UNITED STATES
SECURITIES AND EXCHANGE COMMISSION
Washington, D.C. 20549
FORMN-CSR
CERTIFIED SHAREHOLDER REPORT OF REGISTERED MANAGEMENT INVESTMENT COMPANIES
Investment Company Act file number:811-23341
Name of Fund: BlackRock Funds IV
BlackRock Systematic Multi-Strategy Fund
Fund Address: 100 Bellevue Parkway, Wilmington, DE 19809
Name and address of agent for service: John M. Perlowski, Chief Executive Officer, BlackRock Funds IV, 55 East 52nd Street, New York, NY 10055
Registrant’s telephone number, including area code: (800)441-7762
Date of fiscal year end: 12/31/2019
Date of reporting period: 12/31/2019
| Item 1 – | Report to Stockholders |
| | |
 | | DECEMBER 31, 2019 |
BlackRock Funds IV
| · | | BlackRock Systematic Multi-Strategy Fund |
Beginning on January 1, 2021, as permitted by regulations adopted by the Securities and Exchange Commission, paper copies of the Fund’s shareholder reports will no longer be sent by mail, unless you specifically request paper copies of the reports from BlackRock or from your financial intermediary, such as a broker-dealer or bank. Instead, the reports will be made available on a website, and you will be notified by mail each time a report is posted and provided with a website link to access the report.
You may elect to receive all future reports in paper free of charge. If you hold accounts directly with BlackRock, you can call(800) 441-7762 to inform BlackRock that you wish to continue receiving paper copies of your shareholder reports. If you hold accounts through a financial intermediary, you can follow the instructions included with this disclosure, if applicable, or contact your financial intermediary to request that you continue to receive paper copies of your shareholder reports. Please note that not all financial intermediaries may offer this service. Your election to receive reports in paper will apply to all funds advised by BlackRock Advisors, LLC, BlackRock Fund Advisors or their affiliates, or all funds held with your financial intermediary, as applicable.
If you already elected to receive shareholder reports electronically, you will not be affected by this change and you need not take any action. You may elect to receive electronic delivery of shareholder reports and other communications by: (i) accessing the BlackRock website at blackrock.com/edelivery and logging into your accounts, if you hold accounts directly with BlackRock, or (ii) contacting your financial intermediary, if you hold accounts through a financial intermediary. Please note that not all financial intermediaries may offer this service.
|
| Not FDIC Insured • May Lose Value • No Bank Guarantee |
The Markets in Review
Dear Shareholder,
U.S. equities and bonds finished the last year of the decade with impressive returns, putting an exclamation point on a decade of strong performance despite the fears and doubts about the economy that were ultimately laid to rest with unprecedented monetary stimulus and a sluggish yet resolute performance from the U.S. economy. In many ways, it was fitting that the themes of 2019 — geopolitical uncertainty, fears of recession, and decisive monetary stimulus — put the capstone on a decade that was defined by grappling with these competing forces.
Equity and bond markets posted solid returns, particularly in the second half of the year, as investors began to realize that the U.S. economy was maintaining the modest yet steady growth that has characterized this economic cycle. U.S. large cap equities advanced the most, while equities at the high end of the risk spectrum — emerging markets and U.S. small cap — lagged while still posting solid returns.
Fixed-income securities played an important role in diversified portfolios by delivering strong returns amid economic uncertainty, as interest rates declined (and bond prices rose). Long-term bonds, particularly long-term Treasuries, generally posted the strongest returns, as inflation remained low. Investment-grade and high-yield corporate bonds also posted solid returns, as the credit fundamentals in corporate markets remained relatively solid.
As equity performance faltered in late 2018 and global economic growth slowed, the U.S. Federal Reserve (the “Fed”) shifted away from policies designed to decrease inflation in favor of renewed efforts to stimulate economic activity. The Fed left interest rates unchanged in January 2019, then reduced interest rates three times thereafter, starting in July 2019. Similarly, the Fed took measures to support liquidity in short-term lending markets. Following in the Fed’s footsteps, the European Central Bank announced aggressive economic stimulus measures, including lower interest rates and the return of its bond purchasing program. The Bank of Japan signaled a continuation of accommodative monetary policy, while China committed to looser credit conditions and an increase in fiscal spending.
The outpouring of global economic stimulus led to a sharp rally in risk assets throughout the world despite the headwind of rising geopolitical and trade tensions. Hopes continued to remain high as the current economic expansion became the longest in U.S. history.
Looking ahead, we believe U.S. economic growth will stabilize and gradually improve in 2020. The primary drivers of recent market performance — trade and monetary policies — could take a back seat to a nascent expansion in manufacturing and a recent uptick in global growth. The headwinds of policy uncertainty in 2019 could become tailwinds in 2020 due topro-cyclical policy shifts.
Overall, we favor increasing investment risk to benefit from the brighter outlook. In addition to having a positive view for equities overall, we favor emerging market equities over developed market equities. Increasing cyclical exposure through value-style investing and maintaining a meaningful emphasis on high-quality companies through quality factors also makes sense for diversified investors. In fixed income, government bonds continue to be important portfolio stabilizers, while emerging market bonds, particularly local currency bonds, offer relatively attractive income opportunities.
In this environment, investors need to think globally, extend their scope across a broad array of asset classes, and be nimble as market conditions change. We encourage you to talk with your financial advisor and visitblackrock.com for further insight about investing in today’s markets.
Sincerely,

Rob Kapito
President, BlackRock Advisors, LLC

Rob Kapito
President, BlackRock Advisors, LLC
| | | | |
| Total Returns as of December 31, 2019 |
| | | 6-month | | 12-month |
U.S. large cap equities
(S&P 500® Index) | | 10.92% | | 31.49% |
U.S. small cap equities
(Russell 2000® Index) | | 7.30 | | 25.52 |
International equities
(MSCI Europe, Australasia, Far East Index) | | 7.01 | | 22.01 |
Emerging market equities
(MSCI Emerging Markets Index) | | 7.09 | | 18.42 |
3-month Treasury bills
(ICE BofAML3-Month U.S. Treasury Bill Index) | | 1.03 | | 2.28 |
U.S. Treasury securities
(ICE BofAML10-Year U.S. Treasury Index) | | 1.36 | | 8.91 |
U.S. investment grade bonds
(Bloomberg Barclays U.S. Aggregate Bond Index) | | 2.45 | | 8.72 |
Tax-exempt municipal bonds
(S&P Municipal Bond Index) | | 2.21 | | 7.26 |
U.S. high yield bonds
(Bloomberg Barclays U.S. Corporate High Yield 2% Issuer Capped Index) | | 3.98 | | 14.32 |
| Past performance is no guarantee of future results. Index performance is shown for illustrative purposes only. You cannot invest directly in an index. |
| | |
| 2 | | THIS PAGEISNOT PARTOF YOUR FUND REPORT |
Table of Contents

| | |
| Fund Summary as of December 31, 2019 | | BlackRock Systematic Multi-Strategy Fund |
Investment Objective
BlackRock Systematic Multi-Strategy Fund’s (the “Fund”) investment objective is to seek total return comprised of current income and capital appreciation.
On November 28, 2018, the Board of BlackRock Funds IV approved a proposal to change the name of BlackRock Alternative Capital Strategies Fund to BlackRock Systematic Multi-Strategy Fund. This change became effective January 4, 2019.
Portfolio Management Commentary
How did the Fund perform?
For the12-month period ended December 31, 2019, the Fund outperformed the benchmark ICE BofAML3-Month U.S. Treasury Bill Index, but underperformed its other benchmark, the Bloomberg Barclays U.S. Aggregate Bond Index.
Fund Strategies
Core allocation across fixed-income and equity markets to balance interest rate and credit exposures. Strategies in the core portfolio may include mortgages, duration and curve, investment grade corporates, emerging markets, securitized credit, dividend equities and high yield.
Long/short alpha strategies seek equity securities and equity derivatives, primarily total return swaps, within a global opportunity set. These strategies seek to identify opportunities through a systematic approach by evaluating predicted returns relative to risk for each security. These strategies seek to provide an uncorrelated source of defensive returns.
Long/short macro strategies seek to capture returns through tactical trades to fixed income and equity markets.These strategies seek to tactically allocate and time directional exposures across several asset classes, such as credit default swaps, U.S. Treasures, U.K. Gilts and index futures.
What factors influenced performance?
The Fund’s directional asset allocation (“DAA”) strategy was the biggest contributor to the Fund’s relative performance. The primary driver of the DAA strategy’s outperformance was its exposure to the high-yield arena, dividend equity securities, investment-grade bonds, mortgages, and securitized credit. Interest rate exposure within the DAA strategy also contributed, as rates moved favorably throughout the year. The strategy met its role within the Fund to provide upside participation in strong markets. The macro strategy also contributed slightly to relative returns over the period.
The defensive equity long/short strategy detracted from the Fund’s relative performance during the period. The role of this strategy is to provide ballast for the Fund, and it tends to do best in down markets, as differences in individual stock performance widen and investors focus more on credit fundamentals and balance sheet metrics. Therisk-on market rally throughout 2019 was not the optimal environment for this strategy, as many individual stocks moved higher in concert, and investors focused more on metrics related to corporate income statements, earnings and growth.
Describe recent portfolio activity.
The Fund applied its systematic investment approach, which combines asset allocation, defensive long/short alpha and macro strategies across diversified asset classes. The Fund seeks to provide diversified alpha sources for balanced, consistent returns over time through various market conditions.
The Fund’s strategies performed well to capture the market’s upside in a strong year for both risk and risk-free assets. The DAA’s balancing of spread and rate exposure helped the strategy capture the rally across credit, equity, and interest rate markets. In the middle of the period, the Fund’s regime model turned slightly more defensive upon observing a slight deterioration of leading economic indicators while valuations remained elevated. For this reason, the Fund slightly reduced allocations to high-yield, investment-grade, and dividend equity securities, while increasing allocations to mortgages, which have more defensive characteristics as a spread-focused asset.
The Fund continued to use leveraged strategies, which involve holding cash in order to back investments into-be-announced mortgage derivative securities. Despite having a reported cash position exceeding 5%, the Fund’s investable cash position is negative due to unsettled forward transactions on derivatives, which had a positive impact on Fund performance during the period.
Describe portfolio positioning at period end.
At period end, the Fund continued to target 50% risk contribution from the DAA strategy and 50% risk contribution total from the macro and defensive equity long/short strategies. The Fund remained diversified across fixed income sectors within the DAA strategy to support its goal of participating in market upside and maintaining protection during selloffs, while its macro and defensive equity long/short strategies continued to provide portfolio ballast and uncorrelated returns to provide strong overall risk-adjusted performance across different market environments.
The views expressed reflect the opinions of BlackRock as of the date of this report and are subject to change based on changes in market, economic or other conditions. These views are not intended to be a forecast of future events and are no guarantee of future results.
| | |
| 4 | | 2019 BLACKROCK ANNUAL REPORTTO SHAREHOLDERS |
| | |
| Fund Summary as of December 31, 2019 (continued) | | BlackRock Systematic Multi-Strategy Fund |
TOTAL RETURN BASED ON A $10,000 INVESTMENT
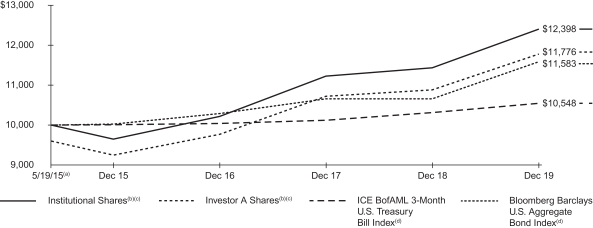
| (a) | Commencement of operations. |
| (b) | Assuming maximum sales charges, if any, transaction costs and other operating expenses, including investment advisory fees. Institutional Shares do not have a sales charge. |
| (c) | The Fund invests in a range of global asset classes, with a focus on fixed and floating rate debt securities and equity securities. On September 17, 2018, the Fund acquired all of the assets, subject to the liabilities, of BlackRock Alternative Capital Strategies Fund (the “Predecessor Fund”), a series of BlackRock FundsSM, through a tax-free reorganization (the “Board Reorganization”). The Predecessor Fund is the performance and accounting survivor of the Board Reorganization. |
| (d) | ICE BofAML 3-Month U.S. Treasury Bill Index is an unmanaged index that tracks 3-month U.S. Treasury securities. Bloomberg Barclays U.S. Aggregate Bond Index is a widely recognized unmanaged market-weighted index, comprised of investment-grade corporate bonds rated BBB or better, mortgages and U.S. Treasury and U.S. Government agency issues with at least one year to maturity. |
Performance Summary for the Period Ended December 31, 2019
| | | | | | | | | | | | | | | | | | | | | | | | | | | | |
| | | | | | | | | Average Annual Total Returns (a) | |
| | | | | | | | | 1 Year | | | | | | Since Inception (b) | |
| | | 6-Month
Total Returns | | | | | | w/o sales
charge | | | w/sales
charge | | | | | | w/o sales
charge | | | w/sales
charge | |
Institutional | | | 1.00 | % | | | | | | | 8.43 | % | | | N/A | | | | | | | | 4.76 | % | | | N/A | |
Investor A | | | 0.95 | | | | | | | | 8.25 | | | | 3.92 | % | | | | | | | 4.52 | | | | 3.60 | % |
Investor C | | | 0.45 | | | | | | | | 7.43 | | | | 6.43 | | | | | | | | 3.71 | | | | 3.71 | |
ICE BofAML 3-Month U.S. Treasury Bill Index | | | 1.03 | | | | | | | | 2.28 | | | | N/A | | | | | | | | 1.16 | | | | N/A | |
Bloomberg Barclays U.S. Aggregate Bond Index | | | 2.45 | | | | | | | | 8.72 | | | | N/A | | | | | | | | 3.24 | | | | N/A | |
| | (a) | Assuming maximum sales charges, if any. Average annual total returns with and without sales charges reflect reductions for distribution and service fees. See “About Fund Performance” on page 7 for a detailed description of share classes, including any related sales charges and fees. | |
| | (b) | The Fund commenced operations on May 19, 2015. | |
N/A — Not applicable as share class and index do not have a sales charge.
Past performance is not indicative of future results.
Performance results may include adjustments made for financial reporting purposes in accordance with U.S. generally accepted accounting principles.
Expense Example
| | | | | | | | | | | | | | | | | | | | | | | | | | | | | | | | |
| | | Actual | | | | | | Hypothetical (b) | | | | |
| | | Beginning
Account Value
(07/01/19) | | | Ending
Account Value
(12/31/19) | | | Expenses
Paid During
the Period (a) | | | | | | Beginning
Account Value
(07/01/19) | | | Ending
Account Value
(12/31/19) | | | Expenses
Paid During
the Period (a) | | | Annualized
Expense
Ratio | |
Institutional | | $ | 1,000.00 | | | $ | 1,010.00 | | | $ | 4.81 | | | | | | | $ | 1,000.00 | | | $ | 1,020.42 | | | $ | 4.84 | | | | 0.95 | % |
Investor A | | | 1,000.00 | | | | 1,009.50 | | | | 6.08 | | | | | | | | 1,000.00 | | | | 1,019.16 | | | | 6.11 | | | | 1.20 | |
Investor C | | | 1,000.00 | | | | 1,004.50 | | | | 9.85 | | | | | | | | 1,000.00 | | | | 1,015.37 | | | | 9.91 | | | | 1.95 | |
| | (a) | For each class of the Fund, expenses are equal to the annualized net expense ratio for the class, multiplied by the average account value over the period, multiplied by 184/365. | |
| | (b) | Hypothetical 5% annual return before expenses is calculated by prorating the number of days in the most recent fiscal half year divided by 365. | |
See “Disclosure of Expenses” on Page 7 for further information on how expenses were calculated.
| | |
| Fund Summary as of December 31, 2019 (continued) | | BlackRock Systematic Multi-Strategy Fund |
Portfolio Information
PORTFOLIO COMPOSITION
| | | | |
| Asset Type | | Percent of Net Assets (a) | |
U.S. Government Sponsored Agency Securities | | | 46 | % |
Corporate Bonds | | | 33 | |
Asset-Backed Securities | | | 9 | |
Common Stocks | | | 6 | |
U.S. Treasury Obligations | | | 5 | |
Non-Agency Mortgage-Backed Securities | | | 4 | |
Short-Term Securities | | | 27 | |
Liabilities in Excess of Other Assets | | | (30 | ) |
| | (a) | Does not include underlying investment in total return swaps. | |
INDUSTRY
| | | | | | | | | | | | |
| | | Percentage of
Total Investments (b) | |
| Industry | | Long | | | Short | | | Total | |
Consumer Discretionary | | | 4 | % | | | 4 | % | | | 8 | % |
Industrials | | | 4 | | | | 2 | | | | 6 | |
Equity Real Estate Investment Trusts (REITs) | | | 3 | | | | 1 | | | | 4 | |
Financials | | | 2 | | | | 2 | | | | 4 | |
Diversified Financial Services | | | 2 | | | | — | | | | 2 | |
Health Care Providers & Services | | | 2 | | | | — | | | | 2 | |
Banks | | | 2 | | | | — | | | | 2 | |
Drug & Grocery Store Chains | | | 2 | | | | — | | | | 2 | |
Consumer Staples | | | 2 | | | | 2 | | | | 4 | |
Utilities | | | 2 | | | | 1 | | | | 3 | |
Health Care | | | 1 | | | | 2 | | | | 3 | |
Oil, Gas & Consumable Fuels | | | 1 | | | | 1 | | | | 2 | |
Energy | | | 1 | | | | 2 | | | | 3 | |
Information Technology | | | 1 | | | | 1 | | | | 2 | |
Materials | | | 1 | | | | 1 | | | | 2 | |
Communication Services | | | 1 | | | | 1 | | | | 2 | |
Media | | | 1 | | | | — | | | | 1 | |
Agency Obligations | | | 1 | | | | — | | | | 1 | |
Hotels, Restaurants & Leisure | | | 1 | | | | — | | | | 1 | |
Food Products | | | 1 | | | | — | | | | 1 | |
Consumer Finance | | | 1 | | | | — | | | | 1 | |
Others(c) | | | 44 | | | | — | | | | 44 | |
| | | | |
| | | 80 | % | | | 20 | % | | | 100 | % |
| | | | |
| | (b) | Total investments include the gross notional values of long and short positions of the underlying derivative contracts utilized by the Fund and exclude short-term securities and TBA sale commitments. | |
| | (c) | Consist of Asset-Backed Securities (4%), Non-Agency Mortgaged-Backed Securities (2%) and U.S. Government Sponsored Agency Obligations (22%) with the remainder consisting of other industries held that were each less than 1% of investments (16% long). | |
| | |
| 6 | | 2019 BLACKROCK ANNUAL REPORTTO SHAREHOLDERS |
About Fund Performance
Institutional Shares are not subject to any sales charge. These shares bear no ongoing distribution or service fees and are available only to certain eligible investors.
Investor A Shares are subject to a maximum initial sales charge (front-end load) of 4.00% and a service fee of 0.25% per year (but no distribution fee). Certain redemptions of these shares may be subject to a contingent deferred sales charge (“CDSC”) where no initial sales charge was paid at the time of purchase. These shares are generally available through financial intermediaries.
Investor C Shares are subject to a 1.00% CDSC if redeemed within one year of purchase. In addition, these shares are subject to a distribution fee of 0.75% per year and a service fee of 0.25% per year. These shares are generally available through financial intermediaries. These shares automatically convert to Investor A Shares after approximately ten years.
Performance information reflects past performance and does not guarantee future results. Current performance may be lower or higher than the performance data quoted. Refer toblackrock.com to obtain performance data current to the most recent month-end. Performance results do not reflect the deduction of taxes that a shareholder would pay on fund distributions or the redemption of fund shares. Figures shown in the performance table on the previous pages assume reinvestment of all distributions, if any, at net asset value (“NAV”) on the ex-dividend/payable date. Investment return and principal value of shares will fluctuate so that shares, when redeemed, may be worth more or less than their original cost. Distributions paid to each class of shares will vary because of the different levels of service, distribution and transfer agency fees applicable to each class, which are deducted from the income available to be paid to shareholders.
BlackRock Advisors, LLC (the “Manager”), the Fund’s investment adviser, has contractually agreed to waive and/or reimburse a portion of the Fund’s expenses. Without such waiver and/or reimbursement, the Fund’s performance would have been lower. With respect to the Fund’s contractual waiver, the Manager is under no obligation to continue waiving and/or reimbursing its fees after the applicable termination date of such agreement. See Note 6 of the Notes to Financial Statements for additional information on waivers and/or reimbursements.
Disclosure of Expenses
Shareholders of the Fund may incur the following charges: (a) transactional expenses, such as sales charges; and (b) operating expenses, including investment advisory fees, service and distribution fees, including 12b-1 fees, acquired fund fees and expenses, and other fund expenses. The expense examples on the previous pages (which are based on a hypothetical investment of $1,000 invested on July 1, 2019 and held through December 31, 2019) are intended to assist shareholders both in calculating expenses based on an investment in the Fund and in comparing these expenses with similar costs of investing in other mutual funds.
The expense example provides information about actual account values and actual expenses. In order to estimate the expenses a shareholder paid during the period covered by this report, shareholders can divide their account value by $1,000 and then multiply the result by the number corresponding to their Fund and share class under the heading entitled “Expenses Paid During the Period.”
The expense example also provides information about hypothetical account values and hypothetical expenses based on the Fund’s actual expense ratio and an assumed rate of return of 5% per year before expenses. In order to assist shareholders in comparing the ongoing expenses of investing in the Fund and other funds, compare the 5% hypothetical examples with the 5% hypothetical examples that appear in shareholder reports of other funds.
The expenses shown in the expense example are intended to highlight shareholders’ ongoing costs only and do not reflect any transactional expenses, such as sales charges, if any. Therefore, the hypothetical example is useful in comparing ongoing expenses only, and will not help shareholders determine the relative total expenses of owning different funds. If these transactional expenses were included, shareholder expenses would have been higher.
Derivative Financial Instruments
The Fund may invest in various derivative financial instruments. These instruments are used to obtain exposure to a security, commodity, index, market, and/or other assets without owning or taking physical custody of securities, commodities and/or other referenced assets or to manage market, equity, credit, interest rate, foreign currency exchange rate, commodity and/or other risks. Derivative financial instruments may give rise to a form of economic leverage and involve risks, including the imperfect correlation between the value of a derivative financial instrument and the underlying asset, possible default of the counterparty to the transaction or illiquidity of the instrument. The Fund’s successful use of a derivative financial instrument depends on the investment adviser’s ability to predict pertinent market movements accurately, which cannot be assured. The use of these instruments may result in losses greater than if they had not been used, may limit the amount of appreciation the Fund can realize on an investment and/or may result in lower distributions paid to shareholders. The Fund’s investments in these instruments, if any, are discussed in detail in the Notes to Financial Statements.
| | | | |
| ABOUT FUND PERFORMANCE / DISCLOSUREOF EXPENSES / DERIVATIVE FINANCIAL INSTRUMENTS | | | 7 | |
| | |
Schedule of Investments December 31, 2019 | | BlackRock Systematic Multi-Strategy Fund (Percentages shown are based on Net Assets) |
| | | | | | | | |
| Security | | Shares | | | Value | |
|
Common Stocks — 6.0% | |
|
| Aerospace & Defense — 0.1% | |
Lockheed Martin Corp. | | | 614 | | | $ | 239,079 | |
| | | | | | | | |
|
| Banks — 0.0% | |
U.S. Bancorp | | | 1,761 | | | | 104,410 | |
| | | | | | | | |
|
| Beverages — 0.2% | |
Coca-Cola European Partners PLC | | | 8,454 | | | | 430,139 | |
PepsiCo, Inc. | | | 3,098 | | | | 423,404 | |
| | | | | | | | |
| | | | 853,543 | |
|
| Biotechnology — 0.1% | |
AbbVie, Inc. | | | 2,711 | | | | 240,032 | |
Amgen, Inc. | | | 497 | | | | 119,812 | |
| | | | | | | | |
| | | | 359,844 | |
|
| Capital Markets — 0.0% | |
Virtu Financial, Inc., Class A | | | 6,648 | | | | 106,302 | |
| | | | | | | | |
|
| Distributors — 0.1% | |
Genuine Parts Co. | | | 2,424 | | | | 257,501 | |
| | | | | | | | |
|
| Diversified Consumer Services — 0.1% | |
H&R Block, Inc. | | | 11,898 | | | | 279,365 | |
| | | | | | | | |
|
| Diversified Telecommunication Services — 0.2% | |
AT&T, Inc. | | | 10,575 | | | | 413,271 | |
Verizon Communications, Inc. | | | 6,954 | | | | 426,976 | |
| | | | | | | | |
| | | | 840,247 | |
|
| Electric Utilities — 0.8% | |
Alliant Energy Corp. | | | 2,390 | | | | 130,781 | |
American Electric Power Co., Inc. | | | 4,225 | | | | 399,305 | |
Duke Energy Corp. | | | 3,188 | | | | 290,778 | |
Entergy Corp. | | | 3,538 | | | | 423,852 | |
Evergy, Inc. | | | 4,693 | | | | 305,467 | |
Eversource Energy | | | 4,796 | | | | 407,996 | |
NextEra Energy, Inc. | | | 1,757 | | | | 425,475 | |
Pinnacle West Capital Corp. | | | 3,229 | | | | 290,384 | |
| | | | | | | | |
| | | | 2,674,038 | |
|
| Equity Real Estate Investment Trusts (REITs) — 1.0% | |
EPR Properties | | | 6,022 | | | | 425,394 | |
Gaming and Leisure Properties, Inc. | | | 9,871 | | | | 424,947 | |
National Health Investors, Inc. | | | 5,274 | | | | 429,725 | |
Omega Healthcare Investors, Inc. | | | 10,222 | | | | 432,902 | |
Public Storage | | | 2,012 | | | | 428,475 | |
Simon Property Group, Inc. | | | 2,893 | | | | 430,941 | |
Spirit Realty Capital, Inc. | | | 8,678 | | | | 426,784 | |
Ventas, Inc. | | | 7,467 | | | | 431,145 | |
| | | | | | | | |
| | | | 3,430,313 | |
|
| Food Products — 0.5% | |
General Mills, Inc. | | | 1,987 | | | | 106,424 | |
Hershey Co. | | | 2,883 | | | | 423,743 | |
Hormel Foods Corp. | | | 2,680 | | | | 120,895 | |
Ingredion, Inc. | | | 1,172 | | | | 108,937 | |
J.M. Smucker Co. | | | 4,045 | | | | 421,206 | |
Kellogg Co. | | | 6,331 | | | | 437,852 | |
| | | | | | | | |
| | | | 1,619,057 | |
|
| Health Care Providers & Services — 0.1% | |
Quest Diagnostics, Inc. | | | 2,346 | | | | 250,529 | |
| | | | | | | | |
|
| Hotels, Restaurants & Leisure — 0.2% | |
Cracker Barrel Old Country Store, Inc. | | | 2,724 | | | | 418,788 | |
Darden Restaurants, Inc. | | | 3,878 | | | | 422,741 | |
| | | | | | | | |
| | | | 841,529 | |
| | | | | | | | |
| Security | | Shares | | | Value | |
|
| Household Products — 0.4% | |
Clorox Co. | | | 2,103 | | | $ | 322,895 | |
Colgate-Palmolive Co. | | | 4,534 | | | | 312,120 | |
Kimberly-Clark Corp. | | | 3,092 | | | | 425,305 | |
Procter & Gamble Co. | | | 2,446 | | | | 305,505 | |
| | | | | | | | |
| | | | 1,365,825 | |
|
| Insurance — 0.6% | |
Aflac, Inc. | | | 5,592 | | | | 295,817 | |
American Financial Group, Inc. | | | 3,339 | | | | 366,121 | |
Everest Re Group Ltd. | | | 1,326 | | | | 367,090 | |
Fidelity National Financial, Inc. | | | 9,286 | | | | 421,120 | |
Hanover Insurance Group, Inc. | | | 3,096 | | | | 423,130 | |
Travelers Cos., Inc. | | | 3,098 | | | | 424,271 | |
| | | | | | | | |
| | | | 2,297,549 | |
|
| IT Services — 0.1% | |
Paychex, Inc. | | | 2,235 | | | | 190,109 | |
| | | | | | | | |
|
| Media — 0.1% | |
Cinemark Holdings, Inc. | | | 3,000 | | | | 101,550 | |
Omnicom Group, Inc. | | | 3,817 | | | | 309,253 | |
| | | | | | | | |
| | | | 410,803 | |
|
| Multi-Utilities — 0.4% | |
CMS Energy Corp. | | | 2,442 | | | | 153,455 | |
Consolidated Edison, Inc. | | | 3,933 | | | | 355,818 | |
Dominion Energy, Inc. | | | 5,168 | | | | 428,014 | |
DTE Energy Co. | | | 1,737 | | | | 225,584 | |
WEC Energy Group, Inc. | | | 4,586 | | | | 422,967 | |
| | | | | | | | |
| | | | | | | 1,585,838 | |
|
| Oil, Gas & Consumable Fuels — 0.5% | |
Chevron Corp. | | | 2,530 | | | | 304,890 | |
Enterprise Products Partners LP | | | 11,293 | | | | 318,011 | |
Exxon Mobil Corp. | | | 2,026 | | | | 141,374 | |
Magellan Midstream Partners LP | | | 6,770 | | | | 425,630 | |
Phillips 66 Partners LP | | | 7,014 | | | | 432,343 | |
| | | | | | | | |
| | | | | | | 1,622,248 | |
|
| Pharmaceuticals — 0.4% | |
Bristol-Myers Squibb Co. | | | 1,682 | | | | 107,968 | |
Eli Lilly & Co. | | | 2,658 | | | | 349,341 | |
Johnson & Johnson | | | 2,909 | | | | 424,336 | |
Merck & Co., Inc. | | | 4,698 | | | | 427,283 | |
Pfizer, Inc. | | | 2,712 | | | | 106,256 | |
| | | | | | | | |
| | | | | | | 1,415,184 | |
|
| Tobacco — 0.1% | |
Philip Morris International, Inc. | | | 4,917 | | | | 418,388 | |
| | | | | | | | |
|
| Trading Companies & Distributors — 0.0% | |
Watsco, Inc. | | | 591 | | | | 106,469 | |
| | | | | | | | |
| |
Total Common Stocks — 6.0%
(Cost — $20,724,027) | | | | 21,268,170 | |
| | | | | |
| | |
| | | Par
(000) | | | | |
|
| Asset-Backed Securities — 9.3% | |
American Credit Acceptance Receivables Trust,Series 2017-1, Class D, 3.54%, 03/13/23(a) | | $ | 1,194 | | | | 1,201,838 | |
AmeriCredit Automobile Receivables Trust, Class D: | | | | | | | | |
Series 2016-3, 2.71%, 09/08/22 | | | 1,200 | | | | 1,207,171 | |
Series 2017-3, 3.18%, 07/18/23 | | | 150 | | | | 152,360 | |
Avant Loans Funding Trust(a): | | | | | | | | |
Series 2018-A, Class B, 3.95%, 12/15/22 | | | 91 | | | | 90,869 | |
Series 2019-A, Class A, 3.48%, 07/15/22 | | | 91 | | | | 91,513 | |
Series 2019-B, Class A, 2.72%, 10/15/26 | | | 1,664 | | | | 1,665,064 | |
Series 2019-B, Class B, 3.15%, 10/15/26 | | | 1,200 | | | | 1,202,258 | |
| | |
| 8 | | 2019 BLACKROCK ANNUAL REPORTTO SHAREHOLDERS |
| | |
Schedule of Investments (continued) December 31, 2019 | | BlackRock Systematic Multi-Strategy Fund (Percentages shown are based on Net Assets) |
| | | | | | | | |
| Security | | Par
(000) | | | Value | |
|
| Asset-Backed Securities (continued) | |
Avid Automobile Receivables Trust,Series 2019-1, Class A, 2.62%, 02/15/24(a) | | $ | 888 | | | $ | 887,557 | |
CLUB Credit Trust,Series 2017-P2, Class A, 2.61%, 01/15/24(a) | | | 2 | | | | 1,831 | |
Conn’s Receivables Funding LLC, Class A(a): | | | | | | | | |
Series 2018-A, 3.25%, 01/15/23 | | | 17 | | | | 17,461 | |
Series 2019-A, 3.40%, 10/16/23 | | | 110 | | | | 110,484 | |
Series 2019-B, 2.66%, 06/17/24 | | | 2,493 | | | | 2,494,056 | |
Consumer Loan Underlying Bond CLUB Credit Trust, Class A(a): | | | | | | | | |
Series 2019-HP1, 2.59%, 12/15/26 | | | 2,270 | | | | 2,270,895 | |
Series 2019-P2, 2.47%, 10/15/26 | | | 1,369 | | | | 1,370,040 | |
Consumer Loan Underlying Bond Credit Trust(a): | | | | | | | | |
Series 2018-P1, Class A, 3.39%, 07/15/25 | | | 27 | | | | 27,107 | |
Series 2018-P1, Class B, 4.07%, 07/15/25 | | | 2,500 | | | | 2,535,358 | |
Series 2018-P2, Class A, 3.47%, 10/15/25 | | | 35 | | | | 35,199 | |
Series 2019-P1, Class A, 2.94%, 07/15/26 | | | 698 | | | | 700,306 | |
Drive Auto Receivables Trust: | | | | | | | | |
Series 2017-1, Class D, 3.84%, 03/15/23 | | | 150 | | | | 151,524 | |
Series 2017-2, Class D, 3.49%, 09/15/23 | | | 100 | | | | 100,758 | |
Series 2017-3, Class D, 3.53%, 12/15/23(a) | | | 250 | | | | 252,300 | |
Series 2017-BA, Class D, 3.72%, 10/17/22(a) | | | 94 | | | | 94,722 | |
Series 2018-2, Class D, 4.14%, 08/15/24 | | | 225 | | | | 229,543 | |
Series 2018-3, Class B, 3.37%, 09/15/22 | | | 23 | | | | 22,859 | |
Series 2019-1, Class B, 3.41%, 06/15/23 | | | 200 | | | | 201,565 | |
Series 2019-2, Class B, 3.17%, 11/15/23 | | | 225 | | | | 227,279 | |
Enva LLC(a): | | | | | | | | |
Series 2018-A, Class A, 4.20%, 05/20/26 | | | 30 | | | | 30,158 | |
Series 2019-A, Class A, 3.96%, 06/22/26 | | | 1,558 | | | | 1,558,240 | |
Series 2019-A, Class B, 6.17%, 06/22/26 | | | 250 | | | | 249,509 | |
Series 2019-A, Class C, 7.62%, 06/22/26 | | | 125 | | | | 124,635 | |
Exeter Automobile Receivables Trust, Class B(a): | | | | | | | | |
Series 2018-4A, 3.64%, 11/15/22 | | | 90 | | | | 90,431 | |
Series 2019-1A, 3.45%, 02/15/23 | | | 190 | | | | 191,492 | |
Flagship Credit Auto Trust,Series 2016-4, Class B, 2.41%, 10/15/21(a) | | | 5 | | | | 5,461 | |
Marlette Funding Trust(a): | | | | | | | | |
Series 2018-3A, Class A, 3.20%, 09/15/28 | | | 22 | | | | 22,114 | |
Series 2018-3A, Class A, 2.69%, 09/17/29 | | | 758 | | | | 760,422 | |
Series 2018-3A, Class B, 3.86%, 09/15/28 | | | 300 | | | | 302,630 | |
Series 2018-4A, Class A, 3.71%, 12/15/28 | | | 92 | | | | 92,389 | |
Series 2019-1A, Class A, 3.44%, 04/16/29 | | | 89 | | | | 89,326 | |
Series 2019-2A, Class A, 3.13%, 07/16/29 | | | 276 | | | | 277,957 | |
Series 2019-4A, Class A, 2.39%, 12/17/29 | | | 1,333 | | | | 1,333,461 | |
OneMain Financial Issuance Trust,Series 2019-2A, Class A, 3.14%, 10/14/36(a) | | | 500 | | | | 496,250 | |
Prosper Marketplace Issuance Trust, Class A(a): | | | | | | | | |
Series 2018-2A, 3.35%, 10/15/24 | | | 58 | | | | 57,749 | |
Series 2019-1A, 3.54%, 04/15/25 | | | 40 | | | | 40,014 | |
Series 2019-2A, 3.20%, 09/15/25 | | | 193 | | | | 193,312 | |
Series 2019-3A, 3.19%, 07/15/25 | | | 1,092 | | | | 1,097,807 | |
Series 2019-4A, 2.48%, 02/17/26 | | �� | 815 | | | | 814,222 | |
Santander Drive Auto Receivables Trust: | | | | | | | | |
Series 2016-1, Class C, 3.09%, 04/15/22 | | | 4 | | | | 3,660 | |
Series 2016-3, Class D, 2.80%, 08/15/22 | | | 100 | | | | 100,618 | |
Series 2017-2, Class D, 3.49%, 07/17/23 | | | 250 | | | | 252,782 | |
Series 2018-2, Class D, 3.88%, 02/15/24 | | | 750 | | | | 768,051 | |
Series 2018-4, Class C, 3.56%, 07/15/24 | | | 1,200 | | | | 1,216,151 | |
Series 2018-5, Class D, 4.19%, 12/16/24 | | | 50 | | | | 51,407 | |
Series 2019-3, Class B, 2.28%, 09/15/23 | | | 970 | | | | 970,614 | |
Santander Revolving Auto Loan Trust,Series 2019-A, Class A, 2.51%, 01/26/32(a) | | | 650 | | | | 647,147 | |
| | | | | | | | |
| Security | | Par
(000) | | | Value | |
|
| Asset-Backed Securities (continued) | |
SoFi Consumer Loan Program LLC, Class A(a): | | | | | | | | |
Series 2016-2A, 3.09%, 10/27/25 | | $ | 8 | | | $ | 8,370 | |
Series 2016-3, 3.05%, 12/26/25 | | | 11 | | | | 10,927 | |
Series 2017-1, 3.28%, 01/26/26 | | | 55 | | | | 55,098 | |
Series 2017-3, 2.77%, 05/25/26 | | | 23 | | | | 22,670 | |
SoFi Consumer Loan Program Trust(a): | | | | | | | | |
Series 2018-1, Class A2, 3.14%, 02/25/27 | | | 110 | | | | 110,355 | |
Series 2018-3, Class A1, 3.20%, 08/25/27 | | | 14 | | | | 14,238 | |
Upgrade Master Pass-Thru Trust,Series 2019-ST4, Class A, 3.75%, 12/15/25(a)(b) | | | 416 | | | | 416,195 | |
Upgrade Receivables Trust, Class A(a): | | | | | | | | |
Series 2018-1A, 3.76%, 11/15/24 | | | 45 | | | | 45,059 | |
Series 2019-1A, 3.48%, 03/15/25 | | | 39 | | | | 38,833 | |
Series 2019-2A, 2.77%, 10/15/25 | | | 706 | | | | 707,430 | |
Westlake Automobile Receivables Trust(a): | | | | | | | | |
Series 2017-1A, Class D, 3.46%, 10/17/22 | | | 150 | | | | 150,948 | |
Series 2018-1A, Class D, 3.41%, 05/15/23 | | | 200 | | | | 202,276 | |
Series 2018-2A, Class B, 3.20%, 01/16/24 | | | 70 | | | | 70,231 | |
Series 2018-3A, Class B, 3.32%, 10/16/23 | | | 100 | | | | 100,776 | |
Series 2018-3A, Class D, 4.00%, 10/16/23 | | | 100 | | | | 102,284 | |
Series 2019-2A, Class B, 2.62%, 07/15/24 | | | 1,250 | | | | 1,254,914 | |
Series 2019-2A, Class D, 3.20%, 11/15/24 | | | 410 | | | | 415,004 | |
| | | | | | | | |
| |
Total Asset-Backed Securities — 9.3%
(Cost — $32,842,826) | | | | 32,905,534 | |
| | | | | |
|
Corporate Bonds — 32.6% | |
|
Aerospace & Defense — 0.8% | |
Arconic, Inc., 5.90%, 02/01/27 | | | 525 | | | | 601,274 | |
Boeing Co.: | | | | | | | | |
2.70%, 05/01/22 | | | 600 | | | | 609,413 | |
3.10%, 05/01/26 | | | 20 | | | | 20,642 | |
Bombardier, Inc.(a): | | | | | | | | |
6.13%, 01/15/23 | | | 50 | | | | 51,275 | |
7.88%, 04/15/27 | | | 75 | | | | 77,156 | |
Global Aircraft Leasing Co. Ltd., (6.5% Cash or 7.25% PIK), 6.50%, 09/15/24(a)(c) | | | 50 | | | | 52,352 | |
L3Harris Technologies, Inc., 4.40%, 06/15/28 | | | 50 | | | | 55,745 | |
Signature Aviation US Holdings, Inc.(a): | | | | | | | | |
5.38%, 05/01/26 | | | 10 | | | | 10,526 | |
4.00%, 03/01/28 | | | 125 | | | | 123,288 | |
Spirit AeroSystems, Inc., 3.95%, 06/15/23 | | | 35 | | | | 36,085 | |
SSL Robotics LLC, 9.75%, 12/31/23(a) | | | 111 | | | | 120,713 | |
TransDigm, Inc.: | | | | | | | | |
6.25%, 03/15/26(a) | | | 290 | | | | 313,957 | |
6.38%, 06/15/26 | | | 100 | | | | 106,061 | |
7.50%, 03/15/27 | | | 50 | | | | 54,690 | |
5.50%, 11/15/27(a) | | | 350 | | | | 353,930 | |
United Technologies Corp., 3.95%, 08/16/25 | | | 130 | | | | 141,775 | |
| | | | | | | | |
| | | | | | | 2,728,882 | |
|
| Air Freight & Logistics — 0.0% | |
XPO Logistics, Inc., 6.50%, 06/15/22(a) | | | 7 | | | | 7,133 | |
| | | | | | | | |
|
| Airlines — 0.0% | |
American Airlines Group, Inc., 4.63%, 03/01/20(a) | | | 10 | | | | 10,016 | |
Delta Air Lines, Inc.: | | | | | | | | |
2.60%, 12/04/20 | | | 25 | | | | 25,073 | |
3.40%, 04/19/21 | | | 75 | | | | 76,039 | |
United Airlines Holdings, Inc., 5.00%, 02/01/24 | | | 25 | | | | 26,683 | |
| | | | | | | | |
| | | | | | | 137,811 | |
|
| Auto Components — 0.8% | |
Adient US LLC, 7.00%, 05/15/26(a) | | | 50 | | | | 54,500 | |
| | | | |
| SCHEDULE OF INVESTMENTS | | | 9 | |
| | |
Schedule of Investments (continued) December 31, 2019 | | BlackRock Systematic Multi-Strategy Fund (Percentages shown are based on Net Assets) |
| | | | | | | | |
| Security | | Par
(000) | | | Value | |
|
| Auto Components (continued) | |
Allison Transmission, Inc.(a): | | | | | | | | |
5.00%, 10/01/24 | | $ | 50 | | | $ | 51,188 | |
5.88%, 06/01/29 | | | 60 | | | | 65,700 | |
Icahn Enterprises LP/Icahn Enterprises Finance Corp.: | | | | | | | | |
5.88%, 02/01/22 | | | 100 | | | | 100,125 | |
6.38%, 12/15/25 | | | 100 | | | | 104,875 | |
6.25%, 05/15/26 | | | 110 | | | | 117,150 | |
PACCAR Financial Corp., 1.90%, 02/07/23 | | | 325 | | | | 325,433 | |
Panther BF Aggregator 2 LP/Panther Finance Co., Inc.(a): | | | | | | | | |
6.25%, 05/15/26 | | | 65 | | | | 70,037 | |
8.50%, 05/15/27 | | | 10 | | | | 10,625 | |
Tesla, Inc., 5.30%, 08/15/25(a) | | | 375 | | | | 363,750 | |
Toyota Motor Corp., 2.76%, 07/02/29 | | | 30 | | | | 30,784 | |
Toyota Motor Credit Corp.: | | | | | | | | |
1.80%, 10/07/21 | | | 1,130 | | | | 1,130,144 | |
2.65%, 04/12/22 | | | 200 | | | | 203,570 | |
| | | | | | | | |
| | | | | | | 2,627,881 | |
|
| Banks — 3.1% | |
Australia & New Zealand Banking Group Ltd., 2.05%, 11/21/22 | | | 925 | | | | 928,290 | |
Bank of America NA(3 mo. LIBOR US + 0.65%), 3.34%, 01/25/23(d) | | | 500 | | | | 513,740 | |
Bank of Montreal: | | | | | | | | |
2.90%, 03/26/22 | | | 100 | | | | 101,958 | |
2.05%, 11/01/22 | | | 625 | | | | 627,561 | |
Bank of Nova Scotia, 2.00%, 11/15/22 | | | 1,150 | | | | 1,151,856 | |
Barclays PLC: | | | | | | | | |
5.20%, 05/12/26 | | | 200 | | | | 218,749 | |
(3 mo. LIBOR US + 3.05%), 5.09%, 06/20/30(d) | | | 200 | | | | 223,008 | |
Capital One Financial Corp.: | | | | | | | | |
2.40%, 10/30/20 | | | 85 | | | | 85,263 | |
3.45%, 04/30/21 | | | 26 | | | | 26,473 | |
CIT Group, Inc., 6.13%, 03/09/28 | | | 25 | | | | 29,500 | |
Citibank NA, 3.65%, 01/23/24 | | | 400 | | | | 423,456 | |
HSBC Holdings PLC: | | | | | | | | |
4.00%, 03/30/22 | | | 50 | | | | 52,109 | |
(3 mo. LIBOR US + 1.06%), 3.26%, 03/13/23(d) | | | 200 | | | | 204,572 | |
(3 mo. LIBOR US + 1.21%), 3.80%, 03/11/25(d) | | | 1,050 | | | | 1,102,296 | |
(3 mo. LIBOR US + 1.14%), 2.63%, 11/07/25(d) | | | 450 | | | | 451,795 | |
3.90%, 05/25/26 | | | 490 | | | | 522,694 | |
HSBC USA, Inc., 3.50%, 06/23/24 | | | 400 | | | | 422,395 | |
Lloyds Bank PLC, 2.25%, 08/14/22 | | | 500 | | | | 502,480 | |
MUFG Union Bank NA, 3.15%, 04/01/22 | | | 250 | | | | 255,868 | |
Royal Bank of Canada, 2.80%, 04/29/22 | | | 200 | | | | 204,120 | |
Toronto-Dominion Bank: | | | | | | | | |
1.90%, 12/01/22 | | | 785 | | | | 785,752 | |
2.65%, 06/12/24 | | | 200 | | | | 204,879 | |
Truist Bank: | | | | | | | | |
2.80%, 05/17/22 | | | 100 | | | | 101,902 | |
2.15%, 12/06/24 | | | 270 | | | | 269,574 | |
Truist Financial Corp., 3.05%, 06/20/22 | | | 100 | | | | 102,499 | |
Wells Fargo & Co.: | | | | | | | | |
4.60%, 04/01/21 | | | 500 | | | | 516,227 | |
(3 mo. LIBOR US + 0.83%), 2.41%, 10/30/25(d) | | | 640 | | | | 640,603 | |
Wells Fargo Bank NA (3 mo. LIBOR US + 0.61%), 2.90%, 05/27/22(d) | | | 300 | | | | 303,955 | |
| | | | | | | | |
| | | | | | | 10,973,574 | |
|
| Beverages — 0.4% | |
Anheuser-Busch InBev Worldwide, Inc., 2.50%, 07/15/22 | | | 80 | | | | 81,430 | |
Coca-Cola Co., 1.75%, 09/06/24 | | | 400 | | | | 397,261 | |
Diageo Capital PLC: | | | | | | | | |
2.13%, 10/24/24 | | | 560 | | | | 560,131 | |
2.38%, 10/24/29 | | | 405 | | | | 399,603 | |
| | | | | | | | |
| | | | | | | 1,438,425 | |
| | | | | | | | |
| Security | | Par
(000) | | | Value | |
|
| Building Materials — 0.1% | |
Allegion US Holding Co., Inc., 3.20%, 10/01/24 | | $ | 100 | | | $ | 102,849 | |
James Hardie International Finance DAC, 5.00%, 01/15/28(a) | | | 200 | | | | 210,000 | |
Summit Materials LLC, 6.13%, 07/15/23 | | | 10 | | | | 10,162 | |
| | | | | | | | |
| | | | | | | 323,011 | |
|
| Building Products — 0.2% | |
Advanced Drainage Systems, Inc., 5.00%, 09/30/27(a) | | | 155 | | | | 159,844 | |
Builders FirstSource, Inc.(a): | | | | | | | | |
5.63%, 09/01/24 | | | 87 | | | | 90,480 | |
6.75%, 06/01/27 | | | 150 | | | | 164,437 | |
Louisiana-Pacific Corp., 4.88%, 09/15/24 | | | 25 | | | | 25,844 | |
Masonite International Corp., 5.38%, 02/01/28(a) | | | 200 | | | | 211,250 | |
Standard Industries, Inc.(a): | | | | | | | | |
5.38%, 11/15/24 | | | 35 | | | | 35,963 | |
4.75%, 01/15/28 | | | 25 | | | | 25,625 | |
| | | | | | | | |
| | | | | | | 713,443 | |
|
| Capital Markets — 1.2% | |
Brookfield Finance, Inc., 3.90%, 01/25/28 | | | 50 | | | | 53,629 | |
FS KKR Capital Corp.: | | | | | | | | |
4.63%, 07/15/24 | | | 150 | | | | 155,880 | |
4.13%, 02/01/25 | | | 105 | | | | 106,483 | |
Goldman Sachs Group, Inc.: | | | | | | | | |
5.25%, 07/27/21 | | | 150 | | | | 157,413 | |
5.75%, 01/24/22 | | | 500 | | | | 536,758 | |
3.63%, 02/20/24 | | | 700 | | | | 734,824 | |
3.75%, 05/22/25 | | | 75 | | | | 79,616 | |
(3 mo. LIBOR US + 1.20%), 3.27%, 09/29/25(d) | | | 125 | | | | 129,413 | |
3.75%, 02/25/26 | | | 75 | | | | 79,389 | |
3.50%, 11/16/26 | | | 35 | | | | 36,836 | |
(3 mo. LIBOR US + 1.16%), 3.81%, 04/23/29(d) | | | 100 | | | | 107,288 | |
(3 mo. LIBOR US + 1.30%), 4.22%, 05/01/29(d) | | | 250 | | | | 275,645 | |
LPL Holdings, Inc.(a): | | | | | | | | |
5.75%, 09/15/25 | | | 50 | | | | 52,312 | |
4.63%, 11/15/27 | | | 90 | | | | 91,800 | |
Morgan Stanley: | | | | | | | | |
2.63%, 11/17/21 | | | 50 | | | | 50,599 | |
2.75%, 05/19/22 | | | 550 | | | | 560,157 | |
4.88%, 11/01/22 | | | 25 | | | | 26,788 | |
3.13%, 01/23/23 | | | 550 | | | | 565,447 | |
3.70%, 10/23/24 | | | 25 | | | | 26,557 | |
(3 mo. LIBOR US + 1.63%), 4.43%, 01/23/30(d) | | | 260 | | | | 294,080 | |
| | | | | | | | |
| | | | | | | 4,120,914 | |
|
| Chemicals — 0.4% | |
Ashland LLC, 4.75%, 08/15/22 | | | 35 | | | | 36,575 | |
Celanese US Holdings LLC, 3.50%, 05/08/24 | | | 45 | | | | 46,536 | |
CF Industries, Inc.: | | | | | | | | |
4.95%, 06/01/43 | | | 75 | | | | 78,187 | |
5.38%, 03/15/44 | | | 50 | | | | 54,500 | |
Chemours Co., 5.38%, 05/15/27 | | | 25 | | | | 22,125 | |
CVR Partners LP/CVR Nitrogen Finance Corp., 9.25%, 06/15/23(a) | | | 25 | | | | 26,115 | |
FMC Corp., 3.20%, 10/01/26 | | | 207 | | | | 211,454 | |
OCI NV, 6.63%, 04/15/23(a) | | | 200 | | | | 208,500 | |
Olin Corp., 5.13%, 09/15/27 | | | 50 | | | | 52,125 | |
PolyOne Corp., 5.25%, 03/15/23 | | | 35 | | | | 37,716 | |
Sherwin-Williams Co.: | | | | | | | | |
3.45%, 06/01/27 | | | 640 | | | | 677,210 | |
2.95%, 08/15/29 | | | 110 | | | | 111,103 | |
| | | | | | | | |
| | | | | | | 1,562,146 | |
|
| Commercial Services & Supplies — 0.1% | |
GFL Environmental, Inc., 5.13%, 12/15/26(a) | | | 30 | | | | 31,541 | |
| | |
| 10 | | 2019 BLACKROCK ANNUAL REPORTTO SHAREHOLDERS |
| | |
Schedule of Investments (continued) December 31, 2019 | | BlackRock Systematic Multi-Strategy Fund (Percentages shown are based on Net Assets) |
| | | | | | | | |
| Security | | Par
(000) | | | Value | |
|
| Commercial Services & Supplies (continued) | |
IHS Markit Ltd.: | | | | | | | | |
4.13%, 08/01/23 | | $ | 35 | | | $ | 37,190 | |
3.63%, 05/01/24 | | | 80 | | | | 83,124 | |
Iron Mountain US Holdings, Inc., 5.38%, 06/01/26(a) | | | 100 | | | | 104,500 | |
United Rentals North America, Inc.: | | | | | | | | |
4.63%, 10/15/25 | | | 50 | | | | 51,405 | |
4.88%, 01/15/28 | | | 50 | | | | 52,062 | |
| | | | | | | | |
| | | | | | | 359,822 | |
|
| Commercial Services & Supplies — 0.1% | |
IHS Markit Ltd., 4.25%, 05/01/29 | | | 150 | | | | 161,643 | |
United Rentals North America, Inc., 5.25%, 01/15/30 | | | 50 | | | | 53,815 | |
| | | | | | | | |
| | | | | | | 215,458 | |
|
| Communications Equipment — 0.4% | |
CommScope Technologies LLC, 6.00%, 06/15/25(a) | | | 25 | | | | 25,028 | |
CommScope, Inc., 8.25%, 03/01/27(a) | | | 50 | | | | 52,625 | |
Gogo Intermediate Holdings LLC/Gogo Finance Co., Inc., 9.88%, 05/01/24(a) | | | 25 | | | | 26,406 | |
Motorola Solutions, Inc.: | | | | | | | | |
4.00%, 09/01/24 | | | 54 | | | | 57,305 | |
4.60%, 02/23/28 | | | 50 | | | | 54,229 | |
4.60%, 05/23/29 | | | 200 | | | | 218,329 | |
National Rural Utilities Cooperative Finance Corp., 3.70%, 03/15/29 | | | 100 | | | | 109,599 | |
ViaSat, Inc.(a): | | | | | | | | |
5.63%, 09/15/25 | | | 100 | | | | 103,000 | |
5.63%, 04/15/27 | | | 400 | | | | 428,000 | |
Zayo Group LLC/Zayo Capital, Inc.: | | | | | | | | |
6.38%, 05/15/25 | | | 30 | | | | 30,925 | |
5.75%, 01/15/27(a) | | | 425 | | | | 431,906 | |
| | | | | | | | |
| | | | | | | 1,537,352 | |
|
| Construction & Engineering — 0.2% | |
AECOM: | | | | | | | | |
5.88%, 10/15/24 | | | 50 | | | | 55,335 | |
5.13%, 03/15/27 | | | 400 | | | | 430,000 | |
Brand Industrial Services, Inc., 8.50%, 07/15/25(a) | | | 25 | | | | 25,625 | |
| | | | | | | | |
| | | | | | | 510,960 | |
|
| Consumer Finance — 1.3% | |
Ally Financial, Inc.: | | | | | | | | |
5.13%, 09/30/24 | | | 25 | | | | 27,570 | |
5.75%, 11/20/25 | | | 150 | | | | 167,812 | |
8.00%, 11/01/31 | | | 100 | | | | 138,810 | |
American Express Co.: | | | | | | | | |
3.70%, 11/05/21 | | | 500 | | | | 515,278 | |
2.75%, 05/20/22 | | | 100 | | | | 101,833 | |
2.50%, 08/01/22 | | | 50 | | | | 50,597 | |
3.40%, 02/27/23 | | | 50 | | | | 51,918 | |
2.50%, 07/30/24 | | | 290 | | | | 293,393 | |
Caterpillar Financial Services Corp., Series I, 2.65%, 05/17/21 | | | 125 | | | | 126,430 | |
Credit Acceptance Corp., 6.63%, 03/15/26(a) | | | 60 | | | | 64,875 | |
Curo Group Holdings Corp., 8.25%, 09/01/25(a) | | | 50 | | | | 43,999 | |
Global Payments, Inc.: | | | | | | | | |
4.00%, 06/01/23 | | | 50 | | | | 52,609 | |
2.65%, 02/15/25 | | | 45 | | | | 45,205 | |
goeasy Ltd., 5.38%, 12/01/24(a) | | | 55 | | | | 56,008 | |
Mastercard, Inc.: | | | | | | | | |
2.95%, 11/21/26 | | | 380 | | | | 395,365 | |
3.50%, 02/26/28 | | | 30 | | | | 32,362 | |
2.95%, 06/01/29 | | | 260 | | | | 271,337 | |
Navient Corp.: | | | | | | | | |
5.00%, 10/26/20 | | | 15 | | | | 15,221 | |
6.63%, 07/26/21 | | | 25 | | | | 26,437 | |
| | | | | | | | |
| Security | | Par
(000) | | | Value | |
|
| Consumer Finance (continued) | |
7.25%, 09/25/23 | | $ | 100 | | | $ | 113,003 | |
6.13%, 03/25/24 | | | 50 | | | | 54,250 | |
5.88%, 10/25/24 | | | 25 | | | | 26,750 | |
6.75%, 06/15/26 | | | 150 | | | | 164,865 | |
PayPal Holdings, Inc.: | | | | | | | | |
2.20%, 09/26/22 | | | 215 | | | | 216,223 | |
2.40%, 10/01/24 | | | 170 | | | | 171,677 | |
2.65%, 10/01/26 | | | 205 | | | | 207,879 | |
Refinitiv US Holdings, Inc.(a): | | | | | | | | |
6.25%, 05/15/26 | | | 15 | | | | 16,369 | |
8.25%, 11/15/26 | | | 20 | | | | 22,525 | |
Springleaf Finance Corp.: | | | | | | | | |
6.13%, 05/15/22 | | | 50 | | | | 53,687 | |
6.13%, 03/15/24 | | | 100 | | | | 109,500 | |
6.88%, 03/15/25 | | | 100 | | | | 113,750 | |
7.13%, 03/15/26 | | | 190 | | | | 219,678 | |
6.63%, 01/15/28 | | | 100 | | | | 112,880 | |
5.38%, 11/15/29 | | | 245 | | | | 255,731 | |
Synchrony Financial, 4.38%, 03/19/24 | | | 100 | | | | 106,701 | |
Verscend Escrow Corp., 9.75%, 08/15/26(a) | | | 15 | | | | 16,406 | |
| | | | | | | | |
| | | | | | | 4,458,933 | |
|
| Containers & Packaging — 0.5% | |
Ardagh Packaging Finance PLC/Ardagh Holdings USA, Inc., 5.25%, 08/15/27(a) | | | 400 | | | | 421,008 | |
Ball Corp.: | | | | | | | | |
4.00%, 11/15/23 | | | 15 | | | | 15,750 | |
5.25%, 07/01/25 | | | 50 | | | | 55,687 | |
4.88%, 03/15/26 | | | 200 | | | | 217,000 | |
Berry Global, Inc.: | | | | | | | | |
5.13%, 07/15/23 | | | 100 | | | | 102,625 | |
4.88%, 07/15/26(a) | | | 150 | | | | 158,205 | |
Cascades Inc/Cascades USA, Inc.(a): | | | | | | | | |
5.13%, 01/15/26 | | | 200 | | | | 205,500 | |
5.38%, 01/15/28 | | | 200 | | | | 205,500 | |
Clearwater Paper Corp., 5.38%, 02/01/25(a) | | | 35 | | | | 34,737 | |
Greif, Inc., 6.50%, 03/01/27(a) | | | 10 | | | | 10,800 | |
Mauser Packaging Solutions Holding Co.(a): | | | | | | | | |
5.50%, 04/15/24 | | | 25 | | | | 25,753 | |
7.25%, 04/15/25 | | | 100 | | | | 98,750 | |
Reynolds Group Issuer, Inc./Reynolds Group Issuer LLC/Reynolds Group Issuer Lu(a): | | | | | | | | |
5.13%, 07/15/23 | | | 25 | | | | 25,594 | |
7.00%, 07/15/24 | | | 100 | | | | 103,375 | |
Sealed Air Corp.(a): | | | | | | | | |
5.50%, 09/15/25 | | | 25 | | | | 27,500 | |
4.00%, 12/01/27 | | | 100 | | | | 101,250 | |
| | | | | | | | |
| | | | | | | 1,809,034 | |
|
| Diversified Consumer Services — 0.3% | |
Carriage Services, Inc., 6.63%, 06/01/26(a) | | | 332 | | | | 353,580 | |
Graham Holdings Co., 5.75%, 06/01/26(a) | | | 40 | | | | 42,700 | |
Prime Security Services Borrower LLC/Prime Finance, Inc.(a): | | | | | | | | |
5.25%, 04/15/24 | | | 100 | | | | 105,800 | |
5.75%, 04/15/26 | | | 182 | | | | 197,812 | |
Service Corp. International: | | | | | | | | |
4.63%, 12/15/27 | | | 50 | | | | 52,125 | |
5.13%, 06/01/29 | | | 55 | | | | 58,438 | |
ServiceMaster Co. LLC, 5.13%, 11/15/24(a) | | | 125 | | | | 129,687 | |
| | | | | | | | |
| | | | | | | 940,142 | |
|
| Diversified Financial Services — 3.8% | |
AerCap Ireland Capital DAC/AerCap Global Aviation Trust, 5.00%, 10/01/21 | | | 200 | | | | 209,712 | |
| | | | |
| SCHEDULE OF INVESTMENTS | | | 11 | |
| | |
Schedule of Investments (continued) December 31, 2019 | | BlackRock Systematic Multi-Strategy Fund (Percentages shown are based on Net Assets) |
| | | | | | | | |
| Security | | Par
(000) | | | Value | |
|
| Diversified Financial Services (continued) | |
Ares Capital Corp.: | | | | | | | | |
3.50%, 02/10/23 | | $ | 300 | | | $ | 304,516 | |
4.20%, 06/10/24 | | | 100 | | | | 104,720 | |
4.25%, 03/01/25 | | | 50 | | | | 52,247 | |
Bank of America Corp.(d): | | | | | | | | |
(3 mo. LIBOR US + 0.63%), 2.33%, 10/01/21 | | | 480 | | | | 481,368 | |
(3 mo. LIBOR US + 1.02%), 2.88%, 04/24/23 | | | 50 | | | | 50,841 | |
(3 mo. LIBOR US + 0.79%), 3.00%, 12/20/23 | | | 453 | | | | 463,575 | |
(3 mo. LIBOR US + 0.97%), 3.46%, 03/15/25 | | | 200 | | | | 208,857 | |
(3 mo. LIBOR US + 1.06%), 3.56%, 04/23/27 | | | 500 | | | | 528,527 | |
(3 mo. LIBOR US + 1.31%), 4.27%, 07/23/29 | | | 45 | | | | 50,018 | |
Citigroup, Inc.: | | | | | | | | |
2.90%, 12/08/21 | | | 500 | | | | 508,217 | |
4.50%, 01/14/22 | | | 50 | | | | 52,424 | |
2.75%, 04/25/22 | | | 100 | | | | 101,602 | |
(Secured Overnight Financing Rate + 0.87%), 2.31%, 11/04/22(d) | | | 500 | | | | 501,557 | |
(3 mo. LIBOR US + 0.95%), 2.88%, 07/24/23(d) | | | 600 | | | | 610,152 | |
(3 mo. LIBOR US + 1.02%), 4.04%, 06/01/24(d) | | | 50 | | | | 52,896 | |
(3 mo. LIBOR US + 0.90%), 3.35%, 04/24/25(d) | | | 225 | | | | 234,181 | |
(3 mo. LIBOR US + 1.34%), 3.98%, 03/20/30(d) | | | 510 | | | | 558,353 | |
Deutsche Bank AG (5 year USD Swap + 2.25%), 4.30%, 05/24/28(d) | | | 400 | | | | 383,225 | |
Ford Motor Credit Co. LLC: | | | | | | | | |
3.47%, 04/05/21 | | | 200 | | | | 201,855 | |
5.60%, 01/07/22 | | | 200 | | | | 210,777 | |
5.58%, 03/18/24 | | | 400 | | | | 433,016 | |
General Motors Financial Co., Inc.: | | | | | | | | |
4.20%, 03/01/21 | | | 50 | | | | 51,081 | |
3.20%, 07/06/21 | | | 550 | | | | 557,594 | |
4.20%, 11/06/21 | | | 65 | | | | 67,391 | |
3.45%, 04/10/22 | | | 50 | | | | 51,137 | |
3.55%, 07/08/22 | | | 690 | | | | 710,306 | |
3.25%, 01/05/23 | | | 50 | | | | 51,105 | |
4.15%, 06/19/23 | | | 195 | | | | 204,845 | |
5.10%, 01/17/24 | | | 300 | | | | 325,690 | |
Horizon Pharma USA, Inc., 5.50%, 08/01/27(a) | | | 200 | | | | 216,020 | |
Intercontinental Exchange, Inc., 3.75%, 12/01/25 | | | 605 | | | | 651,535 | |
Intesa Sanpaolo SpA, 5.02%, 06/26/24(a) | | | 200 | | | | 210,155 | |
John Deere Capital Corp.: | | | | | | | | |
2.30%, 06/07/21 | | | 200 | | | | 201,390 | |
2.60%, 03/07/24 | | | 40 | | | | 40,919 | |
JPMorgan Chase & Co.: | | | | | | | | |
2.40%, 06/07/21 | | | 500 | | | | 503,298 | |
2.97%, 01/15/23 | | | 600 | | | | 611,357 | |
(3 mo. LIBOR US + 0.70%), 3.21%, 04/01/23(d) | | | 700 | | | | 716,693 | |
3.88%, 09/10/24 | | | 25 | | | | 26,764 | |
(3 mo. LIBOR US + 1.00%), 4.02%, 12/05/24(d) | | | 400 | | | | 426,589 | |
3.13%, 01/23/25 | | | 50 | | | | 52,182 | |
(3 mo. LIBOR US + 1.16%), 3.22%, 03/01/25(d) | | | 50 | | | | 51,839 | |
3.30%, 04/01/26 | | | 50 | | | | 52,633 | |
(3 mo. LIBOR US + 1.34%), 3.78%, 02/01/28(d) | | | 300 | | | | 323,516 | |
(3 mo. LIBOR US + 1.26%), 4.20%, 07/23/29(d) | | | 35 | | | | 39,070 | |
(3 mo. LIBOR US + 1.16%), 3.70%, 05/06/30(d) | | | 250 | | | | 269,345 | |
Mitsubishi UFJ Financial Group, Inc., 3.46%, 03/02/23 | | | 50 | | | | 51,749 | |
Murphy Oil USA, Inc., 4.75%, 09/15/29 | | | 150 | | | | 158,411 | |
ORIX Corp., 2.90%, 07/18/22 | | | 25 | | | | 25,488 | |
Quicken Loans, Inc., 5.75%, 05/01/25(a) | | | 15 | | | | 15,506 | |
S&P Global, Inc.: | | | | | | | | |
4.40%, 02/15/26 | | | 100 | | | | 110,909 | |
2.50%, 12/01/29 | | | 115 | | | | 115,089 | |
Sally Holdings LLC/Sally Capital, Inc., 5.63%, 12/01/25 | | | 25 | | | | 26,178 | |
Spectrum Brands, Inc., 5.00%, 10/01/29(a) | | | 20 | | | | 20,650 | |
| | | | | | | | |
| Security | | Par
(000) | | | Value | |
|
| Diversified Financial Services (continued) | |
Voyager Aviation Holdings LLC/Voyager Finance Co., 8.50%, 08/15/21(a) | | $ | 25 | | | $ | 25,613 | |
| | | | | | | | |
| | | | | | | 13,264,683 | |
|
| Diversified Telecommunication Services — 1.2% | |
AT&T, Inc.: | | | | | | | | |
3.88%, 08/15/21 | | | 500 | | | | 515,177 | |
3.20%, 03/01/22 | | | 40 | | | | 40,950 | |
3.60%, 02/17/23 | | | 970 | | | | 1,012,483 | |
3.80%, 03/01/24 | | | 580 | | | | 615,588 | |
4.35%, 03/01/29 | | | 25 | | | | 27,813 | |
CC Holdings GS V LLC/Crown Castle GS III Corp., 3.85%, 04/15/23 | | | 25 | | | | 26,206 | |
CenturyLink, Inc.: | | | | | | | | |
5.13%, 12/15/26(a) | | | 195 | | | | 198,438 | |
Series G, 6.88%, 01/15/28 | | | 50 | | | | 55,125 | |
Series P, 7.60%, 09/15/39 | | | 50 | | | | 52,250 | |
Series S, 6.45%, 06/15/21 | | | 50 | | | | 52,338 | |
Series Y, 7.50%, 04/01/24 | | | 25 | | | | 28,188 | |
Cincinnati Bell, Inc., 7.00%, 07/15/24(a) | | | 50 | | | | 52,437 | |
Embarq Corp., 8.00%, 06/01/36 | | | 75 | | | | 79,312 | |
Frontier Communications Corp.: | | | | | | | | |
10.50%, 09/15/22 | | | 25 | | | | 12,188 | |
11.00%, 09/15/25 | | | 10 | | | | 4,850 | |
8.50%, 04/01/26(a) | | | 60 | | | | 60,750 | |
Level 3 Financing, Inc.: | | | | | | | | |
5.38%, 01/15/24 | | | 100 | | | | 101,625 | |
5.25%, 03/15/26 | | | 25 | | | | 26,000 | |
4.63%, 09/15/27(a) | | | 95 | | | | 97,261 | |
Qwest Corp., 6.88%, 09/15/33 | | | 225 | | | | 226,012 | |
Sable International Finance Ltd., 5.75%, 09/07/27(a) | | | 200 | | | | 212,000 | |
Telecom Italia Capital SA: | | | | | | | | |
6.00%, 09/30/34 | | | 200 | | | | 214,500 | |
7.72%, 06/04/38 | | | 50 | | | | 61,500 | |
Verizon Communications, Inc., 3.13%, 03/16/22 | | | 500 | | | | 513,197 | |
| | | | | | | | |
| | | | | | | 4,286,188 | |
|
| Electric Utilities — 0.6% | |
AEP Texas, Inc., 3.95%, 06/01/28 | | | 50 | | | | 54,372 | |
AES Corp., 4.00%, 03/15/21 | | | 100 | | | | 101,375 | |
Atlantic City Electric Co., 4.00%, 10/15/28 | | | 50 | | | | 55,791 | |
Avangrid, Inc., 3.80%, 06/01/29 | | | 100 | | | | 106,119 | |
Berkshire Hathaway Energy Co., 3.25%, 04/15/28 | | | 100 | | | | 105,731 | |
Dominion Energy, Inc., Series B, 2.75%, 01/15/22 | | | 50 | | | | 50,724 | |
DPL, Inc., 4.35%, 04/15/29(a) | | | 200 | | | | 192,994 | |
Duke Energy Corp.: | | | | | | | | |
3.05%, 08/15/22 | | | 50 | | | | 51,154 | |
3.40%, 06/15/29 | | | 100 | | | | 104,531 | |
Entergy Texas, Inc., 4.00%, 03/30/29 | | | 50 | | | | 55,133 | |
Evergy, Inc., 2.90%, 09/15/29 | | | 100 | | | | 99,530 | |
Eversource Energy, Series N, 3.80%, 12/01/23 | | | 100 | | | | 105,330 | |
Georgia Power Co., 3.25%, 03/30/27 | | | 50 | | | | 51,710 | |
MidAmerican Energy Co., 3.65%, 04/15/29 | | | 310 | | | | 339,004 | |
NextEra Energy Capital Holdings, Inc.: | | | | | | | | |
3.50%, 04/01/29 | | | 150 | | | | 159,684 | |
2.75%, 11/01/29 | | | 85 | | | | 85,453 | |
NextEra Energy Operating Partners LP(a): | | | | | | | | |
4.25%, 07/15/24 | | | 30 | | | | 31,238 | |
4.25%, 09/15/24 | | | 25 | | | | 26,000 | |
4.50%, 09/15/27 | | | 100 | | | | 104,250 | |
PSEG Power LLC, 3.85%, 06/01/23 | | | 100 | | | | 104,957 | |
Talen Energy Supply LLC(a): | | | | | | | | |
10.50%, 01/15/26 | | | 25 | | | | 23,781 | |
7.25%, 05/15/27 | | | 60 | | | | 63,132 | |
6.63%, 01/15/28 | | | 50 | | | | 51,000 | |
| | |
| 12 | | 2019 BLACKROCK ANNUAL REPORTTO SHAREHOLDERS |
| | |
Schedule of Investments (continued) December 31, 2019 | | BlackRock Systematic Multi-Strategy Fund (Percentages shown are based on Net Assets) |
| | | | | | | | |
| Security | | Par
(000) | | | Value | |
|
| Electric Utilities (continued) | |
Union Electric Co., 3.50%, 03/15/29 | | $ | 50 | | | $ | 53,746 | |
| | | | | | | | |
| | | | | | | 2,176,739 | |
|
| Electrical Equipment — 0.0% | |
Roper Technologies, Inc., 2.35%, 09/15/24 | | | 90 | | | | 90,516 | |
| | | | | | | | |
|
| Electronic Equipment, Instruments & Components — 0.1% | |
CDW LLC/CDW Finance Corp.: | | | | | | | | |
5.50%, 12/01/24 | | | 100 | | | | 111,000 | |
4.25%, 04/01/28 | | | 105 | | | | 110,119 | |
Keysight Technologies, Inc.: | | | | | | | | |
4.60%, 04/06/27 | | | 130 | | | | 144,189 | |
3.00%, 10/30/29 | | | 80 | | | | 80,266 | |
| | | | | | | | |
| | | | | | | 445,574 | |
|
| Energy Equipment & Services — 0.1% | |
Archrock Partners LP/Archrock Partners Finance Corp., 6.25%, 04/01/28(a) | | | 250 | | | | 257,500 | |
USA Compression Partners LP/USA Compression Finance Corp., 6.88%, 09/01/27 | | | 200 | | | | 208,320 | |
| | | | | | | | |
| | | | | | | 465,820 | |
|
| Environmental, Maintenance, & Security Service — 0.0% | |
Tervita Corp., 7.63%, 12/01/21(a) | | | 25 | | | | 25,156 | |
| | | | | | | | |
|
| Equity Real Estate Investment Trusts (REITs) — 0.8% | |
CoreCivic, Inc.: | | | | | | | | |
5.00%, 10/15/22 | | | 25 | | | | 25,125 | |
4.75%, 10/15/27 | | | 50 | | | | 43,250 | |
EPR Properties, 3.75%, 08/15/29 | | | 160 | | | | 162,207 | |
Five Point Operating Co. LP/Five Point Capital Corp., 7.88%, 11/15/25(a) | | | 150 | | | | 151,096 | |
GLP Capital LP/GLP Financing II, Inc., 5.38%, 04/15/26 | | | 140 | | | | 154,756 | |
Hilton Worldwide Finance LLC/Hilton Worldwide Finance Corp., 4.63%, 04/01/25 | | | 100 | | | | 102,750 | |
Iron Mountain, Inc.(a): | | | | | | | | |
4.88%, 09/15/27 | | | 50 | | | | 51,625 | |
4.88%, 09/15/29 | | | 30 | | | | 30,474 | |
MGM Growth Properties Operating Partnership LP/MGP FinanceCo-Issuer, Inc.: | | | | | | | | |
5.63%, 05/01/24 | | | 50 | | | | 54,687 | |
5.75%, 02/01/27(a) | | | 160 | | | | 178,400 | |
MPT Operating Partnership LP/MPT Finance Corp.: | | | | | | | | |
5.00%, 10/15/27 | | | 100 | | | | 106,000 | |
4.63%, 08/01/29 | | | 50 | | | | 51,500 | |
Omega Healthcare Investors, Inc., 4.50%, 04/01/27 | | | 350 | | | | 377,865 | |
Public Storage, 3.39%, 05/01/29 | | | 450 | | | | 478,124 | |
Ryman Hospitality Properties, Inc., 4.75%, 10/15/27(a) | | | 100 | | | | 103,250 | |
SBA Communications Corp., 4.88%, 09/01/24 | | | 200 | | | | 207,500 | |
Service Properties Trust: | | | | | | | | |
3.95%, 01/15/28 | | | 200 | | | | 195,158 | |
4.35%, 10/01/24 | | | 150 | | | | 154,153 | |
VICI Properties LP/VICI Note Co., Inc., 4.63%, 12/01/29(a) | | | 150 | | | | 156,375 | |
Welltower, Inc., 4.25%, 04/15/28 | | | 50 | | | | 54,847 | |
| | | | | | | | |
| | | | | | | 2,839,142 | |
|
| Food & Staples Retailing — 0.2% | |
Albertsons Cos., Inc./Safeway, Inc./New Albertsons LP/Albertson’s LLC, 4.63%, 01/15/27(a) | | | 100 | | | | 99,880 | |
Lamb Weston Holdings, Inc., 4.88%, 11/01/26(a) | | | 50 | | | | 53,000 | |
McCormick & Co., Inc., 3.15%, 08/15/24 | | | 300 | | | | 311,539 | |
Mondelez International, Inc.: | | | | | | | | |
3.63%, 05/07/23 | | | 100 | | | | 104,856 | |
3.63%, 02/13/26 | | | 150 | | | | 159,718 | |
| | | | | | | | |
| | | | | | | 728,993 | |
| | | | | | | | |
| Security | | Par
(000) | | | Value | |
|
| Food Products — 0.2% | |
JBS USA LUX SA/JBS USA Finance, Inc.(a): | | | | | | | | |
5.88%, 07/15/24 | | $ | 25 | | | $ | 25,711 | |
5.75%, 06/15/25 | | | 50 | | | | 51,812 | |
JBS USA LUX SA/JBS USA Food Co./JBS USA Finance, Inc.(a): | | | | | | | | |
6.50%, 04/15/29 | | | 50 | | | | 55,564 | |
5.50%, 01/15/30 | | | 100 | | | | 107,410 | |
Performance Food Group, Inc., 5.50%, 10/15/27(a) | | | 30 | | | | 32,063 | |
Pilgrim’s Pride Corp.(a): | | | | | | | | |
5.75%, 03/15/25 | | | 100 | | | | 103,363 | |
5.88%, 09/30/27 | | | 125 | | | | 135,156 | |
Post Holdings, Inc.(a): | | | | | | | | |
5.00%, 08/15/26 | | | 50 | | | | 52,812 | |
5.75%, 03/01/27 | | | 25 | | | | 26,813 | |
5.63%, 01/15/28 | | | 50 | | | | 53,875 | |
Simmons Foods, Inc., 5.75%, 11/01/24(a) | | | 50 | | | | 50,250 | |
| | | | | | | | |
| | | | | | | 694,829 | |
|
| Gas Utilities — 0.1% | |
NiSource, Inc., 3.65%, 06/15/23 | | | 45 | | | | 46,877 | |
Piedmont Natural Gas Co., Inc., 3.50%, 06/01/29 | | | 50 | | | | 53,473 | |
Sempra Energy, 3.40%, 02/01/28 | | | 50 | | | | 51,834 | |
Suburban Propane Partners LP/Suburban Energy Finance Corp.: | | | | | | | | |
5.50%, 06/01/24 | | | 50 | | | | 51,375 | |
5.88%, 03/01/27 | | | 225 | | | | 234,000 | |
| | | | | | | | |
| | | | | | | 437,559 | |
|
| Health Care Equipment & Supplies — 0.3% | |
Abbott Laboratories, 3.40%, 11/30/23 | | | 70 | | | | 73,597 | |
Becton Dickinson & Co., 2.89%, 06/06/22 | | | 30 | | | | 30,499 | |
Boston Scientific Corp., 3.38%, 05/15/22 | | | 50 | | | | 51,638 | |
DH Europe Finance II Sarl: | | | | | | | | |
2.05%, 11/15/22 | | | 275 | | | | 275,301 | |
2.60%, 11/15/29 | | | 110 | | | | 109,601 | |
Hill-Rom Holdings, Inc.(a): | | | | | | | | |
5.00%, 02/15/25 | | | 25 | | | | 26,000 | |
4.38%, 09/15/27 | | | 25 | | | | 25,719 | |
Hologic, Inc., 4.38%, 10/15/25(a) | | | 200 | | | | 206,500 | |
Medtronic, Inc., 3.15%, 03/15/22 | | | 118 | | | | 121,365 | |
Ortho-Clinical Diagnostics, Inc./Ortho-Clinical Diagnostics SA, 6.63%, 05/15/22(a) | | | 25 | | | | 24,844 | |
Teleflex, Inc., 4.88%, 06/01/26 | | | 75 | | | | 78,375 | |
| | | | | | | | |
| | | | | | | 1,023,439 | |
|
| Health Care Providers & Services — 1.3% | |
Anthem, Inc., 2.95%, 12/01/22 | | | 25 | | | | 25,577 | |
Centene Corp.(a): | | | | | | | | |
5.38%, 06/01/26 | | | 30 | | | | 31,838 | |
4.25%, 12/15/27 | | | 500 | | | | 514,375 | |
CHS/Community Health Systems, Inc.: | | | | | | | | |
6.25%, 03/31/23 | | | 100 | | | | 101,500 | |
8.00%, 03/15/26(a) | | | 100 | | | | 103,000 | |
DaVita, Inc., 5.13%, 07/15/24 | | | 25 | | | | 25,625 | |
Encompass Health Corp., 5.75%, 11/01/24 | | | 15 | | | | 15,169 | |
Envision Healthcare Crop., 8.75%, 10/15/26(a) | | | 25 | | | | 15,500 | |
HCA, Inc.: | | | | | | | | |
5.00%, 03/15/24 | | | 50 | | | | 54,658 | |
5.25%, 04/15/25 | | | 285 | | | | 318,889 | |
5.88%, 02/15/26 | | | 100 | | | | 113,713 | |
5.25%, 06/15/26 | | | 100 | | | | 112,033 | |
5.38%, 09/01/26 | | | 10 | | | | 11,138 | |
4.50%, 02/15/27 | | | 100 | | | | 107,849 | |
5.63%, 09/01/28 | | | 110 | | | | 125,356 | |
5.88%, 02/01/29 | | | 80 | | | | 92,500 | |
4.13%, 06/15/29 | | | 880 | | | | 933,750 | |
| | | | |
| SCHEDULE OF INVESTMENTS | | | 13 | |
| | |
Schedule of Investments (continued) December 31, 2019 | | BlackRock Systematic Multi-Strategy Fund (Percentages shown are based on Net Assets) |
| | | | | | | | |
| Security | | Par
(000) | | | Value | |
|
| Health Care Providers & Services (continued) | |
Select Medical Corp., 6.25%, 08/15/26(a) | | $ | 325 | | | $ | 351,819 | |
Tenet Healthcare Corp.: | | | | | | | | |
6.75%, 06/15/23 | | | 25 | | | | 27,468 | |
4.63%, 07/15/24 | | | 50 | | | | 51,187 | |
4.88%, 01/01/26(a) | | | 100 | | | | 104,740 | |
6.25%, 02/01/27(a) | | | 100 | | | | 107,625 | |
5.13%, 11/01/27(a) | | | 300 | | | | 316,875 | |
UnitedHealth Group, Inc.: | | | | | | | | |
3.35%, 07/15/22 | | | 250 | | | | 258,954 | |
2.38%, 10/15/22 | | | 500 | | | | 506,255 | |
3.10%, 03/15/26 | | | 50 | | | | 52,374 | |
WellCare Health Plans, Inc.: | | | | | | | | |
5.25%, 04/01/25 | | | 100 | | | | 104,000 | |
5.38%, 08/15/26(a) | | | 85 | | | | 90,525 | |
| | | | | | | | |
| | | | | | | 4,674,292 | |
|
| Health Care Technology — 0.1% | |
IQVIA, Inc., 5.00%, 10/15/26(a) | | | 200 | | | | 211,000 | |
| | | | | | | | |
|
| Hotels, Restaurants & Leisure — 1.3% | |
1011778 BC ULC/New Red Finance, Inc.(a): | | | | | | | | |
4.25%, 05/15/24 | | | 200 | | | | 205,000 | |
5.00%, 10/15/25 | | | 125 | | | | 129,062 | |
3.88%, 01/15/28 | | | 55 | | | | 55,137 | |
Boyd Gaming Corp., 6.00%, 08/15/26 | | | 10 | | | | 10,725 | |
Cedar Fair LP, 5.25%, 07/15/29(a) | | | 15 | | | | 16,163 | |
Churchill Downs, Inc., 5.50%, 04/01/27(a) | | | 200 | | | | 212,000 | |
Darden Restaurants, Inc., 3.85%, 05/01/27 | | | 30 | | | | 31,364 | |
Eldorado Resorts, Inc., 6.00%, 09/15/26 | | | 10 | | | | 11,013 | |
GLP Capital LP/GLP Financing II, Inc., 5.25%, 06/01/25 | | | 450 | | | | 493,920 | |
Golden Nugget, Inc., 6.75%, 10/15/24(a) | | | 50 | | | | 51,750 | |
Hilton Domestic Operating Co., Inc.: | | | | | | | | |
5.13%, 05/01/26 | | | 125 | | | | 131,562 | |
4.88%, 01/15/30 | | | 375 | | | | 397,277 | |
Hilton Worldwide Finance LLC/Hilton Worldwide Finance Corp., 4.88%, 04/01/27 | | | 50 | | | | 53,125 | |
KFC Holding Co./Pizza Hut Holdings LLC/Taco Bell of America LLC(a): | | | | | | | | |
5.25%, 06/01/26 | | | 125 | | | | 131,875 | |
4.75%, 06/01/27 | | | 125 | | | | 131,562 | |
Las Vegas Sands Corp.: | | | | | | | | |
3.20%, 08/08/24 | | | 135 | | | | 138,997 | |
2.90%, 06/25/25 | | | 210 | | | | 212,232 | |
3.50%, 08/18/26 | | | 700 | | | | 720,155 | |
3.90%, 08/08/29 | | | 102 | | | | 106,503 | |
MGM Resorts International: | | | | | | | | |
7.75%, 03/15/22 | | | 100 | | | | 111,875 | |
5.50%, 04/15/27 | | | 150 | | | | 166,500 | |
Scientific Games International, Inc.(a): | | | | | | | | |
5.00%, 10/15/25 | | | 25 | | | | 26,156 | |
7.00%, 05/15/28 | | | 50 | | | | 53,625 | |
7.25%, 11/15/29 | | | 100 | | | | 108,500 | |
Starbucks Corp., 3.55%, 08/15/29 | | | 40 | | | | 43,394 | |
Stars Group Holdings BV/Stars Group USCo-Borrower LLC, 7.00%, 07/15/26(a) | | | 10 | | | | 10,825 | |
Wyndham Destinations, Inc.: | | | | | | | | |
5.40%, 04/01/24 | | | 100 | | | | 105,875 | |
5.75%, 04/01/27 | | | 300 | | | | 325,500 | |
Wyndham Hotels & Resorts, Inc., 5.38%, 04/15/26(a) | | | 50 | | | | 52,750 | |
Wynn Las Vegas LLC/Wynn Las Vegas Capital Corp.(a): | | | | | | | | |
4.25%, 05/30/23 | | | 50 | | | | 52,366 | |
5.50%, 03/01/25 | | | 50 | | | | 53,500 | |
Yum! Brands, Inc., 4.75%, 01/15/30(a) | | | 300 | | | | 314,250 | |
| | | | | | | | |
| | | | | | | 4,664,538 | |
| | | | | | | | |
| Security | | Par
(000) | | | Value | |
|
| Household Durables — 0.6% | |
Beazer Homes USA, Inc.: | | | | | | | | |
5.88%, 10/15/27 | | $ | 100 | | | $ | 101,000 | |
7.25%, 10/15/29(a) | | | 60 | | | | 64,050 | |
Brookfield Residential Properties, Inc./Brookfield Residential US Corp., 6.25%, 09/15/27(a) | | | 235 | | | | 247,925 | |
KB Home, 4.80%, 11/15/29 | | | 300 | | | | 306,750 | |
Lennar Corp.: | | | | | | | | |
4.13%, 01/15/22 | | | 100 | | | | 102,250 | |
5.88%, 11/15/24 | | | 50 | | | | 55,750 | |
4.75%, 11/29/27 | | | 50 | | | | 53,875 | |
Mattamy Group Corp., 5.25%, 12/15/27(a) | | | 40 | | | | 41,600 | |
MDC Holdings, Inc.: | | | | | | | | |
5.50%, 01/15/24 | | | 50 | | | | 54,375 | |
6.00%, 01/15/43 | | | 100 | | | | 104,000 | |
Meritage Homes Corp., 5.13%, 06/06/27 | | | 100 | | | | 106,750 | |
Newell Brands, Inc., 4.20%, 04/01/26 | | | 250 | | | | 260,689 | |
PulteGroup, Inc.: | | | | | | | | |
5.50%, 03/01/26 | | | 100 | | | | 111,750 | |
5.00%, 01/15/27 | | | 200 | | | | 217,800 | |
Shea Homes LP/Shea Homes Funding Corp., 6.13%, 04/01/25(a) | | | 25 | | | | 25,875 | |
Taylor Morrison Communities, Inc.(a): | | | | | | | | |
5.88%, 06/15/27 | | | 100 | | | | 110,000 | |
5.75%, 01/15/28 | | | 100 | | | | 109,000 | |
Toll Brothers Finance Corp., 4.35%, 02/15/28 | | | 25 | | | | 26,062 | |
TRI Pointe Group, Inc./TRI Pointe Homes, Inc., 5.88%, 06/15/24 | | | 50 | | | | 54,375 | |
| | | | | | | | |
| | | | | | | 2,153,876 | |
|
| Independent Power and Renewable Electricity Producers — 0.3% | |
Calpine Corp.(a): | | | | | | | | |
5.25%, 06/01/26 | | | 250 | | | | 260,312 | |
4.50%, 02/15/28 | | | 45 | | | | 45,399 | |
5.13%, 03/15/28 | | | 345 | | | | 352,141 | |
Clearway Energy Operating LLC, 5.75%, 10/15/25 | | | 40 | | | | 42,100 | |
NRG Energy, Inc.: | | | | | | | | |
6.63%, 01/15/27 | | | 100 | | | | 108,500 | |
5.25%, 06/15/29(a) | | | 150 | | | | 162,188 | |
TerraForm Power Operating LLC(a): | | | | | | | | |
4.25%, 01/31/23 | | | 50 | | | | 51,474 | |
5.00%, 01/31/28 | | | 75 | | | | 79,298 | |
| | | | | | | | |
| | | | | | | 1,101,412 | |
|
| Insurance — 0.9% | |
Acrisure LLC/Acrisure Finance, Inc., 8.13%, 02/15/24(a) | | | 100 | | | | 108,750 | |
American International Group, Inc., 4.88%, 06/01/22 | | | 250 | | | | 266,906 | |
AmWINS Group, Inc., 7.75%, 07/01/26(a) | | | 40 | | | | 44,205 | |
Fidelity & Guaranty Life Holdings, Inc., 5.50%, 05/01/25(a) | | | 15 | | | | 15,975 | |
Markel Corp., 3.35%, 09/17/29 | | | 205 | | | | 210,020 | |
Marsh & McLennan Cos., Inc.: | | | | | | | | |
3.88%, 03/15/24 | | | 625 | | | | 666,748 | |
3.50%, 03/10/25 | | | 200 | | | | 211,140 | |
4.38%, 03/15/29 | | | 600 | | | | 684,085 | |
Nationstar Mortgage Holdings, Inc., 9.13%, 07/15/26(a) | | | 500 | | | | 553,750 | |
Radian Group, Inc., 4.50%, 10/01/24 | | | 50 | | | | 52,875 | |
Trinity Acquisition PLC, 3.50%, 09/15/21 | | | 50 | | | | 50,962 | |
Willis North America, Inc., 4.50%, 09/15/28 | | | 130 | | | | 143,361 | |
| | | | | | | | |
| | | | | | | 3,008,777 | |
|
| Interactive Media & Services — 0.3% | |
Match Group, Inc., 5.63%, 02/15/29(a) | | | 35 | | | | 37,275 | |
Netflix, Inc.: | | | | | | | | |
4.88%, 04/15/28 | | | 100 | | | | 103,870 | |
5.88%, 11/15/28 | | | 150 | | | | 166,284 | |
5.38%, 11/15/29(a) | | | 150 | | | | 159,747 | |
| | |
| 14 | | 2019 BLACKROCK ANNUAL REPORTTO SHAREHOLDERS |
| | |
Schedule of Investments (continued) December 31, 2019 | | BlackRock Systematic Multi-Strategy Fund (Percentages shown are based on Net Assets) |
| | | | | | | | |
| Security | | Par
(000) | | | Value | |
|
| Interactive Media & Services (continued) | |
NortonLifeLock, Inc., 5.00%, 04/15/25(a) | | $ | 300 | | | $ | 306,519 | |
VeriSign, Inc.: | | | | | | | | |
4.63%, 05/01/23 | | | 35 | | | | 35,560 | |
5.25%, 04/01/25 | | | 50 | | | | 55,116 | |
4.75%, 07/15/27 | | | 150 | | | | 158,250 | |
| | | | | | | | |
| | | | | | | 1,022,621 | |
|
| Internet & Direct Marketing Retail — 0.5% | |
Alibaba Group Holding Ltd.: | | | | | | | | |
2.80%, 06/06/23 | | | 500 | | | | 506,490 | |
3.60%, 11/28/24 | | | 400 | | | | 420,320 | |
3.40%, 12/06/27 | | | 500 | | | | 521,260 | |
Expedia Group, Inc., 4.50%, 08/15/24 | | | 125 | | | | 133,449 | |
| | | | | | | | |
| | | | | | | 1,581,519 | |
|
| IT Services — 0.5% | |
Camelot Finance SA, 4.50%, 11/01/26(a) | | | 80 | | | | 82,200 | |
Fair Isaac Corp., 4.00%, 06/15/28(a) | | | 90 | | | | 90,675 | |
Fiserv, Inc., 3.20%, 07/01/26 | | | 75 | | | | 77,673 | |
Global Payments, Inc., 4.80%, 04/01/26 | | | 200 | | | | 222,623 | |
International Business Machines Corp.: | | | | | | | | |
2.85%, 05/13/22 | | | 700 | | | | 715,836 | |
3.00%, 05/15/24 | | | 150 | | | | 155,658 | |
j2 Cloud Services LLC/j2 GlobalCo-Obligor, Inc., 6.00%, 07/15/25(a) | | | 50 | | | | 53,000 | |
Outfront Media Capital LLC/Outfront Media Capital Corp., 5.00%, 08/15/27(a) | | | 25 | | | | 26,187 | |
Verisk Analytics, Inc.: | | | | | | | | |
4.13%, 03/15/29 | | | 100 | | | | 109,823 | |
4.00%, 06/15/25 | | | 50 | | | | 53,843 | |
Xerox Corp., 4.13%, 03/15/23 | | | 100 | | | | 103,625 | |
| | | | | | | | |
| | | | | | | 1,691,143 | |
|
| Leisure Products — 0.1% | |
Hasbro, Inc., 3.55%, 11/19/26 | | | 210 | | | | 211,475 | |
| | | | | | | | |
|
| Machinery — 0.0% | |
Colfax Corp., 6.00%, 02/15/24(a) | | | 60 | | | | 63,750 | |
Mueller Water Products, Inc., 5.50%, 06/15/26(a) | | | 5 | | | | 5,269 | |
| | | | | | | | |
| | | | | | | 69,019 | |
|
| Media — 1.9% | |
Altice Financing SA, 6.63%, 02/15/23(a) | | | 200 | | | | 203,500 | |
Altice France SA, 7.38%, 05/01/26(a) | | | 200 | | | | 214,728 | |
Altice Luxembourg SA, 10.50%, 05/15/27(a) | | | 200 | | | | 228,010 | |
AMC Networks, Inc., 4.75%, 08/01/25 | | | 25 | | | | 25,094 | |
CCO Holdings LLC/CCO Holdings Capital Corp.: | | | | | | | | |
5.25%, 09/30/22 | | | 50 | | | | 50,563 | |
5.88%, 04/01/24(a) | | | 175 | | | | 180,906 | |
5.75%, 02/15/26(a) | | | 25 | | | | 26,376 | |
5.13%, 05/01/27(a) | | | 250 | | | | 263,750 | |
5.00%, 02/01/28(a) | | | 100 | | | | 104,932 | |
5.38%, 06/01/29(a) | | | 100 | | | | 107,000 | |
4.75%, 03/01/30(a) | | | 405 | | | | 412,302 | |
Charter Communications Operating LLC/Charter Communications Operating Capital: | | | | | | | | |
3.58%, 07/23/20 | | | 50 | | | | 50,319 | |
4.46%, 07/23/22 | | | 640 | | | | 672,748 | |
4.50%, 02/01/24 | | | 100 | | | | 107,623 | |
5.05%, 03/30/29 | | | 300 | | | | 340,397 | |
Clear Channel Worldwide Holdings, Inc., 9.25%, 02/15/24(a) | | | 50 | | | | 55,375 | |
Comcast Corp.: | | | | | | | | |
3.70%, 04/15/24 | | | 65 | | | | 69,329 | |
3.95%, 10/15/25 | | | 430 | | | | 469,307 | |
2.65%, 02/01/30 | | | 435 | | | | 436,864 | |
| | | | | | | | |
| Security | | Par
(000) | | | Value | |
|
| Media (continued) | |
CSC Holdings LLC: | | | | | | | | |
5.25%, 06/01/24 | | $ | 200 | | | $ | 215,500 | |
5.50%, 05/15/26(a) | | | 200 | | | | 211,748 | |
6.50%, 02/01/29(a) | | | 200 | | | | 223,000 | |
Diamond Sports Group LLC/Diamond Sports Finance Co.(a): | | | | | | | | |
5.38%, 08/15/26 | | | 100 | | | | 101,155 | |
6.63%, 08/15/27 | | | 50 | | | | 48,625 | |
DISH DBS Corp.: | | | | | | | | |
5.88%, 07/15/22 | | | 100 | | | | 106,000 | |
5.00%, 03/15/23 | | | 50 | | | | 51,292 | |
5.88%, 11/15/24 | | | 225 | | | | 229,922 | |
7.75%, 07/01/26 | | | 75 | | | | 79,454 | |
Fox Corp., 4.03%, 01/25/24(a) | | | 35 | | | | 37,298 | |
Gray Television, Inc., 5.88%, 07/15/26(a) | | | 14 | | | | 14,893 | |
Hughes Satellite Systems Corp.: | | | | | | | | |
5.25%, 08/01/26 | | | 135 | | | | 148,162 | |
6.63%, 08/01/26 | | | 350 | | | | 388,500 | |
Intelsat Jackson Holdings SA(a): | | | | | | | | |
8.50%, 10/15/24 | | | 30 | | | | 27,325 | |
9.75%, 07/15/25 | | | 50 | | | | 46,250 | |
MDC Partners, Inc., 6.50%, 05/01/24(a) | | | 100 | | | | 90,500 | |
Sirius XM Radio, Inc.(a): | | | | | | | | |
5.38%, 04/15/25 | | | 35 | | | | 36,165 | |
5.50%, 07/01/29 | | | 175 | | | | 189,217 | |
Time Warner Cable LLC, 4.00%, 09/01/21 | | | 20 | | | | 20,466 | |
Univision Communications, Inc., 5.13%, 02/15/25(a) | | | 15 | | | | 14,831 | |
Walt Disney Co., 1.65%, 09/01/22 | | | 230 | | | | 229,435 | |
| | | | | | | | |
| | | | | | | 6,528,861 | |
|
| Metals & Mining — 0.4% | |
Allegheny Technologies, Inc., 5.88%, 12/01/27 | | | 50 | | | | 52,500 | |
Cleveland-Cliffs, Inc.: | | | | | | | | |
5.75%, 03/01/25 | | | 20 | | | | 19,738 | |
5.88%, 06/01/27(a) | | | 150 | | | | 144,000 | |
Commercial Metals Co., 5.75%, 04/15/26 | | | 50 | | | | 52,250 | |
FMG Resources August 2006 Property Ltd., 4.50%, 09/15/27(a) | | | 65 | | | | 66,625 | |
Freeport-McMoRan, Inc.: | | | | | | | | |
3.55%, 03/01/22 | | | 50 | | | | 50,625 | |
3.88%, 03/15/23 | | | 100 | | | | 101,823 | |
5.00%, 09/01/27 | | | 100 | | | | 105,000 | |
5.25%, 09/01/29 | | | 50 | | | | 53,565 | |
5.45%, 03/15/43 | | | 25 | | | | 25,875 | |
Hudbay Minerals, Inc., 7.63%, 01/15/25(a) | | | 50 | | | | 52,775 | |
Kaiser Aluminum Corp., 4.63%, 03/01/28(a) | | | 400 | | | | 410,400 | |
Mineral Resources Ltd., 8.13%, 05/01/27(a) | | | 100 | | | | 109,750 | |
New Gold, Inc., 6.25%, 11/15/22(a) | | | 50 | | | | 49,766 | |
Rio Tinto Finance USA Ltd., 3.75%, 06/15/25 | | | 100 | | | | 107,528 | |
Steel Dynamics, Inc., 5.50%, 10/01/24 | | | 50 | | | | 51,505 | |
| | | | | | | | |
| | | | | | | 1,453,725 | |
|
| Multi-Utilities — 0.1% | |
AmeriGas Partners LP/AmeriGas Finance Corp.: | | | | | | | | |
5.63%, 05/20/24 | | | 45 | | | | 48,600 | |
5.75%, 05/20/27 | | | 100 | | | | 109,750 | |
National Fuel Gas Co., 3.95%, 09/15/27 | | | 40 | | | | 41,450 | |
| | | | | | | | |
| | | | | | | 199,800 | |
|
| Office Supplies & Equipment — 0.1% | |
VMware, Inc.: | | | | | | | | |
2.30%, 08/21/20 | | | 300 | | | | 300,424 | |
2.95%, 08/21/22 | | | 40 | | | | 40,758 | |
3.90%, 08/21/27 | | | 50 | | | | 52,341 | |
| | | | | | | | |
| | | | | | | 393,523 | |
| | | | |
| SCHEDULE OF INVESTMENTS | | | 15 | |
| | |
Schedule of Investments (continued) December 31, 2019 | | BlackRock Systematic Multi-Strategy Fund (Percentages shown are based on Net Assets) |
| | | | | | | | |
| Security | | Par
(000) | | | Value | |
|
| Oil, Gas & Consumable Fuels — 2.2% | |
Antero Midstream Partners LP/Antero Midstream Finance Corp., 5.38%, 09/15/24 | | $ | 100 | | | $ | 92,750 | |
BP Capital Markets America, Inc., 2.52%, 09/19/22 | | | 500 | | | | 506,607 | |
Buckeye Partners LP: | | | | | | | | |
4.15%, 07/01/23 | | | 100 | | | | 100,548 | |
3.95%, 12/01/26 | | | 100 | | | | 96,603 | |
Calumet Specialty Products Partners LP / Calumet Finance Corp., 11.00%, 04/15/25(a) | | | 25 | | | | 27,188 | |
Cheniere Corpus Christi Holdings LLC, 5.88%, 03/31/25 | | | 80 | | | | 89,957 | |
Cheniere Energy Partners LP: | | | | | | | | |
5.63%, 10/01/26 | | | 135 | | | | 142,762 | |
4.50%, 10/01/29(a) | | | 195 | | | | 200,382 | |
Series WI, 5.25%, 10/01/25 | | | 150 | | | | 156,313 | |
CNX Resources Corp.: | | | | | | | | |
5.88%, 04/15/22 | | | 25 | | | | 25,018 | |
7.25%, 03/14/27(a) | | | 175 | | | | 153,072 | |
Comstock Resources, Inc., 9.75%, 08/15/26 | | | 50 | | | | 45,375 | |
Crestwood Midstream Partners LP/Crestwood Midstream Finance Corp., 5.63%, 05/01/27(a) | | | 150 | | | | 152,062 | |
CrownRock LP/CrownRock Finance, Inc., 5.63%, 10/15/25(a) | | | 25 | | | | 25,500 | |
DCP Midstream Operating LP, 5.38%, 07/15/25 | | | 130 | | | | 141,375 | |
EnLink Midstream Partners LP: | | | | | | | | |
4.85%, 07/15/26 | | | 50 | | | | 46,875 | |
5.60%, 04/01/44 | | | 50 | | | | 40,500 | |
Extraction Oil & Gas, Inc., 5.63%, 02/01/26(a) | | | 50 | | | | 30,000 | |
Exxon Mobil Corp., 2.02%, 08/16/24 | | | 300 | | | | 301,086 | |
Genesis Energy LP/Genesis Energy Finance Corp., 6.50%, 10/01/25 | | | 100 | | | | 96,750 | |
Gulfport Energy Corp., 6.38%, 05/15/25 | | | 25 | | | | 15,875 | |
Hilcorp Energy I LP/Hilcorp Finance Co.(a): | | | | | | | | |
5.75%, 10/01/25 | | | 50 | | | | 48,752 | |
6.25%, 11/01/28 | | | 20 | | | | 19,000 | |
Kinder Morgan Energy Partners LP, 5.00%, 10/01/21 | | | 400 | | | | 416,959 | |
Matador Resources Co., 5.88%, 09/15/26 | | | 10 | | | | 10,025 | |
MEG Energy Corp., 6.50%, 01/15/25(a) | | | 50 | | | | 52,005 | |
Murphy Oil Corp.: | | | | | | | | |
5.75%, 08/15/25 | | | 75 | | | | 78,446 | |
5.88%, 12/01/27 | | | 80 | | | | 84,000 | |
5.88%, 12/01/42 | | | 50 | | | | 46,000 | |
Nabors Industries, Inc.: | | | | | | | | |
4.63%, 09/15/21 | | | 100 | | | | 99,375 | |
5.50%, 01/15/23 | | | 50 | | | | 48,000 | |
5.75%, 02/01/25 | | | 100 | | | | 90,000 | |
NGL Energy Partners LP/NGL Energy Finance Corp.: | | | | | | | | |
7.50%, 11/01/23 | | | 50 | | | | 50,000 | |
7.50%, 04/15/26(a) | | | 135 | | | | 130,612 | |
NuStar Logistics LP: | | | | | | | | |
6.00%, 06/01/26 | | | 95 | | | | 100,463 | |
5.63%, 04/28/27 | | | 50 | | | | 51,375 | |
Oasis Petroleum, Inc., 6.25%, 05/01/26(a) | | | 10 | | | | 8,300 | |
ONEOK Partners LP: | | | | | | | | |
3.38%, 10/01/22 | | | 650 | | | | 668,976 | |
4.90%, 03/15/25 | | | 200 | | | | 220,285 | |
ONEOK, Inc.: | | | | | | | | |
2.75%, 09/01/24 | | | 155 | | | | 156,472 | |
4.55%, 07/15/28 | | | 80 | | | | 88,010 | |
4.35%, 03/15/29 | | | 100 | | | | 108,319 | |
PBF Holding Co. LLC/PBF Finance Corp., 7.25%, 06/15/25 | | | 50 | | | | 53,375 | |
Phillips 66 Partners LP, 2.45%, 12/15/24 | | | 305 | | | | 305,261 | |
Precision Drilling Corp., 7.13%, 01/15/26(a) | | | 25 | | | | 23,750 | |
QEP Resources, Inc., 5.25%, 05/01/23 | | | 100 | | | | 99,000 | |
| | | | | | | | |
| Security | | Par
(000) | | | Value | |
|
| Oil, Gas & Consumable Fuels (continued) | |
Range Resources Corp.: | | | | | | | | |
5.88%, 07/01/22 | | $ | 100 | | | $ | 99,250 | |
5.00%, 03/15/23 | | | 100 | | | | 91,982 | |
SESI LLC, 7.13%, 12/15/21 | | | 50 | | | | 42,645 | |
Shell International Finance BV, 2.00%, 11/07/24 | | | 790 | | | | 787,920 | |
SM Energy Co., 6.63%, 01/15/27 | | | 105 | | | | 103,200 | |
Southwestern Energy Co.: | | | | | | | | |
6.20%, 01/23/25 | | | 150 | | | | 137,580 | |
7.50%, 04/01/26 | | | 50 | | | | 46,250 | |
7.75%, 10/01/27 | | | 100 | | | | 92,620 | |
Sunoco LP/Sunoco Finance Corp.: | | | | | | | | |
6.00%, 04/15/27 | | | 100 | | | | 106,750 | |
Series WI, 5.50%, 02/15/26 | | | 100 | | | | 103,750 | |
Series WI, 5.88%, 03/15/28 | | | 250 | | | | 265,451 | |
Tallgrass Energy Partners LP/Tallgrass Energy Finance Corp., 5.50%, 09/15/24(a) | | | 100 | | | | 100,500 | |
Targa Resources Partners LP/Targa Resources Partners Finance Corp.: | | | | | | | | |
5.88%, 04/15/26 | | | 35 | | | | 37,188 | |
5.50%, 03/01/30(a) | | | 100 | | | | 102,750 | |
Transocean Guardian Ltd., 5.88%, 01/15/24(a) | | | 4 | | | | 4,550 | |
W&T Offshore, Inc., 2018 Term Loan, 9.75%, 11/01/23(a) | | | 200 | | | | 190,750 | |
| | | | | | | | |
| | | | | | | 7,856,494 | |
|
| Paper & Forest Products — 0.0% | |
Norbord, Inc., 5.75%, 07/15/27(a) | | | 15 | | | | 15,563 | |
| | | | | | | | |
|
| Personal Products — 0.1% | |
Avon International Capital PLC, 6.50%, 08/15/22(a) | | | 100 | | | | 103,750 | |
Avon International Operations, Inc., 7.88%, 08/15/22(a) | | | 25 | | | | 26,062 | |
Estee Lauder Cos., Inc., 2.38%, 12/01/29 | | | 145 | | | | 144,960 | |
| | | | | | | | |
| | | | | | | 274,772 | |
|
| Pharmaceuticals — 1.0% | |
AbbVie, Inc.: | | | | | | | | |
3.38%, 11/14/21 | | | 300 | | | | 307,746 | |
2.90%, 11/06/22 | | | 600 | | | | 612,371 | |
2.30%, 11/21/22(a) | | | 620 | | | | 623,134 | |
AstraZeneca PLC, 3.50%, 08/17/23 | | | 100 | | | | 104,654 | |
Bausch Health Americas, Inc., 8.50%, 01/31/27(a) | | | 25 | | | | 28,470 | |
Bausch Health Cos., Inc.(a): | | | | | | | | |
7.00%, 03/15/24 | | | 100 | | | | 104,000 | |
6.13%, 04/15/25 | | | 150 | | | | 154,984 | |
5.75%, 08/15/27 | | | 100 | | | | 108,500 | |
5.00%, 01/30/28 | | | 85 | | | | 87,243 | |
7.25%, 05/30/29 | | | 125 | | | | 142,813 | |
5.25%, 01/30/30 | | | 85 | | | | 88,145 | |
Bristol-Myers Squibb Co., 2.25%, 08/15/21(a) | | | 100 | | | | 100,625 | |
Catalent Pharma Solutions, Inc., 5.00%, 07/15/27(a) | | | 10 | | | | 10,475 | |
Charles River Laboratories International, Inc., 4.25%, 05/01/28(a) | | | 25 | | | | 25,469 | |
CVS Health Corp., 2.63%, 08/15/24 | | | 85 | | | | 85,725 | |
MEDNAX, Inc., 6.25%, 01/15/27(a) | | | 100 | | | | 102,500 | |
Novartis Capital Corp., 2.40%, 09/21/22 | | | 300 | | | | 304,839 | |
Par Pharmaceutical, Inc., 7.50%, 04/01/27(a) | | | 25 | | | | 24,875 | |
Zoetis, Inc.: | | | | | | | | |
3.00%, 09/12/27 | | | 250 | | | | 257,082 | |
3.90%, 08/20/28 | | | 250 | | | | 271,285 | |
| | | | | | | | |
| | | | | | | 3,544,935 | |
|
| Professional Services — 0.0% | |
ASGN, Inc., 4.63%, 05/15/28(a) | | | 55 | | | | 56,533 | |
| | | | | | | | |
|
| Real Estate — 0.1% | |
Equinix, Inc.: | | | | | | | | |
2.63%, 11/18/24 | | | 110 | | | | 110,205 | |
| | |
| 16 | | 2019 BLACKROCK ANNUAL REPORTTO SHAREHOLDERS |
| | |
Schedule of Investments (continued) December 31, 2019 | | BlackRock Systematic Multi-Strategy Fund (Percentages shown are based on Net Assets) |
| | | | | | | | |
| Security | | Par
(000) | | | Value | |
|
| Real Estate (continued) | |
5.88%, 01/15/26 | | $ | 50 | | | $ | 53,063 | |
2.90%, 11/18/26 | | | 65 | | | | 65,114 | |
5.38%, 05/15/27 | | | 50 | | | | 54,301 | |
3.20%, 11/18/29 | | | 150 | | | | 150,558 | |
| | | | | | | | |
| | | | | | | 433,241 | |
|
| Real Estate Management & Development — 0.0% | |
Howard Hughes Corp., 5.38%, 03/15/25(a) | | | 25 | | | | 26,063 | |
Kennedy-Wilson, Inc., 5.88%, 04/01/24 | | | 25 | | | | 25,625 | |
Realogy Group LLC / RealogyCo-Issuer Corp., 9.38%, 04/01/27(a) | | | 100 | | | | 104,346 | |
| | | | | | | | |
| | | | | | | 156,034 | |
|
| Road & Rail — 0.1% | |
Hertz Corp.(a): | | | | | | | | |
7.63%, 06/01/22 | | | 14 | | | | 14,560 | |
7.13%, 08/01/26 | | | 15 | | | | 16,245 | |
Kansas City Southern, 2.88%, 11/15/29 | | | 80 | | | | 79,812 | |
Kenan Advantage Group, Inc., 7.88%, 07/31/23(a) | | | 15 | | | | 14,669 | |
Union Pacific Corp., 2.95%, 03/01/22 | | | 300 | | | | 306,577 | |
| | | | | | | | |
| | | | | | | 431,863 | |
|
| Semiconductors & Semiconductor Equipment — 1.0% | |
Amkor Technology, Inc., 6.63%, 09/15/27(a) | | | 300 | | | | 330,375 | |
Analog Devices, Inc., 2.50%, 12/05/21 | | | 25 | | | | 25,186 | |
Broadcom Corp./Broadcom Cayman Finance Ltd.: | | | | | | | | |
2.38%, 01/15/20 | | | 75 | | | | 75,003 | |
3.00%, 01/15/22 | | | 75 | | | | 76,110 | |
3.63%, 01/15/24 | | | 40 | | | | 41,457 | |
Broadcom, Inc.(a): | | | | | | | | |
3.13%, 10/15/22 | | | 500 | | | | 509,399 | |
3.63%, 10/15/24 | | | 250 | | | | 259,972 | |
4.25%, 04/15/26 | | | 100 | | | | 106,217 | |
Micron Technology, Inc.: | | | | | | | | |
4.19%, 02/15/27 | | | 300 | | | | 320,214 | |
4.64%, 02/06/24 | | | 400 | | | | 434,117 | |
NXP BV/NXP Funding LLC/NXP USA, Inc., 4.30%, 06/18/29(a) | | | 95 | | | | 102,732 | |
Qorvo, Inc.: | | | | | | | | |
5.50%, 07/15/26 | | | 110 | | | | 117,150 | |
4.38%, 10/15/29(a) | | | 675 | | | | 707,062 | |
Sensata Tech, Inc., 4.38%, 02/15/30(a) | | | 275 | | | | 280,340 | |
Sensata Technologies BV, 5.00%, 10/01/25(a) | | | 25 | | | | 27,156 | |
| | | | | | | | |
| | | | | | | 3,412,490 | |
|
| Software — 0.2% | |
CA, Inc., 3.60%, 08/15/22 | | | 25 | | | | 25,578 | |
CDK Global, Inc., 5.88%, 06/15/26 | | | 60 | | | | 64,097 | |
Citrix Systems, Inc., 4.50%, 12/01/27 | | | 50 | | | | 54,187 | |
MSCI, Inc.(a): | | | | | | | | |
5.38%, 05/15/27 | | | 150 | | | | 161,625 | |
4.00%, 11/15/29 | | | 345 | | | | 349,744 | |
Nuance Communications, Inc., 5.63%, 12/15/26 | | | 100 | | | | 106,573 | |
Solera LLC/Solera Finance, Inc., 10.50%, 03/01/24(a) | | | 50 | | | | 53,053 | |
| | | | | | | | |
| | | | | | | 814,857 | |
|
| Specialty Retail — 0.1% | |
Dollar Tree, Inc., 3.70%, 05/15/23 | | | 60 | | | | 62,523 | |
L Brands, Inc.: | | | | | | | | |
5.63%, 10/15/23 | | | 25 | | | | 26,968 | |
5.25%, 02/01/28 | | | 50 | | | | 47,375 | |
7.50%, 06/15/29 | | | 50 | | | | 51,500 | |
6.88%, 11/01/35 | | | 25 | | | | 22,375 | |
PetSmart, Inc., 5.88%, 06/01/25(a) | | | 21 | | | | 21,394 | |
Staples, Inc., 7.50%, 04/15/26(a) | | | 100 | | | | 103,750 | |
| | | | | | | | |
| | | | | | | 335,885 | |
| | | | | | | | |
| Security | | Par
(000) | | | Value | |
|
| Technology Hardware, Storage & Peripherals — 0.3% | |
Dell International LLC/EMC Corp.(a): | | | | | | | | |
4.00%, 07/15/24 | | $ | 600 | | | $ | 628,634 | |
4.90%, 10/01/26 | | | 250 | | | | 275,300 | |
Western Digital Corp., 4.75%, 02/15/26 | | | 100 | | | | 104,250 | |
| | | | | | | | |
| | | | | | | 1,008,184 | |
|
| Textiles, Apparel & Luxury Goods — 0.0% | |
Hanesbrands, Inc., 4.88%, 05/15/26(a) | | | 50 | | | | 52,938 | |
| | | | | | | | |
|
| Tobacco — 0.7% | |
Altria Group, Inc.: | | | | | | | | |
4.00%, 01/31/24 | | | 50 | | | | 53,056 | |
3.80%, 02/14/24 | | | 35 | | | | 36,857 | |
4.80%, 02/14/29 | | | 230 | | | | 256,373 | |
3.88%, 09/16/46 | | | 80 | | | | 73,855 | |
BAT Capital Corp.: | | | | | | | | |
2.76%, 08/15/22 | | | 75 | | | | 76,106 | |
3.56%, 08/15/27 | | | 620 | | | | 633,036 | |
4.76%, 09/06/49 | | | 30 | | | | 31,019 | |
Philip Morris International, Inc.: | | | | | | | | |
2.13%, 05/10/23 | | | 500 | | | | 501,524 | |
2.88%, 05/01/24 | | | 500 | | | | 514,691 | |
3.25%, 11/10/24 | | | 25 | | | | 26,255 | |
3.13%, 08/17/27 | | | 50 | | | | 51,860 | |
3.38%, 08/15/29 | | | 50 | | | | 52,507 | |
Vector Group Ltd.(a): | | | | | | | | |
6.13%, 02/01/25 | | | 110 | | | | 108,213 | |
10.50%, 11/01/26 | | | 150 | | | | 155,062 | |
| | | | | | | | |
| | | | | | | 2,570,414 | |
|
| Utilities — 0.0% | |
Vistra Operations Co. LLC, 5.63%, 02/15/27(a) | | | 100 | | | | 105,375 | |
| | | | | | | | |
|
| Water Utilities — 0.0% | |
Aqua America, Inc., 3.57%, 05/01/29 | | | 55 | | | | 57,862 | |
| | | | | | | | |
|
| Wireless Telecommunication Services — 1.1% | |
American Tower Corp.: | | | | | | | | |
3.30%, 02/15/21 | | | 50 | | | | 50,680 | |
3.45%, 09/15/21 | | | 100 | | | | 102,278 | |
3.50%, 01/31/23 | | | 835 | | | | 865,336 | |
2.95%, 01/15/25 | | | 200 | | | | 204,385 | |
3.55%, 07/15/27 | | | 180 | | | | 188,719 | |
3.95%, 03/15/29 | | | 100 | | | | 107,560 | |
Crown Castle International Corp.: | | | | | | | | |
5.25%, 01/15/23 | | | 620 | | | | 673,515 | |
3.20%, 09/01/24 | | | 30 | | | | 31,034 | |
3.65%, 09/01/27 | | | 340 | | | | 359,828 | |
HAT Holdings I LLC/HAT Holdings II LLC, 5.25%, 07/15/24(a) | | | 270 | | | | 283,837 | |
Intelsat Connect Finance SA, 9.50%, 02/15/23(a) | | | 10 | | | | 6,997 | |
iStar, Inc., 4.25%, 08/01/25 | | | 300 | | | | 303,288 | |
Sprint Capital Corp., 6.88%, 11/15/28 | | | 50 | | | | 53,875 | |
Sprint Communications, Inc., 6.00%, 11/15/22 | | | 25 | | | | 26,219 | |
Sprint Corp.: | | | | | | | | |
7.25%, 09/15/21 | | | 25 | | | | 26,438 | |
7.88%, 09/15/23 | | | 50 | | | | 55,166 | |
7.63%, 03/01/26 | | | 25 | | | | 27,570 | |
T-Mobile USA, Inc.: | | | | | | | | |
6.38%, 03/01/25 | | | 50 | | | | 51,666 | |
6.50%, 01/15/26 | | | 50 | | | | 53,610 | |
4.75%, 02/01/28 | | | 225 | | | | 235,757 | |
Telesat Canada/Telesat LLC, 6.50%, 10/15/27(a) | | | 60 | | | | 62,550 | |
| | | | | | | | |
| | | | | | | 3,770,308 | |
| | | | | | | | |
| |
Total Corporate Bonds — 32.6%
(Cost — $112,502,012) | | | | 114,806,888 | |
| | | | | |
| | | | |
| SCHEDULE OF INVESTMENTS | | | 17 | |
| | |
Schedule of Investments (continued) December 31, 2019 | | BlackRock Systematic Multi-Strategy Fund (Percentages shown are based on Net Assets) |
| | | | | | | | |
| Security | | Par
(000) | | | Value | |
|
| Non-Agency Mortgage-Backed Securities — 3.6% | |
|
Collateralized Mortgage Obligations — 2.6% | |
Connecticut Avenue Securities Trust(a)(e): | | | | | | | | |
Series2018-R07, Class 1M2, (1 mo. LIBOR US + 2.40%), 4.19%, 04/25/31 | | $ | 471 | | | $ | 476,280 | |
Series2019-R01, Class 2M2, (1 mo. LIBOR US + 2.45%), 4.24%, 07/25/31 | | | 625 | | | | 632,610 | |
Series2019-R02, Class 1M1, (1 mo. LIBOR US + 0.85%), 2.64%, 08/25/31 | | | 12 | | | | 12,034 | |
Series2019-R02, Class 1M2, (1 mo. LIBOR US + 2.30%), 4.09%, 08/25/31 | | | 650 | | | | 656,002 | |
Series2019-R03, Class 1M1, (1 mo. LIBOR US + 0.75%), 2.54%, 09/25/31 | | | 56 | | | | 55,896 | |
Series2019-R03, Class 1M2, (1 mo. LIBOR US + 2.15%), 3.94%, 09/25/31 | | | 200 | | | | 201,505 | |
Series2019-R05, Class 1M1, (1 mo. LIBOR US + 0.75%), 2.54%, 07/25/39 | | | 297 | | | | 296,850 | |
Series2019-R05, Class 1M2, (1 mo. LIBOR US + 2.00%), 3.79%, 07/25/39 | | | 750 | | | | 753,785 | |
Series2019-R06, Class 2M1, (1 mo. LIBOR US + 0.75%), 2.54%, 09/25/39 | | | 1,114 | | | | 1,113,891 | |
Series2019-R06, Class 2M2, (1 mo. LIBOR US + 2.10%), 3.89%, 09/25/39 | | | 1,500 | | | | 1,514,149 | |
Series2019-R07, Class 1M1, (1 mo. LIBOR US + 0.77%), 2.56%, 10/25/39 | | | 1,256 | | | | 1,255,995 | |
Series2019-R07, Class 1M2, (1 mo. LIBOR US + 2.10%), 3.89%, 10/25/39 | | | 612 | | | | 617,750 | |
Freddie Mac, Series 2019-DNA4, Class M1, (1 mo. LIBOR US + 0.70%), 2.41%, 10/25/49(a)(e) | | | 619 | | | | 619,358 | |
STACR Trust(a)(e): | | | | | | | | |
Series 2018-DNA2, Class M1, (1 mo. LIBOR US + 0.80%), 2.59%, 12/25/30 | | | 835 | | | | 835,731 | |
Series 2018-DNA3, Class M1, (1 mo. LIBOR US + 0.75%), 2.54%, 09/25/48 | | | 65 | | | | 64,876 | |
Series 2018-HRP1, Class M2, (1 mo. LIBOR US + 1.65%), 3.44%, 04/25/43 | | | 190 | | | | 190,480 | |
| | | | | | | | |
| | | | | | | 9,297,192 | |
|
| Commercial Mortgage-Backed Securities — 1.0% | |
CFCRE Commercial Mortgage Trust,Series 2016-C4, Class AM, 3.69%, 05/10/58 | | | 160 | | | | 166,624 | |
Citigroup Commercial Mortgage Trust, Series 2015-GC29, Class A2, 2.67%, 04/10/48 | | | 2,155 | | | | 2,155,721 | |
COMM Mortgage Trust, Series 2015-CR22, Class A2, 2.86%, 03/10/48 | | | 853 | | | | 852,566 | |
WFRBS Commercial Mortgage Trust,Series 2014-C24, Class AS, 3.93%, 11/15/47 | | | 280 | | | | 294,388 | |
| | | | | | | | |
| | | | | | | 3,469,299 | |
| | | | | | | | |
| |
TotalNon-Agency Mortgage-Backed Securities — 3.6%
(Cost — $12,738,662) | | | | 12,766,491 | |
| | | | | | | | |
|
U.S. Government Sponsored Agency Securities — 46.0% | |
|
Collateralized Mortgage Obligations — 4.6% | |
Fannie Mae Connecticut Avenue Securities(e): | | | | | | | | |
Series2018-C06, Class 2M1, (1 mo. LIBOR US + 0.55%), 2.34%, 03/25/31 | | | 12 | | | | 11,693 | |
Series2018-C01, Class 1M1, (1 mo. LIBOR US + 0.60%), 2.39%, 07/25/30 | | | 139 | | | | 138,870 | |
Series2018-C03, Class 1M1, (1 mo. LIBOR US + 0.68%), 2.47%, 10/25/30 | | | 152 | | | | 152,178 | |
Series2018-C05, Class 1M1, (1 mo. LIBOR US + 0.72%), 2.51%, 01/25/31 | | | 86 | | | | 85,795 | |
| | | | | | | | |
| Security | | Par
(000) | | | Value | |
|
| Collateralized Mortgage Obligations (continued) | |
Series2017-C06, Class 1M1, (1 mo. LIBOR US + 0.75%), 2.54%, 02/25/30 | | $ | 3 | | | $ | 3,375 | |
Series2019-R04, Class 2M1, (1 mo. LIBOR US + 0.75%), 2.54%, 06/25/39(a) | | | 643 | | | | 643,200 | |
Series2017-C04, Class 2M1, (1 mo. LIBOR US + 0.85%), 2.64%, 11/25/29 | | | 23 | | | | 22,964 | |
Series2017-C01, Class 1M1, (1 mo. LIBOR US + 1.30%), 3.09%, 07/25/29 | | | 11 | | | | 10,596 | |
Series2016-C04, Class 1M1, (1 mo. LIBOR US + 1.45%), 3.24%, 01/25/29 | | | — | (f) | | | 373 | |
Series2018-C06, Class 2M2, (1 mo. LIBOR US + 2.10%), 3.89%, 03/25/31 | | | 792 | | | | 796,461 | |
Series2019-R04, Class 2M2, (1 mo. LIBOR US + 2.10%), 3.89%, 06/25/39(a) | | | 500 | | | | 502,976 | |
Series2017-C05, Class 1M2A, (1 mo. LIBOR US + 2.20%), 3.99%, 01/25/30(b) | | | 140 | | | | 141,190 | |
Series2018-C02, Class 2M2, (1 mo. LIBOR US + 2.20%), 3.99%, 08/25/30 | | | 512 | | | | 516,444 | |
Series2018-C01, Class 1M2, (1 mo. LIBOR US + 2.25%), 4.04%, 07/25/30 | | | 221 | | | | 223,400 | |
Series2017-C07, Class 1M2, (1 mo. LIBOR US + 2.40%), 4.19%, 05/25/30 | | | 100 | | | | 101,848 | |
Series2017-C07, Class 2M2A, (1 mo. LIBOR US + 2.50%), 4.29%, 05/25/30 | | | 98 | | | | 99,440 | |
Series2017-C07, Class 2M2, (1 mo. LIBOR US + 2.50%), 4.29%, 05/25/30 | | | 99 | | | | 100,869 | |
Series2014-C02, Class 2M2, (1 mo. LIBOR US + 2.60%), 4.39%, 05/25/24 | | | 95 | | | | 98,915 | |
Series2017-C06, Class 1M2A, (1 mo. LIBOR US + 2.65%), 4.44%, 02/25/30 | | | 276 | | | | 279,571 | |
Series2017-C06, Class 1M2, (1 mo. LIBOR US + 2.65%), 4.44%, 02/25/30 | | | 100 | | | | 102,626 | |
Series2017-C06, Class 2M2, (1 mo. LIBOR US + 2.80%), 4.59%, 02/25/30 | | | 94 | | | | 96,097 | |
Series2014-C03, Class 2M2, (1 mo. LIBOR US + 2.90%), 4.69%, 07/25/24 | | | 114 | | | | 119,241 | |
Series2017-C01, Class 1M2A, (1 mo. LIBOR US + 3.55%), 5.34%, 07/25/29 | | | 100 | | | | 102,424 | |
Series2017-C05, Class 1B1, (1 mo. LIBOR US + 3.60%), 5.39%, 01/25/30 | | | 370 | | | | 391,612 | |
Series2018-C06, Class 1B1, (1 mo. LIBOR US + 3.75%), 5.54%, 03/25/31 | | | 436 | | | | 459,955 | |
Series2015-C02, Class 1M2, (1 mo. LIBOR US + 4.00%), 5.79%, 05/25/25 | | | 54 | | | | 57,539 | |
Series2015-C02, Class 2M2, (1 mo. LIBOR US + 4.00%), 5.79%, 05/25/25 | | | 44 | | | | 46,079 | |
Series2018-C05, Class 1B1, (1 mo. LIBOR US + 4.25%), 6.04%, 01/25/31 | | | 100 | | | | 109,190 | |
Series2015-C01, Class 1M2, (1 mo. LIBOR US + 4.30%), 6.09%, 02/25/25 | | | 51 | | | | 54,227 | |
Series2014-C01, Class M2, (1 mo. LIBOR US + 4.40%), 6.19%, 01/25/24 | | | 95 | | | | 103,289 | |
Series2016-C05, Class 2M2, (1 mo. LIBOR US + 4.45%), 6.24%, 01/25/29 | | | 125 | | | | 132,024 | |
Series2018-C04, Class 2B1, (1 mo. LIBOR US + 4.50%), 6.29%, 12/25/30 | | | 250 | | | | 276,821 | |
Series2017-C03, Class 1B1, (1 mo. LIBOR US + 4.85%), 6.64%, 10/25/29 | | | 500 | | | | 565,461 | |
Series2014-C04, Class 1M2, (1 mo. LIBOR US + 4.90%), 6.69%, 11/25/24 | | | 27 | | | | 29,410 | |
Series2014-C04, Class 1M2, (1 mo. LIBOR US + 5.00%), 6.79%, 11/25/24 | | | 62 | | | | 67,390 | |
Series2015-C03, Class 1M2, (1 mo. LIBOR US + 5.00%), 6.79%, 07/25/25 | | | 58 | | | | 63,471 | |
| | |
| 18 | | 2019 BLACKROCK ANNUAL REPORTTO SHAREHOLDERS |
| | |
Schedule of Investments (continued) December 31, 2019 | | BlackRock Systematic Multi-Strategy Fund (Percentages shown are based on Net Assets) |
| | | | | | | | |
| Security | | Par
(000) | | | Value | |
|
| Collateralized Mortgage Obligations (continued) | |
Series2017-C04, Class 2B1, (1 mo. LIBOR US + 5.05%), 6.84%, 11/25/29 | | $ | 500 | | | $ | 571,407 | |
Series2017-C02, Class 2B1, (1 mo. LIBOR US + 5.50%), 7.29%, 09/25/29 | | | 500 | | | | 584,126 | |
Series2015-C04, Class 1M2, (1 mo. LIBOR US + 5.70%), 7.49%, 04/25/28 | | | 65 | | | | 72,161 | |
Series2017-C01, Class 1B1, (1 mo. LIBOR US + 5.75%), 7.54%, 07/25/29 | | | 500 | | | | 590,928 | |
Freddie Mac STACR Trust(a)(e): | | | | | | | | |
Series 2019-HQA2, Class M1, (1 mo. LIBOR US + 0.70%), 2.49%, 04/25/49 | | | 78 | | | | 78,242 | |
Series 2019-HQA3, Class M1, (1 mo. LIBOR US + 0.75%), 2.54%, 09/25/49 | | | 570 | | | | 569,680 | |
Series 2019-DNA1, Class M1, (1 mo. LIBOR US + 0.90%), 2.69%, 01/25/49 | | | 1,153 | | | | 1,153,613 | |
Series 2019-FTR2, Class M1, (1 mo. LIBOR US + 0.95%), 2.74%, 11/25/48 | | | 962 | | | | 962,004 | |
Series 2019-HQA3, Class M2, (1 mo. LIBOR US + 1.85%), 3.64%, 09/25/49 | | | 1,000 | | | | 1,000,098 | |
Series 2019-HQA2, Class M2, (1 mo. LIBOR US + 2.05%), 3.84%, 04/25/49 | | | 500 | | | | 502,291 | |
Series 2019-DNA3, Class M2, (1 mo. LIBOR US + 2.05%), 3.84%, 07/25/49 | | | 500 | | | | 502,317 | |
Series 2018-HQA2, Class M2, (1 mo. LIBOR US + 2.30%), 4.09%, 10/25/48 | | | 500 | | | | 506,435 | |
Series 2019-HQA1, Class M2, (1 mo. LIBOR US + 2.35%), 4.14%, 02/25/49 | | | 600 | | | | 606,151 | |
Series 2018-DNA1, Class M2, (1 mo. LIBOR US + 1.80%), 3.59%, 07/25/30 | | | 100 | | | | 100,197 | |
Series 2017-DNA3, Class M2, (1 mo. LIBOR US + 2.50%), 4.29%, 03/25/30 | | | 250 | | | | 255,850 | |
Series 2018-DNA1, Class B1, (1 mo. LIBOR US + 3.15%), 4.94%, 07/25/30 | | | 75 | | | | 77,125 | |
Series2015-DN1, Class M3, (1 mo. LIBOR US + 4.15%), 5.94%, 01/25/25 | | | 137 | | | | 143,461 | |
Series 2017-DNA3, Class B1, (1 mo. LIBOR US + 4.45%), 6.24%, 03/25/30 | | | 250 | | | | 276,482 | |
Series 2016-DNA2, Class M3, (1 mo. LIBOR US + 4.65%), 6.44%, 10/25/28 | | | 467 | | | | 502,403 | |
Series 2017-HQA2, Class B1, (1 mo. LIBOR US + 4.75%), 6.54%, 12/25/29 | | | 500 | | | | 559,040 | |
| | | | | | | | |
| | | | | | | 16,321,025 | |
|
| Mortgage-Backed Securities — 41.4% | |
Fannie Mae Mortgage-Backed Securities(g): | | | | | | | | |
2.50%, 01/01/50 | | | 1,600 | | | | 1,582,062 | |
3.00%, 01/01/35 - 01/01/50 | | | 6,300 | | | | 6,406,459 | |
3.50%, 01/01/35 - 01/01/50 | | | 19,224 | | | | 19,817,741 | |
4.00%, 01/01/35 - 02/01/57 | | | 23,330 | | | | 24,312,094 | |
4.50%, 01/01/35 - 01/01/50 | | | 12,842 | | | | 13,525,003 | |
5.00%, 02/01/41 - 01/01/50 | | | 8,810 | | | | 9,449,119 | |
5.50%, 01/01/50 | | | 1,750 | | | | 1,884,531 | |
Freddie Mac Mortgage-Backed Securities: | | | | | | | | |
3.00%, 08/01/46 - 06/01/49 | | | 468 | | | | 476,260 | |
3.50%, 10/01/44 - 11/01/49 | | | 8,518 | | | | 8,867,042 | |
4.00%, 10/01/46 - 06/01/49 | | | 1,174 | | | | 1,224,216 | |
4.50%, 05/01/42 - 03/01/49 | | | 3,577 | | | | 3,777,544 | |
Ginnie Mae Mortgage-Backed Securities(g): | | | | | | | | |
2.50%, 01/01/50 | | | 575 | | | | 577,448 | |
3.00%, 05/20/45 - 01/01/50 | | | 850 | | | | 874,173 | |
3.50%, 06/15/43 - 01/01/50 | | | 15,505 | | | | 15,986,405 | |
4.00%, 11/20/47 - 01/01/50 | | | 12,289 | | | | 12,725,116 | |
4.50%, 01/01/50 | | | 15,467 | | | | 16,172,438 | |
5.00%, 12/20/48 - 01/01/50 | | | 7,128 | | | | 7,515,459 | |
| | | | | | | | |
| Security | | Par
(000) | | | Value | |
|
| Mortgage-Backed Securities (continued) | |
Multifamily Connecticut Avenue Securities Trust,Series 2019-01, Class M10, (1 mo. LIBOR US + 3.25%), 5.04%, 10/15/49(a)(e) | | $ | 750 | | | $ | 781,419 | |
| | | | | | | | |
| | | | | | | 145,954,529 | |
| | | | | | | | |
| |
Total U.S. Government Sponsored Agency Securities — 46.0%
(Cost — $161,789,566) | | | | 162,275,554 | |
| | | | | | | | |
|
U.S. Treasury Obligations — 5.6% | |
U.S. Treasury Bonds, 3.13%, 08/15/44 | | | 600 | | | | 684,023 | |
U.S. Treasury Notes: | | | | | | | | |
1.88%, 02/28/22 | | | 5,000 | | | | 5,030,664 | |
1.88%, 03/31/22 | | | 4,000 | | | | 4,025,469 | |
1.50%, 08/15/26 | | | 10,000 | | | | 9,806,641 | |
| | | | | | | | |
| |
Total U.S. Treasury Obligations — 5.6%
(Cost — $19,493,305) | | | | 19,546,797 | |
| | | | | | | | |
| |
Total Long-Term Investments — 103.1%
(Cost — $360,090,398) | | | | 363,569,434 | |
| | | | | | | | |
| | |
| | | Shares | | | | |
|
| Short-Term Securities — 27.2% | |
BlackRock Liquidity Funds,T-Fund, Institutional Class, 1.51%(h)(i) | | | 96,002,743 | | | | 96,002,743 | |
| | | | | | | | |
| |
Total Short-Term Securities — 27.2%
(Cost — $96,002,743) | | | | 96,002,743 | |
| | | | | |
| |
Total Investments — 130.3%
(Cost — $456,093,141) | | | | 459,572,177 | |
| |
Liabilities in Excess of Other Assets — (30.3)% | | | | (106,949,730 | ) |
| | | | | | | | |
| |
Net Assets — 100.0% | | | $ | 352,622,447 | |
| | | | | |
| (a) | Security exempt from registration pursuant to Rule 144A under the Securities Act of 1933, as amended. These securities may be resold in transactions exempt from registration to qualified institutional investors. |
| (b) | Security is valued using significant unobservable inputs and is classified as Level 3 in the fair value hierarchy. |
| (c) | Payment-in-kind security which may pay interest/dividends in additional par/shares and/or in cash. Rates shown are the current rate and possible payment rates. |
| (d) | Variable rate security. Security may be issued at a fixed coupon rate, which converts to a variable rate at a specified date. Rate shown is the rate in effect as of period end. |
| (e) | Variable rate security. Rate shown is the rate in effect as of period end. |
| (f) | Amount is less than 500. |
| (g) | Represents or includes a TBA transaction. |
| (h) | Annualized7-day yield as of period end. |
| | | | |
| SCHEDULE OF INVESTMENTS | | | 19 | |
| | |
Schedule of Investments (continued) December 31, 2019 | | BlackRock Systematic Multi-Strategy Fund |
| (i) | During the year ended December 31, 2019, investments in issuers considered to be an affiliate/affiliates of the Fund for purposes of Section 2(a)(3) of the Investment Company Act of 1940, as amended, were as follows: |
| | | | | | | | | | | | | | | | | | | | | | | | | | | | |
| Affiliate | | Shares
Held at
12/31/18 | | | Net
Activity | | | Shares
Held at
12/31/19 | | | Value at
12/31/19 | | | Income | | | Net Realized
Gain (Loss) (a) | | | Change in
Unrealized
Appreciation
(Depreciation) | |
BlackRock Liquidity Funds,T-Fund, Institutional Class | | | 5,039,873 | | | | 90,962,870 | | | | 96,002,743 | | | $ | 96,002,743 | | | $ | 374,816 | | | $ | 93 | | | $ | — | |
| | | | | | | | | | | | | | | | | | | | | | | | | | | | |
| | (a) | Includes net capital gain distributions, if applicable. | |
Derivative Financial Instruments Outstanding as of Period End
Futures Contracts
| | | | | | | | | | | | | | | | |
| Description | | Number of
Contracts | | | Expiration
Date | | | Notional
Amount (000) | | | Value/
Unrealized
Appreciation
(Depreciation) | |
Long Contracts | | | | | | | | | | | | | | | | |
10-Year Australian Treasury Bond | | | 56 | | | | 03/16/20 | | | $ | 5,618 | | | $ | (98,971 | ) |
10-Year Canada Bond | | | 45 | | | | 03/20/20 | | | | 4,764 | | | | (50,748 | ) |
U.S. Ultra Bond | | | 22 | | | | 03/20/20 | | | | 3,996 | | | | (108,485 | ) |
Long Gilt | | | 39 | | | | 03/27/20 | | | | 6,787 | | | | (24,804 | ) |
5-Year U.S. Treasury Note | | | 85 | | | | 03/31/20 | | | | 10,082 | | | | (9,390 | ) |
| | | | | | | | | | | | | | | | |
| | | | | | | | | | | | | | | (292,398 | ) |
| | | | | | | | | | | | | | | | |
Short Contracts | | | | | | | | | | | | | | | | |
Euro Bund Futures | | | 85 | | | | 03/06/20 | | | | 16,255 | | | | 132,375 | |
10-Year U.S. Treasury Note | | | 192 | | | | 03/20/20 | | | | 24,657 | | | | 14,288 | |
10-Year U.S. Ultra Long Treasury Note | | | 16 | | | | 03/20/20 | | | | 2,251 | | | | 29,914 | |
Long U.S. Treasury Bond | | | 12 | | | | 03/20/20 | | | | 1,871 | | | | (392 | ) |
2-Year U.S. Treasury Note | | | 64 | | | | 03/31/20 | | | | 13,792 | | | | 11,946 | |
| | | | | | | | | | | | | | | | |
| | | | | | | | | | | | | | | 188,131 | |
| | | | | | | | | | | | | | | | |
| | | | | | | | | | | | | | $ | (104,267 | ) |
| | | | | | | | | | | | | | | | |
Forward Foreign Currency Exchange Contracts
| | | | | | | | | | | | | | | | | | | | |
Currency
Purchased | | | Currency
Sold | | | Counterparty | | Settlement Date | | | Unrealized
Appreciation
(Depreciation) | |
| USD | | | 165,572 | | | AUD | | | 240,000 | | | Citibank N.A. | | | 03/18/20 | | | $ | (3,160 | ) |
| USD | | | 15,257 | | | CAD | | | 20,000 | | | Deutsche Bank AG | | | 03/18/20 | | | | (149 | ) |
| USD | | | 53,326 | | | CAD | | | 70,000 | | | Deutsche Bank AG | | | 03/18/20 | | | | (594 | ) |
| USD | | | 179,343 | | | EUR | | | 160,000 | | | State Street Bank and Trust Co. | | | 03/18/20 | | | | (972 | ) |
| USD | | | 22,165 | | | SGD | | | 30,000 | | | Royal Bank of Canada | | | 03/18/20 | | | | (157 | ) |
| | | | | | | | | | | | | | | | | | | | |
| | | Net unrealized depreciation | | | $ | (5,032 | ) |
| | | | | | | | | | | | | | | | | | | | |
Centrally Cleared Interest Rate Swaps
| | | | | | | | | | | | | | | | | | | | | | | | | | | | | | | | |
| Paid by the Fund | | Received by the Fund | | Effective
Date (a) | | | Termination
Date | | | Notional
Amount (000) | | | Value | | | Upfront
Premium
Paid
(Received) | | | Unrealized
Appreciation
(Depreciation) | |
| Rate | | Frequency | | Rate | | Frequency |
| 1-Month MXIBOR, 7.56% | | Monthly | | 6.38% | | Monthly | | | 03/18/20 | | | | 03/12/25 | | | MXN | | | 3,320 | | | $ | (1,498 | ) | | $ | 3 | | | $ | (1,501 | ) |
| 1-Month MXIBOR, 7.56% | | Monthly | | 6.45 | | Monthly | | | 03/18/20 | | | | 03/12/25 | | | MXN | | | 14,120 | | | | (4,120 | ) | | | 11 | | | | (4,131 | ) |
| 3-Month STIBOR, 0.15% | | Quarterly | | 0.00 | | Annual | | | 03/18/20 | | | | 03/18/25 | | | SEK | | | 14,980 | | | | (32,646 | ) | | | (43 | ) | | | (32,603 | ) |
| 6-Month SIBOR, 1.83% | | Semi-Annual | | 1.54 | | Semi-Annual | | | 03/18/20 | | | | 03/18/25 | | | SGD | | | 1,100 | | | | 1,175 | | | | 12 | | | | 1,163 | |
| 1.68 | | Annual | | 6-Month WIBOR, 1.69% | | Semi-Annual | | | 03/18/20 | | | | 03/18/25 | | | PLN | | | 9,150 | | | | 13,087 | | | | 35 | | | | 13,052 | |
| 1.74 | | Annual | | 6-Month WIBOR, 1.69% | | Semi-Annual | | | 03/18/20 | | | | 03/18/25 | | | PLN | | | 4,280 | | | | 2,659 | | | | 16 | | | | 2,643 | |
| (0.44) | | Annual | | 6-Month EURIBOR, (0.32)% | | Semi-Annual | | | 03/18/20 | | | | 03/18/25 | | | EUR | | | 2,030 | | | | 37,958 | | | | 1,911 | | | | 36,047 | |
| (0.12) | | Semi-Annual | | 6-Month JPY LIBOR, 0.01% | | Semi-Annual | | | 03/18/20 | | | | 03/18/25 | | | JPY | | | 5,000 | | | | 366 | | | | 1 | | | | 365 | |
| 6-Month SIBOR, 1.83% | | Semi-Annual | | 1.58 | | Semi-Annual | | | 03/18/20 | | | | 03/18/25 | | | SGD | | | 50 | | | | 139 | | | | 1 | | | | 138 | |
| 1.68 | | Quarterly | | 3-Month HIBOR, 2.43% | | Quarterly | | | 03/18/20 | | | | 03/18/25 | | | HKD | | | 2,600 | | | | 4,514 | | | | 5 | | | | 4,509 | |
| | |
| 20 | | 2019 BLACKROCK ANNUAL REPORTTO SHAREHOLDERS |
| | |
Schedule of Investments (continued) December 31, 2019 | | BlackRock Systematic Multi-Strategy Fund |
Centrally Cleared Interest Rate Swaps (continued)
| | | | | | | | | | | | | | | | | | | | | | | | | | | | | | | | |
| Paid by the Fund | | Received by the Fund | | Effective
Date (a) | | | Termination
Date | | | Notional
Amount (000) | | | Value | | | Upfront
Premium
Paid
(Received) | | | Unrealized
Appreciation
(Depreciation) | |
| Rate | | Frequency | | Rate | | Frequency |
| (0.32) % | | Annual | | 6-Month EURIBOR, (0.32)% | | Semi-Annual | | | 03/18/20 | | | | 03/18/25 | | | EUR | | | 560 | | | $ | 6,623 | | | $ | 11 | | | $ | 6,612 | |
| 3-Month STIBOR, 0.15% | | Quarterly | | 0.02 | | Annual | | | 03/18/20 | | | | 03/18/25 | | | SEK | | | 7,760 | | | | (16,291 | ) | | | 14 | | | | (16,305 | ) |
| (0.39) | | Annual | | 6-Month EURIBOR, (0.32)% | | Semi-Annual | | | 03/18/20 | | | | 03/18/25 | | | EUR | | | 620 | | | | 9,970 | | | | 12 | | | | 9,958 | |
| 6-Month CAD BA, 2.07% | | Semi-Annual | | 1.72 | | Semi-Annual | | | 03/18/20 | | | | 03/18/25 | | | CAD | | | 470 | | | | (5,814 | ) | | | 6 | | | | (5,820 | ) |
| 1.70 | | Annual | | 6-Month WIBOR, 1.69% | | Semi-Annual | | | 03/18/20 | | | | 03/18/25 | | | PLN | | | 3,000 | | | | 3,538 | | | | 11 | | | | 3,527 | |
| 0.98 | | Semi-Annual | | 6-Month BBR, 0.21% | | Semi-Annual | | | 03/18/20 | | | | 03/18/25 | | | AUD | | | 880 | | | | 6,841 | | | | 10 | | | | 6,831 | |
| 1.05 | | Semi-Annual | | 6-Month BBR, 0.21% | | Semi-Annual | | | 03/18/20 | | | | 03/18/25 | | | AUD | | | 485 | | | | 2,506 | | | | 6 | | | | 2,500 | |
| 1.06 | | Semi-Annual | | 6-Month BBR, 0.21% | | Semi-Annual | | | 03/18/20 | | | | 03/18/25 | | | AUD | | | 490 | | | | 2,473 | | | | 6 | | | | 2,467 | |
| 1.06 | | Semi-Annual | | 6-Month BBR, 0.21% | | Semi-Annual | | | 03/18/20 | | | | 03/18/25 | | | AUD | | | 485 | | | | 2,440 | | | | 6 | | | | 2,434 | |
| 1.06 | | Semi-Annual | | 6-Month BBR, 0.21% | | Semi-Annual | | | 03/18/20 | | | | 03/18/25 | | | AUD | | | 220 | | | | 1,073 | | | | 3 | | | | 1,070 | |
| (0.12) | | Annual | | 6-Month EURIBOR, (0.32)% | | Semi-Annual | | | 03/18/20 | | | | 03/18/25 | | | EUR | | | 1,340 | | | | 1,291 | | | | 26 | | | | 1,265 | |
| 1.74 | | Annual | | 6-Month WIBOR, 1.69% | | Semi-Annual | | | 03/18/20 | | | | 03/18/25 | | | PLN | | | 6,970 | | | | 3,997 | | | | 28 | | | | 3,969 | |
| 3-Month STIBOR, 0.15% | | Quarterly | | 0.19 | | Annual | | | 03/18/20 | | | | 03/18/25 | | | SEK | | | 6,390 | | | | (7,560 | ) | | | 79 | | | | (7,639 | ) |
| 3-Month STIBOR, 0.15% | | Quarterly | | 0.25 | | Annual | | | 03/18/20 | | | | 03/18/25 | | | SEK | | | 2,880 | | | | (2,502 | ) | | | 5 | | | | (2,507 | ) |
| 3-Month STIBOR, 0.15% | | Quarterly | | 0.26 | | Annual | | | 03/18/20 | | | | 03/18/25 | | | SEK | | | 5,270 | | | | (4,270 | ) | | | 284 | | | | (4,554 | ) |
| 3-Month STIBOR, 0.15% | | Quarterly | | 0.31 | | Annual | | | 03/18/20 | | | | 03/18/25 | | | SEK | | | 5,740 | | | | (3,253 | ) | | | 432 | | | | (3,685 | ) |
| 3-Month STIBOR, 0.15% | | Quarterly | | 0.34 | | Annual | | | 03/18/20 | | | | 03/18/25 | | | SEK | | | 5,570 | | | | (2,139 | ) | | | 10 | | | | (2,149 | ) |
| 3-Month STIBOR, 0.15% | | Quarterly | | 0.37 | | Annual | | | 03/18/20 | | | | 03/18/25 | | | SEK | | | 16,460 | | | | (3,560 | ) | | | 30 | | | | (3,590 | ) |
| 6-Month SIBOR, 1.83% | | Semi-Annual | | 1.48 | | Semi-Annual | | | 03/18/20 | | | | 03/18/25 | | | SGD | | | 890 | | | | (812 | ) | | | 10 | | | | (822 | ) |
| 6-Month SIBOR, 1.83% | | Semi-Annual | | 1.50 | | Semi-Annual | | | 03/18/20 | | | | 03/18/25 | | | SGD | | | 570 | | | | (161 | ) | | | 6 | | | | (167 | ) |
| 6-Month SIBOR, 1.83% | | Semi-Annual | | 1.50 | | Semi-Annual | | | 03/18/20 | | | | 03/18/25 | | | SGD | | | 960 | | | | (184 | ) | | | 11 | | | | (195 | ) |
| 6-Month SIBOR, 1.83% | | Semi-Annual | | 1.51 | | Semi-Annual | | | 03/18/20 | | | | 03/18/25 | | | SGD | | | 390 | | | | (5 | ) | | | 4 | | | | (9 | ) |
| 6-Month SIBOR, 1.83% | | Semi-Annual | | 1.52 | | Semi-Annual | | | 03/18/20 | | | | 03/18/25 | | | SGD | | | 2,500 | | | | 1,321 | | | | 28 | | | | 1,293 | |
| 6-Month SIBOR, 1.83% | | Semi-Annual | | 1.54 | | Semi-Annual | | | 03/18/20 | | | | 03/18/25 | | | SGD | | | 1,120 | | | | 1,398 | | | | 12 | | | | 1,386 | |
| 6-Month SIBOR, 1.83% | | Semi-Annual | | 1.54 | | Semi-Annual | | | 03/18/20 | | | | 03/18/25 | | | SGD | | | 590 | | | | 822 | | | | 7 | | | | 815 | |
| 6-Month SIBOR, 1.83% | | Semi-Annual | | 1.56 | | Semi-Annual | | | 03/18/20 | | | | 03/18/25 | | | SGD | | | 340 | | | | 700 | | | | 4 | | | | 696 | |
| 6-Month SIBOR, 1.83% | | Semi-Annual | | 1.58 | | Semi-Annual | | | 03/18/20 | | | | 03/18/25 | | | SGD | | | 976 | | | | 2,449 | | | | 11 | | | | 2,438 | |
| 6-Month SIBOR, 1.83% | | Semi-Annual | | 1.60 | | Semi-Annual | | | 03/18/20 | | | | 03/18/25 | | | SGD | | | 594 | | | | 2,025 | | | | 7 | | | | 2,018 | |
| 1.69 | | Semi-Annual | | 3-Month LIBOR, 1.91% | | Quarterly | | | 03/18/20 | | | | 03/18/25 | | | USD | | | 1,330 | | | | 2,771 | | | | 23 | | | | 2,748 | |
| 1.69 | | Semi-Annual | | 3-Month LIBOR, 1.91% | | Quarterly | | | 03/18/20 | | | | 03/18/25 | | | USD | | | 925 | | | | 2,020 | | | | 631 | | | | 1,389 | |
| 1.69 | | Semi-Annual | | 3-Month LIBOR, 1.91% | | Quarterly | | | 03/18/20 | | | | 03/18/25 | | | USD | | | 463 | | | | 911 | | | | 7 | | | | 904 | |
| 1.70 | | Semi-Annual | | 3-Month LIBOR, 1.91% | | Quarterly | | | 03/18/20 | | | | 03/18/25 | | | USD | | | 463 | | | | 822 | | | | 7 | | | | 815 | |
| 1.73 | | Semi-Annual | | 3-Month LIBOR, 1.91% | | Quarterly | | | 03/18/20 | | | | 03/18/25 | | | USD | | | 1,100 | | | | (314 | ) | | | 19 | | | | (333 | ) |
| | | | | | | | | | | | | | | | | | | | | | | | | | | | | | | | |
| | | | | | | | | | | | | | | | | | | | | | $ | 30,760 | | | $ | 3,718 | | | $ | 27,042 | |
| | | | | | | | | | | | | | | | | | | | | | | | | | | | | | | | |
OTC Interest Rate Swaps
| | | | | | | | | | | | | | | | | | | | | | | | | | | | | | | | | | | | | | |
| Paid by the Fund | | Received by the Fund | | Counterparty | | Effective
Date (a) | | | Termination
Date | | | Notional
Amount (000) | | | Value | | | Upfront
Premium
Paid
(Received) | | | Unrealized
Appreciation
(Depreciation) | |
| Rate | | Frequency | | Rate | | | Frequency |
| 3-Month KRW CDC, 1.51% | | Quarterly | | | 1.12% | | | Quarterly | | Citibank N.A. | | | 03/18/20 | | | | 03/18/25 | | | | KRW | | | | 4,038,223 | | | $ | (35,258 | ) | | $ | — | | | $ | (35,258 | ) |
| 3-Month KRW CDC, 1.51% | | Quarterly | | | 1.16 | | | Quarterly | | Bank of America N.A. | | | 03/18/20 | | | | 03/18/25 | | | | KRW | | | | 1,173,435 | | | | (8,192 | ) | | | — | | | | (8,192 | ) |
| 3-Month KRW CDC, 1.51% | | Quarterly | | | 1.16 | | | Quarterly | | Citibank N.A. | | | 03/18/20 | | | | 03/18/25 | | | | KRW | | | | 1,173,435 | | | | (8,192 | ) | | | — | | | | (8,192 | ) |
| 3-Month KRW CDC, 1.51% | | Quarterly | | | 1.14 | | | Quarterly | | JPMorgan Chase Bank N.A. | | | 03/18/20 | | | | 03/18/25 | | | | KRW | | | | 629,147 | | | | (4,969 | ) | | | — | | | | (4,969 | ) |
| 3-Month KRW CDC, 1.51% | | Quarterly | | | 1.36 | | | Quarterly | | Bank of America N.A. | | | 03/18/20 | | | | 03/18/25 | | | | KRW | | | | 4,086,790 | | | | 5,517 | | | | — | | | | 5,517 | |
| | | | | | | | | | | | | | | | | | | | | | | | | | | | | | | | | | | | | | |
| | | | | | | | | | | | | | | | | | | | | | | | | | | | $ | (51,094 | ) | | $ | — | | | $ | (51,094 | ) |
| | | | | | | | | | | | | | | | | | | | | | | | | | | | | | | | | | | | | | |
| | | | |
| SCHEDULE OF INVESTMENTS | | | 21 | |
| | |
Schedule of Investments (continued) December 31, 2019 | | BlackRock Systematic Multi-Strategy Fund |
OTC Total Return Swaps (a)
| | | | | | | | | | | | | | | | | | | | | | | | | | |
| Reference Entity | | Counterparty | | Expiration
Date | | | Net Notional
Amount | | | | | | Unrealized
Appreciation (Depreciation) | | | Net Value of Reference
Entities | | | Gross
Notional Amount
Net Asset
Percentage | |
Equity Securities Long/Short: | | Bank of America N.A. | | | 02/15/23 | | | | USD 1,361,210 | | | | | | | $ | (242,848 | )(b) | | $ | 1,146,551 | | | | 3.7 | % |
| | Bank of America N.A. | | | 02/15/23 | | | | 4,188,191 | | | | | | | | 108,671 | (c) | | | 4,296,466 | | | | 1.9 | |
| | Morgan Stanley & Co. International PLC | | | 02/22/23 | | | | 3,028,633 | | | | | | | | 728,484 | (d) | | | 3,621,968 | | | | 45.4 | |
| | Morgan Stanley & Co. International PLC | | | 02/22/23 | | | | 546,480 | | | | | | | | (759,687 | )(e) | | | 11,085 | | | | 53.9 | |
| | | | | | | | | | | | | | | | | | | | | | | | | | |
| | | | | | | | | | | $ | (165,380 | ) | | $ | 9,076,070 | | | | | |
| | | | | | | | | | | | | | | | | | | | | |
| (a) | The Fund receives or pays the total return on a portfolio of long and short positions underlying the total return swap. In addition, the Fund pays or receives a variable rate of interest, based on a specified benchmark, plus or minus a spread in a range of0-418 basis points. The benchmark and spread are determined based upon the country and/or currency of the individual underlying positions. The following are the specified benchmarks used in determining the variable rate of interest: |
| | USD—1D | Overnight Fed Funds Effective Rate (FEDL01) | |
| | USD—1M | US Dollar LIBOR BBA | |
| | USD—1W | US Dollar LIBOR BBA | |
| (b) | Amount includes $(28,189) of net dividends and financing fees. |
| (c) | Amount includes $396 of net dividends and financing fees. |
| (d) | Amount includes $135,149 of net dividends and financing fees. |
| (e) | Amount includes $(224,292) of net dividends and financing fees. |
| | |
| 22 | | 2019 BLACKROCK ANNUAL REPORTTO SHAREHOLDERS |
| | |
Schedule of Investments (continued) December 31, 2019 | | BlackRock Systematic Multi-Strategy Fund |
The following table represents the individual long and short positions and related values of the equity securities underlying the total return swap with Bank of America N.A. as of December 31, 2019 expiration dates 02/15/23:
| | | | | | | | | | | | |
| Security | | Shares | | | Value | | | % of
Basket
Value | |
|
Reference Entity — Long | |
|
| Aerospace & Defense | |
Lockheed Martin Corp. | | | 588 | | | $ | 228,955 | | | | 20.0 | % |
Raytheon Co. | | | 548 | | | | 120,418 | | | | 10.5 | |
| | | | | | | | | | | | |
| | | | 349,373 | | | | | |
|
| Airlines | |
Delta Air Lines, Inc. | | | 9,198 | | | | 537,899 | | | | 46.9 | |
Southwest Airlines Co. | | | 3,820 | | | | 206,204 | | | | 18.0 | |
United Airlines Holdings, Inc. | | | 1,978 | | | | 174,242 | | | | 15.2 | |
| | | | | | | | | | | | |
| | | | 918,345 | | | | | |
|
| Auto Components | |
Goodyear Tire & Rubber Co. | | | 17,060 | | | | 265,368 | | | | 23.1 | |
| | | | | | | | | | | | |
|
| Biotechnology | |
Amgen, Inc. | | | 637 | | | | 153,562 | | | | 13.4 | |
| | | | | | | | | | | | |
|
| Building Products | |
Johnson Controls International PLC | | | 2,445 | | | | 99,536 | | | | 8.7 | |
| | | | | | | | | | | | |
|
| Communications Equipment | |
Cisco Systems, Inc. | | | 4,047 | | | | 194,094 | | | | 16.9 | |
| | | | | | | | | | | | |
|
| Consumer Finance | |
American Express Co. | | | 418 | | | | 52,037 | | | | 4.6 | |
OneMain Holdings, Inc. | | | 1,314 | | | | 55,385 | | | | 4.8 | |
| | | | | | | | | | | | |
| | | | 107,422 | | | | | |
|
| Containers & Packaging | |
Ball Corp. | | | 435 | | | | 28,132 | | | | 2.5 | |
Westrock Co. | | | 2,122 | | | | 91,055 | | | | 7.9 | |
| | | | | | | | | | | | |
| | | | 119,187 | | | | | |
|
| Diversified Telecommunication Services | |
Verizon Communications, Inc. | | | 441 | | | | 27,077 | | | | 2.4 | |
| | | | | | | | | | | | |
|
| Electric Utilities | |
American Electric Power Co., Inc. | | | 284 | | | | 26,841 | | | | 2.3 | |
Duke Energy Corp. | | | 2,181 | | | | 198,929 | | | | 17.4 | |
Exelon Corp. | | | 2,148 | | | | 97,927 | | | | 8.5 | |
| | | | | | | | | | | | |
| | | | 323,697 | | | | | |
|
| Entertainment | |
Walt Disney Co. | | | 1,309 | | | | 189,321 | | | | 16.5 | |
| | | | | | | | | | | | |
|
| Equity Real Estate Investment Trusts (REITs) | |
Weyerhaeuser Co. | | | 2,625 | | | | 79,275 | | | | 6.9 | |
| | | | | | | | | | | | |
|
| Food & Staples Retailing | |
Walmart, Inc. | | | 1,816 | | | | 215,813 | | | | 18.8 | |
| | | | | | | | | | | | |
|
| Food Products | |
Lamb Weston Holdings, Inc. | | | 1,273 | | | | 109,516 | | | | 9.6 | |
| | | | | | | | | | | | |
|
| Health Care Providers & Services | |
DaVita, Inc. | | | 752 | | | | 56,423 | | | | 4.9 | |
Quest Diagnostics, Inc. | | | 298 | | | | 31,823 | | | | 2.8 | |
Universal Health Services, Inc., Class B | | | 838 | | | | 120,219 | | | | 10.5 | |
| | | | | | | | | | | | |
| | | | 208,465 | | | | | |
|
| Hotels, Restaurants & Leisure | |
McDonald’s Corp. | | | 1,262 | | | | 249,384 | | | | 21.7 | |
MGM Resorts International | | | 5,125 | | | | 170,509 | | | | 14.9 | |
Yum! Brands, Inc. | | | 2,516 | | | | 253,436 | | | | 22.1 | |
| | | | | | | | | | | | |
| | | | 673,329 | | | | | |
| | | | | | | | | | | | |
| Security | | Shares | | | Value | | | % of
Basket
Value | |
|
| Household Durables | |
Newell Brands, Inc. | | | 13,206 | | | $ | 253,819 | | | | 22.2 | % |
PulteGroup, Inc. | | | 3,583 | | | | 139,021 | | | | 12.1 | |
Toll Brothers, Inc. | | | 4,473 | | | | 176,728 | | | | 15.4 | |
| | | | | | | | | | | | |
| | | | 569,568 | | | | | |
|
| Household Products | |
Colgate-Palmolive Co. | | | 2,103 | | | | 144,771 | | | | 12.6 | |
Procter & Gamble Co. | | | 1,827 | | | | 228,192 | | | | 19.9 | |
| | | | | | | | | | | | |
| | | | 372,963 | | | | | |
|
| Independent Power and Renewable Electricity Producers | |
NRG Energy, Inc. | | | 1,949 | | | | 77,473 | | | | 6.8 | |
| | | | | | | | | | | | |
|
| Insurance | |
Allstate Corp. | | | 2,250 | | | | 253,013 | | | | 22.1 | |
American International Group, Inc. | | | 2,712 | | | | 139,207 | | | | 12.1 | |
Hartford Financial Services Group, Inc. | | | 4,098 | | | | 249,035 | | | | 21.7 | |
Loews Corp. | | | 455 | | | | 23,883 | | | | 2.1 | |
MetLife, Inc. | | | 3,603 | | | | 183,645 | | | | 16.0 | |
| | | | | | | | | | | | |
| | | | 848,783 | | | | | |
|
| Media | |
Omnicom Group, Inc. | | | 1,072 | | | | 86,853 | | | | 7.6 | |
TEGNA, Inc. | | | 11,010 | | | | 183,757 | | | | 16.0 | |
| | | | | | | | | | | | |
| | | | 270,610 | | | | | |
|
| Oil, Gas & Consumable Fuels | |
ConocoPhillips | | | 1,943 | | | | 126,353 | | | | 11.0 | |
Devon Energy Corp. | | | 1,793 | | | | 46,564 | | | | 4.1 | |
Encana Corp. | | | 36,139 | | | | 169,492 | | | | 14.8 | |
Marathon Oil Corp. | | | 11,900 | | | | 161,602 | | | | 14.1 | |
| | | | | | | | | | | | |
| | | | 504,011 | | | | | |
|
| Pharmaceuticals | |
Pfizer, Inc. | | | 11,601 | | | | 454,527 | | | | 39.6 | |
| | | | | | | | | | | | |
|
| Specialty Retail | |
AutoZone, Inc. | | | 169 | | | | 201,331 | | | | 17.6 | |
Home Depot, Inc. | | | 552 | | | | 120,546 | | | | 10.5 | |
| | | | | | | | | | | | |
| | | | 321,877 | | | | | |
|
| Technology Hardware, Storage & Peripherals | |
Xerox Holdings Corp. | | | 564 | | | | 20,795 | | | | 1.8 | |
| | | | | | | | | | | | |
|
| Thrifts & Mortgage Finance | |
MGIC Investment Corp. | | | 10,757 | | | | 152,427 | | | | 13.3 | |
| | | | | | | | | | | | |
|
| Trading Companies & Distributors | |
HD Supply Holdings, Inc. | | | 2,772 | | | | 111,490 | | | | 9.7 | |
| | | | | | | | | | | | |
| | |
Total Reference Entity — Long | | | | 7,737,904 | | | | | |
| | | | | | | | | |
|
Reference Entity — Short | |
|
Aerospace & Defense | |
Boeing Co. | | | (313 | ) | | | (101,963 | ) | | | (8.9 | ) |
Textron, Inc. | | | (1,807 | ) | | | (80,592 | ) | | | (7.0 | ) |
| | | | | | | | | | | | |
| | | | (182,555 | ) | | | | |
|
| Air Freight & Logistics | |
FedEx Corp. | | | (630 | ) | | | (95,262 | ) | | | (8.3 | ) |
United Parcel Service, Inc., Class B | | | (1,727 | ) | | | (202,163 | ) | | | (17.6 | ) |
| | | | | | | | | | | | |
| | | | (297,425 | ) | | | | |
|
| Automobiles | |
Tesla, Inc. | | | (104 | ) | | | (43,506 | ) | | | (3.8 | ) |
| | | | | | | | | | | | |
|
| Beverages | |
Constellation Brands, Inc., Class A | | | (1,028 | ) | | | (195,063 | ) | | | (17.0 | ) |
| | | | | | | | | | | | |
| | | | |
| SCHEDULE OF INVESTMENTS | | | 23 | |
| | |
Schedule of Investments (continued) December 31, 2019 | | BlackRock Systematic Multi-Strategy Fund |
| | | | | | | | | | | | |
| Security | | Shares | | | Value | | | % of
Basket
Value | |
|
| Chemicals | |
PPG Industries, Inc. | | | (1,386 | ) | | $ | (185,017 | ) | | | (16.1 | ) % |
RPM International, Inc. | | | (2,869 | ) | | | (220,225 | ) | | | (19.2 | ) |
| | | | | | | | | | | | |
| | | | (405,242 | ) | | | | |
|
| Consumer Finance | |
Capital One Financial Corp. | | | (308 | ) | | | (31,696 | ) | | | (2.8 | ) |
| | | | | | | | | | | | |
|
| Diversified Financial Services | |
Berkshire Hathaway, Inc., Class B | | | (969 | ) | | | (219,478 | ) | | | (19.1 | ) |
| | | | | | | | | | | | |
|
| Diversified Telecommunication Services | |
AT&T, Inc. | | | (6,211 | ) | | | (242,726 | ) | | | (21.2 | ) |
| | | | | | | | | | | | |
|
| Electric Utilities | |
FirstEnergy Corp. | | | (4,409 | ) | | | (214,277 | ) | | | (18.7 | ) |
| | | | | | | | | | | | |
|
| Equity Real Estate Investment Trusts (REITs) | |
Healthpeak Properties, Inc. | | | (4,708 | ) | | | (162,285 | ) | | | (14.2 | ) |
| | | | | | | | | | | | |
|
| Food Products | |
Conagra Brands, Inc. | | | (7,003 | ) | | | (239,783 | ) | | | (20.9 | ) |
Kellogg Co. | | | (3,596 | ) | | | (248,699 | ) | | | (21.7 | ) |
| | | | | | | | | | | | |
| | | | (488,482 | ) | | | | |
|
| Health Care Equipment & Supplies | |
Abbott Laboratories | | | (2,239 | ) | | | (194,480 | ) | | | (17.0 | ) |
| | | | | | | | | | | | |
|
| Health Care Providers & Services | |
AmerisourceBergen Corp. | | | (2,025 | ) | | | (172,165 | ) | | | (15.0 | ) |
McKesson Corp. | | | (24 | ) | | | (3,320 | ) | | | (0.3 | ) |
| | | | | | | | | | | | |
| | | | (175,485 | ) | | | | |
|
| Hotels, Restaurants & Leisure | |
Royal Caribbean Cruises Ltd. | | | (1,321 | ) | | | (176,367 | ) | | | (15.4 | ) |
| | | | | | | | | | | | |
|
| Household Durables | |
DR Horton, Inc. | | | (4,709 | ) | | | (248,400 | ) | | | (21.7 | ) |
Mohawk Industries, Inc. | | | (354 | ) | | | (48,278 | ) | | | (4.2 | ) |
| | | | | | | | | | | | |
| | | | (296,678 | ) | | | | |
|
| Leisure Products | |
Brunswick Corp. | | | (1,796 | ) | | | (107,724 | ) | | | (9.4 | ) |
Hasbro, Inc. | | | (1,809 | ) | | | (191,048 | ) | | | (16.7 | ) |
Mattel, Inc. | | | (75,145 | ) | | | (1,018,215 | ) | | | (88.8 | ) |
| | | | | | | | | | | | |
| | | | (1,316,987 | ) | | | | |
|
| Media | |
Comcast Corp., Class A | | | (601 | ) | | | (27,027 | ) | | | (2.4 | ) |
DISH Network Corp., Class A | | | (3,119 | ) | | | (110,631 | ) | | | (9.6 | ) |
| | | | | | | | | | | | |
| | | | (137,658 | ) | | | | |
|
| Metals & Mining | |
United States Steel Corp. | | | (35,139 | ) | | | (400,936 | ) | | | (35.0 | ) |
| | | | | | | | | | | | |
|
| Multi-Utilities | |
Sempra Energy | | | (594 | ) | | | (89,979 | ) | | | (7.8 | ) |
| | | | | | | | | | | | |
|
| Oil, Gas & Consumable Fuels | |
Canadian Natural Resources Ltd. | | | (8,248 | ) | | | (266,823 | ) | | | (23.3 | ) |
Enbridge, Inc. | | | (8,743 | ) | | | (347,709 | ) | | | (30.3 | ) |
Exxon Mobil Corp. | | | (1,258 | ) | | | (87,783 | ) | | | (7.7 | ) |
ONEOK, Inc. | | | (2,885 | ) | | | (218,308 | ) | | | (19.0 | ) |
Williams Cos., Inc. | | | (3,148 | ) | | | (74,671 | ) | | | (6.5 | ) |
| | | | | | | | | | | | |
| | | | (995,294 | ) | | | | |
|
| Road & Rail | |
Avis Budget Group, Inc. | | | (188 | ) | | | (6,061 | ) | | | (0.5 | ) |
| | | | | | | | | | | | |
|
| Specialty Retail | |
TJX Cos., Inc. | | | (1,782 | ) | | | (108,809 | ) | | | (9.5 | ) |
| | | | | | | | | | | | |
| | | | | | | | | | | | |
| Security | | Shares | | | Value | | | % of
Basket
Value | |
|
| Textiles, Apparel & Luxury Goods | |
VF Corp. | | | (2,106 | ) | | $ | (209,884 | ) | | | (18.3 | ) % |
| | | | | | | | | | | | |
| | |
Total Reference Entity — Short | | | | (6,591,353 | ) | | | | |
| | | | | | | | | | | | |
| | |
Net Value of Reference Entity — Bank of America N.A. | | | $ | 1,146,551 | | | | | |
| | | | | | | | | | | | |
The following table represents the individual long and short positions and related values of the equity securities underlying the total return swap with Bank of America N.A. as of December 31, 2019 expiration dates 02/15/23:
| | | | | | | | | | | | |
| Security | | Shares | | | Value | | | % of
Basket
Value | |
|
Reference Entity — Long | |
|
| Aerospace & Defense | |
Arconic, Inc. | | | 1,695 | | | $ | 52,155 | | | | 1.2 | % |
Northrop Grumman Corp. | | | 87 | | | | 29,926 | | | | 0.7 | |
| | | | | | | | | | | | |
| | | | 82,081 | | | | | |
|
| Airlines | |
United Airlines Holdings, Inc. | | | 310 | | | | 27,308 | | | | 0.6 | |
| | | | | | | | | | | | |
|
| Auto Components | |
BorgWarner, Inc. | | | 1,738 | | | | 75,395 | | | | 1.7 | |
| | | | | | | | | | | | |
|
| Biotechnology | |
AbbVie, Inc. | | | 5,096 | | | | 451,200 | | | | 10.5 | |
| | | | | | | | | | | | |
|
| Building Products | |
Fortune Brands Home & Security, Inc. | | | 304 | | | | 19,863 | | | | 0.5 | |
| | | | | | | | | | | | |
|
| Chemicals | |
Celanese Corp. | | | 269 | | | | 33,119 | | | | 0.8 | |
Olin Corp. | | | 1,003 | | | | 17,302 | | | | 0.4 | |
| | | | | | | | | | | | |
| | | | 50,421 | | | | | |
|
| Commercial Services & Supplies | |
Republic Services, Inc. | | | 1,133 | | | | 101,551 | | | | 2.3 | |
Waste Management, Inc. | | | 969 | | | | 110,427 | | | | 2.6 | |
| | | | | | | | | | | | |
| | | | 211,978 | | | | | |
|
| Communications Equipment | |
Cisco Systems, Inc. | | | 1,574 | | | | 75,489 | | | | 1.8 | |
| | | | | | | | | | | | |
|
| Construction & Engineering | |
AECOM | | | 2,131 | | | | 91,910 | | | | 2.1 | |
| | | | | | | | | | | | |
|
| Consumer Finance | |
Ally Financial, Inc. | | | 1,362 | | | | 41,623 | | | | 1.0 | |
OneMain Holdings, Inc. | | | 144 | | | | 6,069 | | | | 0.1 | |
| | | | | | | | | | | | |
| | | | 47,692 | | | | | |
|
| Containers & Packaging | |
Ball Corp. | | | 2,925 | | | | 189,160 | | | | 4.4 | |
| | | | | | | | | | | | |
|
| Diversified Telecommunication Services | |
CenturyLink, Inc. | | | 2,397 | | | | 31,664 | | | | 0.7 | |
| | | | | | | | | | | | |
|
| Electrical Equipment | |
Sensata Technologies Holding PLC | | | 1,557 | | | | 83,876 | | | | 1.9 | |
| | | | | | | | | | | | |
|
| Electronic Equipment, Instruments & Components | |
Keysight Technologies, Inc. | | | 56 | | | | 5,747 | | | | 0.1 | |
| | | | | | | | | | | | |
|
| Equity Real Estate Investment Trusts (REITs) | |
Boston Properties, Inc. | | | 239 | | | | 32,948 | | | | 0.8 | |
Brixmor Property Group, Inc. | | | 3,707 | | | | 80,108 | | | | 1.9 | |
Essex Property Trust, Inc. | | | 58 | | | | 17,450 | | | | 0.4 | |
Gaming and Leisure Properties, Inc. | | | 365 | | | | 15,713 | | | | 0.4 | |
Host Hotels & Resorts, Inc. | | | 5,707 | | | | 105,865 | | | | 2.4 | |
| | |
| 24 | | 2019 BLACKROCK ANNUAL REPORTTO SHAREHOLDERS |
| | |
Schedule of Investments (continued) December 31, 2019 | | BlackRock Systematic Multi-Strategy Fund |
| | | | | | | | | | | | |
| Security | | Shares | | | Value | | | % of
Basket
Value | |
|
| Equity Real Estate Investment Trusts (REITs) (continued) | |
Kimco Realty Corp. | | | 4,173 | | | $ | 86,423 | | | | 2.0 | % |
Life Storage, Inc. | | | 1,033 | | | | 111,853 | | | | 2.6 | |
Outfront Media, Inc. | | | 5,466 | | | | 146,598 | | | | 3.4 | |
Regency Centers Corp. | | | 1,220 | | | | 76,970 | | | | 1.8 | |
Simon Property Group, Inc. | | | 480 | | | | 71,501 | | | | 1.6 | |
Spirit Realty Capital, Inc. | | | 1,815 | | | | 89,262 | | | | 2.1 | |
Tanger Factory Outlet Centers, Inc. | | | 8,971 | | | | 132,143 | | | | 3.1 | |
| | | | | | | | | | | | |
| | | | 966,834 | | | | | |
|
| Food & Staples Retailing | |
Sysco Corp. | | | 944 | | | | 80,750 | | | | 1.9 | |
| | | | | | | | | | | | |
|
| Food Products | |
Campbell Soup Co. | | | 2,733 | | | | 135,065 | | | | 3.1 | |
Hershey Co. | | | 609 | | | | 89,511 | | | | 2.1 | |
| | | | | | | | | | | | |
| | | | 224,576 | | | | | |
|
| Health Care Providers & Services | |
AmerisourceBergen Corp. | | | 861 | | | | 73,202 | | | | 1.7 | |
Encompass Health Corp. | | | 1,082 | | | | 74,950 | | | | 1.7 | |
Quest Diagnostics, Inc. | | | 388 | | | | 41,435 | | | | 1.0 | |
| | | | | | | | | | | | |
| | | | 189,587 | | | | | |
|
| Hotels, Restaurants & Leisure | |
Churchill Downs, Inc. | | | 605 | | | | 83,006 | | | | 1.9 | |
Scientific Games Corp., Class A | | | 819 | | | | 21,933 | | | | 0.5 | |
Starbucks Corp. | | | 465 | | | | 40,883 | | | | 1.0 | |
Yum! Brands, Inc. | | | 1,320 | | | | 132,963 | | | | 3.1 | |
| | | | | | | | | | | | |
| | | | 278,785 | | | | | |
|
| Household Durables | |
TRI Pointe Group, Inc. | | | 2,578 | | | | 40,165 | | | | 0.9 | |
Whirlpool Corp. | | | 447 | | | | 65,946 | | | | 1.6 | |
| | | | | | | | | | | | |
| | | | 106,111 | | | | | |
|
| Household Products | |
Colgate-Palmolive Co. | | | 977 | | | | 67,257 | | | | 1.5 | |
Spectrum Brands Holdings, Inc. | | | 1,323 | | | | 85,055 | | | | 2.0 | |
| | | | | | | | | | | | |
| | | | 152,312 | | | | | |
|
| Independent Power and Renewable Electricity Producers | |
NRG Energy, Inc. | | | 3,105 | | | | 123,424 | | | | 2.9 | |
| | | | | | | | | | | | |
|
| Insurance | |
American International Group, Inc. | | | 1,376 | | | | 70,630 | | | | 1.7 | |
Lincoln National Corp. | | | 728 | | | | 42,959 | | | | 1.0 | |
Manulife Financial Corp. | | | 7,578 | | | | 153,758 | | | | 3.6 | |
Prudential Financial, Inc. | | | 238 | | | | 22,310 | | | | 0.5 | |
Reinsurance Group of America, Inc. | | | 586 | | | | 95,553 | | | | 2.2 | |
| | | | | | | | | | | | |
| | | | 385,210 | | | | | |
|
| Internet & Direct Marketing Retail | |
eBay, Inc. | | | 137 | | | | 4,947 | | | | 0.1 | |
| | | | | | | | | | | | |
|
| Media | |
Omnicom Group, Inc. | | | 457 | | | | 37,026 | | | | 0.9 | |
| | | | | | | | | | | | |
|
| Metals & Mining | |
Cleveland-Cliffs, Inc. | | | 2,983 | | | | 25,057 | | | | 0.6 | |
| | | | | | | | | | | | |
|
| Multiline Retail | |
Dollar General Corp. | | | 678 | | | | 105,755 | | | | 2.5 | |
| | | | | | | | | | | | |
|
| Oil, Gas & Consumable Fuels | |
Callon Petroleum Co. | | | 8,471 | | | | 40,915 | | | | 0.9 | |
Centennial Resource Development, Inc., Class A | | | 3,984 | | | | 18,406 | | | | 0.4 | |
Encana Corp. | | | 6,401 | | | | 30,021 | | | | 0.7 | |
Hess Corp. | | | 817 | | | | 54,584 | | | | 1.3 | |
HollyFrontier Corp. | | | 4,347 | | | | 220,436 | | | | 5.1 | |
Marathon Oil Corp. | | | 18,888 | | | | 256,499 | | | | 6.0 | |
| | | | | | | | | | | | |
| Security | | Shares | | | Value | | | % of
Basket
Value | |
|
| Oil, Gas & Consumable Fuels (continued) | |
Marathon Petroleum Corp. | | | 1,542 | | | $ | 92,905 | | | | 2.2 | % |
Murphy Oil Corp. | | | 1,163 | | | | 31,168 | | | | 0.7 | |
QEP Resources, Inc. | | | 15,006 | | | | 67,527 | | | | 1.6 | |
Range Resources Corp. | | | 11,563 | | | | 56,081 | | | | 1.3 | |
SM Energy Co. | | | 4,087 | | | | 45,938 | | | | 1.1 | |
| | | | | | | | | | | | |
| | | | 914,480 | | | | | |
|
| Road & Rail | |
CSX Corp. | | | 399 | | | | 28,872 | | | | 0.7 | |
Hertz Global Holdings, Inc. | | | 5,104 | | | | 80,388 | | | | 1.9 | |
JB Hunt Transport Services, Inc. | | | 456 | | | | 53,252 | | | | 1.2 | |
Norfolk Southern Corp. | | | 451 | | | | 87,552 | | | | 2.0 | |
| | | | | | | | | | | | |
| | | | 250,064 | | | | | |
|
| Semiconductors & Semiconductor Equipment | |
Applied Materials, Inc. | | | 363 | | | | 22,157 | | | | 0.5 | |
Intel Corp. | | | 1,114 | | | | 66,673 | | | | 1.6 | |
| | | | | | | | | | | | |
| | | | 88,830 | | | | | |
|
| Specialty Retail | |
AutoNation, Inc. | | | 1,649 | | | | 80,191 | | | | 1.9 | |
Home Depot, Inc. | | | 328 | | | | 71,629 | | | | 1.7 | |
Michaels Cos., Inc. | | | 2,267 | | | | 18,340 | | | | 0.4 | |
Murphy USA, Inc. | | | 185 | | | | 21,645 | | | | 0.5 | |
O’Reilly Automotive, Inc. | | | 39 | | | | 17,092 | | | | 0.4 | |
Signet Jewelers Ltd. | | | 1,411 | | | | 30,675 | | | | 0.7 | |
| | | | | | | | | | | | |
| | | | 239,572 | | | | | |
| | | | | | | | | |
| | |
Total Reference Entity — Long | | | | 5,617,104 | | | | | |
| | | | | | | | | |
|
Reference Entity — Short | |
|
Capital Markets | |
Brookfield Asset Management, Inc., Class A | | | (2,258 | ) | | | (130,512 | ) | | | (3.0 | ) |
| | | | | | | | | | | | |
|
| Chemicals | |
Westlake Chemical Corp. | | | (396 | ) | | | (27,779 | ) | | | (0.7 | ) |
| | | | | | | | | | | | |
|
| Energy Equipment & Services | |
Diamond Offshore Drilling, Inc. | | | (2,713 | ) | | | (19,507 | ) | | | (0.5 | ) |
| | | | | | | | | | | | |
|
| Food Products | |
Archer-Daniels-Midland Co. | | | (170 | ) | | | (7,880 | ) | | | (0.2 | ) |
| | | | | | | | | | | | |
|
| Hotels, Restaurants & Leisure | |
Las Vegas Sands Corp. | | | (189 | ) | | | (13,049 | ) | | | (0.3 | ) |
| | | | | | | | | | | | |
|
| Industrial Conglomerates | |
3M Co. | | | (140 | ) | | | (24,699 | ) | | | (0.6 | ) |
| | | | | | | | | | | | |
|
| Insurance | |
Marsh & McLennan Cos., Inc. | | | (325 | ) | | | (36,208 | ) | | | (0.8 | ) |
| | | | | | | | | | | | |
|
| Interactive Media & Services | |
Match Group, Inc. | | | (4,148 | ) | | | (340,592 | ) | | | (7.9 | ) |
| | | | | | | | | | | | |
|
| IT Services | |
Fiserv, Inc. | | | (54 | ) | | | (6,244 | ) | | | (0.1 | ) |
| | | | | | | | | | | | |
|
| Metals & Mining | |
United States Steel Corp. | | | (28,337 | ) | | | (323,325 | ) | | | (7.5 | ) |
| | | | | | | | | | | | |
|
| Oil, Gas & Consumable Fuels | |
Whiting Petroleum Corp. | | | (3,611 | ) | | | (26,505 | ) | | | (0.6 | ) |
| | | | | | | | | | | | |
|
| Specialty Retail | |
Bed Bath & Beyond, Inc. | | | (21,060 | ) | | | (364,338 | ) | | | (8.5 | ) |
| | | | | | | | | | | | |
| | |
Total Reference Entity — Short | | | | (1,320,638 | ) | | | | |
| | | | | | | | | | | | |
| | |
Net Value of Reference Entity — Bank of America N.A. | | | $ | 4,296,466 | | | | | |
| | | | | | | | | | | | |
| | | | |
| SCHEDULE OF INVESTMENTS | | | 25 | |
| | |
Schedule of Investments (continued) December 31, 2019 | | BlackRock Systematic Multi-Strategy Fund |
The following table represents the individual long and short positions and related values of the equity securities underlying the total return swap with Morgan Stanley & Co. International PLC as of December 31, 2019 expiration dates 02/22/23:
| | | | | | | | | | | | |
| Security | | Shares | | | Value | | | % of
Basket
Value | |
|
Reference Entity — Long | |
|
| Aerospace & Defense | |
Arconic, Inc. | | | 10,801 | | | $ | 332,347 | | | | 9.2 | % |
General Dynamics Corp. | | | 1,101 | | | | 194,161 | | | | 5.4 | |
Lockheed Martin Corp. | | | 2,513 | | | | 978,512 | | | | 27.0 | |
Northrop Grumman Corp. | | | 2,816 | | | | 968,620 | | | | 26.7 | |
| | | | | | | | | | | | |
| | | | 2,473,640 | | | | | |
|
| Airlines | |
United Airlines Holdings, Inc. | | | 2,388 | | | | 210,359 | | | | 5.8 | |
| | | | | | | | | | | | |
|
| Auto Components | |
BorgWarner, Inc. | | | 15,457 | | | | 670,525 | | | | 18.5 | |
Goodyear Tire & Rubber Co. | | | 66,312 | | | | 1,031,483 | | | | 28.5 | |
| | | | | | | | | | | | |
| | | | 1,702,008 | | | | | |
|
| Automobiles | |
Harley-Davidson, Inc. | | | 1,771 | | | | 65,863 | | | | 1.8 | |
| | | | | | | | | | | | |
|
| Biotechnology | |
Amgen, Inc. | | | 2,874 | | | | 692,835 | | | | 19.1 | |
Biogen, Inc. | | | 3,494 | | | | 1,036,775 | | | | 28.6 | |
Gilead Sciences, Inc. | | | 1,991 | | | | 129,375 | | | | 3.6 | |
| | | | | | | | | | | | |
| | | | 1,858,985 | | | | | |
|
| Building Products | |
Fortune Brands Home & Security, Inc. | | | 9,106 | | | | 594,986 | | | | 16.4 | |
Owens Corning | | | 667 | | | | 43,435 | | | | 1.2 | |
| | | | | | | | | | | | |
| | | | 638,421 | | | | | |
|
| Chemicals | |
Albemarle Corp. | | | 6,075 | | | | 443,718 | | | | 12.2 | |
Celanese Corp. | | | 7,863 | | | | 968,092 | | | | 26.7 | |
CF Industries Holdings, Inc. | | | 3,871 | | | | 184,801 | | | | 5.1 | |
FMC Corp. | | | 62 | | | | 6,189 | | | | 0.2 | |
LyondellBasell Industries NV, Class A | | | 10,985 | | | | 1,037,863 | | | | 28.7 | |
Olin Corp. | | | 33,848 | | | | 583,878 | | | | 16.1 | |
ScottsMiracle-Gro Co. | | | 1,576 | | | | 167,340 | | | | 4.6 | |
| | | | | | | | | | | | |
| | | | 3,391,881 | | | | | |
|
| Commercial Services & Supplies | |
Brink’s Co. | | | 81 | | | | 7,345 | | | | 0.2 | |
Republic Services, Inc. | | | 10,753 | | | | 963,791 | | | | 26.6 | |
Waste Management, Inc. | | | 8,154 | | | | 929,230 | | | | 25.7 | |
| | | | | | | | | | | | |
| | | | 1,900,366 | | | | | |
|
| Communications Equipment | |
Cisco Systems, Inc. | | | 20,896 | | | | 1,002,172 | | | | 27.7 | |
| | | | | | | | | | | | |
|
| Construction & Engineering | |
AECOM | | | 1,483 | | | | 63,962 | | | | 1.8 | |
| | | | | | | | | | | | |
|
| Construction Materials | |
Martin Marietta Materials, Inc. | | | 2,837 | | | | 793,339 | | | | 21.9 | |
| | | | | | | | | | | | |
|
| Consumer Finance | |
Ally Financial, Inc. | | | 20,070 | | | | 613,339 | | | | 16.9 | |
Discover Financial Services | | | 90 | | | | 7,634 | | | | 0.2 | |
OneMain Holdings, Inc. | | | 1,450 | | | | 61,118 | | | | 1.7 | |
Synchrony Financial | | | 713 | | | | 25,675 | | | | 0.7 | |
| | | | | | | | | | | | |
| | | | 707,766 | | | | | |
|
| Containers & Packaging | |
Ball Corp. | | | 12,749 | | | | 824,478 | | | | 22.8 | |
| | | | | | | | | | | | |
| Security | | Shares | | | Value | | | % of
Basket
Value | |
|
| Containers & Packaging (continued) | |
International Paper Co. | | | 22,209 | | | $ | 1,022,724 | | | | 28.2 | % |
| | | | | | | | | | | | |
| | | | 1,847,202 | | | | | |
|
| Diversified Financial Services | |
Voya Financial, Inc. | | | 17,204 | | | | 1,049,100 | | | | 29.0 | |
| | | | | | | | | | | | |
|
| Diversified Telecommunication Services | |
CenturyLink, Inc. | | | 73,458 | | | | 970,380 | | | | 26.8 | |
| | | | | | | | | | | | |
|
| Electric Utilities | |
Duke Energy Corp. | | | 4,118 | | | | 375,603 | | | | 10.3 | |
Exelon Corp. | | | 5,780 | | | | 263,510 | | | | 7.3 | |
| | | | | | | | | | | | |
| | | | 639,113 | | | | | |
|
| Electrical Equipment | |
Eaton Corp. PLC | | | 6,983 | | | | 661,430 | | | | 18.2 | |
Sensata Technologies Holding PLC | | | 2,004 | | | | 107,955 | | | | 3.0 | |
| | | | | | | | | | | | |
| | | | 769,385 | | | | | |
|
| Electronic Equipment, Instruments & Components | |
CDW Corp. | | | 6,834 | | | | 976,169 | | | | 26.9 | |
Jabil, Inc. | | | 24,462 | | | | 1,011,014 | | | | 27.9 | |
Keysight Technologies, Inc. | | | 9,693 | | | | 994,793 | | | | 27.5 | |
| | | | | | | | | | | | |
| | | | 2,981,976 | | | | | |
|
| Energy Equipment & Services | |
Halliburton Co. | | | 969 | | | | 23,711 | | | | 0.7 | |
| | | | | | | | | | | | |
|
| Equity Real Estate Investment Trusts (REITs) | |
Boston Properties, Inc. | | | 5,356 | | | | 738,378 | | | | 20.4 | |
Brixmor Property Group, Inc. | | | 27,025 | | | | 584,010 | | | | 16.1 | |
EPR Properties | | | 3,006 | | | | 212,344 | | | | 5.9 | |
Essex Property Trust, Inc. | | | 3,305 | | | | 994,342 | | | | 27.4 | |
Gaming and Leisure Properties, Inc. | | | 3,681 | | | | 158,467 | | | | 4.4 | |
Healthpeak Properties, Inc. | | | 26,818 | | | | 924,416 | | | | 25.5 | |
Host Hotels & Resorts, Inc. | | | 1,595 | | | | 29,587 | | | | 0.8 | |
Iron Mountain, Inc. | | | 81 | | | | 2,582 | | | | 0.1 | |
Kimco Realty Corp. | | | 34,214 | | | | 708,572 | | | | 19.6 | |
Life Storage, Inc. | | | 8,551 | | | | 925,902 | | | | 25.6 | |
Mid-America Apartment Communities, Inc. | | | 7,776 | | | | 1,025,343 | | | | 28.3 | |
Outfront Media, Inc. | | | 33,736 | | | | 904,800 | | | | 25.0 | |
Regency Centers Corp. | | | 2,871 | | | | 181,131 | | | | 5.0 | |
Simon Property Group, Inc. | | | 1,813 | | | | 270,065 | | | | 7.5 | |
Spirit Realty Capital, Inc. | | | 18,787 | | | | 923,945 | | | | 25.5 | |
Tanger Factory Outlet Centers, Inc. | | | 53,094 | | | | 782,075 | | | | 21.6 | |
Ventas, Inc. | | | 5,426 | | | | 313,297 | | | | 8.6 | |
VEREIT, Inc. | | | 44,111 | | | | 407,586 | | | | 11.2 | |
| | | | | | | | | | | | |
| | | | 10,086,842 | | | | | |
|
| Food & Staples Retailing | |
Sysco Corp. | | | 7,391 | | | | 632,226 | | | | 17.5 | |
| | | | | | | | | | | | |
|
| Food Products | |
B&G Foods, Inc. | | | 51,840 | | | | 929,491 | | | | 25.7 | |
Campbell Soup Co. | | | 3,291 | | | | 162,641 | | | | 4.5 | |
Hershey Co. | | | 6,447 | | | | 947,580 | | | | 26.2 | |
Tyson Foods, Inc., Class A | | | 11,320 | | | | 1,030,573 | | | | 28.4 | |
| | | | | | | | | | | | |
| | | | 3,070,285 | | | | | |
|
| Health Care Equipment & Supplies | |
Stryker Corp. | | | 846 | | | | 177,609 | | | | 4.9 | |
| | | | | | | | | | | | |
|
| Health Care Providers & Services | |
AmerisourceBergen Corp. | | | 3,274 | | | | 278,356 | | | | 7.7 | |
Cardinal Health, Inc. | | | 15,037 | | | | 760,571 | | | | 21.0 | |
Encompass Health Corp. | | | 13,292 | | | | 920,737 | | | | 25.4 | |
Quest Diagnostics, Inc. | | | 7,977 | | | | 851,864 | | | | 23.5 | |
| | | | | | | | | | | | |
| | | | 2,811,528 | | | | | |
| | |
| 26 | | 2019 BLACKROCK ANNUAL REPORTTO SHAREHOLDERS |
| | |
Schedule of Investments (continued) December 31, 2019 | | BlackRock Systematic Multi-Strategy Fund |
| | | | | | | | | | | | |
| Security | | Shares | | | Value | | | % of
Basket
Value | |
|
| Hotels, Restaurants & Leisure | |
Churchill Downs, Inc. | | | 1,161 | | | $ | 159,289 | | | | 4.4 | % |
Scientific Games Corp., Class A | | | 619 | | | | 16,577 | | | | 0.5 | |
Starbucks Corp. | | | 11,514 | | | | 1,012,311 | | | | 27.9 | |
Wyndham Destinations, Inc. | | | 18,781 | | | | 970,790 | | | | 26.8 | |
Yum! Brands, Inc. | | | 8,883 | | | | 894,784 | | | | 24.7 | |
| | | | | | | | | | | | |
| | | | 3,053,751 | | | | | |
|
| Household Durables | |
Leggett & Platt, Inc. | | | 1,401 | | | | 71,213 | | | | 2.0 | |
Newell Brands, Inc. | | | 54,098 | | | | 1,039,763 | | | | 28.7 | |
Toll Brothers, Inc. | | | 21,846 | | | | 863,135 | | | | 23.8 | |
TRI Pointe Group, Inc. | | | 11,010 | | | | 171,536 | | | | 4.8 | |
Whirlpool Corp. | | | 5,139 | | | | 758,157 | | | | 20.9 | |
| | | | | | | | | | | | |
| | | | 2,903,804 | | | | | |
|
| Household Products | |
Colgate-Palmolive Co. | | | 14,250 | | | | 980,970 | | | | 27.1 | |
Procter & Gamble Co. | | | 1,157 | | | | 144,510 | | | | 4.0 | |
Spectrum Brands Holdings, Inc. | | | 11,825 | | | | 760,229 | | | | 21.0 | |
| | | | | | | | | | | | |
| | | | 1,885,709 | | | | | |
|
| Independent Power and Renewable Electricity Producers | |
NRG Energy, Inc. | | | 22,804 | | | | 906,459 | | | | 25.0 | |
| | | | | | | | | | | | |
|
| Insurance | |
American International Group, Inc. | | | 18,381 | | | | 943,497 | | | | 26.0 | |
Hartford Financial Services Group, Inc. | | | 5,221 | | | | 317,280 | | | | 8.8 | |
Lincoln National Corp. | | | 16,211 | | | | 956,611 | | | | 26.4 | |
Manulife Financial Corp. | | | 19,633 | | | | 398,354 | | | | 11.0 | |
MetLife, Inc. | | | 20,688 | | | | 1,054,467 | | | | 29.1 | |
Prudential Financial, Inc. | | | 4,854 | | | | 455,014 | | | | 12.6 | |
Reinsurance Group of America, Inc. | | | 1,726 | | | | 281,441 | | | | 7.8 | |
| | | | | | | | | | | | |
| | | | 4,406,664 | | | | | |
|
| IT Services | |
Broadridge Financial Solutions, Inc. | | | 252 | | | | 31,132 | | | | 0.9 | |
DXC Technology Co. | | | 27,177 | | | | 1,021,583 | | | | 28.2 | |
VeriSign, Inc. | | | 2,272 | | | | 437,769 | | | | 12.1 | |
| | | | | | | | | | | | |
| | | | 1,490,484 | | | | | |
|
| Machinery | |
Allison Transmission Holdings, Inc. | | | 21,469 | | | | 1,037,382 | | | | 28.6 | |
Trinity Industries, Inc. | | | 22,841 | | | | 505,928 | | | | 14.0 | |
| | | | | | | | | | | | |
| | | | 1,543,310 | | | | | |
|
| Media | |
Altice USA, Inc., Class A | | | 27,668 | | | | 756,443 | | | | 20.9 | |
Interpublic Group of Cos., Inc. | | | 43,402 | | | | 1,002,586 | | | | 27.7 | |
Omnicom Group, Inc. | | | 12,394 | | | | 1,004,162 | | | | 27.7 | |
Sinclair Broadcast Group, Inc., Class A | | | 31,548 | | | | 1,051,811 | | | | 29.0 | |
| | | | | | | | | | | | |
| | | | 3,815,002 | | | | | |
|
| Metals & Mining | |
Cleveland-Cliffs, Inc. | | | 2,312 | | | | 19,421 | | | | 0.5 | |
Nucor Corp. | | | 10,409 | | | | 585,818 | | | | 16.2 | |
| | | | | | | | | | | | |
| | | | 605,239 | | | | | |
|
| Multi-Utilities | |
WEC Energy Group, Inc. | | | 8,461 | | | | 780,358 | | | | 21.5 | |
| | | | | | | | | | | | |
|
| Multiline Retail | |
Dollar General Corp. | | | 2,229 | | | | 347,679 | | | | 9.6 | |
Macy’s, Inc. | | | 14,922 | | | | 253,674 | | | | 7.0 | |
Target Corp. | | | 8,255 | | | | 1,058,374 | | | | 29.2 | |
| | | | | | | | | | | | |
| | | | 1,659,727 | | | | | |
|
| Oil, Gas & Consumable Fuels | |
Apache Corp. | | | 3,382 | | | | 86,545 | | | | 2.4 | |
Callon Petroleum Co. | | | 66,797 | | | | 322,630 | | | | 8.9 | |
| | | | | | | | | | | | |
| Security | | Shares | | | Value | | | % of
Basket
Value | |
|
| Oil, Gas & Consumable Fuels (continued) | |
Centennial Resource Development, Inc., Class A | | | 81,502 | | | $ | 376,539 | | | | 10.4 | % |
Chevron Corp. | | | 1,994 | | | | 240,297 | | | | 6.6 | |
Devon Energy Corp. | | | 28,917 | | | | 750,974 | | | | 20.7 | |
Encana Corp. | | | 13,095 | | | | 61,416 | | | | 1.7 | |
Hess Corp. | | | 1,618 | | | | 108,099 | | | | 3.0 | |
HollyFrontier Corp. | | | 14,710 | | | | 745,944 | | | | 20.6 | |
Marathon Oil Corp. | | | 59,600 | | | | 809,368 | | | | 22.4 | |
Marathon Petroleum Corp. | | | 15,898 | | | | 957,855 | | | | 26.4 | |
Murphy Oil Corp. | | | 22,179 | | | | 594,397 | | | | 16.4 | |
Parsley Energy, Inc., Class A | | | 8,678 | | | | 164,101 | | | | 4.5 | |
Phillips 66 | | | 645 | | | | 71,859 | | | | 2.0 | |
QEP Resources, Inc. | | | 116,216 | | | | 522,972 | | | | 14.4 | |
Range Resources Corp. | | | 38,441 | | | | 186,439 | | | | 5.2 | |
SM Energy Co. | | | 7,204 | | | | 80,973 | | | | 2.2 | |
SRC Energy, Inc. | | | 215,096 | | | | 886,196 | | | | 24.5 | |
Valero Energy Corp. | | | 9,536 | | | | 893,046 | | | | 24.7 | |
WPX Energy, Inc. | | | 3,126 | | | | 42,951 | | | | 1.2 | |
| | | | | | | | | | | | |
| | | | 7,902,601 | | | | | |
|
| Road & Rail | |
CSX Corp. | | | 13,919 | | | | 1,007,179 | | | | 27.8 | |
Hertz Global Holdings, Inc. | | | 17,253 | | | | 271,735 | | | | 7.5 | |
JB Hunt Transport Services, Inc. | | | 8,408 | | | | 981,886 | | | | 27.1 | |
Norfolk Southern Corp. | | | 2,007 | | | | 389,619 | | | | 10.8 | |
Ryder System, Inc. | | | 9,440 | | | | 512,686 | | | | 14.1 | |
Union Pacific Corp. | | | 5,906 | | | | 1,067,746 | | | | 29.5 | |
| | | | | | | | | | | | |
| | | | 4,230,851 | | | | | |
|
| Semiconductors & Semiconductor Equipment | |
Applied Materials, Inc. | | | 6,339 | | | | 386,932 | | | | 10.7 | |
Broadcom, Inc. | | | 258 | | | | 81,533 | | | | 2.2 | |
Intel Corp. | | | 4,942 | | | | 295,779 | | | | 8.2 | |
Lam Research Corp. | | | 3,573 | | | | 1,044,745 | | | | 28.8 | |
Qorvo, Inc. | | | 1,621 | | | | 188,409 | | | | 5.2 | |
QUALCOMM, Inc. | | | 11,929 | | | | 1,052,496 | | | | 29.1 | |
| | | | | | | | | | | | |
| | | | 3,049,894 | | | | | |
|
| Software | |
CDK Global, Inc. | | | 2,161 | | | | 118,164 | | | | 3.3 | |
Oracle Corp. | | | 8,896 | | | | 471,310 | | | | 13.0 | |
| | | | | | | | | | | | |
| | | | 589,474 | | | | | |
|
| Specialty Retail | |
AutoNation, Inc. | | | 7,113 | | | | 345,905 | | | | 9.6 | |
AutoZone, Inc. | | | 840 | | | | 1,000,700 | | | | 27.6 | |
Home Depot, Inc. | | | 4,370 | | | | 954,321 | | | | 26.3 | |
L Brands, Inc. | | | 10,192 | | | | 184,679 | | | | 5.1 | |
Michaels Cos., Inc. | | | 6,086 | | | | 49,236 | | | | 1.4 | |
Murphy USA, Inc. | | | 8,247 | | | | 964,899 | | | | 26.6 | |
O’Reilly Automotive, Inc. | | | 395 | | | | 173,113 | | | | 4.8 | |
| | | | | | | | | | | | |
| | | | 3,672,853 | | | | | |
|
| Technology Hardware, Storage & Peripherals | |
Hewlett Packard Enterprise Co. | | | 60,854 | | | | 965,145 | | | | 26.7 | |
Seagate Technology PLC | | | 60 | | | | 3,570 | | | | 0.1 | |
Xerox Holdings Corp. | | | 27,345 | | | | 1,008,210 | | | | 27.8 | |
| | | | | | | | | | | | |
| | | | 1,976,925 | | | | | |
|
| Textiles, Apparel & Luxury Goods | |
Hanesbrands, Inc. | | | 69,154 | | | | 1,026,937 | | | | 28.4 | |
NIKE, Inc., Class B | | | 370 | | | | 37,485 | | | | 1.0 | |
| | | | | | | | | | | | |
| | | | 1,064,422 | | | | | |
| | | | | | | | | |
| | |
Total Reference Entity — Long | | | | 85,405,646 | | | | | |
| | | | | | | | | |
| | | | |
| SCHEDULE OF INVESTMENTS | | | 27 | |
| | |
Schedule of Investments (continued) December 31, 2019 | | BlackRock Systematic Multi-Strategy Fund |
| | | | | | | | | | | | |
| Security | | Shares | | | Value | | | % of
Basket
Value | |
|
Reference Entity — Short | |
|
Aerospace & Defense | |
Boeing Co. | | | (3,046 | ) | | $ | (992,265 | ) | | | (27.4 | )% |
TransDigm Group, Inc. | | | (243 | ) | | | (136,080 | ) | | | (3.8 | ) |
| | | | | | | | | | | | |
| | | | (1,128,345 | ) | | | | |
|
| Air Freight & Logistics | |
FedEx Corp. | | | (6,782 | ) | | | (1,025,506 | ) | | | (28.3 | ) |
| | | | | | | | | | | | |
|
| Airlines | |
Delta Air Lines, Inc. | | | (15,778 | ) | | | (922,697 | ) | | | (25.5 | ) |
| | | | | | | | | | | | |
|
| Auto Components | |
Lear Corp. | | | (7,194 | ) | | | (987,017 | ) | | | (27.2 | ) |
| | | | | | | | | | | | |
|
| Automobiles | |
Ford Motor Co. | | | (107,889 | ) | | | (1,003,368 | ) | | | (27.7 | ) |
Tesla, Inc. | | | (1,930 | ) | | | (807,377 | ) | | | (22.3 | ) |
| | | | | | | | | | | | |
| | | | (1,810,745 | ) | | | | |
|
| Beverages | |
Constellation Brands, Inc., Class A | | | (224 | ) | | | (42,504 | ) | | | (1.2 | ) |
Molson Coors Brewing Co., Class B | | | (10,792 | ) | | | (581,689 | ) | | | (16.0 | ) |
| | | | | | | | | | | | |
| | | | (624,193 | ) | | | | |
|
| Capital Markets | |
Brookfield Asset Management, Inc., Class A | | | (14,636 | ) | | | (845,961 | ) | | | (23.4 | ) |
CME Group, Inc. | | | (4,968 | ) | | | (997,177 | ) | | | (27.5 | ) |
| | | | | | | | | | | | |
| | | | (1,843,138 | ) | | | | |
|
| Chemicals | |
Chemours Co. | | | (55,156 | ) | | | (997,772 | ) | | | (27.5 | ) |
Mosaic Co. | | | (26,439 | ) | | | (572,140 | ) | | | (15.8 | ) |
PPG Industries, Inc. | | | (7,873 | ) | | | (1,050,967 | ) | | | (29.0 | ) |
RPM International, Inc. | | | (7,113 | ) | | | (545,994 | ) | | | (15.1 | ) |
Westlake Chemical Corp. | | | (12,263 | ) | | | (860,249 | ) | | | (23.8 | ) |
| | | | | | | | | | | | |
| | | | (4,027,122 | ) | | | | |
|
| Communications Equipment | |
CommScope Holding Co., Inc. | | | (7,432 | ) | | | (105,460 | ) | | | (2.9 | ) |
| | | | | | | | | | | | |
|
| Construction & Engineering | |
Fluor Corp. | | | (56,846 | ) | | | (1,073,252 | ) | | | (29.6 | ) |
| | | | | | | | | | | | |
|
| Consumer Finance | |
American Express Co. | | | (687 | ) | | | (85,525 | ) | | | (2.4 | ) |
| | | | | | | | | | | | |
|
| Containers & Packaging | |
Avery Dennison Corp. | | | (6,041 | ) | | | (790,284 | ) | | | (21.8 | ) |
Crown Holdings, Inc. | | | (2,100 | ) | | | (152,334 | ) | | | (4.2 | ) |
| | | | | | | | | | | | |
| | | | (942,618 | ) | | | | |
|
| Diversified Financial Services | |
Berkshire Hathaway, Inc., Class B | | | (4,683 | ) | | | (1,060,699 | ) | | | (29.3 | ) |
| | | | | | | | | | | | |
|
| Electric Utilities | |
Edison International | | | (14,131 | ) | | | (1,065,619 | ) | | | (29.4 | ) |
| | | | | | | | | | | | |
|
| Electronic Equipment, Instruments & Components | |
Amphenol Corp., Class A | | | (7,159 | ) | | | (774,818 | ) | | | (21.4 | ) |
Arrow Electronics, Inc. | | | (3,139 | ) | | | (265,999 | ) | | | (7.3 | ) |
Flex Ltd. | | | (83,982 | ) | | | (1,059,853 | ) | | | (29.3 | ) |
Trimble, Inc. | | | (25,304 | ) | | | (1,054,924 | ) | | | (29.1 | ) |
| | | | | | | | | | | | |
| | | | (3,155,594 | ) | | | | |
|
| Energy Equipment & Services | |
Baker Hughes Co. | | | (41,696 | ) | | | (1,068,669 | ) | | | (29.5 | ) |
Diamond Offshore Drilling, Inc. | | | (32,513 | ) | | | (233,768 | ) | | | (6.5 | ) |
Transocean Ltd. | | | (40,262 | ) | | | (277,003 | ) | | | (7.6 | ) |
| | | | | | | | | | | | |
| | | | (1,579,440 | ) | | | | |
| | | | | | | | | | | | |
| Security | | Shares | | | Value | | | % of
Basket
Value | |
|
| Entertainment | |
Live Nation Entertainment, Inc. | | | (3,235 | ) | | $ | (231,205 | ) | | | (6.4 | ) % |
Netflix, Inc. | | | (3,198 | ) | | | (1,034,777 | ) | | | (28.5 | ) |
Walt Disney Co. | | | (7,006 | ) | | | (1,013,278 | ) | | | (28.0 | ) |
| | | | | | | | | | | | |
| | | | (2,279,260 | ) | | | | |
|
| Equity Real Estate Investment Trusts (REITs) | |
Medical Properties Trust, Inc. | | | (50,081 | ) | | | (1,057,210 | ) | | | (29.2 | ) |
Prologis, Inc. | | | (11,407 | ) | | | (1,016,820 | ) | | | (28.0 | ) |
Realty Income Corp. | | | (13,616 | ) | | | (1,002,546 | ) | | | (27.7 | ) |
Alexandria Real Estate Equities, Inc. | | | (5,767 | ) | | | (931,832 | ) | | | (25.7 | ) |
Digital Realty Trust, Inc. | | | (2,744 | ) | | | (328,566 | ) | | | (9.1 | ) |
MGM Growth Properties LLC, Class A | | | (33,352 | ) | | | (1,032,911 | ) | | | (28.5 | ) |
Ryman Hospitality Properties, Inc. | | | (454 | ) | | | (39,344 | ) | | | (1.1 | ) |
| | | | | | | | | | | | |
| | | | (5,409,229 | ) | | | | |
|
| Food & Staples Retailing | |
Walgreens Boots Alliance, Inc. | | | (8,527 | ) | | | (502,752 | ) | | | (13.9 | ) |
| | | | | | | | | | | | |
|
| Food Products | |
Archer-Daniels-Midland Co. | | | (22,935 | ) | | | (1,063,037 | ) | | | (29.4 | ) |
Conagra Brands, Inc. | | | (30,297 | ) | | | (1,037,369 | ) | | | (28.6 | ) |
JM Smucker Co. | | | (379 | ) | | | (39,465 | ) | | | (1.1 | ) |
Kraft Heinz Co. | | | (31,350 | ) | | | (1,007,276 | ) | | | (27.8 | ) |
McCormick & Co., Inc. | | | (154 | ) | | | (26,138 | ) | | | (0.7 | ) |
Post Holdings, Inc. | | | (2,677 | ) | | | (292,061 | ) | | | (8.1 | ) |
| | | | | | | | | | | | |
| | | | (3,465,346 | ) | | | | |
|
| Health Care Equipment & Supplies | |
Abbott Laboratories | | | (6,757 | ) | | | (586,913 | ) | | | (16.2 | ) |
Baxter International, Inc. | | | (698 | ) | | | (58,367 | ) | | | (1.6 | ) |
Boston Scientific Corp. | | | (4,638 | ) | | | (209,730 | ) | | | (5.8 | ) |
Envista Holdings Corp. | | | (965 | ) | | | (28,603 | ) | | | (0.8 | ) |
| | | | | | | | | | | | |
| | | | (883,613 | ) | | | | |
|
| Health Care Providers & Services | |
Anthem, Inc. | | | (3,507 | ) | | | (1,059,219 | ) | | | (29.3 | ) |
Cigna Corp. | | | (1,560 | ) | | | (319,005 | ) | | | (8.8 | ) |
MEDNAX, Inc. | | | (34,808 | ) | | | (967,314 | ) | | | (26.7 | ) |
Tenet Healthcare Corp. | | | (24,001 | ) | | | (912,758 | ) | | | (25.2 | ) |
UnitedHealth Group, Inc. | | | (3,638 | ) | | | (1,069,499 | ) | | | (29.5 | ) |
| | | | | | | | | | | | |
| | | | (4,327,795 | ) | | | | |
|
| Hotels, Restaurants & Leisure | |
Las Vegas Sands Corp. | | | (14,280 | ) | | | (985,891 | ) | | | (27.2 | ) |
Marriott International, Inc., Class A | | | (2,441 | ) | | | (369,641 | ) | | | (10.2 | ) |
Restaurant Brands International, Inc. | | | (8,278 | ) | | | (527,888 | ) | | | (14.6 | ) |
Royal Caribbean Cruises Ltd. | | | (7,919 | ) | | | (1,057,266 | ) | | | (29.2 | ) |
| | | | | | | | | | | | |
| | | | (2,940,686 | ) | | | | |
|
| Household Durables | |
KB Home | | | (16,974 | ) | | | (581,699 | ) | | | (16.0 | ) |
Lennar Corp., Class A | | | (5,574 | ) | | | (310,974 | ) | | | (8.6 | ) |
Taylor Morrison Home Corp. | | | (25,335 | ) | | | (553,823 | ) | | | (15.3 | ) |
| | | | | | | | | | | | |
| | | | (1,446,496 | ) | | | | |
|
| Industrial Conglomerates | |
3M Co. | | | (782 | ) | | | (137,960 | ) | | | (3.8 | ) |
Danaher Corp. | | | (6,518 | ) | | | (1,000,383 | ) | | | (27.6 | ) |
General Electric Co. | | | (56,429 | ) | | | (629,748 | ) | | | (17.4 | ) |
Roper Industries, Inc. | | | (2,430 | ) | | | (860,779 | ) | | | (23.8 | ) |
| | | | | | | | | | | | |
| | | | (2,628,870 | ) | | | | |
|
| Insurance | |
Assurant, Inc. | | | (5,175 | ) | | | (678,339 | ) | | | (18.7 | ) |
Markel Corp. | | | (6 | ) | | | (6,859 | ) | | | (0.2 | ) |
Marsh & McLennan Cos., Inc. | | | (9,116 | ) | | | (1,015,613 | ) | | | (28.1 | ) |
Willis Towers Watson PLC | | | (2,589 | ) | | | (522,823 | ) | | | (14.4 | ) |
| | | | | | | | | | | | |
| | | | (2,223,634 | ) | | | | |
| | |
| 28 | | 2019 BLACKROCK ANNUAL REPORTTO SHAREHOLDERS |
| | |
Schedule of Investments (continued) December 31, 2019 | | BlackRock Systematic Multi-Strategy Fund |
| | | | | | | | | | | | |
| Security | | Shares | | | Value | | | % of
Basket
Value | |
|
| Interactive Media & Services | |
Match Group, Inc. | | | (8,496 | ) | | $ | (697,607 | ) | | | (19.3 | ) % |
| | | | | | | | | | | | |
|
| Internet & Direct Marketing Retail | |
Booking Holdings, Inc. | | | (24 | ) | | | (49,290 | ) | | | (1.4 | ) |
Expedia Group, Inc. | | | (9,424 | ) | | | (1,019,111 | ) | | | (28.1 | ) |
| | | | | | | | | | | | |
| | | | (1,068,401 | ) | | | | |
|
| IT Services | |
Fiserv, Inc. | | | (9,081 | ) | | | (1,050,036 | ) | | | (29.0 | ) |
MasterCard, Inc., Class A | | | (421 | ) | | | (125,706 | ) | | | (3.5 | ) |
| | | | | | | | | | | | |
| | | | (1,175,742 | ) | | | | |
|
| Leisure Products | |
Hasbro, Inc. | | | (10,046 | ) | | | (1,060,958 | ) | | | (29.3 | ) |
| | | | | | | | | | | | |
|
| Life Sciences Tools & Services | |
PerkinElmer, Inc. | | | (10,583 | ) | | | (1,027,609 | ) | | | (28.4 | ) |
| | | | | | | | | | | | |
|
| Machinery | |
Fortive Corp. | | | (13,946 | ) | | | (1,065,335 | ) | | | (29.4 | ) |
Stanley Black & Decker, Inc. | | | (3,273 | ) | | | (542,467 | ) | | | (15.0 | ) |
Westinghouse Air Brake Technologies Corp. | | | (13,307 | ) | | | (1,035,285 | ) | | | (28.6 | ) |
| | | | | | | | | | | | |
| | | | (2,643,087 | ) | | | | |
|
| Media | |
Comcast Corp., Class A | | | (4,943 | ) | | | (222,287 | ) | | | (6.2 | ) |
DISH Network Corp., Class A | | | (29,836 | ) | | | (1,058,283 | ) | | | (29.2 | ) |
Nexstar Broadcasting Group, Inc. | | | (621 | ) | | | (72,812 | ) | | | (2.0 | ) |
ViacomCBS, Inc., Class B Class B | | | (24,015 | ) | | | (1,007,909 | ) | | | (27.8 | ) |
| | | | | | | | | | | | |
| | | | (2,361,291 | ) | | | | |
|
| Metals & Mining | |
Freeport-McMoRan, Inc. | | | (23,703 | ) | | | (310,983 | ) | | | (8.6 | ) |
Newmont Mining Corp. | | | (10,234 | ) | | | (444,667 | ) | | | (12.3 | ) |
United States Steel Corp. | | | (46,314 | ) | | | (528,443 | ) | | | (14.6 | ) |
| | | | | | | | | | | | |
| | | | (1,284,093 | ) | | | | |
|
| Mortgage Real Estate Investment Trusts (REITs) | |
Starwood Property Trust, Inc. | | | (29,680 | ) | | | (737,845 | ) | | | (20.4 | ) |
| | | | | | | | | | | | |
|
| Multi-Utilities | |
Public Service Enterprise Group, Inc. | | | (17,092 | ) | | | (1,009,283 | ) | | | (27.8 | ) |
Sempra Energy | | | (638 | ) | | | (96,644 | ) | | | (2.7 | ) |
| | | | | | | | | | | | |
| | | | (1,105,927 | ) | | | | |
|
| Multiline Retail | |
Dollar Tree, Inc. | | | (447 | ) | | | (42,040 | ) | | | (1.1 | ) |
Kohl’s Corp. | | | (11,991 | ) | | | (610,941 | ) | | | (16.9 | ) |
Nordstrom, Inc. | | | (14,265 | ) | | | (583,867 | ) | | | (16.1 | ) |
| | | | | | | | | | | | |
| | | | (1,236,848 | ) | | | | |
|
| Oil, Gas & Consumable Fuels | |
Antero Resources Corp. | | | (163,393 | ) | | | (465,670 | ) | | | (12.9 | ) |
Cimarex Energy Co. | | | (1,183 | ) | | | (62,096 | ) | | | (1.7 | ) |
CNX Resources Corp. | | | (14,624 | ) | | | (129,422 | ) | | | (3.6 | ) |
Concho Resources, Inc. | | | (12,423 | ) | | | (1,087,882 | ) | | | (30.0 | ) |
Enbridge, Inc. | | | (7,017 | ) | | | (279,066 | ) | | | (7.7 | ) |
EQT Corp. | | | (95,364 | ) | | | (1,039,468 | ) | | | (28.7 | ) |
Matador Resources Co. | | | (33,149 | ) | | | (595,688 | ) | | | (16.4 | ) |
Oasis Petroleum, Inc. | | | (72,247 | ) | | | (235,525 | ) | | | (6.5 | ) |
ONEOK, Inc. | | | (6,576 | ) | | | (497,606 | ) | | | (13.7 | ) |
Southwestern Energy Co. | | | (262,803 | ) | | | (635,983 | ) | | | (17.6 | ) |
Targa Resources Corp. | | | (4,692 | ) | | | (191,574 | ) | | | (5.3 | ) |
Whiting Petroleum Corp. | | | (872 | ) | | | (6,401 | ) | | | (0.2 | ) |
| | | | | | | | | | | | |
| | | | (5,226,381 | ) | | | | |
|
| Pharmaceuticals | |
Bristol-Myers Squibb Co. | | | (4,318 | ) | | | (277,172 | ) | | | (7.7 | ) |
Eli Lilly & Co. | | | (7,911 | ) | | | (1,039,743 | ) | | | (28.7 | ) |
| | | | | | | | | | | | |
| Security | | Shares | | | Value | | | % of
Basket
Value | |
|
| Pharmaceuticals (continued) | |
Endo International PLC | | | (5,685 | ) | | $ | (26,663 | ) | | | (0.7 | ) % |
Merck & Co., Inc. | | | (1,938 | ) | | | (176,261 | ) | | | (4.9 | ) |
Mylan NV | | | (21,946 | ) | | | (441,115 | ) | | | (12.2 | ) |
Perrigo Co. PLC | | | (19,481 | ) | | | (1,006,388 | ) | | | (27.8 | ) |
Pfizer, Inc. | | | (677 | ) | | | (26,525 | ) | | | (0.7 | ) |
| | | | | | | | | | | | |
| | | | (2,993,867 | ) | | | | |
|
| Professional Services | |
Verisk Analytics, Inc., Class A | | | (329 | ) | | | (49,133 | ) | | | (1.4 | ) |
| | | | | | | | | | | | |
|
| Real Estate Management & Development | |
CBRE Group, Inc., Class A | | | (17,338 | ) | | | (1,062,646 | ) | | | (29.3 | ) |
Realogy Holdings Corp. | | | (58,246 | ) | | | (563,821 | ) | | | (15.6 | ) |
| | | | | | | | | | | | |
| | | | (1,626,467 | ) | | | | |
|
| Road & Rail | |
Avis Budget Group, Inc. | | | (1,326 | ) | | | (42,750 | ) | | | (1.2 | ) |
| | | | | | | | | | | | |
|
| Semiconductors & Semiconductor Equipment | |
KLA Corp. | | | (66 | ) | | | (11,759 | ) | | | (0.3 | ) |
NVIDIA Corp. | | | (2,584 | ) | | | (608,015 | ) | | | (16.8 | ) |
NXP Semiconductors NV | | | (5,886 | ) | | | (749,053 | ) | | | (20.7 | ) |
| | | | | | | | | | | | |
| | | | (1,368,827 | ) | | | | |
|
| Software | |
Autodesk, Inc. | | | (3,133 | ) | | | (574,780 | ) | | | (15.8 | ) |
Citrix Systems, Inc. | | | (4,869 | ) | | | (539,972 | ) | | | (14.9 | ) |
SS&C Technologies Holdings, Inc. | | | (14,572 | ) | | | (894,721 | ) | | | (24.7 | ) |
VMware, Inc., Class A | | | (327 | ) | | | (49,635 | ) | | | (1.4 | ) |
| | | | | | | | | | | | |
| | | | (2,059,108 | ) | | | | |
|
| Specialty Retail | |
Bed Bath & Beyond, Inc. | | | (38,893 | ) | | | (672,849 | ) | | | (18.6 | ) |
Best Buy Co., Inc. | | | (11,985 | ) | | | (1,052,283 | ) | | | (29.0 | ) |
| | | | | | | | | | | | |
| | | | (1,725,132 | ) | | | | |
|
| Technology Hardware, Storage & Peripherals | |
Western Digital Corp. | | | (16,947 | ) | | | (1,075,626 | ) | | | (29.7 | ) |
| | | | | | | | | | | | |
|
| Textiles, Apparel & Luxury Goods | |
Ralph Lauren Corp. | | | (2,312 | ) | | | (271,013 | ) | | | (7.5 | ) |
Tapestry, Inc. | | | (34,147 | ) | | | (920,944 | ) | | | (25.4 | ) |
| | | | | | | | | | | | |
| | | | (1,191,957 | ) | | | | |
|
| Thrifts & Mortgage Finance | |
Radian Group, Inc. | | | (29,805 | ) | | | (749,894 | ) | | | (20.7 | ) |
| | | | | | | | | | | | |
|
| Tobacco | |
Altria Group, Inc. | | | (7,507 | ) | | | (374,674 | ) | | | (10.3 | ) |
| | | | | | | | | | | | |
|
| Trading Companies & Distributors | |
Air Lease Corp. | | | (6,284 | ) | | | (298,616 | ) | | | (8.2 | ) |
Beacon Roofing Supply, Inc. | | | (17,530 | ) | | | (560,609 | ) | | | (15.5 | ) |
| | | | | | | | | | | | |
| | | | (859,225 | ) | | | | |
|
| Water Utilities | |
Aqua America, Inc. | | | (10,579 | ) | | | (496,578 | ) | | | (13.7 | ) |
| | | | | | | | | | | | |
| | |
Total Reference Entity — Short | | | | (81,783,678 | ) | | | | |
| | | | | | | | | | | | |
| | |
Net Value of Reference Entity — Morgan Stanley & Co. International PLC | | | $ | 3,621,968 | | | | | |
| | | | | | | | | | | | |
| | | | |
| SCHEDULE OF INVESTMENTS | | | 29 | |
| | |
Schedule of Investments (continued) December 31, 2019 | | BlackRock Systematic Multi-Strategy Fund |
The following table represents the individual long and short positions and related values of the equity securities underlying the total return swap with Morgan Stanley & Co. International PLC as of December 31, 2019 expiration dates 02/22/23:
| | | | | | | | | | | | |
| Security | | Shares | | | Value | | | % of
Basket
Value | |
Reference Entity — Long | |
|
Aerospace & Defense | |
Arconic, Inc. | | | 20,567 | | | $ | 632,847 | | | | 5,709.0 | % |
Lockheed Martin Corp. | | | 2,740 | | | | 1,066,901 | | | | 9,624.7 | |
Northrop Grumman Corp. | | | 3,726 | | | | 1,281,632 | | | | 11,561.9 | |
Raytheon Co. | | | 5,353 | | | | 1,176,268 | | | | 10,611.4 | |
| | | | | | | | | | | | |
| | | | 4,157,648 | | | | | |
|
| Airlines | |
Delta Air Lines, Inc. | | | 12,364 | | | | 723,047 | | | | 6,522.7 | |
Southwest Airlines Co. | | | 19,760 | | | | 1,066,645 | | | | 9,622.4 | |
United Airlines Holdings, Inc. | | | 12,315 | | | | 1,084,828 | | | | 9,786.5 | |
| | | | | | | | | | | | |
| | | | 2,874,520 | | | | | |
|
| Auto Components | |
BorgWarner, Inc. | | | 13,013 | | | | 564,504 | | | | 5,092.5 | |
Goodyear Tire & Rubber Co. | | | 67,843 | | | | 1,055,298 | | | | 9,520.1 | |
| | | | | | | | | | | | |
| | | | 1,619,802 | | | | | |
|
| Biotechnology | |
Amgen, Inc. | | | 4,636 | | | | 1,117,601 | | | | 10,082.1 | |
| | | | | | | | | | | | |
|
| Building Products | |
Johnson Controls International PLC | | | 28,840 | | | | 1,174,076 | | | | 10,591.6 | |
| | | | | | | | | | | | |
|
| Chemicals | |
Ashland Global Holdings, Inc. | | | 16,726 | | | | 1,280,041 | | | | 11,547.5 | |
Eastman Chemical Co. | | | 6,466 | | | | 512,495 | | | | 4,623.3 | |
Sherwin-Williams Co. | | | 1,716 | | | | 1,001,355 | | | | 9,033.4 | |
| | | | | | | | | | | | |
| | | | 2,793,891 | | | | | |
|
| Communications Equipment | |
Cisco Systems, Inc. | | | 22,586 | | | | 1,083,225 | | | | 9,772.0 | |
| | | | | | | | | | | | |
|
| Construction Materials | |
Vulcan Materials Co. | | | 6,456 | | | | 929,599 | | | | 8,386.1 | |
| | | | | | | | | | | | |
|
| Consumer Finance | |
Ally Financial, Inc. | | | 12,035 | | | | 367,790 | | | | 3,317.9 | |
American Express Co. | | | 9,797 | | | | 1,219,628 | | | | 11,002.5 | |
OneMain Holdings, Inc. | | | 28,621 | | | | 1,206,375 | | | | 10,883.0 | |
| | | | | | | | | | | | |
| | | | 2,793,793 | | | | | |
|
| Containers & Packaging | |
Ball Corp. | | | 19,577 | | | | 1,266,044 | | | | 11,421.3 | |
International Paper Co. | | | 16,179 | | | | 745,043 | | | | 6,721.2 | |
Packaging Corp. of America | | | 11,136 | | | | 1,247,121 | | | | 11,250.5 | |
Westrock Co. | | | 28,067 | | | | 1,204,355 | | | | 10,864.7 | |
| | | | | | | | | | | | |
| | | | 4,462,563 | | | | | |
|
| Diversified Telecommunication Services | |
CenturyLink, Inc. | | | 95,663 | | | | 1,263,708 | | | | 11,400.2 | |
Verizon Communications, Inc. | | | 20,532 | | | | 1,260,665 | | | | 11,372.7 | |
| | | | | | | | | | | | |
| | | | 2,524,373 | | | | | |
|
| Electric Utilities | |
American Electric Power Co., Inc. | | | 13,286 | | | | 1,255,660 | | | | 11,327.6 | |
Duke Energy Corp. | | | 11,996 | | | | 1,094,155 | | | | 9,870.6 | |
Exelon Corp. | | | 18,131 | | | | 826,592 | | | | 7,456.8 | |
Southern Co. | | | 16,659 | | | | 1,061,179 | | | | 9,573.1 | |
| | | | | | | | | | | | |
| | | | 4,237,586 | | | | | |
|
| Energy Equipment & Services | |
Halliburton Co. | | | 43,727 | | | | 1,070,000 | | | | 9,652.7 | |
| | | | | | | | | | | | |
| | | | | | | | | | | | |
| Security | | Shares | | | Value | | | % of
Basket
Value | |
|
| Entertainment | |
Walt Disney Co. | | | 7,416 | | | $ | 1,072,576 | | | | 9,675.9 | % |
| | | | | | | | | | | | |
|
| Equity Real Estate Investment Trusts (REITs) | |
Weyerhaeuser Co. | | | 39,867 | | | | 1,203,983 | | | | 10,861.4 | |
| | | | | | | | | | | | |
|
| Food & Staples Retailing | |
Walmart, Inc. | | | 8,803 | | | | 1,046,149 | | | | 9,437.5 | |
| | | | | | | | | | | | |
|
| Food Products | |
Lamb Weston Holdings, Inc. | | | 13,872 | | | | 1,193,408 | | | | 10,766.0 | |
Tyson Foods, Inc., Class A | | | 11,262 | | | | 1,025,293 | | | | 9,249.3 | |
| | | | | | | | | | | | |
| | | | 2,218,701 | | | | | |
|
| Health Care Providers & Services | |
Cigna Corp. | | | 2,195 | | | | 448,856 | | | | 4,049.2 | |
CVS Health Corp. | | | 16,743 | | | | 1,243,837 | | | | 11,220.9 | |
DaVita, Inc. | | | 16,539 | | | | 1,240,921 | | | | 11,194.6 | |
HCA Healthcare, Inc. | | | 8,619 | | | | 1,273,974 | | | | 11,492.8 | |
Humana, Inc. | | | 3,488 | | | | 1,278,422 | | | | 11,532.9 | |
Quest Diagnostics, Inc. | | | 11,510 | | | | 1,229,153 | | | | 11,088.4 | |
UnitedHealth Group, Inc. | | | 2,156 | | | | 633,821 | | | | 5,717.8 | |
Universal Health Services, Inc., Class B | | | 8,016 | | | | 1,149,975 | | | | 10,374.2 | |
| | | | | | | | | | | | |
| | | | 8,498,959 | | | | | |
|
| Hotels, Restaurants & Leisure | |
Boyd Gaming Corp. | | | 41,003 | | | | 1,227,630 | | | | 11,074.7 | |
Darden Restaurants, Inc. | | | 11,697 | | | | 1,275,090 | | | | 11,502.8 | |
McDonald’s Corp. | | | 5,209 | | | | 1,029,351 | | | | 9,286.0 | |
MGM Resorts International | | | 33,216 | | | | 1,105,096 | | | | 9,969.3 | |
Yum! Brands, Inc. | | | 10,259 | | | | 1,033,389 | | | | 9,322.4 | |
| | | | | | | | | | | | |
| | | | 5,670,556 | | | | | |
|
| Household Durables | |
Newell Brands, Inc. | | | 54,086 | | | | 1,039,533 | | | | 9,377.8 | |
PulteGroup, Inc. | | | 18,483 | | | | 717,141 | | | | 6,469.5 | |
Toll Brothers, Inc. | | | 28,216 | | | | 1,114,814 | | | | 10,057.0 | |
Whirlpool Corp. | | | 2,444 | | | | 360,563 | | | | 3,252.7 | |
| | | | | | | | | | | | |
| | | | 3,232,051 | | | | | |
|
| Household Products | |
Colgate-Palmolive Co. | | | 16,556 | | | | 1,139,715 | | | | 10,281.6 | |
Procter & Gamble Co. | | | 8,381 | | | | 1,046,787 | | | | 9,443.3 | |
| | | | | | | | | | | | |
| | | | 2,186,502 | | | | | |
|
| Independent Power and Renewable Electricity Producers | |
NRG Energy, Inc. | | | 29,685 | | | | 1,179,979 | | | | 10,644.8 | |
Vistra Energy Corp. | | | 55,367 | | | | 1,272,887 | | | | 11,483.0 | |
| | | | | | | | | | | | |
| | | | 2,452,866 | | | | | |
|
| Industrial Conglomerates | |
Honeywell International, Inc. | | | 7,225 | | | | 1,278,825 | | | | 11,536.5 | |
| | | | | | | | | | | | |
|
| Insurance | |
Allstate Corp. | | | 9,216 | | | | 1,036,339 | | | | 9,349.0 | |
American International Group, Inc. | | | 21,844 | | | | 1,121,253 | | | | 10,115.1 | |
Hartford Financial Services Group, Inc. | | | 16,882 | | | | 1,025,919 | | | | 9,255.0 | |
Lincoln National Corp. | | | 8,497 | | | | 501,408 | | | | 4,523.3 | |
Loews Corp. | | | 23,650 | | | | 1,241,388 | | | | 11,198.8 | |
MetLife, Inc. | | | 21,499 | | | | 1,095,804 | | | | 9,885.5 | |
| | | | | | | | | | | | |
| | | | 6,022,111 | | | | | |
|
| IT Services | |
DXC Technology Co. | | | 33,771 | | | | 1,269,452 | | | | 11,452.0 | |
| | | | | | | | | | | | |
|
| Machinery | |
Caterpillar, Inc. | | | 4,217 | | | | 622,767 | | | | 5,618.1 | |
| | | | | | | | | | | | |
|
| Media | |
Omnicom Group, Inc. | | | 14,946 | | | | 1,210,925 | | | | 10,924.0 | |
TEGNA, Inc. | | | 49,544 | | | | 826,889 | | | | 7,459.5 | |
| | | | | | | | | | | | |
| | | | 2,037,814 | | | | | |
| | |
| 30 | | 2019 BLACKROCK ANNUAL REPORTTO SHAREHOLDERS |
| | |
Schedule of Investments (continued) December 31, 2019 | | BlackRock Systematic Multi-Strategy Fund |
| | | | | | | | | | | | |
| Security | | Shares | | | Value | | | % of
Basket
Value | |
|
| Metals & Mining | |
Freeport-McMoRan, Inc. | | | 59,174 | | | $ | 776,363 | | | | 7,003.7 | % |
Newmont Goldcorp Corp. | | | 17,787 | | | | 772,845 | | | | 6,972.0 | |
| | | | | | | | | | | | |
| | | | 1,549,208 | | | | | |
|
| Multi-Utilities | |
Dominion Energy, Inc. | | | 10,325 | | | | 855,116 | | | | 7,714.2 | |
| | | | | | | | | | | | |
|
| Multiline Retail | |
Macy’s, Inc. | | | 42,882 | | | | 728,994 | | | | 6,576.4 | |
Nordstrom, Inc. | | | 9,290 | | | | 380,240 | | | | 3,430.2 | |
Target Corp. | | | 9,908 | | | | 1,270,304 | | | | 11,459.7 | |
| | | | | | | | | | | | |
| | | | 2,379,538 | | | | | |
|
| Oil, Gas & Consumable Fuels | |
Apache Corp. | | | 53,400 | | | | 1,366,506 | | | | 12,327.5 | |
ConocoPhillips | | | 18,237 | | | | 1,185,952 | | | | 10,698.7 | |
Devon Energy Corp. | | | 48,991 | | | | 1,272,296 | | | | 11,477.6 | |
Encana Corp. | | | 145,366 | | | | 681,766 | | | | 6,150.3 | |
Hess Corp. | | | 11,477 | | | | 766,778 | | | | 6,917.3 | |
Kinder Morgan, Inc. | | | 22,816 | | | | 483,015 | | | | 4,357.4 | |
Marathon Oil Corp. | | | 64,031 | | | | 869,541 | | | | 7,844.3 | |
Occidental Petroleum Corp. | | | 5,328 | | | | 219,567 | | | | 1,980.8 | |
Valero Energy Corp. | | | 13,481 | | | | 1,262,496 | | | | 11,389.2 | |
| | | | | | | | | | | | |
| | | | 8,107,917 | | | | | |
|
| Pharmaceuticals | |
Bristol-Myers Squibb Co. | | | 20,289 | | | | 1,302,351 | | | | 11,748.8 | |
Johnson & Johnson | | | 8,773 | | | | 1,279,717 | | | | 11,544.6 | |
Pfizer, Inc. | | | 7,794 | | | | 305,369 | | | | 2,754.8 | |
| | | | | | | | | | | | |
| | | | 2,887,437 | | | | | |
|
| Road & Rail | |
CSX Corp. | | | 17,567 | | | | 1,271,148 | | | | 11,467.3 | |
Norfolk Southern Corp. | | | 4,651 | | | | 902,899 | | | | 8,145.2 | |
Union Pacific Corp. | | | 7,185 | | | | 1,298,976 | | | | 11,718.3 | |
| | | | | | | | | | | | |
| | | | 3,473,023 | | | | | |
|
| Specialty Retail | |
AutoZone, Inc. | | | 877 | | | | 1,044,779 | | | | 9,425.1 | |
Gap, Inc. | | | 66,587 | | | | 1,177,258 | | | | 10,620.3 | |
Home Depot, Inc. | | | 5,238 | | | | 1,143,874 | | | | 10,319.1 | |
Lowe’s Cos., Inc. | | | 6,739 | | | | 807,063 | | | | 7,280.7 | |
| | | | | | | | | | | | |
| | | | 4,172,974 | | | | | |
|
| Technology Hardware, Storage & Peripherals | |
HP, Inc. | | | 62,817 | | | | 1,290,889 | | | | 11,645.4 | |
Xerox Holdings Corp. | | | 33,872 | | | | 1,248,861 | | | | 11,266.2 | |
| | | | | | | | | | | | |
| | | | 2,539,750 | | | | | |
|
| Thrifts & Mortgage Finance | |
MGIC Investment Corp. | | | 63,123 | | | | 894,453 | | | | 8,069.0 | |
Radian Group, Inc. | | | 44,536 | | | | 1,120,526 | | | | 10,108.5 | |
| | | | | | | | | | | | |
| | | | 2,014,979 | | | | | |
|
| Trading Companies & Distributors | |
HD Supply Holdings, Inc. | | | 29,100 | | | | 1,170,402 | | | | 10,558.4 | |
United Rentals, Inc. | | | 7,696 | | | | 1,283,462 | | | | 11,578.4 | |
| | | | | | | | | | | | |
| | | | 2,453,864 | | | | | |
| | | | | | | | | |
| | |
Total Reference Entity — Long | | | | 100,085,795 | | | | | |
| | | | | | | | | | | | |
|
Reference Entity — Short | |
|
Aerospace & Defense | |
Boeing Co. | | | (3,508 | ) | | | (1,142,766 | ) | | | (10,309.1 | ) |
Textron, Inc. | | | (26,711 | ) | | | (1,191,311 | ) | | | (10,747.1 | ) |
TransDigm Group, Inc. | | | (2,216 | ) | | | (1,240,960 | ) | | | (11,194.9 | ) |
| | | | | | | | | | | | |
| | | | (3,575,037 | ) | | | | |
| | | | | | | | | | | | |
| Security | | Shares | | | Value | | | % of
Basket
Value | |
|
| Air Freight & Logistics | |
FedEx Corp. | | | (8,035 | ) | | $ | (1,214,972 | ) | | | (10,960.5 | ) % |
United Parcel Service, Inc., Class B | | | (9,017 | ) | | | (1,055,530 | ) | | | (9,522.1 | ) |
| | | | | | | | | | | | |
| | | | (2,270,502 | ) | | | | |
|
| Airlines | |
American Airlines Group, Inc. | | | (44,641 | ) | | | (1,280,304 | ) | | | (11,549.9 | ) |
| | | | | | | | | | | | |
|
| Automobiles | |
Ford Motor Co. | | | (52,937 | ) | | | (492,314 | ) | | | (4,441.3 | ) |
General Motors Co. | | | (28,824 | ) | | | (1,054,959 | ) | | | (9,517.0 | ) |
Tesla, Inc. | | | (3,031 | ) | | | (1,267,958 | ) | | | (11,438.5 | ) |
| | | | | | | | | | | | |
| | | | (2,815,231 | ) | | | | |
|
| Beverages | |
Constellation Brands, Inc., Class A | | | (5,829 | ) | | | (1,106,053 | ) | | | (9,977.9 | ) |
Molson Coors Brewing Co., Class B | | | (23,930 | ) | | | (1,289,827 | ) | | | (11,635.8 | ) |
| | | | | | | | | | | | |
| | | | (2,395,880 | ) | | | | |
|
| Chemicals | |
Olin Corp. | | | (36,725 | ) | | | (633,506 | ) | | | (5,715.0 | ) |
PPG Industries, Inc. | | | (8,224 | ) | | | (1,097,822 | ) | | | (9,903.6 | ) |
RPM International, Inc. | | | (14,182 | ) | | | (1,088,610 | ) | | | (9,820.6 | ) |
| | | | | | | | | | | | |
| | | | (2,819,938 | ) | | | | |
|
| Commercial Services & Supplies | |
Waste Management, Inc. | | | (6,796 | ) | | | (774,472 | ) | | | (6,986.7 | ) |
| | | | | | | | | | | | |
|
| Communications Equipment | |
Motorola Solutions, Inc. | | | (7,914 | ) | | | (1,275,262 | ) | | | (11,504.4 | ) |
| | | | | | | | | | | | |
|
| Consumer Finance | |
Capital One Financial Corp. | | | (11,905 | ) | | | (1,225,143 | ) | | | (11,052.3 | ) |
Navient Corp. | | | (60,363 | ) | | | (825,766 | ) | | | (7,449.4 | ) |
| | | | | | | | | | | | |
| | | | (2,050,909 | ) | | | | |
|
| Containers & Packaging | |
Sealed Air Corp. | | | (29,460 | ) | | | (1,173,392 | ) | | | (10,585.4 | ) |
| | | | | | | | | | | | |
|
| Diversified Financial Services | |
Berkshire Hathaway, Inc., Class B | | | (4,678 | ) | | | (1,059,567 | ) | | | (9,558.6 | ) |
| | | | | | | | | | | | |
|
| Diversified Telecommunication Services | |
AT&T, Inc. | | | (26,488 | ) | | | (1,035,151 | ) | | | (9,338.3 | ) |
| | | | | | | | | | | | |
|
| Electric Utilities | |
Entergy Corp. | | | (10,641 | ) | | | (1,274,792 | ) | | | (11,500.1 | ) |
FirstEnergy Corp. | | | (21,675 | ) | | | (1,053,405 | ) | | | (9,503.0 | ) |
| | | | | | | | | | | | |
| | | | (2,328,197 | ) | | | | |
|
| Electronic Equipment, Instruments & Components | |
Arrow Electronics, Inc. | | | (8,764 | ) | | | (742,661 | ) | | | (6,699.7 | ) |
Avnet, Inc. | | | (16,278 | ) | | | (690,838 | ) | | | (6,232.2 | ) |
Corning, Inc. | | | (44,053 | ) | | | (1,282,383 | ) | | | (11,568.6 | ) |
| | | | | | | | | | | | |
| | | | (2,715,882 | ) | | | | |
|
| Energy Equipment & Services | |
Transocean Ltd. | | | (112,691 | ) | | | (775,314 | ) | | | (6,994.3 | ) |
| | | | | | | | | | | | |
|
| Equity Real Estate Investment Trusts (REITs) | |
Boston Properties, Inc. | | | (2,173 | ) | | | (299,570 | ) | | | (2,702.5 | ) |
Healthpeak Properties, Inc. | | | (33,985 | ) | | | (1,171,463 | ) | | | (10,568.0 | ) |
Host Hotels & Resorts, Inc. | | | (37,031 | ) | | | (686,925 | ) | | | (6,196.9 | ) |
Simon Property Group, Inc. | | | (7,337 | ) | | | (1,092,919 | ) | | | (9,859.4 | ) |
| | | | | | | | | | | | |
| | | | (3,250,877 | ) | | | | |
|
| Food & Staples Retailing | |
Kroger Co. | | | (37,764 | ) | | | (1,094,778 | ) | | | (9,876.2 | ) |
| | | | | | | | | | | | |
|
| Food Products | |
Campbell Soup Co. | | | (19,170 | ) | | | (947,381 | ) | | | (8,546.5 | ) |
Conagra Brands, Inc. | | | (31,737 | ) | | | (1,086,675 | ) | | | (9,803.1 | ) |
| | | | |
| SCHEDULE OF INVESTMENTS | | | 31 | |
| | |
Schedule of Investments (continued) December 31, 2019 | | BlackRock Systematic Multi-Strategy Fund |
| | | | | | | | | | | | |
| Security | | Shares | | | Value | | | % of
Basket
Value | |
|
| Food Products (continued) | |
General Mills, Inc. | | | (23,944 | ) | | $ | (1,282,441 | ) | | | (11,569.2 | ) % |
Kellogg Co. | | | (15,473 | ) | | | (1,070,113 | ) | | | (9,653.7 | ) |
Kraft Heinz Co. | | | (20,443 | ) | | | (656,833 | ) | | | (5,925.4 | ) |
| | | | | | | | | | | | |
| | | | (5,043,443 | ) | | | | |
|
| Health Care Equipment & Supplies | |
Abbott Laboratories | | | (12,323 | ) | | | (1,070,376 | ) | | | (9,656.0 | ) |
Baxter International, Inc. | | | (15,491 | ) | | | (1,295,357 | ) | | | (11,685.7 | ) |
Boston Scientific Corp. | | | (28,415 | ) | | | (1,284,926 | ) | | | (11,591.6 | ) |
| | | | | | | | | | | | |
| | | | (3,650,659 | ) | | | | |
|
| Health Care Providers & Services | |
AmerisourceBergen Corp. | | | (13,177 | ) | | | (1,120,309 | ) | | | (10,106.5 | ) |
Cardinal Health, Inc. | | | (24,607 | ) | | | (1,244,622 | ) | | | (11,228.0 | ) |
McKesson Corp. | | | (6,878 | ) | | | (951,365 | ) | | | (8,582.5 | ) |
| | | | | | | | | | | | |
| | | | (3,316,296 | ) | | | | |
|
| Hotels, Restaurants & Leisure | |
Carnival Corp. | | | (24,192 | ) | | | (1,229,680 | ) | | | (11,093.2 | ) |
Marriott International, Inc., Class A | | | (8,489 | ) | | | (1,285,489 | ) | | | (11,596.7 | ) |
Royal Caribbean Cruises Ltd. | | | (8,720 | ) | | | (1,164,207 | ) | | | (10,502.5 | ) |
| | | | | | | | | | | | |
| | | | (3,679,376 | ) | | | | |
|
| Household Durables | |
DR Horton, Inc. | | | (19,627 | ) | | | (1,035,324 | ) | | | (9,339.9 | ) |
Lennar Corp., Class A | | | (23,071 | ) | | | (1,287,131 | ) | | | (11,611.5 | ) |
MDC Holdings, Inc. | | | (33,040 | ) | | | (1,260,806 | ) | | | (11,374.0 | ) |
Mohawk Industries, Inc. | | | (9,015 | ) | | | (1,229,466 | ) | | | (11,091.2 | ) |
| | | | | | | | | | | | |
| | | | (4,812,727 | ) | | | | |
|
| Household Products | |
Clorox Co. | | | (8,405 | ) | | | (1,290,504 | ) | | | (11,641.9 | ) |
| | | | | | | | | | | | |
|
| Independent Power and Renewable Electricity Producers | |
AES Corp. | | | (18,518 | ) | | | (368,508 | ) | | | (3,324.4 | ) |
| | | | | | | | | | | | |
|
| Industrial Conglomerates | |
3M Co. | | | (6,432 | ) | | | (1,134,734 | ) | | | (10,236.6 | ) |
General Electric Co. | | | (95,427 | ) | | | (1,064,965 | ) | | | (9,607.3 | ) |
| | | | | | | | | | | | |
| | | | (2,199,699 | ) | | | | |
|
| Insurance | |
Marsh & McLennan Cos., Inc. | | | (11,342 | ) | | | (1,263,612 | ) | | | (11,399.3 | ) |
Prudential Financial, Inc. | | | (13,707 | ) | | | (1,284,894 | ) | | | (11,591.3 | ) |
Travelers Cos., Inc. | | | (9,327 | ) | | | (1,277,333 | ) | | | (11,523.1 | ) |
| | | | | | | | | | | | |
| | | | (3,825,839 | ) | | | | |
|
| Internet & Direct Marketing Retail | |
Expedia Group, Inc. | | | (4,918 | ) | | | (531,833 | ) | | | (4,797.8 | ) |
| | | | | | | | | | | | |
|
| IT Services | |
International Business Machines Corp. | | | (9,466 | ) | | | (1,268,823 | ) | | | (11,446.3 | ) |
Western Union Co. | | | (46,893 | ) | | | (1,255,794 | ) | | | (11,328.8 | ) |
| | | | | | | | | | | | |
| | | | (2,524,617 | ) | | | | |
|
| Leisure Products | |
Brunswick Corp. | | | (19,279 | ) | | | (1,156,354 | ) | | | (10,431.7 | ) |
Hasbro, Inc. | | | (10,400 | ) | | | (1,098,344 | ) | | | (9,908.4 | ) |
Mattel, Inc. | | | (8,319 | ) | | | (112,723 | ) | | | (1,016.9 | ) |
| | | | | | | | | | | | |
| | | | (2,367,421 | ) | | | | |
|
| Machinery | |
Deere & Co. | | | (7,375 | ) | | | (1,277,793 | ) | | | (11,527.2 | ) |
Dover Corp. | | | (4,733 | ) | | | (545,526 | ) | | | (4,921.3 | ) |
Stanley Black & Decker, Inc. | | | (7,679 | ) | | | (1,272,717 | ) | | | (11,481.4 | ) |
| | | | | | | | | | | | |
| | | | (3,096,036 | ) | | | | |
|
| Media | |
Charter Communications, Inc., Class A | | | (2,678 | ) | | | (1,299,044 | ) | | | (11,718.9 | ) |
Comcast Corp., Class A | | | (28,557 | ) | | | (1,284,208 | ) | | | (11,585.1 | ) |
| | | | | | | | | | | | |
| Security | | Shares | | | Value | | | % of
Basket
Value | |
|
| Media (continued) | |
DISH Network Corp., Class A | | | (32,484 | ) | | $ | (1,152,208 | ) | | | (10,394.3 | ) % |
ViacomCBS, Inc., Class B Class B | | | (14,393 | ) | | | (604,074 | ) | | | (5,449.5 | ) |
| | | | | | | | | | | | |
| | | | (4,339,534 | ) | | | | |
|
| Metals & Mining | |
Barrick Gold Corp. | | | (28,483 | ) | | | (529,499 | ) | | | (4,776.7 | ) |
Nucor Corp. | | | (22,429 | ) | | | (1,262,304 | ) | | | (11,387.5 | ) |
United States Steel Corp. | | | (60,169 | ) | | | (686,528 | ) | | | (6,193.3 | ) |
| | | | | | | | | | | | |
| | | | (2,478,331 | ) | | | | |
|
| Multi-Utilities | |
CenterPoint Energy, Inc. | | | (30,637 | ) | | | (835,471 | ) | | | (7,537.0 | ) |
Sempra Energy | | | (7,773 | ) | | | (1,177,454 | ) | | | (10,622.0 | ) |
| | | | | | | | | | | | |
| | | | (2,012,925 | ) | | | | |
|
| Multiline Retail | |
Kohl’s Corp. | | | (13,514 | ) | | | (688,538 | ) | | | (6,211.4 | ) |
| | | | | | | | | | | | |
|
| Oil, Gas & Consumable Fuels | |
Canadian Natural Resources Ltd. | | | (32,001 | ) | | | (1,035,232 | ) | | | (9,339.0 | ) |
Chevron Corp. | | | (10,778 | ) | | | (1,298,857 | ) | | | (11,717.3 | ) |
Enbridge, Inc. | | | (23,808 | ) | | | (946,844 | ) | | | (8,541.7 | ) |
Exxon Mobil Corp. | | | (17,068 | ) | | | (1,191,005 | ) | | | (10,744.3 | ) |
Murphy Oil Corp. | | | (13,463 | ) | | | (360,809 | ) | | | (3,254.9 | ) |
ONEOK, Inc. | | | (14,320 | ) | | | (1,083,594 | ) | | | (9,775.3 | ) |
Pioneer Natural Resources Co. | | | (8,656 | ) | | | (1,310,259 | ) | | | (11,820.1 | ) |
Williams Cos., Inc. | | | (51,033 | ) | | | (1,210,503 | ) | | | (10,920.2 | ) |
| | | | | | | | | | | | |
| | | | (8,437,103 | ) | | | | |
|
| Paper & Forest Products | |
Louisiana-Pacific Corp. | | | (42,956 | ) | | | (1,274,505 | ) | | | (11,497.6 | ) |
| | | | | | | | | | | | |
|
| Pharmaceuticals | |
Bausch Health Cos., Inc. | | | (11,042 | ) | | | (330,377 | ) | | | (2,980.4 | ) |
| | | | | | | | | | | | |
|
| Road & Rail | |
Avis Budget Group, Inc. | | | (39,156 | ) | | | (1,262,390 | ) | | | (11,388.2 | ) |
Ryder System, Inc. | | | (24,210 | ) | | | (1,314,845 | ) | | | (11,861.5 | ) |
| | | | | | | | | | | | |
| | | | (2,577,235 | ) | | | | |
|
| Semiconductors & Semiconductor Equipment | |
Advanced Micro Devices, Inc. | | | (29,765 | ) | | | (1,365,023 | ) | | | (12,314.1 | ) |
| | | | | | | | | | | | |
|
| Specialty Retail | |
Best Buy Co., Inc. | | | (14,377 | ) | | | (1,262,300 | ) | | | (11,387.5 | ) |
L Brands, Inc. | | | (16,615 | ) | | | (301,064 | ) | | | (2,716.0 | ) |
TJX Cos., Inc. | | | (19,344 | ) | | | (1,181,145 | ) | | | (10,655.3 | ) |
| | | | | | | | | | | | |
| | | | (2,744,509 | ) | | | | |
|
| Technology Hardware, Storage & Peripherals | |
Dell Technologies, Inc. | | | (25,552 | ) | | | (1,313,117 | ) | | | (11,845.9 | ) |
| | | | | | | | | | | | |
|
| Textiles, Apparel & Luxury Goods | |
VF Corp. | | | (11,041 | ) | | | (1,100,346 | ) | | | (9,926.4 | ) |
| | | | | | | | | | | | |
|
| Tobacco | |
Altria Group, Inc. | | | (14,723 | ) | | | (734,825 | ) | | | (6,629.0 | ) |
| | | | | | | | | | | | |
|
| Wireless Telecommunication Services | |
Rogers Communications, Inc., Class B | | | (25,784 | ) | | | (1,280,691 | ) | | | (11,553.4 | ) |
| | | | | | | | | | | | |
| | |
Total Reference Entity — Short | | | | (100,074,710 | ) | | | | |
| | | | | | | | | | | | |
| | |
Net Value of Reference Entity — Morgan Stanley & Co. International PLC | | | $ | 11,085 | | | | | |
| | | | | | | | | | | | |
| | |
| 32 | | 2019 BLACKROCK ANNUAL REPORTTO SHAREHOLDERS |
| | |
Schedule of Investments (continued) December 31, 2019 | | BlackRock Systematic Multi-Strategy Fund |
Balances Reported in the Statement of Assets and Liabilities for Centrally Cleared Swaps and OTC Swaps
| | | | | | | | | | | | | | | | |
| | | Swap
Premiums
Paid | | | Swap
Premiums
Received | | | Unrealized
Appreciation | | | Unrealized
Depreciation | |
Centrally Cleared Swaps(a) | | $ | 3,761 | | | $ | (43 | ) | | $ | 113,052 | | | $ | (86,010 | ) |
OTC Swaps | | | — | | | | — | | | | 842,672 | | | | (1,059,146 | ) |
| | (a) | Includes cumulative appreciation (depreciation) on centrally cleared swaps, as reported in the Schedule of Investments. Only current day’s variation margin is reported within the Statement of Assets and Liabilities and is net of any previously paid (received) swap premium amounts. | |
Derivative Financial Instruments Categorized by Risk Exposure
As of period end, the fair values of derivative financial instruments located in the Statement of Assets and Liabilities were as follows:
| | | | | | | | | | | | | | | | | | | | | | | | | | | | |
| | | Commodity
Contracts | | | Credit
Contracts | | | Equity
Contracts | | | Foreign
Currency
Exchange
Contracts | | | Interest
Rate
Contracts | | | Other
Contracts | | | Total | |
Assets — Derivative Financial Instrument | | | | | | | | | | | | | | | | | | | | | | | | | |
Futures contracts | | | | | | | | | | | | | | | | | | | | | | | | | | | | |
Unrealized appreciation on futures contracts(a) | | $ | — | | | $ | — | | | $ | — | | | $ | — | | | $ | 188,523 | | | $ | — | | | $ | 188,523 | |
Swaps — centrally cleared | | | | | | | | | | | | | | | | | | | | | | | | | | | | |
Unrealized appreciation on centrally cleared swaps(a) | | | — | | | | — | | | | — | | | | — | | | | 113,052 | | | | — | | | | 113,052 | |
Swaps — OTC | | | | | | | | | | | | | | | | | | | | | | | | | | | | |
Unrealized appreciation on OTC swaps; Swap premiums paid | | | — | | | | — | | | | 837,155 | | | | — | | | | 5,517 | | | | — | | | | 842,672 | |
| | | | | | | | | | | | | | | | | | | | | | | | | | | | |
| | $ | — | | | $ | — | | | $ | 837,155 | | | $ | — | | | $ | 307,092 | | | $ | — | | | $ | 1,144,247 | |
| | | | | | | | | | | | | | | | | | | | | | | | | | | | |
| | | | | | |
| Liabilities — Derivative Financial Instrument | | | | | | | | | | | | | | | | | | | |
Futures contracts | | | | | | | | | | | | | | | | | | | | | | | | | | | | |
Unrealized depreciation on futures contracts(a) | | $ | — | | | $ | — | | | $ | — | | | $ | — | | | $ | 292,790 | | | $ | — | | | $ | 292,790 | |
Forward foreign currency exchange contracts | | | | | | | | | | | | | | | | | | | | | | | | | | | | |
Unrealized depreciation on forward foreign currency exchange contracts | | | — | | | | — | | | | — | | | | 5,032 | | | | — | | | | — | | | | 5,032 | |
Swaps — centrally cleared | | | | | | | | | | | | | | | | | | | | | | | | | | | | |
Unrealized depreciation on centrally cleared swaps(a) | | | — | | | | — | | | | — | | | | — | | | | 86,010 | | | | — | | | | 86,010 | |
Swaps — OTC | | | | | | | | | | | | | | | | | | | | | | | | | | | | |
Unrealized depreciation on OTC swaps; Swap premiums received | | | — | | | | — | | | | 1,002,535 | | | | — | | | | 56,611 | | | | — | | | | 1,059,146 | |
| | | | | | | | | | | | | | | | | | | | | | | | | | | | |
| | $ | — | | | $ | — | | | $ | 1,002,535 | | | $ | 5,032 | | | $ | 435,411 | | | $ | — | | | $ | 1,442,978 | |
| | | | | | | | | | | | | | | | | | | | | | | | | | | | |
| | (a) | Net cumulative unrealized appreciation (depreciation) on futures contracts and centrally cleared swaps, if any, are reported in the Schedule of Investments. In the Statement of Assets and Liabilities, only current day’s variation margin is reported in receivables or payables and the net cumulative unrealized appreciation (depreciation) is included in accumulated earnings (loss). | |
For the year ended December 31, 2019, the effect of derivative financial instruments in the Statement of Operations was as follows:
| | | | | | | | | | | | | | | | | | | | | | | | | | | | |
| | | Commodity
Contracts | | | Credit
Contracts | | | Equity
Contracts | | | Foreign
Currency
Exchange
Contracts | | | Interest
Rate
Contracts | | | Other
Contracts | | | Total | |
Net Realized Gain (Loss) from: | | | | | | | | | | | | | | | | | | | | | | | | | | | | |
Futures contracts | | $ | — | | | $ | — | | | $ | (52,402 | ) | | $ | — | | | $ | 874,226 | | | $ | — | | | $ | 821,824 | |
Forward foreign currency exchange contracts | | | — | | | | — | | | | — | | | | 6,248 | | | | — | | | | — | | | | 6,248 | |
Swaps | | | — | | | | 37,692 | | | | (1,069,471 | ) | | | — | | | | 36,490 | | | | — | | | | (995,289 | ) |
| | | | | | | | | | | | | | | | | | | | | | | | | | | | |
| | $ | — | | | $ | 37,692 | | | $ | (1,121,873 | ) | | $ | 6,248 | | | $ | 910,716 | | | $ | — | | | $ | (167,217 | ) |
| | | | | | | | | | | | | | | | | | | | | | | | | | | | |
| | | | | | | |
| Net Change in Unrealized Appreciation (Depreciation) on: | | | | | | | | | | | | | | | | | | | | | |
Futures contracts | | $ | — | | | $ | — | | | $ | — | | | $ | — | | | $ | (123,507 | ) | | $ | — | | | $ | (123,507 | ) |
Forward foreign currency exchange contracts | | | — | | | | — | | | | — | | | | (5,096 | ) | | | — | | | | — | | | | (5,096 | ) |
Swaps | | | — | | | | 27,323 | | | | (1,166,019 | ) | | | — | | | | (14,341 | ) | | | — | | | | (1,153,037 | ) |
| | | | | | | | | | | | | | | | | | | | | | | | | | | | |
| | $ | — | | | $ | 27,323 | | | $ | (1,166,019 | ) | | $ | (5,096 | ) | | $ | (137,848 | ) | | $ | — | | | $ | (1,281,640 | ) |
| | | | | | | | | | | | | | | | | | | | | | | | | | | | |
| | | | |
| SCHEDULE OF INVESTMENTS | | | 33 | |
| | |
Schedule of Investments (continued) December 31, 2019 | | BlackRock Systematic Multi-Strategy Fund |
Average Quarterly Balances of Outstanding Derivative Financial Instruments
| | | | |
Futures contracts: | | | | |
Average notional value of contracts purchased | | $ | 18,513,446 | |
Average notional value of contracts sold | | $ | 30,005,023 | |
Forward foreign currency exchange contracts: | | | | |
Average amounts purchased — in USD | | $ | 373,168 | |
Credit default swaps: | | | | |
Average notional value — buy protection | | $ | 664,375 | |
Average notional value — sell protection | | $ | 375,000 | |
Interest rate swaps: | | | | |
Average notional value — pays fixed rate | | $ | 10,867,874 | |
Average notional value — receives fixed rate | | $ | 13,138,136 | |
Total return swaps | | | | |
Average notional amount | | $ | 4,385,693 | |
For more information about the Fund’s Investment risks regarding derivative financial instruments, refer to the Notes to Financial Statements
Derivative Financial Instruments — Offsetting as of Period End
The Fund’s derivative assets and liabilities (by type) are as follows:
| | | | | | | | |
| | | Assets | | | Liabilities | |
Futures contracts | | $ | 57,321 | | | $ | 79,650 | |
Forward foreign currency exchange contracts | | | — | | | | 5,032 | |
Swaps — Centrally cleared | | | 5,309 | | | | — | |
Swaps — OTC(a) | | | 842,672 | | | | 1,059,146 | |
| | | | | | | | |
Total derivative assets and liabilities in the Statement of Assets and Liabilities | | $ | 905,302 | | | $ | 1,143,828 | |
Derivatives not subject to a Master Netting Agreement or similar agreement (“MNA”) | | | (62,630 | ) | | | (79,650 | ) |
| | | | | | | | |
Total derivative assets and liabilities subject to an MNA | | $ | 842,672 | | | $ | 1,064,178 | |
| | | | | | | | |
| | (a) | Includes unrealized appreciation (depreciation) on OTC swaps and swap premiums (paid/received) in the Statement of Assets and Liabilities. | |
The following table presents the Fund’s derivative assets (and liabilities) by counterparty net of amounts available for offset under an MNA and net of the related collateral received (and pledged) by the Fund:
| | | | | | | | | | | | | | | | | | | | |
| Counterparty | | Derivative
Assets
Subject to
an MNA by
Counterparty | | | Derivatives
Available
for Offset (a) | | | Non-cash
Collateral
Received | | | Cash
Collateral
Received | | | Net Amount
of Derivative
Assets | |
Bank of America N.A. | | $ | 114,188 | | | $ | (114,188 | ) | | $ | — | | | $ | — | | | $ | — | |
Morgan Stanley & Co. International PLC | | | 728,484 | | | | (728,484 | ) | | | — | | | | — | | | | — | |
| | | | | | | | | | | | | | | | | | | | |
| | $ | 842,672 | | | $ | (842,672 | ) | | $ | — | | | $ | — | | | $ | — | |
| | | | | | | | | | | | | | | | | | | | |
| | | | | | | | | | | | | | | | | | | | |
| Counterparty | | Derivative
Liabilities
Subject to
an MNA by
Counterparty | | | Derivatives
Available
for Offset (a) | | | Non-cash
Collateral
Pledged | | | Cash
Collateral
Pledged (b) | | | Net Amount
of Derivative
Liabilities (c) | |
Bank of America N.A. | | $ | 251,040 | | | $ | (114,188 | ) | | $ | — | | | $ | (136,852 | ) | | $ | — | |
Citibank N.A. | | | 46,610 | | | | — | | | | — | | | | — | | | | 46,610 | |
Deutsche Bank AG | | | 743 | | | | — | | | | — | | | | — | | | | 743 | |
JPMorgan Chase Bank N.A. | | | 4,969 | | | | — | | | | — | | | | — | | | | 4,969 | |
Morgan Stanley & Co. International PLC | | | 759,687 | | | | (728,484 | ) | | | — | | | | (31,203 | ) | | | — | |
Royal Bank of Canada | | | 157 | | | | — | | | | — | | | | — | | | | 157 | |
State Street Bank and Trust Co. | | | 972 | | | | — | | | | — | | | | — | | | | 972 | |
| | | | | | | | | | | | | | | | | | | | |
| | $ | 1,064,178 | | | $ | (842,672 | ) | | $ | — | | | $ | (168,055 | ) | | $ | 53,451 | |
| | | | | | | | | | | | | | | | | | | | |
| | (a) | The amount of derivatives available for offset is limited to the amount of derivative asset and/or liabilities that are subject to an MNA. | |
| | (b) | Net Excess of collateral pledged to the individual counterparty is not shown for financial reporting purposes. | |
| | (c) | Net amount represents the net amount payable due to counterparty in the event of default. | |
| | |
| 34 | | 2019 BLACKROCK ANNUAL REPORTTO SHAREHOLDERS |
| | |
Schedule of Investments (continued) December 31, 2019 | | BlackRock Systematic Multi-Strategy Fund |
Fair Value Hierarchy as of Period End
Various inputs are used in determining the fair value of investments and derivative financial instruments. For information about the Fund’s policy regarding valuation of investments and derivative financial instruments, refer to the Notes to Financial Statements.
The following tables summarize the Fund’s investments and derivative financial instruments categorized in the disclosure hierarchy:
| | | | | | | | | | | | | | | | |
| | | Level 1 | | | Level 2 | | | Level 3 | | | Total | |
Assets: | |
Investments: | |
Asset-Backed Securities | | $ | — | | | $ | 32,489,339 | | | $ | 416,195 | | | $ | 32,905,534 | |
Common Stocks: | |
United States | | | 20,838,031 | | | | — | | | | — | | | | 20,838,031 | |
United Kingdom | | | 430,139 | | | | — | | | | — | | | | 430,139 | |
Corporate Bonds | | | — | | | | 114,806,888 | | | | — | | | | 114,806,888 | |
Non-Agency Mortgage-Backed Securities | | | — | | | | 12,766,491 | | | | — | | | | 12,766,491 | |
Short-Term Securities | | | 96,002,743 | | | | — | | | | — | | | | 96,002,743 | |
U.S. Government Sponsored Agency Securities | | | — | | | | 162,134,364 | | | | 141,190 | | | | 162,275,554 | |
U.S. Treasury Obligations | | | — | | | | 19,546,797 | | | | — | | | | 19,546,797 | |
| | | | | | | | | | | | | | | | |
| | $ | 117,270,913 | | | $ | 341,743,879 | | | $ | 557,385 | | | $ | 459,572,177 | |
| | | | | | | | | | | | | | | | |
Derivative Financial Instruments(a) | |
Assets: | |
Interest rate contracts | | $ | 188,523 | | | $ | 118,569 | | | $ | — | | | $ | 307,092 | |
Equity contracts | | | — | | | | 837,155 | | | | — | | | | 837,155 | |
Liabilities: | |
Forward foreign currency contracts | | | — | | | | (5,032 | ) | | | — | | | | (5,032 | ) |
Interest rate contracts | | | (292,790 | ) | | | (142,621 | ) | | | — | | | | (435,411 | ) |
Equity contracts | | | | | | | (1,002,535 | ) | | | | | | | (1,002,535 | ) |
| | | | | | | | | | | | | | | | |
| | $ | (104,267 | ) | | $ | (194,464 | ) | | $ | — | | | $ | (298,731 | ) |
| | | | | | | | | | | | | | | | |
| | (a) | Derivative financial instruments are swaps, futures contracts, and forward foreign currency exchange contracts. Swaps, futures contracts and forward foreign currency exchange contracts are valued at the unrealized appreciation (depreciation) on the instrument. | |
See notes to financial statements.
| | | | |
| SCHEDULE OF INVESTMENTS | | | 35 | |
Statement of Assets and Liabilities
December 31, 2019
| | | | |
| | | BlackRock Systematic
Multi-Strategy Fund | |
|
ASSETS | |
Investments at value — unaffiliated(cost — $360,090,398) | | $ | 363,569,434 | |
Investments at value — affiliated (cost — $96,002,743) | | | 96,002,743 | |
Cash pledged: | | | | |
Collateral — OTC derivatives | | | 1,040,000 | |
Futures contracts | | | 794,683 | |
Centrally cleared swaps | | | 220,000 | |
Foreign currency at value (cost — $299,790) | | | 302,622 | |
Receivables: | | | | |
Investments sold | | | 31,130 | |
Capital shares sold | | | 2,068,305 | |
Dividends — affiliated | | | 80,509 | |
Dividends — unaffiliated | | | 41,627 | |
Interest — unaffiliated | | | 1,706,433 | |
Principal paydowns | | | 5,683 | |
Variation margin on futures contracts | | | 57,321 | |
Variation margin on centrally cleared swaps | | | 5,309 | |
Unrealized appreciation on OTC swaps | | | 842,672 | |
Prepaid expenses | | | 87,326 | |
| | | | |
Total assets | | | 466,855,797 | |
| | | | |
|
LIABILITIES | |
Bank overdraft | | | 55,764 | |
Payables: | | | | |
Investments purchased | | | 112,230,893 | |
Administration fees | | | 19,987 | |
Capital shares redeemed | | | 161,117 | |
Investment advisory fees | | | 278,262 | |
Other accrued expenses | | | 327,085 | |
Service and distribution fees | | | 16,414 | |
Variation margin on futures contracts | | | 79,650 | |
Unrealized depreciation on: | | | | |
Forward foreign currency exchange contracts | | | 5,032 | |
OTC swaps | | | 1,059,146 | |
| | | | |
Total liabilities | | | 114,233,350 | |
| | | | |
| |
NET ASSETS | | $ | 352,622,447 | |
| | | | |
|
NET ASSETS CONSIST OF | |
Paid-in capital | | $ | 358,912,613 | |
Accumulated loss | | | (6,290,166 | ) |
| | | | |
NET ASSETS | | $ | 352,622,447 | |
| | | | |
| |
| Institutional | | | |
Net assets | | $ | 277,781,964 | |
| | | | |
Shares outstanding(a) | | | 28,110,346 | |
| | | | |
Net asset value | | $ | 9.88 | |
| | | | |
| |
| Investor A | | | |
Net assets | | $ | 74,535,959 | |
| | | | |
Shares outstanding(a) | | | 7,551,993 | |
| | | | |
Net asset value | | $ | 9.87 | |
| | | | |
| |
| Investor C | | | |
Net assets | | $ | 304,524 | |
| | | | |
Shares outstanding(a) | | | 30,839 | |
| | | | |
Net asset value | | $ | 9.87 | |
| | | | |
| (a) | Unlimited number of shares authorized, $0.001 par value. |
See notes to financial statements.
| | |
| 36 | | 2019 BLACKROCK ANNUAL REPORTTO SHAREHOLDERS |
Statement of Operations
Year Ended December 31, 2019
| | | | |
| | | BlackRock Systematic
Multi-Strategy Fund | |
|
INVESTMENT INCOME | |
Interest — unaffiliated | | $ | 3,717,816 | |
Dividends — unaffiliated | | | 395,413 | |
Dividends — affiliated | | | 374,816 | |
| | | | |
Total investment income | | | 4,488,045 | |
| | | | |
|
EXPENSES | |
Investment advisory | | | 1,121,429 | |
Professional | | | 153,806 | |
Transfer agent — class specific | | | 109,706 | |
Custodian | | | 102,026 | |
Service and distribution — class specific | | | 88,099 | |
Accounting services | | | 72,163 | |
Registration | | | 68,400 | |
Administration | | | 59,576 | |
Printing | | | 31,449 | |
Administration — class specific | | | 28,036 | |
Trustees and Officer | | | 3,079 | |
Miscellaneous | | | 81,223 | |
| | | | |
Total expenses | | | 1,918,992 | |
Less: | |
Fees waived and/or reimbursed by the Manager | | | (359,206 | ) |
Administration fees waived | | | (2,189 | ) |
Administration fees waived — class specific | | | (28,036 | ) |
Transfer agent fees waived and/or reimbursed — class specific | | | (109,702 | ) |
| | | | |
Total expenses after fees waived and/or reimbursed | | | 1,419,859 | |
| | | | |
Net investment income | | | 3,068,186 | |
| | | | |
|
REALIZED AND UNREALIZED GAIN (LOSS) | |
Net realized gain (loss) from: | |
Investments — unaffiliated | | | 1,059,600 | |
Capital gain distributions from investment companies — affiliated | | | 93 | |
Futures contracts | | | 821,824 | |
Forward foreign currency exchange contracts | | | 6,248 | |
Foreign currency transactions | | | 3,973 | |
Swaps | | | (995,289 | ) |
| | | | |
| | | 896,449 | |
| | | | |
Net change in unrealized appreciation (depreciation) on: | | | | |
Investments — unaffiliated | | | 4,044,207 | |
Futures contracts | | | (123,507 | ) |
Forward foreign currency exchange contracts | | | (5,096 | ) |
Foreign currency translations | | | 7,117 | |
Swaps | | | (1,153,037 | ) |
| | | | |
| | | 2,769,684 | |
| | | | |
Net realized and unrealized gain | | | 3,666,133 | |
| | | | |
NET INCREASE IN NET ASSETS RESULTING FROM OPERATIONS | | $ | 6,734,319 | |
| | | | |
See notes to financial statements.
Statements of Changes in Net Assets
| | | | | | | | |
| | | BlackRock Systematic
Multi-Strategy Fund | |
| | | Year Ended December 31, | |
| | | 2019 | | | 2018 | |
|
INCREASE (DECREASE) IN NET ASSETS | |
|
OPERATIONS | |
Net investment income | | $ | 3,068,186 | | | $ | 884,540 | |
Net realized gain | | | 896,449 | | | | 1,225,192 | |
Net change in unrealized appreciation (depreciation) | | | 2,769,684 | | | | (1,561,989 | ) |
| | | | | | | | |
Net increase in net assets resulting from operations | | | 6,734,319 | | | | 547,743 | |
| | | | | | | | |
|
DISTRIBUTIONS TO SHAREHOLDERS(a) | |
Institutional | | | (7,814,178 | ) | | | (2,551,421 | ) |
Investor A | | | (2,122,057 | ) | | | (151,678 | ) |
Investor C | | | (7,685 | ) | | | (5,147 | ) |
| | | | | | | | |
Decrease in net assets resulting from distributions to shareholders | | | (9,943,920 | ) | | | (2,708,246 | ) |
| | | | | | | | |
|
CAPITAL SHARE TRANSACTIONS | |
Net increase in net assets derived from capital share transactions | | | 320,071,947 | | | | 9,056,907 | |
| | | | | | | | |
|
NET ASSETS | |
Total increase in net assets | | | 316,862,346 | | | | 6,896,404 | |
Beginning of year | | | 35,760,101 | | | | 28,863,697 | |
| | | | | | | | |
End of year | | $ | 352,622,447 | | | $ | 35,760,101 | |
| | | | | | | | |
| (a) | Distributions for annual periods determined in accordance with U.S. federal income tax regulations. |
See notes to financial statements.
| | |
| 38 | | 2019 BLACKROCK ANNUAL REPORTTO SHAREHOLDERS |
Financial Highlights
(For a share outstanding throughout each period)
| | | | | | | | | | | | | | | | | | | | | | | | |
| | | BlackRock Systematic Multi-Strategy Fund | |
| |
| | | Institutional | |
| | | Year Ended December 31, | | | | | | Period from
05/19/15 (a) to 12/31/15 | |
| | | 2019 | | | 2018 | | | 2017 | | | 2016 | | | | |
| | | | | | | |
Net asset value, beginning of period | | $ | 9.47 | | | $ | 10.15 | | | $ | 9.61 | | | $ | 9.53 | | | | | | | $ | 10.00 | |
| | | | | | | | | | | | | | | | | | | | | | | | |
Net investment income(b) | | | 0.23 | | | | 0.29 | | | | 0.22 | | | | 0.16 | | | | | | | | 0.11 | |
Net realized and unrealized gain (loss) | | | 0.56 | | | | (0.12 | ) | | | 0.73 | | | | 0.40 | | | | | | | | (0.46 | ) |
| | | | | | | | | | | | | | | | | | | | | | | | |
Net increase (decrease) from investment operations | | | 0.79 | | | | 0.17 | | | | 0.95 | | | | 0.56 | | | | | | | | (0.35 | ) |
| | | | | | | | | | | | | | | | | | | | | | | | |
| | | | | | |
Distributions from(c) | | | | | | | | | | | | | | | | | | | | | | | | |
From net investment income | | | (0.18 | ) | | | (0.29 | ) | | | (0.22 | ) | | | (0.16 | ) | | | | | | | (0.12 | ) |
From net realized gain | | | (0.20 | ) | | | (0.56 | ) | | | (0.19 | ) | | | (0.32 | ) | | | | | | | — | |
| | | | | | | | | | | | | | | | | | | | | | | | |
Total distributions | | | (0.38 | ) | | | (0.85 | ) | | | (0.41 | ) | | | (0.48 | ) | | | | | | | (0.12 | ) |
| | | | | | | | | | | | | | | | | | | | | | | | |
| | | | | | |
Net asset value, end of period | | $ | 9.88 | | | $ | 9.47 | | | $ | 10.15 | | | $ | 9.61 | | | | | | | $ | 9.53 | |
| | | | | | | | | | | | | | | | | | | | | | | | |
| | | | | | |
Total Return(d) | | | | | | | | | | | | | | | | | | | | | | | | |
Based on net asset value | | | 8.43 | % | | | 1.74 | % | | | 10.00 | % | | | 5.91 | % | | | | | | | (3.53 | )%(e) |
| | | | | | | | | | | | | | | | | | | | | | | | |
| | | | | | |
Ratios to Average Net Assets(f) | | | | | | | | | | | | | | | | | | | | | | | | |
Total expenses | | | 1.29 | % | | | 2.33 | % | | | 2.16 | % | | | 2.24 | % | | | | | | | 2.05 | %(g)(h) |
| | | | | | | | | | | | | | | | | | | | | | | | |
Total expenses after fees waived and/or reimbursed | | | 0.95 | % | | | 0.95 | % | | | 0.95 | % | | | 1.19 | % | | | | | | | 1.20 | %(g) |
| | | | | | | | | | | | | | | | | | | | | | | | |
Total expenses after fees waived and/or reimbursed and excluding excise tax | | | 0.95 | % | | | 0.95 | % | | | 0.95 | % | | | 1.18 | % | | | | | | | 1.20 | %(g) |
| | | | | | | | | | | | | | | | | | | | | | | | |
Net investment income | | | 2.27 | % | | | 2.93 | % | | | 2.19 | % | | | 1.64 | % | | | | | | | 1.79 | %(g) |
| | | | | | | | | | | | | | | | | | | | | | | | |
| | | | | | |
Supplemental Data | | | | | | | | | | | | | | | | | | | | | | | | |
Net assets, end of period (000) | | $ | 277,782 | | | $ | 32,961 | | | $ | 27,328 | | | $ | 25,588 | | | | | | | $ | 23,844 | |
| | | | | | | | | | | | | | | | | | | | | | | | |
Portfolio turnover rate(i)(j) | | | 442 | % | | | 426 | % | | | 424 | % | | | 722 | % | | | | | | | 440 | % |
| | | | | | | | | | | | | | | | | | | | | | | | |
| (a) | Commencement of operations. |
| (b) | Based on average shares outstanding. |
| (c) | Distributions for annual periods determined in accordance with U.S. federal income tax regulations. |
| (d) | Where applicable, assumes the reinvestment of distributions. |
| (e) | Aggregate total return. |
| (f) | Excludes expenses incurred indirectly as a result of investments in underlying funds as follows: |
| | | | | | | | | | | | | | | | | | | | | | | | |
| | | Year Ended December 31, | | | | | | Period from
05/19/15 (a) to 12/31/15 | |
| | | 2019 | | | 2018 | | | 2017 | | | 2016 | | | | |
Investments in underlying funds | | | 0.02 | % | | | 0.01 | % | | | 0.00 | % | | | 0.02 | % | | | | | | | 0.03 | % |
| | | | | | | | | | | | | | | | | | | | | | | | |
| (h) | Audit, offering and organization costs were not annualized in the calculation of expense ratios. If these expenses were annualized, the total expenses would have been 2.44%. |
| (i) | Excludes investments underlying the total return swaps. |
| (j) | Includes mortgage dollar rolls (“MDRs”). Additional information regarding portfolio turnover rate is as follows: |
| | | | | | | | | | | | | | | | | | | | | | | | |
| | | Year Ended December 31, | | | | | | Period from
05/19/15 (a) to 12/31/15 | |
| | | 2019 | | | 2018 | | | 2017 | | | 2016 | | | | |
Portfolio turnover rate (excluding MDRs)(i) | | | 267 | % | | | 220 | % | | | 251 | % | | | 488 | % | | | | | | | 437 | % |
| | | | | | | | | | | | | | | | | | | | | | | | |
Financial Highlights (continued)
(For a share outstanding throughout each period)
| | | | | | | | | | | | | | | | | | | | | | | | |
| | | BlackRock Systematic Multi-Strategy Fund (continued) | |
| |
| | | Investor A | |
| | | Year Ended December 31, | | | | | | Period from
05/19/15 (a) to 12/31/15 | |
| | | 2019 | | | 2018 | | | 2017 | | | 2016 | | | | |
| | | | | | | |
Net asset value, beginning of period | | $ | 9.46 | | | $ | 10.15 | | | $ | 9.60 | | | $ | 9.53 | | | | | | | $ | 10.00 | |
| | | | | | | | | | | | | | | | | | | | | | | | |
Net investment income(b) | | | 0.20 | | | | 0.22 | | | | 0.19 | | | | 0.14 | | | | | | | | 0.11 | |
Net realized and unrealized gain (loss) | | | 0.58 | | | | (0.09 | ) | | | 0.74 | | | | 0.39 | | | | | | | | (0.48 | ) |
| | | | | | | | | | | | | | | | | | | | | | | | |
Net increase (decrease) from investment operations | | | 0.78 | | | | 0.13 | | | | 0.93 | | | | 0.53 | | | | | | | | (0.37 | ) |
| | | | | | | | | | | | | | | | | | | | | | | | |
| | | | | | |
Distributions from(c) | | | | | | | | | | | | | | | | | | | | | | | | |
From net investment income | | | (0.17 | ) | | | (0.26 | ) | | | (0.19 | ) | | | (0.14 | ) | | | | | | | (0.10 | ) |
From net realized gain | | | (0.20 | ) | | | (0.56 | ) | | | (0.19 | ) | | | (0.32 | ) | | | | | | | — | |
| | | | | | | | | | | | | | | | | | | | | | | | |
Total distributions | | | (0.37 | ) | | | (0.82 | ) | | | (0.38 | ) | | | (0.46 | ) | | | | | | | (0.10 | ) |
| | | | | | | | | | | | | | | | | | | | | | | | |
| | | | | | |
Net asset value, end of period | | $ | 9.87 | | | $ | 9.46 | | | $ | 10.15 | | | $ | 9.60 | | | | | | | $ | 9.53 | |
| | | | | | | | | | | | | | | | | | | | | | | | |
| | | | | | |
Total Return(d) | | | | | | | | | | | | | | | | | | | | | | | | |
Based on net asset value | | | 8.25 | % | | | 1.41 | % | | | 9.83 | % | | | 5.61 | % | | | | | | | (3.66 | )%(e) |
| | | | | | | | | | | | | | | | | | | | | | | | |
| | | | | | |
Ratios to Average Net Assets(f) | | | | | | | | | | | | | | | | | | | | | | | | |
Total expenses | | | 1.60 | % | | | 2.73 | % | | | 2.63 | % | | | 2.75 | % | | | | | | | 2.42 | %(g)(h) |
| | | | | | | | | | | | | | | | | | | | | | | | |
Total expenses after fees waived and/or reimbursed | | | 1.20 | % | | | 1.20 | % | | | 1.20 | % | | | 1.42 | % | | | | | | | 1.45 | %(g) |
| | | | | | | | | | | | | | | | | | | | | | | | |
Total expenses after fees waived and/or reimbursed and excluding excise tax | | | 1.20 | % | | | 1.20 | % | | | 1.20 | % | | | 1.42 | % | | | | | | | 1.45 | %(g) |
| | | | | | | | | | | | | | | | | | | | | | | | |
Net investment income | | | 1.95 | % | | | 2.21 | % | | | 1.94 | % | | | 1.46 | % | | | | | | | 1.76 | %(g) |
| | | | | | | | | | | | | | | | | | | | | | | | |
| | | | | | |
Supplemental Data | | | | | | | | | | | | | | | | | | | | | | | | |
Net assets, end of period (000) | | $ | 74,536 | | | $ | 2,725 | | | $ | 1,469 | | | $ | 2,439 | | | | | | | $ | 311 | |
| | | | | | | | | | | | | | | | | | | | | | | | |
Portfolio turnover rate(i)(j) | | | 442 | % | | | 426 | % | | | 424 | % | | | 722 | % | | | | | | | 440 | % |
| | | | | | | | | | | | | | | | | | | | | | | | |
| (a) | Commencement of operations. |
| (b) | Based on average shares outstanding. |
| (c) | Distributions for annual periods determined in accordance with U.S. federal income tax regulations. |
| (d) | Where applicable, excludes the effects of any sales charges and assumes the reinvestment of distributions. |
| (e) | Aggregate total return. |
| (f) | Excludes expenses incurred indirectly as a result of investments in underlying funds as follows: |
| | | | | | | | | | | | | | | | | | | | | | | | |
| | | Year Ended December 31, | | | | | | Period from
05/19/15 (a) to 12/31/15 | |
| | | 2019 | | | 2018 | | | 2017 | | | 2016 | | | | |
Investments in underlying funds | | | 0.02 | % | | | 0.01 | % | | | 0.00 | % | | | 0.02 | % | | | | | | | 0.03 | % |
| | | | | | | | | | | | | | | | | | | | | | | | |
| (h) | Audit, offering and organization costs were not annualized in the calculation of expense ratios. If these expenses were annualized, the total expenses would have been 2.81%. |
| (i) | Excludes investments underlying the total return swaps. |
| (j) | Includes mortgage dollar rolls (“MDRs”). Additional information regarding portfolio turnover rate is as follows: |
| | | | | | | | | | | | | | | | | | | | | | | | |
| | | Year Ended December 31, | | | | | | Period from
05/19/15 (a) to 12/31/15 | |
| | | 2019 | | | 2018 | | | 2017 | | | 2016 | | | | |
Portfolio turnover rate (excluding MDRs)(i) | | | 267 | % | | | 220 | % | | | 251 | % | | | 488 | % | | | | | | | 437 | % |
| | | | | | | | | | | | | | | | | | | | | | | | |
| | |
| 40 | | 2019 BLACKROCK ANNUAL REPORTTO SHAREHOLDERS |
Financial Highlights (continued)
(For a share outstanding throughout each period)
| | | | | | | | | | | | | | | | | | | | | | | | |
| | | BlackRock Systematic Multi-Strategy Fund (continued) | |
| |
| | | Investor C | |
| | | Year Ended December 31, | | | | | | Period from
05/19/15 (a) to 12/31/15 | |
| | | 2019 | | | 2018 | | | 2017 | | | 2016 | | | | |
| | | | | | | |
Net asset value, beginning of period | | $ | 9.47 | | | $ | 10.16 | | | $ | 9.58 | | | $ | 9.51 | | | | | | | $ | 10.00 | |
| | | | | | | | | | | | | | | | | | | | | | | | |
Net investment income(b) | | | 0.08 | | | | 0.20 | | | | 0.12 | | | | 0.06 | | | | | | | | 0.05 | |
Net realized and unrealized gain (loss) | | | 0.62 | | | | (0.14 | ) | | | 0.73 | | | | 0.40 | | | | | | | | (0.47 | ) |
| | | | | | | | | | | | | | | | | | | | | | | | |
Net increase (decrease) from investment operations | | | 0.70 | | | | 0.06 | | | | 0.85 | | | | 0.46 | | | | | | | | (0.42 | ) |
| | | | | | | | | | | | | | | | | | | | | | | | |
| | | | | | |
Distributions from(c) | | | | | | | | | | | | | | | | | | | | | | | | |
From net investment income | | | (0.10 | ) | | | (0.19 | ) | | | (0.08 | ) | | | (0.07 | ) | | | | | | | (0.07 | ) |
From net realized gain | | | (0.20 | ) | | | (0.56 | ) | | | (0.19 | ) | | | (0.32 | ) | | | | | | | — | |
| | | | | | | | | | | | | | | | | | | | | | | | |
Total distributions | | | (0.30 | ) | | | (0.75 | ) | | | (0.27 | ) | | | (0.39 | ) | | | | | | | (0.07 | ) |
| | | | | | | | | | | | | | | | | | | | | | | | |
| | | | | | |
Net asset value, end of period | | $ | 9.87 | | | $ | 9.47 | | | $ | 10.16 | | | $ | 9.58 | | | | | | | $ | 9.51 | |
| | | | | | | | | | | | | | | | | | | | | | | | |
| | | | | | |
Total Return(d) | | | | | | | | | | | | | | | | | | | | | | | | |
Based on net asset value | | | 7.43 | % | | | 0.65 | % | | | 8.97 | % | | | 4.82 | % | | | | | | | (4.19 | )%(e) |
| | | | | | | | | | | | | | | | | | | | | | | | |
| | | | | | |
Ratios to Average Net Assets(f) | | | | | | | | | | | | | | | | | | | | | | | | |
Total expenses | | | 2.51 | % | | | 3.48 | % | | | 3.30 | % | | | 3.43 | % | | | | | | | 3.31 | %(g)(h) |
| | | | | | | | | | | | | | | | | | | | | | | | |
Total expenses after fees waived and/or reimbursed | | | 1.95 | % | | | 1.95 | % | | | 1.95 | % | | | 2.19 | % | | | | | | | 2.20 | %(g) |
| | | | | | | | | | | | | | | | | | | | | | | | |
Total expenses after fees waived and/or reimbursed and excluding excise tax | | | 1.95 | % | | | 1.95 | % | | | 1.95 | % | | | 2.18 | % | | | | | | | 2.20 | %(g) |
| | | | | | | | | | | | | | | | | | | | | | | | |
Net investment income | | | 0.76 | % | | | 2.01 | % | | | 1.18 | % | | | 0.64 | % | | | | | | | 0.89 | %(g) |
| | | | | | | | | | | | | | | | | | | | | | | | |
| | | | | | |
Supplemental Data | | | | | | | | | | | | | | | | | | | | | | | | |
Net assets, end of period (000) | | $ | 305 | | | $ | 75 | | | $ | 67 | | | $ | 193 | | | | | | | $ | 71 | |
| | | | | | | | | | | | | | | | | | | | | | | | |
Portfolio turnover rate(i)(j) | | | 442 | % | | | 426 | % | | | 424 | % | | | 722 | % | | | | | | | 440 | % |
| | | | | | | | | | | | | | | | | | | | | | | | |
| (a) | Commencement of operations. |
| (b) | Based on average shares outstanding. |
| (c) | Distributions for annual periods determined in accordance with U.S. federal income tax regulations. |
| (d) | Where applicable, excludes the effects of any sales charges and assumes the reinvestment of distributions. |
| (e) | Aggregate total return. |
| (f) | Excludes expenses incurred indirectly as a result of investments in underlying funds as follows: |
| | | | | | | | | | | | | | | | | | | | | | | | |
| | | Year Ended December 31, | | | | | | Period from
05/19/15 (a) to 12/31/15 | |
| | | 2019 | | | 2018 | | | 2017 | | | 2016 | | | | |
Investments in underlying funds | | | 0.02 | % | | | 0.01 | % | | | 0.00 | % | | | 0.02 | % | | | | | | | 0.03 | % |
| | | | | | | | | | | | | | | | | | | | | | | | |
| (h) | Audit, offering and organization costs were not annualized in the calculation of expense ratios. If these expenses were annualized, the total expenses would have been 3.70%. |
| (i) | Excludes investments underlying the total return swaps. |
| (j) | Includes mortgage dollar rolls (“MDRs”). Additional information regarding portfolio turnover rate is as follows: |
| | | | | | | | | | | | | | | | | | | | | | | | |
| | | Year Ended December 31, | | | | | | Period from
05/19/15 (a) to 12/31/15 | |
| | | 2019 | | | 2018 | | | 2017 | | | 2016 | | | | |
Portfolio turnover rate (excluding MDRs)(i) | | | 267 | % | | | 220 | % | | | 251 | % | | | 488 | % | | | | | | | 437 | % |
| | | | | | | | | | | | | | | | | | | | | | | | |
Notes to Financial Statements
BlackRock Funds IV (the “Trust”) is registered under the Investment Company Act of 1940, as amended (the “1940 Act”), as anopen-end management investment company. The Trust is organized as a Massachusetts business trust. BlackRock Systematic Multi-Strategy Fund (the “Fund”) (formerly known as BlackRock Alternative Capital Strategies Fund) is a series of the Trust. The Fund is classified as diversified.
The Fund offers multiple classes of shares. All classes of shares have identical voting, dividend, liquidation and other rights and are subject to the same terms and conditions, except that certain classes bear expenses related to the shareholder servicing and distribution of such shares. Institutional Shares are sold without a sales charge and only to certain eligible investors. Investor A and Investor C Shares bear certain expenses related to shareholder servicing of such shares, and Investor C Shares also bear certain expenses related to the distribution of such shares. Investor A and Investor C Shares are generally available through financial intermediaries. Investor C shares automatically convert to Investor A Shares after approximately ten years. Each class has exclusive voting rights with respect to matters relating to its shareholder servicing and distribution expenditures (except that Investor C shareholders may vote on material changes to the Investor A Shares distribution and service plan).
| | | | | | | | | | |
| Share Class | | Initial Sales Charge | | | CDSC | | | Conversion Privilege |
Institutional Shares | | | No | | | | No | | | None |
Investor A Shares | | | Yes | (a) | | | No | (a) | | None |
Investor C Shares | | | No | | | | Yes | (b) | | To Investor A Shares after approximately 10 years |
| | (a) | Investor A Shares may be subject to a contingent deferred sales charge (“CDSC”) for certain redemptions where no initial sales charge was paid at the time of purchase. | |
| | (b) | A CDSC of 1.00% is assessed on certain redemptions of Investor C Shares made within one year after purchase. | |
The Fund, together with certain other registered investment companies advised by BlackRock Advisors, LLC (the “Manager”) or its affiliates, is included in a complex ofnon-index fixed-income mutual funds and all BlackRock-advisedclosed-end funds referred to as the BlackRock Fixed-Income Complex.
| 2. | SIGNIFICANT ACCOUNTING POLICIES |
The financial statements are prepared in conformity with accounting principles generally accepted in the United States of America (“U.S. GAAP”), which may require management to make estimates and assumptions that affect the reported amounts of assets and liabilities in the financial statements, disclosure of contingent assets and liabilities at the date of the financial statements and the reported amounts of increases and decreases in net assets from operations during the reporting period. Actual results could differ from those estimates. The Fund is considered an investment company under U.S. GAAP and follows the accounting and reporting guidance applicable to investment companies. Below is a summary of significant accounting policies:
Investment Transactions and Income Recognition:For financial reporting purposes, investment transactions are recorded on the dates the transactions are executed (the “trade dates”). Realized gains and losses on investment transactions are determined on the identified cost basis. Dividend income is recorded on theex-dividend date. Upon notification from issuers, a portion of the dividend income received from a real estate investment trust may be redesignated as a reduction of cost of the related investment and/or realized gain. Interest income, including amortization and accretion of premiums and discounts on debt securities, is recognized on an accrual basis. Income, expenses and realized and unrealized gains and losses are allocated daily to each class based on its relative net assets.
Foreign Currency Translation:The Fund’s books and records are maintained in U.S. dollars. Securities and other assets and liabilities denominated in foreign currencies are translated into U.S. dollars using exchange rates determined as of the close of trading on the New York Stock Exchange (“NYSE”). Purchases and sales of investments are recorded at the rates of exchange prevailing on the respective dates of such transactions. Generally, when the U.S. dollar rises in value against a foreign currency, the investments denominated in that currency will lose value; the opposite effect occurs if the U.S. dollar falls in relative value.
The Fund does not isolate the portion of the results of operations arising as a result of changes in the exchange rates from the changes in the market prices of investments held or sold for financial reporting purposes. Accordingly, the effects of changes in exchange rates on investments are not segregated in the Statement of Operations from the effects of changes in market prices of those investments, but are included as a component of net realized and unrealized gain (loss) from investments. The Fund reports realized currency gains (losses) on foreign currency related transactions as components of net realized gain (loss) for financial reporting purposes, whereas such components are generally treated as ordinary income for U.S. federal income tax purposes.
Segregation and Collateralization:In cases where the Fund enters into certain investments (e.g., dollar rolls,to-be-announced (“TBA”) sale commitments, futures contracts, forward foreign currency exchange contracts, and swaps) that would be treated as “senior securities” for 1940 Act purposes, the Fund may segregate or designate on itsbooks and records cash or liquid assets having a market value at least equal to the amount of its future obligations under such investments. Doing so allows the investment to be excluded from treatment as a “senior security.” Furthermore, if required by an exchange or counterparty agreement, the Fund may be required to deliver/deposit cash and/or securities to/with an exchange, or broker-dealer or custodian as collateral for certain investments or obligations.
Distributions: Distributions from net investment income are declared and paid quarterly. Distributions of capital gains are recorded on theex-dividend date and made at least annually. The character and timing of distributions are determined in accordance with U.S. federal income tax regulations, which may differ from U.S. GAAP.
Recent Accounting Standards: The Fund has adopted Financial Accounting Standards Board Accounting Standards Update2017-08 to amend the amortization period for certain purchased callable debt securities held at a premium. Under the new standard, the Fund has changed the amortization period for the premium on certain purchased callable debt securities withnon-contingent call features to the earliest call date. In accordance with the transition provisions of the standard, the Fund applied the amendments on a modified retrospective basis beginning with the fiscal period ended December 31, 2019. The adjusted cost basis of securities at December 31, 2019 is $43,951,758. This change in accounting policy has been made to comply with the newly issued accounting standard and had no impact on accumulated earnings (loss) or the net asset value of the Fund.
| | |
| 42 | | 2019 BLACKROCK ANNUAL REPORTTO SHAREHOLDERS |
Notes to Financial Statements (continued)
Indemnifications:In the normal course of business, the Fund enters into contracts that contain a variety of representations that provide general indemnification. The Fund’s maximum exposure under these arrangements is unknown because it involves future potential claims against the Fund, which cannot be predicted with any certainty.
Other: Expenses directly related to the Fund or its classes are charged to the Fund or the applicable class. Other operating expenses shared by several funds, including other funds managed by the Manager, are prorated among those funds on the basis of relative net assets or other appropriate methods. Expenses directly related to the Fund and other shared expenses prorated to the Fund are allocated daily to each class based on its relative net assets or other appropriate methods.
| 3. | INVESTMENT VALUATION AND FAIR VALUE MEASUREMENTS |
Investment Valuation Policies: The Fund’s investments are valued at fair value (also referred to as “market value” within the financial statements) as of the close of trading on the NYSE (generally 4:00 p.m., Eastern time). U.S. GAAP defines fair value as the price the Fund would receive to sell an asset or pay to transfer a liability in an orderly transaction between market participants at the measurement date. The Fund determines the fair values of its financial instruments using various independent dealers or pricing services under policies approved by the Board of Trustees of the Fund (the “Board”). The BlackRock Global Valuation Methodologies Committee (the “Global Valuation Committee”) is the committee formed by management to develop global pricing policies and procedures and to oversee the pricing function for all financial instruments.
Fair Value Inputs and Methodologies: The following methods and inputs are used to establish the fair value of the Fund’s assets and liabilities:
| | • | | Equity investments traded on a recognized securities exchange are valued at the official closing price each day, if available. For equity investments traded on more than one exchange, the official closing price on the exchange where the stock is primarily traded is used. Equity investments traded on a recognized exchange for which there were no sales on that day may be valued at the last available bid (long positions) or ask (short positions) price. |
| | • | | Fixed-income securities for which market quotations are readily available are generally valued using the last available bid prices or current market quotations provided by independent dealers or third party pricing services. Floating rate loan interests are valued at the mean of the bid prices from one or more independent brokers or dealers as obtained from a third party pricing service. Pricing services generally value fixed-income securities assuming orderly transactions of an institutional round lot size, but a fund may hold or transact in such securities in smaller, odd lot sizes. Odd lots may trade at lower prices than institutional round lots. The pricing services may use matrix pricing or valuation models that utilize certain inputs and assumptions to derive values, including transaction data (e.g., recent representative bids and offers), credit quality information, perceived market movements, news, and other relevant information. Certain fixed-income securities, including asset-backed and mortgage related securities may be valued based on valuation models that consider the estimated cash flows of each tranche of the entity, establish a benchmark yield and develop an estimated tranche specific spread to the benchmark yield based on the unique attributes of the tranche. The amortized cost method of valuation may be used with respect to debt obligations with sixty days or less remaining to maturity unless the Manager determines such method does not represent fair value. |
Generally, trading in foreign instruments is substantially completed each day at various times prior to the close of trading on the NYSE. Occasionally, events affecting the values of such instruments may occur between the foreign market close and the close of trading on the NYSE that may not be reflected in the computation of the Fund’s net assets. Each business day, the Fund uses a pricing service to assist with the valuation of certain foreign exchange-traded equity securities and foreign exchange-traded andover-the-counter (“OTC”) options (the “Systematic Fair Value Price”). Using current market factors, the Systematic Fair Value Price is designed to value such foreign securities and foreign options at fair value as of the close of trading on the NYSE, which follows the close of the local markets.
| | • | | Investments inopen-end U.S. mutual funds are valued at net asset value (“NAV”) each business day. |
| | • | | Futures contracts traded on exchanges are valued at their last sale price. |
| | • | | Forward foreign currency exchange contracts are valued at the mean between the bid and ask prices and are determined as of the close of trading on the NYSE based on that day’s prevailing forward exchange rate for the underlying currencies. Interpolated values are derived when the settlement date of the contract is an interim date for which quotations are not available. |
| | • | | Swap agreements are valued utilizing quotes received daily by the Fund’s pricing service or through brokers, which are derived using daily swap curves and models that incorporate a number of market data factors, such as discounted cash flows, trades and values of the underlying reference instruments. |
| | • | | TBA commitments are valued on the basis of last available bid prices or current market quotations provided by pricing services. |
If events (e.g., a company announcement, market volatility or a natural disaster) occur that are expected to materially affect the value of such investments, or in the event that the application of these methods of valuation results in a price for an investment that is deemed not to be representative of the market value of such investment, or if a price is not available, the investment will be valued by the Global Valuation Committee, or its delegate, in accordance with a policy approved by the Board as reflecting fair value (“Fair Valued Investments”). The fair valuation approaches that may be used by the Global Valuation Committee will include market approach, income approach and cost approach. Valuation techniques such as discounted cash flow, use of market comparables and matrix pricing are types of valuation approaches and are typically used in determining fair value. When determining the price for Fair Valued Investments, the Global Valuation Committee, or its delegate, seeks to determine the price that the Fund might reasonably expect to receive or pay from the current sale or purchase of that asset or liability in anarm’s-length transaction. Fair value determinations shall be based upon all available factors that the Global Valuation Committee, or its delegate, deems relevant and consistent with the principles of fair value measurement. The pricing of all Fair Valued Investments is subsequently reported to the Board or a committee thereof on a quarterly basis.
| | | | |
| NOTESTO FINANCIAL STATEMENTS | | | 43 | |
Notes to Financial Statements (continued)
For investments in equity or debt issued by privately held companies or funds (“Private Company” or collectively, the “Private Companies”) and other Fair Valued Investments, the fair valuation approaches that are used by the Global Valuation Committee and third party pricing services utilize one or a combination of, but not limited to, the following inputs.
| | |
| | | Standard Inputs Generally Considered By Third Party Pricing Services |
Market approach | | (i) recent market transactions, including subsequent rounds of financing, in the underlying investment or comparable issuers; (ii) recapitalizations and other transactions across the capital structure; and (iii) market multiples of comparable issuers. |
Income approach | | (i) future cash flows discounted to present and adjusted as appropriate for liquidity, credit, and/or market risks; (ii) quoted prices for similar investments or assets in active markets; and (iii) other risk factors, such as interest rates, yield curves, volatilities, prepayment speeds, loss severities, credit risks, recovery rates, liquidation amounts and/or default rates. |
Cost approach | | (i) audited or unaudited financial statements, investor communications and financial or operational metrics issued by the Private Company; (ii) changes in the valuation of relevant indices or publicly traded companies comparable to the Private Company; (iii) relevant news and other public sources; and (iv) known secondary market transactions in the Private Company’s interests and merger or acquisition activity in companies comparable to the Private Company. |
Investments in series of preferred stock issued by Private Companies are typically valued utilizing market approach in determining the enterprise value of the company. Such investments often contain rights and preferences that differ from other series of preferred and common stock of the same issuer. Valuation techniques such as an option pricing model (“OPM”), a probability weighted expected return model (“PWERM”) or a hybrid of those techniques are used in allocating enterprise value of the company, as deemed appropriate under the circumstances. The use of OPM and PWERM techniques involve a determination of the exit scenarios of the investment in order to appropriately allocate the enterprise value of the company among the various parts of its capital structure.
The Private Companies are not subject to the public company disclosure, timing, and reporting standards as other investments held by the Fund. Typically, the most recently available information by a Private Company is as of a date that is earlier than the date the Fund is calculating its NAV. This factor may result in a difference between the value of the investment and the price the Fund could receive upon the sale of the investment.
Fair Value Hierarchy: Various inputs are used in determining the fair value of investments and derivative financial instruments. These inputs to valuation techniques are categorized into a fair value hierarchy consisting of three broad levels for financial statement purposes as follows:
| | • | | Level 1 — Unadjusted price quotations in active markets/exchanges for identical assets or liabilities that the Fund has the ability to access |
| | • | | Level 2 — Other observable inputs (including, but not limited to, quoted prices for similar assets or liabilities in markets that are active, quoted prices for identical or similar assets or liabilities in markets that are not active, inputs other than quoted prices that are observable for the assets or liabilities (such as interest rates, yield curves, volatilities, prepayment speeds, loss severities, credit risks and default rates) or other market–corroborated inputs) |
| | • | | Level 3 — Unobservable inputs based on the best information available in the circumstances, to the extent observable inputs are not available (including the Global Valuation Committee’s assumptions used in determining the fair value of investments and derivative financial instruments) |
The hierarchy gives the highest priority to unadjusted quoted prices in active markets for identical assets or liabilities (Level 1 measurements) and the lowest priority to unobservable inputs (Level 3 measurements). Accordingly, the degree of judgment exercised in determining fair value is greatest for instruments categorized in Level 3. The inputs used to measure fair value may fall into different levels of the fair value hierarchy. In such cases, for disclosure purposes, the fair value hierarchy classification is determined based on the lowest level input that is significant to the fair value measurement in its entirety. Investments classified within Level 3 have significant unobservable inputs used by the Global Valuation Committee in determining the price for Fair Valued Investments. Level 3 investments include equity or debt issued by Private Companies. There may not be a secondary market, and/or there are a limited number of investors. The categorization of a value determined for investments and derivative financial instruments is based on the pricing transparency of the investments and derivative financial instruments and is not necessarily an indication of the risks associated with investing in those securities.
| 4. | SECURITIES AND OTHER INVESTMENTS |
Asset-Backed and Mortgage-Backed Securities:Asset-backed securities are generally issued as pass-through certificates or as debt instruments. Asset-backed securities issued as pass-through certificates represent undivided fractional ownership interests in an underlying pool of assets. Asset-backed securities issued as debt instruments, which are also known as collateralized obligations, are typically issued as the debt of a special purpose entity organized solely for the purpose of owning such assets and issuing such debt. Asset-backed securities are often backed by a pool of assets representing the obligations of a number of different parties. The yield characteristics of certain asset-backed securities may differ from traditional debt securities. One such major difference is that all or a principal part of the obligations may be prepaid at any time because the underlying assets (i.e., loans) may be prepaid at any time. As a result, a decrease in interest rates in the market may result in increases in the level of prepayments as borrowers, particularly mortgagors, refinance and repay their loans. An increased prepayment rate with respect to an asset-backed security will have the effect of shortening the maturity of the security. In addition, a fund may subsequently have to reinvest the proceeds at lower interest rates. If a fund has purchased such an asset-backed security at a premium, a faster than anticipated prepayment rate could result in a loss of principal to the extent of the premium paid.
For mortgage pass-through securities (the “Mortgage Assets”) there are a number of important differences among the agencies and instrumentalities of the U.S. Government that issue mortgage-related securities and among the securities that they issue. For example, mortgage-related securities guaranteed by Ginnie Mae are
| | |
| 44 | | 2019 BLACKROCK ANNUAL REPORTTO SHAREHOLDERS |
Notes to Financial Statements (continued)
guaranteed as to the timely payment of principal and interest by Ginnie Mae and such guarantee is backed by the full faith and credit of the United States. However, mortgage-related securities issued by Freddie Mac and Fannie Mae, including Freddie Mac and Fannie Mae guaranteed mortgage pass-through certificates, which are solely the obligations of Freddie Mac and Fannie Mae, are not backed by or entitled to the full faith and credit of the United States, but are supported by the right of the issuer to borrow from the U.S. Treasury.
Non-agency mortgage-backed securities are securities issued bynon-governmental issuers and have no direct or indirect government guarantees of payment and are subject to various risks.Non-agency mortgage loans are obligations of the borrowers thereunder only and are not typically insured or guaranteed by any other person or entity. The ability of a borrower to repay a loan is dependent upon the income or assets of the borrower. A number of factors, including a general economic downturn, acts of God, terrorism, social unrest and civil disturbances, may impair a borrower’s ability to repay its loans.
Multiple Class Pass-Through Securities: Multiple class pass-through securities, including collateralized mortgage obligations (“CMOs”) and commercial mortgage-backed securities, may be issued by Ginnie Mae, U.S. Government agencies or instrumentalities or by trusts formed by private originators of, or investors in, mortgage loans. In general, CMOs are debt obligations of a legal entity that are collateralized by a pool of residential or commercial mortgage loans or Mortgage Assets. The payments on these are used to make payments on the CMOs or multiple pass-through securities. Multiple class pass-through securities represent direct ownership interests in the Mortgage Assets. Classes of CMOs include interest only (“IOs”), principal only (“POs”), planned amortization classes and targeted amortization classes. IOs and POs are stripped mortgage-backed securities representing interests in a pool of mortgages, the cash flow from which has been separated into interest and principal components. IOs receive the interest portion of the cash flow while POs receive the principal portion. IOs and POs can be extremely volatile in response to changes in interest rates. As interest rates rise and fall, the value of IOs tends to move in the same direction as interest rates. POs perform best when prepayments on the underlying mortgages rise since this increases the rate at which the principal is returned and the yield to maturity on the PO. When payments on mortgages underlying a PO are slower than anticipated, the life of the PO is lengthened and the yield to maturity is reduced. If the underlying Mortgage Assets experience greater than anticipated prepayments of principal, a fund’s initial investment in the IOs may not fully recoup.
TBA Commitments:TBA commitments are forward agreements for the purchase or sale of mortgage-backed securities for a fixed price, with payment and delivery on an agreed upon future settlement date. The specific securities to be delivered are not identified at the trade date. However, delivered securities must meet specified terms, including issuer, rate and mortgage terms. When entering into TBA commitments, a fund may take possession of or deliver the underlying mortgage-backed securities but can extend the settlement or roll the transaction. TBA commitments involve a risk of loss if the value of the security to be purchased or sold declines or increases, respectively, prior to settlement date.
In order to better define contractual rights and to secure rights that will help a fund mitigate their counterparty risk, TBA commitments may be entered into by a fund under Master Securities Forward Transaction Agreements (each, an “MSFTA”). An MSFTA typically contains, among other things, collateral posting terms and netting provisions in the event of default and/or termination event. The collateral requirements are typically calculated by netting themark-to-market amount for each transaction under such agreement and comparing that amount to the value of the collateral currently pledged by a fund and the counterparty. Cash collateral that has been pledged to cover the obligations of a fund and cash collateral received from the counterparty, if any, is reported separately on the Statement of Assets and Liabilities as cash pledged as collateral for TBA commitments or cash received as collateral for TBA commitments, respectively.Non-cash collateral pledged by a fund, if any, is noted in the Schedule of Investments. Typically, a fund is permitted to sell,re-pledge or use the collateral it receives; however, the counterparty is not permitted to do so. To the extent amounts due to a fund are not fully collateralized, contractually or otherwise, a fund bears the risk of loss from counterpartynon-performance.
Mortgage Dollar Roll Transactions: The fund may sell TBA mortgage-backed securities and simultaneously contract to repurchase substantially similar (i.e., same type, coupon and maturity) securities on a specific future date at an agreed upon price. During the period between the sale and repurchase, a fund is not entitled to receive interest and principal payments on the securities sold. Mortgage dollar roll transactions are treated as purchases and sales and realizes gains and losses on these transactions. Mortgage dollar rolls involve the risk that the market value of the securities that a fund is required to purchase may decline below the agreed upon repurchase price of those securities.
| 5. | DERIVATIVE FINANCIAL INSTRUMENTS |
The Fund engages in various portfolio investment strategies using derivative contracts both to increase the returns of the Fund and/or to manage its exposure to certain risks such as credit risk, equity risk, interest rate risk, foreign currency exchange rate risk, commodity price risk or other risks (e.g., inflation risk). Derivative financial instruments categorized by risk exposure are included in the Schedule of Investments. These contracts may be transacted on an exchange or OTC.
Futures Contracts:Futures contracts are purchased or sold to gain exposure to, or manage exposure to, changes in interest rates (interest rate risk) and changes in the value of equity securities (equity risk) or foreign currencies (foreign currency exchange rate risk).
Futures contracts are agreements between the Fund and a counterparty to buy or sell a specific quantity of an underlying instrument at a specified price and on a specified date. Depending on the terms of a contract, it is settled either through physical delivery of the underlying instrument on the settlement date or by payment of a cash amount on the settlement date. Upon entering into a futures contract, the Fund is required to deposit initial margin with the broker in the form of cash or securities in an amount that varies depending on a contract’s size and risk profile. The initial margin deposit must then be maintained at an established level over the life of the contract. Amounts pledged, which are considered restricted, are included in cash pledged for futures contracts in the Statement of Assets and Liabilities.
Securities deposited as initial margin are designated in the Schedule of Investments and cash deposited, if any, is shown as cash pledged for futures contracts in the Statement of Assets and Liabilities. Pursuant to the contract, the Fund agrees to receive from or pay to the broker an amount of cash equal to the daily fluctuation in market value of the contract (“variation margin”). Variation margin is recorded as unrealized appreciation (depreciation) and, if any, shown as variation margin receivable (or payable) on futures contracts in the Statement of Assets and Liabilities. When the contract is closed, a realized gain or loss is recorded in the Statement of Operations equal to the difference between the notional amount of the contract at the time it was opened and the notional amount at the time it was closed. The use of futures contracts involves the risk of an imperfect correlation in the movements in the price of futures contracts and interest, foreign currency exchange rates or underlying assets.
| | | | |
| NOTESTO FINANCIAL STATEMENTS | | | 45 | |
Notes to Financial Statements (continued)
Forward Foreign Currency Exchange Contracts: Forward foreign currency exchange contracts are entered into to gain or reduce exposure to foreign currencies (foreign currency exchange rate risk).
A forward foreign currency exchange contract is an agreement between two parties to buy and sell a currency at a set exchange rate on a specified date. These contracts help to manage the overall exposure to the currencies in which some of the investments held by the Fund are denominated and in some cases, may be used to obtain exposure to a particular market.
The contract ismarked-to-market daily and the change in market value is recorded as unrealized appreciation (depreciation) in the Statement of Assets and Liabilities. When a contract is closed, a realized gain or loss is recorded in the Statement of Operations equal to the difference between the value at the time it was opened and the value at the time it was closed.Non-deliverable forward foreign currency exchange contracts are settled with the counterparty in cash without the delivery of foreign currency. The use of forward foreign currency exchange contracts involves the risk that the value of a forward foreign currency exchange contract changes unfavorably due to movements in the value of the referenced foreign currencies, and such value may exceed the amount reflected in the Statement of Assets and Liabilities. Cash amounts pledged for forward foreign currency exchange contracts are considered restricted and are included in cash pledged as collateral for OTC derivatives in the Statement of Assets and Liabilities.
Swaps:Swap contracts are entered into to manage exposure to issuers, markets and securities. Such contracts are agreements between the Fund and a counterparty to make periodic net payments on a specified notional amount or a net payment upon termination. Swap agreements are privately negotiated in the OTC market and may be entered into as a bilateral contract (“OTC swaps”) or centrally cleared (“centrally cleared swaps”).
For OTC swaps, any upfront premiums paid and any upfront fees received are shown as swap premiums paid and swap premiums received, respectively, in the Statement of Assets and Liabilities and amortized over the term of the contract. The daily fluctuation in market value is recorded as unrealized appreciation (depreciation) on OTC Swaps in the Statement of Assets and Liabilities. Payments received or paid are recorded in the Statement of Operations as realized gains or losses, respectively. When an OTC swap is terminated, a realized gain or loss is recorded in the Statement of Operations equal to the difference between the proceeds from (or cost of) the closing transaction and the Fund’s basis in the contract, if any. Generally, the basis of the contract is the premium received or paid.
In a centrally cleared swap, immediately following execution of the swap contract, the swap contract is novated to a central counterparty (the “CCP”) and the Fund’s counterparty on the swap agreement becomes the CCP. The Fund is required to interface with the CCP through the broker. Upon entering into a centrally cleared swap, the Fund is required to deposit initial margin with the broker in the form of cash or securities in an amount that varies depending on the size and risk profile of the particular swap. Securities deposited as initial margin are designated in the Schedule of Investments and cash deposited is shown as cash pledged for centrally cleared swaps in the Statement of Assets and Liabilities. Amounts pledged, which are considered restricted cash, are included in cash pledged for centrally cleared swaps in the Statement of Assets and Liabilities. Pursuant to the contract, the Fund agrees to receive from or pay to the broker an amount of cash equal to the daily fluctuation in market value of the contract (“variation margin”). Variation margin is recorded as unrealized appreciation (depreciation) and shown as variation margin receivable (or payable) on centrally cleared swaps in the Statement of Assets and Liabilities. Payments received from (paid to) the counterparty, including at termination, are recorded as realized gains (losses) in the Statement of Operations.
| | • | | Credit default swaps — Credit default swaps are entered into to manage exposure to the market or certain sectors of the market, to reduce risk exposure to defaults of corporate and/or sovereign issuers or to create exposure to corporate and/or sovereign issuers to which a fund is not otherwise exposed (credit risk). |
The Fund may either buy or sell (write) credit default swaps on single-name issuers (corporate or sovereign), a combination or basket of single-name issuers or traded indexes. Credit default swaps are agreements in which the protection buyer pays fixed periodic payments to the seller in consideration for a promise from the protection seller to make a specific payment should a negative credit event take place with respect to the referenced entity (e.g., bankruptcy, failure to pay, obligation acceleration, repudiation, moratorium or restructuring). As a buyer, if an underlying credit event occurs, the Fund will either (i) receive from the seller an amount equal to the notional amount of the swap and deliver the referenced security or underlying securities comprising the index, or (ii) receive a net settlement of cash equal to the notional amount of the swap less the recovery value of the security or underlying securities comprising the index. As a seller (writer), if an underlying credit event occurs, the Fund will either pay the buyer an amount equal to the notional amount of the swap and take delivery of the referenced security or underlying securities comprising the index or pay a net settlement of cash equal to the notional amount of the swap less the recovery value of the security or underlying securities comprising the index.
| | • | | Total return swaps — Total return swaps are entered into to obtain exposure to a security or market without owning such security or investing directly in such market or to exchange the risk/return of one security or market (e.g., fixed-income) with another security or market (e.g., equity or commodity prices) (equity risk, commodity price risk and/or interest rate risk). |
Total return swaps are agreements in which there is an exchange of cash flows whereby one party commits to make payments based on the total return (distributions plus capital gains/losses) of an underlying instrument, or basket of underlying instruments, in exchange for fixed or floating rate interest payments. If the total return of the instrument or index underlying the transaction exceeds or falls short of the offsetting fixed or floating interest rate obligation, the Fund receives payment from or makes a payment to the counterparty.
Certain total return swaps are designed to function as a portfolio of direct investments in long and short equity positions. This means that the Fund has the ability to trade in and out of these long and short positions within the swap and will receive the economic benefits and risks equivalent to direct investment in these positions, subject to certain adjustments due to events related to the counterparty. Benefits and risks include capital appreciation (depreciation), corporate actions and dividends received and paid, all of which are reflected in the swap’s market value. The market value also includes interest charges and credits (“financing fees”) related to the notional values of the long and short positions and cash balances within the swap. These interest charges and credits are based on a specified benchmark rate plus or minus a specified spread determined based upon the country and/or currency of the positions in the portfolio.
| | |
| 46 | | 2019 BLACKROCK ANNUAL REPORTTO SHAREHOLDERS |
Notes to Financial Statements (continued)
Positions within the swap and financing fees are reset periodically. During a reset, any unrealized appreciation (depreciation) on positions and accrued financing fees become available for cash settlement between the Fund and the counterparty. The amounts that are available for cash settlement are recorded as realized gains or losses in the Statement of Operations. Cash settlement in and out of the swap may occur at a reset date or any other date, at the discretion of the Fund and the counterparty, over the life of the agreement. Certain swaps have no stated expiration and can be terminated by either party at any time.
| | • | | Interest rate swaps — Interest rate swaps are entered into to gain or reduce exposure to interest rates or to manage duration, the yield curve or interest rate (interest rate risk). |
Interest rate swaps are agreements in which one party pays a stream of interest payments, either fixed or floating, in exchange for another party’s stream of interest payments, either fixed or floating, on the same notional amount for a specified period of time. In more complex interest rate swaps, the notional principal amount may decline (or amortize) over time.
Swap transactions involve, to varying degrees, elements of interest rate, credit and market risk in excess of the amounts recognized in the Statement of Assets and Liabilities. Such risks involve the possibility that there will be no liquid market for these agreements, that the counterparty to the agreements may default on its obligation to perform or disagree as to the meaning of the contractual terms in the agreements, and that there may be unfavorable changes in interest rates and/or market values associated with these transactions.
Master Netting Arrangements: In order to define its contractual rights and to secure rights that will help it mitigate its counterparty risk, the Fund may enter into an International Swaps and Derivatives Association, Inc. Master Agreement (“ISDA Master Agreement”) or similar agreement with its counterparties. An ISDA Master Agreement is a bilateral agreement between the Fund and a counterparty that governs certain OTC derivatives and typically contains, among other things, collateral posting terms and netting provisions in the event of a default and/or termination event. Under an ISDA Master Agreement, the Fund may, under certain circumstances, offset with the counterparty certain derivative financial instruments’ payables and/or receivables with collateral held and/or posted and create one single net payment. The provisions of the ISDA Master Agreement typically permit a single net payment in the event of default including the bankruptcy or insolvency of the counterparty. Bankruptcy or insolvency laws of a particular jurisdiction may restrict or prohibit the right of offset in bankruptcy, insolvency or other events.
Collateral Requirements: For derivatives traded under an ISDA Master Agreement, the collateral requirements are typically calculated by netting themark-to-market amount for each transaction under such agreement and comparing that amount to the value of any collateral currently pledged by the Fund and the counterparty.
Cash collateral that has been pledged to cover obligations of the Fund and cash collateral received from the counterparty, if any, is reported separately on the Statement of Assets and Liabilities as cash pledged as collateral and cash received as collateral, respectively.Non-cash collateral pledged by the Fund, if any, is noted in the Schedule of Investments. Generally, the amount of collateral due from or to a counterparty is subject to a certain minimum transfer amount threshold before a transfer is required, which is determined at the close of business of the Fund. Any additional required collateral is delivered to/pledged by the Fund on the next business day. Typically, the counterparty is not permitted to sell,re-pledge or use cash andnon-cash collateral it receives. The Fund generally agrees not to usenon-cash collateral that it receives but may, absent default or certain other circumstances defined in the underlying ISDA Master Agreement, be permitted to use cash collateral received. In such cases, interest may be paid pursuant to the collateral arrangement with the counterparty. To the extent amounts due to the Fund from its counterparties are not fully collateralized, it bears the risk of loss from counterpartynon-performance. Likewise, to the extent the Fund has delivered collateral to a counterparty and stands ready to perform under the terms of its agreement with such counterparty, it bears the risk of loss from a counterparty in the amount of the value of the collateral in the event the counterparty fails to return such collateral. Based on the terms of agreements, collateral may not be required for all derivative contracts.
For financial reporting purposes, the Fund does not offset derivative assets and derivative liabilities that are subject to netting arrangements, if any, in the Statement of Assets and Liabilities.
| 6. | INVESTMENT ADVISORY AGREEMENT AND OTHER TRANSACTIONS WITH AFFILIATES |
Investment Advisory:The Trust, on behalf of the Fund, entered into an Investment Advisory Agreement with the Manager, the Fund’s investment adviser and an indirect, wholly-owned subsidiary of BlackRock, Inc. (“BlackRock”), to provide investment advisory services. The Manager is responsible for the management of the Fund’s portfolio and provides the personnel, facilities, equipment and certain other services necessary to the operations of the Fund.
For such services, the fund pays the Manager a monthly fee at an annual rate equal to the following percentages of the average daily value of the Fund’s net assets as follows:
| | | | |
| Average Daily Net Assets | | Investment Advisory Fee | |
First $1 Billion | | | 0.80 | % |
$1 Billion — $3 Billion | | | 0.75 | |
$3 Billion — $5 Billion | | | 0.72 | |
$5 Billion — $10 Billion | | | 0.70 | |
Greater than $10 Billion | | | 0.68 | |
The Manager entered into asub-advisory agreement with BlackRock International Limited (“BIL”), an affiliate of the Manager. The Manager pays BIL for services it provides for that portion of the Fund for which BIL acts assub-adviser, a monthly fee that is equal to a percentage of the investment advisory fees paid by the Fund to the Manager.
| | | | |
| NOTESTO FINANCIAL STATEMENTS | | | 47 | |
Notes to Financial Statements (continued)
Service and Distribution Fees:The Trust, on behalf of the Fund, entered into a Distribution Agreement and a Distribution and Service Plan with BlackRock Investments, LLC (“BRIL”), an affiliate of the Manager. Pursuant to the Distribution and Service Plan and in accordance with Rule12b-1 under the 1940 Act, the Fund pays BRIL ongoing service and distribution fees. The fees are accrued daily and paid monthly at annual rates based upon the average daily net assets of the relevant share class of the Fund as follows:
| | | | | | | | |
| | | Service Fees | | | Distribution Fees | |
Investor A | | | 0.25 | % | | | — | % |
Investor C | | | 0.25 | | | | 0.75 | |
BRIL and broker-dealers, pursuant tosub-agreements with BRIL, provide shareholder servicing and distribution services to the Fund. The ongoing service and/or distribution fee compensates/reimburses BRIL and each broker-dealer for providing shareholder servicing and/or distribution related services to shareholders.
For the year ended December 31, 2019, the following table shows the class specific service and distribution fees borne directly by each share class of the Fund:
| | | | | | | | | | | | | | | | | | | | |
| Institutional | | | | | Investor A | | | | | Investor C | | | | | Total | |
| $ | — | | | | | $ | 86,508 | | | | | $ | 1,591 | | | | | $ | 88,099 | |
Administration: The Trust, on behalf of the Fund, entered into an Administration Agreement with the Manager, an indirect, wholly-owned subsidiary of BlackRock, to provide administrative services. For these services, the Manager receives an administration fee computed daily and payable monthly, based on a percentage of the average daily net assets of the Fund. The administration fee, which is shown as administration in the Statement of Operations, is paid at the annual rates below.
| | | | |
| Average Daily Net Assets | | Administration Fee | |
First $500 Million | | | 0.0425 | % |
$500 Million — $1 Billion | | | 0.0400 | |
$1 Billion — $2 Billion | | | 0.0375 | |
$2 Billion — $4 Billion | | | 0.0350 | |
$4 Billion — $13 Billion | | | 0.0325 | |
Greater than $13 Billion | | | 0.0300 | |
In addition, the Manager charges each of the share classes an administration fee, which is shown as administration — class specific in the Statement of Operations, at an annual rate of 0.02% of the average daily net assets of each respective class.
For the year ended December 31, 2019, the following table shows the class specific administration fees borne directly by each share class of the Fund:
| | | | | | | | | | | | | | | | | | | | |
| Institutional | | | | | Investor A | | | | | Investor C | | | | | Total | |
| $ | 21,083 | | | | | $ | 6,921 | | | | | $ | 32 | | | | | $ | 28,036 | |
Transfer Agent: Pursuant to written agreements, certain financial intermediaries, some of which may be affiliates, provide the Fund withsub-accounting, recordkeeping,sub-transfer agency and other administrative services with respect to servicing of underlying investor accounts. For these services, these entities receive an asset-based fee or an annual fee per shareholder account, which will vary depending on share class and/or net assets. For the year ended December 31, 2019, the Fund did not pay any amounts to affiliates in return for these services.
The Manager maintains a call center that is responsible for providing certain shareholder services to the Fund. Shareholder services include responding to inquiries and processing purchases and sales based upon instructions from shareholders. For the year ended December 31, 2019, the Fund reimbursed the Manager the following amounts for costs incurred in running the call center, which are included in transfer agent — class specific in the Statement of Operations:
| | | | | | | | | | | | | | | | | | | | |
| Institutional | | | | | Investor A | | | | | Investor C | | | | | Total | |
| $ | 238 | | | | | $ | 139 | | | | | $ | 50 | | | | | $ | 427 | |
For the year ended December 31, 2019, the following table shows the class specific transfer agent fees borne directly by each share class of the Fund:
| | | | | | | | | | | | | | | | | | | | |
| Institutional | | | | | Investor A | | | | | Investor C | | | | | Total | |
| $ | 53,324 | | | | | $ | 56,025 | | | | | $ | 357 | | | | | $ | 109,706 | |
Other Fees: For the year ended December 31, 2019, affiliates earned underwriting discounts, direct commissions and dealer concessions on sales of each Fund’s Investor A Shares was $210.
For the year ended December 31, 2019, affiliates received CDSCs of $98 for Investor C Shares.
Expense Limitations, Waivers, Reimbursements and Recoupments:The Manager voluntarily agreed to waive its investment advisory fees by the amount of investment advisory fees the Fund pays to the Manager indirectly through its investment in affiliated money market funds (the “affiliated money market fund waiver”). The amount of waivers and/or reimbursements of fees and expenses made pursuant to the expense limitation described below will be reduced by the amount of the affiliated money market fund waiver. This amount is included in fees waived and/or reimbursed by the Manager in the Statement of Operations. For the year ended December 31, 2019, the amount waived was $14,313.
| | |
| 48 | | 2019 BLACKROCK ANNUAL REPORTTO SHAREHOLDERS |
Notes to Financial Statements (continued)
The Manager has contractually agreed to waive its investment advisory fee with respect to any portion of the Fund’s assets invested in affiliated equity and fixed-income mutual funds and affiliated exchange-traded funds that have a contractual management fee through April 30, 2020. The contractual agreement may be terminated upon 90 days’ notice by a majority of the Independent Trustees who are not “interested persons” of the Fund, as defined in the 1940 Act (“Independent Trustees”) or by a vote of a majority of the outstanding voting securities of the Fund. For the year ended December 31, 2019, there were no fees waived and/or reimbursed by the Manager pursuant to this arrangement.
With respect to the Fund, the Manager contractually agreed to waive and/or reimburse fees or expenses in order to limit expenses, excluding interest expense, dividend expense, tax expense, acquired fund fees and expenses, and certain other fund expenses, which constitute extraordinary expenses not incurred in the ordinary course of the Fund’s business (“expense limitation”). The current expense limitations as a percentage of average daily net assets is as follows:
| | | | | | | | | | | | | | |
| Institutional | | | | | Investor A | | | | | Investor C | |
| | 0.95% | | | | | | 1.20% | | | | | | 1.95% | |
The Manager has agreed not to reduce or discontinue this contractual expense limitations through April 30, 2020, unless approved by the Board, including a majority of the Independent Trustees or by a vote of a majority of the outstanding voting securities of the Fund. For the year ended December 31, 2019, amounts included in the Statement of Operations were as follows:
| | | | |
Fees waived and/or reimbursed by the Manager | | $ | 344,893 | |
Administration fees waived | | | 2,189 | |
These amounts waived and/or reimbursed are included in fees waived and/or reimbursed by the Manager, and shown as administration fees waived — class specific and transfer agent fees waived and/or reimbursed — class specific respectively, in the Statement of Operations. For the year ended December 31, 2019, the class specific expense waivers were as follows:
| | | | | | | | | | | | | | | | |
| | | Institutional | | | Investor A | | | Investor C | | | Total | |
Administration Fees Waived — Class Specific | | $ | 21,083 | | | $ | 6,921 | | | $ | 32 | | | $ | 28,036 | |
Transfer Agent Fees Waived and/or Reimbursed — Class Specific | | | 53,322 | | | | 56,024 | | | | 356 | | | | 109,702 | |
With respect to the contractual expense limitation, if during the Fund’s fiscal year the operating expenses of a share class, that at any time during the prior two fiscal years received a waiver and/or reimbursement from the Manager, are less than the current expense limitation for that share class, the Manager is entitled to be reimbursed by such share class up to the lesser of: (a) the amount of fees waived and/or expenses reimbursed during those prior two fiscal years under the agreement and (b) an amount not to exceed either the current expense limitation of that share class or the expense limitation of the share class in effect at the time that the share class received the applicable waiver and/or reimbursement, provided that:
(1) the Fund, of which the share class is a part, has more than $50 million in assets for the fiscal year; and
(2) the Manager or an affiliate continues to serve as the Fund’s investment adviser or administrator.
This repayment applies only to the contractual expense limitation on net expenses and does not apply to the contractual investment advisory fee waiver described above or any voluntary waivers that may be in effect from time to time. Effective May 19, 2022, the repayment arrangement between the Fund and the Manager pursuant to which such Fund may be required to repay amounts waived and/or reimbursed under the Fund’s contractual caps on net expenses will be terminated.
On December 31, 2019, the fund level and class specific waivers and/or reimbursements subject to possible future recoupment under the expense limitation agreement are as follows:
| | | | | | | | |
| | | Expiring December 31, | |
| | | 2020 | | | 2021 | |
Fund Level | | $ | 357,002 | | | $ | 347,082 | |
Institutional | | | 8,833 | | | | 74,405 | |
Investor A | | | 2,869 | | | | 62,945 | |
Investor C | | | 126 | | | | 388 | |
The following fund level and class specific waivers and/or reimbursements previously recorded by the Funds, which were subject to recoupment by the Manager, expired on December 31, 2019:
| | | | |
| | | Expired December 31,
2019 | |
Fund Level | | $ | 328,778 | |
Institutional | | | 6,911 | |
Investor A | | | 4,110 | |
Investor C | | | 232 | |
Interfund Lending: In accordance with an exemptive order (the “Order”) from the U.S. Securities and Exchange Commission (“SEC”), the Fund may participate in a joint lending and borrowing facility for temporary purposes (the “Interfund Lending Program”), subject to compliance with the terms and conditions of the Order, and to the extent permitted by the Fund’s investment policies and restrictions. The Fund is currently permitted to borrow under the Interfund Lending Program.
| | | | |
| NOTESTO FINANCIAL STATEMENTS | | | 49 | |
Notes to Financial Statements (continued)
A lending BlackRock fund may lend in aggregate up to 15% of its net assets, but may not lend more than 5% of its net assets to any one borrowing fund through the Interfund Lending Program. A borrowing BlackRock fund may not borrow through the Interfund Lending Program or from any other source more than 33 1/3% of its total assets (or any lower threshold provided for by the fund’s investment restrictions). If a borrowing BlackRock fund’s total outstanding borrowings exceed 10% of its total assets, each of its outstanding interfund loans will be subject to collateralization of at least 102% of the outstanding principal value of the loan. All interfund loans are for temporary or emergency purposes and the interest rate to be charged will be the average of the highest current overnight repurchase agreement rate available to a lending fund and the bank loan rate, as calculated according to a formula established by the Board.
During the year ended December 31, 2019, the Fund did not participate in the Interfund Lending Program.
Trustees and Officers:Certain trustees and/or officers of the Trust are trustees and/or officers of BlackRock or its affiliates. The Fund reimburses the Manager for a portion of the compensation paid to the Fund’s Chief Compliance Officer, which is included in Trustees and Officer in the Statement of Operations.
For the year ended December 31, 2019, purchases and sales of investments and mortgage dollar rolls and excluding short-term securities, were as follows:
| | | | | | | | |
| | | Purchases | | | Sales | |
Non-U.S. Government Securities | | $ | 1,518,036,235 | | | $ | 1,053,686,133 | |
U.S. Government Securities | | | 32,513,740 | | | | 13,161,353 | |
For the year ended December 31, 2019, purchases and sales related to mortgage dollar rolls were $421,298,850 and $421,162,619, respectively.
It is the Fund’s policy to comply with the requirements of the Internal Revenue Code of 1986, as amended, applicable to regulated investment companies, and to distribute substantially all of its taxable income to its shareholders. Therefore, no U.S. federal income tax provision is required.
The Fund files U.S. federal and various state and local tax returns. No income tax returns are currently under examination. The statute of limitations on the Fund’s U.S. federal tax returns generally remains open for each of the four years ended December 31, 2019. The statutes of limitations on the Fund’s state and local tax returns may remain open for an additional year depending upon the jurisdiction.
Management has analyzed tax laws and regulations and their application to the Fund as of December 31, 2019, inclusive of the open tax return years, and does not believe that there are any uncertain tax positions that require recognition of a tax liability in the Fund’s financial statements.
US GAAP requires that certain components of net assets be adjusted to reflect permanent differences between financial and tax reporting. These reclassifications have no effect on net assets or net asset values per share. As of period end, the following permanent differences attributable to nondeductible expenses and the use of equalization were reclassified to the following accounts:
| | | | |
Paid-in capital | | $ | 1,434,111 | |
Accumulated loss | | | (1,434,111 | ) |
The tax character of distributions paid was as follows:
| | | | | | | | |
| | | 12/31/19 | | | 12/31/18 | |
Ordinary income(a) | | $ | 10,882,877 | | | $ | 2,107,367 | |
Long-term capital gains(a) | | | 495,180 | | | | 600,879 | |
| | | | | | | | |
| | $ | 11,378,057 | | | $ | 2,708,246 | |
| | | | | | | | |
| | (a) | Distribution amounts may include a portion of the proceeds from redeemed shares. | |
As of period end, the tax components of accumulated loss were as follows:
| | | | |
Undistributed ordinary income | | $ | 257,152 | |
Net unrealized gains (losses)(a) | | | (6,505,104 | ) |
Qualified late-year losses(b) | | | (42,214 | ) |
| | | | |
| | $ | (6,290,166 | ) |
| | | | |
| | (a) | The difference between book-basis andtax-basis net unrealized losses was attributable primarily to the tax deferral of losses on wash sales and straddles, the realization for tax purposes of unrealized gains/losses on certain futures and foreign currency contracts, amortization methods for premiums on fixed income securities, the realization for tax purposes of unrealized gains on constructive sales, the accounting for swap agreements and the timing and recognition of partnership income. | |
| | (b) | The Fund has elected to defer certain qualified late-year losses and recognize such losses in the next taxable year. | |
| | |
| 50 | | 2019 BLACKROCK ANNUAL REPORTTO SHAREHOLDERS |
Notes to Financial Statements (continued)
As of December 31, 2019, gross unrealized appreciation and depreciation for investments and derivatives based on cost for U.S. federal income tax purposes were as follows:
| | | | |
Tax Cost | | $ | 457,182,478 | |
| | | | |
Gross unrealized appreciation | | $ | 4,869,686 | |
Gross unrealized depreciation | | | (9,461,417 | ) |
| | | | |
Net unrealized depreciation | | $ | (4,591,731 | ) |
| | | | |
The Trust, on behalf of the Fund, along with certain other funds managed by the Manager and its affiliates (“Participating Funds”), is a party to a364-day, $2.25 billion credit agreement with a group of lenders. Under this agreement, the Fund may borrow to fund shareholder redemptions. Excluding commitments designated for certain individual funds, the Participating Funds, including the Fund, can borrow up to an aggregate commitment amount of $1.75 billion at any time outstanding, subject to asset coverage and other limitations as specified in the agreement. The credit agreement has the following terms: a fee of 0.10% per annum on unused commitment amounts and interest at a rate equal to the higher of(a) one-month LIBOR (but, in any event, not less than 0.00%) on the date the loan is made plus 0.80% per annum or (b) the Fed Funds rate (but, in any event, not less than 0.00%) in effect from time to time plus 0.80% per annum on amounts borrowed. The agreement expires in April 2020 unless extended or renewed. Prior to April 18, 2019, Participating Funds paid an upfront commitment fee of 0.02% on the total commitment amounts, in addition to administration, legal and arrangement fees, which are included in miscellaneous expenses in the Statement of Operations. These fees were allocated among such funds based upon portions of the aggregate commitment available to them and relative net assets of Participating Funds. During the year ended December 31, 2019, the Fund did not borrow under the credit agreement.
In the normal course of business, the Fund invests in securities or other instruments and may enter into certain transactions, and such activities subject the Fund to various risks, including among others, fluctuations in the market (market risk) or failure of an issuer to meet all of its obligations. The value of securities or other instruments may also be affected by various factors, including, without limitation: (i) the general economy; (ii) the overall market as well as local, regional or global political and/or social instability; (iii) regulation, taxation or international tax treaties between various countries; or (iv) currency, interest rate and price fluctuations. The Fund’s prospectus provides details of the risks to which the Fund is subject.
The Fund may be exposed to prepayment risk, which is the risk that borrowers may exercise their option to prepay principal earlier than scheduled during periods of declining interest rates, which would force the Fund to reinvest in lower yielding securities. The Fund may also be exposed to reinvestment risk, which is the risk that income from the Fund’s portfolio will decline if the Fund invests the proceeds from matured, traded or called fixed-income securities at market interest rates that are below the Fund portfolio’s current earnings rate.
Valuation Risk: The market values of equities, such as common stocks and preferred securities or equity related investments, such as futures and options, may decline due to general market conditions which are not specifically related to a particular company. They may also decline due to factors which affect a particular industry or industries. The Fund may invest in illiquid investments. An illiquid investment is any investment that the Fund reasonably expects cannot be sold or disposed of in current market conditions in seven calendar days or less without the sale or disposition significantly changing the market value of the investment. The Fund may experience difficulty in selling illiquid investments in a timely manner at the price that it believes the investments are worth. Prices may fluctuate widely over short or extended periods in response to company, market or economic news. Markets also tend to move in cycles, with periods of rising and falling prices. This volatility may cause the Fund’s NAV to experience significant increases or decreases over short periods of time. If there is a general decline in the securities and other markets, the NAV of the Fund may lose value, regardless of the individual results of the securities and other instruments in which the Fund invests.
The price the Fund could receive upon the sale of any particular portfolio investment may differ from the Fund’s valuation of the investment, particularly for securities that trade in thin or volatile markets or that are valued using a fair valuation technique or a price provided by an independent pricing service. Changes to significant unobservable inputs and assumptions (i.e., publicly traded company multiples, growth rate, time to exit) due to the lack of observable inputs may significantly impact the resulting fair value and therefore the Fund’s results of operations. As a result, the price received upon the sale of an investment may be less than the value ascribed by the Fund, and the Fund could realize a greater than expected loss or lesser than expected gain upon the sale of the investment. The Fund’s ability to value its investments may also be impacted by technological issues and/or errors by pricing services or other third party service providers.
Counterparty Credit Risk:The Fund may be exposed to counterparty credit risk, or the risk that an entity may fail to or be unable to perform on its commitments related to unsettled or open transactions. The Fund manages counterparty credit risk by entering into transactions only with counterparties that the Manager believes have the financial resources to honor their obligations and by monitoring the financial stability of those counterparties. Financial assets, which potentially expose the Fund to market, issuer and counterparty credit risks, consist principally of financial instruments and receivables due from counterparties. The extent of the Fund’s exposure to market, issuer and counterparty credit risks with respect to these financial assets is approximately their value recorded in the Statement of Assets and Liabilities, less any collateral held by the Fund.
A derivative contract may suffer amark-to-market loss if the value of the contract decreases due to an unfavorable change in the market rates or values of the underlying instrument. Losses can also occur if the counterparty does not perform under the contract.
The Fund’s risk of loss from counterparty credit risk on OTC derivatives is generally limited to the aggregate unrealized gain less the value of any collateral held by the Fund.
| | | | |
| NOTESTO FINANCIAL STATEMENTS | | | 51 | |
Notes to Financial Statements (continued)
Concentration Risk:The Fund invests a significant portion of its assets in fixed-income securities and/or uses derivatives tied to the fixed-income markets. Changes in market interest rates or economic conditions may affect the value and/or liquidity of such investments. Interest rate risk is the risk that prices of bonds and other fixed-income securities will increase as interest rates fall and decrease as interest rates rise. The Fund may be subject to a greater risk of rising interest rates due to the current period of historically low rates.
The Fund invest a significant portion of its assets in securities backed by commercial or residential mortgage loans or in issuers that hold mortgage and other asset-backed securities. Investment percentages in these securities are presented in the Schedule of Investments. Changes in economic conditions, including delinquencies and/or defaults on assets underlying these securities, can affect the value, income and/or liquidity of such positions.
| 11. | CAPITAL SHARE TRANSACTIONS |
Transactions in capital shares for each class were as follows:
| | | | | | | | | | | | | | | | |
| | | Year Ended
12/31/19 | | | Year Ended
12/31/18 | |
| | | Shares | | | Amount | | | Shares | | | Amount | |
Institutional | | | | | | | | | | | | | | | | |
Shares sold | | | 29,995,937 | | | $ | 301,017,705 | | | | 1,501,093 | | | $ | 14,532,056 | |
Shares issued in reinvestment of distributions | | | 689,657 | | | | 6,834,059 | | | | 41,133 | | | | 394,564 | |
Shares redeemed | | | (6,056,898 | ) | | | (60,721,591 | ) | | | (752,661 | ) | | | (7,258,403 | ) |
| | | | | | | | | | | | | | | | |
Net increase | | | 24,628,696 | | | | 247,130,173 | | | | 789,565 | | | $ | 7,668,217 | |
| | | | | | | | | | | | | | | | |
| | | | |
Investor A | | | | | | | | | | | | | | | | |
Shares sold | | | 7,668,519 | | | $ | 76,759,083 | | | | 172,385 | | | $ | 1,658,750 | |
Shares issued in reinvestment of distributions | | | 213,591 | | | | 2,116,330 | | | | 15,632 | | | | 150,031 | |
Shares redeemed | | | (618,057 | ) | | | (6,163,789 | ) | | | (44,790 | ) | | | (432,737 | ) |
| | | | | | | | | | | | | | | | |
Net increase | | | 7,264,053 | | | $ | 72,711,624 | | | | 143,227 | | | $ | 1,376,044 | |
| | | | | | | | | | | | | | | | |
| | | | |
Investor C | | | | | | | | | | | | | | | | |
Shares sold | | | 24,664 | | | $ | 247,082 | | | | 1,298 | | | $ | 12,422 | |
Shares issued in reinvestment of distributions | | | 715 | | | | 7,080 | | | | 380 | | | | 3,648 | |
Shares redeemed | | | (2,412 | ) | | | (24,012 | ) | | | (356 | ) | | | (3,424 | ) |
| | | | | | | | | | | | | | | | |
Net increase | | | 22,967 | | | $ | 230,150 | | | | 1,322 | | | $ | 12,646 | |
| | | | | | | | | | | | | | | | |
Total Net Increase | | | 31,915,716 | | | $ | 320,071,947 | | | | 934,114 | | | $ | 9,056,907 | |
| | | | | | | | | | | | | | | | |
As of December 31, 2019, shares of the Fund owned by BlackRock HoldCo 2, Inc., an affiliate of the Fund, were as follows:
| | | | | | | | | | | | | | | | | | | | |
| Institutional | | | | | Investor A | | | | | Investor C | | | | | Total | |
| | 2,497,309 | | | | | | 2,001 | | | | | | 2,000 | | | | | | 2,501,310 | |
Management has evaluated the impact of all subsequent events on the Fund through the date the financial statements were issued and has determined that there were no subsequent events requiring adjustment or additional disclosure in the financial statements.
| | |
| 52 | | 2019 BLACKROCK ANNUAL REPORTTO SHAREHOLDERS |
Report of Independent Registered Public Accounting Firm
To the Shareholders of BlackRock Systematic Multi-Strategy Fund and the Board of Trustees of BlackRock Funds IV:
Opinion on the Financial Statements and Financial Highlights
We have audited the accompanying statement of assets and liabilities of BlackRock Systematic Multi-Strategy Fund (formerly, BlackRock Alternative Capital Strategies Fund) of BlackRock Funds IV (the “Fund”), including the schedule of investments, as of December 31, 2019, the related statement of operations for the year then ended, the statements of changes in net assets for each of the two years in the period then ended, the financial highlights for each of the three years in the period then ended, and the related notes. In our opinion, the financial statements and financial highlights present fairly, in all material respects, the financial position of the Fund as of December 31, 2019, and the results of its operations for the year then ended, the changes in its net assets for each of the two years in the period then ended, and the financial highlights for each of the three years in the period then ended, in conformity with accounting principles generally accepted in the United States of America.
The financial highlights for the year ended December 31, 2016 and for the period from May 19, 2015 (commencement of operations) through December 31, 2015 were audited by other auditors whose report dated February 24, 2017, expressed an unqualified opinion on those financial statements and financial highlights.
Basis for Opinion
These financial statements and financial highlights are the responsibility of the Fund’s management. Our responsibility is to express an opinion on the Fund’s financial statements and financial highlights based on our audits. We are a public accounting firm registered with the Public Company Accounting Oversight Board (United States) (PCAOB) and are required to be independent with respect to the Fund in accordance with the U.S. federal securities laws and the applicable rules and regulations of the Securities and Exchange Commission and the PCAOB.
We conducted our audits in accordance with the standards of the PCAOB. Those standards require that we plan and perform the audit to obtain reasonable assurance about whether the financial statements and financial highlights are free of material misstatement, whether due to error or fraud. The Fund is not required to have, nor were we engaged to perform, an audit of its internal control over financial reporting. As part of our audits we are required to obtain an understanding of internal control over financial reporting but not for the purpose of expressing an opinion on the effectiveness of the Fund’s internal control over financial reporting. Accordingly, we express no such opinion.
Our audits included performing procedures to assess the risks of material misstatement of the financial statements and financial highlights, whether due to error or fraud, and performing procedures that respond to those risks. Such procedures included examining, on a test basis, evidence regarding the amounts and disclosures in the financial statements and financial highlights. Our audits also included evaluating the accounting principles used and significant estimates made by management, as well as evaluating the overall presentation of the financial statements and financial highlights. Our procedures included confirmation of securities owned as of December 31, 2019, by correspondence with the custodian and brokers; when replies were not received from brokers, we performed other auditing procedures. We believe that our audits provide a reasonable basis for our opinion.
Deloitte & Touche LLP
Boston, Massachusetts
February 24, 2020
We have served as the auditor of one or more BlackRock investment companies since 1992.
Important Tax Information (Unaudited)
During the fiscal year ended December 31, 2019, the following information is provided with respect to the ordinary income distributions paid by the Fund:
| | | | | | |
| | | Payable Date | | | |
Qualified Dividend Income for Individuals(a) | | April 2019 | | | 1.62 | % |
| | July 2019 — December 2019 | | | 1.16 | |
Dividends Qualifying for the Dividend Received Deduction for Corporations(a) | | January — December 2019 | | | 1.13 | |
Interest-Related Dividends and Qualified Short-Term Gains forNon-U.S. Residents(b) | | April 2019 | | | 64.23 | |
| | July 2019, October 2019 | | | 62.28 | |
| | December 2019 | | | 95.31 | |
Federal Obligation Interest(c) | | January — December 2019 | | | 2.08 | |
| | (a) | The Funds hereby designate the percentage indicated or the maximum amount allowable by law. | |
| | (b) | Represents the portion of the taxable ordinary income dividends eligible for exemption from U.S. withholding tax for nonresident aliens and foreign corporations. | |
| | (c) | The law varies in each state as to whether and what percentage of dividend income attributable to federal obligations is exempt from state income tax. We recommend that you consult your tax advisor to determine if any portion of the dividends you received is exempt from state income taxes. | |
Additionally, the Systematic Multi-Strategy Fund distributed long-term capital gains of $0.011855 per share to shareholders of record on December 27, 2019.
| | | | |
| REPORTOF INDEPENDENT REGISTERED PUBLIC ACCOUNTING FIRM | | | 53 | |
Statement Regarding Liquidity Risk Management Program
The Securities and Exchange Commission adopted Rule 22e-4 under the Investment Company Act of 1940, as amended (the “Liquidity Rule”) to promote effective liquidity risk management throughout the open-end investment company industry, thereby reducing the risk that funds will be unable to meet their redemption obligations and mitigating dilution of the interests of fund shareholders.
The Board of Trustees (the “Board”) of BlackRock Funds IV, on behalf of BlackRock Systematic Multi-Strategy Fund, met on November 14-15, 2019 (the “Meeting”) to review the liquidity risk management program (the “Program”) applicable to the BlackRock open-end funds, excluding money market funds (each, a “Fund”), pursuant to the Liquidity Rule. The Board has appointed BlackRock Advisors, LLC or BlackRock Fund Advisors (“BlackRock”), each an investment adviser to certain Funds, as the program administrator for each Fund’s Program, as applicable. BlackRock has delegated oversight of the Program to the 40 Act Liquidity Risk Management Committee (the “Committee”). At the Meeting, the Committee, on behalf of BlackRock, provided the Board with a report that addressed the operation of the Program and assessed its adequacy and effectiveness of implementation, including the operation of each Fund’s Highly Liquid Investment Minimum (“HLIM”) where applicable, and any material changes to the Program (the “Report”). The Report covered the period from December 1, 2018 through September 30, 2019 (the “Program Reporting Period”).
The Report described the Program’s liquidity classification methodology for categorizing a Fund’s investments (including derivative transactions) into one of four liquidity buckets. It also described BlackRock’s methodology in establishing a Fund’s HLIM and noted that the Committee reviews and ratifies the HLIM assigned to each Fund no less frequently than annually.
The Report noted that the Program complied with the key factors for consideration under the Liquidity Rule for assessing, managing and periodically reviewing a Fund’s liquidity risk, as follows:
A. The Fund’s investment strategy and liquidity of portfolio investments during both normal and reasonably foreseeable stressed conditions:During the Program Reporting Period, the Committee reviewed whether each Fund’s strategy is appropriate for an open-end fund structure with a focus on Funds with more significant and consistent holdings of less liquid and illiquid assets. The Committee also factored a Fund’s concentration in an issuer into the liquidity classification methodology by taking issuer position sizes into account. Where a Fund participated in borrowings for investment purposes (such as tender option bonds and reverse repurchase agreements), such borrowings were factored into the Program’s calculation of a Fund’s liquidity bucketing. Derivative exposure was also considered in such calculation.
B. Short-term and long-term cash flow projections during both normal and reasonably foreseeable stressed conditions:During the Program Reporting Period, the Committee reviewed historical net redemption activity and used this information as a component to establish each Fund’s reasonably anticipated trading size (“RATS”). Each Fund has adopted an in-kind redemption policy which may be utilized to meet larger redemption requests. The Committee may also take into consideration a Fund’s shareholder ownership concentration (which, depending on product type and distribution channel, may or may not be available), a Fund’s distribution channels, and the degree of certainty associated with a Fund’s short-term and long-term cash flow projections.
C. Holdings of cash and cash equivalents, as well as borrowing arrangements:The Committee considered the terms of the credit facility applicable to the Funds, the financial health of the institution providing the facility and the fact that the credit facility is shared among multiple Funds (including that a portion of the aggregate commitment amount is specifically designated for BlackRock Floating Rate Income Portfolio and BlackRock Credit Strategies Income Fund, each a series of BlackRock Funds V). The Committee also considered other types of borrowing available to the Funds, such as the ability to use reverse repurchase agreements and interfund lending, as applicable.
There were no material changes to the Program during the Program Reporting Period. The Report provided to the Board stated that the Committee concluded that based on the operation of the functions, as described in the Report, the Program is operating as intended and is effective in implementing the requirements of the Liquidity Rule.
| | |
| 54 | | 2019 BLACKROCK ANNUAL REPORTTO SHAREHOLDERS |
Trustee and Officer Information
| | | | | | | | |
| Independent Trustees (a) |
| | | | | |
Name
Year of Birth (b) | | Position(s) Held
(Length of Service) (c) | | Principal Occupation(s) During Past Five Years | | Number of BlackRock-Advised
Registered Investment Companies
(“RICs”) Consisting of
Investment Portfolios
(“Portfolios”) Overseen | | Public Company and
Other Investment Company
Directorships Held During
Past Five Years |
Richard E. Cavanagh 1946 | | Co-Chair of the Board and Trustee
(Since 2019) | | Director, The Guardian Life Insurance Company of America since 1998; Board Chair, Volunteers of America (anot-for-profit organization) from 2015 to 2018 (board member since 2009); Director, Arch Chemicals (chemical and allied products) from 1999 to 2011; Trustee, Educational Testing Service from 1997 to 2009 and Chairman thereof from 2005 to 2009; Senior Advisor, The Fremont Group since 2008 and Director thereof since 1996; Faculty Member/Adjunct Lecturer, Harvard University since 2007 and Executive Dean from 1987 to 1995; President and Chief Executive Officer, The Conference Board, Inc. (global business research organization) from 1995 to 2007. | | 86 RICs consisting of 110 Portfolios | | None |
Karen P. Robards 1950 | | Co-Chair of the Board and Trustee
(Since 2019) | | Principal of Robards & Company, LLC (consulting and private investing) since 1987;Co-founder and Director of the Cooke Center for Learning and Development (anot-for-profit organization) since 1987; Director of Enable Injections, LLC (medical devices) since 2019; Investment Banker at Morgan Stanley from 1976 to 1987. | | 86 RICs consisting of 110 Portfolios | | Greenhill & Co., Inc.; AtriCure, Inc. (medical devices) from 2000 until 2017
|
Michael J. Castellano 1946 | | Trustee
(Since 2019) | | Chief Financial Officer of Lazard Group LLC from 2001 to 2011; Chief Financial Officer of Lazard Ltd from 2004 to 2011; Director, Support Our Aging Religious(non-profit) from 2009 to June 2015 and since 2017; Director, National Advisory Board of Church Management at Villanova University since 2010; Trustee, Domestic Church Media Foundation since 2012; Director, CircleBlack Inc. (financial technology company) since 2015. | | 86 RICs consisting of 110 Portfolios | | None |
Cynthia L. Egan 1955 | | Trustee
(Since 2019) | | Advisor, U.S. Department of the Treasury from 2014 to 2015; President, Retirement Plan Services, for T. Rowe Price Group, Inc. from 2007 to 2012; executive positions within Fidelity Investments from 1989 to 2007. | | 86 RICs consisting of 110 Portfolios | | Unum (insurance); The Hanover Insurance Group (insurance); Envestnet (investment platform) from 2013 until 2016 |
Frank J. Fabozzi (d) 1948 | | Trustee
(Since 2019) | | Editor of The Journal of Portfolio Management since 1986; Professor of Finance, EDHEC Business School (France) since 2011; Visiting Professor, Princeton University for the 2013 to 2014 academic year and Spring 2017 semester; Professor in the Practice of Finance, Yale University School of Management from 1994 to 2011 and currently a Teaching Fellow in Yale’s Executive Programs; Board Member, BlackRock Equity-Liquidity Funds from 2014 to 2016; affiliated professor Karlsruhe Institute of Technology from 2008 to 2011. | | 87 RICs consisting of 111 Portfolios | | None |
Henry Gabbay 1947 | | Trustee
(Since 2019) | | Board Member, BlackRock Equity-Bond Board from 2007 to 2018; Board Member, BlackRock Equity-Liquidity and BlackRockClosed-End Fund Boards from 2007 through 2014; Consultant, BlackRock, Inc. from 2007 to 2008; Managing Director, BlackRock, Inc. from 1989 to 2007; Chief Administrative Officer, BlackRock Advisors, LLC from 1998 to 2007; President of BlackRock Funds and BlackRock Allocation Target Shares (formerly, BlackRock Bond Allocation Target Shares) from 2005 to 2007 and Treasurer of certainclosed-end funds in the BlackRock fund complex from 1989 to 2006. | | 86 RICs consisting of 110 Portfolios | | None |
| | | | |
| TRUSTEEAND OFFICER INFORMATION | | | 55 | |
Trustee and Officer Information (continued)
| | | | | | | | |
| Independent Trustees (a)(continued) |
| | | | | |
Name
Year of Birth (b) | | Position(s) Held
(Length of Service) (c) | | Principal Occupation(s) During Past Five Years | | Number of BlackRock-Advised
Registered Investment Companies
(“RICs”) Consisting of
Investment Portfolios
(“Portfolios”) Overseen | | Public Company and
Other Investment Company
Directorships Held During
Past Five Years |
R. Glenn Hubbard 1958 | | Trustee
(Since 2019) | | Dean, Columbia Business School from 2004 to 2019; Faculty member, Columbia Business School since 1988. | | 86 RICs consisting of 110 Portfolios | | ADP (data and information services); Metropolitan Life Insurance Company (insurance); KKR Financial Corporation (finance) from 2004 until 2014 |
W. Carl Kester (d) 1951 | | Trustee
(Since 2019) | | George Fisher Baker Jr. Professor of Business Administration, Harvard Business School since 2008; Deputy Dean for Academic Affairs from 2006 to 2010; Chairman of the Finance Unit, from 2005 to 2006; Senior Associate Dean and Chairman of the MBA Program from 1999 to 2005; Member of the faculty of Harvard Business School since 1981. | | 87 RICs consisting of 111 Portfolios | | None |
Catherine A. Lynch (d) 1961 | | Trustee
(Since 2019) | | Chief Executive Officer, Chief Investment Officer and various other positions, National Railroad Retirement Investment Trust from 2003 to 2016; Associate Vice President for Treasury Management, The George Washington University from 1999 to 2003; Assistant Treasurer, Episcopal Church of America from 1995 to 1999. | | 87 RICs consisting of 111 Portfolios | | None |
|
| Interested Trustees (a)(e) |
| | | | | |
Name
Year of Birth (b) | | Position(s) Held
(Length of Service) (c) | | Principal Occupation(s) During Past Five Years | | Number of BlackRock-Advised
Registered Investment Companies
(“RICs”) Consisting of
Investment Portfolios
(“Portfolios”) Overseen | | Public Company and
Other Investment Company
Directorships Held During
Past Five Years |
Robert Fairbairn 1965 | | Trustee
(Since 2018) | | Vice Chairman of BlackRock, Inc. since 2019; Member of BlackRock’s Global Executive and Global Operating Committees;Co-Chair of BlackRock’s Human Capital Committee; Senior Managing Director of BlackRock, Inc. from 2010 to 2019; oversaw BlackRock’s Strategic Partner Program and Strategic Product Management Group from 2012 to 2019; Member of the Board of Managers of BlackRock Investments, LLC from 2011 to 2018; Global Head of BlackRock’s Retail and iShares® businesses from 2012 to 2016. | | 123 RICs consisting of 287 Portfolios | | None |
John M. Perlowski (d) 1964 | | Trustee
(Since 2015);
President and Chief Executive Officer
(Since 2010) | | Managing Director of BlackRock, Inc. since 2009; Head of BlackRock Global Accounting and Product Services since 2009; Advisory Director of Family Resource Network (charitable foundation) since 2009. | | 124 RICs consisting of 288 Portfolios | | None |
(a) The address of each Trustee is c/o BlackRock, Inc., 55 East 52nd Street, New York, New York 10055. |
(b) Each Independent Trustee holds office until his or her successor is duly elected and qualifies or until his or her earlier death, resignation, retirement or removal as provided by the Trust’sby-laws or charter or statute, or until December 31 of the year in which he or she turns 75. Trustees who are “interested persons,” as defined in the Investment Company Act serve until their successor is duly elected and qualifies or until their earlier death, resignation, retirement or removal as provided by the Trust’sby-laws or statute, or until December 31 of the year in which they turn 72. The Board may determine to extend the terms of Independent Trustees on acase-by-case basis, as appropriate. |
(c) Following the combination of Merrill Lynch Investment Managers, L.P. (“MLIM”) and BlackRock, Inc. in September 2006, the various legacy MLIM and legacy BlackRock fund boards were realigned and consolidated into three new fund boards in 2007. Certain Independent Trustees first became members of the boards of other legacy MLIM or legacy BlackRock funds as follows: Richard E. Cavanagh, 1994; Frank J. Fabozzi, 1988; R. Glenn Hubbard, 2004; W. Carl Kester, 1995; and Karen P. Robards, 1998. Certain other Independent Trustees became members of the boards of theclosed-end funds in the Fixed-Income Complex as follows: Michael J. Castellano, 2011; Cynthia L. Egan, 2016; and Catherine A. Lynch, 2016. |
(d) Dr. Fabozzi, Dr. Kester, Ms. Lynch and Mr. Perlowski are also trustees of the BlackRock Credit Strategies Fund. |
(e) Mr. Fairbairn and Mr. Perlowski are both “interested persons,” as defined in the 1940 Act, of the Trust based on their positions with BlackRock, Inc. and its affiliates. Mr. Fairbairn and Mr. Perlowski are also board members of the BlackRock Multi-Asset Complex. |
| | |
| 56 | | 2019 BLACKROCK ANNUAL REPORTTO SHAREHOLDERS |
Trustee and Officer Information (continued)
| | | | |
| Officers Who Are Not Trustees (a) |
| | | |
Name
Year of Birth (b) | | Position(s) Held
(Length of Service) | | Principal Occupation(s) During Past Five Years |
Jennifer McGovern 1977 | | Vice President
(Since 2014) | | Managing Director of BlackRock, Inc. since 2016; Director of BlackRock, Inc. from 2011 to 2015; Head of Product Development and Oversight for BlackRock’s Strategic Product Management Group since 2019; Head of Product Structure and Oversight for BlackRock’s U.S. Wealth Advisory Group from 2013 to 2019. |
Neal J. Andrews 1966 | | Chief Financial Officer
(Since 2007) | | Chief Financial Officer of the iShares® exchange traded funds since 2019; Managing Director of BlackRock, Inc. since 2006. |
Jay M. Fife 1970 | | Treasurer
(Since 2007) | | Managing Director of BlackRock, Inc. since 2007. |
Charles Park 1967 | | Chief Compliance Officer
(Since 2014) | | Anti-Money Laundering Compliance Officer for certain BlackRock-advised Funds from 2014 to 2015; Chief Compliance Officer of BlackRock Advisors, LLC and the BlackRock-advised Funds in the BlackRock Multi-Asset Complex and the BlackRock Fixed-Income Complex since 2014; Principal of and Chief Compliance Officer for iShares® Delaware Trust Sponsor LLC since 2012 and BlackRock Fund Advisors (“BFA”) since 2006; Chief Compliance Officer for theBFA-advised iShares® exchange traded funds since 2006; Chief Compliance Officer for BlackRock Asset Management International Inc. since 2012. |
Lisa Belle 1968 | | Anti-Money Laundering Compliance Officer
(Since 2019) | | Managing Director of BlackRock, Inc. since 2019; Global Financial Crime Head for Asset and Wealth Management of JP Morgan from 2013 to 2019; Managing Director of RBS Securities from 2012 to 2013; Head of Financial Crimes for Barclays Wealth Americas from 2010 to 2012. |
Janey Ahn 1975 | | Secretary
(Since 2019) | | Managing Director of BlackRock, Inc. since 2018; Director of BlackRock, Inc. from 2009 to 2017. |
(a) The address of each Officer is c/o BlackRock, Inc., 55 East 52nd Street, New York, New York 10055. |
(b) Officers of the Trust serve at the pleasure of the Board. |
Further information about the Trust’s Trustees and Officers is available in the Trust’s Statement of Additional Information, which can be obtained without charge by calling (800)441-7762.
Effective September 4, 2019, Janey Ahn replaced Benjamin Archibald as the Secretary of the Trust.
Effective September 5, 2019, Lisa Belle replaced John MacKessy as the Anti-Money Laundering Compliance Officer of the Trust.
Effective February 19, 2020, Henry Gabbay resigned as a Trustee of the Trust.
Investment Adviser and Administrator
BlackRock Advisors, LLC
Wilmington, DE 19809
Sub-Adviser
BlackRock International Limited
Edinburgh, EH3 8BL
United Kingdom
Accounting Agent and Custodian
State Street Bank and Trust Company
Boston, MA 02111
Distributor
BlackRock Investments, LLC
New York, NY 10022
Transfer Agent
BNY Mellon Investment Servicing (US) Inc.
Wilmington, DE 19809
Independent Registered Public Accounting Firm
Deloitte & Touche LLP
Boston, MA 02116
Legal Counsel
Willkie Farr & Gallagher LLP
New York, NY 10019
Address of the Fund
100 Bellevue Parkway
Wilmington, DE 19809
| | | | |
| TRUSTEEAND OFFICER INFORMATION | | | 57 | |
Additional Information
General Information
Householding
The Fund will mail only one copy of shareholder documents, including prospectuses, annual and semi-annual reports and proxy statements, to shareholders with multiple accounts at the same address. This practice is commonly called “householding” and is intended to reduce expenses and eliminate duplicate mailings of shareholder documents. Mailings of your shareholder documents may be householded indefinitely unless you instruct us otherwise. If you do not want the mailing of these documents to be combined with those for other members of your household, please call the Fund at (800) 441-7762.
Availability of Quarterly Schedule of Investments
The Fund files its complete schedules of portfolio holdings with the SEC for the first and third quarters of each fiscal year as an exhibit to its reports on Form N-PORT, and for reporting periods ended prior to March 31, 2019, filed such information on Form N-Q. The Fund’s Forms N-PORT andN-Q are available on the SEC’s website at sec.gov. The Fund’s Form N-Q may also be obtained upon request and without charge by calling (800) 441-7762.
Availability of Proxy Voting Policies and Procedures
A description of the policies and procedures that the Fund uses to determine how to vote proxies relating to portfolio securities is available upon request and without charge (1) by calling (800) 441-7762; (2) atblackrock.com; and (3) on the SEC’s website at sec.gov.
Availability of Proxy Voting Record
Information about how the Fund voted proxies relating to securities held in the Fund’s portfolios during the most recent 12-month period ended June 30 is available upon request and without charge (1) atblackrock.com or by calling (800) 441-7762 and (2) on the SEC’s website at sec.gov.
BlackRock’s Mutual Fund Family
BlackRock offers a diverse lineup of open-end mutual funds crossing all investment styles and managed by experts in equity, fixed-income and tax-exempt investing. Visitblackrock.com for more information.
Shareholder Privileges
Account Information
Call us at (800) 441-7762 from 8:00 AM to 6:00 PM ET on any business day to get information about your account balances, recent transactions and share prices. You can also visitblackrock.com for more information.
Automatic Investment Plans
Investor class shareholders who want to invest regularly can arrange to have $50 or more automatically deducted from their checking or savings account and invested in any of the BlackRock funds.
Systematic Withdrawal Plans
Investor class shareholders can establish a systematic withdrawal plan and receive periodic payments of $50 or more from their BlackRock funds, as long as their account balance is at least $10,000.
Retirement Plans
Shareholders may make investments in conjunction with Traditional, Rollover, Roth, Coverdell, Simple IRAs, SEP IRAs and 403(b) Plans.
| | |
| 58 | | 2019 BLACKROCK ANNUAL REPORTTO SHAREHOLDERS |
Additional Information (continued)
BlackRock Privacy Principles
BlackRock is committed to maintaining the privacy of its current and former fund investors and individual clients (collectively, “Clients”) and to safeguarding their non-public personal information. The following information is provided to help you understand what personal information BlackRock collects, how we protect that information and why in certain cases we share such information with select parties.
If you are located in a jurisdiction where specific laws, rules or regulations require BlackRock to provide you with additional or different privacy-related rights beyond what is set forth below, then BlackRock will comply with those specific laws, rules or regulations.
BlackRock obtains or verifies personal non-public information from and about you from different sources, including the following: (i) information we receive from you or, if applicable, your financial intermediary, on applications, forms or other documents; (ii) information about your transactions with us, our affiliates, or others; (iii) information we receive from a consumer reporting agency; and (iv) from visits to our websites.
BlackRock does not sell or disclose to non-affiliated third parties any non-public personal information about its Clients, except as permitted by law or as is necessary to respond to regulatory requests or to service Client accounts. These non-affiliated third parties are required to protect the confidentiality and security of this information and to use it only for its intended purpose.
We may share information with our affiliates to service your account or to provide you with information about other BlackRock products or services that may be of interest to you. In addition, BlackRock restricts access to non-public personal information about its Clients to those BlackRock employees with a legitimate business need for the information. BlackRock maintains physical, electronic and procedural safeguards that are designed to protect the non-public personal information of its Clients, including procedures relating to the proper storage and disposal of such information.
| | |
Glossary of Terms Used in this Report Currency |
| |
| AUD | | Australian Dollar |
| |
| CAD | | Canadian Dollar |
| |
| EUR | | Euro |
| |
| GBP | | British Pound |
| |
| HKD | | Hong Kong Dollar |
| |
| JPY | | Japanese Yen |
| |
| KRW | | South Korean Won |
| |
| MXN | | Mexican Peso |
| |
| PLN | | Polish Zloty |
| |
| SEK | | Swedish Krona |
| |
| SGD | | Singapore Dollar |
| |
| USD | | United States Dollar |
| | |
| Portfolio Abbreviations |
| |
| EURIBOR | | Euro Interbank Offered Rate |
| |
| HIBOR | | Hong Kong Interbank Offered Rate |
| |
| JIBAR | | Johannesburg Interbank Average Rate |
| |
| LIBOR | | London Interbank Offered Rate |
| |
| MSCI | | Morgan Stanley Capital International |
| |
| NVDR | | Non-voting Depository Receipts |
| |
| OTC | | Over-the-Counter |
| |
| PCL | | Public Company Limited |
| |
| SIBOR | | Singapore Interbank Offered Rate |
| |
| STIBOR | | Stockholm Interbank Offered Rate |
| | | | |
| ADDITIONAL INFORMATION / GLOSSARYOF TERMS USEDINTHIS REPORT | | | 59 | |
Want to know more?
blackrock.com | 877-275-1255 (1-877-ASK-1BLK)
This report is intended for current holders. It is not authorized for use as an offer of sale or a solicitation of an offer to buy shares of the Fund unless preceded or accompanied by the Fund’s current prospectus. Past performance results shown in this report should not be considered a representation of future performance. Investment returns and principal value of shares will fluctuate so that shares, when redeemed, may be worth more or less than their original cost. Statements and other information herein are as dated and are subject to change.
SMS-12/19-AR
| Item 2 – | Code of Ethics – The registrant (or the “Fund”) has adopted a code of ethics, as of the end of the period covered by this report, applicable to the registrant’s principal executive officer, principal financial officer, principal accounting officer or controller, or persons performing similar functions. During the period covered by this report, the code of ethics was amended to update certain information and to make othernon-material changes. During the period covered by this report, there have been no waivers granted under the code of ethics. The registrant undertakes to provide a copy of the code of ethics to any person upon request, without charge, who calls1-800-441-7762. |
| Item 3 – | Audit Committee Financial Expert – The registrant’s board of directors (the “board of directors”), has determined that (i) the registrant has the following audit committee financial expert serving on its audit committee and (ii) each audit committee financial expert is independent: |
Michael Castellano
Frank J. Fabozzi
Henry Gabbay
Catherine A. Lynch
Karen P. Robards
The registrant’s board of directors has determined that Karen P. Robards qualifies as an audit committee financial expert pursuant to Item 3(c)(4) of FormN-CSR.
Ms. Robards has a thorough understanding of generally accepted accounting principles, financial statements and internal control over financial reporting as well as audit committee functions. Ms. Robards has been President of Robards & Company, a financial advisory firm, since 1987. Ms. Robards was formerly an investment banker for more than 10 years where she was responsible for evaluating and assessing the performance of companies based on their financial results. Ms. Robards has over 30 years of experience analyzing financial statements. She also is a member of the audit committee of one publicly held company and anon-profit organization.
Under applicable securities laws, a person determined to be an audit committee financial expert will not be deemed an “expert” for any purpose, including without limitation for the purposes of Section 11 of the Securities Act of 1933, as a result of being designated or identified as an audit committee financial expert. The designation or identification of a person as an audit committee financial expert does not impose on such person any duties, obligations, or liabilities greater than the duties, obligations, and liabilities imposed on such person as a member of the audit committee and board of directors in the absence of such designation or identification. The designation or identification of a person as an audit committee financial expert does not affect the duties, obligations, or liability of any other member of the audit committee or board of directors.
| Item 4 – | Principal Accountant Fees and Services |
The following table presents fees billed by Deloitte & Touche (“D&T) in each of the last two fiscal years for the services rendered to the Fund:
| | | | | | | | | | | | | | | | | | |
| | | | | (a) Audit Fees | | (b) Audit-Related Fees1 | | (c) Tax Fees2 | | (d) All Other Fees |
| Entity Name | | | | Current
Fiscal Year
End | | Previous
Fiscal Year
End | | Current
Fiscal Year
End | | Previous
Fiscal Year
End | | Current
Fiscal Year
End | | Previous
Fiscal Year
End | | Current
Fiscal Year
End | | Previous
Fiscal Year
End |
| BlackRock | | | | $65,688 | | $65,688 | | $0 | | $0 | | $20,600 | | $21,200 | | $0 | | $0 |
2
| | | | | | | | | | | | | | | | | | |
| Systematic Multi-Strategy Fund | | | | | | | | | | | | | | | | | | |
The following table presents fees billed by D&T that were required to be approved by the registrant’s audit committee (the “Committee”) for services that relate directly to the operations or financial reporting of the Fund and that are rendered on behalf of BlackRock Advisors, LLC (the “Investment Adviser” or “BlackRock”) and entities controlling, controlled by, or under common control with BlackRock (not including anysub-adviser whose role is primarily portfolio management and is subcontracted with or overseen by another investment adviser) that provide ongoing services to the Fund (“Affiliated Service Providers”):
| | | | |
| | | Current Fiscal Year End | | Previous Fiscal Year End |
(b) Audit-Related Fees1 | | $0 | | $0 |
(c) Tax Fees2 | | $0 | | $0 |
(d) All Other Fees3 | | $2,050,500 | | $2,274,000 |
1 The nature of the services includes assurance and related services reasonably related to the performance of the audit or review of financial statements not included in Audit Fees, including accounting consultations, agreed-upon procedure reports, attestation reports, comfort letters,out-of-pocket expenses and internal control reviews not required by regulators.
2 The nature of the services includes tax compliance and/or tax preparation, including services relating to the filing or amendment of federal, state or local income tax returns, regulated investment company qualification reviews, taxable income and tax distribution calculations.
3Non-audit fees of $2,050,500 and $2,274,000 for the current fiscal year and previous fiscal year, respectively, were paid to the Fund’s principal accountant in their entirety by BlackRock, in connection with services provided to the Affiliated Service Providers of the Fund and of certain other funds sponsored and advised by BlackRock or its affiliates for a service organization review and an accounting research tool subscription. These amounts represent aggregate fees paid by BlackRock and were not allocated on a per fund basis.
(e)(1) Audit CommitteePre-Approval Policies and Procedures:
The Committee has adopted policies and procedures with regard to thepre-approval of services. Audit, audit-related and tax compliance services provided to the registrant on an annual basis require specificpre-approval by the Committee. The Committee also must approve othernon-audit services provided to the registrant and thosenon-audit services provided to the Investment Adviser and Affiliated Service Providers that relate directly to the operations and the financial reporting of the registrant. Certain of thesenon-audit services that the Committee believes are (a) consistent with the SEC’s auditor independence rules and (b) routine and recurring services that will not impair the independence of the independent accountants may be approved by the Committee without consideration on a specificcase-by-case basis (“generalpre-approval”). The term of any generalpre-approval is 12 months from the date of thepre-approval, unless the Committee provides for a different period. Tax or othernon-audit services provided to the registrant which have a direct impact on the operations or financial reporting of the registrant will only be deemedpre-approved provided that any individual project does not exceed $10,000 attributable to the registrant or $50,000 per project. For this purpose, multiple projects will be aggregated to determine if they exceed the previously mentioned cost levels.
Any proposed services exceeding thepre-approved cost levels will require specificpre-approval by the Committee, as will any other services not subject to generalpre-approval (e.g., unanticipated but permissible services). The Committee is informed of each service approved subject to generalpre-approval at the next regularly scheduledin-person board meeting. At this meeting, an analysis of such services is presented to the Committee for ratification. The Committee may delegate to the Committee Chairman the authority to approve the provision of and fees for any specific engagement of permitted non-
3
audit services, including services exceedingpre-approved cost levels.
(e)(2) None of the services described in each of Items 4(b) through (d) were approved by the Committee pursuant to the de minimus exception in paragraph (c)(7)(i)(C) of Rule2-01 of RegulationS-X.
(f) Not Applicable
(g) The aggregatenon-audit fees, defined as the sum of the fees shown under “Audit-Related Fees,” “Tax Fees” and “All Other Fees,” paid to the accountant for services rendered by the accountant to the registrant, the Investment Adviser and the Affiliated Service Providers were:
| | | | | | | | |
| Entity Name | | Current Fiscal Year End | | Previous Fiscal Year End | | | | |
| BlackRock Systematic Multi-Strategy Fund | | $20,600 | | $21,200 |
Additionally, the amounts billed by D&T in connection with services provided to the Affiliated Service Providers of the Fund and of other funds sponsored and advised by BlackRock or its affiliates during the current and previous fiscal years for a service organization review and an accounting research tool subscription were:
| | |
Current Fiscal Year End | | Previous Fiscal Year End |
$2,050,500 | | $2,274,000 |
These amounts represent aggregate fees paid by BlackRock and were not allocated on a per fund basis.
(h) The Committee has considered and determined that the provision ofnon-audit services that were rendered to the Investment Adviser and the Affiliated Service Providers that were notpre-approved pursuant to paragraph (c)(7)(ii) of Rule2-01 of RegulationS-X is compatible with maintaining the principal accountant’s independence.
| Item 5 – | Audit Committee of Listed Registrants – Not Applicable |
(a) The registrant’s Schedule of Investments is included as part of the Report to Stockholders filed under Item 1 of this Form.
(b) Not Applicable due to no such divestments during the semi-annual period covered since the previous FormN-CSR filing.
| Item 7 – | Disclosure of Proxy Voting Policies and Procedures forClosed-End Management Investment Companies – Not Applicable |
| Item 8 – | Portfolio Managers ofClosed-End Management Investment Companies – Not Applicable |
4
| Item 9 – | Purchases of Equity Securities byClosed-End Management Investment Company and Affiliated Purchasers – Not Applicable |
| Item 10 – | Submission of Matters to a Vote of Security Holders – There have been no material changes to these procedures. |
| Item 11 – | Controls and Procedures |
(a) The registrant’s principal executive and principal financial officers, or persons performing similar functions, have concluded that the registrant’s disclosure controls and procedures (as defined in Rule30a-3(c) under the Investment Company Act of 1940, as amended (the “1940 Act”)) are effective as of a date within 90 days of the filing of this report based on the evaluation of these controls and procedures required by Rule30a-3(b) under the 1940 Act and Rule 15d-15(b) under the Securities Exchange Act of 1934, as amended.
(b) There were no changes in the registrant’s internal control over financial reporting (as defined in Rule30a-3(d) under the 1940 Act) that occurred during the period covered by this report that have materially affected, or are reasonably likely to materially affect, the registrant’s internal control over financial reporting.
| Item 12 – | Disclosure of Securities Lending Activities forClosed-End Management Investment Companies – Not Applicable to the registrant. |
| Item 13 – | Exhibits attached hereto |
(a)(1) Code of Ethics – See Item 2
(a)(2) Certifications – Attached hereto
(a)(3) Not Applicable
(a)(4) Not Applicable
(b) Certifications – Attached hereto
5
Pursuant to the requirements of the Securities Exchange Act of 1934 and the Investment Company Act of 1940, the registrant has duly caused this report to be signed on its behalf by the undersigned, thereunto duly authorized.
| | |
| BlackRock Funds IV |
| |
| By: | | /s/ John M. Perlowski |
| | John M. Perlowski |
| | Chief Executive Officer (principal executive officer) of BlackRock Funds IV |
Date: March 6, 2020
Pursuant to the requirements of the Securities Exchange Act of 1934 and the Investment Company Act of 1940, this report has been signed below by the following persons on behalf of the registrant and in the capacities and on the dates indicated.
| | |
| By: | | /s/ John M. Perlowski |
| | John M. Perlowski |
| | Chief Executive Officer (principal executive officer) of BlackRock Funds IV |
Date: March 6, 2020
| | |
| By: | | /s/ Neal J. Andrews |
| | Neal J. Andrews |
| | Chief Financial Officer (principal financial officer) of BlackRock Funds IV |
Date: March 6, 2020
6