UNITED STATES
SECURITIES AND EXCHANGE COMMISSION
Washington, D.C. 20549
FORM N-CSR
CERTIFIED SHAREHOLDER REPORT OF REGISTERED MANAGEMENT INVESTMENT COMPANIES
Investment Company Act file number: 811-23341
| Name of Fund: | | BlackRock Funds IV |
| | | BlackRock Systematic Multi-Strategy Fund |
| Fund Address: | | 100 Bellevue Parkway, Wilmington, DE 19809 |
Name and address of agent for service: John M. Perlowski, Chief Executive Officer, BlackRock Funds IV, 55 East 52nd Street, New York, NY 10055
Registrant’s telephone number, including area code: (800) 441-7762
Date of fiscal year end: 12/31/2020
Date of reporting period: 12/31/2020
Item 1 – Report to Stockholders
(a) The Report to Shareholders is attached herewith.
| | |

| | DECEMBER 31, 2020 |
BlackRock Funds V
· BlackRock Emerging Markets Bond Fund
BlackRock Funds IV
· BlackRock Systematic Multi-Strategy Fund
|
| |
| Not FDIC Insured • May Lose Value • No Bank Guarantee |
The Markets in Review
Dear Shareholder,
The 12-month reporting period as of December 31, 2020 has been a time of sudden change in global financial markets, as the emergence and spread of the coronavirus (or “COVID-19”) led to a vast disruption in the global economy and financial markets. The threat from the coronavirus became increasingly apparent throughout February and March 2020, and countries around the world took economically disruptive countermeasures. Stay-at-home orders and closures of non-essential businesses became widespread, many workers were laid off, and unemployment claims spiked, causing a global recession and a sharp fall in equity prices.
After markets hit their lowest point of the reporting period in late March 2020, a steady recovery ensued, as businesses began to re-open and governments learned to adapt to life with the virus. Equity prices continued to rise throughout the summer, fed by strong fiscal and monetary support and improving economic indicators. Many equity indices neared or surpassed all-time highs late in the reporting period following a series of successful vaccine trials and passage of additional stimulus. In the United States, both large- and small-capitalization stocks posted a significant advance. International equities from developed economies grew at a more modest pace, lagging emerging market stocks, which rebounded sharply.
During the market downturn, the performance of different types of fixed-income securities initially diverged due to a reduced investor appetite for risk. U.S. Treasuries benefited from the risk-off environment, and posted solid returns, as the 10-year U.S. Treasury yield (which is inversely related to bond prices) touched an all-time low. In the corporate bond market, support from the U.S. Federal Reserve (the “Fed”) assuaged credit concerns and both investment-grade and high-yield bonds recovered to post positive returns.
Following the coronavirus outbreak, the Fed instituted two emergency interest rate cuts, pushing short-term interest rates, already low as the year began, close to zero. To stabilize credit markets, the Fed also implemented a new bond-buying program, as did several other central banks around the world, including the European Central Bank and the Bank of Japan.
Looking ahead, while coronavirus-related disruptions have clearly hindered worldwide economic growth, we believe that the global expansion is likely to accelerate as vaccination efforts get under way. The results of the U.S. elections also cleared the way for additional stimulus spending in 2021, which is likely to be a solid tailwind for economic growth. Inflation should increase as the expansion continues, but a shift in central bank policy means that moderate inflation is less likely to be followed by interest rate hikes that could threaten the equity expansion.
Overall, we favor a positive stance toward risk, with an overweight in both equities and credit. We see U.S. and Asian equities benefiting from structural growth trends in tech, while emerging markets should be particularly helped by a vaccine-led economic expansion. In credit, rising inflation should provide tailwinds for inflation-protected bonds, and Euro area peripherals and Asian bonds also provide attractive opportunities. We believe that international diversification and a focus on sustainability can help provide portfolio resilience, and the disruption created by the coronavirus appears to be accelerating the shift toward sustainable investments.
In this environment, our view is that investors need to think globally, extend their scope across a broad array of asset classes, and be nimble as market conditions change. We encourage you to talk with your financial advisor and visit blackrock.com for further insight about investing in today’s markets.
Sincerely,

Rob Kapito
President, BlackRock Advisors, LLC

Rob Kapito
President, BlackRock Advisors, LLC
Total Returns as of December 31, 2020
| | | | |
| | | 6-Month | | 12-Month |
U.S. large cap equities (S&P 500® Index) | | 22.16% | | 18.40% |
U.S. small cap equities (Russell 2000® Index) | | 37.85 | | 19.96 |
International equities (MSCI Europe, Australasia, Far East Index) | | 21.61 | | 7.82 |
Emerging market equities (MSCI Emerging Markets Index) | | 31.14 | | 18.31 |
3-month Treasury bills (ICE BofA 3-Month U.S. Treasury Bill Index) | | 0.07 | | 0.67 |
U.S. Treasury securities (ICE BofA 10-Year U.S. Treasury Index) | | (1.87) | | 10.58 |
U.S. investment grade bonds (Bloomberg Barclays U.S. Aggregate Bond Index) | | 1.29 | | 7.51 |
Tax-exempt municipal bonds (S&P Municipal Bond Index) | | 2.92 | | 4.95 |
| U.S. high yield bonds (Bloomberg Barclays U.S. Corporate High Yield 2% Issuer Capped Index) | | 11.32 | | 7.05 |
Past performance is not an indication of future results. Index performance is shown for illustrative purposes only. You cannot invest directly in an index.
| | |
| 2 | | THIS PAGE IS NOT PART OF YOUR FUND REPORT |
Table of Contents

| | |
| Fund Summary as of December 31, 2020 | | BlackRock Emerging Markets Bond Fund |
Investment Objective
BlackRock Emerging Markets Bond Fund’s (the “Fund”) investment objective is to seek total return.
Portfolio Management Commentary
How did the Fund perform?
For the 12-month period ended December 31, 2020, the Fund outperformed its benchmark, the J.P. Morgan Emerging Markets Bond Index (EMBI) Global Diversified Index.
What factors influenced performance?
Emerging market bonds performed well in 2020. After suffering a large sell-off in the first quarter of 2020 due to the emergence of COVID-19, the asset class recovered over the remainder of the year. Emerging market debt benefited from aggressive monetary and fiscal stimulus from world governments, together with the rapid economic rebound in China and other Asian nations. Later in the year, the approval of a vaccine for COVID-19 provided an additional tailwind and helped the index finish December 2020 near its pre-virus high.
Despite this challenging backdrop, the Fund outpaced its benchmark in 2020. The portfolio was positioned to capitalize on the market’s recovery in the second half of the period through overweight positions in higher-yielding countries such as Mexico, Ukraine and Egypt. Separately, a position in quasi-sovereign corporate issues made a sizable contribution. Holdings in select emerging market currencies and tactical overweights in oil-related countries, such as Angola and Nigeria, further aided results.
An overweight position in Venezuela, which was negatively affected by U.S. sanctions and lower oil prices, was the largest detractor. An overweight in Argentina also weighed on performance, as did underweights in countries that outperformed in the second-half rally, including Turkey, Saudi Arabia and the Philippines.
Describe recent portfolio activity.
During the first quarter of 2020, the investment adviser anticipated a global growth slowdown as the coronavirus developed into a pandemic. The Fund quickly adopted a defensive stance by removing its small positions in emerging market currencies, lengthening duration and employing strategies to manage the risk of widening yield spreads. (Duration is a measure of interest rate sensitivity.) The investment adviser also decreased the portfolio’s allocation to the high yield category through reductions in Ecuador, Nigeria, Turkey and Egypt. The Fund subsequently added to its weighting in oil-related issues, including Bahrain and Qatar, at attractive valuations that emerged in the wake of the sell-off.
During the second half of the reporting period, the Fund marginally rotated its exposure among high-yield countries in favor of those with greater visibility with respect to fundamentals. The Fund also added to Sub-Saharan Africa, including Angola, while partially reducing its weighting in Argentina and Ecuador. Later in the period, the investment adviser increased cash to prepare for new issuance and have the flexibility to capitalize on any volatility resulting from headline risk.
Describe portfolio positioning at period end.
Ukraine, Egypt and Mexico were the Fund’s largest overweights, while Philippines, Saudi Arabia and Malaysia were its most significant underweights. The Fund’s beta (risk profile) was higher than the benchmark, and its duration was approximately 1.35 years below the index. The investment adviser continues to emphasize careful selection given the varying impact COVID-19 is having on different countries.
The views expressed reflect the opinions of BlackRock as of the date of this report and are subject to change based on changes in market, economic or other conditions. These views are not intended to be a forecast of future events and are no guarantee of future results.
TOTAL RETURN BASED ON A $10,000 INVESTMENT
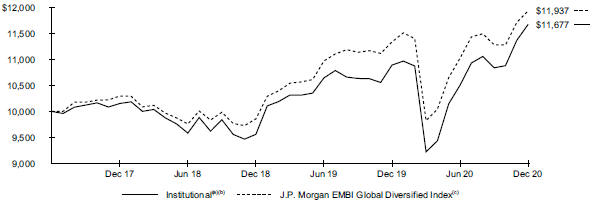
| | The | Fund commenced operations on July 27, 2017. | |
| | (a) | Assuming transaction costs and other operating expenses, including investment advisory fees. | |
| | (b) | The Fund invests primarily in a portfolio of fixed-income securities of issuers located in or tied economically to emerging market countries that are predominantly denominated in U.S. dollars and derivatives with similar economic characteristics. On September 17, 2018, the Fund acquired all of the assets, subject to the liabilities, of BlackRock Emerging Markets Bond Fund (the “Predecessor Fund”), a series of BlackRock Funds II, through a tax-free reorganization (the “Reorganization”). The Predecessor Fund is the performance and accounting survivor of the Reorganization. | |
| | |
| 4 | | 2 0 2 0 BLACK ROCK ANNUAL REPORT TO SHAREHOLDERS |
| | |
| Fund Summary as of December 31, 2020 (continued) | | BlackRock Emerging Markets Bond Fund |
| | (c) | An unmanaged index that tracks total returns for U.S. dollar denominated debt instruments issued by emerging market sovereign and quasi-sovereign entities, including Brady bonds, loans and Eurobonds. | |
Performance Summary for the Period Ended December 31, 2020
| | | | | | | | | | | | | | | | | | | | |
| | | | | | | | | | | | Average Annual Total Returns(a)(b) | |
| | |
| Standardized
30-Day Yields |
| |
| Unsubsidized
30-Day Yields |
| |
| 6-Month
Total Returns |
| | | 1 Year | | |
| Since
Inception |
(c) |
Institutional | | | 3.56 | % | | | 2.47 | % | | | 11.14 | % | | | 7.20 | % | | | 4.62 | % |
Class K | | | 3.69 | | | | 2.66 | | | | 11.07 | | | | 7.18 | | | | 4.67 | |
J.P. Morgan EMBI Global Diversified Index | | | — | | | | — | | | | 8.25 | | | | 5.26 | | | | 5.30 | |
| | (a) | See “About Fund Performance” for a detailed description of share classes, including any related fees. | |
| | (b) | On September 17, 2018, the Fund acquired all of the assets, subject to the liabilities, of BlackRock Emerging Markets Bond Fund (the “Predecessor Fund”), a series of BlackRock Funds II, through a tax-free reorganization (the “Reorganization”). The Predecessor Fund is the performance and accounting survivor of the Reorganization. | |
| | (c) | The Fund commenced operations on July 27, 2017. | |
Past performance is not an indication of future results.
Performance results may include adjustments made for financial reporting purposes in accordance with U.S. generally accepted accounting principles.
Expense Example
| | | | | | | | | | | | | | | | | | | | | | | | | | | | | | | | |
| | | Actual | | | | | | Hypothetical(a) | | | | |
| | |
| Beginning
Account Value
(07/01/20) |
| |
| Ending
Account Value
(12/31/20) |
| |
| Expenses
Paid During
the Period |
(b) | | | | | |
| Beginning
Account Value
(07/01/20) |
| |
| Ending
Account Value
(12/31/20) |
| |
| Expenses
Paid During
the Period |
(b) | |
| Annualized
Expense Ratio |
|
Institutional | | $ | 1,000.00 | | | $ | 1,111.40 | | | $ | 3.61 | | | | | | | $ | 1,000.00 | | | $ | 1,021.72 | | | $ | 3.46 | | | | 0.68 | % |
Class K | | | 1,000.00 | | | | 1,110.70 | | | | 3.13 | | | | | | | | 1,000.00 | | | | 1,022.17 | | | | 3.00 | | | | 0.59 | |
| | (a) | Hypothetical 5% annual return before expenses is calculated by prorating the number of days in the most recent fiscal half year divided by 366. | |
| | (b) | For each class of the Fund, expenses are equal to the annualized expense ratio for the class, multiplied by the average account value over the period, multiplied by 184/366 (to reflect the six-month period shown). | |
See “Disclosure of Expenses” for further information on how expenses were calculated.
Portfolio Information
PORTFOLIO ALLOCATION
| | | | |
| Asset Type(a) | | Percent of Total Investments | |
Foreign Agency Obligations | | | 85 | % |
Corporate Bonds | | | 15 | |
CREDIT QUALITY ALLOCATION
| | | | |
| Credit Rating(a)(b) | | Percent of Total Investments | |
AA/Aa | | | 4 | % |
A | | | 12 | |
BBB/Baa | | | 27 | |
BB/Ba | | | 17 | |
B | | | 34 | |
CCC/Caa | | | 6 | |
C(c) | | | — | |
N/R(c) | | | — | |
| (a) | Excludes short-term securities. |
| (b) | For financial reporting purposes, credit quality ratings shown above reflect the highest rating assigned by either S&P Global Ratings or Moody’s Investors Service, Inc. if ratings differ. These rating agencies are independent, nationally recognized statistical rating organizations and are widely used. Investment grade ratings are credit ratings of BBB/Baa or higher. Below investment grade ratings are credit ratings of BB/Ba or lower. Investments designated N/R are not rated by either rating agency. Unrated investments do not necessarily indicate low credit quality. Credit quality ratings are subject to change. |
| (c) | Rounds to less than 1% of long-term investments. |
| | |
| Fund Summary as of December 31, 2020 | | BlackRock Systematic Multi-Strategy Fund |
Investment Objective
BlackRock Systematic Multi-Strategy Fund’s (the “Fund”) investment objective is to seek total return comprised of current income and capital appreciation.
Portfolio Management Commentary
How did the Fund perform?
For the 12-month period ended December 31, 2020, the Fund outperformed the benchmark ICE BofA 3-Month U.S. Treasury Bill Index, but underperformed its other benchmark, the Bloomberg Barclays U.S. Aggregate Bond Index.
Fund Strategies
Core allocation across fixed-income and equity markets to balance interest rate and credit exposures. Strategies in the core portfolio may include mortgages, duration and curve, investment grade corporates, emerging markets, securitized credit, dividend equities and high yield.
Long/short alpha strategies seek equity securities and equity derivatives, primarily total return swaps, within a global opportunity set. These strategies seek to identify opportunities through a systematic approach by evaluating predicted returns relative to risk for each security. These strategies seek to provide an uncorrelated source of defensive returns.
Long/short macro strategies seek to capture returns through tactical trades to fixed income and equity markets. These strategies seek to tactically allocate and time directional exposures across several asset classes, such as credit default swaps, U.S. Treasures, U.K. Gilts and index futures.
What factors influenced performance?
The largest contributor to the Fund’s relative performance was the Directional Asset Allocation (“DAA”) strategy. The DAA strategy’s outperformance was driven by its exposure to mortgage-backed securities, as well as investment grade, high yield, and securitized credit. Rate exposure within this strategy also contributed, as rates rallied throughout the period. The strategy was successful in providing upside participation during the period. The macro strategy also contributed slightly to Fund returns.
In contrast, the defensive equity long/short strategy detracted slightly from relative performance. This strategy fulfilled its role in providing ballast to the Fund during the market downturn in the first quarter of 2020, as it tends to perform best in down markets, as increased equity market dispersion leads investors to focus more on credit fundamentals and balance sheet metrics. However, the risk-on market rally during the final nine months of 2020 did not provide the best environment for the strategy, as investors grew optimistic over global economic reopening, COVID-19 vaccine efficacy, and fiscal and monetary support.
Describe recent portfolio activity.
The Fund continued to apply its systematic investment approach, which combines asset allocation, defensive equity long/short alpha, and macro strategies across diversified asset classes. The Fund seeks to provide diversified alpha sources for balanced, consistent returns over time through various market conditions.
The Fund largely achieved its objective of upside participation and downside protection. The DAA’s regime indicator signaled elevated valuations and prompted a defensive positioning for the Fund coming into the period, which provided protection during the first quarter selloff. The Fund also participated in the upside from the ensuing market rally, as the regime indicator moved into an expansion phase. As economic data firmed and trended more positively, the Fund increased exposure to spread assets such as investment grade credit, dividend equities, and high yield.
The Fund held derivatives during the period as a part of its investment strategy. Derivatives are used by the investment adviser to obtain exposure to and/or take outright views on interest rates. Standalone performance impact from derivatives used to manage risk can be taken out of context and may not necessarily portray the total performance impact of the affected position. The Fund’s use of derivatives had a negative impact on performance for the period.
The Fund continued to use leveraged strategies, which involve holding cash in order to back investments in to-be-announced mortgage derivative securities. Despite having a reported cash position exceeding 5%, the Fund’s investable cash position is negative due to unsettled forward transactions on derivatives, which had a positive impact on performance during the period.
Describe portfolio positioning at period end.
The Fund remained diversified across fixed-income sectors within the DAA strategy in order to participate in potential market upside while maintaining protection against future selloffs. The DAA strategy was in its expansion phase and strategically increased risk to spread assets accordingly. The macro and defensive equity strategies continued to provide ballast and uncorrelated returns, helping the Fund provide strong risk-adjusted returns across market environments as equity market dispersion remained elevated and could increase in the future.
The views expressed reflect the opinions of BlackRock as of the date of this report and are subject to change based on changes in market, economic or other conditions. These views are not intended to be a forecast of future events and are no guarantee of future results.
| | |
| 6 | | 2 0 2 0 BLACK ROCK ANNUAL REPORT TO SHAREHOLDERS |
| | |
| Fund Summary as of December 31, 2020 (continued) | | BlackRock Systematic Multi-Strategy Fund |
TOTAL RETURN BASED ON A $10,000 INVESTMENT
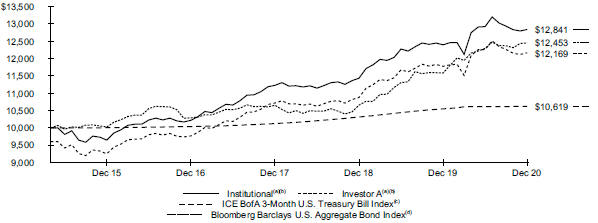
The Fund commenced operations on May 19, 2015.
| | (a) | Assuming maximum sales charges, if any, transaction costs and other operating expenses, including investment advisory fees. Institutional Shares do not have a sales charge. | |
| | (b) | The Fund invests in a range of global asset classes, with a focus on fixed and floating rate debt securities and equity securities. On September 17, 2018, the Fund acquired all of the assets, subject to the liabilities, of BlackRock Alternative Capital Strategies Fund (the “Predecessor Fund”), a series of BlackRock FundsSM, through a tax-free reorganization (the “Board Reorganization”). The Predecessor Fund is the performance and accounting survivor of the Board Reorganization. | |
| | (c) | ICE BofA 3-Month U.S. Treasury Bill Index is an unmanaged index that tracks 3-month U.S. Treasury securities. | |
| | (d) | A broad-based flagship benchmark that measures the investment grade, U.S. dollar-denominated, fixed-rate taxable bond market. | |
Performance Summary for the Period Ended December 31, 2020
| | | | | | | | | | | | | | | | | | | | | | | | | | | | | | | | | | | | | | | | |
| | | | | | | | | Average Annual Total Returns(a)(b) | |
| | | | | | | | | 1 Year | | | | | | 5 Years | | | | | | Since Inception(c) | |
| | | 6-Month
Total
Returns | | | | | | Without
Sales
Charge | | | With
Sales
Charge | | | | | | Without
Sales
Charge | | | With
Sales
Charge | | | | | | Without
Sales
Charge | | | With
Sales
Charge | |
Institutional | | | (0.64 | )% | | | | | | | 3.57 | % | | | N/A | | | | | | | | 5.89 | % | | | N/A | | | | | | | | 4.55 | % | | | N/A | |
Investor A | | | (0.71 | ) | | | | | | | 3.34 | | | | (0.79 | )% | | | | | | | 5.64 | | | | 4.78 | % | | | | | | | 4.31 | | | | 3.55 | % |
Investor C | | | (1.19 | ) | | | | | | | 2.55 | | | | 1.55 | | | | | | | | 4.84 | | | | 4.84 | | | | | | | | 3.50 | | | | 3.50 | |
Class K | | | (0.62 | ) | | | | | | | 3.59 | | | | N/A | | | | | | | | 5.89 | | | | N/A | | | | | | | | 4.55 | | | | N/A | |
ICE BofA 3-Month U.S. Treasury Bill Index | | | 0.07 | | | | | | | | 0.67 | | | | N/A | | | | | | | | 1.20 | | | | N/A | | | | | | | | 1.08 | | | | N/A | |
Bloomberg Barclays U.S. Aggregate Bond Index | | | 1.29 | | | | | | | | 7.51 | | | | N/A | | | | | | | | 4.44 | | | | N/A | | | | | | | | 3.99 | | | | N/A | |
| | (a) | Assuming maximum sales charges, if any. Average annual total returns with and without sales charges reflect reductions for distribution and service fees. See “About Fund Performance” for a detailed description of share classes, including any related sales charges and fees, and how performance was calculated for certain share classes. | |
| | (b) | On September 17, 2018, the Fund acquired all of the assets, subject to the liabilities, of BlackRock Alternative Capital Strategies Fund (the “Predecessor Fund”), a series of BlackRock FundsSM, through a tax-free reorganization (the “Board Reorganization”). The Predecessor Fund is the performance and accounting survivor of the Board Reorganization. | |
| | (c) | The Fund commenced operations on May 19, 2015. | |
N/A — Not applicable as the share class and index do not have a sales charge.
Past performance is not an indication of future results.
Performance results may include adjustments made for financial reporting purposes in accordance with U.S. generally accepted accounting principles.
Expense Example
| | | | | | | | | | | | | | | | | | | | | | | | | | | | | | | | |
| | | Actual | | | | | | Hypothetical(a) | | | | |
| | |
| Beginning
Account Value
(07/01/20) |
| |
| Ending
Account Value
(12/31/20) |
| |
| Expenses
Paid During the Period |
(b) | | | | | |
| Beginning
Account Value
(07/01/20) |
| |
| Ending
Account Value
(12/31/20) |
| |
| Expenses
Paid During the Period |
(b) | |
| Annualized
Expense
Ratio |
|
Institutional | | $ | 1,000.00 | | | $ | 993.60 | | | $ | 4.76 | | | | | | | $ | 1,000.00 | | | $ | 1,020.36 | | | $ | 4.82 | | | | 0.95 | % |
Investor A | | | 1,000.00 | | | | 992.90 | | | | 6.01 | | | | | | | | 1,000.00 | | | | 1,019.10 | | | | 6.09 | | | | 1.20 | |
Investor C | | | 1,000.00 | | | | 988.10 | | | | 9.74 | | | | | | | | 1,000.00 | | | | 1,015.33 | | | | 9.88 | | | | 1.95 | |
Class K(c) | | | 1,000.00 | | | | 993.80 | | | | 2.30 | | | | | | | | 1,000.00 | | | | 1,010.53 | | | | 2.32 | | | | 0.90 | |
| | (a) | Hypothetical 5% annual return before expenses is calculated by prorating the number of days in the most recent fiscal half year divided by 366. | |
| | (b) | For each class of the Fund, expenses are equal to the annualized expense ratio for the class, multiplied by the average account value over the period, multiplied by 184/366 (to reflect the six-month period shown). | |
| | |
| Fund Summary as of December 31, 2020 (continued) | | BlackRock Systematic Multi-Strategy Fund |
Expense Example (continued)
| | (c) | For Class K of the Fund, expenses are equal to the annualized expense ratio for the class, multiplied by the average account value over the period, multiplied by 94/366 (to reflect the period since inception date of September 29, 2020). | |
See “Disclosure of Expenses” for further information on how expenses were calculated.
Portfolio Information
PORTFOLIO COMPOSITION
| | | | |
| Asset Type(a) | | Percent of
Net Assets | |
U.S. Government Sponsored Agency Securities | | | 54 | % |
Corporate Bonds | | | 42 | |
Money Market Funds | | | 9 | |
Common Stocks | | | 8 | |
Non-Agency Mortgage-Backed Securities | | | 7 | |
Investment Companies | | | 5 | |
Asset-Backed Securities | | | 4 | |
U.S. Treasury Obligations | | | 1 | |
Capital Trusts | | | — | (b) |
Warrants | | | — | (b) |
TBA Sale Commitments | | | (3 | ) |
Liabilities in Excess of Other Assets | | | (27 | ) |
INDUSTRY ALLOCATION
| | | | | | | | | | | | |
| | |
| Percent of
Total Investments(c) |
|
| Industry | | Long | | | Short | | | Total | |
Consumer Discretionary | | | 7 | % | | | 4 | % | | | 11 | % |
Financials | | | 9 | | | | 2 | | | | 11 | |
Industrials | | | 5 | | | | 3 | | | | 8 | |
Health Care | | | 4 | | | | 2 | | | | 6 | |
Communication Services | | | 3 | | | | 2 | | | | 5 | |
Energy | | | 3 | | | | 2 | | | | 5 | |
Information Technology | | | 4 | | | | 2 | | | | 6 | |
Materials | | | 3 | | | | 1 | | | | 4 | |
Consumer Staples | | | 3 | | | | 1 | | | | 4 | |
Utilities | | | 3 | | | | 1 | | | | 4 | |
Real Estate | | | 1 | | | | 1 | | | | 2 | |
Other(d) | | | 34 | | | | — | | | | 34 | |
| | | 79 | % | | | 21 | % | | | 100 | % |
| | | | | | | | | | | | |
| (a) | Excludes underlying investment in total return swaps. |
| (b) | Rounds to less than 1% of net assets. |
| (c) | Total investments include the gross values of long and short equity securities of the underlying derivative contracts utilized by the Fund and exclude short-term securities and TBA sale commitments. |
| (d) | Consist of Asset-Backed Securities (2%), Investment Companies (2%), Non-Agency Mortgaged-Backed Securities (3%), U.S. Government Sponsored Agency Obligations (26%) and U.S Treasury Obligations (1%). |
| | |
| 8 | | 2 0 2 0 BLACK ROCK ANNUAL REPORT TO SHAREHOLDERS |
About Fund Performance
Institutional Shares and Class K Shares are not subject to any sales charge. These shares bear no ongoing distribution or service fees and are available only to certain eligible investors. BlackRock Systematic Multi-Strategy Fund’s Class K Shares performance shown prior to the Class K Shares inception date of September 29, 2020 is that of Institutional Shares. The performance of BlackRock Systematic Multi-Strategy Fund’s Class K Shares would be substantially similar to Institutional Shares because Class K Shares and Institutional Shares invest in the same portfolio of securities and performance would only differ to the extent that Class K Shares and Institutional Shares have different expenses. The actual returns of Class K Shares for BlackRock Systematic Multi-Strategy Fund would have been higher than those of the Institutional Shares because Class K Shares have lower expenses than the Institutional Shares.
Investor A Shares (available only in BlackRock Systematic Multi-Strategy Fund) are subject to a maximum initial sales charge (front-end load) of 4.00% and a service fee of 0.25% per year (but no distribution fee). Certain redemptions of these shares may be subject to a contingent deferred sales charge (“CDSC”) where no initial sales charge was paid at the time of purchase. These shares are generally available through financial intermediaries.
Investor C Shares (available only in BlackRock Systematic Multi-Strategy Fund) are subject to a 1.00% CDSC if redeemed within one year of purchase. In addition, these shares are subject to a distribution fee of 0.75% per year and a service fee of 0.25% per year. These shares are generally available through financial intermediaries. These shares automatically convert to Investor A Shares after approximately eight years.
Past performance is not an indication of future results. Financial markets have experienced extreme volatility and trading in many instruments has been disrupted. These circumstances may continue for an extended period of time, and may continue to affect adversely the value and liquidity of the fund’s investments. As a result, current performance may be lower or higher than the performance data quoted. Refer to blackrock.com to obtain performance data current to the most recent month-end. Performance results do not reflect the deduction of taxes that a shareholder would pay on Fund distributions or the redemption of Fund shares. Figures shown in the performance tables on the previous pages assume reinvestment of all distributions, if any, at net asset value (“NAV”) on the ex-dividend date or payable date, as applicable. Investment return and principal value of shares will fluctuate so that shares, when redeemed, may be worth more or less than their original cost. Distributions paid to each class of shares will vary because of the different levels of service, distribution and transfer agency fees applicable to each class, which are deducted from the income available to be paid to shareholders.
BlackRock Advisors, LLC (the “Manager”), each Fund’s investment adviser, has contractually and/or voluntarily agreed to waive and/or reimburse a portion of each Fund’s expenses. Without such waivers and/or reimbursements, each Fund’s performance would have been lower. With respect to each Fund’s voluntary waiver(s), if any, the Manager is under no obligation to waive and/or reimburse or to continue waiving and/or reimbursing its fees and such voluntary waiver(s) may be reduced or discontinued at any time. With respect to each Fund’s contractual waiver(s), if any, the Manager is under no obligation to continue waiving and/or reimbursing its fees after the applicable termination date of such agreement. See the Notes to Financial Statements for additional information on waivers and/or reimbursements.
The standardized 30-day yield includes the effects of any waivers and/or reimbursements. The unsubsidized 30-day yield excludes the effects of any waivers and/or reimbursements.
Disclosure of Expenses
Shareholders of each Fund may incur the following charges: (a) transactional expenses, such as sales charges; and (b) operating expenses, including investment advisory fees, service and distribution fees, 12b-1 fees, acquired fund fees and expenses, and other fund expenses. The expense examples shown (which are based on a hypothetical investment of $1,000 invested on July 1, 2020 and held through December 31, 2020, except with respect to BlackRock Systematic Multi-Strategy Fund’s Class K Shares which are based on a hypothetical investment of $1,000 on September 29, 2020 (commencement of operations) and held through December 31, 2020) are intended to assist shareholders both in calculating expenses based on an investment in each Fund and in comparing these expenses with similar costs of investing in other mutual funds.
The expense examples provide information about actual account values and actual expenses. In order to estimate the expenses a shareholder paid during the period covered by this report, shareholders can divide their account value by $1,000 and then multiply the result by the number corresponding to their Fund and share class under the heading entitled “Expenses Paid During the Period.”
The expense examples also provide information about hypothetical account values and hypothetical expenses based on a Fund’s actual expense ratio and an assumed rate of return of 5% per year before expenses. In order to assist shareholders in comparing the ongoing expenses of investing in these Funds and other funds, compare the 5% hypothetical examples with the 5% hypothetical examples that appear in shareholder reports of other funds.
The expenses shown in the expense examples are intended to highlight shareholders’ ongoing costs only and do not reflect transactional expenses, such as sales charges, if any. Therefore, the hypothetical examples are useful in comparing ongoing expenses only, and will not help shareholders determine the relative total expenses of owning different funds. If these transactional expenses were included, shareholder expenses would have been higher.
Derivative Financial Instruments
The Funds may invest in various derivative financial instruments. These instruments are used to obtain exposure to a security, commodity, index, market, and/or other assets without owning or taking physical custody of securities, commodities and/or other referenced assets or to manage market, equity, credit, interest rate, foreign currency exchange rate, commodity and/or other risks. Derivative financial instruments may give rise to a form of economic leverage and involve risks, including the imperfect correlation between the value of a derivative financial instrument and the underlying asset, possible default of the counterparty to the transaction or illiquidity of the instrument. The Funds’ successful use of a derivative financial instrument depends on the investment adviser’s ability to predict pertinent market movements accurately, which cannot be
| | |
ABOUT FUND PERFORMANCE / DISCLOSURE OF EXPENSES / DERIVATIVE FINANCIAL INSTRUMENTS | | 9 |
| | |
| Derivative Financial Instruments (continued) | | |
assured. The use of these instruments may result in losses greater than if they had not been used, may limit the amount of appreciation a Fund can realize on an investment and/or may result in lower distributions paid to shareholders. The Funds’ investments in these instruments, if any, are discussed in detail in the Notes to Financial Statements.
| | |
| 10 | | 2 0 2 0 BLACK ROCK ANNUAL REPORT TO SHAREHOLDERS |
| | |
Schedule of Investments December 31, 2020 | | BlackRock Emerging Markets Bond Fund (Percentages shown are based on Net Assets) |
| | | | | | | | |
| Security | | Par
(000) | | | Value | |
| | |
| Corporate Bonds | | | | | | |
| | |
| Azerbaijan — 1.1% | | | | | | |
Southern Gas Corridor CJSC, 6.88%, 03/24/26 | | | USD 224 | | | $ | 269,920 | |
| | | | | | | | |
| | |
| Brazil — 0.5% | | | | | | |
Suzano Austria GmbH, 3.75%, 01/15/31 | | | 105 | | | | 111,300 | |
| | | | | | | | |
| | |
| Chile — 0.9% | | | | | | |
Corp. Nacional del Cobre de Chile,
3.00%, 09/30/29 | | | 200 | | | | 216,687 | |
| | | | | | | | |
| | |
| China — 2.0% | | | | | | |
CNAC HK Finbridge Co. Ltd.,
4.63%, 03/14/23 | | | 200 | | | | 206,813 | |
Sinopec Group Overseas Development Ltd., 2.75%, 09/29/26 | | | 263 | | | | 279,355 | |
| | | | | | | | |
| | | | | | | 486,168 | |
| | |
| Kazakhstan — 1.2% | | | | | | |
KazMunayGas National Co. JSC, 6.38%, 10/24/48 | | | 200 | | | | 288,062 | |
| | | | | | | | |
| | |
| Malaysia — 1.8% | | | | | | |
Petronas Capital Ltd. | | | | | | | | |
3.50%, 03/18/25 | | | 200 | | | | 221,625 | |
3.50%, 04/21/30 | | | 200 | | | | 230,453 | |
| | | | | | | | |
| | | | | | | 452,078 | |
| | |
| Mexico — 3.7% | | | | | | |
Petroleos Mexicanos | | | | | | | | |
4.50%, 01/23/26 | | | 68 | | | | 67,966 | |
6.50%, 03/13/27 | | | 110 | | | | 116,236 | |
6.84%, 01/23/30 | | | 304 | | | | 316,464 | |
5.63%, 01/23/46 | | | 50 | | | | 42,766 | |
6.75%, 09/21/47 | | | 120 | | | | 112,500 | |
6.35%, 02/12/48 | | | 64 | | | | 57,500 | |
6.95%, 01/28/60 | | | 207 | | | | 194,300 | |
| | | | | | | | |
| | | | | | | 907,732 | |
| | |
| Netherlands — 0.9% | | | | | | |
MDGH - GMTN BV, 2.88%, 05/21/30 | | | 200 | | | | 215,813 | |
| | | | | | | | |
| | |
| Turkey — 0.8% | | | | | | |
Turkiye Vakiflar Bankasi TAO,
6.50%, 01/08/26 | | | 200 | | | | 204,750 | |
| | | | | | | | |
| | |
| United Arab Emirates — 0.9% | | | | | | |
DP World Crescent Ltd., 3.75%, 01/30/30 | | | 200 | | | | 217,500 | |
| | | | | | | | |
| | |
| Venezuela(a)(b) — 0.4% | | | | | | |
Petroleos de Venezuela SA | | | | | | | | |
9.00%, 11/17/21 | | | 435 | | | | 13,931 | |
12.75%, 02/17/22 | | | 441 | | | | 14,128 | |
6.00%, 05/16/24 | | | 945 | | | | 30,238 | |
6.00%, 11/15/26 | | | 213 | | | | 6,917 | |
9.75%, 05/17/35 | | | 746 | | | | 22,376 | |
| | | | | | | | |
| | | | | | | 87,590 | |
| | | | | | | | |
| | |
Total Corporate Bonds — 14.2%
(Cost: $4,051,983) | | | | | | | 3,457,600 | |
| | | | | | | | |
| | |
| Foreign Agency Obligations | | | | | | |
| | |
| Angola — 1.6% | | | | | | |
Angolan Government International Bond | | | | | | | | |
8.25%, 05/09/28 | | | 200 | | | | 191,938 | |
9.38%, 05/08/48 | | | 210 | | | | 198,253 | |
| | | | | | | | |
| | | | | | | 390,191 | |
| | | | | | | | |
| Security | | Par
(000) | | | Value | |
| | |
| Argentina — 1.5% | | | | | | |
Argentine Republic Government International Bond | | | | | | | | |
1.00%, 07/09/29 | | | USD 84 | | | $ | 36,759 | |
0.13%, 07/09/30 | | | 182 | | | | 74,080 | |
0.13%, 07/09/35 | | | 398 | | | | 145,601 | |
0.13%, 01/09/38 | | | 94 | | | | 38,352 | |
0.13%, 07/09/46 | | | 222 | | | | 81,217 | |
| | | | | | | | |
| | | | | | | 376,009 | |
| | |
| Bahrain — 1.8% | | | | | | |
Bahrain Government International Bond | | | | | | | | |
6.75%, 09/20/29 | | | 200 | | | | 229,375 | |
5.63%, 09/30/31 | | | 200 | | | | 211,500 | |
| | | | | | | | |
| | | | | | | 440,875 | |
| | |
| Brazil — 3.7% | | | | | | |
Brazil Notas do Tesouro Nacional, Serie F, 10.00%, 01/01/27 | | | BRL 561 | | | | 127,489 | |
| | | | | | | | |
Brazilian Government International Bond | | | | | | | | |
4.63%, 01/13/28 | | | USD 200 | | | | 224,250 | |
3.88%, 06/12/30 | | | 310 | | | | 327,050 | |
5.00%, 01/27/45 | | | 200 | | | | 222,187 | |
| | | | | | | | |
| | | | | | | 900,976 | |
| | |
| Chile — 1.8% | | | | | | |
Chile Government International Bond,
2.55%, 01/27/32 | | | 400 | | | | 429,500 | |
| | | | | | | | |
| | |
| China — 0.9% | | | | | | |
China Government Bond, 2.64%, 08/13/22 | | | CNY 100 | | | | 15,346 | |
Export-Import Bank of China,
2.63%, 03/14/22 | | | USD 200 | | | | 204,548 | |
| | | | | | | | |
| | | | | | | 219,894 | |
| | |
| Colombia — 3.9% | | | | | | |
Colombia Government International Bond | | | | | | | | |
2.63%, 03/15/23 | | | 200 | | | | 206,938 | |
4.50%, 01/28/26 | | | 200 | | | | 226,812 | |
5.63%, 02/26/44 | | | 400 | | | | 518,625 | |
| | | | | | | | |
| | | | | | | 952,375 | |
| | |
| Costa Rica — 0.8% | | | | | | |
Costa Rica Government International Bond, 7.16%, 03/12/45 | | | 200 | | | | 184,938 | |
| | | | | | | | |
| | |
| Dominican Republic — 2.6% | | | | | | |
Dominican Republic International Bond | | | | | | | | |
4.50%, 01/30/30 | | | 150 | | | | 162,328 | |
6.85%, 01/27/45 | | | 250 | | | | 304,140 | |
6.50%, 02/15/48 | | | 150 | | | | 176,766 | |
| | | | | | | | |
| | | | | | | 643,234 | |
| | |
| Ecuador(c) — 1.2% | | | | | | |
Ecuador Government International Bond | | | | | | | | |
0.50%, 07/31/30 | | | 135 | | | | 86,770 | |
0.50%, 07/31/35 | | | 282 | | | | 152,955 | |
0.50%, 07/31/40 | | | 115 | | | | 58,107 | |
| | | | | | | | |
| | | | | | | 297,832 | |
| | |
| Egypt — 6.4% | | | | | | |
Egypt Government Bond | | | | | | | | |
14.05%, 07/21/22 | | | EGP 2,180 | | | | 139,454 | |
13.56%, 01/14/30 | | | 1,650 | | | | 101,156 | |
14.66%, 10/06/30 | | | 1,680 | | | | 108,242 | |
Egypt Government International Bond | | | | | | | | |
6.13%, 01/31/22 | | | USD 200 | | | | 208,438 | |
5.25%, 10/06/25 | | | 200 | | | | 212,500 | |
7.63%, 05/29/32 | | | 200 | | | | 226,187 | |
| | |
SCHEDULES OF INVESTMENTS | | 11 |
| | |
Schedule of Investments (continued) December 31, 2020 | | BlackRock Emerging Markets Bond Fund (Percentages shown are based on Net Assets) |
| | | | | | | | |
| Security | | Par
(000) | | | Value | |
| | |
| Egypt (continued) | | | | | | |
Egypt Government International Bond (continued) | | | | | |
7.90%, 02/21/48 | | | USD 200 | | | $ | 217,375 | |
8.88%, 05/29/50 | | | 300 | | | | 351,656 | |
| | | | | | | | |
| | | | | | | 1,565,008 | |
| | |
| El Salvador — 1.0% | | | | | | |
El Salvador Government International Bond | | | | | | | | |
5.88%, 01/30/25 | | | 78 | | | | 73,466 | |
6.38%, 01/18/27 | | | 53 | | | | 50,085 | |
7.65%, 06/15/35 | | | 140 | | | | 131,775 | |
| | | | | | | | |
| | | | | | | 255,326 | |
| | |
| Gabon — 1.8% | | | | | | |
Gabon Government International Bond, 6.95%, 06/16/25 | | | 400 | | | | 429,125 | |
| | | | | | | | |
| | |
| Ghana — 3.0% | | | | | | |
Ghana Government International Bond | | | | | | | | |
7.63%, 05/16/29 | | | 405 | | | | 429,427 | |
7.88%, 02/11/35 | | | 200 | | | | 205,375 | |
Republic of Ghana Government Bonds, 20.75%, 01/16/23 . | | | GHS 580 | | | | 101,138 | |
| | | | | | | | |
| | | | | | | 735,940 | |
| | |
| Guatemala — 0.9% | | | | | | |
Guatemala Government Bond, 4.50%, 05/03/26 | | | USD 200 | | | | 221,188 | |
| | | | | | | | |
| | |
| Hungary — 0.3% | | | | | | |
Hungary Government International Bond, 7.63%, 03/29/41 | | | 40 | | | | 70,684 | |
| | | | | | | | |
| | |
| Indonesia — 3.7% | | | | | | |
Indonesia Government International Bond | | | | | | | | |
2.85%, 02/14/30 | | | 600 | | | | 646,875 | |
4.75%, 07/18/47 | | | 200 | | | | 250,187 | |
| | | | | | | | |
| | | | | | | 897,062 | |
| | |
| Ivory Coast — 0.4% | | | | | | |
Ivory Coast Government International Bond, 5.75%, 12/31/32 | | | 91 | | | | 91,899 | |
| | | | | | | | |
| | |
| Jamaica — 1.0% | | | | | | |
Jamaica Government International Bond, 6.75%, 04/28/28 | | | 200 | | | | 243,313 | |
| | | | | | | | |
| | |
| Jordan — 2.0% | | | | | | |
Jordan Government International Bond, 5.85%, 07/07/30 | | | 450 | | | | 496,125 | |
| | | | | | | | |
| | |
| Kenya — 0.9% | | | | | | |
Kenya Government International Bond, 7.25%, 02/28/28 | | | 200 | | | | 224,375 | |
| | | | | | | | |
| | |
| Lebanon(a)(b) — 0.3% | | | | | | |
Lebanon Government International Bond | | | | | | | | |
6.00%, 01/27/23 | | | 60 | | | | 7,200 | |
6.65%, 04/22/24 | | | 150 | | | | 18,000 | |
6.20%, 02/26/25 | | | 140 | | | | 16,800 | |
6.60%, 11/27/26 | | | 130 | | | | 15,600 | |
6.65%, 02/26/30 | | | 80 | | | | 9,600 | |
| | | | | | | | |
| | | | | | | 67,200 | |
| | |
| Mexico — 2.2% | | | | | | |
Mexico Government International Bond | | | | | | | | |
4.75%, 04/27/32 | | | 200 | | | | 240,375 | |
5.00%, 04/27/51 | | | 240 | | | | 299,220 | |
| | | | | | | | |
| | | | | | | 539,595 | |
| | | | | | | | |
| Security | | Par
(000) | | | Value | |
| | |
| Mongolia — 0.9% | | | | | | |
Mongolia Government International Bond, 5.13%, 04/07/26 | | | USD 200 | | | $ | 214,500 | |
| | | | | | | | |
| | |
| Nigeria — 3.6% | | | | | | |
Nigeria Government International Bond | | | | | | | | |
7.63%, 11/21/25 | | | 200 | | | | 229,562 | |
6.50%, 11/28/27 | | | 200 | | | | 215,438 | |
7.14%, 02/23/30 | | | 200 | | | | 215,313 | |
7.88%, 02/16/32 | | | 200 | | | | 220,187 | |
| | | | | | | | |
| | | | | | | 880,500 | |
| | |
| Oman — 3.4% | | | | | | |
Oman Government International Bond | | | | | | | | |
5.63%, 01/17/28 | | | 400 | | | | 407,580 | |
6.00%, 08/01/29 | | | 220 | | | | 226,806 | |
6.50%, 03/08/47 | | | 200 | | | | 195,875 | |
| | | | | | | | |
| | | | | | | 830,261 | |
| | |
| Panama — 2.0% | | | | | | |
Panama Government International Bond | | | | | | | | |
3.88%, 03/17/28 | | | 200 | | | | 229,563 | |
4.50%, 04/01/56 | | | 200 | | | | 258,000 | |
| | | | | | | | |
| | | | | | | 487,563 | |
| | |
| Peru — 1.1% | | | | | | |
Peruvian Government International Bond | | | | | | | | |
5.63%, 11/18/50 | | | 102 | | | | 159,834 | |
3.23%, 07/28/21 | | | 102 | | | | 101,949 | |
| | | | | | | | |
| | | | | | | 261,783 | |
| | |
| Philippines — 1.6% | | | | | | |
Philippine Government International Bond, 3.00%, 02/01/28 | | | 363 | | | | 401,195 | |
| | | | | | | | |
| | |
| Poland — 0.7% | | | | | | |
Republic of Poland Government International Bond, 3.25%, 04/06/26 | | | 150 | | | | 169,063 | |
| | | | | | | | |
| | |
| Qatar — 2.2% | | | | | | |
Qatar Government International Bond | | | | | | | | |
3.75%, 04/16/30 | | | 220 | | | | 258,294 | |
4.82%, 03/14/49 | | | 200 | | | | 272,375 | |
| | | | | | | | |
| | | | | | | 530,669 | |
| | |
| Romania — 1.1% | | | | | | |
Romanian Government International Bond | | | | | | | | |
3.00%, 02/14/31 | | | 126 | | | | 134,859 | |
2.63%, 12/02/40 | | | EUR 100 | | | | 129,953 | |
| | | | | | | | |
| | | | | | | 264,812 | |
| | |
| Russia — 2.1% | | | | | | |
Russian Foreign Bond - Eurobond | | | | | | | | |
4.25%, 06/23/27 | | | USD 200 | | | | 228,500 | |
5.25%, 06/23/47 | | | 200 | | | | 276,000 | |
| | | | | | | | |
| | | | | | | 504,500 | |
| | |
| Saudi Arabia — 2.7% | | | | | | |
Saudi Government International Bond | | | | | | | | |
4.38%, 04/16/29 | | | 200 | | | | 237,000 | |
2.75%, 02/03/32 | | | 400 | | | | 422,000 | |
| | | | | | | | |
| | | | | | | 659,000 | |
| | |
| 12 | | 2 0 2 0 BLACK ROCK ANNUAL REPORT TO SHAREHOLDERS |
| | |
Schedule of Investments (continued) December 31, 2020 | | BlackRock Emerging Markets Bond Fund (Percentages shown are based on Net Assets) |
| | | | | | | | |
| Security | | Par
(000) | | | Value | |
|
| Senegal — 1.4% | |
Senegal Government International Bond, 6.25%, 05/23/33. | | | USD 300 | | | $ | 336,375 | |
| | | | | | | | |
|
| South Africa — 2.6% | |
Republic of South Africa Government International Bond | | | | | | | | |
4.30%, 10/12/28 | | | 400 | | | | 416,000 | |
5.88%, 06/22/30 | | | 200 | | | | 226,063 | |
| | | | | | | | |
| | | | | | | 642,063 | |
|
| Sri Lanka — 0.9% | |
Sri Lanka Government International Bond | | | | | | | | |
6.13%, 06/03/25 | | | 200 | | | | 118,250 | |
6.20%, 05/11/27 | | | 200 | | | | 113,063 | |
| | | | | | | | |
| | | | | | | 231,313 | |
|
| Turkey — 1.9% | |
Turkey Government International Bond | | | | | | | | |
5.95%, 01/15/31 | | | 260 | | | | 271,050 | |
5.75%, 05/11/47 | | | 200 | | | | 190,000 | |
| | | | | | | | |
| | | | | | | 461,050 | |
|
| Ukraine — 5.7% | |
Ukraine Government International Bond | | | | | | | | |
7.75%, 09/01/24 | | | 100 | | | | 110,906 | |
7.75%, 09/01/25 | | | 430 | | | | 480,659 | |
7.75%, 09/01/27 | | | 200 | | | | 227,000 | |
7.25%, 03/15/33 | | | 200 | | | | 218,000 | |
0.00%, 05/31/40(d) | | | 359 | | | | 368,985 | |
| | | | | | | | |
| | | | | | | 1,405,550 | |
|
| United Arab Emirates — 1.0% | |
Abu Dhabi Government International Bond, 3.88%, 04/16/50 | | | 200 | | | | 242,938 | |
| | | | | | | | |
|
| Uruguay — 1.7% | |
Uruguay Government International Bond | | | | | | | | |
4.38%, 10/27/27 | | | 120 | | | | 141,862 | |
4.13%, 11/20/45 | | | 26 | | | | 32,642 | |
| | | | | | | | |
| Security | | Par
(000) | | | Value | |
|
| Uruguay (continued) | |
Uruguay Government International Bond (continued) | |
5.10%, 06/18/50 | | | USD 160 | | | $ | 223,900 | |
4.98%, 04/20/55 | | | 21 | | | | 28,833 | |
| | | | | | | | |
| | | | | | | 427,237 | |
| | | | | | | | |
| |
Total Foreign Agency Obligations — 80.3%
(Cost: $18,093,632) | | | | 19,623,036 | |
| | | | | | | | |
| |
Total Long-Term Investments — 94.5%
(Cost: $22,145,615) | | | | 23,080,636 | |
| | | | | | | | |
| | |
| | | Shares | | | | |
|
Short-Term Securities | |
|
| Money Market Funds — 4.3% | |
BlackRock Liquidity Funds, T-Fund, Institutional Class, 0.00%(e)(f) | | | 1,056,253 | | | | 1,056,253 | |
| | | | | | | | |
| |
Total Short-Term Securities — 4.3%
(Cost: $1,056,253) | | | | 1,056,253 | |
| | | | | | | | |
| |
Total Investments — 98.8%
(Cost: $23,201,868) | | | | 24,136,889 | |
| |
Other Assets Less Liabilities — 1.2% | | | | 295,893 | |
| | | | | | | | |
| |
Net Assets — 100.0% | | | $ | 24,432,782 | |
| | | | | | | | |
| (a) | Issuer filed for bankruptcy and/or is in default. |
| (b) | Non-income producing security. |
| (c) | Security exempt from registration pursuant to Rule 144A under the Securities Act of 1933, as amended. These securities may be resold in transactions exempt from registration to qualified institutional investors. |
| (d) | Variable rate security. Interest rate resets periodically. The rate shown is the effective interest rate as of period end. Security description also includes the reference rate and spread if published and available. |
| (e) | Affiliate of the Fund. |
| (f) | Annualized 7-day yield as of period end. |
Affiliates
Investments in issuers considered to be affiliate(s) of the Fund during the year ended December 31, 2020 for purposes of Section 2(a)(3) of the Investment Company Act of 1940 (“1940 Act”), as amended, were as follows:
| | | | | | | | | | | | | | | | | | | | | | | | | | | | | | | | | | | | |
| Affiliated Issuer | | Value at
12/31/19 | | | Purchases
at Cost | | | Proceeds
from
Sales | | | Net
Realized
Gain (Loss) | | | Change in
Unrealized
Appreciation
(Depreciation) | | | Value at
12/31/20 | | | Shares
Held at
12/31/20 | | | Income | | | Capital Gain
Distributions
from
Underlying
Funds | |
BlackRock Liquidity Funds, T-Fund, Institutional Class | | $ | 1,259,331 | | | $ | — | | | $ | (203,078 | )(a) | | $ | — | | | $ | — | | | $ | 1,056,253 | | | | 1,056,253 | | | $ | 3,183 | | | $ | — | |
| | | | | | | | | | | | | | | | | | | | | | | | | | | | | | | | | | | | |
| | (a) | Represents net amount purchased (sold). | |
| | |
SCHEDULE OF INVESTMENTS | | 13 |
| | |
Schedule of Investments (continued) December 31, 2020 | | BlackRock Emerging Markets Bond Fund |
Derivative Financial Instruments Outstanding as of Period End
Futures Contracts
| | | | | | | | | | | | | | | | |
| Description | | Number of
Contracts | | | Expiration
Date | | | Notional
Amount (000) | | | Value/
Unrealized
Appreciation
(Depreciation) | |
Short Contracts | | | | | | | | | | | | | | | | |
Euro Bund Futures | | | 5 | | | | 03/08/21 | | | $ | 1,085 | | | $ | (2,461 | ) |
Long U.S. Treasury Bond | | | 8 | | | | 03/22/21 | | | | 1,386 | | | | 10,362 | |
| | | | | | | | | | | | | | | | |
| | | | | | | | | | | | | | $ | 7,901 | |
| | | | | | | | | | | | | | | | |
Forward Foreign Currency Exchange Contracts
| | | | | | | | | | | | | | | | | | | | |
| Currency Purchased | | | Currency Sold | | | Counterparty | | Settlement Date | | | Unrealized Appreciation (Depreciation) | |
| EUR | | | 110,000 | | | USD | | | 133,491 | | | Barclays Bank PLC | | | 01/21/21 | | | $ | 946 | |
| MXN | | | 16,502,334 | | | USD | | | 817,898 | | | Morgan Stanley & Co. International PLC | | | 01/21/21 | | | | 9,853 | |
| ZAR | | | 11,106,929 | | | USD | | | 731,908 | | | Morgan Stanley & Co. International PLC | | | 01/21/21 | | | | 22,107 | |
| TRY | | | 783,942 | | | USD | | | 102,414 | | | Bank of America N.A. | | | 01/29/21 | | | | 2,172 | |
| TRY | | | 808,383 | | | USD | | | 104,739 | | | Bank of America N.A. | | | 01/29/21 | | | | 3,108 | |
| TRY | | | 152,317 | | | USD | | | 19,733 | | | UBS AG | | | 01/29/21 | | | | 587 | |
| TRY | | | 183,958 | | | USD | | | 24,029 | | | UBS AG | | | 01/29/21 | | | | 513 | |
| TRY | | | 997,188 | | | USD | | | 132,445 | | | UBS AG | | | 01/29/21 | | | | 591 | |
| | | | | | | | | | | | | | | | | | | | |
| | | | | | | | | | | | | | | | | | | 39,877 | |
| | | | | | | | | | | | | | | | | | | | |
| BRL | | | 1,794,603 | | | USD | | | 354,918 | | | Goldman Sachs International | | | 01/21/21 | | | | (9,430 | ) |
| RUB | | | 27,104,088 | | | USD | | | 368,969 | | | Barclays Bank PLC | | | 01/21/21 | | | | (2,889 | ) |
| USD | | | 16,787 | | | CNH | | | 110,000 | | | Morgan Stanley & Co. International PLC | | | 01/21/21 | | | | (111 | ) |
| USD | | | 248,745 | | | EUR | | | 205,000 | | | Natwest Markets PLC | | | 01/21/21 | | | | (1,795 | ) |
| USD | | | 24,430 | | | TRY | | | 195,591 | | | Bank of America N.A. | | | 01/29/21 | | | | (1,664 | ) |
| USD | | | 239,759 | | | TRY | | | 1,920,000 | | | Natwest Markets PLC | | | 01/29/21 | | | | (16,389 | ) |
| USD | | | 102,064 | | | TRY | | | 817,309 | | | UBS AG | | | 01/29/21 | | | | (6,974 | ) |
| UAH | | | 1,081,900 | | | USD | | | 37,256 | | | BNP Paribas S.A. | | | 05/11/21 | | | | (121 | ) |
| UAH | | | 1,081,900 | | | USD | | | 37,255 | | | BNP Paribas S.A. | | | 05/11/21 | | | | (121 | ) |
| | | | | | | | | | | | | | | | | | | | |
| | | | | | | | | | | | | | | | | | | (39,494 | ) |
| | | | | | | | | | | | | | | | | | | | |
| | | | | | | | | | | | | | | | | | $ | 383 | |
| | | | | | | | | | | | | | | | | | | | |
OTC Credit Default Swaps — Buy Protection
| | | | | | | | | | | | | | | | | | | | | | | | | | | | | | | | |
| Reference Obligations/Index | | Financing
Rate Paid
by the Fund | | | Payment
Frequency | | | Counterparty | | Termination
Date | | | Notional
Amount (000) | | | Value | | | Upfront
Premium
Paid
(Received) | | | Unrealized
Appreciation
(Depreciation) | |
Republic of Colombia | | | 1.00 | % | | | Quarterly | | | Bank of America N.A. | | | 12/20/25 | | | USD | | | 282 | | | $ | (1,731 | ) | | $ | 5,143 | | | $ | (6,874 | ) |
Republic of Saudi Arabia | | | 1.00 | | | | Quarterly | | | Morgan Stanley & Co. International PLC | | | 12/20/25 | | | USD | | | 288 | | | | (4,757 | ) | | | (695 | ) | | | (4,062 | ) |
Republic of Turkey | | | 1.00 | | | | Quarterly | | | Goldman Sachs International | | | 12/20/25 | | | USD | | | 344 | | | | 31,652 | | | | 60,880 | | | | (29,228 | ) |
| | | | | | | | | | | | | | | | | | | | | | | | | | | | | | | | |
| | | | | | | | | | | | | | | | | | | | | | $ | 25,164 | | | $ | 65,328 | | | $ | (40,164 | ) |
| | | | | | | | | | | | | | | | | | | | | | | | | | | | | | | | |
Balances Reported in the Statements of Assets and Liabilities for OTC Swaps
| | | | | | | | | | | | | | | | |
| Description | | Swap
Premiums
Paid | | | Swap
Premiums
Received | | | Unrealized
Appreciation | | | Unrealized
Depreciation | |
OTC Swaps | | $ | 66,023 | | | $ | (695 | ) | | $ | — | | | $ | (40,164 | ) |
| | |
| 14 | | 2 0 2 0 BLACK ROCK ANNUAL REPORT TO SHAREHOLDERS |
| | |
Schedule of Investments (continued) December 31, 2020 | | BlackRock Emerging Markets Bond Fund |
Derivative Financial Instruments Categorized by Risk Exposure
As of period end, the fair values of derivative financial instruments located in the Statements of Assets and Liabilities were as follows:
| | | | | | | | | | | | | | | | | | | | | | | | | | | | |
| | | Commodity
Contracts | | | Credit
Contracts | | | Equity
Contracts | | | Foreign
Currency
Exchange
Contracts | | | Interest
Rate
Contracts | | | Other
Contracts | | | Total | |
Assets — Derivative Financial Instruments | | | | | | | | | | | | | | | | | | | | | | | | | |
Futures contracts | | | | | | | | | | | | | | | | | | | | | | | | | | | | |
Unrealized appreciation on futures contracts(a) | | $ | — | | | $ | — | | | $ | — | | | $ | — | | | $ | 10,362 | | | $ | — | | | $ | 10,362 | |
Forward foreign currency exchange contracts | | | | | | | | | | | | | | | | | | | | | | | | | | | | |
Unrealized appreciation on forward foreign currency exchange contracts | | | — | | | | — | | | | — | | | | 39,877 | | | | — | | | | — | | | | 39,877 | |
Swaps — OTC | | | | | | | | | | | | | | | | | | | | | | | | | | | | |
Unrealized appreciation on OTC swaps; Swap premiums paid | | | — | | | | 66,023 | | | | — | | | | — | | | | — | | | | — | | | | 66,023 | |
| | | | | | | | | | | | | | | | | | | | | | | | | | | | |
| | $ | — | | | $ | 66,023 | | | $ | — | | | $ | 39,877 | | | $ | 10,362 | | | $ | — | | | $ | 116,262 | |
| | | | | | | | | | | | | | | | | | | | | | | | | | | | |
| | | | | | |
| Liabilities — Derivative Financial Instruments | | | | | | | | | | | | | | | | | | | |
Futures contracts | | | | | | | | | | | | | | | | | | | | | | | | | | | | |
Unrealized depreciation on futures contracts(a) | | $ | — | | | $ | — | | | $ | — | | | $ | — | | | $ | 2,461 | | | $ | — | | | $ | 2,461 | |
Forward foreign currency exchange contracts | | | | | | | | | | | | | | | | | | | | | | | | | | | | |
Unrealized depreciation on forward foreign currency exchange contracts | | | — | | | | — | | | | — | | | | 39,494 | | | | — | | | | — | | | | 39,494 | |
Swaps — OTC | | | | | | | | | | | | | | | | | | | | | | | | | | | | |
Unrealized depreciation on OTC swaps; Swap premiums received | | | — | | | | 40,859 | | | | — | | | | — | | | | — | | | | — | | | | 40,859 | |
| | | | | | | | | | | | | | | | | | | | | | | | | | | | |
| | $ | — | | | $ | 40,859 | | | $ | — | | | $ | 39,494 | | | $ | 2,461 | | | $ | — | | | $ | 82,814 | |
| | | | | | | | | | | | | | | | | | | | | | | | | | | | |
| | (a) | Net cumulative unrealized appreciation (depreciation) on futures contracts and centrally cleared swaps, if any, are reported in the Schedule of Investments. In the Statements of Assets and Liabilities, only current day’s variation margin is reported in receivables or payables and the net cumulative unrealized appreciation (depreciation) is included in accumulated earnings (loss). | |
For the year ended December 31, 2020, the effect of derivative financial instruments in the Statements of Operations was as follows:
| | | | | | | | | | | | | | | | | | | | | | | | | | | | |
| | | Commodity
Contracts | | | Credit
Contracts | | | Equity
Contracts | | | Foreign
Currency
Exchange
Contracts | | | Interest
Rate
Contracts | | | Other
Contracts | | | Total | |
Net Realized Gain (Loss) from | | | | | | | | | | | | | | | | | | | | | | | | | |
Futures contracts | | $ | — | | | $ | — | | | $ | — | | | $ | — | | | $ | (30,750 | ) | | $ | — | | | $ | (30,750 | ) |
Forward foreign currency exchange contracts | | | — | | | | — | | | | — | | | | 273,606 | | | | — | | | | — | | | | 273,606 | |
Options purchased(a) | | | — | | | | — | | | | — | | | | — | | | | (20,562 | ) | | | — | | | | (20,562 | ) |
Swaps | | | — | | | | 60,931 | | | | — | | | | — | | | | — | | | | — | | | | 60,931 | |
| | | | | | | | | | | | | | | | | | | | | | | | | | | | |
| | $ | — | | | $ | 60,931 | | | $ | — | | | $ | 273,606 | | | $ | (51,312 | ) | | $ | — | | | $ | 283,225 | |
| | | | | | | | | | | | | | | | | | | | | | | | | | | | |
Net Change in Unrealized Appreciation (Depreciation) on | | | | | | | | | | | | | | | | | | | | | | | | | |
Futures contracts | | $ | — | | | $ | — | | | $ | — | | | $ | — | | | $ | (25,815 | ) | | $ | — | | | $ | (25,815 | ) |
Forward foreign currency exchange contracts | | | — | | | | — | | | | — | | | | (32,794 | ) | | | — | | | | — | | | | (32,794 | ) |
Swaps | | | — | | | | (10,343 | ) | | | — | | | | — | | | | — | | | | — | | | | (10,343 | ) |
| | | | | | | | | | | | | | | | | | | | | | | | | | | | |
| | $ | — | | | $ | (10,343 | ) | | $ | — | | | $ | (32,794 | ) | | $ | (25,815 | ) | | $ | — | | | $ | (68,952 | ) |
| | | | | | | | | | | | | | | | | | | | | | | | | | | | |
| | (a) | Options purchased are included in net realized gain (loss) from investments — unaffiliated. | |
| | |
SCHEDULE OF INVESTMENTS | | 15 |
| | |
Schedule of Investments (continued) December 31, 2020 | | BlackRock Emerging Markets Bond Fund |
Average Quarterly Balances of Outstanding Derivative Financial Instruments
| | | | |
Futures contracts | | | | |
Average notional value of contracts — long | | $ | — | (a) |
Average notional value of contracts — short | | $ | 1,524,862 | |
Forward foreign currency exchange contracts | | | | |
Average amounts purchased — in USD | | $ | 2,110,273 | |
Average amounts sold — in USD | | $ | 2,663,267 | |
Options | | | | |
Average value of option contracts purchased | | $ | 1,699 | |
Credit default swaps | | | | |
Average notional value — buy protection | | $ | 1,044,213 | |
Average notional value — sell protection | | $ | 196,250 | |
| | (a) | Derivative not held at any quarter-end. The risk exposure table serves as an indicator of activity during the period. | |
For more information about the Fund’s investment risks regarding derivative financial instruments, refer to the Notes to Financial Statements.
Derivative Financial Instruments — Offsetting as of Period End
The Fund’s derivative assets and liabilities (by type) were as follows:
| | | | | | | | |
| | | Assets | | | Liabilities | |
Derivative Financial Instruments | | | | | | | | |
Futures contracts | | $ | — | | | $ | 2,757 | |
Forward foreign currency exchange contracts | | | 39,877 | | | | 39,494 | |
Swaps — OTC(a) | | | 66,023 | | | | 40,859 | |
| | | | | | | | |
Total derivative assets and liabilities in the Statements of Assets and Liabilities | | | 105,900 | | | | 83,110 | |
| | | | | | | | |
Derivatives not subject to a Master Netting Agreement or similar agreement (“MNA”) | | | — | | | | (2,757 | ) |
| | | | | | | | |
Total derivative assets and liabilities subject to an MNA | | $ | 105,900 | | | $ | 80,353 | |
| | | | | | | | |
| | (a) | Includes unrealized appreciation (depreciation) on OTC swaps and swap premiums (paid/received) in the Statements of Assets and Liabilities. | |
The following table presents the Fund’s derivative assets and liabilities by counterparty net of amounts available for offset under an MNA and net of the related collateral received (and pledged) by the Fund:
| | | | | | | | | | | | | | | | | | | | |
| Counterparty | | Derivative
Assets
Subject to
an MNA by
Counterparty | | | Derivatives
Available
for Offset(a) | | | Non-Cash
Collateral
Received | | | Cash
Collateral
Received | | | Net Amount
of Derivative
Assets(b) | |
Bank of America N.A. | | $ | 10,423 | | | $ | (8,538 | ) | | $ | — | | | $ | — | | | $ | 1,885 | |
Barclays Bank PLC | | | 946 | | | | (946 | ) | | | — | | | | — | | | | — | |
Goldman Sachs International | | | 60,880 | | | | (38,658 | ) | | | — | | | | — | | | | 22,222 | |
Morgan Stanley & Co. International PLC | | | 31,960 | | | | (4,868 | ) | | | — | | | | — | | | | 27,092 | |
UBS AG | | | 1,691 | | | | (1,691 | ) | | | — | | | | — | | | | — | |
| | | | | | | | | | | | | | | | | | | | |
| | $ | 105,900 | | | $ | (54,701 | ) | | $ | — | | | $ | — | | | $ | 51,199 | |
| | | | | | | | | | | | | | | | | | | | |
| | |
| 16 | | 2 0 2 0 BLACK ROCK ANNUAL REPORT TO SHAREHOLDERS |
| | |
Schedule of Investments (continued) December 31, 2020 | | BlackRock Emerging Markets Bond Fund |
| | | | | | | | | | | | | | | | | | | | |
| Counterparty | | Derivative
Liabilities
Subject to
an MNA by
Counterparty | | | Derivatives
Available
for Offset(a) | | | Non-Cash
Collateral
Pledged | | | Cash
Collateral
Pledged | | | Net Amount
of Derivative
Liabilities(c) | |
Bank of America N.A. | | $ | 8,538 | | | $ | (8,538 | ) | | $ | — | | | $ | — | | | $ | — | |
Barclays Bank PLC | | | 2,889 | | | | (946 | ) | | | — | | | | — | | | | 1,943 | |
BNP Paribas S.A | | | 242 | | | | — | | | | — | | | | — | | | | 242 | |
Goldman Sachs International | | | 38,658 | | | | (38,658 | ) | | | — | | | | — | | | | — | |
Morgan Stanley & Co. International PLC | | | 4,868 | | | | (4,868 | ) | | | — | | | | — | | | | — | |
Natwest Markets PLC | | | 18,184 | | | | — | | | | — | | | | — | | | | 18,184 | |
UBS AG | | | 6,974 | | | | (1,691 | ) | | | — | | | | — | | | | 5,283 | |
| | | | | | | | | | | | | | | | | | | | |
| | $ | 80,353 | | | $ | (54,701 | ) | | $ | — | | | $ | — | | | $ | 25,652 | |
| | | | | | | | | | | | | | | | | | | | |
| | (a) | The amount of derivatives available for offset is limited to the amount of derivative asset and/or liabilities that are subject to an MNA. | |
| | (b) | Net amount represents the net amount receivable from the counterparty in the event of default. | |
| | (c) | Net amount represents the net amount payable due to counterparty in the event of default. | |
Fair Value Hierarchy as of Period End
Various inputs are used in determining the fair value of financial instruments. For a description of the input levels and information about the Fund’s policy regarding valuation of financial instruments, refer to the Notes to Financial Statements.
The following table summarizes the Fund’s investments and derivative financial instruments categorized in the disclosure hierarchy. The breakdown of the Fund’s investments into major categories is disclosed in the Schedule of Investments above.
| | | | | | | | | | | | | | | | |
| | | Level 1 | | | Level 2 | | | Level 3 | | | Total | |
Assets | | | | | | | | | | | | | | | | |
Investments | | | | | | | | | | | | | | | | |
Long-Term Investments | | | | | | | | | | | | | | | | |
Corporate Bonds | | $ | — | | | $ | 3,457,600 | | | $ | — | | | $ | 3,457,600 | |
Foreign Agency Obligations | | | — | | | | 19,623,036 | | | | — | | | | 19,623,036 | |
Short-Term Securities | | | | | | | | | | | | | | | | |
Money Market Funds | | | 1,056,253 | | | | — | | | | — | | | | 1,056,253 | |
| | | | | | | | | | | | | | | | |
| | $ | 1,056,253 | | | $ | 23,080,636 | | | $ | — | | | $ | 24,136,889 | |
| | | | | | | | | | | | | | | | |
Derivative Financial Instruments(a) | | | | | | | | | | | | | | | | |
Assets | | | | | | | | | | | | | | | | |
Foreign Currency Exchange Contracts | | $ | — | | | $ | 39,877 | | | $ | — | | | $ | 39,877 | |
Interest Rate Contracts | | | 10,362 | | | | — | | | | — | | | | 10,362 | |
Liabilities | | | | | | | | | | | | | | | | |
Credit Contracts | | | — | | | | (40,164 | ) | | | — | | | | (40,164 | ) |
Foreign Currency Exchange Contracts | | | — | | | | (39,494 | ) | | | — | | | | (39,494 | ) |
Interest Rate Contracts | | | (2,461 | ) | | | — | | | | — | | | | (2,461 | ) |
| | | | | | | | | | | | | | | | |
| | $ | 7,901 | | | $ | (39,781 | ) | | $ | — | | | $ | (31,880 | ) |
| | | | | | | | | | | | | | | | |
| | (a) | Derivative financial instruments are swaps, futures contracts and forward foreign currency exchange contracts. Swaps, futures contracts and forward foreign currency exchange contracts are valued at the unrealized appreciation (depreciation) on the instrument. | |
See notes to financial statements.
| | |
SCHEDULE OF INVESTMENTS | | 17 |
| | |
Schedule of Investments December 31, 2020 | | BlackRock Systematic Multi-Strategy Fund (Percentages shown are based on Net Assets) |
| | | | | | | | |
| | |
| Security | | Par
(000) | | | Value | |
| |
Asset-Backed Securities | | | | | |
American Credit Acceptance Receivables Trust, | | | | | | | | |
Series 2017-1, Class D, 3.54%, 03/13/23(a) | | $ | 518 | | | $ | 518,906 | |
AmeriCredit Automobile Receivables Trust | | | | | | | | |
Series 2016-3, Class D, 2.71%, 09/08/22 | | | 1,200 | | | | 1,205,462 | |
Series 2017-3, Class D, 3.18%, 07/18/23 | | | 150 | | | | 154,555 | |
Avant Loans Funding Trust, Series 2019-B, Class A, 2.72%, 10/15/26(a) | | | 348 | | | | 348,993 | |
Avid Automobile Receivables Trust, Series 2019-1, Class A, 2.62%, 02/15/24(a) | | | 402 | | | | 405,859 | |
Conn’s Receivables Funding
LLC(a) | | | | | | | | |
Series 2019-A, Class A, 3.40%, 10/16/23 | | | 26 | | | | 26,093 | |
Series 2019-B, Class A, 2.66%, 06/17/24 | | | 273 | | | | 273,081 | |
Series 2020-A, Class A, 1.71%, 06/16/25 | | | 9,728 | | | | 9,737,127 | |
Consumer Loan Underlying Bond CLUB Credit Trust(a) | | | | | | | | |
Series 2019-HP1, Class A, 2.59%, 12/15/26 | | | 2,700 | | | | 2,730,227 | |
Series 2019-P2, Class A, 2.47%, 10/15/26 | | | 852 | | | | 857,013 | |
Series 2020-P1, Class A, 2.26%, 03/15/28 | | | 3,167 | | | | 3,190,072 | |
Consumer Loan Underlying Bond Credit Trust(a) | | | | | | | | |
Series 2018-P1, Class B, 4.07%, 07/15/25 | | | 1,145 | | | | 1,147,525 | |
Series 2018-P2, Class A, 3.47%, 10/15/25 | | | 1 | | | | 774 | |
Series 2019-P1, Class A, 2.94%, 07/15/26 | | | 225 | | | | 226,085 | |
CPS Auto Receivables Trust, Series 2020-B, Class A, 1.15%, 07/17/23(a) | | | 2,470 | | | | 2,477,539 | |
Drive Auto Receivables Trust | | | | | | | | |
Series 2017-1, Class D, 3.84%, 03/15/23 | | | 57 | | | | 57,292 | |
Series 2017-2, Class D, 3.49%, 09/15/23 | | | 43 | | | | 43,284 | |
Series 2017-3, Class D, 3.53%, 12/15/23(a) | | | 127 | | | | 128,887 | |
Series 2017-BA, Class D, 3.72%, 10/17/22(a) | | | 8 | | | | 8,338 | |
Series 2019-1, Class B, 3.41%, 06/15/23 | | | 42 | | | | 41,736 | |
Series 2019-1, Class D, 4.09%, 06/15/26 | | | 13,120 | | | | 13,742,780 | |
Series 2019-2, Class B, 3.17%, 11/15/23 | | | 189 | | | | 190,556 | |
Series 2020-2, Class A2A,
0.85%, 07/17/23 | | | 1,171 | | | | 1,173,202 | |
Series 2020-2, Class A3, 0.83%, 05/15/24 | | | 1,150 | | | | 1,155,737 | |
Series 2020-2, Class D, 3.05%, 05/15/28 | | | 4,110 | | | | 4,336,200 | |
DT Auto Owner Trust, Series 2020-2A, Class A, 1.14%, 01/16/24(a) | | | 3,940 | | | | 3,958,023 | |
Enva LLC, Series 2018-A, Class B, 7.37%, 05/20/26(a) | | | 6,116 | | | | 6,229,728 | |
ENVA LLC, Series 2019-A, Class A, 3.96%, 06/22/26(a) | | | 355 | | | | 355,826 | |
Exeter Automobile Receivables Trust | | | | | | | | |
Series 2019-1A, Class B, 3.45%, 02/15/23(a) | | | 27 | | | | 26,781 | |
Series 2020-1A, Class B, 2.26%, 04/15/24(a) | | | 3,070 | | | | 3,112,317 | |
Series 2020-2A, Class A, 1.13%, 08/15/23(a) | | | 5,204 | | | | 5,218,512 | |
Series 2020-3A, Class B, 0.79%, 09/16/24 | | | 7,140 | | | | 7,155,502 | |
Marlette Funding Trust(a) | | | | | | | | |
Series 2017-3A, Class C, 4.01%, 12/15/24 | | | 188 | | | | 188,278 | |
Series 2018-3A, Class B, 3.86%, 09/15/28 | | | 96 | | | | 96,383 | |
Series 2018-4A, Class A, 3.71%, 12/15/28 | | | 1,128 | | | | 1,132,247 | |
Series 2019-1A, Class A, 3.44%, 04/16/29 | | | 28 | | | | 28,292 | |
Series 2019-2A, Class A, 3.13%, 07/16/29 | | | 103 | | | | 103,738 | |
Series 2019-3A, Class A, 2.69%, 09/17/29 | | | 277 | | | | 278,781 | |
Series 2019-4A, Class A, 2.39%, 12/17/29 | | | 622 | | | | 626,346 | |
Series 2020-1A, Class A, 2.24%, 03/15/30 | | | 826 | | | | 830,983 | |
Series 2020-2A, Class A, 1.02%, 09/16/30 | | | 7,875 | | | | 7,887,998 | |
OneMain Financial Issuance Trust, Series 2019-2A, Class A, 3.14%, 10/14/36(a) | | | 500 | | | | 539,939 | |
| | | | | | | | |
| | |
| Security | | Par
(000) | | | Value | |
|
Asset-Backed Securities (continued) | |
Prosper Marketplace Issuance Trust(a) | | | | | | | | |
Series 2019-3A, Class A, 3.19%, 07/15/25 | | $ | 2,776 | | | $ | 2,785,484 | |
Series 2019-4A, Class A, 2.48%, 02/17/26 | | | 243 | | | | 243,806 | |
Santander Drive Auto Receivables Trust | | | | | | | | |
Series 2016-3, Class D, 2.80%, 08/15/22 | | | 66 | | | | 66,435 | |
Series 2017-2, Class D, 3.49%, 07/17/23 | | | 184 | | | | 185,736 | |
Series 2018-2, Class D, 3.88%, 02/15/24 | | | 750 | | | | 774,505 | |
Series 2018-4, Class C, 3.56%, 07/15/24 | | | 945 | | | | 957,797 | |
Series 2018-5, Class D, 4.19%, 12/16/24 | | | 50 | | | | 52,043 | |
Series 2019-1, Class C, 3.42%, 04/15/25 | | | 4,670 | | | | 4,751,921 | |
Series 2019-1, Class D, 3.65%, 04/15/25 | | | 3,300 | | | | 3,441,926 | |
Series 2019-3, Class B, 2.28%, 09/15/23 | | | 970 | | | | 977,613 | |
Series 2020-2, Class B, 0.96%, 11/15/24 | | | 1,860 | | | | 1,871,466 | |
Santander Revolving Auto Loan Trust, | | | | | | | | |
Series 2019-A, Class A, 2.51%, 01/26/32(a) | | | 650 | | | | 691,007 | |
SoFi Consumer Loan Program LLC, Series 2017-3, | | | | | | | | |
Class A, 2.77%, 05/25/26(a) | | | 3 | | | | 3,288 | |
SoFi Consumer Loan Program Trust, Series 2018-1, | | | | | | | | |
Class A2, 3.14%, 02/25/27(a) | | | 14 | | | | 13,997 | |
Upgrade Receivables Trust, Series 2019-2A, | | | | | | | | |
Class A, 2.77%, 10/15/25(a) | | | 120 | | | | 120,528 | |
Upstart Securitization Trust(a) | | | | | | | | |
Series 2019-3, Class A, 2.68%, 01/21/30 | | | 9,436 | | | | 9,520,122 | |
Series 2020-1, Class A, 2.32%, 04/22/30 | | | 7,717 | | | | 7,777,824 | |
Westlake Automobile Receivables Trust(a) | | | | | | | | |
Series 2018-1A, Class D, 3.41%, 05/15/23 | | | 135 | | | | 136,218 | |
Series 2018-3A, Class B, 3.32%, 10/16/23 | | | 6 | | | | 6,484 | |
Series 2018-3A, Class C, 3.61%, 10/16/23 | | | 4,000 | | | | 4,038,672 | |
Series 2018-3A, Class D, 4.00%, 10/16/23 | | | 100 | | | | 103,021 | |
Series 2019-1A, Class B, 3.26%, 10/17/22 | | | 5,000 | | | | 5,029,591 | |
Series 2019-2A, Class B, 2.62%, 07/15/24 | | | 1,250 | | | | 1,265,618 | |
Series 2020-2A, Class B, 1.32%, 07/15/25 | | | 5,240 | | | | 5,303,856 | |
Series 2020-3A, Class B, 0.78%, 11/17/25 | | | 12,840 | | | | 12,867,458 | |
Series 2020-3A, Class C, 1.24%, 11/17/25 | | | 2,410 | | | | 2,423,384 | |
| | | | | | | | |
| |
| Total Asset-Backed Securities — 4.5% | | | | |
(Cost: $146,502,114) | | | | | | | 147,356,797 | |
| | | | | | | | |
| | |
| | | Shares | | | | |
| | |
Common Stocks | | | | | | | | |
| |
| Air Freight & Logistics — 0.3% | | | | |
C.H. Robinson Worldwide, Inc. | | | 55,093 | | | | 5,171,580 | |
United Parcel Service, Inc., Class B | | | 31,217 | | | | 5,256,943 | |
| | | | | | | | |
| | | | | | | 10,428,523 | |
| | | | | | | | |
| |
| Biotechnology — 0.5% | | | | |
AbbVie, Inc. | | | 48,962 | | | | 5,246,278 | |
Amgen, Inc. | | | 22,688 | | | | 5,216,425 | |
Gilead Sciences, Inc. | | | 84,913 | | | | 4,947,032 | |
| | | | | | | | |
| | | | | | | 15,409,735 | |
| | | | | | | | |
| |
| Building Products — 0.0% | | | | |
AO Smith Corp. | | | 23,151 | | | | 1,269,138 | |
| | | | | | | | |
| |
| Capital Markets — 0.4% | | | | |
Cboe Global Markets, Inc. | | | 35,192 | | | | 3,277,079 | |
| | | | | | | | |
| | |
| 18 | | 2 0 2 0 BLACK ROCK ANNUAL REPORT TO SHAREHOLDERS |
| | |
Schedule of Investments (continued) December 31, 2020 | | BlackRock Systematic Multi-Strategy Fund (Percentages shown are based on Net Assets) |
| | | | | | | | |
| | |
| Security | | Shares | | | Value | |
|
| Capital Markets (continued) | |
Houlihan Lokey, Inc. | | | 74,930 | | | $ | 5,037,544 | |
Virtu Financial, Inc., Class A | | | 218,793 | | | | 5,507,020 | |
| | | | | | | | |
| | | | | | | 13,821,643 | |
|
| Communications Equipment — 0.3% | |
Cisco Systems, Inc. | | | 117,064 | | | | 5,238,614 | |
Juniper Networks, Inc. | | | 227,050 | | | | 5,110,895 | |
| | | | | | | | |
| | | | | | | 10,349,509 | |
|
| Containers & Packaging — 0.2% | |
Packaging Corp. of America | | | 33,923 | | | | 4,678,321 | |
Sonoco Products Co. | | | 21,365 | | | | 1,265,876 | |
| | | | | | | | |
| | | | | | | 5,944,197 | |
|
| Diversified Telecommunication Services — 0.1% | |
Verizon Communications, Inc. | | | 84,526 | | | | 4,965,902 | |
| | | | | | | | |
|
| Electric Utilities — 0.8% | |
Alliant Energy Corp. | | | 89,179 | | | | 4,595,394 | |
American Electric Power Co., Inc. | | | 62,213 | | | | 5,180,477 | |
Avangrid, Inc. | | | 78,609 | | | | 3,572,779 | |
Duke Energy Corp. | | | 21,774 | | | | 1,993,627 | |
Eversource Energy | | | 34,925 | | | | 3,021,362 | |
IDACORP, Inc. | | | 14,179 | | | | 1,361,609 | |
Xcel Energy, Inc. | | | 78,651 | | | | 5,243,662 | |
| | | | | | | | |
| | | | | | | 24,968,910 | |
|
| Equity Real Estate Investment Trusts (REITs) — 0.2% | |
Public Storage | | | 23,410 | | | | 5,406,071 | |
| | | | | | | | |
|
| Food & Staples Retailing — 0.2% | |
Kroger Co. | | | 165,947 | | | | 5,270,477 | |
| | | | | | | | |
|
| Food Products — 0.8% | |
Campbell Soup Co. | | | 104,518 | | | | 5,053,445 | |
Conagra Brands, Inc. | | | 53,497 | | | | 1,939,801 | |
Flowers Foods, Inc. | | | 230,953 | | | | 5,226,467 | |
General Mills, Inc. | | | 85,996 | | | | 5,056,565 | |
J.M. Smucker Co. | | | 38,038 | | | | 4,397,193 | |
Kellogg Co. | | | 75,783 | | | | 4,715,976 | |
| | | | | | | | |
| | | | | | | 26,389,447 | |
|
| Gas Utilities — 0.1% | |
Atmos Energy Corp. | | | 38,389 | | | | 3,663,462 | |
| | | | | | | | |
|
| Health Care Providers & Services — 0.1% | |
CVS Health Corp. | | | 67,867 | | | | 4,635,316 | |
| | | | | | | | |
|
| Household Durables — 0.1% | |
Garmin Ltd. | | | 22,595 | | | | 2,703,718 | |
| | | | | | | | |
|
| Household Products — 0.6% | |
Clorox Co. | | | 25,602 | | | | 5,169,556 | |
Colgate-Palmolive Co. | | | 60,986 | | | | 5,214,913 | |
Kimberly-Clark Corp. | | | 33,769 | | | | 4,553,074 | |
Procter & Gamble Co. | | | 37,625 | | | | 5,235,142 | |
| | | | | | | | |
| | | | | | | 20,172,685 | |
|
| Independent Power and Renewable Electricity Producers — 0.1% | |
Atlantica Sustainable Infrastructure PLC | | | 68,713 | | | | 2,609,720 | |
| | | | | | | | |
|
| Industrial Conglomerates — 0.2% | |
3M Co. | | | 30,118 | | | | 5,264,325 | |
| | | | | | | | |
|
| IT Services — 0.5% | |
Amdocs Ltd. | | | 77,179 | | | | 5,474,306 | |
| | | | | | | | |
| | |
| Security | | Shares | | | Value | |
|
| IT Services (continued) | |
Automatic Data Processing, Inc. | | | 29,761 | | | $ | 5,243,888 | |
Paychex, Inc. | | | 13,913 | | | | 1,296,413 | |
Western Union Co. | | | 206,208 | | | | 4,524,204 | |
| | | | | | | | |
| | | | | | | 16,538,811 | |
|
| Media — 0.2% | |
Comcast Corp., Class A | | | 101,179 | | | | 5,301,780 | |
| | | | | | | | |
|
| Metals & Mining — 0.3% | |
Newmont Corp. | | | 84,444 | | | | 5,057,351 | |
Southern Copper Corp. | | | 86,124 | | | | 5,608,395 | |
| | | | | | | | |
| | | | | | | 10,665,746 | |
|
| Multi-Utilities — 0.6% | |
Ameren Corp. | | | 67,229 | | | | 5,247,896 | |
CMS Energy Corp. | | | 86,281 | | | | 5,264,004 | |
Consolidated Edison, Inc. | | | 69,664 | | | | 5,034,617 | |
WEC Energy Group, Inc. | | | 55,594 | | | | 5,116,316 | |
| | | | | | | | |
| | | | | | | 20,662,833 | |
|
| Pharmaceuticals — 0.6% | |
Eli Lilly & Co. | | | 34,790 | | | | 5,873,944 | |
Johnson & Johnson | | | 34,273 | | | | 5,393,885 | |
Merck & Co., Inc. | | | 62,445 | | | | 5,108,001 | |
Pfizer, Inc. | | | 123,530 | | | | 4,547,139 | |
| | | | | | | | |
| | | | | | | 20,922,969 | |
|
| Road & Rail — 0.1% | |
Union Pacific Corp. | | | 10,870 | | | | 2,263,351 | |
| | | | | | | | |
|
| Semiconductors & Semiconductor Equipment — 0.3% | |
Intel Corp. | | | 98,607 | | | | 4,912,601 | |
Texas Instruments, Inc. | | | 31,162 | | | | 5,114,619 | |
| | | | | | | | |
| | | | | | | 10,027,220 | |
|
| Specialty Retail — 0.1% | |
Home Depot, Inc. | | | 12,945 | | | | 3,438,451 | |
| | | | | | | | |
|
| Technology Hardware, Storage & Peripherals — 0.2% | |
Seagate Technology PLC | | | 83,572 | | | | 5,194,835 | |
| | | | | | | | |
|
| Trading Companies & Distributors — 0.0% | |
MSC Industrial Direct Co., Inc., Class A | | | 19,697 | | | | 1,662,230 | |
| | | | | | | | |
|
| Total Common Stocks — 7.9% | |
(Cost: $245,032,088) | | | | | | | 259,951,004 | |
| | | | | | | | |
| | |
| | | Par
(000) | | | | |
|
Corporate Bonds | |
|
| Advertising Agencies — 0.0% | |
MDC Partners, Inc.,
7.50%, 05/01/24(a)(b) | | $ | 100 | | | | 101,375 | |
| | | | | | | | |
|
| Aerospace & Defense — 0.5% | |
3M Co. | |
2.25%, 03/15/23 | | | 425 | | | | 443,861 | |
2.65%, 04/15/25 | | | 680 | | | | 738,557 | |
Boeing Co. | |
4.51%, 05/01/23 | | | 1,260 | | | | 1,361,849 | |
4.88%, 05/01/25 | | | 2,080 | | | | 2,371,008 | |
Bombardier, Inc.(a) | |
6.00%, 10/15/22 | | | 100 | | | | 98,165 | |
6.13%, 01/15/23 | | | 50 | | | | 48,875 | |
| | |
SCHEDULE OF INVESTMENTS | | 19 |
| | |
Schedule of Investments (continued) December 31, 2020 | | BlackRock Systematic Multi-Strategy Fund (Percentages shown are based on Net Assets) |
| | | | | | | | |
| | |
| Security | | Par
(000) | | | Value | |
|
| Aerospace & Defense (continued) | |
Bombardier, Inc.(a) (continued) | | | | | | | | |
7.88%, 04/15/27 | | $ | 425 | | | $ | 390,762 | |
General Dynamics Corp., 3.25%, 04/01/25 | | | 350 | | | | 386,465 | |
General Electric Co., 3.63%, 05/01/30 | | | 185 | | | | 211,434 | |
Howmet Aerospace, Inc., 5.90%, 02/01/27 | | | 2,025 | | | | 2,390,776 | |
Lockheed Martin Corp., 1.85%, 06/15/30 | | | 70 | | | | 73,440 | |
Moog, Inc., 4.25%, 12/15/27(a) | | | 400 | | | | 415,000 | |
Raytheon Technologies Corp., 3.15%, 12/15/24 | | | 1,153 | | | | 1,252,520 | |
Rolls-Royce PLC, 5.75%, 10/15/27(a) | | | 805 | | | | 891,537 | |
Signature Aviation US Holdings,
Inc.(a) | | | | | | | | |
5.38%, 05/01/26 | | | 10 | | | | 10,250 | |
4.00%, 03/01/28 | | | 125 | | | | 125,831 | |
Spirit AeroSystems, Inc.(a) | | | | | | | | |
5.50%, 01/15/25 | | | 125 | | | | 131,862 | |
7.50%, 04/15/25 | | | 700 | | | | 750,750 | |
SSL Robotics LLC,
9.75%, 12/31/23(a) | | | 1,150 | | | | 1,299,500 | |
TransDigm, Inc. | | | | | | | | |
8.00%, 12/15/25(a) | | | 115 | | | | 127,110 | |
6.25%, 03/15/26(a) | | | 2,000 | | | | 2,130,000 | |
6.38%, 06/15/26 | | | 100 | | | | 103,500 | |
7.50%, 03/15/27 | | | 50 | | | | 53,375 | |
5.50%, 11/15/27 | | | 1,050 | | | | 1,103,865 | |
Triumph Group Inc., 7.75%, 08/15/25 | | | 40 | | | | 36,550 | |
Triumph Group, Inc., 8.88%, 06/01/24(a) | | | 656 | | | | 719,960 | |
United Technologies Corp., 3.95%, 08/16/25 | | | 130 | | | | 149,099 | |
| | | | | | | | |
| | | | | | | 17,815,901 | |
|
| Air Freight & Logistics(a) — 0.1% | |
Kenan Advantage Group, Inc., 7.88%, 07/31/23 | | | 15 | | | | 15,000 | |
XPO Logistics, Inc. | | | | | | | | |
6.50%, 06/15/22 | | | 7 | | | | 7,023 | |
6.25%, 05/01/25 | | | 1,590 | | | | 1,711,062 | |
| | | | | | | | |
| | | | | | | 1,733,085 | |
|
| Airlines — 0.2% | |
American Airlines Group, Inc., 3.75%, 03/01/25(a) | | | 455 | | | | 351,842 | |
American Airlines, Inc., 11.75%, 07/15/25(a) | | | 750 | | | | 864,938 | |
Delta Air Line, Inc., 7.38%, 01/15/26 | | | 3,125 | | | | 3,569,697 | |
Mileage Plus Holdings LLC/Mileage Plus Intellectual Property Assets Ltd., 6.50%, 06/20/27(a) | | | 1,188 | | | | 1,276,890 | |
Spirit Loyalty Cayman Ltd./Spirit IP Cayman Ltd., 8.00%, 09/20/25(a) | | | 405 | | | | 453,600 | |
United Continental Holdings Inc., 4.88%, 01/15/25 | | | 500 | | | | 492,025 | |
| | | | | | | | |
| | | | | | | 7,008,992 | |
|
| Auto Components — 0.3% | |
Adient Global Holdings Ltd., 4.88%, 08/15/26(a) | | | 2,000 | | | | 2,055,000 | |
Adient US LLC(a) | | | | | | | | |
9.00%, 04/15/25 | | | 355 | | | | 395,825 | |
7.00%, 05/15/26 | | | 50 | | | | 54,386 | |
Aptiv Corp., 4.15%, 03/15/24 | | | 1,700 | | | | 1,870,623 | |
Clarios Global LP/Clarios US Finance Co.(a) | | | | | | | | |
6.25%, 05/15/26 | | | 565 | | | | 605,962 | |
8.50%, 05/15/27 | | | 510 | | | | 554,069 | |
Cooper-Standard Automotive Inc.(a) | | | | | | | | |
13.00%, 06/01/24 | | | 100 | | | | 117,000 | |
5.63%, 11/15/26 | | | 360 | | | | 332,125 | |
Dealer Tire LLC/DT Issuer LLC, 8.00%, 02/01/28(a) | | | 140 | | | | 147,410 | |
Goodyear Tire & Rubber Co. | | | | | | | | |
9.50%, 05/31/25 | | | 100 | | | | 113,030 | |
4.88%, 03/15/27 | | | 250 | | | | 255,625 | |
| | | | | | | | |
| | |
| Security | | Par
(000) | | | Value | |
|
Auto Components (continued) | |
Meritor, Inc.(a) | | | | | | | | |
6.25%, 06/01/25 | | $ | 325 | | | $ | 351,000 | |
4.50%, 12/15/28 | | | 1,850 | | | | 1,896,250 | |
Tenneco, Inc. | | | | | | | | |
5.00%, 07/15/26 | | | 659 | | | | 606,280 | |
7.88%, 01/15/29(a) | | | 285 | | | | 319,987 | |
ZF North America Capital, Inc., 4.75%, 04/29/25(a) | | | 150 | | | | 161,642 | |
| | | | | | | | |
| | | | | | | 9,836,214 | |
Automobiles — 1.5% | |
Allison Transmission, Inc.(a) | | | | | | | | |
5.88%, 06/01/29 | | | 310 | | | | 342,550 | |
3.75%, 01/30/31 | | | 970 | | | | 992,431 | |
American Honda Finance Corp., 1.20%, 07/08/25 | | | 1,395 | | | | 1,427,577 | |
Asbury Automotive Group, Inc., 4.75%, 03/01/30 | | | 495 | | | | 530,887 | |
Aston Martin Capital Holdings Ltd., 10.50%, 11/30/25(a) | | | 1,000 | | | | 1,098,930 | |
Carvana Co., 5.88%, 10/01/28(a) | | | 500 | | | | 519,375 | |
Cummins, Inc., 0.75%, 09/01/25 | | | 4,550 | | | | 4,582,924 | |
Ford Motor Co. | | | | | | | | |
8.50%, 04/21/23 | | | 750 | | | | 844,132 | |
9.00%, 04/22/25 | | | 185 | | | | 226,812 | |
4.35%, 12/08/26 | | | 200 | | | | 213,000 | |
9.63%, 04/22/30 | | | 240 | | | | 338,700 | |
4.75%, 01/15/43 | | | 250 | | | | 255,000 | |
5.29%, 12/08/46 | | | 1,500 | | | | 1,567,500 | |
Ford Motor Credit Co. LLC | | | | | | | | |
4.25%, 09/20/22 | | | 250 | | | | 258,040 | |
4.38%, 08/06/23 | | | 1,000 | | | | 1,037,500 | |
5.58%, 03/18/24 | | | 400 | | | | 431,460 | |
5.13%, 06/16/25 | | | 1,350 | | | | 1,467,855 | |
4.13%, 08/04/25 | | | 1,000 | | | | 1,048,750 | |
3.38%, 11/13/25 | | | 1,230 | | | | 1,263,653 | |
4.39%, 01/08/26 | | | 1,650 | | | | 1,731,972 | |
4.00%, 11/13/30 | | | 1,320 | | | | 1,386,000 | |
General Motors Co. | | | | | | | | |
5.40%, 10/02/23 | | | 160 | | | | 179,158 | |
6.13%, 10/01/25 | | | 600 | | | | 727,781 | |
General Motors Financial Co., Inc. | | | | | | | | |
4.20%, 03/01/21 | | | 50 | | | | 50,123 | |
3.20%, 07/06/21 | | | 550 | | | | 555,916 | |
4.20%, 11/06/21 | | | 65 | | | | 66,997 | |
3.45%, 04/10/22 | | | 50 | | | | 51,416 | |
3.55%, 07/08/22 | | | 690 | | | | 719,646 | |
3.25%, 01/05/23 | | | 50 | | | | 52,430 | |
4.15%, 06/19/23 | | | 195 | | | | 209,785 | |
1.70%, 08/18/23 | | | 5,460 | | | | 5,600,614 | |
5.10%, 01/17/24 | | | 375 | | | | 419,643 | |
4.00%, 01/15/25 | | | 1,000 | | | | 1,100,703 | |
2.75%, 06/20/25 | | | 1,815 | | | | 1,940,787 | |
Group 1 Automotive, Inc., 4.00%, 08/15/28(a) | | | 2,220 | | | | 2,288,332 | |
Jaguar Land Rover Automotive PLC(a) | | | | | | | | |
7.75%, 10/15/25 | | | 1,050 | | | | 1,131,375 | |
4.50%, 10/01/27 | | | 400 | | | | 372,000 | |
5.88%, 01/15/28 | | | 240 | | | | 241,824 | |
Lithia Motors, Inc., 4.38%, 01/15/31(a) | | | 155 | | | | 166,238 | |
Navistar International Corp.(a) | | | | | | | | |
9.50%, 05/01/25 | | | 755 | | | | 847,487 | |
6.63%, 11/01/25 | | | 525 | | | | 550,016 | |
PACCAR Financial Corp., 1.90%, 02/07/23 | | | 325 | | | | 335,625 | |
PM General Purchaser LLC, 9.50%, 10/01/28(a) | | | 900 | | | | 996,750 | |
| | |
| 20 | | 2 0 2 0 BLACK ROCK ANNUAL REPORT TO SHAREHOLDERS |
| | |
Schedule of Investments (continued) December 31, 2020 | | BlackRock Systematic Multi-Strategy Fund (Percentages shown are based on Net Assets) |
| | | | | | | | |
| | |
| Security | | Par
(000) | | | Value | |
|
| Automobiles (continued) | |
Tesla, Inc., 5.30%, 08/15/25(a) | | $ | 1,625 | | | $ | 1,694,062 | |
Toyota Motor Credit Corp. | | | | | | | | |
0.35%, 10/14/22 | | | 3,580 | | | | 3,589,706 | |
0.50%, 08/14/23 | | | 3,560 | | | | 3,578,188 | |
| | | | | | | | |
| | | | | | | 49,031,650 | |
Banks — 1.7% | |
Bank of America NA, (3 mo. LIBOR US + 0.65%), 3.34%, 01/25/23(c) | | | 500 | | | | 516,241 | |
Bank of Montreal | | | | | | | | |
0.45%, 12/08/23 | | | 3,565 | | | | 3,575,466 | |
1.85%, 05/01/25 | | | 2,440 | | | | 2,561,576 | |
Canadian Imperial Bank of Commerce | | | | | | | | |
0.95%, 06/23/23 | | | 3,330 | | | | 3,374,031 | |
2.25%, 01/28/25 | | | 480 | | | | 509,864 | |
0.95%, 10/23/25 | | | 1,870 | | | | 1,896,595 | |
CIT Group, Inc. | | | | | | | | |
5.00%, 08/15/22 | | | 500 | | | | 530,000 | |
5.00%, 08/01/23 | | | 420 | | | | 458,850 | |
6.13%, 03/09/28 | | | 25 | | | | 30,438 | |
Citibank NA, 3.65%, 01/23/24 | | | 400 | | | | 437,256 | |
Credit Suisse AG, New York | | | | | | | | |
2.80%, 04/08/22 | | | 2,110 | | | | 2,178,262 | |
1.00%, 05/05/23 | | | 1,000 | | | | 1,015,127 | |
Fifth Third Bank NA, 1.80%, 01/30/23 | | | 585 | | | | 601,633 | |
First Republic Bank, (Secured Overnight Financing Rate + 0.62%), 1.91%, 02/12/24(c) | | | 1,085 | | | | 1,116,494 | |
Freedom Mortgage Corp., 7.63%, 05/01/26(a) | | | 1,685 | | | | 1,782,224 | |
HSBC USA, Inc., 3.50%, 06/23/24 | | | 400 | | | | 437,777 | |
Huntington National Bank, 1.80%, 02/03/23 | | | 570 | | | | 585,652 | |
ING Groep NV, 4.10%, 10/02/23 | | | 3,570 | | | | 3,922,079 | |
Intesa Sanpaolo SpA(a) | | | | | | | | |
5.02%, 06/26/24 | | | 200 | | | | 218,816 | |
5.71%, 01/15/26 | | | 1,650 | | | | 1,888,577 | |
KeyCorp., 2.25%, 04/06/27 | | | 335 | | | | 357,392 | |
MUFG Union Bank NA, 3.15%, 04/01/22 | | | 250 | | | | 258,141 | |
National Australia Bank Ltd., 1.88%, 12/13/22 | | | 250 | | | | 257,951 | |
National Bank of Canada | | | | | | | | |
2.10%, 02/01/23 | | | 1,550 | | | | 1,602,530 | |
(1 year CMT + 0.40%), 0.55%, 11/15/24(c) | | | 3,405 | | | | 3,414,557 | |
Royal Bank of Canada | | | | | | | | |
1.60%, 04/17/23 | | | 460 | | | | 473,041 | |
1.15%, 06/10/25 | | | 2,500 | | | | 2,554,684 | |
Santander Holdings USA, Inc., 3.45%, 06/02/25 | | | 1,250 | | | | 1,365,131 | |
Santander UK Group Holdings PLC,
(1 year CMT + 1.25%),
1.53%, 08/21/26(c) | | | 3,000 | | | | 3,045,229 | |
Santander UK PLC, 2.10%, 01/13/23 | | | 335 | | | | 346,150 | |
Standard Chartered PLC, (3 mo. LIBOR US + 1.46%), 7.01%(a)(c)(d) | | | 500 | | | | 648,750 | |
Toronto-Dominion Bank | | | | | | | | |
1.90%, 12/01/22 | | | 785 | | | | 809,415 | |
0.45%, 09/11/23 | | | 5,955 | | | | 5,972,109 | |
2.65%, 06/12/24 | | | 200 | | | | 214,304 | |
Truist Financial Corp. | | | | | | | | |
3.05%, 06/20/22 | | | 93 | | | | 96,525 | |
1.20%, 08/05/25 | | | 3,520 | | | | 3,613,061 | |
Wells Fargo & Co. | | | | | | | | |
4.60%, 04/01/21 | | | 500 | | | | 505,281 | |
| | | | | | | | |
| | |
| Security | | Par
(000) | | | Value | |
|
Banks (continued) | |
Wells Fargo & Co. (continued) | | | | | | | | |
(3 mo. LIBOR US + 0.83%), 2.41%, 10/30/25(c) | | $ | 640 | | | $ | 676,717 | |
Wells Fargo Bank NA(c) | | | | | | | | |
(3 mo. LIBOR US + 0.61%), 2.90%, 05/27/22 | | | 300 | | | | 303,046 | |
(3 mo. LIBOR US + 0.65%), 2.08%, 09/09/22 | | | 1,890 | | | | 1,911,605 | |
| | | | | | | | |
| | | | | | | 56,062,577 | |
Beverages — 0.5% | |
ARD Finance SA, (6.50% Cash or 7.25% PIK), 6.50%, 06/30/27(a)(e) | | | 1,350 | | | | 1,441,125 | |
Ardagh Packaging Finance PLC/Ardagh Holdings USA, Inc.(a) | | | | | | | | |
5.25%, 04/30/25 | | | 820 | | | | 865,100 | |
4.13%, 08/15/26 | | | 250 | | | | 261,250 | |
5.25%, 08/15/27 | | | 650 | | | | 682,376 | |
Ball Corp. | | | | | | | | |
4.00%, 11/15/23 | | | 15 | | | | 15,975 | |
5.25%, 07/01/25 | | | 50 | | | | 57,062 | |
4.88%, 03/15/26 | | | 200 | | | | 225,900 | |
2.88%, 08/15/30 | | | 910 | | | | 907,725 | |
Coca-Cola Co. | | | | | | | | |
1.75%, 09/06/24 | | | 400 | | | | 418,986 | |
1.65%, 06/01/30 | | | 1,040 | | | | 1,068,221 | |
Constellation Brands, Inc. | | | | | | | | |
4.40%, 11/15/25 | | | 1,070 | | | | 1,242,417 | |
2.88%, 05/01/30 | | | 310 | | | | 339,692 | |
Diageo Capital PLC | | | | | | | | |
2.13%, 10/24/24 | | | 560 | | | | 591,057 | |
2.38%, 10/24/29 | | | 405 | | | | 435,996 | |
2.00%, 04/29/30 | | | 2,710 | | | | 2,826,014 | |
Greif, Inc., 6.50%, 03/01/27(a) | | | 10 | | | | 10,575 | |
Keurig Dr. Pepper, Inc., 4.06%, 05/25/23 | | | 1,320 | | | | 1,434,200 | |
Mauser Packaging Solutions Holding Co.(a) | | | | | | | | |
5.50%, 04/15/24 | | | 25 | | | | 25,493 | |
7.25%, 04/15/25 | | | 300 | | | | 303,000 | |
Owens-Brockway Glass Container, Inc.(a) | | | | | | | | |
5.88%, 08/15/23 | | | 200 | | | | 214,250 | |
6.63%, 05/13/27 | | | 250 | | | | 270,625 | |
PepsiCo, Inc. | | | | | | | | |
2.25%, 03/19/25 | | | 850 | | | | 907,959 | |
2.63%, 03/19/27 | | | 535 | | | | 588,629 | |
2.75%, 03/19/30 | | | 65 | | | | 72,780 | |
1.63%, 05/01/30 | | | 940 | | | | 964,761 | |
Silgan Holdings, Inc., 4.13%, 02/01/28 | | | 207 | | | | 215,021 | |
| | | | | | | | |
| | | | | | | 16,386,189 | |
Biotechnology — 0.1% | |
Emergent BioSolutions, Inc., 3.88%, 08/15/28(a) | | | 1,310 | | | | 1,356,505 | |
Gilead Sciences, Inc., 0.75%, 09/29/23 | | | 485 | | | | 486,474 | |
Regeneron Pharmaceuticals, Inc., 1.75%, 09/15/30 | | | 305 | | | | 300,345 | |
Royalty Pharma PLC(a) | | | | | | | | |
0.75%, 09/02/23 | | | 165 | | | | 165,789 | |
1.20%, 09/02/25 | | | 60 | | | | 61,003 | |
| | | | | | | | |
| | | | | | | 2,370,116 | |
Building Materials — 0.5% | |
Allegion US Holding Co., Inc., 3.20%, 10/01/24 | | | 1,900 | | | | 2,029,314 | |
Boise Cascade Co.,
4.88%, 07/01/30(a) | | | 540 | | | | 584,550 | |
| | |
SCHEDULE OF INVESTMENTS | | 21 |
| | |
Schedule of Investments (continued) December 31, 2020 | | BlackRock Systematic Multi-Strategy Fund (Percentages shown are based on Net Assets) |
| | | | | | | | |
| | |
| Security | | Par
(000) | | | Value | |
|
| Building Materials (continued) | |
Builders FirstSource, Inc.(a) | | | | | | | | |
6.75%, 06/01/27 | | $ | 160 | | | $ | 173,554 | |
5.00%, 03/01/30 | | | 370 | | | | 400,754 | |
Carrier Global Corp. | | | | | | | | |
1.92%, 02/15/23 | | | 2,055 | | | | 2,116,999 | |
2.24%, 02/15/25 | | | 1,055 | | | | 1,116,362 | |
2.49%, 02/15/27 | | | 1,200 | | | | 1,294,846 | |
Griffon Corp., 5.75%, 03/01/28 | | | 270 | | | | 285,525 | |
James Hardie International Finance DAC, 5.00%, 01/15/28(a) | | | 1,200 | | | | 1,274,604 | |
Masonite International Corp., 5.38%, 02/01/28(a) | | | 1,650 | | | | 1,771,687 | |
Norbord, Inc., 5.75%, 07/15/27(a) | | | 1,215 | | | | 1,306,149 | |
Pisces Midco, Inc., 8.00%, 04/15/26(a) | | | 250 | | | | 263,125 | |
Standard Industries, Inc.(a) | | | | | | | | |
4.75%, 01/15/28 | | | 25 | | | | 26,313 | |
4.38%, 07/15/30 | | | 1,250 | | | | 1,337,163 | |
Summit Materials LLC/Summit Materials Finance Corp., 5.25%, 01/15/29(a) | | | 305 | | | | 320,250 | |
US Concrete, Inc., 5.13%, 03/01/29(a) | | | 465 | | | | 478,950 | |
| | | | | | | | |
| | | | | | | 14,780,145 | |
|
| Building Products — 0.1% | |
Advanced Drainage Systems, Inc., 5.00%, 09/30/27(a) | | | 355 | | | | 372,885 | |
Home Depot, Inc., 2.50%, 04/15/27 | | | 150 | | | | 164,607 | |
LBM Acquisition LLC, 6.25%, 01/15/29(a) | | | 475 | | | | 490,438 | |
Lowe’s Cos., Inc., 4.00%, 04/15/25 | | | 1,930 | | | | 2,192,885 | |
Specialty Building Products Holdings LLC/SBP Finance Corp.,
6.38%, 09/30/26(a) | | | 145 | | | | 153,662 | |
White Cap Buyer LLC,
6.88%, 10/15/28(a) | | | 380 | | | | 405,175 | |
| | | | | | | | |
| | | | | | | 3,779,652 | |
|
| Capital Markets — 1.1% | |
AG Issuer LLC, 6.25%, 03/01/28(a) | | | 520 | | | | 525,850 | |
Ameriprise Financial, Inc.,
3.00%, 04/02/25 | | | 860 | | | | 936,254 | |
Ares Capital Corp. | | | | | | | | |
3.63%, 01/19/22 | | | 1,180 | | | | 1,213,746 | |
3.50%, 02/10/23 | | | 1,300 | | | | 1,369,454 | |
4.20%, 06/10/24 | | | 880 | | | | 949,904 | |
4.25%, 03/01/25 | | | 50 | | | | 54,200 | |
3.25%, 07/15/25 | | | 850 | | | | 900,826 | |
3.88%, 01/15/26 | | | 2,545 | | | | 2,757,718 | |
Bank of New York Mellon Corp., 1.85%, 01/27/23 | | | 315 | | | | 324,844 | |
Brookfield Asset Management, Inc., 4.00%, 01/15/25 | | | 1,000 | | | | 1,115,053 | |
Brookfield Finance, Inc. | | | | | | | | |
4.00%, 04/01/24 | | | 300 | | | | 329,306 | |
3.90%, 01/25/28 | | | 55 | | | | 63,108 | |
FS KKR Capital Corp. | | | | | | | | |
4.63%, 07/15/24 | | | 750 | | | | 790,180 | |
4.13%, 02/01/25 | | | 105 | | | | 109,298 | |
Goldman Sachs BDC, Inc.,
2.88%, 01/15/26 | | | 5,445 | | | | 5,555,942 | |
Icahn Enterprises LP/Icahn Enterprises Finance Corp. | | | | | | | | |
6.38%, 12/15/25 | | | 1,100 | | | | 1,137,950 | |
6.25%, 05/15/26 | | | 610 | | | | 645,929 | |
5.25%, 05/15/27 | | | 300 | | | | 321,600 | |
LPL Holdings, Inc.(a) | | | | | | | | |
5.75%, 09/15/25 | | | 50 | | | | 51,721 | |
4.63%, 11/15/27 | | | 90 | | | | 93,150 | |
NFP Corp., 6.88%, 08/15/28(a) | | | 2,665 | | | | 2,845,367 | |
| | | | | | | | |
| | |
| Security | | Par
(000) | | | Value | |
|
| Capital Markets (continued) | |
Nomura Holdings, Inc. | | | | | | | | |
2.65%, 01/16/25 | | $ | 1,620 | | | $ | 1,730,110 | |
1.85%, 07/16/25 | | | 4,520 | | | | 4,697,529 | |
Owl Rock Capital Corp. | | | | | | | | |
4.00%, 03/30/25 | | | 1,000 | | | | 1,044,155 | |
3.40%, 07/15/26 | | | 1,990 | | | | 2,018,494 | |
RP Escrow Issuer LLC, 5.25%, 12/15/25(a) | | | 325 | | | | 339,645 | |
StoneX Group, Inc., 8.63%, 06/15/25(a) | | | 3,424 | | | | 3,723,600 | |
| | | | | | | | |
| | | | | | | 35,644,933 | |
|
| Chemicals — 1.2% | |
Air Products and Chemicals, Inc. | | | | | | | | |
1.85%, 05/15/27 | | | 2,380 | | | | 2,519,249 | |
2.05%, 05/15/30 | | | 1,125 | | | | 1,200,092 | |
Ashland LLC, 4.75%, 08/15/22 | | | 4 | | | | 4,190 | |
Axalta Coating Systems LLC, 3.38%, 02/15/29(a) | | | 1,080 | | | | 1,080,000 | |
Blue Cube Spinco LLC, 9.75%, 10/15/23 | | | 42 | | | | 43,155 | |
Celanese US Holdings LLC, 3.50%, 05/08/24 | | | 2,045 | | | | 2,214,567 | |
CF Industries, Inc. | | | | | | | | |
4.95%, 06/01/43 | | | 325 | | | | 398,938 | |
5.38%, 03/15/44 | | | 650 | | | | 822,741 | |
Chemours Co. | | | | | | | | |
5.75%, 11/15/28(a) | | | 2,170 | | | | 2,213,400 | |
163851AE8, 5.38%, 05/15/27 | | | 939 | | | | 1,000,035 | |
CVR Partners LP/CVR Nitrogen Finance Corp., 9.25%, 06/15/23(a) | | | 25 | | | | 25,026 | |
DuPont de Nemours, Inc., 2.17%, 05/01/23 | | | 890 | | | | 901,792 | |
Element Solutions, Inc., 3.88%, 09/01/28(a) | | | 1,290 | | | | 1,327,087 | |
FMC Corp., 3.20%, 10/01/26 | | | 1,707 | | | | 1,901,115 | |
Huntsman International LLC, 5.13%, 11/15/22 | | | 5,716 | | | | 6,110,517 | |
Ingevity Corp., 3.88%, 11/01/28(a) | | | 1,770 | | | | 1,783,275 | |
International Flavors & Fragrances, Inc., 4.45%, 09/26/28 | | | 40 | | | | 47,352 | |
Methanex Corp. | | | | | | | | |
5.13%, 10/15/27 | | | 585 | | | | 635,825 | |
5.25%, 12/15/29 | | | 1,200 | | | | 1,300,464 | |
5.65%, 12/01/44 | | | 300 | | | | 321,750 | |
Minerals Technologies, Inc., 5.00%, 07/01/28(a) | | | 1,250 | | | | 1,308,000 | |
Olin Corp. | | | | | | | | |
9.50%, 06/01/25(a) | | | 350 | | | | 437,343 | |
5.13%, 09/15/27 | | | 50 | | | | 52,307 | |
5.63%, 08/01/29 | | | 500 | | | | 543,125 | |
Rayonier AM Products, Inc., 7.63%, 01/15/26(a) | | | 2,325 | | | | 2,424,394 | |
Sherwin-Williams Co. | | | | | | | | |
3.13%, 06/01/24 | | | 2,590 | | | | 2,809,378 | |
3.45%, 06/01/27 | | | 640 | | | | 723,033 | |
2.95%, 08/15/29 | | | 1,640 | | | | 1,804,551 | |
Tronox Inc.(a) | | | | | | | | |
6.50%, 05/01/25 | | | 205 | | | | 219,350 | |
6.50%, 04/15/26 | | | 500 | | | | 520,625 | |
Valvoline, Inc. | | | | | | | | |
4.38%, 08/15/25 | | | 170 | | | | 175,571 | |
3.63%, 06/15/31(a)(f) | | | 470 | | | | 482,337 | |
WESCO Distribution, Inc.(a) | | | | | | | | |
7.13%, 06/15/25 | | | 405 | | | | 445,431 | |
7.25%, 06/15/28 | | | 770 | | | | 875,713 | |
| | | | | | | | |
| | | | | | | 38,671,728 | |
|
| Commercial Services & Supplies — 0.4% | |
AMN Healthcare, Inc., 4.63%, 10/01/27(a) | | | 590 | | | | 618,066 | |
APX Group, Inc., 6.75%, 02/15/27(a) | | | 670 | | | | 720,250 | |
| | |
| 22 | | 2 0 2 0 BLACK ROCK ANNUAL REPORT TO SHAREHOLDERS |
| | |
Schedule of Investments (continued) December 31, 2020 | | BlackRock Systematic Multi-Strategy Fund (Percentages shown are based on Net Assets) |
| | | | | | | | |
| | |
| Security | | Par
(000) | | | Value | |
|
| Commercial Services & Supplies (continued) | |
ASGN, Inc., 4.63%, 05/15/28(a) | | $ | 555 | | | $ | 577,200 | |
Avis Budget Car Rental LLC/Avis Budget Finance, Inc.(a) | | | | | | | | |
10.50%, 05/15/25 | | | 400 | | | | 471,000 | |
5.75%, 07/15/27 | | | 400 | | | | 406,000 | |
Cimpress PLC, 7.00%, 06/15/26(a) | | | 1,490 | | | | 1,566,362 | |
Fortress Transportation & Infrastructure Investors LLC, 6.50%, 10/01/25(a) | | | 1,525 | | | | 1,593,793 | |
Fortress Transportation and Infrastructure Investors LLC, 9.75%, 08/01/27(a) | | | 2,345 | | | | 2,687,956 | |
Herc Holdings, Inc., 5.50%, 07/15/27(a) | | | 400 | | | | 424,000 | |
Prime Security Services Borrower LLC/Prime Finance, Inc.(a) | | | | | | | | |
5.25%, 04/15/24 | | | 100 | | | | 106,750 | |
5.75%, 04/15/26 | | | 800 | | | | 876,000 | |
3.38%, 08/31/27 | | | 290 | | | | 287,825 | |
6.25%, 01/15/28 | | | 185 | | | | 198,614 | |
Ritchie Bros Auctioneers, Inc., 5.38%, 01/15/25(a) | | | 2,100 | | | | 2,161,425 | |
United Rentals North America, Inc. | | | | | | | | |
5.50%, 05/15/27 | | | 500 | | | | 535,000 | |
4.88%, 01/15/28 | | | 50 | | | | 53,250 | |
5.25%, 01/15/30 | | | 50 | | | | 55,500 | |
4.00%, 07/15/30 | | | 155 | | | | 163,138 | |
3.88%, 02/15/31 | | | 1,115 | | | | 1,169,691 | |
| | | | | | | | |
| | | | | | | 14,671,820 | |
Communications Equipment — 0.2% | |
Avaya, Inc., 6.13%, 09/15/28(a) | | | 480 | | | | 512,765 | |
CommScope Technologies LLC, 6.00%, 06/15/25(a) | | | 21 | | | | 21,473 | |
CommScope, Inc.(a) | | | | | | | | |
6.00%, 03/01/26 | | | 2,000 | | | | 2,107,200 | |
8.25%, 03/01/27 | | | 50 | | | | 53,375 | |
Motorola Solutions, Inc. | | | | | | | | |
4.00%, 09/01/24 | | | 54 | | | | 60,334 | |
4.60%, 02/23/28 | | | 50 | | | | 60,321 | |
4.60%, 05/23/29 | | | 600 | | | | 718,809 | |
2.30%, 11/15/30 | | | 200 | | | | 203,867 | |
Nokia OYJ, 6.63%, 05/15/39 | | | 300 | | | | 383,192 | |
ViaSat, Inc.(a) | | | | | | | | |
5.63%, 09/15/25 | | | 100 | | | | 102,280 | |
5.63%, 04/15/27 | | | 400 | | | | 420,000 | |
6.50%, 07/15/28 | | | 1,035 | | | | 1,120,087 | |
| | | | | | | | |
| | | | | | | 5,763,703 | |
Construction & Engineering — 0.2% | |
AECOM | | | | | | | | |
5.88%, 10/15/24 | | | 50 | | | | 55,764 | |
5.13%, 03/15/27 | | | 700 | | | | 778,981 | |
Fluor Corp., 4.25%, 09/15/28 | | | 1,400 | | | | 1,396,542 | |
TopBuild Corp., 5.63%, 05/01/26(a) | | | 3,000 | | | | 3,108,750 | |
Weekley Homes LLC/Weekley Finance Corp., 4.88%, 09/15/28(a) | | | 225 | | | | 235,125 | |
| | | | | | | | |
| | | | | | | 5,575,162 | |
Construction Materials — 0.2% | |
Avient Corp. | | | | | | | | |
5.25%, 03/15/23 | | | 35 | | | | 37,538 | |
5.75%, 05/15/25(a) | | | 2,450 | | | | 2,603,125 | |
G-III Apparel Group Ltd., 7.88%, 08/15/25(a) | | | 1,750 | | | | 1,907,500 | |
H&E Equipment Services, Inc., 3.88%, 12/15/28(a) | | | 1,555 | | | | 1,571,638 | |
Performance Food Group, Inc., 5.50%, 10/15/27(a) | | | 280 | | | | 295,400 | |
| | | | | | | | |
| | |
| Security | | Par
(000) | | | Value | |
|
| Construction Materials (continued) | |
Picasso Finance Sub, Inc.,
6.13%, 06/15/25(a) | | $ | 260 | | | $ | 278,200 | |
Williams Scotsman International, Inc., 4.63%, 08/15/28(a) | | | 235 | | | | 243,225 | |
Winnebago Industries, Inc.,
6.25%, 07/15/28(a) | | | 140 | | | | 150,500 | |
| | | | | | | | |
| | | | | | | 7,087,126 | |
Consumer Discretionary(a) — 0.3% | |
Carnival Corp. | | | | | | | | |
11.50%, 04/01/23 | | | 1,900 | | | | 2,197,768 | |
7.63%, 03/01/26 | | | 310 | | | | 337,742 | |
9.88%, 08/01/27 | | | 510 | | | | 586,500 | |
NCL Corp. Ltd. | | | | | | | | |
10.25%, 02/01/26 | | | 500 | | | | 585,000 | |
5.88%, 03/15/26 | | | 685 | | | | 720,497 | |
Nielsen Finance LLC/Nielsen Finance Co., 5.88%, 10/01/30 | | | 400 | | | | 452,500 | |
Royal Caribbean Cruises Ltd. | | | | | | | | |
10.88%, 06/01/23 | | | 50 | | | | 56,894 | |
9.13%, 06/15/23 | | | 90 | | | | 97,650 | |
11.50%, 06/01/25 | | | 2,180 | | | | 2,548,529 | |
Viking Cruises Ltd., 13.00%, 05/15/25 | | | 1,000 | | | | 1,195,000 | |
| | | | | | | | |
| | | | | | | 8,778,080 | |
Consumer Finance — 0.9% | |
American Express Co. | | | | | | | | |
3.70%, 11/05/21 | | | 500 | | | | 512,773 | |
2.75%, 05/20/22 | | | 100 | | | | 103,165 | |
2.50%, 08/01/22 | | | 50 | | | | 51,588 | |
3.40%, 02/27/23 | | | 50 | | | | 53,178 | |
2.50%, 07/30/24 | | | 290 | | | | 309,373 | |
Capital One Financial Corp. | | | | | | | | |
3.45%, 04/30/21 | | | 26 | | | | 26,193 | |
3.20%, 01/30/23 | | | 660 | | | | 695,377 | |
Curo Group Holdings Corp.,
8.25%, 09/01/25(a) | | | 50 | | | | 47,500 | |
Enova International, Inc.,
8.50%, 09/15/25(a) | | | 850 | | | | 826,625 | |
Equifax, Inc. | | | | | | | | |
2.60%, 12/15/25 | | | 105 | | | | 113,336 | |
3.10%, 05/15/30 | | | 205 | | | | 228,031 | |
Global Payments, Inc. | | | | | | | | |
4.00%, 06/01/23 | | | 3,550 | | | | 3,839,245 | |
2.90%, 05/15/30 | | | 350 | | | | 381,106 | |
goeasy Ltd., 5.38%, 12/01/24(a) | | | 555 | | | | 577,200 | |
IHS Markit Ltd. | | | | | | | | |
4.13%, 08/01/23 | | | 2,035 | | | | 2,212,655 | |
3.63%, 05/01/24 | | | 80 | | | | 87,262 | |
4.25%, 05/01/29 | | | 150 | | | | 182,229 | |
Mastercard, Inc. | | | | | | | | |
2.95%, 11/21/26 | | | 380 | | | | 424,733 | |
3.30%, 03/26/27 | | | 210 | | | | 239,586 | |
3.50%, 02/26/28 | | | 30 | | | | 34,587 | |
2.95%, 06/01/29 | | | 260 | | | | 291,815 | |
MPH Acquisition Holdings LLC, 5.75%, 11/01/28(a) | | | 1,530 | | | | 1,503,684 | |
Navient Corp. | | | | | | | | |
6.63%, 07/26/21 | | | 25 | | | | 25,531 | |
7.25%, 09/25/23 | | | 1,100 | | | | 1,205,578 | |
6.13%, 03/25/24 | | | 50 | | | | 53,375 | |
5.88%, 10/25/24 | | | 25 | | | | 26,563 | |
6.75%, 06/25/25 | | | 200 | | | | 217,500 | |
6.75%, 06/15/26 | | | 150 | | | | 162,938 | |
5.00%, 03/15/27 | | | 450 | | | | 453,937 | |
| | |
SCHEDULE OF INVESTMENTS | | 23 |
| | |
Schedule of Investments (continued) December 31, 2020 | | BlackRock Systematic Multi-Strategy Fund (Percentages shown are based on Net Assets) |
| | | | | | | | |
| | |
| Security | | Par
(000) | | | Value | |
| |
| Consumer Finance (continued) | | | | |
Navient Corp. (continued) | | | | | | | | |
5.63%, 08/01/33 | | $ | 250 | | | $ | 240,000 | |
OneMain Finance Corp. | | | | | | | | |
6.13%, 05/15/22 | | | 50 | | | | 53,000 | |
6.88%, 03/15/25 | | | 250 | | | | 290,313 | |
8.88%, 06/01/25 | | | 710 | | | | 803,187 | |
7.13%, 03/15/26 | | | 490 | | | | 579,425 | |
6.63%, 01/15/28 | | | 100 | | | | 118,750 | |
5.38%, 11/15/29 | | | 995 | | | | 1,119,375 | |
PayPal Holdings, Inc. | | | | | | | | |
2.20%, 09/26/22 | | | 3,055 | | | | 3,156,556 | |
1.35%, 06/01/23 | | | 900 | | | | 921,523 | |
2.40%, 10/01/24 | | | 170 | | | | 181,667 | |
2.65%, 10/01/26 | | | 205 | | | | 225,336 | |
2.85%, 10/01/29 | | | 350 | | | | 388,781 | |
2.30%, 06/01/30 | | | 695 | | | | 744,221 | |
Refinitiv US Holdings, Inc.(a) | | | | | | | | |
6.25%, 05/15/26 | | | 15 | | | | 16,013 | |
8.25%, 11/15/26 | | | 20 | | | | 21,825 | |
S&P Global, Inc. | | | | | | | | |
2.50%, 12/01/29 | | | 115 | | | | 125,430 | |
1.25%, 08/15/30 | | | 1,905 | | | | 1,878,016 | |
Sabre GLBL, Inc., 7.38%, 09/01/25(a) | | | 600 | | | | 651,000 | |
Shift4 Payments LLC/Shift4 Payments Finance Sub, Inc., 4.63%, 11/01/26(a) | | | 150 | | | | 156,000 | |
SLM Corp., 4.20%, 10/29/25 | | | 1,275 | | | | 1,346,719 | |
Springleaf Finance Corp., 6.13%, 03/15/24 | | | 1,100 | | | | 1,201,750 | |
Verscend Escrow Corp.,
9.75%, 08/15/26(a) | | | 15 | | | | 16,256 | |
Visa, Inc. | | | | | | | | |
1.90%, 04/15/27 | | | 300 | | | | 319,295 | |
2.05%, 04/15/30 | | | 1,210 | | | | 1,294,119 | |
| | | | | | | | |
| | | | | | | 30,735,220 | |
| |
| Containers & Packaging — 0.3% | | | | |
Berry Global, Inc. | | | | | | | | |
5.13%, 07/15/23 | | | 29 | | | | 29,363 | |
4.88%, 07/15/26(a) | | | 150 | | | | 161,128 | |
Cascades, Inc./Cascades USA, Inc.(a) | | | | | | | | |
5.13%, 01/15/26 | | | 200 | | | | 211,250 | |
5.38%, 01/15/28 | | | 1,495 | | | | 1,588,905 | |
Clearwater Paper Corp.(a) | | | | | | | | |
5.38%, 02/01/25 | | | 35 | | | | 37,931 | |
4.75%, 08/15/28 | | | 625 | | | | 646,875 | |
Crown Americas LLC/Crown Americas Capital Corp. VI, 4.75%, 02/01/26 | | | 1,000 | | | | 1,037,500 | |
Graham Packaging Co., Inc.,
7.13%, 08/15/28(a) | | | 300 | | | | 331,500 | |
Graphic Packaging International LLC(a) | | | | | | | | |
3.50%, 03/15/28 | | | 250 | | | | 259,062 | |
3.50%, 03/01/29 | | | 450 | | | | 460,125 | |
Intelligent Packaging Ltd. Finco, Inc./Intelligent | | | | | | | | |
Packaging Ltd. Co-Issuer LLC,
6.00%, 09/15/28(a) | | | 1,710 | | | | 1,757,025 | |
LABL Escrow Issuer LLC, 6.75%, 07/15/26(a) | | | 500 | | | | 541,485 | |
Plastipak Holdings, Inc.,
6.25%, 10/15/25(a) | | | 200 | | | | 206,000 | |
Reynolds Group Issuer, Inc./Reynolds Group Issuer LLC/Reynolds Group Issuer Lu(a) | | | | | | | | |
5.13%, 07/15/23 | | | 2 | | | | 2,025 | |
4.00%, 10/15/27 | | | 500 | | | | 512,500 | |
| | | | | | | | |
| | |
| Security | | Par
(000) | | | Value | |
| |
| Containers & Packaging (continued) | | | | |
Sealed Air Corp.(a) | | | | | | | | |
5.50%, 09/15/25 | | $ | 25 | | | $ | 27,969 | |
4.00%, 12/01/27 | | | 200 | | | | 213,500 | |
6.88%, 07/15/33 | | | 500 | | | | 660,000 | |
| | | | | | | | |
| | | | | | | 8,684,143 | |
| |
| Diversified Consumer Services — 0.0% | | | | |
Allied Universal Holdco LLC/Allied Universal Finance Corp., 6.63%, 07/15/26(a) | | | 20 | | | | 21,326 | |
Carriage Services, Inc., 6.63%, 06/01/26(a) | | | 400 | | | | 427,500 | |
Graham Holdings Co., 5.75%, 06/01/26(a) | | | 540 | | | | 567,000 | |
Service Corp. International | | | | | | | | |
4.63%, 12/15/27 | | | 50 | | | | 53,250 | |
5.13%, 06/01/29 | | | 55 | | | | 60,913 | |
3.38%, 08/15/30 | | | 305 | | | | 317,264 | |
| | | | | | | | |
| | | | | | | 1,447,253 | |
| |
| Diversified Financial Services — 7.3% | | | | |
AerCap Ireland Capital DAC/AerCap Global Aviation Trust | | | | | | | | |
4.50%, 09/15/23 | | | 1,760 | | | | 1,908,232 | |
6.50%, 07/15/25 | | | 985 | | | | 1,177,518 | |
Air Lease Corp. | | | | | | | | |
3.50%, 01/15/22 | | | 1,030 | | | | 1,059,983 | |
2.25%, 01/15/23 | | | 2,000 | | | | 2,053,438 | |
3.38%, 07/01/25 | | | 715 | | | | 768,910 | |
2.88%, 01/15/26 | | | 1,415 | | | | 1,497,260 | |
Ally Financial, Inc. | | | | | | | | |
3.05%, 06/05/23 | | | 220 | | | | 231,968 | |
1.45%, 10/02/23 | | | 2,370 | | | | 2,419,341 | |
5.13%, 09/30/24 | | | 25 | | | | 28,821 | |
5.75%, 11/20/25 | | | 150 | | | | 174,636 | |
Banco Santander SA | | | | | | | | |
3.85%, 04/12/23 | | | 2,000 | | | | 2,148,238 | |
2.75%, 05/28/25 | | | 800 | | | | 854,020 | |
3.49%, 05/28/30 | | | 1,000 | | | | 1,120,785 | |
2.75%, 12/03/30 | | | 200 | | | | 206,145 | |
Bank of America Corp. | | | | | | | | |
3.30%, 01/11/23 | | | 2,000 | | | | 2,120,420 | |
4.00%, 01/22/25 | | | 2,180 | | | | 2,449,626 | |
3.88%, 08/01/25 | | | 1,000 | | | | 1,139,795 | |
(3 mo. LIBOR US + 0.79%), 3.00%, 12/20/23(c) | | | 3,253 | | | | 3,423,815 | |
(3 mo. LIBOR US + 0.87%), 2.46%, 10/22/25(c) | | | 2,000 | | | | 2,132,058 | |
(3 mo. LIBOR US + 0.94%), 3.86%, 07/23/24(c) | | | 2,410 | | | | 2,612,926 | |
(3 mo. LIBOR US + 0.97%), 3.46%, 03/15/25(c) | | | 200 | | | | 217,758 | |
(3 mo. LIBOR US + 1.02%), 2.88%, 04/24/23(c) | | | 50 | | | | 51,596 | |
(3 mo. LIBOR US + 1.06%), 3.56%, 04/23/27(c) | | | 1,500 | | | | 1,693,663 | |
(3 mo. LIBOR US + 1.16%), 3.12%, 01/20/23(c) | | | 3,200 | | | | 3,291,869 | |
(3 mo. LIBOR US + 1.31%), 4.27%, 07/23/29(c) | | | 305 | | | | 363,178 | |
(Secured Overnight Financing Rate + 0.74%), 0.81%, 10/24/24(c) | | | 3,715 | | | | 3,749,714 | |
(Secured Overnight Financing Rate + 0.91%), 0.98%, 09/25/25(c) | | | 1,010 | | | | 1,020,988 | |
(Secured Overnight Financing Rate + 1.15%), 1.32%, 06/19/26(c) | | | 8,520 | | | | 8,701,740 | |
Barclays PLC | | | | | | | | |
5.20%, 05/12/26 | | | 400 | | | | 465,088 | |
(1 year CMT + 0.80%), 1.01%, 12/10/24(c) | | | 2,690 | | | | 2,709,072 | |
(3 mo. LIBOR US + 2.45%),
2.85%, 05/07/26(c) | | | 1,150 | | | | 1,235,032 | |
| | |
| 24 | | 2 0 2 0 BLACK ROCK ANNUAL REPORT TO SHAREHOLDERS |
| | |
Schedule of Investments (continued) December 31, 2020 | | BlackRock Systematic Multi-Strategy Fund (Percentages shown are based on Net Assets) |
| | | | | | | | | | | | |
| Security | | | Par
(000) | | | Value | |
|
| Diversified Financial Services (continued) | |
Barclays PLC (continued) | | | | | | | | | | | | |
(3 mo. LIBOR US + 3.05%),
5.09 %, 06/20/30(c) | | | | | | $ | 200 | | | $ | 239,917 | |
Citigroup, Inc. | | | | | | | | | | | | |
2.90%, 12/08/21 | | | | | | | 500 | | | | 510,806 | |
4.50%, 01/14/22 | | | | | | | 50 | | | | 52,134 | |
2.75%, 04/25/22 | | | | | | | 1,100 | | | | 1,132,876 | |
3.75%, 06/16/24 | | | | | | | 2,500 | | | | 2,765,364 | |
4.45%, 09/29/27 | | | | | | | 240 | | | | 283,713 | |
(3 mo. LIBOR US + 0.90%),
3.35%, 04/24/25(c) | | | | | | | 2,725 | | | | 2,962,554 | |
(3 mo. LIBOR US + 0.95%),
2.88%, 07/24/23(c) | | | | | | | 1,385 | | | | 1,438,714 | |
(3 mo. LIBOR US + 1.02%),
4.04%, 06/01/24(c) | | | | | | | 50 | | | | 54,377 | |
(3 mo. LIBOR US + 1.15%), 3.52%, 10/27/28(c) | | | | | | | 1,140 | | | | 1,288,832 | |
(Secured Overnight Financing Rate + 0.69%), 0.78%, 10/30/24(c) | | | | | | | 13,120 | | | | 13,205,112 | |
(Secured Overnight Financing Rate + 0.87%), 2.31%, 11/04/22(c) | | | | | | | 500 | | | | 507,989 | |
(Secured Overnight Financing Rate + 1.42%), 2.98%, 11/05/30(c) | | | | | | | 2,950 | | | | 3,248,874 | |
(Secured Overnight Financing Rate + 1.67%), 1.68%, 05/15/24(c) | | | | | | | 1,960 | | | | 2,019,018 | |
(Secured Overnight Financing Rate + 2.75%), 3.11%, 04/08/26(c) | | | | | | | 3,135 | | | | 3,425,182 | |
Credit Acceptance Corp., 6.63%, 03/15/26 | | | | | | | 360 | | | | 383,400 | |
Deutsche Bank AG | | | | | | | | | | | | |
4.50%, 04/01/25 | | | | | | | 1,400 | | | | 1,518,755 | |
(5 year USD Swap + 2.25%),
4.30 %, 05/24/28(c) | | | | | | | 2,650 | | | | 2,730,568 | |
Deutsche Bank AG, New York(c)
| | | | | | | | | | | | |
(5 year USD ICE Swap + 2.55%), 4.88%, 12/01/32 | | | | | | | 900 | | | | 941,760 | |
(Secured Overnight Financing Rate + 1.87%), 2.13%, 11/24/26 | | | | | | | 2,175 | | | | 2,225,978 | |
(Secured Overnight Financing Rate + 2.16%), 2.22%, 09/18/24 | | | | | | | 2,005 | | | | 2,062,621 | |
Global Aircraft Leasing Co. Ltd., (6.50% Cash or 7.25% PIK),
6.50 %, 09/15/24(a)(e) | | | | | | | 52 | | | | 46,242 | |
Goldman Sachs Group, Inc. | | | | | | | | | | | | |
5.25%, 07/27/21 | | | | | | | 150 | | | | 154,212 | |
5.75%, 01/24/22 | | | | | | | 500 | | | | 528,498 | |
3.20%, 02/23/23 | | | | | | | 1,500 | | | | 1,584,928 | |
3.63%, 02/20/24 | | | | | | | 3,590 | | | | 3,907,052 | |
4.00%, 03/03/24 | | | | | | | 1,000 | | | | 1,104,972 | |
3.50%, 01/23/25 | | | | | | | 1,060 | | | | 1,169,879 | |
3.50%, 04/01/25 | | | | | | | 2,895 | | | | 3,216,315 | |
3.75%, 05/22/25 | | | | | | | 75 | | | | 84,206 | |
4.25%, 10/21/25 | | | | | | | 530 | | | | 607,805 | |
3.75%, 02/25/26 | | | | | | | 75 | | | | 85,196 | |
3.50%, 11/16/26 | | | | | | | 35 | | | | 39,293 | |
2.60%, 02/07/30 | | | | | | | 3,090 | | | | 3,323,764 | |
(3 mo. LIBOR US + 1.05%),
2.91%, 06/05/23(c) | | | | | | | 790 | | | | 818,085 | |
(3 mo. LIBOR US + 1.16%),
3.81%, 04/23/29(c) | | | | | | | 3,015 | | | | 3,489,622 | |
(3 mo. LIBOR US + 1.20%),
3.27%, 09/29/25(c) | | | | | | | 125 | | | | 136,928 | |
(3 mo. LIBOR US + 1.30%),
4.22%, 05/01/29(c) | | | | | | | 250 | | | | 296,591 | |
Series VAR, (Secured Overnight Financing Rate + 0.54%),
0.63%, 11/17/23(c) | | | | | | | 5,680 | | | | 5,702,983 | |
Series VAR, (Secured Overnight Financing Rate + 0.79%),
1.09%, 12/09/26(c) | | | | | | | 6,100 | | | | 6,167,052 | |
Horizon Pharma USA, Inc.,
5.50%, 08/01/27(a) | | | | | | | 2,450 | | | | 2,630,859 | |
HSBC Holdings PLC | | | | | | | | | | | | |
3.60%, 05/25/23 | | | | | | | 1,500 | | | | 1,613,418 | |
(3 mo. LIBOR US + 1.06%),
3.26%, 03/13/23(c) | | | | | | | 1,200 | | | | 1,239,535 | |
(3 mo. LIBOR US + 1.61%),
3.97%, 05/22/30(c) | | | | | | | 2,760 | | | | 3,187,110 | |
| | | | | | | | | | | | |
| Security | | | Par
(000) | | | Value | |
|
| Diversified Financial Services (continued) | |
HSBC Holdings PLC (continued) | | | | | | | | | | | | |
(Secured Overnight Financing Rate + 1.29%), 1.59%, 05/24/27(c) | | | | | | $ | 11,120 | | | $ | 11,308,119 | |
(Secured Overnight Financing Rate + 1.54%), 1.65%, 04/18/26(c) | | | | | | | 1,225 | | | | 1,252,883 | |
Intercontinental Exchange, Inc. | | | | | | | | | | | | |
0.70%, 06/15/23 | | | | | | | 2,090 | | | | 2,104,475 | |
3.75%, 12/01/25 | | | | | | | 2,105 | | | | 2,384,521 | |
2.10%, 06/15/30 | | | | | | | 640 | | | | 664,307 | |
Jefferies Finance LLC/JFIN Co-Issuer Corp., 6.25%, 06/03/26(a) | | | | | | | 200 | | | | 207,063 | |
John Deere Capital Corp., 2.60%, 03/07/24 | | | | | | | 40 | | | | 42,826 | |
JPMorgan Chase & Co. | | | | | | | | | | | | |
3.25%, 09/23/22 | | | | | | | 1,000 | | | | 1,051,710 | |
2.97%, 01/15/23 | | | | | | | 600 | | | | 616,341 | |
3.88%, 09/10/24 | | | | | | | 25 | | | | 27,995 | |
3.13%, 01/23/25 | | | | | | | 50 | | | | 54,763 | |
3.30%, 04/01/26 | | | | | | | 650 | | | | 727,492 | |
(3 mo. LIBOR US + 0.70%),
3.21%, 04/01/23(c) | | | | | | | 2,700 | | | | 2,798,045 | |
(3 mo. LIBOR US + 0.94%), 2.78%, 04/25/23(c) | | | | | | | 790 | | | | 815,544 | |
(3 mo. LIBOR US + 0.95%),
3.51%, 01/23/29(c) | | | | | | | 750 | | | | 852,964 | |
(3 mo. LIBOR US + 1.00%),
4.02%, 12/05/24(c) | | | | | | | 3,150 | | | | 3,470,129 | |
(3 mo. LIBOR US + 1.16%),
3.22%, 03/01/25(c) | | | | | | | 50 | | | | 53,916 | |
(3 mo. LIBOR US + 1.16%),
3.70%, 05/06/30(c) | | | | | | | 955 | | | | 1,107,833 | |
(3 mo. LIBOR US + 1.25%),
3.96%, 01/29/27(c) | | | | | | | 1,300 | | | | 1,493,814 | |
(3 mo. LIBOR US + 1.26%),
4.20%, 07/23/29(c) | | | | | | | 35 | | | | 41,846 | |
(3 mo. LIBOR US + 1.34%),
3.78%, 02/01/28(c) | | | | | | | 300 | | | | 344,810 | |
(Secured Overnight Financing Rate + 0.60%), 0.65%, 09/16/24(c) | | | | | | | 3,970 | | | | 3,991,024 | |
(Secured Overnight Financing Rate + 0.80%), 1.05%, 11/19/26(c) | | | | | | | 8,505 | | | | 8,601,107 | |
(Secured Overnight Financing Rate + 1.16%), 2.30%, 10/15/25(c) | | | | | | | 4,160 | | | | 4,415,948 | |
(Secured Overnight Financing Rate + 1.51%), 2.74%, 10/15/30(c) | | | | | | | 1,000 | | | | 1,087,333 | |
Ladder Capital Finance Holdings LLLP/Ladder Capital Finance Corp., 4.25%, 02/01/27(a) | | | | | | | 230 | | | | 225,975 | |
Mitsubishi UFJ Financial Group, Inc.,
2.05%, 07/17/30 | | | | | | | 1,760 | | | | 1,838,954 | |
Mizuho Financial Group, Inc.(c) | | | | | | | | | | | | |
(3 mo. LIBOR US + 0.61%),
0.85%, 09/08/24 | | | | | | | 3,330 | | | | 3,350,286 | |
(3 mo. LIBOR US + 0.99%),
1.24%, 07/10/24 | | | | | | | 2,490 | | | | 2,531,316 | |
(3 mo. LIBOR US + 1.00%),
3.92%, 09/11/24 | | | | | | | 2,823 | | | | 3,069,479 | |
Morgan Stanley | | | | | | | | | | | | |
5.75%, 01/25/21 | | | | | | | 1,060 | | | | 1,063,163 | |
3.70%, 10/23/24 | | | | | | | 25 | | | | 27,820 | |
(3 mo. LIBOR US + 0.85%),
3.74%, 04/24/24(c) | | | | | | | 3,130 | | | | 3,367,747 | |
(3 mo. LIBOR US + 1.34%),
3.59%, 07/22/28(c) | | | | | | | 325 | | | | 371,051 | |
(Secured Overnight Financing Rate + 0.72%), 0.99%, 12/10/26(c) | | | | | | | 12,180 | | | | 12,270,646 | |
(Secured Overnight Financing Rate + 1.14%), 2.70%, 01/22/31(c) | | | | | | | 2,090 | | | | 2,275,494 | |
(Secured Overnight Financing Rate + 1.99%), 2.19%, 04/28/26(c) | | | | | | | 1,310 | | | | 1,383,677 | |
Series I, (Secured Overnight Financing Rate + 0.75%), 0.86%, 10/21/25(c) | | | | | | | 3,590 | | | | 3,619,506 | |
Natwest Group PLC, (1 year CMT + 2.15%), 2.36%, 05/22/24(c) | | | | | | | 470 | | | | 489,054 | |
ORIX Corp., 2.90%, 07/18/22 | | | | | | | 25 | | | | 25,910 | |
Spectrum Brands, Inc., 5.00%, 10/01/29(a) | | | | | | | 20 | | | | 21,478 | |
Starwood Property Trust Inc.,
5.50%, 11/01/23(a) | | | | | | | 730 | | | | 762,850 | |
| | |
SCHEDULE OF INVESTMENTS | | 25 |
| | |
Schedule of Investments (continued) December 31, 2020 | | BlackRock Systematic Multi-Strategy Fund (Percentages shown are based on Net Assets) |
| | | | | | | | |
| Security | | Par
(000) | | | Value | |
|
| Diversified Financial Services (continued) | |
Stena International SA, 6.13%, 02/01/25(a) | | $ | 200 | | | $ | 197,500 | |
Sumitomo Mitsui Financial Group, Inc. | | | | | | | | |
2.35%, 01/15/25 | | | 360 | | | | 381,996 | |
1.47%, 07/08/25 | | | 8,572 | | | | 8,778,927 | |
2.13%, 07/08/30 | | | 1,830 | | | | 1,907,407 | |
UniCredit SPA, (5 year CMT + 4.75%),
5.46%, 06/30/35(a)(c) | | | 3,625 | | | | 3,988,724 | |
| | | | | | | | |
| | | | | | | 238,626,490 | |
|
| Diversified Telecommunication Services — 0.8% | |
AT&T, Inc., 1.65%, 02/01/28 | | | 2,075 | | | | 2,117,109 | |
CenturyLink, Inc. | | | | | | | | |
5.13%, 12/15/26(a) | | | 495 | | | | 522,700 | |
4.00%, 02/15/27(a) | | | 285 | | | | 294,263 | |
4.50%, 01/15/29(a) | | | 1,415 | | | | 1,439,762 | |
Series G, 6.88%, 01/15/28 | | | 50 | | | | 57,906 | |
Series P, 7.60%, 09/15/39 | | | 50 | | | | 60,750 | |
Series W, 6.75%, 12/01/23 | | | 100 | | | | 111,375 | |
Series Y, 7.50%, 04/01/24 | | | 25 | | | | 28,313 | |
Consolidated Communications, Inc.,
6.50%, 10/01/28(a) | | | 250 | | | | 267,500 | |
Frontier Communications Corp.(a) | | | | | | | | |
5.88%, 10/15/27 | | | 85 | | | | 91,906 | |
5.00%, 05/01/28 | | | 2,275 | | | | 2,371,687 | |
6.75%, 05/01/29 | | | 165 | | | | 176,550 | |
Level 3 Financing, Inc. | | | | | | | | |
5.38%, 01/15/24 | | | 100 | | | | 100,780 | |
5.25%, 03/15/26 | | | 25 | | | | 25,833 | |
4.63%, 09/15/27(a) | | | 95 | | | | 99,221 | |
3.63%, 01/15/29(a) | | | 1,700 | | | | 1,695,750 | |
Sprint Capital Corp. | | | | | | | | |
6.88%, 11/15/28 | | | 1,071 | | | | 1,412,092 | |
8.75%, 03/15/32 | | | 3,120 | | | | 4,940,130 | |
Switch Ltd., 3.75%, 09/15/28(a) | | | 1,200 | | | | 1,218,000 | |
Telecom Italia Capital SA | | | | | | | | |
6.38%, 11/15/33 | | | 900 | | | | 1,107,000 | |
6.00%, 09/30/34 | | | 850 | | | | 1,035,376 | |
7.20%, 07/18/36 | | | 200 | | | | 269,834 | |
7.72%, 06/04/38 | | | 50 | | | | 69,500 | |
Verizon Communications, Inc. | | | | | | | | |
3.38%, 02/15/25 | | | 3,000 | | | | 3,331,905 | |
3.00%, 03/22/27 | | | 440 | | | | 488,156 | |
1.68%, 10/30/30(a) | | | 2,273 | | | | 2,263,804 | |
Zayo Group Holdings, Inc.(a) | | | | | | | | |
4.00%, 03/01/27 | | | 505 | | | | 506,263 | |
6.13%, 03/01/28 | | | 310 | | | | 327,825 | |
| | | | | | | | |
| | | | | | | 26,431,290 | |
| | |
| Electric Utilities — 0.9% | | | | | | |
AEP Texas, Inc., 3.95%, 06/01/28 | | | 50 | | | | 58,486 | |
Ameren Corp., 3.50%, 01/15/31 | | | 140 | | | | 161,526 | |
Atlantic City Electric Co., 4.00%, 10/15/28 | | | 50 | | | | 58,707 | |
Avangrid, Inc., 3.80%, 06/01/29 | | | 100 | | | | 114,690 | |
Berkshire Hathaway Energy Co. | | | | | | | | |
4.05%, 04/15/25(a) | | | 330 | | | | 373,649 | |
3.25%, 04/15/28 | | | 100 | | | | 114,315 | |
1.65%, 05/15/31(a) | | | 245 | | | | 244,965 | |
Commonwealth Edison Co., 2.20%, 03/01/30 | | | 170 | | | | 181,941 | |
Consolidated Edison Co. of New York, Inc., Series 20A, 3.35%, 04/01/30 | | | 330 | | | | 378,155 | |
| | | | | | | | |
| Security | | Par
(000) | | | Value | |
| | |
| Electric Utilities (continued) | | | | | | |
Dominion Energy, Inc. | | | | | | | | |
2.72%, 08/15/21(b) | | $ | 500 | | | $ | 506,169 | |
4.25%, 06/01/28 | | | 165 | | | | 197,904 | |
Series B, 2.75%, 01/15/22 | | | 50 | | | | 51,083 | |
Series B, 3.60%, 03/15/27 | | | 1,300 | | | | 1,477,402 | |
Series C, 3.38%, 04/01/30 | | | 310 | | | | 353,119 | |
DPL, Inc., 4.35%, 04/15/29 | | | 200 | | | | 224,354 | |
DTE Electric Co., Series C, 2.63%, 03/01/31 | | | 390 | | | | 431,767 | |
DTE Energy Co. | | | | | | | | |
Series C, 3.40%, 06/15/29 | | | 130 | | | | 147,373 | |
Series D, 3.70%, 08/01/23 | | | 380 | | | | 410,374 | |
Series F, 1.05%, 06/01/25 | | | 630 | | | | 637,073 | |
Duke Energy Corp. | | | | | | | | |
3.05%, 08/15/22 | | | 50 | | | | 51,795 | |
3.75%, 04/15/24 | | | 1,180 | | | | 1,299,142 | |
3.40%, 06/15/29 | | | 255 | | | | 289,496 | |
Duke Energy Florida LLC, 1.75%, 06/15/30 | | | 115 | | | | 117,588 | |
Entergy Corp., 0.90%, 09/15/25 | | | 290 | | | | 289,902 | |
Entergy Louisiana LLC, 1.60%, 12/15/30 | | | 2,520 | | | | 2,545,662 | |
Entergy Texas, Inc., 4.00%, 03/30/29 | | | 50 | | | | 58,392 | |
Evergy, Inc., 2.90%, 09/15/29 | | | 100 | | | | 109,613 | |
Eversource Energy | | | | | | | | |
Series L, 2.90%, 10/01/24 | | | 800 | | | | 863,358 | |
Series N, 3.80%, 12/01/23 | | | 100 | | | | 109,477 | |
Exelon Corp., 3.95%, 06/15/25 | | | 1,500 | | | | 1,696,777 | |
Exelon Generation Co. LLC, 3.25%, 06/01/25 | | | 770 | | | | 839,617 | |
FirstEnergy Corp. | | | | | | | | |
Series C, 4.85%, 07/15/47 | | | 500 | | | | 622,248 | |
Series C, 3.40%, 03/01/50 | | | 1,000 | | | | 957,833 | |
Florida Power & Light Co., 2.85%, 04/01/25 | | | 35 | | | | 38,089 | |
Georgia Power Co. | | | | | | | | |
3.25%, 03/30/27 | | | 50 | | | | 55,264 | |
Series B, 2.65%, 09/15/29 | | | 700 | | | | 767,910 | |
Interstate Power and Light Co., 2.30%, 06/01/30 | | | 310 | | | | 327,813 | |
MidAmerican Energy Co., 3.65%, 04/15/29 | | | 310 | | | | 368,199 | |
National Rural Utilities Cooperative Finance Corp. | | | | | | | | |
3.70%, 03/15/29 | | | 100 | | | | 116,933 | |
2.40%, 03/15/30 | | | 1,105 | | | | 1,198,479 | |
Nevada Power Co., Series DD, 2.40%, 05/01/30 | | | 700 | | | | 753,322 | |
NextEra Energy Capital Holdings, Inc. | | | | | | | | |
2.80%, 01/15/23 | | | 1,080 | | | | 1,129,906 | |
2.75%, 05/01/25 | | | 145 | | | | 156,865 | |
3.50%, 04/01/29 | | | 150 | | | | 171,738 | |
2.75%, 11/01/29 | | | 1,005 | | | | 1,094,920 | |
NextEra Energy Operating Partners LP(a) | | | | | | | | |
4.25%, 07/15/24 | | | 30 | | | | 32,100 | |
4.25%, 09/15/24 | | | 25 | | | | 26,750 | |
4.50%, 09/15/27 | | | 1,100 | | | | 1,231,197 | |
Pacific Gas and Electric Co. | | | | | | | | |
1.75%, 06/16/22 | | | 330 | | | | 330,931 | |
2.10%, 08/01/27 | | | 35 | | | | 35,617 | |
PG&E Corp., 5.25%, 07/01/30 | | | 1,580 | | | | 1,738,000 | |
PSEG Power LLC, 3.85%, 06/01/23 | | | 100 | | | | 107,589 | |
Public Service Enterprise Group, Inc.,
1.60%, 08/15/30 | | | 110 | | | | 108,457 | |
Sempra Energy, 3.40%, 02/01/28 | | | 50 | | | | 56,946 | |
Southern California Edison Co. | | | | | | | | |
2.85%, 08/01/29 | | | 115 | | | | 125,121 | |
Series B, 3.65%, 03/01/28 | | | 770 | | | | 864,249 | |
| | |
| 26 | | 2 0 2 0 BLACK ROCK ANNUAL REPORT TO SHAREHOLDERS |
| | |
Schedule of Investments (continued) December 31, 2020 | | BlackRock Systematic Multi-Strategy Fund (Percentages shown are based on Net Assets) |
| | | | | | | | |
| Security | | Par
(000) | | | Value | |
| | |
| Electric Utilities (continued) | | | | | | |
Talen Energy Supply LLC(a) | | | | | | | | |
10.50%, 01/15/26 | | $ | 125 | | | $ | 111,191 | |
7.25%, 05/15/27 | | | 60 | | | | 63,900 | |
6.63%, 01/15/28 | | | 850 | | | | 888,250 | |
Tucson Electric Power Co., 1.50%, 08/01/30 | | | 30 | | | | 29,709 | |
Union Electric Co. | | | | | | | | |
3.50%, 03/15/29 | | | 50 | | | | 57,666 | |
2.95%, 03/15/30 | | | 240 | | | | 267,840 | |
| | | | | | | | |
| | | | | | | 28,228,903 | |
| | |
| Electrical Equipment — 0.1% | | | | | | |
FXI Holdings, Inc.(a) | | | | | | | | |
7.88%, 11/01/24 | | | 150 | | | | 151,125 | |
12.25%, 11/15/26 | | | 250 | | | | 285,000 | |
GrafTech Finance, Inc., 4.63%, 12/15/28(a) | | | 245 | | | �� | 247,756 | |
Roper Technologies, Inc. | | | | | | | | |
0.45%, 08/15/22 | | | 275 | | | | 275,446 | |
3.65%, 09/15/23 | | | 830 | | | | 900,586 | |
2.35%, 09/15/24 | | | 90 | | | | 96,046 | |
1.00%, 09/15/25 | | | 590 | | | | 597,119 | |
2.00%, 06/30/30 | | | 75 | | | | 76,659 | |
| | | | | | | | |
| | | | | | | 2,629,737 | |
|
| Electronic Equipment, Instruments & Components — 0.2% | |
Amphenol Corp., 2.05%, 03/01/25 | | | 105 | | | | 110,922 | |
BWX Technologies, Inc., 4.13%, 06/30/28(a) | | | 1,245 | | | | 1,296,356 | |
CDW LLC/CDW Finance Corp. | | | | | | | | |
5.50%, 12/01/24 | | | 100 | | | | 111,799 | |
4.13%, 05/01/25 | | | 220 | | | | 230,160 | |
4.25%, 04/01/28 | | | 605 | | | | 638,735 | |
Energizer Holdings, Inc., 4.75%, 06/15/28(a) | | | 170 | | | | 178,925 | |
Keysight Technologies, Inc. | | | | | | | | |
4.55%, 10/30/24 | | | 2,000 | | | | 2,261,433 | |
4.60%, 04/06/27 | | | 130 | | | | 154,946 | |
3.00%, 10/30/29 | | | 80 | | | | 88,326 | |
Trimble, Inc., 4.90%, 06/15/28 | | | 760 | | | | 909,406 | |
Xerox Corp., 4.38%, 03/15/23 | | | 100 | | | | 105,000 | |
Xerox Holdings Corp., 5.50%, 08/15/28(a) | | | 1,500 | | | | 1,591,725 | |
| | | | | | | | |
| | | | | | | 7,677,733 | |
| | |
| Energy Equipment & Services — 0.0% | | | | | | |
Archrock Partners LP/Archrock Partners Finance Corp., 6.25%, 04/01/28(a) | | | 895 | | | | 931,659 | |
National Oilwell Varco, Inc., 3.60%, 12/01/29 | | | 243 | | | | 254,104 | |
Oceaneering International, Inc., 4.65%, 11/15/24 | | | 250 | | | | 227,500 | |
Weatherford International Ltd.,
11.00%, 12/01/24(a) | | | 100 | | | | 78,000 | |
| | | | | | | | |
| | | | | | | 1,491,263 | |
|
| Environmental, Maintenance, & Security Service — 0.1% | |
GFL Environmental, Inc.(a) | | | | | | | | |
3.75%, 08/01/25 | | | 325 | | | | 333,125 | |
5.13%, 12/15/26 | | | 180 | | | | 191,475 | |
4.00%, 08/01/28 | | | 1,510 | | | | 1,521,325 | |
Stericycle Inc., 3.88%, 01/15/29(a) | | | 170 | | | | 174,675 | |
Tervita Corp., 11.00%, 12/01/25(a) | | | 625 | | | | 672,525 | |
Waste Connections, Inc., 2.60%, 02/01/30 | | | 110 | | | | 118,400 | |
| | | | | | | | |
| | | | | | | 3,011,525 | |
|
| Equity Real Estate Investment Trusts (REITs) — 1.4% | |
American Tower Corp. | | | | | | | | |
3.50%, 01/31/23 | | | 2,545 | | | | 2,698,130 | |
0.60%, 01/15/24 | | | 4,360 | | | | 4,364,577 | |
5.00%, 02/15/24 | | | 1,570 | | | | 1,776,906 | |
| | | | | | | | |
| Security | | Par
(000) | | | Value | |
|
| Equity Real Estate Investment Trusts (REITs) (continued) | |
American Tower Corp. (continued) 2.95%, 01/15/25 | | $ | 200 | | | $ | 216,712 | |
Brixmor Operating Partnership LP, 4.05%, 07/01/30 . | | | 120 | | | | 137,733 | |
Brookfield Property REIT, Inc./BPR Cumulus LLC/BPR Nimbus LLC/GGSI Sellco LL,
5.75%, 05/15/26(a) | | | 275 | | | | 270,875 | |
Camden Property Trust | | | | | | | | |
3.15%, 07/01/29 | | | 1,000 | | | | 1,125,802 | |
2.80%, 05/15/30 | | | 220 | | | | 244,323 | |
Digital Realty Trust LP, 4.75%, 10/01/25 | | | 1,510 | | | | 1,767,664 | |
Equinix, Inc. | | | | | | | | |
2.63%, 11/18/24 | | | 5,150 | | | | 5,505,449 | |
1.25%, 07/15/25 | | | 1,075 | | | | 1,096,643 | |
2.90%, 11/18/26 | | | 2,015 | | | | 2,203,740 | |
5.38%, 05/15/27 | | | 50 | | | | 54,499 | |
3.20%, 11/18/29 | | | 150 | | | | 164,665 | |
ESH Hospitality, Inc., 5.25%, 05/01/25(a) | | | 500 | | | | 512,500 | |
Federal Realty Investment Trust, 3.50%, 06/01/30 | | | 1,315 | | | | 1,456,039 | |
Iron Mountain, Inc.(a) | | | | | | | | |
4.88%, 09/15/27 | | | 50 | | | | 52,250 | |
4.88%, 09/15/29 | | | 30 | | | | 31,650 | |
5.25%, 07/15/30 | | | 1,340 | | | | 1,447,200 | |
4.50%, 02/15/31 | | | 300 | | | | 314,250 | |
5.63%, 07/15/32 | | | 700 | | | | 771,750 | |
MGM Growth Properties Operating Partnership LP/MGP Finance Co-Issuer, Inc. | | | | | | | | |
5.63%, 05/01/24 | | | 1,050 | | | | 1,140,457 | |
4.63%, 06/15/25(a) | | | 1,210 | | | | 1,295,910 | |
5.75%, 02/01/27 | | | 160 | | | | 179,499 | |
3.88%, 02/15/29(a) | | | 620 | | | | 633,950 | |
MPT Operating Partnership LP/MPT Finance Corp. | | | | | | | | |
5.00%, 10/15/27 | | | 1,100 | | | | 1,170,125 | |
4.63%, 08/01/29 | | | 50 | | | | 53,437 | |
3.50%, 03/15/31 | | | 840 | | | | 867,300 | |
Omega Healthcare Investors, Inc. | | | | | | | | |
4.50%, 01/15/25 | | | 2,000 | | | | 2,189,109 | |
4.50%, 04/01/27 | | | 650 | | | | 731,099 | |
3.63%, 10/01/29 | | | 1,000 | | | | 1,061,178 | |
Park Intermediate Holdings LLC/PK Domestic Property LLC/PK Finance Co.Issuer,
5.88%, 10/01/28(a) | | | 1,615 | | | | 1,719,975 | |
Public Storage, 3.39%, 05/01/29 | | | 450 | | | | 515,005 | |
Realty Income Corp. | | | | | | | | |
4.65%, 08/01/23 | | | 1,000 | | | | 1,095,801 | |
3.25%, 01/15/31 | | | 480 | | | | 544,139 | |
RHP Hotel Properties LP/RHP Finance Corp.,
4.75%, 10/15/27 | | | 100 | | | | 103,500 | |
Senior Housing Properties Trust,
4.75%, 02/15/28 | | | 1,500 | | | | 1,492,500 | |
Service Properties Trust | | | | | | | | |
4.65%, 03/15/24 | | | 200 | | | | 198,000 | |
7.50%, 09/15/25 | | | 170 | | | | 195,894 | |
5.50%, 12/15/27 | | | 305 | | | | 333,475 | |
4.95%, 10/01/29 | | | 750 | | | | 751,875 | |
4.38%, 02/15/30 | | | 875 | | | | 853,125 | |
Simon Property Group LP, 3.50%, 09/01/25 | | | 810 | | | | 899,515 | |
Welltower, Inc., 4.00%, 06/01/25 | | | 565 | | | | 639,913 | |
XHR LP, 6.38%, 08/15/25(a) | | | 805 | | | | 849,275 | |
| | | | | | | | |
| | | | | | | 45,727,413 | |
| | |
SCHEDULE OF INVESTMENTS | | 27 |
| | |
Schedule of Investments (continued) December 31, 2020 | | BlackRock Systematic Multi-Strategy Fund (Percentages shown are based on Net Assets) |
| | | | | | | | |
| Security | | Par
(000) | | | Value | |
| | |
| Food & Staples Retailing — 0.9% | | | | | | |
Albertsons Cos., Inc./Safeway, Inc./New Albertsons | |
LP/Albertsons LLC(a) | | | | | | | | |
4.63%, 01/15/27 | | $ | 230 | | | $ | 244,662 | |
3.50%, 03/15/29 | | | 245 | | | | 247,908 | |
4.88%, 02/15/30 | | | 1,750 | | | | 1,928,290 | |
B&G Foods Inc., 5.25%, 09/15/27 | | | 1,000 | | | | 1,063,200 | |
Campbell Soup Co., 3.95%, 03/15/25 | | | 2,500 | | | | 2,817,623 | |
Conagra Brands, Inc. | | | | | | | | |
4.60%, 11/01/25 | | | 570 | | | | 671,421 | |
1.38%, 11/01/27 | | | 2,330 | | | | 2,351,504 | |
Costco Wholesale Corp. | | | | | | | | |
1.38%, 06/20/27 | | | 385 | | | | 396,662 | |
1.60%, 04/20/30 | | | 885 | | | | 906,857 | |
Dollar General Corp. | | | | | | | | |
4.15%, 11/01/25 | | | 2,000 | | | | 2,295,423 | |
3.50%, 04/03/30 | | | 250 | | | | 286,993 | |
General Mills, Inc. | | | | | | | | |
4.00%, 04/17/25 | | | 690 | | | | 780,041 | |
2.88%, 04/15/30 | | | 640 | | | | 709,627 | |
Kraft Heinz Foods Co. | | | | | | | | |
4.63%, 01/30/29 | | | 500 | | | | 572,118 | |
3.75%, 04/01/30(a) | | | 1,000 | | | | 1,068,771 | |
4.25%, 03/01/31(a) | | | 3,000 | | | | 3,345,173 | |
6.88%, 01/26/39 | | | 500 | | | | 692,828 | |
5.00%, 06/04/42 | | | 1,000 | | | | 1,173,274 | |
5.20%, 07/15/45 | | | 2,250 | | | | 2,675,373 | |
4.38%, 06/01/46 | | | 1,000 | | | | 1,081,945 | |
Kroger Co., 2.20%, 05/01/30 | | | 40 | | | | 42,033 | |
Lamb Weston Holdings, Inc.(a) | | | | | | | | |
4.63%, 11/01/24 | | | 500 | | | | 521,250 | |
4.88%, 11/01/26 | | | 50 | | | | 52,265 | |
4.88%, 05/15/28 | | | 110 | | | | 122,788 | |
McCormick & Co., Inc. | | | | | | | | |
3.15%, 08/15/24 | | | 300 | | | | 325,226 | |
2.50%, 04/15/30 | | | 155 | | | | 165,982 | |
Post Holdings, Inc.(a) | | | | | | | | |
5.00%, 08/15/26 | | | 50 | | | | 51,625 | |
5.75%, 03/01/27 | | | 25 | | | | 26,469 | |
5.63%, 01/15/28 | | | 50 | | | | 53,250 | |
4.63%, 04/15/30 | | | 650 | | | | 683,774 | |
Rite Aid Corp., 7.50%, 07/01/25(a) | | | 1,000 | | | | 1,043,750 | |
U.S. Foods, Inc., 6.25%, 04/15/25(a) | | | 300 | | | | 320,625 | |
United Natural Foods, Inc., 6.75%, 10/15/28(a) | | | 445 | | | | 465,572 | |
| | | | | | | | |
| | | | | | | 29,184,302 | |
| | |
| Food Products — 0.4% | | | | | | |
Aramark Services, Inc., 5.00%, 02/01/28(a) | | | 500 | | | | 526,875 | |
Bunge Ltd. Finance Corp., 1.63%, 08/17/25 | | | 1,085 | | | | 1,121,363 | |
Chobani LLC/Chobani Finance Corp., Inc.,
4.63%, 11/15/28(a) | | | 460 | | | | 466,900 | |
Darling Ingredients, Inc., 5.25%, 04/15/27(a) | | | 2,000 | | | | 2,126,600 | |
JBS USA LUX SA/JBS USA Finance, Inc.(a) | | | | | | | | |
5.75%, 06/15/25 | | | 50 | | | | 51,587 | |
6.75%, 02/15/28 | | | 200 | | | | 223,812 | |
JBS USA LUX SA/JBS USA Food Co./JBS USA | | | | | | | | |
Finance, Inc.(a) | | | | | | | | |
6.50%, 04/15/29 | | | 50 | | | | 58,205 | |
5.50%, 01/15/30 | | | 1,100 | | | | 1,263,636 | |
Mondelez International, Inc. | | | | | | | | |
0.63%, 07/01/22 | | | 5,035 | | | | 5,056,866 | |
2.13%, 04/13/23 | | | 200 | | | | 207,730 | |
| | | | | | | | |
| Security | | Par
(000) | | | Value | |
| | |
| Food Products (continued) | | | | | | |
Mondelez International, Inc. (continued) | | | | | | | | |
1.50%, 05/04/25 | | $ | 585 | | | $ | 605,036 | |
Pilgrim’s Pride Corp.(a) | | | | | | | | |
5.75%, 03/15/25 | | | 100 | | | | 102,660 | |
5.88%, 09/30/27 | | | 125 | | | | 135,576 | |
Simmons Foods, Inc., 5.75%, 11/01/24(a) | | | 50 | | | | 51,063 | |
| | | | | | | | |
| | | | | | | 11,997,909 | |
| | |
| Gas Utilities — 0.0% | | | | | | |
Suburban Propane Partners LP/Suburban Energy | | | | | | | | |
Finance Corp. | | | | | | | | |
5.50%, 06/01/24 | | | 50 | | | | 51,062 | |
5.88%, 03/01/27 | | | 225 | | | | 235,125 | |
| | | | | | | | |
| | | | | | | 286,187 | |
| | |
| Health Care Equipment & Supplies — 0.3% | | | | | | |
Abbott Laboratories, 3.40%, 11/30/23 | | | 70 | | | | 75,900 | |
Baxter International, Inc., 2.60%, 08/15/26 | | | 1,605 | | | | 1,752,247 | |
Becton Dickinson & Co., 2.89%, 06/06/22 | | | 26 | | | | 26,875 | |
Boston Scientific Corp., 3.38%, 05/15/22 | | | 25 | | | | 26,038 | |
DH Europe Finance II Sarl | | | | | | | | |
2.05%, 11/15/22 | | | 1,075 | | | | 1,108,873 | |
2.60%, 11/15/29 | | | 68 | | | | 74,369 | |
Hill-Rom Holdings, Inc.(a) | | | | | | | | |
5.00%, 02/15/25 | | | 25 | | | | 25,688 | |
4.38%, 09/15/27 | | | 25 | | | | 26,411 | |
Hologic, Inc.(a) | | | | | | | | |
4.63%, 02/01/28 | | | 1,000 | | | | 1,061,250 | |
3.25%, 02/15/29 | | | 370 | | | | 376,475 | |
Ortho-Clinical Diagnostics, Inc./Ortho-Clinical | | | | | | | | |
Diagnostics SA, 7.25%, 02/01/28(a) | | | 60 | | | | 63,300 | |
Thermo Fisher Scientific, Inc., 4.13%, 03/25/25 | | | 855 | | | | 972,167 | |
Zimmer Biomet Holdings, Inc., 3.70%, 03/19/23 | | | 4,850 | | | | 5,173,746 | |
| | | | | | | | |
| | | | | | | 10,763,339 | |
| | |
| Health Care Providers & Services — 1.5% | | | | | | |
AdaptHealth LLC(a) | | | | | | | | |
6.13%, 08/01/28 | | | 940 | | | | 1,009,325 | |
4.63%, 08/01/29(f) | | | 760 | | | | 780,900 | |
Aetna, Inc., 3.50%, 11/15/24 | | | 1,000 | | | | 1,097,566 | |
AmerisourceBergen Corp. | | | | | | | | |
3.45%, 12/15/27 | | | 849 | | | | 967,437 | |
2.80%, 05/15/30 | | | 310 | | | | 337,035 | |
Anthem, Inc. | | | | | | | | |
2.95%, 12/01/22 | | | 25 | | | | 26,190 | |
3.35%, 12/01/24 | | | 700 | | | | 771,279 | |
2.38%, 01/15/25 | | | 95 | | | | 101,607 | |
Centene Corp. | | | | | | | | |
4.75%, 01/15/25 | | | 500 | | | | 513,115 | |
5.38%, 06/01/26(a) | | | 530 | | | | 558,996 | |
5.38%, 08/15/26(a) | | | 85 | | | | 89,781 | |
4.25%, 12/15/27 | | | 500 | | | | 530,000 | |
4.63%, 12/15/29 | | | 500 | | | | 555,105 | |
3.38%, 02/15/30 | | | 580 | | | | 610,212 | |
3.00%, 10/15/30 | | | 2,000 | | | | 2,119,800 | |
CHS/Community Health Systems, Inc.(a) | | | | | | | | |
8.00%, 03/15/26 | | | 3,650 | | | | 3,932,875 | |
5.63%, 03/15/27 | | | 835 | | | | 897,834 | |
6.00%, 01/15/29 | | | 240 | | | | 259,262 | |
DaVita, Inc.(a) | | | | | | | | |
4.63%, 06/01/30 | | | 1,255 | | | | 1,331,869 | |
3.75%, 02/15/31 | | | 545 | | | | 553,371 | |
| | |
| 28 | | 2 0 2 0 BLACK ROCK ANNUAL REPORT TO SHAREHOLDERS |
| | |
Schedule of Investments (continued) December 31, 2020 | | BlackRock Systematic Multi-Strategy Fund (Percentages shown are based on Net Assets) |
| | | | | | | | |
| Security | | Par
(000) | | | Value | |
| | |
| Health Care Providers & Services (continued) | | | | | | |
Encompass Health Corp. | | | | | | | | |
4.50%, 02/01/28 | | $ | 195 | | | $ | 203,775 | |
4.75%, 02/01/30 | | | 250 | | | | 267,813 | |
HCA, Inc. | | | | | | | | |
5.25%, 04/15/25 | | | 2,940 | | | | 3,432,984 | |
5.88%, 02/15/26 | | | 100 | | | | 115,000 | |
5.25%, 06/15/26 | | | 100 | | | | 118,350 | |
5.38%, 09/01/26 | | | 10 | | | | 11,494 | |
5.63%, 09/01/28 | | | 110 | | | | 129,800 | |
5.88%, 02/01/29 | | | 280 | | | | 336,974 | |
4.13%, 06/15/29 | | | 3,505 | | | | 4,066,086 | |
3.50%, 09/01/30 | | | 2,325 | | | | 2,470,489 | |
Humana, Inc. | | | | | | | | |
3.85%, 10/01/24 | | | 2,395 | | | | 2,650,633 | |
4.50%, 04/01/25 | | | 1,985 | | | | 2,280,545 | |
4.88%, 04/01/30 | | | 150 | | | | 187,419 | |
Legacy LifePoint Health LLC(a) | | | | | | | | |
6.75%, 04/15/25 | | | 110 | | | | 118,119 | |
4.38%, 02/15/27 | | | 195 | | | | 195,244 | |
LifePoint Health, Inc., 5.38%, 01/15/29(a) | | | 960 | | | | 957,936 | |
Magellan Health, Inc., 4.90%, 09/22/24 | | | 1,000 | | | | 1,052,500 | |
McKesson Corp., 0.90%, 12/03/25 | | | 2,515 | | | | 2,527,571 | |
Molina Healthcare, Inc., 4.38%, 06/15/28(a) | | | 1,520 | | | | 1,599,800 | |
Prime Healthcare Services, Inc., 7.25%, 11/01/25(a) | | | 350 | | | | 371,875 | |
Providence Service Corp., 5.88%, 11/15/25(a) | | | 2,805 | | | | 2,966,288 | |
Select Medical Corp., 6.25%, 08/15/26(a) | | | 525 | | | | 565,383 | |
Teleflex, Inc. | | | | | | | | |
4.63%, 11/15/27 | | | 250 | | | | 268,678 | |
4.25%, 06/01/28(a) | | | 75 | | | | 79,500 | |
Tenet Healthcare Corp. | | | | | | | | |
6.75%, 06/15/23 | | | 75 | | | | 80,438 | |
4.63%, 07/15/24 | | | 300 | | | | 307,506 | |
7.50%, 04/01/25(a) | | | 280 | | | | 305,900 | |
4.88%, 01/01/26(a) | | | 600 | | | | 627,666 | |
6.25%, 02/01/27(a) | | | 100 | | | | 106,000 | |
5.13%, 11/01/27(a) | | | 300 | | | | 317,625 | |
6.13%, 10/01/28(a) | | | 805 | | | | 838,794 | |
UnitedHealth Group, Inc. | | | | | | | | |
3.10%, 03/15/26 | | | 50 | | | | 56,033 | |
3.85%, 06/15/28 | | | 2,200 | | | | 2,615,743 | |
2.00%, 05/15/30 | | | 585 | | | | 620,503 | |
| | | | | | | | |
| | | | | | | 49,894,023 | |
| | |
| Health Care Technology(a) — 0.1% | | | | | | |
Catalent Pharma Solutions, Inc., 5.00%, 07/15/27 | | | 10 | | | | 10,561 | |
Charles River Laboratories International, Inc. | | | | | | | | |
5.50%, 04/01/26 | | | 1,000 | | | | 1,047,400 | |
4.25%, 05/01/28 | | | 1,025 | | | | 1,073,688 | |
IQVIA, Inc. | | | | | | | | |
5.00%, 10/15/26 | | | 200 | | | | 209,000 | |
5.00%, 05/15/27 | | | 1,000 | | | | 1,063,025 | |
Mednax, Inc., 6.25%, 01/15/27 | | | 100 | | | | 107,246 | |
Syneos Health, Inc., 3.63%, 01/15/29 | | | 485 | | | | 486,341 | |
| | | | | | | | |
| | | | | | | 3,997,261 | |
| | |
| Healthcare — 0.0% | | | | | | |
Akumin, Inc., 7.00%, 11/01/25(a) | | | 495 | | | | 519,750 | |
| | | | | | | | |
| | |
| Hotels, Restaurants & Leisure — 1.2% | | | | | | |
1011778 BC ULC/New Red Finance, Inc.(a) | | | | | | | | |
4.25%, 05/15/24 | | | 103 | | | | 105,060 | |
5.75%, 04/15/25 | | | 1,295 | | | | 1,385,650 | |
| | | | | | | | |
| Security | | Par
(000) | | | Value | |
| |
| Hotels, Restaurants & Leisure (continued) | | | | |
1011778 BC ULC/New Red Finance, Inc.(a) (continued) | | | | | | | | |
3.88%, 01/15/28 | | $ | 55 | | | $ | 55,867 | |
4.00%, 10/15/30 | | | 2,775 | | | | 2,812,268 | |
Boyd Gaming Corp. | | | | | | | | |
6.00%, 08/15/26 | | | 10 | | | | 10,375 | |
4.75%, 12/01/27 | | | 1,625 | | | | 1,687,969 | |
Boyne USA, Inc., 7.25%, 05/01/25(a) | | | 1,250 | | | | 1,310,937 | |
Caesars Entertainment, Inc.(a) | | | | | | | | |
6.25%, 07/01/25 | | | 915 | | | | 974,475 | |
8.13%, 07/01/27 | | | 650 | | | | 719,565 | |
Caesars Resort Collection LLC/CRC Finco, Inc.(a) | | | | | | | | |
5.75%, 07/01/25 | | | 90 | | | | 95,362 | |
5.25%, 10/15/25 | | | 2,000 | | | | 2,021,180 | |
Cedar Fair LP, 5.25%, 07/15/29 | | | 15 | | | | 15,443 | |
Cedar Fair LP/Canada’s Wonderland Co./Magnum Management Corp./Millennium Op, 5.50%, 05/01/25(a) | | | 310 | | | | 323,175 | |
Churchill Downs, Inc., 5.50%, 04/01/27(a) | | | 500 | | | | 529,375 | |
Darden Restaurants, Inc., 3.85%, 05/01/27 | | | 10 | | | | 10,964 | |
Dave & Buster’s, Inc., 7.63%, 11/01/25(a) | | | 160 | | | | 168,400 | |
GLP Capital LP/GLP Financing II, Inc.,
5.25%, 06/01/25 | | | 1,460 | | | | 1,642,617 | |
Golden Nugget, Inc., 6.75%, 10/15/24(a) | | | 50 | | | | 49,641 | |
Hilton Domestic Operating Co., Inc. | | | | | | | | |
5.38%, 05/01/25(a) | | | 45 | | | | 47,813 | |
5.13%, 05/01/26 | | | 125 | | | | 129,063 | |
4.88%, 01/15/30 | | | 375 | | | | 409,688 | |
4.00%, 05/01/31(a) | | | 1,585 | | | | 1,672,349 | |
Hilton Worldwide Finance LLC/Hilton Worldwide | | | | | | | | |
Finance Corp., 4.88%, 04/01/27 | | | 50 | | | | 52,921 | |
International Game Technology PLC,
5.25%, 01/15/29(a) | | | 1,565 | | | | 1,686,287 | |
KFC Holding Co./Pizza Hut Holdings LLC/Taco Bell of America LLC(a) | | | | | | | | |
5.25%, 06/01/26 | | | 1,125 | | | | 1,167,187 | |
4.75%, 06/01/27 | | | 125 | | | | 132,001 | |
Las Vegas Sands Corp. | | | | | | | | |
3.20%, 08/08/24 | | | 3,610 | | | | 3,823,618 | |
2.90%, 06/25/25 | | | 500 | | | | 523,216 | |
3.50%, 08/18/26 | | | 360 | | | | 385,234 | |
3.90%, 08/08/29 | | | 267 | | | | 287,143 | |
Marriott International, Inc., Series EE,
5.75%, 05/01/25 | | | 1,610 | | | | 1,883,219 | |
Marriott Ownership Resorts, Inc.,
6.13%, 09/15/25(a). | | | 530 | | | | 564,450 | |
Marriott Ownership Resorts, Inc./ILG LLC,
6.50%, 09/15/26 | | | 500 | | | | 522,500 | |
McDonald’s Corp., 1.45%, 09/01/25 | | | 105 | | | | 108,886 | |
Melco Resorts Finance Ltd., 5.38%, 12/04/29(a) | | | 1,200 | | | | 1,243,500 | |
MGM Resorts International | | | | | | | | |
7.75%, 03/15/22 | | | 100 | | | | 106,500 | |
6.75%, 05/01/25 | | | 500 | | | | 541,200 | |
5.50%, 04/15/27 | | | 98 | | | | 109,221 | |
4.75%, 10/15/28 | | | 500 | | | | 535,935 | |
Scientific Games International, Inc.(a) | | | | | | | | |
8.63%, 07/01/25 | | | 790 | | | | 865,050 | |
5.00%, 10/15/25 | | | 25 | | | | 25,797 | |
7.00%, 05/15/28 | | | 50 | | | | 53,761 | |
7.25%, 11/15/29 | | | 1,100 | | | | 1,207,250 | |
Six Flags Theme Parks, Inc.,
7.00%, 07/01/25(a) | | | 1,250 | | | | 1,350,000 | |
| | |
SCHEDULE OF INVESTMENTS | | 29 |
| | |
Schedule of Investments (continued) December 31, 2020 | | BlackRock Systematic Multi-Strategy Fund (Percentages shown are based on Net Assets) |
| | | | | | | | |
| Security | | Par
(000) | | | Value | |
| | |
| Hotels, Restaurants & Leisure (continued) | | | | | | |
Starbucks Corp. | | | | | | | | |
1.30%, 05/07/22 | | $ | 160 | | | $ | 162,238 | |
3.55%, 08/15/29 | | | 40 | | | | 46,548 | |
Stars Group Holdings BV/Stars Group US Co- Borrower LLC, 7.00%, 07/15/26(a) | | | 510 | | | | 536,775 | |
Vail Resorts, Inc., 6.25%, 05/15/25(a) | | | 1,000 | | | | 1,067,500 | |
Wyndham Destinations, Inc. | | | | | | | | |
3.90%, 03/01/23 | | | 100 | | | | 102,000 | |
5.65%, 04/01/24 | | | 100 | | | | 108,000 | |
6.00%, 04/01/27 | | | 300 | | | | 336,000 | |
4.63%, 03/01/30(a) | | | 100 | | | | 105,750 | |
Wyndham Hotels & Resorts, Inc.,
5.38%, 04/15/26(a) | | | 50 | | | | 51,750 | |
Wynn Las Vegas LLC/Wynn Las Vegas Capital Corp.(a) | | | | | | | | |
4.25%, 05/30/23 | | | 50 | | | | 50,728 | |
5.50%, 03/01/25 | | | 50 | | | | 52,188 | |
5.25%, 05/15/27 | | | 400 | | | | 412,300 | |
Wynn Macau Ltd.(a) | | | | | | | | |
5.63%, 08/26/28 | | | 605 | | | | 631,469 | |
5.13%, 12/15/29 | | | 400 | | | | 406,500 | |
Wynn Resorts Finance LLC/Wynn Resorts Capital Corp., 5.13%, 10/01/29(a) | | | 700 | | | | 733,250 | |
Yum! Brands, Inc., 4.75%, 01/15/30(a) | | | 800 | | | | 877,200 | |
| | | | | | | | |
| | | | | | | 39,032,308 | |
| | |
| Household Durables — 0.7% | | | | | | |
Beazer Homes USA, Inc. | | | | | | | | |
5.88%, 10/15/27 | | | 100 | | | | 105,250 | |
7.25%, 10/15/29 | | | 2,560 | | | | 2,886,400 | |
Brookfield Residential Properties, Inc./Brookfield Residential U.S. Corp.(a) | | | | | | | | |
6.25%, 09/15/27 | | | 285 | | | | 303,169 | |
4.88%, 02/15/30 | | | 600 | | | | 620,250 | |
Century Communities, Inc. | | | | | | | | |
5.88%, 07/15/25 | | | 200 | | | | 208,000 | |
6.75%, 06/01/27 | | | 1,750 | | | | 1,868,475 | |
Diebold Nixdorf, Inc., 9.38%, 07/15/25(a) | | | 535 | | | | 599,200 | |
Empire Communities Corp., 7.00%, 12/15/25(a) | | | 525 | | | | 553,276 | |
KB Home, 4.80%, 11/15/29 | | | 300 | | | | 329,250 | |
Lennar Corp. | | | | | | | | |
4.13%, 01/15/22 | | | 100 | | | | 102,375 | |
5.88%, 11/15/24 | | | 50 | | | | 57,750 | |
4.75%, 11/29/27 | | | 50 | | | | 59,090 | |
M/I Homes, Inc., 4.95%, 02/01/28 | | | 975 | | | | 1,032,086 | |
Mattamy Group Corp.(a) | | | | | | | | |
5.25%, 12/15/27 | | | 40 | | | | 42,300 | |
4.63%, 03/01/30 | | | 310 | | | | 328,600 | |
MDC Holdings, Inc. | | | | | | | | |
5.50%, 01/15/24 | | | 50 | | | | 54,750 | |
6.00%, 01/15/43 | | | 200 | | | | 268,109 | |
Meritage Homes Corp. | | | | | | | | |
6.00%, 06/01/25 | | | 1,500 | | | | 1,698,750 | |
5.13%, 06/06/27 | | | 2,100 | | | | 2,346,750 | |
NCR Corp., 5.00%, 10/01/28(a) | | | 500 | | | | 527,500 | |
New Home Co., Inc., 7.25%, 10/15/25(a) | | | 635 | | | | 652,139 | |
Newell Brands, Inc. | | | | | | | | |
4.70%, 04/01/26 | | | 850 | | | | 936,275 | |
5.88%, 04/01/36 | | | 550 | | | | 666,875 | |
PulteGroup, Inc. | | | | | | | | |
5.50%, 03/01/26 | | | 100 | | | | 118,992 | |
| | | | | | | | |
| Security | | Par
(000) | | | Value | |
| | |
| Household Durables (continued) | | | | | | |
PulteGroup, Inc. (continued) | | | | | | | | |
5.00%, 01/15/27 | | $ | 200 | | | $ | 236,000 | |
6.00%, 02/15/35 | | | 100 | | | | 135,970 | |
Shea Homes LP/Shea Homes Funding Corp.(a) | | | | | | | | |
4.75%, 02/15/28 | | | 655 | | | | 677,925 | |
4.75%, 04/01/29 | | | 865 | | | | 888,787 | |
Taylor Morrison Communities, Inc.(a) | | | | | | | | |
5.88%, 06/15/27 | | | 100 | | | | 113,332 | |
5.75%, 01/15/28 | | | 100 | | | | 113,250 | |
Tempur Sealy International, Inc., 5.50%, 06/15/26 | | | 1,000 | | | | 1,040,700 | |
Toll Brothers Finance Corp., 4.35%, 02/15/28 | | | 25 | | | | 27,750 | |
TRI Pointe Group, Inc., 5.70%, 06/15/28 | | | 1,450 | | | | 1,637,050 | |
TRI Pointe Group, Inc./TRI Pointe Homes, Inc., 5.88%, 06/15/24 | | | 50 | | | | 54,575 | |
| | | | | | | | |
| | | | | | | 21,290,950 | |
| | |
| Household Products(a) — 0.1% | | | | | | |
Herbalife Nutrition Ltd./HLF Financing Inc.,
7.88%, 09/01/25 | | | 1,100 | | | | 1,201,750 | |
Kronos Acquisition Holdings, Inc./KIK Custom | | | | | | | | |
Products, Inc. | | | | | | | | |
5.00%, 12/31/26 | | | 355 | | | | 370,339 | |
7.00%, 12/31/27 | | | 730 | | | | 764,325 | |
| | | | | | | | |
| | | | | | | 2,336,414 | |
|
| Independent Power and Renewable Electricity Producers — 0.3% | |
Calpine Corp.(a) | | | | | | | | |
5.25%, 06/01/26 | | | 336 | | | | 347,592 | |
4.50%, 02/15/28 | | | 145 | | | | 150,800 | |
5.13%, 03/15/28 | | | 645 | | | | 678,521 | |
4.63%, 02/01/29 | | | 345 | | | | 354,757 | |
5.00%, 02/01/31 | | | 400 | | | | 418,000 | |
3.75%, 03/01/31 | | | 1,580 | | | | 1,564,721 | |
Clearway Energy Operating LLC | | | | | | | | |
5.75%, 10/15/25 | | | 40 | | | | 42,100 | |
4.75%, 03/15/28(a) | | | 1,580 | | | | 1,694,550 | |
Enviva Partners LP/Enviva Partners Finance Corp., 6.50%, 01/15/26(a) | | | 500 | | | | 531,250 | |
NRG Energy, Inc. | | | | | | | | |
6.63%, 01/15/27 | | | 100 | | | �� | 105,604 | |
5.75%, 01/15/28 | | | 750 | | | | 819,375 | |
5.25%, 06/15/29(a) | | | 150 | | | | 165,000 | |
3.63%, 02/15/31(a) | | | 1,580 | | | | 1,625,504 | |
TerraForm Power Operating LLC(a) | | | | | | | | |
4.25%, 01/31/23 | | | 550 | | | | 568,562 | |
5.00%, 01/31/28 | | | 75 | | | | 84,274 | |
| | | | | | | | |
| | | | | | | 9,150,610 | |
| | |
| Insurance — 0.7% | | | | | | |
Acrisure LLC/Acrisure Finance, Inc.(a) | | | | | | | | |
8.13%, 02/15/24 | | | 100 | | | | 105,872 | |
7.00%, 11/15/25 | | | 250 | | | | 260,262 | |
Alliant Holdings Intermediate LLC/Alliant Holdings | | | | | | | | |
Co-Issuer(a) | | | | | | | | |
4.25%, 10/15/27 | | | 400 | | | | 409,000 | |
6.75%, 10/15/27 | | | 1,000 | | | | 1,070,000 | |
AmWINS Group, Inc., 7.75%, 07/01/26(a) | | | 40 | | | | 42,956 | |
Aon Corp., 2.80%, 05/15/30 | | | 405 | | | | 441,844 | |
AssuredPartners, Inc., 5.63%, 01/15/29(a) | | | 550 | | | | 574,062 | |
Berkshire Hathaway Finance Corp.,
1.85%, 03/12/30 | | | 2,600 | | | | 2,739,999 | |
Berkshire Hathaway, Inc., 3.13%, 03/15/26 | | | 2,005 | | | | 2,240,196 | |
| | |
| 30 | | 2 0 2 0 BLACK ROCK ANNUAL REPORT TO SHAREHOLDERS |
| | |
Schedule of Investments (continued) December 31, 2020 | | BlackRock Systematic Multi-Strategy Fund (Percentages shown are based on Net Assets) |
| | | | | | | | |
| Security | | Par
(000) | | | Value | |
| | |
| Insurance (continued) | | | | | | |
Fidelity & Guaranty Life Holdings, Inc.,
5.50%, 05/01/25(a) | | $ | 1,015 | | | $ | 1,184,505 | |
Marsh & McLennan Cos., Inc. | | | | | | | | |
3.88%, 03/15/24 | | | 2,945 | | | | 3,248,211 | |
3.50%, 03/10/25 | | | 2,200 | | | | 2,440,095 | |
4.38%, 03/15/29 | | | 1,880 | | | | 2,288,948 | |
2.25%, 11/15/30 | | | 2,215 | | | | 2,345,042 | |
NMI Holdings,Inc., 7.38%, 06/01/25(a) | | | 3,000 | | | | 3,360,000 | |
Trinity Acquisition PLC, 3.50%, 09/15/21 | | | 50 | | | | 50,896 | |
Willis North America, Inc. | | | | | | | | |
4.50%, 09/15/28 | | | 130 | | | | 156,688 | |
2.95%, 09/15/29 | | | 995 | | | | 1,088,647 | |
| | | | | | | | |
| | | | | | | 24,047,223 | |
| | |
| Interactive Media & Services — 0.3% | | | | | | |
Arches Buyer, Inc., 4.25%, 06/01/28(a) | | | 415 | | | | 420,270 | |
Baidu, Inc, 1.72%, 04/09/26 | | | 2,660 | | | | 2,693,415 | |
JD.com, Inc., 3.38%, 01/14/30 | | | 1,920 | | | | 2,083,345 | |
Netflix, Inc. | | | | | | | | |
5.50%, 02/15/22 | | | 350 | | | | 366,188 | |
3.63%, 06/15/25(a) | | | 660 | | | | 706,688 | |
4.88%, 04/15/28 | | | 100 | | | | 112,770 | |
5.88%, 11/15/28 | | | 900 | | | | 1,078,875 | |
6.38%, 05/15/29 | | | 500 | | | | 617,500 | |
5.38%, 11/15/29(a) | | | 500 | | | | 589,375 | |
4.88%, 06/15/30(a) | | | 1,000 | | | | 1,150,000 | |
| | | | | | | | |
| | | | | | | 9,818,426 | |
| | |
| Internet & Direct Marketing Retail — 0.3% | | | | | | |
Alibaba Group Holding Ltd. | | | | | | | | |
2.80%, 06/06/23 | | | 1,500 | | | | 1,575,495 | |
3.60%, 11/28/24 | | | 2,400 | | | | 2,638,440 | |
3.40%, 12/06/27 | | | 900 | | | | 1,006,263 | |
eBay, Inc., 1.90%, 03/11/25 | | | 4,150 | | | | 4,362,789 | |
| | | | | | | | |
| | | | | | | 9,582,987 | |
| | |
| Internet Software & Services — 0.3% | | | | | | |
Booking Holdings, Inc., 4.63%, 04/13/30 | | | 153 | | | | 190,115 | |
Expedia Group, Inc., 3.60%, 12/15/23(a) | | | 795 | | | | 847,235 | |
Go Daddy Operating Co. LLC/GD Finance Co., Inc., 5.25%, 12/01/27(a) | | | 1,000 | | | | 1,052,500 | |
GrubHub Holdings, Inc., 5.50%, 07/01/27(a) | | | 350 | | | | 367,063 | |
Match Group Holdings II LLC(a) | | | | | | | | |
4.63%, 06/01/28 | | | 335 | | | | 351,122 | |
5.63%, 02/15/29 | | | 35 | | | | 38,150 | |
4.13%, 08/01/30 | | | 1,930 | | | | 2,007,200 | |
NortonLifeLock, Inc., 5.00%, 04/15/25(a) | | | 750 | | | | 765,000 | |
TripAdvisor, Inc., 7.00%, 07/15/25(a) | | | 60 | | | | 64,800 | |
Uber Technologies, Inc.(a) | | | | | | | | |
7.50%, 05/15/25 | | | 395 | | | | 426,687 | |
8.00%, 11/01/26 | | | 450 | | | | 491,116 | |
6.25%, 01/15/28 | | | 820 | | | | 891,750 | |
VeriSign, Inc. | | | | | | | | |
4.63%, 05/01/23 | | | 35 | | | | 35,306 | |
5.25%, 04/01/25 | | | 800 | | | | 909,000 | |
4.75%, 07/15/27 | | | 1,150 | | | | 1,233,749 | |
| | | | | | | | |
| | | | | | | 9,670,793 | |
| | |
| IT Services — 0.5% | | | | | | |
Austin BidCo, Inc., 7.13%, 12/15/28(a) | | | 275 | | | | 287,031 | |
Banff Merger Sub, Inc., 9.75%, 09/01/26(a) | | | 1,000 | | | | 1,080,150 | |
Booz Allen Hamilton, Inc., 3.88%, 09/01/28(a) | | | 905 | | | | 932,150 | |
Camelot Finance SA, 4.50%, 11/01/26(a) | | | 1,380 | | | | 1,440,375 | |
| | | | | | | | |
| Security | | Par
(000) | | | Value | |
| | |
| IT Services (continued) | | | | | | |
Citrix Systems, Inc. | | | | | | | | |
4.50%, 12/01/27 | | $ | 1,650 | | | $ | 1,940,274 | |
3.30%, 03/01/30 | | | 810 | | | | 894,884 | |
Fair Isaac Corp., 4.00%, 06/15/28(a) | | | 1,090 | | | | 1,147,225 | |
Gartner, Inc.(a) | | | | | | | | |
4.50%, 07/01/28 | | | 1,005 | | | | 1,060,275 | |
3.75%, 10/01/30 | | | 170 | | | | 179,139 | |
International Business Machines Corp., 3.00%, 05/15/24 | | | 150 | | | | 162,492 | |
j2 Global, Inc., 4.63%, 10/15/30(a) | | | 575 | | | | 606,625 | |
LogMeIn, Inc., 5.50%, 09/01/27(a) | | | 735 | | | | 769,912 | |
Presidio Holdings, Inc.(a) | | | | | | | | |
4.88%, 02/01/27 | | | 230 | | | | 243,979 | |
8.25%, 02/01/28 | | | 35 | | | | 38,588 | |
Rackspace Technology Global, Inc., 5.38%, 12/01/28(a) | | | 475 | | | | 497,658 | |
Science Applications International Corp., 4.88%, 04/01/28(a) | | | 170 | | | | 180,200 | |
Unisys Corp., 6.88%, 11/01/27(a) | | | 2,670 | | | | 2,916,975 | |
Verisk Analytics, Inc. | | | | | | | | |
4.00%, 06/15/25 | | | 50 | | | | 56,640 | |
4.13%, 03/15/29 | | | 600 | | | | 721,033 | |
| | | | | | | | |
| | | | | | | 15,155,605 | |
| | |
| Leisure Products — 0.0% | | | | | | |
Hasbro, Inc., 3.55%, 11/19/26 | | | 145 | | | | 161,835 | |
| | | | | | | | |
| | |
| Life Sciences Tools & Services — 0.0% | | | | | | |
Agilent Technologies, Inc., 3.88%, 07/15/23 | | | 690 | | | | 742,484 | |
| | | | | | | | |
| | |
| Machinery — 0.5% | | | | | | |
Caterpillar Financial Services Corp. | | | | | | | | |
1.95%, 11/18/22 | | | 1,525 | | | | 1,573,404 | |
0.45%, 09/14/23 | | | 3,970 | | | | 3,985,301 | |
0.80%, 11/13/25 | | | 7,610 | | | | 7,670,790 | |
Colfax Corp., 6.00%, 02/15/24(a) | | | 60 | | | | 62,176 | |
Deere & Co., 2.75%, 04/15/25 | | | 150 | | | | 163,486 | |
Hillenbrand, Inc., 5.75%, 06/15/25 | | | 320 | | | | 345,600 | |
Mueller Water Products, Inc., 5.50%, 06/15/26(a) | | | 5 | | | | 5,181 | |
Otis Worldwide Corp. | | | | | | | | |
2.29%, 04/05/27 | | | 65 | | | | 69,442 | |
2.57%, 02/15/30 | | | 125 | | | | 134,229 | |
Tennant Co., 5.63%, 05/01/25 | | | 100 | | | | 104,125 | |
Titan Acquisition Ltd./Titan Co-Borrower LLC, 7.75%, 04/15/26(a) | | | 200 | | | | 208,000 | |
Vertical US Newco, Inc., 5.25%, 07/15/27(a) | | | 910 | | | | 964,600 | |
Westinghouse Air Brake Technologies Corp., 3.20%, 06/15/25 | | | 2,305 | | | | 2,486,771 | |
| | | | | | | | |
| | | | | | | 17,773,105 | |
| | |
| Media — 1.9% | | | | | | |
Altice Financing SA(a) | | | | | | | | |
7.50%, 05/15/26 | | | 500 | | | | 527,650 | |
5.00%, 01/15/28 | | | 455 | | | | 466,209 | |
Altice France Holding SA(a) | | | | | | | | |
10.50%, 05/15/27 | | | 400 | | | | 449,000 | |
6.00%, 02/15/28 | | | 455 | | | | 460,688 | |
AMC Networks, Inc., 4.75%, 08/01/25 | | | 25 | | | | 25,818 | |
Banijay Entertainment SASU, 5.38%, 03/01/25(a) | | | 200 | | | | 207,299 | |
Block Communications, Inc., 4.88%, 03/01/28(a) | | | 60 | | | | 61,800 | |
Cable One, Inc., 4.00%, 11/15/30(a) | | | 275 | | | | 285,656 | |
CCO Holdings LLC/CCO Holdings Capital Corp.(a) 5.75%, 02/15/26 | | | 25 | | | | 25,796 | |
| | |
SCHEDULE OF INVESTMENTS | | 31 |
| | |
Schedule of Investments (continued) December 31, 2020 | | BlackRock Systematic Multi-Strategy Fund (Percentages shown are based on Net Assets) |
| | | | | | | | |
| Security | | Par
(000) | | | Value | |
| | |
| Media (continued) | | | | | | |
CCO Holdings LLC/CCO Holdings Capital
Corp.(a) (continued) | | | | | | | | |
5.13%, 05/01/27 | | $ | 250 | | | $ | 265,298 | |
5.00%, 02/01/28 | | | 100 | | | | 105,750 | |
5.38%, 06/01/29 | | | 100 | | | | 109,625 | |
4.75%, 03/01/30 | | | 3,405 | | | | 3,673,995 | |
4.50%, 08/15/30 | | | 810 | | | | 859,612 | |
4.25%, 02/01/31 | | | 420 | | | | 442,621 | |
4.50%, 05/01/32 | | | 2,500 | | | | 2,669,300 | |
Charter Communications Operating LLC/Charter Communications Operating Capital | | | | | | | | |
4.46%, 07/23/22 | | | 1,640 | | | | 1,728,959 | |
4.50%, 02/01/24 | | | 6,920 | | | | 7,675,569 | |
5.05%, 03/30/29 | | | 500 | | | | 607,932 | |
2.80%, 04/01/31 | | | 1,475 | | | | 1,560,079 | |
2.30%, 02/01/32 | | | 3,480 | | | | 3,484,041 | |
Clear Channel Worldwide Holdings, Inc. | | | | | | | | |
9.25%, 02/15/24 | | | 50 | | | | 50,625 | |
5.13%, 08/15/27(a) | | | 900 | | | | 909,000 | |
CSC Holdings LLC | | | | | | | | |
5.25%, 06/01/24 | | | 200 | | | | 216,480 | |
5.50%, 05/15/26(a) | | | 200 | | | | 208,000 | |
6.50%, 02/01/29(a) | | | 900 | | | | 1,016,145 | |
5.75%, 01/15/30(a) | | | 400 | | | | 438,500 | |
4.63%, 12/01/30(a) | | | 800 | | | | 835,000 | |
3.38%, 02/15/31(a) | | | 1,100 | | | | 1,079,375 | |
Cumulus Media New Holdings Inc., 6.75%, 07/01/26(a) | | | 300 | | | | 306,750 | |
Dish DBS Corp., 7.38%, 07/01/28 | | | 2,010 | | | | 2,140,650 | |
DISH DBS Corp. | | | | | | | | |
5.88%, 07/15/22 | | | 100 | | | | 104,500 | |
5.00%, 03/15/23 | | | 450 | | | | 464,625 | |
5.88%, 11/15/24 | | | 475 | | | | 498,054 | |
7.75%, 07/01/26 | | | 1,075 | | | | 1,204,011 | |
Embarq Corp., 8.00%, 06/01/36 | | | 625 | | | | 770,906 | |
Fox Corp., 4.03%, 01/25/24 | | | 35 | | | | 38,547 | |
GCI LLC, 4.75%, 10/15/28(a) | | | 1,310 | | | | 1,397,180 | |
Gray Television, Inc.(a) | | | | | | | | |
5.88%, 07/15/26 | | | 14 | | | | 14,683 | |
4.75%, 10/15/30 | | | 300 | | | | 305,625 | |
Hughes Satellite Systems Corp. | | | | | | | | |
5.25%, 08/01/26 | | | 135 | | | | 149,006 | |
6.63%, 08/01/26 | | | 309 | | | | 349,624 | |
iHeartCommunications, Inc.(a) | | | | | | | | |
5.25%, 08/15/27 | | | 629 | | | | 660,450 | |
4.75%, 01/15/28 | | | 1,150 | | | | 1,180,187 | |
Lamar Media Corp., 4.00%, 02/15/30 | | | 250 | | | | 259,375 | |
LCPR Senior Secured Financing DAC,
6.75%, 10/15/27(a) | | | 500 | | | | 538,125 | |
Liberty Interactive LLC, 8.25%, 02/01/30 | | | 300 | | | | 336,375 | |
Meredith Corp., 6.50%, 07/01/25(a) | | | 150 | | | | 159,000 | |
Nexstar Broadcasting, Inc., 4.75%, 11/01/28(a) | | | 500 | | | | 523,125 | |
Outfront Media Capital LLC/Outfront Media Capital Corp.(a) | | | | | | | | |
5.00%, 08/15/27 | | | 25 | | | | 25,438 | |
4.63%, 03/15/30 | | | 150 | | | | 153,321 | |
Qualitytech LP/QTS Finance Corp.,
3.88%, 10/01/28(a) | | | 1,030 | | | | 1,050,600 | |
Radiate Holdco LLC/Radiate Finance, Inc.(a)
4.50%, 09/15/26 | | | 645 | | | | 665,156 | |
| | | | | | | | |
| Security | | Par
(000) | | | Value | |
| | |
| Media (continued) | | | | | | |
Radiate Holdco LLC/Radiate Finance, Inc.(a) (continued)
6.50%, 09/15/28 | | $ | 300 | | | $ | 316,125 | |
Sable International Finance Ltd.,
5.75%, 09/07/27(a) . | | | 400 | | | | 425,500 | |
Scripps Escrow II, Inc.(a) | | | | | | | | |
3.88%, 01/15/29 | | | 640 | | | | 665,130 | |
5.38%, 01/15/31 | | | 545 | | | | 568,163 | |
Sinclair Television Group, Inc.(a) | | | | | | | | |
5.50%, 03/01/30 | | | 600 | | | | 624,000 | |
4.13%, 12/01/30 | | | 680 | | | | 695,796 | |
Sirius XM Radio, Inc.(a) | | | | | | | | |
4.63%, 07/15/24 | | | 150 | | | | 155,438 | |
5.00%, 08/01/27 | | | 500 | | | | 531,255 | |
5.50%, 07/01/29 | | | 625 | | | | 687,695 | |
4.13%, 07/01/30 | | | 945 | | | | 1,005,834 | |
TEGNA, Inc. | | | | | | | | |
4.75%, 03/15/26(a) | | | 2,570 | | | | 2,744,246 | |
4.63%, 03/15/28(a) | | | 590 | | | | 603,275 | |
5.00%, 09/15/29 | | | 600 | | | | 633,850 | |
Telesat Canada/Telesat LLC, 6.50%, 10/15/27(a) | | | 2,810 | | | | 2,936,450 | |
Time Warner Cable LLC, 4.00%, 09/01/21 | | | 170 | | | | 172,413 | |
Townsquare Media, Inc., 6.88%, 02/01/26(a)(f) | | | 385 | | | | 403,222 | |
Univision Communications Inc.,
9.50%, 05/01/25(a) | | | 85 | | | | 94,563 | |
Univision Communications, Inc.(a) | | | | | | | | |
5.13%, 02/15/25 | | | 15 | | | | 15,113 | |
6.63%, 06/01/27 | | | 900 | | | | 966,645 | |
Virgin Media Finance PLC, 5.00%, 07/15/30(a) | | | 695 | | | | 721,062 | |
Virgin Media Secured Finance PLC(a) | | | | | | | | |
5.50%, 05/15/29 | | | 1,000 | | | | 1,083,750 | |
4.50%, 08/15/30 | | | 1,000 | | | | 1,045,000 | |
Walt Disney Co., 1.65%, 09/01/22 | | | 230 | | | | 235,294 | |
Windstream Escrow LLC/Windstream Escrow | | | | | | | | |
Finance Corp., 7.75%, 08/15/28(a) | | | 135 | | | | 135,945 | |
WMG Acquisition Corp., 3.00%, 02/15/31(a) | | | 1,075 | | | | 1,053,500 | |
| | | | | | | | |
| | | | | | | 62,260,399 | |
| | |
| Metals & Mining — 1.0% | | | | | | |
Alcoa Nederland Holding BV(a) | | | | | | | | |
7.00%, 09/30/26 | | | 200 | | | | 213,000 | |
5.50%, 12/15/27 | | | 1,000 | | | | 1,094,270 | |
6.13%, 05/15/28 | | | 200 | | | | 218,500 | |
Allegheny Technologies, Inc., 5.88%, 12/01/27 | | | 50 | | | | 52,625 | |
ArcelorMittal SA | | | | | | | | |
3.60%, 07/16/24 | | | 500 | | | | 539,574 | |
4.55%, 03/11/26 | | | 2,250 | | | | 2,527,978 | |
4.25%, 07/16/29 | | | 750 | | | | 830,707 | |
Arconic Corp.(a) | | | | | | | | |
6.00%, 05/15/25 | | | 500 | | | | 533,750 | |
6.13%, 02/15/28 | | | 3,100 | | | | 3,342,187 | |
Big River Steel LLC/BRS Finance Corp.,
6.63%, 01/31/29(a) | | | 830 | | | | 896,400 | |
Cleveland-Cliffs, Inc.(a) | | | | | | | | |
9.88%, 10/17/25 | | | 1,623 | | | | 1,909,054 | |
6.75%, 03/15/26 | | | 180 | | | | 194,400 | |
Commercial Metals Co. | | | | | | | | |
5.75%, 04/15/26 | | | 1,750 | | | | 1,806,875 | |
5.38%, 07/15/27 | | | 1,000 | | | | 1,052,500 | |
Compass Minerals International, Inc.,
6.75%, 12/01/27(a) | | | 475 | | | | 514,188 | |
Constellium SE, 5.63%, 06/15/28(a) | | | 250 | | | | 269,375 | |
| | |
| 32 | | 2 0 2 0 BLACK ROCK ANNUAL REPORT TO SHAREHOLDERS |
| | |
Schedule of Investments (continued) December 31, 2020 | | BlackRock Systematic Multi-Strategy Fund (Percentages shown are based on Net Assets) |
| | | | | | | | |
| Security | | Par (000) | | | Value | |
|
| Metals & Mining (continued) | |
FMG Resources August 2006 Pty Ltd., 4.50%, 09/15/27(a) | | $ | 1,065 | | | $ | 1,183,204 | |
Freeport-McMoRan, Inc. | | | | | | | | |
5.00%, 09/01/27 | | | 100 | | | | 106,000 | |
4.13%, 03/01/28 | | | 200 | | | | 209,750 | |
4.38%, 08/01/28 | | | 315 | | | | 334,688 | |
5.25%, 09/01/29 | | | 50 | | | | 55,625 | |
4.25%, 03/01/30 | | | 250 | | | | 269,375 | |
4.63%, 08/01/30 | | | 1,000 | | | | 1,097,500 | |
5.40%, 11/14/34 | | | 100 | | | | 125,125 | |
5.45%, 03/15/43 | | | 925 | | | | 1,151,625 | |
Grinding Media, Inc./Moly-Cop AltaSteel Ltd., 7.38%, 12/15/23(a) | | | 25 | | | | 25,375 | |
Hudbay Minerals, Inc.(a) | | | | | | | | |
7.63%, 01/15/25 | | | 50 | | | | 51,938 | |
6.13%, 04/01/29 | | | 1,625 | | | | 1,750,937 | |
IAMGOLD Corp., 5.75%, 10/15/28(a) | | | 545 | | | | 553,175 | |
Joseph T Ryerson & Son, Inc.,
8.50%, 08/01/28(a) | | | 2,180 | | | | 2,468,850 | |
Kaiser Aluminum Corp.(a) | | | | | | | | |
6.50%, 05/01/25 | | | 305 | | | | 326,350 | |
4.63%, 03/01/28 | | | 400 | | | | 415,000 | |
Kinross Gold Corp., 5.95%, 03/15/24 | | | 1,695 | | | | 1,928,558 | |
Mineral Resources Ltd., 8.13%, 05/01/27(a) | | | 850 | | | | 940,312 | |
New Gold, Inc., 7.50%, 07/15/27(a) | | | 220 | | | | 243,100 | |
Novelis Corp., 4.75%, 01/30/30(a) | | | 185 | | | | 199,313 | |
Reliance Steel & Aluminum Co., 1.30%, 08/15/25 | | | 2,690 | | | | 2,732,151 | |
United States Steel Corp. | | | | | | | | |
12.00%, 06/01/25(a) | | | 840 | | | | 970,200 | |
6.25%, 03/15/26 | | | 500 | | | | 457,500 | |
Vale Overseas Ltd., 3.75%, 07/08/30 | | | 200 | | | | 222,188 | |
| | | | | | | | |
| | | | | | | 33,813,222 | |
|
| Mortgage Real Estate Investment Trusts (REITs) — 0.0% | |
New Residential Investment Corp., 6.25%, 10/15/25(a) | | | 500 | | | | 502,500 | |
| | | | | | | | |
| | |
| Multi-line Retail — 0.0% | | | | | | |
Macy’s, Inc., 8.38%, 06/15/25(a) | | | 250 | | | | 277,625 | |
Nordstrom, Inc., 5.00%, 01/15/44 | | | 500 | | | | 470,647 | |
| | | | | | | | |
| | | | | | | 748,272 | |
| | |
| Multi-Utilities — 0.1% | | | | | | |
AmeriGas Partners LP/AmeriGas Finance Corp. | | | | | | | | |
5.63%, 05/20/24 | | | 45 | | | | 48,488 | |
5.75%, 05/20/27 | | | 100 | | | | 113,769 | |
National Fuel Gas Co., 3.95%, 09/15/27 | | | 40 | | | | 42,477 | |
NiSource, Inc., 0.95%, 08/15/25 | | | 1,330 | | | | 1,338,033 | |
Piedmont Natural Gas Co., Inc.,
3.50%, 06/01/29 | | | 50 | | | | 57,397 | |
Southwest Gas Corp.,
2.20%, 06/15/30 | | | 25 | | | | 26,379 | |
| | | | | | | | |
| | | | | | | 1,626,543 | |
|
| Offshore Drilling & Other Services(a) — 0.1% | |
Entegris, Inc. | | | | | | | | |
4.63%, 02/10/26 | | | 500 | | | | 518,750 | |
4.38%, 04/15/28 | | | 2,325 | | | | 2,479,031 | |
| | | | | | | | |
| | | | | | | 2,997,781 | |
|
| Oil, Gas & Consumable Fuels — 3.6% | |
Antero Midstream Partners LP/Antero Midstream Finance Corp. | | | | | | | | |
5.38%, 09/15/24 | | | 100 | | | | 97,500 | |
5.75%, 01/15/28(a) | | | 1,500 | | | | 1,440,300 | |
| | | | | | | | |
| Security | | Par
(000) | | | Value | |
|
| Oil, Gas & Consumable Fuels (continued) | |
Antero Resources Corp. | | | | | | | | |
5.13%, 12/01/22 | | $ | 235 | | | $ | 234,413 | |
5.63%, 06/01/23 | | | 200 | | | | 196,000 | |
8.38%, 07/15/26(a)(f) | | | 105 | | | | 107,172 | |
Apache Corp. | | | | | | | | |
4.63%, 11/15/25 | | | 480 | | | | 507,370 | |
4.88%, 11/15/27 | | | 1,680 | | | | 1,780,800 | |
4.25%, 01/15/30 | | | 745 | | | | 782,250 | |
5.10%, 09/01/40 | | | 1,250 | | | | 1,332,812 | |
4.75%, 04/15/43 | | | 250 | | | | 259,216 | |
Ascent Resources Utica Holdings LLC/ARU Finance Corp., 8.25 %, 12/31/28(a) | | | 385 | | | | 384,038 | |
BP Capital Markets America, Inc.,
2.52%, 09/19/22 | | | 500 | | | | 517,164 | |
Brand Industrial Services, Inc.,
8.50%, 07/15/25(a) | | | 275 | | | | 280,844 | |
Buckeye Partners LP | | | | | | | | |
4.15%, 07/01/23 | | | 100 | | | | 102,750 | |
4.13%, 03/01/25(a) | | | 500 | | | | 506,250 | |
3.95%, 12/01/26 | | | 100 | | | | 101,300 | |
4.50%, 03/01/28(a) | | | 130 | | | | 133,900 | |
5.85%, 11/15/43 | | | 400 | | | | 393,576 | |
Calumet Specialty Products Partners LP/Calumet Finance Corp.,
11.00%, 04/15/25(a) | | | 475 | | | | 479,750 | |
Canadian Natural Resources Ltd. | | | | | | | | |
2.95%, 01/15/23 | | | 600 | | | | 627,528 | |
3.85%, 06/01/27 | | | 600 | | | | 673,228 | |
Cenovus Energy, Inc. | | | | | | | | |
5.38%, 07/15/25 | | | 165 | | | | 186,029 | |
4.25%, 04/15/27 | | | 500 | | | | 546,011 | |
6.75%, 11/15/39 | | | 1,400 | | | | 1,850,932 | |
Cheniere Corpus Christi Holdings LLC | | | | | | | | |
7.00%, 06/30/24 | | | 700 | | | | 817,442 | |
5.88%, 03/31/25 | | | 5,525 | | | | 6,429,869 | |
Cheniere Energy Partners LP | | | | | | | | |
5.63%, 10/01/26 | | | 135 | | | | 140,400 | |
4.50%, 10/01/29 | | | 395 | | | | 417,823 | |
5.25%, 10/01/25 | | | 150 | | | | 153,938 | |
Cheniere Energy, Inc., 4.63%, 10/15/28(a) | | | 2,000 | | | | 2,100,000 | |
Chevron Corp. | | | | | | | | |
1.55%, 05/11/25 | | | 1,480 | | | | 1,539,170 | |
2.00%, 05/11/27 | | | 140 | | | | 148,469 | |
2.24%, 05/11/30 | | | 170 | | | | 182,224 | |
CNX Resources Corp.(a) | | | | | | | | |
7.25%, 03/14/27 | | | 2,380 | | | | 2,546,600 | |
6.00%, 01/15/29 | | | 685 | | | | 701,772 | |
Comstock Resources, Inc. | | | | | | | | |
7.50%, 05/15/25(a) | | | 50 | | | | 51,230 | |
9.75%, 08/15/26 | | | 340 | | | | 366,225 | |
Continental Resources, Inc. | | | | | | | | |
4.50%, 04/15/23 | | | 61 | | | | 62,897 | |
4.38%, 01/15/28 | | | 2,010 | | | | 2,060,652 | |
5.75%, 01/15/31(a) | | | 565 | | | | 627,139 | |
4.90%, 06/01/44 | | | 300 | | | | 296,703 | |
Crestwood Midstream Partners LP/Crestwood Midstream Finance Corp., 5.63%, 05/01/27(a) | | | 150 | | | | 148,500 | |
CrownRock LP/CrownRock Finance, Inc., 5.63%, 10/15/25(a) | | | 275 | | | | 280,838 | |
CVR Energy, Inc., 5.25%, 02/15/25(a) | | | 500 | | | | 482,500 | |
DCP Midstream Operating LP | | | | | | | | |
5.38%, 07/15/25 | | | 130 | | | | 142,847 | |
5.13%, 05/15/29 | | | 500 | | | | 554,560 | |
8.13%, 08/16/30 | | | 1,000 | | | | 1,277,500 | |
| | |
SCHEDULE OF INVESTMENTS | | 33 |
| | |
Schedule of Investments (continued) December 31, 2020 | | BlackRock Systematic Multi-Strategy Fund (Percentages shown are based on Net Assets) |
| | | | | | | | |
| Security | | Par
(000) | | | Value | |
|
| Oil, Gas & Consumable Fuels (continued) | |
DCP Midstream Operating LP (continued) | |
6.75%, 09/15/37(a) | | $ | 50 | | | $ | 54,000 | |
5.60%, 04/01/44 | | | 610 | | | | 629,044 | |
Enbridge, Inc. | | | | | | | | |
4.00%, 10/01/23 | | | 2,000 | | | | 2,175,434 | |
3.50%, 06/10/24 | | | 1,690 | | | | 1,832,944 | |
Energy Transfer Operating LP,
4.05%, 03/15/25 | | | 2,495 | | | | 2,737,024 | |
EnLink Midstream LLC | | | | | | | | |
5.63%, 01/15/28(a) | | | 385 | | | | 392,777 | |
5.38%, 06/01/29 | | | 1,700 | | | | 1,653,250 | |
EnLink Midstream Partners LP | | | | | | | | |
4.85%, 07/15/26 | | | 1,200 | | | | 1,171,608 | |
5.60%, 04/01/44 | | | 100 | | | | 80,250 | |
5.45%, 06/01/47 | | | 800 | | | | 644,216 | |
EQM Midstream Partners LP | | | | | | | | |
4.13%, 12/01/26 | | | 1,500 | | | | 1,511,250 | |
6.50%, 07/01/27(a) | | | 415 | | | | 467,305 | |
26885BAE0, 6.50%, 07/15/48 | | | 425 | | | | 442,000 | |
EQT Corp. | | | | | | | | |
7.88%, 02/01/25 | | | 775 | | | | 882,531 | |
3.90%, 10/01/27 | | | 1,000 | | | | 993,450 | |
5.00%, 01/15/29 | | | 880 | | | | 927,802 | |
8.75%, 02/01/30 | | | 250 | | | | 306,250 | |
Exxon Mobil Corp. | | | | | | | | |
2.02%, 08/16/24 | | | 300 | | | | 315,858 | |
2.99%, 03/19/25 | | | 950 | | | | 1,039,779 | |
Genesis Energy LP/Genesis Energy Finance Corp. | | | | | | | | |
6.50%, 10/01/25 | | | 250 | | | | 243,125 | |
8.00%, 01/15/27 | | | 355 | | | | 351,521 | |
7.75%, 02/01/28 | | | 250 | | | | 239,375 | |
Hess Corp., 4.30%, 04/01/27 | | | 1,255 | | | | 1,383,603 | |
Hess Midstream Operations LP(a) | | | | | | | | |
5.63%, 02/15/26 | | | 200 | | | | 208,000 | |
5.13%, 06/15/28 | | | 1,050 | | | | 1,097,575 | |
Hilcorp Energy I LP/Hilcorp Finance Co.(a) | | | | | | | | |
5.75%, 10/01/25 | | | 50 | | | | 50,563 | |
6.25%, 11/01/28 | | | 120 | | | | 122,550 | |
Kinder Morgan, Inc., 5.63%, 11/15/23(a) | | | 681 | | | | 768,278 | |
MasTec, Inc., 4.50%, 08/15/28(a) | | | 460 | | | | 483,000 | |
Matador Resources Co.,
5.88%, 09/15/26 | | | 750 | | | | 735,000 | |
MEG Energy Corp.(a) | | | | | | | | |
6.50%, 01/15/25 | | | 42 | | | | 43,262 | |
7.13%, 02/01/27 | | | 250 | | | | 258,125 | |
Murphy Oil Corp. | | | | | | | | |
5.75%, 08/15/25 | | | 75 | | | | 74,250 | |
5.88%, 12/01/27 | | | 962 | | | | 952,380 | |
6.38%, 12/01/42 | | | 50 | | | | 44,063 | |
Murphy Oil USA, Inc. | | | | | | | | |
5.63%, 05/01/27 | | | 500 | | | | 528,750 | |
4.75%, 09/15/29 | | | 900 | | | | 957,375 | |
New Fortress Energy, Inc.,
6.75%, 09/15/25(a) | | | 3,615 | | | | 3,839,781 | |
Newfield Exploration Co.,
5.38%, 01/01/26 | | | 2,000 | | | | 2,146,296 | |
Noble Energy, Inc., 3.85%, 01/15/28 | | | 910 | | | | 1,059,056 | |
NuStar Logistics LP | | | | | | | | |
6.00%, 06/01/26 | | | 95 | | | | 102,743 | |
5.63%, 04/28/27 | | | 50 | | | | 53,250 | |
6.38%, 10/01/30 | | | 500 | | | | 566,400 | |
Occidental Petroleum Corp. | | | | | | | | |
2.90%, 08/15/24 | | | 2,750 | | | | 2,646,875 | |
5.50%, 12/01/25 | | | 420 | | | | 437,896 | |
8.50%, 07/15/27 | | | 265 | | | | 305,823 | |
| | | | | | | | |
| Security | | Par
(000) | | | Value | |
|
| Oil, Gas & Consumable Fuels (continued) | |
Occidental Petroleum Corp. (continued) | |
3.50%, 08/15/29 | | $ | 817 | | | $ | 747,694 | |
8.88%, 07/15/30 | | | 415 | | | | 487,106 | |
6.63%, 09/01/30 | | | 2,500 | | | | 2,714,375 | |
6.13%, 01/01/31 | | | 340 | | | | 363,868 | |
6.45%, 09/15/36 | | | 2,700 | | | | 2,826,900 | |
4.40%, 04/15/46 | | | 1,250 | | | | 1,089,331 | |
4.40%, 08/15/49 | | | 500 | | | | 421,400 | |
ONEOK Inc., 2.20%, 09/15/25 | | | 1,500 | | | | 1,550,071 | |
ONEOK Partners LP | | | | | | | | |
3.38%, 10/01/22 | | | 650 | | | | 676,510 | |
4.90%, 03/15/25 | | | 520 | | | | 591,436 | |
ONEOK, Inc., 2.75%, 09/01/24 | | | 155 | | | | 163,546 | |
Ovintiv, Inc., 6.50%, 08/15/34 | | | 1,710 | | | | 1,980,249 | |
Parsley Energy LLC/Parsley Finance Corp.(a) | | | | | | | | |
5.25%, 08/15/25 | | | 500 | | | | 520,750 | |
4.13%, 02/15/28 | | | 160 | | | | 168,000 | |
PBF Holding Co. LLC/PBF Finance Corp. | | | | | | | | |
9.25%, 05/15/25(a) | | | 730 | | | | 719,707 | |
7.25%, 06/15/25 | | | 50 | | | | 32,412 | |
PowerTeam Services LLC, 9.03%, 12/04/25(a) | | | 650 | | | | 723,196 | |
QEP Resources, Inc. | | | | | | | | |
5.25%, 05/01/23 | | | 100 | | | | 105,250 | |
5.63%, 03/01/26 | | | 650 | | | | 712,757 | |
Range Resources Corp, 9.25%, 02/01/26 | | | 2,540 | | | | 2,654,300 | |
Range Resources Corp.,
5.00%, 03/15/23 | | | 100 | | | | 97,500 | |
Rockies Express Pipeline LLC(a) | | | | | | | | |
4.80%, 05/15/30 | | | 300 | | | | 305,450 | |
6.88%, 04/15/40 | | | 300 | | | | 326,505 | |
Sabine Pass Liquefaction LLC | | | | | | | | |
5.63%, 04/15/23 | | | 1,950 | | | | 2,142,327 | |
4.50%, 05/15/30(a) | | | 1,960 | | | | 2,323,144 | |
Shell International Finance BV,
2.00%, 11/07/24 | | | 790 | | | | 832,445 | |
SM Energy Co., 10.00%, 01/15/25(a) | | | 129 | | | | 138,675 | |
Southwestern Energy Co. | | | | | | | | |
4.10%, 03/15/22 | | | 100 | | | | 100,500 | |
6.45%, 01/23/25 | | | 1,450 | | | | 1,508,000 | |
7.50%, 04/01/26 | | | 550 | | | | 576,950 | |
7.75%, 10/01/27 | | | 100 | | | | 107,970 | |
8.38%, 09/15/28 | | | 505 | | | | 547,925 | |
Sunoco LP/Sunoco Finance Corp. | | | | | | | | |
5.50%, 02/15/26 | | | 100 | | | | 102,500 | |
6.00%, 04/15/27 | | | 100 | | | | 106,302 | |
5.88%, 03/15/28 | | | 1,750 | | | | 1,890,000 | |
4.50%, 05/15/29(a) | | | 1,990 | | | | 2,069,600 | |
Tallgrass Energy Partners LP/Tallgrass Energy Finance Corp.(a) | | | | | | | | |
5.50%, 09/15/24 | | | 66 | | | | 67,155 | |
5.50%, 01/15/28 | | | 650 | | | | 663,813 | |
6.00%, 12/31/30 | | | 755 | | | | 776,933 | |
Targa Resources Partners LP/Targa Resources Partners Finance Corp. | | | | | | | | |
5.88%, 04/15/26 | | | 285 | | | | 302,163 | |
6.88%, 01/15/29 | | | 200 | | | | 225,250 | |
5.50%, 03/01/30 | | | 350 | | | | 379,995 | |
4.88%, 02/01/31(a) | | | 850 | | | | 926,151 | |
Transcontinental Gas Pipe Line Co. LLC, 3.25%, 05/15/30 | | | 1,340 | | | | 1,501,593 | |
Tutor Perini Corp., 6.88%, 05/01/25(a) | | | 1,300 | | | | 1,274,000 | |
Western Midstream Operating LP | | | | | | | | |
4.65%, 07/01/26 | | | 750 | | | | 787,042 | |
| | |
| 34 | | 2 0 2 0 BLACK ROCK ANNUAL REPORT TO SHAREHOLDERS |
| | |
Schedule of Investments (continued) December 31, 2020 | | BlackRock Systematic Multi-Strategy Fund (Percentages shown are based on Net Assets) |
| | | | | | | | |
| Security | | Par
(000) | | | Value | |
|
| Oil, Gas & Consumable Fuels (continued) | |
Western Midstream Operating LP (continued) | |
4.75%, 08/15/28 | | $ | 500 | | | $ | 520,000 | |
5.05%, 02/01/30 | | | 1,700 | | | | 1,903,677 | |
5.30%, 03/01/48 | | | 1,250 | | | | 1,238,700 | |
6.25%, 02/01/50 | | | 285 | | | | 313,500 | |
Williams Cos., Inc., 3.60%, 03/15/22 | | | 770 | | | | 794,836 | |
WPX Energy, Inc. | | | | | | | | |
5.25%, 10/15/27 | | | 500 | | | | 529,810 | |
5.88%, 06/15/28 | | | 294 | | | | 320,469 | |
4.50%, 01/15/30 | | | 300 | | | | 318,000 | |
| | | | | | | | |
| | | | | | | 118,273,856 | |
| | |
| Personal Products — 0.1% | | | | | | |
Procter & Gamble Co. | | | | | | | | |
2.80%, 03/25/27 | | | 965 | | | | 1,075,144 | |
3.00%, 03/25/30 | | | 2,100 | | | | 2,421,626 | |
| | | | | | | | |
| | | | | | | 3,496,770 | |
| | |
| Pharmaceuticals — 1.2% | | | | | | |
AbbVie, Inc. | | | | | | | | |
3.38%, 11/14/21 | | | 300 | | | | 308,063 | |
3.45%, 03/15/22 | | | 1,670 | | | | 1,722,275 | |
2.90%, 11/06/22 | | | 600 | | | | 627,648 | |
2.30%, 11/21/22 | | | 1,120 | | | | 1,160,768 | |
2.60%, 11/21/24 | | | 7,210 | | | | 7,727,648 | |
3.80%, 03/15/25 | | | 1,730 | | | | 1,929,259 | |
AstraZeneca PLC | | | | | | | | |
3.50%, 08/17/23 | | | 100 | | | | 107,719 | |
3.38%, 11/16/25 | | | 1,150 | | | | 1,290,916 | |
0.70%, 04/08/26 | | | 1,200 | | | | 1,193,718 | |
Bausch Health Americas, Inc.,
8.50%, 01/31/27(a) | | | 25 | | | | 27,804 | |
Bausch Health Cos., Inc.(a) | | | | | | | | |
7.00%, 03/15/24 | | | 100 | | | | 102,875 | |
5.75%, 08/15/27 | | | 600 | | | | 643,500 | |
5.00%, 01/30/28 | | | 135 | | | | 139,123 | |
7.25%, 05/30/29 | | | 1,125 | | | | 1,264,624 | |
5.25%, 01/30/30 | | | 85 | | | | 89,250 | |
5.25%, 02/15/31 | | | 450 | | | | 470,124 | |
Bristol-Myers Squibb Co., 3.55%, 08/15/22 | | | 600 | | | | 632,130 | |
Cheplapharm Arzneimittel GmbH, 5.50%, 01/15/28(a) | | | 460 | | | | 480,700 | |
CVS Health Corp. | | | | | | | | |
3.35%, 03/09/21 | | | 1,250 | | | | 1,256,854 | |
3.50%, 07/20/22 | | | 1,000 | | | | 1,043,869 | |
2.63%, 08/15/24 | | | 85 | | | | 91,084 | |
1.30%, 08/21/27 | | | 825 | | | | 828,831 | |
Elanco Animal Health, Inc., 5.90%, 08/28/28 | | | 1,000 | | | | 1,180,000 | |
Johnson & Johnson | | | | | | | | |
0.95%, 09/01/27 | | | 2,770 | | | | 2,783,741 | |
1.30%, 09/01/30 | | | 1,840 | | | | 1,853,734 | |
Merck & Co., Inc., 0.75%, 02/24/26 | | | 1,095 | | | | 1,107,366 | |
Novartis Capital Corp., 2.20%, 08/14/30 | | | 180 | | | | 193,247 | |
P&L Development LLC/PLD Finance Corp., 7.75%, 11/15/25(a) | | | 260 | | | | 279,500 | |
Par Pharmaceutical, Inc., 7.50%, 04/01/27(a) | | | 2,225 | | | | 2,414,125 | |
Perrigo Finance Unlimited Co., 3.15 %, 06/15/30 | | | 115 | | | | 122,907 | |
Viatris, Inc.(a) | | | | | | | | |
1.13%, 06/22/22 | | | 1,330 | | | | 1,342,570 | |
1.65%, 06/22/25 | | | 370 | | | | 382,689 | |
2.70%, 06/22/30 | | | 130 | | | | 137,946 | |
| | | | | | | | |
| Security | | Par
(000) | | | Value | |
| | |
| Pharmaceuticals (continued) | | | | | | |
Zoetis, Inc. | | | | | | | | |
3.00%, 09/12/27 | | $ | 250 | | | $ | 279,747 | |
3.90%, 08/20/28 | | | 250 | | | | 294,527 | |
2.00%, 05/15/30 | | | 2,215 | | | | 2,293,480 | |
| | | | | | | | |
| | | | | | | 37,804,361 | |
|
| Producer Durables: Miscellaneous — 0.1% | |
Oracle Corp., 3.40%, 07/08/24 | | | 1,710 | | | | 1,871,677 | |
| | | | | | | | |
|
| Real Estate Management & Development — 0.0% | |
Five Point Operating Co. LP/Five Point Capital Corp., 7.88%, 11/15/25(a) | | | 150 | | | | 158,783 | |
Greystar Real Estate Partners LLC, 5.75%, 12/01/25(a) | | | 200 | | | | 203,800 | |
Howard Hughes Corp., 5.38%, 03/15/25(a) | | | 25 | | | | 25,781 | |
Hunt Cos., Inc., 6.25%, 02/15/26(a) | | | 250 | | | | 256,250 | |
Kennedy-Wilson, Inc., 5.88%, 04/01/24 | | | 25 | | | | 25,375 | |
Realogy Group LLC/Realogy Co-Issuer Corp.(a) | | | | | | | | |
7.63%, 06/15/25 | | | 200 | | | | 217,144 | |
9.38%, 04/01/27 | | | 150 | | | | 166,125 | |
| | | | | | | | |
| | | | | | | 1,053,258 | |
| | |
| Road & Rail — 0.0% | | | | | | |
Kansas City Southern, 2.88%, 11/15/29 | | | 45 | | | | 48,780 | |
Teekay Offshore Partners LP/Teekay Offshore Finance Corp., 8.50%, 07/15/23(a) | | | 300 | | | | 254,937 | |
Union Pacific Corp., 2.95%, 03/01/22 | | | 300 | | | | 309,288 | |
| | | | | | | 613,005 | |
|
| Semiconductors & Semiconductor Equipment — 1.1% | |
Amkor Technology, Inc.,
6.63%, 09/15/27(a) | | | 600 | | | | 651,000 | |
Analog Devices, Inc. | | | | | | | | |
2.50%, 12/05/21 | | | 25 | | | | 25,451 | |
2.95%, 04/01/25 | | | 80 | | | | 87,316 | |
Broadcom Corp./Broadcom Cayman Finance Ltd., 3.88%, 01/15/27 | | | 125 | | | | 140,288 | |
Broadcom, Inc. | | | | | | | | |
2.25%, 11/15/23 | | | 3,000 | | | | 3,133,153 | |
4.70%, 04/15/25 | | | 4,105 | | | | 4,704,198 | |
3.15%, 11/15/25 | | | 520 | | | | 567,815 | |
4.25%, 04/15/26 | | | 100 | | | | 114,524 | |
3.46%, 09/15/26 | | | 2,189 | | | | 2,428,822 | |
4.11%, 09/15/28 | | | 307 | | | | 351,357 | |
4.15%, 11/15/30 | | | 865 | | | | 1,001,464 | |
4.30%, 11/15/32 | | | 845 | | | | 1,001,738 | |
Flex Ltd. | | | | | | | | |
3.75%, 02/01/26 | | | 100 | | | | 111,250 | |
4.88%, 05/12/30 | | | 340 | | | | 406,300 | |
Honeywell International, Inc.,
2.30%, 08/15/24 | | | 380 | | | | 404,938 | |
Intel Corp., 3.40%, 03/25/25 | | | 2,850 | | | | 3,169,388 | |
Jabil, Inc., 4.70%, 09/15/22 | | | 1,000 | | | | 1,065,380 | |
Microchip Technology, Inc.,
4.25%, 09/01/25(a) | | | 1,210 | | | | 1,280,111 | |
Micron Technology, Inc. | | | | | | | | |
2.50%, 04/24/23 | | | 2,000 | | | | 2,084,036 | |
4.64%, 02/06/24 | | | 925 | | | | 1,029,948 | |
NVIDIA Corp., 2.85%, 04/01/30 | | | 25 | | | | 28,123 | |
NXP BV/NXP Funding LLC,
3.88%, 09/01/22(a) | | | 980 | | | | 1,032,867 | |
NXP BV/NXP Funding LLC/NXP USA, Inc., 2.70%, 05/01/25(a) | | | 4,295 | | | | 4,622,708 | |
ON Semiconductor Corp.,
3.88%, 09/01/28(a) | | | 2,000 | | | | 2,070,000 | |
Qorvo, Inc. | | | | | | | | |
4.38%, 10/15/29 | | | 1,370 | | | | 1,507,301 | |
3.38%, 04/01/31(a) | | | 1,000 | | | | 1,032,500 | |
| | |
SCHEDULE OF INVESTMENTS | | 35 |
| | |
Schedule of Investments (continued) December 31, 2020 | | BlackRock Systematic Multi-Strategy Fund (Percentages shown are based on Net Assets) |
| | | | | | | | |
| | |
| Security | | Par
(000) | | | Value | |
|
| Semiconductors & Semiconductor Equipment (continued) | |
Sensata Technologies BV, 5.00%, 10/01/25(a) | | $ | 25 | | | $ | 27,813 | |
Sensata Technologies, Inc.(a) | | | | | | | | |
4.38%, 02/15/30 | | | 1,275 | | | | 1,372,219 | |
3.75%, 02/15/31 | | | 500 | | | | 518,290 | |
Texas Instruments, Inc. | | | | | | | | |
1.38%, 03/12/25 | | | 315 | | | | 326,677 | |
1.75%, 05/04/30 | | | 220 | | | | 228,157 | |
| | | | | | | | |
| | | | | | | 36,525,132 | |
|
| Software — 0.7% | |
Activision Blizzard, Inc., 1.35%, 09/15/30 | | | 260 | | | | 255,247 | |
Black Knight InfoServ LLC, 3.63%, 09/01/28(a) | | | 2,440 | | | | 2,497,950 | |
Boxer Parent Co., Inc., 7.13%, 10/02/25(a) | | | 135 | | | | 146,535 | |
BY Crown Parent LLC/BY Bond Finance, Inc., 4.25%, 01/31/26(a) | | | 235 | | | | 240,875 | |
CDK Global, Inc. | | | | | | | | |
5.88%, 06/15/26 | | | 60 | | | | 62,945 | |
5.25%, 05/15/29(a) | | | 1,300 | | | | 1,440,296 | |
Intuit, Inc. | | | | | | | | |
0.95%, 07/15/25 | | | 1,015 | | | | 1,027,741 | |
1.35%, 07/15/27 | | | 740 | | | | 757,132 | |
1.65%, 07/15/30 | | | 555 | | | | 569,876 | |
MSCI, Inc.(a) | | | | | | | | |
5.38%, 05/15/27 | | | 150 | | | | 160,125 | |
4.00%, 11/15/29 | | | 745 | | | | 793,425 | |
3.63%, 09/01/30 | | | 200 | | | | 209,000 | |
3.88%, 02/15/31 | | | 1,415 | | | | 1,496,362 | |
Nuance Communications, Inc.,
5.63%, 12/15/26 | | | 3,550 | | | | 3,756,326 | |
Open Text Corp., 3.88%, 02/15/28(a) | | | 305 | | | | 317,200 | |
Open Text Holdings, Inc., 4.13%, 02/15/30(a) | | | 305 | | | | 324,459 | |
PTC, Inc.(a) | | | | | | | | |
3.63%, 02/15/25 | | | 50 | | | | 51,402 | |
4.00%, 02/15/28 | | | 1,045 | | | | 1,095,291 | |
Solera LLC/Solera Finance, Inc.,
10.50%, 03/01/24(a) | | | 50 | | | | 51,812 | |
SS&C Technologies, Inc., 5.50%, 09/30/27(a) | | | 3,000 | | | | 3,204,060 | |
Veritas US, Inc./Veritas Bermuda Ltd.,
7.50%, 09/01/25(a) | | | 3,615 | | | | 3,709,894 | |
VMware, Inc. | | | | | | | | |
2.95%, 08/21/22 | | | 40 | | | | 41,494 | |
3.90%, 08/21/27 | | | 50 | | | | 56,407 | |
| | | | | | | | |
| | | | | | | 22,265,854 | |
|
| Specialty Retail — 0.4% | |
Abercrombie & Fitch Management Co.,
8.75%, 07/15/25(a) | | | 1,500 | | | | 1,666,875 | |
Gap, Inc., 8.88%, 05/15/27(a) | | | 1,500 | | | | 1,740,000 | |
L Brands, Inc. | | | | | | | | |
5.63%, 10/15/23 | | | 25 | | | | 26,938 | |
6.88%, 07/01/25(a) | | | 3,680 | | | | 3,995,670 | |
9.38%, 07/01/25(a) | | | 175 | | | | 215,250 | |
5.25%, 02/01/28 | | | 50 | | | | 52,179 | |
7.50%, 06/15/29 | | | 50 | | | | 55,625 | |
6.63%, 10/01/30(a) | | | 835 | | | | 928,937 | |
6.88%, 11/01/35 | | | 175 | | | | 196,437 | |
Michaels Stores, Inc., 4.75%, 10/01/27(a) | | | 620 | | | | 635,500 | |
PetSmart, Inc., 5.88%, 06/01/25(a) | | | 21 | | | | 21,578 | |
QVC, Inc. | | | | | | | | |
4.38%, 03/15/23 | | | 200 | | | | 209,750 | |
4.85%, 04/01/24 | | | 200 | | | | 215,500 | |
4.45%, 02/15/25 | | | 700 | | | | 747,460 | |
| | | | | | | | |
| | |
| Security | | Par
(000) | | | Value | |
|
| Specialty Retail (continued) | |
QVC, Inc. (continued) | | | | | | | | |
4.75%, 02/15/27 | | $ | 700 | | | $ | 750,750 | |
4.38%, 09/01/28 | | | 1,100 | | | | 1,139,765 | |
5.45%, 08/15/34 | | | 500 | | | | 520,000 | |
Sally Holdings LLC/Sally Capital, Inc.,
5.63%, 12/01/25 | | | 25 | | | | 25,688 | |
Staples, Inc.(a) | | | | | | | | |
7.50%, 04/15/26 | | | 1,000 | | | | 1,044,270 | |
10.75%, 04/15/27 | | | 250 | | | | 248,750 | |
| | | | | | | | |
| | | | | | | 14,436,922 | |
|
| Technology Hardware, Storage & Peripherals — 0.7% | |
Adobe, Inc. | | | | | | | | |
1.90%, 02/01/25 | | | 175 | | | | 185,062 | |
2.15%, 02/01/27 | | | 490 | | | | 525,802 | |
2.30%, 02/01/30 | | | 2,130 | | | | 2,305,472 | |
Apple, Inc. | | | | | | | | |
2.25%, 02/23/21 | | | 770 | | | | 770,914 | |
1.80%, 09/11/24 | | | 340 | | | | 356,814 | |
Dell International LLC/EMC Corp.(a) | | | | | | | | |
7.13%, 06/15/24 | | | 1,500 | | | | 1,555,688 | |
4.00%, 07/15/24 | | | 1,600 | | | | 1,764,203 | |
5.85%, 07/15/25 | | | 6,340 | | | | 7,613,177 | |
4.90%, 10/01/26 | | | 250 | | | | 295,209 | |
6.20%, 07/15/30 | | | 785 | | | | 1,020,445 | |
Dell, Inc., 6.50%, 04/15/38 | | | 500 | | | | 621,250 | |
Hewlett Packard Enterprise Co. | | | | | | | | |
4.45%, 10/02/23 | | | 2,520 | | | | 2,772,212 | |
4.65%, 10/01/24 | | | 600 | | | | 681,060 | |
4.90%, 10/15/25 | | | 480 | | | | 561,582 | |
HP, Inc., 2.20%, 06/17/25 | | | 2,230 | | | | 2,360,988 | |
NetApp, Inc. | | | | | | | | |
1.88%, 06/22/25 | | | 315 | | | | 329,025 | |
2.38%, 06/22/27 | | | 30 | | | | 32,066 | |
Western Digital Corp., 4.75%, 02/15/26 | | | 100 | | | | 110,500 | |
| | | | | | | | |
| | | | | | | 23,861,469 | |
|
| Textiles, Apparel & Luxury Goods — 0.2% | |
Hanesbrands, Inc., 4.88%, 05/15/26(a) | | | 50 | | | | 54,313 | |
NIKE, Inc. | | | | | | | | |
2.40%, 03/27/25 | | | 2,125 | | | | 2,290,097 | |
2.85%, 03/27/30 | | | 1,671 | | | | 1,893,023 | |
Ralph Lauren Corp., 1.70%, 06/15/22 | | | 805 | | | | 819,644 | |
| | | | | | | | |
| | | | | | | 5,057,077 | |
|
| Thrifts & Mortgage Finance — 0.3% | |
MGIC Investment Corp., 5.25%, 08/15/28 | | | 2,000 | | | | 2,140,000 | |
Nationstar Mortgage Holdings, Inc.(a) | | | | | | | | |
6.00%, 01/15/27 | | | 685 | | | | 726,956 | |
5.50%, 08/15/28 | | | 640 | | | | 672,000 | |
5.13%, 12/15/30 | | | 1,455 | | | | 1,520,795 | |
PennyMac Financial Services, Inc.,
5.38%, 10/15/25(a) | | | 2,000 | | | | 2,115,000 | |
Quicken Loans LLC/Quicken Loans Co. Issuer, Inc., 3.88%, 03/01/31(a) | | | 1,000 | | | | 1,037,500 | |
Radian Group, Inc. | | | | | | | | |
4.50%, 10/01/24 | | | 50 | | | | 52,750 | |
6.63%, 03/15/25 | | | 2,095 | | | | 2,372,588 | |
| | | | | | | | |
| | | | | | | 10,637,589 | |
|
| Tobacco — 0.5% | |
Altria Group, Inc. | | | | | | | | |
3.49%, 02/14/22 | | | 1,000 | | | | 1,034,358 | |
| | |
| 36 | | 2 0 2 0 B L A C K R O C K A N N U A L R E P O R T T O S H A R E H O L D E R S |
| | |
Schedule of Investments (continued) December 31, 2020 | | BlackRock Systematic Multi-Strategy Fund (Percentages shown are based on Net Assets) |
| | | | | | | | |
| | |
| Security | | Par (000) | | | Value | |
|
| Tobacco (continued) | |
Altria Group, Inc. (continued) | | | | | | | | |
4.00%, 01/31/24 | | $ | 50 | | | $ | 54,898 | |
3.80%, 02/14/24 | | | 35 | | | | 38,219 | |
2.35%, 05/06/25 | | | 5,370 | | | | 5,705,544 | |
4.80%, 02/14/29 | | | 70 | | | | 83,867 | |
3.40%, 05/06/30 | | | 265 | | | | 297,329 | |
BAT International Finance PLC,
3.95%, 06/15/25(a) | | | 660 | | | | 742,191 | |
Philip Morris International, Inc. | | | | | | | | |
2.38%, 08/17/22 | | | 2,110 | | | | 2,177,215 | |
2.50%, 08/22/22 | | | 690 | | | | 715,092 | |
2.13%, 05/10/23 | | | 500 | | | | 519,501 | |
2.88%, 05/01/24 | | | 500 | | | | 537,042 | |
3.25%, 11/10/24 | | | 25 | | | | 27,533 | |
1.50%, 05/01/25 | | | 630 | | | | 652,548 | |
3.13%, 08/17/27 | | | 50 | | | | 56,007 | |
3.38%, 08/15/29 | | | 50 | | | | 57,297 | |
2.10%, 05/01/30 | | | 790 | | | | 823,928 | |
Reynolds American, Inc.,
4.45%, 06/12/25 | | | 3,000 | | | | 3,416,983 | |
Vector Group Ltd.(a) | | | | | | | | |
6.13%, 02/01/25 | | | 510 | | | | 518,553 | |
10.50%, 11/01/26 | | | 350 | | | | 377,562 | |
| | | | | | | | |
| | | | | | | 17,835,667 | |
|
| Transportation Infrastructure — 0.1% | |
FedEx Corp., 3.80%, 05/15/25 | | | 2,000 | | | | 2,257,706 | |
| | | | | | | | |
|
| Utilities — 0.1% | |
Essential Utilities, Inc. | | | | | | | | |
3.57%, 05/01/29 | | | 55 | | | | 63,173 | |
2.70%, 04/15/30 | | | 220 | | | | 238,500 | |
Pattern Energy Operations LP/Pattern Energy Operations, Inc., 4.50%, 08/15/28(a) | | | 490 | | | | 516,950 | |
TransAlta Corp., 6.50%, 03/15/40 | | | 200 | | | | 220,120 | |
Vistra Operations Co. LLC(a) | | | | | | | | |
5.63%, 02/15/27 | | | 100 | | | | 106,364 | |
5.00%, 07/31/27 | | | 1,500 | | | | 1,590,000 | |
| | | | | | | | |
| | | | | | | 2,735,107 | |
|
| Wireless Telecommunication Services — 1.0% | |
Altice France SA(a) | | | | | | | | |
7.38%, 05/01/26 | | | 200 | | | | 210,500 | |
5.13%, 01/15/29 | | | 280 | | | | 289,800 | |
American Tower Corp. | | | | | | | | |
2.25%, 01/15/22 | | | 750 | | | | 764,400 | |
1.30%, 09/15/25 | | | 515 | | | | 525,856 | |
C&W Senior Financing DAC, 6.88%, 09/15/27(a) | | | 200 | | | | 215,774 | |
CC Holdings GS V LLC/Crown Castle GS III Corp., 3.85%, 04/15/23 | | | 25 | | | | 26,832 | |
Crown Castle International Corp. | | | | | | | | |
5.25%, 01/15/23 | | | 620 | | | | 678,437 | |
3.20%, 09/01/24 | | | 640 | | | | 695,315 | |
1.35%, 07/15/25 | | | 1,105 | | | | 1,127,961 | |
3.65%, 09/01/27 | | | 340 | | | | 383,855 | |
EPR Properties, 3.75%, 08/15/29 | | | 850 | | | | 815,455 | |
GLP Capital LP/GLP Financing II, Inc. | | | | | | | | |
5.38%, 11/01/23 | | | 850 | | | | 928,608 | |
5.30%, 01/15/29 | | | 515 | | | | 595,829 | |
4.00%, 01/15/31 | | | 180 | | | | 196,420 | |
Gogo Intermediate Holdings LLC/Gogo Finance Co., Inc., 9.88%, 05/01/24(a) | | | 25 | | | | 26,769 | |
HAT Holdings I LLC/HAT Holdings II LLC(a)
5.25%, 07/15/24 | | | 270 | | | | 280,800 | |
| | | | | | | | |
| | |
| Security | | Par (000) | | | Value | |
|
| Wireless Telecommunication Services (continued) | |
HAT Holdings I LLC/HAT Holdings II LLC(a) (continued) | |
3.75%, 09/15/30 | | $ | 1,580 | | | $ | 1,639,250 | |
iStar, Inc., 4.25%, 08/01/25 | | | 300 | | | | 296,250 | |
SBA Communications Corp. | | | | | | | | |
4.00%, 10/01/22 | | | 350 | | | | 353,500 | |
4.88%, 09/01/24 | | | 200 | | | | 205,146 | |
3.88%, 02/15/27 | | | 100 | | | | 105,000 | |
Sprint Communications, Inc.,
6.00%, 11/15/22 | | | 25 | | | | 27,062 | |
Sprint Corp. | | | | | | | | |
7.25%, 09/15/21 | | | 25 | | | | 26,013 | |
7.88%, 09/15/23 | | | 750 | | | | 868,350 | |
7.13%, 06/15/24 | | | 1,500 | | | | 1,755,000 | |
7.63%, 02/15/25 | | | 500 | | | | 597,917 | |
7.63%, 03/01/26 | | | 25 | | | | 31,030 | |
T-Mobile USA, Inc. | | | | | | | | |
6.00%, 04/15/24 | | | 1,000 | | | | 1,012,260 | |
3.50%, 04/15/25(a) | | | 7,120 | | | | 7,867,458 | |
6.50%, 01/15/26 | | | 2,050 | | | | 2,121,750 | |
1.50%, 02/15/26(a) | | | 3,000 | | | | 3,071,610 | |
3.75%, 04/15/27(a) | | | 1,530 | | | | 1,742,364 | |
4.75%, 02/01/28 | | | 225 | | | | 241,850 | |
Uniti Group LP/Uniti Group Finance, Inc./CSL Capital LLC | | | | | | | | |
8.25%, 10/15/23 | | | 250 | | | | 251,875 | |
7.13%, 12/15/24(a) | | | 500 | | | | 505,000 | |
7.88%, 02/15/25(a) | | | 1,500 | | | | 1,611,315 | |
VICI Properties LP/VICI Note Co., Inc.(a) | | | | | | | | |
3.75%, 02/15/27 | | | 615 | | | | 628,837 | |
4.63%, 12/01/29 | | | 100 | | | | 107,000 | |
4.13%, 08/15/30 | | | 300 | | | | 316,689 | |
Vmed O2 UK Financing I PLC,
4.25%, 01/31/31(a) | | | 500 | | | | 510,000 | |
| | | | | | | | |
| | | | | | | 33,655,137 | |
| | | | | | | | |
| | |
Total Corporate Bonds — 42.4%
(Cost: $1,340,082,529) | | | | | | | 1,389,524,233 | |
| | | | | | | | |
| | |
| | | Shares | | | | |
| | |
Investment Companies | | | | | | | | |
|
| Equity Funds — 4.6% | |
BlackRock Liquid Environmentally Aware Fund(g) | | | 149,915,033 | | | | 149,989,991 | |
| | | | | | | | |
| | |
Total Investment Companies — 4.6%
(Cost: $150,049,912) | | | | | | | 149,989,991 | |
| | | | | | | | |
| | |
| | | Par (000) | | | | |
|
Non-Agency Mortgage-Backed Securities | |
|
| Collateralized Mortgage Obligations(c) — 6.6% | |
Connecticut Avenue Securities Trust(a) | | | | | | | | |
Series 2018-R07, Class 1M2, (1 mo. LIBOR US + 2.40%), 2.55%, 04/25/31 | | $ | 16,345 | | | | 16,332,127 | |
Series 2019-R01, Class 2ED2,
1.30%, 07/25/31 | | | 3,472 | | | | 3,383,233 | |
Series 2019-R01, Class 2M2, (1 mo. LIBOR US + 2.45%), 2.60%, 07/25/31 | | | 22,240 | | | | 22,225,730 | |
| | |
SCHEDULE OF INVESTMENTS | | 37 |
| | |
Schedule of Investments (continued) December 31, 2020 | | BlackRock Systematic Multi-Strategy Fund (Percentages shown are based on Net Assets) |
| | | | | | | | |
| | |
| Security | | Par (000) | | | Value | |
|
| Collateralized Mortgage Obligations (continued) | |
Connecticut Avenue Securities Trust(a) (continued) | |
Series 2019-R02, Class 1M2, (1 mo. LIBOR US + 2.30%), 2.45%, 08/25/31 | | $ | 13,056 | | | $ | 13,039,658 | |
Series 2019-R03, Class 1M2, (1 mo. LIBOR US + 2.15%), 2.30%, 09/25/31 | | | 18,126 | | | | 18,104,089 | |
Series 2019-R05, Class 1M2, (1 mo. LIBOR US + 2.00%), 2.15%, 07/25/39 | | | 18,082 | | | | 18,065,724 | |
Series 2019-R06, Class 2ED2, (1 mo. LIBOR US + 1.00%), 1.15%, 09/25/39 | | | 5,128 | | | | 4,880,322 | |
Series 2019-R06, Class 2M2, (1 mo. LIBOR US + 2.10%), 2.25%, 09/25/39 | | | 22,571 | | | | 22,529,010 | |
Series 2019-R07, Class 1M2, (1 mo. LIBOR US + 2.10%), 2.25%, 10/25/39 | | | 27,609 | | | | 27,517,894 | |
Series 2020-R01, Class 1M1, (1 mo. LIBOR US + 0.80%), 0.95%, 01/25/40 | | | 1,468 | | | | 1,469,248 | |
Series 2020-R02, Class 2M1, (1 mo. LIBOR US + 0.75%), 0.90%, 01/25/40 | | | 1,786 | | | | 1,785,658 | |
Series 2020-SBT1, Class 1M2, (1 mo. LIBOR US + 3.65%), 3.80%, 02/25/40 | | | 350 | | | | 351,253 | |
Series 2020-SBT1, Class 2M2, (1 mo. LIBOR US + 3.65%), 3.80%, 02/25/40 | | | 450 | | | | 452,238 | |
Connecticut Avenue Securities Trust 2019-R06, Series 2019-R06, Class 2M2C, (1 mo. LIBOR US + 2.10%), 2.25%, 09/25/39(a) | | | 2,148 | | | | 2,054,066 | |
Fannie Mae Connecticut Avenue Securities | | | | | | | | |
Series 2017-C02, Class 2M2C, (1 mo. LIBOR US + 3.65%), 3.80%, 09/25/29 | | | 3,500 | | | | 3,483,557 | |
Series 2017-C03, Class 1M2C, (1 mo. LIBOR US + 3.00%), 3.15%, 10/25/29 | | | 2,410 | | | | 2,365,014 | |
Series 2017-C06, Class 2B1, (1 mo. LIBOR US + 4.45%), 4.60%, 02/25/30 | | | 4,103 | | | | 4,215,403 | |
Series 2017-C07, Class 2B1, (1 mo. LIBOR US + 4.45%), 4.60%, 05/25/30 | | | 2,000 | | | | 2,084,732 | |
Series 2018-C03, Class 1B1, (1 mo. LIBOR US + 3.75%), 3.90%, 10/25/30 | | | 3,500 | | | | 3,528,717 | |
Freddie Mac STACR REMIC Trust(a) | | | | | | | | |
Series 2020-DNA3, Class M2, (1 mo. LIBOR US + 3.00%), 3.15%, 06/25/50 | | | 3,760 | | | | 3,778,772 | |
Series 2020-DNA5, Class M1, (SOFRRATE + 1.30%), 1.38%, 10/25/50 | | | 14,815 | | | | 14,843,873 | |
Series 2020-DNA6, Class M1, (SOFRRATE + 0.90%) , 0.98%, 12/25/50 | | | 15,460 | | | | 15,462,432 | |
Freddie Mac Structured Agency Credit Risk Debt Notes | | | | | | | | |
Series 2018-HQA1, Class M2, (1 mo. LIBOR US + 2.30%), 2.45%, 09/25/30 | | | 2,117 | | | | 2,109,477 | |
Series 2018-SPI1, Class M2, 3.72%, 02/25/48(a) | | | 1,936 | | | | 1,936,045 | |
Series 2018-SPI2, Class M2, 3.81%, 05/25/48(a) | | | 2,347 | | | | 2,354,845 | |
Series 2020-HQA5, Class M1, (SOFRRATE + 1.10%), 1.18%, 11/25/50(a) | | | 7,220 | | | | 7,236,558 | |
STACR Trust(a) | | | | | | | | |
Series 2018-DNA2, Class M1, (1 mo. LIBOR US + 0.80%), 0.95%, 12/25/30 | | | 167 | | | | 166,636 | |
Series 2018-DNA2, Class M2, (1 mo. LIBOR US + 2.15%), 2.30%, 12/25/30 | | | 1,900 | | | | 1,880,943 | |
| | | | | | | | |
| | |
| Security | | Par (000) | | | Value | |
|
| Collateralized Mortgage Obligations (continued) | |
STACR Trust(a) (continued) | | | | | | | | |
Series 2018-DNA3, Class M1, (1 mo. LIBOR US + 0.75%), 0.90%, 09/25/48 | | $ | 4 | | | $ | 4,039 | |
Series 2018-HRP1, Class M2, (1 mo. LIBOR US + 1.65%), 1.80%, 04/25/43 | | | 130 | | | | 128,452 | |
| | | | | | | | |
| | | | | | | 217,769,745 | |
|
| Commercial Mortgage-Backed Securities — 0.1% | |
CFCRE Commercial Mortgage Trust,
Series 2016- C4, Class AM, 3.69%, 05/10/58 | | | 160 | | | | 175,619 | |
COMM Mortgage Trust | | | | | | | | |
Series 2012-LC4, Class A4, 3.29%, 12/10/44 | | | 1,371 | | | | 1,390,101 | |
Series 2015-CR22, Class A2, 2.86%, 03/10/48 | | | 630 | | | | 629,519 | |
Wells Fargo Commercial Mortgage Trust, | | | | | | | | |
Series 2018-C46, Class AS, 4.38 %, 08/15/51 | | | 500 | | | | 589,551 | |
| | | | | | | | |
| | | | | | | 2,784,790 | |
| | | | | | | | |
| |
Total Non-Agency Mortgage-Backed
Securities — 6.7%
(Cost: $219,654,772) | | | | 220,554,535 | |
| | | | | | | | |
|
Preferred Securities | |
|
| Capital Trusts — 0.1%(c) | |
|
| Diversified Financial Services — 0.1% | |
Societe Generale SA, 5.38%(a)(d) | | | 1,000 | | | | 1,060,370 | |
| | | | | | | | |
|
| Wireless Telecommunication Services — 0.0% | |
Vodafone Group PLC, 7.00%, 04/04/79 | | | 200 | | | | 248,807 | |
| | | | | | | | |
| |
| Total Capital Trusts — 0.1% | | | 1,309,177 | |
| | | | | | | | |
| | |
Total Preferred Securities — 0.1%
(Cost: $1,289,964) | | | | | | | 1,309,177 | |
| | | | | | | | |
|
U.S. Government Sponsored Agency Securities | |
|
Collateralized Mortgage Obligations(c) — 9.4% | |
Connecticut Avenue Securities Trust,
Series 2019- R04, Class 2M2, (1 mo. LIBOR US + 2.10%), 2.25%, 06/25/39(a) | | | 21,890 | | | | 21,841,191 | |
Fannie Mae Connecticut Avenue Securities | | | | | | | | |
Series 2015-C04, Class 1M2, (1 mo. LIBOR US + 5.70%), 5.85%, 04/25/28 | | | 46 | | | | 49,261 | |
Series 2016-C04, Class 1M2, (1 mo. LIBOR US + 4.25%), 4.40%, 01/25/29 | | | 3,943 | | | | 4,103,914 | |
Series 2016-C05, Class 2M2, (1 mo. LIBOR US + 4.45%), 4.60%, 01/25/29 | | | 74 | | | | 77,128 | |
Series 2017-C01, Class 1B1, (1 mo. LIBOR US + 5.75%), 5.90%, 07/25/29 | | | 4,663 | | | | 4,984,110 | |
Series 2017-C01, Class 1M2A, (1 mo. LIBOR US + 3.55%), 3.70%, 07/25/29 | | | 10 | | | | 10,086 | |
Series 2017-C02, Class 2B1, (1 mo. LIBOR US + 5.50%), 5.65%, 09/25/29 | | | 7,487 | | | | 7,916,138 | |
Series 2017-C02, Class 2M2, (1 mo. LIBOR US + 3.65%), 3.80%, 09/25/29 | | | 4,448 | | | | 4,552,007 | |
Series 2017-C03, Class 1B1, (1 mo. LIBOR US + 4.85%), 5.00%, 10/25/29 | | | 6,494 | | | | 6,752,935 | |
Series 2017-C03, Class 1M2, (1 mo. LIBOR US + 3.00%), 3.15%, 10/25/29 | | | 1,571 | | | | 1,588,749 | |
Series 2017-C04, Class 2B1, (1 mo. LIBOR US + 5.05%), 5.20%, 11/25/29 | | | 9,803 | | | | 10,193,933 | |
| | |
| 38 | | 2 0 2 0 BLACK ROCK ANNUAL REPORT TO SHAREHOLDERS |
| | |
Schedule of Investments (continued) December 31, 2020 | | BlackRock Systematic Multi-Strategy Fund (Percentages shown are based on Net Assets) |
| | | | | | | | |
| | |
| Security | | Par (000) | | | Value | |
| |
| Collateralized Mortgage Obligations (continued) | | | | |
Fannie Mae Connecticut Avenue | | | | | | | | |
Securities (continued) | | | | | | | | |
Series 2017-C05, Class 1B1, (1 mo. LIBOR US + 3.60%), 3.75%, 01/25/30 | | $ | 5,414 | | | $ | 5,420,757 | |
Series 2017-C05, Class 1M2A, (1 mo. LIBOR US + 2.20%), 2.35%, 01/25/30 | | | 20 | | | | 20,070 | |
Series 2017-C06, Class 1M2, (1 mo. LIBOR US + 2.65%), 2.80%, 02/25/30 | | | 6,904 | | | | 6,921,297 | |
Series 2017-C06, Class 1M2A, (1 mo. LIBOR US + 2.65%), 2.80%, 02/25/30 | | | 64 | | | | 64,794 | |
Series 2017-C06, Class 2M2, (1 mo. LIBOR US + 2.80%), 2.95%, 02/25/30 | | | 62 | | | | 62,534 | |
Series 2017-C07, Class 1M2, (1 mo. LIBOR US + 2.40%), 2.55%, 05/25/30 | | | 70 | | | | 69,986 | |
Series 2017-C07, Class 2M2, (1 mo. LIBOR US + 2.50%), 2.65%, 05/25/30 | | | 1,161 | | | | 1,160,389 | |
Series 2018-C01, Class 1B1, (1 mo. LIBOR US + 3.55%), 3.70%, 07/25/30 | | | 11,262 | | | | 11,232,269 | |
Series 2018-C01, Class 1M2, (1 mo. LIBOR US + 2.25%), 2.40%, 07/25/30 | | | 1,639 | | | | 1,630,884 | |
Series 2018-C02, Class 2B1, (1 mo. LIBOR US + 4.00%), 4.15%, 08/25/30 | | | 11,445 | | | | 11,444,989 | |
Series 2018-C02, Class 2ED2, 1.05%, 08/25/30 | | | 3,114 | | | | 3,054,157 | |
Series 2018-C02, Class 2M2, (1 mo. LIBOR US + 2.20%), 2.35%, 08/25/30 | | | 6,406 | | | | 6,365,792 | |
Series 2018-C04, Class 2M2, (1 mo. LIBOR US + 2.55%), 2.70%, 12/25/30 | | | 10,163 | | | | 10,188,408 | |
Series 2018-C06, Class 2M2, (1 mo. LIBOR US + 2.10%), 2.25%, 03/25/31 | | | 1,939 | | | | 1,914,891 | |
Freddie Mac STACR Trust(a) | | | | | | | | |
Series 2018-HQA2, Class M2, (1 mo. LIBOR US + 2.30%), 2.45%, 10/25/48 | | | 11,250 | | | | 11,136,196 | |
Series 2019-DNA1, Class M2, (1 mo. LIBOR US + 2.65%), 2.80%, 01/25/49 | | | 1,999 | | | | 1,993,535 | |
Series 2019-DNA2, Class M2, (1 mo. LIBOR US + 2.45%), 2.60%, 03/25/49 | | | 4,398 | | | | 4,386,356 | |
Series 2019-DNA3, Class M2, (1 mo. LIBOR US + 2.05%), 2.20%, 07/25/49 | | | 9,063 | | | | 9,012,070 | |
Series 2019-DNA4, Class M2, (1 mo. LIBOR US + 1.95%), 2.10%, 10/25/49 | | | 21,772 | | | | 21,737,030 | |
Series 2019-FTR2, Class M1, (1 mo. LIBOR US + 0.95%), 1.10%, 11/25/48 | | | 450 | | | | 449,130 | |
Series 2019-HQA1, Class M2, (1 mo. LIBOR US + 2.35%), 2.50%, 02/25/49 | | | 12,495 | | | | 12,463,019 | |
Series 2019-HQA2, Class M2, (1 mo. LIBOR US + 2.05%), 2.20%, 04/25/49 | | | 1,295 | | | | 1,277,113 | |
Series 2019-HQA3, Class M2, (1 mo. LIBOR US + 1.85%), 2.00%, 09/25/49 | | | 6,915 | | | | 6,827,302 | |
Series 2019-HQA4, Class M2, (1 mo. LIBOR US + 2.05%), 2.20%, 11/25/49 | | | 20,019 | | | | 19,959,899 | |
Series 2020-DNA1, Class M1, (1 mo. LIBOR US + 0.70%), 0.85%, 01/25/50 | | | 475 | | | | 475,818 | |
Series 2020-DNA1, Class M2, (1 mo. LIBOR US + 1.70%), 1.85%, 01/25/50 | | | 21,825 | | | | 21,660,815 | |
Series 2020-DNA2, Class M1, (1 mo. LIBOR US + 0.75%), 0.90%, 02/25/50 | | | 3,598 | | | | 3,601,525 | |
Series 2020-DNA4, Class M1, (1 mo. LIBOR US + 1.50%), 1.65%, 08/25/50 | | | 7,667 | | | | 7,682,205 | |
| | | | | | | | |
| | |
| Security | | Par (000) | | | Value | |
| |
| Collateralized Mortgage Obligations (continued) | | | | |
Freddie Mac STACR Trust(a) (continued) | | | | | | | | |
Series 2020-HQA1, Class M1, (1 mo. LIBOR US +0.75%), 0.90%, 01/25/50 | | $ | 449 | | | $ | 448,637 | |
Series 2020-HQA1, Class M2, (1 mo. LIBOR US +1.90%), 2.05%, 01/25/50 | | | 24,985 | | | | 24,867,563 | |
Series 2020-HQA3, Class M1, (1 mo. LIBOR US +1.55%), 1.70%, 07/25/50 | | | 7,303 | | | | 7,309,713 | |
Series 2020-HQA4, Class M1, (1 mo. LIBOR US +1.30%), 1.45%, 09/25/50 | | | 10,421 | | | | 10,436,558 | |
Freddie Mac Structured Agency Credit Risk Debt Notes | | | | | | | | |
Series 2016-DNA2, Class M3, (1 mo. LIBOR US + 4.65%), 4.80%, 10/25/28 | | | 349 | | | | 362,693 | |
Series 2017-DNA1, Class B1, (1 mo. LIBOR US + 4.95%), 5.10%, 07/25/29 | | | 3,925 | | | | 4,130,384 | |
Series 2017-DNA2, Class B1, (1 mo. LIBOR US + 5.15%), 5.30%, 10/25/29 | | | 5,000 | | | | 5,311,515 | |
Series 2017-DNA3, Class B1, (1 mo. LIBOR US + 4.45%), 4.60%, 03/25/30 | | | 3,355 | | | | 3,446,612 | |
Series 2017-DNA3, Class M2, (1 mo. LIBOR US + 2.50%), 2.65%, 03/25/30 | | | 250 | | | | 253,415 | |
Series 2017-HQA2, Class B1, (1 mo. LIBOR US + 4.75%), 4.90%, 12/25/29 | | | 1,730 | | | | 1,790,364 | |
Series 2017-HQA3, Class B1, (1 mo. LIBOR US + 4.45%), 4.60%, 04/25/30 | | | 1,981 | | | | 2,030,385 | |
Series 2018-DNA1, Class B1, (1 mo. LIBOR US + 3.15%), 3.30%, 07/25/30 | | | 4,320 | | | | 4,255,395 | |
Series 2018-DNA1, Class M2, (1 mo. LIBOR US + 1.80%), 1.95%, 07/25/30 | | | 86 | | | | 85,776 | |
| | | | | | | | |
| | | | | | | 309,011,692 | |
| |
| Mortgage-Backed Securities — 44.2% | | | | |
Ginnie Mae Mortgage-Backed Securities(h) | | | | | | | | |
3.50%, 06/20/42 - 01/21/51 | | | 87,760 | | | | 93,202,112 | |
3.00%, 05/20/45 - 01/21/51 | | | 92,694 | | | | 97,064,195 | |
2.50%, 12/20/46 - 01/21/51 | | | 50,354 | | | | 53,320,081 | |
4.00%, 11/20/47 - 01/21/51 | | | 44,997 | | | | 48,102,250 | |
4.50%, 10/20/48 - 01/21/51 | | | 18,708 | | | | 20,057,306 | |
5.00%, 12/20/48 - 01/21/51 | | | 11,539 | | | | 12,600,848 | |
1.50%, 01/21/51 | | | 500 | | | | 509,453 | |
2.00%, 01/21/51 | | | 11,775 | | | | 12,313,614 | |
5.50%, 01/21/51 | | | 650 | | | | 716,016 | |
Government National Mortgage Association, 3.00%, 01/20/50 | | | 3,867 | | | | 4,056,135 | |
Multifamily Connecticut Avenue Securities Trust, Series 2019-01, Class M10,
(1 mo. LIBOR US + 3.25%),
3.40%, 10/15/49(a)(c) | | | 750 | | | | 698,723 | |
Uniform Mortgage-Backed Securities(h) | | | | | | | | |
2.50%, 04/01/32 - 02/12/51 | | | 206,237 | | | | 217,481,042 | |
2.00%, 12/01/35 - 02/12/51 | | | 159,174 | | | | 165,632,294 | |
3.00%, 12/01/35 - 01/14/51 | | | 253,698 | | | | 267,323,363 | |
1.50%, 01/16/36 - 01/14/51 | | | 16,975 | | | | 17,304,258 | |
3.50%, 01/16/36 - 01/14/51 | | | 210,919 | | | | 224,351,910 | |
4.00%, 01/16/36 - 02/01/57 | | | 126,391 | | | | 135,831,828 | |
4.50%, 01/16/36 - 01/14/51 | | | 47,479 | | | | 51,682,000 | |
| | |
SCHEDULES OF INVESTMENTS | | 39 |
| | |
Schedule of Investments (continued) December 31, 2020 | | BlackRock Systematic Multi-Strategy Fund (Percentages shown are based on Net Assets) |
| | | | | | | | |
| | |
| Security | | Par (000) | | | Value | |
| |
| Mortgage-Backed Securities (continued) | | | | |
Uniform Mortgage-Backed Securities(h) (continued) | | | | | | | | |
5.00%, 02/01/41 - 01/14/51 | | $ | 18,932 | | | $ | 20,967,329 | |
5.50%, 01/14/51 | | | 2,350 | | | | 2,625,391 | |
| | | | | | | | |
| | | | | | | 1,445,840,148 | |
| | | | | | | | |
| | |
Total U.S. Government Sponsored Agency Securities — 53.6%
(Cost: $1,744,123,679) | | | | | | | 1,754,851,840 | |
| | | | | | | | |
| | |
U.S. Treasury Obligations | | | | | | | | |
| | |
U.S. Treasury Bonds, 3.13%, 08/15/44 | | | 600 | | | | 791,320 | |
U.S. Treasury Notes | | | | | | | | |
1.88%, 02/28/22 - 03/31/22 | | | 9,000 | | | | 9,189,063 | |
1.50%, 08/15/26 | | | 10,000 | | | | 10,588,672 | |
| | | | | | | | |
| |
Total U.S. Treasury Obligations — 0.6%
(Cost: $19,512,290) | | | | 20,569,055 | |
| | | | | | | | |
| | |
| | | Shares | | | | |
| | |
Warrants | | | | | | | | |
| | |
Oil, Gas & Consumable Fuels — 0.0% | | | | | | | | |
| | |
SM Energy Co. (Expires 06/30/23) | | | 3,253 | | | | 19,876 | |
| | | | | | | | |
| | |
Total Warrants — 0.0%
(Cost: $13,955) | | | | | | | 19,876 | |
| | | | | | | | |
| |
Total Long-Term Investments — 120.4%
(Cost: $3,866,261,303) | | | | 3,944,126,508 | |
| | | | | | | | |
| | |
Short-Term Securities | | | | | | | | |
| | |
Money Market Funds — 8.7% | | | | | | | | |
BlackRock Liquidity Funds, T-Fund, Institutional Class, 0.00%(g)(i) | | | 284,922,233 | | | | 284,922,233 | |
| | | | | | | | |
| | |
Total Short-Term Securities — 8.7%
(Cost: $284,922,233) | | | | | | | 284,922,233 | |
| | | | | | | | |
| |
Total Investments Before TBA Sale
Commitments — 129.1%
(Cost: $4,151,183,536) | | | | 4,229,048,741 | |
| | | | | | | | |
| | | | | | | | |
| | |
| Security | | Par (000) | | | Value | |
| | |
TBA Sale Commitments | | | | | | | | |
| | |
Mortgage-Backed Securities — (2.5)% | | | | | | | | |
Uniform Mortgage-Backed Securities(h) | | | | | | | | |
2.00%, 01/16/36 - 01/14/51 | | $ | (28,524 | ) | | $ | (29,653,290 | ) |
2.50%, 01/14/51 | | | (15,225 | ) | | | (16,049,291 | ) |
3.00%, 01/14/51 | | | (9,500 | ) | | | (9,953,477 | ) |
3.50%, 01/14/51 | | | (23,827 | ) | | | (25,185,884 | ) |
| | | | | | | | |
| | |
Total TBA Sale Commitments — (2.5)%
(Proceeds: $(80,559,144)) | | | | | | | (80,841,942 | ) |
| | | | | | | | |
| |
Total Investments, Net of TBA Sale
Commitments — 126.6%
(Cost: $4,070,624,392) | | | | 4,148,206,799 | |
Liabilities in Excess of Other Assets — (26.6)% | | | | (872,355,955 | ) |
| | | | | | | | |
| | |
Net Assets — 100.0% | | | | | | $ | 3,275,850,844 | |
| | | | | | | | |
| (a) | Security exempt from registration pursuant to Rule 144A under the Securities Act of 1933, as amended. These securities may be resold in transactions exempt from registration to qualified institutional investors. |
| (b) | Step-up bond that pays an initial coupon rate for the first period and then a higher coupon rate for the following periods. Rate as of period end. |
| (c) | Variable rate security. Interest rate resets periodically. The rate shown is the effective interest rate as of period end. Security description also includes the reference rate and spread if published and available. |
| (d) | Perpetual security with no stated maturity date. |
| (e) | Payment-in-kind security which may pay interest/dividends in additional par/shares and/or in cash. Rates shown are the current rate and possible payment rates. |
| (f) | When-issued security. (g) Affiliate of the Fund. |
| (h) | Represents or includes a TBA transaction. (i) Annualized 7-day yield as of period end. |
Affiliates
Investments in issuers considered to be affiliate(s) of the Fund during the year ended December 31, 2020 for purposes of Section 2(a)(3) of the 1940 Act, as amended, were as follows:
| | | | | | | | | | | | | | | | | | | | | | | | | | | | | | | | | | | | |
| Affiliated Issuer | | Value at
12/31/19 | | | Purchases at
Cost | | | Proceeds
from Sales | | | Net Realized
Gain (Loss) | | | Change in
Unrealized
Appreciation
(Depreciation) | | | Value at
12/31/20 | | | Shares Held at
12/31/20 | | | Income | | | Capital Gain
Distributions
from
Underlying
Funds | |
BlackRock Liquid Environmentally Aware Fund | | $ | — | | | $ | 150,049,912 | | | $ | — | | | $ | — | | | $ | (59,921 | ) | | $ | 149,989,991 | | | | 149,915,033 | | | $ | 49,918 | | | $ | — | |
BlackRock Liquidity Funds, T-Fund, Institutional Class | | | 96,002,743 | | | | 188,919,490 | (a) | | | — | | | | — | | | | — | | | | 284,922,233 | | | | 284,922,233 | | | | 713,870 | | | | — | |
| | | | | | | | | | | | | | | | | | | | | | | | | | | | | | | | | | | | |
| | | | | | | | | | | | | | $ | — | | | $ | (59,921 | ) | | $ | 434,912,224 | | | | | | | $ | 763,788 | | | $ | — | |
| | | | | | | | | | | | | | | | | | | | | | | | | | | | | | | | | | | | |
| | (a) | Represents net amount purchased (sold). | |
For Fund compliance purposes, the Fund’s industry classifications refer to one or more of the industry sub-classifications used by one or more widely recognized market indexes or rating group indexes, and/or as defined by the investment adviser. These definitions may not apply for purposes of this report, which may combine such industry sub-classifications for reporting ease.
| | |
| 40 | | 2 0 2 0 BLACK ROCK ANNUAL REPORT TO SHAREHOLDERS |
| | |
Schedule of Investments (continued) December 31, 2020 | | BlackRock Systematic Multi-Strategy Fund |
Derivative Financial Instruments Outstanding as of Period End
Futures Contracts
| | | | | | | | | | | | | | | | |
| Description | | Number of Contracts | | | Expiration Date | | | Notional Amount (000) | | | Value/
Unrealized
Appreciation
(Depreciation) | |
Long Contracts | | | | | | | | | | | | | | | | |
10-Year Australian T-Bond | | | 1,459 | | | | 03/15/21 | | | $ | 165,607 | | | $ | 301,835 | |
10-Year U.S. Treasury Note | | | 1,156 | | | | 03/22/21 | | | | 159,618 | | | | 370,126 | |
U.S. Long Bond | | | 68 | | | | 03/22/21 | | | | 11,777 | | | | (115,415 | ) |
U.S. Ultra Bond | | | 30 | | | | 03/22/21 | | | | 6,407 | | | | 39,932 | |
2-Year U.S. Treasury Notes | | | 318 | | | | 03/31/21 | | | | 70,271 | | | | 64,019 | |
5-Year U.S. Treasury Notes | | | 2,917 | | | | 03/31/21 | | | | 368,021 | | | | 794,617 | |
| | | | | | | | | | | | | | | | |
| | | | | | | | | | | | | | | 1,455,114 | |
| | | | | | | | | | | | | | | | |
Short Contracts | | | | | | | | | | | | | | | | |
Euro BTP Futures | | | 43 | | | | 03/08/21 | | | | 7,985 | | | | (8,003 | ) |
Euro Bund Futures | | | 459 | | | | 03/08/21 | | | | 99,609 | | | | (178,515 | ) |
German Euro OAT Futures | | | 176 | | | | 03/08/21 | | | | 36,092 | | | | (1,371 | ) |
10-Year Canada Bond | | | 559 | | | | 03/22/21 | | | | 65,478 | | | | (385,627 | ) |
10-Year U.S. Ultra Long Treasury Note | | | 114 | | | | 03/22/21 | | | | 17,825 | | | | 61,045 | |
Long Gilt Bond Future | | | 152 | | | | 03/29/21 | | | | 28,173 | | | | (217,009 | ) |
| | | | | | | | | | | | | | | | |
| | | | | | | | | | | | | | | (729,480 | ) |
| | | | | | | | | | | | | | | | |
| | | | | | | | | | | | | | $ | 725,634 | |
| | | | | | | | | | | | | | | | |
Forward Foreign Currency Exchange Contracts
| | | | | | | | | | | | | | | | |
| Currency Purchased | | Currency Sold | | Counterparty | | Settlement Date | | Unrealized
Appreciation
(Depreciation) | |
| USD | | 2,495,400 | | | EUR | | | 2,050,000 | | Citibank N.A. | | 03/17/21 | | $ | (13,055 | ) |
| | | | | | | | | | | | | | | | |
Centrally Cleared Interest Rate Swaps
| | | | | | | | | | | | | | | | | | | | | | | | | | | | | | | | | | | | |
| | | | | | | | | | | | | | | | | | | | | | | | | | Upfront
Premium | | | Unrealized | |
| Paid by the Fund | | | | Received by the Fund | | Effective | | | Termination | | | Notional | | | | | | Paid | | | Appreciation | |
| Rate | | Frequency | | | | Rate | | Frequency | | Date | | | Date | | | Amount (000) | | | Value | | | (Received) | | | (Depreciation) | |
1-Month MXIBOR, 4.48% | | Monthly | | | | 5.09% | | Monthly | | | 03/17/21 | (a) | | | 03/11/26 | | | | MXN | | | | 43,110 | | | $ | 31,464 | | | $ | 32 | | | $ | 31,432 | |
(0.47%) | | Annual | | | | 6-Month EURIBOR, (0.53%) | | Semi-Annual | | | 03/17/21 | (a) | | | 03/17/26 | | | | EUR | | | | 3,370 | | | | 3,071 | | | | 69 | | | | 3,002 | |
(0.45%) | | Annual | | | | 6-Month EURIBOR, (0.53%) | | Semi-Annual | | | 03/17/21 | (a) | | | 03/17/26 | | | | EUR | | | | 3,250 | | | | (1,492 | ) | | | 67 | | | | (1,559 | ) |
(0.45%) | | Annual | | | | 6-Month EURIBOR, (0.53%) | | Semi-Annual | | | 03/17/21 | (a) | | | 03/17/26 | | | | EUR | | | | 4,200 | | | | (2,059 | ) | | | 89 | | | | (2,148 | ) |
(0.45%) | | Annual | | | | 6-Month EURIBOR, (0.53%) | | Semi-Annual | | | 03/17/21 | (a) | | | 03/17/26 | | | | EUR | | | | 5,260 | | | | (3,069 | ) | | | 112 | | | | (3,181 | ) |
(0.44%) | | Annual | | | | 6-Month EURIBOR, (0.53%) | | Semi-Annual | | | 03/17/21 | (a) | | | 03/17/26 | | | | EUR | | | | 2,450 | | | | (2,573 | ) | | | 51 | | | | (2,624 | ) |
(0.44%) | | Annual | | | | 6-Month EURIBOR, (0.53%) | | Semi-Annual | | | 03/17/21 | (a) | | | 03/17/26 | | | | EUR | | | | 3,430 | | | | (4,245 | ) | | | 70 | | | | (4,315 | ) |
(0.43%) | | Annual | | | | 6-Month EURIBOR, (0.53%) | | Semi-Annual | | | 03/17/21 | (a) | | | 03/17/26 | | | | EUR | | | | 4,260 | | | | (6,597 | ) | | | 88 | | | | (6,685 | ) |
(0.43%) | | Annual | | | | 6-Month EURIBOR, (0.53%) | | Semi-Annual | | | 03/17/21 | (a) | | | 03/17/26 | | | | EUR | | | | 2,970 | | | | (4,230 | ) | | | 61 | | | | (4,291 | ) |
(0.43%) | | Annual | | | | 6-Month EURIBOR, (0.53%) | | Semi-Annual | | | 03/17/21 | (a) | | | 03/17/26 | | | | EUR | | | | 2,900 | | | | (3,769 | ) | | | 60 | | | | (3,829 | ) |
(0.42%) | | Annual | | | | 6-Month EURIBOR, (0.53%) | | Semi-Annual | | | 03/17/21 | (a) | | | 03/17/26 | | | | EUR | | | | 1,970 | | | | (4,891 | ) | | | 42 | | | | (4,933 | ) |
0.10% | | Annual | | | | 3-Month STIBOR, (0.09%) | | Quarterly | | | 03/17/21 | (a) | | | 03/17/26 | | | | SEK | | | | 33,170 | | | | 10,798 | | | | 68 | | | | 10,730 | |
0.11% | | Annual | | | | 3-Month STIBOR, (0.09%) | | Quarterly | | | 03/17/21 | (a) | | | 03/17/26 | | | | SEK | | | | 13,140 | | | | 3,153 | | | | 26 | | | | 3,127 | |
0.12% | | Annual | | | | 3-Month STIBOR, (0.09%) | | Quarterly | | | 03/17/21 | (a) | | | 03/17/26 | | | | SEK | | | | 50,430 | | | | 9,328 | | | | 102 | | | | 9,226 | |
0.12% | | Annual | | | | 3-Month STIBOR, (0.09%) | | Quarterly | | | 03/17/21 | (a) | | | 03/17/26 | | | | SEK | | | | 22,390 | | | | 4,551 | | | | 45 | | | | 4,506 | |
0.12% | | Annual | | | | 3-Month STIBOR, (0.09%) | | Quarterly | | | 03/17/21 | (a) | | | 03/17/26 | | | | SEK | | | | 21,790 | | | | 4,962 | | | | 44 | | | | 4,918 | |
0.14% | | Annual | | | | 3-Month STIBOR, (0.09%) | | Quarterly | | | 03/17/21 | (a) | | | 03/17/26 | | | | SEK | | | | 23,950 | | | | 1,795 | | | | 895 | | | | 900 | |
0.14% | | Annual | | | | 3-Month STIBOR, (0.09%) | | Quarterly | | | 03/17/21 | (a) | | | 03/17/26 | | | | SEK | | | | 21,910 | | | | 2,178 | | | | 44 | | | | 2,134 | |
0.16% | | Annual | | | | 3-Month STIBOR, (0.09%) | | Quarterly | | | 03/17/21 | (a) | | | 03/17/26 | | | | SEK | | | | 29,720 | | | | (1,314 | ) | | | 60 | | | | (1,374 | ) |
0.22% | | Semi-Annual | | | | 6-Month GBP LIBOR, 0.30% | | Semi-Annual | | | 03/17/21 | (a) | | | 03/17/26 | | | | GBP | | | | 3,040 | | | | (1,370 | ) | | | 68 | | | | (1,438 | ) |
0.22% | | Semi-Annual | | | | 6-Month GBP LIBOR, 0.30% | | Semi-Annual | | | 03/17/21 | (a) | | | 03/17/26 | | | | GBP | | | | 2,540 | | | | (2,275 | ) | | | 59 | | | | (2,334 | ) |
0.23% | | Semi-Annual | | | | 6-Month GBP LIBOR, 0.30% | | Semi-Annual | | | 03/17/21 | (a) | | | 03/17/26 | | | | GBP | | | | 2,720 | | | | (3,740 | ) | | | 61 | | | | (3,801 | ) |
0.24% | | Semi-Annual | | | | 6-Month GBP LIBOR, 0.30% | | Semi-Annual | | | 03/17/21 | (a) | | | 03/17/26 | | | | GBP | | | | 2,190 | | | | (4,060 | ) | | | 50 | | | | (4,110 | ) |
0.25% | | Semi-Annual | | | | 6-Month GBP LIBOR, 0.30% | | Semi-Annual | | | 03/17/21 | (a) | | | 03/17/26 | | | | GBP | | | | 4,050 | | | | (12,084 | ) | | | 95 | | | | (12,179 | ) |
0.26% | | Semi-Annual | | | | 6-Month GBP LIBOR, 0.30% | | Semi-Annual | | | 03/17/21 | (a) | | | 03/17/26 | | | | GBP | | | | 1,840 | | | | (6,246 | ) | | | 43 | | | | (6,289 | ) |
| | |
SCHEDULE OF INVESTMENTS | | 41 |
| | |
Schedule of Investments (continued) December 31, 2020 | | BlackRock Systematic Multi-Strategy Fund |
Centrally Cleared Interest Rate Swaps (continued)
| | | | | | | | | | | | | | | | | | | | | | | | | | | | | | | | | | | | |
| | | | | | | | | | | | | | | | | | | | | | | | | | Upfront
Premium | | | Unrealized | |
| Paid by the Fund | | | | Received by the Fund | | Effective | | | Termination | | | Notional | | | | | | Paid | | | Appreciation | |
| Rate | | Frequency | | | | Rate | | Frequency | | Date | | | Date | | | Amount (000) | | | Value | | | (Received) | | | (Depreciation) | |
0.27% | | Semi-Annual | | | | 6-Month GBP LIBOR, 0.30% | | Semi-Annual | | | 03/17/21 | (a) | | | 03/17/26 | | | | GBP | | | | 3,170 | | | $ | (12,763 | ) | | $ | (639 | ) | | $ | (12,124 | ) |
0.28% | | Semi-Annual | | | | 6-Month GBP LIBOR, 0.30% | | Semi-Annual | | | 03/17/21 | (a) | | | 03/17/26 | | | | GBP | | | | 1,820 | | | | (8,982 | ) | | | 42 | | | | (9,024 | ) |
0.28% | | Semi-Annual | | | | 6-Month GBP LIBOR, 0.30% | | Semi-Annual | | | 03/17/21 | (a) | | | 03/17/26 | | | | GBP | | | | 2,230 | | | | (11,082 | ) | | | 52 | | | | (11,134 | ) |
0.29% | | Semi-Annual | | | | 6-Month GBP LIBOR, 0.30% | | Semi-Annual | | | 03/17/21 | (a) | | | 03/17/26 | | | | GBP | | | | 7,080 | | | | (39,788 | ) | | | 164 | | | | (39,952 | ) |
0.29% | | Semi-Annual | | | | 6-Month GBP LIBOR, 0.30% | | Semi-Annual | | | 03/17/21 | (a) | | | 03/17/26 | | | | GBP | | | | 2,190 | | | | (12,568 | ) | | | 3,178 | | | | (15,746 | ) |
0.30% | | Semi-Annual | | | | 6-Month GBP LIBOR, 0.30% | | Semi-Annual | | | 03/17/21 | (a) | | | 03/17/26 | | | | GBP | | | | 2,590 | | | | (17,038 | ) | | | 60 | | | | (17,098 | ) |
0.31% | | Semi-Annual | | | | 6-Month GBP LIBOR, 0.30% | | Semi-Annual | | | 03/17/21 | (a) | | | 03/17/26 | | | | GBP | | | | 3,050 | | | | (20,377 | ) | | | 70 | | | | (20,447 | ) |
0.31% | | Semi-Annual | | | | 6-Month GBP LIBOR, 0.30% | | Semi-Annual | | | 03/17/21 | (a) | | | 03/17/26 | | | | GBP | | | | 1,920 | | | | (13,353 | ) | | | 45 | | | | (13,398 | ) |
6-Month BBR, 0.76% | | Semi-Annual | | | | 0.35% | | Semi-Annual | | | 03/17/21 | (a) | | | 03/17/26 | | | | AUD | | | | 3,310 | | | | (9,946 | ) | | | 42 | | | | (9,988 | ) |
6-Month BBR, 0.76% | | Semi-Annual | | | | 0.37% | | Semi-Annual | | | 03/17/21 | (a) | | | 03/17/26 | | | | AUD | | | | 3,370 | | | | (6,695 | ) | | | 43 | | | | (6,738 | ) |
6-Month BBR, 0.76% | | Semi-Annual | | | | 0.37% | | Semi-Annual | | | 03/17/21 | (a) | | | 03/17/26 | | | | AUD | | | | 1,227 | | | | (2,792 | ) | | | 16 | | | | (2,808 | ) |
6-Month BBR, 0.76% | | Semi-Annual | | | | 0.37% | | Semi-Annual | | | 03/17/21 | (a) | | | 03/17/26 | | | | AUD | | | | 2,383 | | | | (5,237 | ) | | | 30 | | | | (5,267 | ) |
6-Month BBR, 0.76% | | Semi-Annual | | | | 0.37% | | Semi-Annual | | | 03/17/21 | (a) | | | 03/17/26 | | | | AUD | | | | 1,820 | | | | (3,546 | ) | | | 23 | | | | (3,569 | ) |
6-Month BBR, 0.76% | | Semi-Annual | | | | 0.38% | | Semi-Annual | | | 03/17/21 | (a) | | | 03/17/26 | | | | AUD | | | | 5,270 | | | | (9,154 | ) | | | 67 | | | | (9,221 | ) |
6-Month BBR, 0.76% | | Semi-Annual | | | | 0.38% | | Semi-Annual | | | 03/17/21 | (a) | | | 03/17/26 | | | | AUD | | | | 1,590 | | | | (2,701 | ) | | | 20 | | | | (2,721 | ) |
6-Month BBR, 0.76% | | Semi-Annual | | | | 0.38% | | Semi-Annual | | | 03/17/21 | (a) | | | 03/17/26 | | | | AUD | | | | 1,820 | | | | (2,986 | ) | | | 23 | | | | (3,009 | ) |
6-Month BBR, 0.76% | | Semi-Annual | | | | 0.39% | | Semi-Annual | | | 03/17/21 | (a) | | | 03/17/26 | | | | AUD | | | | 1,930 | | | | (2,536 | ) | | | 25 | | | | (2,561 | ) |
6-Month BBR, 0.76% | | Semi-Annual | | | | 0.39% | | Semi-Annual | | | 03/17/21 | (a) | | | 03/17/26 | | | | AUD | | | | 1,930 | | | | (2,833 | ) | | | 25 | | | | (2,858 | ) |
6-Month BBR, 0.76% | | Semi-Annual | | | | 0.41% | | Semi-Annual | | | 03/17/21 | (a) | | | 03/17/26 | | | | AUD | | | | 3,470 | | | | (2,227 | ) | | | 45 | | | | (2,272 | ) |
6-Month BBR, 0.76% | | Semi-Annual | | | | 0.42% | | Semi-Annual | | | 03/17/21 | (a) | | | 03/17/26 | | | | AUD | | | | 3,350 | | | | (1,185 | ) | | | 43 | | | | (1,228 | ) |
6-Month BBR, 0.76% | | Semi-Annual | | | | 0.42% | | Semi-Annual | | | 03/17/21 | (a) | | | 03/17/26 | | | | AUD | | | | 3,170 | | | | (999 | ) | | | 41 | | | | (1,040 | ) |
6-Month BBR, 0.76% | | Semi-Annual | | | | 0.42% | | Semi-Annual | | | 03/17/21 | (a) | | | 03/17/26 | | | | AUD | | | | 6,610 | | | | (1,196 | ) | | | 86 | | | | (1,282 | ) |
6-Month BBR, 0.76% | | Semi-Annual | | | | 0.43% | | Semi-Annual | | | 03/17/21 | (a) | | | 03/17/26 | | | | AUD | | | | 4,390 | | | | 1,146 | | | | 57 | | | | 1,089 | |
6-Month BBR, 0.76% | | Semi-Annual | | | | 0.43% | | Semi-Annual | | | 03/17/21 | (a) | | | 03/17/26 | | | | AUD | | | | 4,180 | | | | 609 | | | | 54 | | | | 555 | |
6-Month BBR, 0.76% | | Semi-Annual | | | | 0.43% | | Semi-Annual | | | 03/17/21 | (a) | | | 03/17/26 | | | | AUD | | | | 5,400 | | | | 2,031 | | | | 70 | | | | 1,961 | |
6-Month BBR, 0.76% | | Semi-Annual | | | | 0.44% | | Semi-Annual | | | 03/17/21 | (a) | | | 03/17/26 | | | | AUD | | | | 4,490 | | | | 2,552 | | | | 58 | | | | 2,494 | |
6-Month BBR, 0.76% | | Semi-Annual | | | | 0.45% | | Semi-Annual | | | 03/17/21 | (a) | | | 03/17/26 | | | | AUD | | | | 4,500 | | | | 4,027 | | | | 59 | | | | 3,968 | |
0.47% | | Semi-Annual | | | | 3-Month LIBOR, 0.24% | | Quarterly | | | 03/17/21 | (a) | | | 03/17/26 | | | | USD | | | | 2,410 | | | | (1,042 | ) | | | 41 | | | | (1,083 | ) |
0.47% | | Semi-Annual | | | | 3-Month LIBOR, 0.24% | | Quarterly | | | 03/17/21 | (a) | | | 03/17/26 | | | | USD | | | | 3,770 | | | | (1,721 | ) | | | 66 | | | | (1,787 | ) |
0.48% | | Semi-Annual | | | | 3-Month LIBOR, 0.24% | | Quarterly | | | 03/17/21 | (a) | | | 03/17/26 | | | | USD | | | | 5,740 | | | | (6,048 | ) | | | 100 | | | | (6,148 | ) |
0.50% | | Semi-Annual | | | | 3-Month LIBOR, 0.24% | | Quarterly | | | 03/17/21 | (a) | | | 03/17/26 | | | | USD | | | | 3,410 | | | | (7,580 | ) | | | 58 | | | | (7,638 | ) |
0.51% | | Semi-Annual | | | | 3-Month LIBOR, 0.24% | | Quarterly | | | 03/17/21 | (a) | | | 03/17/26 | | | | USD | | | | 2,870 | | | | (6,807 | ) | | | 50 | | | | (6,857 | ) |
0.51% | | Semi-Annual | | | | 6-Month SIBOR, 0.59% | | Semi-Annual | | | 03/17/21 | (a) | | | 03/17/26 | | | | SGD | | | | 6,470 | | | | (7,403 | ) | | | 75 | | | | (7,478 | ) |
0.52% | | Semi-Annual | | | | 3-Month LIBOR, 0.24% | | Quarterly | | | 03/17/21 | (a) | | | 03/17/26 | | | | USD | | | | 3,850 | | | | (11,909 | ) | | | 67 | | | | (11,976 | ) |
3-Month HIBOR, 0.35% | | Quarterly | | | | 0.53% | | Quarterly | | | 03/17/21 | (a) | | | 03/17/26 | | | | HKD | | | | 34,470 | | | | 4,938 | | | | 69 | | | | 4,869 | |
0.53% | | Semi-Annual | | | | 6-Month SIBOR, 0.59% | | Semi-Annual | | | 03/17/21 | (a) | | | 03/17/26 | | | | SGD | | | | 3,850 | | | | (7,465 | ) | | | 44 | | | | (7,509 | ) |
0.54% | | Semi-Annual | | | | 6-Month SIBOR, 0.59% | | Semi-Annual | | | 03/17/21 | (a) | | | 03/17/26 | | | | SGD | | | | 5,020 | | | | (12,012 | ) | | | 58 | | | | (12,070 | ) |
0.54% | | Semi-Annual | | | | 6-Month SIBOR, 0.59% | | Semi-Annual | | | 03/17/21 | (a) | | | 03/17/26 | | | | SGD | | | | 3,850 | | | | (9,358 | ) | | | 44 | | | | (9,402 | ) |
0.55% | | Semi-Annual | | | | 6-Month SIBOR, 0.59% | | Semi-Annual | | | 03/17/21 | (a) | | | 03/17/26 | | | | SGD | | | | 2,733 | | | | (7,056 | ) | | | 32 | | | | (7,088 | ) |
0.55% | | Semi-Annual | | | | 6-Month SIBOR, 0.59% | | Semi-Annual | | | 03/17/21 | (a) | | | 03/17/26 | | | | SGD | | | | 1,537 | | | | (4,405 | ) | | | 18 | | | | (4,423 | ) |
0.56% | | Semi-Annual | | | | 6-Month SIBOR, 0.59% | | Semi-Annual | | | 03/17/21 | (a) | | | 03/17/26 | | | | SGD | | | | 4,240 | | | | (13,355 | ) | | | 48 | | | | (13,403 | ) |
3-Month HIBOR, 0.35% | | Quarterly | | | | 0.57% | | Quarterly | | | 03/17/21 | (a) | | | 03/17/26 | | | | HKD | | | | 23,970 | | | | 9,204 | | | | 48 | | | | 9,156 | |
3-Month HIBOR, 0.35% | | Quarterly | | | | 0.57% | | Quarterly | | | 03/17/21 | (a) | | | 03/17/26 | | | | HKD | | | | 27,020 | | | | 9,508 | | | | 54 | | | | 9,454 | |
3-Month HIBOR, 0.35% | | Quarterly | | | | 0.57% | | Quarterly | | | 03/17/21 | (a) | | | 03/17/26 | | | | HKD | | | | 21,370 | | | | 7,863 | | | | 43 | | | | 7,820 | |
3-Month HIBOR, 0.35% | | Quarterly | | | | 0.58% | | Quarterly | | | 03/17/21 | (a) | | | 03/17/26 | | | | HKD | | | | 24,910 | | | | 11,164 | | | | 50 | | | | 11,114 | |
0.59% | | Semi-Annual | | | | 6-Month SIBOR, 0.59% | | Semi-Annual | | | 03/17/21 | (a) | | | 03/17/26 | | | | SGD | | | | 2,465 | | | | (10,655 | ) | | | 28 | | | | (10,683 | ) |
0.60% | | Semi-Annual | | | | 6-Month SIBOR, 0.59% | | Semi-Annual | | | 03/17/21 | (a) | | | 03/17/26 | | | | SGD | | | | 1,393 | | | | (6,629 | ) | | | 16 | | | | (6,645 | ) |
0.61% | | Semi-Annual | | | | 6-Month SIBOR, 0.59% | | Semi-Annual | | | 03/17/21 | (a) | | | 03/17/26 | | | | SGD | | | | 2,787 | | | | (13,786 | ) | | | 32 | | | | (13,818 | ) |
6-Month WIBOR, 0.15% | | Semi-Annual | | | | 0.77% | | Annual | | | 03/17/21 | (a) | | | 03/17/26 | | | | PLN | | | | 13,180 | | | | 20,128 | | | | 56 | | | | 20,072 | |
6-Month WIBOR, 0.15% | | Semi-Annual | | | | 0.82% | | Annual | | | 03/17/21 | (a) | | | 03/17/26 | | | | PLN | | | | 12,380 | | | | 27,273 | | | | 53 | | | | 27,220 | |
6-Month WIBOR, 0.15% | | Semi-Annual | | | | 0.82% | | Annual | | | 03/17/21 | (a) | | | 03/17/26 | | | | PLN | | | | 11,410 | | | | 25,439 | | | | 49 | | | | 25,390 | |
3-Month CAD BA, 0.48% | | Semi-Annual | | | | 0.87% | | Semi-Annual | | | 03/17/21 | (a) | | | 03/17/26 | | | | CAD | | | | 5,480 | | | | 6,878 | | | | 73 | | | | 6,805 | |
3-Month CAD BA, 0.48% | | Semi-Annual | | | | 0.88% | | Semi-Annual | | | 03/17/21 | (a) | | | 03/17/26 | | | | CAD | | | | 4,030 | | | | 6,546 | | | | 54 | | | | 6,492 | |
3-Month CAD BA, 0.48% | | Semi-Annual | | | | 0.89% | | Semi-Annual | | | 03/17/21 | (a) | | | 03/17/26 | | | | CAD | | | | 3,900 | | | | 7,850 | | | | 52 | | | | 7,798 | |
3-Month CAD BA, 0.48% | | Semi-Annual | | | | 0.89% | | Semi-Annual | | | 03/17/21 | (a) | | | 03/17/26 | | | | CAD | | | | 7,680 | | | | 15,906 | | | | 103 | | | | 15,803 | |
3-Month CAD BA, 0.48% | | Semi-Annual | | | | 0.90% | | Semi-Annual | | | 03/17/21 | (a) | | | 03/17/26 | | | | CAD | | | | 5,200 | | | | 11,376 | | | | 70 | | | | 11,306 | |
| | |
| 42 | | 2 0 2 0 BLACK ROCK ANNUAL REPORT TO SHAREHOLDERS |
| | |
Schedule of Investments (continued) December 31, 2020 | | BlackRock Systematic Multi-Strategy Fund |
Centrally Cleared Interest Rate Swaps (continued)
| | | | | | | | | | | | | | | | | | | | | | | | | | | | | | | | | | | | |
| | | | | | | | | | | | | | | | | | | | | | | | | | Upfront
Premium | | | Unrealized | |
| Paid by the Fund | | | | Received by the Fund | | Effective | | | Termination | | | Notional | | | | | | Paid | | | Appreciation | |
| Rate | | Frequency | | | | Rate | | Frequency | | Date | | | Date | | | Amount (000) | | | Value | | | (Received) | | | (Depreciation) | |
3-Month CAD BA, 0.48% | | Semi-Annual | | | | 0.91% | | Semi-Annual | | | 03/17/21 | (a) | | | 03/17/26 | | | | CAD | | | | 4,250 | | | $ | 11,196 | | | $ | 56 | | | $ | 11,140 | |
3-Month CAD BA, 0.48% | | Quarterly | | | | 5.45% | | Quarterly | | | 03/17/21 | (a) | | | 03/17/26 | | | | ZAR | | | | 29,710 | | | | 50,998 | | | | 26 | | | | 50,972 | |
| | | | | | | | | | | | | | | | | | | | | | | | | | | | | | | | | | | | |
| | | | | | | | | | | | | | | | | | | | | | | | | | $ | (73,297 | ) | | $ | 7,833 | | | $ | (81,130 | ) |
| | | | | | | | | | | | | | | | | | | | | | | | | | | | | | | | | | | | |
OTC Interest Rate Swaps
| | | | | | | | | | | | | | | | | | | | | | | | | | | | | | | | | | | | | | | | | | | | | | | | |
| | | | | | | | | | | | | | | | | | | | | | | | | | | | | | | | | Upfront
Premium | | | Unrealized | |
| Paid by the Fund | | | | | | Received by the Fund | | | | | | Effective | | | Termination | | | | | | Notional | | | | | | Paid | | | Appreciation | |
| Rate | | Frequency | | | | | | Rate | | | Frequency | | | Counterparty | | | Date | | | Date | | | Amount (000) | | | Value | | | (Received) | | | (Depreciation) | |
3-Month KRW CDC, 0.81% | | | Quarterly | | | | | | | | 1.00 | % | | | Quarterly | | | | Citibank N.A. | | | | 03/17/21 | (a) | | | 03/17/26 | | | | KRW | | | | 32,344,085 | | | $ | (201,413 | ) | | $ | — | | | $ | (201,413 | ) |
3-Month KRW CDC, 0.81% | | | Quarterly | | | | | | | | 0.99 | % | | | Quarterly | | | | Citibank N.A. | | | | 03/17/21 | (a) | | | 03/17/26 | | | | KRW | | | | 2,918,600 | | | | (19,652 | ) | | | — | | | | (19,652 | ) |
3-Month KRW CDC, 0.81% | | | Quarterly | | | | | | | | 0.92 | % | | | Quarterly | | | | Bank of America N.A. | | | | 03/17/21 | (a) | | | 03/17/26 | | | | KRW | | | | 2,691,160 | | | | (26,858 | ) | | | — | | | | (26,858 | ) |
3-Month KRW CDC, 0.81% | | | Quarterly | | | | | | | | 0.99 | % | | | Quarterly | | | | Bank of America N.A. | | | | 03/17/21 | (a) | | | 03/17/26 | | | | KRW | | | | 5,208,960 | | | | (36,823 | ) | | | — | | | | (36,823 | ) |
3-Month KRW CDC, 0.81% | | | Quarterly | | | | | | | | 1.05 | % | | | Quarterly | | | | Citibank N.A. | | | | 03/17/21 | (a) | | | 03/17/26 | | | | KRW | | | | 4,255,020 | | | | (17,217 | ) | | | — | | | | (17,217 | ) |
3-Month KRW CDC, 0.81% | | | Quarterly | | | | | | | | 1.06 | % | | | Quarterly | | |
| JPMorgan Chase Bank
N.A. |
| | | 03/17/21 | (a) | | | 03/17/26 | | | | KRW | | | | 4,255,020 | | | | (15,788 | ) | | | — | | | | (15,788 | ) |
| | | | | | | | | | | | | | | | | | | | | | | | | | | | | | | | | | | | | | | | | | | | | | | | |
| | | | | | | | | | | | | | | | | | | | | | | | | | | | | | | | | | | | | | $ | (317,751 | ) | | $ | — | | | $ | (317,751 | ) |
| | | | | | | | | | | | | | | | | | | | | | | | | | | | | | | | | | | | | | | | | | | | | | | | |
OTC Total Return Swaps
| | | | | | | | | | | | | | | | | | | | | | | | | | |
| Reference Entity | | Payment
Frequency | | | Counterparty(a) | | Termination
Date | | | Net Notional | | | Accrued
Unrealized
Appreciation (Depreciation) | | | Net Value of
Reference
Entity | | | Gross
Notional
Amount
Net Asset
Percentage | |
Equity Securities Long/Short | | | Monthly | | | Barclays Bank PLC(b) | | | 01/21/22 | | | $ | (23,818,787 | ) | | $ | (1,368,663 | )(c) | | $ | (24,841,308 | ) | | | 5.8 | % |
| | | Monthly | | | Barclays Bank PLC(d) | | | 01/21/22 | | | | 2,620,808 | | | | (550,449 | )(e) | | | 2,139,402 | | | | 2.0 | |
| | | Monthly | | | Merrill Lynch International(f) | | | 02/15/23 | | | | 7,720,250 | | | | 7,741 | (g) | | | 7,662,432 | | | | 2.2 | |
| | | Monthly | | | Merrill Lynch International(h) | | | 02/15/23 | | | | 12,792,263 | | | | 65,712 | (i) | | | 12,828,856 | | | | 0.8 | |
| | | | | | Morgan Stanley & Co. | | | | | | | | | | | | | | | | | | | | |
| | | Monthly | | | International PLC(j) | | | 10/05/22 | | | | 41,964,777 | | | | (5,976,954 | )(k) | | | 36,023,353 | | | | 38.1 | |
| | | | | | Morgan Stanley & Co. | | | | | | | | | | | | | | | | | | | | |
| | | Monthly | | | International PLC(l) | | | 10/05/22 | | | | 45,038,974 | | | | (7,533,561 | )(m) | | | 37,368,689 | | | | 37.2 | |
| | | | | | | | | | | | | | | | | | | | | | | | | | |
| | | | | | | | | | | | $ | 86,318,285 | | | $ | (15,356,174 | ) | | $ | 71,181,424 | | | | | |
| | | | | | | | | | | | | | | | | | | | | | | | | | |
| | (a) | The Fund receives the total return on a portfolio of long positions underlying the total return swap. In addition, the Fund pays or receives a variable rate of interest, based on a specified benchmark. The benchmark and spread are determined based upon the country and/or currency of the individual underlying positions. | |
| | (c) | Amount includes $(346,142) of net dividends and financing fees. | |
| | (e) | Amount includes $(69,043) of net dividends and financing fees. | |
| | (g) | Amount includes $65,559 of net dividends and financing fees. | |
| | (i) | Amount includes $29,119 of net dividends and financing fees. | |
| | (k) | Amount includes $(35,530) of net dividends and financing fees. | |
| | (m) | Amount includes $136,724 of net dividends and financing fees. | |
The following are the specified benchmarks (plus or minus a range) used in determining the variable rate of interest:
| | |
SCHEDULE OF INVESTMENTS | | 43 |
| | |
Schedule of Investments (continued) December 31, 2020 | | BlackRock Systematic Multi-Strategy Fund |
| | | | | | |
| | (b) | | (d) | | (f) |
| Range: | | 20-38 basis points | | 20 basis points | | 20-100 basis points |
| Benchmarks: | | USD - 1D Overnight Bank Funding Rate (OBFR01) | | USD - 1D Overnight Bank Funding Rate (OBFR01) | | USD - 1D Overnight Bank Funding Rate (OBFR01) |
| | | | | | USD - 1M US Dollar LIBOR BBA |
| | (h) | | (j) | | (l) |
| Range: | | 20-177 basis points | | 0-20 basis points | | 15-109 basis points |
| Benchmarks: | | USD - 1D Overnight Bank Funding Rate (OBFR01) | | USD - 1D Overnight Fed Funds Effective Rate | | USD - 1D Overnight Fed Funds Effective Rate |
| | USD - 1M US Dollar LIBOR BBA | | (FEDL01) | | (FEDL01) |
The following table represents the individual long and short positions and related values of the equity securities underlying the total return swap with Barclays Bank PLC as of period end, termination date January 21, 2022:
| | | | | | | | | | | | |
| Security | | Shares | | | Value | | | % of Basket Value | |
|
Reference Entity — Long | |
|
| Common Stocks | |
| | | |
Aerospace & Defense | | | | | | | | | | | | |
Lockheed Martin Corp. | | | 4,837 | | | $ | 1,717,038 | | | | (6.9 | )% |
| | | | | | | | | | | | |
|
| Air Freight & Logistics | |
FedEx Corp. | | | 2,229 | | | | 578,693 | | | | (2.3 | ) |
United Parcel Service, Inc. | | | 15,103 | | | | 2,543,345 | | | | (10.3 | ) |
| | | | | | | | | | | | |
| | | | | | | 3,122,038 | | | | | |
|
| Airlines | |
Delta Air Lines, Inc. | | | 10,829 | | | | 435,434 | | | | (1.7 | ) |
| | | | | | | | | | | | |
|
| Automobiles | |
Ford Motor Co. | | | 6,989 | | | | 61,433 | | | | (0.2 | ) |
Harley-Davidson Inc. | | | 2,740 | | | | 100,558 | | | | (0.4 | ) |
| | | | | | | | | | | | |
| | | | | | | 161,991 | | | | | |
|
| Biotechnology | |
Gilead Sciences, Inc. | | | 2,990 | | | | 174,197 | | | | (0.7 | ) |
| | | | | | | | | | | | |
|
| Building Products | |
Fortune Brands Home & Security Inc. | | | 1,386 | | | | 118,808 | | | | (0.5 | ) |
Lennox International Inc. | | | 342 | | | | 93,698 | | | | (0.4 | ) |
| | | | | | | | | | | | |
| | | | | | | 212,506 | | | | | |
|
| Capital Markets | |
S&P Global, Inc. | | | 1,963 | | | | 645,297 | | | | (2.6 | ) |
| | | | | | | | | | | | |
|
| Chemicals | |
Eastman Chemical Co. | | | 4,664 | | | | 467,706 | | | | (1.9 | ) |
FMC Corp. | | | 964 | | | | 110,793 | | | | (0.4 | ) |
| | | | | | | | | | | | |
| | | | | | | 578,499 | | | | | |
|
| Commercial Services & Supplies | |
Cintas Corp. | | | 888 | | | | 313,872 | | | | (1.3 | ) |
| | | | | | | | | | | | |
|
| Containers & Packaging | |
Crown Holdings Inc. | | | 651 | | | | 65,230 | | | | (0.3 | ) |
| | | | | | | | | | | | |
|
| Diversified Consumer Services | |
H&R Block, Inc. | | | 21,205 | | | | 336,311 | | | | (1.4 | ) |
| | | | | | | | | | | | |
|
| Diversified Financial Services | |
Voya Financial, Inc. | | | 3,368 | | | | 198,072 | | | | (0.8 | ) |
| | | | | | | | | | | | |
|
| Electric Utilities | |
Avangrid Inc. | | | 2,911 | | | | 132,305 | | | | (0.5 | ) |
Entergy Corp. | | | 15,331 | | | | 1,530,647 | | | | (6.2 | ) |
Evergy, Inc. | | | 2,827 | | | | 156,927 | | | | (0.6 | ) |
Southern Co. | | | 8,119 | | | | 498,750 | | | | (2.0 | ) |
| | | | | | | | | | | | |
| | | | | | | 2,318,629 | | | | | |
| | | | | | | | | | | | |
| Security | | Shares | | | Value | | | % of Basket Value | |
|
| Electrical Equipment | |
Emerson Electric Co. | | | 81,551 | | | $ | 6,554,254 | | | | (26.4 | )% |
| | | | | | | | | | | | |
|
| Electronic Equipment, Instruments & Components | |
Amphenol Corp. | | | 453 | | | | 59,239 | | | | (0.2 | ) |
| | | | | | | | | | | | |
|
| Equity Real Estate Investment Trusts (REITs) | |
American Tower Corp. | | | 614 | | | | 137,818 | | | | (0.5 | ) |
Healthpeak Properties, Inc. | | | 83,084 | | | | 2,511,629 | | | | (10.1 | ) |
Mid-America Apartment Communities, Inc. | | | 6,222 | | | | 788,265 | | | | (3.2 | ) |
| | | | | | | | | | | | |
| | | | | | | 3,437,712 | | | | | |
|
| Food & Staples Retailing | |
Rite Aid Corp. | | | 11,831 | | | | 187,285 | | | | (0.8 | ) |
| | | | | | | | | | | | |
|
| Food Products | |
Bunge Ltd. | | | 6,343 | | | | 415,974 | | | | (1.7 | ) |
| | | | | | | | | | | | |
|
| Health Care Equipment & Supplies | |
Danaher Corp. | | | 17,326 | | | | 3,848,798 | | | | (15.5 | ) |
| | | | | | | | | | | | |
|
| Health Care Providers & Services | |
Cigna Corp. | | | 5,712 | | | | 1,189,124 | | | | (4.8 | ) |
McKesson Corp. | | | 17,181 | | | | 2,988,120 | | | | (12.0 | ) |
Quest Diagnostics, Inc. | | | 54,595 | | | | 6,506,086 | | | | (26.2 | ) |
| | | | | | | | | | | | |
| | | | | | | 10,683,330 | | | | | |
|
| Household Durables | |
D.R. Horton, Inc. | | | 96,561 | | | | 6,654,984 | | | | (26.8 | ) |
Meritage Homes Corp. | | | 12,273 | | | | 1,016,450 | | | | (4.1 | ) |
Newell Brands, Inc. | | | 26,856 | | | | 570,153 | | | | (2.3 | ) |
Toll Brothers, Inc. | | | 3,266 | | | | 141,973 | | | | (0.5 | ) |
| | | | | | | | | | | | |
| | | | | | | 8,383,560 | | | | | |
|
| Insurance | |
American International Group, Inc. | | | 11,428 | | | | 432,664 | | | | (1.8 | ) |
Brighthouse Financial, Inc. | | | 2,244 | | | | 81,244 | | | | (0.3 | ) |
Old Republic International Corp. | | | 6,757 | | | | 133,180 | | | | (0.5 | ) |
| | | | | | | | | | | | |
| | | | | | | 647,088 | | | | | |
|
| Internet & Direct Marketing Retail | |
Amazon.com Inc. | | | 848 | | | | 2,761,877 | | | | (11.1 | ) |
|
| IT Services | |
Broadridge Financial Solutions, Inc. | | | 3,709 | | | | 568,219 | | | | (2.3 | ) |
Dxc Technology Co. | | | 3,064 | | | | 78,898 | | | | (0.3 | ) |
Fidelity National Information Services Inc. | | | 6,242 | | | | 882,993 | | | | (3.6 | ) |
| | | | | | | | | | | | |
| | | | | | | 1,530,110 | | | | | |
|
| Machinery | |
Cummins Inc. | | | 3,754 | | | | 852,533 | | | | (3.4 | ) |
Illinois Tool Works, Inc. | | | 9,250 | | | | 1,885,890 | | | | (7.6 | ) |
| | | | | | | | | | | | |
| | | | | | | 2,738,423 | | | | | |
|
| Media | |
Nexstar Media Group Inc. | | | 17,620 | | | | 1,923,928 | | | | (7.8 | ) |
| | |
| 44 | | 2 0 2 0 BLACK ROCK ANNUAL REPORT TO SHAREHOLDERS |
| | |
Schedule of Investments (continued) December 31, 2020 | | BlackRock Systematic Multi-Strategy Fund |
| | | | | | | | | | | | |
| Security | | Shares | | | Value | | | % of Basket
Value | |
| | | |
| Media (continued) | | | | | | | | | |
Sinclair Broadcast Group, Inc. | | | 4,943 | | | $ | 157,435 | | | | (0.6 | )% |
ViacomCBS, Inc. | | | 60,738 | | | | 2,263,098 | | | | (9.1 | ) |
| | | | | | | | | | | | |
| | | | | | | 4,344,461 | | | | | |
| | | |
| Metals & Mining | | | | | | | | | |
Reliance Steel & Aluminum Co. | | | 12,323 | | | | 1,475,679 | | | | (5.9 | ) |
Steel Dynamics, Inc. | | | 6,550 | | | | 241,499 | | | | (1.0 | ) |
| | | | | | | | | | | | |
| | | | | | | 1,717,178 | | | | | |
| | | |
| Multi-Utilities | | | | | | | | | |
Dominion Energy, Inc. | | | 15,445 | | | | 1,161,464 | | | | (4.7 | ) |
DTE Energy Co. | | | 3,104 | | | | 376,857 | | | | (1.5 | ) |
| | | | | | | | | | | | |
| | | | | | | 1,538,321 | | | | | |
| | | |
| Oil, Gas & Consumable Fuels | | | | | | | | | |
Antero Midstream Corp. | | | 7,668 | | | | 59,120 | | | | (0.2 | ) |
Antero Resources Corp. | | | 233,624 | | | | 1,273,251 | | | | (5.1 | ) |
Apache Corp. | | | 44,213 | | | | 627,382 | | | | (2.5 | ) |
Cenovus Energy, Inc. | | | 352,314 | | | | 2,127,977 | | | | (8.6 | ) |
Marathon Petroleum Corp. | | | 100,922 | | | | 4,174,134 | | | | (16.8 | ) |
Murphy Oil Corp. | | | 324,900 | | | | 3,931,290 | | | | (15.8 | ) |
Ovintiv Inc. | | | 17,320 | | | | 248,715 | | | | (1.0 | ) |
Sm Energy Co. | | | 26,396 | | | | 161,544 | | | | (0.7 | ) |
| | | | | | | | | | | | |
| | | | | | | 12,603,413 | | | | | |
| | | |
| Personal Products | | | | | | | | | |
Coty Inc. | | | 12,636 | | | | 88,705 | | | | (0.4 | ) |
| | | | | | | | | | | | |
|
| Semiconductors & Semiconductor Equipment | |
Nxp Semiconductors Nv | | | 42,261 | | | | 6,719,922 | | | | (27.0 | ) |
| | | | | | | | | | | | |
| | | |
| Specialty Retail | | | | | | | | | |
Bed Bath & Beyond, Inc. | | | 67,927 | | | | 1,206,384 | | | | (4.9 | ) |
Best Buy Co., Inc. | | | 38,331 | | | | 3,825,050 | | | | (15.4 | ) |
L Brands, Inc. | | | 4,861 | | | | 180,781 | | | | (0.7 | ) |
| | | | | | | | | | | | |
| | | | | | | 5,212,215 | | | | | |
| | | | | | | | | | | | |
Total Reference Entity — Long | | | | | | | 83,750,979 | | | | | |
| | | | | | | | | | | | |
| | | |
Reference Entity — Short | | | | | | | | | | | | |
| | | |
| Common Stocks | | | | | | | | | |
| | | |
| Aerospace & Defense | | | | | | | | | |
Boeing Co., | | | (3,452 | ) | | | (738,935 | ) | | | 3.0 | |
Hexcel Corp, | | | (9,499 | ) | | | (460,607 | ) | | | 1.8 | |
| | | | | | | | | | | | |
| | | | | | | (1,199,542 | ) | | | | |
| | | |
| Airlines | | | | | | | | | |
Southwest Airlines Co., | | | (19,793 | ) | | | (922,552 | ) | | | 3.7 | |
United Airlines Holdings, Inc., | | | (16,576 | ) | | | (716,912 | ) | | | 2.9 | |
| | | | | | | | | | | | |
| | | | | | | (1,639,464 | ) | | | | |
| | | |
| Auto Components | | | | | | | | | |
Aptiv Plc, | | | (13,226 | ) | | | (1,723,216 | ) | | | 6.9 | |
Lear Corp., | | | (14,147 | ) | | | (2,249,797 | ) | | | 9.1 | |
| | | | | | | | | | | | |
| | | | | | | (3,973,013 | ) | | | | |
| | | |
| Biotechnology | | | | | | | | | |
Emergent BioSolutions, Inc., | | | (31,196 | ) | | | (2,795,162 | ) | | | 11.3 | |
| | | | | | | | | | | | |
| | | |
| Building Products | | | | | | | | | |
Builders FirstSource, Inc., | | | (50,427 | ) | | | (2,057,926 | ) | | | 8.3 | |
| | | | | | | | | | | | |
| | | |
| Capital Markets | | | | | | | | | |
Brookfield Asset Management, Inc., | | | (8,113 | ) | | | (334,824 | ) | | | 1.4 | |
| | | | | | | | | | | | |
| Security | | Shares | | | Value | | | % of Basket
Value | |
| | | |
| Capital Markets (continued) | | | | | | | | | |
Cme Group Inc, | | | (16,223 | ) | | $ | (2,953,397 | ) | | | 11.9 | % |
Intercontinental Exchange Inc, | | | (77,203 | ) | | | (8,900,734 | ) | | | 35.8 | |
| | | | | | | | | | | | |
| | | | | | | (12,188,955 | ) | | | | |
| | | |
| Chemicals | | | | | | | | | |
Cf Industries Holdings Inc, | | | (2,227 | ) | | | (86,207 | ) | | | 0.4 | |
Element Solutions Inc, | | | (18,617 | ) | | | (330,079 | ) | | | 1.3 | |
Scotts Miracle-Gro Co/The, | | | (778 | ) | | | (154,931 | ) | | | 0.6 | |
| | | | | | | | | | | | |
| | | | | | | (571,217 | ) | | | | |
| | | |
| Communications Equipment | | | | | | | | | |
Commscope Holding Co Inc, | | | (16,050 | ) | | | (215,070 | ) | | | 0.9 | |
| | | | | | | | | | | | |
| | | |
| Containers & Packaging | | | | | | | | | |
Sonoco Products Co., | | | (12,301 | ) | | | (728,834 | ) | | | 2.9 | |
| | | | | | | | | | | | |
| | | |
| Energy Equipment & Services | | | | | | | | | |
Baker Hughes Co., | | | (17,844 | ) | | | (372,047 | ) | | | 1.5 | |
| | | | | | | | | | | | |
| | | |
| Entertainment | | | | | | | | | |
Activision Blizzard Inc, | | | (27,597 | ) | | | (2,562,381 | ) | | | 10.3 | |
Live Nation Entertainment, Inc., | | | (3,689 | ) | | | (271,068 | ) | | | 1.1 | |
Netflix Inc, | | | (3,734 | ) | | | (2,019,086 | ) | | | 8.1 | |
Walt Disney Co., | | | (2,452 | ) | | | (444,253 | ) | | | 1.8 | |
| | | | | | | | | | | | |
| | | | | | | (5,296,788 | ) | | | | |
|
| Equity Real Estate Investment Trusts (REITs) | |
Alexandria Real Estate Equities Inc, | | | (10,915 | ) | | | (1,945,271 | ) | | | 7.8 | |
Cyrusone Inc, | | | (8,081 | ) | | | (591,125 | ) | | | 2.4 | |
Equity Residential, | | | (1,089 | ) | | | (64,556 | ) | | | 0.3 | |
Federal Realty Investment Trust, | | | (4,057 | ) | | | (345,332 | ) | | | 1.4 | |
Medical Properties Trust, Inc., | | | (15,691 | ) | | | (341,907 | ) | | | 1.4 | |
Simon Property Group, Inc., | | | (700 | ) | | | (59,696 | ) | | | 0.2 | |
Spirit Realty Capital Inc, | | | (7,541 | ) | | | (302,922 | ) | | | 1.2 | |
Vornado Realty Trust, | | | (1,900 | ) | | | (70,946 | ) | | | 0.3 | |
Weyerhaeuser Co., | | | (13,914 | ) | | | (466,536 | ) | | | 1.9 | |
| | | | | | | | | | | | |
| | | | | | | (4,188,291 | ) | | | | |
| | | |
| Food Products | | | | | | | | | |
Lamb Weston Holdings, Inc., | | | (28,407 | ) | | | (2,236,767 | ) | | | 9.0 | |
| | | | | | | | | | | | |
| | | |
| Health Care Equipment & Supplies | | | | | | | | | |
Baxter International, Inc., | | | (935 | ) | | | (75,024 | ) | | | 0.3 | |
Becton Dickinson And Co, | | | (21,623 | ) | | | (5,410,507 | ) | | | 21.8 | |
| | | | | | | | | | | | |
| | | | | | | (5,485,531 | ) | | | | |
| | | |
| Health Care Providers & Services | | | | | | | | | |
Encompass Health Corp., | | | (3,813 | ) | | | (315,297 | ) | | | 1.3 | |
Tenet Healthcare Corp, | | | (24,706 | ) | | | (986,511 | ) | | | 4.0 | |
UnitedHealth Group, Inc., | | | (2,155 | ) | | | (755,715 | ) | | | 3.0 | |
| | | | | | | | | | | | |
| | | | | | | (2,057,523 | ) | | | | |
| | | |
| Hotels, Restaurants & Leisure | | | | | | | | | |
Carnival Corp., | | | (11,861 | ) | | | (256,909 | ) | | | 1.0 | |
Darden Restaurants, Inc., | | | (1,385 | ) | | | (164,981 | ) | | | 0.7 | |
| | | | | | | | | | | | |
| | | | | | | (421,890 | ) | | | | |
| | | |
| Household Durables | | | | | | | | | |
Mohawk Industries Inc, | | | (3,412 | ) | | | (480,921 | ) | | | 1.9 | |
| | | | | | | | | | | | |
|
| Independent Power and Renewable Electricity Producers | |
AES Corp., | | | (103,550 | ) | | | (2,433,425 | ) | | | 9.8 | |
| | | | | | | | | | | | |
| | |
SCHEDULE OF INVESTMENTS | | 45 |
| | |
Schedule of Investments (continued) December 31, 2020 | | BlackRock Systematic Multi-Strategy Fund |
| | | | | | | | | | | | |
| Security | | Shares | | | Value | | | % of Basket
Value | |
| | | |
| Industrial Conglomerates | | | | | | | | | |
Carlisle Cos., Inc., | | | (19,369 | ) | | $ | (3,025,050 | ) | | | 12.2 | % |
Roper Technologies Inc, | | | (5,722 | ) | | | (2,466,697 | ) | | | 9.9 | |
| | | | | | | | | | | | |
| | | | | | | (5,491,747 | ) | | | | |
| | | |
| Insurance | | | | | | | | | |
Loews Corp., | | | (9,408 | ) | | | (423,548 | ) | | | 1.7 | |
Progressive Corp., | | | (72,388 | ) | | | (7,157,725 | ) | | | 28.8 | |
| | | | | | | | | | | | |
| | | | | | | (7,581,273 | ) | | | | |
| | | |
| IT Services | | | | | | | | | |
Global Payments, Inc., | | | (1,832 | ) | | | (394,649 | ) | | | 1.6 | |
International Business Machines Corp., | | | (1,600 | ) | | | (201,408 | ) | | | 0.8 | |
Visa, Inc., | | | (1,589 | ) | | | (347,562 | ) | | | 1.4 | |
| | | | | | | | | | | | |
| | | | | | | (943,619 | ) | | | | |
| | | |
| Leisure Products | | | | | | | | | |
Hasbro, Inc., | | | (17,343 | ) | | | (1,622,264 | ) | | | 6.5 | |
| | | | | | | | | | | | |
| | | |
| Machinery | | | | | | | | | |
Allison Transmission Holdings Inc, | | | (2,212 | ) | | | (95,404 | ) | | | 0.4 | |
Flowserve Corp, | | | (2,880 | ) | | | (106,128 | ) | | | 0.4 | |
Xylem Inc, | | | (3,760 | ) | | | (382,730 | ) | | | 1.5 | |
| | | | | | | | | | | | |
| | | | | | | (584,262 | ) | | | | |
| | | |
| Media | | | | | | | | | |
Altice USA, Inc., | | | (120,236 | ) | | | (4,553,337 | ) | | | 18.3 | |
Discovery Inc, | | | (34,823 | ) | | | (1,047,824 | ) | | | 4.2 | |
DISH Network Corp., | | | (24,851 | ) | | | (803,681 | ) | | | 3.3 | |
Sirius Xm Holdings Inc, | | | (12,361 | ) | | | (78,740 | ) | | | 0.3 | |
| | | | | | | | | | | | |
| | | | | | | (6,483,582 | ) | | | | |
| | | |
| Metals & Mining | | | | | | | | | |
Southern Copper Corp., | | | (9,846 | ) | | | (641,172 | ) | | | 2.6 | |
United States Steel Corp., | | | (18,802 | ) | | | (315,310 | ) | | | 1.2 | |
| | | | | | | | | | | | |
| | | | | | | (956,482 | ) | | | | |
| | | |
| Multi-Utilities | | | | | | | | | |
Cms Energy Corp, | | | (3,509 | ) | | | (214,084 | ) | | | 0.9 | |
| | | |
| Oil, Gas & Consumable Fuels | | | | | | | | | |
Cnx Resources Corp, | | | (75,459 | ) | | | (814,957 | ) | | | 3.3 | |
Conocophillips, | | | (13,277 | ) | | | (530,947 | ) | | | 2.1 | |
Diamondback Energy Inc, | | | (2,698 | ) | | | (130,583 | ) | | | 0.5 | |
Eog Resources Inc, | | | (70,265 | ) | | | (3,504,116 | ) | | | 14.1 | |
Hess Corp., | | | (5,047 | ) | | | (266,431 | ) | | | 1.1 | |
Phillips 66, | | | (29,173 | ) | | | (2,040,360 | ) | | | 8.2 | |
Pioneer Natural Resources Co., | | | (28,805 | ) | | | (3,280,601 | ) | | | 13.2 | |
Range Resources Corp., | | | (38,135 | ) | | | (255,505 | ) | | | 1.0 | |
Suncor Energy, Inc., | | | (33,475 | ) | | | (561,711 | ) | | | 2.3 | |
| | | | | | | | | | | | |
| | | | | | | (11,385,211 | ) | | | | |
| | | |
| Pharmaceuticals | | | | | | | | | |
Eli Lilly and Co, | | | (52,794 | ) | | | (8,913,739 | ) | | | 35.9 | |
| | | | | | | | | | | | |
| | | |
| Professional Services | | | | | | | | | |
Nielsen Holdings Plc, | | | (28,368 | ) | | | (592,040 | ) | | | 2.4 | |
| | | | | | | | | | | | |
|
| Semiconductors & Semiconductor Equipment | |
Broadcom Inc, | | | (11,677 | ) | | | (5,112,774 | ) | | | 20.6 | |
| | | | | | | | | | | | |
| | | |
| Software | | | | | | | | | |
Citrix Systems Inc, | | | (447 | ) | | | (58,155 | ) | | | 0.2 | |
| | | | | | | | | | | | |
| | | | | | | | | | | | |
| Security | | Shares | | | Value | | | % of Basket
Value | |
| | | |
| Specialty Retail | | | | | | | | | |
Carvana Co, | | | (2,777 | ) | | $ | (665,203 | ) | | | 2.7 | % |
Ross Stores Inc, | | | (605 | ) | | | (74,300 | ) | | | 0.3 | |
| | | | | | | | | | | | |
| | | | | | | (739,503 | ) | | | | |
|
| Technology Hardware, Storage & Peripherals | |
NCR Corp., | | | (191,148 | ) | | | (7,181,430 | ) | | | 28.9 | |
Western Digital Corp., | | | (1,916 | ) | | | (106,127 | ) | | | 0.4 | |
| | | | | | | | | | | | |
| | | | | | | (7,287,557 | ) | | | | |
| | | |
| Textiles, Apparel & Luxury Goods | | | | | | | | | |
Ralph Lauren Corp, | | | (22,013 | ) | | | (2,283,629 | ) | | | 9.2 | |
| | | | | | | | | | | | |
Total Reference Entity — Short | | | | (108,592,287 | ) | | | | |
| | |
Net Value of Reference Entity — Barclays
Bank PLC | | | $(24,841,308) | | | | |
| | | | | | | | | | | | |
The following table represents the individual long positions and related values of theequity securities underlying the total return swap with Barclays Bank PLC as ofperiod end, termination date January 21, 2022:
| | | | | | | | | | | | |
| Security | | Shares | | | Value | | | %of
Basket
Value | |
| | | |
Reference Entity — Long | | | | | | | | | | | | |
| | | |
| Common Stocks | | | | | | | | | |
| | | |
| Airlines | | | | | | | | | |
Delta Air Lines, Inc. | | | 12,964 | | | $ | 521,282 | | | | 24.4 | % |
| | | | | | | | | | | | |
| | | |
| Automobiles | | | | | | | | | |
Ford Motor Co. | | | 10,524 | | | | 92,506 | | | | 4.3 | |
| | | | | | | | | | | | |
| | | |
| Chemicals | | | | | | | | | |
Dow, Inc. | | | 6,545 | | | | 363,248 | | | | 17.0 | |
| | | | | | | | | | | | |
| | | |
| Containers & Packaging | | | | | | | | | |
International Paper Co. | | | 21,693 | | | | 1,078,576 | | | | 50.4 | |
| | | | | | | | | | | | |
| | | |
| Diversified Financial Services | | | | | | | | | |
Berkshire Hathaway Inc. | | | 7,576 | | | | 1,756,647 | | | | 82.1 | |
| | | | | | | | | | | | |
| | | |
| Electric Utilities | | | | | | | | | |
American Electric Power Co Inc. | | | 20,853 | | | | 1,736,429 | | | | 81.2 | |
| | | | | | | | | | | | |
| |
| Equity Real Estate Investment Trusts (REITs) | | | | |
Weyerhaeuser Co. | | | 11,886 | | | | 398,538 | | | | 18.6 | |
| | | | | | | | | | | | |
| | | |
| Food & Staples Retailing | | | | | | | | | |
Walmart, Inc. | | | 7,731 | | | | 1,114,424 | | | | 52.1 | |
| | | | | | | | | | | | |
| | | |
| Food Products | | | | | | | | | |
Tyson Foods, Inc. | | | 49,869 | | | | 3,213,558 | | | | 150.2 | |
| | | | | | | | | | | | |
| | |
| Health Care Providers & Services | | | | | | | |
HCA Healthcare, Inc. | | | 15,141 | | | | 2,490,089 | | | | 116.4 | |
McKesson Corp. | | | 21,830 | | | | 3,796,674 | | | | 177.5 | |
Quest Diagnostics, Inc. | | | 1,483 | | | | 176,729 | | | | 8.2 | |
| | | | | | | | | | | | |
| | | | | | | 6,463,492 | | | | | |
| | | |
| Hotels, Restaurants & Leisure | | | | | | | | | |
Boyd Gaming Corp. | | | 14,017 | | | | 601,610 | | | | 28.1 | |
| | | | | | | | | | | | |
| | | |
| Household Durables | | | | | | | | | |
Lennar Corp. | | | 23,760 | | | | 1,811,225 | | | | 84.7 | |
| | | | | | | | | | | | |
| | |
| 46 | | 2 0 2 0 BLACK ROCK ANNUAL REPORT TO SHAREHOLDERS |
| | |
Schedule of Investments (continued) December 31, 2020 | | BlackRock Systematic Multi-Strategy Fund |
| | | | | | | | | | | | |
| Security | | Shares | | | Value | | | % of
Basket
Value | |
|
| Independent Power and Renewable Electricity Producers | |
Vistra Corp. | | | 6,191 | | | $ | 121,715 | | | | 5.7 | % |
| | | | | | | | | | | | |
| | | |
| Insurance | | | | | | | | | |
American International Group Inc. | | | 14,223 | | | | 538,483 | | | | 25.2 | |
MetLife, Inc. | | | 2,780 | | | | 130,521 | | | | 6.1 | |
| | | | | | | | | | | | |
| | | | | | | 669,004 | | | | | |
| | | |
| Media | | | | | | | | | |
Omnicom Group, Inc. | | | 2,389 | | | | 149,002 | | | | 7.0 | |
ViacomCBS, Inc. | | | 136,910 | | | | 5,101,267 | | | | 238.4 | |
| | | | | | | | | | | | |
| | | | | | | 5,250,269 | | | | | |
| | | |
| Oil, Gas & Consumable Fuels | | | | | | | | | |
Murphy Oil Corp. | | | 41,017 | | | | 496,306 | | | | 23.2 | |
Occidental Petroleum Corp. | | | 24,637 | | | | 426,466 | | | | 19.9 | |
Ovintiv Inc. | | | 18,115 | | | | 260,131 | | | | 12.1 | |
Williams Cos., Inc. | | | 5,401 | | | | 108,290 | | | | 5.1 | |
| | | | | | | | | | | | |
| | | | | | | 1,291,193 | | | | | |
| | | |
| Pharmaceuticals | | | | | | | | | |
Pfizer, Inc. | | | 74,777 | | | | 2,752,541 | | | | 128.7 | |
| | | | | | | | | | | | |
| | | |
| Road & Rail | | | | | | | | | |
CSX Corp. | | | 6,206 | | | | 563,195 | | | | 26.3 | |
Norfolk Southern Corp. | | | 1,842 | | | | 437,678 | | | | 20.4 | |
Ryder System, Inc. | | | 18,940 | | | | 1,169,734 | | | | 54.7 | |
| | | | | | | | | | | | |
| | | | | | | 2,170,607 | | | | | |
| | | |
| Specialty Retail | | | | | | | | | |
Best Buy Co Inc. | | | 1,662 | | | | 165,851 | | | | 7.8 | |
Gap, Inc. | | | 23,760 | | | | 479,714 | | | | 22.4 | |
L Brands, Inc. | | | 9,195 | | | | 341,962 | | | | 16.0 | |
| | | | | | | | | | | | |
| | | | | | | 987,527 | | | | | |
| | | |
Technology Hardware, Storage &
Peripherals | | | | | | | | | |
Dell Technologies, Inc. | | | 30,951 | | | | 2,268,399 | | | | 106.0 | |
| | | | | | | | | | | | |
Total Reference Entity — Long | | | | | | | 34,662,790 | | | | | |
| | | | | | | | | | | | |
| | | |
Reference Entity — Short | | | | | | | | | | | | |
| | | |
| Common Stocks | | | | | | | | | |
| | | |
| Aerospace & Defense | | | | | | | | | |
Boeing Co/the | | | (7,047 | ) | | | (1,508,481 | ) | | | (70.5 | ) |
| | | | | | | | | | | | |
| | | |
| Airlines | | | | | | | | | |
American Airlines Group, Inc. | | | (20,265 | ) | | | (319,579 | ) | | | (15.0 | ) |
Southwest Airlines Co. | | | (76,567 | ) | | | (3,568,788 | ) | | | (166.8 | ) |
| | | | | | | | | | | | |
| | | | | | | (3,888,367 | ) | | | | |
| | | |
| Automobiles | | | | | | | | | |
Tesla, Inc. | | | (2,662 | ) | | | (1,878,494 | ) | | | (87.8 | ) |
| | | | | | | | | | | | |
| | | |
| Chemicals | | | | | | | | | |
Ashland Global Holdings Inc. | | | (22,733 | ) | | | (1,800,454 | ) | | | (84.1 | ) |
Olin Corp. | | | (11,818 | ) | | | (290,250 | ) | | | (13.6 | ) |
Sherwin-Williams Co. | | | (108 | ) | | | (79,370 | ) | | | (3.7 | ) |
| | | | | | | | | | | | |
| | | | | | | (2,170,074 | ) | | | | |
| | | |
| Communications Equipment | | | | | | | | | |
Motorola Solutions, Inc. | | | (3,470 | ) | | | (590,108 | ) | | | (27.6 | ) |
| | | | | | | | | | | | |
| | | |
| Consumer Finance | | | | | | | | | |
American Express Co. | | | (19,512 | ) | | | (2,359,196 | ) | | | (110.3 | ) |
| | | | | | | | | | | | |
| | | |
| Containers & Packaging | | | | | | | | | |
Ball Corp. | | | (897 | ) | | | (83,582 | ) | | | (3.9 | ) |
| | | | | | | | | | | | |
| | | | | | | | | | | | |
| Security | | Shares | | | Value | | | % of
Basket
Value | |
|
| Equity Real Estate Investment Trusts (REITs) | |
Host Hotels & Resorts, Inc. | | | (9,214 | ) | | $ | (134,801 | ) | | | (6.3 | )% |
Simon Property Group, Inc. | | | (1,608 | ) | | | (137,130 | ) | | | (6.4 | ) |
| | | | | | | | | | | | |
| | | | | | | (271,931 | ) | | | | |
| | | |
| Food Products | | | | | | | | | |
Kraft Heinz Co. | | | (15,379 | ) | | | (533,036 | ) | | | (24.9 | ) |
| | | | | | | | | | | | |
| | |
| Health Care Equipment & Supplies | | | | | | | |
Baxter International Inc. | | | (12,213 | ) | | | (979,971 | ) | | | (45.8 | ) |
Boston Scientific Corp. | | | (100,715 | ) | | | (3,620,704 | ) | | | (169.3 | ) |
| | | | | | | | | | | | |
| | | | | | | (4,600,675 | ) | | | | |
| | | |
| Health Care Providers & Services | | | | | | | | | |
UnitedHealth Group, Inc. | | | (1,414 | ) | | | (495,862 | ) | | | (23.2 | ) |
| | | | | | | | | | | | |
| | | |
| Hotels, Restaurants & Leisure | | | | | | | | | |
Darden Restaurants, Inc. | | | (5,204 | ) | | | (619,900 | ) | | | (29.0 | ) |
Marriott International, Inc. | | | (6,746 | ) | | | (889,932 | ) | | | (41.6 | ) |
Royal Caribbean Cruises Ltd. | | | (5,967 | ) | | | (445,675 | ) | | | (20.8 | ) |
| | | | | | | | | | | | |
| | | | | | | (1,955,507 | ) | | | | |
|
| Independent Power and Renewable Electricity Producers | |
AES Corp. | | | (122,728 | ) | | | (2,884,108 | ) | | | (134.8 | ) |
| | | | | | | | | | | | |
| | | |
| Industrial Conglomerates | | | | | | | | | |
Honeywell International, Inc. | | | (834 | ) | | | (177,392 | ) | | | (8.3 | ) |
| | | | | | | | | | | | |
| | | |
| IT Services | | | | | | | | | |
Dxc Technology Co. | | | (33,239 | ) | | | (855,904 | ) | | | (40.0 | ) |
| | | | | | | | | | | | |
| | | |
| Machinery | | | | | | | | | |
Caterpillar, Inc. | | | (2,823 | ) | | | (513,842 | ) | | | (24.0 | ) |
| | | | | | | | | | | | |
| | | |
| Media | | | | | | | | | |
Comcast Corp. | | | (20,317 | ) | | | (1,064,611 | ) | | | (49.8 | ) |
DISH Network Corp. | | | (45,525 | ) | | | (1,472,279 | ) | | | (68.8 | ) |
TEGNA, Inc. | | | (43,593 | ) | | | (608,122 | ) | | | (28.4 | ) |
| | | | | | | | | | | | |
| | | | | | | (3,145,012 | ) | | | | |
| | | |
| Metals & Mining | | | | | | | | | |
Teck Resources Ltd. | | | (11,821 | ) | | | (214,551 | ) | | | (10.0 | ) |
| | | | | | | | | | | | |
| | | |
| Multi-Utilities | | | | | | | | | |
Dominion Energy, Inc. | | | (20,248 | ) | | | (1,522,650 | ) | | | (71.2 | ) |
Sempra Energy | | | (778 | ) | | | (99,125 | ) | | | (4.6 | ) |
| | | | | | | | | | | | |
| | | | | | | (1,621,775 | ) | | | | |
| | | |
| Oil, Gas & Consumable Fuels | | | | | | | | | |
Canadian Natural Resources Ltd. | | | (11,020 | ) | | | (265,031 | ) | | | (12.4 | ) |
Hess Corp. | | | (6,692 | ) | | | (353,271 | ) | | | (16.5 | ) |
| | | | | | | | | | | | |
| | | | | | | (618,302 | ) | | | | |
| | | |
| Pharmaceuticals | | | | | | | | | |
Bausch Health Cos Inc. | | | (103,711 | ) | | | (2,157,189 | ) | | | (100.8 | ) |
Total Reference Entity — Short | | | | | | | (32,523,388 | ) | | | | |
| | | | | | | | | | | | |
Net Value of Reference Entity — Barclays
Bank PLC | | | $ | 2,139,402 | | | | | |
| | | | | | | | | | | | |
| | |
SCHEDULE OF INVESTMENTS | | 47 |
| | |
Schedule of Investments (continued) December 31, 2020 | | BlackRock Systematic Multi-Strategy Fund |
The following table represents the individual long and short positions and related values of the equity securities underlying the total return swap with Merrill Lynch International as of period end, termination date February 15, 2023:
| | | | | | | | | | | | |
| Security | | Shares | | | Value | | | % of
Basket
Value | |
| | | |
| Reference Entity — Long | | | | | | | | | |
| | | |
| Common Stocks | | | | | | | | | |
| | | |
| Aerospace & Defense | | | | | | | | | |
Lockheed Martin Corp., | | | 2,794 | | | $ | 991,814 | | | | 12.9 | % |
Northrop Grumman Corp., | | | 7,209 | | | | 2,196,726 | | | | 28.7 | |
| | | | | | | | | | | | |
| | | | | | | 3,188,540 | | | | | |
| | | |
| Air Freight & Logistics | | | | | | | | | |
United Parcel Service, Inc., Class B, | | | 38,441 | | | | 6,473,464 | | | | 84.5 | |
| | | | | | | | | | | | |
| | | |
| Airlines | | | | | | | | | |
Delta Air Lines, Inc., | | | 4,974 | | | | 200,005 | | | | 2.6 | |
| | | | | | | | | | | | |
| | | |
| Building Products | | | | | | | | | |
Johnson Controls International PLC, | | | 32,582 | | | | 1,517,995 | | | | 19.8 | |
| | | | | | | | | | | | |
| | | |
| Chemicals | | | | | | | | | |
DuPont de Nemours, Inc., | | | 13,285 | | | | 944,696 | | | | 12.3 | |
Eastman Chemical Co., | | | 6,051 | | | | 606,794 | | | | 7.9 | |
| | | | | | | | | | | | |
| | | | | | | 1,551,490 | | | | | |
| | | |
| Communications Equipment | | | | | | | | | |
Cisco Systems, Inc., | | | 26,202 | | | | 1,172,540 | | | | 15.3 | |
| | | | | | | | | | | | |
| | | |
| Consumer Finance | | | | | | | | | |
OneMain Holdings, Inc., | | | 21,274 | | | | 1,024,556 | | | | 13.4 | |
| | | | | | | | | | | | |
| | | |
| Containers & Packaging | | | | | | | | | |
Sealed Air Corp., | | | 41,731 | | | | 1,910,862 | | | | 24.9 | |
| | | | | | | | | | | | |
| | | |
| Electric Utilities | | | | | | | | | |
Exelon Corp., | | | 27,571 | | | | 1,164,048 | | | | 15.2 | |
NRG Energy, Inc., | | | 51,020 | | | | 1,915,801 | | | | 25.0 | |
| | | | | | | | | | | | |
| | | | | | | 3,079,849 | | | | | |
| | | |
| Health Care Providers & Services | | | | | | | | | |
Quest Diagnostics, Inc., | | | 19,902 | | | | 2,371,721 | | | | 31.0 | |
| | | | | | | | | | | | |
| | | |
| Hotels, Restaurants & Leisure | | | | | | | | | |
Boyd Gaming Corp., | | | 6,556 | | | | 281,384 | | | | 3.7 | |
McDonald’s Corp., | | | 1,459 | | | | 313,072 | | | | 4.1 | |
Yum! Brands, Inc., | | | 9,453 | | | | 1,026,218 | | | | 13.4 | |
| | | | | | | | | | | | |
| | | | | | | 1,620,674 | | | | | |
| | | |
| Household Durables | | | | | | | | | |
PulteGroup, Inc., | | | 15,471 | | | | 667,110 | | | | 8.7 | |
Toll Brothers, Inc., | | | 30,765 | | | | 1,337,355 | | | | 17.5 | |
| | | | | | | | | | | | |
| | | | | | | 2,004,465 | | | | | |
| | | |
| Household Products | | | | | | | | | |
Procter & Gamble Co., | | | 4,982 | | | | 693,195 | | | | 9.0 | |
| | | | | | | | | | | | |
| |
| Independent Power and Renewable Electricity Producers | | | | |
Vistra Corp., | | | 5,265 | | | | 103,510 | | | | 1.4 | |
| | | | | | | | | | | | |
| | | |
| Insurance | | | | | | | | | |
Hartford Financial Services Group, Inc., | | | 16,952 | | | | 830,309 | | | | 10.8 | |
Marsh & McLennan Cos., Inc., | | | 4,467 | | | | 522,639 | | | | 6.8 | |
Prudential Financial, Inc., | | | 1,736 | | | | 135,530 | | | | 1.8 | |
| | | | | | | | | | | | |
| | | | | | 1,488,478 | | | | |
| | | | | | | | | | | | |
| Security | | Shares | | | Value | | | % of
Basket
Value | |
| | | |
| Machinery | | | | | | | | | |
Deere & Co., | | | 8,351 | | | $ | 2,246,837 | | | | 29.3 | % |
| | | | | | | | | | | | |
| | | |
| Metals & Mining | | | | | | | | | |
Barrick Gold Corp., | | | 113,052 | | | | 2,575,325 | | | | 33.6 | |
Newmont Corp., | | | 6,285 | | | | 376,409 | | | | 4.9 | |
| �� | | | | | | | | | | | |
| | | | | | | 2,951,734 | | | | | |
| | | |
| Multi-line Retail | | | | | | | | | |
Target Corp., | | | 6,665 | | | | 1,176,572 | | | | 15.4 | |
| | | | | | | | | | | | |
| | | |
| Oil, Gas & Consumable Fuels | | | | | | | | | |
Williams Cos., Inc., | | | 22,327 | | | | 447,656 | | | | 5.8 | |
| | | | | | | | | | | | |
| | | |
| Road & Rail | | | | | | | | | |
Norfolk Southern Corp., | | | 713 | | | | 169,416 | | | | 2.2 | |
Ryder System, Inc., | | | 23,079 | | | | 1,425,359 | | | | 18.6 | |
| | | | | | | | | | | | |
| | | | | | | 1,594,775 | | | | | |
| | | |
| Specialty Retail | | | | | | | | | |
AutoZone, Inc., | | | 2,392 | | | | 2,835,572 | | | | 37.0 | |
Lowe’s Cos., Inc., | | | 2,181 | | | | 350,072 | | | | 4.6 | |
| | | | | | | | | | | | |
| | | | | | | 3,185,644 | | | | | |
| | | | | | | | | | | | |
Total Reference Entity — Long | | | | | | | 40,004,562 | | | | | |
| | | | | | | | | | | | |
| | | |
Reference Entity — Short | | | | | | | | | | | | |
| | | |
| Common Stocks | | | | | | | | | |
| | | |
| Airlines | | | | | | | | | |
American Airlines Group, Inc., | | | (20,645 | ) | | | (325,572 | ) | | | (4.2 | ) |
Southwest Airlines Co., | | | (75,125 | ) | | | (3,501,576 | ) | | | (45.7 | ) |
| | | | | | | | | | | | |
| | | | | | | (3,827,148 | ) | | | | |
| | | |
| Biotechnology | | | | | | | | | |
Amgen, Inc., | | | (9,690 | ) | | | (2,227,925 | ) | | | (29.1 | ) |
| | | | | | | | | | | | |
| | | |
| Chemicals | | | | | | | | | |
Ashland Global Holdings, Inc., | | | (14,318 | ) | | | (1,133,986 | ) | | | (14.8 | ) |
| | | | | | | | | | | | |
| | | |
| Communications Equipment | | | | | | | | | |
Motorola Solutions, Inc., | | | (2,749 | ) | | | (467,495 | ) | | | (6.1 | ) |
| | | | | | | | | | | | |
| | | |
| Consumer Finance | | | | | | | | | |
American Express Co., | | | (18,074 | ) | | | (2,185,327 | ) | | | (28.5 | ) |
| | | | | | | | | | | | |
| |
| Equity Real Estate Investment Trusts (REITs) | | | | |
Host Hotels & Resorts, Inc., | | | (15,454 | ) | | | (226,092 | ) | | | (3.0 | ) |
| | | | | | | | | | | | |
| | | |
| Food Products | | | | | | | | | |
Kraft Heinz Co., | | | (5,237 | ) | | | (181,514 | ) | | | (2.4 | ) |
| | | | | | | | | | | | |
| | | |
| Health Care Equipment & Supplies | | | | | | | | | |
Baxter International, Inc., | | | (8,652 | ) | | | (694,236 | ) | | | (9.1 | ) |
Boston Scientific Corp., | | | (46,556 | ) | | | (1,673,688 | ) | | | (21.8 | ) |
| | | | | | | | | | | | |
| | | | | | | (2,367,924 | ) | | | | |
| | | |
| Hotels, Restaurants & Leisure | | | | | | | | | |
Darden Restaurants, Inc., | | | (8,344 | ) | | | (993,937 | ) | | | (13.0 | ) |
Marriott International, Inc., Class A, | | | (2,211 | ) | | | (291,675 | ) | | | (3.8 | ) |
Royal Caribbean Cruises Ltd., | | | (3,813 | ) | | | (284,793 | ) | | | (3.7 | ) |
| | | | | | | | | | | | |
| | | | | | | (1,570,405 | ) | | | | |
| |
| Independent Power and Renewable Electricity Producers | | | | |
AES Corp., | | | (70,009 | ) | | | (1,645,212 | ) | | | (21.5 | ) |
| | | | | | | | | | | | |
| | |
| 48 | | 2 0 2 0 BLACK ROCK ANNUAL REPORT TO SHAREHOLDERS |
| | |
Schedule of Investments (continued) December 31, 2020 | | BlackRock Systematic Multi-Strategy Fund |
| | | | | | | | | | | | |
| Security | | Shares | | | Value | | | % of
Basket
Value | |
| | | |
| Media | | | | | | | | | |
DISH Network Corp., Class A, | | | (21,532 | ) | | $ | (696,345 | ) | | | (9.1 | )% |
TEGNA, Inc., | | | (28,262 | ) | | | (394,255 | ) | | | (5.1 | ) |
| | | | | | | | | | | | |
| | | | | | | (1,090,600 | ) | | | | |
| | | |
| Multi-line Retail | | | | | | | | | |
Nordstrom, Inc., | | | (368,063 | ) | | | (11,487,246 | ) | | | (149.9 | ) |
| | | | | | | | | | | | |
| | | |
| Multi-Utilities | | | | | | | | | |
Dominion Energy, Inc., | | | (2,750 | ) | | | (206,800 | ) | | | (2.7 | ) |
| | | | | | | | | | | | |
| | | |
| Oil, Gas & Consumable Fuels | | | | | | | | | |
Canadian Natural Resources Ltd., | | | (8,248 | ) | | | (198,364 | ) | | | (2.6 | ) |
Enbridge, Inc., | | | (13,328 | ) | | | (426,363 | ) | | | (5.6 | ) |
Valero Energy Corp., | | | (8,867 | ) | | | (501,606 | ) | | | (6.5 | ) |
| | | | | | | | | | | | |
| | | | | | | (1,126,333 | ) | | | | |
| | | |
| Pharmaceuticals | | | | | | | | | |
Bausch Health Cos., Inc., | | | (118,142 | ) | | | (2,457,354 | ) | | | (32.1 | ) |
| | | | | | | | | | | | |
| | |
| Trading Companies & Distributors | | | | | | | |
United Rentals, Inc., | | | (607 | ) | | | (140,769 | ) | | | (1.8 | ) |
| | | | | | | | | | | | |
Total Reference Entity — Short | | | | | | | (32,342,130 | ) | | | | |
| | | | | | | | | | | | |
Net Value of Reference Entity — Merrill Lynch International | | | $ | 7,662,432 | | | | | |
| | | | | | | | | | | | |
The following table represents the individual long and short positions and related values of the equity securities underlying the total return swap with Merrill Lynch International as of period end, termination date February 15, 2023:
| | | | | | | | | | | | |
| Security | | Shares | | | Value | | | % of
Basket
Value | |
| | | |
| Reference Entity — Long | | | | | | | | | |
| | | |
| Common Stocks | | | | | | | | | |
| | | |
| Biotechnology | | | | | | | | | |
Biogen, Inc., | | | 9,231 | | | $ | 2,260,303 | | | | 17.6 | % |
Gilead Sciences, Inc., | | | 10,101 | | | | 588,484 | | | | 4.6 | |
| | | | | | | | | | | | |
| | | | | | | 2,848,787 | | | | | |
| | | |
| Building Products | | | | | | | | | |
Masco Corp., | | | 4,251 | | | | 233,507 | | | | 1.8 | |
| | | | | | | | | | | | |
| | | |
| Chemicals | | | | | | | | | |
DuPont de Nemours, Inc., | | | 6,703 | | | | 476,650 | | | | 3.7 | |
FMC Corp., | | | 588 | | | | 67,579 | | | | 0.6 | |
Olin Corp., | | | 1,169 | | | | 28,711 | | | | 0.2 | |
Sherwin-Williams Co., | | | 649 | | | | 476,957 | | | | 3.7 | |
| | | | | | | | | | | | |
| | | | | | | 1,049,897 | | | | | |
| | | |
| Containers & Packaging | | | | | | | | | |
International Paper Co., | | | 2,096 | | | | 104,213 | | | | 0.8 | |
| | | | | | | | | | | | |
| | | |
| Electric Utilities | | | | | | | | | |
Avangrid, Inc., | | | 6,319 | | | | 287,199 | | | | 2.2 | |
Eversource Energy, | | | 322 | | | | 27,856 | | | | 0.2 | |
| | | | | | | | | | | | |
| | | | | | | 315,055 | | | | | |
| |
| Electronic Equipment, Instruments & Components | | | | |
Arrow Electronics, Inc., | | | 5,353 | | | | 520,847 | | | | 4.1 | |
| | | | | | | | | | | | |
| | | | | | | | | | | | |
| Security | | Shares | | | Value | | | % of
Basket
Value | |
| |
| Equity Real Estate Investment Trusts (REITs) | | | | |
Healthpeak Properties, Inc., | | | 1,993 | | | $ | 60,248 | | | | 0.5 | % |
Mid-America Apartment Communities, Inc., | | | 3,159 | | | | 400,214 | | | | 3.1 | |
| | | | | | | | | | | | |
| | | | | | | 460,462 | | | | | |
| | | |
| Food Products | | | | | | | | | |
Kellogg Co., | | | 1,913 | | | | 119,046 | | | | 0.9 | |
| | | | | | | | | | | | |
| | | |
| Health Care Providers & Services | | | | | | | | | |
Laboratory Corp. of America Holdings, | | | 4,687 | | | | 954,039 | | | | 7.4 | |
Quest Diagnostics, Inc., | | | 1,789 | | | | 213,195 | | | | 1.7 | |
| | | | | | | | | | | | |
| | | | | | | 1,167,234 | | | | | |
| | | |
| Hotels, Restaurants & Leisure | | | | | | | | | |
Scientific Games Corp., | | | 33,729 | | | | 1,399,416 | | | | 10.9 | |
| | | | | | | | | | | | |
| | | |
| Household Durables | | | | | | | | | |
D.R. Horton, Inc., | | | 824 | | | | 56,790 | | | | 0.5 | |
Meritage Homes Corp., | | | 6,231 | | | | 516,051 | | | | 4.0 | |
Newell Brands, Inc., | | | 67,265 | | | | 1,428,036 | | | | 11.1 | |
Toll Brothers, Inc., | | | 1,619 | | | | 70,378 | | | | 0.6 | |
TRI Pointe Group, Inc., | | | 2,547 | | | | 43,936 | | | | 0.3 | |
| | | | | | | | | | | | |
| | | | | | | 2,115,191 | | | | | |
| | | |
| Household Products | | | | | | | | | |
Clorox Co., | | | 3,478 | | | | 702,278 | | | | 5.5 | |
Procter & Gamble Co., | | | 1,329 | | | | 184,917 | | | | 1.4 | |
| | | | | | | | | | | | |
| | | | | | | 887,195 | | | | | |
| | | |
| Insurance | | | | | | | | | |
Old Republic International Corp, | | | 29,009 | | | | 571,767 | | | | 4.5 | |
| | | | | | | | | | | | |
| | | |
| IT Services | | | | | | | | | |
Western Union Co., | | | 53,755 | | | | 1,179,385 | | | | 9.2 | |
| | | | | | | | | | | | |
| | | |
| Media | | | | | | | | | |
Nexstar Media Group Inc, Class A, | | | 1,043 | | | | 113,885 | | | | 0.9 | |
Sinclair Broadcast Group, Inc., Class A, | | | 99,862 | | | | 3,180,605 | | | | 24.8 | |
| | | | | | | | | | | | |
| | | | | | | 3,294,490 | | | | | |
| | | |
| Metals & Mining | | | | | | | | | |
Reliance Steel & Aluminum Co., | | | 5,869 | | | | 702,813 | | | | 5.5 | |
| | | | | | | | | | | | |
| | | |
| Multi-Utilities | | | | | | | | | |
DTE Energy Co, | | | 4,459 | | | | 541,367 | | | | 4.2 | |
| | | | | | | | | | | | |
| | | |
| Oil, Gas & Consumable Fuels | | | | | | | | | |
Cenovus Energy, Inc., | | | 58,242 | | | | 351,782 | | | | 2.8 | |
Marathon Oil Corp., | | | 109,658 | | | | 731,419 | | | | 5.7 | |
Marathon Petroleum Corp., | | | 2,288 | | | | 94,632 | | | | 0.7 | |
| | | | | | | | | | | | |
| | | | | | | 1,177,833 | | | | | |
| | | |
| Personal Products | | | | | | | | | |
Coty Inc, Class A, | | | 9,178 | | | | 64,430 | | | | 0.5 | |
| | | | | | | | | | | | |
| | | |
| Specialty Retail | | | | | | | | | |
Bed Bath & Beyond, Inc., | | | 10,717 | | | | 190,334 | | | | 1.5 | |
| | | | | | | | | | | | |
Total Reference Entity — Long | | | | | | | 18,943,269 | | | | | |
| | | | | | | | | | | | |
| | | |
| Reference Entity — Short | | | | | | | | | |
| | | |
| Common Stocks | | | | | | | | | |
| | | |
| Capital Markets | | | | | | | | | |
Brookfield Asset Management, Inc., Class A, | | | (1 | ) | | | (41 | ) | | | (0.0 | ) |
| | | | | | | | | | | | |
| | | |
| Commercial Services & Supplies | | | | | | | | | |
Waste Connections, Inc., | | | (6,524 | ) | | | (669,167 | ) | | | (5.2 | ) |
| | | | | | | | | | | | |
| | |
SCHEDULE OF INVESTMENTS | | 49 |
| | |
Schedule of Investments (continued) December 31, 2020 | | BlackRock Systematic Multi-Strategy Fund |
| | | | | | | | | | | | |
| Security | | Shares | | | Value | | | % of
Basket
Value | |
| | | |
| Media | | | | | | | | | |
Discovery Inc, Class A, | | | (180,561 | ) | | $ | (5,433,080 | ) | | | (42.4 | )% |
| | | | | | | | | | | | |
| | | |
| Metals & Mining | | | | | | | | | |
United States Steel Corp., | | | (723 | ) | | | (12,125 | ) | | | (0.1 | ) |
| | | | | | | | | | | | |
Total Reference Entity — Short | | | | (6,114,413 | ) | | | | |
| | | | | | | | | | | | |
Net Value of Reference Entity — Merrill Lynch International | | | $ | 12,828,856 | | | | | |
| | | | | | | | | | | | |
The following table represents the individual long and short positions and related values of the equity securities underlying the total return swap with Morgan Stanley & Co. International PLC as of period end, termination date October 5, 2022:
| | | | | | | | | | | | |
| Security | | Shares | | | Value | | | % of
Basket
Value | |
| | | |
| Reference Entity — Long | | | | | | | | | |
| | | |
| Common Stocks | | | | | | | | | |
| | | |
| Aerospace & Defense | | | | | | | | | |
Howmet Aerospace, Inc. | | | 328,557 | | | $ | 9,377,017 | | | | 26.0 | % |
Lockheed Martin Corp. | | | 19,525 | | | | 6,930,985 | | | | 19.3 | |
Northrop Grumman Corp. | | | 16,812 | | | | 5,122,953 | | | | 14.2 | |
Spirit AeroSystems Holdings, Inc., Class A | | | 242,251 | | | | 9,469,592 | | | | 26.3 | |
| | | | | | | | | | | | |
| | | | | | | 30,900,547 | | | | | |
| | | |
| Air Freight & Logistics | | | | | | | | | |
FedEx Corp. | | | 31,372 | | | | 8,144,799 | | | | 22.6 | |
United Parcel Service, Inc., Class B | | | 19,999 | | | | 3,367,832 | | | | 9.4 | |
| | | | | | | | | | | | |
| | | | | | | 11,512,631 | | | | | |
| | | |
| Airlines | | | | | | | | | |
Delta Air Lines, Inc. | | | 37,853 | | | | 1,522,069 | | | | 4.2 | |
| | | | | | | | | | | | |
| | | |
| Auto Components | | | | | | | | | |
Magna International Inc. | | | 60,950 | | | | 4,315,260 | | | | 12.0 | |
| | | | | | | | | | | | |
| | | |
| Automobiles | | | | | | | | | |
Ford Motor Co. | | | 100,357 | | | | 882,138 | | | | 2.4 | |
| | | | | | | | | | | | |
| | | |
| Biotechnology | | | | | | | | | |
Amgen, Inc. | | | 39,629 | | | | 9,111,500 | | | | 25.3 | |
Biogen, Inc. | | | 24,732 | | | | 6,055,878 | | | | 16.8 | |
Gilead Sciences, Inc. | | | 140,156 | | | | 8,165,489 | | | | 22.7 | |
| | | | | | | | | | | | |
| | | | | | | 23,332,867 | | | | | |
| | | |
| Building Products | | | | | | | | | |
Carrier Global Corp. | | | 113,058 | | | | 4,264,548 | | | | 11.8 | |
Fortune Brands Home & Security Inc. | | | 47,193 | | | | 4,045,384 | | | | 11.2 | |
Lennox International Inc. | | | 31,997 | | | | 8,766,218 | | | | 24.3 | |
Masco Corp. | | | 160,280 | | | | 8,804,180 | | | | 24.5 | |
| | | | | | | | | | | | |
| | | | | | | 25,880,330 | | | | | |
| | | |
| Capital Markets | | | | | | | | | |
Nasdaq, Inc. | | | 38,512 | | | | 5,112,083 | | | | 14.2 | |
S&P Global, Inc. | | | 11,059 | | | | 3,635,425 | | | | 10.1 | |
| | | | | | | | | | | | |
| | | | | | | 8,747,508 | | | | | |
| | | |
| Chemicals | | | | | | | | | |
Chemours Co/the | | | 38,683 | | | | 958,952 | | | | 2.7 | |
Dow, Inc. | | | 8,184 | | | | 454,212 | | | | 1.2 | |
DuPont de Nemours, Inc. | | | 123,927 | | | | 8,812,449 | | | | 24.5 | |
| | | | | | | | | | | | |
| Security | | Shares | | | Value | | | % of
Basket
Value | |
| | | |
| Chemicals (continued) | | | | | | | | | |
Eastman Chemical Co. | | | 60,668 | | | $ | 6,083,787 | | | | 16.9 | % |
FMC Corp. | | | 76,000 | | | | 8,734,680 | | | | 24.2 | |
Olin Corp. | | | 13,264 | | | | 325,764 | | | | 0.9 | |
Sherwin-Williams Co. | | | 11,955 | | | | 8,785,849 | | | | 24.4 | |
| | | | | | | | | | | | |
| | | | | | | 34,155,693 | | | | | |
| | | |
| Communications Equipment | | | | | | | | | |
Cisco Systems, Inc. | | | 205,058 | | | | 9,176,346 | | | | 25.5 | |
| | | | | | | | | | | | |
| | | |
| Consumer Finance | | | | | | | | | |
Ally Financial, Inc. | | | 267,174 | | | | 9,527,425 | | | | 26.4 | |
Synchrony Financial | | | 9,969 | | | | 346,024 | | | | 1.0 | |
| | | | | | | | | | | | |
| | | | | | | 9,873,449 | | | | | |
| | | |
| Containers & Packaging | | | | | | | | | |
International Paper Co. | | | 59,463 | | | | 2,956,500 | | | | 8.2 | |
| | | | | | | | | | | | |
| | | |
| Diversified Consumer Services | | | | | | | | | |
H&R Block, Inc. | | | 35,903 | | | | 569,422 | | | | 1.6 | |
| | | | | | | | | | | | |
| | | |
| Diversified Financial Services | | | | | | | | | |
Equitable Holdings Inc. | | | 297,414 | | | | 7,610,824 | | | | 21.1 | |
Voya Financial, Inc. | | | 154,162 | | | | 9,066,267 | | | | 25.2 | |
| | | | | | | | | | | | |
| | | | | | | 16,677,091 | | | | | |
|
| Diversified Telecommunication Services | |
CenturyLink, Inc. | | | 520,552 | | | | 5,075,382 | | | | 14.1 | |
| | | | | | | | | | | | |
| | | |
| Electric Utilities | | | | | | | | | |
Avangrid, Inc. | | | 161,314 | | | | 7,331,721 | | | | 20.3 | |
Entergy Corp. | | | 10,183 | | | | 1,016,671 | | | | 2.8 | |
Evergy, Inc. | | | 162,701 | | | | 9,031,533 | | | | 25.1 | |
Eversource Energy | | | 56 | | | | 4,845 | | | | 0.0 | |
NRG Energy, Inc. | | | 201,165 | | | | 7,553,746 | | | | 21.0 | |
Pinnacle West Capital Corp. | | | 12,541 | | | | 1,002,653 | | | | 2.8 | |
Southern Co. | | | 8,539 | | | | 524,551 | | | | 1.5 | |
| | | | | | | | | | | | |
| | | | | | | 26,465,720 | | | | | |
| | | |
| Electrical Equipment | | | | | | | | | |
Emerson Electric Co. | | | 27,889 | | | | 2,241,439 | | | | 6.2 | |
| | | | | | | | | | | | |
|
| Electronic Equipment, Instruments & Components | |
Arrow Electronics, Inc | | | 31,713 | | | | 3,085,675 | | | | 8.5 | |
Jabil, Inc | | | 37,870 | | | | 1,610,611 | | | | 4.5 | |
| | | | | | | 4,696,286 | | | | | |
|
| Equity Real Estate Investment Trusts (REITs) | |
American Tower Corp. | | | 32,119 | | | | 7,209,431 | | | | 20.0 | |
Brixmor Property Group, Inc. | | | 544,356 | | | | 9,009,092 | | | | 25.0 | |
Healthpeak Properties, Inc. | | | 80,175 | | | | 2,423,690 | | | | 6.7 | |
Hudson Pacific Properties, Inc. | | | 177,066 | | | | 4,253,125 | | | | 11.8 | |
Iron Mountain, Inc. | | | 1,286 | | | | 37,911 | | | | 0.1 | |
Kimco Realty Corp. | | | 597,013 | | | | 8,961,165 | | | | 24.9 | |
Life Storage, Inc. | | | 338 | | | | 40,354 | | | | 0.1 | |
Mid-America Apartment Communities, Inc. | | | 49,865 | | | | 6,317,397 | | | | 17.5 | |
National Retail Properties Inc. | | | 15,337 | | | | 627,590 | | | | 1.8 | |
Regency Centers Corp. | | | 54,210 | | | | 2,471,434 | | | | 6.9 | |
Ventas, Inc. | | | 49,252 | | | | 2,415,318 | | | | 6.7 | |
| | | | | | | | | | | | |
| | | | | | | 43,766,507 | | | | | |
| | | |
| Food Products | | | | | | | | | |
Conagra Brands, Inc. | | | 210,458 | | | | 7,631,207 | | | | 21.2 | |
| | |
| 50 | | 2 0 2 0 BLACK ROCK ANNUAL REPORT TO SHAREHOLDERS |
| | |
Schedule of Investments (continued) December 31, 2020 | | BlackRock Systematic Multi-Strategy Fund |
| | | | | | | | | | | | |
| Security | | Shares | | | Value | | | % of
Basket
Value | |
| | | |
| Food Products (continued) | | | | | | | | | |
General Mills, Inc. | | | 61,143 | | | $ | 3,595,208 | | | | 10.0 | % |
McCormick & Co Inc/MD | | | 21,333 | | | | 2,039,435 | | | | 5.6 | |
Tyson Foods, Inc., Class A | | | 102,336 | | | | 6,594,532 | | | | 18.3 | |
| | | | | | | | | | | | |
| | | | | | | 19,860,382 | | | | | |
| | | |
| Health Care Equipment & Supplies | | | | | | | | | |
Hologic Inc. | | | 105,932 | | | | 7,715,028 | | | | 21.4 | |
| | | | | | | | | | | | |
| | | |
| Health Care Providers & Services | | | | | | | | | |
Cardinal Health, Inc. | | | 163,538 | | | | 8,759,095 | | | | 24.3 | |
HCA Healthcare, Inc. | | | 11,813 | | | | 1,942,766 | | | | 5.4 | |
Laboratory Corp. of America Holdings | | | 39,781 | | | | 8,097,423 | | | | 22.5 | |
McKesson Corp. | | | 34,190 | | | | 5,946,325 | | | | 16.5 | |
Quest Diagnostics, Inc. | | | 17,339 | | | | 2,066,289 | | | | 5.7 | |
| | | | | | | | | | | | |
| | | | | | | 26,811,898 | | | | | |
| | | |
| Hotels, Restaurants & Leisure | | | | | | | | | |
Red Rock Resorts, Inc., Class A | | | 362,608 | | | | 9,079,704 | | | | 25.2 | |
Royal Caribbean Cruises Ltd. | | | 57,129 | | | | 4,266,965 | | | | 11.9 | |
Scientific Games Corp., Class A | | | 67,148 | | | | 2,785,971 | | | | 7.7 | |
Wyndham Destinations, Inc. | | | 207,496 | | | | 9,308,271 | | | | 25.8 | |
Wyndham Hotels & Resorts, Inc. | | | 157,977 | | | | 9,390,153 | | | | 26.1 | |
Wynn Resorts Ltd. | | | 3,333 | | | | 376,062 | | | | 1.0 | |
| | | | | | | | | | | | |
| | | | | | | 35,207,126 | | | | | |
| | | |
| Household Durables | | | | | | | | | |
D.R. Horton, Inc. | | | 27,418 | | | | 1,889,649 | | | | 5.3 | |
Meritage Homes Corp. | | | 69,734 | | | | 5,775,370 | | | | 16.0 | |
Newell Brands, Inc. | | | 127,310 | | | | 2,702,791 | | | | 7.5 | |
PulteGroup, Inc. | | | 128,819 | | | | 5,554,675 | | | | 15.4 | |
Toll Brothers, Inc. | | | 84,045 | | | | 3,653,436 | | | | 10.2 | |
TRI Pointe Group, Inc. | | | 466,358 | | | | 8,044,676 | | | | 22.3 | |
Whirlpool Corp. | | | 47,898 | | | | 8,645,110 | | | | 24.0 | |
| | | | | | | | | | | | |
| | | | | | | 36,265,707 | | | | | |
| | | |
| Household Products | | | | | | | | | |
Clorox Co. | | | 41,344 | | | | 8,348,180 | | | | 23.2 | |
Procter & Gamble Co. | | | 62,720 | | | | 8,726,861 | | | | 24.2 | |
Spectrum Brands Holdings, Inc. | | | 59,153 | | | | 4,671,904 | | | | 13.0 | |
| | | | | | | | | | | | |
| | | | | | | 21,746,945 | | | | | |
| | | |
| Insurance | | | | | | | | | |
American International Group, Inc. | | | 27,962 | | | | 1,058,641 | | | | 2.9 | |
Brighthouse Financial, Inc. | | | 71,076 | | | | 2,573,307 | | | | 7.2 | |
Lincoln National Corp. | | | 61,665 | | | | 3,102,366 | | | | 8.6 | |
Old Republic International Corp. | | | 316,660 | | | | 6,241,369 | | | | 17.3 | |
Prudential Financial, Inc. | | | 22,387 | | | | 1,747,753 | | | | 4.9 | |
| | | | | | | | | | | | |
| | | | | | | 14,723,436 | | | | | |
| | | |
| Internet & Direct Marketing Retail | | | | | | | | | |
Amazon.com Inc. | | | 981 | | | | 3,195,048 | | | | 8.9 | |
eBay, Inc. | | | 173,669 | | | | 8,726,867 | | | | 24.2 | |
| | | | | | | | | | | | |
| | | | | | | 11,921,915 | | | | | |
| | | |
| IT Services | | | | | | | | | |
Broadridge Financial Solutions, Inc. | | | 37,060 | | | | 5,677,592 | | | | 15.8 | |
Western Union Co. | | | 350,091 | | | | 7,680,997 | | | | 21.3 | |
| | | | | | | | | | | | |
| | | | | | | 13,358,589 | | | | | |
| | | |
| Machinery | | | | | | | | | |
Cummins Inc. | | | 2,610 | | | | 592,731 | | | | 1.7 | |
Deere & Co. | | | 7,250 | | | | 1,950,613 | | | | 5.4 | |
| | | | | | | | | | | | |
| Security | | Shares | | | Value | | | % of
Basket
Value | |
| | | |
| Machinery (continued) | | | | | | | | | |
Fortive Corp. | | | 127,975 | | | $ | 9,063,190 | | | | 25.2 | % |
Illinois Tool Works, Inc. | | | 6,441 | | | | 1,313,191 | | | | 3.6 | |
Otis Worldwide Corp. | | | 67,861 | | | | 4,584,011 | | | | 12.7 | |
| | | | | | | | | | | | |
| | | | | | | 17,503,736 | | | | | |
| | | |
| Media | | | | | | | | | |
Nexstar Media Group Inc, Class A | | | 53,959 | | | | 5,891,783 | | | | 16.3 | |
Sinclair Broadcast Group, Inc., Class A | | | 185,125 | | | | 5,896,231 | | | | 16.4 | |
ViacomCBS, Inc., Class B | | | 21,510 | | | | 801,463 | | | | 2.2 | |
| | | | | | | | | | | | |
| | | | | | | 12,589,477 | | | | | |
| | | |
| Metals & Mining | | | | | | | | | |
Kinross Gold Corp. | | | 125,080 | | | | 918,087 | | | | 2.6 | |
Newmont Corp. | | | 151,213 | | | | 9,056,147 | | | | 25.1 | |
Reliance Steel & Aluminum Co. | | | 55,587 | | | | 6,656,543 | | | | 18.5 | |
Steel Dynamics, Inc. | | | 235,296 | | | | 8,675,364 | | | | 24.1 | |
| | | | | | | | | | | | |
| | | | | | | 25,306,141 | | | | | |
| |
| Mortgage Real Estate Investment Trusts (REITs) | | | | |
Starwood Property Trust, Inc. | | | 265,380 | | | | 5,121,834 | | | | 14.2 | |
| | | | | | | | | | | | |
| | | |
| Multi-line Retail | | | | | | | | | |
Target Corp. | | | 52,486 | | | | 9,265,354 | | | | 25.7 | |
| | | | | | | | | | | | |
| | | |
| Multi-Utilities | | | | | | | | | |
Dominion Energy, Inc. | | | 9,756 | | | | 733,651 | | | | 2.1 | |
DTE Energy Co. | | | 66,263 | | | | 8,044,991 | | | | 22.3 | |
Public Service Enterprise Group Inc. | | | 45,317 | | | | 2,641,981 | | | | 7.3 | |
| | | | | | | | | | | | |
| | | | | | | 11,420,623 | | | | | |
| | | |
| Oil, Gas & Consumable Fuels | | | | | | | | | |
Antero Midstream Corp. | | | 1,105,586 | | | | 8,524,068 | | | | 23.7 | |
Antero Resources Corp. | | | 504,406 | | | | 2,749,013 | | | | 7.6 | |
Apache Corp. | | | 570,580 | | | | 8,096,530 | | | | 22.5 | |
Cenovus Energy, Inc. | | | 268,487 | | | | 1,621,661 | | | | 4.5 | |
Devon Energy Corp. | | | 1,705 | | | | 26,956 | | | | 0.1 | |
Eqt Corp. | | | 120,202 | | | | 1,527,767 | | | | 4.2 | |
Marathon Oil Corp | | | 1,133,639 | | | | 7,561,372 | | | | 21.0 | |
Marathon Petroleum Corp. | | | 26,186 | | | | 1,083,053 | | | | 3.0 | |
Murphy Oil Corp. | | | 296,439 | | | | 3,586,912 | | | | 9.9 | |
Ovintiv Inc. | | | 614,739 | | | | 8,827,652 | | | | 24.5 | |
Targa Resources Corp. | | | 174,368 | | | | 4,599,828 | | | | 12.8 | |
Williams Cos., Inc. | | | 23,481 | | | | 470,794 | | | | 1.3 | |
| | | | | | | | | | | | |
| | | | | | | 48,675,606 | | | | | |
| | | |
| Personal Products | | | | | | | | | |
Coty Inc, Class A | | | 1,030,626 | | | | 7,234,995 | | | | 20.1 | |
| | | | | | | | | | | | |
| | | |
| Pharmaceuticals | | | | | | | | | |
Bristol-Myers Squibb Co. | | | 4,360 | | | | 270,451 | | | | 0.8 | |
| | | | | | | | | | | | |
| | | |
| Professional Services | | | | | | | | | |
Equifax, Inc. | | | 48,137 | | | | 9,282,739 | | | | 25.8 | |
| | | | | | | | | | | | |
|
| Real Estate Management & Development | |
CBRE Group, Inc., Class A | | | 35,165 | | | | 2,205,549 | | | | 6.1 | |
| | | | | | | | | | | | |
| | | |
| Road & Rail | | | | | | | | | |
Avis Budget Group Inc. | | | 811 | | | | 30,250 | | | | 0.1 | |
| | |
SCHEDULE OF INVESTMENTS | | 51 |
| | |
Schedule of Investments (continued) December 31, 2020 | | BlackRock Systematic Multi-Strategy Fund |
| | | | | | | | | | | | |
| Security | | Shares | | | Value | | | % of
Basket
Value | |
| | | |
| Road & Rail (continued) | | | | | | | | | |
JB Hunt Transport Services, Inc. | | | 66,745 | | | $ | 9,120,704 | | | | 25.3 | % |
Ryder System, Inc. | | | 145,883 | | | | 9,009,734 | | | | 25.0 | |
| | | | | | | | | | | | |
| | | | | | | 18,160,688 | | | | | |
|
| Semiconductors & Semiconductor Equipment | |
Nxp Semiconductors Nv | | | 3,213 | | | | 510,899 | | | | 1.4 | |
| | | | | | | | | | | | |
| | |
| Specialty Retail | | | | | | | |
AutoZone, Inc. | | | 675 | | | | 800,172 | | | | 2.2 | |
Bed Bath & Beyond, Inc. | | | 78,275 | | | | 1,390,164 | | | | 3.9 | |
Best Buy Co., Inc. | | | 10,330 | | | | 1,030,831 | | | | 2.9 | |
L Brands, Inc. | | | 227,514 | | | | 8,461,246 | | | | 23.5 | |
Lowe’s Cos., Inc. | | | 57,055 | | | | 9,157,898 | | | | 25.4 | |
| | | | | | | | | | | | |
| | | | 20,840,311 | | | | | |
|
| Technology Hardware, Storage & Peripherals | |
Apple, Inc. | | | 68,173 | | | | 9,045,875 | | | | 25.1 | |
Dell Technologies, Inc., Class C | | | 1,715 | | | | 125,692 | | | | 0.3 | |
NetApp, Inc. | | | 77,079 | | | | 5,105,713 | | | | 14.2 | |
| | | | | | | | | | | | |
| | | | 14,277,280 | | | | | |
| | |
| Trading Companies & Distributors | | | | | | | |
W.W. Grainger, Inc. | | | 986 | | | | 402,623 | | | | 1.1 | |
| | | | | | | | | | | | |
| Total Reference Entity — Long | | | 653,426,517 | | | | |
| | | | | | | | | | | | |
| | |
Reference Entity — Short | | | | | | | | | |
| | |
| Common Stocks | | | | | | | |
| | |
| Aerospace & Defense | | | | | | | |
Boeing Co. | | | (36,941 | ) | | | (7,907,590 | ) | | | (21.9 | ) |
Hexcel Corp. | | | (175,097 | ) | | | (8,490,454 | ) | | | (23.6 | ) |
Raytheon Technologies Corp. | | | (125,324 | ) | | | (8,961,919 | ) | | | (24.9 | ) |
| | | | | | | | | | | | |
| | | | (25,359,963 | ) | | | | |
| | |
| Airlines | | | | | | | |
United Airlines Holdings, Inc. | | | (186,707 | ) | | | (8,075,078 | ) | | | (22.4 | ) |
| | | | | | | | | | | | |
| | |
| Auto Components | | | | | | | |
Aptiv Plc | | | (11,362 | ) | | | (1,480,355 | ) | | | (4.1 | ) |
Lear Corp. | | | (465 | ) | | | (73,949 | ) | | | (0.2 | ) |
| | | | | | | | | | | | |
| | | | (1,554,304 | ) | | | | |
| | |
| Beverages | | | | | | | |
Molson Coors Beverage Co, Class B | | | (17,266 | ) | | | (780,251 | ) | | | (2.2 | ) |
| | | | | | | | | | | | |
| | |
| Biotechnology | | | | | | | |
AbbVie, Inc. | | | (10,520 | ) | | | (1,127,218 | ) | | | (3.1 | ) |
Emergent BioSolutions, Inc. | | | (31,834 | ) | | | (2,852,326 | ) | | | (7.9 | ) |
| | | | | | | | | | | | |
| | | | (3,979,544 | ) | | | | |
| | |
| Building Products | | | | | | | |
Builders FirstSource, Inc. | | | (164,073 | ) | | | (6,695,819 | ) | | | (18.6 | ) |
| | | | | | | | | | | | |
| | |
| Capital Markets | | | | | | | |
Brookfield Asset Management, Inc., Class A | | | (207,319 | ) | | | (8,556,055 | ) | | | (23.8 | ) |
MSCI, Inc. | | | (15,840 | ) | | | (7,073,035 | ) | | | (19.6 | ) |
| | | | | | | | | | | | |
| | | | (15,629,090 | ) | | | | |
| | |
| Chemicals | | | | | | | |
Ecolab, Inc. | | | (41,454 | ) | | | (8,968,987 | ) | | | (24.9 | ) |
| | | | | | | | | | | | |
| | |
| Commercial Services & Supplies | | | | | | | |
Waste Connections, Inc. | | | (1,800 | ) | | | (184,626 | ) | | | (0.5 | ) |
| | | | | | | | | | | | |
| | | | | | | | | | | | |
| Security | | Shares | | | Value | | | % of
Basket
Value | |
| | |
| Communications Equipment | | | | | | | |
Motorola Solutions, Inc. | | | (572 | ) | | $ | (97,274 | ) | | | (0.3 | )% |
| | | | | | | | | | | | |
| | |
| Construction & Engineering | | | | | | | |
Aecom | | | (124,557 | ) | | | (6,200,447 | ) | | | (17.2 | ) |
| | | | | | | | | | | | |
| | |
| Construction Materials | | | | | | | |
Martin Marietta Materials, Inc. | | | (28,459 | ) | | | (8,081,502 | ) | | | (22.4 | ) |
| | | | | | | | | | | | |
| | |
| Containers & Packaging | | | | | | | |
Avery Dennison Corp. | | | (13,283 | ) | | | (2,060,326 | ) | | | (5.7 | ) |
Ball Corp. | | | (21,252 | ) | | | (1,980,261 | ) | | | (5.5 | ) |
Sonoco Products Co. | | | (7,894 | ) | | | (467,720 | ) | | | (1.3 | ) |
| | | | | | | | | | | | |
| | | | (4,508,307 | ) | | | | |
| | |
| Diversified Financial Services | | | | | | | |
Berkshire Hathaway, Inc., Class B | | | (12,595 | ) | | | (2,920,403 | ) | | | (8.1 | ) |
| | | | | | | | | | | | |
| | |
| Electric Utilities | | | | | | | |
Edison International | | | (142,993 | ) | | | (8,982,820 | ) | | | (24.9 | ) |
FirstEnergy Corp. | | | (296,778 | ) | | | (9,084,375 | ) | | | (25.2 | ) |
PG&E Corp. | | | (736,543 | ) | | | (9,177,326 | ) | | | (25.5 | ) |
| | | | | | | | | | | | |
| | | | (27,244,521 | ) | | | | |
| | |
| Electrical Equipment | | | | | | | |
Eaton Corp Plc | | | (51,735 | ) | | | (6,215,443 | ) | | | (17.3 | ) |
| | | | | | | | | | | | |
| |
| Electronic Equipment, Instruments & Components | | | | |
Keysight Technologies In | | | (71,454 | ) | | | (9,438,359 | ) | | | (26.2 | ) |
Trimble, Inc. | | | (65,976 | ) | | | (4,405,218 | ) | | | (12.2 | ) |
| | | | | | | | | | | | |
| | | | (13,843,577 | ) | | | | |
| | |
| Energy Equipment & Services | | | | | | | |
Baker Hughes Co. | | | (403,118 | ) | | | (8,405,010 | ) | | | (23.3 | ) |
National Oilwell Varco, Inc. | | | (30,301 | ) | | | (416,033 | ) | | | (1.2 | ) |
| | | | | | | | | | | | |
| | | | (8,821,043 | ) | | | | |
| | |
| Entertainment | | | | | | | |
Live Nation Entertainment, Inc. | | | (65,804 | ) | | | (4,835,278 | ) | | | (13.4 | ) |
Walt Disney Co. | | | (48,732 | ) | | | (8,829,264 | ) | | | (24.5 | ) |
| | | | | | | | | | | | |
| | | | (13,664,542 | ) | | | | |
|
| Equity Real Estate Investment Trusts (REITs) | |
American Campus Communities, Inc. | | | (214,852 | ) | | | (9,189,220 | ) | | | (25.5 | ) |
Avalonbay Communities Inc. | | | (20,229 | ) | | | (3,245,338 | ) | | | (9.0 | ) |
Boston Properties, Inc. | | | (26,417 | ) | | | (2,497,199 | ) | | | (6.9 | ) |
Camden Property Trust | | | (26,036 | ) | | | (2,601,517 | ) | | | (7.2 | ) |
Digital Realty Trust, Inc. | | | (16,969 | ) | | | (2,367,345 | ) | | | (6.6 | ) |
Epr Properties | | | (175,606 | ) | | | (5,707,195 | ) | | | (15.8 | ) |
Equity Residential | | | (87,402 | ) | | | (5,181,191 | ) | | | (14.4 | ) |
Federal Realty Investment Trust | | | (48,783 | ) | | | (4,152,409 | ) | | | (11.5 | ) |
Host Hotels & Resorts, Inc. | | | (540,275 | ) | | | (7,904,223 | ) | | | (21.9 | ) |
Medical Properties Trust, Inc. | | | (401,329 | ) | | | (8,744,959 | ) | | | (24.3 | ) |
Ryman Hospitality Properties, Inc. | | | (95,713 | ) | | | (6,485,513 | ) | | | (18.0 | ) |
Simon Property Group, Inc. | | | (707 | ) | | | (60,293 | ) | | | (0.2 | ) |
VICI Properties, Inc. | | | (345,434 | ) | | | (8,808,567 | ) | | | (24.5 | ) |
Vornado Realty Trust | | | (119,310 | ) | | | (4,455,035 | ) | | | (12.4 | ) |
| | | | | | | | | | | | |
| | | | (71,400,004 | ) | | | | |
| | |
| Food & Staples Retailing | | | | | | | |
Walgreens Boots Alliance, Inc. | | | (116,393 | ) | | | (4,641,753 | ) | | | (12.9 | ) |
| | | | | | | | | | | | |
| | |
| 52 | | 2 0 2 0 BLACK ROCK ANNUAL REPORT TO SHAREHOLDERS |
| | |
Schedule of Investments (continued) December 31, 2020 | | BlackRock Systematic Multi-Strategy Fund |
| | | | | | | | | | | | |
| Security | | Shares | | | Value | | | % of
Basket
Value | |
| | |
| Food Products | | | | | | | |
Lamb Weston Holdings, Inc. | | | (44,332 | ) | | $ | (3,490,702 | ) | | | (9.7 | )% |
Post Holdings, Inc. | | | (93,199 | ) | | | (9,414,031 | ) | | | (26.1 | ) |
| | | | | | | | | | | | |
| | | | (12,904,733 | ) | | | | |
| | |
| Gas Utilities | | | | | | | |
National Fuel Gas Co. | | | (171,760 | ) | | | (7,064,489 | ) | | | (19.6 | ) |
UGI Corp. | | | (245,052 | ) | | | (8,567,018 | ) | | | (23.8 | ) |
| | | | | | | | | | | | |
| | | | (15,631,507 | ) | | | | |
| | |
| Health Care Equipment & Supplies | | | | | | | |
Baxter International, Inc. | | | (110,113 | ) | | | (8,835,467 | ) | | | (24.6 | ) |
Becton Dickinson And Co. | | | (14,146 | ) | | | (3,539,612 | ) | | | (9.8 | ) |
DENTSPLY SIRONA, Inc. | | | (151,481 | ) | | | (7,931,545 | ) | | | (22.0 | ) |
| | | | | | | | | | | | |
| | | | (20,306,624 | ) | | | | |
| | |
| Health Care Providers & Services | | | | | | | |
Encompass Health Corp. | | | (12,460 | ) | | | (1,030,317 | ) | | | (2.9 | ) |
Tenet Healthcare Corp. | | | (44,697 | ) | | | (1,784,751 | ) | | | (4.9 | ) |
UnitedHealth Group, Inc. | | | (95 | ) | | | (33,315 | ) | | | (0.1 | ) |
| | | | | | | | | | | | |
| | | | (2,848,383 | ) | | | | |
| | |
| Hotels, Restaurants & Leisure | | | | | | | |
Carnival Corp. | | | (417,371 | ) | | | (9,040,256 | ) | | | (25.1 | ) |
Choice Hotels International Inc. | | | (24,404 | ) | | | (2,604,639 | ) | | | (7.2 | ) |
Darden Restaurants, Inc. | | | (8,336 | ) | | | (992,984 | ) | | | (2.8 | ) |
Hyatt Hotels Corp, Class A | | | (76,914 | ) | | | (5,710,865 | ) | | | (15.9 | ) |
Las Vegas Sands Corp. | | | (770 | ) | | | (45,892 | ) | | | (0.1 | ) |
Marriott International, Inc., Class A | | | (52,901 | ) | | | (6,978,700 | ) | | | (19.4 | ) |
Mgm Resorts International | | | (14,076 | ) | | | (443,535 | ) | | | (1.2 | ) |
Six Flags Entertainment Corp. | | | (45,837 | ) | | | (1,563,042 | ) | | | (4.3 | ) |
| | | | | | | | | | | | |
| | | | (27,379,913 | ) | | | | |
| | |
| Household Durables | | | | | | | |
Mohawk Industries Inc. | | | (21,080 | ) | | | (2,971,226 | ) | | | (8.3 | ) |
NVR, Inc. | | | (163 | ) | | | (665,017 | ) | | | (1.8 | ) |
| | | | | | | | | | | | |
| | | | (3,636,243 | ) | | | | |
|
| Independent Power and Renewable Electricity Producers | |
AES Corp. | | | (86,877 | ) | | | (2,041,610 | ) | | | (5.7 | ) |
| | | | | | | | | | | | |
Industrial Conglomerates | | | | | | | | | |
Carlisle Cos., Inc. | | | (17,933 | ) | | | (2,800,776 | ) | | | (7.8 | ) |
General Electric Co | | | (74,194 | ) | | | (801,295 | ) | | | (2.2 | ) |
Roper Technologies Inc. | | | (3,367 | ) | | | (1,451,480 | ) | | | (4.0 | ) |
| | | | | | | | | | | | |
| | | | (5,053,551 | ) | | | | |
| | |
| Insurance | | | | | | | |
Assurant, Inc. | | | (66,098 | ) | | | (9,003,870 | ) | | | (25.0 | ) |
Loews Corp. | | | (67,200 | ) | | | (3,025,344 | ) | | | (8.4 | ) |
Progressive Corp. | | | (796 | ) | | | (78,708 | ) | | | (0.2 | ) |
| | | | | | | | | | | | |
| | | | (12,107,922 | ) | | | | |
| | |
| Interactive Media & Services | | | | | | | |
Match Group, Inc. | | | (60,542 | ) | | | (9,153,345 | ) | | | (25.4 | ) |
Twitter, Inc. | | | (166,777 | ) | | | (9,030,975 | ) | | | (25.1 | ) |
| | | | | | | | | | | | |
| | | | (18,184,320 | ) | | | | |
| | |
| Internet & Direct Marketing Retail | | | | | | | |
Expedia Group, Inc. | | | (71,435 | ) | | | (9,457,994 | ) | | | (26.3 | ) |
| | | | | | | | | | | | |
| | |
| IT Services | | | | | | | |
Global Payments, Inc. | | | (42,322 | ) | | | (9,117,005 | ) | | | (25.3 | ) |
| | | | | | | | | | | | |
| Security | | Shares | | | Value | | | % of
Basket
Value | |
| | |
| IT Services (continued) | | | | | | | |
International Business Machines Corp. | | | (1,341 | ) | | $ | (168,805 | ) | | | (0.4 | )% |
MasterCard, Inc., Class A | | | (88 | ) | | | (31,411 | ) | | | (0.1 | ) |
Visa, Inc., Class A | | | (10,333 | ) | | | (2,260,137 | ) | | | (6.3 | ) |
| | | | | | | | | | | | |
| | | | (11,577,358 | ) | | | | |
| | |
| Leisure Products | | | | | | | |
Hasbro, Inc. | | | (69,826 | ) | | | (6,531,524 | ) | | | (18.1 | ) |
| | | | | | | | | | | | |
| | |
| Life Sciences Tools & Services | | | | | | | |
Avantor, Inc. | | | (103,931 | ) | | | (2,925,658 | ) | | | (8.1 | ) |
| | | | | | | | | | | | |
| | |
| Machinery | | | | | | | |
Flowserve Corp. | | | (237,822 | ) | | | (8,763,741 | ) | | | (24.3 | ) |
Westinghouse Air Brake Technologies Corp. | | | (49,859 | ) | | | (3,649,679 | ) | | | (10.2 | ) |
| | | | | | | | | | | | |
| | | | (12,413,420 | ) | | | | |
| | |
| Media | | | | | | | |
Altice USA, Inc., Class A | | | (41,469 | ) | | | (1,570,431 | ) | | | (4.4 | ) |
Comcast Corp., Class A | | | (178,039 | ) | | | (9,329,244 | ) | | | (25.9 | ) |
Discovery Inc, Class A | | | (98,435 | ) | | | (2,961,909 | ) | | | (8.2 | ) |
DISH Network Corp., Class A | | | (250,700 | ) | | | (8,107,638 | ) | | | (22.5 | ) |
Sirius Xm Holdings Inc. | | | (869,517 | ) | | | (5,538,823 | ) | | | (15.4 | ) |
| | | | | | | | | | | | |
| | | | (27,508,045 | ) | | | | |
| | |
| Metals & Mining | | | | | | | |
Cleveland-Cliffs, Inc. | | | (641,286 | ) | | | (9,337,124 | ) | | | (25.9 | ) |
Southern Copper Corp. | | | (55,918 | ) | | | (3,641,380 | ) | | | (10.1 | ) |
Teck Resources Ltd., Class B | | | (384,931 | ) | | | (6,986,498 | ) | | | (19.4 | ) |
United States Steel Corp. | | | (192,129 | ) | | | (3,222,003 | ) | | | (9.0 | ) |
| | | | | | | | | | | | |
| | | | (23,187,005 | ) | | | | |
| | |
| Multi-line Retail | | | | | | | |
Dollar Tree, Inc. | | | (5,385 | ) | | | (581,795 | ) | | | (1.6 | ) |
Kohl’s Corp. | | | (102,839 | ) | | | (4,184,519 | ) | | | (11.6 | ) |
| | | | | | | | | | | | |
| | | | (4,766,314 | ) | | | | |
| | |
| Multi-Utilities | | | | | | | |
CMS Energy Corp. | | | (1,525 | ) | | | (93,040 | ) | | | (0.3 | ) |
| | | | | | | | | | | | |
| | |
| Oil, Gas & Consumable Fuels | | | | | | | |
Canadian Natural Resources Ltd. | | | (59,748 | ) | | | (1,436,939 | ) | | | (4.0 | ) |
Conocophillips | | | (210,527 | ) | | | (8,418,975 | ) | | | (23.4 | ) |
Eog Resources Inc. | | | (13,490 | ) | | | (672,746 | ) | | | (1.9 | ) |
Hess Corp. | | | (162,645 | ) | | | (8,586,030 | ) | | | (23.8 | ) |
Hollyfrontier Corp. | | | (209,469 | ) | | | (5,414,774 | ) | | | (15.0 | ) |
Occidental Petroleum Corp. | | | (222,010 | ) | | | (3,842,993 | ) | | | (10.7 | ) |
PBF Energy, Inc., Class A | | | (8,003 | ) | | | (56,821 | ) | | | (0.1 | ) |
Phillips 66 | | | (21,954 | ) | | | (1,535,463 | ) | | | (4.3 | ) |
Pioneer Natural Resources Co. | | | (51,747 | ) | | | (5,893,466 | ) | | | (16.3 | ) |
Range Resources Corp. | | | (322,131 | ) | | | (2,158,278 | ) | | | (6.0 | ) |
Suncor Energy, Inc. | | | (496,278 | ) | | | (8,327,545 | ) | | | (23.1 | ) |
TC Energy Corp. | | | (202,345 | ) | | | (8,239,488 | ) | | | (22.9 | ) |
Valero Energy Corp. | | | (52,816 | ) | | | (2,987,801 | ) | | | (8.3 | ) |
| | | | | | | | | | | | |
| | | | (57,571,319 | ) | | | | |
| | |
| Personal Products | | | | | | | |
Estee Lauder Cos., Inc., Class A | | | (29,064 | ) | | | (7,736,546 | ) | | | (21.5 | ) |
| | | | | | | | | | | | |
| | |
| Pharmaceuticals | | | | | | | |
Elanco Animal Health, Inc. | | | (266,298 | ) | | | (8,167,360 | ) | | | (22.7 | ) |
| | | | | | | | | | | | |
| | |
| Semiconductors & Semiconductor Equipment | | | | | | | |
Applied Materials, Inc. | | | (38,732 | ) | | | (3,342,572 | ) | | | (9.3 | ) |
| | |
SCHEDULE OF INVESTMENTS | | 53 |
| | |
Schedule of Investments (continued) December 31, 2020 | | BlackRock Systematic Multi-Strategy Fund |
| | | | | | | | | | | | |
| Security | | Shares | | | Value | | | % of
Basket
Value | |
| |
| Semiconductors & Semiconductor Equipment (continued) | | | | |
Lam Research Corp. | | | (8,174 | ) | | $ | (3,860,335 | ) | | | (10.7 | )% |
Micron Technology, Inc. | | | (90,590 | ) | | | (6,810,556 | ) | | | (18.9 | ) |
On Semiconductor Corp. | | | (291,250 | ) | | | (9,532,613 | ) | | | (26.5 | ) |
| | | | | | | | | | | | |
| | | | | | | (23,546,076 | ) | | | | |
| | | |
| Specialty Retail | | | | | | | | | |
Carvana Co. | | | (31,961 | ) | | | (7,655,938 | ) | | | (21.2 | ) |
| | | | | | | | | | | | |
|
| Technology Hardware, Storage & Peripherals | |
NCR Corp. | | | (46,732 | ) | | | (1,755,721 | ) | | | (4.9 | ) |
Seagate Technology PLC | | | (133,839 | ) | | | (8,319,432 | ) | | | (23.1 | ) |
Western Digital Corp. | | | (162,843 | ) | | | (9,019,874 | ) | | | (25.0 | ) |
Xerox Holdings Corp. | | | (1,748 | ) | | | (40,536 | ) | | | (0.1 | ) |
| | | | | | | | | | | | |
| | | | | | | (19,135,563 | ) | | | | |
| | | |
| Textiles, Apparel & Luxury Goods | | | | | | | | | |
Ralph Lauren Corp. | | | (13,792 | ) | | | (1,430,782 | ) | | | (4.0 | ) |
Tapestry, Inc. | | | (297,568 | ) | | | (9,248,413 | ) | | | (25.7 | ) |
Under Armour, Inc., Class A | | | (114,675 | ) | | | (1,968,970 | ) | | | (5.4 | ) |
VF Corp. | | | (23,627 | ) | | | (2,017,982 | ) | | | (5.6 | ) |
| | | | | | | | | | | | |
| | | | | | | (14,666,147 | ) | | | | |
| | | |
| Thrifts & Mortgage Finance | | | | | | | | | |
MGIC Investment Corp. | | | (217,921 | ) | | | (2,734,909 | ) | | | (7.6 | ) |
Radian Group, Inc. | | | (48,428 | ) | | | (980,667 | ) | | | (2.7 | ) |
| | | | | | | | | | | | |
| | | | | | | (3,715,576 | ) | | | | |
|
| Trading Companies & Distributors | |
Air Lease Corp. | | | (24,815 | ) | | | (1,102,282 | ) | | | (3.1 | ) |
United Rentals, Inc. | | | (32,374 | ) | | | (7,507,854 | ) | | | (20.8 | ) |
| | | | | | | | | | | | |
| | | | | | | (8,610,136 | ) | | | | |
| | | |
| Water Utilities | | | | | | | | | |
Essential Utilities, Inc. | | | (194,055 | ) | | | (9,176,861 | ) | | | (25.5 | ) |
| | | | | | | | | | | | |
Total Reference Entity — Short | | | | | | | (617,403,164 | ) | | | | |
| | | | | | | | | | | | |
| | |
Net Value of Reference Entity — Morgan
Stanley & Co. International PLC | | | $ 36,023,353 | | | | |
| | | | | | | | | | | | |
The following table represents the individual long and short positions and related values of the equity securities underlying the total return swap with Morgan Stanley & Co. International PLC as of period end, termination date October 5, 2022:
| | | | | | | | | | | | |
| Security | | Shares | | | Value | | | %of
Basket
Value | |
| | | |
Reference Entity — Long | | | | | | | | | | | | |
| | | |
| Common Stocks | | | | | | | | | |
| | | |
| Aerospace & Defense | | | | | | | | | |
Howmet Aerospace, Inc. | | | 147,445 | | | $ | 4,208,080 | | | | 11.2 | % |
Lockheed Martin Corp. | | | 30,412 | | | | 10,795,652 | | | | 28.9 | |
Northrop Grumman Corp. | | | 31,617 | | | | 9,634,332 | | | | 25.8 | |
| | | | | | | | | | | | |
| | | | | | | 24,638,064 | | | | | |
| | | |
| Air Freight & Logistics | | | | | | | | | |
United Parcel Service, Inc., Class B | | | 32,328 | | | | 5,444,035 | | | | 14.6 | |
| | | | | | | | | | | | |
| | | |
| Airlines | | | | | | | | | |
Delta Air Lines, Inc. | | | 98,862 | | | | 3,975,241 | | | | 10.6 | |
| | | | | | | | | | | | |
| | | | | | | | | | | | |
| Security | | Shares | | | Value | | | % of
Basket
Value | |
| | |
| Auto Components | | | | | | | |
Goodyear Tire & Rubber Co. | | | 1,115,390 | | | $ | 12,168,905 | | | | 32.6 | % |
| | | | | | | | | | | | |
| | |
| Automobiles | | | | | | | |
Ford Motor Co. | | | 1,035,802 | | | | 9,104,700 | | | | 24.4 | |
| | | | | | | | | | | | |
| | |
| Building Products | | | | | | | |
Johnson Controls International PLC. | | | 235,391 | | | | 10,966,867 | | | | 29.4 | |
Trane Technologies Plc. | | | 32,043 | | | | 4,651,362 | | | | 12.4 | |
| | | | | | | | | | | | |
| | | | 15,618,229 | | | | | |
| | |
| Chemicals | | | | | | | |
Dow, Inc. | | | 12,706 | | | | 705,183 | | | | 1.9 | |
DuPont de Nemours, Inc. | | | 164,791 | | | | 11,718,288 | | | | 31.3 | |
Eastman Chemical Co. | | | 90,107 | | | | 9,035,930 | | | | 24.2 | |
| | | | | | | | | | | | |
| | | | 21,459,401 | | | | | |
| | |
| Communications Equipment | | | | | | | |
Cisco Systems, Inc. | | | 243,254 | | | | 10,885,617 | | | | 29.1 | |
| | | | | | | | | | | | |
| | |
| Consumer Finance | | | | | | | |
OneMain Holdings, Inc. | | | 85,121 | | | | 4,099,427 | | | | 11.0 | |
| | | | | | | | | | | | |
| | |
| Containers & Packaging | | | | | | | |
International Paper Co. | | | 91,981 | | | | 4,573,295 | | | | 12.3 | |
Packaging Corp. of America | | | 32,519 | | | | 4,484,695 | | | | 12.0 | |
Sealed Air Corp. | | | 234,415 | | | | 10,733,863 | | | | 28.7 | |
Westrock Co. | | | 52,510 | | | | 2,285,760 | | | | 6.1 | |
| | | | | | | | | | | | |
| | | | 22,077,613 | | | | | |
| | |
| Diversified Telecommunication Services | | | | | | | |
Verizon Communications, Inc. | | | 109,495 | | | | 6,432,831 | | | | 17.2 | |
| | | | | | | | | | | | |
| | |
| Electric Utilities | | | | | | | |
American Electric Power Co., Inc. | | | 107,464 | | | | 8,948,527 | | | | 24.0 | |
Exelon Corp. | | | 254,895 | | | | 10,761,667 | | | | 28.8 | |
NRG Energy, Inc. | | | 109,836 | | | | 4,124,342 | | | | 11.0 | |
| | | | | | | | | | | | |
| | | | 23,834,536 | | | | | |
|
| Electronic Equipment, Instruments & Components | |
Arrow Electronics, Inc. | | | 124,743 | | | | 12,137,494 | | | | 32.5 | |
| | | | | | | | | | | | |
| | |
| Energy Equipment & Services | | | | | | | |
Halliburton Co. | | | 636,846 | | | | 12,036,389 | | | | 32.2 | |
| | | | | | | | | | | | |
| | |
| Entertainment | | | | | | | |
Walt Disney Co. | | | 65,224 | | | | 11,817,284 | | | | 31.6 | |
| | | | | | | | | | | | |
| | |
| Equity Real Estate Investment Trusts (REITs) | | | | | | | |
Weyerhaeuser Co. | | | 121,265 | | | | 4,066,015 | | | | 10.9 | |
| | | | | | | | | | | | |
| | |
| Food & Staples Retailing | | | | | | | |
Kroger Co. | | | 2,750 | | | | 87,340 | | | | 0.3 | |
Walmart, Inc. | | | 72,667 | | | | 10,474,948 | | | | 28.0 | |
| | | | | | | | | | | | |
| | | | 10,562,288 | | | | | |
| | |
| Food Products | | | | | | | |
Conagra Brands, Inc. | | | 209,495 | | | | 7,596,289 | | | | 20.3 | |
General Mills, Inc. | | | 57,374 | | | | 3,373,591 | | | | 9.0 | |
Tyson Foods, Inc., Class A | | | 32,978 | | | | 2,125,102 | | | | 5.7 | |
| | | | | | | | | | | | |
| | | | 13,094,982 | | | | | |
| | |
| Health Care Providers & Services | | | | | | | |
DaVita, Inc. | | | 26,892 | | | | 3,157,121 | | | | 8.5 | |
HCA Healthcare, Inc. | | | 28,608 | | | | 4,704,872 | | | | 12.6 | |
| | |
| 54 | | 2 0 2 0 BLACK ROCK ANNUAL REPORT TO SHAREHOLDERS |
| | |
Schedule of Investments (continued) December 31, 2020 | | BlackRock Systematic Multi-Strategy Fund |
| | | | | | | | | | | | |
| Security | | Shares | | | Value | | | % of
Basket
Value | |
| | |
| Health Care Providers & Services (continued) | | | | | | | |
McKesson Corp. | | | 36,566 | | | $ | 6,359,559 | | | | 17.0 | % |
Quest Diagnostics, Inc. | | | 76,515 | | | | 9,118,293 | | | | 24.4 | |
| | | | | | | | | |
| | | | 23,339,845 | | | | | |
| | |
| Hotels, Restaurants & Leisure | | | | | | | |
Boyd Gaming Corp. | | | 219,714 | | | | 9,430,125 | | | | 25.2 | |
Carnival Corp. | | | 483,920 | | | | 10,481,707 | | | | 28.0 | |
McDonald’s Corp. | | | 54,073 | | | | 11,602,984 | | | | 31.1 | |
Yum! Brands, Inc. | | | 101,913 | | | | 11,063,675 | | | | 29.6 | |
| | | | | | | | | |
| | | | 42,578,491 | | | | | |
| | |
| Household Durables | | | | | | | |
Lennar Corp., Class A | | | 3,315 | | | | 252,702 | | | | 0.7 | |
Newell Brands, Inc. | | | 251,878 | | | | 5,347,370 | | | | 14.3 | |
PulteGroup, Inc. | | | 213,129 | | | | 9,190,122 | | | | 24.6 | |
Toll Brothers, Inc. | | | 172,898 | | | | 7,515,876 | | | | 20.1 | |
Whirlpool Corp. | | | 60,566 | | | | 10,931,557 | | | | 29.2 | |
| | | | | | | | | |
| | | | 33,237,627 | | | | | |
| | |
| Household Products | | | | | | | |
Procter & Gamble Co. | | | 80,067 | | | | 11,140,522 | | | | 29.8 | |
| | | | | | | | | |
|
| Independent Power and Renewable Electricity Producers | |
Vistra Corp. | | | 645,834 | | | | 12,697,096 | | | | 34.0 | |
| | | | | | | | | |
| | |
| Insurance | | | | | | | |
Allstate Corp. | | | 114,427 | | | | 12,578,960 | | | | 33.7 | |
American International Group, Inc. | | | 298,728 | | | | 11,309,842 | | | | 30.3 | |
Hartford Financial Services Group, Inc. | | | 151,780 | | | | 7,434,184 | | | | 19.9 | |
Marsh & McLennan Cos., Inc. | | | 102,550 | | | | 11,998,350 | | | | 32.1 | |
MetLife, Inc. | | | 253,795 | | | | 11,915,675 | | | | 31.9 | |
Prudential Financial, Inc. | | | 152,928 | | | | 11,939,089 | | | | 31.9 | |
| | | | | | | | | |
| | | | 67,176,100 | | | | | |
| | |
| Machinery | | | | | | | |
Deere & Co. | | | 36,921 | | | | 9,933,595 | | | | 26.6 | |
| | | | | | | | | |
| | |
| Media | | | | | | | |
Omnicom Group, Inc. | | | 191,619 | | | | 11,951,277 | | | | 32.0 | |
ViacomCBS, Inc., Class B | | | 90,348 | | | | 3,366,366 | | | | 9.0 | |
| | | | | | | | | |
| | | | 15,317,643 | | | | | |
| | |
| Metals & Mining | | | | | | | |
Barrick Gold Corp. | | | 404,009 | | | | 9,203,325 | | | | 24.6 | |
Newmont Corp. | | | 197,705 | | | | 11,840,552 | | | | 31.7 | |
| | | | | | | | | |
| | | | 21,043,877 | | | | | |
| | |
| Multi-line Retail | | | | | | | |
Target Corp. | | | 63,028 | | | | 11,126,333 | | | | 29.8 | |
| | | | | | | | | |
| | |
| Oil, Gas & Consumable Fuels | | | | | | | |
Apache Corp. | | | 339,270 | | | | 4,814,241 | | | | 12.9 | |
Conocophillips | | | 42,729 | | | | 1,708,733 | | | | 4.6 | |
Murphy Oil Corp. | | | 121,642 | | | | 1,471,868 | | | | 3.9 | |
Occidental Petroleum Corp. | | | 659,809 | | | | 11,421,294 | | | | 30.5 | |
Ovintiv Inc. | | | 554,621 | | | | 7,964,358 | | | | 21.3 | |
Williams Cos., Inc. | | | 450,435 | | | | 9,031,222 | | | | 24.2 | |
| | | | | | | | | |
| | | | 36,411,716 | | | | | |
| | |
| Pharmaceuticals | | | | | | | |
Bristol-Myers Squibb Co. | | | 159,400 | | | | 9,887,582 | | | | 26.4 | |
Pfizer, Inc. | | | 120,514 | | | | 4,436,120 | | | | 11.9 | |
| | | | | | | | | |
| | | | 14,323,702 | | | | | |
| | | | | | | | | | | | |
| Security | | Shares | | | Value | | | % of
Basket
Value | |
| | |
| Road & Rail | | | | | | | |
CSX Corp. | | | 21,115 | | | $ | 1,916,186 | | | | 5.1 | % |
Norfolk Southern Corp. | | | 47,026 | | | | 11,173,848 | | | | 29.9 | |
Ryder System, Inc. | | | 142,155 | | | | 8,779,493 | | | | 23.5 | |
Union Pacific Corp. | | | 17,480 | | | | 3,639,686 | | | | 9.8 | |
| | | | | | | | | |
| | | | 25,509,213 | | | | | |
| | |
| Specialty Retail | | | | | | | |
AutoZone, Inc. | | | 8,193 | | | | 9,712,310 | | | | 26.0 | |
Best Buy Co., Inc. | | | 52,825 | | | | 5,271,407 | | | | 14.1 | |
Gap, Inc. | | | 256,297 | | | | 5,174,636 | | | | 13.9 | |
Home Depot, Inc. | | | 44,327 | | | | 11,774,138 | | | | 31.5 | |
L Brands, Inc. | | | 299,434 | | | | 11,135,950 | | | | 29.8 | |
Lowe’s Cos., Inc. | | | 73,119 | | | | 11,736,331 | | | | 31.4 | |
| | | | | | | | | |
| | | | 54,804,772 | | | | | |
|
| Technology Hardware, Storage & Peripherals | |
Dell Technologies, Inc., Class C | | | 16,306 | | | | 1,195,067 | | | | 3.2 | |
HP, Inc. | | | 510,920 | | | | 12,563,523 | | | | 33.6 | |
Xerox Holdings Corp. | | | 279,513 | | | | 6,481,906 | | | | 17.4 | |
| | | | | | | | | |
| | | | 20,240,496 | | | | | |
| | |
| Thrifts & Mortgage Finance | | | | | | | |
MGIC Investment Corp. | | | 441,208 | | | | 5,537,160 | | | | 14.8 | |
| | | | | | | | | |
| | |
| Tobacco | | | | | | | |
Altria Group, Inc. | | | 284,836 | | | | 11,678,276 | | | | 31.2 | |
| | | | | | | | | |
| Total Reference Entity — Long | | | 639,549,515 | | | | |
| | | | | | | | | |
| | |
Reference Entity — Short | | | | | | | | | |
| | |
| Common Stocks | | | | | | | |
| | |
| Aerospace & Defense | | | | | | | |
Boeing Co., | | | (44,074 | ) | | | (9,434,480 | ) | | | (25.3 | ) |
TransDigm Group, Inc., | | | (19,289 | ) | | | (11,936,998 | ) | | | (31.9 | ) |
| | | | | | | | | |
| | | | (21,371,478 | ) | | | | |
| | |
| Airlines | | | | | | | |
Southwest Airlines Co., | | | (51,541 | ) | | | (2,402,326 | ) | | | (6.4 | ) |
United Airlines Holdings, Inc., | | | (153,226 | ) | | | (6,627,025 | ) | | | (17.8 | ) |
| | | | | | | | | |
| | | | (9,029,351 | ) | | | | |
| | |
| Automobiles | | | | | | | |
General Motors Co., | | | (278,520 | ) | | | (11,597,573 | ) | | | (31.0 | ) |
Tesla, Inc., | | | (14,757 | ) | | | (10,413,572 | ) | | | (27.9 | ) |
| | | | | | | | | |
| | | | (22,011,145 | ) | | | | |
| | |
| Biotechnology | | | | | | | |
Amgen, Inc., | | | (37,328 | ) | | | (8,582,454 | ) | | | (23.0 | ) |
| | | | | | | | | |
| | |
| Chemicals | | | | | | | |
Olin Corp., | | | (377,852 | ) | | | (9,280,045 | ) | | | (24.8 | ) |
Sherwin-Williams Co., | | | (8,093 | ) | | | (5,947,627 | ) | | | (15.9 | ) |
| | | | | | | | | |
| | | | (15,227,672 | ) | | | | |
| | |
| Communications Equipment | | | | | | | |
Motorola Solutions, Inc., | | | (63,457 | ) | | | (10,791,497 | ) | | | (28.9 | ) |
| | | | | | | | | |
| | |
| Consumer Finance | | | | | | | |
Ally Financial, Inc., | | | (138,349 | ) | | | (4,933,525 | ) | | | (13.2 | ) |
American Express Co., | | | (60,778 | ) | | | (7,348,668 | ) | | | (19.7 | ) |
Capital One Financial Corp., | | | (127,817 | ) | | | (12,634,710 | ) | | | (33.8 | ) |
Navient Corp., | | | (731,223 | ) | | | (7,180,610 | ) | | | (19.2 | ) |
| | | | | | | | | |
| | | | (32,097,513 | ) | | | | |
| | |
| Containers & Packaging | | | | | | | |
Ball Corp., | | | (108,073 | ) | | | (10,070,242 | ) | | | (26.9 | ) |
| | | | | | | | | | | | |
| | |
SCHEDULE OF INVESTMENTS | | 55 |
| | |
Schedule of Investments (continued) December 31, 2020 | | BlackRock Systematic Multi-Strategy Fund |
| | | | | | | | | | | | |
| Security | | Shares | | | Value | | | % of
Basket
Value | |
| | |
| Diversified Telecommunication Services | | | | | | | |
AT&T, Inc., | | | (272,120 | ) | | $ | (7,826,171 | ) | | | (20.9 | )% |
CenturyLink, Inc., | | | (761,535 | ) | | | (7,424,966 | ) | | | (19.9 | ) |
| | | | | | | | | | | | |
| | | | (15,251,137 | ) | | | | |
| | |
| Electric Utilities | | | | | | | |
FirstEnergy Corp., | | | (217,572 | ) | | | (6,659,879 | ) | | | (17.8 | ) |
Southern Co., | | | (117,366 | ) | | | (7,209,793 | ) | | | (19.3 | ) |
| | | | | | | | | | | | |
| | | | (13,869,672 | ) | | | | |
|
| Equity Real Estate Investment Trusts (REITs) | |
Host Hotels & Resorts, Inc., | | | (827,003 | ) | | | (12,099,054 | ) | | | (32.4 | ) |
Simon Property Group, Inc., | | | (121,215 | ) | | | (10,337,215 | ) | | | (27.6 | ) |
| | | | | | | | | | | | |
| | | | (22,436,269 | ) | | | | |
| | |
| Food Products | | | | | | | |
Campbell Soup Co., | | | (248,402 | ) | | | (12,010,237 | ) | | | (32.1 | ) |
Kraft Heinz Co., | | | (29,397 | ) | | | (1,018,900 | ) | | | (2.7 | ) |
Lamb Weston Holdings, Inc., | | | (157,356 | ) | | | (12,390,211 | ) | | | (33.2 | ) |
Mondelez International, Inc., Class A, | | | (207,421 | ) | | | (12,127,906 | ) | | | (32.5 | ) |
| | | | | | | | | | | | |
| | | | (37,547,254 | ) | | | | |
| | |
| Health Care Equipment & Supplies | | | | | | | |
Baxter International, Inc., | | | (125,886 | ) | | | (10,101,093 | ) | | | (27.0 | ) |
Boston Scientific Corp., | | | (184,949 | ) | | | (6,648,917 | ) | | | (17.8 | ) |
| | | | | | | | | | | | |
| | | | (16,750,010 | ) | | | | |
| | |
| Health Care Providers & Services | | | | | | | |
Cardinal Health, Inc., | | | (91,478 | ) | | | (4,899,562 | ) | | | (13.1 | ) |
CVS Health Corp., | | | (111,227 | ) | | | (7,596,804 | ) | | | (20.3 | ) |
UnitedHealth Group, Inc., | | | (21,216 | ) | | | (7,440,027 | ) | | | (19.9 | ) |
Universal Health Services, Inc., Class B, | | | (8,299 | ) | | | (1,141,113 | ) | | | (3.1 | ) |
| | | | | | | | | | | | |
| | | | (21,077,506 | ) | | | | |
| | |
| Hotels, Restaurants & Leisure | | | | | | | |
Aramark, | | | (323,670 | ) | | | (12,454,822 | ) | | | (33.3 | ) |
Darden Restaurants, Inc., | | | (53,272 | ) | | | (6,345,761 | ) | | | (17.0 | ) |
Marriott International, Inc., Class A, | | | (55,141 | ) | | | (7,274,201 | ) | | | (19.5 | ) |
Mgm Resorts International, | | | (37,105 | ) | | | (1,169,179 | ) | | | (3.1 | ) |
Royal Caribbean Cruises Ltd., | | | (156,668 | ) | | | (11,701,533 | ) | | | (31.3 | ) |
| | | | | | | | | | | | |
| | | | (38,945,496 | ) | | | | |
| | |
| Household Durables | | | | | | | |
D.R. Horton, Inc., | | | (165,797 | ) | | | (11,426,729 | ) | | | (30.6 | ) |
MDC Holdings, Inc., | | | (180,162 | ) | | | (8,755,873 | ) | | | (23.4 | ) |
| | | | | | | | | | | | |
| | | | (20,182,602 | ) | | | | |
| | |
| Independent Power and Renewable | | | | | | | |
Electricity Producers | | | | | | | | | |
AES Corp., | | | (70,233 | ) | | | (1,650,476 | ) | | | (4.4 | ) |
| | | | | | | | | | | | |
| | |
| Industrial Conglomerates | | | | | | | |
General Electric Co., | | | (1,055,115 | ) | | | (11,395,242 | ) | | | (30.5 | ) |
Honeywell International, Inc., | | | (54,950 | ) | | | (11,687,865 | ) | | | (31.3 | ) |
| | | | | | | | | | | | |
| | | | (23,083,107 | ) | | | | |
| | |
| Insurance | | | | | | | |
Lincoln National Corp., | | | (160,163 | ) | | | (8,057,801 | ) | | | (21.6 | ) |
Loews Corp., | | | (271,473 | ) | | | (12,221,714 | ) | | | (32.7 | ) |
| | | | | | | | | | | | |
| | | | (20,279,515 | ) | | | | |
| | |
| Internet & Direct Marketing Retail | | | | | | | |
Expedia Group, Inc., | | | (94,248 | ) | | | (12,478,435 | ) | | | (33.4 | ) |
| | | | | | | | | | | | |
| | | | | | | | | | | | |
| Security | | Shares | | | Value | | | % of
Basket
Value | |
| | |
| IT Services | | | | | | | |
International Business Machines Corp., | | | (99,322 | ) | | $ | (12,502,653 | ) | | | (33.4 | )% |
| | | | | | | | | | | | |
| | |
| Leisure Products | | | | | | | |
Mattel, Inc., | | | (682,924 | ) | | | (11,917,024 | ) | | | (31.9 | ) |
| | | | | | | | | | | | |
| | |
| Machinery | | | | | | | |
Caterpillar, Inc., | | | (12,390 | ) | | | (2,255,228 | ) | | | (6.0 | ) |
| | | | | | | | | | | | |
| | |
| Media | | | | | | | |
Altice USA, Inc., Class A, | | | (326,511 | ) | | | (12,364,972 | ) | | | (33.1 | ) |
Charter Communications, Inc., Class A, | | | (18,176 | ) | | | (12,024,333 | ) | | | (32.2 | ) |
Comcast Corp., Class A, | | | (39,873 | ) | | | (2,089,345 | ) | | | (5.6 | ) |
DISH Network Corp., Class A, | | | (334,597 | ) | | | (10,820,867 | ) | | | (28.9 | ) |
TEGNA, Inc., | | | (669,552 | ) | | | (9,340,250 | ) | | | (25.0 | ) |
| | | | | | | | | | | | |
| | | | (46,639,767 | ) | | | | |
| | |
| Metals & Mining | | | | | | | |
Freeport-McMoRan, Inc., | | | (10,636 | ) | | | (276,749 | ) | | | (0.8 | ) |
Teck Resources Ltd., Class B, | | | (657,139 | ) | | | (11,927,073 | ) | | | (31.9 | ) |
| | | | | | | | | | | | |
| | | | (12,203,822 | ) | | | | |
| | |
| Multi-line Retail | | | | | | | |
Kohl’s Corp., | | | (124,486 | ) | | | (5,065,335 | ) | | | (13.6 | ) |
Nordstrom, Inc., | | | (21,818 | ) | | | (680,940 | ) | | | (1.8 | ) |
| | | | | | | | | | | | |
| | | | (5,746,275 | ) | | | | |
| | |
| Multi-Utilities | | | | | | | |
Dominion Energy, Inc., | | | (56,856 | ) | | | (4,275,571 | ) | | | (11.5 | ) |
Sempra Energy, | | | (91,336 | ) | | | (11,637,120 | ) | | | (31.1 | ) |
| | | | | | | | | | | | |
| | | | (15,912,691 | ) | | | | |
| | |
| Oil, Gas & Consumable Fuels | | | | | | | |
Canadian Natural Resources Ltd., | | | (483,757 | ) | | | (11,634,356 | ) | | | (31.1 | ) |
Devon Energy Corp., | | | (697,683 | ) | | | (11,030,368 | ) | | | (29.5 | ) |
Enbridge, Inc., | | | (364,750 | ) | | | (11,668,353 | ) | | | (31.2 | ) |
Hess Corp., | | | (215,995 | ) | | | (11,402,376 | ) | | | (30.5 | ) |
Kinder Morgan, Inc., | | | (280,467 | ) | | | (3,833,984 | ) | | | (10.3 | ) |
Valero Energy Corp., | | | (205,761 | ) | | | (11,639,900 | ) | | | (31.2 | ) |
| | | | | | | | | | | | |
| | | | (61,209,337 | ) | | | | |
| | |
| Pharmaceuticals | | | | | | | |
Bausch Health Cos., Inc., | | | (262,853 | ) | | | (5,467,342 | ) | | | (14.6 | ) |
Johnson & Johnson, | | | (78,720 | ) | | | (12,388,954 | ) | | | (33.2 | ) |
| | | | | | | | | | | | |
| | | | (17,856,296 | ) | | | | |
| | |
| Semiconductors & Semiconductor | | | | | | | |
| Equipment | | | | | | | |
Advanced Micro Devices, Inc., | | | (104,676 | ) | | | (9,599,836 | ) | | | (25.7 | ) |
| | | | | | | | | | | | |
| | |
| Thrifts & Mortgage Finance | | | | | | | |
Radian Group, Inc., | | | (444,706 | ) | | | (9,005,297 | ) | | | (24.1 | ) |
| | | | | | | | | | | | |
| | |
| Trading Companies & Distributors | | | | | | | |
United Rentals, Inc., | | | (50,378 | ) | | | (11,683,162 | ) | | | (31.3 | ) |
| | | | | | | | | | | | |
| | |
| Wireless Telecommunication Services | | | | | | | |
T-Mobile US, Inc., | | | (95,785 | ) | | | (12,916,607 | ) | | | (34.6 | ) |
| | | | | | | | | | | | |
| Total Reference Entity — Short | | | (602,180,826) | | | | |
| | | | | | | | | | | | |
| | |
Net Value of Reference Entity — Morgan
Stanley & Co. International PLC | | | $ 37,368,689 | | | | |
| | | | | | | | | | | | |
| | |
| 56 | | 2 0 2 0 BLACK ROCK ANNUAL REPORT TO SHAREHOLDERS |
| | |
Schedule of Investments (continued) December 31, 2020 | | BlackRock Systematic Multi-Strategy Fund |
Balances Reported in the Statements of Assets and Liabilities for Centrally Cleared Swaps and OTC Swaps
| | | | | | | | | | | | | | | | |
Description | |
| Swap
Premiums
Paid |
| |
| Swap
Premiums
Received |
| |
| Unrealized
Appreciation |
| |
| Unrealized
Depreciation |
|
Centrally Cleared Swaps(a) | | $ | 8,472 | | | $ | (639) | | | $ | 305,453 | | | $ | (386,583) | |
OTC Swaps | | | — | | | | — | | | | 73,453 | | | | (15,747,378) | |
| | (a) | Includes cumulative appreciation (depreciation) on centrally cleared swaps, as reported in the Schedule of Investments. Only current day’s variation margin is reported within the Statements of Assets and Liabilities and is net of any previously paid (received) swap premium amounts. | |
Derivative Financial Instruments Categorized by Risk Exposure
As of period end, the fair values of derivative financial instruments located in the Statements of Assets and Liabilities were as follows:
| | | | | | | | | | | | | | | | | | | | | | | | | | | | |
| | | Commodity
Contracts | | | Credit
Contracts | | | Equity
Contracts | | | Foreign
Currency
Exchange
Contracts | | | Interest
Rate
Contracts | | | Other
Contracts | | | Total | |
Assets — Derivative Financial Instruments | | | | | | | | | | | | | | | | | | | | | | | | | | | | |
Futures contracts | | | | | | | | | | | | | | | | | | | | | | | | | | | | |
Unrealized appreciation on futures contracts(a) | | $ | — | | | $ | — | | | $ | — | | | $ | — | | | $ | 1,631,574 | | | $ | — | | | $ | 1,631,574 | |
Swaps — centrally cleared | | | | | | | | | | | | | | | | | | | | | | | | | | | | |
Unrealized appreciation on centrally cleared swaps(a) | | | — | | | | — | | | | — | | | | — | | | | 305,453 | | | | — | | | | 305,453 | |
Swaps — OTC | | | | | | | | | | | | | | | | | | | | | | | | | | | | |
Unrealized appreciation on OTC swaps; Swap premiums paid | | | — | | | | — | | | | 73,453 | | | | — | | | | — | | | | — | | | | 73,453 | |
| | | | | | | | | | | | | | | | | | | | | | | | | | | | |
| | $ | — | | | $ | — | | | $ | 73,453 | | | $ | — | | | $ | 1,937,027 | | | $ | — | | | $ | 2,010,480 | |
| | | | | | | | | | | | | | | | | | | | | | | | | | | | |
Liabilities — Derivative Financial Instruments | | | | | | | | | | | | | | | | | | | | | | | | | |
Futures contracts | | | | | | | | | | | | | | | | | | | | | | | | | | | | |
Unrealized depreciation on futures contracts(a) | | $ | — | | | $ | — | | | $ | — | | | $ | — | | | $ | 905,940 | | | $ | — | | | $ | 905,940 | |
Forward foreign currency exchange contracts | | | | | | | | | | | | | | | | | | | | | | | | | | | | |
Unrealized depreciation on forward foreign currency exchange contracts | | | — | | | | — | | | | — | | | | 13,055 | | | | — | | | | — | | | | 13,055 | |
Swaps — centrally cleared | | | | | | | | | | | | | | | | | | | | | | | | | | | | |
Unrealized depreciation on centrally cleared swaps(a) | | | — | | | | — | | | | — | | | | — | | | | 386,583 | | | | — | | | | 386,583 | |
Swaps — OTC | | | | | | | | | | | | | | | | | | | | | | | | | | | | |
Unrealized depreciation on OTC swaps; Swap premiums received | | | — | | | | — | | | | 15,429,627 | | | | — | | | | 317,751 | | | | — | | | | 15,747,378 | |
| | | | | | | | | | | | | | | | | | | | | | | | | | | | |
| | $ | — | | | $ | — | | | $ | 15,429,627 | | | $ | 13,055 | | | $ | 1,610,274 | | | $ | — | | | $ | 17,052,956 | |
| | | | | | | | | | | | | | | | | | | | | | | | | | | | |
| | (a) | Net cumulative unrealized appreciation (depreciation) on futures contracts and centrally cleared swaps, if any, are reported in the Schedule of Investments. In the Statements of Assets and Liabilities, only current day’s variation margin is reported in receivables or payables and the net cumulative unrealized appreciation (depreciation) is included in accumulated earnings (loss). | |
For the year ended December 31, 2020, the effect of derivative financial instruments in the Statements of Operations was as follows:
| | | | | | | | | | | | | | | | | | | | | | | | | | | | |
| | | Commodity
Contracts | | | Credit
Contracts | | | Equity
Contracts | | | Foreign
Currency
Exchange
Contracts | | | Interest
Rate
Contracts | | | Other
Contracts | | | Total | |
Net Realized Gain (Loss) from | | | | | | | | | | | | | | | | | | | | | | | | | | | | |
Futures contracts | | $ | — | | | $ | — | | | $ | (1,670,345 | ) | | $ | — | | | $ | (3,719,467 | ) | | $ | — | | | $ | (5,389,812 | ) |
Forward foreign currency exchange contracts | | | — | | | | — | | | | — | | | | (54,373 | ) | | | — | | | | — | | | | (54,373 | ) |
Swaps | | | — | | | | 1,331,112 | | | | (58,903,400 | ) | | | — | | | | 1,827,114 | | | | — | | | | (55,745,174 | ) |
| | | | | | | | | | | | | | | | | | | | | | | | | | | | |
| | $ | — | | | $ | 1,331,112 | | | $ | (60,573,745 | ) | | $ | (54,373 | ) | | $ | (1,892,353 | ) | | $ | — | | | $ | (61,189,359 | ) |
| | | | | | | | | | | | | | | | | | | | | | | | | | | | |
Net Change in Unrealized Appreciation (Depreciation) on | | | | | | | | | | | | | | | | | | | | | |
Futures contracts | | $ | — | | | $ | — | | | $ | — | | | $ | — | | | $ | 829,901 | | | $ | — | | | $ | 829,901 | |
Forward foreign currency exchange contracts | | | — | | | | — | | | | — | | | | (8,023 | ) | | | — | | | | — | | | | (8,023 | ) |
Swaps | | | — | | | | — | | | | (15,190,794 | ) | | | — | | | | (374,829 | ) | | | — | | | | (15,565,623 | ) |
| | | | | | | | | | | | | | | | | | | | | | | | | | | | |
| | $ | — | | | $ | — | | | $ | (15,190,794 | ) | | $ | (8,023 | ) | | $ | 455,072 | | | $ | — | | | $ | (14,743,745 | ) |
| | | | | | | | | | | | | | | | | | | | | | | | | | | | |
| | |
SCHEDULE OF INVESTMENTS | | 57 |
| | |
Schedule of Investments (continued) December 31, 2020 | | BlackRock Systematic Multi-Strategy Fund |
Average Quarterly Balances of Outstanding Derivative Financial Instruments
| | | | |
Futures contracts | | | | |
Average notional value of contracts — long | | $ | 297,039,866 | |
Average notional value of contracts — short | | $ | 174,924,437 | |
Forward foreign currency exchange contracts | | | | |
Average amounts purchased — in USD | | $ | 1,861,658 | |
Credit default swaps | | | | |
Average notional value — buy protection | | $ | 1,492,425 | |
Average notional value — sell protection | | $ | 2,723,200 | |
Interest rate swaps | | | | |
Average notional value — pays fixed rate | | $ | 92,853,114 | |
Average notional value — receives fixed rate | | $ | 93,311,673 | |
Total return swaps | | | | |
Average notional value | | $ | 5,670,168 | |
For more information about the Fund’s investment risks regarding derivative financial instruments, refer to the Notes to Financial Statements.
Derivative Financial Instruments — Offsetting as of Period End
The Fund’s derivative assets and liabilities (by type) were as follows:
| | | | | | | | |
| | | Assets | | | Liabilities | |
Derivative Financial Instruments | | | | | | | | |
Futures contracts | | $ | 450,431 | | | $ | 417,774 | |
Forward foreign currency exchange contracts | | | — | | | | 13,055 | |
Swaps — centrally cleared | | | 8,408 | | | | — | |
Swaps — OTC(a) | | | 73,453 | | | | 15,747,378 | |
| | | | | | | | |
Total derivative assets and liabilities in the Statements of Assets and Liabilities | | | 532,292 | | | | 16,178,207 | |
| | | | | | | | |
Derivatives not subject to a Master Netting Agreement or similar agreement (“MNA”) | | | (458,839 | ) | | | (417,774 | ) |
| | | | | | | | |
Total derivative assets and liabilities subject to an MNA | | $ | 73,453 | | | $ | 15,760,433 | |
| | | | | | | | |
| | (a) | Includes unrealized appreciation (depreciation) on OTC swaps and swap premiums (paid/received) in the Statements of Assets and Liabilities. | |
The following table presents the Fund’s derivative assets and liabilities by counterparty net of amounts available for offset under an MNA and net of the related collateral received (and pledged) by the Fund:
| | | | | | | | | | | | | | | | | | | | |
| | | | | | | | | | | | | | | | | | | | | |
Counterparty | |
| Derivative
Assets
Subject to an MNA by
Counterparty |
| |
| Derivatives
Available
for Offset |
| |
| Non-Cash
Collateral
Received |
| |
| Cash
Collateral
Received |
| |
| Net Amount
of Derivative
Assets |
(a) |
Merrill Lynch International | | $ | 73,453 | | | $ | — | | | $ | — | | | $ | — | | | $ | 73,453 | |
| | | | | | | | | | | | | | | | | | | | |
| | | | | | | | | | | | | | | | | | | | |
| | | | | | | | | | | | | | | | | | | | | |
Counterparty | |
| Derivative
Liabilities
Subject to an MNA by
Counterparty |
| |
| Derivatives
Available
for Offset |
| |
| Non-Cash
Collateral
Pledged |
| |
| Cash
Collateral
Pledged |
(b) | |
| Net Amount
of Derivative
Liabilities |
(c) |
Bank of America N.A | | $ | 63,681 | | | $ | — | | | $ | — | | | $ | — | | | $ | 63,681 | |
Barclays Bank PLC | | | 1,919,112 | | | | — | | | | — | | | | (470,000 | ) | | | 1,449,112 | |
Citibank N.A | | | 251,337 | | | | — | | | | — | | | | — | | | | 251,337 | |
JPMorgan Chase Bank N.A | | | 15,788 | | | | — | | | | — | | | | — | | | | 15,788 | |
Morgan Stanley & Co. International PLC | | | 13,510,515 | | | | — | | | | — | | | | (7,590,000 | ) | | | 5,920,515 | |
| | | | | | | | | | | | | | | | | | | | |
| | $ | 15,760,433 | | | $ | — | | | $ | — | | | $ | (8,060,000 | ) | | $ | 7,700,433 | |
| | | | | | | | | | | | | | | | | | | | |
| | (a) | Net amount represents the net amount receivable from the counterparty in the event of default. | |
| | (b) | Excess of collateral pledged to the individual counterparty is not shown for financial reporting purposes. | |
| | (c) | Net amount represents the net amount payable due to counterparty in the event of default. | |
| | |
| 58 | | 2 0 2 0 BLACK ROCK ANNUAL REPORT TO SHAREHOLDERS |
| | |
Schedule of Investments (continued) December 31, 2020 | | BlackRock Systematic Multi-Strategy Fund |
Fair Value Hierarchy as of Period End
Various inputs are used in determining the fair value of financial instruments. For a description of the input levels and information about the Fund’s policy regarding valuation of financial instruments, refer to the Notes to Financial Statements.
The following table summarizes the Fund’s investments and derivative financial instruments categorized in the disclosure hierarchy. The breakdown of the Fund’s investments into major categories is disclosed in the Schedule of Investments above.
| | | | | | | | | | | | | | | | |
| | | Level 1 | | | Level 2 | | | Level 3 | | | Total | |
Assets | | | | | | | | | | | | | | | | |
Investments | | | | | | | | | | | | | | | | |
Long-Term Investments | | | | | | | | | | | | | | | | |
Asset-Backed Securities | | $ | — | | | $ | 147,356,797 | | | $ | — | | | $ | 147,356,797 | |
Common Stocks | | | 259,951,004 | | | | — | | | | — | | | | 259,951,004 | |
Corporate Bonds | | | — | | | | 1,389,524,233 | | | | — | | | | 1,389,524,233 | |
Investment Companies | | | 149,989,991 | | | | — | | | | — | | | | 149,989,991 | |
Non-Agency Mortgage-Backed Securities | | | — | | | | 220,554,535 | | | | — | | | | 220,554,535 | |
Preferred Securities | | | | | | | | | | | | | | | | |
Capital Trusts | | | — | | | | 1,309,177 | | | | — | | | | 1,309,177 | |
U.S. Government Sponsored Agency Securities | | | — | | | | 1,754,851,840 | | | | — | | | | 1,754,851,840 | |
U.S. Treasury Obligations | | | — | | | | 20,569,055 | | | | — | | | | 20,569,055 | |
Warrants | | | — | | | | 19,876 | | | | — | | | | 19,876 | |
Short-Term Securities | | | | | | | | | | | | | | | | |
Money Market Funds | | | 284,922,233 | | | | — | | | | — | | | | 284,922,233 | |
Liabilities | | | | | | | | | | | | | | | | |
Investments | | | | | | | | | | | | | | | | |
TBA Sale Commitments | | | — | | | | (80,841,942 | ) | | | — | | | | (80,841,942 | ) |
| | | | | | | | | | | | | | | | |
| | $ | 694,863,228 | | | $ | 3,453,343,571 | | | $ | — | | | $ | 4,148,206,799 | |
| | | | | | | | | | | | | | | | |
Derivative Financial Instruments(a) | | | | | | | | | | | | | | | | |
Assets | | | | | | | | | | | | | | | | |
Equity Contracts | | $ | — | | | $ | 73,453 | | | $ | — | | | $ | 73,453 | |
Interest Rate Contracts | | | 1,631,574 | | | | 305,453 | | | | — | | | | 1,937,027 | |
Liabilities | | | | | | | | | | | | | | | | |
Equity Contracts | | | — | | | | (15,429,627 | ) | | | — | | | | (15,429,627 | ) |
Foreign Currency Exchange Contracts | | | — | | | | (13,055 | ) | | | — | | | | (13,055 | ) |
Interest Rate Contracts | | | (905,940 | ) | | | (704,334 | ) | | | — | | | | (1,610,274 | ) |
| | | | | | | | | | | | | | | | |
| | $ | 725,634 | | | $ | (15,768,110 | ) | | $ | — | | | $ | (15,042,476 | ) |
| | | | | | | | | | | | | | | | |
| | (a) | Derivative financial instruments are swaps, futures contracts and forward foreign currency exchange contracts. Swaps, futures contracts and forward foreign currency exchange contracts are valued at the unrealized appreciation (depreciation) on the instrument. | |
See notes to financial statements.
| | |
SCHEDULE OF INVESTMENTS | | 59 |
Statements of Assets and Liabilities
December 31, 2020
| | | | | | | | | | | | | | | | |
| | | BlackRock
Emerging Markets
Bond Fund | | | BlackRock Systematic
Multi-Strategy Fund | |
| | | | |
ASSETS | | | | | | | | | | | | | | | | |
Investments at value — unaffiliated(a) | | | | | | $ | 23,080,636 | | | | | | | $ | 3,794,136,517 | |
Investments at value — affiliated(b) | | | | | | | 1,056,253 | | | | | | | | 434,912,224 | |
Cash pledged: | | | | | | | | | | | | | | | | |
Collateral — OTC derivatives | | | | | | | — | | | | | | | | 19,100,000 | |
Futures contracts | | | | | | | 55,000 | | | | | | | | 11,565,683 | |
Centrally cleared swaps | | | | | | | — | | | | | | | | 2,358,000 | |
Foreign currency at value(c) | | | | | | | 26,716 | | | | | | | | 6,781,201 | |
Receivables: | | | | | | | | | | | | | | | | |
Investments sold | | | | | | | — | | | | | | | | 316,483 | |
Swaps | | | | | | | 8,119 | | | | | | | | 91,593,635 | |
TBA sale commitments | | | | | | | — | | | | | | | | 80,702,790 | |
Capital shares sold | | | | | | | — | | | | | | | | 29,669,081 | |
Dividends — unaffiliated | | | | | | | — | | | | | | | | 334,310 | |
Dividends — affiliated | | | | | | | 359 | | | | | | | | 5,054 | |
Interest — unaffiliated | | | | | | | 301,350 | | | | | | | | 16,493,773 | |
From the Administrator | | | | | | | 15 | | | | | | | | — | |
From the Manager | | | | | | | 8,429 | | | | | | | | — | |
Variation margin on futures contracts | | | | | | | — | | | | | | | | 450,431 | |
Variation margin on centrally cleared swaps | | | | | | | — | | | | | | | | 8,408 | |
Swap premiums paid | | | | | | | 66,023 | | | | | | | | — | |
Unrealized appreciation on: | | | | | | | | | | | | | | | | |
Forward foreign currency exchange contracts | | | | | | | 39,877 | | | | | | | | — | |
OTC swaps | | | | | | | — | | | | | | | | 73,453 | |
Deferred offering costs | | | | | | | — | | | | | | | | 44,833 | |
Prepaid expenses | | | | | | | 27,232 | | | | | | | | 274,616 | |
| | | | | | | | | | | | | | | | |
Total assets | | | | | | | 24,670,009 | | | | | | | | 4,488,820,492 | |
| | | | | | | | | | | | | | | | |
| | | | |
LIABILITIES | | | | | | | | | | | | | | | | |
Bank overdraft | | | | | | | — | | | | | | | | 279,658 | |
Cash received as collateral for TBA commitments | | | | | | | — | | | | | | | | 1,210,000 | |
TBA sale commitments at value(d) | | | | | | | — | | | | | | | | 80,841,942 | |
Payables: | | | | | | | | | | | | | | | | |
Investments purchased | | | | | | | — | | | | | | | | 1,007,851,307 | |
Swaps | | | | | | | — | | | | | | | | 86,110,875 | |
Accounting services fees | | | | | | | 14,269 | | | | | | | | 138,944 | |
Administration fees | | | | | | | — | | | | | | | | 145,976 | |
Capital shares redeemed | | | | | | | — | | | | | | | | 17,449,588 | |
Income dividend distributions | | | | | | | 95,343 | | | | | | | | 1,961 | |
Investment advisory fees | | | | | | | — | | | | | | | | 2,002,138 | |
Trustees’ and Officer’s fees | | | | | | | 48 | | | | | | | | — | |
Other accrued expenses | | | | | | | 3,877 | | | | | | | | 647,495 | |
Professional fees | | | | | | | 40,580 | | | | | | | | 70,167 | |
Distribution fees | | | | | | | — | | | | | | | | 41,390 | |
Variation margin on futures contracts | | | | | | | 2,757 | | | | | | | | 417,774 | |
Swap premiums received | | | | | | | 695 | | | | | | | | — | |
Unrealized depreciation on: | | | | | | | | | | | | | | | | |
Forward foreign currency exchange contracts | | | | | | | 39,494 | | | | | | | | 13,055 | |
OTC swaps | | | | | | | 40,164 | | | | | | | | 15,747,378 | |
| | | | | | | | | | | | | | | | |
Total liabilities | | | | | | | 237,227 | | | | | | | | 1,212,969,648 | |
| | | | | | | | | | | | | | | | |
| | | | |
NET ASSETS | | | | | | $ | 24,432,782 | | | | | | | $ | 3,275,850,844 | |
| | | | | | | | | | | | | | | | |
| | |
| 60 | | 2 0 2 0 BLACK ROCK ANNUAL REPORT TO SHAREHOLDERS |
Statements of Assets and Liabilities (continued)
December 31, 2020
| | | | | | | | | | | | | | | | |
| | | BlackRock
Emerging Markets
Bond Fund | | | BlackRock Systematic
Multi-Strategy Fund | |
| | | | |
NET ASSETS CONSIST OF | | | | | | | | | | | | | | | | |
Paid-in capital | | | | | | $ | 25,036,859 | | | | | | | $ | 3,286,051,859 | |
Accumulated loss | | | | | | | (604,077 | ) | | | | | | | (10,201,015 | ) |
| | | | | | | | | | | | | | | | |
NET ASSETS | | | | | | $ | 24,432,782 | | | | | | | $ | 3,275,850,844 | |
| | | | | | | | | | | | | | | | |
| | | | |
(a) Investments at cost — unaffiliated | | | | | | $ | 22,145,615 | | | | | | | $ | 3,716,211,391 | |
(b) Investments at cost — affiliated | | | | | | $ | 1,056,253 | | | | | | | $ | 434,972,145 | |
(c) Foreign currency at cost | | | | | | $ | 26,874 | | | | | | | $ | 6,540,067 | |
(d) Proceeds from TBA sale commitments | | | | | | $ | — | | | | | | | $ | 80,559,144 | |
Statements of Assets and Liabilities (continued)
December 31, 2020
| | | | | | | | | | | | | | | | | | | | |
| | | BlackRock
Emerging Markets
Bond Fund | | BlackRock Systematic
Multi-Strategy Fund |
| | | | |
NET ASSET VALUE | | | | | | | | | | | | | | | | | | | | |
Institutional | | | | | | | | | | | | | | | | | | | | |
Net assets | | | | | | | | $ | 145,675 | | | | | | | | | $ | 3,091,297,699 | |
| | | | | | | | | | | | | | | | | | | | |
| | | | |
Shares outstanding | | | | | | | | | 14,964 | | | | | | | | | | 306,058,447 | |
| | | | | | | | | | | | | | | | | | | | |
| | | | |
Net asset value | | | | | | | | $ | 9.74 | | | | | | | | | $ | 10.10 | |
| | | | | | | | | | | | | | | | | | | | |
| | | | |
Shares authorized | | | | | | | | | Unlimited | | | | | | | | | | Unlimited | |
| | | | | | | | | | | | | | | | | | | | |
| | | | |
Par value | | | | | | | | $ | 0.001 | | | | | | | | | $ | 0.001 | |
| | | | | | | | | | | | | | | | | | | | |
| | | | |
Investor A | | | | | | | | | | | | | | | | | | | | |
Net assets | | | | | | | | | N/A | | | | | | | | | $ | 179,389,276 | |
| | | | | | | | | | | | | | | | | | | | |
| | | | |
Shares outstanding | | | | | | | | | N/A | | | | | | | | | | 17,785,662 | |
| | | | | | | | | | | | | | | | | | | | |
| | | | |
Net asset value | | | | | | | | | N/A | | | | | | | | | $ | 10.09 | |
| | | | | | | | | | | | | | | | | | | | |
| | | | |
Shares authorized | | | | | | | | | N/A | | | | | | | | | | Unlimited | |
| | | | | | | | | | | | | | | | | | | | |
| | | | |
Par value | | | | | | | | | N/A | | | | | | | | | $ | 0.001 | |
| | | | | | | | | | | | | | | | | | | | |
| | | | |
Investor C | | | | | | | | | | | | | | | | | | | | |
Net assets | | | | | | | | | N/A | | | | | | | | | $ | 4,867,501 | |
| | | | | | | | | | | | | | | | | | | | |
| | | | |
Shares outstanding | | | | | | | | | N/A | | | | | | | | | | 484,112 | |
| | | | | | | | | | | | | | | | | | | | |
| | | | |
Net asset value | | | | | | | | | N/A | | | | | | | | | $ | 10.05 | |
| | | | | | | | | | | | | | | | | | | | |
| | | | |
Shares authorized | | | | | | | | | N/A | | | | | | | | | | Unlimited | |
| | | | | | | | | | | | | | | | | | | | |
| | | | |
Par value | | | | | | | | | N/A | | | | | | | | | $ | 0.001 | |
| | | | | | | | | | | | | | | | | | | | |
| | | | |
Class K | | | | | | | | | | | | | | | | | | | | |
Net assets | | | | | | | | $ | 24,287,107 | | | | | | | | | $ | 296,368 | |
| | | | | | | | | | | | | | | | | | | | |
| | | | |
Shares outstanding | | | | | | | | | 2,495,000 | | | | | | | | | | 29,354 | |
| | | | | | | | | | | | | | | | | | | | |
| | | | |
Net asset value | | | | | | | | $ | 9.73 | | | | | | | | | $ | 10.10 | |
| | | | | | | | | | | | | | | | | | | | |
| | | | |
Shares authorized | | | | | | | | | Unlimited | | | | | | | | | | Unlimited | |
| | | | | | | | | | | | | | | | | | | | |
| | | | |
Par value | | | | | | | | $ | 0.001 | | | | | | | | | $ | 0.001 | |
| | | | | | | | | | | | | | | | | | | | |
See notes to financial statements.
| | |
| 62 | | 2 0 2 0 BLACK ROCK ANNUAL REPORT TO SHAREHOLDERS |
Statements of Operations
Year Ended December 31, 2020
| | | | | | | | | | | | | | | | |
| | | BlackRock
Emerging Markets
Bond Fund | | | BlackRock Systematic
Multi-Strategy Fund | |
| | | | |
INVESTMENT INCOME | | | | | | | | | | | | | | | | |
Dividends — unaffiliated | | | | | | $ | — | | | | | | | $ | 3,021,898 | |
Dividends — affiliated | | | | | | | 3,183 | | | | | | | | 763,788 | |
Interest — unaffiliated | | | | | | | 1,176,650 | | | | | | | | 34,166,389 | |
Foreign taxes withheld | | | | | | | (6,231 | ) | | | | | | | — | |
| | | | | | | | | | | | | | | | |
Total investment income | | | | | | | 1,173,602 | | | | | | | | 37,952,075 | |
| | | | | | | | | | | | | | | | |
| | | | |
EXPENSES | | | | | | | | | | | | | | | | |
Investment advisory | | | | | | | 126,277 | | | | | | | | 12,604,938 | |
Professional | | | | | | | 95,829 | | | | | | | | 151,035 | |
Registration | | | | | | | 49,403 | | | | | | | | 183,876 | |
Printing and postage | | | | | | | 35,333 | | | | | | | | 51,660 | |
Accounting services | | | | | | | 17,480 | | | | | | | | 180,556 | |
Custodian | | | | | | | 11,575 | | | | | | | | 159,120 | |
Administration | | | | | | | 9,758 | | | | | | | | 637,526 | |
Administration — class specific | | | | | | | 4,592 | | | | | | | | 324,169 | |
Trustees and Officer | | | | | | | 1,578 | | | | | | | | 15,763 | |
Transfer agent — class specific | | | | | | | 198 | | | | | | | | 1,697,090 | |
Offering | | | | | | | — | | | | | | | | 15,329 | |
Distribution — class specific | | | | | | | — | | | | | | | | 320,757 | |
Miscellaneous | | | | | | | 12,196 | | | | | | | | 162,298 | |
| | | | | | | | | | | | | | | | |
| | | | |
Total expenses | | | | | | | 364,219 | | | | | | | | 16,504,117 | |
Less: | | | | | | | | | | | | | | | | |
Administration fees waived—class specific | | | | | | | (4,592 | ) | | | | | | | (262,196 | ) |
Fees waived and/or reimbursed by the Administrator | | | | | | | (9,770 | ) | | | | | | | — | |
Fees waived and/or reimbursed by the Manager | | | | | | | (214,141 | ) | | | | | | | (208,080 | ) |
Transfer agent fees waived and/or reimbursed — class specific | | | | | | | (125 | ) | | | | | | | (361,172 | ) |
| | | | | | | | | | | | | | | | |
| | | | |
Total expenses after fees waived and/or reimbursed | | | | | | | 135,591 | | | | | | | | 15,672,669 | |
| | | | | | | | | | | | | | | | |
| | | | |
Net investment income | | | | | | | 1,038,011 | | | | | | | | 22,279,406 | |
| | | | | | | | | | | | | | | | |
| | | | |
REALIZED AND UNREALIZED GAIN (LOSS) | | | | | | | | | | | | | | | | |
Net realized gain (loss) from: | | | | | | | | | | | | | | | | |
Investments — unaffiliated | | | | | | | (846,025 | ) | | | | | | | 3,384,925 | |
Foreign currency transactions | | | | | | | (7,709 | ) | | | | | | | 158,507 | |
Forward foreign currency exchange contracts | | | | | | | 273,606 | | | | | | | | (54,373 | ) |
Futures contracts | | | | | | | (30,750 | ) | | | | | | | (5,389,812 | ) |
Swaps | | | | | | | 60,931 | | | | | | | | (55,745,174 | ) |
| | | | | | | | | | | | | | | | |
| | | | | | | (549,947 | ) | | | | | | | (57,645,927 | ) |
| | | | | | | | | | | | | | | | |
Net change in unrealized appreciation (depreciation) on: | | | | | | | | | | | | | | | | |
Investments — unaffiliated | | | | | | | 1,214,112 | | | | | | | | 74,163,292 | |
Investments — affiliated | | | | | | | — | | | | | | | | (59,921 | ) |
Foreign currency translations | | | | | | | (1,117 | ) | | | | | | | 237,854 | |
Forward foreign currency exchange contracts | | | | | | | (32,794 | ) | | | | | | | (8,023 | ) |
Futures contracts | | | | | | | (25,815 | ) | | | | | | | 829,901 | |
Swaps | | | | | | | (10,343 | ) | | | | | | | (15,565,623 | ) |
| | | | | | | | | | | | | | | | |
| | | | | | | 1,144,043 | | | | | | | | 59,597,480 | |
| | | | | | | | | | | | | | | | |
Net realized and unrealized gain | | | | | | | 594,096 | | | | | | | | 1,951,553 | |
| | | | | | | | | | | | | | | | |
| | | | |
NET INCREASE IN NET ASSETS RESULTING FROM OPERATIONS | | | | | | $ | 1,632,107 | | | | | | | $ | 24,230,959 | |
| | | | | | | | | | | | | | | | |
See notes to financial statements.
Statements of Changes in Net Assets
| | | | | | | | | | | | | | | | | | | | |
| | | BlackRock Emerging Markets Bond Fund | | BlackRock Systematic
Multi-Strategy Fund |
| | | Year Ended December 31, | | Year Ended December 31, |
| | | 2020 | | 2019 | | 2020 | | 2019 |
| | | | |
INCREASE (DECREASE) IN NET ASSETS | | | | | | | | | | | | | | | | | | | | |
| | | | |
OPERATIONS | | | | | | | | | | | | | | | | | | | | |
Net investment income | | | $ | 1,038,011 | | | | $ | 1,157,019 | | | | $ | 22,279,406 | | | | $ | 3,068,186 | |
Net realized gain (loss) | | | | (549,947 | ) | | | | 273,535 | | | | | (57,645,927 | ) | | | | 896,449 | |
Net change in unrealized appreciation | | | | 1,144,043 | | | | | 1,655,788 | | | | | 59,597,480 | | | | | 2,769,684 | |
| | | | | | | | | | | | | | | | | | | | |
Net increase in net assets resulting from operations | | | | 1,632,107 | | | | | 3,086,342 | | | | | 24,230,959 | | | | | 6,734,319 | |
| | | | | | | | | | | | | | | | | | | | |
| | | | |
DISTRIBUTIONS TO SHAREHOLDERS(a) | | | | | | | | | | | | | | | | | | | | |
From net investment income | | | | | | | | | | | | | | | | | | | | |
Institutional | | | | (5,005 | ) | | | | (2,330 | ) | | | | (26,669,101 | ) | | | | (7,814,178 | ) |
Investor A | | | | — | | | | | — | | | | | (1,467,609 | ) | | | | (2,122,057 | ) |
Investor C | | | | — | | | | | — | | | | | (18,725 | ) | | | | (7,685 | ) |
Class K | | | | (1,270,431 | ) | | | | (1,183,568 | ) | | | | (1,792 | ) | | | | — | |
Return of capital | | | | | | | | | | | | | | | | | | | | |
Institutional | | | | — | | | | | — | | | | | (778,698 | ) | | | | — | |
Investor A | | | | — | | | | | — | | | | | (63,207 | ) | | | | — | |
Investor C | | | | — | | | | | — | | | | | (877 | ) | | | | — | |
Class K | | | | — | | | | | — | | | | | (154 | ) | | | | — | |
| | | | | | | | | | | | | | | | | | | | |
Decrease in net assets resulting from distributions to shareholders | | | | (1,275,436 | ) | | | | (1,185,898 | ) | | | | (29,000,163 | ) | | | | (9,943,920 | ) |
| | | | | | | | | | | | | | | | | | | | |
| | | | |
CAPITAL SHARE TRANSACTIONS | | | | | | | | | | | | | | | | | | | | |
Net increase in net assets derived from capital share transactions | | | | 89,843 | | | | | — | | | | | 2,927,997,601 | | | | | 320,071,947 | |
| | | | | | | | | | | | | | | | | | | | |
| | | | |
NET ASSETS | | | | | | | | | | | | | | | | | | | | |
Total increase in net assets | | | | 446,514 | | | | | 1,900,444 | | | | | 2,923,228,397 | | | | | 316,862,346 | |
Beginning of year | | | | 23,986,268 | | | | | 22,085,824 | | | | | 352,622,447 | | | | | 35,760,101 | |
| | | | | | | | | | | | | | | | | | | | |
End of year | | | $ | 24,432,782 | | | | $ | 23,986,268 | | | | $ | 3,275,850,844 | | | | $ | 352,622,447 | |
| | | | | | | | | | | | | | | | | | | | |
| (a) | Distributions for annual periods determined in accordance with U.S. federal income tax regulations. |
See notes to financial statements.
| | |
| 64 | | 2 0 2 0 BLACK ROCK ANNUAL REPORT TO SHAREHOLDERS |
Financial Highlights
(For a share outstanding throughout each period)
| | | | | | | | | | | | | | | | | | | | |
| | | BlackRock Emerging Markets Bond Fund |
| | | Institutional |
| | | Year Ended December 31, | | Period from
07/27/17(a)
to 12/31/17 |
| | | 2020 | | 2019 | | 2018 |
Net asset value, beginning of period | | | $ | 9.59 | | | | $ | 8.83 | | | | $ | 9.93 | | | | $ | 10.00 | |
| | | | | | | | | | | | | | | | | | | | |
| | | | |
Net investment income(b) | | | | 0.41 | | | | | 0.46 | | | | | 0.37 | | | | | 0.21 | |
Net realized and unrealized gain (loss) | | | | 0.24 | | | | | 0.77 | | | | | (0.95 | ) | | | | (0.06 | ) |
| | | | | | | | | | | | | | | | | | | | |
| | | | |
Net increase (decrease) from investment operations | | | | 0.65 | | | | | 1.23 | | | | | (0.58 | ) | | | | 0.15 | |
| | | | | | | | | | | | | | | | | | | | |
| | | | |
Distributions from net investment income(c) | | | | (0.50 | ) | | | | (0.47 | ) | | | | (0.52 | ) | | | | (0.22 | ) |
| | | | | | | | | | | | | | | | | | | | |
| | | | |
Net asset value, end of period | | | $ | 9.74 | | | | $ | 9.59 | | | | $ | 8.83 | | | | $ | 9.93 | |
| | | | | | | | | | | | | | | | | | | | |
| | | | |
Total Return(d) | | | | | | | | | | | | | | | | | | | | |
Based on net asset value | | | | 7.20 | % | | | | 14.07 | % | | | | (5.95 | )% | | | | 1.53 | %(e) |
| | | | | | | | | | | | | | | | | | | | |
| | | | |
Ratios to Average Net Assets(f) | | | | | | | | | | | | | | | | | | | | |
Total expenses | | | | 1.72 | % | | | | 1.58 | % | | | | 1.86 | % | | | | 1.35 | %(g)(h) |
| | | | | | | | | | | | | | | | | | | | |
| | | | |
Total expenses after fees waived and/or reimbursed | | | | 0.68 | % | | | | 0.68 | % | | | | 0.67 | % | | | | 0.65 | %(g) |
| | | | | | | | | | | | | | | | | | | | |
| | | | |
Net investment income | | | | 4.43 | % | | | | 4.81 | % | | | | 3.95 | % | | | | 4.93 | %(g) |
| | | | | | | | | | | | | | | | | | | | |
| | | | |
Supplemental Data | | | | | | | | | | | | | | | | | | | | |
Net assets, end of period (000) | | | $ | 146 | | | | $ | 48 | | | | $ | 44 | | | | $ | 50 | |
| | | | | | | | | | | | | | | | | | | | |
| | | | |
Portfolio turnover rate | | | | 80 | % | | | | 68 | % | | | | 59 | % | | | | 23 | % |
| | | | | | | | | | | | | | | | | | | | |
| (a) | Commencement of operations. |
| (b) | Based on average shares outstanding. |
| (c) | Distributions for annual periods determined in accordance with U.S. federal income tax regulations. |
| (d) | Where applicable, assumes the reinvestment of distributions. |
| (e) | Aggregate total return. |
| (f) | Excludes expenses incurred indirectly as a result of investments in underlying funds as follows: |
| | | | | | | | | | | | | | | | |
| | | Year Ended December 31, | | | Period from
07/27/17to 12/31/17 | |
| | | 2020 | | | 2019 | | | 2018 | |
Investments in underlying funds | | | 0.01 | % | | | 0.01 | % | | | — | % | | | 0.02 | % |
| | | | | | | | | | | | | | | | |
| (h) | Audit, offering and organization costs were not annualized in the calculation of the expense ratios. If these expenses were annualized, the total expenses would have been 2.03%. |
See notes to financial statements.
Financial Highlights (continued)
(For a share outstanding throughout each period)
| | | | | | | | | | | | | | | | | | | | |
| | | BlackRock Emerging Markets Bond Fund (continued) |
| | | Class K |
| | | Year Ended December 31, | | Period from
07/27/17(a)
to 12/31/17 |
| | | 2020 | | 2019 | | 2018 |
Net asset value, beginning of period | | | $ | 9.59 | | | | $ | 8.83 | | | | $ | 9.93 | | | | $ | 10.00 | |
| | | | | | | | | | | | | | | | | | | | |
Net investment income(b) | | | | 0.41 | | | | | 0.46 | | | | | 0.38 | | | | | 0.21 | |
Net realized and unrealized gain (loss) | | | | 0.23 | | | | | 0.77 | | | | | (0.96 | ) | | | | (0.06 | ) |
| | | | | | | | | | | | | | | | | | | | |
| | | | |
Net increase (decrease) from investment operations | | | | 0.64 | | | | | 1.23 | | | | | (0.58 | ) | | | | 0.15 | |
| | | | | | | | | | | | | | | | | | | | |
| | | | |
Distributions from net investment income(c) | | | | (0.50 | ) | | | | (0.47 | ) | | | | (0.52 | ) | | | | (0.22 | ) |
| | | | | | | | | | | | | | | | | | | | |
| | | | |
Net asset value, end of period | | | $ | 9.73 | | | | $ | 9.59 | | | | $ | 8.83 | | | | $ | 9.93 | |
| | | | | | | | | | | | | | | | | | | | |
| | | | |
Total Return(d) | | | | | | | | | | | | | | | | | | | | |
Based on net asset value | | | | 7.18 | % | | | | 14.17 | % | | | | (5.87 | )% | | | | 1.55 | %(e) |
| | | | | | | | | | | | | | | | | | | | |
| | | | |
Ratios to Average Net Assets(f) | | | | | | | | | | | | | | | | | | | | |
Total expenses | | | | 1.59 | % | | | | 1.45 | % | | | | 1.70 | % | | | | 1.31 | %(g)(h) |
| | | | | | | | | | | | | | | | | | | | |
| | | | |
Total expenses after fees waived and/or reimbursed | | | | 0.59 | % | | | | 0.59 | % | | | | 0.59 | % | | | | 0.59 | %(g) |
| | | | | | | | | | | | | | | | | | | | |
| | | | |
Net investment income | | | | 4.52 | % | | | | 4.90 | % | | | | 4.03 | % | | | | 4.98 | %(g) |
| | | | | | | | | | | | | | | | | | | | |
| | | | |
Supplemental Data | | | | | | | | | | | | | | | | | | | | |
Net assets, end of period (000) | | | $ | 24,287 | | | | $ | 23,938 | | | | $ | 22,042 | | | | $ | 24,770 | |
| | | | | | | | | | | | | | | | | | | | |
| | | | |
Portfolio turnover rate | | | | 80 | % | | | | 68 | % | | | | 59 | % | | | | 23 | % |
| | | | | | | | | | | | | | | | | | | | |
| (a) | Commencement of operations. |
| (b) | Based on average shares outstanding. |
| (c) | Distributions for annual periods determined in accordance with U.S. federal income tax regulations. |
| (d) | Where applicable, assumes the reinvestment of distributions. |
| (e) | Aggregate total return. |
| (f) | Excludes expenses incurred indirectly as a result of investments in underlying funds as follows: |
| | | | | | | | | | | | | | | | |
| | | Year Ended December 31, | | | Period from
07/27/17
to 12/31/17 | |
| | | 2020 | | | 2019 | | | 2018 | |
Investments in underlying funds | | | 0.01 | % | | | 0.01 | % | | | — | % | | | 0.02 | % |
| | | | | | | | | | | | | | | | |
| (h) | Audit, offering and organization costs were not annualized in the calculation of the expense ratios. If these expenses were annualized, the total expenses would have been 1.98%. |
See notes to financial statements.
| | |
| 66 | | 2 0 2 0 BLACK ROCK ANNUAL REPORT TO SHAREHOLDERS |
Financial Highlights (continued)
(For a share outstanding throughout each period)
| | | | | | | | | | | | | | | | | | | | |
| | | BlackRock Systematic Multi-Strategy Fund | |
| | | Institutional | |
| | | Year Ended December 31, | |
| | | 2020 | | | 2019 | | | 2018 | | | 2017 | | | 2016 | |
Net asset value, beginning of year | | $ | 9.88 | | | $ | 9.47 | | | $ | 10.15 | | | $ | 9.61 | | | $ | 9.53 | |
| | | | | | | | | | | | | | | | | | | | |
Net investment income(a) | | | 0.14 | | | | 0.23 | | | | 0.29 | | | | 0.22 | | | | 0.16 | |
Net realized and unrealized gain (loss) | | | 0.21 | | | | 0.56 | | | | (0.12 | ) | | | 0.73 | | | | 0.40 | |
| | | | | | | | | | | | | | | | | | | | |
| | | | | |
Net increase from investment operations | | | 0.35 | | | | 0.79 | | | | 0.17 | | | | 0.95 | | | | 0.56 | |
| | | | | | | | | | | | | | | | | | | | |
| | | | | |
Distributions(b) | | | | | | | | | | | | | | | | | | | | |
From net investment income | | | (0.13 | ) | | | (0.18 | ) | | | (0.29 | ) | | | (0.22 | ) | | | (0.16 | ) |
From net realized gain | | | (0.00 | )(c) | | | (0.20 | ) | | | (0.56 | ) | | | (0.19 | ) | | | (0.32 | ) |
Return of capital | | | (0.00 | )(c) | | | — | | | | — | | | | — | | | | — | |
| | | | | | | | | | | | | | | | | | | | |
| | | | | |
Total distributions | | | (0.13 | ) | | | (0.38 | ) | | | (0.85 | ) | | | (0.41 | ) | | | (0.48 | ) |
| | | | | | | | | | | | | | | | | | | | |
| | | | | |
Net asset value, end of year | | $ | 10.10 | | | $ | 9.88 | | | $ | 9.47 | | | $ | 10.15 | | | $ | 9.61 | |
| | | | | | | | | | | | | | | | | | | | |
| | | | | |
Total Return(d) | | | | | | | | | | | | | | | | | | | | |
Based on net asset value | | | 3.57 | % | | | 8.43 | % | | | 1.74 | % | | | 10.00 | % | | | 5.91 | % |
| | | | | | | | | | | | | | | | | | | | |
| | | | | |
Ratios to Average Net Assets(e) | | | | | | | | | | | | | | | | | | | | |
Total expenses | | | 0.99 | % | | | 1.29 | % | | | 2.33 | % | | | 2.16 | % | | | 2.24 | % |
| | | | | | | | | | | | | | | | | | | | |
| | | | | |
Total expenses after fees waived and/or reimbursed | | | 0.95 | % | | | 0.95 | % | | | 0.95 | % | | | 0.95 | % | | | 1.19 | % |
| | | | | | | | | | | | | | | | | | | | |
| | | | | |
Total expenses after fees waived and/or reimbursed and excluding excise tax | | | 0.95 | % | | | 0.95 | % | | | 0.95 | % | | | 0.95 | % | | | 1.18 | % |
| | | | | | | | | | | | | | | | | | | | |
| | | | | |
Net investment income | | | 1.38 | % | | | 2.27 | % | | | 2.93 | % | | | 2.19 | % | | | 1.64 | % |
| | | | | | | | | | | | | | | | | | | | |
| | | | | |
Supplemental Data | | | | | | | | | | | | | | | | | | | | |
Net assets, end of year (000) | | $ | 3,091,298 | | | $ | 277,782 | | | $ | 32,961 | | | $ | 27,328 | | | $ | 25,588 | |
| | | | | | | | | | | | | | | | | | | | |
| | | | | |
Portfolio turnover rate(f)(g) | | | 503 | % | | | 442 | % | | | 426 | % | | | 424 | % | | | 722 | % |
| | | | | | | | | | | | | | | | | | | | |
| (a) | Based on average shares outstanding. |
| (b) | Distributions for annual periods determined in accordance with U.S. federal income tax regulations. |
| (c) | Amount is greater than $(0.005) per share. |
| (d) | Where applicable, assumes the reinvestment of distributions. |
| (e) | Excludes expenses incurred indirectly as a result of investments in underlying funds as follows: |
| | | | | | | | | | | | | | | | | | | | |
| | | Year Ended December 31, | |
| | | 2020 | | | 2019 | | | 2018 | | | 2017 | | | 2016 | |
Investments in underlying funds | | | 0.03 | % | | | 0.02 | % | | | 0.01 | % | | | 0.00 | % | | | 0.02 | % |
| | | | | | | | | | | | | | | | | | | | |
| (f) | Includes mortgage dollar roll transactions (“MDRs”). Additional information regarding portfolio turnover rate is as follows: |
| | | | | | | | | | | | | | | | | | | | |
| | | Year Ended December 31, | |
| | | 2020 | | | 2019 | | | 2018 | | | 2017 | | | 2016 | |
Portfolio turnover rate (excluding MDRs) | | | 258 | % | | | 267 | % | | | 220 | % | | | 251 | % | | | 488 | % |
| | | | | | | | | | | | | | | | | | | | |
| (g) | Excludes investments underlying the total return swaps. |
See notes to financial statements.
Financial Highlights (continued)
(For a share outstanding throughout each period)
| | | | | | | | | | | | | | | | | | | | |
| | | BlackRock Systematic Multi-Strategy Fund (continued) | |
| | | Investor A | |
| | | Year Ended December 31, | |
| | | 2020 | | | 2019 | | | 2018 | | | 2017 | | | 2016 | |
Net asset value, beginning of year | | $ | 9.87 | | | $ | 9.46 | | | $ | 10.15 | | | $ | 9.60 | | | $ | 9.53 | |
| | | | | | | | | | | | | | | | | | | | |
Net investment income(a) | | | 0.14 | | | | 0.20 | | | | 0.22 | | | | 0.19 | | | | 0.14 | |
Net realized and unrealized gain (loss) | | | 0.19 | | | | 0.58 | | | | (0.09 | ) | | | 0.74 | | | | 0.39 | |
| | | | | | | | | | | | | | | | | | | | |
| | | | | |
Net increase from investment operations | | | 0.33 | | | | 0.78 | | | | 0.13 | | | | 0.93 | | | | 0.53 | |
| | | | | | | | | | | | | | | | | | | | |
| | | | | |
Distributions(b) | | | | | | | | | | | | | | | | | | | | |
From net investment income | | | (0.11 | ) | | | (0.17 | ) | | | (0.26 | ) | | | (0.19 | ) | | | (0.14 | ) |
From net realized gain | | | (0.00 | )(c) | | | (0.20 | ) | | | (0.56 | ) | | | (0.19 | ) | | | (0.32 | ) |
Return of capital | | | (0.00 | )(c) | | | — | | | | — | | | | — | | | | — | |
| | | | | | | | | | | | | | | | | | | | |
| | | | | |
Total distributions | | | (0.11 | ) | | | (0.37 | ) | | | (0.82 | ) | | | (0.38 | ) | | | (0.46 | ) |
| | | | | | | | | | | | | | | | | | | | |
| | | | | |
Net asset value, end of year | | $ | 10.09 | | | $ | 9.87 | | | $ | 9.46 | | | $ | 10.15 | | | $ | 9.60 | |
| | | | | | | | | | | | | | | | | | | | |
| | | | | |
Total Return(d) | | | | | | | | | | | | | | | | | | | | |
Based on net asset value | | | 3.34 | % | | | 8.25 | % | | | 1.41 | % | | | 9.83 | % | | | 5.61 | % |
| | | | | | | | | | | | | | | | | | | | |
| | | | | |
Ratios to Average Net Assets(e) | | | | | | | | | | | | | | | | | | | | |
Total expenses | | | 1.31 | % | | | 1.60 | % | | | 2.73 | % | | | 2.63 | % | | | 2.75 | % |
| | | | | | | | | | | | | | | | | | | | |
| | | | | |
Total expenses after fees waived and/or reimbursed | | | 1.20 | % | | | 1.20 | % | | | 1.20 | % | | | 1.20 | % | | | 1.42 | % |
| | | | | | | | | | | | | | | | | | | | |
| | | | | |
Total expenses after fees waived and/or reimbursed and excluding excise tax | | | 1.20 | % | | | 1.20 | % | | | 1.20 | % | | | 1.20 | % | | | 1.42 | % |
| | | | | | | | | | | | | | | | | | | | |
| | | | | |
Net investment income | | | 1.34 | % | | | 1.95 | % | | | 2.21 | % | | | 1.94 | % | | | 1.46 | % |
| | | | | | | | | | | | | | | | | | | | |
| | | | | |
Supplemental Data | | | | | | | | | | | | | | | | | | | | |
Net assets, end of year (000) | | $ | 179,389 | | | $ | 74,536 | | | $ | 2,725 | | | $ | 1,469 | | | $ | 2,439 | |
| | | | | | | | | | | | | | | | | | | | |
| | | | | |
Portfolio turnover rate(f)(g) | | | 503 | % | | | 442 | % | | | 426 | % | | | 424 | % | | | 722 | % |
| | | | | | | | | | | | | | | | | | | | |
| (a) | Based on average shares outstanding. |
| (b) | Distributions for annual periods determined in accordance with U.S. federal income tax regulations. |
| (c) | Amount is greater than $(0.005) per share. |
| (d) | Where applicable, excludes the effects of any sales charges and assumes the reinvestment of distributions. |
| (e) | Excludes expenses incurred indirectly as a result of investments in underlying funds as follows: |
| | | | | | | | | | | | | | | | | | | | |
| | | Year Ended December 31, | |
| | | 2020 | | | 2019 | | | 2018 | | | 2017 | | | 2016 | |
Investments in underlying funds | | | 0.03 | % | | | 0.02 | % | | | 0.01 | % | | | 0.00 | % | | | 0.02 | % |
| | | | | | | | | | | | | | | | | | | | |
| (f) | Includes mortgage dollar roll transactions (“MDRs”). Additional information regarding portfolio turnover rate is as follows: |
| | | | | | | | | | | | | | | | | | | | |
| | | Year Ended December 31, | |
| | | 2020 | | | 2019 | | | 2018 | | | 2017 | | | 2016 | |
Portfolio turnover rate (excluding MDRs) | | | 258 | % | | | 267 | % | | | 220 | % | | | 251 | % | | | 488 | % |
| | | | | | | | | | | | | | | | | | | | |
| (g) | Excludes investments underlying the total return swaps. |
See notes to financial statements.
| | |
| 68 | | 2 0 2 0 BLACK ROCK ANNUAL REPORT TO SHAREHOLDERS |
Financial Highlights (continued)
(For a share outstanding throughout each period)
| | | | | | | | | | | | | | | | | | | | |
| | | BlackRock Systematic Multi-Strategy Fund (continued) | |
| | | Investor C | |
| | | Year Ended December 31, | |
| | | 2020 | | | 2019 | | | 2018 | | | 2017 | | | 2016 | |
Net asset value, beginning of year | | $ | 9.87 | | | $ | 9.47 | | | $ | 10.16 | | | $ | 9.58 | | | $ | 9.51 | |
| | | | | | | | | | | | | | | | | | | | |
Net investment income(a) | | | 0.01 | | | | 0.08 | | | | 0.20 | | | | 0.12 | | | | 0.06 | |
Net realized and unrealized gain (loss) | | | 0.24 | | | | 0.62 | | | | (0.14 | ) | | | 0.73 | | | | 0.40 | |
| | | | | | | | | | | | | | | | | | | | |
| | | | | |
Net increase from investment operations | | | 0.25 | | | | 0.70 | | | | 0.06 | | | | 0.85 | | | | 0.46 | |
| | | | | | | | | | | | | | | | | | | | |
| | | | | |
Distributions(b) | | | | | | | | | | | | | | | | | | | | |
From net investment income | | | (0.07 | ) | | | (0.10 | ) | | | (0.19 | ) | | | (0.08 | ) | | | (0.07 | ) |
From net realized gain | | | (0.00 | )(c) | | | (0.20 | ) | | | (0.56 | ) | | | (0.19 | ) | | | (0.32 | ) |
Return of capital | | | (0.00 | )(c) | | | — | | | | — | | | | — | | | | — | |
| | | | | | | | | | | | | | | | | | | | |
| | | | | |
Total distributions | | | (0.07 | ) | | | (0.30 | ) | | | (0.75 | ) | | | (0.27 | ) | | | (0.39 | ) |
| | | | | | | | | | | | | | | | | | | | |
| | | | | |
Net asset value, end of year | | $ | 10.05 | | | $ | 9.87 | | | $ | 9.47 | | | $ | 10.16 | | | $ | 9.58 | |
| | | | | | | | | | | | | | | | | | | | |
| | | | | |
Total Return(d) | | | | | | | | | | | | | | | | | | | | |
Based on net asset value | | | 2.55 | % | | | 7.43 | % | | | 0.65 | % | | | 8.97 | % | | | 4.82 | % |
| | | | | | | | | | | | | | | | | | | | |
| | | | | |
Ratios to Average Net Assets(e) | | | | | | | | | | | | | | | | | | | | |
Total expenses | | | 2.07 | % | | | 2.51 | % | | | 3.48 | % | | | 3.30 | % | | | 3.43 | % |
| | | | | | | | | | | | | | | | | | | | |
| | | | | |
Total expenses after fees waived and/or reimbursed | | | 1.95 | % | | | 1.95 | % | | | 1.95 | % | | | 1.95 | % | | | 2.19 | % |
| | | | | | | | | | | | | | | | | | | | |
| | | | | |
Total expenses after fees waived and/or reimbursed and excluding excise tax | | | 1.95 | % | | | 1.95 | % | | | 1.95 | % | | | 1.95 | % | | | 2.18 | % |
| | | | | | | | | | | | | | | | | | | | |
| | | | | |
Net investment income | | | 0.10 | % | | | 0.76 | % | | | 2.01 | % | | | 1.18 | % | | | 0.64 | % |
| | | | | | | | | | | | | | | | | | | | |
| | | | | |
Supplemental Data | | | | | | | | | | | | | | | | | | | | |
Net assets, end of year (000) | | $ | 4,868 | | | $ | 305 | | | $ | 75 | | | $ | 67 | | | $ | 193 | |
| | | | | | | | | | | | | | | | | | | | |
| | | | | |
Portfolio turnover rate(f)(g) | | | 503 | % | | | 442 | % | | | 426 | % | | | 424 | % | | | 722 | % |
| | | | | | | | | | | | | | | | | | | | |
| (a) | Based on average shares outstanding. |
| (b) | Distributions for annual periods determined in accordance with U.S. federal income tax regulations. |
| (c) | Amount is greater than $(0.005) per share. |
| (d) | Where applicable, excludes the effects of any sales charges and assumes the reinvestment of distributions. |
| (e) | Excludes expenses incurred indirectly as a result of investments in underlying funds as follows: |
| | | | | | | | | | | | | | | | | | | | |
| | | Year Ended December 31, | |
| | | 2020 | | | 2019 | | | 2018 | | | 2017 | | | 2016 | |
Investments in underlying funds | | | 0.03 | % | | | 0.02 | % | | | 0.01 | % | | | 0.00 | % | | | 0.02 | % |
| | | | | | | | | | | | | | | | | | | | |
| (f) | Includes mortgage dollar roll transactions (“MDRs”). Additional information regarding portfolio turnover rate is as follows: |
| | | | | | | | | | | | | | | | | | | | |
| | | Year Ended December 31 | |
| | | 2020 | | | 2019 | | | 2018 | | | 2017 | | | 2016 | |
Portfolio turnover rate (excluding MDRs) | | | 258 | % | | | 267 | % | | | 220 | % | | | 251 | % | | | 488 | % |
| | | | | | | | | | | | | | | | | | | | |
| (g) | Excludes investments underlying the total return swaps. |
See notes to financial statements.
Financial Highlights (continued)
(For a share outstanding throughout each period)
| | | | | | | | | | |
| | | BlackRock Systematic Multi-Strategy Fund (continued) |
| | | | Class K | |
| | | |
| Period from
09/29/20(a) to 12/31/20 |
|
Net asset value, beginning of period | | | | | | | | $ | 10.22 | |
| | | | | | | | | | |
Net investment income(b) | | | | | | | | | 0.01 | |
Net realized and unrealized loss | | | | | | | | | (0.06 | ) |
| | | | | | | | | | |
| | |
Net decrease from investment operations | | | | | | | | | (0.05 | ) |
| | | | | | | | | | |
| | |
Distributions(c) | | | | | | | | | | |
Distributions from net investment income | | | | | | | | | (0.07 | ) |
From net realized gain | | | | | | | | | (0.00 | )(d) |
Return of capital | | | | | | | | | (0.00 | )(d) |
| | | | | | | | | | |
Total distributions | | | | | | | | | (0.07 | ) |
| | | | | | | | | | |
| | |
Net asset value, end of period | | | | | | | | $ | 10.10 | |
| | | | | | | | | | |
| | |
Total Return(e) | | | | | | | | | | |
Based on net asset value | | | | | | | | | (0.53 | )%(f) |
| | | | | | | | | | |
| | |
Ratios to Average Net Assets(g) | | | | | | | | | | |
Total expenses | | | | | | | | | 0.99 | %(h) |
| | | | | | | | | | |
| | |
Total expenses after fees waived and/or reimbursed | | | | | | | | | 0.90 | %(h) |
| | | | | | | | | | |
| | |
Total expenses after fees waived and/or reimbursed and excluding excise tax | | | | | | | | | 0.90 | %(h) |
| | | | | | | | | | |
| | |
Net investment income | | | | | | | | | 0.35 | %(h) |
| | | | | | | | | | |
| | |
Supplemental Data | | | | | | | | | | |
Net assets, end of period (000) | | | | | | | | $ | 296 | |
| | | | | | | | | | |
| | |
Portfolio turnover rate(i)(j) | | | | | | | | | 503 | % |
| | | | | | | | | | |
| (a) | Commencement of operations. |
| (b) | Based on average shares outstanding. |
(c) Distributions for annual periods determined in accordance with U.S. federal income tax regulations.
(d) Amount is greater than $(0.005) per share.
| (e) | Where applicable, assumes the reinvestment of distributions. |
| (f) | Aggregate total return. |
| (g) | Excludes expenses incurred indirectly as a result of investments in underlying funds of 0.03%. |
| (i) | Includes mortgage dollar roll transactions (“MDRs”). Additional information regarding portfolio turnover rate is as follows: |
| | | | | |
| | | |
| Period from
09/29/20 |
(a) |
| | | | | to 12/31/20 | |
Portfolio turnover rate (excluding MDRs) | | | | 258 | % |
| | | | | |
| (j) | Excludes investments underlying the total return swaps. |
See notes to financial statements.
| | |
| 70 | | 2 0 2 0 BLACK ROCK ANNUAL REPORT TO SHAREHOLDERS |
Notes to Financial Statements
BlackRock Funds V and BlackRock Funds IV (each, a “Trust” or collectively, the “Trusts”) are each registered under the Investment Company Act of 1940, as amended (the “1940 Act”), as open-end management investment companies. The Trust is organized as a Massachusetts business trust. The following, each of which is a series of the Trust, are referred to herein collectively as the “Funds” or individually as a “Fund”:
| | | | | | | | |
| Fund Name | | Herein Referred To As | | | Diversification
Classification | |
BlackRock Emerging Markets Bond Fund | | | Emerging Markets Bond Fund | | | | Diversified | * |
BlackRock Systematic Multi-Strategy Fund | | | Systematic Multi-Strategy Fund | | | | Diversified | |
| | * | The Fund’s classification changed from non-diversified to diversified during the reporting period. |
Each Fund offers multiple classes of shares. All classes of shares have identical voting, dividend, liquidation and other rights and are subject to the same terms and conditions, except that certain classes bear expenses related to the shareholder servicing and distribution of such shares. Institutional and Class K Shares are sold only to certain eligible investors. Investor A and Investor C Shares bear certain expenses related to shareholder servicing of such shares, and Investor C Shares also bear certain expenses related to the distribution of such shares. Investor A and Investor C Shares are generally available through financial intermediaries. Each class has exclusive voting rights with respect to matters relating to its shareholder servicing and distribution expenditures (except that Investor C shareholders may vote on material changes to the Investor A Shares distribution and service plan).
| | | | | | | | | | | | |
| Share Class | | Initial Sales Charge | | | CDSC | | | Conversion Privilege | |
Institutional and Class K Shares | | | No | | | | No | | | | None | |
Investor A Shares | | | Yes | | | | No | (a) | | | None | |
Investor C Shares | | | No | | | | Yes | | | | To Investor A Shares after approximately 8 years | |
| | (a) | Investor A Shares may be subject to a contingent deferred sales charge (“CDSC”) for certain redemptions where no initial sales charge was paid at the time of purchase. |
The Funds, together with certain other registered investment companies advised by BlackRock Advisors, LLC (the “Manager”) or its affiliates, are included in a complex of non-index fixed-income mutual funds and all BlackRock-advised closed-end funds referred to as the BlackRock Fixed-Income Complex.
| 2. | SIGNIFICANT ACCOUNTING POLICIES |
The financial statements are prepared in conformity with accounting principles generally accepted in the United States of America (“U.S. GAAP”), which may require management to make estimates and assumptions that affect the reported amounts of assets and liabilities in the financial statements, disclosure of contingent assets and liabilities at the date of the financial statements and the reported amounts of increases and decreases in net assets from operations during the reporting period. Actual results could differ from those estimates. Each Fund is considered an investment company under U.S. GAAP and follows the accounting and reporting guidance applicable to investment companies. Below is a summary of significant accounting policies:
Investment Transactions and Income Recognition: For financial reporting purposes, investment transactions are recorded on the dates the transactions are executed. Realized gains and losses on investment transactions are determined on the identified cost basis. Dividend income and non-cash dividend income, if any, are recorded on the ex-dividend date. Upon notification from issuers, a portion of the dividend income received from a real estate investment trust may be redesignated as a reduction of cost of the related investment and/or realized gain. Interest income, including amortization and accretion of premiums and discounts on debt securities, is recognized daily on an accrual basis. Income, expenses and realized and unrealized gains and losses are allocated daily to each class based on its relative net assets.
Foreign Currency Translation: Each Fund’s books and records are maintained in U.S. dollars. Securities and other assets and liabilities denominated in foreign currencies are translated into U.S. dollars using exchange rates determined as of the close of trading on the New York Stock Exchange (“NYSE”). Purchases and sales of investments are recorded at the rates of exchange prevailing on the respective dates of such transactions. Generally, when the U.S. dollar rises in value against a foreign currency, the investments denominated in that currency will lose value; the opposite effect occurs if the U.S. dollar falls in relative value.
Each Fund does not isolate the effect of fluctuations in foreign exchange rates from the effect of fluctuations in the market prices of investments for financial reporting purposes. Accordingly, the effects of changes in exchange rates on investments are not segregated in the Statements of Operations from the effects of changes in market prices of those investments, but are included as a component of net realized and unrealized gain (loss) from investments. Each Fund reports realized currency gains (losses) on foreign currency related transactions as components of net realized gain (loss) for financial reporting purposes, whereas such components are generally treated as ordinary income for U.S. federal income tax purposes.
Segregation and Collateralization: In cases where a Fund enters into certain investments (e.g., dollar rolls, to-be-announced (“TBA”) sale commitments, futures contracts, forward foreign currency exchange contracts and swaps) that would be treated as “senior securities” for 1940 Act purposes, a Fund may segregate or designate on its books and records cash or liquid assets having a market value at least equal to the amount of its future obligations under such investments. Doing so allows the investment to be excluded from treatment as a “senior security.” Furthermore, if required by an exchange or counterparty agreement, the Funds may be required to deliver/deposit cash and/or securities to/with an exchange, or broker-dealer or custodian as collateral for certain investments or obligations.
Distributions: Distributions from net investment income are declared daily and paid monthly for For Emerging Markets Bond Fund and for Systematic Multi-Strategy Fund declared and paid annually. Distributions of capital gains are recorded on the ex-dividend date and made at least annually. The portion of distributions, if any, that exceeds a fund’s current and accumulated earnings and profits, as measured on a tax basis, constitute a non-taxable return of capital. The character and timing of distributions are determined in accordance with U.S. federal income tax regulations, which may differ from U.S. GAAP.
| | |
NOTES TO FINANCIAL STATEMENTS | | 71 |
Notes to Financial Statements (continued)
Offering Costs: Offering costs are amortized over a 12-month period beginning with the commencement of operations of a class of shares.
Deferred Compensation Plan: Under the Deferred Compensation Plan (the “Plan”) approved by each Board of Trustees of the Trust (the “Board”), the trustees who are not “interested persons” of the Funds, as defined in the 1940 Act (“Independent Trustees”), may defer a portion of their annual complex-wide compensation. Deferred amounts earn an approximate return as though equivalent dollar amounts had been invested in common shares of certain funds in the BlackRock Fixed-Income Complex selected by the Independent Trustees. This has the same economic effect for the Independent Trustees as if the Independent Trustees had invested the deferred amounts directly in certain funds in the BlackRock Fixed-Income Complex.
The Plan is not funded and obligations thereunder represent general unsecured claims against the general assets of each Fund, as applicable. Deferred compensation liabilities, if any, are included in the Trustees’ and Officer’s fees payable in the Statements of Assets and Liabilities and will remain as a liability of the Funds until such amounts are distributed in accordance with the Plan.
Indemnifications: In the normal course of business, a Fund enters into contracts that contain a variety of representations that provide general indemnification. A Fund’s maximum exposure under these arrangements is unknown because it involves future potential claims against a Fund, which cannot be predicted with any certainty.
Other: Expenses directly related to a Fund or its classes are charged to that Fund or the applicable class. Expenses directly related to the Funds and other shared expenses prorated to the Funds are allocated daily to each class based on their relative net assets or other appropriate methods. Other operating expenses shared by several funds, including other funds managed by the Manager, are prorated among those funds on the basis of relative net assets or other appropriate methods.
| 3. | INVESTMENT VALUATION AND FAIR VALUE MEASUREMENTS |
Investment Valuation Policies: Each Fund’s investments are valued at fair value (also referred to as “market value” within the financial statements) each day that the Fund is open for business and, for financial reporting purposes, as of the report date. U.S. GAAP defines fair value as the price a fund would receive to sell an asset or pay to transfer a liability in an orderly transaction between market participants at the measurement date. Each Fund determines the fair values of its financial instruments using various independent dealers or pricing services under policies approved by the Board. If a security’s market price is not readily available or does not otherwise accurately represent the fair value of the security, the security will be valued in accordance with a policy approved by the Board as reflecting fair value. The BlackRock Global Valuation Methodologies Committee (the “Global Valuation Committee”) is the committee formed by management to develop global pricing policies and procedures and to oversee the pricing function for all financial instruments.
Fair Value Inputs and Methodologies: The following methods and inputs are used to establish the fair value of each Fund’s assets and liabilities:
| | • | | Equity investments traded on a recognized securities exchange are valued at that day’s official closing price, as applicable, on the exchange where the stock is primarily traded. Equity investments traded on a recognized exchange for which there were no sales on that day may be valued at the last available bid (long positions) or ask (short positions) price. |
Generally, trading in foreign instruments is substantially completed each day at various times prior to the close of trading on the NYSE. Occasionally, events affecting the values of such instruments may occur between the foreign market close and the close of trading on the NYSE that may not be reflected in the computation of the Funds’ net assets. Each business day, the Funds use a pricing service to assist with the valuation of certain foreign exchange-traded equity securities and foreign exchange-traded and over-the-counter (“OTC”) options (the “Systematic Fair Value Price”). Using current market factors, the Systematic Fair Value Price is designed to value such foreign securities and foreign options at fair value as of the close of trading on the NYSE, which follows the close of the local markets.
| | • | | Fixed-income investments for which market quotations are readily available are generally valued using the last available bid price or current market quotations provided by independent dealers or third party pricing services. Floating rate loan interests are valued at the mean of the bid prices from one or more independent brokers or dealers as obtained from a third party pricing service. Pricing services generally value fixed-income securities assuming orderly transactions of an institutional round lot size, but a fund may hold or transact in such securities in smaller, odd lot sizes. Odd lots may trade at lower prices than institutional round lots. The pricing services may use matrix pricing or valuation models that utilize certain inputs and assumptions to derive values, including transaction data (e.g., recent representative bids and offers), market data, credit quality information, perceived market movements, news, and other relevant information. Certain fixed-income securities, including asset-backed and mortgage related securities may be valued based on valuation models that consider the estimated cash flows of each tranche of the entity, establish a benchmark yield and develop an estimated tranche specific spread to the benchmark yield based on the unique attributes of the tranche. The amortized cost method of valuation may be used with respect to debt obligations with sixty days or less remaining to maturity unless the Manager determines such method does not represent fair value. |
| | • | | Exchange-traded funds (“ETFs”) and closed-end funds traded on a recognized securities exchange are valued at that day’s official closing price, as applicable, on the exchange where the stock is primarily traded. ETFs and closed-end funds traded on a recognized exchange for which there were no sales on that day may be valued at the last available bid (long positions) or ask (short positions) price. |
| | • | | Investments in open-end U.S. mutual funds (including money market funds) are valued at that day’s published net asset value (“NAV”). |
| | • | | Futures contracts are valued based on that day’s last reported settlement price on the exchange where the contract is traded. |
| | • | | Forward foreign currency exchange contracts are valued at the mean between the bid and ask prices and are determined as of the close of trading on the NYSE based on that day’s prevailing forward exchange rate for the underlying currencies. |
| | |
| 72 | | 2 0 2 0 BLACK ROCK ANNUAL REPORT TO SHAREHOLDERS |
Notes to Financial Statements (continued)
| | • | | Exchange-traded options are valued at the mean between the last bid and ask prices at the close of the options market in which the options trade. An exchange-traded option for which there is no mean price is valued at the last bid (long positions) or ask (short positions) price. If no bid or ask price is available, the prior day’s price will be used, unless it is determined that the prior day’s price no longer reflects the fair value of the option. OTC options and options on swaps (“swaptions”) are valued by an independent pricing service using a mathematical model, which incorporates a number of market data factors, such as the trades and prices of the underlying instruments. |
| | • | | Swap agreements are valued utilizing quotes received daily by independent pricing services or through brokers, which are derived using daily swap curves and models that incorporate a number of market data factors, such as discounted cash flows, trades and values of the underlying reference instruments. |
If events (e.g., a market closure, market volatility, company announcement or a natural disaster) occur that are expected to materially affect the value of such investment, or in the event that application of these methods of valuation results in a price for an investment that is deemed not to be representative of the market value of such investment, or if a price is not available, the investment will be valued by the Global Valuation Committee, or its delegate, in accordance with a policy approved by the Board as reflecting fair value (“Fair Valued Investments”). The fair valuation approaches that may be used by the Global Valuation Committee include market approach, income approach and cost approach. Valuation techniques such as discounted cash flow, use of market comparables and matrix pricing are types of valuation approaches and are typically used in determining fair value. When determining the price for Fair Valued Investments, the Global Valuation Committee, or its delegate, seeks to determine the price that each Fund might reasonably expect to receive or pay from the current sale or purchase of that asset or liability in an arm’s-length transaction. Fair value determinations shall be based upon all available factors that the Global Valuation Committee, or its delegate, deems relevant and consistent with the principles of fair value measurement. The pricing of all Fair Valued Investments is subsequently reported to the Board or a committee thereof on a quarterly basis.
Fair Value Hierarchy: Various inputs are used in determining the fair value of financial instruments. These inputs to valuation techniques are categorized into a fair value hierarchy consisting of three broad levels for financial reporting purposes as follows:
| | • | | Level 1 – Unadjusted price quotations in active markets/exchanges for identical assets or liabilities that each Fund has the ability to access; |
| | • | | Level 2 – Other observable inputs (including, but not limited to, quoted prices for similar assets or liabilities in markets that are active, quoted prices for identical or similar assets or liabilities in markets that are not active, inputs other than quoted prices that are observable for the assets or liabilities (such as interest rates, yield curves, volatilities, prepayment speeds, loss severities, credit risks and default rates) or other market–corroborated inputs); and |
| | • | | Level 3 – Unobservable inputs based on the best information available in the circumstances, to the extent observable inputs are not available (including the Global Valuation Committee’s assumptions used in determining the fair value of financial instruments). |
The hierarchy gives the highest priority to unadjusted quoted prices in active markets for identical assets or liabilities (Level 1 measurements) and the lowest priority to unobservable inputs (Level 3 measurements). Accordingly, the degree of judgment exercised in determining fair value is greatest for instruments categorized in Level 3. The inputs used to measure fair value may fall into different levels of the fair value hierarchy. In such cases, for disclosure purposes, the fair value hierarchy classification is determined based on the lowest level input that is significant to the fair value measurement in its entirety. Investments classified within Level 3 have significant unobservable inputs used by the Global Valuation Committee in determining the price for Fair Valued Investments. Level 3 investments include equity or debt issued by privately held companies or funds that may not have a secondary market and/or may have a limited number of investors. The categorization of a value determined for financial instruments is based on the pricing transparency of the financial instruments and is not necessarily an indication of the risks associated with investing in those securities.
| 4. | SECURITIES AND OTHER INVESTMENTS |
Asset-Backed and Mortgage-Backed Securities: Asset-backed securities are generally issued as pass-through certificates or as debt instruments. Asset-backed securities issued as pass-through certificates represent undivided fractional ownership interests in an underlying pool of assets. Asset-backed securities issued as debt instruments, which are also known as collateralized obligations, are typically issued as the debt of a special purpose entity organized solely for the purpose of owning such assets and issuing such debt. Asset-backed securities are often backed by a pool of assets representing the obligations of a number of different parties. The yield characteristics of certain asset-backed securities may differ from traditional debt securities. One such major difference is that all or a principal part of the obligations may be prepaid at any time because the underlying assets (i.e., loans) may be prepaid at any time. As a result, a decrease in interest rates in the market may result in increases in the level of prepayments as borrowers, particularly mortgagors, refinance and repay their loans. An increased prepayment rate with respect to an asset-backed security will have the effect of shortening the maturity of the security. In addition, a fund may subsequently have to reinvest the proceeds at lower interest rates. If a fund has purchased such an asset-backed security at a premium, a faster than anticipated prepayment rate could result in a loss of principal to the extent of the premium paid.
For mortgage pass-through securities (the “Mortgage Assets”) there are a number of important differences among the agencies and instrumentalities of the U.S. Government that issue mortgage-related securities and among the securities that they issue. For example, mortgage-related securities guaranteed by Ginnie Mae are guaranteed as to the timely payment of principal and interest by Ginnie Mae and such guarantee is backed by the full faith and credit of the United States. However, mortgage-related securities issued by Freddie Mac and Fannie Mae, including Freddie Mac and Fannie Mae guaranteed mortgage pass-through certificates, which are solely the obligations of Freddie Mac and Fannie Mae, are not backed by or entitled to the full faith and credit of the United States, but are supported by the right of the issuer to borrow from the U.S. Treasury.
Non-agency mortgage-backed securities are securities issued by non-governmental issuers and have no direct or indirect government guarantees of payment and are subject to various risks. Non-agency mortgage loans are obligations of the borrowers thereunder only and are not typically insured or guaranteed by any other person or entity. The ability of a borrower to repay a loan is dependent upon the income or assets of the borrower. A number of factors, including a general economic downturn, acts of God, terrorism, social unrest and civil disturbances, may impair a borrower’s ability to repay its loans.
Collateralized Debt Obligations: Collateralized debt obligations (“CDOs”), including collateralized bond obligations (“CBOs”) and collateralized loan obligations (“CLOs”), are types of asset-backed securities. ACDO is an entity that is backed by a diversified pool of debt securities (CBOs) or syndicated bank loans (CLOs). The cash flows of the CDO
| | |
NOTES TO FINANCIAL STATEMENTS | | 73 |
Notes to Financial Statements (continued)
can be split into multiple segments, called “tranches,” which will vary in risk profile and yield. The riskiest segment is the subordinated or “equity” tranche. This tranche bears the greatest risk of defaults from the underlying assets in the CDO and serves to protect the other, more senior, tranches from default in all but the most severe circumstances. Since it is shielded from defaults by the more junior tranches, a “senior” tranche will typically have higher credit ratings and lower yields than their underlying securities, and often receive investment grade ratings from one or more of the nationally recognized rating agencies. Despite the protection from the more junior tranches, senior tranches can experience substantial losses due to actual defaults, increased sensitivity to future defaults and the disappearance of one or more protecting tranches as a result of changes in the credit profile of the underlying pool of assets.
Multiple Class Pass-Through Securities: Multiple class pass-through securities, including collateralized mortgage obligations (“CMOs”) and commercial mortgage-backed securities, may be issued by Ginnie Mae, U.S. Government agencies or instrumentalities or by trusts formed by private originators of, or investors in, mortgage loans. In general, CMOs are debt obligations of a legal entity that are collateralized by a pool of residential or commercial mortgage loans or mortgage pass-through securities (the “Mortgage Assets”). The payments on these are used to make payments on the CMOs or multiple pass-through securities. Multiple class pass-through securities represent direct ownership interests in the Mortgage Assets. Classes of CMOs include interest only (“IOs”), principal only (“POs”), planned amortization classes and targeted amortization classes. IOs and POs are stripped mortgage-backed securities representing interests in a pool of mortgages, the cash flow from which has been separated into interest and principal components. IOs receive the interest portion of the cash flow while POs receive the principal portion. IOs and POs can be extremely volatile in response to changes in interest rates. As interest rates rise and fall, the value of IOs tends to move in the same direction as interest rates. POs perform best when prepayments on the underlying mortgages rise since this increases the rate at which the principal is returned and the yield to maturity on the PO. When payments on mortgages underlying a PO are slower than anticipated, the life of the PO is lengthened and the yield to maturity is reduced. If the underlying Mortgage Assets experience greater than anticipated prepayments of principal, a fund’s initial investment in the IOs may not fully recoup.
Capital Securities and Trust Preferred Securities: Capital securities, including trust preferred securities, are typically issued by corporations, generally in the form of interest-bearing notes with preferred securities characteristics. In the case of trust preferred securities, an affiliated business trust of a corporation issues these securities, generally in the form of beneficial interests in subordinated debentures or similarly structured securities. The securities can be structured with either a fixed or adjustable coupon that can have either a perpetual or stated maturity date. For trust preferred securities, the issuing bank or corporation pays interest to the trust, which is then distributed to holders of these securities as a dividend. Dividends can be deferred without creating an event of default or acceleration, although maturity cannot take place unless all cumulative payment obligations have been met. The deferral of payments does not affect the purchase or sale of these securities in the open market. These securities generally are rated below that of the issuing company’s senior debt securities and are freely callable at the issuer’s option.
Warrants: Warrants entitle a fund to purchase a specified number of shares of common stock and are non-income producing. The purchase price and number of shares are subject to adjustment under certain conditions until the expiration date of the warrants, if any. If the price of the underlying stock does not rise above the strike price before the warrant expires, the warrant generally expires without any value and a fund will lose any amount it paid for the warrant. Thus, investments in warrants may involve more risk than investments in common stock. Warrants may trade in the same markets as their underlying stock; however, the price of the warrant does not necessarily move with the price of the underlying stock.
Forward Commitments, When-Issued and Delayed Delivery Securities: Certain Funds may purchase securities on a when-issued basis and may purchase or sell securities on a forward commitment basis. Settlement of such transactions normally occurs within a month or more after the purchase or sale commitment is made. A Fund may purchase securities under such conditions with the intention of actually acquiring them, but may enter into a separate agreement to sell the securities before the settlement date. Since the value of securities purchased may fluctuate prior to settlement, a Fund may be required to pay more at settlement than the security is worth. In addition, a Fund is not entitled to any of the interest earned prior to settlement. When purchasing a security on a delayed delivery basis, a Fund assumes the rights and risks of ownership of the security, including the risk of price and yield fluctuations. In the event of default by the counterparty, a Fund’s maximum amount of loss is the unrealized appreciation of unsettled when-issued transactions.
TBA Commitments: TBA commitments are forward agreements for the purchase or sale of mortgage-backed securities for a fixed price, with payment and delivery on an agreed upon future settlement date. The specific securities to be delivered are not identified at the trade date. However, delivered securities must meet specified terms, including issuer, rate and mortgage terms. When entering into TBA commitments, a fund may take possession of or deliver the underlying mortgage-backed securities but can extend the settlement or roll the transaction. TBA commitments involve a risk of loss if the value of the security to be purchased or sold declines or increases, respectively, prior to settlement date.
In order to better define contractual rights and to secure rights that will help a fund mitigate its counterparty risk, TBA commitments may be entered into by a fund under Master Securities Forward Transaction Agreements (each, an “MSFTA”). An MSFTA typically contains, among other things, collateral posting terms and netting provisions in the event of default and/or termination event. The collateral requirements are typically calculated by netting the mark-to-market amount for each transaction under such agreement and comparing that amount to the value of the collateral currently pledged by a fund and the counterparty. Cash collateral that has been pledged to cover the obligations of a fund and cash collateral received from the counterparty, if any, is reported separately in the Statements of Assets and Liabilities as cash pledged as collateral for TBA commitments or cash received as collateral for TBA commitments, respectively. Non-cash collateral pledged by a fund, if any, is noted in the Schedules of Investments. Typically, a fund is permitted to sell, re-pledge or use the collateral it receives; however, the counterparty is not permitted to do so. To the extent amounts due to a fund are not fully collateralized, contractually or otherwise, a fund bears the risk of loss from counterparty non-performance.
Mortgage Dollar Roll Transactions: Certain Funds may sell TBA mortgage-backed securities and simultaneously contract to repurchase substantially similar (i.e., same type, coupon and maturity) securities on a specific future date at an agreed upon price. During the period between the sale and repurchase, a fund is not entitled to receive interest and principal payments on the securities sold. Mortgage dollar roll transactions are treated as purchases and sales and a fund realizes gains and losses on these transactions. Mortgage dollar rolls involve the risk that the market value of the securities that a fund is required to purchase may decline below the agreed upon repurchase price of those securities.
| | |
| 74 | | 2 0 2 0 BLACK ROCK ANNUAL REPORT TO SHAREHOLDERS |
Notes to Financial Statements (continued)
| 5. | DERIVATIVE FINANCIAL INSTRUMENTS |
The Funds engage in various portfolio investment strategies using derivative contracts both to increase the returns of the Funds and/or to manage their exposure to certain risks such as credit risk, equity risk, interest rate risk, foreign currency exchange rate risk, commodity price risk or other risks (e.g., inflation risk). Derivative financial instruments categorized by risk exposure are included in the Schedules of Investments. These contracts may be transacted on an exchange or OTC.
Futures Contracts: Futures contracts are purchased or sold to gain exposure to, or manage exposure to, changes in interest rates (interest rate risk) and changes in the value of equity securities (equity risk) or foreign currencies (foreign currency exchange rate risk).
Futures contracts are exchange-traded agreements between the Funds and a counterparty to buy or sell a specific quantity of an underlying instrument at a specified price and on a specified date. Depending on the terms of a contract, it is settled either through physical delivery of the underlying instrument on the settlement date or by payment of a cash amount on the settlement date. Upon entering into a futures contract, the Funds are required to deposit initial margin with the broker in the form of cash or securities in an amount that varies depending on a contract’s size and risk profile. The initial margin deposit must then be maintained at an established level over the life of the contract. Amounts pledged, which are considered restricted, are included in cash pledged for futures contracts in the Statements of Assets and Liabilities.
Securities deposited as initial margin are designated in the Schedules of Investments and cash deposited, if any, are shown as cash pledged for futures contracts in the Statements of Assets and Liabilities. Pursuant to the contract, the Funds agree to receive from or pay to the broker an amount of cash equal to the daily fluctuation in market value of the contract (“variation margin”). Variation margin is recorded as unrealized appreciation (depreciation) and, if any, shown as variation margin receivable (or payable) on futures contracts in the Statements of Assets and Liabilities. When the contract is closed, a realized gain or loss is recorded in the Statements of Operations equal to the difference between the notional amount of the contract at the time it was opened and the notional amount at the time it was closed. The use of futures contracts involves the risk of an imperfect correlation in the movements in the price of futures contracts and interest rates, foreign currency exchange rates or underlying assets.
Forward Foreign Currency Exchange Contracts: Forward foreign currency exchange contracts are entered into to gain or reduce exposure to foreign currencies (foreign currency exchange rate risk).
A forward foreign currency exchange contract is an agreement between two parties to buy and sell a currency at a set exchange rate on a specified date. These contracts help to manage the overall exposure to the currencies in which some of the investments held by the Funds are denominated and in some cases, may be used to obtain exposure to a particular market. The contracts are traded OTC and not on an organized exchange.
The contract is marked-to-market daily and the change in market value is recorded as unrealized appreciation (depreciation) in the Statements of Assets and Liabilities. When a contract is closed, a realized gain or loss is recorded in the Statements of Operations equal to the difference between the value at the time it was opened and the value at the time it was closed. Non-deliverable forward foreign currency exchange contracts are settled with the counterparty in cash without the delivery of foreign currency. The use of forward foreign currency exchange contracts involves the risk that the value of a forward foreign currency exchange contract changes unfavorably due to movements in the value of the referenced foreign currencies, and such value may exceed the amount(s)reflected in the Statements of Assets and Liabilities. Cash amounts pledged for forward foreign currency exchange contracts are considered restricted and are included in cash pledged as collateral for OTC derivatives in the Statements of Assets and Liabilities. A Fund’s risk of loss from counterparty credit risk on OTC derivatives is generally limited to the aggregate unrealized gain netted against any collateral held by the Fund.
Options: Certain Funds purchase and write call and put options to increase or decrease their exposure to the risks of underlying instruments, including equity risk, interest rate risk and/or commodity price risk and/or, in the case of options written, to generate gains from options premiums.
A call option gives the purchaser (holder) of the option the right (but not the obligation) to buy, and obligates the seller (writer) to sell (when the option is exercised) the underlying instrument at the exercise or strike price at any time or at a specified time during the option period. A put option gives the holder the right to sell and obligates the writer to buy the underlying instrument at the exercise or strike price at any time or at a specified time during the option period.
Premiums paid on options purchased and premiums received on options written, as well as the daily fluctuation in market value, are included in investments at value –unaffiliated and options written at value, respectively, in the Statements of Assets and Liabilities. When an instrument is purchased or sold through the exercise of an option, the premium is offset against the cost or proceeds of the underlying instrument. When an option expires, a realized gain or loss is recorded in the Statements of Operations to the extent of the premiums received or paid. When an option is closed or sold, a gain or loss is recorded in the Statements of Operations to the extent the cost of the closing transaction exceeds the premiums received or paid. When the Funds write a call option, such option is typically “covered,” meaning that they hold the underlying instrument subject to being called by the option counterparty. When the Funds write a put option, cash is segregated in an amount sufficient to cover the obligation. These amounts, which are considered restricted, are included in cash pledged as collateral for options written in the Statements of Assets and Liabilities.
In purchasing and writing options, the Funds bear the risk of an unfavorable change in the value of the underlying instrument or the risk that they may not be able to enter into a closing transaction due to an illiquid market. Exercise of a written option could result in the Funds purchasing or selling a security when they otherwise would not, or at a price different from the current market value.
Swaps: Swap contracts are entered into to manage exposure to issuers, markets and securities. Such contracts are agreements between the Funds and a counterparty to make periodic net payments on a specified notional amount or a net payment upon termination. Swap agreements are privately negotiated in the OTC market and may be entered into as a bilateral contract (“OTC swaps”) or centrally cleared (“centrally cleared swaps”).
For OTC swaps, any upfront premiums paid and any upfront fees received are shown as swap premiums paid and swap premiums received, respectively, in the Statements of Assets and Liabilities and amortized over the term of the contract. The daily fluctuation in market value is recorded as unrealized appreciation (depreciation) on OTC Swaps in the Statements of Assets and Liabilities. Payments received or paid are recorded in the Statements of Operations as realized gains or losses, respectively. When an OTC swap is terminated, a realized gain or loss is recorded in the Statements of Operations equal to the difference between the proceeds from (or cost of) the closing transaction and the Funds’ basis in the contract, if any. Generally, the basis of the contract is the premium received or paid.
| | |
NOTES TO FINANCIAL STATEMENTS | | 75 |
Notes to Financial Statements (continued)
In a centrally cleared swap, immediately following execution of the swap contract, the swap contract is novated to a central counterparty (the “CCP”) and the CCP becomes the Funds’ counterparty on the swap. Each Fund is required to interface with the CCP through the broker. Upon entering into a centrally cleared swap, each Fund is required to deposit initial margin with the broker in the form of cash or securities in an amount that varies depending on the size and risk profile of the particular swap. Securities deposited as initial margin are designated in the Schedules of Investments and cash deposited is shown as cash pledged for centrally cleared swaps in the Statements of Assets and Liabilities. Amounts pledged, which are considered restricted cash, are included in cash pledged for centrally cleared swaps in the Statements of Assets and Liabilities. Pursuant to the contract, each Fund agrees to receive from or pay to the broker an amount of cash equal to the daily fluctuation in market value of the contract (“variation margin”). Variation margin is recorded as unrealized appreciation (depreciation) and shown as variation margin receivable (or payable) on centrally cleared swaps in the Statements of Assets and Liabilities. Payments received from (paid to) the counterparty are amortized over the term of the contract and recorded as realized gains (losses) in the Statements of Operations, including those at termination.
| | • | | Credit default swaps — Credit default swaps are entered into to manage exposure to the market or certain sectors of the market, to reduce risk exposure to defaults of corporate and/or sovereign issuers or to create exposure to corporate and/or sovereign issuers to which a fund is not otherwise exposed (credit risk). |
The Funds may either buy or sell (write) credit default swaps on single-name issuers (corporate or sovereign), a combination or basket of single-name issuers or traded indexes. Credit default swaps are agreements in which the protection buyer pays fixed periodic payments to the seller in consideration for a promise from the protection seller to make a specific payment should a negative credit event take place with respect to the referenced entity (e.g., bankruptcy, failure to pay, obligation acceleration, repudiation, moratorium or restructuring). As a buyer, if an underlying credit event occurs, the Funds will either (i) receive from the seller an amount equal to the notional amount of the swap and deliver the referenced security or underlying securities comprising the index, or (ii) receive a net settlement of cash equal to the notional amount of the swap less the recovery value of the security or underlying securities comprising the index. As a seller (writer), if an underlying credit event occurs, the Funds will either pay the buyer an amount equal to the notional amount of the swap and take delivery of the referenced security or underlying securities comprising the index or pay a net settlement of cash equal to the notional amount of the swap less the recovery value of the security or underlying securities comprising the index.
| | • | | Total return swaps — Total return swaps are entered into to obtain exposure to a security or market without owning such security or investing directly in such market or to exchange the risk/return of one security or market (e.g., fixed-income) with another security or market (e.g., equity or commodity prices) (equity risk, commodity price risk and/or interest rate risk). |
Total return swaps are agreements in which there is an exchange of cash flows whereby one party commits to make payments based on the total return (distributions plus capital gains/losses) of an underlying instrument, or basket of underlying instruments, in exchange for fixed or floating rate interest payments. If the total return of the instrument(s) or index underlying the transaction exceeds or falls short of the offsetting fixed or floating interest rate obligation, the Funds receive payment from or make a payment to the counterparty.
Certain total return swaps are designed to function as a portfolio of direct investments in long and short equity positions. This means that the Fund has the ability to trade in and out of these long and short positions within the swap and will receive the economic benefits and risks equivalent to direct investment in these positions, subject to certain adjustments due to events related to the counterparty. Benefits and risks include capital appreciation (depreciation), corporate actions and dividends received and paid, all of which are reflected in the swap’s market value. The market value also includes interest charges and credits (“financing fees”) related to the notional values of the long and short positions and cash balances within the swap. These interest charges and credits are based on a specified benchmark rate plus or minus a specified spread determined based upon the country and/or currency of the positions in the portfolio.
Positions within the swap and financing fees are reset periodically. During a reset, any unrealized appreciation (depreciation) on positions and accrued financing fees become available for cash settlement between the Funds and the counterparty. The amounts that are available for cash settlement are recorded as realized gains or losses in the Statements of Operations. Cash settlement in and out of the swap may occur at a reset date or any other date, at the discretion of the Funds and the counterparty, over the life of the agreement. Certain swaps have no stated expiration and can be terminated by either party at any time.
| | • | | Interest rate swaps — Interest rate swaps are entered into to gain or reduce exposure to interest rates or to manage duration, the yield curve or interest rate (interest rate risk). |
Interest rate swaps are agreements in which one party pays a stream of interest payments, either fixed or floating, in exchange for another party’s stream of interest payments, either fixed or floating, on the same notional amount for a specified period of time. In more complex interest rate swaps, the notional principal amount may decline (or amortize) over time.
Swap transactions involve, to varying degrees, elements of interest rate, credit and market risk in excess of the amounts recognized in the Statements of Assets and Liabilities. Such risks involve the possibility that there will be no liquid market for these agreements, that the counterparty to the agreements may default on its obligation to perform or disagree as to the meaning of the contractual terms in the agreements, and that there may be unfavorable changes in interest rates and/or market values associated with these transactions.
Master Netting Arrangements: In order to define its contractual rights and to secure rights that will help it mitigate its counterparty risk, a Fund may enter into an International Swaps and Derivatives Association, Inc. Master Agreement (“ISDA Master Agreement”) or similar agreement with its counterparties. An ISDA Master Agreement is a bilateral agreement between a Fund and a counterparty that governs certain OTC derivatives and typically contains, among other things, collateral posting terms and netting provisions in the event of a default and/or termination event. Under an ISDA Master Agreement, a Fund may, under certain circumstances, offset with the counterparty certain derivative financial instruments’ payables and/or receivables with collateral held and/or posted and create one single net payment. The provisions of the ISDA Master Agreement typically permit a single net payment in the event of default including the bankruptcy or insolvency of the counterparty. However, bankruptcy or insolvency laws of a particular jurisdiction may impose restrictions on or prohibitions against the right of offset in bankruptcy, insolvency or other events.
| | |
| 76 | | 2 0 2 0 BLACK ROCK ANNUAL REPORT TO SHAREHOLDERS |
Notes to Financial Statements (continued)
Collateral Requirements: For derivatives traded under an ISDA Master Agreement, the collateral requirements are typically calculated by netting the mark-to-market amount for each transaction under such agreement and comparing that amount to the value of any collateral currently pledged by the Fund and the counterparty.
Cash collateral that has been pledged to cover obligations of the Funds and cash collateral received from the counterparty, if any, is reported separately in the Statements of Assets and Liabilities as cash pledged as collateral and cash received as collateral, respectively. Non-cash collateral pledged by the Funds, if any, is noted in the Schedules of Investments. Generally, the amount of collateral due from or to a counterparty is subject to a certain minimum transfer amount threshold before a transfer is required, which is determined at the close of business of the Funds. Any additional required collateral is delivered to/pledged by the Funds on the next business day. Typically, the counterparty is not permitted to sell, re-pledge or use cash and non-cash collateral it receives. A Fund generally agrees not to use non-cash collateral that it receives but may, absent default or certain other circumstances defined in the underlying ISDA Master Agreement, be permitted to use cash collateral received. In such cases, interest may be paid pursuant to the collateral arrangement with the counterparty. To the extent amounts due to the Funds from the counterparties are not fully collateralized, each Fund bears the risk of loss from counterparty non-performance. Likewise, to the extent the Funds have delivered collateral to a counterparty and stand ready to perform under the terms of their agreement with such counterparty, each Fund bears the risk of loss from a counterparty in the amount of the value of the collateral in the event the counterparty fails to return such collateral. Based on the terms of agreements, collateral may not be required for all derivative contracts.
For financial reporting purposes, the Funds do not offset derivative assets and derivative liabilities that are subject to netting arrangements, if any, in the Statements of Assets and Liabilities.
| 6. | INVESTMENT ADVISORY AGREEMENT AND OTHER TRANSACTIONS WITH AFFILIATES |
Investment Advisory: The Trust, on behalf of each Fund, entered into an Investment Advisory Agreement with the Manager, the Funds’ investment adviser and an indirect, wholly-owned subsidiary of BlackRock, Inc. (“BlackRock”), to provide investment advisory services. The Manager is responsible for the management of each Fund’s portfolio and provides the personnel, facilities, equipment and certain other services necessary to the operations of each Fund.
For such services, each Fund pays the Manager a monthly fee at an annual rate equal to the following percentages of the average daily value of each Fund’s net assets:
| | | | |
| | | Investment Advisory Fees | |
| Average Daily Net Assets | | Emerging Markets Bond Fund | |
First $1 billion | | | 0.55 | % |
$1 billion — $2 billion | | | 0.51 | |
$2 billion — $3 billion | | | 0.48 | |
Greater than $3 billion | | | 0.46 | |
| | | | |
| | | Investment Advisory Fees | |
| Average Daily Net Assets | | Systematic Multi-Strategy Fund | |
First $1 billion | | | 0.80 | % |
$1 billion — $3 billion | | | 0.75 | |
$3 billion — $5 billion | | | 0.72 | |
$5 billion — $10 billion | | | 0.70 | |
Greater than $10 billion | | | 0.68 | |
With respect to each Fund, the Manager entered into separate sub-advisory agreements with BlackRock International Limited (“BIL”), an affiliate of the Manager. The Manager pays BIL for services it provides for that portion of each Fund for which BIL acts as sub-adviser a monthly fee that is equal to a percentage of the investment advisory fees paid by each Fund to the Manager.
Service and Distribution Fees: The Trust, on behalf of the Systematic Multi-Strategy Fund, entered into a Distribution Agreement and a Distribution and Service Plan with BlackRock Investments, LLC (“BRIL”), an affiliate of the Manager. Pursuant to the Distribution and Service Plan and in accordance with Rule 12b-1 under the 1940 Act, the Fund pays BRIL ongoing service and distribution fees. The fees are accrued daily and paid monthly at annual rates based upon the average daily net assets of the relevant share class of the Fund as follows:
| | | | | | | | |
| | | Systematic Multi-Strategy Fund | |
| Share Class | | Service Fees | | | Distribution Fees | |
Investor A | | | 0.25 | % | | | N/A | |
Investor C | | | 0.25 | | | | 0.75 | % |
BRIL and broker-dealers, pursuant to sub-agreements with BRIL, provide shareholder servicing and distribution services to the Fund. The ongoing service and/or distribution fee compensates/reimburses BRIL and each broker-dealer for providing shareholder servicing and/or distribution related services to shareholders.
For the year ended December 31, 2020, the following table shows the class specific service and distribution fees borne directly by each share class of the Fund:
| | | | | | | | | | | | |
| Fund Name | | Investor A | | | Investor C | | | Total | |
Systematic Multi-Strategy Fund | | $ | 303,888 | | | $ | 16,869 | | | $ | 320,757 | |
| | |
NOTES TO FINANCIAL STATEMENTS | | 77 |
Notes to Financial Statements (continued)
Administration: The Trust, on behalf of each Fund, entered into an Administration Agreement with the Manager, an indirect, wholly-owned subsidiary of BlackRock, to provide administrative services. For these services, the Manager receives an administration fee computed daily and payable monthly, based on a percentage of the average daily net assets of each Fund. The administration fee, which is shown as administration in the Statements of Operations, is paid at the annual rates below.
| | | | |
| Average Daily Net Assets | | Administration Fees | |
First $500 million | | | 0.0425 | % |
$500 million - $1 billion | | | 0.0400 | |
$1 billion - $2 billion | | | 0.0375 | |
$2 billion - $4 billion | | | 0.0350 | |
$4 billion - $13 billion | | | 0.0325 | |
Greater than $13 billion | | | 0.0300 | |
In addition, the Manager charges each of the share classes an administration fee, which is shown as administration – class specific in the Statements of Operations, at an annual rate of 0.02% of the average daily net assets of each respective class.
For the year ended December 31, 2020, the following table shows the class specific administration fees borne directly by each share class of each Fund:
| | | | | | | | | | | | | | | | | | | | |
| Fund Name | | Institutional | | | Investor A | | | Investor C | | | Class K | | | Total | |
Emerging Markets Bond Fund | | $ | 16 | | | $ | — | | | $ | — | | | $ | 4,576 | | | $ | 4,592 | |
Systematic Multi-Strategy Fund | | | 299,505 | | | | 24,311 | | | | 338 | | | | 15 | | | | 324,169 | |
Transfer Agent: Pursuant to written agreements, certain financial intermediaries, some of which may be affiliates, provide the Funds with sub-accounting, recordkeeping, sub-transfer agency and other administrative services with respect to servicing of underlying investor accounts. For these services, these entities receive an asset-based fee or an annual fee per shareholder account, which will vary depending on share class and/or net assets. For the year ended December 31, 2020, the Funds did not pay any amounts to affiliates in return for these services.
The Manager maintains a call center that is responsible for providing certain shareholder services to the Funds. Shareholder services include responding to inquiries and processing purchases and sales based upon instructions from shareholders. For the year ended December 31, 2020, each Fund reimbursed the Manager the following amounts for costs incurred in running the call center, which are included in transfer agent — class specific in the Statements of Operations:
| | | | | | | | | | | | | | | | | | | | |
| Fund Name | | Institutional | | | Investor A | | | Investor C | | | Class K | | | Total | |
Emerging Markets Bond Fund | | $ | 12 | | | $ | — | | | $ | — | | | $ | 46 | | | | $ 58 | |
Systematic Multi-Strategy Fund | | | 919 | | | | 747 | | | | 164 | | | | — | | | | 1,830 | |
For the year ended December 31, 2020, the following table shows the class specific transfer agent fees borne directly by each share class of each Fund:
| | | | | | | | | | | | | | | | | | | | |
| Fund Name | | Institutional | | | Investor A | | | Investor C | | | Class K | | | Total | |
Emerging Markets Bond Fund | | $ | 112 | | | $ | — | | | $ | — | | | $ | 86 | | | | $ 198 | |
Systematic Multi-Strategy Fund | | | 1,507,130 | | | | 186,686 | | | | 3,181 | | | | 93 | | | | 1,697,090 | |
Other Fees: For the year ended December 31, 2020, affiliates earned underwriting discounts, direct commissions and dealer concessions on sales of each Fund’s Investor A Shares as follows:
| | | | |
| Fund Name | | Investor A | |
Systematic Multi-Strategy Fund | | $ | 9,538 | |
For the year ended December 31, 2020, affiliates received CDSCs as follows:
| | | | | | | | |
| Fund Name | | Investor A | | | Investor C | |
Systematic Multi-Strategy Fund | | $ | 118 | | | $ | 362 | |
Expense Limitations, Waivers and Reimbursements: With respect to each Fund, the Manager contractually agreed to waive its investment advisory fees by the amount of investment advisory fees each Fund pays to the Manager indirectly through its investment in affiliated money market funds (the “affiliated money market fund waiver”) through April 30, 2021. The contractual agreement may be terminated upon 90 days’ notice by a majority of the Independent Trustees, or by a vote of a majority of the outstanding voting securities of a Fund. The amount of waivers and/or reimbursements of fees and expenses made pursuant to the expense limitation described below will be reduced by the amount of the affiliated money market fund waiver. These amounts are included in fees waived and/or reimbursed by the Manager in the Statements of Operations. For the year ended December 31, 2020, the amounts waived were as follows:
| | | | |
| Fund Name | | Amounts Waived | |
Emerging Markets Bond Fund | | $ | 639 | |
Systematic Multi-Strategy Fund | | | 199,514 | |
The Manager has contractually agreed to waive its investment advisory fee with respect to any portion of each Fund’s assets invested in affiliated equity and fixed-income mutual funds and affiliated exchange-traded funds that have a contractual management fee through April 30, 2021. The contractual agreement may be terminated upon 90 days’ notice by a majority of the Independent Trustees, or by a vote of a majority of the outstanding voting securities of a Fund. For the year ended December 31, 2020, there were no fees waived and/or reimbursed by the Manager pursuant to this arrangement.
| | |
| 78 | | 2 0 2 0 BLACK ROCK ANNUAL REPORT TO SHAREHOLDERS |
Notes to Financial Statements (continued)
With respect to each Fund, the Manager contractually agreed to waive and/or reimburse fees or expenses in order to limit expenses, excluding interest expense, dividend expense, tax expense, acquired fund fees and expenses, and certain other fund expenses, which constitute extraordinary expenses not incurred in the ordinary course of each Fund’s business (“expense limitation”). The expense limitations as a percentage of average daily net assets are as follows:
| | | | | | | | | | | | | | | | |
| Fund Name | | Institutional | | | Investor A | | | Investor C | | | Class K | |
Emerging Markets Bond Fund | | | 0.68 | % | | | — | % | | | — | % | | | 0.59 | % |
Systematic Multi-Strategy Fund | | | 0.95 | | | | 1.20 | | | | 1.95 | | | | 0.90 | |
The Manager has agreed not to reduce or discontinue these contractual expense limitations through April 30, 2021, unless approved by the Board, including a majority of the Independent Trustees, or by a vote of a majority of the outstanding voting securities of a Fund. For the year ended December 31, 2020, the Manager waived and/or reimbursed amounts were as follows, which is included in fees waived and/or reimbursed by the Manager in the Statements of Operations.
| | | | |
| Fund Name | | Amounts Waived | |
Emerging Markets Bond Fund | | $ | 213,502 | |
Systematic Multi-Strategy Fund | | | 8,566 | |
| | | | |
| Fund Name | | Administration fees waived | |
Emerging Markets Bond Fund | | $ | 9,770 | |
In addition, these amounts waived and/or reimbursed by the Manager are included in administration fees waived — class specific and transfer agent fees waived and/or reimbursed — class specific, respectively, in the Statements of Operations. For the year ended December 31, 2020, class specific expense waivers and/or reimbursements are as follows:
| | | | | | | | | | | | | | | | | | | | |
| | | Administration Fees Waived - Class Specific | |
| Fund Name | | Institutional | | | Investor A | | | Investor C | | | Class K | | | Total | |
Emerging Markets Bond Fund | | $ | 14 | | | $ | — | | | $ | — | | | $ | 4,578 | | | $ | 4,592 | |
Systematic Multi-Strategy Fund | | | 237,533 | | | | 24,311 | | | | 337 | | | | 15 | | | | 262,196 | |
| | | | | | | | | | | | | | | | | | | | |
| | | Transfer Agent Fees Waived and/or Reimbursed - Class Specific | |
| Fund Name | | Institutional | | | Investor A | | | Investor C | | | Class K | | | Total | |
Emerging Markets Bond Fund | | $ | 42 | | | $ | — | | | $ | — | | | $ | 83 | | | $ | 125 | |
Systematic Multi-Strategy Fund | | | 269,094 | | | | 90,435 | | | | 1,596 | | | | 47 | | | | 361,172 | |
With respect to the contractual expense limitation, if during a Fund’s fiscal year the operating expenses of a share class, that at any time during the prior two fiscal years received a waiver and/or reimbursement from the Manager, are less than the current expense limitation for that share class, the Manager is entitled to be reimbursed by such share class up to the lesser of: (a) the amount of fees waived and/or expenses reimbursed during those prior two fiscal years under the agreement and (b) an amount not to exceed either the current expense limitation of that share class or the expense limitation of the share class in effect at the time that the share class received the applicable waiver and/or reimbursement, provided that:
| (1) | | each Fund, of which the share class is a part, has more than $50 million in assets for the fiscal year, and |
| (2) | | the Manager or an affiliate continues to serve as a Fund’s investment adviser or administrator. |
This repayment applies only to the contractual expense limitation on net expenses and does not apply to the contractual investment advisory fee waiver described above or any voluntary waivers that may be in effect from time to time. Effective May 19, 2022, for Systematic Multi-Strategy Fund, and effective July 27, 2024 for Emerging Markets Bond Fund, the repayment arrangement between each Fund and the Manager pursuant to which such Fund may be required to repay amounts waived and/or reimbursed under each Fund’s contractual caps on net expenses will be terminated.
As of December 31, 2020, the fund level and class specific waivers and/or reimbursements subject to possible future recoupment under the expense limitation agreement are as follows:
| | | | | | | | |
| | | Expiring | |
| Fund Name/Fund Level/Share Class | | December 31, 2021 | | | December 31, 2022 | |
Emerging Markets Bond Fund | | | | | | | | |
Fund Level | | $ | 197,841 | | | $ | 223,272 | |
Institutional | | | 30 | | | | 56 | |
Class K | | | 4,802 | | | | 4,661 | |
Systematic Multi-Strategy Fund | | | | | | | | |
Fund Level | | | 347,082 | | | | 8,566 | |
Institutional | | | 74,405 | | | | 506,627 | |
Investor A | | | 62,945 | | | | 114,746 | |
Investor C | | | 388 | | | | 1,933 | |
Class K | | | — | | | | 62 | |
| | |
NOTES TO FINANCIAL STATEMENTS | | 79 |
Notes to Financial Statements (continued)
The following fund level and class specific waivers and/or reimbursements previously recorded by the Funds, which were subject to recoupment by the Manager, expired on December 31, 2020:
| | | | |
| Fund Name/Fund Level/Share Class | | Expired
December 31, 2020 | |
Emerging Markets Bond Fund | | | | |
Fund Level | | $ | 220,267 | |
Institutional | | | 48 | |
Class K | | | 4,809 | |
Systematic Multi-Strategy Fund | | | | |
Fund Level | | | 357,002 | |
Institutional | | | 8,833 | |
Investor A | | | 2,869 | |
Class K | | | — | |
Investor C | | | 126 | |
Interfund Lending: In accordance with an exemptive order (the “Order”) from the U.S. Securities and Exchange Commission (“SEC”), each Fund may participate in a joint lending and borrowing facility for temporary purposes (the “Interfund Lending Program”), subject to compliance with the terms and conditions of the Order, and to the extent permitted by each Fund’s investment policies and restrictions. Each Fund is currently permitted to borrow and lend under the Interfund Lending Program.
A lending BlackRock fund may lend in aggregate up to 15% of its net assets, but may not lend more than 5% of its net assets to any one borrowing fund through the Interfund Lending Program. A borrowing BlackRock fund may not borrow through the Interfund Lending Program or from any other source more than 33 1/3% of its total assets (or any lower threshold provided for by the fund’s investment restrictions). If a borrowing BlackRock fund’s total outstanding borrowings exceed 10% of its total assets, each of its outstanding interfund loans will be subject to collateralization of at least 102% of the outstanding principal value of the loan. All interfund loans are for temporary or emergency purposes and the interest rate to be charged will be the average of the highest current overnight repurchase agreement rate available to a lending fund and the bank loan rate, as calculated according to a formula established by the Board.
During the year ended December 31, 2020, the Funds did not participate in the Interfund Lending Program.
Trustees and Officers: Certain trustees and/or officers of the Funds are directors and/or officers of BlackRock or its affiliates. The Funds reimburse the Manager for a portion of the compensation paid to the Fund’s Chief Compliance Officer, which is included in Trustees and Officer in the Statements of Operations.
Other Transactions: The Funds may purchase securities from, or sell securities to, an affiliated fund provided the affiliation is due solely to having a common investment adviser, common officers, or common trustees. For the year ended December 31, 2020, the purchase and sale transactions and any net realized gains (losses) with an affiliated fund in compliance with Rule 17a-7 under the 1940 Act were as follows:
| | | | | | | | | | | | |
| Fund Name | | Purchases | | | Sales | | | Net Realized
Gain (Loss) | |
Systematic Multi-Strategy Fund | | $ | 4,205,332 | | | $ | 3,150,004 | | | $ | 50,383 | |
For the year ended December 31, 2020, purchases and sales of investments, including paydowns/payups and mortgage dollar rollsexcluding short-term investments, were as follows:
| | | | | | | | | | | | | | | | | | | | |
| | | U.S. Government Securities | | | | | | Other Securities | |
| | | | | |
| Fund Name | | Purchases | | | Sales | | | | | | Purchases | | | Sales | |
Emerging Markets Bond Fund | | $ | — | | | $ | 242,203 | | | | | | | $ | 17,538,346 | | | $ | 17,215,447 | |
Systematic Multi-Strategy Fund | | | 35,194,671 | | | | 32,533,962 | | | | | | | | 12,534,403,745 | | | | 9,110,315,824 | |
For the year ended December 31, 2020, purchases and sales related to mortgage dollar rolls were as follows:
| | | | | | | | |
| | | |
| Fund Name | | Purchases | | | Sales | |
Systematic Multi-Strategy Fund | | $ | 4,455,073,909 | | | $ | 4,455,909,603 | |
It is each Fund’s policy to comply with the requirements of the Internal Revenue Code of 1986, as amended, applicable to regulated investment companies, and to distribute substantially all of its taxable income to its shareholders. Therefore, no U.S. federal income tax provision is required.
Each Fund files U.S. federal and various state and local tax returns. No income tax returns are currently under examination. The statute of limitations on each Fund’s U.S. federal tax returns generally remains open for a period of three fiscal years after they are filed. The statutes of limitations on each Fund’s state and local tax returns may remain open for an additional year depending upon the jurisdiction.
| | |
| 80 | | 2 0 2 0 BLACK ROCK ANNUAL REPORT TO SHAREHOLDERS |
Notes to Financial Statements (continued)
Management has analyzed tax laws and regulations and their application to the Funds as of December 31, 2020, inclusive of the open tax return years, and does not believe that there are any uncertain tax positions that require recognition of a tax liability in the Funds’ financial statements.
U.S. GAAP requires that certain components of net assets be adjusted to reflect permanent differences between financial and tax reporting. These reclassifications have no effect on net assets or NAVs per share. As of period end, the following permanent differences attributable to nondeductible expenses were reclassified to the following accounts:
| | | | | | | | |
| |
| | |
| | | Emerging Markets Bond Fund | | | Systematic Multi-Strategy Fund | |
| |
Paid-in capital | | $ | — | | | $ | (15,419 | ) |
Accumulated earnings (loss) | | | — | | | | 15,419 | |
| |
The tax character of distributions paid was as follows:
| | | | | | | | | | |
| | | | |
| | | Periods | | Emerging Markets Bond Fund | | | Systematic Multi-Strategy Fund | |
Ordinary income(a) | | 12/31/20 | | $ | 1,275,436 | | | $ | 28,157,227 | |
| | 12/31/19 | | | 1,185,898 | | | | 10,882,877 | |
Long-term capital gains(a) | | 12/31/20 | | | — | | | | — | |
| | 12/31/19 | | | — | | | | 495,180 | |
Return of capital | | 12/31/20 | | | — | | | | 842,936 | |
| | 12/31/19 | | | — | | | | — | |
| | | | | | | | | | |
Total | | 12/31/20 | | $ | 1,275,436 | | | $ | 29,000,163 | |
| | | | | | | | | | |
| | 12/31/19 | | $ | 1,185,898 | | | $ | 11,378,057 | |
| | | | | | | | | | |
| | (a) | Distribution amounts may include a portion of the proceeds from redeemed shares. |
As of period end, the tax components of accumulated earnings (loss) were as follows:
| | | | | | | | |
| |
| | |
| | | Emerging Markets Bond Fund | | | Systematic Multi-Strategy Fund | |
| |
Undistributed ordinary income | | $ | 33,937 | | | $ | — | |
Non-expiring capital loss carryforwards(a) | | | (1,092,405 | ) | | | (14,425,410 | ) |
Net unrealized gains(b) | | | 454,391 | | | | 66,656,035 | |
Qualified late-year losses(c) | | | — | | | | (62,431,640 | ) |
| | | | | | | | |
| | $ | (604,077 | ) | | $ | (10,201,015 | ) |
| | | | | | | | |
| | (a) | Amounts available to offset future realized capital gains. |
| | (b) | The differences between book-basis and tax-basis net unrealized gains (losses) were attributable primarily to the tax deferral of losses on wash sales and straddles, the realization for tax purposes of unrealized gains/losses on certain futures and foreign currency contracts, the realization for tax purposes of unrealized gains on constructive sales, the accounting for swap agreements, the accrual of income on securities in default, the classification of investments, and amortization methods for premiums on fixed income securities. |
| | (c) | The Fund has elected to defer certain qualified late-year losses and recognize such losses in the next taxable year. |
As of December 31, 2020, gross unrealized appreciation and depreciation based on cost of investments (including short positions and derivatives, if any) for U.S. federal income tax purposes were as follows:
| | | | | | | | |
| |
| | |
| | | Emerging Markets Bond Fund | | | Systematic Multi-Strategy Fund | |
| |
Tax cost | | $ | 23,630,992 | | | $ | 4,157,009,621 | |
| | | | | | | | |
Gross unrealized appreciation | | $ | 2,459,636 | | | $ | 83,680,788 | |
Gross unrealized depreciation | | | (2,002,221 | ) | | | (14,586,681 | ) |
| | | | | | | | |
Net unrealized appreciation (depreciation) | | $ | 457,415 | | | $ | 69,094,107 | |
| | | | | | | | |
The Trust, on behalf of the Funds, along with certain other funds managed by the Manager and its affiliates (“Participating Funds”), is a party to a 364-day, $2.25 billion credit agreement with a group of lenders. Under this agreement, the Funds may borrow to fund shareholder redemptions. Excluding commitments designated for certain individual funds, the Participating Funds, including the Funds, can borrow up to an aggregate commitment amount of $1.75 billion at any time outstanding, subject to asset coverage and other limitations as specified in the agreement. The credit agreement has the following terms: a fee of 0.10% per annum on unused commitment amounts and interest at a rate equal to the higher of (a) one-month LIBOR (but, in any event, not less than 0.00%) on the date the loan is made plus 0.80% per annum or (b) the Fed Funds rate (but, in any event, not less than 0.00%) in effect from time to time plus 0.80% per annum on amounts borrowed. The agreement expires in April 2021 unless extended or renewed. These fees were allocated among such funds based upon portions of the aggregate commitment available to them and relative net assets of Participating Funds. During the year ended December 31, 2020, the Funds did not borrow under the credit agreement.
In the normal course of business, certain Funds invest in securities or other instruments and may enter into certain transactions, and such activities subject each Fund to various risks, including among others, fluctuations in the market (market risk) or failure of an issuer to meet all of its obligations. The value of securities or other instruments may
| | |
NOTES TO FINANCIAL STATEMENTS | | 81 |
Notes to Financial Statements (continued)
also be affected by various factors, including, without limitation: (i) the general economy; (ii) the overall market as well as local, regional or global political and/or social instability; (iii) regulation, taxation or international tax treaties between various countries; or (iv) currency, interest rate and price fluctuations. Local, regional or global events such as war, acts of terrorism, the spread of infectious illness or other public health issues, recessions, or other events could have a significant impact on the Funds and their investments. Each Fund’s prospectus provides details of the risks to which each Fund is subject.
Market Risk: Investments in the securities of issuers domiciled in countries with emerging capital markets involve certain additional risks that do not generally apply to investments in securities of issuers in more developed capital markets, such as (i) low or nonexistent trading volume, resulting in a lack of liquidity and increased volatility in prices for such securities; (ii) uncertain national policies and social, political and economic instability, increasing the potential for expropriation of assets, confiscatory taxation, high rates of inflation or unfavorable diplomatic developments; (iii) lack of publicly available or reliable information about issuers as a result of not being subject to the same degree of regulatory requirements and accounting, auditing and financial reporting standards; and (iv) possible fluctuations in exchange rates, differing legal systems and the existence or possible imposition of exchange controls, custodial restrictions or other foreign or U.S. governmental laws or restrictions applicable to such investments.
Each Fund may be exposed to prepayment risk, which is the risk that borrowers may exercise their option to prepay principal earlier than scheduled during periods of declining interest rates, which would force each Fund to reinvest in lower yielding securities. Each Fund may also be exposed to reinvestment risk, which is the risk that income from each Fund’s portfolio will decline if each Fund invests the proceeds from matured, traded or called fixed-income securities at market interest rates that are below each Fund portfolio’s current earnings rate.
An outbreak of respiratory disease caused by a novel coronavirus has developed into a global pandemic and has resulted in closing borders, quarantines, disruptions to supply chains and customer activity, as well as general concern and uncertainty. The impact of this pandemic, and other global health crises that may arise in the future, could affect the economies of many nations, individual companies and the market in general in ways that cannot necessarily be foreseen at the present time. This pandemic may result in substantial market volatility and may adversely impact the prices and liquidity of a fund’s investments. The duration of this pandemic and its effects cannot be determined with certainty.
Valuation Risk: The market values of equities, such as common stocks and preferred securities or equity related investments, such as futures and options, may decline due to general market conditions which are not specifically related to a particular company. They may also decline due to factors which affect a particular industry or industries. A Fund may invest in illiquid investments. An illiquid investment is any investment that a Fund reasonably expects cannot be sold or disposed of in current market conditions in seven calendar days or less without the sale or disposition significantly changing the market value of the investment. A Fund may experience difficulty in selling illiquid investments in a timely manner at the price that it believes the investments are worth. Prices may fluctuate widely over short or extended periods in response to company, market or economic news. Markets also tend to move in cycles, with periods of rising and falling prices. This volatility may cause each Fund’s NAV to experience significant increases or decreases over short periods of time. If there is a general decline in the securities and other markets, the NAV of a Fund may lose value, regardless of the individual results of the securities and other instruments in which a Fund invests.
The price a Fund could receive upon the sale of any particular portfolio investment may differ from a Fund’s valuation of the investment, particularly for securities that trade in thin or volatile markets or that are valued using a fair valuation technique or a price provided by an independent pricing service. Changes to significant unobservable inputs and assumptions (i.e., publicly traded company multiples, growth rate, time to exit) due to the lack of observable inputs may significantly impact the resulting fair value and therefore a Fund’s results of operations. As a result, the price received upon the sale of an investment may be less than the value ascribed by a Fund, and a Fund could realize a greater than expected loss or lesser than expected gain upon the sale of the investment. A Fund’s ability to value its investments may also be impacted by technological issues and/or errors by pricing services or other third party service providers.
Counterparty Credit Risk: The Funds may be exposed to counterparty credit risk, or the risk that an entity may fail to or be unable to perform on its commitments related to unsettled or open transactions, including making timely interest and/or principal payments or otherwise honoring its obligations. The Funds manage counterparty credit risk by entering into transactions only with counterparties that the Manager believes have the financial resources to honor their obligations and by monitoring the financial stability of those counterparties. Financial assets, which potentially expose the Funds to market, issuer and counterparty credit risks, consist principally of financial instruments and receivables due from counterparties. The extent of the Funds’ exposure to market, issuer and counterparty credit risks with respect to these financial assets is approximately their value recorded in the Statements of Assets and Liabilities, less any collateral held by the Funds.
A derivative contract may suffer a mark-to-market loss if the value of the contract decreases due to an unfavorable change in the market rates or values of the underlying instrument. Losses can also occur if the counterparty does not perform under the contract.
With exchange-traded futures, there is less counterparty credit risk to the Funds since the exchange or clearinghouse, as counterparty to such instruments, guarantees against a possible default. The clearinghouse stands between the buyer and the seller of the contract; therefore, credit risk is limited to failure of the clearinghouse. While offset rights may exist under applicable law, a Fund does not have a contractual right of offset against a clearing broker or clearinghouse in the event of a default (including the bankruptcy or insolvency). Additionally, credit risk exists in exchange-traded futures with respect to initial and variation margin that is held in a clearing broker’s customer accounts. While clearing brokers are required to segregate customer margin from their own assets, in the event that a clearing broker becomes insolvent or goes into bankruptcy and at that time there is a shortfall in the aggregate amount of margin held by the clearing broker for all its clients, typically the shortfall would be allocated on a pro rata basis across all the clearing broker’s customers, potentially resulting in losses to the Funds.
Concentration Risk: A diversified portfolio, where this is appropriate and consistent with a fund’s objectives, minimizes the risk that a price change of a particular investment will have a material impact on the NAV of a fund. The investment concentrations within certain Fund’s portfolio are disclosed in its Schedule of Investments.
Certain Funds invest a significant portion of their assets in high yield securities. High yield securities that are rated below investment-grade (commonly referred to as “junk bonds”) or are unrated may be deemed speculative, involve greater levels of risk than higher-rated securities of similar maturity and are more likely to default. High yield
| | |
| 82 | | 2 0 2 0 BLACK ROCK ANNUAL REPORT TO SHAREHOLDERS |
Notes to Financial Statements (continued)
securities may be issued by less creditworthy issuers, and issuers of high yield securities may be unable to meet their interest or principal payment obligations. High yield securities are subject to extreme price fluctuations, may be less liquid than higher rated fixed-income securities, even under normal economic conditions, and frequently have redemption features.
Certain Funds invest a significant portion of their assets in fixed-income securities and/or use derivatives tied to the fixed-income markets. Changes in market interest rates or economic conditions may affect the value and/or liquidity of such investments. Interest rate risk is the risk that prices of bonds and other fixed-income securities will increase as interest rates fall and decrease as interest rates rise. The Funds may be subject to a greater risk of rising interest rates due to the current period of historically low rates.
Certain Funds invest a significant portion of their assets in securities of issuers located in Asia or with significant exposure to Asian issuers or countries. The Asian financial markets have recently experienced volatility and adverse trends due to concerns in several Asian countries regarding monetary policy, government intervention in the markets, rising government debt levels or economic downturns. These events may spread to other countries in Asia and may affect the value and liquidity of certain of the Funds’ investments.
Certain Funds invest a significant portion of their assets in securities backed by commercial or residential mortgage loans or in issuers that hold mortgage and other asset-backed securities. When a Fund concentrates its investments in this manner, it assumes a greater risk of prepayment or payment extension by securities issuers. Changes in economic conditions, including delinquencies and/or defaults on assets underlying these securities, can affect the value, income and/or liquidity of such positions. Investment percentages in these securities are presented in the Schedules of Investments.
LIBOR Transition Risk: The United Kingdom’s Financial Conduct Authority announced a phase out of the London Interbank Offered Rate (“LIBOR”) by the end of 2021, and it is expected that LIBOR will cease to be published after that time. The Funds may be exposed to financial instruments tied to LIBOR to determine payment obligations, financing terms, hedging strategies or investment value. The transition process away from LIBOR might lead to increased volatility and illiquidity in markets for, and reduce the effectiveness of new hedges placed against, instruments whose terms currently include LIBOR. The ultimate effect of the LIBOR transition process on the Funds is uncertain.
| 11. | CAPITAL SHARE TRANSACTIONS |
Transactions in capital shares for each class were as follows:
| | | | | | | | | | | | | | | | | | | | |
| | | |
| | | Year Ended
12/31/20 | | Year Ended
12/31/19 |
| | | | |
| Fund Name / Share Class | | Shares | | Amounts | | Shares | | Amounts |
Emerging Markets Bond Fund | | | | | | | | | | | | | | | | | | | | |
Institutional | | | | | | | | | | | | | | | | | | | | |
Shares sold | | | | 9,892 | | | | $ | 89,151 | | | | | — | | | | $ | — | |
Shares issued in reinvestment of distributions | | | | 261 | | | | | 2,466 | | | | | — | | | | | — | |
Shares redeemed | | | | (189 | ) | | | | (1,774 | ) | | | | — | | | | | — | |
| | | | | | | | | | | | | | | | | | | | |
| | | | 9,964 | | | | $ | 89,843 | | | | | — | | | | $ | — | |
| | | | | | | | | | | | | | | | | | | | |
Class K | | | | | | | | | | | | | | | | | | | | |
Shares sold | | | | — | | | | $ | — | | | | | — | | | | $ | — | |
Shares issued in reinvestment of distributions | | | | — | | | | | — | | | | | — | | | | | — | |
Shares redeemed | | | | — | | | | | — | | | | | — | | | | | — | |
| | | | | | | | | | | | | | | | | | | | |
| | | | — | | | | $ | — | | | | | — | | | | $ | — | |
| | | | | | | | | | | | | | | | | | | | |
| | | | 9,964 | | | | $ | 89,843 | | | | | — | | | | $ | — | |
| | | | | | | | | | | | | | | | | | | | |
| | | | | | | | | | | | | | | | | | | | |
| | | |
| | | Year Ended
12/31/20 | | Year Ended
12/31/19 |
| | | | |
| Fund Name / Share Class | | Shares | | Amounts | | Shares | | Amounts |
Systematic Multi-Strategy Fund | | | | | | | | | | | | | | | | | | | | |
Institutional | | | | | | | | | | | | | | | | | | | | |
Shares sold | | | | 313,757,236 | | | | $ | 3,180,691,392 | | | | | 29,995,937 | | | | $ | 301,017,705 | |
Shares issued in reinvestment of distributions | | | | 2,559,501 | | | | | 25,870,980 | | | | | 689,657 | | | | | 6,834,059 | |
Shares redeemed | | | | (38,368,636 | ) | | | | (388,028,447 | ) | | | | (6,056,898 | ) | | | | (60,721,591 | ) |
| | | | | | | | | | | | | | | | | | | | |
| | | | 277,948,101 | | | | $ | 2,818,533,925 | | | | | 24,628,696 | | | | $ | 247,130,173 | |
| | | | | | | | | | | | | | | | | | | | |
Investor A | | | | | | | | | | | | | | | | | | | | |
Shares sold and automatic conversion of shares | | | | 14,113,467 | | | | $ | 143,367,057 | | | | | 7,668,519 | | | | $ | 76,759,083 | |
Shares issued in reinvestment of distributions | | | | 150,864 | | | | | 1,522,722 | | | | | 213,591 | | | | | 2,116,330 | |
Shares redeemed | | | | (4,030,662 | ) | | | | (40,338,338 | ) | | | | (618,057 | ) | | | | (6,163,789 | ) |
| | | | | | | | | | | | | | | | | | | | |
| | | | 10,233,669 | | | | $ | 104,551,441 | | | | | 7,264,053 | | | | $ | 72,711,624 | |
| | | | | | | | | | | | | | | | | | | | |
| | |
NOTES TO FINANCIAL STATEMENTS | | 83 |
Notes to Financial Statements (continued)
| | | | | | | | | | | | | | | | |
| | | |
| | | Year Ended 12/31/20 | | | Year Ended 12/31/19 | |
| | | | |
| Fund Name / Share Class (continued) | | Shares | | | Amounts | | | Shares | | | Amounts | |
Systematic Multi-Strategy Fund (continued) | | | | | | | | | | | | | | | | |
Investor C | | | | | | | | | | | | | | | | |
Shares sold | | | 475,985 | | | $ | 4,838,834 | | | | 24,664 | | | $ | 247,082 | |
Shares issued in reinvestment of distributions | | | 1,947 | | | | 19,602 | | | | 715 | | | | 7,080 | |
Shares redeemed and automatic conversion of shares | | | (24,659 | ) | | | (246,201 | ) | | | (2,412 | ) | | | (24,012 | ) |
| | | | | | | | | | | | | | | | |
| | | 453,273 | | | $ | 4,612,235 | | | | 22,967 | | | $ | 230,150 | |
| | | | | | | | | | | | | | | | |
Class K(a) | | | | | | | | | | | | | | | | |
Shares sold | | | 29,354 | | | $ | 300,000 | | | | — | | | $ | — | |
Shares issued in reinvestment of distributions | | | — | | | | — | | | | — | | | | — | |
Shares redeemed | | | — | | | | — | | | | — | | | | — | |
| | | | | | | | | | | | | | | | |
| | | 29,354 | | | $ | 300,000 | | | | — | | | $ | — | |
| | | | | | | | | | | | | | | | |
| | | 288,664,397 | | | $ | 2,927,997,601 | | | | 31,915,716 | | | $ | 320,071,947 | |
| | | | | | | | | | | | | | | | |
| | (a) | The share class commenced operation on September 29, 2020. |
As of December 31, 2020, shares owned by BlackRock Financial Management, Inc., an affiliate of the Funds, were as follows:
| | | | | | | | | | | | |
| | | | |
| Fund Name | | Institutional | | | Class K | | | Total | |
Emerging Markets Bond Fund | | | 5,000 | | | | 2,495,000 | | | | 2,500,000 | |
Systematic Multi-Strategy Fund | | | — | | | | 29,354 | | | | 29,354 | |
Management has evaluated the impact of all subsequent events on the Funds through the date the financial statements were issued and has determined that there were no subsequent events requiring adjustment or additional disclosure in the financial statements.
| | |
| 84 | | 2 0 2 0 BLACK ROCK ANNUAL REPORT TO SHAREHOLDERS |
Report of Independent Registered Public Accounting Firm
To the Shareholders of BlackRock Emerging Markets Bond Fund and BlackRock Systematic Multi-Strategy Fund and the Board of Trustees of BlackRock Funds V and BlackRock Funds IV:
Opinion on the Financial Statements and Financial Highlights
We have audited the accompanying statements of assets and liabilities of BlackRock Emerging Markets Bond Fund of BlackRock Funds V, and of BlackRock Systematic Multi-Strategy Fund of BlackRock Funds IV, (the “Funds”), including the schedules of investments, as of December 31, 2020, the related statements of operations for the year then ended, the statements of changes in net assets for each of the two years in the period then ended, the financial highlights for the periods indicated in the table below, and the related notes. In our opinion, the financial statements and financial highlights present fairly, in all material respects, the financial position of the Funds as of December 31, 2020, and the results of their operations for the year then ended, the changes in their net assets for each of the two years in the period then ended, and the financial highlights for the periods indicated in the table below, in conformity with accounting principles generally accepted in the United States of America.
| | |
Fund | | Financial Highlights |
BlackRock Emerging Markets Bond Fund | | For each of the three years in the period ended December 31, 2020 and for the period from July 27, 2017 (commencement of operations) through December 31, 2017 |
BlackRock Systematic Multi-Strategy Fund | | For each of the four years in the period ended December 31, 2020 |
The financial highlights of BlackRock Systematic Multi-Strategy Fund for the year ended December 31, 2016 were audited by other auditors whose report dated February 24, 2017, expressed an unqualified opinion on those financial highlights.
Basis for Opinion
These financial statements and financial highlights are the responsibility of the Funds’ management. Our responsibility is to express an opinion on the Funds’ financial statements and financial highlights based on our audits. We are a public accounting firm registered with the Public Company Accounting Oversight Board (United States) (PCAOB) and are required to be independent with respect to the Funds in accordance with the U.S. federal securities laws and the applicable rules and regulations of the Securities and Exchange Commission and the PCAOB.
We conducted our audits in accordance with the standards of the PCAOB. Those standards require that we plan and perform the audit to obtain reasonable assurance about whether the financial statements and financial highlights are free of material misstatement, whether due to error or fraud. The Funds are not required to have, nor were we engaged to perform, an audit of their internal control over financial reporting. As part of our audits we are required to obtain an understanding of internal control over financial reporting but not for the purpose of expressing an opinion on the effectiveness of the Funds’ internal control over financial reporting. Accordingly, we express no such opinion.
Our audits included performing procedures to assess the risks of material misstatement of the financial statements and financial highlights, whether due to error or fraud, and performing procedures that respond to those risks. Such procedures included examining, on a test basis, evidence regarding the amounts and disclosures in the financial statements and financial highlights. Our audits also included evaluating the accounting principles used and significant estimates made by management, as well as evaluating the overall presentation of the financial statements and financial highlights. Our procedures included confirmation of securities owned as of December 31, 2020, by correspondence with the custodian and brokers; when replies were not received from brokers, we performed other auditing procedures. We believe that our audits provide a reasonable basis for our opinion.
Deloitte & Touche LLP
Boston, Massachusetts
February 23, 2021
We have served as the auditor of one or more BlackRock investment companies since 1992.
| | |
REPORT OF INDEPENDENT REGISTERED PUBLIC ACCOUNTING FIRM | | 85 |
Important Tax Information (unaudited)
For corporate shareholders, the percentage of ordinary income distributions paid during the fiscal year ended December 31, 2020 that qualified for the dividends-received deduction were as follows:
| | |
| Fund Name | | Dividends-Received
Deduction |
Systematic Multi-Strategy Fund | | 4.82% |
The following maximum amounts are hereby designated as qualified dividend income for individuals for the fiscal year ended December 31, 2020:
| | | | |
| Fund Name | | Qualified Dividend
Income | |
Systematic Multi-Strategy Fund | | $ | 1,519,907 | |
For the fiscal year ended December 31, 2020, the Funds earned foreign source income and paid foreign taxes which they intend to pass through to their shareholders:
| | | | | | | | |
| Fund Name | | Foreign Source
Income Earned | | | Foreign
Taxes Paid | |
Emerging Markets Bond Fund | | $ | 1,057,152 | | | $ | — | |
For the fiscal year ended December 31, 2020, the Funds hereby designate the following maximum amounts allowable as interest-related dividends eligible for exemption from U.S. withholding tax for nonresident aliens and foreign corporations:
| | | | |
| Fund Name | | Interest-Related
Dividends | |
Systematic Multi-Strategy Fund | | $ | 15,375,880 | |
The Funds hereby designate the following amount of distributions from direct federal obligation interest for the fiscal year ended December 31, 2020:
| | | | |
| Fund Name | | Federal Obligation
Interest | |
Systematic Multi-Strategy Fund | | $ | 439,444 | |
The law varies in each state as to whether and what percent of ordinary income dividends attributable to federal obligations is exempt from state income tax. Shareholders are advised to check with their tax advisers to determine if any portion of the dividends received is exempt from state income tax.
| | |
| 86 | | 2 0 2 0 BLACK ROCK ANNUAL REPORT TO SHAREHOLDERS |
Statement Regarding Liquidity Risk Management Program
In compliance with Rule 22e-4 under the Investment Company Act of 1940, as amended (the “Liquidity Rule”), BlackRock Funds IV and BlackRock Funds V (the “Trusts”) have adopted and implemented a liquidity risk management program (the “Program”) for BlackRock Emerging Markets Bond Fund and BlackRock Systematic Multi-Strategy Fund (the “Funds”), each a series of the respective Trust, which is reasonably designed to assess and manage each Fund’s liquidity risk.
The Board of Trustees (the “Board”) of the Trusts, on behalf of the respective Funds, met on November 18-19, 2020 (the “Meeting”) to review the Program. The Board previously appointed BlackRock Advisors, LLC or BlackRock Fund Advisors (“BlackRock”), each an investment adviser to certain Funds, as the program administrator for each Fund’s Program, as applicable. BlackRock also previously delegated oversight of the Program to the 40 Act Liquidity Risk Management Committee (the “Committee”). At the Meeting, the Committee, on behalf of BlackRock, provided the Board with a report that addressed the operation of the Program and assessed its adequacy and effectiveness of implementation, including the operation of each Fund’s Highly Liquid Investment Minimum (“HLIM”) where applicable, and any material changes to the Program (the “Report”). The Report covered the period from October 1, 2019 through September 30, 2020 (the “Program Reporting Period”).
The Report described the Program’s liquidity classification methodology for categorizing a Fund’s investments (including derivative transactions) into one of four liquidity buckets. It also referenced the methodology used by BlackRock to establish a Fund’s HLIM and noted that the Committee reviews and ratifies the HLIM assigned to each Fund no less frequently than annually. The Report also discussed notable events affecting liquidity over the Program Reporting Period, including the impact of the coronavirus outbreak on the Funds and the overall market.
The Report noted that the Program complied with the key factors for consideration under the Liquidity Rule for assessing, managing and periodically reviewing a Fund’s liquidity risk, as follows:
| | a) | The Fund’s investment strategy and liquidity of portfolio investments during both normal and reasonably foreseeable stressed conditions. During the Program Reporting Period, the Committee reviewed whether each Fund’s strategy is appropriate for an open-end fund structure with a focus on Funds with more significant and consistent holdings of less liquid and illiquid assets. The Committee also factored a Fund’s concentration in an issuer into the liquidity classification methodology by taking issuer position sizes into account. Where a Fund participated in borrowings for investment purposes (such as tender option bonds and reverse repurchase agreements), such borrowings were factored into the Program’s calculation of a Fund’s liquidity bucketing. Derivative exposure was also considered in such calculation. |
| | b) | Short-term and long-term cash flow projections during both normal and reasonably foreseeable stressed conditions. During the Program Reporting Period, the Committee reviewed historical net redemption activity and used this information as a component to establish each Fund’s reasonably anticipated trading size (“RATS”). Each Fund has adopted an in-kind redemption policy which may be utilized to meet larger redemption requests. The Committee may also take into consideration a Fund’s shareholder ownership concentration (which, depending on product type and distribution channel, may or may not be available), a Fund’s distribution channels, and the degree of certainty associated with a Fund’s short-term and long-term cash flow projections. |
| | c) | Holdings of cash and cash equivalents, as well as borrowing arrangements. The Committee considered the terms of the credit facility committed to the Funds, the financial health of the institution providing the facility and the fact that the credit facility is shared among multiple Funds (including that a portion of the aggregate commitment amount is specifically designated for BlackRock Floating Rate Income Portfolio, a series of BlackRock Funds V). The Committee also considered other types of borrowing available to the Funds, such as the ability to use reverse repurchase agreements and interfund lending, as applicable. |
There were no material changes to the Program during the Program Reporting Period. The Report provided to the Board stated that the Committee concluded that based on the operation of the functions, as described in the Report, the Program is operating as intended and is effective in implementing the requirements of the Liquidity Rule.
| | |
STATEMENT REGARDING LIQUIDITY RISK MANAGEMENT PROGRAM | | 87 |
Trustee and Officer Information
| | | | | | | | |
| Independent Trustees(a) |
Name Year of Birth(b) | | Position(s) Held (Length of Service)(c) | | Principal Occupation(s) During Past Five Years | | Number of BlackRock-Advised
Registered Investment Companies
(“RICs”) Consisting of
Investment Portfolios
(“Portfolios”) Overseen | | Public Company and Other Investment Company Directorships Held
During Past Five Years |
Richard E. Cavanagh 1946 | | Co-Chair of the Board and Trustee (Since 2019) | | Director, The Guardian Life Insurance Company of America since 1998; Board Chair, Volunteers of America (a not-for-profit organization) from 2015 to 2018 (board member since 2009); Director, Arch Chemicals (chemical and allied products) from 1999 to 2011; Trustee, Educational Testing Service from 1997 to 2009 and Chairman thereof from 2005 to 2009; Senior Advisor, The Fremont Group since 2008 and Director thereof since 1996; Faculty Member/Adjunct Lecturer, Harvard University since 2007 and Executive Dean from 1987 to 1995; President and Chief Executive Officer, The Conference Board, Inc. (global business research organization) from 1995 to 2007. | | 84 RICs consisting of 108 Portfolios | | None |
Karen P. Robards 1950 | | Co-Chair of the Board and Trustee (Since 2019) | | Principal of Robards & Company, LLC (consulting and private investing) since 1987; Co-founder and Director of the Cooke Center for Learning and Development (a not- for-profit organization) since 1987; Director of Enable Injections, LLC (medical devices) since 2019; Investment Banker at Morgan Stanley from 1976 to 1987. | | 84 RICs consisting of 108 Portfolios | | Greenhill & Co., Inc.; AtriCure, Inc. (medical devices) from 2000 until 2017 |
| Michael J. Castellano 1946 | | Trustee (Since 2019) | | Chief Financial Officer of Lazard Group LLC from 2001 to 2011; Chief Financial Officer of Lazard Ltd from 2004 to 2011; Director, Support Our Aging Religious (non-profit) from 2009 to June 2015 and from 2017 to September 2020; Director, National Advisory Board of Church Management at Villanova University since 2010; Trustee, Domestic Church Media Foundation since 2012; Director, CircleBlack Inc. (financial technology company) from 2015 to July 2020. | | 84 RICs consisting of 108 Portfolios | | None |
Cynthia L. Egan 1955 | | Trustee (Since 2019) | | Advisor, U.S. Department of the Treasury from 2014 to 2015; President, Retirement Plan Services, for T. Rowe Price Group, Inc. from 2007 to 2012; executive positions within Fidelity Investments from 1989 to 2007. | | 84 RICs consisting of 108 Portfolios | | Unum (insurance); The Hanover Insurance Group (Board Chair) (insurance); Huntsman Corporation (chemical products); Envestnet (investment platform) from 2013 until 2016 |
Frank J. Fabozzi(d) 1948 | | Trustee (Since 2019) | | Editor of The Journal of Portfolio Management since 1986; Professor of Finance, EDHEC Business School (France) since 2011; Visiting Professor, Princeton University for the 2013 to 2014 academic year and Spring 2017 semester; Professor in the Practice of Finance, Yale University School of Management from 1994 to 2011 and currently a Teaching Fellow in Yale’s Executive Programs; Board Member, BlackRock Equity-Liquidity Funds from 2014 to 2016; affiliated professor Karlsruhe Institute of Technology from 2008 to 2011; Visiting Professor, Rutgers University for the Spring 2019 semester; Visiting Professor, New York University for the 2019 academic year. | | 85 RICs consisting of 109 Portfolios | | None |
| | |
| 88 | | 2 0 2 0 BLACK ROCK ANNUAL REPORT TO SHAREHOLDERS |
| | |
Trustee and Officer Information (continued)
| | | | | | | | |
| Independent Trustees(a) (continued) |
Name Year of Birth(b) | | Position(s) Held (Length of Service)(c) | | Principal Occupation(s) During Past Five Years | | Number of BlackRock-Advised
Registered Investment Companies
(“RICs”) Consisting of
Investment Portfolios
(“Portfolios”) Overseen | | Public Company and Other Investment Company Directorships
Held During Past Five Years |
R. Glenn Hubbard 1958 | | Trustee (Since 2019) | | Dean, Columbia Business School from 2004 to 2019; Faculty member, Columbia Business School since 1988. | | 84 RICs consisting of 108 Portfolios | | ADP (data and information services); Metropolitan Life Insurance Company (insurance); KKR Financial Corporation (finance) from 2004 until 2014 |
| W. Carl Kester(d) 1951 | | Trustee (Since 2019) | | George Fisher Baker Jr. Professor of Business Administration, Harvard Business School since 2008; Deputy Dean for Academic Affairs from 2006 to 2010; Chairman of the Finance Unit, from 2005 to 2006; Senior Associate Dean and Chairman of the MBA Program from 1999 to 2005; Member of the faculty of Harvard Business School since 1981. | | 85 RICs consisting of 109 Portfolios | | None |
Catherine A. Lynch(d) 1961 | | Trustee (Since 2019) | | Chief Executive Officer, Chief Investment Officer and various other positions, National Railroad Retirement Investment Trust from 2003 to 2016; Associate Vice President for Treasury Management, The George Washington University from 1999 to 2003; Assistant Treasurer, Episcopal Church of America from 1995 to 1999. | | 85 RICs consisting of 109 Portfolios | | None |
|
| Interested Trustees(a)(e) |
Name Year of Birth(b) | | Position(s) Held (Length of Service)(c) | | Principal Occupation(s) During Past Five Years | | Number of BlackRock-Advised
Registered Investment Companies
(“RICs”) Consisting of
Investment Portfolios
(“Portfolios”) Overseen | | Public Company
and Other
Investment
Company
Directorships
Held During
Past Five Years |
Robert Fairbairn 1965 | | Trustee (Since 2018) | | Vice Chairman of BlackRock, Inc. since 2019; Member of BlackRock’s Global Executive and Global Operating Committees; Co-Chair of BlackRock’s Human Capital Committee; Senior Managing Director of BlackRock, Inc. from 2010 to 2019; oversaw BlackRock’s Strategic Partner Program and Strategic Product Management Group from 2012 to 2019; Member of the Board of Managers of BlackRock Investments, LLC from 2011 to 2018; Global Head of BlackRock’s Retail and iShares® businesses from 2012 to 2016. | | 117 RICs consisting of 267 Portfolios | | None |
John M. Perlowski(d) 1964 | | Trustee (Since 2015); President and Chief Executive Officer (Since 2010) | | Managing Director of BlackRock, Inc. since 2009; Head of BlackRock Global Accounting and Product Services since 2009; Advisory Director of Family Resource Network (charitable foundation) since 2009. | | 118 RICs consisting of 268 Portfolios | | None |
| (a) | The address of each Trustee is c/o BlackRock, Inc., 55 East 52nd Street, New York, New York 10055. |
| (b) | Each Independent Trustee holds office until his or her successor is duly elected and qualifies or until his or her earlier death, resignation, retirement or removal as provided by the Trust’s by-laws or charter or statute, or until December 31 of the year in which he or she turns 75. Trustees who are “interested persons,” as defined in the Investment Company Act serve until their successor is duly elected and qualifies or until their earlier death, resignation, retirement or removal as provided by the Trust’s by-laws or statute, or until December 31 of the year in which they turn 72. The Board may determine to extend the terms of Independent Trustees on a case-by-case basis, as appropriate. |
| | |
TRUSTEE AND OFFICER INFORMATION | | 89 |
Trustee and Officer Information (continued)
| (c) | Following the combination of Merrill Lynch Investment Managers, L.P. (“MLIM”) and BlackRock, Inc. in September 2006, the various legacy MLIM and legacy BlackRock fund boards were realigned and consolidated into three new fund boards in 2007. Certain Independent Trustees first became members of the boards of other legacy MLIM or legacy BlackRock funds as follows: Richard E. Cavanagh, 1994; Frank J. Fabozzi, 1988; R. Glenn Hubbard, 2004; W. Carl Kester, 1995; and Karen P. Robards, 1998. Certain other Independent Trustees became members of the boards of the closed-end funds in the Fixed-Income Complex as follows: Michael J. Castellano, 2011; Cynthia L. Egan, 2016; and Catherine A. Lynch, 2016. |
| (d) | Dr. Fabozzi, Dr. Kester, Ms. Lynch and Mr. Perlowski are also trustees of the BlackRock Credit Strategies Fund. |
| (e) | Mr. Fairbairn and Mr. Perlowski are both “interested persons,” as defined in the 1940 Act, of the Trust based on their positions with BlackRock, Inc. and its affiliates. Mr. Fairbairn and Mr. Perlowski are also board members of the BlackRock Multi-Asset Complex. |
| | | | |
| Officers Who Are Not Trustees(a) |
Name Year of Birth(b) | | Position(s) Held (Length of Service) | | Principal Occupation(s) During Past Five Years |
| | |
Jennifer McGovern 1977 | | Vice President (Since 2014) | | Managing Director of BlackRock, Inc. since 2016; Director of BlackRock, Inc. from 2011 to 2015; Head of Americas Product Development and Governance for BlackRock’s Global Product Group since 2019; Head of Product Structure and Oversight for BlackRock’s U.S. Wealth Advisory Group from 2013 to 2019. |
| | |
Neal J. Andrews 1966 | | Chief Financial Officer (Since 2007) | | Chief Financial Officer of the iShares® exchange traded funds from 2019 to 2020; Managing Director of BlackRock, Inc. since 2006. |
| | |
Jay M. Fife 1970 | | Treasurer (Since 2007) | | Managing Director of BlackRock, Inc. since 2007. |
| | |
Charles Park 1967 | | Chief Compliance Officer (Since 2014) | | Anti-Money Laundering Compliance Officer for certain BlackRock-advised Funds from 2014 to 2015; Chief Compliance Officer of BlackRock Advisors, LLC and the BlackRock-advised Funds in the BlackRock Multi-Asset Complex and the BlackRock Fixed-Income Complex since 2014; Principal of and Chief Compliance Officer for iShares® Delaware Trust Sponsor LLC since 2012 and BlackRock Fund Advisors (“BFA”) since 2006; Chief Compliance Officer for the BFA-advised iShares® exchange traded funds since 2006; Chief Compliance Officer for BlackRock Asset Management International Inc. since 2012. |
| | |
Lisa Belle 1968 | | Anti-Money Laundering Compliance Officer (Since 2019) | | Managing Director of BlackRock, Inc. since 2019; Global Financial Crime Head for Asset and Wealth Management of JP Morgan from 2013 to 2019; Managing Director of RBS Securities from 2012 to 2013; Head of Financial Crimes for Barclays Wealth Americas from 2010 to 2012. |
| | |
Janey Ahn 1975 | | Secretary (Since 2019) | | Managing Director of BlackRock, Inc. since 2018; Director of BlackRock, Inc. from 2009 to 2017. |
| (a) | The address of each Officer is c/o BlackRock, Inc., 55 East 52nd Street, New York, New York 10055. |
| (b) | Officers of the Trust serve at the pleasure of the Board. |
Further information about the Trust’s Trustees and Officers is available in the Trust’s Statement of Additional Information, which can be obtained without charge by calling (800) 441-7762.
Neal J. Andrews retired as the Chief Financial Officer effective December 31, 2020, and Trent Walker was elected as the Chief Financial Officer effective January 1, 2021.
| | |
| 90 | | 2 0 2 0 BLACK ROCK ANNUAL REPORT TO SHAREHOLDERS |
Additional Information
Regulation Regarding Derivatives
On October 28, 2020, the Securities and Exchange Commission (the “SEC”) adopted new regulations governing the use of derivatives by registered investment companies (“Rule 18f-4”). The Funds will be required to implement and comply with Rule 18f-4 by the third quarter of 2022. Once implemented, Rule 18f-4 will impose limits on the amount of derivatives a fund can enter into, eliminate the asset segregation framework currently used by funds to comply with Section 18 of the 1940 Act, treat derivatives as senior securities so that a failure to comply with the limits would result in a statutory violation and require funds whose use of derivatives is more than a limited specified exposure amount to establish and maintain a comprehensive derivatives risk management program and appoint a derivatives risk manager.
General Information
Quarterly performance, semi-annual and annual reports, current net asset value and other information regarding the Funds may be found on BlackRock’s website, which can be accessed at blackrock.com. Any reference to BlackRock’s website in this report is intended to allow investors public access to information regarding the Funds and does not, and is not intended to, incorporate BlackRock’s website in this report.
Householding
The Funds will mail only one copy of shareholder documents, including prospectuses, annual and semi-annual reports, Rule 30e-3 notices and proxy statements, to shareholders with multiple accounts at the same address. This practice is commonly called “householding” and is intended to reduce expenses and eliminate duplicate mailings of shareholder documents. Mailings of your shareholder documents may be householded indefinitely unless you instruct us otherwise. If you do not want the mailing of these documents to be combined with those for other members of your household, please call the Funds at (800) 441-7762.
Availability of Quarterly Schedule of Investments
The Funds file their complete schedule of portfolio holdings with the SEC for the first and third quarters of each fiscal year as an exhibit to their reports on Form N-PORT. The Funds’ Forms N-PORT are available on the SEC’s website at sec.gov. Additionally, each Fund makes its portfolio holdings for the first and third quarters of each fiscal year available at blackrock.com/fundreports.
Availability of Proxy Voting Policies and Procedures
A description of the policies and procedures that the Funds use to determine how to vote proxies relating to portfolio securities is available upon request and without charge (1) by calling (800) 441-7762; (2) at blackrock.com; and (3) on the SEC’s website at sec.gov.
Availability of Proxy Voting Record
Information about how the Funds voted proxies relating to securities held in the Funds’ portfolios during the most recent 12-month period ended June 30 is available upon request and without charge (1) at blackrock.com; or by calling (800) 441-7762 and (2) on the SEC’s website at sec.gov.
BlackRock’s Mutual Fund Family
BlackRock offers a diverse lineup of open-end mutual funds crossing all investment styles and managed by experts in equity, fixed-income and tax-exempt investing. Visit blackrock.com for more information.
Shareholder Privileges
Account Information
Call us at (800) 441-7762 from 8:00 AM to 6:00 PM ET on any business day to get information about your account balances, recent transactions and share prices. You can also visit blackrock.com for more information.
Automatic Investment Plans
Investor class shareholders who want to invest regularly can arrange to have $50 or more automatically deducted from their checking or savings account and invested in any of the BlackRock funds.
Systematic Withdrawal Plans
Investor class shareholders can establish a systematic withdrawal plan and receive periodic payments of $50 or more from their BlackRock funds, as long as their account balance is at least $10,000.
Retirement Plans
Shareholders may make investments in conjunction with Traditional, Rollover, Roth, Coverdell, Simple IRAs, SEP IRAs and 403(b) Plans.
| | |
ADDITIONAL INFORMATION | | 91 |
Additional Information (continued)
BlackRock Privacy Principles
BlackRock is committed to maintaining the privacy of its current and former fund investors and individual clients (collectively, “Clients”) and to safeguarding their non-public personal information. The following information is provided to help you understand what personal information BlackRock collects, how we protect that information and why in certain cases we share such information with select parties.
If you are located in a jurisdiction where specific laws, rules or regulations require BlackRock to provide you with additional or different privacy-related rights beyond what is set forth below, then BlackRock will comply with those specific laws, rules or regulations.
BlackRock obtains or verifies personal non-public information from and about you from different sources, including the following: (i) information we receive from you or, if applicable, your financial intermediary, on applications, forms or other documents; (ii) information about your transactions with us, our affiliates, or others; (iii) information we receive from a consumer reporting agency; and (iv) from visits to our websites.
BlackRock does not sell or disclose to non-affiliated third parties any non-public personal information about its Clients, except as permitted by law or as is necessary to respond to regulatory requests or to service Client accounts. These non-affiliated third parties are required to protect the confidentiality and security of this information and to use it only for its intended purpose.
We may share information with our affiliates to service your account or to provide you with information about other BlackRock products or services that may be of interest to you. In addition, BlackRock restricts access to non-public personal information about its Clients to those BlackRock employees with a legitimate business need for the information. BlackRock maintains physical, electronic and procedural safeguards that are designed to protect the non-public personal information of its Clients, including procedures relating to the proper storage and disposal of such information.
| | |
Fund and Service Providers | | |
| |
Investment Adviser and Administrator | | Distributor |
BlackRock Advisors, LLC | | BlackRock Investments, LLC |
Wilmington, DE 19809 | | New York, NY 10022 |
| |
Sub-Adviser | | Independent Registered Public Accounting Firm |
BlackRock International Limited | | Deloitte & Touche LLP |
Edinburgh, EH3 8BL | | Boston, MA 02116 |
United Kingdom | | |
| |
Accounting Agent and Custodian | | Legal Counsel |
State Street Bank and Trust Company | | Willkie Farr & Gallagher LLP |
Boston, MA 02111 | | New York, NY 10019 |
| |
Transfer Agent | | Address of the Funds |
BNY Mellon Investment Servicing (US) Inc. | | 100 Bellevue Parkway |
Wilmington, DE 19809 | | Wilmington, DE 19809 |
| | |
| 92 | | 2 0 2 0 BLACK ROCK ANNUAL REPORT TO SHAREHOLDERS |
Glossary of Terms Used in this Report
| | |
| Currency Abbreviation |
| |
AUD | | Australian Dollar |
| |
BRL | | Brazilian Real |
| |
CAD | | Canadian Dollar |
| |
CNH | | Chinese Yuan |
| |
CNY | | Chinese Yuan |
| |
EGP | | Egyptian Pound |
| |
EUR | | Euro |
| |
GBP | | British Pound |
| |
HKD | | Hong Kong Dollar |
| |
KRW | | South Korean Won |
| |
MXN | | Mexican Peso |
| |
PLN | | Polish Zloty |
| |
RUB | | New Russian Ruble |
| |
SEK | | Swedish Krona |
| |
SGD | | Singapore Dollar |
| |
TRY | | Turkish Lira |
| |
USD | | United States Dollar |
| |
ZAR | | South African Rand |
|
| Portfolio Abbreviation |
| |
BBR | | Bank Bill Rate |
| |
CMT | | Constant Maturity Treasury |
| |
DAC | | Designated Activity Company |
| |
EURIBOR | | Euro Interbank Offered Rate |
| |
GMTN | | Global Medium-Term Note |
| |
HIBOR | | Hong Kong Interbank Offered Rate |
| |
JSC | | Joint Stock Company |
| |
LIBOR | | London Interbank Offered Rate |
| |
MSCI | | Morgan Stanley Capital International |
| |
MXIBOR | | Mexico Interbank Offered Rate |
| |
PIK | | Payment-in-Kind |
| |
REIT | | Real Estate Investment Trust |
| |
REMIC | | Real Estate Mortgage Investment Conduit |
| |
S&P | | Standard & Poor’s |
| |
SIBOR | | Singapore Interbank Offered Rate |
| |
STIBOR | | Stockholm Interbank Offered Rate |
| |
TBA | | To-Be-Announced |
| |
WIBOR | | Warsaw Interbank Offered Rate |
| | |
GLOSSARY OF TERMS USED IN THIS REPORT | | 93 |
Want to know more?
blackrock.com | 800-441-7762
This report is intended for current holders. It is not authorized for use as an offer of sale or a solicitation of an offer to buy shares of the Funds unless preceded or accompanied by the Funds’ current prospectus. Past performance results shown in this report should not be considered a representation of future performance. Investment returns and principal value of shares will fluctuate so that shares, when redeemed, may be worth more or less than their original cost. Statements and other information herein are as dated and are subject to change.
FIXINC-12/20-AR
(b) Not Applicable
| Item 2 – | Code of Ethics – The registrant (or the “Fund”) has adopted a code of ethics, as of the end of the period covered by this report, applicable to the registrant’s principal executive officer, principal financial officer, principal accounting officer or controller, or persons performing similar functions. During the period covered by this report, the code of ethics was amended to update certain information and to make other non-material changes. During the period covered by this report, there have been no waivers granted under the code of ethics. The registrant undertakes to provide a copy of the code of ethics to any person upon request, without charge, who calls 1-800-441-7762. |
| Item 3 – | Audit Committee Financial Expert – The registrant’s board of directors (the “board of directors”), has determined that (i) the registrant has the following audit committee financial experts serving on its audit committee and (ii) each audit committee financial expert is independent: |
Michael Castellano
Frank J. Fabozzi
Catherine A. Lynch
Karen P. Robards
The registrant’s board of directors has determined that Karen P. Robards qualifies as an audit committee financial expert pursuant to Item 3(c)(4) of Form N-CSR.
Ms. Robards has a thorough understanding of generally accepted accounting principles, financial statements and internal control over financial reporting as well as audit committee functions. Ms. Robards has been President of Robards & Company, a financial advisory firm, since 1987. Ms. Robards was formerly an investment banker for more than 10 years where she was responsible for evaluating and assessing the performance of companies based on their financial results. Ms. Robards has over 30 years of experience analyzing financial statements. She also is a member of the audit committee of one publicly held company and a non-profit organization.
Under applicable securities laws, a person determined to be an audit committee financial expert will not be deemed an “expert” for any purpose, including without limitation for the purposes of Section 11 of the Securities Act of 1933, as a result of being designated or identified as an audit committee financial expert. The designation or identification of a person as an audit committee financial expert does not impose on such person any duties, obligations, or liabilities greater than the duties, obligations, and liabilities imposed on such person as a member of the audit committee and board of directors in the absence of such designation or identification. The designation or identification of a person as an audit committee financial expert does not affect the duties, obligations, or liability of any other member of the audit committee or board of directors.
| Item 4 – | Principal Accountant Fees and Services |
The following table presents fees billed by Deloitte & Touche (“D&T) in each of the last two fiscal years for the services rendered to the Fund:
| | | | | | | | | | | | | | | | |
| | | (a) Audit Fees | | (b) Audit-Related Fees1 | | (c) Tax Fees2 | | (d) All Other Fees |
| Entity Name | | Current
Fiscal Year
End | | Previous
Fiscal Year
End | | Current
Fiscal Year
End | | Previous
Fiscal Year
End | | Current
Fiscal Year End | | Previous
Fiscal Year
End | | Current
Fiscal Year
End | | Previous
Fiscal Year
End |
| BlackRock Systematic Multi-Strategy Fund | | $65,688 | | $65,688 | | $4,000 | | $0 | | $26,800 | | $20,600 | | $0 | | $0 |
2
The following table presents fees billed by D&T that were required to be approved by the registrant’s audit committee (the “Committee”) for services that relate directly to the operations or financial reporting of the Fund and that are rendered on behalf of BlackRock Advisors, LLC (the “Investment Adviser” or “BlackRock”) and entities controlling, controlled by, or under common control with BlackRock (not including any sub-adviser whose role is primarily portfolio management and is subcontracted with or overseen by another investment adviser) that provide ongoing services to the Fund (“Affiliated Service Providers”):
| | | | |
| | | Current Fiscal Year End | | Previous Fiscal Year End |
| (b) Audit-Related Fees1 | | $0 | | $0 |
| (c) Tax Fees2 | | $0 | | $0 |
| (d) All Other Fees3 | | $1,984,000 | | $2,050,500 |
1 The nature of the services includes assurance and related services reasonably related to the performance of the audit or review of financial statements not included in Audit Fees, including accounting consultations, agreed-upon procedure reports, attestation reports, comfort letters, out-of-pocket expenses and internal control reviews not required by regulators.
2 The nature of the services includes tax compliance and/or tax preparation, including services relating to the filing or amendment of federal, state or local income tax returns, regulated investment company qualification reviews, taxable income and tax distribution calculations.
3 Non-audit fees of $1,984,000 and $2,050,500 for the current fiscal year and previous fiscal year, respectively, were paid to the Fund’s principal accountant in their entirety by BlackRock, in connection with services provided to the Affiliated Service Providers of the Fund and of certain other funds sponsored and advised by BlackRock or its affiliates for a service organization review and an accounting research tool subscription. These amounts represent aggregate fees paid by BlackRock and were not allocated on a per fund basis.
(e)(1) Audit Committee Pre-Approval Policies and Procedures:
The Committee has adopted policies and procedures with regard to the pre-approval of services. Audit, audit-related and tax compliance services provided to the registrant on an annual basis require specific pre-approval by the Committee. The Committee also must approve other non-audit services provided to the registrant and those non-audit services provided to the Investment Adviser and Affiliated Service Providers that relate directly to the operations and the financial reporting of the registrant. Certain of these non-audit services that the Committee believes are (a) consistent with the SEC’s auditor independence rules and (b) routine and recurring services that will not impair the independence of the independent accountants may be approved by the Committee without consideration on a specific case-by-case basis (“general pre-approval”). The term of any general pre-approval is 12 months from the date of the pre-approval, unless the Committee provides for a different period. Tax or other non-audit services provided to the registrant which have a direct impact on the operations or financial reporting of the registrant will only be deemed pre-approved provided that any individual project does not exceed $10,000 attributable to the registrant or $50,000 per project. For this purpose, multiple projects will be aggregated to determine if they exceed the previously mentioned cost levels.
Any proposed services exceeding the pre-approved cost levels will require specific pre-approval by the Committee, as will any other services not subject to general pre-approval (e.g., unanticipated but permissible services). The Committee is informed of each service approved subject to general pre-approval at the next regularly scheduled in-person board meeting. At this meeting, an analysis of such services is presented to the Committee for ratification. The Committee may delegate to the Committee Chairman the authority to approve the provision of and fees for any specific engagement of permitted non-audit services, including services exceeding pre-approved cost levels.
3
(e)(2) None of the services described in each of Items 4(b) through (d) were approved by the Committee pursuant to the de minimis exception in paragraph (c)(7)(i)(C) of Rule 2-01 of Regulation S-X.
(f) Not Applicable
(g) The aggregate non-audit fees, defined as the sum of the fees shown under “Audit-Related Fees,” “Tax Fees” and “All Other Fees,” paid to the accountant for services rendered by the accountant to the registrant, the Investment Adviser and the Affiliated Service Providers were:
| | | | | | | | | | | | | | |
| | | | Entity Name | | Current Fiscal Year
End | | Previous Fiscal Year
End | | | | | | |
| | | | BlackRock Systematic Multi-Strategy Fund | | $30,800 | | $20,600 | | | | | | |
Additionally, the amounts billed by D&T in connection with services provided to the Affiliated Service Providers of the Fund and of other funds sponsored and advised by BlackRock or its affiliates during the current and previous fiscal years for a service organization review and an accounting research tool subscription were:
| | |
Current Fiscal Year
End | | Previous Fiscal Year
End |
$1,984,000 | | $2,050,500 |
These amounts represent aggregate fees paid by BlackRock and were not allocated on a per fund basis.
(h) The Committee has considered and determined that the provision of non-audit services that were rendered to the Investment Adviser and the Affiliated Service Providers that were not pre-approved pursuant to paragraph (c)(7)(ii) of Rule 2-01 of Regulation S-X is compatible with maintaining the principal accountant’s independence.
| Item 5 – | Audit Committee of Listed Registrant – Not Applicable |
(a) The registrant’s Schedule of Investments is included as part of the Report to Stockholders filed under Item 1 of this Form.
(b) Not Applicable due to no such divestments during the semi-annual period covered since the previous Form N-CSR filing.
| Item 7 – | Disclosure of Proxy Voting Policies and Procedures for Closed-End Management Investment Companies – Not Applicable |
| Item 8 – | Portfolio Managers of Closed-End Management Investment Companies – Not Applicable |
| Item 9 – | Purchases of Equity Securities by Closed-End Management Investment Company and Affiliated Purchasers – Not Applicable |
4
| Item 10 – | Submission of Matters to a Vote of Security Holders – There have been no material changes to these procedures. |
| Item 11 – | Controls and Procedures |
(a) The registrant’s principal executive and principal financial officers, or persons performing similar functions, have concluded that the registrant’s disclosure controls and procedures (as defined in Rule 30a-3(c) under the Investment Company Act of 1940, as amended (the “1940 Act”)) are effective as of a date within 90 days of the filing of this report based on the evaluation of these controls and procedures required by Rule 30a-3(b) under the 1940 Act and Rule 15d-15(b) under the Securities Exchange Act of 1934, as amended.
(b) There were no changes in the registrant’s internal control over financial reporting (as defined in Rule 30a-3(d) under the 1940 Act) that occurred during the period covered by this report that have materially affected, or are reasonably likely to materially affect, the registrant’s internal control over financial reporting.
| Item 12 – | Disclosure of Securities Lending Activities for Closed-End Management Investment Companies – Not Applicable |
| Item 13 – | Exhibits attached hereto |
(a)(1) Code of Ethics – See Item 2
(a)(2) Section 302 Certifications are attached
(a)(3) Not Applicable
(a)(4) Not Applicable
(b) Section 906 Certifications are attached
5
Pursuant to the requirements of the Securities Exchange Act of 1934 and the Investment Company Act of 1940, the registrant has duly caused this report to be signed on its behalf by the undersigned, thereunto duly authorized.
BlackRock Funds IV
| | | | |
| | By: | | /s/ John M. Perlowski |
| | | | John M. Perlowski |
| | | | Chief Executive Officer (principal executive officer) of |
| | | | BlackRock Funds IV |
Date: March 5, 2021
Pursuant to the requirements of the Securities Exchange Act of 1934 and the Investment Company Act of 1940, this report has been signed below by the following persons on behalf of the registrant and in the capacities and on the dates indicated.
| | | | |
| | By: | | /s/ John M. Perlowski |
| | | | John M. Perlowski |
| | | | Chief Executive Officer (principal executive officer) of |
| | | | BlackRock Funds IV |
Date: March 5, 2021
| | | | |
| | By: | | /s/ Trent Walker |
| | | | Trent Walker |
| | | | Chief Financial Officer (principal financial officer) of |
| | | | BlackRock Funds IV |
Date: March 5, 2021
6