Wells Fargo Commercial Mortgage Trust 2018-C45
Filed: 20 Jun 18, 4:15pm
| FREE WRITING PROSPECTUS | ||
| FILED PURSUANT TO RULE 433 | ||
| REGISTRATION FILE NO.: 333-206677-25 | ||
 |  |
Free Writing Prospectus
Structural and Collateral Term Sheet
$658,765,419
(Approximate Initial Pool Balance)
$571,479,000
(Approximate Aggregate Certificate Balance of Offered Certificates)
Wells Fargo Commercial Mortgage Trust 2018-C45
as Issuing Entity
Wells Fargo Commercial Mortgage Securities, Inc.
as Depositor
Wells Fargo Bank, National Association
Barclays Bank PLC
Rialto Mortgage Finance, LLC
C-III Commercial Mortgage LLC
as Sponsors and Mortgage Loan Sellers
Commercial Mortgage Pass-Through Certificates
Series 2018-C45
June 19, 2018
WELLS FARGO SECURITIES
Co-Lead Manager and Joint Bookrunner | BARCLAYS
Co-Lead Manager and Joint Bookrunner | |
Academy Securities Co-Manager |
STATEMENT REGARDING THIS FREE WRITING PROSPECTUS
The depositor has filed a registration statement (including a prospectus) with the Securities and Exchange Commission (’’SEC’’) (SEC File No. 333-206677) for the offering to which this communication relates. Before you invest, you should read the prospectus in the registration statement and other documents the depositor has filed with the SEC for more complete information about the depositor, the issuing entity and this offering. You may get these documents for free by visiting EDGAR on the SEC Web site at www.sec.gov. Alternatively, the depositor, any underwriter, or any dealer participating in the offering will arrange to send you the prospectus after filing if you request it by calling toll free 1-800-745-2063 (8 a.m. – 5 p.m. EST) or by emailing wfs.cmbs@wellsfargo.com.
Nothing in this document constitutes an offer of securities for sale in any jurisdiction where the offer or sale is not permitted. The information contained herein is preliminary as of the date hereof, supersedes any such information previously delivered to you and will be superseded by any such information subsequently delivered and ultimately by the final prospectus relating to the securities. These materials are subject to change, completion, supplement or amendment from time to time.
This free writing prospectus has been prepared by the underwriters for information purposes only and does not constitute, in whole or in part, a prospectus for the purposes of Directive 2003/71/EC (as amended) and/or Part VI of the Financial Services and Markets Act 2000, as amended, or other offering document.
STATEMENT REGARDING ASSUMPTIONS AS TO SECURITIES, PRICING ESTIMATES AND OTHER INFORMATION
The attached information contains certain tables and other statistical analyses (the “Computational Materials”) which have been prepared in reliance upon information furnished by the Mortgage Loan Sellers. Numerous assumptions were used in preparing the Computational Materials, which may or may not be reflected herein. As such, no assurance can be given as to the Computational Materials’ accuracy, appropriateness or completeness in any particular context; or as to whether the Computational Materials and/or the assumptions upon which they are based reflect present market conditions or future market performance. The Computational Materials should not be construed as either projections or predictions or as legal, tax, financial or accounting advice. You should consult your own counsel, accountant and other advisors as to the legal, tax, business, financial and related aspects of a purchase of these securities. Any weighted average lives, yields and principal payment periods shown in the Computational Materials are based on prepayment and/or loss assumptions, and changes in such prepayment and/or loss assumptions may dramatically affect such weighted average lives, yields and principal payment periods. In addition, it is possible that prepayments or losses on the underlying assets will occur at rates higher or lower than the rates shown in the attached Computational Materials. The specific characteristics of the securities may differ from those shown in the Computational Materials due to differences between the final underlying assets and the preliminary underlying assets used in preparing the Computational Materials. The principal amount and designation of any security described in the Computational Materials are subject to change prior to issuance. None of Wells Fargo Securities, LLC, Barclays Capital Inc., Academy Securities, Inc., or any of their respective affiliates, make any representation or warranty as to the actual rate or timing of payments or losses on any of the underlying assets or the payments or yield on the securities. The information in this presentation is based upon management forecasts and reflects prevailing conditions and management’s views as of this date, all of which are subject to change. In preparing this presentation, we have relied upon and assumed, without independent verification, the accuracy and completeness of all information available from public sources or which was provided to us by or on behalf of the Mortgage Loan Sellers or which was otherwise reviewed by us.
This free writing prospectus contains certain forward-looking statements. If and when included in this free writing prospectus, the words “expects”, “intends”, “anticipates”, “estimates” and analogous expressions and all statements that are not historical facts, including statements about our beliefs or expectations, are intended to identify forward-looking statements. Any forward-looking statements are made subject to risks and uncertainties which could cause actual results to differ materially from those stated. Those risks and uncertainties include, among other things, declines in general economic and business conditions, increased competition, changes in demographics, changes in political and social conditions, regulatory initiatives and changes in customer preferences, many of which are beyond our control and the control of any other person or entity related to this offering. The forward-looking statements made in this free writing prospectus are made as of the date stated on the cover. We have no obligation to update or revise any forward-looking statement.
Wells Fargo Securities is the trade name for the capital markets and investment banking services of Wells Fargo & Company and its subsidiaries, including but not limited to Wells Fargo Securities, LLC, a member of NYSE, FINRA, NFA and SIPC, Wells Fargo Prime Services, LLC, a member of FINRA, NFA and SIPC, and Wells Fargo Bank, N.A. Wells Fargo Securities, LLC and Wells Fargo Prime Services, LLC are distinct entities from affiliated banks and thrifts.
IMPORTANT NOTICE REGARDING THE OFFERED CERTIFICATES
The information herein is preliminary and may be supplemented or amended prior to the time of sale. In addition, the Offered Certificates referred to in these materials and the asset pool backing them are subject to modification or revision (including the possibility that one or more classes of certificates may be split, combined or eliminated at any time prior to issuance or availability of a final prospectus) and are offered on a “when, as and if issued” basis.
The underwriters described in these materials may from time to time perform investment banking services for, or solicit investment banking business from, any company named in these materials. The underwriters and/or their affiliates or respective employees may from time to time have a long or short position in any security or contract discussed in these materials.
The information contained herein supersedes any previous such information delivered to any prospective investor and will be superseded by information delivered to such prospective investor prior to the time of sale.
IMPORTANT NOTICE RELATING TO AUTOMATICALLY-GENERATED EMAIL DISCLAIMERS
Any legends, disclaimers or other notices that may appear at the bottom of any email communication to which this free writing prospectus is attached relating to (1) these materials not constituting an offer (or a solicitation of an offer), (2) any representation that these materials are accurate or complete and may not be updated or (3) these materials possibly being confidential, are not applicable to these materials and should be disregarded. Such legends, disclaimers or other notices have been automatically generated as a result of these materials having been sent via Bloomberg or another system.
THE INFORMATION IN THIS STRUCTURAL AND COLLATERAL TERM SHEET IS NOT COMPLETE AND MAY BE AMENDED PRIOR TO THE TIME OF SALE. THIS TERM SHEET IS NOT AN OFFER TO SELL THESE SECURITIES AND IT IS NOT A SOLICITATION OF AN OFFER TO BUY THESE SECURITIES IN ANY JURISDICTION WHERE THE OFFER OR SALE IS NOT PERMITTED.
2
| Wells Fargo Commercial Mortgage Trust 2018-C45 | Certificate Structure |
I. Certificate Structure
| Class | Expected Ratings (DBRS/Fitch/Moody’s)(1) | Approximate Initial Certificate Balance or Notional Amount(2) | Approx. | Pass-Through Rate Description | Weighted Average Life (Years)(4) | Expected Principal Window(4) | Certificate Principal to Value Ratio(5) | Certificate Principal U/W NOI Debt Yield(6) | ||
| Offered Certificates | ||||||||||
| A-1 | AAA(sf)/AAAsf/Aaa(sf) | $14,405,000 | 30.000% | (7) | 2.87 | 08/18 – 03/23 | 42.8% | 14.8% | ||
| A-2 | AAA(sf)/AAAsf/Aaa(sf) | $5,559,000 | 30.000% | (7) | 4.66 | 03/23 – 03/23 | 42.8% | 14.8% | ||
| A-SB | AAA(sf)/AAAsf/Aaa(sf) | $37,388,000 | 30.000% | (7) | 7.20 | 03/23 – 12/27 | 42.8% | 14.8% | ||
| A-3 | AAA(sf)/AAAsf/Aaa(sf) | (8) | 30.000% | (7) | (8) | (8) | 42.8% | 14.8% | ||
| A-4 | AAA(sf)/AAAsf/Aaa(sf) | (8) | 30.000% | (7) | (8) | (8) | 42.8% | 14.8% | ||
| X-A | AAA(sf)/AAAsf/Aaa(sf) | $461,135,000(9) | N/A | Variable(10) | N/A | N/A | N/A | N/A | ||
| X-B | A(high)(sf)/A-sf/NR | $110,344,000(11) | N/A | Variable(12) | N/A | N/A | N/A | N/A | ||
| A-S | AAA(sf)/AAAsf/Aa2(sf) | $46,114,000 | 23.000% | (7) | 9.91 | 06/28 – 06/28 | 47.1% | 13.4% | ||
| B | AA(high)(sf)/AA-sf/NR | $32,115,000 | 18.125% | (7) | 9.91 | 06/28 – 06/28 | 50.1% | 12.6% | ||
| C | A(sf)/A-sf/NR | $32,115,000 | 13.250% | (7) | 9.91 | 06/28 – 06/28 | 53.1% | 11.9% | ||
| Non-Offered Certificates | ||||||||||
| X-D(13) | A(low)(sf)/BBB-sf/NR | $21,174,000(14) | N/A | Variable(15) | N/A | N/A | N/A | N/A | ||
| D(13) | BBB(high)(sf)/BBB-sf/NR | $21,174,000 | 10.036% | (7) | 9.91 | 06/28 – 06/28 | 55.0% | 11.5% | ||
| Risk Retention Certificates | ||||||||||
| E-RR(13) | BBB(low)(sf)/BBB-sf/NR | $14,234,000 | 7.875% | (7) | 9.92 | 06/28 – 07/28 | 56.3% | 11.2% | ||
| F-RR | BBB(low)(sf)/BB+sf/NR | $8,235,000 | 6.625% | (7) | 9.99 | 07/28 – 07/28 | 57.1% | 11.1% | ||
| G-RR | BB(sf)/BB-sf/NR | $9,881,000 | 5.125% | (7) | 9.99 | 07/28 – 07/28 | 58.0% | 10.9% | ||
| H-RR | B(high)(sf)/B-sf/NR | $7,411,000 | 4.000% | (7) | 9.99 | 07/28 – 07/28 | 58.7% | 10.8% | ||
| J-RR | NR/NR/NR | $26,351,419 | 0.000% | (7) | 9.99 | 07/28 – 07/28 | 61.2% | 10.3% | ||
| Notes: | |
| (1) | The expected ratings presented are those of DBRS, Inc. (“DBRS”), Fitch Ratings, Inc. (“Fitch”) and Moody’s Investors Service, Inc. (“Moody’s”), which the depositor hired to rate the Offered Certificates. One or more other nationally recognized statistical rating organizations that were not hired by the depositor may use information they receive pursuant to Rule 17g-5 under the Securities Exchange Act of 1934, as amended (the “Exchange Act”) or otherwise, to rate or provide market reports and/or published commentary related to the Offered Certificates. We cannot assure you as to what ratings a non-hired nationally recognized statistical rating organization would assign or that its reports will not express differing, possibly negative, views of the mortgage loans and/or the Offered Certificates. The ratings of each class of Offered Certificates address the likelihood of the timely distribution of interest and, except in the case of the Class X-A, X-B and X-D Certificates, the ultimate distribution of principal due on those classes on or before the Rated Final Distribution Date. See “Risk Factors—Other Risks Relating to the Certificates—Nationally Recognized Statistical Rating Organizations May Assign Different Ratings to the Certificates; Ratings of the Certificates Reflect Only the Views of the Applicable Rating Agencies as of the Dates Such Ratings Were Issued; Ratings May Affect ERISA Eligibility; Ratings May Be Downgraded” and “Ratings” in the Preliminary Prospectus, expected to be dated June 19, 2018 (the “Preliminary Prospectus”). DBRS, Fitch and Moody’s have informed us that the “sf” designation in their ratings represents an identifier for structured finance product ratings. |
| (2) | The certificate balances and notional amounts set forth in the table are approximate. The actual initial certificate balances and notional amounts may be larger or smaller depending on the initial pool balance of the mortgage loans definitively included in the pool of mortgage loans, which aggregate cut-off date balance may be as much as 5% larger or smaller than the amount presented in the Preliminary Prospectus. In addition, the notional amounts of the Class X-A, X-B and X-D certificates may vary depending upon the final pricing of the classes of principal balance certificates whose certificate balances comprise such notional amounts, and, if, as a result of such pricing, the pass-through rate of the Class X-A, X-B or X-D certificates, as applicable, would be equal to zero at all times, such class of certificates may not be issued on the closing date of this securitization. |
| (3) | The approximate initial credit support with respect to the Class A-1, A-2, A-SB, A-3 and A-4 Certificates represents the approximate credit enhancement for the Class A-1, A-2, A-SB, A-3 and A-4 Certificates in the aggregate. |
| (4) | Weighted Average Lives and Expected Principal Windows are calculated based on an assumed prepayment rate of 0% CPR and the “Structuring Assumptions” described under “Yield and Maturity Considerations—Weighted Average Life” in the Preliminary Prospectus. |
| (5) | The Certificate Principal to Value Ratio for each Class of Certificates (other than the Class A-1, A-2, A-SB, A-3 and A-4 Certificates) is calculated as the product of (a) the weighted average Cut-off Date LTV Ratio for the mortgage loans and (b) a fraction, the numerator of which is the total initial Certificate Balance of such Class of Certificates and all Classes of Principal Balance Certificates (as defined in the Preliminary Prospectus) senior to such Class of Certificates and the denominator of which is the total initial Certificate Balance of all of the Principal Balance Certificates. The Certificate Principal to Value Ratio for each of the Class A-1, A-2, A-SB, A-3 and A-4 Certificates is calculated in the aggregate for those Classes as if they were a single Class and is calculated as the product of (a) the weighted average Cut-off Date LTV Ratio for the mortgage loans and (b) a fraction, the numerator of which is the total initial aggregate Certificate Balances of such Classes of Certificates and the denominator of which is the total initial Certificate Balance of all of the Principal Balance Certificates. In any event, however, excess mortgaged property value associated with a mortgage loan will not be available to offset losses on any other mortgage loan. |
| (6) | The Certificate Principal U/W NOI Debt Yield for each Class of Certificates (other than the Class A-1, A-2, A-SB, A-3 and A-4 Certificates) is calculated as the product of (a) the weighted average U/W NOI Debt Yield for the mortgage loans and (b) a fraction, the numerator of which is the total initial Certificate Balance of all of the Classes of Principal Balance Certificates and the denominator of which is the total initial Certificate Balance for such Class of Certificates and all Classes of Principal Balance Certificates senior to such Class of Certificates. The Certificate Principal U/W NOI Debt Yield for each of the Class A-1, A-2, A-SB, A-3 and A-4 Certificates is calculated in the aggregate for those Classes as if they were a single Class and is calculated as the product of (a) the weighted average U/W NOI Debt Yield for the mortgage loans and (b) a fraction, the numerator of which is the total initial Certificate Balance of all of the Classes of Principal Balance Certificates and the denominator of which is the total aggregate initial Certificate Balances for the Class A-1, A-2, A-SB, A-3 and A-4 Certificates. In any event, however, cash flow from each mortgaged property supports only the related mortgage loan and will not be available to support any other mortgage loan. |
| (7) | The pass-through rates for the Class A-1, A-2, A-SB, A-3, A-4, A-S, B, C, D, E-RR, F-RR, G-RR, H-RR and J-RR Certificates in each case will be one of the following: (i) a fixed rateper annum, (ii) a variable rate per annum equal to the weighted average of the net mortgage interest rates on the mortgage loans for the related distribution date, (iii) a variable rateper annum equal to the lesser of (a) a fixed rate and (b) the weighted average of the net mortgage interest rates on the mortgage loans for the related distribution date or (iv) a variable rateper annum equal to the weighted average of the net mortgage interest rates on the mortgage loans for the related |
THE INFORMATION IN THIS STRUCTURAL AND COLLATERAL TERM SHEET IS NOT COMPLETE AND MAY BE AMENDED PRIOR TO THE TIME OF SALE. THIS TERM SHEET IS NOT AN OFFER TO SELL THESE SECURITIES AND IT IS NOT A SOLICITATION OF AN OFFER TO BUY THESE SECURITIES IN ANY JURISDICTION WHERE THE OFFER OR SALE IS NOT PERMITTED.
3
| Wells Fargo Commercial Mortgage Trust 2018-C45 | Certificate Structure |
| distribution date minus a specified percentage. For purposes of the calculation of the weighted average of the net mortgage interest rates on the mortgage loans for each distribution date, the mortgage interest rates will be adjusted as necessary to a 30/360 basis. | |
| (8) | The exact initial certificate balances of the Class A-3 and A-4 Certificates are unknown and will be determined based on the final pricing of those classes of certificates. However, the respective initial certificate balances, weighted average lives and principal windows of the Class A-3 and A-4 Certificates are expected to be within the applicable ranges reflected in the following chart. The aggregate initial certificate balance of the Class A-3 and A-4 Certificates is expected to be approximately $403,783,000, subject to a variance of plus or minus 5%. |
Class of | Expected Range of | Expected Range of | Expected Range of Principal Window |
| Class A-3 | $150,000,000 - $200,000,000 | 9.74 – 9.76 | 12/27 – 05/28 / 12/27 – 05/28 |
| Class A-4 | $203,783,000 - $253,783,000 | 9.87 – 9.88 | 05/28 – 06/28 / 05/28 – 06/28 |
| (9) | The Class X-A Certificates are notional amount certificates. The Notional Amount of the Class X-A Certificates will be equal to the aggregate Certificate Balance of the Class A-1, A-2, A-SB, A-3 and A-4 Certificates outstanding from time to time. The Class X-A Certificates will not be entitled to distributions of principal. |
| (10) | The pass-through rate for the Class X-A Certificates for any distribution date will be aper annum rate equal to the excess, if any, of (a) the weighted average of the net mortgage interest rates on the mortgage loans for the related distribution date, over (b) the weighted average of the pass-through rates on the Class A-1, A-2, A-SB, A-3 and A-4 Certificates for the related distribution date, weighted on the basis of their respective Certificate Balances outstanding immediately prior to that distribution date. For purposes of the calculation of the weighted average of the net mortgage interest rates on the mortgage loans for each distribution date, the mortgage interest rates will be adjusted as necessary to a 30/360 basis. |
| (11) | The Class X-B Certificates are notional amount certificates. The Notional Amount of the Class X-B Certificates will be equal to the aggregate Certificate Balance of the Class A-S, B and C Certificates outstanding from time to time. The Class X-B Certificates will not be entitled to distributions of principal. |
| (12) | The pass-through rate for the Class X-B Certificates for any distribution date will be aper annum rate equal to the excess, if any, of (a) the weighted average of the net mortgage interest rates on the mortgage loans for the related distribution date, over (b) the weighted average of the pass-through rates on the Class A-S, B and C Certificates for the related distribution date, weighted on the basis of their respective Certificate Balances outstanding immediately prior to that distribution date. For purposes of the calculation of the weighted average of the net mortgage interest rates on the mortgage loans for each distribution date, the mortgage interest rates will be adjusted as necessary to a 30/360 basis. |
| (13) | The initial notional amount of the X-D certificates and the initial certificate balance of each of the Class D and E-RR certificates are subject to change based on final pricing of all certificates and the final determination of the Class E-RR, F-RR, G-RR, H-RR and J-RR Certificates (collectively, the “horizontal risk retention certificates”) that will be retained by the retaining sponsor through a third party purchaser as part of the U.S. risk retention requirements. For more information regarding the methodology and key inputs and assumptions used to determine the sizing of the horizontal risk retention certificates, see “Credit Risk Retention” in the Preliminary Prospectus. |
| (14) | The Class X-D Certificates are notional amount certificates. The Notional Amount of the Class X-D Certificates will be equal to the Certificate Balance of the Class D Certificates outstanding from time to time. The Class X-D Certificates will not be entitled to distributions of principal. |
| (15) | The pass-through rate for the Class X-D Certificates for any distribution date will be aper annum rate equal to the excess, if any, of (a) the weighted average of the net mortgage interest rates on the mortgage loans for the related distribution date, over (b) the pass-through rate on the Class D Certificates for the related distribution date. For purposes of the calculation of the weighted average of the net mortgage interest rates on the mortgage loans for each distribution date, the mortgage interest rates will be adjusted as necessary to a 30/360 basis. |
THE INFORMATION IN THIS STRUCTURAL AND COLLATERAL TERM SHEET IS NOT COMPLETE AND MAY BE AMENDED PRIOR TO THE TIME OF SALE. THIS TERM SHEET IS NOT AN OFFER TO SELL THESE SECURITIES AND IT IS NOT A SOLICITATION OF AN OFFER TO BUY THESE SECURITIES IN ANY JURISDICTION WHERE THE OFFER OR SALE IS NOT PERMITTED.
4
| Wells Fargo Commercial Mortgage Trust 2018-C45 | Transaction Highlights |
II. Transaction Highlights
Mortgage Loan Sellers:
Mortgage Loan Seller | Number | Number of | Aggregate Cut-off | % of Initial |
| Wells Fargo Bank, National Association | 14 | 27 | $271,350,036 | 41.2% |
| Barclays Bank PLC | 11 | 31 | 172,882,585 | 26.2 |
| Rialto Mortgage Finance, LLC | 7 | 13 | 113,800,000 | 17.3 |
| C-III Commercial Mortgage LLC | 17 | 18 | 100,732,798 | 15.3 |
Total | 49 | 89 | $658,765,419 | 100.0% |
Loan Pool:
| Initial Pool Balance: | $658,765,419 |
| Number of Mortgage Loans: | 49 |
| Average Cut-off Date Balance per Mortgage Loan: | $13,444,192 |
| Number of Mortgaged Properties: | 89 |
| Average Cut-off Date Balance per Mortgaged Property(1): | $7,401,859 |
| Weighted Average Mortgage Interest Rate: | 4.899% |
| Ten Largest Mortgage Loans as % of Initial Pool Balance: | 54.6% |
| Weighted Average Original Term to Maturity or ARD (months): | 120 |
| Weighted Average Remaining Term to Maturity or ARD (months): | 118 |
| Weighted Average Original Amortization Term (months)(2): | 358 |
| Weighted Average Remaining Amortization Term (months)(2): | 358 |
| Weighted Average Seasoning (months): | 2 |
| (1) | Information regarding mortgage loans secured by multiple properties is based on an allocation according to relative appraised values or the allocated loan amounts or property-specific release prices set forth in the related loan documents or such other allocation as the related mortgage loan seller deemed appropriate. |
| (2) | Excludes any mortgage loan that does not amortize. |
Credit Statistics:
| Weighted Average U/W Net Cash Flow DSCR(1): | 1.66x |
| Weighted Average U/W Net Operating Income Debt Yield(1): | 10.3% |
| Weighted Average Cut-off Date Loan-to-Value Ratio(1): | 61.2% |
| Weighted Average Balloon or ARD Loan-to-Value Ratio(1): | 55.8% |
| % of Mortgage Loans with Additional Subordinate Debt(2): | 17.2% |
| % of Mortgage Loans with Single Tenants(3): | 9.9% |
| (1) | With respect to any mortgage loan that is part of a whole loan, loan-to-value ratio, debt service coverage ratio and debt yield calculations include the relatedpari passu companion loan(s) but exclude any related subordinate debt (unless otherwise stated). The debt service coverage ratio, debt yield and loan-to-value ratio information do not take into account any subordinate debt (whether or not secured by the related mortgaged property), that currently exists or is allowed under the terms of any mortgage loan. See “Description of the Mortgage Pool—Mortgage Pool Characteristics” in the Preliminary Prospectus and Annex A-1 to the Preliminary Prospectus. |
| (2) | The percentage figure expressed as “% of Mortgage Loans with Additional Subordinate Debt” is determined as a percentage of the initial pool balance and does not take into account any future subordinate debt (whether or not secured by the mortgaged property), if any, that may be permitted under the terms of any mortgage loan or the pooling and servicing agreement. See “Description of the Mortgage Pool—Additional Indebtedness—Other Unsecured Indebtedness” in the Preliminary Prospectus. |
| (3) | Excludes mortgage loans that are secured by multiple single tenant properties. |
THE INFORMATION IN THIS STRUCTURAL AND COLLATERAL TERM SHEET IS NOT COMPLETE AND MAY BE AMENDED PRIOR TO THE TIME OF SALE. THIS TERM SHEET IS NOT AN OFFER TO SELL THESE SECURITIES AND IT IS NOT A SOLICITATION OF AN OFFER TO BUY THESE SECURITIES IN ANY JURISDICTION WHERE THE OFFER OR SALE IS NOT PERMITTED.
5
| Wells Fargo Commercial Mortgage Trust 2018-C45 | Transaction Highlights |
Loan Structural Features:
Amortization:Based on the Initial Pool Balance, 74.5% of the mortgage pool (39 mortgage loans) has scheduled amortization, as follows:
54.7% (20 mortgage loans) provides for an interest-only period followed by an amortization period;
17.7% (18 mortgage loans) requires amortization during the entire loan term; and
2.1% (1 mortgage loan) provides for an interest-only period followed by an amortizing ARD period.
Interest-Only:Based on the Initial Pool Balance, 25.5% of the mortgage pool (10 mortgage loans) provides for interest-only payments during the entire loan term through maturity or ARD. The Weighted Average Cut-off Date Loan-to-Value Ratio and Weighted Average U/W Net Cash Flow DSCR for those mortgage loans are 59.0% and 2.02x, respectively.
Hard Lockboxes: Based on the Initial Pool Balance, 46.4% of the mortgage pool (15 mortgage loans) have hard lockboxes in place.
Reserves:The mortgage loans require amounts to be escrowed monthly as follows (excluding any mortgage loans with springing provisions):
| Real Estate Taxes: | 87.9% of the pool |
| Insurance: | 51.8% of the pool |
| Capital Replacements: | 82.6% of the pool |
| TI/LC: | 81.4% of the pool(1) |
| (1) | The percentage of Initial Pool Balance for mortgage loans with TI/LC reserves is based on the aggregate principal balance allocable to loans that include retail, office, mixed use and industrial properties. |
Call Protection/Defeasance: Based on the Initial Pool Balance, the mortgage pool has the following call protection and defeasance features:
88.0% of the mortgage pool (42 mortgage loans) features a lockout period, then defeasance only until an open period;
6.0% of the mortgage pool (5 mortgage loans) features a lockout period, then the greater of a prepayment premium or yield maintenance until an open period;
3.0% of the mortgage pool (1 mortgage loan) features a lockout period, then the greater of a prepayment premium or yield maintenance, then the greater of a prepayment premium or yield maintenance or defeasance until an open period; and
3.0% of the mortgage pool (1 mortgage loan) features a lockout period, then the greater of a prepayment premium or yield maintenance or defeasance until an open period.
Prepayment restrictions for each mortgage loan reflect the entire life of the mortgage loan. Please refer to Annex A-1 to the Preliminary Prospectus and the footnotes related thereto for further information regarding individual loan call protection.
THE INFORMATION IN THIS STRUCTURAL AND COLLATERAL TERM SHEET IS NOT COMPLETE AND MAY BE AMENDED PRIOR TO THE TIME OF SALE. THIS TERM SHEET IS NOT AN OFFER TO SELL THESE SECURITIES AND IT IS NOT A SOLICITATION OF AN OFFER TO BUY THESE SECURITIES IN ANY JURISDICTION WHERE THE OFFER OR SALE IS NOT PERMITTED.
6
| Wells Fargo Commercial Mortgage Trust 2018-C45 | Issue Characteristics |
| III. | Issue Characteristics |
| Securities Offered: | $571,479,000 approximate monthly pay, multi-class, commercial mortgage REMIC pass-through certificates consisting of eleven classes (Classes A-1, A-2, A-SB, A-3, A-4, A-S, B, C, X-A and X-B), which are offered pursuant to a registration statement filed with the SEC (such classes of certificates, the “Offered Certificates”). |
| Mortgage Loan Sellers: | Wells Fargo Bank, National Association (“WFB”), Barclays Bank PLC (“Barclays”), Rialto Mortgage Finance, LLC (“RMF”) and C-III Commercial Mortgage LLC (“CIIICM”). |
| Joint Bookrunners and Co-Lead Managers: | Wells Fargo Securities, LLC and Barclays Capital Inc. |
| Co-Manager: | Academy Securities, Inc. |
| Rating Agencies: | DBRS, Inc., Fitch Ratings, Inc. and Moody’s Investors Service, Inc. |
| Master Servicer: | Wells Fargo Bank, National Association |
| Special Servicer: | LNR Partners, LLC |
| Certificate Administrator: | Wells Fargo Bank, National Association |
| Trustee: | Wilmington Trust, National Association |
| Operating Advisor: | Park Bridge Lender Services LLC |
| Asset Representations Reviewer: | Park Bridge Lender Services LLC |
| Initial Majority Controlling Class Certificateholder: | Prime Finance Long Duration (B-Piece) II Holdco I, L.P. or an affiliate |
| U.S. Credit Risk Retention: | For a discussion on the manner in which the U.S. credit risk retention requirements will be satisfied by Wells Fargo Bank, National Association, as the retaining sponsor, see “Credit Risk Retention” in the Preliminary Prospectus.
This transaction is being structured with a “third party purchaser” that will acquire an “eligible horizontal residual interest”, which will be comprised of the Class E-RR, F-RR, G-RR, H-RR and J-RR certificates (the “horizontal risk retention certificates”). Prime Finance Long Duration (B-Piece) II Holdco I, L.P. (in satisfaction of the retention obligations of Wells Fargo Bank, National Association, as the retaining sponsor) will be contractually obligated to retain the horizontal risk retention certificates for a minimum of five years after the closing date, subject to certain permitted exceptions provided for under the risk retention rules. During this time, Prime Finance Long Duration (B-Piece) II Holdco I, L.P. will agree to comply with hedging, transfer and financing restrictions that are applicable to third party purchasers under the credit risk retention rules. For additional information, see “Credit Risk Retention” in the Preliminary Prospectus.
|
| EU Credit Risk Retention | None of the sponsors, the depositor or the issuing entity intends to retain a material net economic interest in the securitization constituted by the issue of the Offered Certificates in accordance with the EU risk retention and due diligence requirements or to take any other action which may be required by EEA-regulated investors for the purposes of their compliance with the EU risk retention and due diligence requirements or similar requirements. |
| Cut-off Date: | The Cut-off Date with respect to each mortgage loan is the due date for the monthly debt service payment that is due in July 2018 (or, in the case of any mortgage loan that has its first due date in August 2018, the date that would have been its due date in July 2018 under the terms of that mortgage loan if a monthly debt service payment were scheduled to be due in that month). |
| Expected Closing Date: | On or about July 17, 2018. |
| Determination Dates: | The 11th day of each month (or if that day is not a business day, the next succeeding business day), commencing in August 2018. |
| Distribution Dates: | The fourth business day following the Determination Date in each month, commencing in August 2018. |
| Rated Final Distribution Date: | The Distribution Date in June 2051. |
| Interest Accrual Period: | With respect to any Distribution Date, the calendar month immediately preceding the month in which such Distribution Date occurs. |
THE INFORMATION IN THIS STRUCTURAL AND COLLATERAL TERM SHEET IS NOT COMPLETE AND MAY BE AMENDED PRIOR TO THE TIME OF SALE. THIS TERM SHEET IS NOT AN OFFER TO SELL THESE SECURITIES AND IT IS NOT A SOLICITATION OF AN OFFER TO BUY THESE SECURITIES IN ANY JURISDICTION WHERE THE OFFER OR SALE IS NOT PERMITTED.
7
| Wells Fargo Commercial Mortgage Trust 2018-C45 | Issue Characteristics |
| Day Count: | The Offered Certificates will accrue interest on a 30/360 basis. |
| Minimum Denominations: | $10,000 for each Class of Offered Certificates (other than the Class X-A and X-B Certificates) and $1,000,000 for the Class X-A and X-B Certificates. Investments may also be made in any whole dollar denomination in excess of the applicable minimum denomination. |
| Clean-up Call: | 1.0% |
| Delivery: | DTC, Euroclear and Clearstream Banking |
| ERISA/SMMEA Status: | Each Class of Offered Certificates is expected to be eligible for exemptive relief under ERISA. No Class of Offered Certificates will be SMMEA eligible. |
| Risk Factors: | THE CERTIFICATES INVOLVE CERTAIN RISKS AND MAY NOT BE SUITABLE FOR ALL INVESTORS. SEE THE “RISK FACTORS” SECTION OF THE PRELIMINARY PROSPECTUS. |
| Bond Analytics Information: | The Certificate Administrator will be authorized to make distribution date statements, CREFC® reports and certain supplemental reports (other than confidential information) available to certain financial modeling and data provision services, including Bloomberg, L.P., Trepp, LLC, Intex Solutions, Inc., Interactive Data Corp., Markit Group Limited, BlackRock Financial Management, Inc., CMBS.com, Inc., Moody’s Analytics, MBS Data, LLC and Thomson Reuters Corporation. |
THE INFORMATION IN THIS STRUCTURAL AND COLLATERAL TERM SHEET IS NOT COMPLETE AND MAY BE AMENDED PRIOR TO THE TIME OF SALE. THIS TERM SHEET IS NOT AN OFFER TO SELL THESE SECURITIES AND IT IS NOT A SOLICITATION OF AN OFFER TO BUY THESE SECURITIES IN ANY JURISDICTION WHERE THE OFFER OR SALE IS NOT PERMITTED.
8
| Wells Fargo Commercial Mortgage Trust 2018-C45 | Characteristics of the Mortgage Pool |
IV. Characteristics of the Mortgage Pool(1)
A. Ten Largest Mortgage Loans
| Mortgage Loan Seller | Mortgage Loan Name | City | State | Number of Mortgage Loans / Mortgaged Properties | Mortgage Loan Cut-off Date Balance ($) | % of Initial Pool Balance (%) | Property Type | Number of SF/Units | Cut-off Date Balance Per SF/Unit | Cut-off Date LTV Ratio (%) | Balloon or ARD LTV Ratio (%) | U/W NCF DSCR (x) | U/W NOI Debt Yield (%) |
| WFB | Village at Leesburg | Leesburg | VA | 1/1 | $65,250,000 | 9.9% | Retail | 546,107 | $240 | 58.1% | 53.4% | 1.28x | 8.4% |
| WFB | Westport Self Storage Portfolio | Various | Various | 1/12 | 48,300,000 | 7.3 | Self Storage | 851,164 | 57 | 58.7 | 56.0 | 1.51 | 9.7 |
| CIIICM | Parkway Center | Pittsburgh | PA | 1/1 | 42,560,000 | 6.5 | Office | 588,913 | 72 | 63.9 | 56.7 | 1.38 | 10.7 |
| WFB | 1801 L Street | Sacramento | CA | 1/1 | 38,000,000 | 5.8 | Multifamily | 176 | 215,909 | 63.1 | 63.1 | 1.61 | 8.1 |
| Barclays | ExchangeRight Net Leased Portfolio #21 | Various | Various | 1/20 | 37,795,000 | 5.7 | Various | 263,629 | 143 | 61.7 | 61.7 | 2.19 | 9.6 |
| WFB | Mission Center | San Diego | CA | 1/1 | 29,750,000 | 4.5 | Office | 183,410 | 162 | 68.4 | 62.4 | 1.68 | 11.0 |
| Barclays | Center Pointe Plaza II | Newark | DE | 1/1 | 28,270,000 | 4.3 | Retail | 187,900 | 150 | 57.9 | 49.7 | 2.00 | 13.1 |
| RMF | Addison Ridge Apartments - Phase II | Fayetteville | NC | 1/1 | 25,000,000 | 3.8 | Multifamily | 214 | 116,822 | 69.8 | 63.6 | 1.36 | 9.3 |
| RMF | Citadel Self Storage | Thousand Oaks | CA | 1/1 | 25,000,000 | 3.8 | Self Storage | 143,754 | 174 | 59.9 | 53.7 | 1.25 | 8.7 |
| Barclays | 181 Fremont Street | San Francisco | CA | 1/1 | 20,000,000 | 3.0 | Office | 436,332 | 573 | 39.6 | 39.6 | 3.14 | 11.8 |
| Top Three Total/Weighted Average | 3 / 14 | $156,110,000 | 23.7% | 59.9% | 55.1% | 1.38x | 9.4% | ||||||
| Top Five Total/Weighted Average | 5 / 35 | $231,905,000 | 35.2% | 60.7% | 57.5% | 1.55x | 9.2% | ||||||
| Top Ten Total/Weighted Average | 10 / 40 | $359,925,000 | 54.6% | 60.5% | 56.5% | 1.65x | 9.8% | ||||||
| Non-Top Ten Total/Weighted Average | 39 / 49 | $298,840,419 | 45.4% | 61.9% | 55.0% | 1.67x | 11.0% | ||||||
| (1) | With respect to any mortgage loan that is part of a whole loan, Cut-off Date Balance Per SF/Unit, loan-to-value ratio, debt service coverage ratio and debt yield calculations include the relatedpari passu companion loan(s) but exclude any related subordinate debt (unless otherwise stated). With respect to each mortgage loan, debt service coverage ratio, debt yield and loan-to-value ratio information do not take into account subordinate debt (whether or not secured by the related mortgaged property), if any, that currently exists or is allowed under the terms of such mortgage loan. |
THE INFORMATION IN THIS STRUCTURAL AND COLLATERAL TERM SHEET IS NOT COMPLETE AND MAY BE AMENDED PRIOR TO THE TIME OF SALE. THIS TERM SHEET IS NOT AN OFFER TO SELL THESE SECURITIES AND IT IS NOT A SOLICITATION OF AN OFFER TO BUY THESE SECURITIES IN ANY JURISDICTION WHERE THE OFFER OR SALE IS NOT PERMITTED.
9
Wells Fargo Commercial Mortgage Trust 2018-C45 | Characteristics of the Mortgage Pool |
| B. | Summary of the Whole Loans |
| Property Name | Mortgage Loan Seller in | Note(s)(1) | Original Balance | Holder of Note(1) | Lead Servicer for Whole Loan | Master Servicer Under | Special Servicer Under Lead Securitization Servicing Agreement |
| Village at Leesburg | WFB | A-1 | $66,000,000 | WFCM 2018-C44 | Yes | Wells Fargo Bank, National Association | Rialto Capital Advisors, LLC |
| A-2 | $65,250,000 | WFCM 2018-C45 | No | ||||
| CoolSprings Galleria | WFB | A-1 | $75,000,000 | BANK 2018-BNK12 | Yes | Wells Fargo Bank, National Association | Midland Loan Services, a Division of PNC Bank, National Association |
| A-2 | $15,000,000 | BANK 2018-BNK12 | No | ||||
| A-3 | $20,000,000 | WFCM 2018-C45 | No | ||||
| A-4 | $45,000,000 | WFB | No | ||||
| 181 Fremont Street(2) | Barclays | A-1 | $50,000,000 | Deutsche Bank AG, New York Branch | Yes | Wells Fargo Bank, National Association(2) | Rialto Capital Advisors, LLC(2) |
| A-2 | $58,000,000 | BANK 2018-BNK12 | No | ||||
| A-3 | $22,000,000 | WFB | No | ||||
| A-4 | $30,000,000 | Deutsche Bank AG, New York Branch | No | ||||
| A-5 | $40,000,000 | Deutsche Bank AG, New York Branch | No | ||||
| A-6-1 | $30,000,000 | WFCM 2018-C44 | No | ||||
| A-6-2 | $20,000,000 | WFCM 2018-C45 | No | ||||
| A-1 | $59,000,000 | CGCMT 2018-C5(3) | Yes | Midland Loan Services, a Division of PNC Bank, National Association | |||
| Flats at East Bank | RMF | A-2 | $13,000,000 | WFCM 2018-C45 | No | KeyBank National Association | |
| B | $21,000,000 | ACREFI Mortgage Lending, LLC | No |
| (1) | Unless otherwise indicated, each note not currently held by a securitization trust is expected to be contributed to a future securitization. No assurance can be provided that any such note will not be split further. |
| (2) | The 181 Fremont Street whole loan is currently being serviced under the pooling and servicing agreement governing the WFCM 2018-C44 securitization.On and after the securitization of the related “lead” pari passu note (namely, the related pari passu note marked “Yes” in the column entitled “Lead Servicer for Whole Loan”), such whole loan will be serviced under the pooling and servicing agreement governing such securitization. The master servicer and special servicer for such securitization will be identified in a notice, report or statement to holders of the WFCM 2018-C45 certificates after the closing of such securitization. |
| (3) | The CGCMT 2018-C5 securitization is expected to close on or about June 21, 2018. |
THE INFORMATION IN THIS STRUCTURAL AND COLLATERAL TERM SHEET IS NOT COMPLETE AND MAY BE AMENDED PRIOR TO THE TIME OF SALE. THIS TERM SHEET IS NOT AN OFFER TO SELL THESE SECURITIES AND IT IS NOT A SOLICITATION OF AN OFFER TO BUY THESE SECURITIES IN ANY JURISDICTION WHERE THE OFFER OR SALE IS NOT PERMITTED.
10
Wells Fargo Commercial Mortgage Trust 2018-C45 | Characteristics of the Mortgage Pool |
| C. | Mortgage Loans with Additional Secured and Mezzanine Financing |
| Loan No. | Mortgage Loan Seller | Mortgage Loan Name | Mortgage Loan Cut-off Date Balance ($) | % of Initial Pool Balance (%) | Sub Debt Cut-off Date Balance ($) | Mezzanine Debt Cut-off Date Balance ($) | Total Debt Interest Rate (%)(1) | Mortgage Loan U/W NCF DSCR (x)(2) | Total Debt U/W NCF DSCR (x) | Mortgage Loan Cut-off Date U/W NOI Debt Yield (%)(2) | Total Debt Cut-off Date U/W NOI Debt Yield (%) | Mortgage Loan Cut-off Date LTV Ratio (%)(2) | Total Debt Cut-off Date LTV Ratio (%) |
| 3 | CIIICM | Parkway Center | $42,560,000 | 6.5% | NAP | $4,700,000 | 5.5873% | 1.38x | 1.18x | 10.7% | 9.6% | 63.9% | 71.0% |
| 4 | WFB | 1801 L Street | 38,000,000 | 5.8 | 6,244,117 | NAP | NAP(3) | 1.61 | NAP(3) | 8.1 | NAP(3) | 63.1 | 73.4 |
| 10 | Barclays | 181 Fremont Street | 20,000,000 | 3.0 | NAP | 225,000,000 | 4.4340 | 3.14 | 1.38 | 11.8 | 6.2 | 39.6 | 75.2 |
| 18 | RMF | Flats at East Bank | 13,000,000 | 2.0 | 20,829,951 | NAP | 6.0167 | 1.90 | 1.05 | 9.9 | 7.7 | 52.0 | 67.1 |
| Total/Weighted Average | $113,560,000 | 17.2% | $27,074,068 | $229,700,000 | 5.3559% | 1.83x | 1.21x | 9.9% | 8.4% | 58.0% | 72.1% | ||
| (1) | Total Debt Interest Rate for any specified mortgage loan reflects the weighted average of the interest rates on the respective components of the total debt. |
| (2) | With respect to any mortgage loan that is part of a whole loan, the loan-to-value ratio, debt service coverage ratio and debt yield calculations include the related pari passu companion loan(s). |
| (3) | Please see the “Subordinate and Mezzanine Indebtedness” section of the 1801 L Street mortgage loan large loan summary herein. |
THE INFORMATION IN THIS STRUCTURAL AND COLLATERAL TERM SHEET IS NOT COMPLETE AND MAY BE AMENDED PRIOR TO THE TIME OF SALE. THIS TERM SHEET IS NOT AN OFFER TO SELL THESE SECURITIES AND IT IS NOT A SOLICITATION OF AN OFFER TO BUY THESE SECURITIES IN ANY JURISDICTION WHERE THE OFFER OR SALE IS NOT PERMITTED.
11
Wells Fargo Commercial Mortgage Trust 2018-C45 | Characteristics of the Mortgage Pool |
| D. | Previous Securitization History(1) |
| Loan No. | Mortgage Loan Seller | Mortgage Loan or Mortgaged Property Name | City | State | Property Type | Mortgage Loan or Mortgaged Property Cut-off Date Balance ($) | % of Initial Pool Balance (%) | Previous Securitization |
| 9 | RMF | Citadel Self Storage | Thousand Oaks | CA | Self Storage | 25,000,000 | 3.8 | CFCRE 2011-C1 |
| 12.01 | RMF | Sunset Country MHC | Pueblo | CO | Manufactured Housing Community | 6,700,000 | 1.0 | GSMS 2011-GC3 |
| 12.03 | RMF | Oasis MHC | Pueblo | CO | Manufactured Housing Community | 5,700,000 | 0.9 | GSMS 2011-GC3 |
| 13 | WFB | Roseville Corporate Center | Roseville | CA | Office | 16,000,000 | 2.4 | BACM 2007-4 |
| 36 | WFB | The Shops at Vacaville Crossings | Vacaville | CA | Retail | 4,127,500 | 0.6 | BSCMS 2006-PW13 |
| Total | $57,527,500 | 8.7% |
| (1) | The table above represents the most recent securitization with respect to the mortgaged property securing the related mortgage loan, based on information provided by the related borrower or obtained through searches of a third-party database. While loans secured by the above mortgaged properties may have been securitized multiple times in prior transactions, mortgage loans in this securitization are only listed in the above chart if the mortgage loan paid off a loan in another securitization. The information has not otherwise been confirmed by the mortgage loan sellers. |
THE INFORMATION IN THIS STRUCTURAL AND COLLATERAL TERM SHEET IS NOT COMPLETE AND MAY BE AMENDED PRIOR TO THE TIME OF SALE. THIS TERM SHEET IS NOT AN OFFER TO SELL THESE SECURITIES AND IT IS NOT A SOLICITATION OF AN OFFER TO BUY THESE SECURITIES IN ANY JURISDICTION WHERE THE OFFER OR SALE IS NOT PERMITTED.
12
Wells Fargo Commercial Mortgage Trust 2018-C45 | Characteristics of the Mortgage Pool |
| E. | Mortgage Loans with Scheduled Balloon Payments and Related Classes |
| Class A-2(1) | ||||||||||||||||
| Loan No. | Mortgage Loan Seller | Mortgage Loan Name | State | Property Type | Mortgage Loan Cut-off Date Balance ($) | % of Initial Pool Balance (%) | Mortgage Loan Balance at Maturity or ARD ($) | % of Class A-2 Certificate Principal Balance (%)(2) | SF | Loan per SF ($) | U/W NCF DSCR (x) | U/W NOI Debt Yield (%) | Cut-off Date LTV Ratio (%) | Balloon Or ARD LTV Ratio (%) | Rem. IO Period (mos.) | Rem. Term to Maturity or ARD (mos.) |
| 35 | RMF | Citi Bank - Chicago | IL | Retail | $5,200,000 | 0.8% | $5,014,760 | 90.2% | 7,200 | $722 | 1.36x | 10.1% | 67.5% | 65.1% | 20 | 56 |
| Total/Weighted Average | $5,200,000 | 0.8% | $5,014,760 | 90.2% | 1.36x | 10.1% | 67.5% | 65.1% | 20 | 56 | ||||||
| (1) | The table above presents the mortgage loan(s) whose balloon payments would be applied to pay down the principal balance of the Class A-2 Certificates, assuming a 0% CPR and applying the “Structuring Assumptions” described in the Preliminary Prospectus, including the assumptions that (i) none of the mortgage loans in the pool experience prepayments prior to maturity (or, in the case of an ARD loan, its anticipated repayment date), defaults or losses; (ii) there are no extensions of maturity dates of any mortgage loans in the pool; and (iii) each mortgage loan in the pool is paid in full on its stated maturity date (or, in the case of an ARD loan, its anticipated repayment date). Each Class of Certificates evidences undivided ownership interests in the entire pool of mortgage loans. Debt service coverage ratio, debt yield and loan-to-value ratio information do not take into account subordinate debt (whether or not secured by the related mortgaged property), if any, that currently exists or is allowed under the terms of any mortgage loan. See Annex A-1 to the Preliminary Prospectus. |
| (2) | Reflects the percentage equal to the Balloon Balance divided by the initial Class A-2 Certificate Balance. |
THE INFORMATION IN THIS STRUCTURAL AND COLLATERAL TERM SHEET IS NOT COMPLETE AND MAY BE AMENDED PRIOR TO THE TIME OF SALE. THIS TERM SHEET IS NOT AN OFFER TO SELL THESE SECURITIES AND IT IS NOT A SOLICITATION OF AN OFFER TO BUY THESE SECURITIES IN ANY JURISDICTION WHERE THE OFFER OR SALE IS NOT PERMITTED.
13
Wells Fargo Commercial Mortgage Trust 2018-C45 | Characteristics of the Mortgage Pool |
| F. | Property Type Distribution(1) |
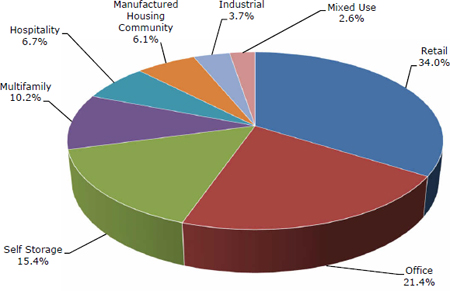
| Property Type | Number of Mortgaged Properties | Aggregate Cut-off Date Balance ($) | % of Initial Pool Balance (%) | Weighted Average Cut- off Date LTV Ratio (%) | Weighted Average Balloon or ARD LTV Ratio (%) | Weighted Average U/W NCF DSCR (x) | Weighted Average U/W NOI Debt Yield (%) | Weighted Average U/W NCF Debt Yield (%) | Weighted Average Mortgage Rate (%) | ||||||||
| Retail | 34 | $223,732,106 | 34.0 | % | 59.4 | % | 54.3 | % | 1.66 | x | 10.2 | % | 9.7 | % | 4.812 | % | |
| Anchored | 7 | 131,605,357 | 20.0 | 58.3 | 53.1 | 1.55 | 10.0 | 9.4 | 4.821 | ||||||||
| Single Tenant | 18 | 35,515,000 | 5.4 | 62.5 | 62.2 | 2.07 | 9.7 | 9.6 | 4.539 | ||||||||
| Shadow Anchored | 5 | 19,974,600 | 3.0 | 68.8 | 61.1 | 1.45 | 9.9 | 9.3 | 5.035 | ||||||||
| Super Regional Mall | 1 | 19,950,390 | 3.0 | 48.0 | 39.0 | 1.91 | 12.8 | 12.1 | 4.839 | ||||||||
| Unanchored | 3 | 16,686,759 | 2.5 | 63.2 | 57.4 | 1.59 | 9.8 | 9.3 | 5.020 | ||||||||
| Office | 10 | 140,937,221 | 21.4 | 61.4 | 56.0 | 1.85 | 11.2 | 10.1 | 4.678 | ||||||||
| Suburban | 5 | 104,187,221 | 15.8 | 64.6 | 58.0 | 1.62 | 11.3 | 9.9 | 4.872 | ||||||||
| CBD | 1 | 20,000,000 | 3.0 | 39.6 | 39.6 | 3.14 | 11.8 | 11.8 | 3.709 | ||||||||
| Medical | 4 | 16,750,000 | 2.5 | 68.0 | 63.2 | 1.73 | 9.4 | 9.1 | 4.629 | ||||||||
| Self Storage | 19 | 101,447,884 | 15.4 | 62.1 | 56.8 | 1.40 | 9.3 | 9.1 | 5.082 | ||||||||
| Self Storage | 19 | 101,447,884 | 15.4 | 62.1 | 56.8 | 1.40 | 9.3 | 9.1 | 5.082 | ||||||||
| Multifamily | 3 | 67,091,470 | 10.2 | 66.2 | 63.1 | 1.50 | 8.6 | 8.4 | 5.071 | ||||||||
| Low Rise | 1 | 38,000,000 | 5.8 | 63.1 | 63.1 | 1.61 | 8.1 | 7.9 | 4.845 | ||||||||
| Garden | 2 | 29,091,470 | 4.4 | 70.2 | 63.1 | 1.35 | 9.3 | 9.1 | 5.367 | ||||||||
| Hospitality | 5 | 44,430,416 | 6.7 | 62.3 | 51.4 | 1.95 | 14.3 | 12.7 | 5.071 | ||||||||
| Limited Service | 4 | 30,447,281 | 4.6 | 61.7 | 51.0 | 1.90 | 14.0 | 12.5 | 5.109 | ||||||||
| Select Service | 1 | 13,983,135 | 2.1 | 63.6 | 52.3 | 2.05 | 14.9 | 13.2 | 4.986 | ||||||||
| Manufactured Housing Community | 13 | 39,992,909 | 6.1 | 60.6 | 55.3 | 1.58 | 9.8 | 9.6 | 5.208 | ||||||||
| Manufactured Housing Community | 13 | 39,992,909 | 6.1 | 60.6 | 55.3 | 1.58 | 9.8 | 9.6 | 5.208 | ||||||||
| Industrial | 2 | 24,137,006 | 3.7 | 62.7 | 54.9 | 1.57 | 10.1 | 9.8 | 4.709 | ||||||||
| Warehouse | 2 | 24,137,006 | 3.7 | 62.7 | 54.9 | 1.57 | 10.1 | 9.8 | 4.709 | ||||||||
| Mixed Use | 3 | 16,996,408 | 2.6 | 53.5 | 52.4 | 1.81 | 9.8 | 9.7 | 5.183 | ||||||||
| Multifamily/Retail | 1 | 13,000,000 | 2.0 | 52.0 | 52.0 | 1.90 | 9.9 | 9.8 | 5.090 | ||||||||
| Retail/Multifamily | 1 | 2,100,000 | 0.3 | 52.5 | 52.5 | 1.68 | 8.9 | 8.8 | 5.160 | ||||||||
| Self Storage/Office | 1 | 1,896,408 | 0.3 | 64.7 | 54.8 | 1.37 | 10.5 | 9.7 | 5.850 | ||||||||
| Total/Weighted Average: | 89 | $658,765,419 | 100.0 | % | 61.2 | % | 55.8 | % | 1.66 | x | 10.3 | % | 9.7 | % | 4.899 | % | |
| (1) | Because this table presents information relating to the mortgaged properties and not the mortgage loans, the information for mortgage loans secured by more than one mortgaged property is based on allocated amounts (allocating the principal balance of the mortgage loan to each of those properties according to the relative appraised values of the mortgaged properties or the allocated loan amounts or property-specific release prices set forth in the related mortgage loan documents or such other allocation as the related mortgage loan seller deemed appropriate). With respect to any mortgage loan that is part of a whole loan, the loan-to-value ratio, debt service coverage ratio and debt yield calculations include the related pari passu companion loan(s) but exclude any related subordinate debt (unless otherwise stated). With respect to each mortgage loan, debt service coverage ratio, debt yield and loan-to-value ratio information do not take into account any subordinate debt (whether or not secured by the related mortgaged property) that currently exists or is allowed under the terms of such mortgage loan. See Annex A-1 to the Preliminary Prospectus. |
THE INFORMATION IN THIS STRUCTURAL AND COLLATERAL TERM SHEET IS NOT COMPLETE AND MAY BE AMENDED PRIOR TO THE TIME OF SALE. THIS TERM SHEET IS NOT AN OFFER TO SELL THESE SECURITIES AND IT IS NOT A SOLICITATION OF AN OFFER TO BUY THESE SECURITIES IN ANY JURISDICTION WHERE THE OFFER OR SALE IS NOT PERMITTED.
14
Wells Fargo Commercial Mortgage Trust 2018-C45 | Characteristics of the Mortgage Pool |
| G. | Geographic Distribution(1) |
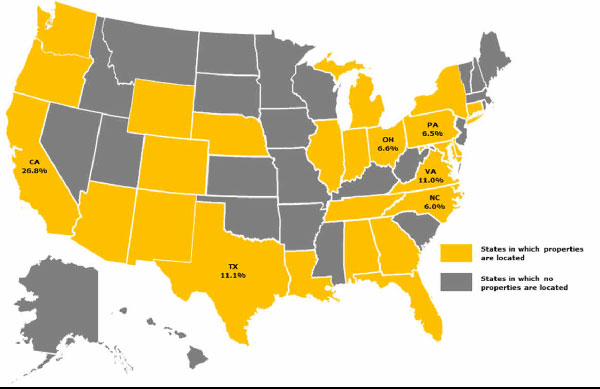
| Location | Number of Mortgaged Properties | Aggregate Cut-off Date Balance ($) | % of Initial Pool Balance (%) | Weighted Average Cut-off Date LTV Ratio (%) | Weighted Average Balloon or ARD LTV Ratio (%) | Weighted Average U/W NCF DSCR (x) | Weighted Average U/W NOI Debt Yield (%) | Weighted Average U/W NCF Debt Yield (%) | Weighted Average Mortgage Rate (%) | ||||||||
| California | 11 | $176,625,344 | 26.8 | % | 60.8 | % | 57.5 | % | 1.81 | x | 10.1 | % | 9.5 | % | 4.786 | % | |
| Northern California | 6 | 91,320,009 | 13.9 | 58.2 | 56.6 | 2.00 | 9.8 | 9.5 | 4.644 | ||||||||
| Southern California | 5 | 85,305,335 | 12.9 | 63.6 | 58.4 | 1.59 | 10.3 | 9.6 | 4.938 | ||||||||
| Texas | 14 | 73,028,847 | 11.1 | 62.6 | 57.1 | 1.50 | 10.2 | 9.7 | 4.881 | ||||||||
| Virginia | 3 | 72,275,000 | 11.0 | 58.4 | 54.2 | 1.37 | 8.5 | 8.1 | 4.711 | ||||||||
| Ohio | 9 | 43,528,746 | 6.6 | 58.8 | 54.9 | 1.74 | 9.8 | 9.6 | 4.854 | ||||||||
| Pennsylvania | 1 | 42,560,000 | 6.5 | 63.9 | 56.7 | 1.38 | 10.7 | 9.0 | 5.100 | ||||||||
| North Carolina | 8 | 39,497,884 | 6.0 | 68.4 | 63.8 | 1.51 | 9.4 | 9.2 | 5.256 | ||||||||
| Delaware | 1 | 28,270,000 | 4.3 | 57.9 | 49.7 | 2.00 | 13.1 | 12.4 | 4.655 | ||||||||
| Tennessee | 4 | 28,204,990 | 4.3 | 53.5 | 45.3 | 1.81 | 12.0 | 11.4 | 4.865 | ||||||||
| New York | 4 | 22,778,555 | 3.5 | 59.5 | 53.5 | 1.65 | 10.4 | 9.8 | 5.020 | ||||||||
| Washington | 2 | 20,175,865 | 3.1 | 55.5 | 46.8 | 1.92 | 13.8 | 12.5 | 5.020 | ||||||||
| Georgia | 4 | 19,382,545 | 2.9 | 71.6 | 61.9 | 1.39 | 9.7 | 9.2 | 5.238 | ||||||||
| Colorado | 3 | 18,400,000 | 2.8 | 57.6 | 50.2 | 1.43 | 9.7 | 9.5 | 5.320 | ||||||||
| Arizona | 1 | 13,983,135 | 2.1 | 63.6 | 52.3 | 2.05 | 14.9 | 13.2 | 4.986 | ||||||||
| Florida | 6 | 12,375,345 | 1.9 | 57.6 | 54.0 | 1.67 | 10.0 | 9.7 | 4.843 | ||||||||
| Illinois | 4 | 9,639,825 | 1.5 | 64.8 | 63.5 | 1.74 | 9.9 | 9.7 | 5.263 | ||||||||
| Alabama | 2 | 7,080,000 | 1.1 | 64.2 | 61.1 | 1.89 | 9.8 | 9.5 | 4.592 | ||||||||
| Nebraska | 1 | 6,991,281 | 1.1 | 62.7 | 51.3 | 1.73 | 12.6 | 10.9 | 4.805 | ||||||||
| Maryland | 2 | 6,966,470 | 1.1 | 67.9 | 60.9 | 1.67 | 9.4 | 9.1 | 4.940 | ||||||||
| Louisiana | 3 | 4,885,286 | 0.7 | 61.7 | 61.7 | 2.19 | 9.6 | 9.5 | 4.270 | ||||||||
| Connecticut | 1 | 3,492,811 | 0.5 | 65.9 | 55.1 | 1.33 | 10.3 | 9.1 | 5.470 | ||||||||
| New Mexico | 1 | 2,497,299 | 0.4 | 69.4 | 58.1 | 1.44 | 10.0 | 9.9 | 5.570 | ||||||||
| Michigan | 1 | 1,896,408 | 0.3 | 64.7 | 54.8 | 1.37 | 10.5 | 9.7 | 5.850 | ||||||||
| Oregon | 1 | 1,750,000 | 0.3 | 70.7 | 60.9 | 1.81 | 11.6 | 11.4 | 4.830 | ||||||||
| Indiana | 1 | 1,550,000 | 0.2 | 61.7 | 61.7 | 2.19 | 9.6 | 9.5 | 4.270 | ||||||||
| Wyoming | 1 | 929,781 | 0.1 | 61.7 | 61.7 | 2.19 | 9.6 | 9.5 | 4.270 | ||||||||
| Total/Weighted Average | 89 | $658,765,419 | 100.0 | % | 61.2 | % | 55.8 | % | 1.66 | x | 10.3 | % | 9.7 | % | 4.899 | % | |
| (1) | Because this table presents information relating to the mortgaged properties and not the mortgage loans, the information for mortgage loans secured by more than one mortgaged property is based on allocated amounts (allocating the principal balance of the mortgage loan to each of those properties according to the relative appraised values of the mortgaged properties or the allocated loan amounts or property-specific release prices set forth in the related mortgage loan documents or such other allocation as the related mortgage loan seller deemed appropriate). With respect to any mortgage loan that is part of a whole loan, the loan-to-value ratio, debt service coverage ratio and debt yield calculations include the relatedpari passu companion loan(s) but exclude any related subordinate debt (unless otherwise stated). With respect to each mortgage loan, debt service coverage ratio, debt yield and loan-to-value ratio information do not take into account any subordinate debt (whether or not secured by the related mortgaged property) that currently exists or is allowed under the terms of such mortgage loan. See Annex A-1 to the Preliminary Prospectus. |
THE INFORMATION IN THIS STRUCTURAL AND COLLATERAL TERM SHEET IS NOT COMPLETE AND MAY BE AMENDED PRIOR TO THE TIME OF SALE. THIS TERM SHEET IS NOT AN OFFER TO SELL THESE SECURITIES AND IT IS NOT A SOLICITATION OF AN OFFER TO BUY THESE SECURITIES IN ANY JURISDICTION WHERE THE OFFER OR SALE IS NOT PERMITTED.
15
| Wells Fargo Commercial Mortgage Trust 2018-C45 | Characteristics of the Mortgage Pool |
| H. | Characteristics of the Mortgage Pool(1) |
| CUT-OFF DATE BALANCE | |||
| Range of Cut-off Date Balances ($) | Number of Mortgage Loans | Aggregate Cut-off Date Balance | Percent by Aggregate Cut-off Date Pool Balance (%) |
| 797,183 - 1,000,000 | 1 | $797,183 | 0.1% |
| 1,000,001 - 2,000,000 | 4 | 7,192,719 | 1.1 |
| 2,000,001 - 3,000,000 | 5 | 12,478,849 | 1.9 |
| 3,000,001 - 4,000,000 | 2 | 6,985,357 | 1.1 |
| 4,000,001 - 5,000,000 | 2 | 8,218,970 | 1.2 |
| 5,000,001 - 6,000,000 | 2 | 11,050,000 | 1.7 |
| 6,000,001 - 7,000,000 | 5 | 33,500,540 | 5.1 |
| 7,000,001 - 8,000,000 | 2 | 14,888,582 | 2.3 |
| 8,000,001 - 9,000,000 | 2 | 17,388,639 | 2.6 |
| 9,000,001 - 10,000,000 | 2 | 18,758,585 | 2.8 |
| 10,000,001 - 15,000,000 | 9 | 113,230,606 | 17.2 |
| 15,000,001 - 20,000,000 | 4 | 74,350,390 | 11.3 |
| 20,000,001 - 30,000,000 | 4 | 108,020,000 | 16.4 |
| 30,000,001 - 50,000,000 | 4 | 166,655,000 | 25.3 |
| 50,000,001 - 65,250,000 | 1 | 65,250,000 | 9.9 |
| Total: | 49 | $658,765,419 | 100.0% |
| Weighted Average | $13,444,192 | ||
| UNDERWRITTEN NOI DEBT SERVICE COVERAGE RATIO | |||
| Range of U/W NOI DSCRs (x) | Number of Mortgage Loans | Aggregate Cut-off Date Balance | Percent by Aggregate Cut-off Date Pool Balance (%) |
| 1.26 - 1.30 | 1 | $25,000,000 | 3.8% |
| 1.31 - 1.40 | 9 | 128,037,080 | 19.4 |
| 1.41 - 1.50 | 8 | 55,592,739 | 8.4 |
| 1.51 - 1.60 | 5 | 80,004,911 | 12.1 |
| 1.61 - 1.70 | 5 | 92,650,000 | 14.1 |
| 1.71 - 1.80 | 3 | 28,679,551 | 4.4 |
| 1.81 - 1.90 | 5 | 52,866,750 | 8.0 |
| 1.91 - 2.00 | 2 | 19,991,281 | 3.0 |
| 2.01 - 3.00 | 10 | 155,943,106 | 23.7 |
| 3.01 - 3.15 | 1 | 20,000,000 | 3.0 |
| Total: | 49 | $658,765,419 | 100.0% |
| Weighted Average | 1.76x | ||
| UNDERWRITTEN NCF DEBT SERVICE COVERAGE RATIO | |||
Range of U/W NCF | Number of Mortgage Loans | Aggregate Cut-off Date Balance | Percent by Aggregate Cut-off Date Pool Balance (%) |
| 1.25 - 1.30 | 5 | $96,687,080 | 14.7% |
| 1.31 - 1.40 | 11 | 128,907,858 | 19.6 |
| 1.41 - 1.50 | 5 | 39,522,292 | 6.0 |
| 1.51 - 1.60 | 7 | 90,047,051 | 13.7 |
| 1.61 - 1.70 | 4 | 84,550,000 | 12.8 |
| 1.71 - 1.80 | 3 | 15,858,031 | 2.4 |
| 1.81 - 1.90 | 3 | 27,250,000 | 4.1 |
| 1.91 - 2.00 | 6 | 85,373,422 | 13.0 |
| 2.01 - 3.00 | 4 | 70,569,684 | 10.7 |
| 3.01 - 3.14 | 1 | 20,000,000 | 3.0 |
| Total: | 49 | $658,765,419 | 100.0% |
| Weighted Average | 1.66x | ||
| LOAN PURPOSE | |||
| Loan Purpose | Number of Mortgage Loans | Aggregate Cut-off Date Balance | Percent by Aggregate Cut-off Date Pool Balance (%) |
| Refinance | 31 | $402,551,518 | 61.1% |
| Acquisition | 17 | 190,963,902 | 29.0 |
| Recapitalization | 1 | 65,250,000 | 9.9 |
| Total: | 49 | $658,765,419 | 100.0% |
| MORTGAGE RATE | |||
Range of Mortgage | Number of Mortgage Loans | Aggregate Cut-off Date Balance | Percent by Aggregate Cut-off Date Pool Balance (%) |
| 3.709 | 1 | $20,000,000 | 3.0% |
| 4.251 - 4.500 | 2 | 67,545,000 | 10.3 |
| 4.501 - 4.750 | 5 | 115,220,000 | 17.5 |
| 4.751 - 5.000 | 13 | 203,762,906 | 30.9 |
| 5.001 - 5.250 | 11 | 119,854,715 | 18.2 |
| 5.251 - 5.500 | 7 | 76,165,466 | 11.6 |
| 5.501 - 5.750 | 6 | 46,775,314 | 7.1 |
| 5.751 - 6.000 | 3 | 4,242,018 | 0.6 |
| 6.001 - 6.110 | 1 | 5,200,000 | 0.8 |
| Total: | 49 | $658,765,419 | 100.0% |
| Weighted Average | 4.899% | ||
| UNDERWRITTEN NOI DEBT YIELD | |||
Range of U/W NOI | Number of Mortgage Loans | Aggregate Cut-off Date Balance | Percent by Aggregate Cut-off Date Pool Balance (%) |
| 8.1 - 9.0 | 7 | $156,900,000 | 23.8% |
| 9.1 - 10.0 | 18 | 238,493,238 | 36.2 |
| 10.1 - 11.0 | 10 | 110,490,248 | 16.8 |
| 11.1 - 12.0 | 5 | 43,742,545 | 6.6 |
| 12.1 - 13.0 | 2 | 26,941,672 | 4.1 |
| 13.1 - 14.0 | 2 | 37,270,000 | 5.7 |
| 14.1 - 15.0 | 3 | 34,647,585 | 5.3 |
| 15.1 - 16.0 | 1 | 2,791,549 | 0.4 |
| 16.1 - 16.2 | 1 | 7,488,582 | 1.1 |
| Total: | 49 | $658,765,419 | 100.0% |
| Weighted Average | 10.3% | ||
| UNDERWRITTEN NCF DEBT YIELD | |||
| Range of U/W NCF Debt Yields (%) | Number of Mortgage Loans | Aggregate Cut-off Date Balance | Percent by Aggregate Cut-off Date Pool Balance (%) |
| 7.9 - 8.0 | 3 | $110,650,000 | 16.8% |
| 8.1 - 9.0 | 9 | 123,821,470 | 18.8 |
| 9.1 - 10.0 | 21 | 258,927,126 | 39.3 |
| 10.1 - 11.0 | 6 | 41,468,717 | 6.3 |
| 11.1 - 12.0 | 2 | 21,750,000 | 3.3 |
| 12.1 - 13.0 | 5 | 77,884,840 | 11.8 |
| 13.1 - 14.0 | 1 | 13,983,135 | 2.1 |
| 14.1 - 14.5 | 2 | 10,280,131 | 1.6 |
| Total: | 49 | $658,765,419 | 100.0% |
| Weighted Average | 9.7% | ||
| ORIGINAL TERM TO MATURITY OR ARD | |||
| Original Terms to Maturity or ARD (months) | Number of Mortgage Loans | Aggregate Cut-off Date Balance | Percent by Aggregate Cut-off Date Pool Balance (%) |
| 60 | 1 | $5,200,000 | 0.8% |
| 120 | 48 | 653,565,419 | 99.2 |
| Total: | 49 | $658,765,419 | 100.0% |
| Weighted Average | 120 | ||
| (1) | With respect to any mortgage loan that is part of a whole loan, the loan-to-value ratio, debt service coverage ratio and debt yield calculations include the relatedpari passu companion loan(s) but exclude any related subordinate debt (unless otherwise stated). With respect to each mortgage loan, debt service coverage ratio, debt yield and loan-to-value ratio information do not take into account any subordinate debt (whether or not secured by the related mortgaged property) that currently exists or is allowed under the terms of such mortgage loan. See Annex A-1 to the Preliminary Prospectus. Prepayment provisions for each mortgage loan reflects the entire life of the loan (from origination to maturity or ARD). |
THE INFORMATION IN THIS STRUCTURAL AND COLLATERAL TERM SHEET IS NOT COMPLETE AND MAY BE AMENDED PRIOR TO THE TIME OF SALE. THIS TERM SHEET IS NOT AN OFFER TO SELL THESE SECURITIES AND IT IS NOT A SOLICITATION OF AN OFFER TO BUY THESE SECURITIES IN ANY JURISDICTION WHERE THE OFFER OR SALE IS NOT PERMITTED.
16
| Wells Fargo Commercial Mortgage Trust 2018-C45 | Characteristics of the Mortgage Pool |
| REMAINING TERM TO MATURITY OR ARD | ||||
| Range of Remaining Terms to Maturity or ARD (months) | Number of Mortgage Loans | Aggregate Cut-off Date Balance | Percent by Aggregate Cut-off Date Pool Balance (%) | |
| 56 | 1 | $5,200,000 | 0.8% | |
| 57 - 120 | 48 | 653,565,419 | 99.2 | |
| Total | 49 | $658,765,419 | 100.0% | |
| Weighted Average | 118 months | |||
| ORIGINAL AMORTIZATION TERM(2) | ||||
| Range of Original Amortization Terms (months) | Number of Mortgage Loans | Aggregate Cut-off Date Balance | Percent by Aggregate Cut-off Date Pool Balance (%) | |
| Non-Amortizing | 10 | $167,861,750 | 25.5% | |
| 300 | 1 | 7,488,582 | 1.1 | |
| 301 - 360 | 38 | 483,415,088 | 73.4 | |
| Total: | 49 | $658,765,419 | 100.0% | |
| Weighted Average(3) | 358 months | |||
(2) The original amortization term shown for any mortgage loan that is interest-only for part of its term does not include the number of months in its interest-only period and reflects only the number of months as of the commencement of amortization remaining from the end of such interest-only period. (3) Excludes the non-amortizing mortgage loans. | ||||
| REMAINING AMORTIZATION TERM(4) | ||||
| Range of Remaining Amortization Terms (months) | Number of Mortgage Loans | Aggregate Cut-off Date Balance | Percent by Aggregate Cut-off Date Pool Balance (%) | |
| Non-Amortizing | 10 | $167,861,750 | 25.5% | |
| 299 | 1 | $7,488,582 | 1.1 | |
| 301 - 360 | 38 | 483,415,088 | 73.4 | |
| Total: | 49 | $658,765,419 | 100.0% | |
| Weighted Average(5) | 358 months | |||
(4) The remaining amortization term shown for any mortgage loan that is interest-only for part of its term does not include the number of months in its interest-only period and reflects only the number of months as of the commencement of amortization remaining from the end of such interest-only period. (5) Excludes the non-amortizing mortgage loans. | ||||
| LOCKBOXES | ||||
| Type of Lockbox | Number of Mortgage Loans | Aggregate Cut-off Date Balance | Percent by Aggregate Cut-off Date Pool Balance (%) | |
| Springing | 32 | $321,362,581 | 48.8% | |
| Hard/Springing Cash Management | 11 | 199,814,257 | 30.3 | |
| Hard/Upfront Cash Management | 4 | 105,738,582 | 16.1 | |
| Soft/Springing Cash Management | 1 | 29,750,000 | 4.5 | |
| None | 1 | 2,100,000 | 0.3 | |
| Total: | 49 | $658,765,419 | 100.0% | |
| PREPAYMENT PROVISION SUMMARY(6) | ||||
| Prepayment Provision | Number of Mortgage Loans | Aggregate Cut-off Date Balance | Percent by Aggregate Cut-off Date Pool Balance (%) | |
| Lockout / Defeasance / Open | 42 | $579,525,029 | 88.0% | |
| Lockout / GRTR 1% or YM / Open | 5 | 39,290,000 | 6.0 | |
| Lockout / GRTR 1% or YM / GRTR 1% or YM or Def / Open | 1 | 20,000,000 | 3.0 | |
| Lockout / GRTR 1% or YM or Defeasance / Open | 1 | 19,950,390 | 3.0 | |
| Total: | 49 | $658,765,419 | 100.0% | |
(6) As a result of property releases or the application of funds in a performance reserve, partial principal prepayments could occur during a period that voluntary principal prepayments are otherwise prohibited.
| ||||
| CUT-OFF DATE LOAN-TO-VALUE RATIO | |||
| Range of Cut-off Date LTV Ratios (%) | Number of Mortgage Loans | Aggregate Cut-off Date Balance | Percent by Aggregate Cut-off Date Pool Balance (%) |
| 39.6 - 45.0 | 1 | $20,000,000 | 3.0% |
| 45.1 - 50.0 | 2 | 22,450,390 | 3.4 |
| 50.1 - 55.0 | 3 | 24,100,000 | 3.7 |
| 55.1 - 60.0 | 12 | 241,048,823 | 36.6 |
| 60.1 - 65.0 | 14 | 200,011,010 | 30.4 |
| 65.1 - 70.0 | 10 | 107,945,841 | 16.4 |
| 70.1 - 74.5 | 7 | 43,209,354 | 6.6 |
| Total: | 49 | $658,765,419 | 100.0% |
| Weighted Average | 61.2% | ||
BALLOON OR ARD LOAN-TO-VALUE RATIO | |||
| Range of Balloon or ARD LTV Ratios (%) | Number of Mortgage Loans | Aggregate Cut-off Date Balance | Percent by Aggregate Cut-off Date Pool Balance (%) |
| 39.0 - 40.0 | 2 | $39,950,390 | 6.1% |
| 40.1 - 45.0 | 4 | 27,377,221 | 4.2 |
| 45.1 - 50.0 | 6 | 59,714,112 | 9.1 |
| 50.1 - 55.0 | 11 | 164,657,837 | 25.0 |
| 55.1 - 60.0 | 9 | 135,410,156 | 20.6 |
| 60.1 - 65.0 | 15 | 210,455,704 | 31.9 |
| 65.1 - 66.4 | 2 | 21,200,000 | 3.2 |
| Total: | 49 | $658,765,419 | 100.0% |
| Weighted Average | 55.8% | ||
AMORTIZATION TYPE | |||
| Amortization Type | Number of Mortgage Loans | Aggregate Cut-off Date Balance | Percent by Aggregate Cut-off Date Pool Balance (%) |
| Interest-only, Amortizing Balloon | 20 | $360,502,100 | 54.7% |
| Interest-only, Balloon | 9 | 147,861,750 | 22.4 |
| Amortizing Balloon | 18 | 116,751,569 | 17.7 |
| Interest-only, ARD | 1 | 20,000,000 | 3.0 |
| Interest-only, Amortizing ARD | 1 | 13,650,000 | 2.1 |
| Total: | 49 | $658,765,419 | 100.0% |
ORIGINAL TERM OF INTEREST-ONLY PERIOD FOR PARTIAL IO LOANS | |||
| IO Terms (months) | Number of Mortgage Loans | Aggregate Cut-off Date Balance | Percent by Aggregate Cut-off Date Pool Balance (%) |
| 24 | 8 | $85,510,000 | 13.0% |
| 36 | 6 | 93,757,500 | 14.2 |
| 42 | 1 | 10,434,600 | 1.6 |
| 48 | 1 | 25,000,000 | 3.8 |
| 60 | 4 | 111,150,000 | 16.9 |
| 84 | 1 | 48,300,000 | 7.3 |
| Total: | 21 | $374,152,100 | 56.8% |
| Weighted Average | 48 months | ||
SEASONING | |||
| Seasoning (months) | Number of Mortgage Loans | Aggregate Cut-off Date Balance | Percent by Aggregate Cut-off Date Pool Balance (%) |
| 0 | 2 | $52,700,000 | 8.0% |
| 1 | 23 | 312,970,530 | 47.5 |
| 2 | 15 | 149,368,340 | 22.7 |
| 3 | 6 | 134,276,549 | 20.4 |
| 4 | 1 | 5,200,000 | 0.8 |
| 6 | 1 | 2,500,000 | 0.4 |
| 7 | 1 | 1,750,000 | 0.3 |
| Total: | 49 | $658,765,419 | 100.0% |
| Weighted Average | 2 months | ||
THE INFORMATION IN THIS STRUCTURAL AND COLLATERAL TERM SHEET IS NOT COMPLETE AND MAY BE AMENDED PRIOR TO THE TIME OF SALE. THIS TERM SHEET IS NOT AN OFFER TO SELL THESE SECURITIES AND IT IS NOT A SOLICITATION OF AN OFFER TO BUY THESE SECURITIES IN ANY JURISDICTION WHERE THE OFFER OR SALE IS NOT PERMITTED.
17
| Wells Fargo Commercial Mortgage Trust 2018-C45 | Certain Terms and Conditions |
| V. | Certain Terms and Conditions |
| Interest Entitlements: | The interest entitlement of each Class of Certificates on each Distribution Date generally will be the interest accrued during the related Interest Accrual Period on the related Certificate Balance or Notional Amount at the related pass-through rate, net of any prepayment interest shortfalls allocated to that Class for such Distribution Date as described below. If prepayment interest shortfalls arise from voluntary prepayments (without Master Servicer consent) on particular non-specially serviced loans during any collection period, the Master Servicer is required to make a compensating interest payment to offset those shortfalls, generally up to an amount equal to the portion of its master servicing fees that accrue at 0.25 basis pointsper annum. The remaining amount of prepayment interest shortfalls will be allocated to reduce the interest entitlement on all Classes of Certificates entitled to interest, on apro rata basis, based on their respective amounts of accrued interest for the related Distribution Date. If a Class receives less than the entirety of its interest entitlement on any Distribution Date, then the shortfall (excluding any shortfall due to prepayment interest shortfalls), together with interest thereon, will be added to its interest entitlement for the next succeeding Distribution Date. |
| Principal Distribution Amount: | The Principal Distribution Amount for each Distribution Date generally will be the aggregate amount of principal received or advanced in respect of the mortgage loans, net of any non-recoverable advances and interest thereon and workout-delayed reimbursement amounts that are reimbursed to the Master Servicer, the Special Servicer or the Trustee during the related collection period. Non-recoverable advances and interest thereon are reimbursable from principal collections and advances before reimbursement from other amounts. Workout-delayed reimbursement amounts are reimbursable from principal collections. |
| Subordination, Allocation of Losses and Certain Expenses | The chart below describes the manner in which the payment rights of certain Classes of Certificates will be senior or subordinate, as the case may be, to the payment rights of other Classes of Certificates. The chart also shows the corresponding entitlement to receive principal and/or interest of certain Classes of Certificates (other than excess interest that accrues on each mortgage loan that has an anticipated repayment date) on any distribution date in descending order. It also shows the manner in which losses are allocated to certain Classes of Certificates in ascending order (beginning with the Non-Offered Certificates, and other than the Class V and R certificates) to reduce the balance of each such class to zero;provided that no principal payments or mortgage loan losses will be allocated to the Class X-A, X-B, X-D, V or R Certificates, although principal payments and losses may reduce the notional amounts of the Class X-A, X-B and X-D certificates and, therefore, the amount of interest they accrue. |
THE INFORMATION IN THIS STRUCTURAL AND COLLATERAL TERM SHEET IS NOT COMPLETE AND MAY BE AMENDED PRIOR TO THE TIME OF SALE. THIS TERM SHEET IS NOT AN OFFER TO SELL THESE SECURITIES AND IT IS NOT A SOLICITATION OF AN OFFER TO BUY THESE SECURITIES IN ANY JURISDICTION WHERE THE OFFER OR SALE IS NOT PERMITTED.
18
| Wells Fargo Commercial Mortgage Trust 2018-C45 | Certain Terms and Conditions |
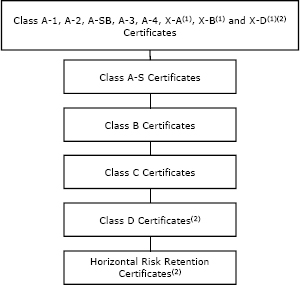 | |
(1) The Class X-A, X-B and X-D Certificates are interest-only certificates. (2) Non-Offered Certificates.
| |
| Distributions: | On each Distribution Date, funds available for distribution from the mortgage loans, net of specified trust fees, expenses and reimbursements will generally be distributed in the following amounts and order of priority (in each case to the extent of remaining available funds): |
| 1. Class A-1, A-2, A-SB, A-3, A-4, X-A, X-B and X-D Certificates: To interest on the Class A-1, A-2, A-SB, A-3, A-4, X-A, X-B and X-D Certificates,pro rata, according to their respective interest entitlements. | |
| 2. Class A-1, A-2, A-SB, A-3 and A-4 Certificates: To principal on the Class A-1, A-2, A-SB, A-3 and A-4 Certificates in the following amounts and order of priority: (i) first, to principal on the Class A-SB Certificates, in an amount up to the Principal Distribution Amount for such Distribution Date until their Certificate Balance is reduced to the Class A-SB Planned Principal Balance for such Distribution Date; (ii) second, to principal on the Class A-1 Certificates until their Certificate Balance is reduced to zero, up to the remainder of the Principal Distribution Amount for such Distribution Date; (iii) third, to principal on the Class A-2 Certificates until their Certificate Balance is reduced to zero, up to the remainder of the Principal Distribution Amount for such Distribution Date; (iv) fourth, to principal on the Class A-3 Certificates until their Certificate Balance is reduced to zero, up to the remainder of the Principal Distribution Amount for such Distribution Date; (v) fifth, to principal on the Class A-4 Certificates until their Certificate Balance is reduced to zero, up to the remainder of the Principal Distribution Amount for such Distribution Date; and (vi) sixth, to principal on the Class A-SB Certificates until their Certificate Balance is reduced to zero, up to the remainder of the Principal Distribution Amount for such Distribution Date. However, if the Certificate Balance of each Class of Principal Balance Certificates, other than the Class A-1, A-2, A-SB, A-3 and A-4 Certificates, has been reduced to zero as a result of the allocation of Mortgage Loan losses and expenses and any of the Class A-1, A-2, A-SB, A-3 and A-4 Certificates remains outstanding, then the Principal Distribution Amount will be distributed to the Class A-1, A-2, A-SB, A-3 and A-4 Certificates,pro rata, based on their respective outstanding Certificate Balances, until their Certificate Balances have been reduced to zero. | |
| 3. Class A-1, A-2, A-SB, A-3 and A-4 Certificates: To reimburse the holders of the Class A-1, A-2, A-SB, A-3 and A-4 Certificates,pro rata, on the basis of previously allocated unreimbursed losses, for any previously unreimbursed losses (plus interest thereon) on the mortgage loans that were previously allocated in reduction of the Certificate Balances of such Classes. |
THE INFORMATION IN THIS STRUCTURAL AND COLLATERAL TERM SHEET IS NOT COMPLETE AND MAY BE AMENDED PRIOR TO THE TIME OF SALE. THIS TERM SHEET IS NOT AN OFFER TO SELL THESE SECURITIES AND IT IS NOT A SOLICITATION OF AN OFFER TO BUY THESE SECURITIES IN ANY JURISDICTION WHERE THE OFFER OR SALE IS NOT PERMITTED.
19
| Wells Fargo Commercial Mortgage Trust 2018-C45 | Certain Terms and Conditions |
4. Class A-S Certificates: To make distributions on the Class A-S Certificates as follows: (a) first, to interest on the Class A-S Certificates in the amount of the interest entitlement for that Class; (b) next, to the extent of the portion of the Principal Distribution Amount remaining after distributions in respect of principal to each Class with a higher distribution priority (in this case, the Class A-1, A-2, A-SB, A-3 and A-4 Certificates), to principal on the Class A-S Certificates until their Certificate Balance is reduced to zero; and (c) next, to reimburse the holders of the Class A-S Certificates for any previously unreimbursed losses (plus interest thereon) on the mortgage loans that were previously allocated to that Class in reduction of their Certificate Balance.
5. Class B Certificates: To make distributions on the Class B Certificates as follows: (a) first, to interest on the Class B Certificates in the amount of the interest entitlement for that Class; (b) next, to the extent of the portion of the Principal Distribution Amount remaining after distributions in respect of principal to each Class with a higher distribution priority (in this case, the Class A-1, A-2, A-SB, A-3, A-4 and A-S Certificates), to principal on the Class B Certificates until their Certificate Balance is reduced to zero; and (c) next, to reimburse the holders of the Class B Certificates for any previously unreimbursed losses (plus interest thereon) on the mortgage loans that were previously allocated to that Class in reduction of their Certificate Balance.
6. Class C Certificates: To make distributions on the Class C Certificates as follows: (a) first, to interest on the Class C Certificates in the amount of the interest entitlement for that Class; (b) next, to the extent of the portion of the Principal Distribution Amount remaining after distributions in respect of principal to each Class with a higher distribution priority (in this case, the Class A-1, A-2, A-SB, A-3, A-4, A-S and B Certificates), to principal on the Class C Certificates until their Certificate Balance is reduced to zero; and (c) next, to reimburse the holders of the Class C Certificates for any previously unreimbursed losses (plus interest thereon) on the mortgage loans that were previously allocated to that Class in reduction of their Certificate Balance.
7. After the Class A-1, A-2, A-SB, A-3, A-4, X-A, X-B, X-D, A-S, B and C Certificates are paid all amounts to which they are entitled, the remaining funds available for distribution will be used to pay interest, principal and loss reimbursement amounts on the Class D, E-RR, F-RR, G-RR, H-RR and J-RR Certificates sequentially in that order in a manner analogous to the Class C Certificates.
| |
| Allocation of Yield Maintenance Charges and Prepayment Premiums: | If any yield maintenance charge or prepayment premium is collected during any particular collection period with respect to any mortgage loan, then on the Distribution Date corresponding to that collection period, the certificate administrator will pay that yield maintenance charge or prepayment premium (net of liquidation fees payable therefrom) in the following manner: (1) to each of the Class A-1, A-2, A-SB, A-3, A-4, A-S, B, C and D Certificates, the product of (a) the yield maintenance charge or prepayment premium, (b) the related Base Interest Fraction (as defined in the Preliminary Prospectus) for such Class, and (c) a fraction, the numerator of which is equal to the amount of principal distributed to such Class for that Distribution Date, and the denominator of which is the total amount of principal distributed to all Principal Balance Certificates for that Distribution Date, (2) to the Class X-A Certificates, the excess, if any, of (a) the product of (i) such yield maintenance charge or prepayment premium and (ii) a fraction, the numerator of which is equal to the amount of principal distributed to the Class A-1, A-2, A-SB, A-3 and A-4 Certificates for that Distribution Date, and the denominator of which is the total amount of principal distributed to all Principal Balance Certificates for that Distribution Date, over (b) the amount of such yield maintenance charge or prepayment premium distributed to the Class A-1, A-2, A-SB, A-3 and A-4 Certificates as described above, and (3) to the Class X-B Certificates, any remaining portion of such yield maintenance charge or prepayment premium not distributed as described above.
No prepayment premiums or yield maintenance charges will be distributed to the holders of the Class X-D, E-RR, F-RR, G-RR, H-RR, J-RR, V or R certificates. For a description of when prepayment premiums and yield maintenance charges are generally required on the mortgage loans, see Annex A-1 to the Preliminary Prospectus. See also “Risk Factors—Risks Relating to the Mortgage Loans—Risks Relating to Enforceability of Yield Maintenance Charges, Prepayment Premiums or Defeasance Provisions” and “Risk Factors—Other Risks Relating to the Certificates—Your Yield May Be Affected by Defaults, Prepayments and Other Factors” in the Preliminary Prospectus. Prepayment premiums and yield maintenance charges will be distributed on each Distribution Date only to the extent they are actually received on the mortgage loans as of the related Determination Date.
|
| Realized Losses: | The Certificate Balances of the Class A-1, A-2, A-SB, A-3, A-4, A-S, B, C, D, E-RR, F-RR, G-RR, H-RR and J-RR Certificates will be reduced without distribution on any Distribution Date as a write-off to the extent of any losses realized on the mortgage loans allocated to such Class on such Distribution Date. Such losses will be applied in the following order, in each case until the |
THE INFORMATION IN THIS STRUCTURAL AND COLLATERAL TERM SHEET IS NOT COMPLETE AND MAY BE AMENDED PRIOR TO THE TIME OF SALE. THIS TERM SHEET IS NOT AN OFFER TO SELL THESE SECURITIES AND IT IS NOT A SOLICITATION OF AN OFFER TO BUY THESE SECURITIES IN ANY JURISDICTION WHERE THE OFFER OR SALE IS NOT PERMITTED.
20
| Wells Fargo Commercial Mortgage Trust 2018-C45 | Certain Terms and Conditions |
related Certificate Balance is reduced to zero: first, to the Class J-RR Certificates; second, to the Class H-RR Certificates; third, to the Class G-RR Certificates; fourth, to the Class F-RR Certificates; fifth, to the Class E-RR Certificates; sixth, to the Class D Certificates; seventh, to the Class C Certificates; eighth, to the Class B Certificates; ninth, to the Class A-S Certificates; and, finally,pro rata, to the Class A-1, A-2, A-SB, A-3 and A-4 Certificates based on their outstanding Certificate Balances.
The notional amount of the Class X-A Certificates will be reduced by the amount of all losses that are allocated to the Class A-1, A-2, A-SB, A-3 or A-4 Certificates as write-offs in reduction of their Certificate Balances. The notional amount of the Class X-B Certificates will be reduced by the amount of all losses that are allocated to the Class A-S, B or C Certificates as write-offs in reduction of their Certificate Balances. The notional amount of the Class X-D Certificates will be reduced by the amount of all losses that are allocated to the Class D Certificates as write-offs in reduction of its Certificate Balance.
| |
| P&I Advances: | The Master Servicer or, if the Master Servicer fails to do so, the Trustee, will be obligated to advance delinquent debt service payments (other than balloon payments, excess interest and default interest) and assumed debt service payments on mortgage loans with delinquent balloon payments (excluding any related companion loan), except to the extent any such advance is deemed non-recoverable from collections on the related mortgage loan. In addition, if an Appraisal Reduction Amount exists for a given mortgage loan, the interest portion of any P&I advance for such mortgage loan will be reduced, which will have the effect of reducing the amount of interest available for distribution to the Certificates in reverse alphabetical order of their Class designations (except that interest payments on the Class A-1, A-2, A-SB, A-3, A-4, X-A, X-B and X-D Certificates would be affected on apari passu basis). |
| Servicing Advances: | The Master Servicer or, if the Master Servicer fails to do so, the Trustee, will be obligated to make servicing advances, including the payment of delinquent property taxes, insurance premiums and ground rent, except to the extent that those advances are deemed non-recoverable from collections on the related mortgage loan. With respect to any non-serviced whole loan, the master servicer or trustee, as applicable, under the related lead securitization servicing agreement will have the primary obligation to make any required servicing advances with respect to such non-serviced whole loan. |
Appraisal Reduction Amounts and Collateral Deficiency Amounts:
| An “Appraisal Reduction Amount” generally will be created in the amount, if any, by which the principal balance of a required appraisal loan (which is a mortgage loan with respect to which certain defaults, modifications or insolvency events have occurred as further described in the Preliminary Prospectus) plus other amounts overdue or advanced in connection with such mortgage loan exceeds 90% of the appraised value of the related mortgaged property plus certain escrows and reserves (including letters of credit) held with respect to the mortgage loan. With respect to any whole loan, any Appraisal Reduction Amount will be allocated,pro rata, to the related mortgage loan and the relatedpari passu companion loan(s).
A mortgage loan will cease to be a required appraisal loan when the same has ceased to be a specially serviced loan (if applicable), has been brought current for at least three consecutive months and no other circumstances exist that would cause such mortgage loan to be a required appraisal loan.
A “Collateral Deficiency Amount” will exist with respect to any mortgage loan that is modified into an AB loan structure and remains a corrected mortgage loan and will generally equal the excess of (i) the stated principal balance of such AB modified loan (taking into account the related junior note(s) and anypari passu notes included therein), over (ii) the sum of (in the case of a whole loan, solely to the extent allocable to the subject mortgage loan) (x) the most recent appraised value of the related mortgaged property plus (y) solely to the extent not reflected or taken into account in such appraised value and to the extent on deposit with, or otherwise under the control of, the lender as of the date of such determination, any capital or additional collateral contributed by the related borrower at the time the mortgage loan (and as part of the modification thereto) became an AB modified loan plus (z) any other escrows or reserves (in addition to any amounts set forth in the immediately preceding clause (y)) held with respect to the mortgage loan as of the date of such determination.
A “Cumulative Appraisal Reduction Amount” with respect to any mortgage loan will be the sum of any Appraisal Reduction Amount and any Collateral Deficiency Amount.
Appraisal Reduction Amounts will affect the amount of debt service advances in respect of the related mortgage loan. Additionally, Cumulative Appraisal Reduction Amounts will be taken into account in the determination of the identity of the Class whose majority constitutes the “majority controlling class certificateholder” and is entitled to appoint the directing certificateholder. |
THE INFORMATION IN THIS STRUCTURAL AND COLLATERAL TERM SHEET IS NOT COMPLETE AND MAY BE AMENDED PRIOR TO THE TIME OF SALE. THIS TERM SHEET IS NOT AN OFFER TO SELL THESE SECURITIES AND IT IS NOT A SOLICITATION OF AN OFFER TO BUY THESE SECURITIES IN ANY JURISDICTION WHERE THE OFFER OR SALE IS NOT PERMITTED.
21
| Wells Fargo Commercial Mortgage Trust 2018-C45 | Certain Terms and Conditions |
Clean-Up Call and Exchange Termination:
| On each Distribution Date occurring after the aggregate unpaid principal balance of the pool of mortgage loans is less than 1.0% of the principal balance of the mortgage loans as of the cut-off date, certain specified persons will have the option to purchase all of the remaining mortgage loans (and the trust’s interest in all property acquired through exercise of remedies in respect of any mortgage loan) at the price specified in the Preliminary Prospectus. Exercise of the option will terminate the trust and retire the then-outstanding certificates.
If the aggregate Certificate Balances of each of the Class A-1, A-2, A-SB, A-3, A-4, A-S, B, C and D Certificates have been reduced to zero, the trust may also be terminated in connection with an exchange of all the then-outstanding certificates (other than the Class V and Class R Certificates) for the mortgage loans and REO properties then remaining in the issuing entity, subject to payment of a price specified in the Preliminary Prospectus, but all of the holders of those outstanding Classes (other than the Class V and R Certificates) of certificates would have to voluntarily participate in the exchange.
|
| Liquidation Loan Waterfall: | Following the liquidation of any loan or property, the net liquidation proceeds generally will be applied (after reimbursement of advances and certain trust fund expenses), first, as a recovery of accrued interest, other than delinquent interest that was not advanced as a result of Appraisal Reduction Amounts, second, as a recovery of principal until all principal has been recovered, and then as a recovery of delinquent interest that was not advanced as a result of Appraisal Reduction Amounts. Please see “Description of the Certificates—Distributions—Application Priority of Mortgage Loan Collections or Whole Loan Collections” in the Preliminary Prospectus. |
| Control Eligible Certificates: | The Class E-RR, F-RR, G-RR, H-RR and J-RR Certificates. |
| Directing Certificateholder/ Controlling Class: | A directing certificateholder may be appointed by the “majority controlling class certificateholder”, which will be the holder(s) of a majority of the “controlling class”, which means the most subordinate class of Certificates among the Control Eligible Certificates.
The “Controlling Class” will be, as of any time of determination, the most subordinate class of Control Eligible Certificates then outstanding that has an aggregate Certificate Balance (as notionally reduced by any Cumulative Appraisal Reduction Amounts allocable to such class(es)) at least equal to 25% of the initial Certificate Balance of that class;provided,however, that if at any time the Certificate Balances of the certificates other than the Control Eligible Certificates have been reduced to zero as a result of principal payments on the Mortgage Loans, then the Controlling Class will be the most subordinate class of Control Eligible Certificates that has a Certificate Balance greater than zero without regard to any Cumulative Appraisal Reduction Amounts. The Controlling Class as of the Closing Date will be the Class J-RR Certificates.
|
| Control and Consultation: | The rights of various parties to replace the Special Servicer and approve or consult with respect to major actions of the Special Servicer will vary according to defined periods.
A “Control Termination Event” will occur when the Class F-RR Certificates have a Certificate Balance (taking into account the application of any Cumulative Appraisal Reduction Amounts to notionally reduce the Certificate Balance of such class) of less than 25% of the initial Certificate Balance of that class;provided,however, that a Control Termination Event will not be deemed continuing in the event that the Certificate Balances of the certificates other than the Control Eligible Certificates have been reduced to zero as a result of principal payments on the Mortgage Loans.
A “Consultation Termination Event” will occur when there is no class of Control Eligible Certificates that has a then-outstanding Certificate Balance at least equal to 25% of the initial Certificate Balance of that class, in each case, without regard to the application of any Cumulative Appraisal Reduction Amounts;provided,however, that a Consultation Termination Event will not be deemed continuing in the event that the Certificate Balances of the certificates other than the Control Eligible Certificates have been reduced to zero as a result of principal payments on the Mortgage Loans.
If no Control Termination Event has occurred and is continuing, except with respect to the Excluded Loans (as defined below) with respect to the directing certificateholder (i) the directing certificateholder will be entitled to grant or withhold approval of asset status reports prepared, and material servicing actions proposed, by the Special Servicer, and (ii) the directing certificateholder will be entitled to terminate and replace the Special Servicer with or without cause, and appoint itself or another person as the successor special servicer. It will be a condition to such appointment that DBRS, Fitch and Moody’s (and any rating agency rating any securities backed by anypari passu companion loan(s) serviced under this transaction) confirm that the appointment would not result in a qualification, downgrade or withdrawal of any of their then-current ratings of certificates (and any certificates backed by anypari passu companion loan(s) serviced under this transaction). |
THE INFORMATION IN THIS STRUCTURAL AND COLLATERAL TERM SHEET IS NOT COMPLETE AND MAY BE AMENDED PRIOR TO THE TIME OF SALE. THIS TERM SHEET IS NOT AN OFFER TO SELL THESE SECURITIES AND IT IS NOT A SOLICITATION OF AN OFFER TO BUY THESE SECURITIES IN ANY JURISDICTION WHERE THE OFFER OR SALE IS NOT PERMITTED.
22
| Wells Fargo Commercial Mortgage Trust 2018-C45 | Certain Terms and Conditions |
If a Control Termination Event has occurred and is continuing but no Consultation Termination Event has occurred and is continuing, the Special Servicer will be required to consult with the directing certificateholder (other than with respect to Excluded Loans) in connection with asset status reports and material special servicing actions.
If a Consultation Termination Event has occurred and is continuing, no directing certificateholder will be recognized or have any right to terminate the Special Servicer or approve, direct or consult with respect to servicing matters.
With respect to each non-serviced whole loan, the applicable servicing agreement for the related controllingpari passu companion loan(s) generally grants the directing certificateholder under the related securitization control rights that may include the right to approve or disapprove various material servicing actions involving the related whole loan. The directing certificateholder for this securitization (so long as no Consultation Termination Event has occurred and is occurring) generally will nonetheless have the right to be consulted on a non-binding basis with respect to such actions. For purposes of the servicing of any such whole loan contemplated by this paragraph, the occurrence and continuance of a Control Termination Event or Consultation Termination Event under this securitization will not limit the control or other rights of the directing certificateholder (or equivalent) under the securitization of the related controllingpari passu companion loan(s).
The control rights and consent and consultation rights described in the three preceding paragraphs are subject to various limitations, conditions and exceptions as described in the Preliminary Prospectus.
Notwithstanding any contrary description set forth above, in the event that, with respect to any mortgage loan, if the majority controlling class certificateholder or the directing certificateholder is a Borrower Party, the majority controlling class certificateholder and the directing certificateholder will have no right to receive asset status reports or such other information as may be specified in the WFCM 2018-C45 pooling and servicing agreement, to grant or withhold approval of, or consult with respect to, asset status reports prepared, and material servicing actions proposed, by the Special Servicer, with respect to such mortgage loan, and such mortgage loan will be referred to as an “Excluded Loan” as to such party.
In addition, notwithstanding any contrary description set forth above, in the event that, with respect to any mortgage loan, a controlling class certificateholder is a Borrower Party, such controlling class certificateholder will have no right to receive asset status reports or such other information as may be specified in the WFCM 2018-C45 pooling and servicing agreement with respect to such mortgage loan, and such controlling class certificateholder will be referred to as an “excluded controlling class holder”.
“Borrower Party” means a borrower, a mortgagor or a manager of a mortgaged property, an Accelerated Mezzanine Loan Lender, or any Borrower Party Affiliate. “Accelerated Mezzanine Loan Lender” means a mezzanine lender under a mezzanine loan that has been accelerated or as to which foreclosure or enforcement proceedings have been commenced against the equity collateral pledged to secure such mezzanine loan. “Borrower Party Affiliate” means, with respect to a borrower, a mortgagor, a manager of a Mortgaged Property or an Accelerated Mezzanine Loan Lender, (x) any other person controlling or controlled by or under common control with such borrower, mortgagor, manager or Accelerated Mezzanine Loan Lender, as applicable, or (y) any other person owning, directly or indirectly, 25% or more of the beneficial interests in such borrower, mortgagor, manager or Accelerated Mezzanine Loan Lender.
| |
| Replacement of Special Servicer: | If a Control Termination Event has occurred and is continuing, the Special Servicer may be removed and replaced without cause upon the affirmative direction of certificate owners holding not less than 66-2/3% of a certificateholder quorum, following a proposal from certificate owners holding not less than 25% of the appraisal-reduced voting rights of all Certificates. The certificateholders who initiate a vote on a termination and replacement of the Special Servicer without cause must cause DBRS, Fitch and Moody’s to confirm the then-current ratings of the certificates (or decline to review the matter) and cause the payment of the fees and expenses incurred in the replacement. If no Control Termination Event has occurred and is continuing, the Special Servicer may be replaced by the directing certificateholder, subject to DBRS, Fitch and Moody’s (and any Rating Agency rating any securities backed by anypari passu companion loan(s) serviced under this transaction) confirming the then-current ratings of the Certificates (and any certificates backed by anypari passucompanion loans serviced under this transaction) or declining to review the matter.
In addition, if at any time the Operating Advisor determines, in its sole discretion exercised in good faith, that (i) the Special Servicer is not performing its duties as required under the pooling and servicing agreement in accordance with the Servicing Standard and (ii) the replacement of the Special Servicer would be in the best interest of the certificateholders as a collective whole, then, the Operating Advisor will have the right to recommend the replacement |
THE INFORMATION IN THIS STRUCTURAL AND COLLATERAL TERM SHEET IS NOT COMPLETE AND MAY BE AMENDED PRIOR TO THE TIME OF SALE. THIS TERM SHEET IS NOT AN OFFER TO SELL THESE SECURITIES AND IT IS NOT A SOLICITATION OF AN OFFER TO BUY THESE SECURITIES IN ANY JURISDICTION WHERE THE OFFER OR SALE IS NOT PERMITTED.
23
| Wells Fargo Commercial Mortgage Trust 2018-C45 | Certain Terms and Conditions |
of the Special Servicer and will submit its formal recommendation to the Trustee and the Certificate Administrator (along with its rationale, its proposed replacement special servicer and other relevant information justifying its recommendation).
The Operating Advisor’s recommendation to replace the Special Servicer must be confirmed by an affirmative vote of holders of Principal Balance Certificates evidencing at least a majority of a quorum of certificateholders (which, for this purpose, is the holders of Principal Balance Certificates that (i) evidence at least 20% of the Voting Rights (taking into account the application of any cumulative appraisal reduction amounts to notionally reduce the respective Certificate Balances) of all Principal Balance Certificates on an aggregate basis, and (ii) consist of at least three certificateholders or certificate owners that are not risk retention affiliated with each other). In the event the holders of Principal Balance Certificates evidencing at least a majority of a quorum of certificateholders elect to remove and replace the Special Servicer (which requisite affirmative votes must be received within 180 days of the posting of the notice of the Operating Advisor’s recommendation to replace the Special Servicer to the Certificate Administrator’s website), the Certificate Administrator will be required to receive a Rating Agency Confirmation from each of the Rating Agencies at that time.
| |
| Excluded Special Servicer: | In the event that, with respect to any mortgage loan, the Special Servicer is a Borrower Party, the Special Servicer will be required to resign as special servicer of such mortgage loan (referred to as an “excluded special servicer loan”). If no Control Termination Event has occurred and is continuing, the directing certificateholder will be entitled to appoint (and may replace with or without cause) a separate special servicer that is not a Borrower Party (referred to as an “excluded special servicer”) with respect to such excluded special servicer loan unless such excluded special servicer loan is also an excluded loan. Otherwise, upon resignation of the Special Servicer with respect to an excluded special servicer loan, the resigning Special Servicer will be required to appoint the excluded special servicer. |
| Appraisal Remedy: | If the Class of Certificates comprising the controlling class loses its status as controlling class because of the application of an Appraisal Reduction Amount or Collateral Deficiency Amount, the holders of a majority of the voting rights of such Class may require the Special Servicer to order a second appraisal for any mortgage loan in respect of which an Appraisal Reduction Amount or Collateral Deficiency Amount has been applied. The Special Servicer must thereafter determine whether, based on its assessment of such second appraisal, any recalculation of the Appraisal Reduction Amount or Collateral Deficiency Amount is warranted. Such Class will not be able to exercise any direction, control, consent and/or similar rights of the controlling class unless and until reinstated as the controlling class through such determination; and pending such determination, the rights of the controlling class will be exercised by the Control Eligible Certificates, if any, that would be the controlling class taking into account the subject appraisal reduction amount. |
| Sale of Defaulted Assets: | There will be no “fair value” purchase option. Instead, the WFCM 2018-C45 pooling and servicing agreement will authorize the Special Servicer to sell defaulted mortgage loans serviced by such Special Servicer to the highest bidder in a manner generally similar to sales of REO properties.
The sale of a defaulted loan (other than a non-serviced whole loan) for less than par plus accrued interest and certain other fees and expenses owed on the loan will be subject to consent or consultation rights of the directing certificateholder and/or Operating Advisor, as described in the Preliminary Prospectus. Generally speaking, the holder of apari passu companion loan will have consent and/or consultation rights, as described in the Preliminary Prospectus.
With respect to each non-serviced whole loan, the applicable servicing agreement governing the servicing of such whole loan generally provides that, if the relatedpari passu companion loan(s) serviced under such agreement become a defaulted loan under such servicing agreement, then the related special servicer may offer to sell to any person (or may offer to purchase) for cash such whole loan during such time as such applicablepari passucompanion loan(s) constitutes a defaulted loan under such servicing agreement. Generally speaking, in connection with any such sale, the related special servicer is required to sell both the mortgage loan and the related pari passu companion loan(s) as a whole loan. The directing certificateholder for this securitization generally will have consent and/or consultation rights as the holder of an interest in the related mortgage loan, as described in the Preliminary Prospectus.
The procedures for the sale of any whole loan that becomes a defaulted whole loan, and any associated consultation rights, are subject to various limitations, conditions and exceptions as described in the Preliminary Prospectus. |
THE INFORMATION IN THIS STRUCTURAL AND COLLATERAL TERM SHEET IS NOT COMPLETE AND MAY BE AMENDED PRIOR TO THE TIME OF SALE. THIS TERM SHEET IS NOT AN OFFER TO SELL THESE SECURITIES AND IT IS NOT A SOLICITATION OF AN OFFER TO BUY THESE SECURITIES IN ANY JURISDICTION WHERE THE OFFER OR SALE IS NOT PERMITTED.
24
| Wells Fargo Commercial Mortgage Trust 2018-C45 | Certain Terms and Conditions |
| “As-Is” Appraisals: | Appraisals must be conducted on an “as-is” basis, and must be no more than 12 months old, for purposes of determining Appraisal Reduction Amounts and market value in connection with REO sales. Required appraisals may consist of updates of prior appraisals. Internal valuations by the Special Servicer are permitted if the principal balance of a mortgage loan is less than $2,000,000. |
| Operating Advisor: | The Operating Advisor will have certain review and consultation rights relating to the performance of the Special Servicer and with respect to its actions taken in connection with the resolution and/or liquidation of Specially Serviced Loans. With respect to each mortgage loan (other than a Non-Serviced Mortgage Loan), the Operating Advisor will be responsible for:
● reviewing the actions of the Special Servicer with respect to any Specially Serviced Loan;
● reviewing (i) all reports by the Special Servicer made available to Privileged Persons on the Certificate Administrator’s website and (ii) each Asset Status Report (as defined in the Preliminary Prospectus) (after the occurrence and during the continuance of an Operating Advisor Consultation Event (as defined below)) and Final Asset Status Report (as defined in the Preliminary Prospectus);
● recalculating and verifying the accuracy of the mathematical calculations by the special servicer and the corresponding application of the non-discretionary portion of the applicable formulas required to be utilized in connection with Appraisal Reduction Amounts, Collateral Deficiency Amounts and net present value calculations used in the Special Servicer’s determination of what course of action to take in connection with the workout or liquidation of a Specially Serviced Loan; and
● preparing an annual report (if any mortgage loan (other than any Non-Serviced Mortgage Loan) was a Specially Serviced Loan at any time during the prior calendar year or an Operating Advisor Consultation Event (as defined below) occurred during the prior calendar year) that sets forth whether the Operating Advisor believes, in its sole discretion exercised in good faith, that the Special Servicer is operating in compliance with the Servicing Standard with respect to its performance of its duties under the pooling and servicing agreement with respect to Specially Serviced Loans (and, after the occurrence and continuance of an Operating Advisor Consultation Event (as defined below), with respect to major decisions on non-Specially Serviced Loans) during the prior calendar year on an “asset-level basis”. The Operating Advisor will identify (1) which, if any, standards the Operating Advisor believes, in its sole discretion exercised in good faith, the Special Servicer has failed to comply with and (2) any material deviations from the Special Servicer’s obligations under the pooling and servicing agreement with respect to the resolution or liquidation of any Specially Serviced Loan or REO Property (other than with respect to any REO Property related to any Non-Serviced Mortgage Loan). In preparing any Operating Advisor Annual Report (as defined in the Preliminary Prospectus), the Operating Advisor will not be required to report on instances of non-compliance with, or deviations from, the Servicing Standard or the Special Servicer’s obligations under the pooling and servicing agreement that the Operating Advisor determines, in its sole discretion exercised in good faith, to be immaterial.
With respect to each mortgage loan (other than any Non-Serviced Mortgage Loan), after the Operating Advisor has received notice that an Operating Advisor Consultation Event (as defined below) has occurred and is continuing, in addition to the duties described above, the Operating Advisor will be required to perform the following additional duties:
● to consult (on a non-binding basis) with the Special Servicer in respect of asset status reports and
● to consult (on a non-binding basis) with the Special Servicer with respect to “major decisions” processed by the Special Servicer.
An “Operating Advisor Consultation Event” will occur when the Certificate Balances of the Class E-RR, F-RR, G-RR, H-RR and J-RR Certificates in the aggregate (taking into account the application of any Cumulative Appraisal Reduction Amounts to notionally reduce the Certificate Balances of such classes) is 25% or less of the initial Certificate Balances of such classes in the aggregate.
|
| Asset Representations Reviewer: | The Asset Representations Reviewer will be required to review certain delinquent mortgage loans after a specified delinquency threshold has been exceeded (an “Asset Review Trigger”) and the required percentage of certificateholders vote to direct a review of such delinquent loans. An Asset Review Trigger will occur when either (1) mortgage loans with an aggregate |
THE INFORMATION IN THIS STRUCTURAL AND COLLATERAL TERM SHEET IS NOT COMPLETE AND MAY BE AMENDED PRIOR TO THE TIME OF SALE. THIS TERM SHEET IS NOT AN OFFER TO SELL THESE SECURITIES AND IT IS NOT A SOLICITATION OF AN OFFER TO BUY THESE SECURITIES IN ANY JURISDICTION WHERE THE OFFER OR SALE IS NOT PERMITTED.
25
| Wells Fargo Commercial Mortgage Trust 2018-C45 | Certain Terms and Conditions |
outstanding principal balance of 25.0% or more of the aggregate outstanding principal balance of all of the mortgage loans (including any REO loans (or a portion of any REO loan in the case of a whole loan)) held by the issuing entity as of the end of the applicable collection period are delinquent loans or (2) at least 15 mortgage loans are delinquent loans as of the end of the applicable collection period and the outstanding principal balance of such delinquent loans in the aggregate constitutes at least 20.0% of the aggregate outstanding principal balance of all of the mortgage loans (including any REO loans (or a portion of any REO loan in the case of a whole loan)) held by the issuing entity as of the end of the applicable collection period. See “Pooling and Servicing Agreement—The Asset Representations Reviewer—Asset Review” in the Preliminary Prospectus.
The Asset Representations Reviewer may be terminated and replaced without cause. Upon (i) the written direction of certificateholders evidencing not less than 25% of the voting rights (without regard to the application of any Cumulative Appraisal Reduction Amounts) requesting a vote to terminate and replace the Asset Representations Reviewer with a proposed successor Asset Representations Reviewer that is an eligible asset representations reviewer, and (ii) payment by such holders to the certificate administrator of the reasonable fees and expenses to be incurred by the certificate administrator in connection with administering such vote, the certificate administrator will promptly provide notice to all certificateholders and the Asset Representations Reviewer of such request by posting such notice on its internet website, and by mailing such notice to all certificateholders and the Asset Representations Reviewer. Upon the written direction of certificateholders evidencing at least 75% of a certificateholder quorum (without regard to the application of any Cumulative Appraisal Reduction Amounts), the Trustee will terminate all of the rights and obligations of the Asset Representations Reviewer under the WFCM 2018-C45 pooling and servicing agreement by written notice to the Asset Representations Reviewer, and the proposed successor Asset Representations Reviewer will be appointed. See “Pooling and Servicing Agreement—The Asset Representations Reviewer” in the Preliminary Prospectus.
| |
| Dispute Resolution Provisions: | The mortgage loan sellers will be subject to the dispute resolution provisions set forth in the WFCM 2018-C45 pooling and servicing agreement to the extent those provisions are triggered with respect to any mortgage loan sold to the depositor by a mortgage loan seller and such mortgage loan seller will be obligated under the related mortgage loan purchase agreement to comply with all applicable provisions and to take part in any mediation or arbitration proceedings that may result.
Generally, in the event that a Repurchase Request (as defined in the Preliminary Prospectus) is not “Resolved” (as defined below) within 180 days after the related mortgage loan seller receives such Repurchase Request, then the enforcing servicer will be required to send a notice to the “Initial Requesting Certificateholder” (if any) and the Certificate Administrator indicating the enforcing servicer’s intended course of action with respect to the Repurchase Request. If (a) the enforcing servicer’s intended course of action with respect to the Repurchase Request does not involve pursuing further action to exercise rights against the related mortgage loan seller with respect to the Repurchase Request and the Initial Requesting Certificateholder, if any, or any other certificateholder or certificate owner wishes to exercise its right to refer the matter to mediation (including non-binding arbitration) or arbitration, or (b) the enforcing servicer’s intended course of action is to pursue further action to exercise rights against the related mortgage loan seller with respect to the Repurchase Request but the Initial Requesting Certificateholder, if any, or any other certificateholder or certificate owner does not agree with the dispute resolution method selected by the enforcing servicer, then the Initial Requesting Certificateholder, if any, or such other certificateholder or certificate owner may deliver a written notice to the Special Servicer indicating its intent to exercise its right to refer the matter to either mediation or arbitration.
“Resolved” means, with respect to a Repurchase Request, (i) that the related Material Defect has been cured, (ii) the related mortgage loan has been repurchased in accordance with the related mortgage loan purchase agreement, (iii) a mortgage loan has been substituted for the related mortgage loan in accordance with the related mortgage loan purchase agreement, (iv) the applicable mortgage loan seller has made a Loss of Value Payment (as defined in the Preliminary Prospectus), (v) a contractually binding agreement is entered into between the enforcing servicer, on behalf of the issuing entity, and the related mortgage loan seller that settles the related mortgage loan seller’s obligations under the related mortgage loan purchase agreement or (vi) the related mortgage loan is no longer property of the issuing entity as a result of a sale or other disposition in accordance with the WFCM 2018-C45 pooling and servicing agreement. See “Pooling and Servicing Agreement—Dispute Resolution Provisions” in the Preliminary Prospectus.
|
| Investor Communications: | The certificate administrator is required to include on any Form 10–D any request received from a certificateholder to communicate with other certificateholders related to certificateholders exercising their rights under the terms of the WFCM 2018-C45 pooling and |
THE INFORMATION IN THIS STRUCTURAL AND COLLATERAL TERM SHEET IS NOT COMPLETE AND MAY BE AMENDED PRIOR TO THE TIME OF SALE. THIS TERM SHEET IS NOT AN OFFER TO SELL THESE SECURITIES AND IT IS NOT A SOLICITATION OF AN OFFER TO BUY THESE SECURITIES IN ANY JURISDICTION WHERE THE OFFER OR SALE IS NOT PERMITTED.
26
| Wells Fargo Commercial Mortgage Trust 2018-C45 | Certain Terms and Conditions |
| servicing agreement. Any certificateholder wishing to communicate with other certificateholders regarding the exercise of its rights under the terms of the WFCM 2018-C45 pooling and servicing agreement will be able to deliver a written request signed by an authorized representative of the requesting investor to the certificate administrator. | |
| Certain Fee Offsets: | If a workout fee is earned by the Special Servicer following a loan default with respect to any mortgage loan that it services, then certain limitations will apply based on modification fees paid by the borrower. The modification fee generally must not exceed 1% of the principal balance of the loan as modified in any 12-month period. In addition, if the loan re-defaults, any subsequent workout fee on that loan must be reduced by a portion of the modification fees paid by the borrower in the previous 12-months. Likewise, liquidation fees collected in connection with a liquidation or partial liquidation of a mortgage loan must be reduced by a portion of the modification fees paid by the borrower in the previous 12 months. |
| Deal Website: | The Certificate Administrator will be required to maintain a deal website, which will include, among other items: (a) summaries of asset status reports prepared by the Special Servicer, (b) inspection reports, (c) appraisals, (d) various “special notices” described in the Preliminary Prospectus, (e) the “Investor Q&A Forum”, (f) a voluntary “Investor Registry” and (g) the “Risk Retention” tab. Investors may access the deal website following execution of a certification and confidentiality agreement. |
| Initial Majority Controlling Class Certificateholder: | It is expected that Prime Finance Long Duration (B-Piece) II Holdco I, L.P. or an affiliate will be the initial majority controlling class certificateholder. |
| Whole Loans: | Each of the mortgaged properties identified above under “IV. Characteristics of the Mortgage Pool—B. Summary of the Whole Loans” secures both a mortgage loan to be included in the trust fund and one or more other mortgage loans that will not be included in the trust fund, each of which will bepari passu or subordinate in right of payment with the mortgage loan included in the trust fund. We refer to each such group of mortgage loans as a “whole loan”. Such “—Summary of the Whole Loans” section includes further information regarding the various notes in each whole loan, the holders of such notes, the lead servicing agreement for each such whole loan, and the master servicer and special servicer under such lead servicing agreement. |
THE INFORMATION IN THIS STRUCTURAL AND COLLATERAL TERM SHEET IS NOT COMPLETE AND MAY BE AMENDED PRIOR TO THE TIME OF SALE. THIS TERM SHEET IS NOT AN OFFER TO SELL THESE SECURITIES AND IT IS NOT A SOLICITATION OF AN OFFER TO BUY THESE SECURITIES IN ANY JURISDICTION WHERE THE OFFER OR SALE IS NOT PERMITTED.
27
| VILLAGE AT LEESBURG |
Certain portions of the improvements shown in the pictures below are part of the overall Village at Leesburg development but may not serve as collateral for the Village at Leesburg Whole Loan. See “The Property” section for further detail regarding the overall Village at Leesburg development and the Village at Leesburg Property.

THE INFORMATION IN THIS STRUCTURAL AND COLLATERAL TERM SHEET IS NOT COMPLETE AND MAY BE AMENDED PRIOR TO THE TIME OF SALE. THIS TERM SHEET IS NOT AN OFFER TO SELL THESE SECURITIES AND IT IS NOT A SOLICITATION OF AN OFFER TO BUY THESE SECURITIES IN ANY JURISDICTION WHERE THE OFFER OR SALE IS NOT PERMITTED.
28
| VILLAGE AT LEESBURG |

THE INFORMATION IN THIS STRUCTURAL AND COLLATERAL TERM SHEET IS NOT COMPLETE AND MAY BE AMENDED PRIOR TO THE TIME OF SALE. THIS TERM SHEET IS NOT AN OFFER TO SELL THESE SECURITIES AND IT IS NOT A SOLICITATION OF AN OFFER TO BUY THESE SECURITIES IN ANY JURISDICTION WHERE THE OFFER OR SALE IS NOT PERMITTED.
29
| No. 1 – Village at Leesburg | |||||||
| Loan Information | Property Information | ||||||
| Mortgage Loan Seller: | Wells Fargo Bank, National Association | Single Asset/Portfolio: | Single Asset | ||||
Credit Assessment (DBRS/Fitch/Moody’s): | NR/NR/NR | Property Type: | Retail | ||||
| Original Principal Balance(1): | $65,250,000 | Specific Property Type: | Anchored | ||||
| Cut-off Date Balance(1): | $65,250,000 | Location: | Leesburg, VA | ||||
| % of Initial Pool Balance: | 9.9% | Size(4): | 546,107 SF | ||||
| Loan Purpose(2): | Recapitalization | Cut-off Date Balance Per SF(1)(4): | $240.34 | ||||
| Borrower Name: | CRP/TRC Leesburg Retail Owner, L.L.C. | Year Built/Renovated: | 2009/2018 | ||||
| Sponsor: | Gary D. Rappaport | Title Vesting: | Fee | ||||
| Mortgage Rate: | 4.7580% | Property Manager: | Self-managed | ||||
| Note Date: | March 9, 2018 | 4thMost Recent Occupancy (As of): | 78.7% (12/31/2014) | ||||
| Anticipated Repayment Date: | NAP | 3rdMost Recent Occupancy (As of): | 82.1% (12/31/2015) | ||||
| Maturity Date: | April 1, 2028 | 2ndMost Recent Occupancy (As of): | 88.4% (12/31/2016) | ||||
| IO Period: | 60 months | Most Recent Occupancy (As of): | 93.6% (12/31/2017) | ||||
| Loan Term (Original): | 120 months | Current Occupancy (As of)(4): | 91.6% (3/9/2018) | ||||
| Seasoning: | 3 months | ||||||
| Amortization Term (Original): | 360 months | Underwriting and Financial Information: | |||||
| Loan Amortization Type: | Interest-only, Amortizing Balloon | ||||||
| Interest Accrual Method: | Actual/360 | 4thMost Recent NOI (As of)(5): | $6,914,642 (12/31/2014) | ||||
| Call Protection: | L(27),D(89),O(4) | 3rdMost Recent NOI (As of)(5): | $6,200,743 (12/31/2015) | ||||
| Lockbox Type: | Hard/Upfront Cash Management | 2ndMost Recent NOI (As of)(5): | $7,766,054 (12/31/2016) | ||||
| Additional Debt(1): | Yes | Most Recent NOI (As of)(5): | $8,685,899 (12/31/2017) | ||||
| Additional Debt Type(1): | Pari Passu | ||||||
| U/W Revenues: | $14,588,909 | ||||||
| U/W Expenses: | $3,574,353 | ||||||
| Escrows and Reserves(3): | U/W NOI(4): | $11,014,555 | |||||
| U/W NCF: | $10,531,133 | ||||||
| Type: | Initial | Monthly | Cap (If Any) | U/W NOI DSCR(1): | 1.34x | ||
| Taxes | $560,062 | $112,013 | NAP | U/W NCF DSCR(1): | 1.28x | ||
| Insurance | $0 | Springing | NAP | U/W NOI Debt Yield(1): | 8.4% | ||
| Deferred Maintenance | $28,125 | $0 | NAP | U/W NCF Debt Yield(1): | 8.0% | ||
| Replacement Reserve | $0 | $6,801 | $244,818 | Appraised Value(6): | $226,000,000 | ||
| TI / LC Reserve | $0 | $45,894 | $2,010,135(3) | Appraisal Valuation Date(6): | December 1, 2018 | ||
| Rent Concession Reserve | $842,933 | $0 | NAP | Cut-off Date LTV Ratio(1)(6): | 58.1% | ||
| Existing TI/LC Reserve | $7,649,629 | $0 | NAP | LTV Ratio at Maturity or ARD(1)(6): | 53.4% | ||
| (1) | See “The Mortgage Loan” section. All statistical financial information related to balance per square foot, loan-to-value ratios, debt service coverage ratios and debt yields are based on the funded outstanding principal balance of the Village at Leesburg Whole Loan (as defined below). |
| (2) | The Village at Leesburg Property (as defined below) was previously majority owned by an affiliate of the Carlyle Group, which originally developed the overall Village at Leesburg community in 2009. At the time of origination, an entity related to Rappaport (see “Borrower Sponsor” section) acquired a 60% equity ownership interest in the Village at Leesburg Property with the Carlyle Group maintaining a 40% equity ownership interest. |
| (3) | See “Escrows” section. |
| (4) | The Size, Cut-off Date Balance per SF and Current Occupancy assume the completion of the 12,297 square foot expansion related to Cobb Theatres (see “The Property” section). Excluding the expansion space, the Size, Cut-off Date Balance per SF and Current Occupancy are 533,810, $245.87 and 91.4%, respectively. |
| (5) | See “Cash Flow Analysis” section. |
| (6) | The Appraised Value and LTV Ratios shown are based on the appraiser’s Prospective Market Value Upon Completion, which assumes the completion of planned renovations and an expansion related to Cobb Theatres. Cobb Theatres is expected to renovate all existing auditoriums and add two new auditoriums with all work projected to be completed by December 2018 (see “The Property” section). Cobb Theatres is required to commence paying rent on its expanded premises once the tenant is open for business in such space. The underwritten base rent for Cobb Theatres is based on its expanded premises, and the difference between the tenant’s underwritten base rent and current base rent through December 31, 2018 was reserved upon origination of the Village at Leesburg Whole Loan (see “Major Tenants” section). In addition, outstanding tenant improvement obligations related to Cobb Theatres were reserved upon origination of the Village at Leesburg Whole Loan (see “Escrows” section). Based on the as-is appraised value of $205,000,000 (as of February 2, 2018), the Cut-off Date LTV Ratio and LTV Ratio at Maturity are 64.0% and 58.8%, respectively. |
The Mortgage Loan. The mortgage loan (the “Village at Leesburg Mortgage Loan”) is part of a whole loan (the “Village at Leesburg Whole Loan”) evidenced by twopari passu notes secured by a first mortgage encumbering the fee interest in an anchored retail shopping center located in Leesburg, Virginia (the “Village at Leesburg Property”). The Village at Leesburg Whole Loan was originated on March 9, 2018 by Wells Fargo Bank, National Association. The Village at Leesburg Whole Loan had an original principal balance of $131,250,000, has an outstanding principal balance as of the Cut-off Date of $131,250,000 and accrues interest at an interest rate of 4.7580%per annum. The Village at Leesburg Whole Loan had an initial term of 120 months, has a remaining term of 117 months as of the Cut-off Date and requires interest-only payments for the first 60 months following origination and, thereafter, requires payments of principal and interest based on a 30-year amortization schedule. The Village at Leesburg Whole Loan matures on April 1, 2028.
THE INFORMATION IN THIS STRUCTURAL AND COLLATERAL TERM SHEET IS NOT COMPLETE AND MAY BE AMENDED PRIOR TO THE TIME OF SALE. THIS TERM SHEET IS NOT AN OFFER TO SELL THESE SECURITIES AND IT IS NOT A SOLICITATION OF AN OFFER TO BUY THESE SECURITIES IN ANY JURISDICTION WHERE THE OFFER OR SALE IS NOT PERMITTED.
30
| VILLAGE AT LEESBURG |
The non-controlling Note A-2, which will be contributed to the WFCM 2018-C45 securitization trust, had an original principal balance of $65,250,000 and has an outstanding principal balance as of the Cut-off Date of $65,250,000. The controlling Note A-1, which has been contributed to the WFCM 2018-C44 securitization trust, had an original principal balance of $66,000,000 and has an outstanding principal balance as of the Cut-off Date of $66,000,000. The mortgage loan evidenced by Note A-1 is referred to herein as the “Village at Leesburg Companion Loan”. The lender provides no assurances that the non-securitizedpari passu note will not be split further. See “Description of the Mortgage Pool—The Whole Loans—The Non-Serviced Pari Passu Whole Loans” and “Pooling and Servicing Agreement” in the Prospectus.
Note Summary
| Notes | Original Balance | Note Holder | Controlling Interest | |
| A-1 | $66,000,000 | WFCM 2018-C44 | Yes | |
| A-2 | $65,250,000 | WFCM 2018-C45 | No | |
| Total | $131,250,000 |
Following the lockout period, on any date before January 1, 2028, the borrower has the right to defease the Village at Leesburg Whole Loan in whole, but not in part. In addition, the Village at Leesburg Whole Loan is prepayable without penalty on or after January 1, 2028. The lockout period will expire on the earlier to occur of (i) two years after the closing date of the securitization that includes the last note to be securitized and (ii) May 1, 2021.
Sources and Uses
| Sources | Uses | |||||||
| Original whole loan amount | $131,250,000 | 100.0% | Loan payoff(1): | $112,394,408 | 85.6% | |||
| Upfront reserves: | 9,080,749 | 6.9 | ||||||
| Closing costs: | 1,181,685 | 0.9 | ||||||
| Return of equity: | 8,593,158 | 6.5 | ||||||
| Total Sources | $131,250,000 | 100.0% | Total Uses | $131,250,000 | 100.0% |
| (1) | Prior to the origination of the Village at Leesburg Whole Loan, the Village at Leesburg Property was majority owned by an affiliate of the Carlyle Group, which originally developed the overall Village at Leesburg community in 2009. At the time of origination, an entity related to Rappaport (see “Borrower Sponsor” section) acquired a 60% equity ownership interest in the Village at Leesburg Property with the Carlyle Group maintaining a 40% equity ownership interest. The loan payoff shown represents a mortgage loan related to the Carlyle Group’s prior majority ownership of the Village at Leesburg Property. |
The Property.The Village at Leesburg Property consists of 546,107 square feet of retail, open-air lifestyle and entertainment space within the Village at Leesburg development in Leesburg, Virginia. The Village at Leesburg Property is situated on 55.0 acres of land and encompasses 16 one- and two-story buildings. In addition to the Village at Leesburg Property, the overall Village at Leesburg development contains office and multifamily components, which do not serve as collateral for the Village at Leesburg Whole Loan. The non-collateral office component comprises approximately 120,000 square feet of class A office space above the street level retail space and was 91.2% occupied as of April 2018, while the non-collateral multifamily component comprises 335 class A rental units with monthly rental rates for one-bedroom units starting at approximately $1,571. The Village at Leesburg Property was built in 2009, and in 2016, the Village at Leesburg development underwent a $6.6 million common area maintenance project that included upgrades to landscaping, patio seating, and the addition of a fountain and fire-pit. The Village at Leesburg Property hosts entertainment and cultural events throughout the year, including the Winter Ice Festival and ice carving in January, the Leesburg Fine Arts Festival in May, movie nights throughout the summer, Halloween activities and an annual holiday tree lighting in December. The Village at Leesburg Property has exclusive use of 3,128 surface and garage parking spaces, resulting in a parking ratio of 5.7 spaces per 1,000 square feet of rentable area (the overall Village at Leesburg development contains 3,732 surface and garage parking spaces, of which 604 spaces are for the exclusive use of the non-collateral multifamily units).
As of March 9, 2018, the Village at Leesburg Property was 91.6% leased to 65 tenants. In addition to the Wegmans grocery anchor, the tenant mix at the Village at Leesburg Property consists of entertainment options, including Cobb Theatres, Bowlero bowling alley, Atomic Trampoline and Luv2Play Indoor Playground; restaurant tenants, including Firebirds Wood Fire Grill, Travinia Italian Kitchen, Eggspectations, Noodles & Company, BurgerFi and Bon Chon Chicken; and national retail tenants including Ulta, Verizon Wireless, AT&T, European Wax Center, Massage Envy, Visionworks and GNC.
The Village at Leesburg Property is anchored by a Wegmans grocery store (Rated ‘BBB+’ by S&P, 142,692 square feet, 26.1% of net rentable area and 10.1% of underwritten base rent), which is subject to a ground lease with a lease expiration date in July 2034 with five, five-year renewal options. Wegmans is a regional supermarket chain with 96 stores in the northeastern United States. The company reported 2017 sales of approximately $8.7 billion and was ranked 31stof the top 75 supermarkets in the country based on sales volume by an industry news publication. The store provides customers with the convenience of an in-store pharmacy, a Market Café with take-out and in-store dining, a cheese shop, a sub shop, a fresh sushi shop, a salad bar, a pizza shop, a floral shop and a pastry shop.
The second largest tenant is Cobb Theatres (63,564 square feet, 11.6% of net rentable area and 15.0% of underwritten base rent), which currently features 12 screens with approximately 1,900 seats. Cobb Theatres is currently renovating its existing auditoriums with new, reclining seats and is expected to add two new auditoriums (for a total of 14 screens) with a total estimated renovation and construction cost of approximately $7.6 million. The existing auditorium renovations are currently underway and are expected to be completed by October 2018; while the expansion work is expected to begin in June 2018 and is expected to be completed by December 2018. With respect to Cobb Theatres, all outstanding tenant improvement costs and gap rent through December 31, 2018 were reserved upon origination of the Village at Leesburg Whole Loan. Cobb Theatres recently exercised a 10-year lease renewal and has a lease expiration date in December 2028 with three, five-year renewal options.
THE INFORMATION IN THIS STRUCTURAL AND COLLATERAL TERM SHEET IS NOT COMPLETE AND MAY BE AMENDED PRIOR TO THE TIME OF SALE. THIS TERM SHEET IS NOT AN OFFER TO SELL THESE SECURITIES AND IT IS NOT A SOLICITATION OF AN OFFER TO BUY THESE SECURITIES IN ANY JURISDICTION WHERE THE OFFER OR SALE IS NOT PERMITTED.
31
| VILLAGE AT LEESBURG |
The third largest tenant is LA Fitness (45,000 square feet, 8.2% of net rentable area and 9.1% of underwritten base rent). LA Fitness is a privately-owned American health club with headquarters in Irvine, California. LA Fitness has 675 locations across 27 states in the U.S. and Canada, serving over 3.8 million members. The LA Fitness at the Village at Leesburg Property features basketball courts, group fitness classes, indoor cycling, an indoor pool, a kids club, personal training, a racquetball court, a sauna, a whirlpool spa and a juice bar.
The fourth largest tenant is Bowlero (21,564 square feet, 3.9% net rentable area and 4.2% underwritten base rent). Bowlmor AMF, the owner of Bowlero, is the largest ten-pin bowling center operator in the world with over 300 locations. Bowlero leased the former King Pinz bowling alley space at the Village at Leesburg Property with a lease that commenced in March 2017.
The Village at Leesburg Property comprises two retail condominium units consisting of the Wegmans leased fee parcel (excluding the improvements), and the remaining retail space within the related project (having a 58.06% voting rights interest in each of (i) a condominium regime governing the common elements of the related mixed use buildings within the overall Village at Leesburg development and (ii) a master condominium regime governing the common areas within the overall Village of Leesburg development, including parking garages and structures and private streets). The loan documents provide for springing full recourse to the borrower and guarantors resulting from the condominium regime’s being withdrawn or terminated, or the master owners’ association regime being terminated. See“Description of the Mortgage Pool—Mortgage Pool Characteristics—Condominium Interests”in the Prospectus.
The following table presents certain information relating to the tenancy at the Village at Leesburg Property:
Major Tenants
| Tenant Name | Credit Rating (Fitch/Moody’s/ S&P)(1) | Tenant NRSF | % of NRSF | Annual U/W Base Rent PSF(2) | Annual U/W Base Rent(2) | % of Total Annual U/W Base Rent | Sales | Occupancy Cost | Lease Expiration Date |
| Anchor Tenant | |||||||||
| Wegmans (Ground Lease) | NR/NR/BBB+ | 142,692 | 26.1% | $8.30(3) | $1,184,921(3) | 10.1% | NAV | NAV | 7/31/2034(4) |
| Total Anchor Tenant | 142,692 | 26.1% | $8.30 | $1,184,921 | 100.0% | ||||
| Major Tenants | |||||||||
| Cobb Theatres | NR/NR/NR | 63,564(5) | 11.6% | $27.50(5) | $1,748,010(5) | 15.0% | $516,260(6) | 24.4%(6) | 12/31/2028(7) |
| LA Fitness | NR/NR/NR | 45,000 | 8.2% | $23.67 | $1,065,042 | 9.1% | NAV | NAV | 3/31/2026(8) |
| Bowlero | NR/B3/B | 21,564 | 3.9% | $22.49 | $485,000 | 4.2% | NAV | NAV | 3/31/2027(9) |
| Wells Fargo (Ground Lease) | AA-/Aa2/A+ | (10) | (10) | (10) | $430,532(11) | 3.7% | NAV | NAV | 11/14/2029(12) |
| Atomic Trampoline | NR/NR/NR | 16,653 | 3.0% | $19.26 | $320,736 | 2.7% | NAV | NAV | 8/31/2026(13) |
| Total Major Tenants | 289,473 | 53.0% | $16.59(14) | $5,234,241 | 44.8% | ||||
| Non-Major Tenants | 210,864 | 38.6% | $30.59 | $6,451,262 | 55.2% | ||||
| Occupied Collateral Total | 500,337 | 91.6% | $22.49(14) | $11,685,503 | 100.0% | ||||
| Vacant Space | 45,770 | 8.4% | |||||||
| Collateral Total | 546,107 | 100.0% | |||||||
| (1) | Certain ratings are those of the parent company whether or not the parent company guarantees the lease. |
| (2) | Annual U/W Base Rent PSF and Annual U/W Base Rent include contractual rent steps totaling $147,163 through January 2019 and straight-line rent averaging for investment grade tenants over the loan term for Wegmans and Wells Fargo (totaling $165,453) and over the remaining lease term for Charles Schwab (totaling $28,642). |
| (3) | Wegman’s Annual U/W Base Rent PSF and Annual U/W Base Rent are based on the tenant’s average rental rate over the loan term. Wegman’s current annual base rent is $1,065,000 ($7.46 per square foot). Commencing on August 1, 2019, Wegman’s annual base rent will increase to $1,164,367 ($8.16 per square foot) and commencing on August 1, 2024, Wegman’s annual base rent will increase to $1,265,678 ($8.87 per square foot). |
| (4) | Wegmans hasfive, five-year renewal options, with nine months’ notice, at rental rates as specified in the lease. |
| (5) | Cobb Theatres’ Tenant NRSF, Annual U/W Base Rent PSF and Annual U/W Base Rent assume the completion of the planned renovation and expansion, which are expected to be completed by December 2018 (see “The Property” section). The tenant’s current net rentable square footage, annual base rent per square foot and annual base rent are 51,267, $23.10 and $1,184,961, respectively. The tenant is required to begin paying rent on its expanded premises once it is open for business in such space, and the difference between the tenant’s underwritten base rent and current base rent through December 31, 2018 was reserved at origination of the Village at Leesburg Whole Loan. We cannot assure you that such renovation or expansion work will be completed or that the tenant will begin paying rent on such expansion space. |
| (6) | Sales and Occupancy Cost are for the trailing 12-month period ending December 31, 2017. Sales shown are per screen and based on the tenant’s current 12 screens; and occupancy cost shown is based on the tenant’s current annual base rent of $1,184,961 and underwritten reimbursements. |
| (7) | Cobb Theatres has three five-year renewal options, with nine months’ notice, at rental rates as specified in the lease. |
| (8) | LA Fitness has three five-year renewal options, with six months’ notice, at rental rates calculated in accordance with the Consumer Price Index or 12.0% greater than the minimum rent in effect immediately prior to the extension. |
| (9) | Bowlero has two five-year renewal options, with 180 days’ notice, at rental rates as specified in the lease. |
| (10) | Wells Fargo is subject to a ground lease and owns its improvements with no attributed square footage. |
| (11) | Wells Fargo’s Annual U/W Base Rent is based on the tenant’s average rental rate over the loan term. Wells Fargo’s current annual base rent is $385,000. Commencing on December 1, 2019, Wells Fargo’s annual base rent will increase to $423,519 and commencing on December 1, 2024, Wells Fargo’s annual base rent will increase to $465,838. |
| (12) | Wells Fargo has four five-year renewal options, with 270 days’ notice, at rental rates as specified in the lease. |
| (13) | Atomic Trampoline has one five-year renewal option, with 12 months’ notice, at rental rates as specified in the lease. |
| (14) | Annual U/W Base Rent PSF for Total Major Tenants and Occupied Collateral Total excludes Annual U/W Base Rent related to Wells Fargo, which is on a ground lease and owns its improvements with no attributed square footage. |
THE INFORMATION IN THIS STRUCTURAL AND COLLATERAL TERM SHEET IS NOT COMPLETE AND MAY BE AMENDED PRIOR TO THE TIME OF SALE. THIS TERM SHEET IS NOT AN OFFER TO SELL THESE SECURITIES AND IT IS NOT A SOLICITATION OF AN OFFER TO BUY THESE SECURITIES IN ANY JURISDICTION WHERE THE OFFER OR SALE IS NOT PERMITTED.
32
| VILLAGE AT LEESBURG |
The following table presents certain information relating to the lease rollover schedule at the Village at Leesburg Property:
Lease Expiration Schedule(1)(2)
| Year Ending December 31, | No. of Leases Expiring | Expiring NRSF | % of Total NRSF | Cumulative Expiring NRSF | Cumulative % of Total NRSF | Annual U/W Base Rent(3) | % of Total Annual U/W Base Rent(3) | Annual U/W Base Rent PSF(3)(4) |
| MTM | 0 | 0 | 0.0% | 0 | 0.0% | $0 | 0.0% | $0.00 |
| 2018 | 2 | 5,819 | 1.1% | 5,819 | 1.1% | $171,678 | 1.5% | $29.50 |
| 2019 | 4 | 10,544 | 1.9% | 16,363 | 3.0% | $270,722 | 2.3% | $25.68 |
| 2020 | 13 | 35,568 | 6.5% | 51,931 | 9.5% | $1,566,326 | 13.4% | $44.04 |
| 2021 | 8 | 35,416 | 6.5% | 87,347 | 16.0% | $878,891 | 7.5% | $24.82 |
| 2022 | 4 | 16,161 | 3.0% | 103,508 | 19.0% | $455,520 | 3.9% | $28.19 |
| 2023 | 3 | 14,127 | 2.6% | 117,635 | 21.5% | $369,802 | 3.2% | $26.18 |
| 2024 | 4 | 17,290 | 3.2% | 134,925 | 24.7% | $402,174 | 3.4% | $23.26 |
| 2025 | 7 | 24,061 | 4.4% | 158,986 | 29.1% | $774,013 | 6.6% | $32.17 |
| 2026 | 6 | 76,309 | 14.0% | 235,295 | 43.1% | $1,955,297 | 16.7% | $25.62 |
| 2027 | 8 | 43,074 | 7.9% | 278,369 | 51.0% | $1,115,539 | 9.5% | $25.90 |
| 2028 | 4 | 79,276 | 14.5% | 357,645 | 65.5% | $2,110,088 | 18.1% | $26.62 |
| Thereafter | 2 | 142,692 | 26.1% | 500,337 | 91.6% | $1,615,453 | 13.8% | $11.32 |
| Vacant | 0 | 45,770 | 8.4% | 546,107 | 100.0% | $0 | 0.0% | $0.00 |
| Total/Weighted Average | 65 | 546,107 | 100.0% | $11,685,503 | 100.0% | $22.49 |
| (1) | Information obtained from the underwritten rent roll. |
| (2) | Certain tenants may have lease termination options that are exercisable prior to the originally stated expiration date of the subject lease and that are not considered in the Lease Expiration Schedule. |
| (3) | Weighted Average Annual U/W Base Rent PSF and Total Annual U/W Base Rent exclude vacant space. |
| (4) | Annual U/W Base Rent PSF excludes Annual U/W Base Rent related to Wells Fargo, which is on a ground lease and owns its improvements. |
The following table presents historical occupancy percentages at the Village at Leesburg Mortgaged Property:
Historical Occupancy
12/31/2014(1) | 12/31/2015(1) | 12/31/2016(1) | 12/31/2017(1) | 3/9/2018(2) |
| 78.7% | 82.1% | 88.4% | 93.6% | 91.6% |
| (1) | Information obtained from the borrower. |
| (2) | Information obtained from the underwritten rent roll. Occupancy assumes the completion of the 12,297 square foot expansion related to Cobb Theatres (see “The Property” section). Excluding the expansion space, the physical occupancy as of March 9, 2018 was 91.4%. |
THE INFORMATION IN THIS STRUCTURAL AND COLLATERAL TERM SHEET IS NOT COMPLETE AND MAY BE AMENDED PRIOR TO THE TIME OF SALE. THIS TERM SHEET IS NOT AN OFFER TO SELL THESE SECURITIES AND IT IS NOT A SOLICITATION OF AN OFFER TO BUY THESE SECURITIES IN ANY JURISDICTION WHERE THE OFFER OR SALE IS NOT PERMITTED.
33
| VILLAGE AT LEESBURG |
Operating History and Underwritten Net Cash Flow. The following table presents certain information relating to the historical operating performance and the underwritten net cash flow at the Village at Leesburg Property:
Cash Flow Analysis
| 2014 | 2015(2) | 2016(3) | 2017(4) | U/W(5) | % of U/W Effective Gross Income | U/W $ per SF | |||||||||
| Base Rent | $8,506,614 | $7,561,648 | $8,431,880 | $9,277,247 | $11,685,503 | 80.1% | $21.40 | ||||||||
| Grossed Up Vacant Space | 0 | 0 | 0 | 0 | 1,532,967 | 10.5 | 2.81 | ||||||||
| Percentage Rent | 181,679 | 194,854 | 153,795 | 72,657 | 55,276 | 0.4 | 0.10 | ||||||||
| Total Reimbursables | 2,416,951 | 2,643,318 | 2,832,773 | 2,846,697 | 2,843,935 | 19.5 | 5.21 | ||||||||
| Other Income(1) | 89,005 | 49,684 | 129,044 | 179,020 | 4,195 | 0.0 | 0.01 | ||||||||
| Less Vacancy & Credit Loss | 0 | 0 | 0 | 0 | (1,532,967)(6) | (10.5) | (2.81) | ||||||||
| Effective Gross Income | $11,194,249 | $10,449,504 | $11,547,492 | $12,375,621 | $14,588,909 | 100.0% | $26.71 | ||||||||
| Total Operating Expenses | $4,279,607 | $4,248,761 | $3,781,438 | $3,689,722 | $3,574,353 | 24.5% | $6.55 | ||||||||
| Net Operating Income | $6,914,642 | $6,200,743 | $7,766,054 | $8,685,899 | $11,014,555 | 75.5% | $20.17 | ||||||||
| TI/LC | 0 | 0 | 0 | 0 | 403,415 | 2.8 | 0.74 | ||||||||
| Capital Expenditures | 0 | 0 | 0 | 0 | 80,007 | 0.5 | 0.15 | ||||||||
| Net Cash Flow | $6,914,642 | $6,200,743 | $7,766,054 | $8,685,899 | $10,531,133 | 72.2% | $19.28 | ||||||||
| NOI DSCR(7) | 0.84x | 0.75x | 0.94x | 1.06x | 1.34x | ||||||||||
| NCF DSCR(7) | 0.84x | 0.75x | 0.94x | 1.06x | 1.28x | ||||||||||
| NOI DY(7) | 5.3% | 4.7% | 5.9% | 6.6% | 8.4% | ||||||||||
| NCF DY(7) | 5.3% | 4.7% | 5.9% | 6.6% | 8.0% |
| (1) | Other income includes income from storage, stroller rentals, ATMs and other miscellaneous rental income. |
| (2) | The decline in Base Rent and Net Operating Income from 2014 to 2015 was driven partly by bad debt expense in 2015 from multiple tenants totaling $730,948. |
| (3) | The increase in Net Operating Income from 2015 to 2016 was primarily driven by an increase in Base Rent and decrease in Total Operating Expenses. The increase in Base Rent from 2015 to 2016 was driven by 13 new leases (10.6% of net rentable area, 12.6% of underwritten base rent) signed from March 2015 to December 2016 and three renewal leases (1.9% of net rentable area, 3.4% of underwritten base rent) signed from March 2015 to November 2015. The decrease in Total Operating Expenses from 2015 to 2016 was primarily driven by reduced expenses for snow removal, advertising and holiday decorating. |
| (4) | The increase in Base Rent and Net Operating Income from 2016 to 2017 was driven by eight new leases (7.2% of net rentable area, 10.1% of underwritten base rent) signed from January 2017 to July 2017 and two renewal leases (0.9% of net rentable area, 1.7% of underwritten base rent) signed from May 2017 to November 2017. |
| (5) | The increase in Net Operating Income from 2017 to U/W was driven by (i) three new leases(2.9% of net rentable area, 3.1% of underwritten base rent) and three renewal leases (1.8% of net rentable area, 2.4% of underwritten base rent) signed since January 2018; (ii) the inclusion of increased base rent for Cobb Theatres assuming the completion of the tenant’s planned renovation and expansion (annual base rent increase of $563,049; see “The Property” and “Major Tenants” sections); (iii) the inclusion ofcontractual rent steps totaling $147,163 through January 2019 and straight-line rent averaging for investment grade tenants over the lesser of the loan term and remaining lease term (totaling $194,095); and (iv) bad debt expenses in 2017 from multiple tenants totaling approximately $1.0 million. |
| (6) | The underwritten economic vacancy is 11.6%. The Village at Leesburg Property was 91.6% leased as of March 9, 2018. |
| (7) | The debt service coverage ratios and debt yields shown are based on the Village at Leesburg Whole Loan. |
Appraisal.The appraiser concluded to a Prospective Market Value Upon Completion for the Village at Leesburg Property of $226,000,000 as of December 1, 2018, which assumes the completion of the renovation and expansion related to Cobb Theatres.
Environmental Matters. According to a Phase I environmental site assessment dated February 23, 2018, there was no evidence of any recognized environmental conditions at the Village at Leesburg Property.
Market Overview and Competition.The Village at Leesburg Property is located in Leesburg, Loudoun County, Virginia, approximately 38.1 miles northwest of the Washington, D.C. central business district, 14.4 miles northwest of Washington Dulles International Airport and 1.7 miles southeast of U.S. Route 15. Per U.S. Census Bureau estimates, Loudoun County has the highest median household income of any county in the United States, and according to a third party market research report, the 2017 estimated average household income within a three- and five-mile radius of the Village at Leesburg Property was $144,117 and $151,624, respectively. According to the appraisal, Loudoun County has grown faster than any other Virginia jurisdiction since 1990, and the county’s population grew by approximately 3.7% annually from 2006 to 2016. According to a third party market research report, the estimated 2017 population within a three- and five-mile radius of the Village at Leesburg Property was 74,657 and 137,723, respectively.
The Metropolitan Washington Airports Authority is constructing a 23-mile extension of the existing Metrorail system, branching from the East Falls Church Station in Arlington, Virginia to the Washington Dulles International Airport and west to eastern Loudoun County. Phase 2 of the extension, expected to be completed in 2020, is expected to continue 11 miles from Wiehle Avenue to eastern Loudoun County. This phase will add six stations, including stops in Reston, Herndon, Dulles Airport, and Ashburn. The Ashburn Station is expected to be located approximately 9.7 miles southeast of the Village at Leesburg Property.
According to a third party market research report, the Village at Leesburg Property is situated within the Loudoun County submarket of the Suburban Virginia retail market. As of year-end 2017, the submarket reported total inventory of approximately 6.8 million square feet with a 3.0% vacancy rate and an average asking net rental rate of $29.13 per square foot. Submarket vacancy has decreased from 6.6% in 2012 and has averaged 4.4% in the last six years. The appraiser concluded to a weighted average net market rent for the Village at Leesburg Property of $22.89 per square foot.
THE INFORMATION IN THIS STRUCTURAL AND COLLATERAL TERM SHEET IS NOT COMPLETE AND MAY BE AMENDED PRIOR TO THE TIME OF SALE. THIS TERM SHEET IS NOT AN OFFER TO SELL THESE SECURITIES AND IT IS NOT A SOLICITATION OF AN OFFER TO BUY THESE SECURITIES IN ANY JURISDICTION WHERE THE OFFER OR SALE IS NOT PERMITTED.
34
| VILLAGE AT LEESBURG |
The table below presents certain information relating to five comparable properties to the Village at Leesburg Property identified by the appraiser:
Competitive Set(1)
Village at Leesburg (Subject) | Marketplace at Potomac Station | Fort Evan Plaza I | Fort Evans Plaza II | Battlefield Shopping Center | Leesburg Plaza | |
| Location | Leesburg, VA | Leesburg, VA | Leesburg, VA | Leesburg, VA | Leesburg, VA | Leesburg, VA |
| Distance from Subject | -- | 1.1 miles | 2.1 miles | 1.8 miles | 2.3 miles | 2.4 miles |
| Property Type | Anchored | Community Center | Community Center | Community Center | Power Center | Community Center |
| Year Built/Renovated | 2009/2018 | 2004/NAP | 1999/NAP | 2008/NAP | 1991/NAP | 1956/1992 |
| Anchors | Wegmans, Cobb Theatres, LA Fitness, Bowlero | Giant Food, Best Buy | Home Depot, Hobby Lobby | Marshall’s, Bed, Bath & Beyond, Walgreens, Jo-Ann Stores | Dick’s Sporting Goods, DSW, Ross Dress for Less, Staples, Stein Mart, Michael’s | Giant Food, Office Depot, PetSmart, Party City |
| Total GLA | 546,107 SF | 143,176 SF | 214,477 SF | 228,529 SF | 296,140 SF | 228,878 SF |
| Total Occupancy | 91.6%(2) | 92.0% | 97.0% | 100.0% | 97.0% | 96.0% |
| (1) | Information obtained from the appraisal. In total, the appraiser identified 10 comparable properties totaling approximately 2.7 million square feet with an average occupancy rate of approximately 96.0% and minimum occupancy rate of 90.0%. |
| (2) | Information obtained from underwritten rent roll. |
The Borrower.The borrower is CRP/TRC Leesburg Retail Owner, L.L.C., a Delaware limited liability company and single purpose entity with two independent directors. Legal counsel to the borrower delivered a non-consolidation opinion in connection with the origination of the Village at Leesburg Whole Loan. Gary D. Rappaport and the Gary D. Rappaport Revocable Trust, individually and/or collectively, are the guarantors of certain nonrecourse carveouts under the Village at Leesburg Whole Loan.
The Borrower Sponsor.The borrower sponsor is Gary D. Rappaport, the chief executive officer of Rappaport, a retail real estate company founded in 1984. Rappaport’s portfolio includes more than 50 shopping centers and ground floor retail spaces in approximately 125 mixed-use properties, both residential and office, located primarily throughout the mid-Atlantic region of the United States. Mr. Rappaport is the former chairman and trustee of the International Council of Shopping Centers and is the principal partner for approximately 4.3 million square feet of the shopping centers managed by Rappaport. At the time of origination of the Village at Leesburg Whole Loan, an entity related to Rappaport acquired a 60% equity interest in the Village at Leesburg Property. Gary D. Rappaport and affiliates owned an indirect and non-controlling 10% interest in an entity that defaulted on a loan that was the subject of a foreclosure in 2009. See“Description of the Mortgage Pool— Loan Purpose; Default History, Bankruptcy Issues and Other Proceedings”in the Prospectus.
The remaining 40% equity interest in the Village at Leesburg Property is held by an affiliate of the Carlyle Group (“Carlyle”). Carlyle was the original developer of the overall Village at Leesburg community and was the majority owner of the Village at Leesburg Property prior to the origination of the Village at Leesburg Whole Loan. Founded in 1987 in Washington, D.C., Carlyle currently has approximately $195 billion of assets under management and more than 1,600 professionals operating in 31 offices in North America, South America, Europe, the Middle East, Africa, Asia and Australia. Carlyle’s real estate division has made more than 850 investments in 397 metropolitan statistical areas around the world. As of December 31, 2017, Carlyle’s real estate funds reported more than $18 billion in assets under management.
Escrows.The loan documents provide for upfront reserves of $560,062 for real estate taxes, $28,125 for immediate repairs, $842,933 for outstanding rent concessions and gap rent related to multiple tenants (including $520,190 related to the Cobb Theatres expansion) and $7,649,629 for existing tenant improvements and leasing commissions (“TI/LC”) related to multiple tenants (including $6,455,836 related to the Cobb Theatres renovation and expansion). The loan documents also provide for ongoing monthly reserves of $112,013 for real estate taxes, $6,801 for replacement reserves (subject to a cap of $244,818), and $45,894 for general TI/LCs (subject to a cap of $2,010,135 so long as no event of default exists and the net cash flow debt service coverage ratio is equal to or greater than 1.20x).
The loan documents do not require ongoing monthly escrows for insurance premiums as long as (i) no event of default has occurred and is continuing; (ii) the borrower provides the lender with evidence that the Village at Leesburg Property’s insurance coverage is included in a blanket policy and such policy is in full force and effect; and (iii) the borrower pays all applicable insurance premiums and provides the lender with evidence of renewals.
Lockbox and Cash Management.The Village at Leesburg Whole Loan requires a lender-controlled lockbox account, which is already in place, and that the borrower directs tenants to pay all rents directly into such lockbox account. The loan documents also require that all rents received by the borrower or the property manager be deposited into the lockbox account within one business day of receipt. All funds in the lockbox account are required to be swept each business day into the cash management account controlled by the lender and disbursed on each payment date in accordance with the loan documents. Prior to the occurrence of a Cash Trap Event Period (as defined below), all excess funds are required to be distributed to the borrower. During a Cash Trap Event Period, all excess funds are required to be swept to an excess cash flow subaccount.
THE INFORMATION IN THIS STRUCTURAL AND COLLATERAL TERM SHEET IS NOT COMPLETE AND MAY BE AMENDED PRIOR TO THE TIME OF SALE. THIS TERM SHEET IS NOT AN OFFER TO SELL THESE SECURITIES AND IT IS NOT A SOLICITATION OF AN OFFER TO BUY THESE SECURITIES IN ANY JURISDICTION WHERE THE OFFER OR SALE IS NOT PERMITTED.
35
| VILLAGE AT LEESBURG |
A “Cash Trap Event Period” will commence upon the earlier of the following:
| (i) | the occurrence of an event of default; |
| (ii) | the amortizing net cash flow debt service coverage ratio falling below 1.15x at the end of any calendar quarter; or |
| (iii) | the occurrence of a Lease Expiration Cash Trap Event Period (as defined below). |
A Cash Trap Event Period will end upon the occurrence of the following:
| ● | with regard to clause (i), the cure of such event of default; |
| ● | with regard to clause (ii), the amortizing net cash flow debt service coverage ratio being equal to or greater than 1.20x for two consecutive calendar quarters; or |
| ● | with regard to clause (iii), a Lease Expiration Cash Trap Event Period Cure (as defined below). |
A “Lease Expiration Cash Trap Event Period” will commence upon the earlier of the following:
| (i) | either Wegmans or Cobb Theatres giving notice of its intent to terminate its lease or vacate its space; |
| (ii) | either Wegmans or Cobb Theatres failing to be in actual, physical occupancy of its entire space, failing to be open to the public during customary hours or going dark; |
| (iii) | either Wegmans or Cobb Theatres becoming insolvent or filing for bankruptcy; or |
| (iv) | Cobb Theatres failing to extend its lease nine months prior to expiration upon terms and conditions reasonably satisfactory to the lender. |
A “Lease Expiration Cash Trap Event Period Cure” will occur upon the following:
| ● | with regard to clause (i), a Qualified Re-Leasing Event (as defined below); |
| ● | with regard to clause (ii), Wegmans or Cobb Theatres, as applicable, being in actual, physical possession of its entire space, being open to the public during customary hours and no longer being dark; |
| ● | with regard to clause (iii), Wegmans or Cobb Theatres, as applicable, being no longer insolvent or subject to any bankruptcy or insolvency proceedings and its lease having been affirmed or assigned pursuant to a final and non-appealable order of a court of competent jurisdiction; or |
| ● | with regard to clause (iv), Cobb Theatres extending its lease upon terms and conditions reasonably satisfactory to the lender. |
A “Qualified Re-Leasing Event” will occur upon one or more replacement tenants reasonably acceptable to the lender executing leases covering all of the space currently occupied by Wegmans or Cobb Theatres, as applicable, and delivering an estoppel certificate confirming such replacement tenants having taken physical occupancy of the entire space, commencing normal business operations and paying full unabated rent.
Property Management. The Village at Leesburg Property is managed by Rappaport Management Company, an affiliate of the borrower.
Assumption.The borrower has the two-time right to transfer the Village at Leesburg Property, provided that certain conditions are satisfied, including (i) no event of default has occurred and is continuing; (ii) the lender has reasonably determined that the proposed transferee and guarantor satisfy the lender’s credit review and underwriting standards, taking into consideration the transferee’s experience, financial strength and general business standing; and (iii) if required by the lender, rating agency confirmation from DBRS, Fitch and Moody’s that the transfer will not result in a downgrade, withdrawal or qualification of the respective ratings assigned to the Series WFCM 2018-C45 certificates and similar confirmations from each rating agency rating any securities backed by the Village at Leesburg Companion Loan with respect to the ratings of such securities.
Partial Release. Not permitted.
Real Estate Substitution.Not permitted.
Subordinate and Mezzanine Indebtedness.Not permitted.
Ground Lease. None.
Terrorism Insurance.The loan documents require that the “all risk” insurance policies required to be maintained by the borrower provide coverage for terrorism in an amount equal to the full replacement cost of the Village at Leesburg Property. The loan documents also require business interruption insurance covering no less than the 18-month period following the occurrence of a casualty event, together with a six-month extended period of indemnity.
THE INFORMATION IN THIS STRUCTURAL AND COLLATERAL TERM SHEET IS NOT COMPLETE AND MAY BE AMENDED PRIOR TO THE TIME OF SALE. THIS TERM SHEET IS NOT AN OFFER TO SELL THESE SECURITIES AND IT IS NOT A SOLICITATION OF AN OFFER TO BUY THESE SECURITIES IN ANY JURISDICTION WHERE THE OFFER OR SALE IS NOT PERMITTED.
36
(THIS PAGE INTENTIONALLY LEFT BLANK)
THE INFORMATION IN THIS STRUCTURAL AND COLLATERAL TERM SHEET IS NOT COMPLETE AND MAY BE AMENDED PRIOR TO THE TIME OF SALE. THIS TERM SHEET IS NOT AN OFFER TO SELL THESE SECURITIES AND IT IS NOT A SOLICITATION OF AN OFFER TO BUY THESE SECURITIES IN ANY JURISDICTION WHERE THE OFFER OR SALE IS NOT PERMITTED.
37
| WESTPORT SELF STORAGE PORTFOLIO |
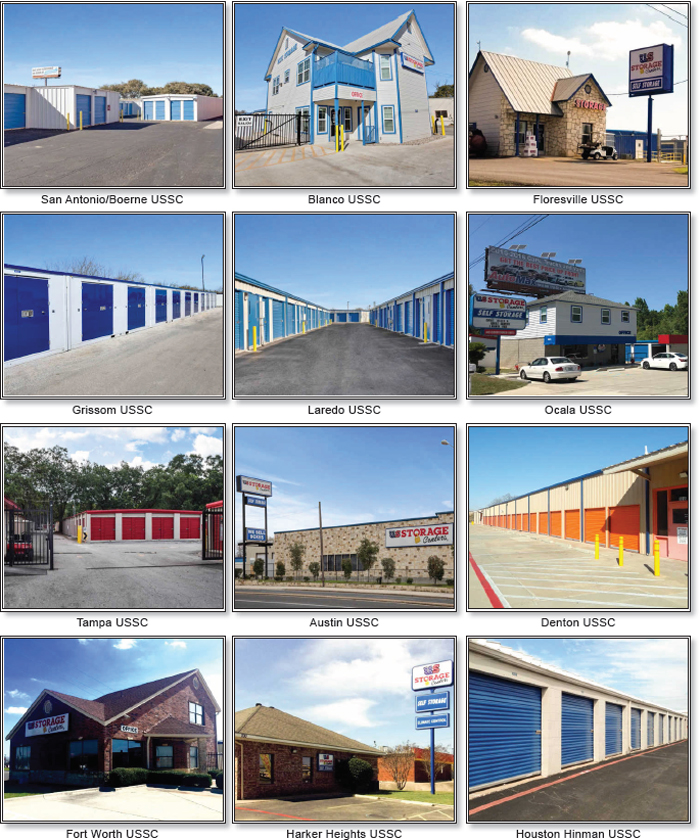
THE INFORMATION IN THIS STRUCTURAL AND COLLATERAL TERM SHEET IS NOT COMPLETE AND MAY BE AMENDED PRIOR TO THE TIME OF SALE. THIS TERM SHEET IS NOT AN OFFER TO SELL THESE SECURITIES AND IT IS NOT A SOLICITATION OF AN OFFER TO BUY THESE SECURITIES IN ANY JURISDICTION WHERE THE OFFER OR SALE IS NOT PERMITTED.
38
| WESTPORT SELF STORAGE PORTFOLIO |
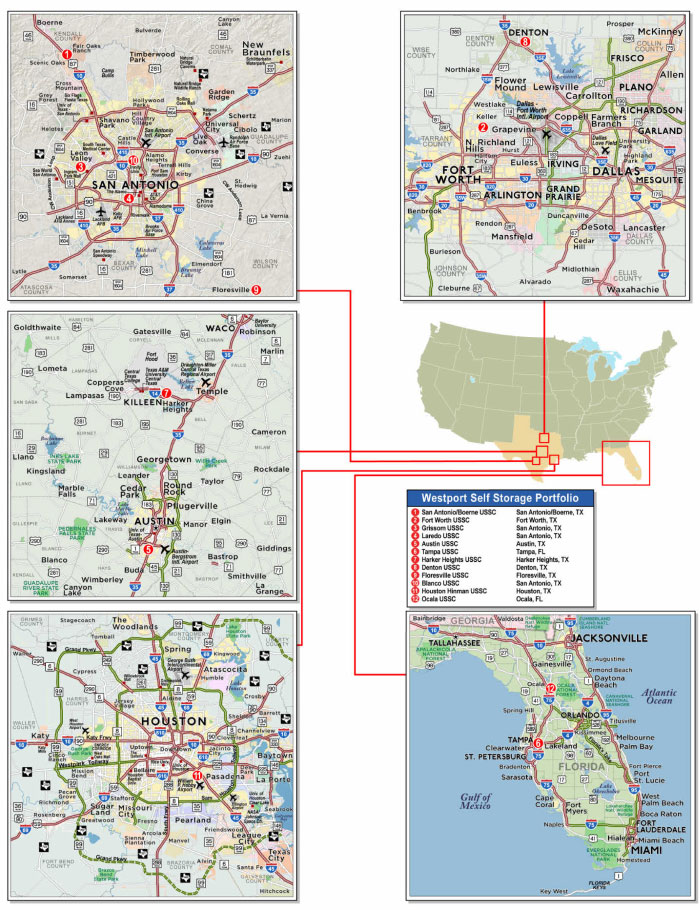
THE INFORMATION IN THIS STRUCTURAL AND COLLATERAL TERM SHEET IS NOT COMPLETE AND MAY BE AMENDED PRIOR TO THE TIME OF SALE. THIS TERM SHEET IS NOT AN OFFER TO SELL THESE SECURITIES AND IT IS NOT A SOLICITATION OF AN OFFER TO BUY THESE SECURITIES IN ANY JURISDICTION WHERE THE OFFER OR SALE IS NOT PERMITTED.
39
| No. 2 – Westport Self Storage Portfolio | |||||||
| Loan Information | Property Information | ||||||
| Mortgage Loan Seller: | Wells Fargo Bank, National Association | Single Asset/Portfolio: | Portfolio | ||||
| Credit Assessment (DBRS/Fitch/Moody’s): | NR/NR/NR | Property Type: | Self Storage | ||||
| Original Principal Balance: | $48,300,000 | Specific Property Type: | Self Storage | ||||
| Cut-off Date Balance: | $48,300,000 | Location: | Various – See Table | ||||
| % of Initial Pool Balance: | 7.3% | Size: | 851,164 SF | ||||
| Loan Purpose: | Refinance | Cut-off Date Balance Per SF: | $56.75 | ||||
| Borrower Names(1): | Various | Year Built/Renovated: | Various – See Table | ||||
| Borrower Sponsor: | Westport Properties Inc. | Title Vesting: | Fee | ||||
| Mortgage Rate: | 4.6800% | Property Manager: | Self-Managed | ||||
| Note Date: | June 8, 2018 | 4thMost Recent Occupancy(3): | NAV | ||||
| Anticipated Repayment Date: | NAP | 3rdMost Recent Occupancy(3): | NAV | ||||
| Maturity Date: | June 11, 2028 | 2ndMost Recent Occupancy (As of): | 80.3% (12/31/2016) | ||||
| IO Period: | 84 months | Most Recent Occupancy (As of): | 85.1% (12/31/2017) | ||||
| Loan Term (Original): | 120 months | Current Occupancy (As of): | 87.1% (5/21/2018) | ||||
| Seasoning: | 1 month | ||||||
| Amortization Term (Original): | 360 months | Underwriting and Financial Information: | |||||
| Loan Amortization Type: | Interest-only, Amortizing Balloon | 4thMost Recent NOI (As of)(4): | $4,113,114 (Annualized 10 or 11 12/31/2016) | ||||
| Interest Accrual Method: | Actual/360 | ||||||
| Call Protection: | L(25),D(91),O(4) | 3rdMost Recent NOI (As of)(4): | $4,767,136 (12/31/2017) | ||||
| Lockbox Type: | Springing | 2ndMost Recent NOI (As of): | $4,677,216 (TTM 5/31/2018) | ||||
| Additional Debt: | None | Most Recent NOI (As of): | $4,783,088 (Annualized 3 5/31/2018) | ||||
| Additional Debt Type: | NAP | ||||||
| U/W Revenues: | $8,105,950 | ||||||
| U/W Expenses: | $3,430,604 | ||||||
| U/W NOI: | $4,675,346 | ||||||
| U/W NCF: | $4,518,214 | ||||||
| U/W NOI DSCR: | 1.56x | ||||||
| U/W NCF DSCR: | 1.51x | ||||||
| Escrows and Reserves(2): | U/W NOI Debt Yield: | 9.7% | |||||
| Type: | Initial | Monthly | Cap (If Any) | U/W NCF Debt Yield: | 9.4% | ||
| Taxes | $0 | Springing | NAP | As-Is Appraised Value(5): | $82,240,000 | ||
| Insurance | $0 | Springing | NAP | As-Is Appraisal Valuation Date(5) : | April 18, 2018 | ||
| Deferred Maintenance | $74,520 | $0 | NAP | Cut-off Date LTV Ratio(5) : | 58.7% | ||
| Replacement Reserves | $0 | Springing | NAP | LTV Ratio at Maturity(5) : | 56.0% | ||
| (1) | See “The Borrower” section. |
| (2) | See “Escrows” section. |
| (3) | The Westport Self Storage Portfolio Borrower (as defined below) acquired the Westport Self Storage Portfolio Properties (as defined below) on March 31, 2016 and historical occupancy prior to such date is not available. |
| (4) | See “Cash Flow Analysis” section. |
| (5) | The individual property level appraised values total $79,210,000, which would equate to a Cut-off Date LTV Ratio and LTV Ratio at Maturity of 61.0% and 58.1%, respectively; however, the appraiser concluded to a portfolio value of $82,240,000 based on the assumption that the entire portfolio is marketed to a single purchaser. |
The Mortgage Loan. The mortgage loan (the “Westport Self Storage Mortgage Loan”) is evidenced by a single promissory note secured by the fee interest in a 12-property self-storage portfolio located in Texas and Florida (the “Westport Self Storage Portfolio Properties”). The Westport Self Storage Mortgage Loan was originated on June 8, 2018 by Wells Fargo Bank, National Association. The Westport Self Storage Mortgage Loan had an original principal balance of $48,300,000, has an outstanding principal balance as of the Cut-off Date of $48,300,000 and accrues interest at an interest rate of 4.6800%per annum. The Westport Self Storage Mortgage Loan had an initial term of 120 months, has a remaining term of 119 months as of the Cut-off Date and requires interest-only payments for the first 84 months following origination and, thereafter, requires payments of principal and interest based on a 30-year amortization schedule. The Westport Self Storage Mortgage Loan matures on June 11, 2028.
Following the lockout period, the borrower has the right to defease the Westport Self Storage Mortgage Loan in whole, or in part (see “Partial Release” section), on any date before March 11, 2028. In addition, the Westport Self Storage Mortgage Loan is prepayable without penalty on or after March 11, 2028.
THE INFORMATION IN THIS STRUCTURAL AND COLLATERAL TERM SHEET IS NOT COMPLETE AND MAY BE AMENDED PRIOR TO THE TIME OF SALE. THIS TERM SHEET IS NOT AN OFFER TO SELL THESE SECURITIES AND IT IS NOT A SOLICITATION OF AN OFFER TO BUY THESE SECURITIES IN ANY JURISDICTION WHERE THE OFFER OR SALE IS NOT PERMITTED.
40
| WESTPORT SELF STORAGE PORTFOLIO |
Sources and Uses
| Sources | Uses | |||||||
| Original loan amount | $48,300,000 | 100.0% | Loan payoff | $39,966,576 | 82.7% | |||
| Reserves | 74,520 | 0.2 | ||||||
| Closing costs | 667,552 | 1.4 | ||||||
| Return of equity | 7,591,352 | 15.7 | ||||||
| Total Sources | $48,300,000 | 100.0% | Total Uses | $48,300,000 | 100.0% |
The Properties. The Westport Self Storage Portfolio Properties comprise 12 self-storage properties totaling 851,164 square feet of rentable area, including 5,913 self storage units and 32,127 square feet of retail and commercial space, plus 406 RV parking spaces (see “Unit Mix” table below). The net rentable area of the Westport Self Storage Portfolio consists of approximately 96.2% self storage space and 3.8% retail and commercial space with no square footage attributed to the RV parking spaces. The Westport Self Storage Portfolio Properties range in size from 42,131 square feet to 176,939 square feet and were originally built between 1960 and 2002, with 10 properties having been renovated and/or expanded since 2004 (including eight since 2016).
The Westport Self Storage Portfolio Properties are located in Texas (10 properties; 748,537 square feet; 87.9% of net rentable area) and Florida (two properties; 102,627 square feet; 12.1% of net rentable area). Since acquiring the Westport Self Storage Portfolio Properties in 2016, the borrower sponsor has spent approximately $8.1 million in capital expenditures across the portfolio to rebrand the properties to US Storage Centers (“USSC”) and add CCTV security systems. As of May 21, 2018, the Westport Self Storage Portfolio Properties were 87.1% occupied with individual property occupancies ranging from 76.5% to 95.1% (see “Historical Occupancy” table below).
The following table presents certain information relating to the Westport Self Storage Portfolio Properties:
| Property Name – Location | Year Built/ Renovated | Allocated Cut-off Date Balance | % of ALA | Appraised Value(1) | Allocated LTV | UW NCF | % UW NCF |
| San Antonio/Boerne USSC – San Antonio/Boerne, TX | 1984/2004 | $9,437,217 | 19.5% | $15,640,000 | 60.3% | $868,811 | 19.2% |
| Fort Worth USSC – Fort Worth, TX | 2001/2016 | $5,407,616 | 11.2% | $8,920,000 | 60.6% | $483,788 | 10.7% |
| Grissom USSC – San Antonio, TX | 1987/2016 | $5,054,009 | 10.5% | $7,830,000 | 64.5% | $502,664 | 11.1% |
| Laredo USSC – San Antonio, TX | 2000/2016 | $4,662,017 | 9.7% | $7,870,000 | 59.2% | $435,928 | 9.6% |
| Austin USSC – Austin, TX | 1983/2016 | $4,291,045 | 8.9% | $7,790,000 | 55.1% | $418,084 | 9.3% |
| Tampa USSC – Tampa, FL | 1987/NAP | $3,454,403 | 7.2% | $5,300,000 | 65.2% | $315,043 | 7.0% |
| Harker Heights USSC – Harker Heights, TX | 2002/2016 | $3,450,344 | 7.1% | $5,320,000 | 64.9% | $317,966 | 7.0% |
| Denton USSC – Denton, TX | 1960/2016 | $3,356,378 | 6.9% | $5,600,000 | 59.9% | $352,264 | 7.8% |
| Floresville USSC – Floresville, TX | 1986/2006 | $3,306,223 | 6.8% | $5,070,000 | 65.2% | $314,230 | 7.0% |
| Blanco USSC – San Antonio, TX | 1986/2016 | $2,933,616 | 6.1% | $4,660,000 | 63.0% | $285,453 | 6.3% |
| Houston Hinman USSC – Houston, TX | 1975/2016 | $1,571,800 | 3.3% | $2,710,000 | 58.0% | $96,647 | 2.1% |
| Ocala USSC – Ocala, FL | 1989/NAP | $1,375,332 | 2.8% | $2,500,000 | 55.0% | $127,336 | 2.8% |
| Total/Weighted Average | $48,300,000 | 100.0% | $82,240,000 | 58.7% | $4,518,214 | 100.0% |
| (1) | The individual property level appraised values total $79,210,000, which would equate to a Cut-off Date LTV Ratio and LTV Ratio at Maturity of 61.0% and 58.1%, respectively; however, the appraiser concluded to a portfolio value of $82,240,000 based on the assumption that the entire portfolio is marketed to a single purchaser. |
The following table presents detailed information with respect to the unit mix of the Westport Self Storage Portfolio Properties:
Unit Mix
| Property Name | Net Rentable Area (SF)(1) | % GLA | Self Storage Units | Commercial Space (SF) | RV Parking Units |
| San Antonio/Boerne USSC | 176,939 | 20.8% | 741 | 11,055 | 45 |
| Fort Worth USSC | 65,140 | 7.7% | 453 | 0 | 60 |
| Grissom USSC | 100,320 | 11.8% | 330 | 0 | 276 |
| Laredo USSC | 56,706 | 6.7% | 577 | 0 | 8 |
| Austin USSC | 62,402 | 7.3% | 707 | 0 | 0 |
| Tampa USSC | 60,496 | 7.1% | 435 | 0 | 1 |
| Harker Heights USSC | 66,075 | 7.8% | 464 | 0 | 4 |
| Denton USSC | 61,533 | 7.2% | 524 | 18,000 | 0 |
| Floresville USSC | 56,197 | 6.6% | 369 | 3,072 | 0 |
| Blanco USSC | 51,205 | 6.0% | 490 | 0 | 0 |
| Houston Hinman USSC | 52,020 | 6.1% | 466 | 0 | 0 |
| Ocala USSC | 42,131 | 4.9% | 357 | 0 | 12 |
| Total/Weighted Average | 851,164 | 100% | 5,913 | 32,127 | 406 |
THE INFORMATION IN THIS STRUCTURAL AND COLLATERAL TERM SHEET IS NOT COMPLETE AND MAY BE AMENDED PRIOR TO THE TIME OF SALE. THIS TERM SHEET IS NOT AN OFFER TO SELL THESE SECURITIES AND IT IS NOT A SOLICITATION OF AN OFFER TO BUY THESE SECURITIES IN ANY JURISDICTION WHERE THE OFFER OR SALE IS NOT PERMITTED.
41
| WESTPORT SELF STORAGE PORTFOLIO |
The following table presents historical occupancy percentages at the Westport Self Storage Portfolio Properties:
Historical Occupancy(1)
| Property Name | 12/31/2016(2) | 12/31/2017(2) | 5/21/2018(3) |
| San Antonio/Boerne USSC | 87.6% | 90.2% | 88.9% |
| Fort Worth USSC | 76.9% | 90.6% | 88.8% |
| Grissom USSC | 94.3% | 93.9% | 95.1% |
| Laredo USSC | 92.6% | 88.3% | 89.7% |
| Austin USSC | 72.8% | 78.8% | 80.3% |
| Tampa USSC | 82.5% | 91.6% | 83.6% |
| Harker Heights USSC | 81.3% | 87.3% | 89.2% |
| Denton USSC | 73.7% | 82.7% | 83.2% |
| Floresville USSC | 84.7% | 86.8% | 82.4% |
| Blanco USSC | 89.0% | 89.4% | 90.2% |
| Houston Hinman USSC | 68.8% | 34.8%(4) | 76.5% |
| Ocala USSC | 74.3% | 82.6% | 86.8% |
| Total/Weighted Average | 83.0% | 85.1% | 87.1% |
| (1) | The Westport Self Storage Portfolio Borrower acquired the Westport Self Storage Portfolio Properties on March 31, 2016, and historical occupancy is not available prior to such date. |
| (2) | Information obtained from the Westport Self Storage Portfolio Borrower. |
| (3) | Information obtained from the underwritten rent roll. |
| (4) | The decline in occupancy at the Houston Hinman USSC property from 2016 to 2017 was due to damage sustained from Hurricane Harvey. |
Operating History and Underwritten Net Cash Flow.The following table presents certain information relating to the historical operating performance and the underwritten net cash flow at the Westport Self Storage Portfolio Properties:
Cash Flow Analysis
| Annualized 10 or 11 12/31/2016(1) | 2017(2) | TTM 5/31/2018 | Annualized 3 5/31/2018 | U/W | % of U/W Effective Gross Income | U/W $ per SF | |||||||||
| Base Rent | $6,491,761 | $6,981,609 | $7,037,957 | $6,914,044 | $7,285,656(4) | 89.9% | $8.56 | ||||||||
| Grossed Up Vacant Space | 0 | 0 | 0 | 0 | 1,242,624 | 15.3 | 1.46 | ||||||||
| Other Income(3) | 953,817 | 997,930 | 936,219 | 988,076 | 988,076 | 12.2 | 1.16 | ||||||||
| Retail/Commercial | 144,781 | 348,052 | 372,326 | 387,336 | 323,114 | 4.0 | 0.38 | ||||||||
| Less Vacancy and Credit Loss | (340,639) | (443,133) | (349,086) | (182,320) | (1,733,520)(5) | (21.4) | (2.04) | ||||||||
| Effective Gross Income | $7,249,719 | $7,884,458 | $7,997,416 | $8,107,136 | $8,105,950 | 100.0% | $9.52 | ||||||||
| Total Operating Expenses | $3,136,605 | $3,117,322 | $3,320,200 | $3,324,048 | $3,430,604 | 42.3% | $4.03 | ||||||||
| Net Operating Income | $4,113,114 | $4,767,136 | $4,677,216 | $4,783,088 | $4,675,346 | 57.7% | $5.49 | ||||||||
| Capital Expenditures | 0 | 0 | 0 | 0 | 157,132 | 1.9 | 0.18 | ||||||||
| Net Cash Flow | $4,113,114 | $4,767,136 | $4,677,216 | $4,783,088 | $4,518,214 | 55.7% | $5.31 | ||||||||
| NOI DSCR | 1.37x | 1.59x | 1.56x | 1.59x | 1.56x | ||||||||||
| NCF DSCR | 1.37x | 1.59x | 1.56x | 1.59x | 1.51x | ||||||||||
| NOI DY | 8.5% | 9.9% | 9.7% | 9.9% | 9.7% | ||||||||||
| NCF DY | 8.5% | 9.9% | 9.7% | 9.9% | 9.4% |
| (1) | Of the 12 Westport Self Storage Portfolio properties, financials for four properties represent trailing 10-month annualized financials ending December 31, 2016, and financials for the remaining eight properties represent trailing 11-month annualized financials ending December 31, 2016. |
| (2) | 2017 NOI is higher than Annualized 10 or 11 2016 NOI due in part to a $247,384 increase in other income, primarily driven by retail and commercial tenant income, and an overall increase in occupancy from 80.3% as of December 31, 2016 to 85.1% as of December 31, 2017. |
| (3) | Other Income consists of late fees, administrative fees, retail merchandise sales, truck rental income, postal box income, income from two cell tower leases (at the San Antonio/Boerne USSC property and Blanco USSC property) and two billboard leases (at the San Antonio/Boerne USSC property and Ocala USSC property), and tenant insurance. |
| (4) | Underwritten Base Rent comprises approximately 95.3% of income from self storage units and 4.7% of income from RV parking income. |
| (5) | The underwritten economic vacancy is 20.3%. As of May 21, 2018, the Westport Self Storage Portfolio Properties were 87.1% physically occupied. |
Appraisal.The appraiser concluded to an “as is” appraised value for the Westport Self Storage Portfolio Properties of $82,240,000 as of April 18, 2018.
Environmental Matters. According to the Phase I environmental site assessments dated April 30, 2018, there are no recognized environmental conditions at the Westport Self Storage Portfolio Properties.
Market Overview and Competition. The Westport Self Storage Portfolio Properties are located in eight cities in Texas (87.9% of net rentable area) and two cities in Florida (12.1% of net rentable area). Within a five-mile radius of the Westport Self Storage Portfolio Properties, the average estimated population and median household income are 185,670 and $78,311, respectively (see table below).
THE INFORMATION IN THIS STRUCTURAL AND COLLATERAL TERM SHEET IS NOT COMPLETE AND MAY BE AMENDED PRIOR TO THE TIME OF SALE. THIS TERM SHEET IS NOT AN OFFER TO SELL THESE SECURITIES AND IT IS NOT A SOLICITATION OF AN OFFER TO BUY THESE SECURITIES IN ANY JURISDICTION WHERE THE OFFER OR SALE IS NOT PERMITTED.
42
| WESTPORT SELF STORAGE PORTFOLIO |
Four of the Westport Self Storage Portfolio Properties are located in San Antonio, Texas (45.7% of the allocated loan amount and 45.3% of net rentable area). According to the appraisal, the overall San Antonio self storage market reported an average vacancy rate of 13.4% from 2011 to 2017, with a 2017 vacancy rate of 14.4%.
The following table presents certain demographic information with respect to the Westport Self Storage Portfolio Properties:
Demographic Summary(1)
| Property | City | State | 2017/2018 Population (within 1- ,3- , 5-mile radius) | 2017/2018 Median Income (within 1- ,3- , 5-mile radius) |
| San Antonio/Boerne USSC | San Antonio/Boerne | TX | 4,552, 23,555, 36,905 | $115,357, $127,041, $126,484 |
| Fort Worth USSC | Fort Worth | TX | 11,873, 98,031, 216,520 | $89,197, $93,373, $89,624 |
| Grissom USSC | San Antonio | TX | 4,552, 23,555, 36,905 | $115,357, $127,041, $126,484 |
| Laredo USSC | San Antonio | TX | 4,552, 23,555, 36,905 | $115,357, $127,041, $126,484 |
| Austin USSC | Austin | TX | 19,953, 144,227, 308,009 | $46,068, $46,129, $53,641 |
| Tampa USSC | Tampa | FL | 106,870, 250,987, 757,077 | $32,915, $42,031, $49,471 |
| Harker Heights USSC | Harker Heights | TX | 9,666, 49,067, 105,102 | $53,788, $61,940, $54,682 |
| Denton USSC | Denton | TX | 8,794, 87,558, 145,329 | $30,231, $40,160, $52,047 |
| Floresville USSC | Floresville | TX | 484, 7,413, 11,349 | $58,053, $51,955, $54,338 |
| Blanco USSC | San Antonio | TX | 4,522, 23,555, 36,905 | $115,357, $127,041, $126,484 |
| Houston Hinman USSC | Houston | TX | 15,300, 131,046, 337,043 | $31,593, $39,979, $40,319 |
| Ocala USSC | Ocala | FL | 39,677, 88,048, 199,990 | $36,341, $39,205, $39,672 |
| (1) | Based on 2017 and 2018 demographic and market information as provided by third party research reports and the appraisal. |
The Borrowers.The borrowers are Westport Austin Self Storage, LLC; Westport Blanco Self Storage, LLC; Westport Boerne Self Storage, LLC; Westport Denton Self Storage, LLC; Westport Floresville Self Storage, LLC; Westport Ft. Worth Self Storage, LLC; Westport Grissom Self Storage, LLC; Westport Harker Self Storage, LLC; Westport Houston Self Storage, LLC; Westport Laredo Self Storage, LLC; Westport Ocala Self Storage, LLC; and Westport Tampa Self Storage, LLC (collectively, the “Westport Self Storage Portfolio Borrower”), each a Delaware limited liability company and single purpose entity with one independent director. Legal counsel to the borrower delivered a non-consolidation opinion in connection with the origination of the Westport Self Storage Portfolio Mortgage Loan. Westport/TR Storage Venture LLC is the guarantor of certain nonrecourse carveouts under the Westport Self Storage Portfolio Mortgage Loan.
The Borrower Sponsor.The borrower sponsor is Westport Properties Inc., which is a joint venture between entities affiliated with Westport Properties, Inc. (10.0% interest; “Westport”) and Teachers’ Retirement System of the State of Illinois (90.0% interest; “TRS”).
Westport was founded in 1985 and currently operates 120 self storage facilities totaling over six million square feet and located in 15 states. TRS is the 37th largest pension system in the United States and provides retirement, disability and survivor benefits to teachers, administrators and other public school personnel employed in the state of Illinois, excluding those employed in Chicago. TRS serves approximately 412,000 members and reported total assets of approximately $51.5 billion as of April 30, 2018, with 13.6% of those assets invested in real estate.
Escrows.The loan documents provide for upfront reserves of $74,520 for immediate repairs and springing monthly reserves of $13,093 for replacement reserves during the continuance of an event of default.
The loan documents do not require ongoing monthly escrows for real estate taxes as long as (i) no event of default has occurred and is continuing; and (ii) the Westport Self Storage Portfolio Borrower pays all applicable taxes prior to delinquency and provides the lender with evidence of payment. The loan documents do not require ongoing monthly escrows for insurance premiums as long as (i) no event of default has occurred and is continuing; (ii) the Westport Self Storage Portfolio Borrower provides the lender with evidence that the Westport Self Storage Portfolio Properties’ insurance coverage is included in a blanket policy and such policy is in full force and effect; and (iii) the Westport Self Storage Portfolio Borrower pays all applicable insurance premiums and provides the lender with evidence of renewals at least 30 days prior to the expiration date of such policy.
Lockbox and Cash Management.Upon the occurrence of a Cash Trap Event Period (as defined below), the loan documents require that the borrower establish a lockbox account and the borrower or property manager must cause all rents to be deposited directly into such lockbox account. During a Cash Trap Event Period, all excess cash flow after payment of all amounts due and payable under the loan documents and all operating expenses will be retained by the lender as additional collateral for the Westport Self Storage Portfolio Mortgage Loan.
A “Cash Trap Event Period” will commence upon the earlier of the following; provided, however that the Westport Self Storage Portfolio Borrower has the right to release an individual property from the lien of the Westport Self Storage Portfolio Mortgage Loan to prevent the commencement thereof (see “Partial Release” below):
| (i) | the occurrence and continuance of an event of default; or |
| (ii) | the debt yield being less than 7.5% at the end of any calendar quarter. |
A Cash Trap Event Period will end:
| ● | with regard to clause (i), upon the cure of such event of default; and |
| ● | with regard to clause (ii), upon the debt yield being at least 7.5% for two consecutive calendar quarters. |
Property Management.The Westport Self Storage Portfolio Properties are managed by an affiliate of the Westport Self Storage Portfolio Borrower.
THE INFORMATION IN THIS STRUCTURAL AND COLLATERAL TERM SHEET IS NOT COMPLETE AND MAY BE AMENDED PRIOR TO THE TIME OF SALE. THIS TERM SHEET IS NOT AN OFFER TO SELL THESE SECURITIES AND IT IS NOT A SOLICITATION OF AN OFFER TO BUY THESE SECURITIES IN ANY JURISDICTION WHERE THE OFFER OR SALE IS NOT PERMITTED.
43
| WESTPORT SELF STORAGE PORTFOLIO |
Assumption.The Westport Self Storage Portfolio Borrower has the two-time right, commencing 12 months after loan origination, to transfer the Westport Self Storage Portfolio Properties in their entirety, provided that certain conditions are satisfied, including (i) no event of default has occurred and is continuing; (ii) the lender has reasonably determined that the proposed transferee and guarantor satisfy the lender’s credit review and underwriting standards, taking into consideration the transferee’s experience, financial strength and general business standing; and (iii) if required by the lender, rating agency confirmation from DBRS, Fitch and Moody’s that the transfer will not result in a downgrade, withdrawal or qualification of the respective ratings assigned to the Series WFCM 2018-C45 certificates.
Partial Release.Following the lockout period, the Westport Self Storage Portfolio Borrower may obtain the release of any of the Westport Self Storage Portfolio Properties to (a) prevent the commencement of, or cause the expiration of, a Cash Trap Event Period (see “Lockbox” section) or to otherwise prevent or cure the occurrence of an event of default or (b) in connection with a bona fide sale of any of the Westport Self Storage Portfolio Properties to an unaffiliated third party, with both (a) and (b) being subject to certain conditions, including (i) partial defeasance in an amount equal to or greater than the applicable Partial Release Defeasance Amount (as defined below); (ii) the amortizing net cash flow debt service coverage ratio of the remaining properties is not less than the greater of 1.55x and the net cash flow debt service coverage ratio immediately prior to the release; (iii) the net cash flow debt yield of the remaining properties is not less than the greater of the applicable Partial Release Debt Yield Requirement (as defined below) and the net cash flow debt yield prior to the release; (iv) the loan-to-value ratio of the remaining properties is no greater than the lesser of 60.0% and the loan-to-value ratio prior to the release; (v) delivery of a legal opinion covering compliance in all respects with all laws, rules and regulations governing REMICs, (vi) rating agency confirmation that the sale (as applicable) and release will not result in a downgrade, withdrawal or qualification of the respective ratings assigned to the WFCM 2018-C45 certificates, and (vii) if the Fort Worth USSC property remains part of the collateral for the Westport Self Storage Mortgage Loan, the collateral must also include at least four other Westport Self Storage Portfolio Properties.
“Partial Release Defeasance Amount” is equal to (i) in the event of a release of the first through the fifth Westport Self Storage Portfolio Properties, 120% of the Allocated Cut-off Date Balance of such release property (identified in “The Properties” section chart above); (ii) in the event of a release of the sixth through the ninth Westport Self Storage Portfolio Properties, 125% of the Allocated Cut-off Date Balance of such release property; and (iii) in the event of a release of the tenth through the twelfth Westport Self Storage Portfolio Properties, 130% of the Allocated Cut-off Date Balance of such release property.
“Partial Release Debt Yield Requirement” is equal to (i) in the event of a release of the first through the fifth Westport Self Storage Portfolio Properties, 9.75%, (ii) in the event of a release of the sixth through the ninth Westport Self Storage Portfolio Properties, 10.0% or (iii) in the event of a release of the tenth through the twelfth Westport Self Storage Portfolio Properties, 10.5%.
Real Estate Substitution.Not permitted.
Subordinate and Mezzanine Indebtedness.Not permitted.
Ground Lease.None.
Terrorism Insurance. The loan documents require that the “all risk” insurance policy required to be maintained by the borrower provide coverage for terrorism in an amount equal to the full replacement cost of the Westport Self Storage Portfolio Properties. The loan documents also require business interruption insurance covering no less than the 12-month period following the occurrence of a casualty event, together with a 6-month extended period of indemnity.
Windstorm Insurance. The Westport Self Storage Portfolio loan documents require windstorm and flood insurance covering the full replacement cost of the Westport Self Storage Portfolio Properties during the loan term. At the time of loan closing, Westport Self Storage Portfolio Properties had windstorm insurance coverage and flood insurance in the maximum limit available under the National Flood Insurance Program together with excess coverage.
THE INFORMATION IN THIS STRUCTURAL AND COLLATERAL TERM SHEET IS NOT COMPLETE AND MAY BE AMENDED PRIOR TO THE TIME OF SALE. THIS TERM SHEET IS NOT AN OFFER TO SELL THESE SECURITIES AND IT IS NOT A SOLICITATION OF AN OFFER TO BUY THESE SECURITIES IN ANY JURISDICTION WHERE THE OFFER OR SALE IS NOT PERMITTED.
44
(THIS PAGE INTENTIONALLY LEFT BLANK)
THE INFORMATION IN THIS STRUCTURAL AND COLLATERAL TERM SHEET IS NOT COMPLETE AND MAY BE AMENDED PRIOR TO THE TIME OF SALE. THIS TERM SHEET IS NOT AN OFFER TO SELL THESE SECURITIES AND IT IS NOT A SOLICITATION OF AN OFFER TO BUY THESE SECURITIES IN ANY JURISDICTION WHERE THE OFFER OR SALE IS NOT PERMITTED.
45
(THIS PAGE INTENTIONALLY LEFT BLANK)
THE INFORMATION IN THIS STRUCTURAL AND COLLATERAL TERM SHEET IS NOT COMPLETE AND MAY BE AMENDED PRIOR TO THE TIME OF SALE. THIS TERM SHEET IS NOT AN OFFER TO SELL THESE SECURITIES AND IT IS NOT A SOLICITATION OF AN OFFER TO BUY THESE SECURITIES IN ANY JURISDICTION WHERE THE OFFER OR SALE IS NOT PERMITTED.
46
PARKWAY CENTER |
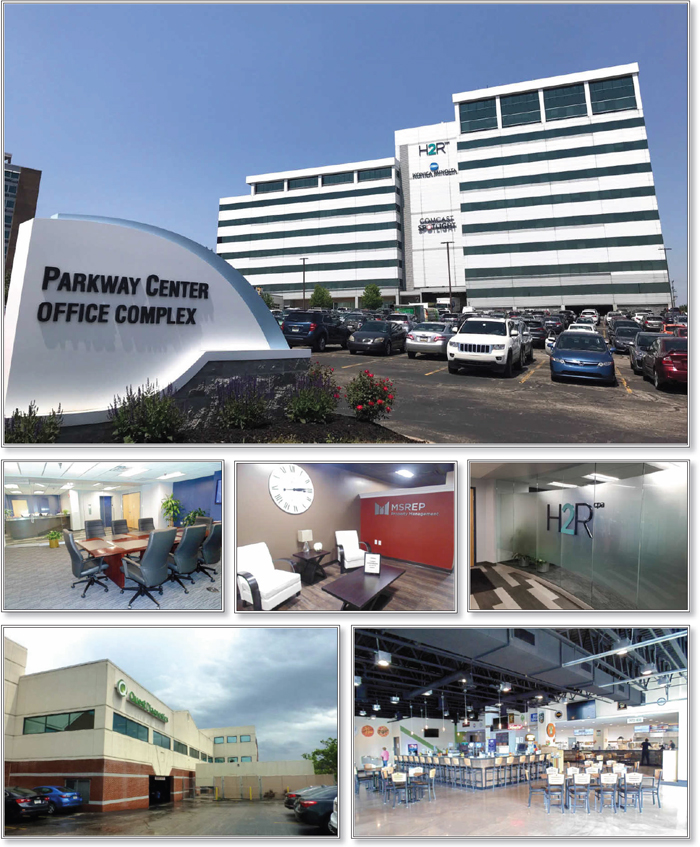
THE INFORMATION IN THIS STRUCTURAL AND COLLATERAL TERM SHEET IS NOT COMPLETE AND MAY BE AMENDED PRIOR TO THE TIME OF SALE. THIS TERM SHEET IS NOT AN OFFER TO SELL THESE SECURITIES AND IT IS NOT A SOLICITATION OF AN OFFER TO BUY THESE SECURITIES IN ANY JURISDICTION WHERE THE OFFER OR SALE IS NOT PERMITTED.
47
PARKWAY CENTER |
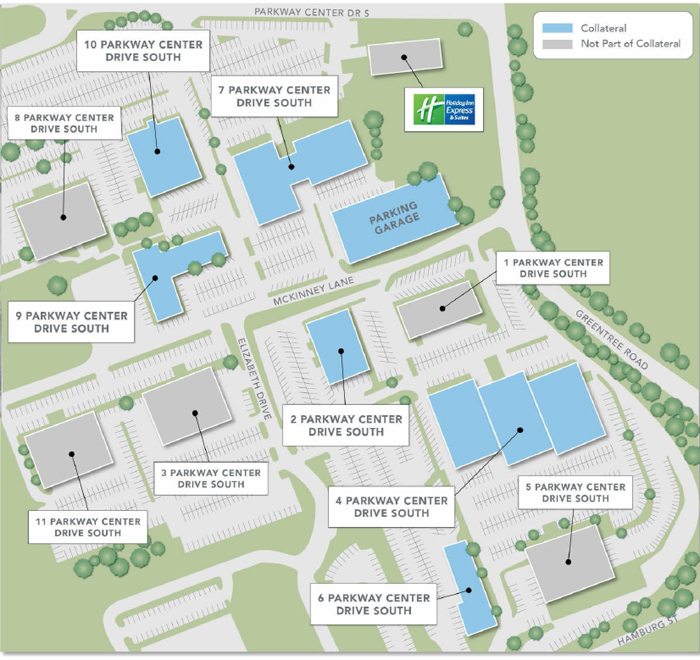
THE INFORMATION IN THIS STRUCTURAL AND COLLATERAL TERM SHEET IS NOT COMPLETE AND MAY BE AMENDED PRIOR TO THE TIME OF SALE. THIS TERM SHEET IS NOT AN OFFER TO SELL THESE SECURITIES AND IT IS NOT A SOLICITATION OF AN OFFER TO BUY THESE SECURITIES IN ANY JURISDICTION WHERE THE OFFER OR SALE IS NOT PERMITTED.
48
PARKWAY CENTER |

THE INFORMATION IN THIS STRUCTURAL AND COLLATERAL TERM SHEET IS NOT COMPLETE AND MAY BE AMENDED PRIOR TO THE TIME OF SALE. THIS TERM SHEET IS NOT AN OFFER TO SELL THESE SECURITIES AND IT IS NOT A SOLICITATION OF AN OFFER TO BUY THESE SECURITIES IN ANY JURISDICTION WHERE THE OFFER OR SALE IS NOT PERMITTED.
49
| No. 3 – Parkway Center |
| Loan Information | Property Information | |||||
| Mortgage Loan Seller: | C-III Commercial Mortgage | Single Asset/Portfolio: | Single Asset | |||
| Credit Assessment (DBRS/Fitch/Moody’s): | NR/NR/NR | Property Type: | Office | |||
| Original Principal Balance: | $42,560,000 | Specific Property Type: | Suburban | |||
| Cut-off Date Balance: | $42,560,000 | Location: | Pittsburgh, PA | |||
| % of Initial Pool Balance: | 6.5% | Size: | 588,913 SF | |||
| Loan Purpose: | Refinance | Cut-off Date Balance Per SF: | $72.27 | |||
| Borrower: | PWC Pitt, LLC | Year Built/Renovated(3): | 1960/2017 | |||
| Borrower Sponsor: | Allan Serviansky, Daniel Warman, Robert Oppenheim, Jeffrey Aeder | Title Vesting: | Fee | |||
| Mortgage Rate: | 5.1000% | Property Manager: | Self-managed | |||
| Note Date: | June 8, 2018 | |||||
| Anticipated Repayment Date: | NAP | 3rd Most Recent Occupancy (As of): | 64.5% (12/31/2015) | |||
| Maturity Date: | June 11, 2028 | 2nd Most Recent Occupancy (As of): | 72.7% (12/31/2016) | |||
| IO Period: | 36 months | Most Recent Occupancy (As of): | 86.5% (12/31/2017) | |||
| Loan Term (Original): | 120 months | Current Occupancy (As of): | 85.8% (4/30/2018) | |||
| Seasoning: | 1 month | |||||
| Amortization Term (Original): | 360 months | Underwriting and Financial Information: | ||||
| Loan Amortization Type: | Interest-only, Amortizing Balloon | |||||
| Interest Accrual Method: | Actual/360 | 4th Most Recent NOI (As of): | $3,181,233(12/31/2015) | |||
| Call Protection: | L(25),D(92),O(3) | 3rd Most Recent NOI (As of)(4): | $3,089,303 (12/31/2016) | |||
| Lockbox Type: | Hard/Springing Cash Management | 2nd Most Recent NOI (As of)(4): | $4,332,009 (12/31/2017) | |||
| Additional Debt(1): | Yes | Most Recent NOI (As of): | $4,581,637 (TTM 4/30/2018) | |||
| Additional Debt Type(1): | Mezzanine | |||||
| U/W Revenues: | $9,194,024 | |||||
| U/W Expenses: | $4,656,855 | |||||
| U/W NOI: | $4,537,169 | |||||
| Escrows and Reserves(2): | U/W NCF: | $3,830,474 | ||||
| Type: | Initial | Monthly | Cap (If Any) | U/W NOI DSCR: | 1.64x | |
| Taxes | $705,609 | 100,801 | NAP | U/W NCF DSCR(1): | 1.38x | |
| Insurance | 31,673 | 10,558 | NAP | U/W NOI Debt Yield: | 10.7% | |
| Replacement Reserves | $9,815 | $9,815 | NAP | U/W NCF Debt Yield(1): | 9.0% | |
| TI/LC Reserve | $299,076 | $49,076 | NAP | As-Is Appraised Value: | $66,600,000 | |
| Quest Leasing Reserve(2) | $1,616,313 | $13,000 | NAP | As-Is Appraisal Valuation Date: | March 13, 2018 | |
| Deferred Maintenance | $254,896 | $0 | NAP | Cut-off Date LTV Ratio(1): | 63.9% | |
| Free Rent Reserve | $45,530 | $0 | NAP | LTV Ratio at Maturity or ARD: | 56.7% | |
| (1) | See “Subordinate and Mezzanine Indebtedness” section. The Cut-off Date LTV Ratio, U/W NCF DSCR and U/W NCF Debt Yield based on the Parkway Center Mortgage Loan (as defined below), and the Parkway Center Mezzanine Loan (as defined below), together, are 71.0%, 1.18x and 8.11%, respectively. |
| (2) | See “Escrows” section. |
| (3) | The Parkway Center Property consists of 6 separate buildings which were constructed at various times. Building 2 was constructed in 1960, Building 4 in 1961, Building 6 in 1975, Building 7 in 1970, Building 9 in 1962 and Building 10 in 1965. All buildings were renovated in 2017. |
| (4) | The increase from in NOI from 2016 to 2017 is primarily attributable to lease up of two buildings to Alorica in June 2016 and County of Allegheny in June 2017. |
The Mortgage Loan.The mortgage loan (the “Parkway Center Mortgage Loan”) was originated on June 8, 2018 by C-III Commercial Mortgage LLC. The Parkway Center Mortgage Loan had an original principal balance of $42,560,000, has an outstanding principal balance as of the Cut-off Date of $42,560,000 and has an interest rate of 5.1000%per annum. The Parkway Center Mortgage Loan had an initial term of 120 months, has a remaining term of 119 months as of the Cut-off Date and requires payments of interest-only for the first three years of the term, followed by payments on a 30-year amortization schedule through maturity. The Parkway Center Mortgage Loan has a maturity date on June 11, 2028.
Following the defeasance lockout period, the Parkway Center Borrower (as defined below) has the right to defease the Parkway Center Mortgage Loan in whole or in connection with a parcel release in part. In addition, the Parkway Center Mortgage Loan is prepayable without penalty on or after March 11, 2028. The defeasance lockout period will expire two years and one day after the closing date of the securitization, which is expected to occur in July 2018.
THE INFORMATION IN THIS STRUCTURAL AND COLLATERAL TERM SHEET IS NOT COMPLETE AND MAY BE AMENDED PRIOR TO THE TIME OF SALE. THIS TERM SHEET IS NOT AN OFFER TO SELL THESE SECURITIES AND IT IS NOT A SOLICITATION OF AN OFFER TO BUY THESE SECURITIES IN ANY JURISDICTION WHERE THE OFFER OR SALE IS NOT PERMITTED.
50
PARKWAY CENTER |
Sources and Uses
| Sources | Uses | |||||
| Original loan amount | $42,560,000 | 90.1% | Loan payoff | $37,723,904 | 79.8% | |
| Mezzanine Loan | 4,700,000 | 9.9 | Return of Equity | 5,099,389 | 10.8 | |
| Reserves | 2,962,912 | 6.3 | ||||
| Closing costs | 1,473,795 | 3.1 | ||||
| Total Sources | $47,260,000 | 100.0% | Total Uses | $47,260,000 | 100.0% |
The Property. The Parkway Center Mortgage Loan is secured by a first mortgage lien on the Parkway Center Borrower’s fee interest in a 6 building 588,913 square-foot, Class B office park located in Pittsburgh, Pennsylvania (the “Parkway Center Property”). The Parkway Center Property is part of a larger office park that has 11 total buildings with a combined NRA of nearly 930,000 SF. The Parkway Center Property is located along GreenTree Road in Pittsburgh, which has direct access to Interstate-376. I-376 is a main east-west running highway that connects the Pittsburgh central business district to the east with the Pittsburgh International Airport to the northwest. The Parkway Center Property is less than a 4-mile drive from downtown Pittsburgh and is less than a 15-mile drive from Pittsburgh International Airport. The 6 separate buildings comprising the Parkway Center Property were constructed at different times. Building 2 was built in 1960, Building 4 in 1961, Building 6 in 1975, Building 7 in 1970, Building 9 in 1962 and Building 10 in 1965. The Parkway Center Property was most recently renovated in 2017. The Parkway Center Property sits on an approximately 19.4-acre site within the Pittsburgh suburb of Green Tree. The Parkway Center Property includes an adjacent three-level parking garage (which along with surface parking and parking granted through easements) has 2,107 total spaces, representing 3.58 spaces per 1000 square feet, and tenant amenities such as a 3,891 square-foot landlord operated fitness center, a 6,895 square-foot food court, a Jitters Café and The Alcove Restaurant. The Parkway Center Property was renovated and repositioned by the Parkway Center Borrower after acquisition in 2014 to bring in new tenancy and keep the Parkway Center Property amenities competitive with other offices in the market.
As of April 30, 2018, the Parkway Center Property was 85.8% leased to 53 tenants across a variety of industries.The top five tenants include Quest Diagnostics PA (NYSE: DGX), McKesson (NYSE: MCK), County of Allegheny, Alorica and Comcast Spotlight (Parent Company: Comcast Cable (NASDAQ: CMCSA)). Outside the top five tenants, no other tenant at the Parkway Center Property accounts for more than 2.7% of the net rentable area.
The largest tenant at the Parkway Center Property, Quest Diagnostics PA (Moody’s: Baa2, S&P: BBB+) has been in occupancy since 1994, has extended and expanded their lease 3 times previously and recently extended their lease by an additional 10 years from 2019 to 2029. As part of their extension, they also signed a lease for an additional 11,162 SF space located on the third story of Building 4, which will bring their total presence at the Parkway Center Property to 136,197 SF across Buildings 4 and 6. They have one 10-year renewal option at the end of their lease term. According to discussions with the tenant the office and lab at the Parkway Center Property serve a radius of more than 250 miles from Syracuse and Buffalo to central and western Pennsylvania with the nearest facility performing similar services located in Horsham, Pennsylvania. This location also has a relationship with the University of Pittsburgh Medical Center, which per the appraisal, is the largest employer in Allegheny County.
The following table presents certain information relating to the tenancy at the Parkway Center Property:
Major Tenants
| Tenant Name | Credit Rating S&P)(1) | Tenant NRSF | % of NRSF | Annual U/W Base Rent PSF(2) | Annual U/W Base Rent(2) | % of Total Annual U/W Base Rent | Lease Expiration Date | |
| Major Tenant(3) | ||||||||
| Quest Diagnostics PA | BBB/Baa2/BBB+ | 136,197 | 23.1% | $10.24 | $1,395,265 | 18.6% | 11/30/2029(4) | |
| McKesson | BBB+/Baa2/BBB+ | 49,413 | 8.4% | $19.00 | $938,847 | 12.5% | 12/31/2022 | |
| County of Allegheny | NR/A1/AA- | 38,853 | 6.6% | $18.18 | $706,459 | 9.4% | 6/30/2032(5) | |
| Alorica | NR/B1/BB- | 38,354 | 6.5% | $11.19 | $429,181 | 5.7% | 10/31/2023(6) | |
| Comcast | A-/A3/A- | 18,476 | 3.1% | $21.32 | $393,845 | 5.3% | 6/30/2022(7) | |
| Total Major Tenants | 281,293 | 47.8% | $13.74 | $3,863,597 | 51.6% | |||
| Non-Major Tenants | 223,829 | 38.0% | $16.21 | $3,627,455 | 48.4% | |||
| Occupied Collateral Total | 505,122 | 85.8% | $14.83 | $7,491,052 | 100.0% | |||
| Vacant Space | 83,791 | 14.2% | ||||||
| Collateral Total | 588,913 | 100.0% | ||||||
| (1) | Certain ratings are those of the parent company whether or not the parent guarantees the lease. |
| (2) | Annual U/W Base Rent PSF and Annual U/W Base Rent include: (a) contractual rent steps through December 2018; and (b) in the case of an investment grade tenant lease that runs through the loan term, the average rent over the remaining term of that lease through the end of the loan term, totaling approximately $184,257 ($118,873 for Quest Diagnostics PA and $65,384 for the County of Allegheny). Underwritten Base Rent does not include rental income for Sprint and Blue Network. |
| (3) | The Quest Diagnostics PA and Alorica leases are NNN. McKesson, County of Allegheny and Comcast are on modified gross lease structures. |
| (4) | Quest Diagnostics PA has two 5 year renewal options. |
| (5) | County of Allegheny has one 10 year renewal option. |
| (6) | Alorica has two 3 year renewal options. Alorica also has a one-time right to terminate its lease effective May 30, 2021 with nine months’ notice and payment of a termination fee equal to unamortized tenant improvements, architectural fees, legal fees and any commissions paid by the landlord, equal to approximately $1,391,115. |
| (7) | Comcast has two, five-year lease renewal options. Comcast has a one-time right to terminate its lease effective July 1, 2020 with nine months’ notice and payment of a termination fee equal to two months’ rent and unamortized leasing costs equal to $1,082,664. Comcast has been a tenant at Parkway Center since 2005. |
THE INFORMATION IN THIS STRUCTURAL AND COLLATERAL TERM SHEET IS NOT COMPLETE AND MAY BE AMENDED PRIOR TO THE TIME OF SALE. THIS TERM SHEET IS NOT AN OFFER TO SELL THESE SECURITIES AND IT IS NOT A SOLICITATION OF AN OFFER TO BUY THESE SECURITIES IN ANY JURISDICTION WHERE THE OFFER OR SALE IS NOT PERMITTED.
51
PARKWAY CENTER |
The following table presents certain information relating to the lease rollover schedule at the Parkway Center Property:
Lease Expiration Schedule(1)(2)
| Year Ending December 31, | No. of Leases Expiring | Expiring NRSF | % of NRSF | Cumulative Expiring NRSF | Cumulative % of Total NRSF | Annual U/W Base Rent | % of Total Annual U/W Base Rent | Annual U/W Base Rent PSF(3) |
| MTM | 0 | 0 | 0.0% | 0 | 0.0% | $0 | 0.0% | $0.00 |
| 2018 | 8 | 32,839 | 5.6% | 32,839 | 5.6% | $341,081 | 4.6% | $10.39 |
| 2019 | 6 | 19,465 | 3.3% | 52,304 | 8.9% | $382,474 | 5.1% | $19.65 |
| 2020 | 8 | 19,419 | 3.3% | 71,723 | 12.2% | $323,232 | 4.3% | $16.65 |
| 2021 | 8 | 34,548 | 5.9% | 106,271 | 18.0% | $705,739 | 9.4% | $20.43 |
| 2022 | 11 | 114,465 | 19.4% | 220,736 | 37.5% | $2,145,523 | 28.6% | $18.74 |
| 2023 | 7 | 72,280 | 12.3% | 293,016 | 49.8% | $1,031,818 | 13.8% | $14.28 |
| 2024 | 2 | 22,326 | 3.8% | 315,342 | 53.5% | $417,460 | 5.6% | $18.70 |
| 2025 | 0 | 0 | 0.0% | 315,342 | 53.5% | $0 | 0.0% | $0.00 |
| 2026 | 1 | 6,895 | 1.2% | 322,237 | 54.7% | $42,000 | 0.6% | $6.09 |
| 2027 | 0 | 0 | 0.0% | 322,237 | 54.7% | $0 | 0.0% | $0.00 |
| 2028 | 0 | 0 | 0.0% | 322,237 | 54.7% | $0 | 0.0% | $0.00 |
| Thereafter | 2 | 182,885 | 31.1% | 505,122 | 85.8% | $2,101,723 | 28.1% | $11.49 |
| Vacant | 0 | 83,791 | 14.2% | 588,913 | 100.0% | $0 | 0.0% | $0.00 |
| Total/Weighted Average | 53 | 588,913 | 100.0% | $7,491,052 | 100.0% | $14.83 |
| (1) | Information obtained from the underwritten rent roll. The rentable conference room, gym space and management office are located in Building 7 totaling 7,835 NRSF and are occupied, but are not on leases. Underwritten Base Rent does not include rental income for Sprint and Blue Network. |
| (2) | Certain tenants may have lease termination options that are exercisable prior to the originally stated expiration date of the subject lease and that are not considered in the Lease Expiration Schedule. |
| (3) | Weighted Average U/W Base Rent PSF excludes vacant space. |
The following table presents historical occupancy percentages at the Parkway Center Property:
Historical Occupancy
5/28/2014(1)(2) | 12/31/2015(1) | 12/31/2016(1) | 12/31/2017(1) | 4/30/2018(3) |
| 71.9% | 64.5% | 72.7% | 86.5% | 85.8% |
| (1) | Information obtained from the Parkway Center Borrower. |
| (2) | Occupancy at acquisition. |
| (3) | Information obtained from the 4/30/2018 rent roll. |
THE INFORMATION IN THIS STRUCTURAL AND COLLATERAL TERM SHEET IS NOT COMPLETE AND MAY BE AMENDED PRIOR TO THE TIME OF SALE. THIS TERM SHEET IS NOT AN OFFER TO SELL THESE SECURITIES AND IT IS NOT A SOLICITATION OF AN OFFER TO BUY THESE SECURITIES IN ANY JURISDICTION WHERE THE OFFER OR SALE IS NOT PERMITTED.
52
PARKWAY CENTER |
Operating History and Underwritten Net Cash Flow. The following table presents certain information relating to the historical operating history and underwritten net cash flow at the Parkway Center Property:
Cash Flow Analysis(1)(2)
| 2015 | 2016 | 2017 | TTM 4/30/2018 | U/W | % of U/W Effective Gross Income | U/W $ per SF | |
| Base Rent | $6,052,101 | $5,964,667 | $6,885,104 | $7,080,716 | $7,491,052(1) | 81.5% | $12.72 |
| Grossed Up Vacant | 0 | 0 | 0 | 0 | 2,415,352 | 26.3 | 4.10 |
| Total Reimbursables | 1,759,057 | 1,836,596 | 1,887,954 | 1,974,642 | 1,611,945 | 17.5 | 2.74 |
| Other Income | 90,870 | 109,749 | 117,775 | 91,027 | 91,027 | 1.0 | 0.15 |
| Less Vacancy & Credit | 0 | 0 | 0 | 0 | (2,415,352) | (26.3) | (4.10) |
| Effective Gross | $7,902,027 | $7,911,012 | $8,890,833 | $9,146,385 | $9,194,024 | 100.0% | $15.61 |
| Total Operating Expenses | $4,720,795 | $4,821,709 | $4,558,824 | $4,564,747 | $4,656,855 | 50.7% | $7.91 |
| Net Operating Income | $3,181,233 | $3,089,303(2) | $4,332,009(2) | $4,581,637 | $4,537,169 | 49.3% | $7.70 |
| TI/LC | 0 | 0 | 0 | 0 | 588,913 | 6.4 | 1.00 |
| Capital Expenditures | 0 | 0 | 0 | 0 | 117,783 | 1.3 | 0.20 |
| Net Cash Flow | $3,181,233 | $3,089,303 | $4,332,009 | $4,581,637 | $3,830,474 | 41.7% | $6.50 |
| NOI DSCR | 1.15x | 1.11x | 1.56x | 1.65x | 1.64x | ||
| NCF DSCR | 1.15x | 1.11x | 1.56x | 1.65x | 1.38x | ||
| NOI DY | 7.5% | 7.3% | 10.2% | 10.8% | 10.7% | ||
| NCF DY | 7.5% | 7.3% | 10.2% | 10.8% | 9.0% |
| (1) | U/W Base Rent includes: (a) contractual rent steps through December 2018; and (b) in the case of an investment grade tenant lease that runs through the loan term, the average rent over the remaining term of that lease through the end of the loan term, totaling approximately $184,257 ($118,873 for Quest Diagnostics PA and 465,384 for County of Allegheny). Underwritten Base Rent does not include rental income for Sprint and Blue Network. |
| (2) | The increase in Net Operating Income from 2016 to 2017 was driven partly by Alorica and County of Allegheny executing leases for 38,354 and 38,853 square feet in June 2016 and June 2017, respectively. This additional leasing accounted for approximately $1,000,000 in base rent. |
Appraisal. As of the appraisal valuation date of March 13, 2018 the Parkway Center Property had an “as-is” appraised value of $66,600,000.
Environmental Matters. According to a Phase I environmental site assessment dated December 18, 2017, there was no evidence of any recognized environmental conditions at the Parkway Center Property. O&M plans have been implemented by the borrower to manage the asbestos containing materials and lead based paints at the property.
Market Overview and Competition.The Parkway Center Property is located in the South Pittsburgh/Route 19 Office submarket of the Pittsburgh market. According to the appraisal, the South Pittsburgh/Route 19 submarket had, as of year end 2017, approximately 4.9 million square feet of office inventory, average asking rents of $18.93 per square foot and a vacancy rate of 6.7%. The fourth quarter 2017 vacancy rate (6.5%) is consistent with last year (6.7%) and substantially lower than the average vacancy over the past ten years (10.7%). According to the appraisal, the historic vacancy trend indicates stable long-term demand for office space in the South Pittsburgh/Route 19 submarket. The most recent vacancy trends demonstrate superior market conditions in comparison to the historic trend and suggest continued stability moving forward. According to the appraisal, the 2017 estimated population within a three-mile radius of the Parkway Center Property was 131,138, while the 2017 estimated median household income within the same radius was $50,774.
THE INFORMATION IN THIS STRUCTURAL AND COLLATERAL TERM SHEET IS NOT COMPLETE AND MAY BE AMENDED PRIOR TO THE TIME OF SALE. THIS TERM SHEET IS NOT AN OFFER TO SELL THESE SECURITIES AND IT IS NOT A SOLICITATION OF AN OFFER TO BUY THESE SECURITIES IN ANY JURISDICTION WHERE THE OFFER OR SALE IS NOT PERMITTED.
53
PARKWAY CENTER |
The following table presents certain information relating to comparable office leases for the Parkway Center Property:
Comparable Leases(1)
| Property Name/Location | Year Built | Occupancy | Distance Subject | Tenant Name | Lease Date/Term | Lease Area (SF) | Annual Base Rent PSF | Lease Type |
Greentree Commons Pittsburgh, PA | 1987 | 84.0% | 0.8 miles | NAV | NAV | 11,825 | $22.00 | MG |
Foster Plaza 9 Pittsburgh, PA | 1989 | 82.1% | 1.3 miles | Stantec | Nov. 2017 / 3Yrs. | 1,852 | $23.50 | MG |
Cherrington Corporate Center 700 Pittsburgh, PA | 1993 | 100.0% | 12.3 miles | Chevron Corporation | July 2015 / 10 Yrs. | 120,000 | $22.50 | FSG |
Parkway Center 11 Pittsburgh, PA | 1989 | 82.9% | 0.0 miles | PA Department of Revenue | Oct. 2017 / 10 Yrs. | 6,112 | $19.50 | MG |
Landmarks Building Pittsburgh, PA | 1900 | 91.9% | 2.0 miles | NAV | Mar. 2017/ 3 Yrs. | 1,536 | $23.00 | MG |
| (1) | Information obtained from the appraisal and third party reports. |
The Borrower.The borrower under the Parkway Center Mortgage Loan is PWC Pitt, LLC (the “Parkway Center Borrower”), a recycled Delaware limited liability company and a special purpose entity with two independent directors. The Parkway Center Borrower is a recycled SPE that purchased the Parkway Center Property in 2014 and 7 months later sold off one building (Building 1) to a single tenant user. A nonrecourse carve-out has been added for any losses suffered in connection with the borrower’s prior ownership of Building 1. Legal counsel to the Parkway Center Borrower delivered a non-consolidation opinion in connection with the origination of the Parkway Center Mortgage Loan. Allan Serviansky, Daniel Warman, Robert Oppenheim and Jeffrey Aeder are the guarantors of certain non-recourse carveouts under the Parkway Center Mortgage Loan.
The Borrower Sponsor. The borrower sponsors and carveout guarantors are Allan Serviansky, Daniel Warman, Robert Oppenheim and Jeffrey Aeder. Collectively Mr. Serviansky, Mr. Warman, Mr. Oppenheim and Mr. Aeder have more than 50 years of real estate experience. Mr. Warman is the founder of Market Street Real Estate Partners, a privately-held real estate investment and management firm headquartered in Miami, Florida. Prior to forming Market Street, Mr. Warman was most recently a senior member of Bayview’s commercial loan acquisition and asset management team. Mr. Oppenheim was head of a specialized group responsible for restructuring non-performing and sub-performing commercial loans and oversaw the property management division. Mr. Oppenheim was also a member of the investment committee for the Bayview Opportunity Fund. Mr. Oppenheim is originally a native of Pittsburgh and earned his Bachelor of Science degree from Carnegie Mellon University. Robbie Oppenheim, Daniel Warman and Allan Serviansky together have ownership interests in 10 properties with a total net rentable area of over 1.17 million SF across the states of Pennsylvania, California, Florida, Texas, Kentucky and Rhode Island. Mr. Aeder co-founded JDI Realty in 1988 and currently serves as Chairman. JDI Realty is a private real estate investment firm.
Escrows.The related loan documents provide for upfront escrows in the amount of $705,609 for real estate taxes, $31,673 for insurance premiums, $9,815 for replacement reserves, $1,616,313 for the Quest leasing reserve for tenant improvements awarded as part of the renewal and expansion of the Quest Diagnostics PA lease, $254,896 for deferred maintenance and $45,530 for a free rent reserve. The loan documents also provide for ongoing monthly escrow deposits of $100,801 for real estate taxes, $10,558 for insurance premiums, $9,815 for replacement reserves, $49,076 for TI/LC reserve and $13,000 for the Quest leasing reserve from months 1 through 77 of the loan term.
Lockbox and Cash Management.The Parkway Center Mortgage Loan is structured with a hard lockbox and springing cash management. All rents and payments (including credit card receivables) are required to be deposited by the Parkway Center Borrower into the applicable lender-controlled lockbox account and swept each business day into the applicable borrower operating account, unless a Trigger Period has occurred and is continuing, in which case such funds are required to be swept each business day into the applicable lender-controlled cash management account and disbursed on each payment date in accordance with the related loan documents. Upon the occurrence and during the continuance of a Trigger Period, all excess cash flow is required to be swept into the applicable cash management account and held by the lender as additional collateral for the Parkway Center Mortgage Loan.
A “Trigger Period” will commence upon the earliest of the following:
| (i) | an event of default under the Parkway Center Mortgage Loan; |
| (ii) | the NCF debt service coverage ratio for the Parkway Center Mortgage Loan being below 1.15x; |
| (iii) | the Parkway Center Borrower, McKesson, County of Allegheny, Alorica, and/or Quest Diagnostics PA become insolvent or petition in bankruptcy has been filed by or against the Parkway Center Borrower and/or Quest Diagnostics PA; |
| (iv) | the property manager has become insolvent or a petition in bankruptcy has been filed by or against the property manager, and the Parkway Center Borrower has not replaced the property manager within thirty (30) days after the earlier of the date of such insolvency or the filing of such bankruptcy; and |
| (v) | McKesson,County of Allegheny, Alorica, and/or Quest Diagnostics PA has (a) ceased all or substantially all of its business operations at its leased premises at the Parkway Center Property for a period in excess of sixty (60) consecutive days (i.e., “goes dark”), (b) fails to cure a default under its lease for more than thirty (30) days, and/or (c) fails to provide notice to renew is lease as required therein. |
THE INFORMATION IN THIS STRUCTURAL AND COLLATERAL TERM SHEET IS NOT COMPLETE AND MAY BE AMENDED PRIOR TO THE TIME OF SALE. THIS TERM SHEET IS NOT AN OFFER TO SELL THESE SECURITIES AND IT IS NOT A SOLICITATION OF AN OFFER TO BUY THESE SECURITIES IN ANY JURISDICTION WHERE THE OFFER OR SALE IS NOT PERMITTED.
54
PARKWAY CENTER |
A “Trigger Period” will end:
| (a) | with regard to clause (i) upon Lender’s written waiver of such event of default; and |
| (b) | with regards to clause (ii) upon the NCF debt service coverage ratio for the Parkway Center Mortgage Loan being equal to or greater than 1.25x for two consecutive calendar quarters. |
Property Management. The Parkway Center Property is managed by MSREP Property Management, LLC, an affiliate of the Parkway Center Borrower.
Assumption. The Parkway Center Borrower has an unlimited right to transfer the Parkway Center Property, provided that certain conditions are satisfied, including, but not limited to: (i) no mortgage loan default or event of default has occurred and is continuing; (ii) the lender’s reasonable determination that the proposed transferee and guarantor satisfy the lender’s credit review and underwriting standards, taking into consideration the transferee’s experience, financial strength and general business standing; (iii) execution of a recourse guaranty and an environmental indemnity by an acceptable replacement guarantor; and (iv) receipt of a rating agency confirmation from the applicable rating agencies.
Partial Release.Following the lockout period, the borrower is permitted to obtain a partial release of any building of the Parkway Center Property (with the exception of Building 7) (the “Parkway Center Release Parcel”) from the lien of the Parkway Center Mortgage Loan subject to certain conditions, including, but not limited to: (i) partial defeasance in an amount equal to the 125.0% of the allocated loan amount for the Parkway Center Release Parcel; (ii) the debt yield of the undefeased portion of the Parkway Center Mortgage Loan based on the remaining portion of the Parkway Center Property is not less than 9.75%; (iii) the debt service coverage ratio of the undefeased portion of the Parkway Center Mortgage Loan based on the remaining portion of the Parkway Center Property is not less than the greater of 1.35x and the debt service coverage ratio as of the notice date and the release date and (iv) the loan-to-value ratio of the undefeased portion of the Parkway Center Mortgage Loan based on the remaining portion of the Parkway Center Property is no greater than the lesser of 70% and the loan-to-value ratio of the Parkway Center Mortgage Loan as of the notice date and the release date.
Real Estate Substitution.Not permitted.
Subordinate and Mezzanine Indebtedness.RCC Real Estate, Inc. funded $4,700,000 of mezzanine debt (the “Parkway Center Mezzanine Loan”). The Parkway Center Mezzanine loan has a 10.0% coupon and pays interest only for the entire term. The Parkway Center Mezzanine loan is coterminous with the Parkway Center Mortgage Loan. Including the Parkway Center Mezzanine Loan, the cumulative cut-off date LTV, cumulative UW NCF DSCR and cumulative UW NCF Debt Yield are 71.0%, 1.18x and 8.1%. The mortgage lenders and mezzanine lenders have entered into an intercreditor agreement. The rights of the lender of the Parkway Center Mezzanine Loan are further described underDescription of the Mortgage Pool – Additional Indebtedness – Mezzanine Indebtedness”in the Preliminary Prospectus.
Ground Lease. Not Applicable
Terrorism Insurance.The Parkway Center Mortgage Loan documents require that the “all risk” insurance policies required to be maintained by the borrower provide coverage for terrorism in an amount equal to the full replacement cost of the Parkway Center Property, or that if the Terrorism Risk Insurance Program Reauthorization Act is no longer in effect and such policies contain an exclusion for acts of terrorism, the borrower will obtain, to the extent available, a stand-alone policy that provides the same coverage as the policies would have if such exclusion did not exist.
THE INFORMATION IN THIS STRUCTURAL AND COLLATERAL TERM SHEET IS NOT COMPLETE AND MAY BE AMENDED PRIOR TO THE TIME OF SALE. THIS TERM SHEET IS NOT AN OFFER TO SELL THESE SECURITIES AND IT IS NOT A SOLICITATION OF AN OFFER TO BUY THESE SECURITIES IN ANY JURISDICTION WHERE THE OFFER OR SALE IS NOT PERMITTED.
55
1801 L STREET |

THE INFORMATION IN THIS STRUCTURAL AND COLLATERAL TERM SHEET IS NOT COMPLETE AND MAY BE AMENDED PRIOR TO THE TIME OF SALE. THIS TERM SHEET IS NOT AN OFFER TO SELL THESE SECURITIES AND IT IS NOT A SOLICITATION OF AN OFFER TO BUY THESE SECURITIES IN ANY JURISDICTION WHERE THE OFFER OR SALE IS NOT PERMITTED.
56
1801 L STREET |

THE INFORMATION IN THIS STRUCTURAL AND COLLATERAL TERM SHEET IS NOT COMPLETE AND MAY BE AMENDED PRIOR TO THE TIME OF SALE. THIS TERM SHEET IS NOT AN OFFER TO SELL THESE SECURITIES AND IT IS NOT A SOLICITATION OF AN OFFER TO BUY THESE SECURITIES IN ANY JURISDICTION WHERE THE OFFER OR SALE IS NOT PERMITTED.
57
| No. 4 – 1801 L Street | |||||||
| Loan Information | Property Information | ||||||
| Mortgage Loan Seller: | Well Fargo Bank, National Association | Single Asset/Portfolio: | Single Asset | ||||
Credit Assessment (DBRS/Fitch/Moody’s): | NR/NR/NR | Property Type: | Multifamily | ||||
| Original Principal Balance: | $38,000,000 | Specific Property Type: | Low Rise | ||||
| Cut-off Date Balance: | $38,000,000 | Location: | Sacramento, CA | ||||
| % of Initial Pool Balance: | 5.8% | Size: | 176 Units | ||||
| Loan Purpose: | Refinance | Cut-off Date Balance Per Unit: | $215,909 | ||||
| Borrower Name: | 1801 L Street Associates, a California Limited Partnership | Year Built/Renovated: | 2007/NAP | ||||
| Borrower Sponsors: | Sotiris K. Kolokotronis; Matina R. Kolokotronis | Title Vesting: | Fee | ||||
| Mortgage Rate: | 4.8450% | Property Manager: | FPI Management, Inc. | ||||
| Note Date: | June 13, 2018 | 4th Most Recent Occupancy(As of)(3): | 95.5% (12/31/2014) | ||||
| Anticipated Repayment Date: | NAP | 3rd Most Recent Occupancy (As of)(3): | 95.7% (12/31/2015) | ||||
| Maturity Date: | July 11, 2028 | 2nd Most Recent Occupancy (As of)(3): | 95.3% (12/31/2016) | ||||
| IO Period: | 120 months | Most Recent Occupancy (As of)(3): | 96.3% (12/31/2017) | ||||
| Loan Term (Original): | 120 months | Current Occupancy (As of)(3): | 94.3% (4/23/2018) | ||||
| Seasoning: | 0 months | ||||||
| Amortization Term (Original): | NAP | Underwriting and Financial Information: | |||||
| Loan Amortization Type: | Interest-only, Balloon | 4th Most Recent NOI (As of): | $2,691,028 (12/31/2015) | ||||
| Interest Accrual Method: | Actual/360 | 3rd Most Recent NOI (As of): | $2,751,164 (12/31/2016) | ||||
| Call Protection: | L(24),D(92),O(4) | 2nd Most Recent NOI (As of): | $2,951,790 (12/31/2017) | ||||
| Lockbox Type: | Springing | Most Recent NOI (As of): | $2,973,148 (TTM 4/30/2018) | ||||
| Additional Debt(1): | Yes | ||||||
| Additional Debt Type(1): | Subordinate | U/W Revenues: | $4,789,700 | ||||
| U/W Expenses: | $1,721,068 | ||||||
| U/W NOI: | $3,068,632 | ||||||
| Escrows and Reserves(2): | U/W NCF: | $3,007,209 | |||||
| U/W NOI DSCR: | 1.64x | ||||||
| Type: | Initial | Monthly | Cap (If Any) | U/W NCF DSCR: | 1.61x | ||
| Taxes | $117,936 | $29,484 | NAP | U/W NOI Debt Yield: | 8.1% | ||
| Insurance | $54,120 | $4,510 | NAP | U/W NCF Debt Yield: | 7.9% | ||
| Deferred Maintenance | $63,232 | $0 | NAP | As-Is Appraised Value: | $60,260,000 | ||
| Replacement Reserves | $0 | $4,216 | NAP | As-Is Appraisal Valuation Date: | April 9, 2018 | ||
| Leasing Reserves | $160,000 | $903 | NAP | Cut-off Date LTV Ratio(1): | 63.1% | ||
| Economic Holdback Reserve | $700,000 | $0 | NAP | LTV Ratio at Maturity or ARD(1): | 63.1% | ||
| (1) | See “Subordinate and Mezzanine Indebtedness” section. All statistical information related to the balance per square foot, loan-to-value (“LTV”) ratios, debt service coverage ratios and debt yields are based solely on the 1801 L Street Mortgage Loan. The Subordinate Agency Loan (as defined below) has a current balance of approximately $6,244,117 and, with accrued interest, is projected to have a total outstanding balance of approximately $8,649,945 at the Maturity Date of the 1801 L Street Mortgage Loan. Assuming full interest deferral (as outlined in the “Subordinate and Mezzanine Indebtedness” section), the Cut-off Date LTV Ratio and LTV Ratio at Maturity based on the 1801 L Street Mortgage Loan and Subordinate Agency Loan are 73.4% and 77.4%, respectively. |
| (2) | See “Escrows” section. |
| (3) | See “Historical Occupancy” section. |
The Mortgage Loan. The 1801 L Street mortgage loan (the “1801 L Street Mortgage Loan”) is evidenced by a single promissory note secured by a first mortgage encumbering the fee interest in a multifamily property located in Sacramento, California (the “1801 L Street Property”). The 1801 L Street Mortgage Loan was originated on June 13, 2018 by Wells Fargo Bank, National Association. The 1801 L Street Mortgage Loan had an original principal balance of $38,000,000, has an outstanding principal balance as of the Cut-off Date of $38,000,000 and accrues interest at an interest rate of 4.845% per annum. The 1801 L Street Mortgage Loan had an initial term of 120 months, has a remaining term of 120 months as of the Cut-off Date and requires interest-only payments through the full term of the 1801 L Street Mortgage Loan. The 1801 L Street Mortgage Loan matures on July 11, 2028.
Following the lockout period, on any date before April 11, 2028, the borrower has the right to defease the 1801 L Street Mortgage Loan in whole, but not in part. The 1801 L Street Mortgage Loan is prepayable without penalty on or after April 11, 2028.
THE INFORMATION IN THIS STRUCTURAL AND COLLATERAL TERM SHEET IS NOT COMPLETE AND MAY BE AMENDED PRIOR TO THE TIME OF SALE. THIS TERM SHEET IS NOT AN OFFER TO SELL THESE SECURITIES AND IT IS NOT A SOLICITATION OF AN OFFER TO BUY THESE SECURITIES IN ANY JURISDICTION WHERE THE OFFER OR SALE IS NOT PERMITTED.
58
1801 L STREET |
Sources and Uses
| Sources | Uses | |||||||
| Original loan amount | $38,000,000 | 100.0% | Refinance | $34,520,353 | 90.8% | |||
| Reserves | 1,095,288 | 2.9 | ||||||
| Closing costs | 785,449 | 2.1 | ||||||
| Return of equity | 1,598,910 | 4.2 | ||||||
| Total Sources | $38,000,000 | 100.0% | Total Uses | $38,000,000 | 100.0% |
The Property. The 1801 L Street Property is a class A, four-story multifamily property located in Sacramento, California. Constructed in 2007 by the borrower sponsor for a total cost of approximately $45.3 million, the 1801 L Street Property comprises 176 unfurnished apartment units and also contains 10,840 square feet of ground floor retail space (11.5% of the underwritten effective gross income). The apartment units include 38 studio units, 97 one-bedroom units, 39 two-bedroom units, and two three-bedroom units. Common area amenities at the 1801 L Street Property include an outdoor swimming pool, spa, fitness center, and storage closets. Unit amenities include wood flooring, in-unit washer/dryer, walk-in closet, balcony, granite countertops, garbage disposal, and stainless steel appliances including an oven/range combination, dishwasher, and refrigerator/freezer. As of April 23, 2018, the multifamily component of the 1801 L Street Property was 94.3% occupied and has averaged 96.1% occupancy since 2014. As of April 23, 2018, the retail space was 71.1% leased by six tenants. There is an executed letter of intent for the remaining 28.9% of the retail net rentable area; however, the lender provides no assurance that such letter of intent will result in a lease being executed.
The 1801 L Street Property contains a secured access parking garage with 160 parking spaces, resulting in a parking ratio of 0.9 spaces per unit. The parking is rented to residents on a monthly basis ($175 per month for an unreserved space or $250 per month for a reserved space) and is also used as hourly and event parking pursuant to an agreement with the City of Sacramento.
In conjunction with a subordinate agency loan from the Housing Authority of the City of Sacramento (see “Subordinate and Mezzanine Indebtedness” section), the 1801 L Street Property is subject to regulatory agreements expiring in 2032 and 2057 with The Redevelopment Agency of the City of Sacramento and the California Tax Credit Allocation Committee. As part of the agreements, the 1801 L Street Property is required to allocate 36 Below-Market-Rate (“BMR”) units to Very Low Income residents (tenants earning less than 50% of the Sacramento Area Median Income (“AMI”)) and 9 BMR units to Moderate Income residents (tenants earning less than 110% of the AMI). The 45 BMR units are 100.0% leased with a waiting list of more than 800 people as of May 31, 2018, according to the property manager. The 1801 L Street Property receives a 20.45% tax exemption so long as 36 BMR units are allocated to Very Low Income residents. Twenty of the BMR units at the 1801 L Street Property are subject to an agreement expiring in 2032, and the remaining 25 BMR units are subject to an agreement expiring in 2057.
The following table presents certain information relating to the unit mix of the 1801 L Street Property:
Unit Mix Summary(1)
| Unit Type | Total No. of Units | % of Total Units | Average Unit Size (SF) | No. of BMR Units | Average Monthly Rent per Unit (Market Rate Units) | Average Monthly Rent per Unit (BMR) |
| Studio / 1 Bathroom | 38 | 21.6% | 459 | 12 | $1,521 | $825(2) |
| 1 Bedroom / 1 Bathroom | 97 | 55.1% | 756 | 24 | $2,083 | $762(3) |
| 2 Bedroom / 2 Bathroom | 39 | 22.2% | 1,057 | 9 | $2,569 | $907(4) |
| 3 Bedroom / 2 Bathroom | 2 | 1.1% | 1,885 | 0 | $4,473 | NAP |
| Total/Weighted Average | 176 | 100.0% | 772 | 45 | $2,126 | $808 |
| (1) | Information obtained from the appraisal and underwritten rent roll. |
| (2) | Eight BMR units are rented at an average rate of $575 per month to Very Low Income tenants, and four BMR units are rented at an average rate of $1,325 to Moderate Income tenants. |
| (3) | 20 BMR units are rented at an average rate of $635 per month to Very Low Income tenants, and four BMR units are rented at an average rate of $1,400 to Moderate Income tenants. |
| (4) | Eight BMR units are rented at an average rate of $793 per month to Very Low Income tenants, and one BMR unit is rented at $1,820 to a Moderate Income tenant. |
The following table presents historical occupancy percentages at the 1801 L Street Property:
Historical Occupancy
12/31/2014(1)(2) | 12/31/2015(1)(2) | 12/31/2016(1)(2) | 12/31/2017(1)(2) | 4/23/2018(2)(3) |
| 95.5% | 95.7% | 95.3% | 96.3% | 94.3% |
| (1) | Information obtained from the borrower. |
| (2) | Occupancy shown above represents the multifamily component of the 1801 L Street Property. Historical occupancy of the retail portion is as follows: 96.5% in 2014; 100.0% in 2015; 99.9% in 2016; and 76.0% in 2017. As of April 23, 2018, the retail component was 71.1% occupied by six tenants. There is an executed letter of intent for the remaining 28.9% of the net rentable area of the retail space; however, the lender provides no assurance that such letter of intent will result in a lease being executed. |
| (3) | Information obtained from the underwritten rent roll. |
THE INFORMATION IN THIS STRUCTURAL AND COLLATERAL TERM SHEET IS NOT COMPLETE AND MAY BE AMENDED PRIOR TO THE TIME OF SALE. THIS TERM SHEET IS NOT AN OFFER TO SELL THESE SECURITIES AND IT IS NOT A SOLICITATION OF AN OFFER TO BUY THESE SECURITIES IN ANY JURISDICTION WHERE THE OFFER OR SALE IS NOT PERMITTED.
59
1801 L STREET |
Operating History and Underwritten Net Cash Flow.The following table presents certain information relating to the historical operating performance and underwritten net cash flow at the 1801 L Street Property:
Cash Flow Analysis
| 2015 | 2016 | 2017 | TTM 4/30/2018 | U/W | % of U/W Effective Gross Income | U/W $ per Unit | |
| Base Rent | $3,067,566 | $3,250,777 | $3,370,316 | $3,415,454 | $3,519,180 | 73.5% | $19,995 |
| Grossed Up Vacant Space | 0 | 0 | 0 | 0 | $105,900 | 2.2 | 602 |
| Retail Income | 559,693 | 399,929 | 460,237 | 466,571 | 549,430(1) | 11.5 | 3,122 |
| Parking Income | 348,415 | 484,489 | 512,133 | 525,080 | 525,080 | 11.0 | 2,983 |
| Other Income(2) | 242,710 | 283,722 | 278,233 | 271,364 | 271,364 | 5.7 | 1,542 |
| Less Vacancy & Credit Loss | 0 | 0 | 0 | 0 | (181,254)(3) | (3.8) | (1,030) |
| Effective Gross Income | $4,218,384 | $4,418,917 | $4,620,919 | $4,678,469 | $4,789,700 | 100.0% | $27,214 |
| Total Operating Expenses | $1,527,355 | $1,667,754 | $1,669,129 | $1,705,321 | $1,721,068 | 35.9% | $9,779 |
|
|
|
|
|
|
| |
| Net Operating Income | $2,691,028 | $2,751,164 | $2,951,790 | $2,973,148 | $3,068,632 | 64.1% | $17,435 |
| Capital Expenditures | 0 | 0 | 0 | 0 | 50,583 | 1.1 | 287 |
| TI/LC | 0 | 0 | 0 | 0 | 10,840 | 0.2 | 62 |
| Net Cash Flow | $2,691,028 | $2,751,164 | $2,951,790 | $2,973,148 | $3,007,209 | 62.8% | $17,086 |
| NOI DSCR | 1.44x | 1.47x | 1.58x | 1.59x | 1.64x | ||
| NCF DSCR | 1.44x | 1.47x | 1.58x | 1.59x | 1.61x | ||
| NOI DY | 7.1% | 7.2% | 7.8% | 7.8% | 8.1% | ||
| NCF DY | 7.1% | 7.2% | 7.8% | 7.8% | 7.9% |
| (1) | U/W Retail Income includes $93,840 of base rent, plus applicable reimbursements, attributed to an executed letter of intent related to the currently vacant retail space totaling 3,128 square feet. The lender provides no assurance that such letter of intent will result in a lease being executed, and the 1801 L Street Mortgage Loan is structured with a $700,000 economic holdback, which the lender is required to apply to pay down the principal balance of the mortgage loan if a lease is not executed on such currently vacant retail space (along with additional conditions fully outlined in the “Escrows” section) by June 1, 2021. Removing credit for the aforementioned letter of intent from the U/W would result in an U/W Net Cash Flow of $2,950,525, which would reflect a NCF DSCR and NCF DY of 1.58x and 7.8%, respectively, based on the $38,000,000 Original Principal Balance of the 1801 L Street Mortgage Loan and a NCF DSCR and NCF DY of 1.61x and 7.9%, respectively, based on the $37,300,000 net-of-holdback principal balance (Original Principal Balance minus the $700,000 economic holdback). |
| (2) | Other income includes laundry, storage, application fees, pet fees, and other revenue. |
| (3) | The underwritten economic vacancy is 5.0%. The multifamily component of the 1801 L Street Property was 94.3% physically occupied and 97.1% economically occupied as of April 23, 2018. |
Appraisal. As of the appraisal valuation date of April 9, 2018, the 1801 L Street Property had an “as-is” appraised value of $60,260,000.
Environmental Matters. According to a Phase I environmental site assessment dated April 19, 2018, there was no evidence of any recognized environmental conditions at the 1801 L Street Property.
Market Overview and Competition.The 1801 L Street Property is located in downtown Sacramento, California, approximately 11.2 miles southeast of the Sacramento International Airport. Sacramento is the capital of the state of California and is located at the nucleus of several major freeways, including U.S. Highway 50, State Highway 99, and Interstates 5 and 80. These freeways provide access to the San Francisco Bay Area to the west, Southern California to the south, Oregon and Washington to the north, and Nevada to the east. The Sacramento metropolitan statistical area (“MSA”) has a population of approximately 2.1 million people and its economy is primarily driven by the government sector, with federal, state and local government being the largest employers in the MSA, followed by the agriculture, education and healthcare industries. Additionally, the inland Port of West Sacramento’s deep water port connecting to San Francisco Bay via a 43-mile channel provides transportation services for goods grown and produced along the farming communities surrounding the MSA.
Approximately 1.1 miles west of the 1801 L Street Property is the Golden 1 Center, home of the Sacramento Kings (the “Kings”) of the National Basketball Association (“NBA”). Matina Kolokotronis, one of the borrower sponsors of the 1801 L Street Mortgage Loan, is the Chief Operating Officer (“COO”) of the Kings and has been involved in the development of Golden 1 Center, as well as its adjacent approximately $500 million mixed-use development project, Downtown Commons. Golden 1 Center opened in September 2016 and is recognized as being a “green” and technologically advanced arena. According to a third party market report, since the opening of Golden 1 Center, 11 Downtown properties with more than 1.3 million square feet of office space have been sold, totaling more than $359 million with additional development projects currently under construction and in the planning stages. In its inaugural year, Golden 1 Center hosted more than 350 events, including 161 ticketed events (43 concerts, 34 family shows, 16 graduations, 25 live sporting events and 43 Kings’ basketball games), as well as hundreds of community and private events. Additionally, the NCAA March Madness tournament returned to Sacramento in 2017 for the first time in 10 years.
According to the appraisal, the estimated 2017 population within a three- and five-mile radius of the 1801 L Street Property was 140,969 and 360,886, respectively; while the estimated average household income within the same radii was $79,399 and $71,173, respectively. According to a third party market report, Sacramento and the greater Northern California region are experiencing an influx of people, primarily from the Bay Area, moving to the region in search of more affordable living. According to a third party market report as of December 2017, more than 17,000 people commute from Sacramento to the Bay Area for work.
THE INFORMATION IN THIS STRUCTURAL AND COLLATERAL TERM SHEET IS NOT COMPLETE AND MAY BE AMENDED PRIOR TO THE TIME OF SALE. THIS TERM SHEET IS NOT AN OFFER TO SELL THESE SECURITIES AND IT IS NOT A SOLICITATION OF AN OFFER TO BUY THESE SECURITIES IN ANY JURISDICTION WHERE THE OFFER OR SALE IS NOT PERMITTED.
60
1801 L STREET |
According to a third party market research report, the 1801 L Street Property is located in the Downtown submarket of the Sacramento multifamily market. As of year-end 2017, the class A submarket reported total inventory of 1,457 multifamily units with a 4.9% vacancy rate and average monthly asking rent of $1,882 with projected rent growth of 4.8% over the next 12 months.
The following table presents certain information relating to comparable multifamily properties for the 1801 L Street Property:
Competitive Set(1)
| 1801 L Street (Subject) | Legado de Ravel Apartments | EVIVA Midtown | Fremont Mews | 16 Powerhouse | 800 J Lofts | Linq Midtown | |
| Location | Sacramento, CA | Sacramento, CA | Sacramento, CA | Sacramento, CA | Sacramento, CA | Sacramento, CA | Sacramento, CA |
| Distance to Subject | -- | 0.5 miles | 0.4 miles | 0.6 miles | 0.5 miles | 0.9 miles | 1.5 miles |
| Property Type | Low Rise | Mid Rise | Mid Rise | Garden | Mid Rise | Mid Rise | Garden |
| Year Built/Renovated | 2007/NAP | 2014/NAP | 2016/NAP | 2006/NAP | 2015/NAP | 2006/NAP | 2010/NAP |
| Number of Units | 176 | 84 | 118 | 70 | 50 | 225 | 275 |
| Average Monthly Rent (per unit) | |||||||
| Studio | $1,521(2) | NAP | $1,900 | $1,762 | NAP | $1,317 | $1,674 |
| 1 Bedroom | $2,083(2) | $1,792 | $2,056 | $2,000 | $2,450 | $2,120 | $1,965 |
| 2 Bedroom | $2,569(2) | $2,378 | $2,970 | $2,399 | $3,694 | $2,633 | $2,324 |
| 3 Bedroom | $4,473(2) | NAP | NAP | NAP | NAP | NAP | NAP |
| Occupancy | 94.3% | 98.8% | 94.9% | 95.7% | 100.0% | 96.0% | 96.4% |
| (1) | Information obtained from the appraisal and underwritten rent roll. |
| (2) | The rents shown represent the market rate units at the 1801 L Street Property. See “Unit Mix Summary” above for information related to the BMR units at the 1801 L Street Property. |
The Borrower.The borrower is 1801 L Street Associates, a California Limited Partnership, a single purpose entity with one independent director. Legal counsel to the borrower delivered a non-consolidation opinion in connection with the origination of the 1801 L Street Mortgage Loan. Sotiris K. Kolokotronis and Matina R. Kolokotronis, each an individual, individually and/or collectively, are the guarantors of certain nonrecourse carveouts under the 1801 L Street Mortgage Loan.
The Borrower Sponsors.The borrower sponsors are Sotiris K. Kolokotronis and Matina R. Kolokotronis, husband and wife and long-time Sacramento residents. Sotiris Kolokotronis is the founder and owner of SKK Developments, a real estate firm that specializes in mixed-use, multi-family and land development projects. Mr. Kolokotronis began his real estate career in 1985 and has been involved in developing more than 7,000 residential home sites, 2,000 single-family homes, 1,500 multi-family units, and 300,000 square feet of commercial buildings in Northern California, Colorado, Nevada, and Oregon that are valued at more than $1.0 billion. Mr. Kolokotronis is currently involved in the development of multiple projects in Sacramento’s urban core valued at approximately $225 million. Mr. Kolokotronis is also involved in the planning and entitlement of approximately 3,000 acres in Sacramento. Mr. Kolokotronis was subjected to a foreclosure in 2010 and personal bankruptcy 2012, which have both been resolved. See“Description of the Mortgage Pool— Loan Purpose; Default History, Bankruptcy Issues and Other Proceedings”in the Preliminary Prospectus.
As previously mentioned, Mrs. Kolokotronis is the COO of the Kings, has worked for the Kings for 21 years, and is the only woman in the NBA to hold the titles of both Chief Operating Officer and President of Business Operations. Mrs. Kolokotronis has been involved in the development of the Kings’ new downtown arena, Golden 1 Center, as well as its adjacent $500 million mixed-use development project, Downtown Commons. Together, Golden 1 Center and Downtown Commons are part of nearly $2.0 billion in investment in downtown Sacramento since 2015.
Escrows.The loan documents provide for upfront reserves of $117,936 for real estate taxes, $54,120 for insurance, $63,232 for immediate repairs, and $160,000 for outstanding tenant improvements and leasing commissions (“TI/LC”). The loan documents also provide for ongoing monthly reserves of $29,484 for real estate taxes, $4,510 for insurance, $4,216 for replacement reserves, and $903 for general TI/LCs.
The 1801 L Street Mortgage Loan is structured with a $700,000 upfront economic holdback. The loan documents require the lender to disburse the economic holdback reserve funds to the borrower if the following conditions are satisfied on or before June 1, 2021: (i) no Cash Trap Event Period (as defined below) then exists; (ii) the net cash flow debt yield is equal to or greater than 7.9%; (iii) the net cash flow debt service coverage ratio (calculated based on a hypothetical 30-year amortization schedule) is equal to or greater than 1.20x; (iv) lender has reasonably determined there have been no material changes that could adversely impact the 1801 L Street Property; and (v) the currently vacant retail space, totaling 3,128 square feet, is leased with such tenant being in occupancy, paying full, unabated rent, with all TI/LCs having been paid. If the preceding conditions are not satisfied as of June 1, 2021, the lender is required to apply the economic holdback reserve funds to pay down the principal balance of the 1801 L Street Mortgage Loan. There is an executed letter of intent for the currently vacant retail space, which is included in the lender’s underwritten net cash flow ($93,840 of annual rent included in Retail Income); however, the lender provides no assurance that such letter of intent will result in a lease being executed.
Lockbox and Cash Management. Upon the occurrence and continuance of a Cash Trap Event Period (as defined below), the 1801 L Street Mortgage Loan requires the borrower to establish a lender-controlled lockbox account and instruct tenants to deposit rents into such lockbox account. All funds in the lockbox account are required to be swept each business day into the cash management account controlled by the lender and disbursed on each payment date in accordance with the loan documents. During a Cash Trap Event Period, all excess funds are required to be swept to an excess cash flow subaccount controlled by the lender.
THE INFORMATION IN THIS STRUCTURAL AND COLLATERAL TERM SHEET IS NOT COMPLETE AND MAY BE AMENDED PRIOR TO THE TIME OF SALE. THIS TERM SHEET IS NOT AN OFFER TO SELL THESE SECURITIES AND IT IS NOT A SOLICITATION OF AN OFFER TO BUY THESE SECURITIES IN ANY JURISDICTION WHERE THE OFFER OR SALE IS NOT PERMITTED.
61
1801 L STREET |
A “Cash Trap Event Period” will commence upon the earlier of the following:
| (i) | the occurrence of an event of default; or |
| (ii) | the net cash flow debt service coverage ratio falling below 1.45x at the end of any calendar quarter. |
A Cash Trap Event Period will end upon the occurrence of the following:
| ● | with regard to clause (i), the cure of such event of default; or |
| ● | with regard to clause (ii), the net cash flow debt service coverage ratio being equal to or greater than 1.55x for two consecutive calendar quarters. |
Property Management. The 1801 L Street Property is managed by FPI Management, Inc. (“FPI”), a privately owned, third party multifamily property manager. FPI manages more than 100,000 units located in 13 states, and its portfolio consists of approximately 60% market rate units and 40% affordable units.
Assumption. The borrower has the two-time right to transfer the 1801 L Street Property, provided that certain conditions are satisfied, including (i) no event of default has occurred and is continuing; (ii) the lender has reasonably determined that the proposed transferee and guarantor satisfy the lender’s credit review and underwriting standards, taking into consideration the transferee’s experience, financial strength and general business standing; and (iii) if required by the lender, rating agency confirmation from DBRS, Fitch and Moody’s that the transfer will not result in a downgrade, withdrawal or qualification of the respective ratings assigned to the Series WFCM 2018-C45 certificates.
Partial Release. Not permitted.
Real Estate Substitution.Not permitted.
Subordinate and Mezzanine Indebtedness.The Housing Authority of the City of Sacramento (the “Subordinate Lender”), as successor to the Redevelopment Agency of the City of Sacramento, funded a $4,750,000 subordinate agency loan (the “Subordinate Agency Loan”) to 1801 L Street Associates in January 2006. The Subordinate Agency Loan is secured by the 1801 L Street Property. The Subordinate Agency Loan accrues interest at a rate of 4.000%per annum, however, payments are deferred, and interest accrues, unless the 1801 L Street Property’s average net operating income (“NOI”) meets or exceeds certain thresholds as tested every five years, on a trailing five-year basis, beginning in 2021. The trailing five-year NOI thresholds in 2021, 2026 and 2031 are $3,409,078, $4,217,573 and $5,210,656, respectively. If the 2021 NOI threshold is met (based on the trailing five-year test period ending December 31, 2020), monthly payments are required in the amount of $24,167 in 2021 through 2025, $43,333 in 2026 through 2030, $78,000 in 2031 through 2035 and $83,799 due on January 1, 2036. If the 2026 NOI threshold is met (based on the trailing five-year test period ending December 31, 2025), monthly payments are required in the amount of $43,333 in 2026 through 2030, $103,583 in 2031 through 2035 and $105,715 due on January 1, 2036. If the 2031 NOI threshold is met (based on the trailing five-year test period ending December 31, 2030), monthly payments are required in the amount of $168,417 in 2031 through 2035, and $174,044 due on January 1, 2036.
As of June 2018, the Subordinate Agency Loan has accrued interest of $1,494,117, bringing the total balance of the Subordinate Agency Loan to approximately $6,244,117. The Subordinate Agency Loan has a maturity date of January 1, 2036. Assuming the NOI threshold is not satisfied in 2021, 2026, or 2031, no payments will be required until the Subordinate Agency Loan matures in 2036, at which point the balance, including principal and accrued interest, would be approximately $10,260,000. If the NOI threshold is not satisfied in 2021 or 2026, the total balance of the Subordinate Agency Loan, including principal and accrued interest, at the maturity date of the 1801 L Street Mortgage Loan in 2028 would be approximately $8,649,945.
The lender of the 1801 L Street Mortgage Loan (the “Senior Lender”) has the right to notice of, and the right to cure, any defaults under the Subordinate Agency Loan agreement. The Subordinate Agency Loan is fully subordinate to the 1801 L Street Mortgage Loan pursuant to the 1801 L Street Subordination Agreement, and a default under the Subordinate Agency Loan agreement is a default under the 1801 L Street Mortgage Loan documents. A foreclosure of the 1801 L Street Mortgage Loan would extinguish the deed of trust securing the Subordinate Agency Loan, and the Senior Lender or any purchaser of the 1801 L Street Mortgage Loan at foreclosure would take the 1801 L Street Property free and clear. In addition, the associated Affordable Housing Agreement will automatically terminate (although Federal law requires the continuation of affordable housing for three years after the termination of the Affordable Housing Agreement).
Ground Lease. None.
Terrorism Insurance.The loan documents require that the “all risk” insurance policies required to be maintained by the borrower provide coverage for terrorism in an amount equal to the full replacement cost of the 1801 L Street Property. The loan documents also require business interruption insurance covering no less than the 18-month period following the occurrence of a casualty event, together with a six-month extended period of indemnity.
Earthquake Insurance. The loan documents do not require earthquake insurance. The seismic report indicated a probable maximum loss for the 1801 L Street Property of 10.0%.
THE INFORMATION IN THIS STRUCTURAL AND COLLATERAL TERM SHEET IS NOT COMPLETE AND MAY BE AMENDED PRIOR TO THE TIME OF SALE. THIS TERM SHEET IS NOT AN OFFER TO SELL THESE SECURITIES AND IT IS NOT A SOLICITATION OF AN OFFER TO BUY THESE SECURITIES IN ANY JURISDICTION WHERE THE OFFER OR SALE IS NOT PERMITTED.
62
(THIS PAGE INTENTIONALLY LEFT BLANK)
THE INFORMATION IN THIS STRUCTURAL AND COLLATERAL TERM SHEET IS NOT COMPLETE AND MAY BE AMENDED PRIOR TO THE TIME OF SALE. THIS TERM SHEET IS NOT AN OFFER TO SELL THESE SECURITIES AND IT IS NOT A SOLICITATION OF AN OFFER TO BUY THESE SECURITIES IN ANY JURISDICTION WHERE THE OFFER OR SALE IS NOT PERMITTED.
63
EXCHANGERIGHT NET LEASED PORTFOLIO #21
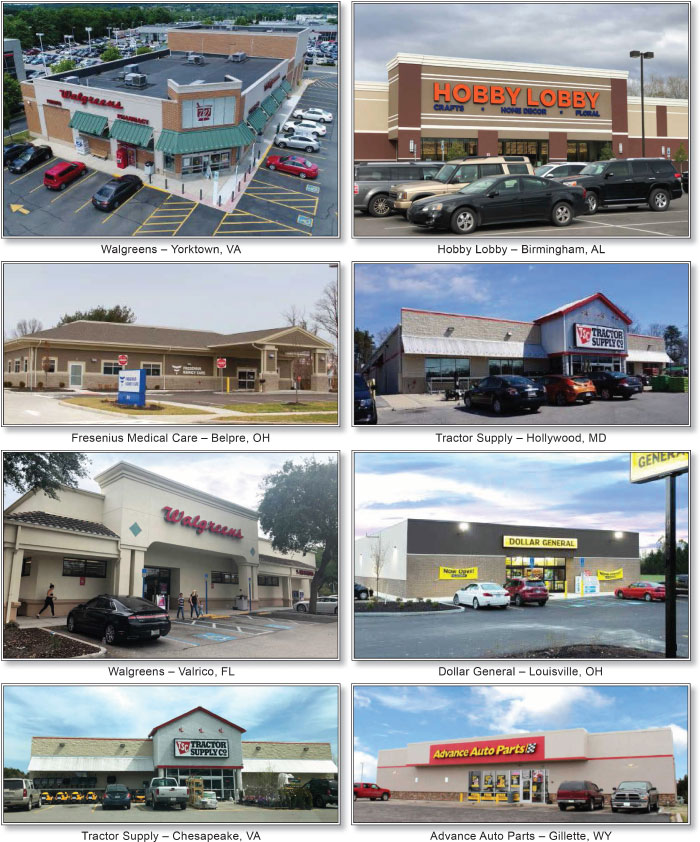
THE INFORMATION IN THIS STRUCTURAL AND COLLATERAL TERM SHEET IS NOT COMPLETE AND MAY BE AMENDED PRIOR TO THE TIME OF SALE. THIS TERM SHEET IS NOT AN OFFER TO SELL THESE SECURITIES AND IT IS NOT A SOLICITATION OF AN OFFER TO BUY THESE SECURITIES IN ANY JURISDICTION WHERE THE OFFER OR SALE IS NOT PERMITTED.
64
EXCHANGERIGHT NET LEASED PORTFOLIO #21
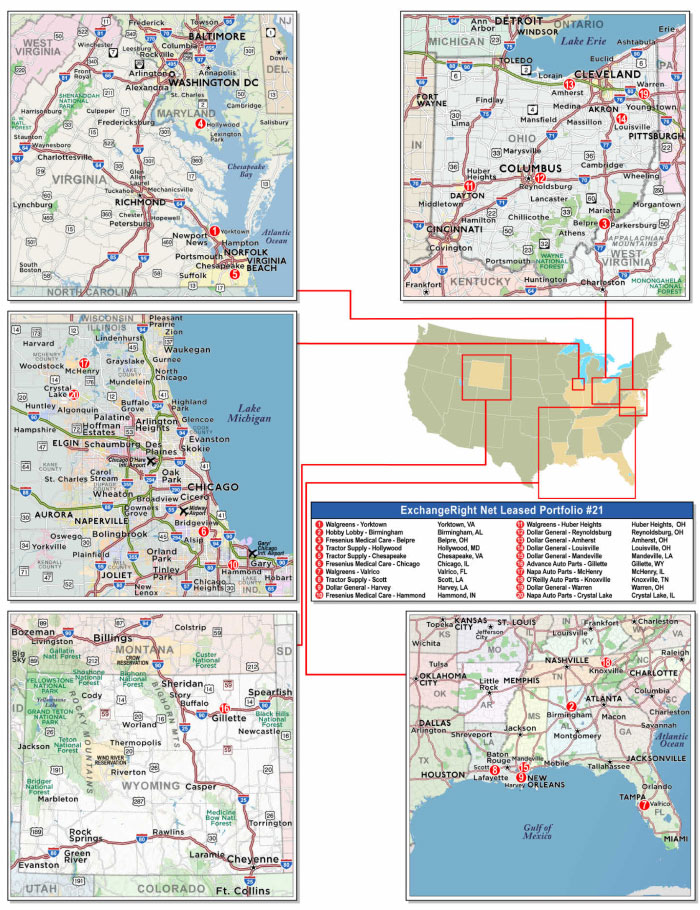
THE INFORMATION IN THIS STRUCTURAL AND COLLATERAL TERM SHEET IS NOT COMPLETE AND MAY BE AMENDED PRIOR TO THE TIME OF SALE. THIS TERM SHEET IS NOT AN OFFER TO SELL THESE SECURITIES AND IT IS NOT A SOLICITATION OF AN OFFER TO BUY THESE SECURITIES IN ANY JURISDICTION WHERE THE OFFER OR SALE IS NOT PERMITTED.
65
| No. 5 – ExchangeRight Net Leased Portfolio #21 | |||||||
| Loan Information | Property Information | ||||||
| Mortgage Loan Seller: | Barclays Bank PLC | Single Asset/Portfolio: | Portfolio | ||||
Credit Assessment (DBRS/Fitch/Moody’s): | NR/NR/NR | Property Type: | Various | ||||
| Original Principal Balance: | $37,795,000 | Specific Property Type: | Various | ||||
| Cut-off Date Balance: | $37,795,000 | Location(3): | Various | ||||
| % of Initial Pool Balance: | 5.7% | Size: | 263,629 SF | ||||
| Loan Purpose: | Acquisition | Cut-off Date Balance Per SF: | $143.36 | ||||
| Borrower Name(1): | ExchangeRight Net Leased Portfolio 21 DST | Year Built/Renovated(3): | Various | ||||
| Borrower Sponsor: | ExchangeRight Real Estate | Title Vesting: | Fee | ||||
| Mortgage Rate: | 4.2700% | Property Manager: | Self-managed | ||||
| Note Date: | April 9, 2018 | 4th Most Recent Occupancy(4): | NAV | ||||
| Anticipated Repayment Date: | NAP | 3rd Most Recent Occupancy(4): | NAV | ||||
| Maturity Date: | April 6, 2028 | 2nd Most Recent Occupancy(4): | NAV | ||||
| IO Period: | 120 months | Most Recent Occupancy(4): | NAV | ||||
| Loan Term (Original): | 120 months | Current Occupancy (As of): | 100.0% (7/1/2018) | ||||
| Seasoning: | 3 months | ||||||
| Amortization Term (Original): | NAP | Underwriting and Financial Information: | |||||
| Loan Amortization Type: | Interest-only, Balloon | ||||||
| Interest Accrual Method: | Actual/360 | 4th Most Recent NOI(5): | NAV | ||||
| Call Protection: | L(27),D(89),O(4) | 3rd Most Recent NOI(5): | NAV | ||||
| Lockbox Type: | Hard/Springing Cash Management | 2nd Most Recent NOI(5): | NAV | ||||
| Additional Debt: | None | Most Recent NOI(5): | NAV | ||||
| Additional Debt Type: | NAP | ||||||
| U/W Revenues: | $4,024,258 | ||||||
| U/W Expenses: | $381,942 | ||||||
| U/W NOI: | $3,642,316 | ||||||
| U/W NCF: | $3,580,000 | ||||||
| Escrows and Reserves(2): | U/W NOI DSCR: | 2.23x | |||||
| U/W NCF DSCR: | 2.19x | ||||||
| Type: | Initial | Monthly | Cap (If Any) | U/W NOI Debt Yield: | 9.6% | ||
| Taxes | $68,033 | $13,633 | NAP | U/W NCF Debt Yield: | 9.5% | ||
| Insurance | $1,728 | $1,728 | NAP | As-Is Appraised Value(6): | $61,230,000 | ||
| Replacement Reserves | $244,457 | $1,409 | NAP | As-Is Appraisal Valuation Date(6): | Various | ||
| TI/LC Reserve | $500,000 | $15,378 | NAP | Cut-off Date LTV Ratio: | 61.7% | ||
| Deferred Maintenance | $52,133 | $0 | NAP | LTV Ratio at Maturity or ARD: | 61.7% | ||
| (1) | See “The Borrower” section. |
| (2) | See “Escrows” section. |
| (3) | See “The Properties” section. |
| (4) | See “Historical Occupancy” section. |
| (5) | See “Cash Flow Analysis” section. Historical cash flows are unavailable as the ExchangeRight Properties (as defined below) were acquired by ExchangeRight (as defined below) between December 2017 and April 2018. According to ExchangeRight, the sellers of the ExchangeRight Properties did not provide historical operating statements to ExchangeRight. |
| (6) | See “Appraisal” section. Each of the ExchangeRight Properties was valued individually. The appraisals are dated from January 22, 2018 to March 23, 2018. |
The Mortgage Loan. The mortgage loan (the “ExchangeRight Mortgage Loan”) is evidenced by a single promissory note that is secured by a first mortgage encumbering 20 cross-collateralized, triple-net leased, retail and medical office properties located in 10 states (the “ExchangeRight Properties”). The ExchangeRight Mortgage Loan was originated on April 9, 2018 by Barclays Bank PLC. The ExchangeRight Mortgage Loan had an original principal balance of $37,795,000, has an outstanding principal balance as of the Cut-off Date of $37,795,000 and accrues interest at an interest rate of 4.2700%per annum. The ExchangeRight Mortgage Loan had an initial term of 120 months, has a remaining term of 117 months as of the Cut-off Date and requires interest-only payments through its term. The ExchangeRight Mortgage Loan matures on April 6, 2028.
Following the lockout period, the borrower has the right to defease the ExchangeRight Mortgage Loan in whole, but not in part, on any date before January 6, 2028. The ExchangeRight Mortgage Loan is prepayable without penalty on or after January 6, 2028.
THE INFORMATION IN THIS STRUCTURAL AND COLLATERAL TERM SHEET IS NOT COMPLETE AND MAY BE AMENDED PRIOR TO THE TIME OF SALE. THIS TERM SHEET IS NOT AN OFFER TO SELL THESE SECURITIES AND IT IS NOT A SOLICITATION OF AN OFFER TO BUY THESE SECURITIES IN ANY JURISDICTION WHERE THE OFFER OR SALE IS NOT PERMITTED.
66
EXCHANGERIGHT NET LEASED PORTFOLIO #21
Sources and Uses
| Sources | Uses | |||||||
| Original loan amount | $37,795,000 | 60.3% | Purchase price | $61,022,845 | 97.4% | |||
| Sponsor’s new cash contribution | 24,853,186 | 39.7 | Reserves | 866,351 | 1.4 | |||
| Closing costs | 758,990 | 1.2 | ||||||
| Total Sources | $62,648,186 | 100.0% | Total Uses | $62,648,186 | 100.0% |
The Properties. The ExchangeRight Properties are comprised of 17 retail and 3 medical office properties totaling 263,629 square feet located in 10 states. The largest geographical concentrations by state include Ohio (six properties, 22.5% of the allocated Cut-Off date balance), Virginia (two properties, 18.6% of the allocated Cut-Off date balance) and Louisiana (three properties, 12.9% of the allocated Cut-Off date balance). Built between 1992 and 2018, the ExchangeRight Properties range in size from 6,500 square feet to 55,000 square feet. As of July 1, 2018, the ExchangeRight Properties were 100.0% occupied.
The ExchangeRight Properties include nationally recognized credit-tenants, such as Dollar General (rated Baa2/BBB by Moody’s/S&P), Walgreens (rated BBB/Baa2/BBB by Fitch/Moody’s/S&P), Fresenius Medical Care (rated BBB-/Baa3/BBB- by Fitch/Moody’s/S&P), Advance Auto Parts (rated Baa2/BBB- by Moody’s/S&P) and O’Reilly Auto Parts (rated Baa1/BBB by Moody’s/S&P). Credit rated tenants occupy 14 of the 20 properties representing 62.6% of underwritten base rent (leases are directly with rated entities or are guaranteed by such entities, with the exception of O’Reilly Auto Parts). The ExchangeRight Properties have a weighted average remaining initial lease term of approximately 13.1 years. If the fully extended lease maturity dates are used, the weighted average remaining lease term is approximately 34.7 years. Leases representing approximately 86.4% of the net rentable area and 85.4% of the underwritten base rent expire after the ExchangeRight Mortgage Loan maturity date. No individual property accounts for more than 11.4% of the underwritten base rent of the ExchangeRight Properties. The largest property, Hobby Lobby – Birmingham, comprises approximately 55,000 square feet (20.9% of the total net rentable area) and $440,000 of the underwritten base rent (11.4% of underwritten base rent). Excluding Hobby Lobby – Birmingham, no individual property accounts for more than 10.1% of the underwritten base rent.
The following table presents certain information relating to the ExchangeRight Properties:
| Tenant Name | City, State | Allocated Cut-off Date Balance | % of Portfolio Cut-off Date Balance | Occupancy | Year Built/ Renovated | Net Rentable Area (SF) | Lease Expiration | Appraised Value(1) | |||
| Walgreens | Yorktown, VA | $4,150,000 | 11.0% | 100.0% | 2007/NAP | 14,739 | 5/31/2033 | $6,330,000 | |||
| Hobby Lobby | Birmingham, AL | $4,000,000 | 10.6% | 100.0% | 2017/NAP | 55,000 | 4/30/2032 | $7,325,000 | |||
| Fresenius Medical Care | Belpre, OH | $3,130,000 | 8.3% | 100.0% | 2017/NAP | 7,516 | 11/30/2032 | $4,550,000 | |||
| Tractor Supply | Chesapeake, VA | $2,875,000 | 7.6% | 100.0% | 2012/NAP | 19,097 | 4/30/2028 | $4,475,000 | |||
| Tractor Supply | Hollywood, MD | $2,875,000 | 7.6% | 100.0% | 2013/NAP | 20,097 | 3/1/2028 | $4,800,000 | |||
| Fresenius Medical Care | Chicago, IL | $2,800,000 | 7.4% | 100.0% | 2017/NAP | 9,396 | 12/31/2032 | $4,400,000 | |||
| Walgreens | Valrico, FL | $2,700,000 | 7.1% | 100.0% | 1997/NAP | 15,930 | 11/30/2029 | $4,350,000 | |||
| Tractor Supply | Scott, LA | $2,265,000 | 6.0% | 100.0% | 2017/NAP | 19,097 | 10/20/2032 | $3,850,000 | |||
| Dollar General | Harvey, LA | $1,640,286 | 4.3% | 100.0% | 2013/NAP | 12,406 | 4/30/2028 | $2,630,000 | |||
| Fresenius Medical Care | Hammond, IN | $1,550,000 | 4.1% | 100.0% | 2008/NAP | 6,834 | 9/30/2027 | $2,350,000 | |||
| Walgreens | Huber Heights, OH | $1,479,420 | 3.9% | 100.0% | 1998/NAP | 13,905 | 6/30/2028 | $2,390,000 | |||
| Dollar General | Reynoldsburg, OH | $1,050,000 | 2.8% | 100.0% | 2017/NAP | 7,489 | 1/31/2033 | $1,510,000 | |||
| Dollar General | Amherst, OH | $1,034,007 | 2.7% | 100.0% | 2017/NAP | 9,026 | 1/31/2033 | $1,510,000 | |||
| Dollar General | Louisville, OH | $1,000,000 | 2.6% | 100.0% | 2017/NAP | 9,026 | 11/30/2032 | $1,480,000 | |||
| Dollar General | Mandeville, LA | $980,000 | 2.6% | 100.0% | 2012/NAP | 9,026 | 9/30/2027 | $1,500,000 | |||
| Advance Auto Parts | Gillette, WY | $929,781 | 2.5% | 100.0% | 1998/2017 | 7,000 | 5/31/2032 | $2,100,000 | |||
| Napa Auto Parts | McHenry, IL | $925,000 | 2.4% | 100.0% | 2006/NAP | 7,000 | 4/5/2038 | $1,470,000 | |||
| O’Reilly Auto Parts | Knoxville, TN | $900,000 | 2.4% | 100.0% | 1997/NAP | 6,500 | 4/14/2028 | $1,450,000 | |||
| Dollar General | Warren, OH | $796,680 | 2.1% | 100.0% | 2018/NAP | 7,545 | 1/31/2033 | $1,290,000 | |||
| Napa Auto Parts | Crystal Lake, IL | $714,825 | 1.9% | 100.0% | 1992/NAP | 7,000 | 4/5/2038 | $1,470,000 | |||
| Total/Weighted Average | $37,795,000 | 100.0% | 100.0% | 263,629 | $61,230,000 | ||||||
| (1) | In addition, each appraisal provides a “go-dark” value for the related property. The ExchangeRight Properties have an aggregate “go-dark” value of $36,160,000. |
THE INFORMATION IN THIS STRUCTURAL AND COLLATERAL TERM SHEET IS NOT COMPLETE AND MAY BE AMENDED PRIOR TO THE TIME OF SALE. THIS TERM SHEET IS NOT AN OFFER TO SELL THESE SECURITIES AND IT IS NOT A SOLICITATION OF AN OFFER TO BUY THESE SECURITIES IN ANY JURISDICTION WHERE THE OFFER OR SALE IS NOT PERMITTED.
67
EXCHANGERIGHT NET LEASED PORTFOLIO #21
The following table presents certain information relating to the tenancies at the ExchangeRight Properties:
Major Tenants
| Tenant Name | Credit Rating (Fitch/Moody’s/ S&P)(1) | Number of Properties | Tenant NRSF | % of NRSF | Annual U/W Base Rent PSF | Annual U/W Base Rent | % of Total Annual U/W Base Rent | Lease Expiration Date |
| Major Tenants | ||||||||
| Tractor Supply | NR/NR/NR | 3 | 58,291 | 22.1% | $13.92 | $811,271 | 21.1% | Various(2) |
| Hobby Lobby | NR/NR/NR | 1 | 55,000 | 20.9% | $8.00 | $440,000 | 11.4% | 4/30/2032(3) |
| Dollar General | NR/Baa2/BBB | 6 | 54,518 | 20.7% | $12.01 | $654,518 | 17.0% | Various(4) |
| Walgreens | BBB/Baa2/BBB | 3 | 44,574 | 16.9% | $18.13 | $807,955 | 21.0% | Various(5) |
| Fresenius Medical Care | BBB-/Baa3/BBB- | 3 | 23,746 | 9.0% | $30.08 | $714,362 | 18.5% | Various(6) |
| Napa Auto Parts | NR/NR/NR | 2 | 14,000 | 5.3% | $13.63 | $190,800 | 5.0% | 4/5/2038(7) |
| Advance Auto Parts | NR/Baa2/BBB- | 1 | 7,000 | 2.7% | $18.89 | $132,250 | 3.4% | 5/31/2032(8) |
| O’Reilly Auto Parts | NR/Baa1/BBB | 1 | 6,500 | 2.5% | $15.56 | $101,129 | 2.6% | 4/14/2028(9) |
| Occupied Collateral Total | 20 | 263,629 | 100.0% | $14.61 | $3,852,285 | 100.0% | ||
| Vacant Space | 0 | 0.0% | ||||||
| Collateral Total | 263,629 | 100.0% | ||||||
| (1) | Certain ratings are those of the parent company whether or not the parent guarantees the lease. |
| (2) | Tractor Supply is a tenant at three of the ExchangeRight Properties and leases 20,097 square feet at the Tractor Supply - Hollywood property under a lease that expires on March 1, 2028 and has four, five-year renewal options; 19,097 square feet at the Tractor Supply - Chesapeake property under a lease that expires on April 30, 2028 and has four, five-year renewal options and 19,097 square feet at the Tractor Supply - Scott property under a lease that expires on October 20, 2032 and has four, five-year renewal options. |
| (3) | Hobby Lobby has three, five-year renewal options. |
| (4) | Dollar General is a tenant at six of the ExchangeRight Properties and leases 12,406 square feet at the Dollar General - Harvey property under a lease that expires on April 30, 2028 and has four, five-year renewal options; 9,026 square feet at the Dollar General – Amherst property under a lease that expires on January 31, 2033 and has four, five-year renewal options; 9,026 square feet at the Dollar General – Louisville property under a lease that expires on November 30, 2032 and has four, five-year renewal options; 9,026 square feet at the Dollar General – Mandeville property under a lease that expires on September 30, 2027 and has three, five-year renewal options; 7,545 square feet at the Dollar General – Warren property under a lease that expires on January 31, 2033 and has four, five-year renewal options and 7,489 square feet at the Dollar General - Reynoldsburg property under a lease that expires on January 31, 2033 and has four, five-year renewal options. |
| (5) | Walgreens is a tenant at three of the ExchangeRight Properties and leases 15,930 square feet at the Walgreens – Valrico property under a lease that expires on November 30, 2029 and has seven, five-year renewal options; 14,739 square feet at the Walgreens - Yorktown property under a lease that expires on May 31, 2033 and has eight, five-year renewal options and 13,905 square feet at the Walgreens – Huber Heights property under a lease that expires on June 30, 2028 and has seven, five-year renewal options. |
| (6) | Fresenius Medical Care is a tenant at three of the ExchangeRight Properties and leases 9,396 square feet at the Fresenius Medical Care - Chicago property under a lease that expires on December 31, 2032 and has three, five-year renewal options; 7,516 square feet at the Fresenius Medical Care – Belpre property under a lease that expires on November 30, 2032 and has three, five-year renewal options and 6,834 square feet at the Fresenius Medical Care - Hammond property under a lease that expires on September 30, 2027 and has two, five-year renewal options. |
| (7) | Napa Auto Parts has four, five-year renewal options under each of the Napa Auto Parts – Crystal Lake property lease and the Napa Auto Parts – McHenry property lease. |
| (8) | Advance Auto Parts has three, five-year renewal options. |
| (9) | O’Reilly Auto Parts has two, five-year renewal options. |
THE INFORMATION IN THIS STRUCTURAL AND COLLATERAL TERM SHEET IS NOT COMPLETE AND MAY BE AMENDED PRIOR TO THE TIME OF SALE. THIS TERM SHEET IS NOT AN OFFER TO SELL THESE SECURITIES AND IT IS NOT A SOLICITATION OF AN OFFER TO BUY THESE SECURITIES IN ANY JURISDICTION WHERE THE OFFER OR SALE IS NOT PERMITTED.
68
EXCHANGERIGHT NET LEASED PORTFOLIO #21
The following table presents certain information relating to the lease rollover schedule at the ExchangeRight Properties:
Lease Expiration Schedule(1)
| Year Ending December 31, | No. of Leases Expiring | Expiring NRSF | % of Total NRSF | Cumulative Expiring NRSF | Cumulative % of Total NRSF | Annual U/W Base Rent | % of Total Annual U/W Base Rent | Annual U/W Base Rent PSF |
| MTM | 0 | 0 | 0.0% | 0 | 0.0% | $0 | 0.0% | $0.00 |
| 2018 | 0 | 0 | 0.0% | 0 | 0.0% | $0 | 0.0% | $0.00 |
| 2019 | 0 | 0 | 0.0% | 0 | 0.0% | $0 | 0.0% | $0.00 |
| 2020 | 0 | 0 | 0.0% | 0 | 0.0% | $0 | 0.0% | $0.00 |
| 2021 | 0 | 0 | 0.0% | 0 | 0.0% | $0 | 0.0% | $0.00 |
| 2022 | 0 | 0 | 0.0% | 0 | 0.0% | $0 | 0.0% | $0.00 |
| 2023 | 0 | 0 | 0.0% | 0 | 0.0% | $0 | 0.0% | $0.00 |
| 2024 | 0 | 0 | 0.0% | 0 | 0.0% | $0 | 0.0% | $0.00 |
| 2025 | 0 | 0 | 0.0% | 0 | 0.0% | $0 | 0.0% | $0.00 |
| 2026 | 0 | 0 | 0.0% | 0 | 0.0% | $0 | 0.0% | $0.00 |
| 2027 | 2 | 15,860 | 6.0% | 15,860 | 6.0% | $268,646 | 7.0% | $16.94 |
| 2028 | 5 | 72,005 | 27.3% | 87,865 | 33.3% | $1,006,393 | 26.1% | $13.98 |
| Thereafter | 13 | 175,764 | 66.7% | 263,629 | 100.0% | $2,577,246 | 66.9% | $14.66 |
| Vacant | 0 | 0 | 0.0% | 263,629 | 100.0% | $0 | 0.0% | $0.00 |
| Total/Weighted Average | 20 | 263,629 | 100.0% | $3,852,285 | 100.0% | $14.61 |
| (1) | Information obtained from the underwritten rent roll. |
The following table presents historical occupancy percentages at the ExchangeRight Properties:
Historical Occupancy
12/31/2014(1) | 12/31/2015(1) | 12/31/2016(1) | 12/31/2017(1) | 7/1/2018(2) |
| NAV | NAV | NAV | NAV | 100.0% |
| (1) | The ExchangeRight Properties were acquired by ExchangeRight between December 2017 and April 2018. According to ExchangeRight, the sellers of the ExchangeRight Properties did not provide historical operating statements to ExchangeRight. |
| (2) | Information obtained from the underwritten rent roll. |
THE INFORMATION IN THIS STRUCTURAL AND COLLATERAL TERM SHEET IS NOT COMPLETE AND MAY BE AMENDED PRIOR TO THE TIME OF SALE. THIS TERM SHEET IS NOT AN OFFER TO SELL THESE SECURITIES AND IT IS NOT A SOLICITATION OF AN OFFER TO BUY THESE SECURITIES IN ANY JURISDICTION WHERE THE OFFER OR SALE IS NOT PERMITTED.
69
EXCHANGERIGHT NET LEASED PORTFOLIO #21
Operating History and Underwritten Net Cash Flow. The following table presents certain information relating to the underwritten net cash flow at the ExchangeRight Properties:
Cash Flow Analysis(1)
| U/W | % of U/W Effective Gross Income | U/W $/SF | ||||
| Base Rent(2) | $3,852,285 | 95.7% | $14.61 | |||
| Grossed Up Vacant Space | 0 | 0.0 | 0.00 | |||
| Total Reimbursables(3) | 273,397 | 6.8 | 1.04 | |||
| Other Income(4) | 14,000 | 0.3 | 0.05 | |||
| Less Vacancy(5) | (115,424) | (2.9) | (0.44) | |||
| Effective Gross Income | $4,024,258 | 100.0% | $15.26 | |||
| Total Operating Expenses | $381,942 | 9.5% | $1.45 | |||
| Net Operating Income | $3,642,316 | 90.5% | $13.82 | |||
| TI/LC(6) | 51,210 | 1.3 | 0.19 | |||
| Replacement Reserves(7) | 11,107 | 0.3 | 0.04 | |||
| Net Cash Flow | $ 3,580,000 | 89.0% | $13.58 | |||
| NOI DSCR | 2.23x | |||||
| NCF DSCR | 2.19x | |||||
| NOI DY | 9.6% | |||||
| NCF DY | 9.5% | |||||
| (1) | According to ExchangeRight, the sellers of the ExchangeRight Properties did not provide historical operating statements to ExchangeRight. |
| (2) | U/W Base Rent is inclusive of $42,028 of straight-line rent for Fresenius Medical Care - Chicago, Fresenius Medical Care - Hammond, Fresenius Medical Care - Belpre, Dollar General - Mandeville and O’Reilly Auto Parts – Knoxville and $7,664 of rent steps schedule to occur by October 2018. |
| (3) | Total Reimburseables are underwritten based on tenant leases and discussions with ExchangeRight. There are no reimbursements at ten of the properties as the tenants pay for their respective property expenses directly. The remaining ten tenants reimburse either property taxes, insurance or operating expenses or some combination of the three. |
| (4) | Other Income consists of billboard income for the Fresenius Medical Care – Chicago property. |
| (5) | The underwritten economic vacancy is 5.0% at the property level except for nine properties which are underwritten to a 0.0% economic vacancy. The nine properties are 100.0% occupied by investment grade tenants with at least 11 years remaining on the initial lease term and a fully extended expiration date of 2042 or later. The overall underwritten blended economic vacancy is 2.8%. The ExchangeRight Properties are 100.0% physically occupied as of July 1, 2018. |
| (6) | U/W TI/LC is inclusive of a straight-line credit for the upfront TI/LC Reserve equal to $50,000, which is 10.0% of the upfront TI/LC Reserve of $500,000. |
| (7) | U/W Replacement Reserves is inclusive of a straight-line credit equal to $24,446, which is 10.0% of the upfront Replacement Reserves of $244,457. |
Appraisal.The ExchangeRight Properties were valued individually, with the individual values reflecting a cumulative “as-is” appraised value of $61,230,000. The appraisals are dated from January 22, 2018 to March 23, 2018. Additionally, each appraisal provided a corresponding “go-dark” value which equates to a cumulative “go-dark” appraised value of $36,160,000 for the ExchangeRight Properties.
Environmental Matters. According to the Phase I environmental site assessments, dated from January 10, 2018 to March 28, 2018, there were no recognized environmental conditions at any of the ExchangeRight Properties.
The Borrower. The borrower is ExchangeRight Net Leased Portfolio 21 DST, a Delaware Statutory Trust (the “ExchangeRight Borrower”). At loan origination, the ExchangeRight Properties were conveyed and assumed from ExchangeRight Net Leased Portfolio 21, LLC to and by the ExchangeRight Borrower. The ExchangeRight Borrower has master leased the ExchangeRight Properties to a master lessee affiliated with the sponsors. The master lessee is structured as a special purpose entity. The master lessee’s interest in all tenant rents are assigned to the ExchangeRight Borrower, which in turn assigned its interest to the lender. The lender has the ability to cause the ExchangeRight Borrower to terminate the master lease. The sponsors have a 100% ownership interest in the master lessee. The master lease is subordinate to the ExchangeRight Mortgage Loan. There is one independent director for the borrowing entity and one independent director for the master lessee. Legal counsel to the ExchangeRight Borrower delivered a non-consolidation opinion in connection with the origination of the ExchangeRight Mortgage Loan. David Fisher, Joshua Ungerecht and Warren Thomas, all of whom are managing members of ExchangeRight Real Estate, LLC, are the guarantors of certain nonrecourse carveouts under the ExchangeRight Mortgage Loan. See“Description of the Mortgage Pool—Mortgage Pool Characteristics—Delaware Statutory Trusts” in the Preliminary Prospectus.
The Borrower Sponsor.The borrower sponsor is ExchangeRight Real Estate (“ExchangeRight”). ExchangeRight has more than $1.1 billion of assets and more than 10 million square feet under management. ExchangeRight has more than 400 investment-grade retail and class B/B+ multifamily properties located across 28 states. Warren Thomas was involved in a foreclosure in 2013 unrelated to the ExchangeRight Properties.See “Description of the Mortgage Pool—Loan Purpose; Default History, Bankruptcy Issues and Other Proceedings” in the Preliminary Prospectus.
THE INFORMATION IN THIS STRUCTURAL AND COLLATERAL TERM SHEET IS NOT COMPLETE AND MAY BE AMENDED PRIOR TO THE TIME OF SALE. THIS TERM SHEET IS NOT AN OFFER TO SELL THESE SECURITIES AND IT IS NOT A SOLICITATION OF AN OFFER TO BUY THESE SECURITIES IN ANY JURISDICTION WHERE THE OFFER OR SALE IS NOT PERMITTED.
70
EXCHANGERIGHT NET LEASED PORTFOLIO #21
Escrows.The ExchangeRight Mortgage Loan documents provide for upfront reserves in the amount of $500,000 for future TI/LC reserves, $244,457 for replacement reserves, $68,033 for real estate taxes, $52,133 for deferred maintenance, and $1,728 for insurance reserves.
The ExchangeRight Mortgage Loan documents require monthly deposits for (a) real estate taxes in an amount equal to one-twelfth of an amount which would be sufficient to pay the taxes payable during the next ensuing twelve months, initially $13,633, (b) TI/LC reserves in an amount equal to $15,378, (c) insurance premiums in an amount equal to one-twelfth of an amount which would be sufficient to pay the insurance premiums payable during the next ensuing twelve months, initially $1,728 and (d) replacement reserves in an amount equal to $1,409. The ExchangeRight Borrower will not be required to make monthly deposits for real estate taxes for any of the individual ExchangeRight Properties provided (i) no Cash Sweep Event (as defined below) has occurred and is continuing, (ii) no default exists under the applicable lease of the tenant at such individual property, (iii) the tenant under such lease remains liable for paying all taxes directly to the applicable taxing authorities and (iv) the ExchangeRight Borrower has provided written evidence that all such taxes for such individual property have been paid in full at least 15 days prior to the due date of such taxes.
Lockbox and Cash Management.The ExchangeRight Mortgage Loan is structured with a hard lockbox and springing cash management. The ExchangeRight Borrower was required at origination to deliver letters to the tenants at the ExchangeRight Properties directing them to pay all rents directly into a lender-controlled lockbox account. Additionally, all revenues and other monies received by the ExchangeRight Borrower or property manager relating to the ExchangeRight Properties are required to be deposited into the lockbox account within two business days upon receipt. During the occurrence and continuance of a Cash Sweep Event (as defined below), all funds are required to be swept each business day into the cash management account controlled by the lender and disbursed on each payment date in accordance with the ExchangeRight Mortgage Loan documents, with all excess cash flow to be held as additional security for the ExchangeRight Mortgage Loan.
A “Cash Sweep Event” will occur:
| (i) | upon the occurrence and continuance of an event of default; |
| (ii) | upon the net operating income (as defined in the ExchangeRight Mortgage Loan documents) debt service coverage ratio being less than 1.45x; or |
| (iii) | on the date that is 36 months prior to the maturity date. |
A “Cash Sweep Event” will end upon the earlier of the following:
| (a) | the payment date next occurring following: |
| (x) | with regard to clause (i) above, the cure of such event of default; |
| (y) | with regard to clause (ii) above, the net operating income flow debt service coverage ratio being equal to or greater than 1.45x for any two consecutive calendar quarters; or |
| (z) | with regard to clause (iii) above, the occurrence of a qualified transfer under the ExchangeRight Mortgage Loan documents, provided that the approved transferee: (a) must maintain a minimum net worth of at least $200,000,000 and total assets of at least $400,000,000, (b) must execute and deliver a full recourse guaranty guaranteeing payment of the entire amount of the debt, (c) must at all times own no less than 100% of the legal and beneficial ownership interests in the ExchangeRight Borrower, (d) must not be a Delaware statutory trust and (e) will cause the ExchangeRight Borrower to convert to a limited liability company. |
| (b) | The payment in full of all principal and interest on the ExchangeRight Mortgage Loan and all other amounts payable under the ExchangeRight Mortgage Loan documents. |
Property Management. The ExchangeRight Properties are managed by an affiliate of the ExchangeRight Borrower.
Assumption. The ExchangeRight Borrower has the right to transfer all of the ExchangeRight Properties provided that certain conditions are satisfied, including: (i) no event of default has occurred and is continuing, (ii) the ExchangeRight Borrower has provided the lender with at least 60 days prior written notice, (iii) the proposed transferee qualifies as a qualified transferee under the ExchangeRight Mortgage Loan documents, (iv) the delivery of a REMIC opinion, an insolvency opinion and other opinions required by the lender, (v) the lender has received confirmation from DBRS, Fitch and Moody’s that such assumption will not result in a downgrade of the respective ratings assigned to the WFCM 2018-C45 certificates and (vi) other conditions set forth in the ExchangeRight Mortgage Loan documents.
Partial Release.Not permitted.
Real Estate Substitution.Not permitted.
Subordinate and Mezzanine Indebtedness.Not permitted.
Ground Lease.None.
Right of First Refusal / Offer. Four tenants have rights of first refusal and one tenant has a right of first offer. See “Description of the Mortgage Pool— Purchase Options and Rights of First Refusal” in the Preliminary Prospectus.
Terrorism Insurance.The ExchangeRight Mortgage Loan documents require that the “all risk” insurance policy required to be maintained by the ExchangeRight Borrower provide coverage for terrorism in an amount equal to 100% of the full replacement cost of the ExchangeRight Properties. The ExchangeRight Mortgage Loan documents also require business interruption insurance covering no less than the 18-month period following the occurrence of a casualty event, together with a three-month extended period of indemnity.
THE INFORMATION IN THIS STRUCTURAL AND COLLATERAL TERM SHEET IS NOT COMPLETE AND MAY BE AMENDED PRIOR TO THE TIME OF SALE. THIS TERM SHEET IS NOT AN OFFER TO SELL THESE SECURITIES AND IT IS NOT A SOLICITATION OF AN OFFER TO BUY THESE SECURITIES IN ANY JURISDICTION WHERE THE OFFER OR SALE IS NOT PERMITTED.
71
Mission Center
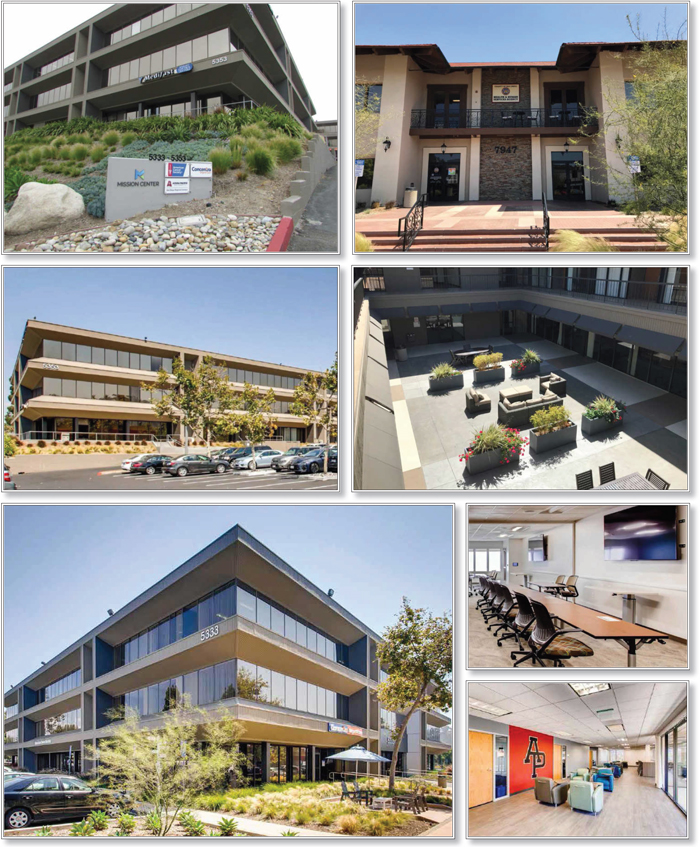
THE INFORMATION IN THIS STRUCTURAL AND COLLATERAL TERM SHEET IS NOT COMPLETE AND MAY BE AMENDED PRIOR TO THE TIME OF SALE. THIS TERM SHEET IS NOT AN OFFER TO SELL THESE SECURITIES AND IT IS NOT A SOLICITATION OF AN OFFER TO BUY THESE SECURITIES IN ANY JURISDICTION WHERE THE OFFER OR SALE IS NOT PERMITTED.
72
Mission Center
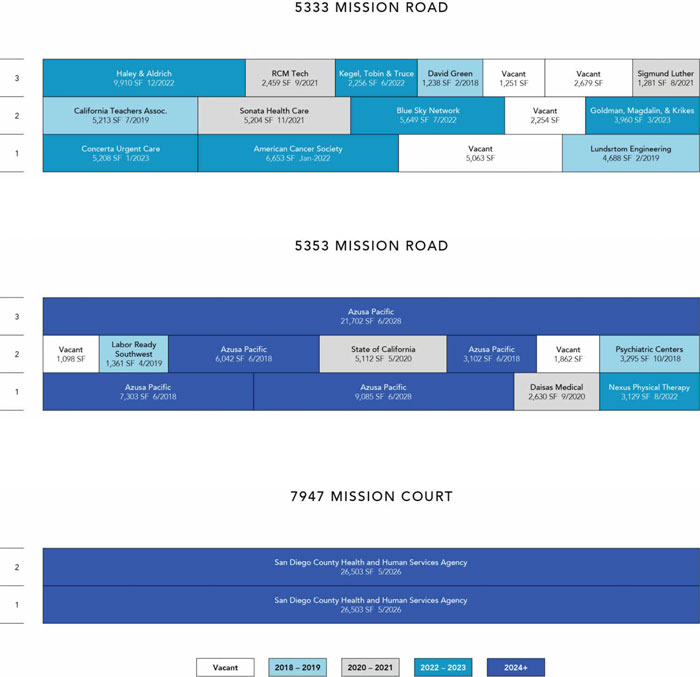
THE INFORMATION IN THIS STRUCTURAL AND COLLATERAL TERM SHEET IS NOT COMPLETE AND MAY BE AMENDED PRIOR TO THE TIME OF SALE. THIS TERM SHEET IS NOT AN OFFER TO SELL THESE SECURITIES AND IT IS NOT A SOLICITATION OF AN OFFER TO BUY THESE SECURITIES IN ANY JURISDICTION WHERE THE OFFER OR SALE IS NOT PERMITTED.
73
Mission Center

THE INFORMATION IN THIS STRUCTURAL AND COLLATERAL TERM SHEET IS NOT COMPLETE AND MAY BE AMENDED PRIOR TO THE TIME OF SALE. THIS TERM SHEET IS NOT AN OFFER TO SELL THESE SECURITIES AND IT IS NOT A SOLICITATION OF AN OFFER TO BUY THESE SECURITIES IN ANY JURISDICTION WHERE THE OFFER OR SALE IS NOT PERMITTED.
74
Mission Center
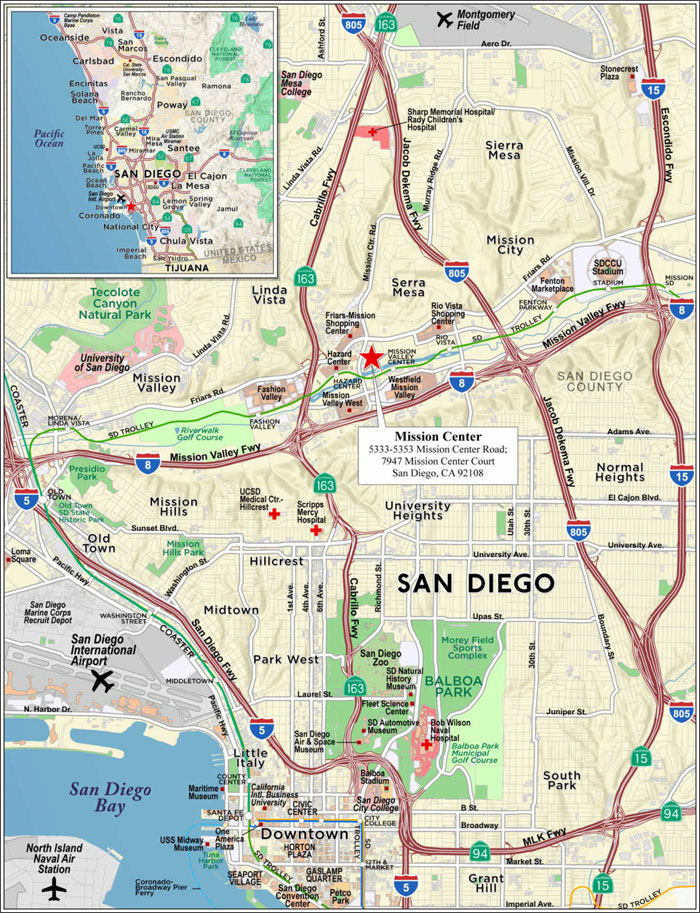
THE INFORMATION IN THIS STRUCTURAL AND COLLATERAL TERM SHEET IS NOT COMPLETE AND MAY BE AMENDED PRIOR TO THE TIME OF SALE. THIS TERM SHEET IS NOT AN OFFER TO SELL THESE SECURITIES AND IT IS NOT A SOLICITATION OF AN OFFER TO BUY THESE SECURITIES IN ANY JURISDICTION WHERE THE OFFER OR SALE IS NOT PERMITTED.
75
| No. 6 – Mission Center | ||||||
| Loan Information | Property Information | |||||
| Mortgage Loan Seller: | Wells Fargo Bank, National Association | Single Asset/Portfolio: | Single Asset | |||
Credit Assessment (DBRS/Fitch/Moody’s): | NR/NR/NR | Property Type: | Office | |||
| Original Principal Balance: | $29,750,000 | Specific Property Type: | Suburban | |||
| Cut-off Date Balance: | $29,750,000 | Location: | San Diego, CA | |||
| % of Initial Pool Balance: | 4.5% | Size: | 183,410 SF | |||
| Loan Purpose: | Acquisition | Cut-off Date Balance Per SF: | $162.20 | |||
| Borrower Names: | Omninet Mission Center, LLC; Omninet Mission Centerview, LLC | Year Built/Renovated: | 1973/2018 | |||
| Borrower Sponsors: | Neil Kadisha; Benjamin Nazarian | Title Vesting: | Fee | |||
| Mortgage Rate: | 4.2650% | Property Manager: | Self-managed | |||
| Note Date: | May 29, 2018 | 4thMost Recent Occupancy (As of): | 90.8% (12/31/2014) | |||
| Anticipated Repayment Date: | NAP | 3rdMost Recent Occupancy (As of)(3): | 90.2% (12/31/2015) | |||
| Maturity Date: | June 11, 2028 | 2ndMost Recent Occupancy (As of)(3): | 84.6% (12/31/2016) | |||
| IO Period: | (1) | Most Recent Occupancy (As of)(3): | 93.3% (12/31/2017) | |||
| Loan Term (Original): | 120 months | Current Occupancy (As of): | 94.6% (5/24/2018) | |||
| Seasoning: | 1 month | |||||
| Amortization Term (Original): | 360 months | |||||
| Loan Amortization Type: | Interest-only, Amortizing Balloon | |||||
| Interest Accrual Method: | Actual/360 | Underwriting and Financial Information: | ||||
| Call Protection: | L(25),D(91),O(4) | 4thMost Recent NOI(4): | NAV | |||
| Lockbox Type: | Soft/Springing Cash Management | 3rdMost Recent NOI(4): | NAV | |||
| Additional Debt: | None | 2ndMost Recent NOI (As of)(4): | $1,896,281 (12/31/2016) | |||
| Additional Debt Type: | NAP | Most Recent NOI (As of)(4): | $2,515,160 (Annualized 8 8/31/2017) | |||
| U/W Revenues: | $4,967,665 | |||||
| U/W Expenses: | $1,684,476 | |||||
| Escrows and Reserves(2): | U/W NOI(4): | $3,283,188 | ||||
| U/W NCF: | $2,958,306 | |||||
| Type: | Initial | Monthly | Cap (If Any) | U/W NOI DSCR: | 1.87x | |
| Taxes | $121,395 | $40,465 | NAP | U/W NCF DSCR: | 1.68x | |
| Insurance | $0 | Springing | NAP | U/W NOI Debt Yield: | 11.0% | |
| HVAC Improvement Project | $632,500 | $0 | NAP | U/W NCF Debt Yield: | 9.9% | |
| Replacement Reserve | $0 | $3,821 | $137,545 | As-Is Appraised Value: | $43,500,000 | |
| TI/LC Reserve | $0 | $22,926 | $825,265 | As-Is Appraisal Valuation Date: | April 5, 2018 | |
| Existing TI/LC Obligations | $46,872 | $0 | NAP | Cut-off Date LTV Ratio: | 68.4% | |
| Rent Concession Reserve | $149,706 | $0 | NAP | LTV Ratio at Maturity or ARD(5): | 62.4% | |
| (1) | The Mission Center Mortgage Loan (as defined below) is structured with a 60-month interest only period. An additional 12-month interest only period (July 11, 2023 through June 11, 2024) is contingent upon satisfaction of the Debt Yield Condition (as defined in “The Mortgage Loan” section). If the Debt Yield Condition is not satisfied, the interest only period will remain at 60 months total and the loan will require payments of principal and interest based on a 30-year amortization schedule commencing July 11, 2023 through the end of the loan term. |
| (2) | See “Escrows” section. |
| (3) | See “Historical Occupancy” table. |
| (4) | See “Cash Flow Analysis” section. |
| (5) | The LTV Ratio at Maturity or ARD reflects an interest only period of 60 months. Assuming a 72-month interest only period, the LTV Ratio at Maturity or ARD is 63.7%. |
The Mortgage Loan. The mortgage loan (the “Mission Center Mortgage Loan”) is evidenced by a single promissory note secured by a first mortgage encumbering the fee interest in a three-building suburban office complex located in San Diego, California (the “Mission Center Property”). The Mission Center Mortgage Loan was originated on May 29, 2018 by Wells Fargo Bank, National Association. The Mission Center Mortgage Loan had an original principal balance of $29,750,000, has an outstanding principal balance as of the Cut-off Date of $29,750,000 and accrues interest at an interest rate of 4.265%per annum. The Mission Center Mortgage Loan had an initial term of 120 months, has a remaining term of 119 months as of the Cut-off Date and requires interest-only payments for the first 60 months following origination (provided, however, that interest-only payments are required for an additional 12 months (for a potential total interest-only period of 72 months) as long as the net cash flow debt yield is equal to or greater than 10.5% as of June 11, 2023 (the “Debt Yield Condition”)) and, thereafter, requires payments of principal and interest based on a 30-year amortization schedule. The Mission Center Mortgage Loan matures on June 11, 2028.
Following the lockout period, the borrower has the right to defease the Mission Center Mortgage Loan in whole, but not in part, on any date before March 11, 2028. In addition, the Mission Center Mortgage Loan is prepayable without penalty on or after March 11, 2028. The lockout period will expire on the earlier to occur of (i) two years after the closing date of the securitization trust and (ii) July 11, 2021.
THE INFORMATION IN THIS STRUCTURAL AND COLLATERAL TERM SHEET IS NOT COMPLETE AND MAY BE AMENDED PRIOR TO THE TIME OF SALE. THIS TERM SHEET IS NOT AN OFFER TO SELL THESE SECURITIES AND IT IS NOT A SOLICITATION OF AN OFFER TO BUY THESE SECURITIES IN ANY JURISDICTION WHERE THE OFFER OR SALE IS NOT PERMITTED.
76
Mission Center
Sources and Uses
| Sources | Uses | |||||||
| Original loan amount | $29,750,000 | 73.3% | Purchase price(1) | $39,275,000 | 96.8% | |||
| Borrower sponsor’s new cash contribution | 10,828,862 | 26.7 | Upfront reserves | 950,473 | 2.3 | |||
| Closing costs | 353,389 | 0.9 | ||||||
| Total Sources | $40,578,862 | 100.0% | Total Uses | $40,578,862 | 100.0% | |||
| (1) | The borrower acquired the Mission Center Property in an all cash transaction on December 8, 2017 for $39,275,000. |
The Property.The Mission Center Property is a three-building suburban office complex totaling 183,410 square feet of rentable area located in San Diego, San Diego County, California. Originally constructed between 1973 and 1976 and renovated in 2005, 2016 and 2018, the Mission Center Property is situated on a 6.7-acre parcel of land in the suburban business district of Mission Valley. During the 2016 renovation, the Mission Center Property underwent an approximately $7.0 million capital improvement project to install exterior patios, replace roof areas, repair asphalt pavement, and upgrade exterior walkways, landscaping, lobbies, restrooms and other common areas. In addition, the borrower is currently upgrading the heating, ventilation and air conditioning (“HVAC”) systems at all three buildings, including the installation of new 40-ton rooftop cooling units, new heating systems, a replacement boiler and digital control mechanisms ($632,500 reserved at origination; see “Escrows” section).
The Mission Center Property is occupied by tenants from the education, government, engineering, healthcare, legal, and technology sectors. Amenities at the Mission Center Property include outdoor atrium style courtyards equipped with seating and dining areas and a workout facility with showers and grab-and-go bikes for tenant use. The site also includes three pad buildings occupied by Carl’s Jr., Del Taco, and InCahoots, which are not part of the collateral for the Mission Center Mortgage Loan but do contribute to the CAM reimbursements for parking lot maintenance and repairs. The Mission Center Property features 768 surface parking spaces indicating a parking ratio of 4.2 spaces per 1,000 square feet of net rentable area. As of May 24, 2018, the Mission Center Property was 94.6% occupied by 21 tenants. The Mission Center Property has averaged 90.7% occupancy since 2014 and 88.7% since 2009. Approximately 54.7% of the net rentable area and 60.6% of underwritten base rent at the Mission Center Property is attributed to investment grade tenants.
The largest tenant at the Mission Center Property by underwritten base rent is Azusa Pacific (“APU”), a private, not-for-profit university headquartered in Azusa, California, approximately 25.3 miles northeast of downtown Los Angeles (rated Baa3 by Moody’s; 25.8% of net rentable area; 31.9% of underwritten base rent). APU offers more than 100 associate’s, bachelor’s, master’s and doctoral programs on campus, online and at six regional centers across Southern California, including, San Diego, Los Angeles, Orange County, Murrieta, San Bernardino and Victorville. The Mission Center Property regional center includes programs for accelerated bachelor’s degrees, teaching credentials and master’s degrees in education, leadership, nursing, psychology and theology. In 2017 APU expanded its space at the Mission Center Property from 30,846 square feet to 47,234 square feet and extended its lease by 10 years and nine months through March 2028. The tenant has been at the Mission Center Property since 2007.
The second largest tenant at the Mission Center Property by underwritten base rent is the County of San Diego (rated AA+/Aa1/AA+ by Fitch/Moody’s/S&P; 28.9% of net rentable area; 28.7% of underwritten base rent). The County of San Diego has been at the Mission Center Property since 1973 and exercised an early 5-year renewal option in December 2016 to extend its lease term until May 2026. The Mission Center Property serves as an office for the Health and Human Services Agency (one of five divisions of the San Diego County government). The Health and Human Services Agency’s mission is to provide a range of health and social services, promoting wellness, self-sufficiency and a better quality of life for residents of San Diego County. The Health and Human Services Agency provides approximately 300 programs and services and employs approximately 6,000 people. The County of San Diego occupies the entire 7947 Mission Center Court building at the Mission Center Property.
Other than APU and the County of San Diego, no tenant accounts for more than 5.4% of the net rentable area or 4.6% of underwritten base rent at the Mission Center Property.
THE INFORMATION IN THIS STRUCTURAL AND COLLATERAL TERM SHEET IS NOT COMPLETE AND MAY BE AMENDED PRIOR TO THE TIME OF SALE. THIS TERM SHEET IS NOT AN OFFER TO SELL THESE SECURITIES AND IT IS NOT A SOLICITATION OF AN OFFER TO BUY THESE SECURITIES IN ANY JURISDICTION WHERE THE OFFER OR SALE IS NOT PERMITTED.
77
Mission Center
The following table presents certain information relating to the tenancy at the Mission Center Property:
Major Tenants
| Tenant Name | Credit Rating (Fitch/Moody’s/ S&P)(1) | Tenant NRSF | % of NRSF | Annual U/W Base Rent PSF(2) | Annual U/W Base Rent(2) | % of Total Annual U/W Base Rent | Lease Expiration Date |
| Major Tenants | |||||||
| Azusa Pacific | NR/Baa3/NR | 47,234 | 25.8% | $34.08(3)(4) | $1,609,830(3)(4) | 31.9% | 3/31/2028(5) |
| County of San Diego | AA+/Aa1/AA+ | 53,006 | 28.9% | $27.29(6) | $1,446,526(6) | 28.7% | 5/31/2026(7) |
| Haley & Aldrich | NR/NR/NR | 9,910 | 5.4% | $23.64 | $234,272 | 4.6% | 12/31/2022(8) |
| American Cancer Society | NR/NR/NR | 6,653 | 3.6% | $24.84 | $165,261 | 3.3% | 1/31/2022 |
| Blue Sky Network | NR/NR/NR | 5,649 | 3.1% | $28.68 | $162,013 | 3.2% | 7/31/2022(9) |
| Total Major Tenants | 122,452 | 66.8% | $29.55 | $3,617,902 | 71.8% | ||
| Non-Major Tenants | 50,963 | 27.8% | $27.91 | $1,422,501 | 28.2% | ||
| Occupied Collateral Total | 173,415 | 94.6% | $29.07 | $5,040,403 | 100.0% | ||
| Vacant Space | 9,995 | 5.4% | |||||
| Collateral Total | 183,410 | 100.0% | |||||
| (1) | The ratings shown represent those of the entities on the respective tenant leases. |
| (2) | Annual U/W Base Rent PSF and Annual U/W Base Rent include contractual rent steps through June 2019 for 18 tenants totaling $66,868 and straight-line rent averaging for investment grade tenants over the remaining lease term for APU and the County of San Diego totaling $374,203. |
| (3) | APU’s Annual U/W Base Rent PSF and Annual U/W Base Rent are based on the tenant’s average rental rate over the remaining lease term. APU currently pays rent of $29.64 per square foot. APU’s base rent is scheduled to increase by approximately 3.0% annually. |
| (4) | APU is currently in a 50% rent abatement period through September 2018. All remaining rent credits and abatements were reserved at the origination of the Mission Center Mortgage Loan (see “Escrows” section). |
| (5) | APU has one, 5-year renewal option, with 270 days’ notice, at fair market rental rate. |
| (6) | The County of San Diego’s Annual U/W Base Rent PSF and Annual U/W Base Rent are based on the tenant’s average rental rate over the remaining lease term. The County of San Diego currently pays rent of $24.19 per square foot. The County of San Diego’s base rent is scheduled to increase by 3.0% annually. |
| (7) | The County of San Diego has one, 5-year renewal option, with nine months’ notice, at 95% of the fair market rental rate. |
| (8) | Haley & Aldrich has one, 5-year renewal option, with nine months’ notice, at the fair market rental rate. |
| (9) | Blue Sky Network has one, 5-year renewal option, with eight months’ notice, at the fair market rental rate. |
The following table presents certain information relating to the lease rollover schedule at the Mission Center Property:
Lease Expiration Schedule(1)(2)
| Year Ending December 31, | No. of Leases Expiring | Expiring NRSF | % of Total NRSF | Cumulative Expiring NRSF | Cumulative % of Total NRSF | Annual U/W Base Rent(3) | % of Total Annual U/W Base Rent | Annual U/W Base Rent PSF(3) |
| MTM | 0 | 0 | 0.0% | 0 | 0.0% | $0 | 0.0% | $0.00 |
| 2018 | 1 | 3,171 | 1.7% | 3,171 | 1.7% | $81,816 | 1.6% | $25.80 |
| 2019 | 2 | 9,879 | 5.4% | 13,050 | 7.1% | $271,900 | 5.4% | $27.52 |
| 2020 | 6 | 13,179 | 7.2% | 26,229 | 14.3% | $381,627 | 7.6% | $28.96 |
| 2021 | 3 | 8,943 | 4.9% | 35,172 | 19.2% | $233,663 | 4.6% | $26.13 |
| 2022 | 5 | 27,597 | 15.0% | 62,769 | 34.2% | $717,230 | 14.2% | $25.99 |
| 2023 | 3 | 10,406 | 5.7% | 73,175 | 39.9% | $297,812 | 5.9% | $28.62 |
| 2024 | 0 | 0 | 0.0% | 73,175 | 39.9% | $0 | 0.0% | $0.00 |
| 2025 | 0 | 0 | 0.0% | 73,175 | 39.9% | $0 | 0.0% | $0.00 |
| 2026 | 1 | 53,006 | 28.9% | 126,181 | 68.8% | $1,446,526 | 28.7% | $27.29 |
| 2027 | 0 | 0 | 0.0% | 126,181 | 68.8% | $0 | 0.0% | $0.00 |
| 2028 | 5 | 47,234 | 25.8% | 173,415 | 94.6% | $1,609,830 | 31.9% | $34.08 |
| Thereafter | 0 | 0 | 0.0% | 173,415 | 94.6% | $0 | 0.0% | $0.00 |
| Vacant | 0 | 9,995 | 5.4% | 183,410 | 100.0% | $0 | 0.0% | $0.00 |
| Total/Weighted Average | 26 | 183,410 | 100.0% | $5,040,403 | 100.0% | $29.07 |
| (1) | Information obtained from the underwritten rent roll. |
| (2) | Certain tenants may have lease termination options that are exercisable prior to the originally stated expiration date of the subject lease and that are not considered in the Lease Expiration Schedule. |
| (3) | Weighted Average Annual U/W Base Rent PSF and Total Annual U/W Base Rent exclude vacant space. |
THE INFORMATION IN THIS STRUCTURAL AND COLLATERAL TERM SHEET IS NOT COMPLETE AND MAY BE AMENDED PRIOR TO THE TIME OF SALE. THIS TERM SHEET IS NOT AN OFFER TO SELL THESE SECURITIES AND IT IS NOT A SOLICITATION OF AN OFFER TO BUY THESE SECURITIES IN ANY JURISDICTION WHERE THE OFFER OR SALE IS NOT PERMITTED.
78
Mission Center
The following table presents historical occupancy percentages at the Mission Center Property:
Historical Occupancy
12/31/2014(1) | 12/31/2015(1) | 12/31/2016(1)(2) | 12/31/2017(1)(3) | 5/24/2018(4) |
| 90.8% | 90.2% | 84.6% | 93.3% | 94.6% |
| (1) | Information obtained from a third-party market research provider. |
| (2) | The decrease in occupancy from 12/31/2015 to 12/31/2016 can be attributed in part to two tenants vacating: Tele-Consultants (approximately 11,682 square feet and 6.4% of net rentable area) and Technology Associates (approximately 5,540 square feet and 3.0% of net rentable area). |
| (3) | The increase in occupancy from 12/31/2016 to 12/31/2017 can be attributed to new leases with Blue Sky Network (5,649 square feet, 3.1% of net rentable area) signed in March 2017 and Labor Ready Southwest (1,862 square feet, 1.0% of net rentable area) signed in November 2017, along with APU’s expansion from 30,846 square feet to 47,234 square feet (expansion of approximately 9.0% of net rentable area) in July 2017. |
| (4) | Information obtained from the underwritten rent roll. |
Operating History and Underwritten Net Cash Flow. The following table presents certain information relating to the historical operating performance and underwritten net cash flow at the Mission Center Property:
Cash Flow Analysis(1)(2)
| 2016 | Annualized 8 8/31/2017(3) | U/W(4) | % of U/W Effective Gross Income | U/W $ per SF | |||||||
| Base Rent | $3,277,482 | $3,873,465 | $5,040,403 | 101.5% | $27.48 | ||||||
| Grossed Up Vacant Space | 0 | 0 | 275,862 | 5.6 | 1.50 | ||||||
| Total Recoveries | 86,140 | 175,242 | 183,025 | 3.7 | 1.00 | ||||||
| Other Income | 2,774 | 55,661 | 0 | 0.0 | 0.00 | ||||||
| Less Vacancy & Credit Loss | 0 | 0 | (531,627)(5) | (10.7) | (2.90) | ||||||
| Effective Gross Income | $3,366,396 | $4,104,368 | $4,967,665 | 100.0% | $27.09 | ||||||
| Total Operating Expenses | 1,470,115 | 1,589,208 | 1,684,476 | 33.9% | 9.18 | ||||||
| Net Operating Income | $1,896,281 | $2,515,160 | $3,283,188 | 66.1% | $17.90 | ||||||
| TI/LC | 0 | 0 | 279,029 | 5.6 | 1.52 | ||||||
| Capital Expenditures | 0 | 0 | 45,853 | 0.9 | 0.25 | ||||||
| Net Cash Flow | $1,896,281 | $2,515,160 | $2,958,306 | 59.6% | $16.13 | ||||||
| NOI DSCR | 1.08x | 1.43x | 1.87x | ||||||||
| NCF DSCR | 1.08x | 1.43x | 1.68x | ||||||||
| NOI DY | 6.4% | 8.5% | 11.0% | ||||||||
| NCF DY | 6.4% | 8.5% | 9.9% |
| (1) | The borrower acquired the Mission Center Property on December 8, 2017 and was not provided with financials prior to 2016. |
| (2) | Annual U/W Base Rent PSF and Annual U/W Base Rent include contractual rent steps through June 2019 for 18 tenants totaling $66,868 and straight-line rent averaging for investment grade tenants over the remaining lease term for APU and the County of San Diego totaling $374,203. |
| (3) | The increase in Base Rent and Net Operating Income from 2016 to Annualized 8 8/31/2017 was driven partly by (i) seven new leases totaling 21.6% of underwritten base rent signed from February 2016 to July 2017 and (ii) nine renewal leases totaling 36.0% of underwritten base rent signed from May 2016 to July 2017. |
| (4) | The increase in Base Rent and Net Operating Income from Annualized 8 8/31/2017 to U/W was driven by (i) six new leases totaling 16.7% of underwritten base rent and eight renewal leases totaling 29.9% of underwritten base rent signed since March 2017, (ii) the inclusion of contractual rent escalations through June 2019 for 18 tenants totaling $66,868 and (iii) straight-line rent averaging for investment grade tenants over the remaining lease term for APU and the County of San Diego totaling $374,203. |
| (5) | The underwritten economic vacancy is 10.0%. The Mission Center Property was 94.6% physically occupied as of May 24, 2018. |
Appraisal.As of the appraisal valuation date of April 5, 2018, the Mission Center Property had an “as-is” appraised value of $43,500,000.
Environmental Matters.According to the Phase I environmental report dated April 13, 2018, there was no evidence of any recognized environmental conditions at the Mission Center Property.
Market Overview and Competition.The Mission Center Property is located in San Diego, San Diego County, California, approximately 0.8 miles east of state route 163, 0.9 miles northwest of Interstate 8 and 1.2 miles west of interstate 805. The Mission Center Property is located approximately 5.2 miles northeast of downtown San Diego and 6.8 miles northeast of San Diego International Airport. Surrounding development along Interstate 8 comprises big box retail and entertainment options including Westfield Mission Valley (0.6 miles southeast of the Mission Center Property), which features a 24 Hour Fitness, Bed Bath & Beyond, Target, Nordstrom Rack, Buffalo Wild Wings and an AMC Theatre. Fashion Valley, a Simon-owned 1.8 million square foot open-air mall anchored by Neiman Marcus, Bloomingdales, Nordstrom and Macy’s, is located approximately 1.4 miles west of the Mission Center Property. Fashion Valley also has dining options including Cheesecake Factory, California Pizza Kitchen, True Food Kitchen and P.F. Chang’s China Bistro, as well as an AMC Theatre. According to a third party market research provider, the estimated 2018 population within a three- and five-mile radius of the Mission Center Property was 221,249 and 533,036, respectively; and the estimated 2018 average household income within the same radii was $86,520 and $84,560, respectively.
THE INFORMATION IN THIS STRUCTURAL AND COLLATERAL TERM SHEET IS NOT COMPLETE AND MAY BE AMENDED PRIOR TO THE TIME OF SALE. THIS TERM SHEET IS NOT AN OFFER TO SELL THESE SECURITIES AND IT IS NOT A SOLICITATION OF AN OFFER TO BUY THESE SECURITIES IN ANY JURISDICTION WHERE THE OFFER OR SALE IS NOT PERMITTED.
79
Mission Center
The residential base in the Mission Valley submarket encompasses apartments, condos and townhomes totaling over 22,000 units with approximately 5,000 units planned or in development. Currently in development is Civita, a 230-acre transit-oriented development which is planned to include approximately 4,780 residences, 67 acres of parks and open space and 900,000 square feet of retail, office, hospitality and civic space. Civita, located approximately 1.4 miles northeast of the Mission Center Property, is currently expected to be fully built-out in approximately 10 years.
The San Diego Trolley Green Line extends from Santee Town Center (approximately 16.1 miles northeast of the Mission Center Property) into downtown San Diego and traverses Mission Valley with 10 stops between Old Town on the western border of the valley (approximately 4.2 miles southwest of the Mission Center Property) to San Diego County Credit Union Stadium on the east end (approximately 2.4 miles northeast of the Mission Center Property). The Mission Center Property is located approximately 0.3 miles northeast of the Hazard Center Station Trolley Green Line stop and approximately 0.5 miles northwest of the Mission Valley Center Station Trolley Green Line stop.
Per a third-party market research report, the Mission Center Property is situated within the Mission Valley office submarket of the San Diego office market. As of year-end 2017, the submarket reported a total inventory of 7.2 million square feet with a 9.7% vacancy rate and average asking rents of $28.52 per square foot.
The following table presents certain information relating to comparable office leases for the Mission Center Property:
Comparable Leases(1)
| Property Name/Location | Total GLA (SF) | Total Property Occupancy | Distance from Subject | Lease Date/ Term(2) | Lease Area (SF)(2) | Annual Base Rent PSF(2) | Lease Type |
Fountain View Business Park 3530-3570 N. Camino Del Rio, San Diego, CA | 89,319 | 89.0% | 2.7 miles | Jun. 2017 / 5.4 Yrs | 1,841 | $26.40 | Gross plus Utilities |
Mission Courtyard 5030 Camino De La Siesta, San Diego, CA | 85,409 | 79.0% | 1.0 mile | Oct. 2017 – Apr. 2018 / 3.0 – 7.6 Yrs | 1,423 – 12,287 | $24.00 - $28.80 | Gross plus Utilities |
Rio Vista Plaza I 8989 Rio San Diego Drive, San Diego, CA | 78,388 | 96.0% | 1.3 miles | Jan. 2017 – May 2018 / 3.2 – 7.4 Yrs | 2,513 – 20,088 | $27.00 - $29.40 | FSG |
Rio Vista Plaza 8885 Rio San Diego Drive, San Diego, CA | 108,550 | 83.0% | 1.3 miles | Apr. 2017 – Aug. 2017 / 2.1 – 5.5 Yrs | 1,120 – 2,595 | $25.80 - $27.00 | Gross plus Utilities |
Hotel Circle Plaza 1660 Hotel Circle North, San Diego, CA | 106,844 | 91.0% | 2.2 miles | Jul. 2017 – Apr. 2018 / 5.3 Yrs | 792 – 4,418 | $22.80 - $25.20 | FSG |
Friars Office Park 7801 Mission Center Ct, San Diego, CA | 37,633 | 100.0% | 0.3 miles | Jun. 2017 – Aug. 2017 / 2.1 – 5.0 Yrs | 994 – 4,664 | $24.00 - $24.60 | FSG |
| (1) | Information obtained from the appraisal and third party reports. |
| (2) | The appraiser provided multiple comparable leases for five of the six properties shown on the table above (excluding Fountain View Business Park). The information shown, as available, represents the ranges of such leases. |
The Borrower.The borrower for the Mission Center Mortgage Loan comprises two tenants in common: Omninet Mission Center, LLC and Omninet Mission Centerview, LLC, each a Delaware limited liability company and single purpose entity. Neil Kadisha and Benjamin Nazarian are the guarantors of certain nonrecourse carveouts under the Mission Center Mortgage Loan.
The Borrower Sponsor.The borrower sponsors are Neil Kadisha and Benjamin Nazarian, each a managing partner of Omninet Capital, LLC (“Omninet”), a diversified investment firm that owns approximately 7.6 million square feet of office, industrial and retail space in Arizona, California, Colorado, Nevada, New Mexico and Texas. Omninet seeks value-added opportunities in income producing commercial real estate by leveraging the principals’ operating experience in stabilizing properties. Mr. Kadisha disclosed a civil judgment from 2011 in connection with the misappropriation of trust assets, which was ultimately satisfied and paid in full in 2011. See“Description of the Mortgage Pool— Loan Purpose; Default History, Bankruptcy Issues and Other Proceedings”in the Preliminary Prospectus.
Escrows.The loan documents provide for upfront reserves of $121,395 for real estate taxes, $632,500 for ongoing HVAC improvements, $149,706 for outstanding rent concessions related to APU ($116,668), Concentra Urgent Care ($25,780), David Green PhD ($2,848) and Michael Wax ($4,410) and $46,872 for outstanding tenant improvements and leasing commissions (“TI/LC”) related to Concentra Urgent Care. The loan documents also provide for ongoing monthly reserves of $40,465 for real estate taxes, $3,821 for replacement reserves (subject to a cap of $137,545 so long as no event of default is continuing and the Mission Center Property is being adequately maintained as determined by lender based on annual inspections) and $22,926 for general TI/LCs (subject to a cap of $825,265, inclusive of any termination fees required to be deposited with the lender pursuant to the loan documents).
The loan documents do not require ongoing monthly escrows for insurance premiums as long as (i) no event of default has occurred and is continuing; (ii) the borrower provides the lender with evidence that the Mission Center Property’s insurance coverage is
THE INFORMATION IN THIS STRUCTURAL AND COLLATERAL TERM SHEET IS NOT COMPLETE AND MAY BE AMENDED PRIOR TO THE TIME OF SALE. THIS TERM SHEET IS NOT AN OFFER TO SELL THESE SECURITIES AND IT IS NOT A SOLICITATION OF AN OFFER TO BUY THESE SECURITIES IN ANY JURISDICTION WHERE THE OFFER OR SALE IS NOT PERMITTED.
80
Mission Center
included in a blanket policy and such policy is in full force and effect; and (iii) the borrower pays all applicable insurance premiums and provides the lender with evidence of renewals.
Lockbox and Cash Management.The Mission Center Mortgage Loan is structured with a soft lockbox and springing cash management. Prior to the occurrence of a Cash Trap Event Period (as defined below), the loan documents require that the borrower or the property manager deposit all rents into the lockbox account within three business days of receipt. Upon the occurrence and during the continuance of a Cash Trap Event Period, the borrower will be required to direct all tenants to deposit all rents directly into the lockbox account. All funds in the lockbox account will then be required to be swept each business day into the cash management account controlled by the lender and disbursed on each payment date in accordance with the loan documents. During a Cash Trap Event Period, all excess cash flow after payment of all sums due and payable under the loan documents and monthly operating expenses will be retained in a lender-controlled subaccount (provided, however, any excess cash flow swept solely in accordance with a Major Tenant Event Period (as defined below) will be deposited into a separate Major Tenant Reserve subaccount subject to the Major Tenant Sweep Cap (as defined below)).
A “Cash Trap Event Period” will commence upon the earlier of the following:
| (i) | the occurrence of an event of default; |
| (ii) | the amortizing net cash flow debt service coverage ratio falling below 1.15x at the end of any calendar quarter; or |
| (iii) | the occurrence of a Major Tenant Event Period. |
A CashTrap Event Period will end upon the occurrence of the following:
| ● | with regard to clause (i), the cure of such event of default; |
| ● | with regard to clause (ii), the earlier of (a) the amortizing net cash flow debt service coverage ratio being equal to or greater than 1.20x for two consecutive calendar quarters or (b) the excess cash flow held by lender equalling $2,500,000; or |
| ● | with regard to clause (iii), a Major Tenant Event Period Cure (as defined below). |
A “Major Tenant Event Period” will commence upon the earlier of the following, so long as the net cash flow debt yield is below 9.75% (excluding rent for any tenant which has failed to extend or renew during a lease option notice period or for which less than 180 days remain under its lease term (120 days for tenants occupying less than 4,000 square feet)):
| (i) | any Major Tenant (as defined below) going dark, vacating, failing to occupy its space or giving notice of its intent to commence any of the foregoing; or |
| (ii) | any Major Tenant providing notice of its intention not to renew its lease or failing to extend its lease prior to the earlier of (x) nine months prior to the end of its lease term or (y) the date on which a renewal notice must be given under its lease; |
A “Major TenantEvent Period Cure” will occur upon the following:
| ● | with regard to clause (i), any of (x) a Major Tenant Re-Tenanting Event (as defined below) having occurred, (y) such Major Tenant having resumed occupancy of, and resumed its normal business operations in, its space for two consecutive calendar quarters or (z) the net cash flow debt yield being and continuing to be at least 9.75%; |
| ● | with regard to clause (ii), any of (x) a Major Tenant Re-Tenanting Event having occurred, (y) Lender having received satisfactory evidence (including a tenant estoppel certificate reasonably satisfactory to lender) that such Major Tenant has exercised its renewal or extension option pursuant to the terms of its lease or otherwise on terms and conditions reasonably satisfactory to lender or (z) the net cash flow debt yield being and continuing to be at least 9.75%; or |
| ● | an amount equal to the Major Tenant Sweep Cap having been deposited into the Major Tenant Reserve subaccount. |
A “Major Tenant” means, individually or collectively, APU and County of San Diego, their successors and assigns, and any replacement tenant that enters into a lease for at least 25,000 square feet of the space currently occupied by APU or County of San Diego.
A “Major Tenant Re-Tenanting Event” will occur upon one or more replacement tenants satisfactory to lender executing leases covering an applicable portion of the space leased to such Major Tenant with (i) such replacement tenants having taken occupancy of such space and conducting normal business operations therein and paying full unabated rent or any such abatement has been reserved; (ii) all TI/LCs having been paid or reserved; and (iii) such replacement tenants having delivered a satisfactory estoppel certificate affirming the foregoing conditions.
“Major Tenant Sweep Cap” means an amount equal to the product obtained by multiplying (x) $35.00 by (y) the number of square feet of Major Tenant space that is the subject of any ongoing Major Tenant Event Period (which, for the avoidance of doubt, excludes any portion thereof that has been re-tenanted pursuant to a Major Tenant Re-Tenanting Event).
Property Management.The Mission Center Property is managed by an affiliate of the borrower.
Assumption.The borrower has the five-time right, commencing 12 months after loan origination, to transfer the Mission Center Property, provided that certain conditions are satisfied, including (i) no event of default has occurred and is continuing; (ii) the lender has reasonably determined that the proposed transferee and guarantor satisfy the lender’s credit review and underwriting standards, taking into consideration the transferee’s experience, financial strength and general business standing; and (iii) if required by the lender, rating agency confirmation from DBRS, Fitch and Moody’s that the transfer will not result in a downgrade, withdrawal or qualification of the respective ratings assigned to the Series WFCM 2018-C45 certificates.
THE INFORMATION IN THIS STRUCTURAL AND COLLATERAL TERM SHEET IS NOT COMPLETE AND MAY BE AMENDED PRIOR TO THE TIME OF SALE. THIS TERM SHEET IS NOT AN OFFER TO SELL THESE SECURITIES AND IT IS NOT A SOLICITATION OF AN OFFER TO BUY THESE SECURITIES IN ANY JURISDICTION WHERE THE OFFER OR SALE IS NOT PERMITTED.
81
Mission Center
Partial Release.Not permitted.
Real Estate Substitution.Not permitted.
Subordinate and Mezzanine Indebtedness. Not permitted.
Ground Lease. None.
Terrorism Insurance.The loan documents require that the “all risk” insurance policy required to be maintained by the borrower provide coverage for terrorism in an amount equal to the full replacement cost of the Mission Center Property. The loan documents also require business interruption insurance covering no less than the 12-month period following the occurrence of a casualty event, together with a six-month extended period of indemnity.
Earthquake Insurance.The loan documents do not require earthquake insurance. The seismic report indicated a probable maximum loss for the entire Mission Center Property of 11.0%.
THE INFORMATION IN THIS STRUCTURAL AND COLLATERAL TERM SHEET IS NOT COMPLETE AND MAY BE AMENDED PRIOR TO THE TIME OF SALE. THIS TERM SHEET IS NOT AN OFFER TO SELL THESE SECURITIES AND IT IS NOT A SOLICITATION OF AN OFFER TO BUY THESE SECURITIES IN ANY JURISDICTION WHERE THE OFFER OR SALE IS NOT PERMITTED.
82
(THIS PAGE INTENTIONALLY LEFT BLANK)
THE INFORMATION IN THIS STRUCTURAL AND COLLATERAL TERM SHEET IS NOT COMPLETE AND MAY BE AMENDED PRIOR TO THE TIME OF SALE. THIS TERM SHEET IS NOT AN OFFER TO SELL THESE SECURITIES AND IT IS NOT A SOLICITATION OF AN OFFER TO BUY THESE SECURITIES IN ANY JURISDICTION WHERE THE OFFER OR SALE IS NOT PERMITTED.
83
(THIS PAGE INTENTIONALLY LEFT BLANK)
THE INFORMATION IN THIS STRUCTURAL AND COLLATERAL TERM SHEET IS NOT COMPLETE AND MAY BE AMENDED PRIOR TO THE TIME OF SALE. THIS TERM SHEET IS NOT AN OFFER TO SELL THESE SECURITIES AND IT IS NOT A SOLICITATION OF AN OFFER TO BUY THESE SECURITIES IN ANY JURISDICTION WHERE THE OFFER OR SALE IS NOT PERMITTED.
84
Center Pointe Plaza II
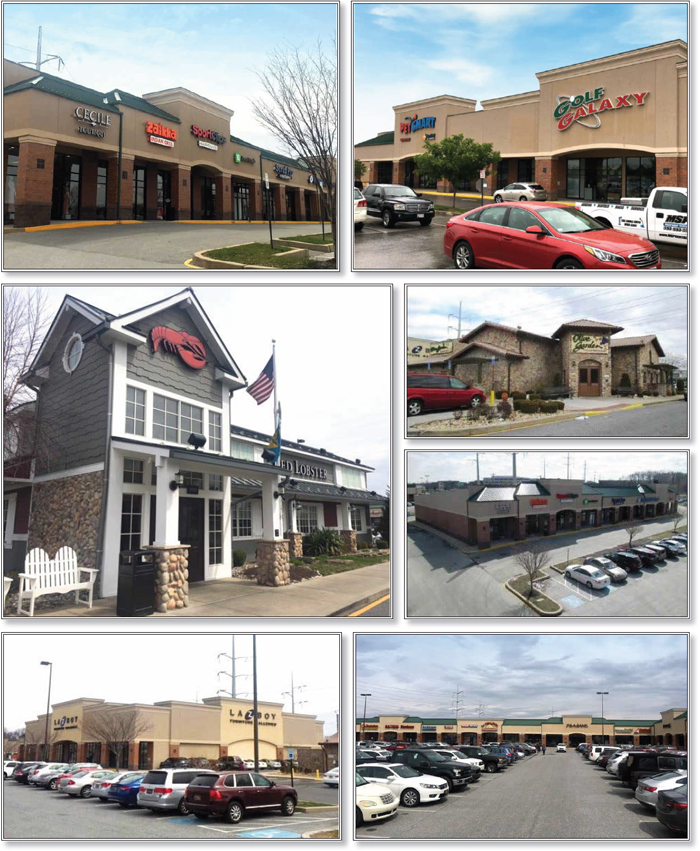
THE INFORMATION IN THIS STRUCTURAL AND COLLATERAL TERM SHEET IS NOT COMPLETE AND MAY BE AMENDED PRIOR TO THE TIME OF SALE. THIS TERM SHEET IS NOT AN OFFER TO SELL THESE SECURITIES AND IT IS NOT A SOLICITATION OF AN OFFER TO BUY THESE SECURITIES IN ANY JURISDICTION WHERE THE OFFER OR SALE IS NOT PERMITTED.
85
Center Pointe Plaza II
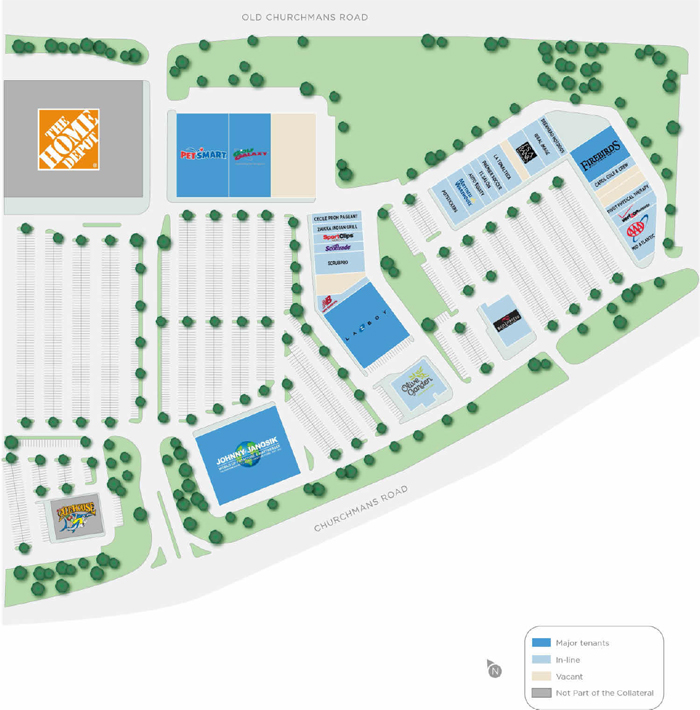
THE INFORMATION IN THIS STRUCTURAL AND COLLATERAL TERM SHEET IS NOT COMPLETE AND MAY BE AMENDED PRIOR TO THE TIME OF SALE. THIS TERM SHEET IS NOT AN OFFER TO SELL THESE SECURITIES AND IT IS NOT A SOLICITATION OF AN OFFER TO BUY THESE SECURITIES IN ANY JURISDICTION WHERE THE OFFER OR SALE IS NOT PERMITTED.
86
Center Pointe Plaza II
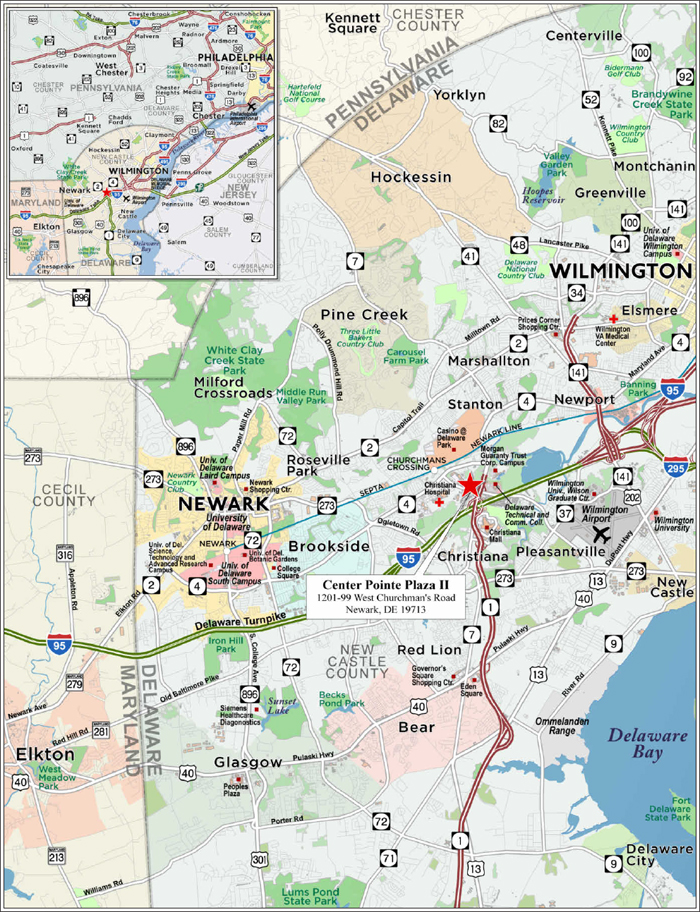
THE INFORMATION IN THIS STRUCTURAL AND COLLATERAL TERM SHEET IS NOT COMPLETE AND MAY BE AMENDED PRIOR TO THE TIME OF SALE. THIS TERM SHEET IS NOT AN OFFER TO SELL THESE SECURITIES AND IT IS NOT A SOLICITATION OF AN OFFER TO BUY THESE SECURITIES IN ANY JURISDICTION WHERE THE OFFER OR SALE IS NOT PERMITTED.
87
| No. 7 – Center Pointe Plaza II | ||||||
| Loan Information | Property Information | |||||
| Mortgage Loan Seller: | Barclays Bank PLC | Single Asset/Portfolio: | Single Asset | |||
| Credit Assessment (DBRS/Fitch/Moody’s): | NR/NR/NR | Property Type: | Retail | |||
| Original Principal Balance: | $28,270,000 | Specific Property Type: | Anchored | |||
| Cut-off Date Balance: | $28,270,000 | Location: | Newark, DE | |||
| % of Initial Pool Balance: | 4.3% | Size: | 187,900 SF | |||
| Loan Purpose: | Refinance | Cut-off Date Balance Per SF: | $150.45 | |||
| Borrower Names(1): | Centerpointcap I, LLC; Centerpointcap II, LLC; Centerpointcap III, LLC; Christiana Pit, L.L.C. | Year Built/Renovated: | 2006/NAP | |||
| Sponsors: | Louis Capano, III & Louis Capano Jr. | Title Vesting: | Fee | |||
| Mortgage Rate: | 4.6550% | Property Manager: | Self-managed | |||
| Note Date: | April 20, 2018 | 4thMost Recent Occupancy (As of)(3): | 94.4% (12/31/2014) | |||
| Anticipated Repayment Date: | NAP | 3rdMost Recent Occupancy (As of)(3)(4): | 96.6% (12/31/2015) | |||
| Maturity Date: | May 6, 2028 | 2ndMost Recent Occupancy (As of)(3)(4): | 88.4% (12/31/2016) | |||
| IO Period: | 24 months | Most Recent Occupancy (As of)(3): | 88.9% (12/31/2017) | |||
| Loan Term (Original): | 120 months | Current Occupancy (As of)(3): | 85.2% (3/1/2018) | |||
| Seasoning: | 2 months | |||||
| Amortization Term (Original): | 360 months | Underwriting and Financial Information: | ||||
| Loan Amortization Type: | Interest-only, Amortizing Balloon | |||||
| Interest Accrual Method: | Actual/360 | 4thMost Recent NOI (As of)(5): | $3,634,910 (12/31/2015) | |||
| Call Protection: | L(26),D(90),O(4) | 3rdMost Recent NOI (As of)(5): | $3,757,254 (12/31/2016) | |||
| Lockbox Type: | Hard/Springing Cash Management | 2ndMost Recent NOI (As of)(5): | $3,439,346 (12/31/2017) | |||
| Additional Debt: | None | Most Recent NOI (As of)(5): | $3,404,914 (TTM 2/28/2018) | |||
| Additional Debt Type: | NAP | |||||
| U/W Revenues: | $4,580,308 | |||||
| U/W Expenses: | $876,945 | |||||
| Escrows and Reserves(2): | U/W NOI(5): | $3,703,363 | ||||
| U/W NCF: | $3,503,620 | |||||
| U/W NOI DSCR: | 2.12x | |||||
| Type: | Initial | Monthly | Cap (If Any) | U/W NCF DSCR: | 2.00x | |
| Taxes | $194,163 | $24,270 | NAP | U/W NOI Debt Yield: | 13.1% | |
| Insurance | $53,798 | Springing | NAP | U/W NCF Debt Yield: | 12.4% | |
| Replacement Reserve | $0 | $2,349 | NAP | As-Is Appraised Value: | $48,825,000 | |
| TI/LC Reserve | $270,000 | $11,744 | $270,000 | As-Is Appraisal Valuation Date: | March 15, 2018 | |
| Janosik Rent Abatement/CAM Reserve | $295,516 | $0 | NAP | Cut-off Date LTV Ratio: | 57.9% | |
| Existing TI/LC Reserve | $107,000 | $0 | NAP | LTV Ratio at Maturity or ARD: | 49.7% | |
| (1) | See “Borrowers” section. |
| (2) | See “Escrows” section. |
| (3) | See “Historical Occupancy” section. |
| (4) | The decline in occupancy from 2015 to 2016 is a result of Eastern Mountain Sport’s parent company filing for bankruptcy and the tenant consequently vacating the Center Pointe Plaza II Property |
| (5) | See “Cash Flows” section. |
The Mortgage Loan. The mortgage loan (the “Center Pointe Plaza II Mortgage Loan”) is evidenced by a single promissory note secured by a first mortgage encumbering the fee interest in an anchored retail shopping center located in Newark, Delaware (the “Center Pointe Plaza II Property”). The Center Pointe Plaza II Mortgage Loan was originated on April 20, 2018 by Barclays Bank PLC. The Center Pointe Plaza II Mortgage Loan had an original principal balance of $28,270,000, has an outstanding principal balance as of the Cut-off Date of $28,270,000 and accrues interest at an interest rate of 4.6550%per annum. The Center Pointe Plaza II Mortgage Loan had an initial term of 120 months, has a remaining term of 118 months as of the Cut-off Date and requires interest-only payments for the first 24 payments following origination and, thereafter, requires payments of principal and interest based on a 30-year amortization schedule. The Center Pointe Plaza II Mortgage Loan matures on May 6, 2028.
Following the lockout period, on any date before February 6, 2028, the borrowers have the right to defease the Center Pointe Plaza II Mortgage Loan in whole, but not in part. In addition, the Center Pointe Plaza II Mortgage Loan is prepayable without penalty on or after February 6, 2028.
THE INFORMATION IN THIS STRUCTURAL AND COLLATERAL TERM SHEET IS NOT COMPLETE AND MAY BE AMENDED PRIOR TO THE TIME OF SALE. THIS TERM SHEET IS NOT AN OFFER TO SELL THESE SECURITIES AND IT IS NOT A SOLICITATION OF AN OFFER TO BUY THESE SECURITIES IN ANY JURISDICTION WHERE THE OFFER OR SALE IS NOT PERMITTED.
88
Center Pointe Plaza II
Sources and Uses
| Sources | Uses | |||||||
| Original Loan amount | $28,270,000 | 100.0% | Loan payoff: | $22,674,528 | 80.2% | |||
| Return of equity: | 4,157,144 | 14.7 | ||||||
| Upfront reserves: | 920,476 | 3.3 | ||||||
| Closing costs: | 517,851 | 1.8 | ||||||
| Total Sources | $28,270,000 | 100.0% | Total Uses | $28,270,000 | 100.0% |
The Property.The Center Pointe Plaza II Property consists of a 187,900 square foot anchored retail center located in Newark, Delaware, approximately two miles from the Christiana Mall and across the street from Christiana Hospital. The Center Pointe Plaza II Property is located within a retail corridor on Churchman’s Road and State Route 7. The borrower sponsors developed the Center Pointe Plaza II Property in 2006 alongside the adjacent Center Pointe Plaza I property, which they also own. The Center Pointe Plaza II Property is anchored by Johnny Janosik, PetSmart, La-Z-Boy and Golf Galaxy. Additionally, the Center Pointe Plaza II Property is shadow anchored by a Home Depot and TJ Maxx, which are located at the adjacent Center Pointe Plaza I property. The Center Pointe Plaza II Property contains 953 parking spaces, resulting in a parking ratio of 5.1 spaces per 1,000 square feet of rentable area.
As of March 1, 2018, the Center Pointe Plaza II Property was 85.2% leased to 26 tenants. The largest tenant at the Center Pointe Plaza II Property is Johnny Janosik (15.3% of the U/W base rent). Johnny Janosik is a Delaware-based furniture store established in 1953 and has over 270 employees. In 2016, Johnny Janosik was ranked in the Top 100 furniture stores by Furniture Today and was ranked #2 as a “Large Independent” furniture store by Home Furnishings Business. In addition to the store at the Center Pointe Plaza II Property, Johnny Janosik has three retail locations in Dover and Laurel, Delaware. Johnny Janosik backfilled the space that was originally occupied by Best Buy, which left the Center Pointe Plaza II Property in January 2018 due to size constraints. The second largest tenant is PetSmart (10.8% of the U/W base rent) and has been at the Center Pointe Plaza II Property since 2006 and recently extended its lease in June 2017. The third largest tenant is La-Z-Boy Incorporated (13.3% of the U/W base rent) and has been in at the Center Pointe Plaza II Property since 2005.
The following table presents certain information relating to the tenancy at the Center Pointe Plaza II Property:
Major Tenants
| Tenant Name | Credit Rating (Fitch/Moody’s/ S&P)(1) | Tenant NRSF | % of NRSF | Annual U/W Base Rent PSF(2) | Annual U/W Base Rent(2) | % of Total Annual U/W Base Rent | Sales | Occupancy Cost | Lease Expiration Date |
| Major Tenants | |||||||||
| Johnny Janosik | NR/NR/NR | 30,000 | 16.0% | $20.00 | $600,000 | 15.3% | NAV | NAV | 5/14/2028(3) |
| PetSmart, Inc. | NR/Caa3/CCC+ | 20,063 | 10.7% | $21.00 | $421,323 | 10.8% | NAV | NAV | 5/31/2027(4) |
| La-Z-Boy Incorporated | NR/NR/NR | 18,000 | 9.6% | $29.00 | $522,000 | 13.3% | NAV | NAV | 3/31/2021(5) |
| Golf Galaxy | NR/NR/NR | 15,000 | 8.0% | $22.84 | $342,600 | 8.7% | NAV | NAV | 1/31/2021(6) |
| Firebirds of Wilmington | NR/NR/NR | 7,952 | 4.2% | $27.84 | $221,414 | 5.6% | NAV | NAV | 6/30/2023(7) |
| Total Major Tenants | 91,015 | 48.4% | $23.15 | $2,107,337 | 53.8% | ||||
| Non-Major Tenants | 69,076 | 36.8% | $26.23 | $1,811,939 | 46.2% | ||||
| Occupied Collateral Total | 160,091 | 85.2% | $24.48 | $3,919,276 | 100.0% | ||||
| Vacant Space | 27,809 | 14.8% | |||||||
| Collateral Total | 187,900 | 100.0% | |||||||
| (1) | Certain ratings are those of the parent company whether or not the parent company guarantees the lease. |
| (2) | Annual U/W Base Rent PSF and Annual U/W Base Rent include contractual rent steps totaling $42,628 through March 1, 2019. |
| (3) | Johnny Janosik has four, five-year renewal options. Johnny Janosik has a rent abatement period of five months and a CAM abatement period of six months. At loan closing, $295,516 was deposited into the Rent Abatement/CAM Reserve Account, representing the outstanding rent abatement and CAM abatement due to the largest tenant. |
| (4) | Petsmart has one, five-year renewal option. |
| (5) | La-Z-Boy Incorporated has two, five-year renewal options. |
| (6) | Golf Galaxy has one, five-year renewal option. |
| (7) | Firebirds of Wilmington has three, five-year renewal options. |
THE INFORMATION IN THIS STRUCTURAL AND COLLATERAL TERM SHEET IS NOT COMPLETE AND MAY BE AMENDED PRIOR TO THE TIME OF SALE. THIS TERM SHEET IS NOT AN OFFER TO SELL THESE SECURITIES AND IT IS NOT A SOLICITATION OF AN OFFER TO BUY THESE SECURITIES IN ANY JURISDICTION WHERE THE OFFER OR SALE IS NOT PERMITTED.
89
Center Pointe Plaza II
The following table presents certain information relating to the lease rollover schedule at the Center Pointe Plaza II Property:
Lease Expiration Schedule(1)(2)
| Year Ending December 31, | No. of Leases Expiring | Expiring NRSF | % of Total NRSF | Cumulative Expiring NRSF | Cumulative % of Total NRSF | Annual U/W Base Rent(3) | % of Total Annual U/W Base Rent | Annual U/W Base Rent PSF(3) |
| MTM | 1 | 1,921 | 1.0% | 1,921 | 1.0% | $46,984 | 1.2% | $24.46 |
| 2018 | 2 | 6,000 | 3.2% | 7,921 | 4.2% | $129,000 | 3.3% | $21.50 |
| 2019 | 2 | 6,191 | 3.3% | 14,112 | 7.5% | $143,345 | 3.7% | $23.15 |
| 2020 | 3 | 6,000 | 3.2% | 20,112 | 10.7% | $130,000 | 3.3% | $21.67 |
| 2021 | 8 | 60,800 | 32.4% | 80,912 | 43.1% | $1,694,700 | 43.2% | $27.87 |
| 2022 | 4 | 12,578 | 6.7% | 93,490 | 49.8% | $317,267 | 8.1% | $25.22 |
| 2023 | 2 | 9,952 | 5.3% | 103,442 | 55.1% | $263,414 | 6.7% | $26.47 |
| 2024 | 1 | 1,768 | 0.9% | 105,210 | 56.0% | $45,029 | 1.1% | $25.47 |
| 2025 | 0 | 0 | 0.0% | 105,210 | 56.0% | $0 | 0.0% | $0.00 |
| 2026 | 1 | 4,000 | 2.1% | 109,210 | 58.1% | $128,214 | 3.3% | $32.05 |
| 2027 | 1 | 20,063 | 10.7% | 129,273 | 68.8% | $421,323 | 10.8% | $21.00 |
| 2028 | 1 | 30,000 | 16.0% | 159,273 | 84.8% | $600,000 | 15.3% | $20.00 |
| Thereafter(4) | 0 | 818 | 0.4% | 160,091 | 85.2% | $0 | 0.0% | $0.00 |
| Vacant | 0 | 27,809 | 14.8% | 187,900 | 100.0% | $0 | 0.0% | $0.00 |
| Total/Weighted Average | 26 | 187,900 | 100.0% | $3,919,276 | 100.0% | $24.48 |
| (1) | Information obtained from the underwritten rent roll. |
| (2) | Certain tenants may have lease termination options that are exercisable prior to the originally stated expiration date of the subject lease and that are not considered in the Lease Expiration Schedule. |
| (3) | Weighted Average Annual U/W Base Rent PSF and Total Annual U/W Base Rent exclude vacant space. |
| (4) | Expiring NRSF after 2028 includes 818 square feet of sprinkler rooms. |
The following table presents historical occupancy percentages at the Center Pointe Plaza II Property:
Historical Occupancy
12/31/2014(1) | 12/31/2015(1) | 12/31/2016(1)(2) | 12/31/2017(1) | 3/1/2018(3) |
| 94.4% | 96.6% | 88.4% | 88.9% | 85.2% |
| (1) | Information obtained from the borrowers. |
| (2) | The decline in occupancy from 2015 to 2016 is a result of Eastern Mountain Sport’s parent company filing for bankruptcy and the tenant consequently vacating the Center Pointe Plaza II Property. |
| (3) | Information obtained from the underwritten rent roll. |
Operating History and Underwritten Net Cash Flow. The following table presents certain information relating to the historical operating performance and the underwritten net cash flow at the Center Pointe Plaza II Property:
Cash Flow Analysis
| 2015 | 2016(2) | 2017(2) | TTM 2/28/2018(3) | U/W(3) | % of U/W Effective Gross Income | U/W $ per SF | |||||||||
| Base Rent(1) | $3,857,932 | $3,993,878 | $3,713,372 | $3,716,177 | $3,919,276 | 85.6% | $20.86 | ||||||||
| Grossed Up Vacant Space | 0 | 0 | 0 | 0 | 622,582 | 13.6 | 3.31 | ||||||||
| Total Reimbursables | 571,029 | 522,384 | 539,433 | 543,414 | 661,033 | 14.4 | 3.52 | ||||||||
| Other Income | 2,471 | 2,966 | 2,465 | 0 | 0 | 0.0 | 0.00 | ||||||||
| Less Vacancy & Credit Loss | 0 | 0 | 0 | 0 | (622,582)(4) | (13.6) | (3.31) | ||||||||
| Effective Gross Income | $4,431,432 | $4,519,228 | $4,255,270 | $4,259,591 | $4,580,308 | 100.0% | $24.38 | ||||||||
| Total Operating Expenses | $796,522 | $761,974 | $815,924 | $854,677 | $876,945 | 19.1% | $4.67 | ||||||||
| Net Operating Income | $3,634,910 | $3,757,254 | $3,439,346 | $3,404,914 | $3,703,363 | 80.9% | $19.71 | ||||||||
| TI/LC | 0 | 0 | 0 | 0 | 171,558(5) | 3.7 | 0.91 | ||||||||
| Capital Expenditures | 0 | 0 | 0 | 0 | 28,185 | 0.6 | 0.15 | ||||||||
| Net Cash Flow | $3,634,910 | $3,757,254 | $3,439,346 | $3,404,914 | $3,503,620 | 76.5% | $18.65 | ||||||||
| NOI DSCR | 2.08x | 2.15x | 1.97x | 1.95x | 2.12x | ||||||||||
| NCF DSCR | 2.08x | 2.15x | 1.97x | 1.95x | 2.00x | ||||||||||
| NOI DY | 12.9% | 13.3% | 12.2% | 12.0% | 13.1% | ||||||||||
| NCF DY | 12.9% | 13.3% | 12.2% | 12.0% | 12.4% |
| (1) | Historical Base Rent is inclusive of free rent adjustments of $119,464 in 2015, $51,410 in 2016 and $269,168 in 2017. |
| (2) | The decline in Base Rent and Net Operating Income from 2016 to 2017 was driven partly by Eastern Mountain Sport vacating the Center Pointe Plaza II Property in 2016. |
| (3) | The increase in Net Operating Income from TTM 2/28/2018 to U/W was driven by (i) Johnny Janosik commencing its lease on May 15, 2018and (ii) the inclusion ofcontractual rent steps totaling $42,628 through March 2019. |
| (4) | The underwritten economic vacancy is 12.0%. The Center Pointe Plaza II Property was 85.2% leased as of March 1, 2018. |
| (5) | UW TI/LC is inclusive of a TI/LC credit equivalent to one-tenth of the upfront TI/LC reserve of $270,000. |
THE INFORMATION IN THIS STRUCTURAL AND COLLATERAL TERM SHEET IS NOT COMPLETE AND MAY BE AMENDED PRIOR TO THE TIME OF SALE. THIS TERM SHEET IS NOT AN OFFER TO SELL THESE SECURITIES AND IT IS NOT A SOLICITATION OF AN OFFER TO BUY THESE SECURITIES IN ANY JURISDICTION WHERE THE OFFER OR SALE IS NOT PERMITTED.
90
Center Pointe Plaza II
Appraisal. The appraiser concluded to an “as-is” value for the Center Pointe Plaza II Property of $48,825,000 as of March 15, 2018. The appraiser also concluded to an “as-stabilized” value for the Center Pointe Plaza II Property of $52,375,000 as of April 1, 2019.
Environmental Matters. According to a Phase I environmental site assessment dated March 16, 2018, there was no evidence of any recognized environmental conditions at the Center Pointe Plaza II Property.
Market Overview and Competition.The Center Pointe Plaza II Property is located in Newark, Delaware, approximately 10.2 miles southwest of Wilmington, Delaware, 40.8 miles southwest of Philadelphia, Pennsylvania and 6.1 miles west of the Wilmington Airport. The Center Pointe Plaza II Property is located directly west of an interchange of Interstate 95 and Route 7, within a retail corridor on Churchman’s Road, which has a traffic count of 23,000 to 25,900 vehicles per day, and State Route 7, which has a traffic count of 48,000 vehicles per day. Center Pointe Plaza II is located across the street from Christiana Hospital, and is approximately two miles north of Christiana Mall. In addition to the retail centers, there are various multi-family developments and office parks. According to the appraisal, the 2017 estimated average household income within a three- and five-mile radius of the Center Pointe Plaza II Property was $73,593 and $77,812, respectively, and the estimated 2017 population within a three- and five-mile radius of the Center Pointe Plaza II Property was 72,314 and 209,736, respectively.
According to a third party market research report, the Center Pointe Plaza II Property is situated within the South New Castle County retail submarket of the overall Philadelphia retail market. As of fourth quarter 2017, the submarket reported total inventory of approximately 15.9 million square feet with a 5.4% vacancy rate and an average asking net rental rate of $16.57 per square foot. Based on recent leasing at the Center Pointe Plaza II Property as well as comparable rentals in the market, the appraiser concluded market rents that range from $22.00 per square foot to $35.00 per square foot depending on the tenant category.
The table below presents certain information relating to five comparable properties to the Center Pointe Plaza II Property identified by the appraiser:
Competitive Set(1)
Center Pointe (Subject) | Christiana Center | Center Pointe Plaza I | Christiana Fashion Center | Christiana Town Center | University Plaza | |
| Location | Newark, DE | Newark, DE | Newark, DE | Newark, DE | Newark, DE | Newark, DE |
| Distance from Subject | -- | 2.4 miles | 0.0 miles | 2.4 miles | 3.4 miles | 3.0 miles |
| Property Type | Anchored | Power Center | Anchored | Power Center | Anchored | Anchored |
| Year Built/Renovated | 2006/NAP | 1998/2004 | 2006/NAP | 2015/NAP | 2004/NAP | 1971/1989 |
| Anchors | Johnny Janosik, PetSmart, La-Z-Boy | Costco, Dicks, PETCO | Home Depot, Modell’s, T.J. Maxx | Best Buy, Marshalls/Home Goods, Raymour & Flanigan | Boscov’s, Bed Bath & Beyond, Staples | Burlington Coat Factory, Acme Market, Harbor Freight Tools |
| Total GLA | 187,900 SF | 302,779 SF | 44,264 SF | 113,821 SF | 131,570 SF | 91,211 SF |
| Total Occupancy | 85.2%(2) | 98.0% | 100.0% | 76.0% | 91.0% | 100.0% |
| (1) | Information obtained from the appraisal. |
| (2) | Information obtained from underwritten rent roll. |
The Borrowers.The borrowers for the Center Pointe Plaza II Mortgage Loan are Centerpointcap I, LLC, Centerpointcap II, LLC, Centerpointcap III, LLC and Christiana Pit, L.L.C., each a Delaware limited liability company and single purpose entity. The managing member of each borrower is a newly-formed, special purpose entity with one independent director. The Centerpointcap I, LLC, Centerpointcap II, LLC and Centerpointcap III, LLC borrowers own the Center Pointe Plaza II Property (excluding the Red Lobster) as tenants-in-common. Such borrowers have waived their respective rights of partition. The three tenant-in-common entities are owned and controlled by two individuals. Legal counsel to the borrowers delivered a non-consolidation opinion in connection with the origination of the Center Pointe Plaza II Mortgage Loan. Louis J. Capano, III and Louis J. Capano, Jr. have jointly and severally guaranteed certain nonrecourse carveouts under the Center Pointe Plaza II Mortgage Loan.
The Borrower Sponsors.The borrower sponsors are Louis Capano, III and Louis Capano, Jr., who are the owners of Capano Management Company, founded in 1947. Capano Management Company predominantly develops residential and commercial real estate in Delaware and Florida. Capano Management and its affiliated companies own and manage over 2 million square feet of retail and office space and over 4,800 multifamily units with an additional 1,089 multifamily units under development. The borrower sponsor, Louis J. Capano, III was one of several partners involved in a land development project, where the unrelated loan was subject to a discounted payoff. The borrower sponsor, Louis J. Capano, Jr. had a loan modification for an unrelated property in 2013. See“Description of the Mortgage Pool— Loan Purpose; Default History, Bankruptcy Issues and Other Proceedings and Litigation and Other Considerations”in the Preliminary Prospectus.
Escrows.The Center Pointe Plaza II Mortgage Loan documents provide for upfront reserves of $194,163 for real estate taxes, $53,798 for insurance, $270,000 for tenant improvements and leasing commissions (“TI/LC”), $295,516 for rent abatements and CAM abatements relating to the Johnny Janosik lease and $107,000 for outstanding leasing commissions for Johnny Janosik. The Center Pointe Plaza II Mortgage Loan documents also provide for ongoing monthly reserves of $24,270 for real estate taxes, $2,349 for replacement reserves and $11,744 for general TI/LC (subject to a cap of $270,000).
THE INFORMATION IN THIS STRUCTURAL AND COLLATERAL TERM SHEET IS NOT COMPLETE AND MAY BE AMENDED PRIOR TO THE TIME OF SALE. THIS TERM SHEET IS NOT AN OFFER TO SELL THESE SECURITIES AND IT IS NOT A SOLICITATION OF AN OFFER TO BUY THESE SECURITIES IN ANY JURISDICTION WHERE THE OFFER OR SALE IS NOT PERMITTED.
91
Center Pointe Plaza II
Lockbox and Cash Management.The Center Pointe Plaza II Mortgage Loan is structured with a hard lockbox and springing cash management. The borrowers were required at origination to deliver letters to all tenants at the Center Pointe Plaza II Property directing them to pay all rents directly into a lender-controlled lockbox account. All other funds received by the borrowers or manager are required to be deposited in the lockbox account within one business day following receipt. During the occurrence and continuance of a Trigger Period (as defined below), all funds are required to be swept each business day into the cash management account controlled by the lender and disbursed on each payment date in accordance with the Center Pointe Plaza II Mortgage Loan documents, with all excess cash flow to be deposited to an excess cash reserve to be held as additional security for the Center Pointe Plaza II Mortgage Loan.
A “Trigger Period” will commence upon the earlier of the following:
| (i) | the occurrence of an event of default; or |
| (ii) | the amortizing net cash flow debt service coverage ratio falling below 1.20x. |
A Trigger Period will end upon the occurrence of the following:
| ● | with regard to clause (i), the cure of such event of default; or |
| ● | with regard to clause (ii), the amortizing net cash flow debt service coverage ratio being equal to or greater than 1.25x for one calendar quarter. |
Property Management. The Center Pointe Plaza II Property is managed by Capano Management Company, an affiliate of the borrowers.
Assumption. The borrowers have the one-time right to transfer the Center Pointe Plaza II Property, provided that certain conditions are satisfied, including (i) no event of default has occurred and is continuing; (ii) the lender has reasonably determined that the proposed transferee and guarantor satisfy the lender’s credit review and underwriting standards, taking into consideration the transferee’s experience, financial strength and general business standing; and (iii) if required by the lender, rating agency confirmation from DBRS, Fitch and Moody’s that the transfer will not result in a downgrade, withdrawal or qualification of the respective ratings assigned to the Series WFCM 2018-C45 certificates.
Partial Release. Not permitted.
Real Estate Substitution.Not permitted.
Subordinate and Mezzanine Indebtedness.Not permitted.
Ground Lease. None.
Terrorism Insurance.The Center Pointe Plaza II Mortgage Loan documents require that the “all risk” insurance policies required to be maintained by the borrower provide coverage for terrorism in an amount equal to the full replacement cost of the Center Pointe Plaza II Property. The Center Pointe Plaza II Mortgage Loan documents also require business interruption insurance covering no less than the 18-month period following the occurrence of a casualty event, together with a 12-month extended period of indemnity.
THE INFORMATION IN THIS STRUCTURAL AND COLLATERAL TERM SHEET IS NOT COMPLETE AND MAY BE AMENDED PRIOR TO THE TIME OF SALE. THIS TERM SHEET IS NOT AN OFFER TO SELL THESE SECURITIES AND IT IS NOT A SOLICITATION OF AN OFFER TO BUY THESE SECURITIES IN ANY JURISDICTION WHERE THE OFFER OR SALE IS NOT PERMITTED.
92
(THIS PAGE INTENTIONALLY LEFT BLANK)
THE INFORMATION IN THIS STRUCTURAL AND COLLATERAL TERM SHEET IS NOT COMPLETE AND MAY BE AMENDED PRIOR TO THE TIME OF SALE. THIS TERM SHEET IS NOT AN OFFER TO SELL THESE SECURITIES AND IT IS NOT A SOLICITATION OF AN OFFER TO BUY THESE SECURITIES IN ANY JURISDICTION WHERE THE OFFER OR SALE IS NOT PERMITTED.
93
Addison Ridge Apartments - Phase II |
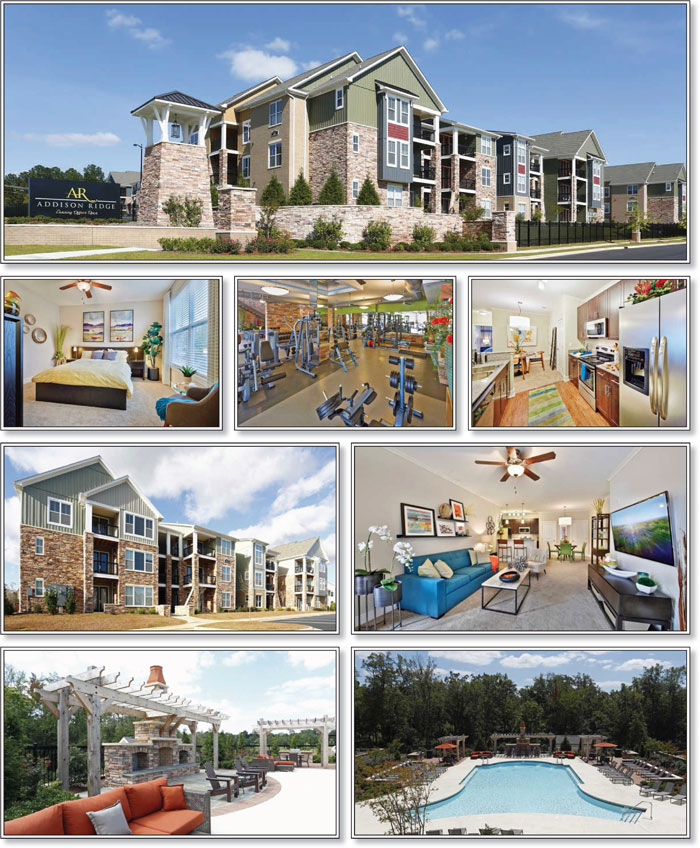
THE INFORMATION IN THIS STRUCTURAL AND COLLATERAL TERM SHEET IS NOT COMPLETE AND MAY BE AMENDED PRIOR TO THE TIME OF SALE. THIS TERM SHEET IS NOT AN OFFER TO SELL THESE SECURITIES AND IT IS NOT A SOLICITATION OF AN OFFER TO BUY THESE SECURITIES IN ANY JURISDICTION WHERE THE OFFER OR SALE IS NOT PERMITTED.
94
Addison Ridge Apartments - Phase II |
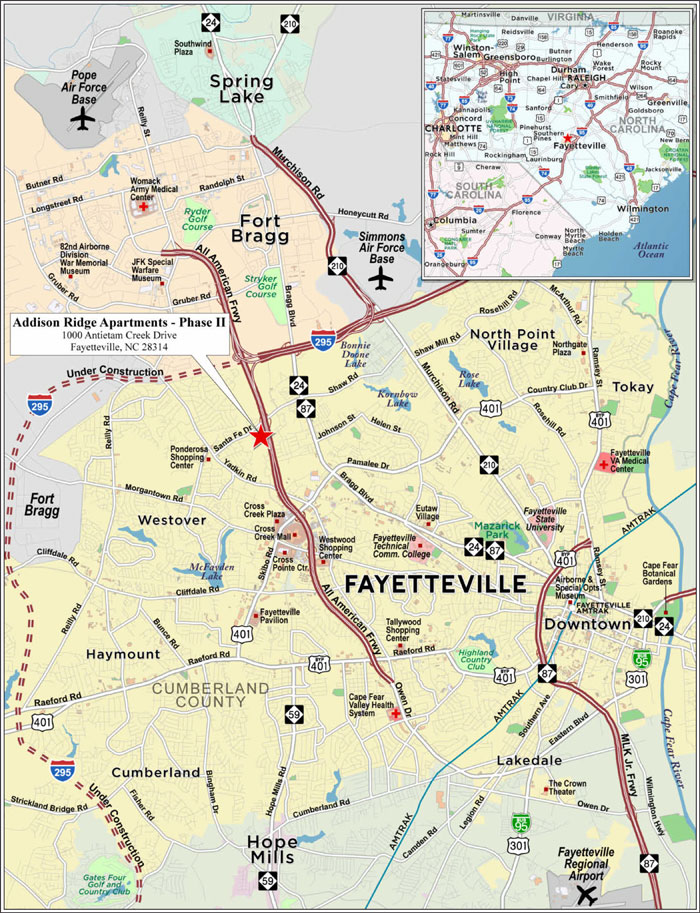
THE INFORMATION IN THIS STRUCTURAL AND COLLATERAL TERM SHEET IS NOT COMPLETE AND MAY BE AMENDED PRIOR TO THE TIME OF SALE. THIS TERM SHEET IS NOT AN OFFER TO SELL THESE SECURITIES AND IT IS NOT A SOLICITATION OF AN OFFER TO BUY THESE SECURITIES IN ANY JURISDICTION WHERE THE OFFER OR SALE IS NOT PERMITTED.
95
| No. 8 – Addison Ridge Apartments - Phase II | ||||||||
| Loan Information | Property Information | |||||||
| Mortgage Loan Seller: | Rialto Mortgage Finance, LLC | Single Asset/Portfolio: | Single Asset | |||||
| Credit Assessment (DBRS/Fitch/Moody’s): | NR/NR/NR | Property Type: | Multifamily | |||||
| Original Principal Balance: | $25,000,000 | Specific Property Type: | Garden | |||||
| Cut-off Date Principal Balance: | $25,000,000 | Location: | Fayetteville, NC | |||||
| % of Initial Pool Balance: | 3.8% | Size: | 214 Units | |||||
| Loan Purpose: | Refinance | Cut-off Date Principal Balance Per Unit: | $116,822 | |||||
| Borrower Name: | Santa Fe Properties II SPE, LLC | Year Built/Renovated: | 2016/NAP | |||||
| Borrower Sponsor: | Charles F. Weber | Title Vesting: | Fee | |||||
| Mortgage Rate: | 5.3600% | Property Manager: | Self-managed | |||||
| 4thMost Recent Occupancy (As of)(2): | NAV | |||||||
| Note Date: | May 16, 2018 | 3rdMost Recent Occupancy (As of)(2): | NAV | |||||
| Anticipated Repayment Date: | NAP | 2ndMost Recent Occupancy (As of)(2): | NAV | |||||
| Maturity Date: | June 6, 2028 | Most Recent Occupancy (As of)(2): | NAV | |||||
| IO Period: | 48 months | Current Occupancy (As of): | 98.1% (5/31/2018) | |||||
| Loan Term (Original): | 120 months | |||||||
| Seasoning: | 1 month | Underwriting and Financial Information: | ||||||
| Amortization Term (Original): | 360 months | 4thMost Recent NOI (As of)(2): | NAV | |||||
| Loan Amortization Type: | Interest-only, Amortizing Balloon | 3rdMost Recent NOI (As of)(2): | NAV | |||||
| Interest Accrual Method: | Actual/360 | 2ndMost Recent NOI (As of)(2): | NAV | |||||
| Call Protection: | L(25),D(91),O(4) | Most Recent NOI (As of): | $1,856,564 (TTM 5/31/2018) | |||||
| Lockbox Type: | Springing | |||||||
| Additional Debt: | None | U/W Revenues: | $3,212,219 | |||||
| Additional Debt Type: | NAP | U/W Expenses: | $890,227 | |||||
| U/W NOI: | $2,321,992 | |||||||
| U/W NCF: | $2,279,192 | |||||||
| U/W NOI DSCR: | 1.38x | |||||||
| Escrows and Reserves(1): | U/W NCF DSCR: | 1.36x | ||||||
| U/W NOI Debt Yield: | 9.3% | |||||||
| Type: | Initial | Monthly | Cap (If Any) | U/W NCF Debt Yield: | 9.1% | |||
| Taxes | $122,848 | $19,500 | NAP | As-Is Appraised Value: | $35,800,000 | |||
| Insurance | $18,894 | $3,599 | NAP | As-Is Appraisal Valuation Date: | March 27, 2018 | |||
| Replacement Reserves | $0 | $3,567 | NAP | Cut-off Date LTV Ratio: | 69.8% | |||
| LTV Ratio at Maturity or ARD: | 63.6% | |||||||
| (1) | See “Escrows” section. |
| (2) | Historical occupancy, operating and financial information is unavailable as the Addison Ridge Apartments – Phase II Property (as defined below) was constructed in 2016-2017. |
The Mortgage Loan. The mortgage loan (the “Addison Ridge Apartments - Phase II Mortgage Loan”) is evidenced by a single promissory note that is secured by a first mortgage encumbering an eight building, garden-style multifamily property located in Fayetteville, North Carolina (the “Addison Ridge Apartments - Phase II Property”). The Addison Ridge Apartments - Phase II Mortgage Loan was originated on May 16, 2018 by Rialto Mortgage Finance, LLC. The Addison Ridge Apartments - Phase II Mortgage Loan had an original principal balance of $25,000,000, has an outstanding principal balance as of the Cut-off Date of $25,000,000 and accrues interest at an interest rate of 5.3600%per annum. The Addison Ridge Apartments - Phase II Mortgage Loan had an initial term of 120 months, has a remaining term of 119 months as of the Cut-off Date and requires payments of interest-only for the first 48 months followed by payments of principal and interest based on a 30-year amortization schedule. The Addison Ridge Apartments - Phase II Mortgage Loan matures on June 6, 2028.
Following the lockout period, the borrower has the right to defease the Addison Ridge Apartments - Phase II Mortgage Loan in whole, but not in part, on any date before March 6, 2028. In addition, the Addison Ridge Apartments – Phase II Mortgage Loan is prepayable without penalty on or after March 6, 2028.
THE INFORMATION IN THIS STRUCTURAL AND COLLATERAL TERM SHEET IS NOT COMPLETE AND MAY BE AMENDED PRIOR TO THE TIME OF SALE. THIS TERM SHEET IS NOT AN OFFER TO SELL THESE SECURITIES AND IT IS NOT A SOLICITATION OF AN OFFER TO BUY THESE SECURITIES IN ANY JURISDICTION WHERE THE OFFER OR SALE IS NOT PERMITTED.
96
Addison Ridge Apartments - Phase II |
Sources and Uses
| Sources | Uses | |||||||
| Original loan amount | $25,000,000 | 100.0% | Loan Payoff | $20,052,548 | 80.2% | |||
| Closing Costs | 344,782 | 1.4 | ||||||
| Reserves | 141,743 | 0.6 | ||||||
| Return of Equity | 4,460,927 | 17.8 | ||||||
| Total Sources | $25,000,000 | 100.0% | Total Uses | $25,000,000 | 100.0% |
The Property.The Addison Ridge Apartments - Phase II Property is an eight building, three- and four-story, 214 unit Class A+ garden style multifamily property located in Fayetteville, North Carolina. The Addison Ridge Apartments - Phase II Property was constructed in 2016-2017 and is situated on a 21.3-acre site. The Addison Ridge Apartments - Phase II Property’s residential unit mix includes 73 one-bedroom units, 113 two-bedroom units, and 28 three-bedroom units, with an average unit size of 1,110 square feet. The Addison Ridge Apartments - Phase II Property offers certain “all inclusive” units whereby the landlord pays for electricity and water/sewer charges in exchange for an additional rent premium of $225 to $250 per month. The Addison Ridge Apartments - Phase II Property also offers certain fully-furnished “corporate” units whereby landlord pays for all utilities, including cable and internet in exchange for an additional rent premium of $900 to $1,000 per month. As of March 27, 2018, the Addison Ridge Apartments - Phase II Property had 33 all-inclusive units and 9 corporate units. According to the sponsor, approximately 53.7% of tenants at the Addison Ridge Apartments - Phase II Property are either active or retired members of the military. See “Description of the Mortgage Pool—Mortgage Pool Characteristics – Property Types - Multifamily Properties” in the Prospectus.
Community amenities include a clubhouse which includes a fitness center with on-site personal trainer, laundry room, business center, conference room, game room, coffee lounge, 30 seat movie theater, yoga studio, a pool and the leasing office. The community amenities, including the existing leasing office which is located in the clubhouse (collectively, the “Common Facilities”), are located in Phase I of Addison Ridge, which is not part of the Addison Ridge Apartments - Phase II Mortgage Loan collateral. All amenities, including the clubhouse, are available to the tenants of the Addison Ridge Apartments - Phase II Property pursuant to recorded perpetual easement agreements (collectively, the “Easements”), which provide for, among other things, access to the Addison Ridge Apartments - Phase II Property and Common Facilities, use of the Common Facilities and sharing of expenses relating thereto. The Easements also grant borrower the access and use of the leasing office, which is a part of the Common Facilities. Pursuant to an amendment, the Easements require the three owners of Phases I-III to enter into a common management agreement to provide for the management and operation of the Common Facilities. A form of common management has been prepared and approved by the three property owners and the loan documents require the borrower to use its best efforts to enter into the agreement within one year of closing after final approval is received from the Phase I lender. Any foreclosing lender on any one of the three phases of Addison Ridge will have a veto right over the selection of the manager of the Common Facilities. The loan documents and the common management agreement for the Common Facilities each require the borrower to cause the leasing of the three phases of Addison Ridge to occur in an unbiased manner and to use its good faith and commercially reasonable efforts to keep the occupancy levels at each phase substantially the same. The documents also contain non-poaching/steering language.
Unit amenities include 9 foot ceilings, fully-equipped kitchens with granite countertops and a stainless steel appliance packages, ceiling fans, walk-in closets, linen closets, washer/dryer connections, balconies and patios; select units have pantries. The Addison Ridge Apartments - Phase II Property also features approximately 402 parking spaces (1.9 spaces per unit), of which 12 are detached garages. As of May 31, 2018, the Addison Ridge Apartments - Phase II Property was 98.1% occupied.
The borrower acquired the land as vacant in 2011 for $2.4 million, and subsequently invested approximately $28.3 million to develop the Addison Ridge Apartments - Phase II Property. This included approximately $25.0 million in hard costs and $3.0 million in soft costs. The total cost basis of approximately $30.0 million excluded $600,000 paid to a borrower sponsor-affiliate as a development fee. The Addison Ridge Apartments - Phase II Property is part of a larger multi-phase apartment community that added the Addison Ridge Phase I in 2014, which included 211 units, and the Addison Ridge Apartments - Phase II Property in 2016. Additionally, the borrower has plans to develop Addison Ridge Phase III, which is expected to include 210 units.
The following table presents certain information relating to the unit mix of the Addison Ridge Apartments - Phase II Property:
Apartment Unit Summary(1)
| Unit Type | No. of Units | % of Total Units | Average Unit Size (SF) | Average Monthly Rent per Unit |
| One Bedroom / One Bath | 73 | 34.1% | 942 | $1,041 |
| Two Bedroom / Two Bath | 113 | 52.8% | 1,154 | $1,228 |
| Three Bedroom / Two Bath | 28 | 13.1% | 1,373 | $1,460 |
| Total/Weighted Average | 214 | 100.0% | 1,110 | $1,195 |
| (1) | Information obtained from the underwritten rent roll. |
THE INFORMATION IN THIS STRUCTURAL AND COLLATERAL TERM SHEET IS NOT COMPLETE AND MAY BE AMENDED PRIOR TO THE TIME OF SALE. THIS TERM SHEET IS NOT AN OFFER TO SELL THESE SECURITIES AND IT IS NOT A SOLICITATION OF AN OFFER TO BUY THESE SECURITIES IN ANY JURISDICTION WHERE THE OFFER OR SALE IS NOT PERMITTED.
97
Addison Ridge Apartments - Phase II |
The following table presents historical occupancy percentages at the Addison Ridge Apartments - Phase II Property:
Historical Occupancy
12/31/2015(1) | 12/31/2016(1) | 12/31/2017(1) | 5/31/2018(2) |
| NAP | NAP | NAP | 98.1% |
| (1) | The Addison Ridge Apartments - Phase II Property (as defined below) was constructed in 2016-2017; therefore, no historical occupancy is available. |
| (2) | Information obtained from the underwritten rent roll. |
Operating History and Underwritten Net Cash Flow.The following table presents certain information relating to the historical operating performance and Underwritten Net Cash Flow at the Addison Ridge Apartments - Phase II Property:
Cash Flow Analysis
| TTM 5/31/2018(1) | U/W | % of U/W Effective Gross Income | U/W $ per Unit | |
| Base Rent | $2,425,485 | $3,005,781 | 93.6% | $14,046 |
| Grossed Up Vacant Space | 647,456 | 63,030 | 2.0 | 295 |
| Concessions | (45,838) | (43,235) | (1.3) | (202) |
| Other Income(2) | 303,763 | 418,614 | 13.0 | 1,956 |
| Less Vacancy & Credit Loss(3) | (647,782) | (231,970) | (7.2) | (1,084) |
| Effective Gross Income | $2,683,083 | $3,212,219 | 100.0% | $15,010 |
| Total Operating Expenses(4) | $826,520 | $890,227 | 27.7% | $4,160 |
|
|
|
| |
| Net Operating Income | $1,856,564 | $2,321,992 | 72.3% | $10,850 |
| Capital Expenditures | 0 | 42,800 | 1.3 | 200 |
| Net Cash Flow | $1,856,564 | $2,279,192 | 71.0% | $10,650 |
| NOI DSCR | 1.11x | 1.38x | ||
| NCF DSCR | 1.11x | 1.36x | ||
| NOI DY | 7.4% | 9.3% | ||
| NCF DY | 7.4% | 9.1% |
| (1) | The Addison Ridge Apartments - Phase II Property was developed in 2016 so there is no historical financial information. |
| (2) | Other income includes corporate and all-inclusive rent premiums, application fees, administrative/amenity fees, cable income, termination fees, pet fees, trash reimbursement, short-term premiums and laundry income. |
| (3) | The underwritten economic vacancy is 9.0%. The Addison Ridge Apartments - Phase II Property was 98.1% occupied as of May 31, 2018. |
| (4) | Total Operating Expenses include expenses related to the Common Facilities. |
Appraisal.As of the appraisal valuation date of March 27, 2018, the Addison Ridge Apartments - Phase II Property had an “as-is” appraised value of $35,800,000.
Environmental Matters.According to a Phase I environmental assessment dated April 13, 2018, there was no evidence of any recognized environmental conditions at the Addison Ridge Apartments - Phase II Property.
Market Overview and Competition.The Addison Ridge Apartments - Phase II Property is located in Fayetteville, Cumberland County, North Carolina, within the Fayetteville metropolitan statistical area (the “Fayetteville MSA”). The Fayetteville MSA economy is driven by Fort Bragg, a major U.S. Army installation. Encompassing more than 160,000 acres (500 square miles) in northwest Fayetteville, Fort Bragg is the nation’s largest army installation, home to the U.S. Army’s 82nd Airborne Division, Special Operation Command, Forces Command, and Reserve Command. Fort Bragg employs approximately 15,500 civilians, has an annual payroll of $3.5 billion, and an annual economic impact estimated at $13 billion. There are 48,000 active duty, 12,500 reserve and temporary duty members, and 99,000 military retirees residing in the surrounding area, plus 63,000+ family members. The Fayetteville area has a large and growing defense industry and was ranked in the Top 5 defense industry development areas in the US for 2010. Eight of the ten top American defense contractors are located in the area, including Lockheed Martin, Boeing, Northrop Grumman, General Dynamics, and L-3 Communications. Other major employers include Cape Fear Valley Health System, Cumberland County Board of Education, Wal-Mart Associates Inc., and Cumberland County Government. As of October 2017, the Fayetteville MSA unemployment rate was 5.2%, in comparison to the state and national unemployment rate of 4.1%.
Access to the region is provided by major thoroughfares which include Martin Luther King Jr. Freeway, Interstate 95, Interstate 95 Business, Interstate 295 (partially completed), and State Highway 24. The neighborhood is comprised of a mix of residential and commercial development. The major thoroughfares are generally lined with retail, office, and other commercial uses. The major super regional mall in the area is Cross Creek Mall, which is anchored by Belk, JCPenney, Macy’s, and Sears and includes over 150 specialty retailers. The mall is located in the main commercial artery at the intersection of Morganton Road and Skibo Road, All-American Expressway and between Interstate 95 and Fort Bragg with numerous big box stores in close proximity, which include Sam’s Club, Walmart Supercenter, Lowe’s Home Improvement, Target, Barnes and Nobles, The Home Depot, Best Buy, and AMC Market Fair 15.
THE INFORMATION IN THIS STRUCTURAL AND COLLATERAL TERM SHEET IS NOT COMPLETE AND MAY BE AMENDED PRIOR TO THE TIME OF SALE. THIS TERM SHEET IS NOT AN OFFER TO SELL THESE SECURITIES AND IT IS NOT A SOLICITATION OF AN OFFER TO BUY THESE SECURITIES IN ANY JURISDICTION WHERE THE OFFER OR SALE IS NOT PERMITTED.
98
Addison Ridge Apartments - Phase II |
According to a third party market research report, the 2018 estimated population within a one-, three- and five-mile radius of the Addison Ridge Apartments - Phase II Property is 5,223, 49,933 and 135,864, respectively, with an average household income within a one-, three- and five-mile radius of the Addison Ridge Apartments - Phase II Property of approximately $59,826, $55,619 and $56,683, respectively.
According to a third party market research report the Addison Ridge Apartments - Phase II Property is located within the Fayetteville multifamily market, which reported a vacancy rate of 6.8% as of fourth quarter 2017, with an average asking rental rate of $777 per unit.
The following table presents certain information relating to some comparable multifamily properties for the Addison Ridge Apartments - Phase II Property:
Competitive Set(1)
| Average Rent (per unit) | |||||||||
| Location | Distance to Subject | Property Type | Number of Units | 1 BR | 2 BR | 3 BR | Overall Average PSF | Total Occupancy | |
| Addison Ridge Apartments – Phase II (Subject) | Fayetteville, NC | -- | Garden | 214 | $1,041 | $1,228 | $1,460 | $1.08 | 98.1% |
| Westlake at Morganton | Fayetteville, NC | 2.7 miles | Garden | 327 | $960 | $1,081 | $1,205 | $0.91 | 98.0% |
| Plantation at Fayetteville | Fayetteville, NC | 0.3 miles | Garden | 360 | $875 | $1,025 | $1,150 | $0.85 | 95.0% |
Addison Ridge I | Fayetteville, NC | 0.0 miles | Garden | 211 | $1,009 | $1,194 | $1,450 | $1.05 | 96.0% |
| Preserve at Grand Oaks | Fayetteville, NC | 2.7 miles | Garden | 315 | $887 | $1,028 | $1,150 | $0.81 | 97.0% |
| Jamestown Commons | Fayetteville, NC | 2.4 miles | Garden | 216 | $829 | $952 | $999 | $0.88 | 98.0% |
| (1) | Information obtained from the appraisal and the underwritten rent roll. |
The Borrower.The borrower is Santa Fe Properties II SPE, LLC, a single purpose Delaware limited liability company with two independent directors. Legal counsel to the borrower delivered a non-consolidation opinion in connection with the origination of the Addison Ridge Apartments - Phase II Mortgage Loan. The borrower is wholly owned by sole member Santa Fe Properties II, LLC which is owned by Charles F. Weber (50.1%, managing member), and Betty A. Weber, LLC (49.9%). Betty A. Weber, LLC is wholly owned by Betty A. Weber. Charles F. Weber is the guarantor of certain nonrecourse carveouts under the Addison Ridge Apartments – Phase II Mortgage Loan.
The Borrower Sponsor. The borrower sponsor, Charles F. Weber, has over 20 years’ experience in the commercial and multifamily real estate industry. Mr. Weber is a local owner and operator in Fayetteville and is the only developer of Class A+ apartment communities in the area.
Escrows.The loan documents provided for upfront reserve in the amount of $122,848 for real estate taxes, and $18,894 for insurance premiums. The loan documents require ongoing monthly deposits of $19,500 for real estate taxes, $3,599 for insurance premiums and $3,567 for replacement reserves.
Lockbox and Cash Management.Upon the occurrence of a Cash Management Trigger Event (as defined below) the borrower will be required to establish a lender-controlled lockbox account and instruct each tenant to deposit rents into such lockbox account. Additionally, all revenues received by the borrower or the property manager relating to Addison Ridge Apartments – Phase II Property are required to be deposited into the lockbox account within two business days of receipt. Other than during a Cash Sweep Event (as defined below), all excess funds on deposit are disbursed to the borrower.
A “Cash Management Trigger Event” will commence upon:
| (i) | an event of default; |
| (ii) | the borrower’s second late debt service payment in a twelve (12) month period; |
| (iii) | any bankruptcy action of the borrower, the guarantor or property manager; or |
| (iv) | a Cash Management DSCR Trigger Event (as defined below). |
A Cash Management Trigger Event will end:
| (a) | with respect to clause (i) above, when a cure of such event of default has been accepted or waived by lender; |
| (b) | with respect to clause (ii) above, when the borrower makes twelve (12) consecutive timely monthly debt service payments; |
| (c) | with respect to clause (iii) above, when such bankruptcy petition has been discharged, stayed, or dismissed within 30 days of such filing among other conditions for the borrower or guarantor and within 120 days for the property manager among other conditions or, with respect to a bankruptcy action of the manager, the borrower replacing the manager with a qualified manager acceptable to the lender; and |
| (d) | with respect to clause (iv) above, the amortizing debt service coverage ratio based upon the trailing 12-month period immediately preceding the date of such determination is greater than 1.05x for two consecutive quarters. |
A “Cash Management DSCR Trigger Event” occurs upon any date the amortizing debt service coverage ratio based on the trailing 12-month period immediately preceding the date of such determination, is less than 1.05x.
THE INFORMATION IN THIS STRUCTURAL AND COLLATERAL TERM SHEET IS NOT COMPLETE AND MAY BE AMENDED PRIOR TO THE TIME OF SALE. THIS TERM SHEET IS NOT AN OFFER TO SELL THESE SECURITIES AND IT IS NOT A SOLICITATION OF AN OFFER TO BUY THESE SECURITIES IN ANY JURISDICTION WHERE THE OFFER OR SALE IS NOT PERMITTED.
99
Addison Ridge Apartments - Phase II |
A “Cash Sweep Event” will commence upon:
| (i) | an event of default; |
| (ii) | any bankruptcy action of the borrower, the guarantor or property manager; or |
| (iii) | a Cash Sweep DSCR Trigger Event (as defined below). |
A Cash Sweep Event will end:
| (a) | with respect to clause (i) above, when a cure of such event of default has been accepted or waived by lender; |
| (b) | with respect to clause (ii) above, when such bankruptcy petition has been discharged, stayed, or dismissed within 30 days of such filing among other conditions for the borrower or guarantor and within 120 days for the property manager among other conditions or, with respect to a bankruptcy action of the manager, the borrower replacing the manager with a qualified manager acceptable to the lender; and |
| (c) | with respect to clause (iii) above, the amortizing debt service coverage ratio based upon the trailing 12-month period immediately preceding the date of such determination is greater than 1.05x for two consecutive calendar quarters. |
A “Cash Sweep DSCR Trigger Event” occurs upon any date the debt service coverage ratio based on the trailing 12-month period immediately preceding the date of such determination is less than 1.05x.
Property Management.The Addison Ridge Apartments - Phase II Property is managed by an affiliate of the borrower.
Assumption.The borrower has the right to transfer the Addison Ridge Apartments – Phase II Property on or before the earlier to occur of the first anniversary following the origination or the 60th day following securitization of the Addison Ridge Apartments – Phase II Mortgage Loan, provided that no event of default has occurred and is continuing and certain other conditions are satisfied, including (i) the lender’s reasonable determination that the proposed transferee and guarantor satisfy the lender’s credit review and underwriting standards, taking into consideration transferee experience, financial strength and general business standing; (ii) execution of a recourse guaranty and an environmental indemnity by an affiliate of the transferee; and (iii) if required by the lender, rating agency confirmation from DBRS, Fitch and Moody’s that the transfer will not result in a downgrade, withdrawal or qualification of the respective ratings assigned to the Series WFCM 2018-C45 Certificates.
Partial Release.Not permitted.
Real Estate Substitution.Not permitted.
Subordinate and Mezzanine Indebtedness.Not permitted.
Terrorism Insurance.The loan documents require that the “all risk” insurance policy required to be maintained by the borrower provides coverage for terrorism in an amount equal to the full replacement cost of the Addison Ridge Apartments – Phase II Property, as well as business interruption insurance covering no less than the 18-month period following the occurrence of a casualty event, together with a 6-month extended period of indemnity.
THE INFORMATION IN THIS STRUCTURAL AND COLLATERAL TERM SHEET IS NOT COMPLETE AND MAY BE AMENDED PRIOR TO THE TIME OF SALE. THIS TERM SHEET IS NOT AN OFFER TO SELL THESE SECURITIES AND IT IS NOT A SOLICITATION OF AN OFFER TO BUY THESE SECURITIES IN ANY JURISDICTION WHERE THE OFFER OR SALE IS NOT PERMITTED.
100
(THIS PAGE INTENTIONALLY LEFT BLANK)
THE INFORMATION IN THIS STRUCTURAL AND COLLATERAL TERM SHEET IS NOT COMPLETE AND MAY BE AMENDED PRIOR TO THE TIME OF SALE. THIS TERM SHEET IS NOT AN OFFER TO SELL THESE SECURITIES AND IT IS NOT A SOLICITATION OF AN OFFER TO BUY THESE SECURITIES IN ANY JURISDICTION WHERE THE OFFER OR SALE IS NOT PERMITTED.
101
Citadel Self Storage
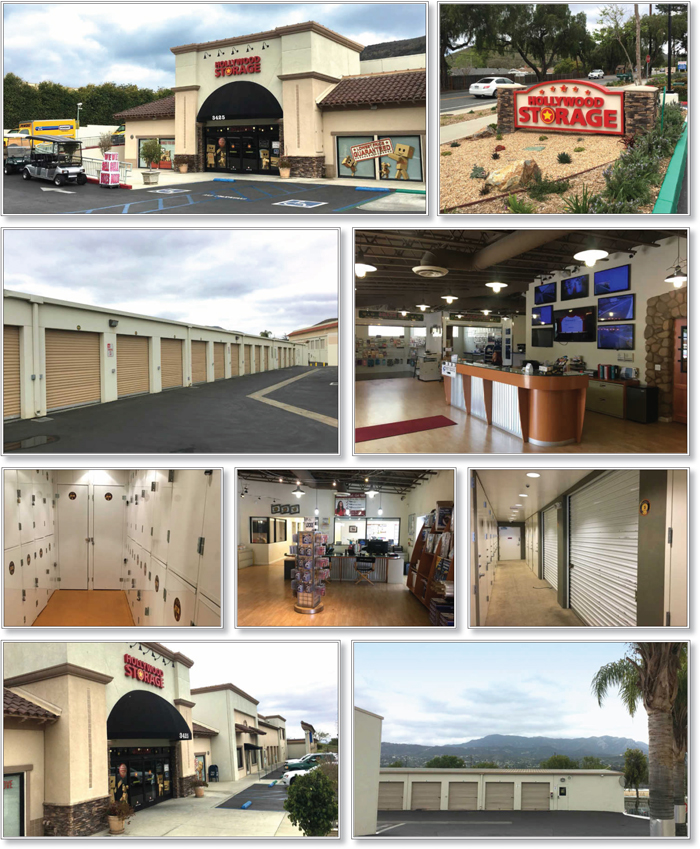
THE INFORMATION IN THIS STRUCTURAL AND COLLATERAL TERM SHEET IS NOT COMPLETE AND MAY BE AMENDED PRIOR TO THE TIME OF SALE. THIS TERM SHEET IS NOT AN OFFER TO SELL THESE SECURITIES AND IT IS NOT A SOLICITATION OF AN OFFER TO BUY THESE SECURITIES IN ANY JURISDICTION WHERE THE OFFER OR SALE IS NOT PERMITTED.
102
Citadel Self Storage
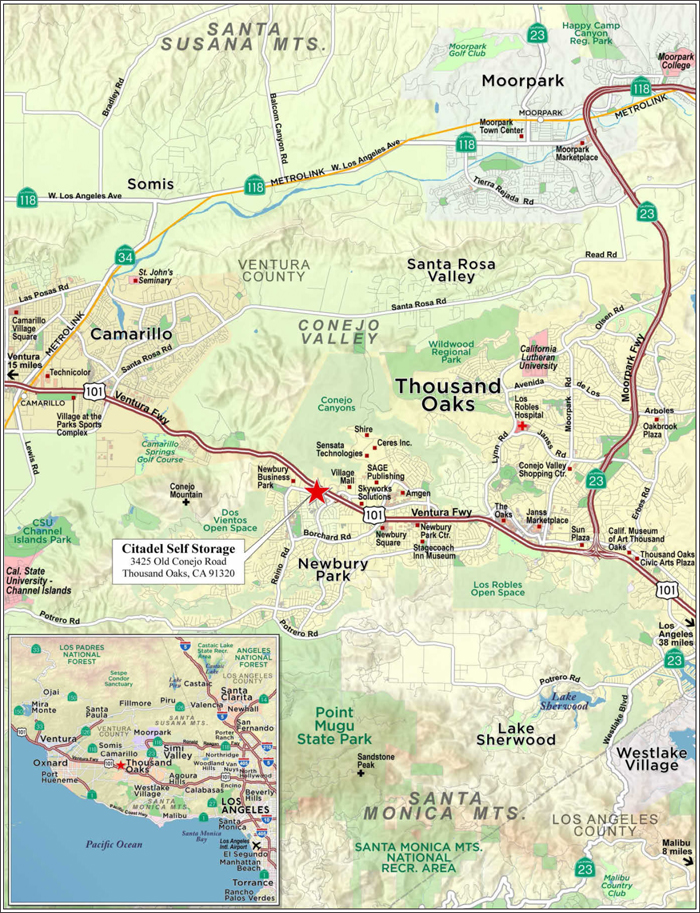
THE INFORMATION IN THIS STRUCTURAL AND COLLATERAL TERM SHEET IS NOT COMPLETE AND MAY BE AMENDED PRIOR TO THE TIME OF SALE. THIS TERM SHEET IS NOT AN OFFER TO SELL THESE SECURITIES AND IT IS NOT A SOLICITATION OF AN OFFER TO BUY THESE SECURITIES IN ANY JURISDICTION WHERE THE OFFER OR SALE IS NOT PERMITTED.
103
| No. 9 – Citadel Self Storage | ||||||||
| Loan Information | Property Information | |||||||
| Mortgage Loan Seller: | Rialto Mortgage Finance, LLC | Single Asset/Portfolio: | Single Asset | |||||
| Credit Assessment (DBRS/Fitch/Moody’s): | NR/NR/NR | Property Type: | Self Storage | |||||
| Original Principal Balance: | $25,000,000 | Specific Property Type: | Self Storage | |||||
| Cut-off Date Principal Balance: | $25,000,000 | Location: | Thousand Oaks, CA | |||||
| % of Initial Pool Balance: | 3.8% | Size: | 143,754 SF | |||||
| Loan Purpose: | Refinance | Cut-off Date Principal Balance Per Unit: | $173.91 | |||||
| Borrower Name: | Citadel Storage Delaware, LLC | Year Built/Renovated: | 2002/NAP | |||||
| Borrower Sponsor: | Raubi Sundher; Kabir Sundher | Title Vesting: | Fee | |||||
| Mortgage Rate: | 5.5800% | Property Manager: | Self-managed | |||||
| 4thMost Recent Occupancy (As of): | NAV | |||||||
| Note Date: | May 18, 2018 | 3rdMost Recent Occupancy (As of): | 96.3% (12/31/2015) | |||||
| Anticipated Repayment Date: | NAP | 2ndMost Recent Occupancy (As of): | 89.0% (12/31/2016) | |||||
| Maturity Date: | June 6, 2028 | Most Recent Occupancy (As of): | 81.6% (12/31/2017) | |||||
| IO Period: | 36 months | Current Occupancy (As of): | 96.3% (5/4/2018) | |||||
| Loan Term (Original): | 120 Months | |||||||
| Seasoning: | 1 month | Underwriting and Financial Information: | ||||||
| Amortization Term (Original): | 360 months | 4th Most Recent NOI (As of): | $1,829,205 (12/31/2015) | |||||
| Loan Amortization Type: | Interest-only, Amortizing Balloon | 3rd Most Recent NOI (As of): | $1,816,090 (12/31/2016) | |||||
| Interest Accrual Method: | Actual/360 | 2nd Most Recent NOI (As of): | $2,020,302 (12/31/2017) | |||||
| Call Protection: | L(25),D(91),O(4) | Most Recent NOI (As of): | $2,136,329 (TTM 3/31/2018) | |||||
| Lockbox Type: | Springing | |||||||
| Additional Debt: | None | U/W Revenues: | $3,224,874 | |||||
| Additional Debt Type: | NAP | U/W Expenses: | $1,051,844 | |||||
| U/W NOI: | $2,173,030 | |||||||
| U/W NCF: | $2,151,467 | |||||||
| U/W NOI DSCR: | 1.26x | |||||||
| Escrows and Reserves(1): | U/W NCF DSCR: | 1.25x | ||||||
| U/W NOI Debt Yield: | 8.7% | |||||||
| Type: | Initial | Monthly | Cap (If Any) | U/W NCF Debt Yield: | 8.6% | |||
| Taxes | $25,291 | $8,265 | NAP | As-Is Appraised Value: | $41,720,000 | |||
| Insurance | $29,892 | $2,847 | NAP | As-Is Appraisal Valuation Date: | April 11, 2018 | |||
| Replacement Reserves | $0 | $1,797 | NAP | Cut-off Date LTV Ratio: | 59.9% | |||
| LTV Ratio at Maturity or ARD: | 53.7% | |||||||
| (1) | See “Escrows” section. |
The Mortgage Loan. The mortgage loan (the “Citadel Self Storage Mortgage Loan”) is evidenced by a single promissory note that is secured by a first mortgage encumbering a self storage property located in Thousand Oaks, California (the “Citadel Self Storage Property”). The Citadel Self Storage Mortgage Loan was originated on May 18, 2018 by Rialto Mortgage Finance, LLC. The Citadel Self Storage Mortgage Loan had an original principal balance of $25,000,000, has an outstanding principal balance as of the Cut-off Date of $25,000,000 and accrues interest at an interest rate of 5.5800%per annum. The Citadel Self Storage Mortgage Loan had an initial term of 120 months, has a remaining term of 119 months as of the Cut-off Date and requires payments of interest only for the first 36 months followed by payments of principal and interest based on a 30-year amortization schedule. The Citadel Self Storage Mortgage Loan matures on June 6, 2028.
Following the lockout period, the borrower has the right to defease the Citadel Self Storage Mortgage Loan in whole, but not in part, on any date before March 6, 2028. In addition, the Citadel Self Storage Mortgage Loan is prepayable without penalty on or after March 6, 2028.
Sources and Uses
| Sources | Uses | |||||||
| Original loan amount | $25,000,000 | 100.0% | Loan Payoff | $12,699,934 | 50.8% | |||
| Closing Costs | 308,786 | 1.2 | ||||||
| Upfront Reserves | 55,182 | 0.2 | ||||||
| Return of Equity | 11,936,098 | 47.7 | ||||||
| Total Sources | $25,000,000 | 100.0% | Total Uses | $25,000,000 | 100.0% |
THE INFORMATION IN THIS STRUCTURAL AND COLLATERAL TERM SHEET IS NOT COMPLETE AND MAY BE AMENDED PRIOR TO THE TIME OF SALE. THIS TERM SHEET IS NOT AN OFFER TO SELL THESE SECURITIES AND IT IS NOT A SOLICITATION OF AN OFFER TO BUY THESE SECURITIES IN ANY JURISDICTION WHERE THE OFFER OR SALE IS NOT PERMITTED.
104
Citadel Self Storage
The Property.The Citadel Self Storage Property is a 143,754 square foot self storage facility located in Thousand Oaks, California. The Citadel Self Storage Property was completed in two phases in 2002 and 2005 and is situated on a 4.5 acre site. The Citadel Self Storage Property is comprised of four single-story buildings, one two-story building, and one three-story building. The Citadel Self Storage Property has a total of 1,788 self storage units including 1,605 traditional self storage units, 97 climate controlled wine storage units, 17 vault units and 69 safety deposit boxes. The unit mix is comprised of 929 climate controlled units (52.0% of total units) and 859 non-climate controlled units (48.0% of total units). Property amenities include a post office, 24 hour camera security system, an electronic gate, keypad entry, perimeter fencing, exterior lighting, two elevators, security alarms, a leasing office, and an on-site manager. In 2016, the guarantor redeveloped building 3 at the Citadel Self Storage Property adding approximately 20,721 square feet of self storage space at a cost of approximately $2.2 million. The redevelopment included the addition of two concrete floors and two elevators and created 484 climate controlled self storage units which were absorbed throughout 2017. As of May 4, 2018, the Citadel Self Storage Property was 96.3% occupied.
The following table presents historical occupancy percentages at the Citadel Self Storage Property:
Historical Occupancy
12/31/2015(1) | 12/31/2016(1) | 12/31/2017(1) | 5/4/2018(2) |
| 96.3% | 89.0% | 81.6% | 96.3% |
| (1) | Information obtained from the borrower. |
| (2) | Information obtained from the underwritten rent roll. |
Operating History and Underwritten Net Cash Flow.The following table presents certain information relating to the historical operating performance and Underwritten Net Cash Flow at the Citadel Self Storage Property:
Cash Flow Analysis
| 2015 | 2016 | 2017 | TTM 3/31/2018 | U/W | % of U/W Effective Gross Income | U/W $ per Room(1) | |
| Base Rent | $2,448,785 | $2,542,002 | $2,785,578 | $2,926,872 | $3,352,056 | 103.9% | $23.32 |
| Grossed Up Vacant Space | 0 | 0 | 0 | 0 | 140,892(1) | 4.4 | 0.98 |
| Other Income(2) | 77,449 | 78,262 | 105,327 | 114,922 | 114,922 | 3.6 | 0.80 |
| Less Vacancy & Credit Loss | (12,480) | (10,015) | (17,997) | (15,684) | (382,996)(3) | (11.9) | (2.66) |
| Effective Gross Income | $2,513,754 | $2,610,249 | $2,872,908 | $3,026,110 | $3,224,874 | 100.0% | $22.43 |
| Total Operating Expenses | $684,549 | $794,159 | $852,606 | $889,781 | $1,051,844 | 32.6% | $7.32 |
| Net Operating Income | $1,829,205 | $1,816,090 | $2,020,302 | $2,136,329 | $2,173,030 | 67.4% | $15.12 |
| Capital Expenditures | 0 | 0 | 0 | 0 | 21,563 | 0.7 | 0.15 |
| Net Cash Flow | $1,829,205 | $1,816,090 | $2,020,302 | $2,136,329 | $2,151,467 | 66.7% | $14.97 |
| NOI DSCR | 1.06x | 1.06x | 1.18x | 1.24x | 1.26x | ||
| NCF DSCR | 1.06x | 1.06x | 1.18x | 1.24x | 1.25x | ||
| NOI DY | 7.3% | 7.3% | 8.1% | 8.5% | 8.7% | ||
| NCF DY | 7.3% | 7.3% | 8.1% | 8.5% | 8.6% |
| (1) | Gross up vacant space is based on actual vacant space as of May 4, 2018. |
| (2) | Other income includes liens, late fees, administration fees, insurance commission, and USPS income. |
| (3) | The underwritten economic vacancy is 11.0%. Underwritten adjustment is based on the T-3 Effective Gross Income. In 2016, the sponsors redeveloped one of the buildings at the Citadel Self Storage Property, adding 20,721 square feet of self storage. The new self storage units became available for leasing in January 2017 and were absorbed throughout 2017. The Citadel Self Storage Property was 96.3% physically occupied as of May 4, 2018. |
Appraisal.As of the appraisal valuation date of April 11, 2018, the Citadel Self Storage Property had an “as-is” appraised value of $41,720,000.
Environmental Matters.According to a Phase I environmental assessment dated February 26, 2018, there was no evidence of any recognized environmental conditions at the Citadel Self Storage Property.
Market Overview and Competition.The Citadel Self Storage Property is located in Thousand Oaks, Ventura County, California, within the Oxnard-Thousand Oaks-Ventura, CA metropolitan statistical area (“Thousand Oaks MSA”). Ventura has hundreds of miles of national and state parks and forestland, with the Los Padres National Forest making up most of the northern half of the county. Ventura has evolved into an employment center with the growth of the technology corridor that stretches along U.S. Route 101 from Woodland Hills to Camarillo. Major employers with the Thousand Oaks MSA include Naval Construction Battalion, Amgen Inc., Naval Air Warfare Center Weapons, the Air National Guard and St. John’s Regional Medical Center.
The Citadel Self Storage Property is located along Old Conejo Road in the southeastern portion of Ventura at the center of Conejo Valley which is bordered by Simi Valley to the north, Westlake Village to the east, Hidden Valley and the Santa Monica Mountains to the south, and Camarillo to the west. Access to the neighborhood is provided by U.S. Route 101, and State Route 23. Development in the neighborhood consists of office, retail and industrial uses along the major arterials with multifamily and single family development removed from arterials.
THE INFORMATION IN THIS STRUCTURAL AND COLLATERAL TERM SHEET IS NOT COMPLETE AND MAY BE AMENDED PRIOR TO THE TIME OF SALE. THIS TERM SHEET IS NOT AN OFFER TO SELL THESE SECURITIES AND IT IS NOT A SOLICITATION OF AN OFFER TO BUY THESE SECURITIES IN ANY JURISDICTION WHERE THE OFFER OR SALE IS NOT PERMITTED.
105
Citadel Self Storage
According to the appraisal, the Citadel Self Storage Property is located in the San Fernando Valley-West self storage submarket of the Los Angeles self storage market. As of 2017, the San Fernando Valley-West self storage submarket reported a vacancy rate of 7.3%. Asking rentals rates were $182.93 for 10x10 non-climate controlled units and $214.87 for 10x10 climate controlled units for 2017. The Los Angeles self storage market reported a vacancy rate of 7.7% for 2017. Asking rental rates of $184.58 for 10x10 non-climate controlled units and $210.53 for 10x10 climate controlled units were quoted for the Los Angeles self storage market as of 2017.
The following table presents certain information relating to some comparable self storage properties for the Citadel Self Storage Property:
Competitive Set(1)
| Citadel Self Storage (Subject) | StorCal Self Storage | Ventu Park Self Storage | Extra Space Self Storage | Newbury Park Self Storage | Hollywood Storage Center | |
| Location | Thousand Oaks, CA | Newbury Park, CA | Newbury Park, CA | Newbury Park, CA | Newbury Park, CA | Newbury Park, CA |
| Distance to Subject | -- | 1.1 miles | 2.5 miles | 0.4 miles | 2.0 miles | 0.1 miles |
| Property Type | Self Storage | Self Storage | Self Storage | Self Storage | Self Storage | Self Storage |
| Year Built/Renovated | 2002/NAP | 1981/NAP | 2002/NAP | 2001/NAP | 1992/NAP | 1982/NAP |
| Total Units | 1,788 | 280 | 616 | 427 | 320 | 1,412 |
| Total Occupancy | 96.3%(2) | 92.0% | 90.0% | 90.0% | 90.1% | 90.0% |
| (1) | Information obtained from the appraisal. |
| (2) | Information obtained from the underwritten rent roll |
The Borrower.The borrower is Citadel Storage Delaware, LLC , a single purpose Delaware limited liability company, with one independent director. Legal counsel to the borrower delivered a non-consolidation opinion in connection with the origination of the Citadel Self Storage Mortgage Loan. Citadel Storage Delaware, LLC is wholly owned by Citadel Storage, LLC, which is owned by Raubi Sundher (36.0%), Kabir Singh Sundher (29.7%), Jehlam (Jay) Sundher (24.3%), and S. Tej Sundher (10.0%). Raubi Sundher and Kabir Sundher are the guarantors of certain nonrecourse carveouts under the Citadel Self Storage Mortgage Loan on a joint and several basis.
The Borrower Sponsors.The borrower sponsors of the borrower are Raubi Sundher and Kabir Singh Sundher. Raubi Sundher has over 30 years of real estate experience and is a founding member of the Hollywood Business Improvement District. Since 1987, Mr. Sundher has led Kuvera Partners, a privately held corporation which focuses on the development and construction of multiple properties in the entertainment and the self storage industry. Kabir Singh Sundher joined Kuvera Partners in 1996 after working as an attorney and as in-house counsel for the real estate developer C. L. Development, Inc. Kabir Singh Sundher is responsible for legal, financial and technological affairs for Kuvera Partners.
Escrows.The loan documents provided for upfront reserves in the amount of $25,291 for real estate taxes and $29,892 for insurance premiums. The loan documents require ongoing monthly deposits of $8,265 for real estate taxes, $2,847 for insurance premiums and $1,797 for replacement reserves.
Lockbox and Cash Management.Upon the occurrence of a Cash Management Trigger Event (as defined below) the borrower will be required to establish a lender-controlled lockbox account and instruct each tenant to deposit rents into such lockbox account. Additionally, all revenues received by the borrowers or the property manager relating to Citadel Self Storage Property are required to be deposited into the lockbox account within one business day of receipt. Other than during a Cash Sweep Event (as defined below), all excess funds on deposit are disbursed to the borrower.
A “Cash Management Trigger Event” will commence upon:
| (i) | an event of default; |
| (ii) | the borrower’s second late debt service payment within a twelve (12) month period; |
| (iii) | any bankruptcy action of the borrower, guarantors or property manager; or |
| (iv) | a Cash Management DSCR Trigger Event (as defined below). |
A Cash Management Trigger Event will end:
| (a) | with respect to clause (i) above, when a cure of such event of default has been accepted or waived by lender; |
| (b) | with respect to clause (ii) above, the timely payment of the monthly debt service payments on twelve (12) consecutive payment dates; |
| (c) | with respect to clause (iii) above, when such bankruptcy action has been discharged, stayed, or dismissed within 30 days for the borrower or guarantors and 120 days for the property manager, among other conditions or, with respect to a bankruptcy action of the property manager, the borrower has replaced the manager with a qualified manager acceptable to the lender; and |
| (d) | with respect to clause (iv), upon the termination of the Cash Management DSCR Trigger Event as set forth below. |
A “Cash Management DSCR Trigger Event” will commence upon any date the amortizing debt service coverage ratio based on the trailing 12-month period immediately preceding the date of such determination is less than 1.15x, and will end if the amortizing debt
THE INFORMATION IN THIS STRUCTURAL AND COLLATERAL TERM SHEET IS NOT COMPLETE AND MAY BE AMENDED PRIOR TO THE TIME OF SALE. THIS TERM SHEET IS NOT AN OFFER TO SELL THESE SECURITIES AND IT IS NOT A SOLICITATION OF AN OFFER TO BUY THESE SECURITIES IN ANY JURISDICTION WHERE THE OFFER OR SALE IS NOT PERMITTED.
106
Citadel Self Storage
service coverage ratio based upon the trailing 12-month period immediately preceding the date of such determination is greater than 1.15x for two consecutive calendar quarters.
A “Cash Sweep Event” means:
| (i) | an event of default; |
| (ii) | any bankruptcy action of the borrowers, guarantors or property manager; or |
| (iii) | a Cash Sweep DSCR Trigger Event (as defined below). |
A Cash Sweep Event will end:
| (a) | with respect to clause (i) above, when a cure of such event of default has been accepted or waived by lender; |
| (b) | with respect to clause (ii) above, when such bankruptcy action has been discharged, stayed, or dismissed, within 30 days for the borrowers or guarantors and 120 days for the property manager, among other conditions or, with respect to a bankruptcy action of the property manager, the borrower has replaced the property manager with a qualified manager acceptable to the lender; and |
| (c) | with respect to clause (iii) above, upon the termination of the Cash Sweep DSCR Trigger Event as set forth below. |
A “Cash Sweep DSCR Trigger Event” occurs upon any date the amortizing debt service coverage ratio based on the trailing 12-month period immediately preceding the date of such determination is less than 1.10x and will end once the amortizing debt service coverage ratio based upon the trailing 12-month period immediately preceding the date of such determination is greater than 1.10x for two consecutive quarters.
Property Management.The Citadel Self Storage Property is managed by an affiliate of the borrower.
Assumption.The borrower has the right to transfer the Citadel Self Storage Property on or before the earlier to occur of the first anniversary following the origination of the Citadel Self Storage Mortgage Loan or the 60th day following securitization of the Citadel Self Storage Mortgage Loan, provided that no event of default has occurred and is continuing and certain other conditions are satisfied, including (i) the lender’s reasonable determination that the proposed transferee and guarantor satisfy the lender’s credit review and underwriting standards, taking into consideration transferee experience, financial strength and general business standing; (ii) execution of a recourse guaranty and an environmental indemnity by an affiliate of the transferee; and (iii) if required by the lender, rating agency confirmation from DBRS, Fitch and Moody’s that the transfer will not result in a downgrade, withdrawal or qualification of the respective ratings assigned to the Series WFCM 2018-C45 Certificates.
Partial Release.Not permitted.
Real Estate Substitution.Not permitted.
Subordinate and Mezzanine Indebtedness.Not permitted.
Terrorism Insurance.The loan documents require that the “all risk” insurance policy required to be maintained by the borrowers provide coverage for terrorism in an amount equal to the full replacement cost of the Citadel Self Storage Property, as well as business interruption insurance covering no less than the 18-month period following the occurrence of a casualty event, together with a 12-month extended period of indemnity.
Earthquake Insurance. The loan documents do not require earthquake insurance. The property is located in Seismic Zone 4. The seismic report indicated scenario expected loss for the property is 11%.
THE INFORMATION IN THIS STRUCTURAL AND COLLATERAL TERM SHEET IS NOT COMPLETE AND MAY BE AMENDED PRIOR TO THE TIME OF SALE. THIS TERM SHEET IS NOT AN OFFER TO SELL THESE SECURITIES AND IT IS NOT A SOLICITATION OF AN OFFER TO BUY THESE SECURITIES IN ANY JURISDICTION WHERE THE OFFER OR SALE IS NOT PERMITTED.
107
| 181 FREMONT STREET |

THE INFORMATION IN THIS STRUCTURAL AND COLLATERAL TERM SHEET IS NOT COMPLETE AND MAY BE AMENDED PRIOR TO THE TIME OF SALE. THIS TERM SHEET IS NOT AN OFFER TO SELL THESE SECURITIES AND IT IS NOT A SOLICITATION OF AN OFFER TO BUY THESE SECURITIES IN ANY JURISDICTION WHERE THE OFFER OR SALE IS NOT PERMITTED.
108
| 181 FREMONT STREET |
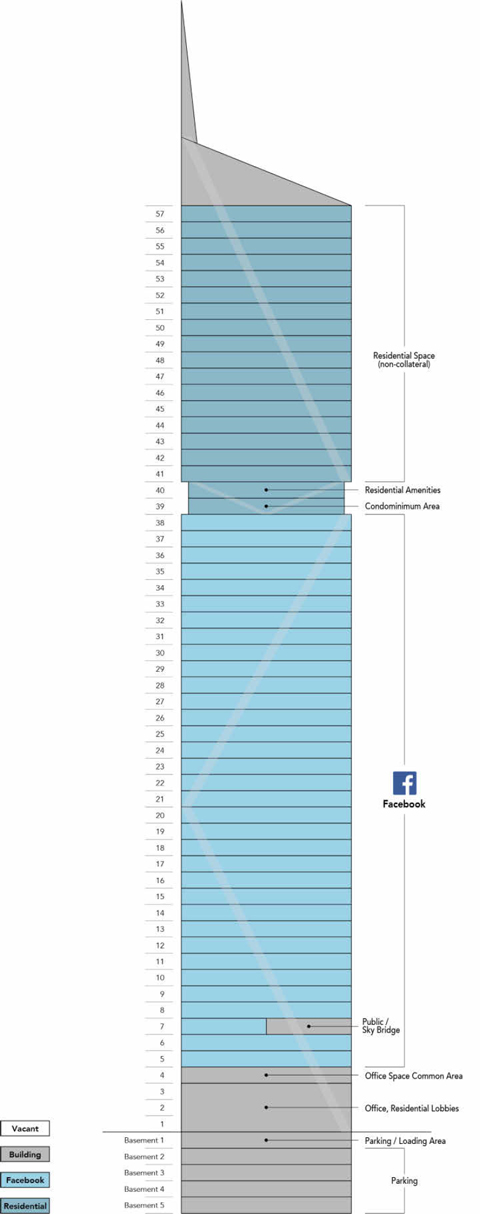
THE INFORMATION IN THIS STRUCTURAL AND COLLATERAL TERM SHEET IS NOT COMPLETE AND MAY BE AMENDED PRIOR TO THE TIME OF SALE. THIS TERM SHEET IS NOT AN OFFER TO SELL THESE SECURITIES AND IT IS NOT A SOLICITATION OF AN OFFER TO BUY THESE SECURITIES IN ANY JURISDICTION WHERE THE OFFER OR SALE IS NOT PERMITTED.
109
| No. 10 – 181 Fremont Street | ||||||||
| Loan Information | Property Information | |||||||
| Mortgage Loan Seller: | Barclays Bank PLC | Single Asset/Portfolio: | Single Asset | |||||
| Credit Assessment | Property Type: | Office | ||||||
| (DBRS/Fitch/Moody’s): | AA/BBB-/NR | Specific Property Type: | CBD | |||||
| Original Principal Balance(1): | $20,000,000 | Location: | San Francisco, CA | |||||
| Cut-off Date Balance(1): | $20,000,000 | Size: | 436,332 SF | |||||
| % of Initial Pool Balance: | 3.0% | Cut-off Date Balance Per SF(1): | $572.96 | |||||
| Loan Purpose: | Refinance | Year Built/Renovated: | 2018/NAP | |||||
| Borrower Name: | 181 Fremont Office LLC | Title Vesting: | Fee | |||||
| Borrower Sponsor: | Joseph K. Paul | Property Manager: | Self-managed | |||||
| Mortgage Rate: | 3.7086% | 4thMost Recent Occupancy (As of)(5): | NAP | |||||
| Note Date: | March 29, 2018 | 3rdMost Recent Occupancy (As of)(5): | NAP | |||||
| Anticipated Repayment Date: | April 6, 2028 | 2ndMost Recent Occupancy (As of)(5): | NAP | |||||
| Maturity Date: | April 6, 2031 | Most Recent Occupancy (As of)(5): | NAP | |||||
| IO Period: | 120 months | Current Occupancy (As of): | 100.0% (7/1/2018) | |||||
| Loan Term (Original): | 120 months | |||||||
| Seasoning: | 3 months | |||||||
| Amortization Term (Original): | NAP | Underwriting and Financial Information: | ||||||
| Loan Amortization Type: | Interest-only, ARD | 4thMost Recent NOI (As of)(5): | NAP | |||||
| Interest Accrual Method: | Actual/360 | 3rdMost Recent NOI (As of)(5): | NAP | |||||
| Call Protection(2): | L(23),GRTR 1% or YM(4),GRTR 1% | 2ndMost Recent NOI (As of)(5): | NAP | |||||
| or YM or D(86),O(7) | Most Recent NOI (As of)(5): | NAP | ||||||
| Lockbox Type: | Hard/Upfront Cash Management | |||||||
| Additional Debt(1): | Yes | |||||||
| Additional Debt Type(1)(3): | Pari Passu; Mezzanine | U/W Revenues: | $43,664,053 | |||||
| U/W Expenses: | $14,094,390 | |||||||
| U/W NOI: | $29,569,663 | |||||||
| U/W NCF: | $29,482,397 | |||||||
| Escrows and Reserves(4): | U/W NOI DSCR(1): | 3.15x | ||||||
| U/W NCF DSCR(1): | 3.14x | |||||||
| Type: | Initial | Monthly | Cap (If Any) | U/W NOI Debt Yield(1): | 11.8% | |||
| Taxes | $0 | $509,418 | NAP | U/W NCF Debt Yield(1): | 11.8% | |||
| Insurance | $0 | Springing | NAP | Appraised Value(6): | $632,000,000 | |||
| Replacement Reserves | $0 | Springing | NAP | Appraisal Valuation Date(6): | March 1, 2021 | |||
| Rent Concessions Reserve | $68,379,092 | $0 | NAP | Cut-off Date LTV Ratio(1): | 39.6% | |||
| TI/LC Reserve | $42,717,266 | $0 | NAP | LTV Ratio at ARD(1): | 39.6% | |||
| (1) | See “The Mortgage Loan” section. All statistical information related to balance per square foot, loan-to-value ratios, debt service coverage ratios and debt yields are based on the 181 Fremont Street Whole Loan (as defined below). The Cut-off Date LTV Ratio, LTV Ratio at ARD, U/W NCF DSCR and U/W NOI Debt Yield based on the 181 Fremont Street Whole Loan and the 181 Fremont Street Mezzanine Loans (as defined below) (together, the “181 Fremont Street Total Debt”), are 75.2%, 75.2%, 1.38x and 6.2%, respectively. |
| (2) | Defeasance of the 181 Fremont Street Mortgage Loan (as defined below) is permitted at any time after the earlier to occur of (i) two years after the closing date of the securitization that includes the last note to be securitized or (ii) March 29, 2021. The assumed lockout period applicable to defeasance of 27 payments is based on the expected WFCM 2018-C45 securitization trust closing date in July 2018. |
| (3) | See “Subordinate and Mezzanine Indebtedness” section. |
| (4) | See “Escrows” section. |
| (5) | Historical occupancy, operating and financial information is unavailable as the 181 Fremont Street Property (as defined below) was built in 2018. |
| (6) | See “Appraisal” section. The appraised value shown is a prospective market value that assumes the 181 Fremont Street Property is complete and/or achieves stabilization as of March 1, 2021, the date upon which all free rent burns off. The As-Is Appraised Value is $461,000,000 as of February 28, 2018 and is inclusive of deductions for free rent, tenant improvement and leasing commission (“TI/LC”) obligations, equating to a Cut-off Date LTV Ratio and LTV Ratio at ARD of 54.2%.The borrower deposited upfront reserves totaling $111,096,358 for such contractual TI/LC obligations and free rent (see “Escrows” section). |
The Mortgage Loan.The mortgage loan (the “181 Fremont Street Mortgage Loan”) is part of a whole loan (the “181 Fremont Street Whole Loan”) evidenced by sevenpari passu notes secured by a first mortgage encumbering the fee simple interest in the Class A office condominium portion of 181 Fremont Street in San Francisco, California (the “181 Fremont Street Property”). The 181 Fremont Street Whole Loan was co-originated on March 29, 2018 by Barclays Bank PLC and Deutsche Bank AG, acting through its New York Branch. The 181 Fremont Street Whole Loan had an original principal balance of $250,000,000, has an outstanding principal balance as of the Cut-off Date of $250,000,000 and accrues interest at an interest rate of 3.70860%per annum(the “Initial Interest Rate”) through the anticipated repayment date (the “ARD”). The ARD is April 6, 2028 and the final maturity date is April 6, 2031. In the event that the 181 Fremont Street Whole Loan is not repaid in full on or prior to the ARD, the 181 Fremont Street Whole Loan will accrue interest at aper annumrate equal to the greater of (a) the Initial Interest Rate plus 1.5000%, (b) the swap rate as determined in the 181 Fremont Street Whole Loan documents on the ARD plus 2.4146% or (c) when applicable, the default rate as defined in the 181 Fremont Street Whole Loan documents (the “Adjusted Interest Rate”); however, interest accrued at the excess of the Adjusted Interest Rate over the Initial Interest Rate (the “Accrued Interest”) will be deferred. In addition, from and
THE INFORMATION IN THIS STRUCTURAL AND COLLATERAL TERM SHEET IS NOT COMPLETE AND MAY BE AMENDED PRIOR TO THE TIME OF SALE. THIS TERM SHEET IS NOT AN OFFER TO SELL THESE SECURITIES AND IT IS NOT A SOLICITATION OF AN OFFER TO BUY THESE SECURITIES IN ANY JURISDICTION WHERE THE OFFER OR SALE IS NOT PERMITTED.
110
| 181 FREMONT STREET |
after the ARD, all excess cash flow from the 181 Fremont Street Property after the payment of reserves, interest calculated at the Initial Interest Rate, debt service on the 181 Fremont Street Mezzanine Loans and operating expenses will be applied (i)firstto repay the principal balance of the 181 Fremont Street Whole Loan and (ii)second to the payment of Accrued Interest. See “Description of the Mortgage Pool—The Whole Loans—The Non-Serviced Pari Passu Whole Loans—the 181 Fremont Street Whole Loan” and “Pooling and Servicing Agreement” in the Preliminary Prospectus.
Note A-6-2, which will be contributed to the WFCM 2018-C45 Trust, had an original principal balance of $20,000,000, has an outstanding principal balance as of the Cut-off Date of $20,000,000 and represents a non-controlling interest in the 181 Fremont Street Whole Loan. The non-controlling Note A-2 had an original principal balance of $58,000,000, has an outstanding principal balance as of the Cut-off Date of $58,000,000 and was contributed to the BANK 2018-BNK12 Trust. The non-controlling Note A-3 had an original principal balance of $22,000,000, has an outstanding principal balance as of the Cut-off Date of $22,000,000, is currently held by Wells Fargo Bank, N.A. and is expected to be contributed to one or more future securitizations. The non-controlling Note A-6-1 had an original principal balance of $30,000,000, has an outstanding principal balance as of the Cut-off Date of $30,000,000 and was contributed to the WFCM 2014-C44 Trust. The controlling Note A-1 and the non-controlling Notes A-4 and A-5 had an aggregate original principal balance of $120,000,000, have an aggregate outstanding principal balance as of the Cut-off Date of $120,000,000, are currently held by Deutsche Bank AG, New York Branch and are expected to be contributed to one or more future securitizations. The mortgage loans evidenced by Notes A-1, A-2, A-3, A-4, A-5 and A-6-1 are collectively referred to herein as the “181 Fremont Street Companion Loans”. The lender provides no assurances that any non-securitized notes will not be split further. See“Description of the Mortgage Pool—The Whole Loans—The Non-Serviced Pari Passu Whole Loans” in the Preliminary Prospectus.
Note Summary(1)
| Notes | Original Balance | Note Holder | Controlling Interest | |
| A-1 | $50,000,000 | Deutsche Bank AG, New York Branch | Yes | |
| A-2 | $58,000,000 | BANK 2018-BNK12 | No | |
| A-3 | $22,000,000 | Wells Fargo Bank, N.A. | No | |
| A-4 | $30,000,000 | Deutsche Bank AG, New York Branch | No | |
| A-5 | $40,000,000 | Deutsche Bank AG, New York Branch | No | |
| A-6-1 | $30,000,000 | WFCM 2018-C44 | No | |
| A-6-2 | $20,000,000 | WFCM 2018-C45 | No | |
| Total | $250,000,000 |
| (1) | The lender provides no assurances that any non-securitizedpari passu note will not be split further. |
Following the earlier to occur of (i) two years after the closing date of the securitization that includes the last note to be securitized or (ii) March 29, 2021, on any date before October 6, 2027, the borrower has the right to defease the 181 Fremont Street Whole Loan in whole, but not in part. On April 6, 2020 and on any business day thereafter, the borrower has the right to prepay the 181 Fremont Street Whole Loan in whole, provided that the borrower pays the greater of a yield maintenance premium or a prepayment premium equal to 1.0% of the principal amount being prepaid. The 181 Fremont Street Whole Loan is prepayable without penalty on or after October 6, 2027.
Sources and Uses
| Sources | Uses | |||||||
| Original whole loan amount | $250,000,000 | 52.6% | Loan payoff | $362,943,921 | 76.3% | |||
| Mezzanine loans | 225,000,000 | 47.3 | Reserves | 111,096,358 | 23.4 | |||
| Borrower sponsors’ new cash contribution | 695,692 | 0.1 | Closing costs | 1,655,413 | 0.3 | |||
| Total Sources | $475,695,692 | 100.0% | Total Uses | $475,695,692 | 100.0% |
The Property.The 181 Fremont Street Property comprises the office condominium portion of a 57-story Class A, LEED Platinum tower constructed in 2018 and located in downtown San Francisco, California (see “Condominium” section below). The 181 Fremont Street tower consists of 654,698 square feet of total gross building area, with 436,332 square feet allocated to office space on the first 38 stories (collateral for the 181 Fremont Street Whole Loan) and 120,457 square feet of space allocated to 67 luxury market rate residential units on floors 39 to 57 (non-collateral). The 181 Fremont Street tower is over 800 feet tall and offers unobstructed views of the San Francisco Bay and the waterfront. As of July 1, 2018, the 181 Fremont Street Property was 100.0% leased to Facebook, Inc. (“Facebook”) on a triple-net basis through February 2031, with two, five-year extension options and no early termination options.
The 181 Fremont Street Property is located in the South Financial District, three blocks from the San Francisco Bay and within two blocks of Market Street. According to the appraisal, the San Francisco Financial District is the most concentrated employment center in northern California with an employment base that supports a wide variety of commercial use. The 181 Fremont Street Property offers direct access to the new Transbay Transit Center and its elevated 5.4 acre park via a 7th floor skybridge. The new public transportation hub is expected to connect eight Bay Area counties through 11 transit systems, expected to open by 2019. The first phase of the project includes the five-story structure, active bus terminal, elevated park and over 100,000 square feet of retail space including dining, shopping and entertainment.
THE INFORMATION IN THIS STRUCTURAL AND COLLATERAL TERM SHEET IS NOT COMPLETE AND MAY BE AMENDED PRIOR TO THE TIME OF SALE. THIS TERM SHEET IS NOT AN OFFER TO SELL THESE SECURITIES AND IT IS NOT A SOLICITATION OF AN OFFER TO BUY THESE SECURITIES IN ANY JURISDICTION WHERE THE OFFER OR SALE IS NOT PERMITTED.
111
| 181 FREMONT STREET |
As of the origination date, Facebook has taken possession of the 181 Fremont Street Property and commenced the build out of its space. Outstanding rent concessions and tenant improvement allowances related to the Facebook lease were deposited into escrow by the borrower on the origination date (See “Escrows” section). According to the borrower sponsor, Facebook is expected to occupy the 181 Fremont Street Property in three phases with floors five through 13 being occupied in February 2019, floors 14 through 25 being occupied in March 2020 and floors 26 through 38 being occupied in March 2021. Floors two and three are partially open to the first floor and also consist of residential storage and security offices. The fourth floor features bicycle storage, showers, storage and laundry areas.
Facebook is a technology company whose platforms allow users to communicate with family, friends and coworkers. Facebook currently shuttles thousands of employees to its Silicon Valley headquarters and is now adding a San Francisco footprint, as other technology companies have done, including Google and Apple. The 181 Fremont Street Property will be Facebook’s first outpost in San Francisco, housing between 2,000 and 3,000 employees by 2021 to support its growth. One of Facebook’s fast-growing divisions, Instagram, will be one of the groups to move a team into the 181 Fremont Street Property. Daily and monthly active users across Facebook’s platforms were up approximately 14.0% in 2017 year-over-year. As of December 2017, there were 2.1 billion active users on Facebook each month, as of January 2018 there were 1.5 billion active users on WhatsApp (owned by Facebook) each month, and as of September 2017 there were 800 million active users on Instagram each month. Facebook reported 2017 revenue of approximately $40.7 billion, up approximately 47.1% over 2016, which is primarily attributable to approximately $39.9 billion of advertising revenue. Additionally, Facebook reported net income of approximately $15.9 billion in 2017, up approximately 56.0% from 2016.
The following table presents certain information relating to the tenancy at the 181 Fremont Street Property:
Major Tenants
| Tenant Name | Credit Rating (Fitch/Moody’s/S&P) | Tenant NRSF | % of NRSF | Annual U/W Base Rent PSF(1)(2) | Annual U/W Base Rent(1)(2) | % of Total Annual U/W Base Rent(1)(2) | Lease Expiration Date |
| Major Tenant | |||||||
| Facebook, Inc. | NR/NR/NR | 436,332 | 100.0% | $72.22 | $31,511,897 | 100.0% | 2/28/2031(3) |
| Total Major Tenant | 436,332 | 100.0% | $72.22 | $31,511,897 | 100.0% | ||
| Vacant Space | 0 | 0.0% | |||||
| Collateral Total | 436,332 | 100.0% | |||||
| (1) | Annual U/W Base Rent PSF and Annual U/W Base Rent include $4,546,579 of straight-line rent through the maturity date of the Facebook lease. |
| (2) | Facebook has rent abatements through 2021, all of which were deposited into escrow on the origination date. |
| (3) | Facebook has two, five-year lease renewal options. |
The following table presents certain information relating to the lease rollover schedule at the 181 Fremont Street Property:
Lease Expiration Schedule(1)
| Year Ending December 31, | No. of Leases Expiring | Expiring NRSF | % of Total NRSF | Cumulative Expiring NRSF | Cumulative % of Total NRSF | Annual U/W Base Rent(2) | % of Annual U/W Base Rent(2) | Annual U/W Base Rent PSF(2) |
| MTM | 0 | 0 | 0.0% | 0 | 0.0% | $0 | 0.0% | $0.00 |
| 2018 | 0 | 0 | 0.0% | 0 | 0.0% | $0 | 0.0% | $0.00 |
| 2019 | 0 | 0 | 0.0% | 0 | 0.0% | $0 | 0.0% | $0.00 |
| 2020 | 0 | 0 | 0.0% | 0 | 0.0% | $0 | 0.0% | $0.00 |
| 2021 | 0 | 0 | 0.0% | 0 | 0.0% | $0 | 0.0% | $0.00 |
| 2022 | 0 | 0 | 0.0% | 0 | 0.0% | $0 | 0.0% | $0.00 |
| 2023 | 0 | 0 | 0.0% | 0 | 0.0% | $0 | 0.0% | $0.00 |
| 2024 | 0 | 0 | 0.0% | 0 | 0.0% | $0 | 0.0% | $0.00 |
| 2025 | 0 | 0 | 0.0% | 0 | 0.0% | $0 | 0.0% | $0.00 |
| 2026 | 0 | 0 | 0.0% | 0 | 0.0% | $0 | 0.0% | $0.00 |
| 2027 | 0 | 0 | 0.0% | 0 | 0.0% | $0 | 0.0% | $0.00 |
| 2028 | 0 | 0 | 0.0% | 0 | 0.0% | $0 | 0.0% | $0.00 |
| Thereafter | 1 | 436,332 | 100.0% | 436,332 | 100.0% | $31,511,897 | 100.0% | $72.22 |
| Vacant | 0 | 0 | 0.0% | 436,332 | 100.0% | $0 | 0.0% | $0.00 |
| Total/Weighted Average | 1 | 436,332 | 100.0% | $31,511,897 | 100.0% | $72.22 |
| (1) | Information obtained from the underwritten rent roll. |
| (2) | Annual U/W Base Rent, % of Annual U/W Base Rent and Annual U/W Base Rent PSF include $4,546,579 of straight-line rent through the maturity date of the Facebook lease. |
THE INFORMATION IN THIS STRUCTURAL AND COLLATERAL TERM SHEET IS NOT COMPLETE AND MAY BE AMENDED PRIOR TO THE TIME OF SALE. THIS TERM SHEET IS NOT AN OFFER TO SELL THESE SECURITIES AND IT IS NOT A SOLICITATION OF AN OFFER TO BUY THESE SECURITIES IN ANY JURISDICTION WHERE THE OFFER OR SALE IS NOT PERMITTED.
112
| 181 FREMONT STREET |
The following table presents historical occupancy percentages at the 181 Fremont Street Property:
Historical Occupancy
12/31/2014(1) | 12/31/2015(1) | 12/31/2016(1) | 12/31/2017(1) | 7/1/2018(2) |
| NAP | NAP | NAP | NAP | 100.0% |
| (1) | Historical Occupancy prior to 7/1/2018 is not applicable as the 181 Fremont Street Property was built in 2018. |
| (2) | Information obtained from the underwritten rent roll. |
Underwritten Net Cash Flow. The following table presents certain information relating to the underwritten net cash flow at the 181 Fremont Street Property:
Cash Flow Analysis(1)
| U/W | % of U/W Effective Gross Income | U/W $ per SF | |
| Base Rent(2) | $31,511,897 | 72.2% | $72.22 |
| Grossed Up Vacant Space | 0 | 0.0 | 0.00 |
| Total Reimbursables | 13,502,591 | 30.9 | 30.95 |
| Less Vacancy & Credit Loss(3) | (1,350,435) | (3.1) | (3.09) |
| Effective Gross Income | $43,664,053 | 100.0% | $100.07 |
| Total Operating Expenses | $14,094,390 | 32.3% | $32.30 |
| Net Operating Income | $29,569,663 | 67.7% | $67.77 |
| TI/LC | 0 | 0.0 | 0.00 |
| Capital Expenditures | 87,266 | 0.2 | 0.20 |
| Net Cash Flow | $29,482,397 | 67.5% | $67.57 |
| NOI DSCR(4) | 3.15x | ||
| NCF DSCR(4) | 3.14x | ||
| NOI DY(4) | 11.8% | ||
| NCF DY(4) | 11.8% |
| (1) | Historical Cash Flows are not available as the 181 Fremont Street Property was built in 2018. |
| (2) | U/W Base Rent includes $4,546,579 of straight-line rent through the maturity date of the Facebook lease. |
| (3) | The underwritten economic vacancy is 3.0%. The 181 Fremont Street Property was 100.0% leased as of July 1, 2018. |
| (4) | Debt service coverage ratios and debt yields are based on the 181 Fremont Street Whole Loan. |
Appraisal.The appraiser concluded to an appraised value of $632,000,000 with a valuation date of March 1, 2021 which assumes the 181 Fremont Street Property is complete and/or achieves stabilization. Facebook is expected to be in full occupancy of their leased space by March 2021. As of the appraisal valuation date of February 28, 2018 the 181 Fremont Street Property had an “as-is” appraised value of $461,000,000 and is inclusive of deductions for free rent, tenant improvement and leasing commission (“TI/LC”) obligations. The borrower deposited upfront reserves totaling $111,096,358 for such contractual TI/LC obligations and free rent (see “Escrows” section). The appraiser also concluded to a “hypothetical go dark” appraised value of $522,000,000, equating to a Cut-off Date LTV Ratio and LTV Ratio at ARD of 47.9%.
Environmental Matters. According to a Phase I environmental site assessment dated March 7, 2018, there was no evidence of any recognized environmental conditions at the 181 Fremont Street Property.
Market Overview and Competition.The 181 Fremont Street Property is located in the South Financial District of downtown San Francisco, California, three blocks from the San Francisco Bay and within two blocks of Market Street. According to the appraisal, the area immediately surrounding the 181 Fremont Street Property is approximately 98% built up, predominantly consisting of mid- and high-rise office and residential buildings, with few redevelopment sites available for re-use. Immediately north of the 181 Fremont Street Property is the Transbay Terminal, which is currently under construction and expected to open by 2019. Once complete, the Transbay Terminal is expected to be the bus and rail transportation hub of the Bay Area and has been proposed to be the termination point for the high-speed rail system planned between San Francisco and Los Angeles.
According to the appraisal, the 181 Fremont Street Property is located within the South Financial District office submarket. The South Financial District office submarket had fourth quarter 2017 inventory of approximately 15,384,000 square feet with a 7.6% vacancy rate and average asking rents of $72.94 PSF, as compared to the broader San Francisco office market which had a 9.8% vacancy rate and average asking rents of $56.66 PSF for the same period. The estimated 2017 population within a 1.0-, 3.0- and 5.0-mile radius around the 181 Fremont Street Property was 66,410, 369,991 and 636,799, respectively, reflective of a population compound growth rate from 2010 to 2017 of 1.6%, 1.5% and 1.3%, respectively. The estimated 2017 median household income within the same radii was $59,179, $78,089 and $82,936, respectively.
THE INFORMATION IN THIS STRUCTURAL AND COLLATERAL TERM SHEET IS NOT COMPLETE AND MAY BE AMENDED PRIOR TO THE TIME OF SALE. THIS TERM SHEET IS NOT AN OFFER TO SELL THESE SECURITIES AND IT IS NOT A SOLICITATION OF AN OFFER TO BUY THESE SECURITIES IN ANY JURISDICTION WHERE THE OFFER OR SALE IS NOT PERMITTED.
113
| 181 FREMONT STREET |
The following table presents certain information relating to comparable leases to the 181 Fremont Street Property:
Comparable Leases(1)
| Property Name/Location | Year Built | Stories | Total GLA (SF) | Tenant Name | Lease Date/Term | Lease Area (SF) | Annual Base Rent PSF | Lease Type |
Salesforce Tower San Francisco, CA | 2018 | 61 | 1,400,000 | Accenture | March 2017 / 61 Months | 100,630 | $52.00 | Net |
Two Rincon San Francisco, CA | 1989 | 6 | 326,001 | March 2017 / 132 Months | 166,460 | $52.00 | Net | |
Foundry Square IV San Francisco, CA | 2003 | 10 | 247,238 | Slack | January 2017 / 120 Months | 228,998 | $56.50 | Net |
Charles Schwab Plaza San Francisco, CA | 1973 | 17 | 417,266 | Charles Schwab | December 2016 / 120 Months | 359,000 | $50.00 | Net |
First Market Tower San Francisco, CA | 1973 | 39 | 1,034,329 | Merrill Lynch | December 2016 / 72 Months | 121,000 | $40.00 | Net |
350 Bush San Francisco, CA | 2018 | 19 | 386,907 | Twitch | November 2017 / 120 Months | 178,000 | $62.00 | Net |
| Confidential | May 2018 / 136 Months | 145,217 | $67.00 | Net | ||||
| Confidential | October 2018 / 128 Months | 52,880 | $69.00 | Net |
| (1) | Information obtained from the appraisal. |
The Borrower.The borrower for the 181 Fremont Street Whole Loan is 181 Fremont Office LLC, a Delaware limited liability company and a special purpose entity with two independent directors. Legal counsel to the borrower delivered a non-consolidation opinion in connection with the origination of the 181 Fremont Street Whole Loan. Paul Guarantor LLC, a Delaware limited liability company, is the guarantor of certain nonrecourse carveouts under the 181 Fremont Street Whole Loan (the “181 Fremont Street Guarantor”). The 181 Fremont Street Guarantor is wholly owned by the Jay Paul Revocable Living Trust, of which Jay Paul is trustee and grantor. The 181 Fremont Street Guarantor will be required to maintain a minimum net worth, excluding its interest in the 181 Fremont Street Property, of $475,000,000 and liquidity of at least $15,000,000.
The Borrower Sponsor.The borrower sponsor is Joseph K. Paul, the founder of the Jay Paul Company, a privately held, opportunity-driven real estate firm based in San Francisco, California. Founded in 1975, the Jay Paul Company concentrates on the acquisition, development, and management of commercial properties throughout California. The Jay Paul Company has developed over 11.0 million square feet of institutional quality space with an additional 6.0 million square feet of space in their development pipeline. The Jay Paul Company has built projects for Google, Apple, Amazon, Motorola, Microsoft, Northrop Grumman, HP, Ariba, Synopsys, Rambus, Nokia and Dreamworks, among others.
Escrows.The 181 Fremont Street Whole Loan documents provide for upfront reserves in the amount of $68,379,092 for outstanding rent concessions due under the Facebook lease and $42,717,266 for outstanding tenant improvements and leasing commissions relating to the Facebook space.
The 181 Fremont Street Whole Loan documents require monthly reserve deposits for real estate taxes in an amount equal to one-twelfth of the real estate taxes that the lender estimates will be payable during the next twelve months (initially $509,418). The 181 Fremont Street Whole Loan documents do not require ongoing monthly escrows for insurance premiums as long as the borrower provides the lender with evidence that the 181 Fremont Street Property is insured via an acceptable blanket insurance policy or insured under the condominium association policy, and in either case, such policy is in full force and effect. During the continuance of a Trigger Period (as defined below), the 181 Fremont Street Whole Loan documents require monthly reserve deposits for capital expenditures equal to $7,272 and the monthly amount due for common charges due to the condominium association.
Lockbox and Cash Management.The 181 Fremont Street Whole Loan is structured with a hard lockbox and an upfront cash management. The borrower was required at origination to deliver letters to all tenants at the 181 Fremont Street Property directing them to pay all rents directly into a lender-controlled lockbox account. All funds received by the borrower or the manager are required to be deposited in the lockbox account within one business day following receipt. Funds on deposit in the lockbox account are required to be swept on each business day into a lender-controlled cash management account and applied on each payment date to the payment of debt service, the funding of required reserves, budgeted monthly operating expenses, debt service on the 181 Fremont Street Mezzanine Loans (as defined below) and, during a Lease Sweep Period (as defined below), to the payment of an amount equal to $636,318 to fund a lease sweep reserve account (the “Lease Sweep Reserve Account”) until the aggregate funds swept in the Lease Sweep Reserve Account during such lease sweep equals the Lease Sweep Reserve Threshold (as defined below) and then to the debt service reserve account until the aggregate funds transferred to the Lease Sweep Reserve Account and the debt service reserve account during such lease sweep equals the Lease Sweep and Debt Service Reserve Cap (as defined below). Provided no Trigger Period (as defined below) is continuing, excess cash in the deposit account will be disbursed to the borrower in accordance with the 181 Fremont Street Whole Loan documents. If a Trigger Period is continuing (other than a Trigger Period due to a Lease Sweep Period), excess cash in the deposit account will be transferred to an account (the “Cash Collateral Account”) held by the lender as additional collateral for the 181 Fremont Street Whole Loan.
THE INFORMATION IN THIS STRUCTURAL AND COLLATERAL TERM SHEET IS NOT COMPLETE AND MAY BE AMENDED PRIOR TO THE TIME OF SALE. THIS TERM SHEET IS NOT AN OFFER TO SELL THESE SECURITIES AND IT IS NOT A SOLICITATION OF AN OFFER TO BUY THESE SECURITIES IN ANY JURISDICTION WHERE THE OFFER OR SALE IS NOT PERMITTED.
114
| 181 FREMONT STREET |
A “Trigger Period” will commence upon the earlier of the following:
| (i) | the ARD; |
| (ii) | an event of default under the 181 Fremont Street Whole Loan; |
| (iii) | as of the last day of any calendar quarter during the term of the 181 Fremont Street Whole Loan (a) the 181 Fremont Street Property not being fully leased to either Facebook or an investment grade tenant pursuant to a lease that is substantially on the same or better terms as the Facebook lease and (b) the debt service coverage ratio falling below 2.84x based on the 181 Fremont Street Whole Loan or 1.25x based on the 181 Fremont Street Total Debt (a “Low Debt Service Period”); |
| (iv) | the commencement of a Lease Sweep Period; or |
| (v) | an event of default under the 181 Fremont Street Mezzanine Loans. |
A Trigger Period will end:
| (a) | with regard to clause (i) above, upon the 181 Fremont Street Whole Loan being repaid in full, |
| (b) | with regard to clause (ii) and (v) above, upon the cure of such event of default; |
| (c) | with regard to clause (iii) above, upon the date that the debt service coverage ratio is at least 2.84x based on the 181 Fremont Street Whole Loan and 1.25x based on the 181 Fremont Street Total Debt for two consecutive calendar quarters; and |
| (d) | with regard to clause (iv) above, upon the ending of such Lease Sweep Period. |
A “Lease Sweep Period” will commence following the earliest to occur of any of the following (each a “Lease Sweep Trigger”):
| (i) | the date on which, with respect to any Lease Sweep Lease (as defined below), (a) a Lease Sweep Tenant Party (as defined below) cancels or terminates its Lease Sweep Lease with respect to all or a Material Termination Portion (as defined below) of the Lease Sweep Space (as defined below) subject to such Lease Sweep Lease prior to the then current expiration date under such Lease Sweep Lease, or (b) a Lease Sweep Tenant Party delivers to the borrower notice that it is canceling or terminating its Lease Sweep Lease with respect to all or a Material Termination Portion of the Lease Sweep Space subject to such Lease Sweep Lease (the affected space being the “Terminated Space”); provided, however, no Lease Sweep Period will commence pursuant to this clause (i) if, in connection with such termination or cancellation (or delivery of notice of termination or cancellation), the borrower simultaneously enters into a replacement lease with an entity or a wholly-owned subsidiary of an entity rated “BBB-” or equivalent by at least two of Fitch, Moody’s and S&P (an “Investment Grade Entity”) covering the Terminated Space, provided that such replacement lease is a qualified lease and the occupancy conditions, as specified in the 181 Fremont Street Whole Loan documents, are satisfied with respect to such replacement lease on or prior to the date of such termination or cancellation (or delivery of notice of termination or cancellation); |
| (ii) | the date on which, with respect to any Lease Sweep Lease, a Lease Sweep Tenant Party ceases operating its business (i.e., “goes dark”) at 20.0% or more of its Lease Sweep Space on a rentable square foot basis (a “Dark Period Event” and the affected space, the “Dark Space”), provided, however, that if the Lease Sweep Tenant Party either (a) is Facebook, (b) is an Investment Grade Entity or (c) has subleased the Dark Space portion of its premises to an Investment Grade Entity who has accepted delivery thereof (i.e., the lease has commenced) and is paying unabated rent at a contract rate no less than the contract rate required under the Lease Sweep Lease, such Lease Sweep Tenant Party will not be deemed to have “gone dark” for purposes of this clause (ii) and no Lease Sweep Period will commence pursuant to this clause (ii); |
| (iii) | an event of default under a Lease Sweep Lease by the tenant thereunder that continues beyond any applicable notice and cure period; |
| (iv) | a Lease Sweep Tenant Party being subject to an insolvency proceeding; or |
| (v) | the date on which Facebook becomes rated by at least two of Fitch, Moody’s and S&P and thereafter is no longer rated as an Investment Grade Entity (a “Facebook Downgrade Event”). |
A Lease Sweep Period (other than a Lease Sweep Period triggered by clause (iv) above) will not be triggered (or, if already triggered, may be terminated) if the borrower delivers to the lender an acceptable letter of credit in an amount equal to the applicable Lease Sweep and Debt Service Reserve Cap (as defined below).
A Lease Sweep Period will end on the earliest of the applicable of the following to occur:
| (a) | with regard to clauses (i) above, the date on which, with respect to each applicable Lease Sweep Space, one or more replacement tenants acceptable to the lender (in its sole but good faith discretion) execute and deliver replacement lease(s) covering the Requisite Lease Sweep Space (as defined below), provided that such replacement lease(s) are qualified leases and the occupancy conditions, as specified in the 181 Fremont Street Whole Loan documents, are satisfied; |
| (b) | with regard to clauses (ii) and (v) above, the date on which either (1) one or more replacement tenants acceptable to the lender (in its sole but good faith discretion) execute and deliver replacement lease(s) covering the Requisite Lease Sweep Space, provided that such replacement tenant(s) and lease(s) are qualified leases and the occupancy conditions, as specified in the 181 Fremont Street Whole Loan documents, are satisfied or (2) for a Dark Period Event or a Facebook Downgrade Event, Facebook is restored as an Investment Grade Entity or the entirety of the Lease Sweep Space has been sublet to an Investment Grade Entity who has accepted delivery thereof (i.e., the lease has commenced) and is paying unabated rent at a contract rate no less than the contract rate required under the Lease Sweep Lease; |
THE INFORMATION IN THIS STRUCTURAL AND COLLATERAL TERM SHEET IS NOT COMPLETE AND MAY BE AMENDED PRIOR TO THE TIME OF SALE. THIS TERM SHEET IS NOT AN OFFER TO SELL THESE SECURITIES AND IT IS NOT A SOLICITATION OF AN OFFER TO BUY THESE SECURITIES IN ANY JURISDICTION WHERE THE OFFER OR SALE IS NOT PERMITTED.
115
| 181 FREMONT STREET |
| (c) | with regard to clause (iii) above, the date on which the event of default has been cured and no other event of default under such Lease Sweep Lease occurs for a period of three consecutive months following such cure; |
| (d) | with regard to clause (iv) above, the Lease Sweep Tenant Party insolvency proceeding having terminated and the applicable Lease Sweep Lease having been affirmed, assumed or assigned in a manner satisfactory to the lender; and |
| (e) | with regard to clauses (i), (ii), (iii), and (v) above, the date on which the aggregate amount of funds transferred into the Lease Sweep Reserve Account and the debt service reserve account equals the applicable Lease Sweep and Debt Reserve Cap (as defined below) and if a Lease Sweep Period is continuing due to the occurrence of more than one Lease Sweep Trigger, the aggregate amount of funds required to be transferred over the course of the Lease Sweep Period will be equal to the amount of the largest Lease Sweep and Debt Service Reserve Cap applicable to all then-continuing Lease Sweep Periods, such that each Lease Sweep Period will be treated as concurrent and not duplicative or independent of another. |
The “Lease Sweep Reserve Threshold” means (a) with respect to a Lease Sweep Period continuing solely pursuant to clauses (iii) and/or (v) above, $15,271,620 ($35.00 per square foot) or (b) with respect to a Lease Sweep Period continuing solely pursuant to clause (i) and/or (ii) above, $35.00 per square foot of the Dark Space or Terminated Space.
The “Lease Sweep and Debt Service Reserve Cap” means (a) with respect to a Lease Sweep Period continuing solely pursuant to clause (iii) above, $15,271,620 ($35.00 per square foot), (b) with respect to a Lease Sweep Period continuing solely pursuant to clause (i) above, $35.00 per square foot of the Terminated Space, (c) with respect to a Lease Sweep Period continuing pursuant to clause (ii) above, whether or not a Lease Sweep Period pursuant to clauses (i) and/or (iii) above is concurrently continuing, $50.00 per square foot of Dark Space or (d) with respect to clause (v) above, whether or not a Lease Sweep Period pursuant to clauses (i), (ii) and/or (iii) above is concurrently continuing, $21,816,600 ($50.00 per square foot).
The “Lease Sweep Space” means the space demised under a Lease Sweep Lease.
A “Lease Sweep Lease” is the Facebook lease or any replacement lease or leases which cover at least 75.0% of the rentable square feet demised under the Facebook lease (the “Requisite Lease Sweep Space”).
A “Lease Sweep Tenant Party” means any tenant under a Lease Sweep Lease or its direct or indirect parent company.
A “Material Termination Portion” is, with respect to any space under a Lease Sweep Lease, if the tenant under a Lease Sweep Lease cancels or terminates its Lease Sweep Lease with respect to at least 20,000 square feet of space (or, if a full floor of space is less than 20,000 square feet, a full floor of space) but less than the entirety of the space under such Lease Sweep Lease, the portion of space under the Lease Sweep Lease affected by such cancellation or termination.
Property Management. The 181 Fremont Street Property is managed by an affiliate of the borrower.
Assumption.The borrower has, at any time following the securitization of the 181 Fremont Street Whole Loan and prior to the ARD, the right to transfer the 181 Fremont Street Property (no more than twice through the term of the 181 Fremont Street Whole Loan), provided that certain conditions are satisfied, including: (i) no event of default under the 181 Fremont Street Whole Loan documents or mezzanine loan documents has occurred and is continuing, (ii) the borrower has provided the lender with 60 days’ prior written notice, (iii) the proposed transferee qualifies as a qualified transferee under the 181 Fremont Street Whole Loan documents and (iv) the lender has received rating agency confirmation that such assumption will not result in a downgrade of the respective ratings assigned to the Series WFCM 2018-C45 certificates and similar confirmations from each rating agency rating any securities backed by any of the 181 Fremont Street Companion Loans.
Partial Release. Not permitted.
Real Estate Substitution.Not permitted.
Subordinate and Mezzanine Indebtedness.Barclays Bank PLC and Deutsche Bank AG, acting through its New York Branch funded $225,000,000 of mezzanine debt (the “181 Fremont Street Mezzanine Loans”). The 181 Fremont Street Mezzanine Loans consist of a $175,000,000 senior mezzanine loan and a $50,000,000 junior mezzanine loan. The senior mezzanine loan has a 4.8800% coupon and the junior mezzanine loan has a 6.5000% coupon. The 181 Fremont Street Mezzanine Loans are interest-only for the full term of the loans and are coterminous with the 181 Fremont Street Whole Loan. Including the 181 Fremont Street Mezzanine Loans, the cumulative cut-off date LTV, cumulative UW NCF DSCR and cumulative UW NOI Debt Yield are 75.2%, 1.38x and 6.2%, respectively. The mortgage lenders and the mezzanine lenders have entered into an intercreditor agreement. The 181 Fremont Street Mezzanine Loans have been or are expected to be sold to institutional investors. The rights of the lender of the 181 Fremont Street Mezzanine Loans are further described under “Description of the Mortgage Pool—Additional Indebtedness—Mezzanine Indebtedness” in the Preliminary Prospectus.
Ground Lease.None.
Condominium.The 181 Fremont Street Property is subject to a condominium regime. The 181 Fremont Street Property consists of a two-parcel condominium; with the commercial parcel owned by the borrower as collateral for the 181 Fremont Street Whole Loan. The commercial parcel consists of the five basement levels, floors 1 through 38, the bridge connecting 181 Fremont to the Transbay Terminal Rooftop Park and the roof of the 181 Fremont Street tower. The residential parcel, inclusive of the 67 luxury market rate residential units on floors 39 to 57, is not owned by the borrower and is not collateral for the 181 Fremont Street Whole Loan. The owner of the commercial parcel will have 140 votes out of 200 votes in the condominium association and the owner of the residential
THE INFORMATION IN THIS STRUCTURAL AND COLLATERAL TERM SHEET IS NOT COMPLETE AND MAY BE AMENDED PRIOR TO THE TIME OF SALE. THIS TERM SHEET IS NOT AN OFFER TO SELL THESE SECURITIES AND IT IS NOT A SOLICITATION OF AN OFFER TO BUY THESE SECURITIES IN ANY JURISDICTION WHERE THE OFFER OR SALE IS NOT PERMITTED.
116
| 181 FREMONT STREET |
parcel will have 60 votes out of the 200 votes in the condominium association. See “Description of the Mortgage Pool — Mortgage Pool Characteristics — Condominium Interest” in the Preliminary Prospectus.
Terrorism Insurance.The 181 Fremont Street Whole Loan documents require that the “all risk” insurance policy required to be maintained by the borrower provide coverage for terrorism in an amount equal to the full replacement cost of the 181 Fremont Street Property, or that if the Terrorism Risk Insurance Program Reauthorization Act is no longer in effect and such policies contain an exclusion for acts of terrorism, the borrower will obtain, to the extent available, a stand-alone policy that provides the same coverage as the policies would have if such exclusion did not exist.
Earthquake Insurance.The loan documents require earthquake insurance. The property is located in Seismic Zone 4. The seismic report indicated scenario expected loss for the property is 12%.
THE INFORMATION IN THIS STRUCTURAL AND COLLATERAL TERM SHEET IS NOT COMPLETE AND MAY BE AMENDED PRIOR TO THE TIME OF SALE. THIS TERM SHEET IS NOT AN OFFER TO SELL THESE SECURITIES AND IT IS NOT A SOLICITATION OF AN OFFER TO BUY THESE SECURITIES IN ANY JURISDICTION WHERE THE OFFER OR SALE IS NOT PERMITTED.
117
| No. 11 – CoolSprings Galleria | |||||||
| Loan Information | Property Information | ||||||
| Mortgage Loan Seller: | Wells Fargo Bank, National Association | Single Asset/Portfolio: | Single Asset | ||||
Credit Assessment (DBRS/Fitch/Moody’s):
| NR/NR/NR | Property Type: | Retail | ||||
| Original Principal Balance(1): | $20,000,000 | Specific Property Type: | Super Regional Mall | ||||
| Cut-off Date Balance(1): | $19,950,390 | Location: | Franklin, TN | ||||
| % of Initial Pool Balance: | 3.0% | Size(3): | 640,176 SF | ||||
| Loan Purpose: | Refinance | Cut-off Date Balance Per SF(1): | $241.52 | ||||
| Borrower Name: | CoolSprings Mall, LLC | Year Built/Renovated: | 1991/2017 | ||||
| Borrower Sponsors: | CBL & Associates Limited Partnership; CBL & Associates Properties, Inc.; Teachers Insurance and Annuity Association of America; APG Asset Management US Inc. | Title Vesting: | Fee | ||||
| Mortgage Rate: | 4.8390% | Property Manager: | Self-managed | ||||
| Note Date: | April 30, 2018 | 4th Most Recent Occupancy (As of): | 97.8% (12/31/2014) | ||||
| Anticipated Repayment Date: | NAP | 3rd Most Recent Occupancy (As of): | 97.2% (12/31/2015) | ||||
| Maturity Date: | May 11, 2028 | 2nd Most Recent Occupancy (As of): | 99.1% (12/31/2016) | ||||
| IO Period: | 0 months | Most Recent Occupancy (As of): | 96.8% (12/31/2017) | ||||
| Loan Term (Original): | 120 months | Current Occupancy (As of)(4)(5): | 96.2% (4/24/2018) | ||||
| Seasoning: | 2 months | ||||||
| Amortization Term (Original): | 360 months | Underwriting and Financial Information: | |||||
| Loan Amortization Type: | Amortizing Balloon | ||||||
| Interest Accrual Method: | 30/360 | 4th Most Recent NOI (As of): | $17,755,019 (12/31/2014) | ||||
| Call Protection: | L(26),GRTR 1% or YM or D(90),O(4) | 3rd Most Recent NOI (As of): | $18,016,611 (12/31/2015) | ||||
| Lockbox Type: | Hard/Springing Cash Management | 2nd Most Recent NOI (As of): | $20,300,157 (12/31/2016) | ||||
| Additional Debt(1): | Yes | Most Recent NOI (As of): | $20,678,073 (12/31/2017) | ||||
| Additional Debt Type(1): | Pari Passu | U/W Revenues(4): | $30,554,183 | ||||
| U/W Expenses: | $10,828,665 | ||||||
| U/W NOI: | $19,725,518 | ||||||
| U/W NCF: | $18,729,081 | ||||||
| Escrows and Reserves(2): | U/W NOI DSCR(1): | 2.01x | |||||
| U/W NCF DSCR(1): | 1.91x | ||||||
| Type: | Initial | Monthly | Cap (If Any) | U/W NOI Debt Yield(1): | 12.8% | ||
| Taxes: | $702,515 | $234,171 | NAP | U/W NCF Debt Yield(1): | 12.1% | ||
| Insurance: | $0 | Springing | NAP | As-Is Appraised Value: | $322,000,000 | ||
| Replacements Reserves: | $0 | $10,907 | 392,643 | As-Is Appraisal Valuation Date: | March 23, 2018 | ||
| General TI/LC Reserves: | $3,000,000 | $54,534 | (2) | Cut-off Date LTV Ratio(1): | 48.0% | ||
| Existing TI/LC Reserves: | $2,107,816 | $0 | NAP | LTV Ratio at Maturity(1): | 39.0% | ||
| (1) | See “The Mortgage Loan” Section. All statistical information related to balances per square foot, loan-to-value ratio, debt service coverage ratio and debt yield are based on the CoolSprings Galleria Whole Loan (as defined below). |
| (2) | See “Escrows” section. |
| (3) | The size shown represents the space that serves as collateral for the CoolSprings Galleria Whole Loan. Including non-collateral anchors, the total square footage of the CoolSprings Galleria Mall (as defined below) is 1,146,121 square feet. |
| (4) | See “Historical Occupancy” and “Operating History and Underwritten Net Cash Flow” below for discussion of various tenants included in Most Recent Occupancy and underwritten base rent. |
| (5) | The occupancy rates shown represent the portion of the CoolSprings Galleria Mall that serves as collateral for the CoolSprings Galleria Whole Loan. Including the non-collateral anchor stores, Most Recent Occupancy for the CoolSprings Galleria Mall was 97.9% as of April 24, 2018. |
The Mortgage Loan. The mortgage loan (the “CoolSprings Galleria Mortgage Loan”) is part of a whole loan (the “CoolSprings Galleria Whole Loan”) that is evidenced by fourpari passu promissory notes in the aggregate original principal amount of $155,000,000. The CoolSprings Galleria Whole Loan is secured by a first priority fee mortgage encumbering a super-regional mall located in Franklin, Tennessee (the “CoolSprings Galleria Property”). The CoolSprings Galleria Whole Loan was originated on April 30, 2018 by Wells Fargo Bank, National Association. The CoolSprings Galleria Whole Loan had an original principal balance of $155,000,000, has an outstanding principal balance as of the Cut-off Date of $154,615,523 and accrues interest at an interest rate of 4.8390% per annum. The CoolSprings Galleria Whole Loan had an initial term of 120 months, has a remaining term of 118 months as of the Cut-off Date and requires payments of interest and principal based on a 30-year amortization schedule through the loan term. The CoolSprings Galleria Mortgage Loan matures on May 11, 2028.
Note A-3, which will be contributed to the WFCM 2018-C45 securitization trust, had an original principal balance of $20,000,000 and has an outstanding principal balance as of the Cut-off Date of $19,950,390 and represents a non-controlling interest in the CoolSprings Galleria Center Whole Loan. The controlling Note A-1 had an original principal balance of $75,000,000, has an outstanding principal balance as of the Cut-off Date of $74,813,963 and was contributed to the BANK 2018-BNK12 trust. The non-controlling Note A-2 had an original principal balance of $15,000,000, has an outstanding principal balance as of the Cut-off Date of
THE INFORMATION IN THIS STRUCTURAL AND COLLATERAL TERM SHEET IS NOT COMPLETE AND MAY BE AMENDED PRIOR TO THE TIME OF SALE. THIS TERM SHEET IS NOT AN OFFER TO SELL THESE SECURITIES AND IT IS NOT A SOLICITATION OF AN OFFER TO BUY THESE SECURITIES IN ANY JURISDICTION WHERE THE OFFER OR SALE IS NOT PERMITTED.
118
COOLSPRINGS GALLERIA
$14,962,793 and was contributed to the BANK 2018-BNK12 trust. The non-controlling Note A-4 had an original principal balance of $45,000,000, has an outstanding principal balance as of the Cut-off Date of $44,888,378 and is expected to be contributed to one or more future securitizations. The mortgage loans evidenced by Notes A-1, A-2 and A-4 are collectively referred to herein as the “CoolSprings Galleria Companion Loans”. See “Description of the Mortgage Pool—The Whole Loans—The Non-Serviced Whole Loans” and “Pooling and Servicing Agreement” in the Preliminary Prospectus.
Note Summary
| Notes | Original Balance | Note Holder | Controlling Interest | |
| A-1 | $75,000,000 | BANK 2018-BNK12 | Yes | |
| A-2 | $15,000,000 | BANK 2018-BNK12 | No | |
| A-3 | $20,000,000 | WFCM 2018-C45 | No | |
| A-4 | $45,000,000 | Wells Fargo Bank, N.A. | No | |
| Total | $155,000,000 |
At any time after the earlier of (i) April 30, 2021 and (ii) two years from the closing date of the securitization that includes the last pari passu note of the CoolSprings Galleria Whole Loan to be securitized, the CoolSprings Galleria Borrower (as defined below) has the right to either (a) on any date before February 11, 2028, defease the CoolSprings Galleria Whole Loan in whole, but not in part, or (b) prepay the CoolSprings Galleria Whole Loan in whole, but not in part, provided that the CoolSprings Galleria Borrower pays the greater of a yield maintenance premium or a prepayment premium equal to 1.0% of the principal amount being prepaid. No prepayment premium shall apply on or after February 11, 2028. The assumed lockout period of 26 payments is based on the closing date of this transaction in July 2018.
Sources and Uses
| Sources | Uses | |||||||
| Original Whole Loan amount | $155,000,000 | 100.0% | Loan payoff | $98,015,151 | 63.2% | |||
| Return of Equity | $50,401,732 | 32.5 | ||||||
| Upfront Reserves | $5,810,331 | 3.7 | ||||||
| Closing costs | $772,787 | 0.5 | ||||||
| Total Sources | $155,000,000 | 100.0% | Total Uses | $155,000,000 | 100.0% |
The Property.The CoolSprings Galleria Property comprises 640,176 square feet of a two-level super-regional mall totaling 1,146,121 square feet (the “CoolSprings Galleria Mall”) located in Franklin, Tennessee, approximately 16 miles south of the Nashville central business district. Built in 1991 and most recently renovated in 2017, the CoolSprings Galleria Mall is anchored by Belk, Dillard’s, Macy’s, JC Penney, and Belk Men’s and Kid’s (only Belk and Belk Men’s and Kid’s serves as collateral for the CoolSprings Galleria Whole Loan). Since 2014, the CoolSprings Galleria Sponsors have spent approximately $78.6 million in renovations at the CoolSprings Galleria Property, which included the completion of (a) from 2014 to 2016, an approximately $64.6 million redevelopment of the former Sears box and parking lot into approximately 209,000 square feet of multi-tenant space (now occupied by tenants including American Girl, Ulta Beauty, Kona Grill and H&M; see property layout above); and (b) in 2017, approximately $14.0 million of renovations throughout the property, including new entrances, painting, tile flooring, restrooms, and lighting.
As of April 24, 2018, the CoolSprings Galleria Property was 96.2% occupied by 124 tenants, excluding the three non-collateral anchor stores, and 97.9% occupied including non-collateral anchors. As of December 31, 2017, the comparable sales and occupancy cost for inline tenants (less than 10,000 square feet (excluding Apple)) were approximately $438 per square foot and 14.3%, respectively, while including Apple, the comparable sales and occupancy cost for inline tenants (less than 10,000 square feet) were approximately $526 per square foot and 11.9%, respectively. Comparable in-line sales (less than 10,000 square feet and excluding Apple) have increased by approximately 11.5% since 2013, and the 2017 estimated total gross sales for the CoolSprings Galleria Mall were approximately $246.0 million ($212.9 million excluding the non-collateral anchors). In addition to the tenants listed on the “Tenant Summary” table below, notable tenants at the CoolSprings Galleria Property include Apple (2017 sales of $3,849 per square foot; 1.6% occupancy cost), American Girl (2017 sales of $679 per square foot; 7.2% occupancy cost), Sephora (2017 sales of $1,187 per square foot; 7.9% occupancy cost), The Cheesecake Factory (2017 sales of $880 per square foot; 5.9% occupancy cost) and Chick-Fil-A (2017 sales of $2,265 per square foot; 8.8% occupancy cost). The overall CoolSprings Galleria Mall contains 5,525 surface parking spaces, resulting in a parking ratio of 4.8 spaces per 1,000 square feet of rentable area; while the CoolSprings Galleria Property contains 2,528 surface parking spaces, resulting in a parking ratio of 3.9 spaces per 1,000 square feet of rentable area.
The following table presents a summary of historical comparable in-line sales and occupancy costs at the CoolSprings Galleria Property.
Historical In-Line Sales and Occupancy Cost Summary(1)
| 2013 | 2014 | 2015 | 2016 | 2017 | |
| In-Line Sales PSF | $455 | $474 | $546 | $543 | $526 |
| Occupancy Costs | 13.3% | 13.3% | 11.6% | 11.3% | 11.9% |
| In-Line Sales PSF (excluding Apple) | $393 | $403 | $465 | $462 | $438 |
| Occupancy Costs (excluding Apple) | 15.4% | 15.7% | 13.6% | 13.3% | 14.3% |
| (1) | Comparable In-line Tenant Sales PSF and Comparable In-line Tenant Occupancy Cost reflect comparable in-line tenants that are less than 10,000 square feet with at least 12 months of sales data. Sales PSF are as of December 31 unless otherwise indicated. |
THE INFORMATION IN THIS STRUCTURAL AND COLLATERAL TERM SHEET IS NOT COMPLETE AND MAY BE AMENDED PRIOR TO THE TIME OF SALE. THIS TERM SHEET IS NOT AN OFFER TO SELL THESE SECURITIES AND IT IS NOT A SOLICITATION OF AN OFFER TO BUY THESE SECURITIES IN ANY JURISDICTION WHERE THE OFFER OR SALE IS NOT PERMITTED.
119
COOLSPRINGS GALLERIA
The following table presents certain information relating to the tenancy at CoolSprings Galleria Property:
Major Tenants
| Tenant Name | Credit Rating (Fitch/Moody’s/ S&P)(1) | Tenant NRSF | % of NRSF | Annual U/W Base Rent PSF | Annual U/W Base Rent | % of Total Annual U/W Base Rent | Sales PSF(2) | Occupancy Cost(2) | Lease Expiration Date |
| Anchor Tenants (non-collateral) | |||||||||
| Dillard’s | BBB-/Baa3/BB+ | 207,700 | NAV | NAV | NAV | NAV | NAV | NAV | |
| Macy’s | BBB/Baa3/BBB- | 194,700 | NAV | NAV | NAV | NAV | $120 | NAV | |
| JC Penney | B+/B1/B+ | 103,545 | NAV | NAV | NAV | NAV | NAV | NAV | |
| Anchor Tenants | |||||||||
| Belk | NR/B2/B- | 132,621 | 20.7% | $6.85 | $908,619 | 5.0% | NAV | NAV | 1/31/2030(3) |
| Belk Men’s and Kid’s | NR/B2/B- | 50,458 | 7.9% | $7.50 | $378,435 | 2.1% | $111 | 8.6% | 1/31/2030(4) |
| Total Anchor Tenants | 183,079 | 28.6% | $7.03 | $1,287,054 | 7.0% | ||||
| Major Tenants | |||||||||
| Forever 21 | NR/NR/NR | 18,015 | 2.8% | $48.93 | $881,491 | 4.8% | $181 | 27.0% | 11/30/2020(5)(6) |
| H&M | NR/NR/NR | 23,644 | 3.7% | $30.30 | $716,315 | 3.9% | $244 | 12.4% | 1/31/2026(7)(8) |
| Kings Bowl | NR/NR/NR | 22,678 | 3.5% | $25.12 | $569,671 | 3.1% | $195 | 16.2% | 1/31/2026(9) |
| Victoria’s Secret | BB+/Baa1/BB+ | 12,785 | 2.0% | $42.00 | $536,970 | 2.9% | $525 | 12.3% | 1/31/2027 |
| Altar’d State(10) | NR/NR/NR | 10,197(10) | 1.6% | $48.89(10) | $498,490(10) | 2.7% | NAV | NAV | 4/30/2027(11) |
| Ulta Beauty | NR/NR/NR | 10,044 | 1.6% | $47.04 | $472,470 | 2.6% | $634 | 8.8% | 11/30/2025(12) |
| Pottery Barn | NR/NR/NR | 11,000 | 1.7% | $35.23 | $387,500 | 2.1% | $423 | 10.0% | 1/31/2026 |
| A’GACI(13) | NR/NR/NR | 12,237 | 1.9% | (13) | (13) | (13) | $113 | 8.0% | 1/31/2026(14)(15) |
| Total Major Tenants | 120,600 | 18.8% | $33.69 | $4,062,907 | 22.2% | ||||
| Other In Place Tenants | 311,947 | 48.7% | $41.40 | $12,913,904 | 70.7% | ||||
| Occupied Collateral Total | 615,626 | 96.2% | $29.67 | $18,263,865 | 100.0% | ||||
| Vacant Space | 24,550 | 3.8% | |||||||
| Collateral Total | 640,176 | 100.0% | |||||||
| (1) | Certain ratings are those of the parent company whether or not the parent guarantees the lease. |
| (2) | Sales PSF and Occupancy Costs are for the trailing 12 months as of December 31, 2017 |
| (3) | Belk has three, 5-year extension options with 12-months’ notice. |
| (4) | Belk Men’s and Kid’s has three, 5-year extension options with 180-days’ notice. |
| (5) | Forever 21 has one, 5-year extension option with 180-days’ notice. |
| (6) | Forever 21 previously had the right to terminate its lease if gross sales were less than $4,000,000 for the trailing 12-month period ending December 1, 2017. Forever 21 did not exercise this option, and it has since expired. |
| (7) | H&M has three, 5-year extension options with 180-days’ notice. |
| (8) | H&M has the right to terminate its lease with 180 days’ notice if gross sales are less than $4,000,000 for the trailing 12-month period ending May 1, 2020. |
| (9) | Kings Bowl has two, 5-year extension options with 12-months’ notice. |
| (10) | Altar’d State currently occupies a 5,952 square feet space (0.9% of NRA), has executed a lease to expand into a 10,197 square feet space (1.6% of NRA) and is anticipated to take occupancy and begin paying rent on the new space in August 2018. |
| (11) | Altar’d State has the right to terminate its lease 180 days’ notice if gross sales are less than $2,400,000 for the trailing 12-month period ending April 30, 2022. |
| (12) | Ulta Beauty has two, 5-year extension options with 210-days’ notice. |
| (13) | A’GACI is currently in bankruptcy and expected to shift from its current annual rent of $416,058 ($34.00 per square foot) to a percent-in-lieu rental rate equal to 8.0% of annual gross sales. The tenant was underwritten to $111,086 ($9.08 per square foot), which was included in underwritten Other Income and equates to 8.0% of its 2017 gross sales. |
| (14) | A’GACI has one, 5-year extension option with 180-days’ notice. |
| (15) | A’GACI has the right to terminate its lease with 60 days’ notice if gross sales are less than $3,000,000 for the trailing 12-month period ending April 30, 2020. |
THE INFORMATION IN THIS STRUCTURAL AND COLLATERAL TERM SHEET IS NOT COMPLETE AND MAY BE AMENDED PRIOR TO THE TIME OF SALE. THIS TERM SHEET IS NOT AN OFFER TO SELL THESE SECURITIES AND IT IS NOT A SOLICITATION OF AN OFFER TO BUY THESE SECURITIES IN ANY JURISDICTION WHERE THE OFFER OR SALE IS NOT PERMITTED.
120
COOLSPRINGS GALLERIA
The following table presents certain information relating to the lease rollover schedule at CoolSprings Galleria Property:
Lease Expiration Schedule(1)(2)
| Year Ending December 31, | No. of Leases Expiring | Expiring NRSF | % of Total NRSF | Cumulative Expiring NRSF | Cumulative % of Total NRSF | Annual U/W Base Rent | % of Total Annual U/W Base Rent | Annual U/W Base Rent PSF(3) |
| MTM | 2 | 2,810 | 0.4% | 2,810 | 0.4% | $203,708 | 1.1% | $72.49 |
| 2018 | 9 | 19,535 | 3.1% | 22,345 | 3.5% | $212,420 | 1.2% | $10.87 |
| 2019 | 13 | 19,035 | 3.0% | 41,380 | 6.5% | $941,392 | 5.2% | $49.46 |
| 2020 | 18 | 57,954 | 9.1% | 99,334 | 15.5% | $2,448,904 | 13.4% | $42.26 |
| 2021 | 8 | 23,520 | 3.7% | 122,854 | 19.2% | $1,000,572 | 5.5% | $42.54 |
| 2022 | 9 | 28,184 | 4.4% | 151,038 | 23.6% | $1,450,282 | 7.9% | $51.46 |
| 2023 | 16 | 36,495 | 5.7% | 187,533 | 29.3% | $1,449,815 | 7.9% | $39.73 |
| 2024 | 6 | 15,265 | 2.4% | 202,798 | 31.7% | $778,233 | 4.3% | $50.98 |
| 2025 | 8 | 28,551 | 4.5% | 231,349 | 36.1% | $1,270,356 | 7.0% | $44.49 |
| 2026 | 19 | 128,724 | 20.1% | 360,073 | 56.2% | $4,297,752 | 23.5% | $33.39 |
| 2027 | 10 | 50,887 | 7.9% | 410,960 | 64.2% | $2,177,247 | 11.9% | $42.79 |
| 2028 | 2 | 9,288 | 1.5% | 420,248 | 65.6% | $313,080 | 1.7% | $33.71 |
| Thereafter | 4 | 195,378 | 30.5% | 615,626 | 96.2% | $1,720,104 | 9.4% | $8.80 |
| Vacant | 0 | 24,550 | 3.8% | 640,176 | 100.0% | $0 | 0.0% | $0.00 |
| Total/Weighted Average | 124 | 640,176 | 100.0% | $18,263,865 | 100.0% | $29.67 |
| (1) | Information obtained from the underwritten rent roll. |
| (2) | Certain tenants may have lease termination options that are exercisable prior to the originally stated expiration date of the related lease and are not considered in the rollover schedule. |
| (3) | Weighted Average UW Rent PSF Rolling excludes vacant space. |
The following table presents historical occupancy percentages at CoolSprings Galleria Property:
Historical Occupancy
12/31/2013(1) | 12/31/2014(1) | 12/31/2015(1) | 12/31/2016(1) | 12/31/2017(1) | 4/24/2018(2) |
| 99.7 % | 97.8% | 97.2% | 99.1% | 96.8 | 96.2% |
| (1) | Information obtained from the borrower. |
| (2) | Most Recent Occupancy includes Altar’d State, which currently occupies a 5,952 square feet space (0.9% of NRA), has executed a lease to expand into a 10,197 square feet space (1.6% of NRA) and is expected to take occupancy and begin paying rent on the new space in August 2018 (occupancy reflects the tenant’s expansion space). In addition, Most Recent Occupancy includes three tenants totaling 1.6% of NRA that have executed new leases, but are not yet in occupancy or paying rent: California Pizza Kitchen (4,504 square feet, 0.7% of NRA, expected to take occupancy and begin paying rent in August 2018); Kristals Cosmetics (802 square feet, 0.1% of NRA, expected to take occupancy and begin paying rent in June 2018); Look Dental and Optical (4,784 square feet, 0.7% of NRA, expected to take occupancy and begin paying rent in October 2018). In addition, Most Recent Occupancy includes A’GACI (12,237 square feet, 1.9% of NRA) that has filed for bankruptcy but is currently in-place and is expected to shift from its current annual rent of $416,058 ($34.00 per square foot) to a percent-in-lieu rental rate equal to 8.0% of annual gross sales. The tenant was underwritten to $111,086 ($9.08 per square foot), which is included in underwritten other income and equates to 8.0% of its 2017 gross sales. |
THE INFORMATION IN THIS STRUCTURAL AND COLLATERAL TERM SHEET IS NOT COMPLETE AND MAY BE AMENDED PRIOR TO THE TIME OF SALE. THIS TERM SHEET IS NOT AN OFFER TO SELL THESE SECURITIES AND IT IS NOT A SOLICITATION OF AN OFFER TO BUY THESE SECURITIES IN ANY JURISDICTION WHERE THE OFFER OR SALE IS NOT PERMITTED.
121
COOLSPRINGS GALLERIA
Operating History and Underwritten Net Cash Flow. The following table presents certain information relating to the historical operating performance and the underwritten net cash flow at CoolSprings Galleria Property:
Cash Flow Analysis
| 2014 | 2015(1) | 2016(1) | 2017 | U/W | % of U/W Effective Gross Income | U/W $ per SF | ||||||||||
| Base Rent | $14,113,937 | $14,547,535 | $17,010,323 | $17,995,515 | $18,263,865(2) | 59.8 | % | $28.53 | ||||||||
| Grossed Up Vacant Space | 0 | 0 | 0 | 0 | 1,398,448 | 4.6 | 2.18 | |||||||||
| Total Reimbursables | 8,647,286 | 8,604,749 | 9,340,443 | 9,585,193 | 9,203,936 | 30.1 | 14.38 | |||||||||
| Percentage Rent | 701,251 | 872,072 | 905,549 | 899,539 | 937,321 | 3.1 | 1.46 | |||||||||
| Other Income | 2,730,985 | 3,064,750 | 3,220,791 | 2,710,540 | 2,149,061 | 7.0 | 3.36 | |||||||||
| Less Vacancy & Credit Loss | 0 | 0 | 0 | 0 | ($1,398,448)(3) | (4.6 | ) | (2.18) | ||||||||
| Effective Gross Income | $26,193,459 | $27,089,106 | $30,477,106 | $31,190,786 | $30,554,183 | 100.0 | % | $47.73 | ||||||||
| Total Operating Expenses | $8,438,440 | $9,072,495 | $10,176,949 | $10,512,713 | $10,828,665 | 35.4 | % | $16.92 | ||||||||
| Net Operating Income | $17,755,019 | $18,016,611 | $20,300,157 | $20,678,073 | $19,725,518 | 64.6 | % | $30.81 | ||||||||
| Capital Expenditures | 0 | 0 | 0 | 0 | 128,035 | 0.4 | 0.20 | |||||||||
| TI/LC | 0 | 0 | 0 | 0 | 868,402 | 2.8 | 1.36 | |||||||||
| Net Cash Flow | $17,755,019 | $18,016,611 | $20,300,157 | $20,678,073 | $18,729,081 | 61.3 | % | $29.26 | ||||||||
| NOI DSCR(4) | 1.81x | 1.84x | 2.07x | 2.11x | 2.01x | |||||||||||
| NCF DSCR(4) | 1.81x | 1.84x | 2.07x | 2.11x | 1.91x | |||||||||||
| NOI DY(4) | 11.5% | 11.7% | 13.1% | 13.4% | 12.8% | |||||||||||
| NCF DY(4) | 11.5% | 11.7% | 13.1% | 13.4% | 12.1% | |||||||||||
| (1) | The increase in Base Rent and Net Operating Income from 2015 to 2016 was driven partly by the completion of the Sears renovation into multi-tenant space (see “The Property” section above), including the tenants Kings Bowl, H&M and Ulta Beauty, which account for 8.8% of NRA and 9.6% of underwritten base rent. |
| (2) | Underwritten Base Rent includes Altar’d State, which currently occupies a 5,952 square feet space, has executed a lease to expand into a 10,197 square feet space and is expected to take occupancy and begin paying rent on the new space in August 2018 (tenant was underwritten to its expansion space, reflecting 2.7% of underwritten base rent). In addition, Underwritten Base Rent includes three tenants totaling 2.3% of underwritten base rent that have executed new leases, but are not yet in occupancy or paying rent: California Pizza Kitchen (4,504 square feet, 1.2% of underwritten base rent, expected to take occupancy and begin paying rent in August 2018); Kristals Cosmetics (802 square feet, 0.6% of underwritten base rent, expected to take occupancy and begin paying rent in June 2018); Look Dental and Optical (4,784 square feet, 0.5% of underwritten base rent, expected to take occupancy and begin paying rent in October 2018). In addition, Underwritten Base Rent includes A’GACI (12,237 square feet) that has filed for bankruptcy but is currently in-place and paying rent and is expected to shift from its current annual rent of $416,058 ($34.00 per square foot) to a percent-in-lieu rental rate equal to 8.0% of annual gross sales. The tenant was underwritten to $111,086 ($9.08 per square foot), which is included in underwritten Other Income and equates to 8.0% of its 2017 gross sales. |
| (3) | The underwritten economic vacancy is 7.1%. The CoolSprings Galleria Property was 96.2% physically occupied as of April 24, 2018. |
| (4) | The debt service coverage ratios and debt yields are based on the CoolSprings Galleria Whole Loan. |
Appraisal. As of the appraisal valuation date of March 23, 2018, the CoolSprings Galleria Property had an “as-is” appraised value of $322,000,000.
Environmental Matters. According to a Phase I environmental site assessment dated March 21, 2018, there was no evidence of any recognized environmental conditions at the CoolSprings Galleria Property.
Market Overview and Competition.The CoolSprings Galleria Property is located in Franklin, Tennessee, within Williamson County in the Nashville Metropolitan Statistical Area (“MSA”). The CoolSprings Galleria Property is situated adjacent to Interstate 65, which connects the Nashville MSA with Birmingham, Alabama to the south and Louisville, Kentucky to the north, and has an average daily traffic count of approximately 112,000 vehicles near the CoolSprings Galleria Property. Nashville serves as the state’s capital, and is a major hub for the healthcare, music, publishing, banking and transportation industries. The CoolSprings Galleria Property benefits from its access to 18 colleges and universities within the Nashville region, including Vanderbilt University (total 2017 enrollment of 12,592; approximately 14.6 miles north of the CoolSprings Galleria Property) and Middle Tennessee State University (total 2017 enrollment of 19,693; approximately 31.5 miles southeast of the CoolSprings Galleria Property).
According to the appraisal, the estimated 2017 population within a five-, ten- and fifteen- mile radius of the CoolSprings Galleria Property was 97,298, 278,884 and 657,650, respectively, and the estimated 2017 average household income within the same radii was $158,041, $137,906 and $103,580, respectively. The area has experienced considerable population growth, with population increases across the same radii of 45.0%, 50.9% and 42.7%, respectively, from 2000 to 2017. The average household income in the primary trade area in 2017 was approximately $137,906, which compares to the Nashville MSA and state averages of $81,499 and $67,809, respectively. According to a news publication, as of 2017, Williamson County was the seventh richest county in America, with a median household income of approximately $104,367. Williamson County also benefits from the lowest county tax in the Nashville region, no state income tax, and a highly educated population with over half of the 489,250 residents being college educated.
According to the appraisal, the CoolSprings Galleria Property is located within the South/Southwest Nashville retail submarket of the Nashville retail market. As of the fourth quarter of 2017, the submarket reported total inventory of approximately 6.7 million square feet (33.3% of the broader Nashville retail market inventory) with a vacancy rate of 4.2%, as compared to the Nashville retail market, which reported total inventory of approximately 20.2 million square feet with a vacancy rate of 8.3%. In addition, there is approximately 10.9 million square feet of office space within a five-mile radius of the CoolSprings Galleria Property. The appraiser concluded to the following market rents for the CoolSprings Galleria Property: $32.50 per square foot for spaces from 5,000 to 10,000 square feet; $35.00 per square foot for spaces from 2,500 to 4,999 square feet; $45.00 per square foot for spaces from 1,000 to 2,499 per square foot; $85.00 per square foot for spaces less than 1,000 square feet; and $95.00 per square foot for jewelry tenants.
THE INFORMATION IN THIS STRUCTURAL AND COLLATERAL TERM SHEET IS NOT COMPLETE AND MAY BE AMENDED PRIOR TO THE TIME OF SALE. THIS TERM SHEET IS NOT AN OFFER TO SELL THESE SECURITIES AND IT IS NOT A SOLICITATION OF AN OFFER TO BUY THESE SECURITIES IN ANY JURISDICTION WHERE THE OFFER OR SALE IS NOT PERMITTED.
122
COOLSPRINGS GALLERIA
The following table presents certain information relating to comparable properties the CoolSprings Galleria Property:
Comparable Properties(1)
CoolSprings Galleria (Subject) | The Mall at Green Hills | The Avenue Murfreesboro | Stones River Town Centre | |
| Location | Franklin, TN | Nashville, TN | Murfreesboro, TN | Murfreesboro, TN |
| Distance from Subject | -- | 10.3 miles | 21.7 miles | 23.2 miles |
| Property Type | Regional Center | Regional Center | Lifestyle Center | Super-Regional Center |
| Year Built/Renovated | 1991/2017 | 1956/2005-2011 | 2007 | 1992/2008 |
| Anchors | Belk, Belk Men’s and Kid’s, Dillards, JC Penney, Macy’s | Dillard’s, Macy’s, Nordstrom | Belk, Dick’s, Best Buy, Haverty’s, Barnes & Noble, Bed Bath & Beyond, Michael’s, Off Broadway Shoes, Old Navy, Cost Plus | Dillard’s, JC Penney, Sears, AMC Theatre |
| Total GLA | 1,146,121 SF(2) | 865,428 SF | 803,730 SF | 613,975 SF |
| Total Occupancy | 97.9%(2) | 94.0% | 90.0% | 77.0% |
| Comparable In-Line Sales PSF(3) | $526 | $675 | NAP | $375 |
| (1) | Information obtained from the appraisal. |
| (2) | The size and occupancy rate shown represent the entire CoolSprings Galleria Mall, including non-collateral anchor spaces. Excluding non-collateral anchor spaces, the CoolSprings Galleria Property contains 640,176 square feet with a 96.2% occupancy rate as of April 24, 2018. |
| (3) | Sales shown on the table are inclusive of Apple for the CoolSprings Galleria Property and The Mall at Green Hills. Excluding Apple, the CoolSprings Galleria Property reported in-line sales of $438 per square feet as of year-end 2017. |
The Borrower. The borrower is CoolSprings Mall, LLC (the “CoolSprings Galleria Borrower”), a single-purpose Delaware limited liability company with two independent directors. The CoolSprings Galleria Borrower is 100.0% directly owned by CBL/T-C, LLC, which is indirectly 50% owned by CBL & Associates Limited Partnership and CBL & Associates Properties, Inc. (collectively, “CBL”) and directly 50% owned by T-C Midwest Retail LLC, which is indirectly 51% owned by Teachers Insurance and Annuity Association of America (“TIAA”) and indirectly 49% owned by APG Asset Management US Inc. (“APG”). Legal counsel to the CoolSprings Galleria Borrower delivered a non-consolidation opinion in connection with the origination of the CoolSprings Galleria Whole Loan, and CBL/T-C, LLC is the guarantor of certain nonrecourse carveouts under the CoolSprings Galleria Whole Loan.
The Borrower Sponsors.The borrower sponsors are CBL, TIAA and APG (collectively, the “CoolSprings Galleria Sponsors”). CBL is a self-managed, self-administered, real estate investment trust in the United States with ownership or management interests in 119 properties including 63 malls, outlet centers, office buildings and associated centers. As of March 2018, CBL’s properties were located in 27 states, primarily in the southeastern and mid-western United States.
TIAA is a Fortune 100 financial services organization that serves over 5 million active and retired employees participating at more than 15,000 institutions. As of December 2017, TIAA had approximately $1 trillion in combined assets under management and offices in 19 countries.
APG Group NV, the parent company of APG, is a financial services provider in the collective pensions market that offers consultancy, asset management, administration and communication support. As of December 2017, APG serviced approximately 25,000 employers, administering pensions for one in four people in the Netherlands (approximately 4.5 million participants), and managed approximately €470 billion in pension assets.
Escrows.The loan documents provide for upfront reserves of $702,515 for real estate taxes, $3,000,000 for general tenant improvements and leasing commissions (“TI/LC”), and $2,107,816 for existing TI/LC related to AERIE ($143,160), Altar’d State ($671,750), California Pizza Kitchen ($1,075,000), Club Champion ($112,906), and Look Dental and Optical ($105,000). The loan documents also provide for ongoing monthly reserves of $234,171 for real estate taxes, $10,907 for replacement reserves (subject to a cap of $392,643 if no event of default has occurred or is continuing) and $54,534 for general TI/LC (subject to the Leasing Reserve Cap Amount (as defined below)). The CoolSprings Galleria Borrower has the right to replace the initial $3,000,000 TI/LC reserve deposit with a letter of credit, which may be reduced quarterly (provided no event of default exists) to an amount equal to the initial TI/LC reserve less aggregate disbursements from such reserve.
The loan documents do not require ongoing monthly escrows for insurance premiums as long as (i) no event of default has occurred and is continuing; (ii) the borrower provides the lender with evidence that the CoolSprings Galleria Property’s insurance coverage is included in a blanket policy and such policy is in full force and effect; and (iii) the borrower provides the lender with evidence of renewals and paid receipts for the applicable premiums.
“Leasing Reserve Cap Amount” means an amount equal to the greater of (i) $2,500,000 and (ii) the positive difference (if any) equal to (A) $5,500,000 minus (B) the aggregate amount of all disbursements of general TI/LC funds made to the CoolSprings Galleria Borrower.
THE INFORMATION IN THIS STRUCTURAL AND COLLATERAL TERM SHEET IS NOT COMPLETE AND MAY BE AMENDED PRIOR TO THE TIME OF SALE. THIS TERM SHEET IS NOT AN OFFER TO SELL THESE SECURITIES AND IT IS NOT A SOLICITATION OF AN OFFER TO BUY THESE SECURITIES IN ANY JURISDICTION WHERE THE OFFER OR SALE IS NOT PERMITTED.
123
COOLSPRINGS GALLERIA
Lockbox and Cash Management.The CoolSprings Galleria Whole Loan is structured with a hard lockbox and springing cash management. The CoolSprings Galleria Borrower is required to direct tenants to pay rent directly into a lender-controlled lockbox account and all cash revenues relating to the CoolSprings Galleria Property and all other money received by the CoolSprings Galleria Borrower or the property manager are required to be deposited into such lockbox account or cash management account within one business day. Prior to the occurrence of a Trigger Event Period (as defined below), all funds are required to be distributed to the CoolSprings Galleria Borrower. During a Trigger Event Period, the CoolSprings Galleria Borrower will be required to establish a lender-controlled cash management account.
During a Trigger Event Period, all excess funds are required to be swept to an excess cash flow subaccount controlled by the lender; provided, however, that during a Trigger Event Period caused solely by a Single Dark Anchor Trigger Event Period (as defined below), only 50.0% of excess cash flow is required to be swept to an excess cash flow subaccount controlled by the lender (subject to a cap of an amount equal to $10,000,000 minus the amount of excess cash flow disbursed to the CoolSprings Galleria Borrower during the then-outstanding Single Dark Anchor Trigger Event Period).
A “Trigger Event Period” will commence upon the earlier of the following:
| (i) | the occurrence of an event of default; |
| (ii) | the net operating income debt yield being less than or equal to 9.0% at the end of any calendar quarter; |
| (iii) | the occurrence of a Single Dark Anchor Trigger Event Period; or |
| (iv) | the occurrence of a Multiple Dark Anchor Trigger Event Period (as defined below). |
A Trigger Event Period will end upon the occurrence of the following:
| ● | with regard to clause (i), the cure of such event of default; |
| ● | with regard to clause (ii), the net operating income debt yield being greater than 9.0% for two consecutive calendar quarters; |
| ● | with regard to clause (iii), the occurrence of a Single Dark Anchor Trigger Event Period Cure (as defined below); or |
| ● | with regard to clause (iv), the occurrence of a Multiple Dark Anchor Trigger Event Period Cure (as defined below). |
A “Single Dark Anchor Trigger Event Period” will commence upon the date on which there is one (and only one) Dark Anchor (as defined below), provided that, if Belk Men’s and Kid’s is the only Dark Anchor, no Single Dark Anchor Trigger Event Period will be deemed to exist.
A “Single Dark Anchor Trigger Event Period Cure” will occur upon the earlier of (i) the date on which there are no Dark Anchors and (ii) the date on which (A) at least 24 months have passed since the applicable Dark Anchor ceased operations (and such Dark Anchor has not re-opened) and (B) the Replacement Anchor Financial Criteria (as defined below) have been satisfied.
A “Multiple Dark Anchor Trigger Event Period” will commence upon the date on which there are two or more Dark Anchors; provided that Belk Men’s and Kid’s will not be deemed to be a Dark Anchor unless the failure of Belk Men’s and Kid’s to be open and operating in its space (together with the failure of any other Dark Anchor to be open and operating in its space) would permit tenants under then-existing leases to terminate such leases and/or reduce the rent payable under such leases, and such potential termination and/or rent reduction would reasonably be expected to result in the loss of at least $1,000,000 in gross rent.
A “Multiple Dark Anchor Trigger Ever Period Cure” will occur upon the date on which there are fewer than two Dark Anchors.
“Dark Anchor” means an Anchor (as defined below) that has ceased operations for a period of more than 30 days. An Anchor will no longer be considered to be a Dark Anchor if (A) a replacement anchor that satisfies the Replacement Anchor Financial Criteria (as determined on the date that is 24 months following the date upon which such replacement anchor is open and operating) (1) is in actual physical possession of its space and open for business and (2) only for space related to an Actual Anchor, executes a replacement lease acceptable to lender and has commenced paying unabated rent (or any such rent has been reserved), as evidenced by an estoppel reasonably acceptable to lender; or (B) the formerly Dark Anchor re-opens for business and is operating for 30 consecutive days, as evidenced by an estoppel reasonably acceptable to lender.
An “Anchor” means, (i) Belk and/or Belk Men’s and Kid’s (each an “Actual Anchor”) or (ii) Macy’s, Dillard’s and/or J.C. Penney (each a “Shadow Anchor”).
“Replacement Anchor Financial Criteria” means each of the following:
| (i) | no Trigger Event Period (other than the applicable Single Dark Anchor Trigger Event Period or Multiple Dark Anchor Trigger Event Period) and/or event of default has occurred and is outstanding; |
| (ii) | the net operating income debt yield (with such calculation being based on the original balance of the CoolSprings Galleria Whole Loan) as of the date of determination is greater than 12.45%; |
| (iii) | average in-line sales at the CoolSprings Galleria Property (exclusive of Apple) are greater than or equal to average in-line sales at the CoolSprings Galleria Property (exclusive of Apple) as of origination of the CoolSprings Galleria Whole Loan; and |
| (iv) | replacement of the Dark Anchor with such proposed replacement anchor (and/or the failure of the Dark Anchor to be open and operating in the relevant dark space, as applicable) is permitted pursuant to the terms of each reciprocal easement agreement and/or lease without reduction of assessments, rent, other amounts or other obligations thereunder (including, without limitation, due to a termination of such reciprocal easement agreement and/or lease), or materially increase any obligation, or reduce any right of the CoolSprings Galleria Borrower thereunder. |
THE INFORMATION IN THIS STRUCTURAL AND COLLATERAL TERM SHEET IS NOT COMPLETE AND MAY BE AMENDED PRIOR TO THE TIME OF SALE. THIS TERM SHEET IS NOT AN OFFER TO SELL THESE SECURITIES AND IT IS NOT A SOLICITATION OF AN OFFER TO BUY THESE SECURITIES IN ANY JURISDICTION WHERE THE OFFER OR SALE IS NOT PERMITTED.
124
COOLSPRINGS GALLERIA
Property Management. The CoolSprings Galleria Property is managed by an affiliate of the borrower.
Assumption. Following the date which is 12 months after origination of the CoolSprings Galleria Whole Loan, provided that certain conditions are satisfied as outlined in the loan documents, the CoolSprings Galleria Borrower has the right to transfer the CoolSprings Galleria Property to a transferee that (i) has sponsorship that satisfies the Ownership Net Worth Criteria (as defined below) and (ii) either (A) is an experienced owner and/or operator of retail shopping mall properties in similar submarkets to the CoolSprings Galleria Property and satisfies the Ownership Experience Criteria (as defined below) or (B) will retain a qualified manager that is an experienced owner and/or operator of retail shopping mall properties in similar submarkets to the CoolSprings Galleria Property and satisfies the Ownership Experience Criteria.
“Ownership Net Worth Criteria” means that such person or entity has (i) total assets of at least $1 billion and (ii) net worth of at least $500 million as calculated in accordance with generally accepted accounting principles; provided that if such entity is a publicly traded entity which has common stock listed on the New York Stock Exchange or another nationally recognized exchange, then such entity’s net worth will be determined based on the lesser of its (x) then current market capitalization based solely on its common stock (i.e., exclusive of any preferred stock outstanding) and (y) shareholder’s equity value.
“Ownership Experience Criteria” means that such person or entity (i) has at least 10 years’ experience owning and/or operating properties comparable to the CoolSprings Galleria Property in major metropolitan areas, (ii) is regularly engaged in the business of owning and/or operating properties comparable to the CoolSprings Galleria Property in major metropolitan areas and (iii) owns and/or operates, together with such person or entity’s affiliates, as of the applicable date of determination, at least 12 super regional malls (of at least 500,000 square feet each) containing comparable retail space totaling at least 10 million square feet in the aggregate.
Partial Release. Not permitted.
Real Estate Substitution.Not permitted.
Subordinate and Mezzanine Indebtedness.Not permitted.
Ground Lease. None.
Terrorism Insurance.The CoolSprings Galleria Whole Loan documents require that the “all risk” insurance policy required to be maintained by the CoolSprings Galleria Borrower provide coverage for terrorism in an amount equal to the full replacement cost of the CoolSprings Galleria Property. The CoolSprings Galleria Whole Loan documents also require business interruption insurance covering no less than the 18 month period following the occurrence of a casualty event, together with a six month extended period of indemnity.
THE INFORMATION IN THIS STRUCTURAL AND COLLATERAL TERM SHEET IS NOT COMPLETE AND MAY BE AMENDED PRIOR TO THE TIME OF SALE. THIS TERM SHEET IS NOT AN OFFER TO SELL THESE SECURITIES AND IT IS NOT A SOLICITATION OF AN OFFER TO BUY THESE SECURITIES IN ANY JURISDICTION WHERE THE OFFER OR SALE IS NOT PERMITTED.
125
| No. 12 – Pueblo MHC Portfolio | ||||||||
| Loan Information | Property Information | |||||||
| Mortgage Loan Seller: | Rialto Mortgage Finance, LLC | Single Asset/Portfolio: | Portfolio | |||||
| Credit Assessment (DBRS/Fitch/Moody’s): | NR/NR/NR | Property Type: | Manufactured Housing Community | |||||
| Original Principal Balance: | $18,400,000 | Specific Property Type: | Manufactured Housing Community | |||||
| Cut-off Date Principal Balance: | $18,400,000 | Location: | Pueblo, Colorado | |||||
| % of Initial Pool Balance: | 2.8% | Size: | 697 Pads | |||||
| Loan Purpose: | Refinance | Cut-off Date Principal
Balance Per Pad:
| $26,399 | |||||
| Borrower Names(1): | Various | Year Built/Renovated(3): | Various - See Table | |||||
| Borrower Sponsor: | Ben Braband; Geoff Rosenhain | Title Vesting: | Fee | |||||
| Mortgage Rate: | 5.3200% | Property Manager: | Self-managed | |||||
| 4thMost Recent Occupancy (As of): | NAV | |||||||
| Note Date: | May 9, 2018 | 3rdMost Recent Occupancy (As of): | 71.2% (12/31/2016) | |||||
| Anticipated Repayment Date: | NAP | 2ndMost Recent Occupancy (As of): | 69.7.% (12/31/2017) | |||||
| Maturity Date: | May 6, 2028 | Most Recent Occupancy (As of): | 71.2% (TTM 2/28/2018) | |||||
| IO Period: | 24 months | Current Occupancy (As of): | 71.2% (4/6/2018) | |||||
| Loan Term (Original): | 120 months | |||||||
| Seasoning: | 2 months | Underwriting and Financial Information: | ||||||
| Amortization Term (Original): | 360 months | 4th Most Recent NOI (As of): | NAV | |||||
| Loan Amortization Type: | Interest-only, Amortizing Balloon | 3rd Most Recent NOI (As of): | $1,671,993 (12/31/2016) | |||||
| Interest Accrual Method: | Actual/360 | 2nd Most Recent NOI (As of): | $1,683,125 (12/31/2017) | |||||
| Call Protection(2): | L(26),D(90),O(4) | Most Recent NOI (As of): | $1,701,269 (TTM 2/28/2018) | |||||
| Lockbox Type: | Springing | |||||||
| Additional Debt: | None | U/W Revenues: | $2,746,743 | |||||
| Additional Debt Type: | NAP | U/W Expenses: | $958,197 | |||||
| U/W NOI: | $1,788,546 | |||||||
| U/W NCF: | $1,753,696 | |||||||
| U/W NOI DSCR: | 1.46x | |||||||
| Escrows and Reserves: | U/W NCF DSCR: | 1.43x | ||||||
| U/W NOI Debt Yield: | 9.7% | |||||||
| Type: | Initial | Monthly | Cap (If Any) | U/W NCF Debt Yield: | 9.5% | |||
| Taxes | $0 | $3,226 | NAP | As-Is Appraised Value: | $31,950,000 | |||
| Insurance | $34,346 | $4,673 | NAP | As-Is Appraisal Valuation Date: | March 30, 2018 | |||
| Replacement Reserves | $0 | $2,904 | NAP | Cut-off Date LTV Ratio: | 57.6% | |||
| Home Purchase Reserve | $600,000 | $0 | NAP | LTV Ratio at Maturity or ARD: | 50.2% | |||
| Titling Reserve | $13,965 | $0 | NAP | |||||
| (1) | The borrowers are Sunset Country MHP LLC, Meadowbrook MHP LLC, Oasis MHP, LLC and Rapid City Financial LLC. Each of the borrowers is a Colorado limited liability company and single purpose entity with one independent director. Ben Braband and Geoff Rosenhain are the guarantors, on a joint and several basis, of certain non-recourse carveouts under the Pueblo MHC Portfolio Mortgage Loan. |
| (2) | Following the lockout period and prior to February 6, 2028, the borrowers are permitted to obtain the release of one or more individual properties in connection with a partial defeasance, subject to the satisfaction of certain conditions, including, among other things, (i) partial defeasance of 125.0% of the released property’s original allocated loan balance; (ii) the amortizing debt service coverage ratio (based upon the trailing 12-month period immediately preceding the date of such determination) with respect to the remaining properties is no less than the greater of (a) 1.43x and (b) the amortizing debt service coverage ratio immediately prior to the release; (iii) the loan to value ratio with respect to the remaining properties is no greater than the lesser of (a) 57.8%, and (b) the loan to value ratio immediately prior to the release; and (v) the occupancy of the portfolio of remaining properties is at least 80% occupancy. |
| (3) | See “Property Information” table. |
The Pueblo MHC Portfolio Mortgage Loan is evidenced by a single promissory note that is secured by a first mortgage encumbering three manufactured housing community properties located in Pueblo, Colorado (the “Pueblo MHC Portfolio Properties”). The Pueblo MHC Portfolio Properties consist of three manufactured housing communities containing 697 pads all located in Pueblo, Colorado. The Pueblo MHC Portfolio Mortgage Loan also includes 226 park-owned homes (also collateral for the Pueblo MHC Portfolio Mortgage Loan) across the Pueblo MHC Portfolio Properties, which are owned by the co-borrower, Rapid City Financial, LLC. The park-owned homes were manufactured between 1970 and 2013. With respect to the park-owned homes, each tenant is required to sign a separate lease for the pad and a separate lease for the related park-owned home. The tenants at 109 of the 226 park-owned homes have purchase options with the co-borrower, with terms that vary based on the length and history of the contract. The Pueblo MHC Portfolio Mortgage Loan documents permit the release of any park-owned home that is subject to a purchase option from the lien of the collateral in the event the related tenant satisfies the conditions in the purchase option contract and the borrower satisfies certain conditions in the loan documents. With respect to the remaining park-owned homes, 113 are under home rental agreements, without any purchase options, two are under notes and two are vacant. In addition to the permitted release of the park-owned homes that are subject to a purchase option contract, the other park-owned homes may be released as collateral for the Pueblo MHC Portfolio Mortgage Loan upon a sale of the park-owned homes subject to terms and conditions set forth in the loan documents.
THE INFORMATION IN THIS STRUCTURAL AND COLLATERAL TERM SHEET IS NOT COMPLETE AND MAY BE AMENDED PRIOR TO THE TIME OF SALE. THIS TERM SHEET IS NOT AN OFFER TO SELL THESE SECURITIES AND IT IS NOT A SOLICITATION OF AN OFFER TO BUY THESE SECURITIES IN ANY JURISDICTION WHERE THE OFFER OR SALE IS NOT PERMITTED.
126
PUEBLO MHC PORTFOLIO
Sunset Country MHC
The Sunset Country MHC property is a 198-pad, all-age manufactured housing community developed in 1970 and is situated on a 28.6-acre site. The Sunset Country property includes 97 park-owned homes. Amenities include a clubhouse, pool, and RV storage. Since acquisition, a total of approximately $2.1 million has been invested into the Sunset Country MHC property for the purchase of new homes, home restoration, road repairs, sewage systems, landscaping, sub-meter installation and clubhouse & amenities.
Oakwood Estates MHC
The Oakwood Estates MHC property is a 339-pad, all-age manufactured housing community developed in 1974 and is situated on a 61.1-acre site. The Oakwood Estates MHC Property includes 101 park-owned homes. Amenities include a clubhouse, pool, basketball court, playground, exercise facilities and RV storage. Since acquisition, approximately $1.5 million has been invested into the Oakwood Estates MHC property for the purchase of new homes, home restoration, sewage systems, clubhouse & amenities, transaction & soft costs, sub-meter installation, sidewalks & curbing, and signage & lighting.
Oasis MHC
The Oasis MHC property is a 160-pad, 55+ manufactured housing community developed in 1970 and is situated on a 20.0-acre site. The Oasis MHC property includes 28 park-owned homes. Amenities include a clubhouse.Since acquisition, a total of $539,000 has been invested into the Oasis MHC property for the purchase of new homes, home restoration, road repairs, sub-meter installation, and landscaping.
Sources and Uses
| Sources | Uses | |||||||
| Original loan amount | $18,400,000 | 100.0% | Loan payoff | $16,236,586 | 88.2% | |||
| Closing Costs | 397,190 | 2.2 | ||||||
| Reserves | 648,311 | 3.5 | ||||||
| Return of Equity | 1,117,913 | 6.1 | ||||||
| Total Sources | $18,400,000 | 100.0% | Total Uses | $18,400,000 | 100.0% |
Property Information
| Property Name | City, State | Allocated Cut-off Date Balance | % of Portfolio Cut-off Date Balance | Occupancy | Year Built/ Renovated | Pads | As-Is Appraised Value | Allocated Cut-off Date LTV |
| Sunset Country MHC | Pueblo, CO | $6,700,000 | 36.4% | 81.3% | 1970/NAP | 198 | $10,200,000 | 65.7% |
| Oakwood Estates MHC | Pueblo, CO | $6,000,000 | 32.6% | 57.2% | 1974/NAP | 339 | $13,300,000 | 45.1% |
| Oasis MHC | Pueblo, CO | $5,700,000 | 31.0% | 88.1% | 1970/NAP | 160 | $8,450,000 | 67.5% |
| Total/Weighted Average | $18,400,000 | 100.0% | 71.2% | 697 | $31,950,000 | 57.6% |
The following table presents historical occupancy percentages at the Pueblo MHC Portfolio Properties:
Historical Occupancy
12/31/2016(1) | 12/31/2017(1) | 4/6/2018(2) |
| 71.2% | 69.7% | 71.2% |
| (1) | Information obtained from the borrower. |
| (2) | Information obtained from the underwritten rent roll. |
THE INFORMATION IN THIS STRUCTURAL AND COLLATERAL TERM SHEET IS NOT COMPLETE AND MAY BE AMENDED PRIOR TO THE TIME OF SALE. THIS TERM SHEET IS NOT AN OFFER TO SELL THESE SECURITIES AND IT IS NOT A SOLICITATION OF AN OFFER TO BUY THESE SECURITIES IN ANY JURISDICTION WHERE THE OFFER OR SALE IS NOT PERMITTED.
127
PUEBLO MHC PORTFOLIO
Operating History and Underwritten Net Cash Flow.The following table presents certain information relating to the historical operating performance and Underwritten Net Cash Flow at the Pueblo MHC Portfolio Properties:
Cash Flow Analysis
| 2016 | 2017 | TTM 2/28/2018 | U/W | % of U/W Effective Income | U/W $ per Pad | |||||||||||||
| Base Rent(1) | $2,201,583 | $2,180,392 | $2,197,562 | $2,295,840 | 83.6 | % | $3,294 | |||||||||||
| Grossed Up Vacant Space | 0 | 0 | 0 | 916,800 | 33.4 | 1,315 | ||||||||||||
| Concessions | (4,736 | ) | (900 | ) | (700 | ) | (700 | ) | (0.0 | ) | (1 | ) | ||||||
| Other Income(2) | 412,408 | 454,784 | 451,603 | 451,603 | 16.4 | 648 | ||||||||||||
| Less Vacancy & Credit Loss | 0 | 0 | 0 | (916,800 | )(3) | (33.4 | ) | (1,315 | ) | |||||||||
| Effective Gross Income | $2,609,255 | $2,634,276 | $2,648,465 | $2,746,743 | 100.0 | % | $3,941 | |||||||||||
| Total Operating Expenses | $937,262 | $951,151 | $947,196 | $958,197 | 34.9 | % | $1,375 | |||||||||||
| Net Operating Income | $1,671,993 | $1,683,125 | $1,701,269 | $1,788,546 | 65.1 | % | $2,566 | |||||||||||
| Capital Expenditures | 0 | 0 | 0 | 34,850 | 1.3 | 50 | ||||||||||||
| Net Cash Flow | $1,671,993 | $1,683,125 | $1,701,269 | $1,753,696 | 63.8 | % | $2,516 | |||||||||||
| NOI DSCR | 1.36x | 1.37x | 1.38x | 1.46x | ||||||||||||||
| NCF DSCR | 1.36x | 1.37x | 1.38x | 1.43x | ||||||||||||||
| NOI DY | 9.1% | 9.1% | 9.2% | 9.7% | ||||||||||||||
| NCF DY | 9.1% | 9.1% | 9.2% | 9.5% | ||||||||||||||
| (1) | Base Rent includes income from park owned homes. |
| (2) | Other Income includes RUBS income, application fees, late fees, pet fees and miscellaneous income. |
| (3) | The underwritten economic vacancy is 28.6%. The Pueblo MHC Portfolio Properties were 71.2% physically occupied as of April 6, 2018. |
THE INFORMATION IN THIS STRUCTURAL AND COLLATERAL TERM SHEET IS NOT COMPLETE AND MAY BE AMENDED PRIOR TO THE TIME OF SALE. THIS TERM SHEET IS NOT AN OFFER TO SELL THESE SECURITIES AND IT IS NOT A SOLICITATION OF AN OFFER TO BUY THESE SECURITIES IN ANY JURISDICTION WHERE THE OFFER OR SALE IS NOT PERMITTED.
128
(THIS PAGE INTENTIONALLY LEFT BLANK)
THE INFORMATION IN THIS STRUCTURAL AND COLLATERAL TERM SHEET IS NOT COMPLETE AND MAY BE AMENDED PRIOR TO THE TIME OF SALE. THIS TERM SHEET IS NOT AN OFFER TO SELL THESE SECURITIES AND IT IS NOT A SOLICITATION OF AN OFFER TO BUY THESE SECURITIES IN ANY JURISDICTION WHERE THE OFFER OR SALE IS NOT PERMITTED.
129
| No. 13 – Roseville Corporate Center | |||||||
| Loan Information | Property Information | ||||||
| Mortgage Loan Seller: | Wells Fargo Bank, National Association | Single Asset/Portfolio: | Single Asset | ||||
| Credit Assessment (DBRS/Fitch/Moody’s): | NR/NR/NR | Property Type: | Office | ||||
| Original Principal Balance: | $16,000,000 | Specific Property Type: | Suburban | ||||
| Cut-off Date Principal Balance: | $16,000,000 | Location: | Roseville, CA | ||||
| % of Initial Pool Balance: | 2.4% | Size: | 109,234 SF | ||||
| Loan Purpose: | Acquisition |
Cut-off Date Balance Per SF: | $146.47 | ||||
| Borrower Name: | Roseville Corporate Center, LLC | Year Built/Renovated: | 1999/NAP | ||||
| Sponsors: | Stephen B. Dwelle; Walter A. Dwelle; Thomas A. Dwelle; David W. Dwelle | Title Vesting: | Fee | ||||
| Mortgage Rate: | 4.7100% | Property Manager: | RPI Property Management, Inc. | ||||
| Note Date: | June 1, 2018 | 4thMost Recent Occupancy (As of)(5): | 69.9% (12/31/2014) | ||||
| Anticipated Repayment Date: | NAP | 3rdMost Recent Occupancy (As of)(5): | 77.0% (12/31/2015) | ||||
| Maturity Date: | June 11, 2028 | 2ndMost Recent Occupancy (As of)(5): | 93.8% (12/31/2016) | ||||
| IO Period: | 120 months | Most Recent Occupancy (As of)(5): | 93.8% (12/31/2017) | ||||
| Loan Term (Original): | 120 months | Current Occupancy (As of): | 90.8% (5/23/2018) | ||||
| Seasoning: | 1 month | ||||||
| Amortization Term (Original): | NAP | Underwriting and Financial Information: | |||||
| Loan Amortization Type: | Interest-only, Balloon | 4thMost Recent NOI (As of)(6): | $1,193,866 (12/31/2015) | ||||
| Interest Accrual Method: | Actual/360 | 3reMost Recent NOI (As of)(6): | $1,341,057 (12/31/2016) | ||||
| Call Protection: | L(25),D(91),O(4) | 2ndMost Recent NOI (As of)(6): | $1,397,023 (12/31/2017) | ||||
| Lockbox Type: | Springing | Most Recent NOI (As of)(6): | $1,853,452 (Annualized 6 3/31/2018) | ||||
| Additional Debt: | None | ||||||
| Additional Debt Type: | NAP | U/W Revenues: | $2,770,885 | ||||
| U/W Expenses: | $896,651 | ||||||
| U/W NOI: | $1,874,235 | ||||||
| Escrows and Reserves: | U/W NCF: | $1,640,567 | |||||
| U/W NOI DSCR : | 2.45x | ||||||
| Type: | Initial | Monthly | Cap(If Any) | U/W NCF DSCR : | 2.15x | ||
| Taxes | $88,104 | $22,026 | NAP | U/W NOI Debt Yield : | 11.7% | ||
| Insurance | $0 | Springing(1) | NAP | U/W NCF Debt Yield : | 10.3% | ||
| Deferred Maintenance | $41,185 | $0 | NAP | As-Is Appraised Value: | $24,100,000 | ||
| Replacement Reserve | $0 | $3,018 | $108,648(2) | As-Is Appraisal Valuation Date: | April 25, 2018 | ||
| TI/LC Reserve | $0 | $11,379 | $500,000(3) | Cut-off Date LTV Ratio: | 66.4% | ||
| Revionics TI/LC Reserve(4) | $204,544 | $0 | NAP | LTV Ratio at Maturity or ARD: | 66.4% | ||
| (1) | The loan documents do not require ongoing monthly escrows for insurance premiums as long as (i) no event of default has occurred and is continuing; (ii) the borrower provides the lender with evidence that the Roseville Corporate Center Property’s (as defined below) insurance coverage is included in a blanket policy and such policy is in full force and effect; and (iii) the borrower pays all applicable insurance premiums and provides the lender with evidence of renewals. |
| (2) | The Replacement Reserve account will be capped at $108,648 as long as (i) no event of default is continuing and (ii) the Roseville Corporate Center Property is being adequately maintained as determined by lender based on annual inspections. |
| (3) | The Leasing Reserve account will be capped at $500,000 as long as (i) no event of default exists; (ii) the office building located at the Roseville Corporate Center Property maintains a minimum physical and economic occupancy of at least 79.0% (as determined by lender in its reasonable discretion); (iii) the net cash flow debt service coverage ratio does not fall below 1.15x; and (iv) the net cash flow debt yield is not less than 7.10%. |
| (4) | The tenant Revionics has a lease expiration date of November 30, 2018. At origination of the Roseville Corporate Center Mortgage Loan (as defined below), lender escrowed $204,544 for potential tenant improvement and leasing commission costs (“TI/LCs”) associated with the re-tenanting of Revionics’ space. The lender will release the escrowed funds to borrower if Revionics (a) extends or renews its lease in accordance with the terms thereof or otherwise on terms reasonably satisfactory to lender in accordance with the loan documents or (b)(i) enters into a new lease for the space at the Roseville Corporate Center Property currently known as “suite 230” upon terms and conditions reasonably satisfactory to lender and/or in accordance with the loan documents and (ii) lender receives reasonably satisfactory evidence that Revionics is in occupancy of its space and has commenced payment of full, unabated rent under its lease. In the event that these conditions are not satisfied, borrower may enter into a replacement lease for the Revionics space in accordance with the loan documents, and lender will disburse amounts from the Revionics Reserve to borrower for TI/LCs incurred in connection with such replacement lease as if the same were funds in the Leasing Reserve. |
| (5) | See “Historical Occupancy” table. |
| (6) | See “Cash Flow Analysis” section. |
The mortgage loan (the “Roseville Corporate Center Mortgage Loan”) is evidenced by a single promissory note that is secured by a first mortgage encumbering the borrower’s fee interest in a 109,234 square foot, class A, three-story suburban office building located in Roseville, California (the “Roseville Corporate Center Property”). The Roseville Corporate Center Property was developed in 1999 and is situated on a 10.9-acre site with 442 surface parking spaces resulting in a parking ratio of 4.0 spaces per 1,000 square feet of rentable area. As of May 23, 2018 the Roseville Corporate Center Property was 90.8% occupied by 13 tenants. Approximately 46.7% of the net rentable area and 53.8% of underwritten base rent at the Roseville Corporate Center Property is attributed to investment grade tenants.
THE INFORMATION IN THIS STRUCTURAL AND COLLATERAL TERM SHEET IS NOT COMPLETE AND MAY BE AMENDED PRIOR TO THE TIME OF SALE. THIS TERM SHEET IS NOT AN OFFER TO SELL THESE SECURITIES AND IT IS NOT A SOLICITATION OF AN OFFER TO BUY THESE SECURITIES IN ANY JURISDICTION WHERE THE OFFER OR SALE IS NOT PERMITTED.
130
ROSEVILLE CORPORATE CENTER
The largest tenant at the Roseville Corporate Center Property is Umpqua Bank (rated BBB+ by Fitch), which accounts for 14.8% of net rentable area and 18.0% of underwritten base rent with a February 2025 lease expiration. Umpqua Bank has been a tenant at the Roseville Corporate Center Property since 2005, expanded its space by 3,225 square feet in November 2010 and recently extended its lease by 7 years and 11 months in 2017. Umpqua Bank has one 5-year renewal option, with nine months’ notice, at the fair market rental rate.
The second largest tenant at the Roseville Corporate Center Property is Philadelphia Insurance/Maguire Insurance (“Philadelphia Insurance”), which accounts for 12.9% of net rentable area and 14.5% of underwritten base rent with a December 2024 lease expiration. Philadelphia Insurance signed a lease in July 2016 and its lease term commenced in March 2017. Philadelphia Insurance has one 5-year renewal option, with nine months’ notice, at the fair market rental rate.
The third largest tenant at the Roseville Corporate Center Property is Merrill, Lynch, Pierce, Fenner & Smith Incorporated (“Merrill Lynch”, rated A+/NR/A+ by Fitch/Moody’s/S&P), which accounts for 11.4% of net rentable area and 11.8% of underwritten base rent with an August 2022 lease expiration. Merrill Lynch signed a lease in June 2011 and its lease term commenced in October 2011. Merrill Lynch has two 5-year renewal options, with nine months’ notice, at the fair market rental rate.
Other than Umpqua Bank, Philadelphia Insurance and Merrill Lynch, no tenant accounts for more than 9.4% of the net rentable area or 11.0% of underwritten base rent at the Roseville Corporate Center Property.
The Roseville Corporate Center Property is located approximately 1.9 miles east of Interstate 80, 3.4 miles southeast of downtown Roseville, 19.5 miles northeast of downtown Sacramento and 25.7 miles northeast of the Sacramento International Airport. Westfield Galleria at Roseville, a 1.1 million square foot Unibail-Rodamco-Westfield -owned regional mall anchored by JCPenney, Nordstrom and Macy’s, is located approximately 3.3 miles northwest of the Roseville Corporate Center Property. According to the appraisal, as of 2017, the Sacramento-Roseville-Arden-Arcade metropolitan statistical area had an estimated population of approximately 2.3 million people with an estimated average household income of $88,639. According to a third-party market research report, the estimated 2018 population within a three- and five-mile radius of the Roseville Corporate Center Property was approximately 81,593, and 239,960, respectively; while the 2018 estimated average household income within the same radii was $111,004, and $101,255, respectively.
Per a third party market research provider, as of year-end 2017, the Roseville/Rocklin office submarket reported a total inventory of approximately 12.9 million square feet with an 8.7% vacancy rate. The appraiser concluded to market rents for the Roseville Corporate Center Property ranging from $26.40 to $28.80 per square foot, full service gross.
Sources and Uses
| Sources | Uses | |||||||
| Original loan amount | $16,000,000 | 67.3% | Purchase price(1) | $23,340,000 | 98.2% | |||
| Borrower sponsor’s new cash equity | 7,768,940 | 32.7 | Upfront reserves | 333,833 | 1.4 | |||
| Closing costs | 95,107 | 0.4 | ||||||
| Total Sources | $23,768,940 | 100.0% | Total Uses | $23,768,940 | 100.0% |
| (1) | The borrower acquired the Roseville Corporate Center Property in a transaction on October 6, 2017 for $23,340,000. |
THE INFORMATION IN THIS STRUCTURAL AND COLLATERAL TERM SHEET IS NOT COMPLETE AND MAY BE AMENDED PRIOR TO THE TIME OF SALE. THIS TERM SHEET IS NOT AN OFFER TO SELL THESE SECURITIES AND IT IS NOT A SOLICITATION OF AN OFFER TO BUY THESE SECURITIES IN ANY JURISDICTION WHERE THE OFFER OR SALE IS NOT PERMITTED.
131
ROSEVILLE CORPORATE CENTER
The following table presents certain information relating to the tenancy at the Roseville Corporate Center Property:
Major Tenants
| Tenant Name | Credit Rating (Fitch/Moody’s/ S&P)(1) | Tenant NRSF | % of NRSF | Annual U/W Base Rent PSF(2) | Annual U/W Base Rent(2) | % of Total Annual U/W Base Rent | Lease Expiration Date |
| Major Tenants | |||||||
| Umpqua Bank | BBB+/NR/NR | 16,162 | 14.8% | $30.40 | $491,396 | 18.0% | 2/28/2025(3) |
| Philadelphia Insurance | NR/NR/NR | 14,119 | 12.9% | $27.96 | $394,767 | 14.5% | 12/31/2024(4)(5) |
| Merrill Lynch | A+/NR/A+ | 12,442 | 11.4% | $25.80 | $321,004 | 11.8% | 8/31/2022(6) |
| Prudential Insurance Company | A/Baa1/A | 9,984 | 9.1% | $30.00 | $299,520 | 11.0% | 2/28/2021(7) |
| Bank of America | A/A3/A- | 10,242 | 9.4% | $28.50(8) | $291,927 | 10.7% | Various(9)(10) |
| Total Major Tenants | 62,949 | 57.6% | $28.57 | $1,798,614 | 66.0% | ||
| Non-Major Tenants | 36,284 | 33.2% | $25.49 | $925,010 | 34.0% | ||
| Occupied Collateral Total(11) | 99,233 | 90.8% | $27.45 | $2,723,624 | 100.0% | ||
| Vacant Space | 10,001 | 9.2% | |||||
| Collateral Total | 109,234 | 100.0% | |||||
| (1) | Certain ratings are those of the parent company whether or not the parent guarantees the lease. |
| (2) | Annual U/W Base Rent PSF and Annual U/W Base Rent include contractual rent steps through March 2019 for eight tenants totalling $38,758 and straight-line rent averaging for investment grade tenants over the remaining lease term for Umpqua Bank, JP Morgan Chase Bank, Merrill Lynch and the 4,164 square foot Bank of America space totalling $64,464. Umpqua Bank, JP Morgan Chase Bank, Merrill Lynch and the 4,164 square foot Bank of America space have current annual base rent per square foot of $27.72, $27.84, $24.60 and $27.48, respectively. |
| (3) | Umpqua Bank has one 5-year renewal option, with nine months’ notice, at the fair market rental rate. |
| (4) | Philadelphia Insurance has one 5-year renewal option, with nine months’ notice, at the fair market rental rate. |
| (5) | Philadelphia Insurance has a one-time right to terminate its lease effective August 31, 2022 if the company shuts down its operations in Sacramento and Placer County or the company’s business needs require it to expand operations beyond borrower’s ability to accommodate the company at the Roseville Corporate Center Property or any of borrower’s other properties in Roseville, California. With respect to the termination option, Philadelphia Insurance is required to provide 12 months’ notice, not be in default under its lease at the time of notice or termination and pay a termination fee of the sum of (i) the $186,371 base rent abatement amount, plus (ii) the unamortized improvement costs, leasing commissions, moving allowance and test-fit allowance. |
| (6) | Merrill Lynch has two 5-year renewal options, with nine months’ notice, at the fair market rental rate. |
| (7) | Prudential Insurance Company has one 5-year renewal option, with 10 months’ notice, at the fair market rental rate. |
| (8) | Bank of America leases two spaces: 6,078 square feet with an Annual U/W Base Rent PSF of $28.32 and Lease Expiration Date of January 31, 2020; and 4,164 square feet with an Annual U/W Base Rent PSF of $28.77 and Lease Expiration Date of November 30, 2021. |
| (9) | Bank of America has two 5-year renewal options for its 6,078 square foot space, with 10 months’ notice, at the fair market rental rate. Bank of America has two 3-year renewal options for its 4,164 square foot space, with ten months’ notice, at the fair market rental rate. |
| (10) | Bank of America has a one-time right to terminate the lease for its 4,164 square foot space effective January 31, 2020, with nine months’ notice and payment of all unamortized improvement costs, rent abatements and leasing commissions. Bank of America does not have any remaining termination options for its 6,078 square foot space. Bank of America expanded its space by 4,164 square feet in December 2016. |
| (11) | Includes 3,176 square feet of conference room and health club space, which has no lease and no attributed Annual U/W Base Rent. |
The following table presents certain information relating to the lease rollover schedule at the Roseville Corporate Center Property:
Lease Expiration Schedule(1)(2)
| Year Ending December 31, | No. of Leases Expiring | Expiring NRSF | % of Total NRSF | Cumulative Expiring NRSF | Cumulative % of Total NRSF | Annual U/W Base Rent(4) | % of Total Annual U/W Base Rent | Annual U/W Base Rent PSF(4) |
| MTM(3) | 1 | 3,176 | 2.9% | 3,176 | 2.9% | $0(3) | 0.0% | $0.00(3) |
| 2018 | 1 | 7,411 | 6.8% | 10,587 | 9.7% | $204,544 | 7.5% | $27.60 |
| 2019 | 3 | 19,892 | 18.2% | 30,479 | 27.9% | $555,966 | 20.4% | $27.95 |
| 2020 | 1 | 6,078 | 5.6% | 36,557 | 33.5% | $172,129 | 6.3% | $28.32 |
| 2021 | 4 | 18,854 | 17.3% | 55,411 | 50.7% | $553,250 | 20.3% | $29.34 |
| 2022 | 2 | 13,541 | 12.4% | 68,952 | 63.1% | $351,572 | 12.9% | $25.96 |
| 2023 | 0 | 0 | 0.0% | 68,952 | 63.1% | $0 | 0.0% | $0.00 |
| 2024 | 1 | 14,119 | 12.9% | 83,071 | 76.0% | $394,767 | 14.5% | $27.96 |
| 2025 | 4 | 16,162 | 14.8% | 99,233 | 90.8% | $491,396 | 18.0% | $30.40 |
| 2026 | 0 | 0 | 0.0% | 99,233 | 90.8% | $0 | 0.0% | $0.00 |
| 2027 | 0 | 0 | 0.0% | 99,233 | 90.8% | $0 | 0.0% | $0.00 |
| 2028 | 0 | 0 | 0.0% | 99,233 | 90.8% | $0 | 0.0% | $0.00 |
| Thereafter | 0 | 0 | 0.0% | 99,233 | 90.8% | $0 | 0.0% | $0.00 |
| Vacant | 0 | 10,001 | 9.2% | 109,234 | 100.0% | $0 | 0.0% | $0.00 |
| Total/Weighted Average | 17 | 109,234 | 100.0% | $2,723,624 | 100.0% | $27.45 |
| (1) | Information obtained from the underwritten rent roll. |
THE INFORMATION IN THIS STRUCTURAL AND COLLATERAL TERM SHEET IS NOT COMPLETE AND MAY BE AMENDED PRIOR TO THE TIME OF SALE. THIS TERM SHEET IS NOT AN OFFER TO SELL THESE SECURITIES AND IT IS NOT A SOLICITATION OF AN OFFER TO BUY THESE SECURITIES IN ANY JURISDICTION WHERE THE OFFER OR SALE IS NOT PERMITTED.
132
ROSEVILLE CORPORATE CENTER
| (2) | Certain tenants may have lease termination options that are exercisable prior to the originally stated expiration date of the subject lease and that are not considered in the Lease Expiration Schedule. |
| (3) | MTM includes 3,176 square feet of conference room and health club space, which has no lease and no attributed Annual U/W Base Rent. |
| (4) | Weighted Average Annual U/W Base Rent PSF and Total Annual U/W Base Rent exclude vacant space. |
The following table presents historical occupancy percentages at the Roseville Corporate Center Property:
Historical Occupancy
12/31/2014(1) | 12/31/2015(1)(2) | 12/31/2016(1)(2) | 12/31/2017(1) | 5/23/2018(3) |
| 69.9% | 77.0% | 93.8% | 93.8% | 90.8% |
| (1) | Information obtainedfrom a third-party market research provider. |
| (2) | The increase in occupancy from 12/31/2015 to 12/31/2016 can be attributed in part to the new lease with Philadelphia Insurance (14,119 square feet, 12.9% of net rentable area) signed in July 2016 (with its lease term commencing in March 2017) along with Bank of America’s expansion from 6,078 square feet to 10,242 square feet (expansion of approximately 3.8% of net rentable area) signed in June 2016 (with its lease term commencing in December 2016). |
| (3) | Information obtained from the underwritten rent roll. |
Operating History and Underwritten Net Cash Flow.The following table presents certain information relating to the historical operating performance and underwritten net cash flow at the Roseville Corporate Center Property:
Cash Flow Analysis(1)
| 2015(2) | 2016(2) | 2017(3) | Annualized 6 3/31/2018(3) | U/W | % of U/W Effective Gross Income | U/W $ per SF | |
| Base Rent | $1,937,538 | $2,109,012 | $2,162,035 | $2,605,067 | $2,723,624 | 98.3% | $24.93 |
| Grossed Up Vacant Space | 0 | 0 | 0 | 0 | $276,027 | 10.0 | 2.53 |
| Total Reimbursement | 1,740 | 2,968 | 11,105 | 34,757 | 67,598 | 2.4 | 0.62 |
| Other Income(4) | 1,005 | 376 | 2,145 | 3,784 | 3,600 | 0.1 | 0.03 |
| Less Vacancy & Credit Loss | 0 | 0 | 0 | 0 | (299,965)(5) | (10.8) | (2.75) |
| Effective Gross Income | $1,940,284 | $2,112,356 | $2,175,284 | $2,643,607 | $2,770,884 | 100.0% | $25.37 |
| Total Operating Expenses | $746,418 | $771,300 | $778,261 | $790,155 | $896,651 | 32.4% | $8.21 |
|
|
|
|
|
|
| |
| Net Operating Income | $1,193,866 | $1,341,057 | $1,397,023 | $1,853,452 | $1,874,233 | 67.6% | $17.16 |
| Replacement Reserves | 0 | 0 | 0 | 0 | 36,047 | 1.3 | 0.33 |
| TI/LC | 0 | 0 | 0 | 0 | 197,621 | 7.1 | 1.81 |
| Net Cash Flow | $1,193,866 | $1,341,057 | $1,397,023 | $1,853,452 | $1,640,565 | 59.2% | $15.02 |
| NOI DSCR | 1.56x | 1.76x | 1.83x | 2.43x | 2.45x | ||
| NCF DSCR | 1.56x | 1.76x | 1.83x | 2.43x | 2.15x | ||
| NOI DY | 7.5% | 8.4% | 8.7% | 11.6% | 11.7% | ||
| NCF DY | 7.5% | 8.4% | 8.7% | 11.6% | 10.3% |
| (1) | Annual U/W Base Rent PSF and Annual U/W Base Rent include contractual rent steps through March 2019 for eight tenants totalling $38,758 and straight-line rent averaging for investment grade tenants over the remaining lease term for Umpqua Bank, JP Morgan Chase Bank, Merrill Lynch and the 4,164 square foot Bank of America space totalling $64,464. |
| (2) | The increase in Base Rent and Net Operating Income from 2015 to 2016 was driven by (i) one new lease totalling 6.3% of underwritten base rent signed in February 2015 and (ii) two renewal leases totalling 5.9% of underwritten base rent signed from July 2015 to August 2016. |
| (3) | The increase in Base Rent and Net Operating Income from 2017 to Annualized 6 3/31/2018 was driven by (i) one new lease totalling 14.5% of underwritten base rent signed in March 2017 and (ii) seven renewal leases totalling 37.7% of underwritten base rent signed from March 2017 to December 2017. |
| (4) | Other Income includes kiosk income from a small café space on the ground floor and antennae use income by Prudential Insurance Company. |
| (5) | The underwritten economic vacancy is 10.0%. The Roseville Corporate Center Property was 90.8%% physically occupied as of May 23, 2018. |
THE INFORMATION IN THIS STRUCTURAL AND COLLATERAL TERM SHEET IS NOT COMPLETE AND MAY BE AMENDED PRIOR TO THE TIME OF SALE. THIS TERM SHEET IS NOT AN OFFER TO SELL THESE SECURITIES AND IT IS NOT A SOLICITATION OF AN OFFER TO BUY THESE SECURITIES IN ANY JURISDICTION WHERE THE OFFER OR SALE IS NOT PERMITTED.
133
| No. 14 – Montclair East |
| Loan Information | Property Information | |||||
| Mortgage Loan Seller: | Rialto Mortgage Finance, LLC | Single Asset/Portfolio: | Single Asset | |||
| Credit Assessment (DBRS/Fitch/Moody’s): | NR/NR/NR | Property Type: | Retail | |||
| Original Principal Balance: | $14,700,000 | Specific Property Type: | Anchored | |||
| Cut-off Date Principal Balance: | $14,700,000 | Location: | Montclair, CA | |||
| % of Initial Pool Balance: | 2.2% | Size: | 135,603 SF | |||
| Loan Purpose: | Refinance | Cut-off Date Principal Balance Per SF: | $108.40 | |||
| Borrower Name: | Montclair Plaza Partners, LLC | Year Built/Renovated: | 1992/NAP | |||
| Sponsor: | Behnam “Benny” Kohanteb; Benjamin Donel | Title Vesting: | Fee | |||
| Mortgage Rate: | 5.1200% | Property Manager: | Self-managed | |||
| 4thMost Recent Occupancy (As of)(2): | NAV | |||||
| Note Date: | June 13, 2018 | 3rdMost Recent Occupancy (As of)(2): | NAV | |||
| Anticipated Repayment Date: | NAP | 2ndMost Recent Occupancy (As of)(2): | NAV | |||
| Maturity Date: | July 6, 2028 | Most Recent Occupancy (As of): | 47.3% (12/31/2017) | |||
| IO Period: | 120 months | Current Occupancy (As of): | 98.8% (5/11/2018) | |||
| Loan Term (Original): | 120 months | |||||
| Seasoning: | 0 months | Underwriting and Financial Information: | ||||
| Amortization Term (Original): | NAP | 4thMost Recent NOI (As of)(2): | NAV | |||
| Loan Amortization Type: | Interest Only, Balloon | 3rdMost Recent NOI (As of)(2): | NAV | |||
| Interest Accrual Method: | Actual/360 | 2ndMost Recent NOI (As of): | $633,715 (12/31/2017) | |||
| Call Protection: | L(24),GRTR 1% or YM(92),O(4) | Most Recent NOI (As of): | $606,157 (TTM 3/31/2018) | |||
| Lockbox Type: | Springing | |||||
| Additional Debt: | None | U/W Revenues: | $1,847,613 | |||
| Additional Debt Type: | NAP | U/W Expenses: | $474,097 | |||
| U/W NOI: | $1,373,516 | |||||
| U/W NCF: | $1,285,374 | |||||
| Escrows and Reserves: | U/W NOI DSCR: | 1.80x | ||||
| U/W NCF DSCR: | 1.68x | |||||
| Type: | Initial | Monthly | Cap (If Any) | U/W NOI Debt Yield: | 9.3% | |
| Taxes | $60,818 | $14,480 | NAP | U/W NCF Debt Yield: | 8.7% | |
| Insurance | $2,061 | $654 | NAP | As-Is Appraised Value: | $25,200,000 | |
| Replacement Reserves | $0 | $1,695 | NAP | As-Is Appraisal Valuation Date: | March 23, 2018 | |
| TI/LC Reserve | $500,000 | Springing | NAP | Cut-off Date LTV Ratio: | 58.3% | |
| Other Reserves(1) | $1,745,976 | $0 | NAP | LTV Ratio at Maturity or ARD: | 58.3% | |
| (1) | Other Reserves include a $1,500,000 new tenant reserve and a $245,976 rent concession reserve. The $1,500,000 new tenant reserve consists of (a) $842,493 for Hair Beauty Secret and (b) $657,507 for USA Furniture. Amounts in the new tenant reserve may be released to the borrower provided that (i) no event of default exists and (ii) the debt yield is not less than 8.7% (as determined by the lender) and (iii) the borrower delivers to the lender an executed estoppel certificate stating the respective tenant is open for business and paying full, unabated rent and common area maintenance reimbursements in accordance with its lease. The $245,976 free rent reserve consists of (a) $150,000 for Ross Stores and (b) $95,975 for dd’s Discount Stores. The free rent reserve may be released to the borrower provided that no event of default exists and the borrower provides an executed estoppel certificate stating that the respective tenant is in occupancy, open for business and paying full, unabated rent and common area maintenance reimbursements in accordance with the its lease. |
| (2) | Historical occupancy, operating and financial information prior to 2016 is not available as the borrower acquired the Montclair East Property as an REO property in May 2016. Since acquisition the borrower has leased the Montclair East Property up to its current occupancy rate of 98.8%. |
The mortgage loan is evidenced by a single promissory note that is secured by a first mortgage encumbering the fee interest in an 135,603 square foot anchored retail property located in Montclair, California (the “Montclair East Property”), approximately 35 miles east of the Los Angeles central business district. The Montclair East Property consists of two single story retail buildings which were constructed in 1992 and are situated on a 9.6 acre site. The Montclair East Property is anchored by Ross Stores, dd’s Discounts, Fallas Discount Stores, Five Below, and Dollar Tree. The Montclair East Property contains 509 surface parking spaces, resulting in a parking ratio of 3.8 spaces per 1,000 square feet. As of May 11, 2018, the Montclair East Property was 98.8% occupied by 14 national, regional and local tenants.
The Montclair East Property is located at the southeast corner of Central Avenue and Moreno Street in Montclair, California. Montclair is located in the western portion of San Bernardino County, on the border of Los Angeles County. The Montclair East Property neighborhood is accessed by the San Bernardino (10) and Pomona (60) freeways. Location and proximity to the freeway system gives the Montclair East Property neighborhood access to the major employment centers in Inland Empire, northern Orange County and Los Angeles County. The Montclair East Property is located within a major retail cluster, with an unanchored retail strip center located to the north, a freestanding retail building located to the east, McDonalds, Chipotle, Petco, Harbor Freight Tools, Chase Bank, and El Pollo Loco located to the west and the San Bernardino freeway located to the south. According to a third party market
THE INFORMATION IN THIS STRUCTURAL AND COLLATERAL TERM SHEET IS NOT COMPLETE AND MAY BE AMENDED PRIOR TO THE TIME OF SALE. THIS TERM SHEET IS NOT AN OFFER TO SELL THESE SECURITIES AND IT IS NOT A SOLICITATION OF AN OFFER TO BUY THESE SECURITIES IN ANY JURISDICTION WHERE THE OFFER OR SALE IS NOT PERMITTED.
134
MONTCLAIR EAST
research report, the 2018 estimated population within a one, three, and five-mile radius of the Montclair East Property is 19,303, 184,911, and 456,363. The 2018 average household income within the same radii is $62,119, $78,734, and $82,585.
According to the appraisal, the Montclair East Property is located within the Inland Empire retail market, which contained 117.7 million square feet of inventory as of the fourth quarter of 2017. The Inland Empire retail market reported an overall vacancy rate of 8.0% with an average quoted rental rate of $25.20 per square foot. As of the fourth quarter of 2017, the Inland Empire market reported positive net absorption of 531,118 square feet, with 103,000 square feet of retail space being delivered and 421,725 square feet under construction.
According to the appraisal, the Montclair East Property is located within the West End retail submarket, which contained 27.7 million square feet of retail space as of the fourth quarter of 2017. The West End retail market reported an overall vacancy rate of 7.7% with an average quoted rental rate of $27.48 per square foot. As of the fourth quarter of 2017, the West End submarket reported positive net absorption of 22,260 square feet, with 50,000 square feet being delivered and 234,135 square feet under construction.
Sources and Uses
| Sources | Uses | |||||||
| Original loan amount | $14,700,000 | 100.0% | Loan payoff | $11,895,927 | 80.9% | |||
| Reserves | 2,308,855 | 15.7 | ||||||
| Return of Equity | 333,316 | 2.3 | ||||||
| Closing Costs | 161,902 | 1.1 | ||||||
| Total Sources | $14,700,000 | 100.0% | Total Uses | $14,700,000 | 100.0% |
The following table presents certain information relating to the tenancies at the Montclair East Property:
Major Tenants
| Tenant Name | Credit Rating (Fitch/ Moody’s/ S&P)(1) | Tenant NRSF | % of NRSF | Annual U/W Base Rent PSF(2) | Annual U/W Base Rent(2) | % of Total Annual U/W Base Rent | Sales PSF(3) | Occupancy Cost(3) | Lease Expiration Date |
| Anchor Tenants | |||||||||
| Ross Stores | NR/A3/A- | 41,623 | 30.7% | $8.65 | $360,000 | 24.5% | NAV | NAV | 2/28/2028(4) |
| dd’s Discounts | NR/A3/A- | 24,000 | 17.7% | $12.00 | $287,928 | 19.6% | $541 | 2.8% | 1/31/2024(5) |
| Fallas Discount Stores | NR/NR/NR | 22,500 | 16.6% | $7.40 | $166,500 | 11.3% | NAV | NAV | 1/31/2023(6) |
| Five Below, Inc. | NR/NR/NR | 12,652 | 9.3% | $12.95 | $163,808 | 11.1% | NAV | NAV | 12/31/2027(7) |
| Dollar Tree | NR/Baa3/NR | 10,385 | 7.7% | $10.00 | $103,850 | 7.1% | NAV | NAV | 9/30/2020(8) |
| Total Anchor Tenants | 111,160 | 82.0% | $9.73 | $1,082,086 | 73.6% | ||||
| Major Tenants | |||||||||
| Hair Beauty Secret, LLC | NR/NR/NR | 6,615 | 4.9% | $14.00 | $92,610 | 6.3% | NAV | NAV | 8/31/2023(9) |
| Total Major Tenants | 6,615 | 4.9% | $14.00 | $92,610 | 6.3% | ||||
| Non-Major Tenants | 16,225 | 12.0% | $18.24 | $295,884 | 20.1% | ||||
| Occupied Collateral Total | 134,000 | 98.8% | $10.97 | $1,470,581 | 100.0% | ||||
| Vacant Space | 1,603 | 1.2% | |||||||
| Collateral Total | 135,603 | 100.0% | |||||||
| (1) | Certain ratings are those of the parent company whether or not the parent guarantees the lease. |
| (2) | Unless otherwise noted, Annual U/W Base Rent PSF and Annual U/W Base Rent include contractual rent escalations through February 2019. |
| (3) | Sales PSF and Occupancy Costs are for the trailing 12-month period ending January 31, 2018. |
| (4) | Ross Stores will pay abated rent for 120 days upon the delivery of the space in order to facilitate relocation to the space. The borrower reserved $150,000 with the lender related to this period. The tenant has four, 5-year renewal options remaining under its lease. |
| (5) | dd’s Discounts will pay abated rent for 120 days upon the delivery of the space in order to facilitate relocation to the space. The borrower reserved $95,975 with the lender related to this period. The tenant has four, 5-year renewal options remaining under its lease. |
| (6) | Fallas Discount Stores has two, 5-year renewal options remaining. |
| (7) | Five Below, Inc. has two, 5-year renewal options remaining. Five Below, Inc. has one termination option effective on the last day of the 60th full calendar month with a 90-day notice period and a termination fee equal 50% of the unamortized tenant improvement allowance. |
| (8) | Dollar Tree has three, 5-year renewal options remaining. |
| (9) | Hair Beauty Secret, LLC has one, 5-year renewal option remaining. |
THE INFORMATION IN THIS STRUCTURAL AND COLLATERAL TERM SHEET IS NOT COMPLETE AND MAY BE AMENDED PRIOR TO THE TIME OF SALE. THIS TERM SHEET IS NOT AN OFFER TO SELL THESE SECURITIES AND IT IS NOT A SOLICITATION OF AN OFFER TO BUY THESE SECURITIES IN ANY JURISDICTION WHERE THE OFFER OR SALE IS NOT PERMITTED.
135
MONTCLAIR EAST
The following table presents certain information relating to the lease rollover schedule at the Montclair East Property:
Lease Expiration Schedule(1)(2)
| Year Ending December 31, | No. of Leases Expiring | Expiring NRSF | % of Total NRSF | Cumulative Expiring NRSF | Cumulative % of Total NRSF | Annual U/W Base Rent | % of Total Annual U/W Base Rent | Annual U/W Base Rent PSF(3) |
| MTM | 0 | 0 | 0.0% | 0 | 0.0% | $0 | 0.0% | $0.00 |
| 2018 | 0 | 0 | 0.0% | 0 | 0.0% | $0 | 0.0% | $0.00 |
| 2019 | 2 | 4,695 | 3.5% | 4,695 | 3.5% | $100,676 | 6.8% | $21.44 |
| 2020 | 2 | 12,345 | 9.1% | 17,040 | 12.6% | $133,406 | 9.1% | $10.81 |
| 2021 | 0 | 0 | 0.0% | 17,040 | 12.6% | $0 | 0.0% | $0.00 |
| 2022 | 0 | 0 | 0.0% | 17,040 | 12.6% | $0 | 0.0% | $0.00 |
| 2023 | 6 | 37,425 | 27.6% | 54,465 | 40.2% | $400,623 | 27.2% | $10.70 |
| 2024 | 1 | 24,000 | 17.7% | 78,465 | 57.9% | $287,928 | 19.6% | $12.00 |
| 2025 | 0 | 0 | 0.0% | 78,465 | 57.9% | $0 | 0.0% | $0.00 |
| 2026 | 0 | 0 | 0.0% | 78,465 | 57.9% | $0 | 0.0% | $0.00 |
| 2027 | 1 | 12,652 | 9.3% | 91,117 | 67.2% | $163,808 | 11.1% | $12.95 |
| 2028 | 2 | 42,883 | 31.6% | 134,000 | 98.8% | $384,139 | 26.1% | $8.96 |
| Thereafter | 0 | 0 | 0.0% | 134,000 | 98.8% | $0 | 0.0% | $0.00 |
| Vacant | 0 | 1,603 | 1.2% | 135,603 | 100.0% | $0 | 0.0% | $0.00 |
| Total/Weighted Average | 14 | 135,603 | 100.0% | $1,470,581 | 100.0% | $10.97 |
| (1) | Information obtained from the underwritten rent roll. |
| (2) | Certain tenants may have lease termination options that are exercisable prior to the originally stated expiration date of the subject lease and that are not considered in the Lease Expiration Schedule. |
| (3) | Weighted Average Annual U/W Base Rent PSF excludes vacant space. |
The following table presents historical occupancy percentages at the Montclair East Property:
Historical Occupancy
12/31/2015(1) | 12/31/2016(1) | 12/31/2017(1) | 5/11/2018(2) | |||
| NAP | NAP | 47.3% | 98.8% |
| (1) | Information obtained from the borrower. The borrower acquired the Montclair East Property, which at the time was an REO property in May 2016; therefore, occupancy is not available prior to 2016. Since acquisition the borrower has leased up to Montclair East Property to its current occupancy of 98.8%. |
| (2) | Information obtained from the underwritten rent roll. |
Operating History and Underwritten Net Cash Flow. The following table presents certain information relating to the historical operating performance and Underwritten Net Cash Flow at the Montclair East Property:
Cash Flow Analysis(1)
| 2017 | TTM 3/31/2018 | U/W | % of U/W Effective Gross Income | U/W $ per SF | ||||||
| Base Rent | $816,411 | $810,002 | $1,463,349 | 79.2% | $10.79 | |||||
| Rent Steps | 0 | 0 | 7,231 | 0.4 | 0.05 | |||||
| Straight Line Rent(2) | 0 | 0 | 13,500 | 0.7 | 0.10 | |||||
| Grossed Up Vacant Space | 0 | 0 | 33,663 | 1.8 | 0.25 | |||||
| Total Reimbursements | 252,979 | 224,440 | 420,047 | 22.7 | 3.10 | |||||
| Other Income(3) | 5,890 | 6,712 | 6,712 | 0.4 | 0.05 | |||||
| Less Vacancy & Credit Loss(4) | 0 | 0 | (96,890) | (5.2) | (0.71) | |||||
| Effective Gross Income | $1,075,280 | $1,041,153 | $1,847,613 | 100.0% | $13.63 | |||||
| Total Operating Expenses | $441,565 | $434,997 | $474,097 | 25.7% | $3.50 | |||||
| Net Operating Income(5) | $633,715 | $606,157 | $1,373,516 | 74.3% | $10.13 | |||||
| TI/LC | 0 | 0 | 67,802 | 3.7 | 0.50 | |||||
| Capital Expenditures | 0 | 0 | 20,340 | 1.1 | 0.15 | |||||
| Net Cash Flow | $633,715 | $606,157 | $1,285,374 | 69.6% | $9.48 | |||||
| NOI DSCR | 0.83x | 0.79x | 1.80x | |||||||
| NCF DSCR | 0.83x | 0.79x | 1.68x | |||||||
| NOI DY | 4.3% | 4.1% | 9.3% | |||||||
| NCF DY | 4.3% | 4.1% | 8.7% |
| (1) | Historical operating and financial information prior to 2017 is not available as the borrower acquired the Montclair East Property as an REO property in May 2016. |
| (2) | Straight Line Rent is attributed to Ross Stores. |
| (3) | Other Income consists of late fees. |
| (4) | The underwritten economic vacancy is 5.0%. The Montclair East Property was 98.8% physically occupied as of May 11, 2018. |
| (5) | The UW NOI increased more than 10% compared to the TTM NOI because 8 tenants totalling 70,460 square feet started or extended their leases in 2018. This includes the largest tenant, Ross Stores, which accounts for 30.7% of the total net rentable area of the Montclair East Property. |
THE INFORMATION IN THIS STRUCTURAL AND COLLATERAL TERM SHEET IS NOT COMPLETE AND MAY BE AMENDED PRIOR TO THE TIME OF SALE. THIS TERM SHEET IS NOT AN OFFER TO SELL THESE SECURITIES AND IT IS NOT A SOLICITATION OF AN OFFER TO BUY THESE SECURITIES IN ANY JURISDICTION WHERE THE OFFER OR SALE IS NOT PERMITTED.
136
MONTCLAIR EAST
The following table presents certain information relating to comparable retail properties for Montclair East Property:
Competitive Set(1)
Property Name/Location | Year Built/Renovated | Total GLA (SF) | Total Occupancy | Distance from Subject | Tenant Name | Lease Area (SF) | Annual Base Rent PSF | Lease Type |
Montclair East (subject) Montclair, CA | 1992/NA | 135,603 | 98.8% | - | Ross Stores | 41,623 | $7.40 - $24.04 | NNN |
Montclair Village Plaza Montclair, CA | 1985/NA | 48,565 | 81% | 0.4 miles | Agustin A. Barrios | 1,377 | $18.00 - $22.00 | MG/NNN |
Upland Freeway Center Upland, CA | 1987/NA | 116,092 | 86% | 0.8 miles | Barbeques Galore | 8,200 | $13.20 | NNN |
Upland Square Upland, CA | 1965/2003 | 103,763 | 92% | 2.8 miles | Pet Supplies Plus | 7,993 | $17.04 - $26.40 | NNN |
Upland Plaza Upland, CA | 1975/NA | 65,220 | 95% | 2.9 miles | Ruben Bernal | 975 | $15.00 - $18.60 | NNN |
Foothill Town Center Upland, CA | 2004/NA | 96,380 | 100% | 3.5 miles | Arigato Sushi | 1,692 | $21.00 - $27.00 | NNN |
Chino Towne Center Chino, CA | 1981/NA | 117,419 | 91% | 4.5 miles | H&R Block | 1,800 | $15.00 - $18.00 | NNN |
Village Grove Shopping Center Upland, CA | 1980/NA | 156,556 | 90% | 4.5 miles | Biomat USA, Inc. | 13,800 | $15.00 - $30.00 | NNN |
| (1) | Information obtained from the appraisal dated June 7, 2018 and the underwritten rent roll. |
THE INFORMATION IN THIS STRUCTURAL AND COLLATERAL TERM SHEET IS NOT COMPLETE AND MAY BE AMENDED PRIOR TO THE TIME OF SALE. THIS TERM SHEET IS NOT AN OFFER TO SELL THESE SECURITIES AND IT IS NOT A SOLICITATION OF AN OFFER TO BUY THESE SECURITIES IN ANY JURISDICTION WHERE THE OFFER OR SALE IS NOT PERMITTED.
137
| No. 15 – Embassy Suites Tucson, AZ | |||||||
| Loan Information | Property Information | ||||||
| Mortgage Loan Seller: | Barclays Bank PLC | Single Asset/Portfolio: | Single Asset | ||||
| Credit Assessment (DBRS/Fitch/Moody’s): | NR/NR/NR | Property Type: | Hospitality | ||||
| Original Principal Balance: | $14,000,000 | Specific Property Type: | Select Service | ||||
| Cut-off Date Balance: | $13,983,135 | Location: | Tucson, AZ | ||||
| % of Initial Pool Balance: | 2.1% | Size: | 119 Rooms | ||||
| Loan Purpose: | Refinance | Cut-off Date Balance Per Room: | 117,505 | ||||
| Borrower Name: | LDK Tucson, LLC | Year Built/Renovated: | 2007/2017 | ||||
| Borrower Sponsor: | Lodging Dynamics | Title Vesting: | Fee | ||||
| Mortgage Rate: | 4.9860% | Property Manager: | Self-managed | ||||
| Note Date: | June 6, 2018 | 4thMost Recent Occupancy (As of): | 85.7% (12/31/2014) | ||||
| Anticipated Repayment Date: | NAP | 3rd Most Recent Occupancy (As of): | 84.3% (12/31/2015) | ||||
| Maturity Date: | June 6, 2028 | 2nd Most Recent Occupancy (As of)(4): | 82.4% (12/31/2016) | ||||
| IO Period: | 0 months | Most Recent Occupancy (As of)(4): | 82.0% (12/31/2017) | ||||
| Loan Term (Original): | 120 months | Current Occupancy (As of): | 83.7% (4/30/2018) | ||||
| Seasoning: | 1 month | ||||||
| Amortization Term (Original): | 360 months | Underwriting and Financial Information: | |||||
| Loan Amortization Type: | Amortizing Balloon | ||||||
| Interest Accrual Method: | Actual/360 | 4th Most Recent NOI (As of): | $1,705,358 (12/31/2015) | ||||
| Call Protection: | L(25),D(91),O(4) | 3rd Most Recent NOI (As of): | $1,616,818 (12/31/2016) | ||||
| Lockbox Type: | Hard/Springing Cash Management | 2nd Most Recent NOI (As of): | $1,845,636 (12/31/2017) | ||||
| Additional Debt(1): | Yes | Most Recent NOI (As of): | $2,069,720 (TTM 4/30/2018) | ||||
| Additional Debt Type(1): | Permitted Future Mezzanine | ||||||
| U/W Revenues: | $6,080,718 | ||||||
| U/W Expenses: | $3,994,549 | ||||||
| U/W NOI: | $2,086,169 | ||||||
| U/W NCF: | $1,842,940 | ||||||
| U/W NOI DSCR: | 2.32x | ||||||
| Escrows and Reserves: | U/W NCF DSCR: | 2.05x | |||||
| U/W NOI Debt Yield: | 14.9% | ||||||
| Type: | Initial | Monthly | Cap (If Any) | U/W NCF Debt Yield: | 13.2% | ||
| Taxes | $56,039 | $18,680 | NAP | As-Is Appraised Value: | $22,000,000 | ||
| Insurance(2) | $0 | Springing | NAP | As-Is Appraisal Valuation Date: | April 27, 2018 | ||
| FF&E Reserve(3) | $0 | Springing | NAP | Cut-off Date LTV Ratio: | 63.6% | ||
| PIP Reserve | $297,323 | $0 | NAP | LTV Ratio at Maturity or ARD: | 52.3% | ||
| (1) | The loan documents permit mezzanine financing subject to certain conditions, including: (i) no event of default has occurred and is continuing; (ii) the mezzanine financing is obtained simultaneously with the closing of a permitted transfer of the Embassy Suites Tucson, AZ Property; (iii) the combined loan-to-value ratio is not greater than the loan-to-value ratio at origination; (iv) the combined amortizing debt service coverage ratio is not less than the amortizing debt service coverage ratio at origination; and (v) receipt of rating agency confirmation from each of Fitch, DBRS and Moody’s that the mezzanine financing will not result in a downgrade, withdrawal or qualification of the respective ratings assigned to the Series WFCM 2018-C45 certificates. |
| (2) | Ongoing monthly reserves for insurance are not required as long as (i) no event of default has occurred and is continuing; (ii) the Embassy Suites Tucson, AZ Property (as defined below) is insured via an acceptable blanket insurance policy; and (iii) the borrower provides the lender with evidence of renewal of the insurance policies and timely proof of payment of insurance premiums. |
| (3) | On the 13th payment date and on each payment date thereafter, the borrower shall deposit one-twelfth of the greater of (x) 4.0% of the projected annual gross income from operations of the Embassy Suites Tucson, AZ Property and (y) the amount required for FF&E under the franchise agreement. |
| (4) | According to the appraisal, 2016 and 2017 occupancy declined because of a $1.6 million PIP renovation completed at the Embassy Suites Tucson, AZ Property. |
The Embassy Suites Tucson, AZ mortgage loan is evidenced by a single promissory note that is secured by a first mortgage encumbering the borrower’s fee interest in a two-story, 119-room select service hotel located in Tucson, Arizona (the “Embassy Suites Tucson, AZ Property”). The Embassy Suites Tucson, AZ Property, which opened in 2007, is comprised of 119 rooms, 2,667 square feet of meeting space, a breakfast dining area, an outdoor pool, a fitness room, a lobby workstation, a market pantry, a guest laundry room, a courtyard and vending areas. Other amenities include daily complimentary made to order hot full breakfast, an evening social with complimentary drinks and snacks, business center internet access, and a complimentary shuttle service within a 5-mile radius. The area surrounding the Embassy Suites Tucson, AZ Property features the University of Arizona, local golf courses, shopping and dining in downtown Tucson and hiking trails in Sabino Canyon and Saguaro National Park. The Embassy Suites Tucson, AZ Property operates under the flag of Embassy Suites by Hilton pursuant to a franchise agreement that extends through July 2030. The Embassy Suites Tucson, AZ Property benefits from the franchise in large part due to the extensive reservations system (HHonors®) of the Hilton umbrella of hotels.
THE INFORMATION IN THIS STRUCTURAL AND COLLATERAL TERM SHEET IS NOT COMPLETE AND MAY BE AMENDED PRIOR TO THE TIME OF SALE. THIS TERM SHEET IS NOT AN OFFER TO SELL THESE SECURITIES AND IT IS NOT A SOLICITATION OF AN OFFER TO BUY THESE SECURITIES IN ANY JURISDICTION WHERE THE OFFER OR SALE IS NOT PERMITTED.
138
EMBASSY SUITES TUCSON, AZ
The Embassy Suites Tucson, AZ Property is situated on Skyline Drive in Tucson, Pima County, Arizona, with primary regional access provided by east/west Interstate 10, which extends to Las Cruces, New Mexico to the east and Phoenix, Arizona to the northwest. The surrounding area is served by the Tucson International Airport, approximately 12.0 miles to the south of the Embassy Suites Tucson, AZ Property. The Embassy Suites Tucson, AZ Property is nestled in the foothills of Santa Catalina Mountains, offering a view over Tucson. The hotel’s demand drivers are the University of Arizona, Mount Lemmon, La Encantada Shopping area, Sabino Canyon, and local corporate clients. According to the appraisal, the 2018 estimated population within a one-, three- and five-mile radius of the Embassy Suites Tucson, AZ Property was 4,525, 30,276 and 129,916, respectively; while the 2018 estimated average household income within the same radii was $148,545, $119,180 and $73,721, respectively.
Sources and Uses
| Sources | Uses | |||||||
| Original whole loan amount | $14,000,000 | 100.0% | Loan payoff | $10,283,824 | 73.5% | |||
| Return of equity | 3,056,215 | 21.8 | ||||||
| Reserves | 353,362 | 2.5 | ||||||
| Closing costs | 306,600 | 2.2 | ||||||
| Total Sources | $14,000,000 | 100.0% | Total Uses | $14,000,000 | 100.0% |
Operating History and Underwritten Net Cash Flow.The following table presents certain information relating to the historical operating performance and underwritten net cash flow at the Embassy Suites Tucson, AZ Property:
Cash Flow Analysis
| 2015 | 2016 | 2017 | TTM 4/30/2018 | U/W | % of U/W Total Revenue | U/W $ per Room | |
| Occupancy | 84.3% | 82.4% | 82.0% | 83.7% | 83.7% | ||
| ADR | $131.67 | $138.57 | $152.77 | $156.45 | $156.45 | ||
| RevPAR | $107.75 | $114.17 | $125.27 | $130.95 | $130.95 | ||
| Room Revenue | $4,820,603 | $4,972,577 | $5,441,020 | $5,687,745 | $5,687,755 | 93.5% | $47,796 |
| F&B Revenue | 268,973 | 195,111 | 294,496 | 328,742 | 328,742 | 5.4 | 2,763 |
| Other Revenue(1) | 49,971 | 44,349 | 72,440 | 64,221 | 64,221 | 1.1 | 540 |
| Total Revenue | $5,139,547 | $5,212,037 | $5,807,956 | $6,080,708 | $6,080,718 | 100% | $51,098 |
| Total Operating Expenses | 3,434,189 | 3,595,219 | 3,962,320 | 4,010,988 | 3,994,549 | 65.7 | 33,568 |
| Net Operating Income | $1,705,358 | $1,616,818 | $1,845,636 | $2,069,720 | $2,086,169 | 34.3% | $17,531 |
| FF&E | 0 | 0 | 0 | 0 | 243,229 | 4.0 | 2,044 |
| Net Cash Flow | $1,705,358 | $1,616,818 | $1,845,636 | $2,069,720 | $1,842,940 | 30.3% | $15,487 |
| NOI DSCR | 1.89x | 1.80x | 2.05x | 2.30x | 2.32x | ||
| NCF DSCR | 1.89x | 1.80x | 2.05x | 2.30x | 2.05x | ||
| NOI DY | 12.2% | 11.6% | 13.2% | 14.8% | 14.9% | ||
| NCF DY | 12.2% | 11.6% | 13.2% | 14.8% | 13.2% | ||
| (1) | Other Revenue consists primarily of food and beverage revenue, vending machine sales, laundry, and conference room rental revenue. |
The following table presents certain information relating to the Embassy Suites Tucson, AZ Property’s competitive set:
Subject and Market Historical Occupancy, ADR and RevPAR(1)
Competitive Set | Embassy Suites Tucson | Penetration Factor | |||||||
Year | Occupancy | ADR | RevPAR | Occupancy | ADR | RevPAR | Occupancy | ADR | RevPAR |
| TTM 12/31/2017 | 65.0% | $108.91 | $70.77 | 82.0% | $152.77 | $125.27 | 126.2% | 140.3% | 177.0% |
| TTM 12/31/2016 | 65.0% | $108.49 | $70.54 | 82.4% | 138.57 | $114.17 | 126.7% | 127.7% | 161.8% |
| TTM 12/31/2015 | 65.3% | $105.19 | $68.65 | 84.3% | $131.67 | $107.75 | 129.2% | 125.2% | 157.0% |
| (1) | Information obtained from a third party hospitality report dated January 18, 2018. Competitive set includes the following hotels: Embassy Suites Tucson Paloma Village, DoubleTree Tucson@ Reid Park, DoubleTree Suites Tucson Williams Center, Radisson Suites Tucson, Wyndham Westward Look Grand Resort & Spa, Tucson Hotel, and Holiday Inn Express & Suites North Tucson Mall. |
THE INFORMATION IN THIS STRUCTURAL AND COLLATERAL TERM SHEET IS NOT COMPLETE AND MAY BE AMENDED PRIOR TO THE TIME OF SALE. THIS TERM SHEET IS NOT AN OFFER TO SELL THESE SECURITIES AND IT IS NOT A SOLICITATION OF AN OFFER TO BUY THESE SECURITIES IN ANY JURISDICTION WHERE THE OFFER OR SALE IS NOT PERMITTED.
139
| Wells Fargo Commercial Mortgage Trust 2018-C45 | Transaction Contact Information |
| VI. | Transaction Contact Information |
Questions regarding this Structural and Collateral Term Sheet may be directed to any of the following individuals:
| Wells Fargo Securities, LLC | |
| Brigid Mattingly | Tel. (312) 269-3062 |
| A.J. Sfarra | Tel. (212) 214-5613 |
| Alex Wong | Tel. (212) 214-5615 |
| Barclays Capital Inc. | |
| Daniel Vinson | Tel. (212) 528-8224 |
| Brian Wiele | Tel. (212) 412-5780 |
| Brian La Belle | Tel. (212) 526-1809 |
THE INFORMATION IN THIS STRUCTURAL AND COLLATERAL TERM SHEET IS NOT COMPLETE AND MAY BE AMENDED PRIOR TO THE TIME OF SALE. THIS TERM SHEET IS NOT AN OFFER TO SELL THESE SECURITIES AND IT IS NOT A SOLICITATION OF AN OFFER TO BUY THESE SECURITIES IN ANY JURISDICTION WHERE THE OFFER OR SALE IS NOT PERMITTED.
140