UNITED STATES
SECURITIES AND EXCHANGE COMMISSION
Washington, D.C. 20549
FORM N-CSR
CERTIFIED SHAREHOLDER REPORT OF REGISTERED
MANAGEMENT INVESTMENT COMPANIES
Investment Company Act file number (811-23377)
Tidal ETF Trust
(Exact name of registrant as specified in charter)
234 West Florida Street, Suite 203
Milwaukee, Wisconsin 53204
(Address of principal executive offices) (Zip code)
Eric W. Falkeis
Tidal ETF Trust
234 West Florida Street, Suite 203
Milwaukee, Wisconsin 53204
(Name and address of agent for service)
(844) 986-7700
Registrant’s telephone number, including area code
Date of fiscal year end: November 30
Date of reporting period: May 31, 2024
Item 1. Reports to Stockholders.
Sound Enhanced Fixed Income ETF Tailored Shareholder Report
Sound Enhanced Fixed Income ETF Tailored Shareholder Report
semi-annual Shareholder Report May 31, 2024 Sound Enhanced Fixed Income ETF Sound Enhanced Fixed Income ETF Ticker: FXED ( Listed on New York Stock Exchange LLC) |
This semi-annual shareholder report contains important information about the Sound Enhanced Fixed Income ETF (the "Fund") for the period December 1, 2023 to May 31, 2024. You can find additional information about the Fund at www.soundetfs.com. You can also request this information by contacting us at (833) 916-9056 or by sending an email request to connect@soundincomestrategies.com.
What were the Fund costs for the past six months?
(based on a hypothetical $10,000 investment)
Fund Name | Costs of a $10,000 investment | Costs paid as a percentage of a $10,000 investment |
|---|
Sound Enhanced Fixed Income ETF | $24 | 0.49% |
Key Fund Statistics
(as of May 31, 2024 )
| |
|---|
Fund Size (Thousands) | $36,859 |
Number of Holdings | 52 |
Portfolio Turnover | 4% |
Sector Breakdown (% of net assets)
Sector | % of Net Assets |
Financial | 0.534 |
Exchange Traded Funds | 0.126 |
Energy | 0.082 |
Utilities | 0.066 |
Consumer, Cyclical | 0.052 |
Basic Materials | 0.036 |
Cash Equivalents | 0.026 |
Industrial | 0.021 |
Communications | 0.02 |
Consumer, Non-cyclical | 0.019 |
Technology | 0.018 |
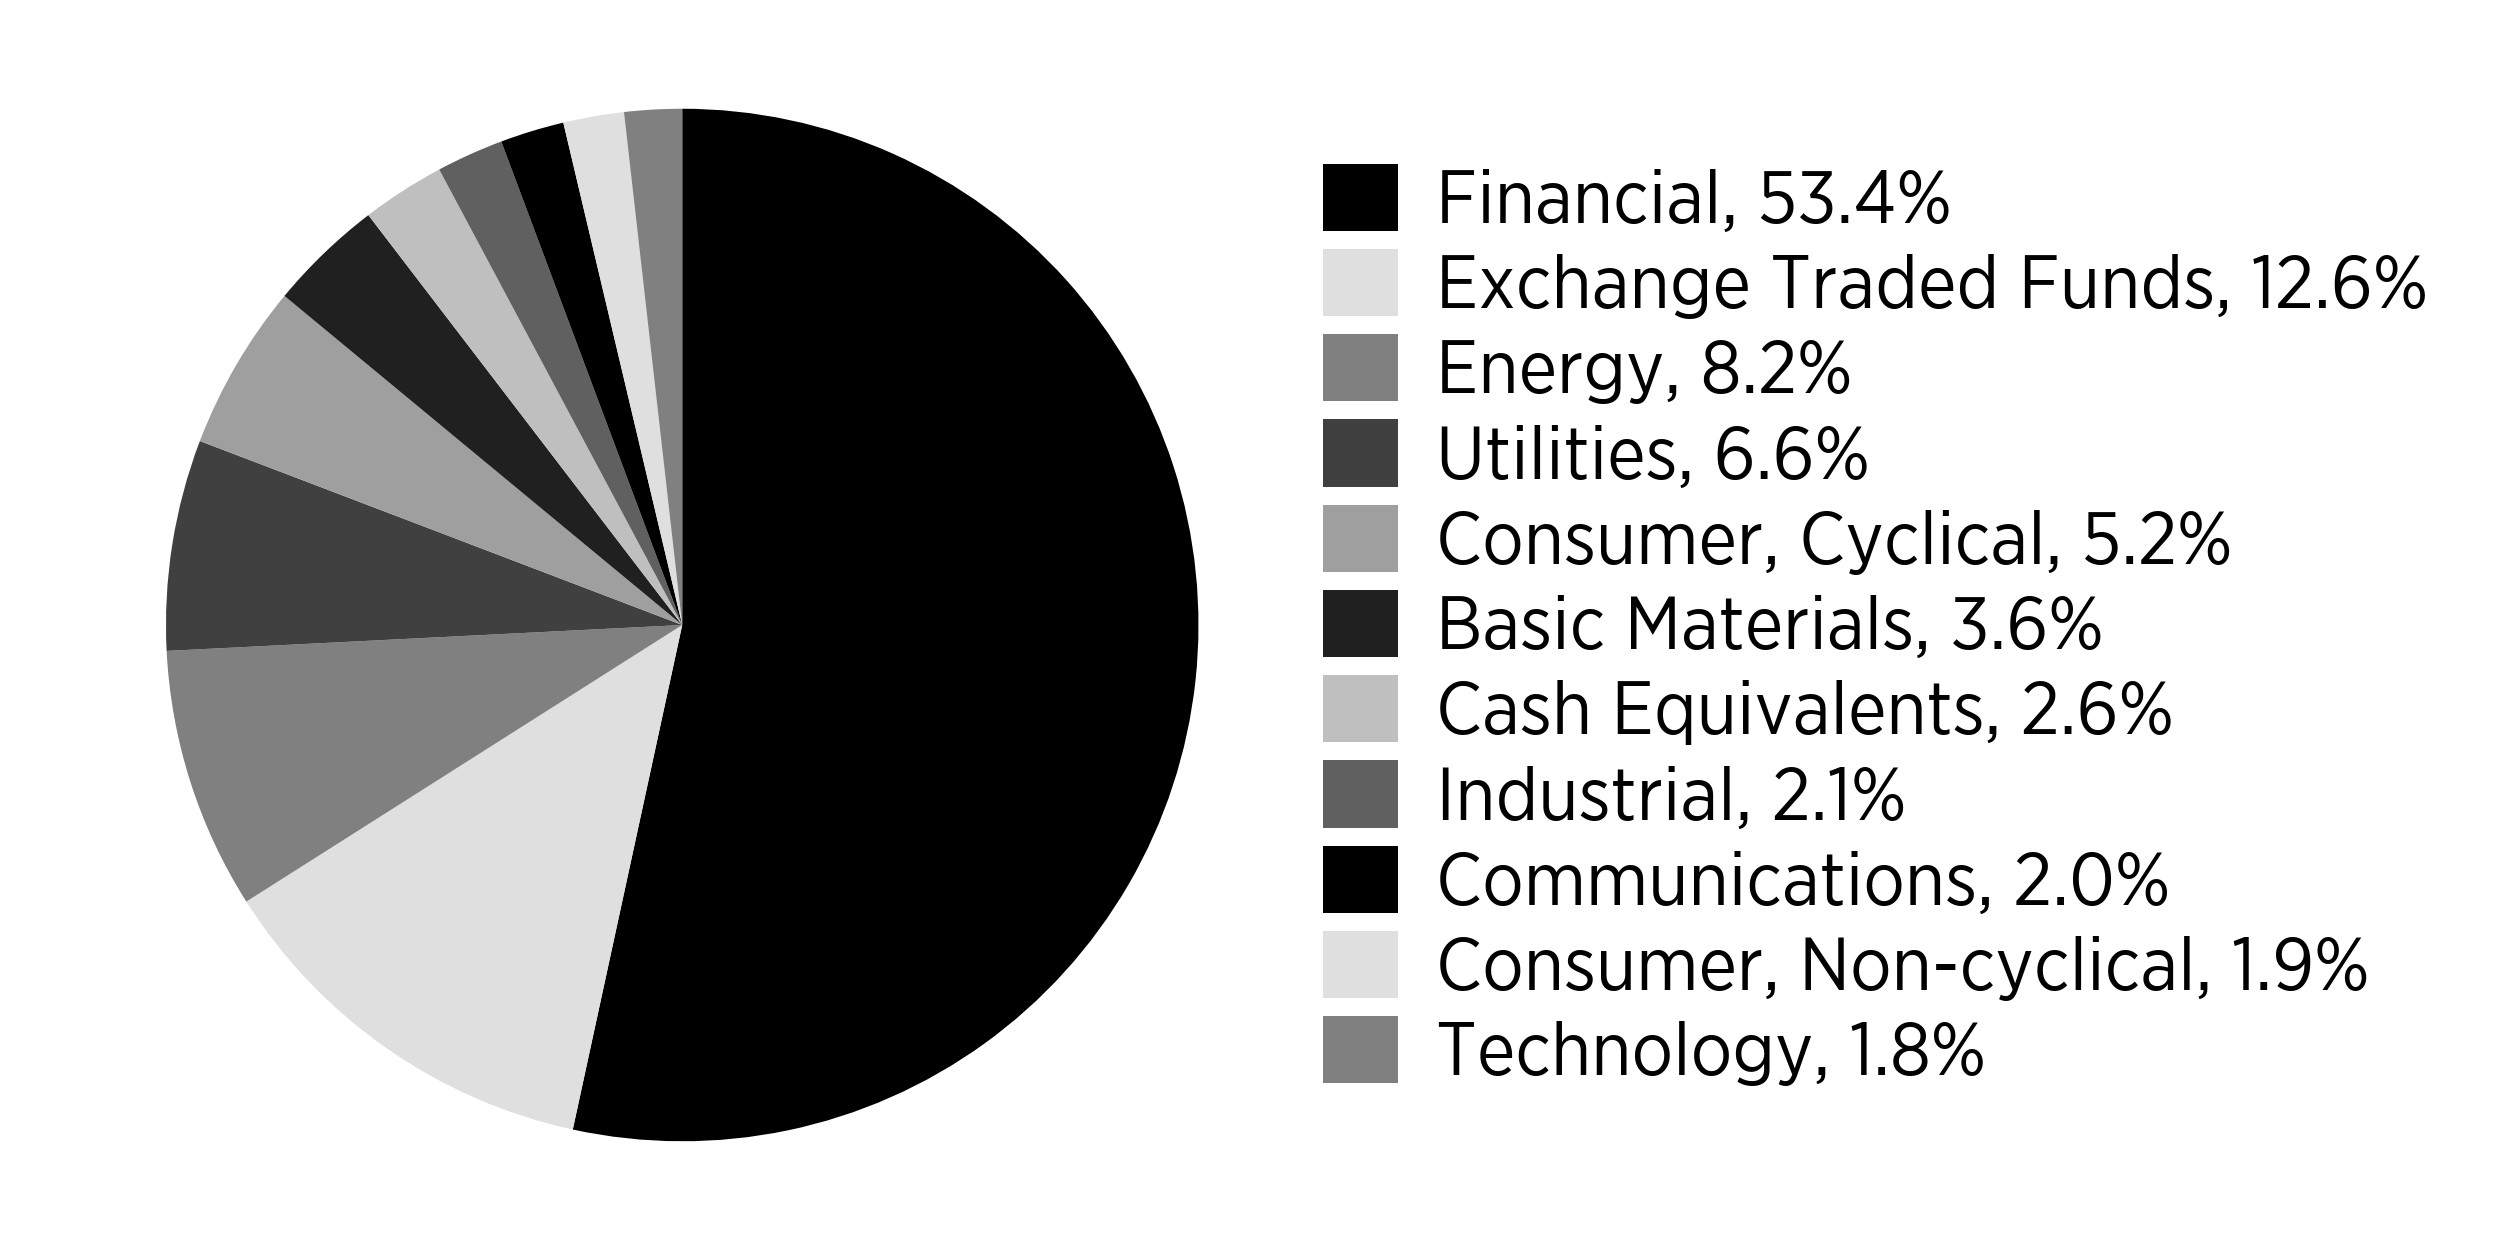
Percentages are based on total net assets. Cash Equivalents represents short-term investments, investments purchased with proceeds from securities lending and liabilities in excess of other assets.
What did the Fund invest in?
(as of May 31, 2024 )
Top 10 Holdings | (% of net assets) |
|---|
Hercules Capital, Inc. | 3.68 |
Ares Capital Corp. | 3.45 |
Golub Capital BDC, Inc. | 3.19 |
iShares 0-5 Year High Yield Corporate Bond ETF | 2.97 |
AllianceBernstein Global High Income Fund, Inc. | 2.91 |
PennantPark Floating Rate Capital Ltd. | 2.91 |
Sixth Street Specialty Lending, Inc. | 2.83 |
iShares J.P. Morgan EM High Yield Bond ETF | 2.59 |
Murphy Oil Corp., 5.88%, 12/01/2027 | 2.37 |
JPMorgan Chase & Co., Series EE, 6.00%, Perpetual | 2.35 |
How has the Fund changed?
There were no material changes during the reporting period.
Changes in and Disagreements with Accountants
There were no changes in or disagreements with accountants during the reporting period.
Householding
Householding is an option available to certain investors of the Fund. Householding is a method of delivery, based on the preference of the individual investor, in which a single copy of certain shareholder documents can be delivered to investors who share the same address, even if their accounts are registered under different names. Householding for the Fund is available through certain broker-dealers. If you are interested in enrolling in householding and receiving a single copy of prospectuses and other shareholder documents, please contact your broker-dealer. If you are currently enrolled in householding and wish to change your householding status, please contact your broker-dealer.
For additional information about the Fund; including its prospectus, financial information, holdings and proxy information, visit www.soundetfs.com .
Sound Equity Dividend Income ETF Tailored Shareholder Report
Sound Equity Dividend Income ETF Tailored Shareholder Report
semi-annual Shareholder Report May 31, 2024 Sound Equity Dividend Income ETF Sound Equity Dividend Income ETF Ticker: DIVY ( Listed on New York Stock Exchange LLC) |
This semi-annual shareholder report contains important information about the Sound Equity Dividend Income ETF (the "Fund") for the period December 1, 2023 to May 31, 2024. You can find additional information about the Fund at www.soundetfs.com. You can also request this information by contacting us at (833) 916-9056 or by sending an email request to connect@soundincomestrategies.com.
What were the Fund costs for the past six months?
(based on a hypothetical $10,000 investment)
Fund Name | Costs of a $10,000 investment | Costs paid as a percentage of a $10,000 investment |
|---|
Sound Equity Dividend Income ETF | $22 | 0.45% |
Key Fund Statistics
(as of May 31, 2024 )
| |
|---|
Fund Size (Thousands) | $28,705 |
Number of Holdings | 36 |
Portfolio Turnover | 8% |
Sector Breakdown (% of net assets)
Sector | % of Net Assets |
Consumer, Non-cyclical | 0.251 |
Energy | 0.173 |
Financial | 0.139 |
Communications | 0.133 |
Consumer, Cyclical | 0.081 |
Basic Materials | 0.069 |
Technology | 0.059 |
Utilities | 0.052 |
Industrial | 0.038 |
Cash Equivalents | 0.005 |
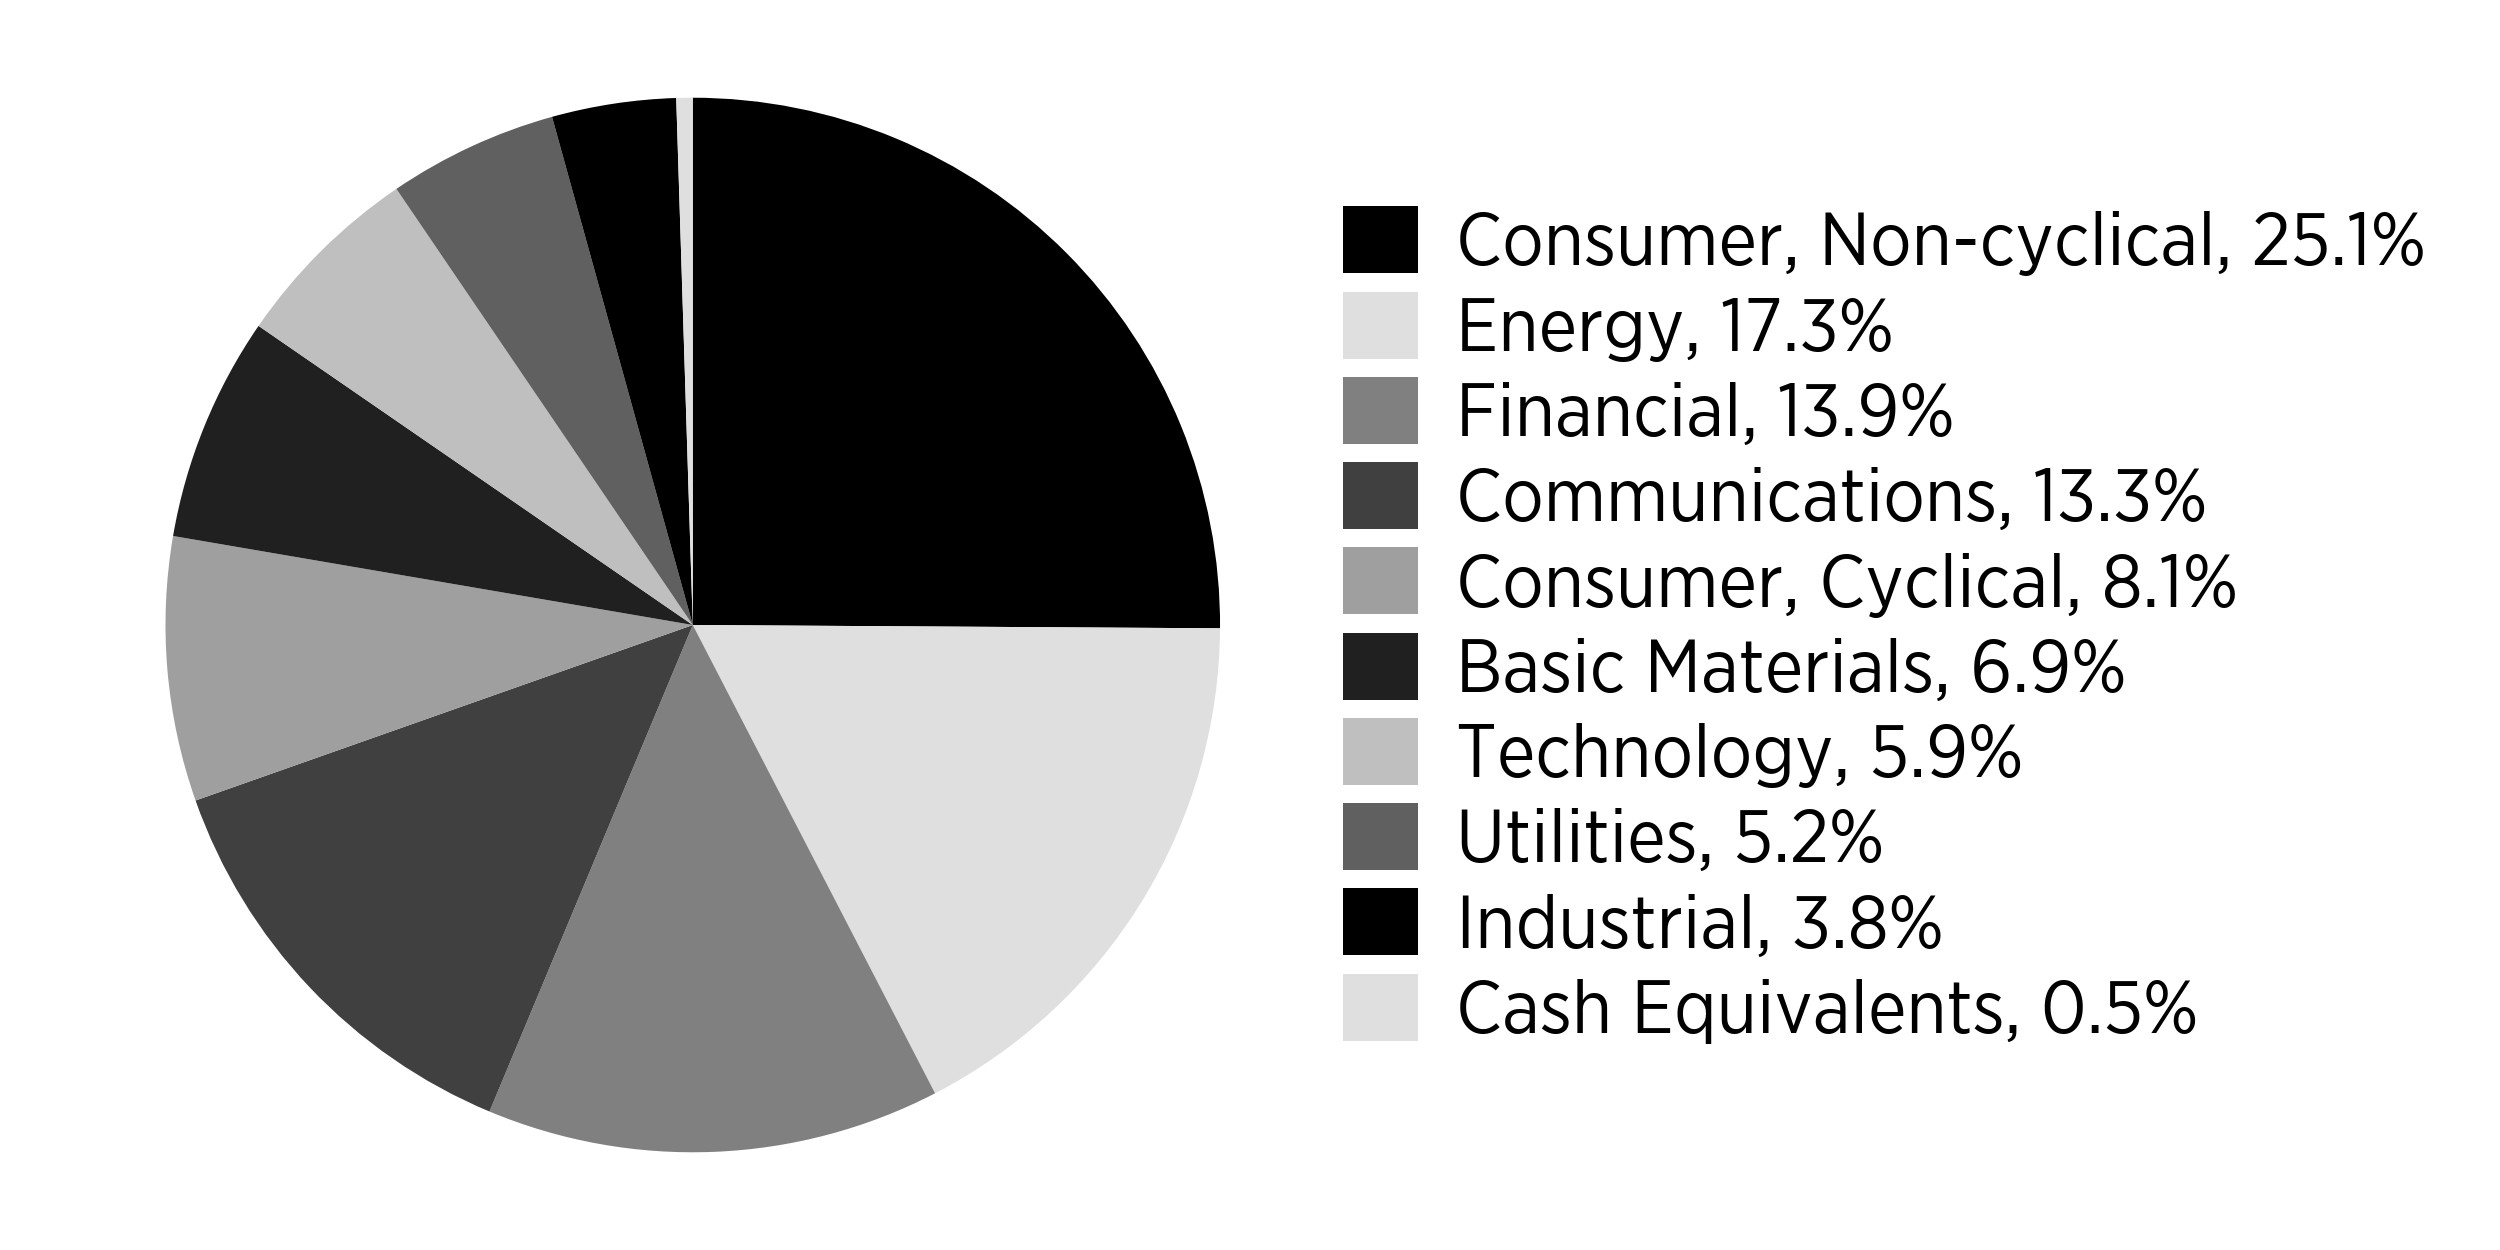
Percentages are based on total net assets. Cash Equivalents represents short-term investments, investments purchased with proceeds from securities lending and liabilities in excess of other assets.
What did the Fund invest in?
(as of May 31, 2024 )
Top 10 Holdings | (% of net assets) |
|---|
LyondellBasell Industries NV - Class A | 4.72 |
ONEOK, Inc. | 4.64 |
TotalEnergies SE - ADR | 4.19 |
Omnicom Group, Inc. | 4.01 |
Patterson Companies Inc. | 3.97 |
AT&T, Inc. | 3.88 |
Greif, Inc. - Class B | 3.82 |
Enbridge, Inc. | 3.82 |
GSK PLC - ADR | 3.81 |
Citigroup, Inc. | 3.56 |
How has the Fund changed?
There were no material changes during the reporting period.
Changes in and Disagreements with Accountants
There were no changes in or disagreements with accountants during the reporting period.
Householding
Householding is an option available to certain investors of the Fund. Householding is a method of delivery, based on the preference of the individual investor, in which a single copy of certain shareholder documents can be delivered to investors who share the same address, even if their accounts are registered under different names. Householding for the Fund is available through certain broker-dealers. If you are interested in enrolling in householding and receiving a single copy of prospectuses and other shareholder documents, please contact your broker-dealer. If you are currently enrolled in householding and wish to change your householding status, please contact your broker-dealer.
For additional information about the Fund; including its prospectus, financial information, holdings and proxy information, visit www.soundetfs.com .
Item 2. Code of Ethics.
Not applicable for semi-annual reports.
Item 3. Audit Committee Financial Expert.
Not applicable for semi-annual reports.
Item 4. Principal Accountant Fees and Services.
Not applicable for semi-annual reports.
Item 5. Audit Committee of Listed Registrants.
Not applicable for semi-annual reports.
Item 6. Investments.
| (a) | Schedule of Investments is included within the financial statements filed under Item 7 of this Form. |
Item 7. Financial Statements and Financial Highlights for Open-End Investment Companies.

Core Financial Statements
May 31, 2024 (Unaudited)
| Tidal ETF Trust |
| •Sound Enhanced Fixed Income ETF | | FXED | | New York Stock Exchange LLC |
| •Sound Equity Dividend Income ETF | | DIVY | | New York Stock Exchange LLC |
| Sound Income Strategies ETFs |
Table of Contents
| Schedules of Investments | Sound Enhanced Fixed Income ETF |
| May 31, 2024 (Unaudited) |
| PREFERRED STOCKS - 29.4% | | Shares | | | Value | |
| Banks - 14.8% | | | | | | | | |
| | | | 34,221 | | | $ | 673,127 | |
| Bank of America Corp., Series KK, 5.38%, Perpetual | | | 36,038 | | | | 829,235 | |
| JPMorgan Chase & Co., Series EE, 6.00%, Perpetual | | | 34,537 | | | | 865,152 | |
| Morgan Stanley | | | — | | | $ | — | |
| Series L, 4.88%, Perpetual | | | 37,066 | | | | 822,865 | |
| Series O, 4.25%, Perpetual | | | 35,942 | | | | 681,101 | |
| Truist Financial Corp., Series O, 5.25%, Perpetual | | | 35,407 | | | | 805,509 | |
| Wells Fargo & Co., Series AA, 4.70%, Perpetual | | | 37,698 | | | | 766,777 | |
| | | | | | | | 5,443,766 | |
| | | | | | | | | |
| Diversified Financial Services - 1.9% | | | | | | | | |
| Capital One Financial Corp., Series J, 4.80%, Perpetual | | | 37,935 | | | | 718,109 | |
| | | | | | | | | |
| Electric - 4.5% | | | | | | | | |
| CMS Energy Corp., 5.88%, 03/01/2079 | | | 35,170 | | | | 859,203 | |
| The Southern Co., Series 2020, 4.95%, 01/30/2080 | | | 35,881 | | | | 794,764 | |
| | | | | | | | 1,653,967 | |
| | | | | | | | | |
| Insurance - 6.2% | | | | | | | | |
| AEGON Funding Co., LLC, 5.10%, 12/15/2049 | | | 36,275 | | | | 755,246 | |
| MetLife, Inc., Series F, 4.75%, Perpetual | | | 36,117 | | | | 737,148 | |
| The Allstate Corp., Series H, 5.10%, Perpetual | | | 35,248 | | | | 777,923 | |
| | | | | | | | 2,270,317 | |
| | | | | | | | | |
| Telecommunications - 2.0% | | | | | | | | |
| AT&T, Inc., Series C, 4.75%, Perpetual | | | 36,592 | | | | 737,329 | |
| TOTAL PREFERRED STOCKS (Cost $12,196,767) | | | | | | | 10,823,488 | |
| | | | | | | | | |
| CORPORATE BONDS - 27.0% | | | Par | | | | | |
| Auto Parts & Equipment - 3.2% | | | | | | | | |
| American Axle & Manufacturing, Inc., 5.00%, 10/01/2029(a) | | | 717,000 | | | | 653,696 | |
| Dana, Inc., 4.25%, 09/01/2030 | | | 599,000 | | | | 521,362 | |
| | | | | | | | 1,175,058 | |
| | | | | | | | | |
| Chemicals - 2.1% | | | | | | | | |
| Olin Corp., 5.13%, 09/15/2027 | | | 789,000 | | | | 765,825 | |
| | | | | | | | | |
| Commercial Services - 1.9% | | | | | | | | |
| United Rentals North America, Inc., 4.88%, 01/15/2028 | | | 727,000 | | | | 700,398 | |
| | | | | | | | | |
| Computers - 1.8% | | | | | | | | |
| Dell, Inc., 6.50%, 04/15/2038 | | | 616,000 | | | | 651,354 | |
| | | | | | | | | |
| Diversified Financial Services - 2.1% | | | | | | | | |
| Radian Group, Inc., 4.88%, 03/15/2027 | | | 789,000 | | | | 768,353 | |
| | | | | | | | | |
| Gas - 2.1% | | | | | | | | |
| National Fuel Gas Co., 4.75%, 09/01/2028 | | | 789,000 | | | | 764,567 | |
| | | | | | | | | |
| Iron & Steel - 1.5% | | | | | | | | |
| Cleveland-Cliffs, Inc., 5.88%, 06/01/2027 | | | 581,000 | | | | 576,039 | |
The accompanying notes are an integral part of these financial statements.
| Schedules of Investments (Continued) | Sound Enhanced Fixed Income ETF |
| May 31, 2024 (Unaudited) |
| Lodging - 2.0% | | | | | | | | |
| Hilton Domestic Operating Co., Inc., 4.88%, 01/15/2030 | | | 782,000 | | | | 740,002 | |
| | | | | | | | | |
| Miscellaneous Manufacturers - 2.1% | | | | | | | | |
| Trinity Industries, Inc., 4.55%, 10/01/2024 | | | 789,000 | | | | 788,097 | |
| | | | | | | | | |
| Oil & Gas - 4.2% | | | | | | | | |
| Apache Corp., 5.10%, 09/01/2040 | | | 789,000 | | | | 679,556 | |
| Murphy Oil Corp., 5.88%, 12/01/2027 | | | 868,000 | | | | 872,244 | |
| | | | | | | | 1,551,800 | |
| | | | | | | | | |
| Pipelines - 4.0% | | | | | | | | |
| EQM Midstream Partners L.P., 5.50%, 07/15/2028 (a) | | | 711,000 | | | | 695,477 | |
| Targa Resources Partners LP / Targa Resources Partners Finance Corp., 5.00%, 01/15/2028 (a) | | | 789,000 | | | | 770,065 | |
| | | | | | | | 1,465,542 | |
| TOTAL CORPORATE BONDS (Cost $10,258,724) | | | | | | | 9,947,035 | |
| | | | | | | | | |
| COMMON STOCKS - 18.6% | | | Shares | | | | | |
| Investment Companies - 14.9% | | | | | | | | |
| Ares Capital Corp.(a) | | | 59,017 | | | | 1,272,996 | |
| Golub Capital BDC, Inc.(a) | | | 70,910 | | | | 1,174,979 | |
| PennantPark Floating Rate Capital Ltd.(a) | | | 94,046 | | | | 1,071,184 | |
| Runway Growth Finance Corp. | | | 29,243 | | | | 350,331 | |
| Sixth Street Specialty Lending, Inc.(a) | | | 47,379 | | | | 1,042,812 | |
| WhiteHorse Finance, Inc.(a) | | | 45,020 | | | | 578,507 | |
| | | | | | | | 5,490,809 | |
| | | | | | | | | |
| Private Equity - 3.7% | | | | | | | | |
| Hercules Capital, Inc.(a) | | | 68,698 | | | | 1,356,099 | |
| TOTAL COMMON STOCKS (Cost $6,571,869) | | | | | | | 6,846,908 | |
| | | | | | | | | |
| EXCHANGE TRADED FUNDS - 12.6% | | | | | | | | |
| AllianceBernstein Global High Income Fund, Inc. | | | 100,427 | | | | 1,072,560 | |
| Invesco Emerging Markets Sovereign Debt ETF | | | 38,380 | | | | 776,428 | |
| iShares 0-5 Year High Yield Corporate Bond ETF | | | 25,962 | | | | 1,095,596 | |
| iShares J.P. Morgan EM High Yield Bond ETF | | | 25,409 | | | | 953,092 | |
| VanEck Emerging Markets High Yield Bond ETF(a) | | | 38,054 | | | | 729,876 | |
| TOTAL EXCHANGE TRADED FUNDS (Cost $4,991,378) | | | | | | | 4,627,552 | |
| | | | | | | | | |
| REAL ESTATE INVESTMENT TRUSTS - 9.8% | | | | | | | | |
| Alpine Income Property Trust, Inc. | | | 21,328 | | | | 334,423 | |
| Apple Hospitality REIT, Inc.(a) | | | 9,819 | | | | 141,786 | |
| Gaming and Leisure Properties, Inc. | | | 2,567 | | | | 115,258 | |
| National Health Investors, Inc. | | | 2,668 | | | | 176,302 | |
| NNN REIT, Inc.(a) | | | 6,221 | | | | 259,851 | |
| Omega Healthcare Investors, Inc.(a) | | | 10,612 | | | | 343,086 | |
| Park Hotels & Resorts, Inc. | | | 13,821 | | | | 219,201 | |
| Plymouth Industrial REIT, Inc. | | | 21,819 | | | | 455,144 | |
| Realty Income Corp.(a) | | | 7,429 | | | | 394,183 | |
| Simon Property Group, Inc. | | | 4,644 | | | | 702,684 | |
| VICI Properties, Inc.(a) | | | 17,081 | | | | 490,396 | |
| TOTAL REAL ESTATE INVESTMENT TRUSTS (Cost $3,565,325) | | | | | | | 3,632,314 | |
The accompanying notes are an integral part of these financial statements.
| Schedules of Investments (Continued) | Sound Enhanced Fixed Income ETF |
| May 31, 2024 (Unaudited) |
| SHORT-TERM INVESTMENTS - 21.0% | | | | | | | | |
| Investments Purchased with Proceeds from Securities Lending - 18.3% | | | | | | | | |
| Mount Vernon Liquid Assets Portfolio, LLC(b) | | | 6,731,008 | | | | 6,731,008 | |
Money Market Funds - 2.7% | | | | | | | | |
| First American Government Obligations Fund - Class X, 5.24%(b) | | | 1,017,690 | | | | 1,017,690 | |
| TOTAL SHORT-TERM INVESTMENTS (Cost $7,748,698) | | | | | | | 7,748,698 | |
| | | | | | | | | |
| TOTAL INVESTMENTS - 118.4% (Cost $45,332,761) | | | | | | $ | 43,625,995 | |
| Liabilities in Excess of Other Assets - (18.4)% | | | | | | | (6,766,886 | ) |
| TOTAL NET ASSETS - 100.0% | | | | | | $ | 36,859,109 | |
Percentages are stated as a percent of net assets.
| (a) | | All or a portion of this security is on loan as of May 31, 2024. The total market value of these securities was $6,550,504 which represented 17.8% of net assets. |
| (b) | | The rate shown represents the 7-day effective yield as of May 31, 2024. |
The accompanying notes are an integral part of these financial statements.
| Schedules of Investments | Sound Equity Dividend Income ETF |
| May 31, 2024 (Unaudited) |
| COMMON STOCKS - 99.5% | | Shares | | | Value | |
| Advertising - 5.9% | | | |
| Omnicom Group, Inc. | | | 12,369 | | | $ | 1,149,822 | |
| The Interpublic Group of Cos., Inc. | | | 17,789 | | | | 558,041 | |
| | | | | | | | 1,707,863 | |
| | | | | | | | | |
| Apparel - 1.9% | | | | | | | | |
| Carter’s, Inc. | | | 7,879 | | | | 538,924 | |
| | | | | | | | | |
| Banks - 6.3% | | | | | | | | |
| Citigroup, Inc. | | | 16,383 | | | | 1,020,825 | |
| M&T Bank Corp. | | | 5,241 | | | | 794,535 | |
| | | | | | | | 1,815,360 | |
| | | | | | | | | |
| Chemicals - 6.9% | | | | | | | | |
| Dow, Inc. | | | 10,783 | | | | 621,424 | |
| LyondellBasell Industries NV - Class A | | | 13,642 | | | | 1,356,288 | |
| | | | | | | | 1,977,712 | |
| | | | | | | | | |
| Commercial Services - 1.6% | | | | | | | | |
| H&R Block, Inc. | | | 9,211 | | | | 457,234 | |
| | | | | | | | | |
| Computers - 3.3% | | | | | | | | |
| International Business Machines Corp. | | | 5,592 | | | | 933,025 | |
| | | | | | | | | |
| Cosmetics & Personal Care - 4.1% | | | | | | | | |
| Kenvue, Inc. | | | 24,800 | | | | 478,640 | |
| Unilever PLC - ADR | | | 12,777 | | | | 699,541 | |
| | | | | | | | 1,178,181 | |
| | | | | | | | | |
| Diversified Financial Services - 2.7% | | | | | | | | |
| Franklin Resources, Inc. | | | 33,223 | | | | 784,063 | |
| | | | | | | | | |
| Electric - 5.2% | | | | | | | | |
| Edison International | | | 11,143 | | | | 856,339 | |
| Entergy Corp. | | | 5,561 | | | | 625,557 | |
| | | | | | | | 1,481,896 | |
| | | | | | | | | |
| Food - 1.0% | | | | | | | | |
| The Kraft Heinz Co. | | | 8,368 | | | | 295,976 | |
| | | | | | | | | |
| Healthcare - Products - 4.0% | | | | | | | | |
| Patterson Cos. Inc. | | | 46,386 | | | | 1,140,632 | |
| | | | | | | | | |
| Household Products & Wares - 1.1% | | | | | | | | |
| Reckitt Benckiser Group PLC - ADR | | | 26,879 | | | | 308,840 | |
| | | | | | | | | |
| Insurance - 4.8% | | | | | | | | |
| Corebridge Financial, Inc. | | | 15,602 | | | | 455,110 | |
| Principal Financial Group, Inc. | | | 11,376 | | | | 933,287 | |
| | | | | | | | 1,388,397 | |
The accompanying notes are an integral part of these financial statements.
| Schedules of Investments (Continued) | Sound Equity Dividend Income ETF |
| May 31, 2024 (Unaudited) |
Office & Business Equipment - 2.6% | | | | | | | | |
| Xerox Holdings Corp. | | | 53,763 | | | | 755,908 | |
| | | | | | | | | |
| Oil & Gas - 8.9% | | | | | | | | |
| HF Sinclair Corp. | | | 9,932 | | | | 548,545 | |
| TotalEnergies SE - ADR | | | 16,460 | | | | 1,203,555 | |
| Valero Energy Corp. | | | 5,088 | | | | 799,528 | |
| | | | | | | | 2,551,628 | |
| | | | | | | | | |
| Packaging & Containers - 3.8% | | | | | | | | |
| Greif, Inc. - Class B | | | 16,808 | | | | 1,096,722 | |
| | | | | | | | | |
| Pharmaceuticals - 13.3% | | | | | | | | |
| AbbVie, Inc. | | | 5,005 | | | | 807,006 | |
| GSK PLC - ADR | | | 24,421 | | | | 1,093,328 | |
| Organon & Co. | | | 42,475 | | | | 905,992 | |
| Pfizer, Inc. | | | 35,162 | | | | 1,007,743 | |
| | | | | | | | 3,814,069 | |
| | | | | | | | | |
| Pipelines - 8.5% | | | | | | | | |
| Enbridge, Inc. | | | 29,964 | | | | 1,096,083 | |
| ONEOK, Inc. | | | 16,458 | | | | 1,333,098 | |
| | | | | | | | 2,429,181 | |
| | | | | | | | | |
| Retail - 4.1% | | | | | | | | |
| MSC Industrial Direct Co., Inc. - Class A | | | 7,442 | | | | 639,268 | |
| Walgreens Boots Alliance, Inc. | | | 33,556 | | | | 544,278 | |
| | | | | | | | 1,183,546 | |
| | | | | | | | | |
| Telecommunications - 7.4% | | | | | | | | |
| AT&T, Inc. | | | 61,131 | | | | 1,113,807 | |
| Cisco Systems, Inc. | | | 21,539 | | | | 1,001,563 | |
| | | | | | | | 2,115,370 | |
| | | | | | | | | |
| Toys, Games & Hobbies - 2.1% | | | | | | | | |
| Hasbro, Inc. | | | 10,164 | | | | 607,604 | |
| TOTAL COMMON STOCKS (Cost $26,850,722) | | | | | | | 28,562,131 | |
| | | | | | | | | |
| SHORT-TERM INVESTMENTS - 0.1% | | | | | | | | |
| Money Market Funds - 0.1% | | | | | | | | |
| First American Government Obligations Fund - Class X, 5.24%(a) | | | 35,282 | | | | 35,282 | |
| TOTAL SHORT-TERM INVESTMENTS (Cost $35,282) | | | | | | | 35,282 | |
| | | | | | | | | |
| TOTAL INVESTMENTS - 99.6% (Cost $26,886,004) | | | | | | $ | 28,597,413 | |
| Other Assets in Excess of Liabilities - 0.4% | | | | | | | 107,119 | |
| TOTAL NET ASSETS - 100.0% | | | | | | $ | 28,704,532 | |
Percentages are stated as a percent of net assets.
ADR - American Depositary Receipt
NV - Naamloze Vennootschap
PLC - Public Limited Company
| (a) | | The rate shown represents the 7-day effective yield as of May 31, 2024. |
The accompanying notes are an integral part of these financial statements.
| Statements of Assets and Liabilities | Sound Income Strategies ETFs |
| May 31, 2024 (Unaudited) |
| | | Sound Enhanced Fixed
Income ETF | | | Sound Equity Dividend
Income ETF | |
| ASSETS: | | | | | | | | |
| Investments, at value | | $ | 43,625,995 | | | $ | 28,597,413 | |
| Dividends and interest receivable | | | 302,276 | | | | 117,874 | |
| Security lending income receivable | | | 3,168 | | | | — | |
| Total assets | | | 43,931,439 | | | | 28,715,287 | |
| | | | | | | | | |
| LIABILITIES: | | | | | | | | |
| Payable upon return of securities loaned | | | 6,731,008 | | | | — | |
| Payable for investments purchased | | | 330,960 | | | | — | |
| Payable to adviser | | | 15,050 | | | | 10,755 | |
| Payable for expense and other liabilities | | | (4,688 | ) | | | — | |
| Total liabilities | | | 7,072,330 | | | | 10,755 | |
| NET ASSETS | | $ | 36,859,109 | | | $ | 28,704,532 | |
| | | | | | | | | |
| NET ASSETS CONSISTS OF: | | | | | | | | |
| Paid-in capital | | $ | 39,012,340 | | | $ | 27,574,924 | |
| Total distributable earnings/(accumulated losses) | | | (2,153,231 | ) | | | 1,129,608 | |
| Total net assets | | $ | 36,859,109 | | | $ | 28,704,532 | |
| | | | | | | | | |
| Net asset value | | $ | 36,859,109 | | | $ | 28,704,532 | |
| Shares issued and outstanding(a) | | | 2,000,000 | | | | 1,100,000 | |
| Net asset value per share | | $ | 18.43 | | | $ | 26.10 | |
| | | | | | | | | |
| COST: | | | | | | | | |
| Investments cost | | $ | 45,332,761 | | | $ | 26,886,004 | |
| | | $ | 6,550,504 | | | $ | — | |
| LOANED SECURITIES: | | $ | 6,550,504 | | | $ | — | |
| at value (included in investments) | | $ | 6,550,504 | | | $ | — | |
| (a) | Unlimited shares authorized without par value. |
The accompanying notes are an integral part of these financial statements.
| Statements of Operations | Sound Income Strategies ETFs |
| For the Six-Months Ended May 31, 2024 (Unaudited) |
| | | Sound Enhanced Fixed
Income ETF | | | Sound Equity Dividend
Income ETF | |
| INVESTMENT INCOME: | | | | | | | | |
| Dividend income | | $ | 913,396 | | | $ | 587,529 | |
| Less: Dividend withholding taxes | | | — | | | | (9,624 | ) |
| Less: Issuance fees | | | — | | | | (786 | ) |
| Interest income | | | 257,950 | | | | 1,833 | |
| Securities lending income | | | 36,088 | | | | — | |
| Total investment income | | | 1,207,434 | | | | 578,952 | |
| | | | | | | | | |
| EXPENSES: | | | | | | | | |
| Investment advisory fee | | | 82,029 | | | | 61,666 | |
| Total expenses | | | 82,029 | | | | 61,666 | |
| NET INVESTMENT INCOME | | | 1,125,405 | | | | 517,286 | |
| | | | | | | | | |
| REALIZED AND UNREALIZED GAIN | | | 1,189,842 | | | | 1,668,718 | |
| Net realized gain/(loss) from: | | | (383,709 | ) | | | 52,628 | |
| Investments | | | (383,709 | ) | | | 52,628 | |
| Net realized gain/(loss) | | | (383,709 | ) | | | 52,628 | |
| Net change in unrealized appreciation on: | | | 1,573,551 | | | | 1,616,090 | |
| Investments | | | 1,573,551 | | | | 1,616,098 | |
| Foreign currency translation | | | — | | | | (8 | ) |
| Net change in unrealized appreciation | | | 1,573,551 | | | | 1,616,090 | |
| Net realized and unrealized gain | | | 1,189,842 | | | | 1,668,718 | |
| NET INCREASE IN NET ASSETS RESULTING FROM OPERATIONS | | $ | 2,315,247 | | | $ | 2,186,004 | |
The accompanying notes are an integral part of these financial statements.
| Statements of Changes in Net Assets | Sound Income Strategies ETFs |
| | Sound Enhanced Fixed Income ETF | | Sound Equity Dividend Income ETF | |
| | | Period ended
May 31, 2024 (Unaudited) | | | Year ended November 30, 2023 | | | Period ended May 31, 2024 (Unaudited) | | | Year ended November 30, 2023 | |
| OPERATIONS: | | | | | | | | | | | | | | | | |
| Net investment income | | $ | 1,125,405 | | | $ | 1,704,741 | | | $ | 517,286 | | | $ | 980,159 | |
| Net realized gain/(loss) | | | (383,709 | ) | | | (307,953 | ) | | | 52,628 | | | | (666,218 | ) |
| Net change in unrealized appreciation/(depreciation) | | | 1,573,551 | | | | 480,306 | | | | 1,616,090 | | | | (1,391,229 | ) |
| Net increase/(decrease) in net assets from operations | | | 2,315,247 | | | | 1,877,094 | | | | 2,186,004 | | | | (1,077,288 | ) |
| | | | | | | | | | | | | | | | | |
| DISTRIBUTIONS TO SHAREHOLDERS: | | | | | | | | | | | | | | | | |
| Distributions to shareholders | | | (1,020,000 | ) | | | (1,542,704 | ) | | | (590,140 | ) | | | (1,199,151 | ) |
| Total distributions to shareholders | | | (1,020,000 | ) | | | (1,542,704 | ) | | | (590,140 | ) | | | (1,199,151 | ) |
| | | | | | | | | | | | | | | | | |
| CAPITAL TRANSACTIONS: | | | | | | | | | | | | | | | | |
| Subscriptions | | | 5,492,098 | | | | 6,565,897 | | | | 2,570,673 | | | | 5,195,922 | |
| Redemptions | | | — | | | | — | | | | (1,303,575 | ) | | | — | |
| ETF transaction fees (See Note 9) | | | 1,376 | | | | 218 | | | | — | | | | — | |
| Net increase in net assets from capital transactions | | | 5,493,474 | | | | 6,566,115 | | | | 1,267,098 | | | | 5,195,922 | |
| | | | | | | | | | | | | | | | | |
| NET INCREASE IN NET ASSETS | | | 6,788,721 | | | | 6,900,505 | | | | 2,862,962 | | | | 2,919,483 | |
| | | | | | | | | | | | | | | | | |
| NET ASSETS: | | | | | | | | | | | | | | | | |
| Beginning of the period | | | 30,070,388 | | | | 23,169,883 | | | | 25,841,570 | | | | 22,922,087 | |
| End of the period | | $ | 36,859,109 | | | $ | 30,070,388 | | | $ | 28,704,532 | | | $ | 25,841,570 | |
| | | | | | | | | | | | | | | | | |
| SHARES TRANSACTIONS | | | | | | | | | | | | | | | | |
| Subscriptions | | | 300,000 | | | | 375,000 | | | | 100,000 | | | | 200,000 | |
| Redemptions | | | — | | | | — | | | | (50,000 | ) | | | — | |
| Total increase in shares outstanding | | | 300,000 | | | | 375,000 | | | | 50,000 | | | | 200,000 | |
The accompanying notes are an integral part of these financial statements.
| Financial Highlights | Sound Enhanced Fixed Income ETF |
| For a share outstanding throughout the periods presented |
| | | Period ended May 31, 2024 (Unaudited) | | | Year Ended November 30, 2023 | | | Year Ended November 30, 2022 | | | Period ended November 30, 2021(a) | |
| PER SHARE DATA: | | | | | | | | | | | | |
| Net asset value, beginning of year | | $ | 17.69 | | | $ | 17.49 | | | $ | 20.53 | | | $ | 20.00 | |
| | | | | | | | | | | | | | | | | |
| INVESTMENTS OPERATIONS: | | | | | | | | | | | | | | | | |
| Net investment income(b)(c) | | | 0.62 | | | | 1.11 | | | | 0.98 | | | | 0.85 | |
| Net realized and unrealized gain (loss) on investments | | | 0.68 | | | | 0.10 | | | | (3.02 | ) | | | 0.53 | |
| Total from investment operations | | | 1.30 | | | | 1.21 | | | | (2.04 | ) | | | 1.38 | |
| | | | | | | | | | | | | | | | | |
| LESS DISTRIBUTIONS FROM: | | | | | | | | | | | | | | | | |
| From net investment income | | | (0.56 | ) | | | (1.01 | ) | | | (0.99 | ) | | | (0.80 | ) |
| Return of capital | | | — | | | | — | | | | (0.01 | ) | | | (0.05 | ) |
| Total distributions | | | (0.56 | ) | | | (1.01 | ) | | | (1.00 | ) | | | (0.85 | ) |
| | | | | | | | | | | | | | | | | |
| ETF transaction fees per share | | | 0.00 | (d) | | | 0.00 | (d) | | | 0.00 | (d) | | | 0.00 | (d) |
| Net asset value, end of year | | $ | 18.43 | | | $ | 17.69 | | | $ | 17.49 | | | $ | 20.53 | |
| | | | | | | | | | | | | | | | | |
| TOTAL RETURN(e) | | | 7.43 | % | | | 7.21 | % | | | -10.10 | % | | | 6.94 | % |
| | | | | | | | | | | | | | | | | |
| SUPPLEMENTAL DATA AND RATIOS: | | | | | | | | | | | | | | | | |
| Net assets, end of year (in thousands) | | $ | 36,859 | | | $ | 30,070 | | | $ | 23,170 | | | $ | 13,347 | |
| Ratio of expenses to average net assets(f)(g) | | | 0.49 | % | | | 0.49 | % | | | 0.49 | % | | | 0.49 | % |
| Ratio of net investment income to average net assets(f)(g) | | | 6.72 | % | | | 6.40 | % | | | 5.35 | % | | | 4.46 | % |
| Portfolio turnover rates(e)(h) | | | 4 | % | | | 1 | % | | | 6 | % | | | 6 | % |
| (a) | Inception date of the Fund was December 30, 2020. The information presented is from December 30, 2020 to November 30, 2021. |
| (b) | Net investment income per share has been calculated based on average shares outstanding during the period. |
| (c) | Recognition of net investment income by the Fund is affected by the timing of the declaration of dividends by the underlying exchange traded funds in which the Fund invests. The ratio does not include net investment income of the exchange traded funds in which the Fund invests. |
| (d) | Amount represents less than $0.005 per share. |
| (e) | Not annualized for periods less than one year. |
| (f) | Annualized for periods less than one year. |
| (g) | These ratios exclude the impact of expenses of the underlying exchange traded funds as represented in the Schedule of Investments. Recognition of net investment income by the Fund is affected by the timing of the underlying exchange traded funds in which the Fund invests. |
| (h) | Portfolio turnover rate exclude in-kind transactions. |
The accompanying notes are an integral part of these financial statements.
| Financial Highlights (Continued) | Sound Equity Dividend Income ETF |
| For a share outstanding throughout the periods presented |
| | | Period ended May 31, 2024 (Unaudited) | | | Year Ended November 30, 2023 | | | Year Ended November 30, 2022 | | | Period ended November 30, 2021(a) | |
| PER SHARE DATA: | | | | | | | | | | | | | | | | |
| Net asset value, beginning of year | | $ | 24.61 | | | $ | 26.97 | | | $ | 24.30 | | | $ | 20.00 | |
| | | | | | | | | | | | | | | | | |
| INVESTMENTS OPERATIONS: | | | | | | | | | | | | | | | | |
| Net investment income(b) | | | 0.49 | | | | 1.00 | | | | 1.01 | | | | 0.86 | |
| Net realized and unrealized gain (loss) on investments | | | 1.56 | | | | (2.10 | ) | | | 2.55 | | | | 4.15 | |
| Total from investment operations | | | 2.05 | | | | (1.10 | ) | | | 3.56 | | | | 5.01 | |
| | | | | | | | | | | | | | | | | |
| LESS DISTRIBUTIONS FROM: | | | | | | | | | | | | | | | | |
| From net investment income | | | (0.56 | ) | | | (1.12 | ) | | | (0.89 | ) | | | (0.71 | ) |
| From net realized gains | | | — | | | | (0.14 | ) | | | — | | | | — | |
| Total distributions | | | (0.56 | ) | | | (1.26 | ) | | | (0.89 | ) | | | (0.71 | ) |
| | | | | | | | | | | | | | | | | |
| Net asset value, end of year | | $ | 26.10 | | | $ | 24.61 | | | $ | 26.97 | | | $ | 24.30 | |
| | | | | | | | | | | | | | | | | |
| TOTAL RETURN(c) | | | 8.33 | % | | | -4.13 | % | | | 14.88 | % | | | 25.05 | % |
| | | | | | | | | | | | | | | | | |
| SUPPLEMENTAL DATA AND RATIOS: | | | | | | | | | | | | | | | | |
| Net assets, end of year (in thousands) | | $ | 28,705 | | | $ | 25,842 | | | $ | 22,922 | | | $ | 12,150 | |
| Ratio of expenses to average net assets(d) | | | 0.45 | % | | | 0.45 | % | | | 0.45 | % | | | 0.45 | % |
| Ratio of net investment income to average net assets(d) | | | 3.77 | % | | | 3.93 | % | | | 3.94 | % | | | 3.78 | % |
| Portfolio turnover rate(c)(e) | | | 8 | % | | | 17 | % | | | 20 | % | | | 16 | % |
| (a) | Inception date of the Fund was December 30, 2020. The information presented is from December 30, 2020 to November 30, 2021. |
| (b) | Net investment income per share has been calculated based on average shares outstanding during the period. |
| (c) | Not annualized for periods less than one year. |
| (d) | Annualized for periods less than one year. |
| (e) | Portfolio turnover rate exclude in-kind transactions. |
The accompanying notes are an integral part of these financial statements.
| Notes to the Financial Statements | Sound Income Strategies ETFs |
| May 31, 2024 (Unaudited) |
The Sound Enhanced Fixed Income ETF and Sound Equity Dividend Income ETF (each, a “Fund,” and collectively, the “Funds”) are diversified series of shares of beneficial interest of Tidal ETF Trust (the “Trust”). Each Fund commenced operations as a non-diversified Fund, however each Fund continuously operated as diversified for three years and effective December 30, 2023 is now classified as diversified. The Trust was organized as a Delaware statutory trust on June 4, 2018 and is registered with the Securities and Exchange Commission (the “SEC”) under the Investment Company Act of 1940, as amended (the “1940 Act”), as an open-end management investment company and the offering of each Fund’s shares is registered under the Securities Act of 1933, as amended. The Trust is governed by the Board of Trustees (the “Board”). Tidal Investments LLC (f/k/a Toroso Investments, LLC) (“Tidal Investments” or the “Adviser”), a Tidal Financial Group company, serves as investment adviser to the Funds and Sound Income Strategies, LLC (the “Sub-Adviser”) serves as sub-adviser to the Funds. Each Fund is an investment company and accordingly follows the investment company accounting and reporting guidance of the Financial Accounting Standards Board (“FASB”) Accounting Standard Codification Topic 946 “Financial Services—Investment Companies.” The Funds commenced operations on December 30, 2020.
The investment objective of the Sound Enhanced Fixed Income ETF is to seek current income while providing the opportunity for capital appreciation. The primary investment objective of the Sound Equity Dividend Income ETF is to generate current income via a dividend yield that is a least two times that of the S&P 500® Index. The Sound Equity Dividend Income ETF also seeks to capture long-term capital appreciation as a secondary objective.
| NOTE 2 – SIGNIFICANT ACCOUNTING POLICIES |
The following is a summary of significant accounting policies consistently followed by the Funds. These policies are in conformity with accounting principles generally accepted in the United States of America (“U.S. GAAP”).
| A. | Security Valuation. Equity securities, which may include Real Estate Investment Trusts (“REITs”), Business Development Companies (“BDCs”), and Master Limited Partnerships (“MLPs”), listed on a securities exchange, market or automated quotation system for which quotations are readily available (except for securities traded on the NASDAQ Stock Market, LLC (“NASDAQ”)), including securities traded over the counter, are valued at the last quoted sale price on the primary exchange or market (foreign or domestic) on which they are traded on the valuation date (or at approximately 4:00 p.m. EST if a security’s primary exchange is normally open at that time), or, if there is no such reported sale on the valuation date, at the most recent quoted bid price or mean between the most recent quoted bid and ask prices for long and short positions. For a security that trades on multiple exchanges, the primary exchange will generally be considered the exchange on which the security is generally most actively traded. For securities traded on NASDAQ, the NASDAQ Official Closing Price will be used. Prices of securities traded on the securities exchange will be obtained from recognized independent pricing agents (“Independent Pricing Agents”) each day that the Funds are open for business. |
Debt securities are valued by using an evaluated mean of the bid and asked prices provided by Independent Pricing Agents. The Independent Pricing Agents may employ methodologies that utilize actual market transactions (if the security is actively traded), broker dealer supplied valuations, or other methodologies designed to identify the market value for such securities. In arriving at valuations, such methodologies generally consider factors such as security prices, yields, maturities, call features, ratings and developments relating to specific securities.
Units of Mount Vernon Liquid Assets Portfolio, LLC are not traded on an exchange and are measured at fair value using the investment company’s net asset value per share (or its equivalent) practical expedient as provided by the underlying fund’s administrator.
Under Rule 2a-5 of the 1940 Act, a fair value is determine by the Valuation Designee (as defined in Rule 2a-5) in accordance with the Pricing and Valuation Policy and Fair Value Procedures, as applicable, of the Adviser, subject to oversight by the Board. When a security is “fair valued,” consideration is given to the facts and circumstances relevant to the particular situation, including a review of various factors set forth in the Adviser’s Pricing and Valuation Policy and Fair Value Procedures, as applicable. Fair value pricing is an inherently subjective process, and no single standard exists for determining fair value. Different funds could reasonably arrive at different values for the same security. The use of fair value pricing by a fund may cause the net asset value (“NAV”) of its shares to differ significantly from the NAV that would be calculated without regard to such considerations.
| NOTE 2 – SIGNIFICANT ACCOUNTING POLICIES (CONTINUED) |
As described above, the Funds utilize various methods to measure the fair value of their investments on a recurring basis. U.S. GAAP establishes a hierarchy that prioritizes inputs to valuation methods. The three levels of inputs are:
| | Level 1 – | Unadjusted quoted prices in active markets for identical assets or liabilities that the Funds have the ability to access. |
| | | |
|---|
| | Level 2 – | Observable inputs other than quoted prices included in Level 1 that are observable for the asset or liability, either directly or indirectly. These inputs may include quoted prices for the identical instrument on an inactive market, prices for similar instruments, interest rates, prepayment speeds, credit risk, yield curves, default rates and similar data. |
| | | |
|---|
| | Level 3 – | Unobservable inputs for the asset or liability, to the extent relevant observable inputs are not available; representing a Fund’s own assumptions about the assumptions a market participant would use in valuing the asset or liability and would be based on the best information available. |
The availability of observable inputs can vary from security to security and is affected by a wide variety of factors, including, for example, the type of security, whether the security is new and not yet established in the marketplace, the liquidity of markets, and other characteristics particular to the security. To the extent that valuation is based on models or inputs that are less observable or unobservable in the market, the determination of fair value requires more judgment. Accordingly, the degree of judgment exercised in determining fair value is greatest for instruments categorized in Level 3.
The inputs used to measure fair value may fall into different levels of the fair value hierarchy. In such cases, for disclosure purposes, the level in the fair value hierarchy within which the fair value measurement falls in its entirety, is determined based on the lowest level input that is significant to the fair value measurement in its entirety.
The following is a summary of the inputs used to value each Fund’s investments as of May 31, 2024:
| | | Sound Enhanced Fixed Income ETF | |
| Investments in Securities | | Level 1 | | | Level 2 | | | Level 3 | | | Total | |
| Preferred Stocks(a) | | $ | 10,823,488 | | | $ | — | | | $ | — | | | $ | 10,823,488 | |
| Corporate Bonds(a) | | | — | | | | 9,947,035 | | | | — | | | | 9,947,035 | |
| Common Stocks(a) | | | 6,846,908 | | | | — | | | | — | | | | 6,846,908 | |
| Exchange Traded Funds | | | 4,627,552 | | | | — | | | | — | | | | 4,627,552 | |
| Real Estate Investment Trusts | | | 3,632,314 | | | | — | | | | — | | | | 3,632,314 | |
| Investments Purchased with Proceeds from Securities Lending(b) | | | — | | | | — | | | | — | | | | 6,731,008 | |
| Money Market Funds | | | 1,017,690 | | | | — | | | | — | | | | 1,017,690 | |
| Total Investments in Securities | | $ | 26,947,952 | | | $ | 9,947,035 | | | $ | — | | | $ | 43,625,995 | |
| | | Sound Equity Dividend Income ETF | |
| Investments in Securities | | Level 1 | | | Level 2 | | | Level 3 | | | Total | |
| Common Stocks(a) | | $ | 28,562,131 | | | $ | — | | | $ | — | | | $ | 28,562,131 | |
| Money Market Funds | | | 35,282 | | | | — | | | | — | | | | 35,282 | |
| Total Investments in Securities | | $ | 28,597,413 | | | $ | — | | | $ | — | | | $ | 28,597,413 | |
| (a) | See Schedule of Investments for the industry breakout |
| (b) | Certain investments that are measured at fair value using the net asset value per share (or its equivalent) practical expedient have not been categorized in the fair value hierarchy. The fair value amounts presented in the table are intended to permit reconciliation of the fair value hierarchy to the amounts presented in the Schedule of Investments. |
| B. | Federal Income Taxes. Each Fund has elected to be taxed as a “regulated investment company” and intends to distribute substantially all taxable income to its shareholders and otherwise comply with the provisions of the Internal Revenue Code applicable to regulated investment companies. Therefore, no provision for federal income taxes or excise taxes has been made. |
In order to avoid imposition of the excise tax applicable to regulated investment companies, the Funds intend to declare as dividends in each calendar year at least 98.0% of their net investment income (earned during the calendar year) and at least 98.2% of their net realized capital gains (earned during the twelve months ended November 30) plus undistributed amounts, if any, from prior years. As a registered investment company, the Funds are subject to a 4% excise tax that is imposed if the Funds do not distribute by the end of any calendar year at least the sum of (i) 98% of its ordinary income (not taking into account any capital gain or loss) for the calendar year and (ii) 98.2% of its capital gain in excess of its capital loss (adjusted for certain ordinary losses) for a one year period generally ending on October 31 of the calendar year (unless an election is made to use the fund’s fiscal year). The Funds generally intend to distribute income and capital gains in the manner necessary to minimize (but not necessarily eliminate) the imposition of such excise tax. The Funds may retain income or capital gains and pay excise tax when it is determined that doing so is in the best interest of shareholders. Management, in consultation with the Board of Trustees, evaluates the costs of the excise tax relative to the benefits of retaining income and capital gains, including that such undistributed amounts (net of the excise tax paid) remain available for investment by the Funds and are available to supplement future distributions. Tax expense is disclosed in the Statements of Operations, if applicable.
| NOTE 2 – SIGNIFICANT ACCOUNTING POLICIES (CONTINUED) |
As of May 31, 2024, the Funds did not have any tax positions that did not meet the threshold of being sustained by the applicable tax authority. Generally, tax authorities can examine all the tax returns filed for the last three years. The Funds identify their major tax jurisdiction as U.S. Federal and the Commonwealth of Delaware; however, the Funds are not aware of any tax positions for which it is reasonably possible that the total amounts of unrecognized tax benefits will change materially.
| C. | Securities Transactions and Investment Income. Investment securities transactions are accounted for on the trade date. Gains and losses realized on sales of securities are determined on a specific identification basis. Discounts/premiums on debt securities purchased are accreted/amortized over the life of the respective securities using the effective interest method. Dividend income is recorded on the ex-dividend date. Dividends received from REITs generally are comprised of ordinary income, capital gains, and may include return of capital. Debt income is recorded on an accrual basis. Other non-cash dividends are recognized as investment income at the fair value of the property received. Withholding taxes on foreign dividends have been provided for in accordance with the Fund’s understanding of the applicable country’s tax rules and rates. |
| D. | Distributions to Shareholders. Distributions to shareholders from net investment income, if any, for the Funds are declared and paid at least monthly. Distributions to shareholders from net realized gains on securities, if any, for the Funds normally are declared and paid on an annual basis. Distributions are recorded on the ex-dividend date. |
| E. | Use of Estimates. The preparation of financial statements in conformity with U.S. GAAP requires management to make estimates and assumptions that affect the reported amounts of assets and liabilities and disclosure of contingent assets and liabilities at the date of the financial statements and the reported amount of increases and decreases in net assets from operations during the reporting period. Actual results could differ from those estimates. |
| F. | Share Valuation. The NAV per share of each Fund is calculated by dividing the sum of the value of the securities held by the Fund, plus cash or other assets, minus all liabilities by the total number of shares outstanding for the Fund, rounded to the nearest cent. The Funds’ shares will not be priced on the days on which the New York Stock Exchange (“NYSE”) is closed for trading. |
| G. | Guarantees and Indemnifications. In the normal course of business, the Funds enter into contracts with service providers that contain general indemnification clauses. The Funds’ maximum exposure under these arrangements is unknown as this would involve future claims that may be made against the Funds that have not yet occurred. However, based on experience, the Funds expect the risk of loss to be remote. |
| H. | Illiquid Securities. Pursuant to Rule 22e-4 under the 1940 Act, the Funds have adopted a Board-approved Liquidity Risk Management Program (the “Program”) that requires, among other things, that each Fund limit its illiquid investments that are assets to no more than 15% of the value of the Fund’s net assets. An illiquid investment is any security that a fund reasonably expects cannot be sold or disposed of in current market conditions in seven calendar days or less without the sale or disposition significantly changing the market value of the investment. If a Fund should be in a position where the value of illiquid investments held by the Fund exceeds 15% of the Fund’s net assets, the Fund will take such steps as set forth in the Program. |
| I. | Recently Issued Accounting Pronouncements. In June 2022, the FASB issued Accounting Standards Update 2022-03, which amends Fair Value Measurement (Topic 820): Fair Value Measurement of Equity Securities Subject to Contractual Sale Restrictions (“ASU 2022-03”). ASU 2022-03 clarifies guidance for fair value measurement of an equity security subject to a contractual sale restriction and establishes new disclosure requirements for such equity securities. ASU 2022-03 is effective for fiscal years beginning after December 15, 2023 and for interim periods within those fiscal years, with early adoption permitted. The Funds are currently evaluating the impact, if any, of these amendments on the financial statements. |
| NOTE 3 – PRINCIPAL INVESTMENT RISKS |
| A. | BDC Risk (Sound Enhanced Fixed Income ETF Only). BDCs generally invest in debt securities that are not rated by a credit rating agency and are considered below investment grade quality (“junk bonds”). Little public information generally exists for the type of companies in which a BDC may invest and, therefore, there is a risk that the Fund may not be able to make a fully informed evaluation of the BDC and its portfolio of investments. In addition, investments made by BDCs are typically illiquid and are difficult to value for purposes of determining a BDC’s NAV. |
| NOTE 3 – PRINCIPAL INVESTMENT RISKS (CONTINUED) |
| B. | Credit Risk (Sound Enhanced Fixed Income ETF Only). Debt securities are subject to the risk of an issuer’s (or other party’s) failure or inability to meet its obligations under the security. Multiple parties may have obligations under a debt security. An issuer or borrower may fail to pay principal and interest when due. A guarantor, insurer or credit support provider may fail to provide the agreed upon protection. A counterparty to a transaction may fail to perform its side of the bargain. An intermediary or agent interposed between the investor and other parties may fail to perform the terms of its service. Also, performance under a debt security may be linked to the obligations of other persons who may fail to meet their obligations. The credit risk associated with a debt security could increase to the extent that the Fund’s ability to benefit fully from its investment in the security depends on the performance by multiple parties of their respective contractual or other obligations. The market value of a debt security is also affected by the market’s perception of the creditworthiness of the issuer. |
| C. | Depositary Receipt Risk (Sound Equity Dividend Income ETF Only). Depositary receipts involve risks similar to those associated with investments in foreign securities and give rise to certain additional risks. Depositary receipts listed on U.S. or foreign exchanges are issued by banks or trust companies and entitle the holder to all dividends and capital gains that are paid out on the underlying foreign shares (“Underlying Shares”). When the Fund invests in depositary receipts as a substitute for an investment directly in the Underlying Shares, the Fund is exposed to the risk that the depositary receipts may not provide a return that corresponds precisely with that of the Underlying Shares. |
| D. | Equity Markets Risk. The equity securities held in the Funds’ portfolio may experience sudden, unpredictable drops in value or long periods of decline in value. This may occur because of factors that affect securities markets generally or factors affecting specific issuers, industries, or sectors in which the Funds invest. Common stocks are generally exposed to greater risk than other types of securities, such as preferred stock and debt obligations, because common stockholders generally have inferior rights to receive payment from specific issuers. |
| E. | Exchange-Traded Fund (“ETF”) Risks. |
| • | Authorized Participants, Market Makers, and Liquidity Providers Concentration Risk. The Funds have a limited number of financial institutions that are authorized to purchase and redeem shares of the Funds (“Shares”) directly from the Funds (known as “Authorized Participants” or “APs”). In addition, there may be a limited number of market makers and/or liquidity providers in the marketplace. To the extent either of the following events occur, Shares may trade at a material discount to NAV and possibly face delisting: (i) APs exit the business or otherwise become unable to process creation and/or redemption orders and no other APs step forward to perform these services; or (ii) market makers and/or liquidity providers exit the business or significantly reduce their business activities and no other entities step forward to perform their functions. |
| • | Cash Redemption Risk (Sound Enhanced Fixed Income ETF Only). The Fund’s investment strategy may require it to redeem shares for cash or to otherwise include cash as part of its redemption proceeds. For example, the Fund may not be able to redeem in-kind certain securities held by the Fund (e.g., derivative instruments and bonds that cannot be broken up beyond certain minimum sizes needed for transfer and settlement). In such a case, the Fund may be required to sell or unwind portfolio investments to obtain the cash needed to distribute redemption proceeds. This may cause the Fund to recognize a capital gain that it might not have recognized if it had made a redemption in-kind. As a result, the Fund may pay out higher annual capital gain distributions than if the in-kind redemption process was used. |
| • | Costs of Buying or Selling Shares. Due to the costs of buying or selling shares, including brokerage commissions imposed by brokers and bid-ask spreads, frequent trading of shares may significantly reduce investment results and an investment in shares may not be advisable for investors who anticipate regularly making small investments. |
| • | Shares May Trade at Prices Other Than NAV. As with all ETFs, Shares may be bought and sold in the secondary market at market prices. Although it is expected that the market price of shares will approximate each Fund’s NAV, there may be times when the market price of shares is more than the NAV intra-day (premium) or less than the NAV intra-day (discount) due to supply and demand of shares or during periods of market volatility. This risk is heightened in times of market volatility, periods of steep market declines, and periods when there is limited trading activity for shares in the secondary market, in which case such premiums or discounts may be significant. Because securities held by each Funds may trade on foreign exchanges that are closed when the Funds’ primary listing exchange is open, the Funds are likely to experience premiums and discounts greater than those of ETFs holding only domestic securities. |
| NOTE 3 – PRINCIPAL INVESTMENT RISKS (CONTINUED) |
| • | Trading. Although shares are listed on a national securities exchange, such as NYSE Arca, Inc. (the “Exchange”), and may be traded on U.S. exchanges other than the Exchange, there can be no assurance that shares will trade with any volume, or at all, on any stock exchange. In stressed market conditions, the liquidity of shares may begin to mirror the liquidity of each Fund’s underlying portfolio holdings, which can be significantly less liquid than shares. Also, in stressed market conditions, the market for Shares may become less liquid in response to deteriorating liquidity in the markets for the Fund’s underlying portfolio holdings. These adverse effects on liquidity for Shares, in turn, could lead to wider bid/ask spreads and differences between the market price of Shares and the underlying value of those Shares. |
| F. | Financial Services Sector Risk (Sound Enhanced Fixed Income ETF Only). The Fund has emphasized its investments in the financial services sector. Companies in the financial services sector are often subject to risks tied to the global financial markets, which have experienced very difficult conditions and volatility as well as significant adverse trends. Companies in the financial services sector may also be negatively impacted by disruptions in the banking industry. The conditions in these markets have resulted in a decrease in availability of corporate credit, capital and liquidity and have led indirectly to the insolvency, closure or acquisition of a number of financial institutions. |
| G. | Fixed Income Risk (Sound Enhanced Fixed Income ETF Only). The prices of fixed income securities respond to economic developments, particularly interest rate changes, as well as to changes in an issuer’s credit rating or market perceptions about the creditworthiness of an issuer. In general, the market price of fixed income securities with longer maturities will increase or decrease more in response to changes in interest rates than shorter-term securities. Changes in government intervention may have adverse effects on investments, volatility, and illiquidity in debt markets. These changes could cause the Fund’s net asset value to fluctuate or make it more difficult for the Fund to accurately value its securities. How specific fixed income securities may react to changes in interest rates will depend on the specific characteristics of each security. |
| H. | Foreign Securities Risk. Investments in securities or other instruments of non-U.S. issuers involve certain risks not involved in domestic investments and may experience more rapid and extreme changes in value than investments in securities of U.S. companies. Financial markets in foreign countries often are not as developed, efficient, or liquid as financial markets in the United States, and therefore, the prices of non-U.S. securities and instruments can be more volatile. In addition, the Fund will be subject to risks associated with adverse political and economic developments in foreign countries, which may include the imposition of economic sanctions. Generally, there is less readily available and reliable information about non-U.S. issuers due to less rigorous disclosure or accounting standards and regulatory practices. |
| I. | General Market Risk. Securities markets and individual securities may increase or decrease in value. Security prices may fluctuate widely over short or extended periods in response to market or economic news and conditions, and securities markets also tend to move in cycles. If there is a general decline in the securities markets, it is possible your investment may lose value regardless of the individual results of the companies in which the Fund invests. The magnitude of up and down price or market fluctuations over time is sometimes referred to as “volatility”, and it can be significant. In addition, different asset classes and geographic markets may experience periods of significant correlation with each other. As a result of this correlation, the securities and markets in which the Fund invests may experience volatility due to market, economic, political or social events and conditions that may not readily appear to directly relate to such securities, the securities’ issuer or the markets in which they trade. |
| J. | High Yield Securities Risk (Sound Enhanced Fixed Income ETF Only). Securities rated below investment grade are often referred to as high yield securities or “junk bonds.” Investments in lower rated corporate debt securities typically entail greater price volatility and principal and income risk. High yield securities may be more susceptible to real or perceived adverse economic and competitive industry conditions than investment grade securities. The prices of high yield securities have been found to be more sensitive to adverse economic downturns or individual corporate developments. A projection of an economic downturn or of a period of rising interest rates, for example, could cause a decline in high yield security prices because the advent of a recession could lessen the ability of a highly leveraged company to make principal and interest payments on its debt securities. If an issuer of high yield securities defaults, in addition to risking payment of all or a portion of interest and principal, the Fund by investing in such securities may incur additional expenses to obtain recovery. |
| K. | Illiquid Investments Risk (Sound Enhanced Fixed Income ETF Only). The Fund may, at times, hold illiquid securities, by virtue of the absence of a readily available market for certain of its investments, or because of legal or contractual restrictions on sales. The Fund could lose money if it is unable to dispose of an investment at a time or price that is most beneficial to the Fund. |
| L. | Interest Rate Risk (Sound Enhanced Fixed Income ETF Only). Generally, the value of fixed income securities will change inversely with changes in interest rates. As interest rates rise, the market value of fixed income securities tends to decrease. Conversely, as interest rates fall, the market value of fixed income securities tends to increase. This risk will be greater for long-term securities than for short-term securities. Changes in government intervention may have adverse effects on investments, volatility, and illiquidity in debt markets. |
| NOTE 3 – PRINCIPAL INVESTMENT RISKS (CONTINUED) |
| M. | Management Risk. The Funds are actively-managed and may not meet their investment objectives based on the Sub-Adviser’s success or failure to implement investment strategies for the Funds. |
| N. | Market Capitalization Risk. |
| • | Large-Capitalization Investing. The securities of large-capitalization companies may be relatively mature compared to smaller companies and therefore subject to slower growth during times of economic expansion. Large-capitalization companies may also be unable to respond quickly to new competitive challenges, such as changes in technology and consumer tastes. |
| • | Mid-Capitalization Investing. The securities of mid-capitalization companies may be more vulnerable to adverse issuer, market, political, or economic developments than securities of large-capitalization companies. The securities of mid-capitalization companies generally trade in lower volumes and are subject to greater and more unpredictable price changes than large capitalization stocks or the stock market as a whole. |
| • | Small-Capitalization Investing (Sound Enhanced Fixed Income ETF Only). The securities of small-capitalization companies may be more vulnerable to adverse issuer, market, political, or economic developments than securities of large- or mid-capitalization companies. The securities of small-capitalization companies generally trade in lower volumes and are subject to greater and more unpredictable price changes than large- or mid-capitalization stocks or the stock market as a whole. There is typically less publicly available information concerning smaller-capitalization companies than for larger, more established companies. |
| O. | Other Investment Companies Risk. The Funds will incur higher and duplicative expenses when they invest in ETFs and other investment companies. By investing in another investment company, the Funds become shareholders of that investment company and bear their proportionate share of the fees and expenses of the other investment company. There is also the risk that the Funds may suffer losses due to the investment practices of the underlying funds as the Fund will be subject to substantially the same risks as those associated with the direct ownership of securities held by such investment companies. ETFs may be less liquid than other investments, and thus their share values more volatile than the values of the investments they hold. Investments in ETFs are also subject to the “ETF Risks” described above. |
| P. | Preferred Stocks Risk (Sound Enhanced Fixed Income ETF Only). Preferred stocks are subject to the risks of equity securities generally and also risks associated with fixed-income securities, such as interest rate risk. A company’s preferred stock, which may pay fixed or variable rates of return, generally pays dividends only after the company makes required payments to creditors, including vendors, depositors, counterparties, holders of its bonds and other fixed-income securities. As a result, the value of a company’s preferred stock will react more strongly than bonds and other debt to actual or perceived changes in the company’s financial condition or prospects. Preferred stock may be less liquid than many other types of securities, such as common stock, and generally has limited or no voting rights. In addition, preferred stock is subject to the risks that a company may defer or not pay dividends, and, in certain situations, may call or redeem its preferred stock or convert it to common stock. To the extent that the Fund invests a substantial portion of its assets in convertible preferred stocks, declining common stock values may also cause the value of the Fund’s investments to decline. |
| Q. | REIT Risk (Sound Enhanced Fixed Income ETF Only). A REIT is a company that owns or finances income-producing real estate. Through its investments in REITs, the Fund is subject to the risks of investing in the real estate market, including decreases in property revenues, increases in interest rates, increases in property taxes and operating expenses, legal and regulatory changes, a lack of credit or capital, defaults by borrowers or tenants, environmental problems and natural disasters. |
REITs are subject to additional risks, including those related to adverse governmental actions; declines in property value and the real estate market; the potential failure to qualify for tax-free pass through of income; and exemption from registration as an investment company. REITs are dependent upon specialized management skills and may invest in relatively few properties, a small geographic area, or a small number of property types. As a result, investments in REITs may be volatile. To the extent the Fund invests in REITs concentrated in specific geographic areas or property types, the Fund may be subject to a greater loss as a result of adverse developments affecting such area or property types. REITs are pooled investment vehicles with their own fees and expenses and the Fund will indirectly bear a proportionate share of those fees and expenses.
| R. | Sovereign Debt Risk (Sound Enhanced Fixed Income ETF Only). The Fund may invest in securities issued or guaranteed by foreign governmental entities (known as sovereign debt securities). These investments are subject to the risk of payment delays or defaults, due, for example, to cash flow problems, insufficient foreign currency reserves, political considerations, large debt positions relative to the country’s economy, or failure to implement economic reforms. There is no legal or bankruptcy process for collecting sovereign debt. |
| NOTE 3 – PRINCIPAL INVESTMENT RISKS (CONTINUED) |
| S. | U.S. Government Obligations Risk (Sound Enhanced Fixed Income ETF Only). Obligations of U.S. government agencies and authorities receive varying levels of support and may not be backed by the full faith and credit of the U.S. government, which could affect the Fund’s ability to recover should they default. No assurance can be given that the U.S. government will provide financial support to its agencies and authorities if it is not obligated by law to do so. Additionally, market prices and yields of securities supported by the full faith and credit of the U.S. government or other countries may decline or be negative for short or long periods of time. |
| T. | Value Investing Risk (Sound Equity Dividend Income ETF Only). The value approach to investing involves the risk that stocks may remain undervalued. Value stocks may underperform the overall equity market if they remain out of favour in the market or are not undervalued in the market. |
| NOTE 4 – COMMITMENTS AND OTHER RELATED PARTY TRANSACTIONS |
The Adviser serves as investment adviser to the Funds pursuant to an investment advisory agreement between the Adviser and the Trust, on behalf of the Funds (the “Advisory Agreement”), and, pursuant to the Advisory Agreement, provides investment advice to the Funds and oversees the day-to-day operations of the Funds, subject to the direction and oversight of the Board. The Adviser provides oversight of the Sub-Adviser, the investment sub-adviser to the Funds, and review of the Sub-Adviser’s performance. The Adviser is also responsible for trading portfolio securities for the Funds, including selecting broker-dealers to execute purchase and sale transactions subject to the supervision of the Board.
Pursuant to the Advisory Agreement, each Fund pays the Adviser a unitary management fee (the “Management Fee”) based on the average daily net assets of the Fund as follows:
| | | |
| Fund | | Management Fee |
| Sound Enhanced Fixed Income ETF | | 0.49% |
| Sound Equity Dividend Income ETF | | 0.45% |
Out of the Management Fee, the Adviser is obligated to pay or arrange for the payment of substantially all expenses of the Funds, including the cost of transfer agency, custody, fund administration, and all other related services necessary for the Funds to operate. Under the Advisory Agreement, the Adviser has agreed to pay all expenses incurred by each Fund except for interest charges on any borrowings, dividends and other expenses on securities sold short, taxes, brokerage commissions and other expenses incurred in placing orders for the purchase and sale of securities and other investment instruments, acquired fund fees and expenses, accrued deferred tax liability, extraordinary expenses, and distribution fees and expenses paid by the Funds under any distribution plan adopted pursuant to Rule 12b-1 under the 1940 Act (collectively, “Excluded Expenses”), and the Management Fees payable to the Adviser. To the extent a Fund incurs Excluded Expenses, the Fund’s Total Annual Fund Operating Expenses will be greater than the Management Fee. The Management Fees incurred are paid monthly to the Adviser. Management Fees for the six-months ended May 31, 2024 are disclosed in the Statements of Operations.
The Sub-Adviser serves as sub-adviser to the Funds, pursuant to a sub-advisory agreement between the Adviser and the Sub-Adviser with respect to the Funds (the “Sub-Advisory Agreement”). Pursuant to the Sub-Advisory Agreement, the Sub-Adviser is responsible for the day-to-day management of the Funds’ portfolio, including determining the securities purchased and sold by the Funds, subject to the supervision of the Adviser and the Board. The Sub-Adviser is paid a fee by the Adviser, which is calculated and paid monthly, at an annual rate of 0.02% of the Funds’ average daily net assets (the “Sub-Advisory Fee”). The Sub-Adviser has agreed to assume a portion of the Adviser’s obligation to pay all expenses incurred by the Funds, except for the Sub-Advisory Fee payable to the Sub-Adviser and Excluded Expenses. For assuming the payment obligations for a portion of the Funds’ expenses, the Adviser has agreed to pay the Sub-Adviser a corresponding share of profits, if any, generated by the Funds’ Management Fee, less a contractual fee retained by the Adviser. Expenses incurred by the Funds and paid by the Sub-Adviser include fees charged by Tidal (defined below), which is the Funds’ administrator and an affiliate of the Adviser.
Tidal ETF Services LLC (“Tidal”), a Tidal Financial Group company and an affiliate of the Adviser, serves as the Funds’ administrator and, in that capacity, performs various administrative and management services for the Funds. Tidal coordinates the payment of Fund-related expenses and manages the Trust’s relationships with its various service providers.
| NOTE 4 – COMMITMENTS AND OTHER RELATED PARTY TRANSACTIONS (CONTINUED) |
U.S. Bancorp Fund Services, LLC, doing business as U.S. Bank Global Fund Services (“Fund Services”), serves as the Funds’ sub-administrator, fund accountant and transfer agent. In those capacities, Fund Services performs various administrative and accounting services for the Funds. Fund Services prepares various federal and state regulatory filings, reports and returns for the Funds, including regulatory compliance monitoring and financial reporting; prepares reports and materials to be supplied to the Board; and monitors the activities of the Funds’ custodian. U.S. Bank N.A. (the “Custodian”), an affiliate of Fund Services, serves as the Funds’ custodian. The Custodian acts as the securities lending agent (the “Securities Lending Agent”) for the Sound Enhanced Fixed Income ETF.
Foreside Fund Services, LLC (the “Distributor”) acts as the Funds’ principal underwriter in a continuous public offering of the Funds’ shares.
Certain officers and a trustee of the Trust are affiliated with the Adviser. Neither the affiliated trustee nor the Trust’s officers receive compensation from the Funds.
| NOTE 5 – PURCHASES AND SALES OF SECURITIES |
For the six-months ended May 31, 2024, the cost of purchases and proceeds from the sales or maturities of securities, excluding short-term investments, U.S. government securities, and in-kind transactions were as follows:
| Fund | | Purchases | | | Sales | |
| Sound Enhanced Fixed Income ETF | | $ | 3,798,240 | | | $ | 1,410,993 | |
| Sound Equity Dividend Income ETF | | | 2,285,670 | | | | 2,284,935 | |
For the six-months ended May 31, 2024, there were no purchases or sales of long-term U.S. government securities.
For the six-months ended May 31, 2024, in-kind transactions associated with creations and redemptions for the Funds were as follows:
| Fund | | Purchases | | | Sales | |
| Sound Enhanced Fixed Income ETF | | $ | 2,648,220 | | | $ | — | |
| Sound Equity Dividend Income ETF | | | 2,553,888 | | | | 1,298,144 | |
| NOTE 6 – DISTRIBUTIONS TO SHAREHOLDERS |
The tax character of distributions paid during the six-months ended May 31, 2024 (estimated), was as follows:
| Distributions paid from: | | Sound
Enhanced Fixed
Income ETF | | | Sound Equity
Dividend
Income ETF | |
| Ordinary income | | $ | 1,020,000 | | | $ | 590,140 | |
| Total Distributions Paid | | $ | 1,020,000 | | | $ | 590,140 | |
The tax character of distributions paid during the year ended November 30, 2023, was as follows:
| Distributions paid from: | | Sound
Enhanced Fixed
Income ETF | | | Sound Equity Dividend
Income ETF | |
| Ordinary income | | $ | 1,542,704 | | | $ | 1,073,347 | |
| Long-term capital gains | | | — | | | | 125,804 | |
| Total Distributions Paid | | $ | 1,542,704 | | | $ | 1,199,151 | |
| NOTE 6 – DISTRIBUTIONS TO SHAREHOLDERS (CONTINUED) |
As of the year ended November 30, 2023, the components of accumulated earnings/(losses) on a tax basis were as follows:
| | | Sound
Enhanced Fixed Income ETF | | | Sound Equity Dividend
Income ETF | |
| Cost of investments (1) | | $ | 38,673,099 | | | $ | 25,681,167 | |
| Gross tax unrealized appreciation | | | 385,170 | | | | 2,404,567 | |
| Gross tax unrealized depreciation | | | (3,687,768 | ) | | | (2,370,671 | ) |
| Net tax unrealized appreciation (depreciation) | | | (3,302,598 | ) | | | 33,896 | |
| Undistributed ordinary income (loss) | | | 171,898 | | | | 126,783 | |
| Undistributed long-term capital gain (loss) | | | — | | | | — | |
| Total distributable earnings | | | 171,898 | | | | 126,783 | |
| Other accumulated gain (loss) | | | (317,779 | ) | | | (626,936 | ) |
| Total distributable (accumulated) earnings (losses) | | $ | (3,448,479 | ) | | $ | (466,257 | ) |
| (1) | The difference between book and tax-basis unrealized appreciation was attributable primarily to the treatment of wash sales. |
Net capital losses incurred after October 31 (post-October losses) and net investment losses incurred after December 31 (late year losses), and within the taxable year, may be elected to be deferred to the first business day of the Funds’ next taxable year. As of November 30, 2023, the Funds had no late year losses and had not elected to defer any post-October or late year losses. As of November 30, 2023, there were short-term and long-term capital loss carryovers of the following:
| Fund | | Short-Term | | | Long-Term | |
| Sound Enhanced Fixed Income ETF | | $ | 56,422 | | | $ | 261,357 | |
| Sound Equity Dividend Income ETF | | | 293,551 | | | | 333,385 | |
U.S. Bank N.A. has made available to the Sound Enhanced Fixed Income ETF a credit facility pursuant to a Loan Agreement for temporary or extraordinary purposes. Credit facility details for the six-months ended May 31, 2024, are as follows:
| Maximum available credit | | $ | 50,000,000 | |
| Largest amount outstanding on an individual day | | | — | |
| Average daily loan outstanding | | | — | |
| Credit facility outstanding as of May 31, 2024 | | | — | |
| Average interest rate, when in use | | | — | |
| Interest rate terms | | | Prime | |
| Interest rate as of May 31, 2024 | | | 8.25 | % |
| Expiration date | | | June 25, 2025 | |
Interest expense incurred for the six-months ended May 31, 2024 is disclosed in the Statements of Operations, if applicable. The credit facility is an uncommitted, senior secured 364-day umbrella line of credit used for the benefit of certain funds in the Trust.
The maximum available credit is disclosed at the Trust level. The Fund’s ability to borrow is therefore limited by borrowings of other funds within the Trust which are party to the agreement and to one-third of the Fund’s total assets.
| NOTE 8 – SECURITIES LENDING |
The Funds may lend up to 33 1/3% of the value of the securities in their portfolios to brokers, dealers and financial institutions (but not individuals) under terms of participation in a securities lending program administered by the Securities Lending Agent. The securities lending agreement requires that loans are collateralized at all times in an amount equal to at least the market value of the securities loaned by the Funds. The Funds receive compensation in the form of fees and earned interest on the cash collateral. Due to timing issues of when a security is recalled from loan, the financial statements may differ in presentation. The amount of fees depends on a number of factors including the type of security and length of the loan. The Funds continue to receive interest payments or dividends on the securities loaned during the borrowing period. Gain or loss in the value of securities loaned that may occur during the term of the loan will be for the account of the Funds. The Funds have the right under the terms of the securities lending agreements to recall the securities from the borrower on demand.
| NOTE 8 – SECURITIES LENDING (CONTINUED) |
As of May 31, 2024, for the Sound Enhanced Fixed Income ETF, market value of the securities on loan and payable on collateral received for securities lending were as follows:
Market Value of
Securities on Loan | | Payable on
Collateral Received | | Percentage of
Net Assets of
Securities on Loan |
| $6,550,504 | | $6,731,008 | | 17.8% |
The cash collateral is invested in the Mount Vernon Liquid Assets Portfolio, LLC, of which the investment objective is to seek to maximize income to the extent consistent with the preservation of capital and liquidity and maintain a stable NAV of $1.00. Although risk is mitigated by the collateral, the Funds could experience a delay in recovering its securities and possible loss of income or value if the borrower fails to return the borrowed securities. In addition, the Funds bear the risk of loss associated with the investment of cash collateral received. During the six-months ended May 31, 2024, the Sound Enhanced Fixed Income ETF loaned securities that were collateralized by cash. The cash collateral received was invested in the Mount Vernon Liquid Assets Portfolio, LLC, as listed in the Sound Enhanced Fixed Income ETF’s Schedule of Investments. Securities lending income is disclosed in the Sound Enhanced Fixed Income ETF’s Statement of Operations.
The Funds are not subject to a master netting agreement with respect to a Fund’s participation in securities lending; therefore, no additional disclosures regarding netting arrangements are required.
The Sound Equity Dividend Income ETF did not lend securities during the six-months ended May 31, 2024.
| NOTE 9 – SHARE TRANSACTIONS |
Shares of the Funds are listed and traded on the Exchange. Market prices for the shares may be different from their NAV. The Funds issue and redeem shares on a continuous basis at NAV generally in large blocks of shares (“Creation Units”). Creation Units are issued and redeemed principally in-kind for securities included in a specified universe. Once created, shares generally trade in the secondary market at market prices that change throughout the day. Except when aggregated in Creation Units, shares are not redeemable securities of the Funds. Creation Units may only be purchased or redeemed by Authorized Participants. An Authorized Participant is either (i) a broker-dealer or other participant in the clearing process through the Continuous Net Settlement System of the National Securities Clearing Corporation or (ii) a Depository Trust Company participant and, in each case, must have executed a Participant Agreement with the Distributor. Most retail investors do not qualify as Authorized Participants nor have the resources to buy and sell whole Creation Units. Therefore, they are unable to purchase or redeem the shares directly from the Funds. Rather, most retail investors may purchase shares in the secondary market with the assistance of a broker and are subject to customary brokerage commissions or fees.
Each Fund currently offers one class of shares, which has no front-end sales load, no deferred sales charge, and no redemption fee. A fixed transaction fee is imposed for the transfer and other transaction costs associated with the purchase or sale of Creation Units. The standard fixed transaction fee for the Sound Enhanced Fixed Income ETF is $500 and for the Sound Equity Dividend Income ETF is $300, payable to the Custodian. The fixed transaction fee may be waived on certain orders if the Funds’ Custodian has determined to waive some or all of the costs associated with the order or another party, such as the Adviser, has agreed to pay such fee. In addition, a variable fee may be charged on all cash transactions or substitutes for Creation Units and Redemption Units for the Sound Enhanced Fixed Income ETF of up to a maximum of 5% and for the Sound Equity Dividend Income ETF of up to a maximum of 2% of the value of the Creation Units and Redemption Units subject to the transaction. Variable fees received by the Funds, if any, are disclosed in the capital shares transactions section of the Statements of Changes in Net Assets. The Funds may issue an unlimited number of shares of beneficial interest, with no par value. All shares of the Funds have equal rights and privileges.
| NOTE 10 – RECENT MARKET EVENTS |
U.S. and international markets have experienced and may continue to experience significant periods of volatility in recent years and months due to a number of economic, political and global macro factors including rising inflation, uncertainty regarding central banks’ interest rate increases, the possibility of a national or global recession, trade tensions, political events, the war between Russia and Ukraine, significant conflict between Israel and Hamas in the Middle East, and the impact of COVID-19. The global recovery from COVID-19 may last for an extended period of time. As a result of continuing political tensions and armed conflicts, including the war between Ukraine and Russia, the U.S. and the European Union imposed sanctions on certain Russian individuals and companies, including certain financial institutions, and have limited certain exports and imports to and from Russia. The war has contributed to recent market volatility and may continue to do so. The Middle East conflict has led to significant loss of life, damaged infrastructure and escalated tensions both in the region and globally. These developments, as well as other events, could result in further market volatility and negatively affect financial asset prices, the liquidity of certain securities and the normal operations of securities exchanges and other markets, despite government efforts to address market disruptions. As a result, the risk environment remains elevated.
| NOTE 11 – SUBSEQUENT EVENTS |
In preparing these financial statements, the Funds have evaluated events and transactions for potential recognition or disclosure through the date the financial statements were issued. The Funds have determined that there are no other subsequent events that would need to be recorded or disclosed in the Funds’ financial statements.
| Item 8. | Changes in and Disagreements with
Accountants for Open- End Management Investment Companies | Sound Income Strategies ETFs |
An open-end management investment company registered on Form N-1A [17 CFR 239.15A and 17 CFR 274.11A] must disclose the information concerning changes in and disagreements with accountants and on accounting and financial disclosure required by Item 304 of Regulation S-K [17 CFR 229.304].
Response: There have been no changes in or disagreements with the Funds’ accountants.
| Item 9. Proxy Disclosures for Open- End Management Investment Companies | Sound Income Strategies ETFs |
If any matter was submitted during the period covered by the report to a vote of shareholders of an open-end management investment company registered on Form N-1A [17 CFR 239.15A and 17 CFR 274.11A], through the solicitation of proxies or otherwise, the company must furnish the following information:
(1) The date of the meeting and whether it was an annual or special meeting.
(2) If the meeting involved the election of directors, the name of each director elected at the meeting and the name of each other director whose term of office as a director continued after the meeting.
(3) A brief description of each matter voted upon at the meeting and the number of votes cast for, against or withheld, as well as the number of abstentions and broker non-votes as to each such matter, including a separate tabulation with respect to each matter or nominee for office.
Response: There were no matters submitted to a vote of shareholders during the period covered by the report.
| Item 10. | Remuneration Paid to Directors, Officers, and Others of
Open-End Management Investment Companies | Sound Income Strategies ETFs |
Unless the following information is disclosed as part of the financial statements included in Item 7, an open-end management investment company registered on Form N-1A [17 CFR 239.15A and 17 CFR 274.11A] must disclose the aggregate remuneration paid by the company during the period covered by the report to:
(1) All directors and all members of any advisory board for regular compensation;
(2) Each director and each member of an advisory board for special compensation;
(3) All officers; and
(4) Each person of whom any officer or director of the Fund is an affiliated person
Response: See Item 7.
| Item 11. | Statement Regarding Basis for
Approval of Investment Advisory Contract | Sound Income Strategies ETFs |
Response: This is not applicable to the Funds during the report period.
| (b) | Financial Highlights are included within the financial statements filed under Item 7(a) of this Form. |
Item 8. Changes in and Disagreements with Accountants for Open-End Investment Companies.
See Item 7(a).
There were no changes in or disagreements with accountants during the period covered by this report.
Item 9. Proxy Disclosure for Open-End Investment Companies.
There were no matters submitted to a vote of shareholders during the period covered by this report.
Item 10. Remuneration Paid to Directors, Officers, and Others of Open-End Investment Companies.
See Item 7(a).
Item 11. Statement Regarding Basis for Approval of Investment Advisory Contract.
See Item 7(a).
Item 12. Disclosure of Proxy Voting Policies and Procedures for Closed-End Management Investment Companies.
Not applicable to open-end investment companies.
Item 13. Portfolio Managers of Closed-End Management Investment Companies.
Not applicable to open-end investment companies.
Item 14. Purchases of Equity Securities by Closed-End Management Investment Company and Affiliated Purchasers.
Not applicable to open-end investment companies.
Item 15. Submission of Matters to a Vote of Security Holders.
Not Applicable.
Item 16. Controls and Procedures.
| (a) | The Registrant’s President/Principal Executive Officer and Treasurer/Principal Financial Officer have reviewed the Registrant’s disclosure controls and procedures (as defined in Rule 30a-3(c) under the Investment Company Act of 1940 (the “Act”)) as of a date within 90 days of the filing of this report, as required by Rule 30a-3(b) under the Act and Rules 13a-15(b) or 15d-15(b) under the Securities Exchange Act of 1934. Based on their review, such officers have concluded that the disclosure controls and procedures are effective in ensuring that information required to be disclosed in this report is appropriately recorded, processed, summarized and reported and made known to them by others within the Registrant and by the Registrant’s service provider. |
| (b) | There were no changes in the Registrant’s internal control over financial reporting (as defined in Rule 30a-3(d) under the Act) that occurred during the period covered by this report that have materially affected, or are reasonably likely to materially affect, the Registrant’s internal control over financial reporting. |
Item 17. Disclosure of Securities Lending Activities for Closed-End Management Investment Companies.
Not applicable to open-end investment companies.
Item 18. Recovery of Erroneously Awarded Compensation.
(a) Not Applicable.
(b) Not Applicable.
Item 19. Exhibits.
| (a) | (1) Any code of ethics or amendment thereto, that is the subject of the disclosure required by Item 2, to the extent that the registrant intends to satisfy Item 2 requirements through filing an exhibit. Not Applicable. |
(2) A separate certification for each principal executive officer and principal financial officer pursuant to Section 302 of the Sarbanes-Oxley Act of 2002. Filed herewith.
SIGNATURES
Pursuant to the requirements of the Securities Exchange Act of 1934 and the Investment Company Act of 1940, the registrant has duly caused this report to be signed on its behalf by the undersigned, thereunto duly authorized.
| | (Registrant) | Tidal ETF Trust |
| | By (Signature and Title)* | /s/ Eric W. Falkeis |
| | | Eric W. Falkeis, President/Principal Executive Officer |
Pursuant to the requirements of the Securities Exchange Act of 1934 and the Investment Company Act of 1940, this report has been signed below by the following persons on behalf of the registrant and in the capacities and on the dates indicated.
| | By (Signature and Title)* | /s/ Eric W. Falkeis |
| | | Eric W. Falkeis, President/Principal Executive Officer |
| | By (Signature and Title)* | /s/ Aaron J. Perkovich |
| | | Aaron J. Perkovich, Treasurer/Principal Financial Officer |
* Print the name and title of each signing officer under his or her signature.