UNITED STATES
SECURITIES AND EXCHANGE COMMISSION
Washington, D.C. 20549
FORM N-CSR
CERTIFIED SHAREHOLDER REPORT OF REGISTERED MANAGEMENT INVESTMENT COMPANIES
Investment Company Act file number (811-23377)
Tidal ETF Trust
(Exact name of registrant as specified in charter)
234 West Florida Street, Suite 203
Milwaukee, Wisconsin 53204
(Address of principal executive offices) (Zip code)
Eric W. Falkeis
Tidal ETF Trust
234 West Florida Street, Suite 203
Milwaukee, Wisconsin 53204
(Name and address of agent for service)
(844) 986-7700
Registrant’s telephone number, including area code
Date of fiscal year end: December 31
Date of reporting period: June 30, 2024
Updated June 27, 2024
Item 1. Reports to Stockholders.
RPAR Risk Parity ETF Tailored Shareholder Report
RPAR Risk Parity ETF Tailored Shareholder Report
semi-annual Shareholder Report June 30, 2024 RPAR Risk Parity ETF Ticker: RPAR (Listed on NYSE Arca, Inc.) |
This semi-annual shareholder report contains important information about the RPAR Risk Parity ETF (the "Fund") for the period January 1, 2024 to June 30, 2024. You can find additional information about the Fund at www.rparetf.com. You can also request this information by contacting us at (833) 540-0039 or by sending an email request to info@rparetf.com.
What were the Fund costs for the past six months?
(based on a hypothetical $10,000 investment)
Fund Name | Costs of a $10,000 investment | Costs paid as a percentage of a $10,000 investment |
|---|
RPAR Risk Parity ETF | $24 | 0.48% |
Key Fund Statistics
(as of June 30, 2024)
| |
|---|
Fund Size (Thousands) | $602,245 |
Number of Holdings | 99 |
Portfolio Turnover | 5% |
Sector/Security Type Breakdown
(% of total portfolio)
Sector/Security Type | % of Total Portfolio |
Futures Contracts | 25.6 |
U.S. Treasury Obligations | 25.4 |
Exchange Traded Funds | 25.3 |
Cash Equivalents | 13.6 |
Energy | 4.2 |
Basic Materials | 4.2 |
Industrial | 1.3 |
Consumer (Non-cyclical) | 0.3 |
Utilities | 0.1 |
Consumer (Cyclical) | 0 |
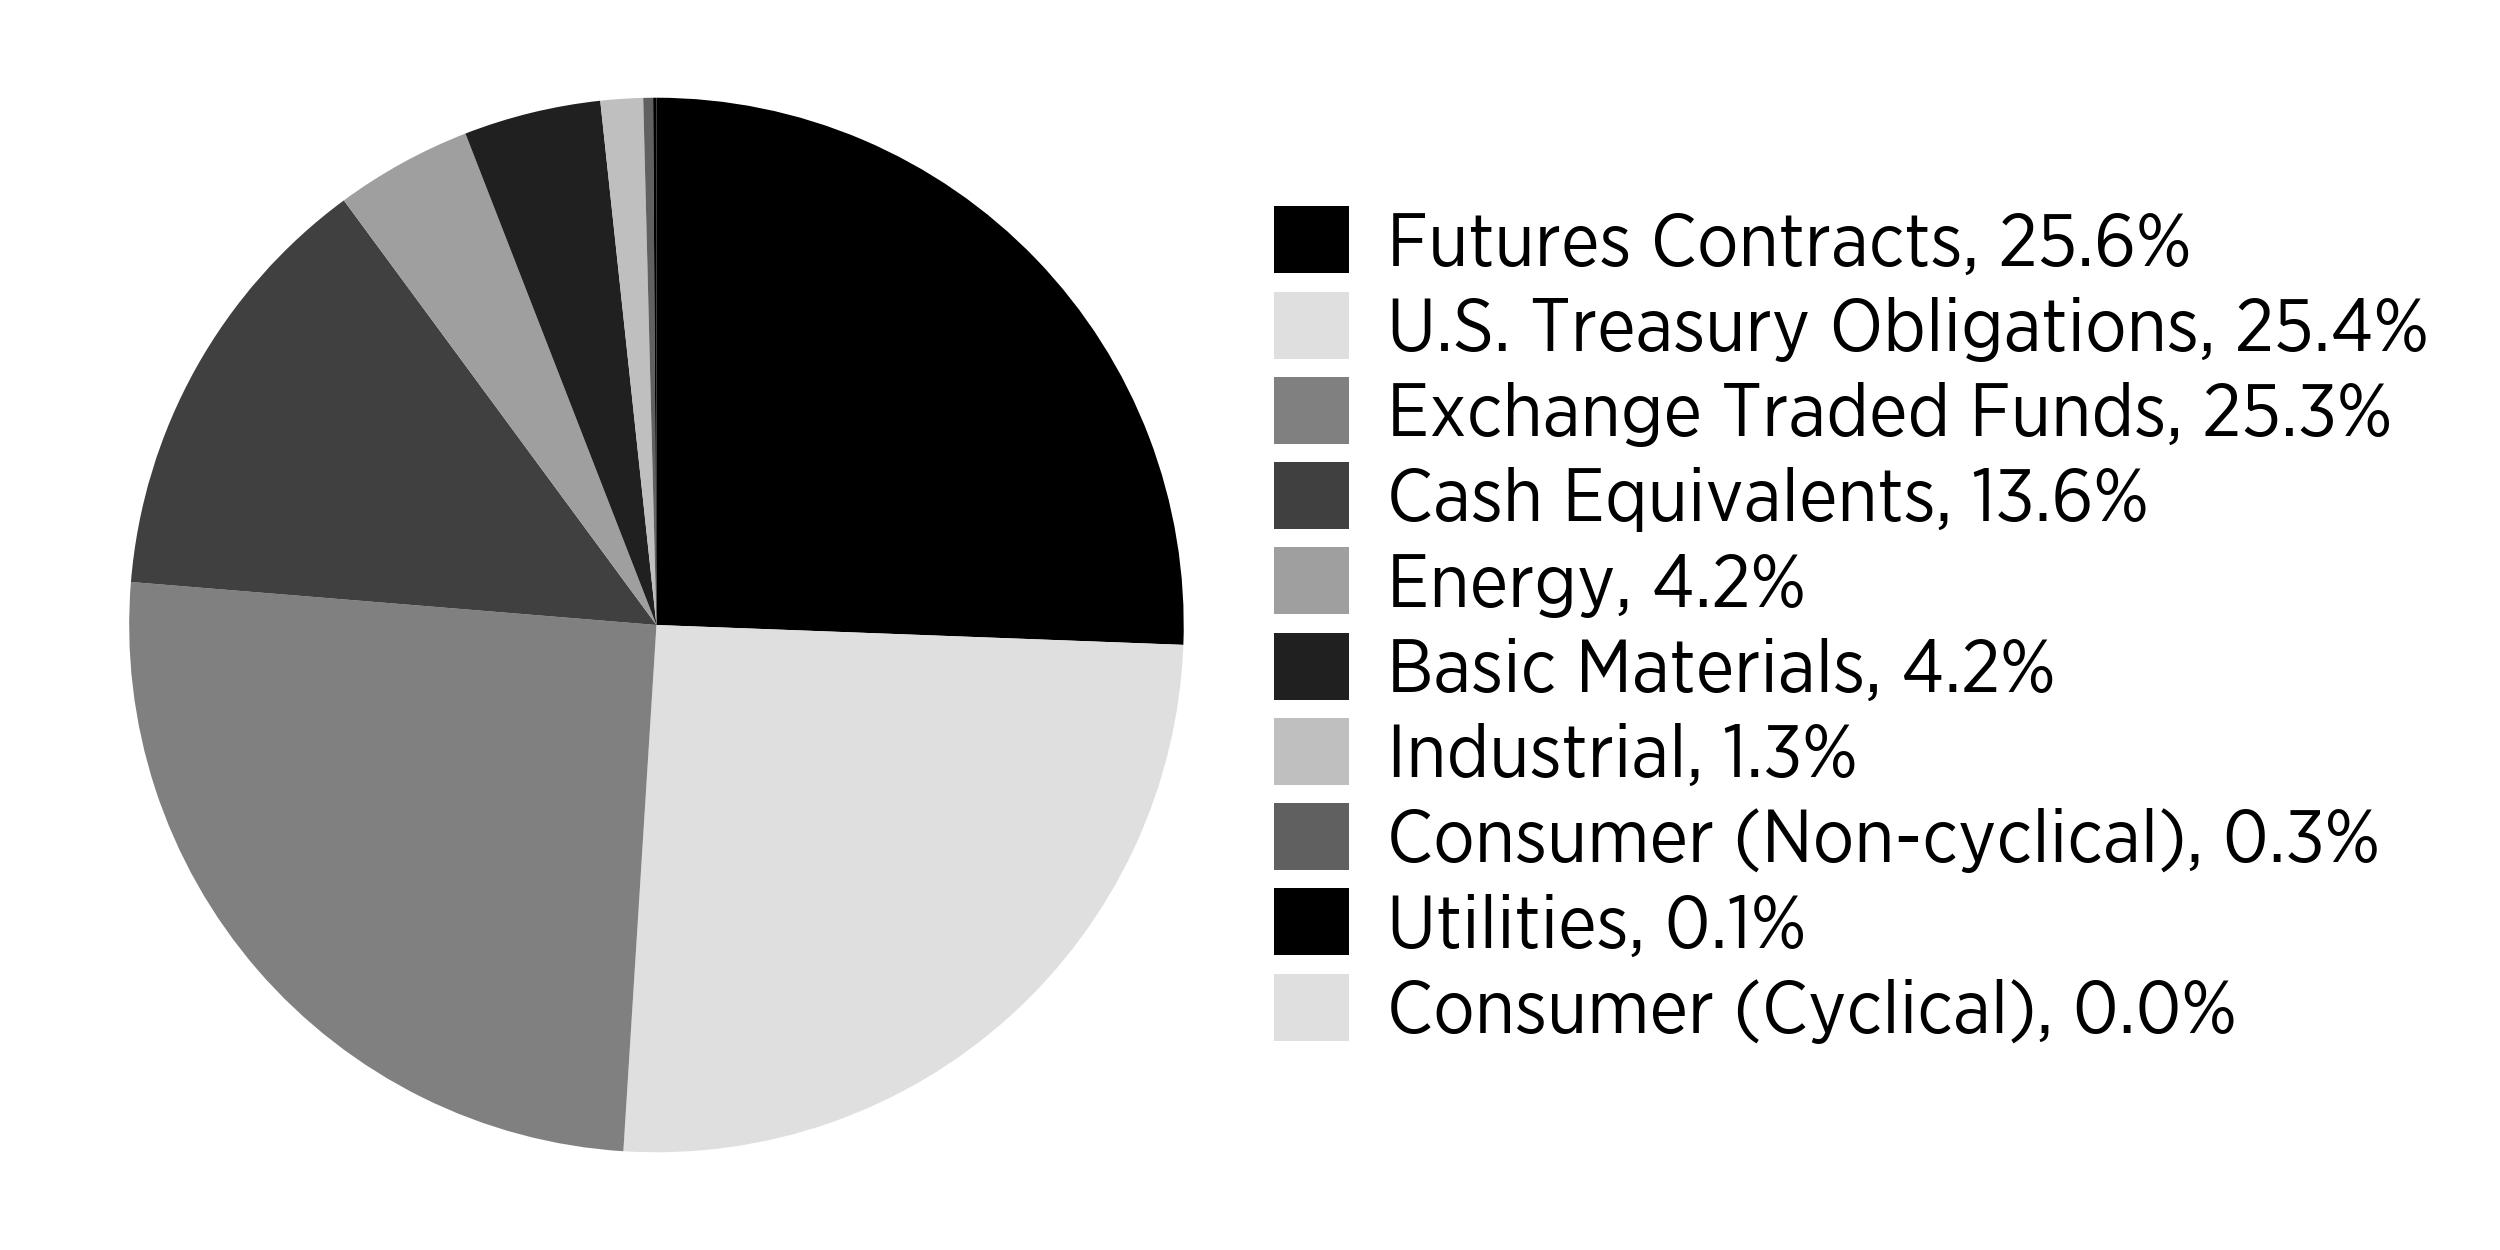
Percentages are based on total investments, including derivative contracts. Cash & Cash Equivalents represents cash, investments purchased with proceeds from securities lending, short-term investments and liabilities in excess of other assets. Futures contracts represents the notional amount of the futures contracts.
What did the Fund invest in?
(as of June 30, 2024)
Top 10 Issuers | (% of net assets) |
|---|
United States Treasury Inflation Indexed Bonds | 35.3 |
Vanguard Total Stock Market ETF | 12.7 |
SPDR Gold MiniShares Trust | 9.9 |
Vanguard FTSE Emerging Markets ETF | 7.6 |
Vanguard FTSE Developed Markets ETF | 4.9 |
Exxon Mobil Corp. | 1.2 |
Deere & Co. | 1.0 |
BHP Group Ltd. | 0.9 |
Rio Tinto PLC | 0.7 |
Chevron Corp. | 0.6 |
How has the Fund changed?
There were no material changes during the reporting period.
Changes in and Disagreements with Accountants
There were no changes in or disagreements with accountants during the reporting period.
Householding
Householding is an option available to certain investors of the Fund. Householding is a method of delivery, based on the preference of the individual investor, in which a single copy of certain shareholder documents can be delivered to investors who share the same address, even if their accounts are registered under different names. Householding for the Fund is available through certain broker-dealers. If you are interested in enrolling in householding and receiving a single copy of prospectuses and other shareholder documents, please contact your broker-dealer. If you are currently enrolled in householding and wish to change your householding status, please contact your broker-dealer.
For additional information about the Fund; including its prospectus, financial information, holdings and proxy information, visit www.rparetf.com.
UPAR Ultra Risk Parity ETF Tailored Shareholder Report
UPAR Ultra Risk Parity ETF Tailored Shareholder Report
semi-annual Shareholder Report June 30, 2024 UPAR Ultra Risk Parity ETF Ticker: UPAR (Listed on NYSE Arca, Inc.) |
This semi-annual shareholder report contains important information about the UPAR Ultra Risk Parity ETF (the "Fund") for the period January 1, 2024 to June 30, 2024. You can find additional information about the Fund at www.rparetf.com. You can also request this information by contacting us at (833) 540-0039 or by sending an email request to info@rparetf.com.
What were the Fund costs for the past six months?
(based on a hypothetical $10,000 investment)
Fund Name | Costs of a $10,000 investment | Costs paid as a percentage of a $10,000 investment |
|---|
UPAR Ultra Risk Parity ETF | $31 | 0.63% |
Key Fund Statistics
(as of June 30, 2024)
| |
|---|
Fund Size (Thousands) | $81,607 |
Number of Holdings | 105 |
Portfolio Turnover | 5% |
Sector/Security Type Breakdown
(% of total portfolio)
Sector | % of Total Portfolio |
Futures Contracts | 43.3 |
United States Treasury Inflation Indexed Bonds | 29 |
Exchange Traded Funds | 14.7 |
Energy | 4.8 |
Basic Materials | 4.7 |
Industrial | 1.6 |
Cash Equivalents | 1.4 |
Consumer (Non-cyclical) | 0.4 |
Utilities | 0.1 |
Consumer (Cyclical) | 0.0 |
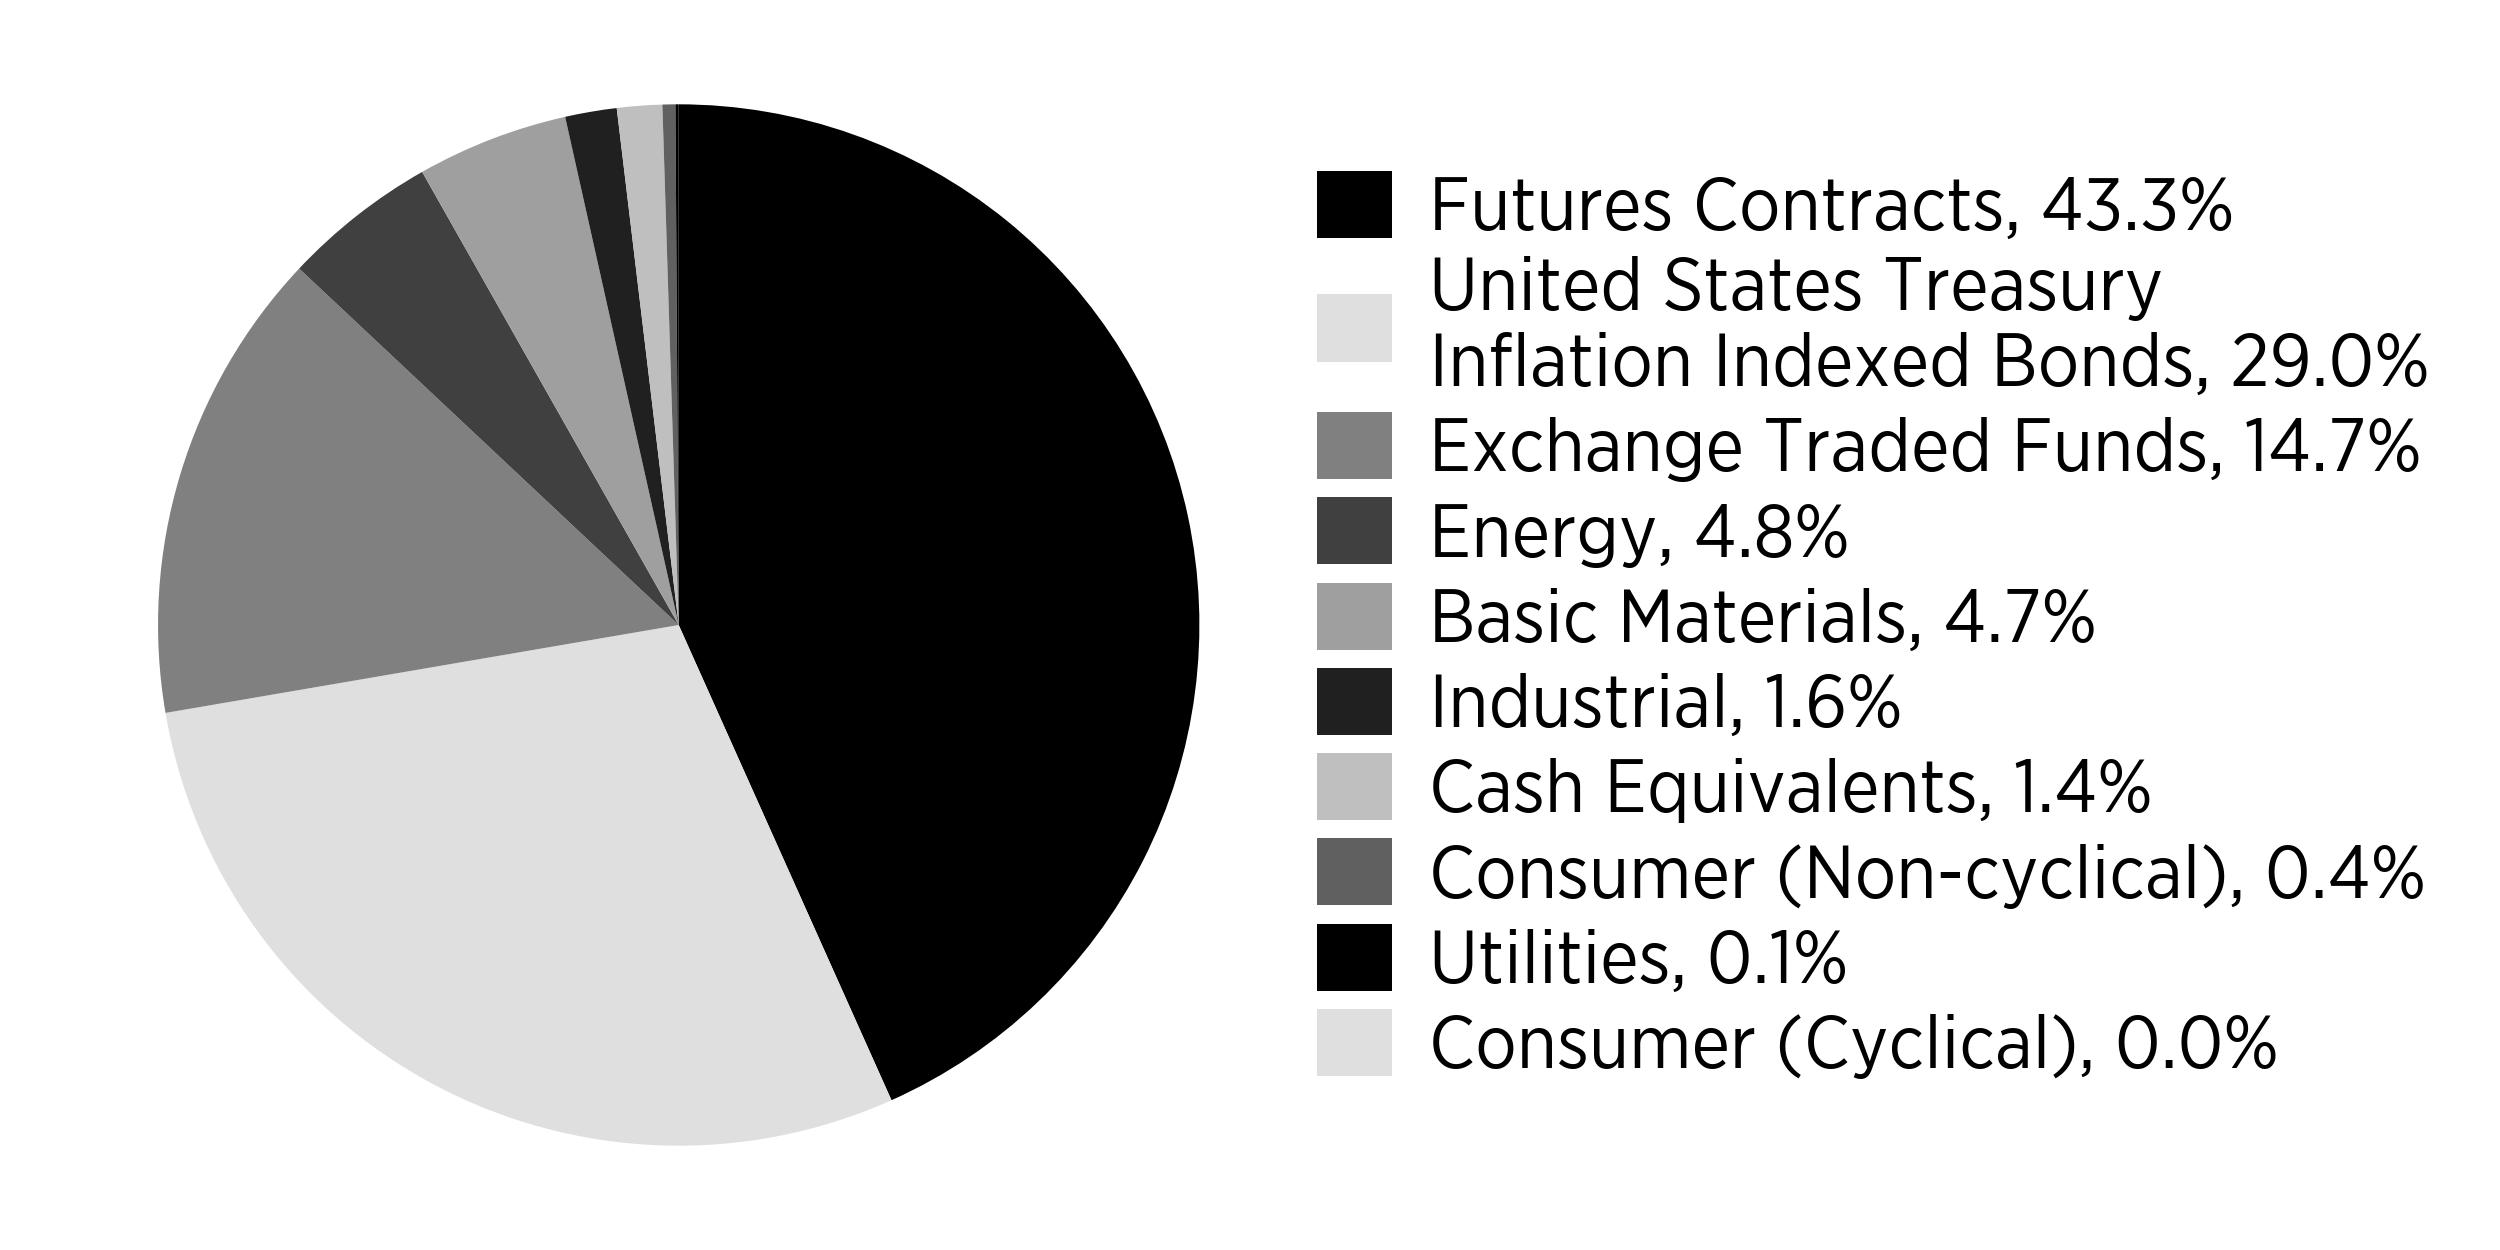
Percentages are based on total investments, including derivative contracts. Cash & Cash Equivalents represents cash, short-term investments and other assets in excess of liabilities. Futures contracts represents the notional amount of the futures contracts.
What did the Fund invest in?
(as of June 30, 2024)
Top 10 Issuers | (% of net assets) |
|---|
United States Treasury Inflation Indexed Bonds | 49.3 |
SPDR Gold MiniShares Trust | 13.8 |
Vanguard FTSE Emerging Markets ETF | 5.1 |
Vanguard Extended Market ETF | 3.5 |
Vanguard FTSE Developed Markets ETF | 2.5 |
Exxon Mobil Corp. | 1.6 |
Deere & Co. | 1.6 |
BHP Group Ltd. | 1.2 |
Rio Tinto PLC | 1.0 |
Chevron Corp. | 1.0 |
How has the Fund changed?
There were no material changes during the reporting period.
Changes in and Disagreements with Accountants
There were no changes in or disagreements with accountants during the reporting period.
Householding
Householding is an option available to certain investors of the Fund. Householding is a method of delivery, based on the preference of the individual investor, in which a single copy of certain shareholder documents can be delivered to investors who share the same address, even if their accounts are registered under different names. Householding for the Fund is available through certain broker-dealers. If you are interested in enrolling in householding and receiving a single copy of prospectuses and other shareholder documents, please contact your broker-dealer. If you are currently enrolled in householding and wish to change your householding status, please contact your broker-dealer.
For additional information about the Fund; including its prospectus, financial information, holdings and proxy information, visit www.rparetf.com.
Item 2. Code of Ethics.
Not applicable for semi-annual reports.
Item 3. Audit Committee Financial Expert.
Not applicable for semi-annual reports.
Item 4. Principal Accountant Fees and Services.
Not applicable for semi-annual reports.
Item 5. Audit Committee of Listed Registrants.
Not applicable for semi-annual reports.
Item 6. Investments.
| (a) | Schedule of Investments is included within the financial statements filed under Item 7 of this Form. |
Item 7. Financial Statements and Financial Highlights for Open-End Investment Companies.
Core Financial Statements
June 30, 2024
Tidal ETF Trust
| •RPAR Risk Parity ETF | | RPAR | | NYSE Arca, Inc. |
| •UPAR Ultra Risk Parity ETF | | UPAR | | NYSE Arca, Inc. |
RPAR ETFs
Table of Contents
| Schedules of Investments & Futures Contracts | RPAR ETFs |
| June 30, 2024 (Unaudited) | |
RPAR Risk Parity ETF
Schedule of Investments
| U.S. TREASURY SECURITIES - 35.3% | | Par | | | Value | |
| United States Treasury Inflation Indexed Bonds | | | | | | | | |
| 2.13%, 02/15/2040 | | $ | 3,182,770 | | | $ | 3,167,715 | |
| 2.13%, 02/15/2041 | | | 18,807,862 | | | | 18,750,740 | |
| 0.75%, 02/15/2042 | | | 26,991,984 | | | | 21,231,439 | |
| 0.63%, 02/15/2043 | | | 28,530,278 | | | | 21,579,652 | |
| 1.38%, 02/15/2044 | | | 30,869,285 | | | | 26,638,501 | |
| 0.75%, 02/15/2045 | | | 29,871,320 | | | | 22,547,178 | |
| 1.00%, 02/15/2046 | | | 26,466,000 | | | | 20,811,783 | |
| 0.88%, 02/15/2047 | | | 26,231,487 | | | | 19,856,653 | |
| 1.00%, 02/15/2048 | | | 24,588,267 | | | | 18,982,860 | |
| 1.00%, 02/15/2049 | | | 16,695,690 | | | | 12,792,107 | |
| 0.25%, 02/15/2050 | | | 15,330,121 | | | | 9,453,681 | |
| 0.13%, 02/15/2051 | | | 10,583,652 | | | | 6,186,006 | |
| 0.13%, 02/15/2052 | | | 9,617,903 | | | | 5,521,254 | |
| 1.50%, 02/15/2053 | | | 4,487,204 | | | | 3,805,004 | |
| 2.13%, 02/15/2054 | | | 1,078,862 | | | | 1,058,763 | |
| TOTAL U.S. TREASURY SECURITIES (Cost $324,704,779) | | | | | | | 212,383,336 | |
| | | | | | | | | |
| EXCHANGE TRADED FUNDS - 35.1% | | | Shares | | | | | |
| SPDR Gold MiniShares Trust(a) | | | 1,294,532 | | | | 59,664,980 | |
| Vanguard FTSE Developed Markets ETF | | | 595,455 | | | | 29,427,386 | |
| Vanguard FTSE Emerging Markets ETF | | | 1,044,058 | | | | 45,687,978 | |
| Vanguard Total Stock Market ETF(b) | | | 286,572 | | | | 76,660,876 | |
| TOTAL EXCHANGE TRADED FUNDS (Cost $201,229,293) | | | | | | | 211,441,220 | |
| | | | | | | | | |
| COMMON STOCKS - 14.1% | | | | | | | | |
| Biotechnology - 0.4% | | | | | | | | |
| Corteva, Inc. | | | 43,703 | | | | 2,357,340 | |
| | | | | | | | | |
| Building Materials - 0.1% | | | | | | | | |
| Geberit AG | | | 948 | | | | 559,980 | |
| | | | | | | | | |
| Chemicals - 1.1% | | | | | | | | |
| CF Industries Holdings, Inc. | | | 11,120 | | | | 824,214 | |
| Ecolab, Inc. | | | 6,653 | | | | 1,583,414 | |
| FMC Corp. | | | 8,063 | | | | 464,026 | |
| Nutrien Ltd. | | | 30,651 | | | | 1,560,158 | |
| OCI NV | | | 13,193 | | | | 322,243 | |
| PhosAgro PJSC - GDR(a)(c) | | | 52,122 | | | | 0 | |
| Sociedad Quimica y Minera de Chile S.A. - ADR(b) | | | 16,437 | | | | 669,808 | |
| The Mosaic Co. | | | 20,208 | | | | 584,011 | |
| Yara International ASA | | | 16,602 | | | | 479,622 | |
| | | | | | | | 6,487,496 | |
| Coal - 0.1% | | | | | | | | |
| Teck Resources Ltd. - Class B(a) | | | 18,510 | | | | 886,846 | |
| | | | | | | | | |
| Distribution & Wholesale - 0.0%(d) | | | | | | | | |
| Ferguson PLC | | | 36 | | | | 6,933 | |
| | | | | | | | | |
| Energy - Alternate Sources - 0.6% | | | | | | | | |
| Enphase Energy, Inc.(a) | | | 5,668 | | | | 565,156 | |
| First Solar, Inc.(a) | | | 5,317 | | | | 1,198,771 | |
| Flat Glass Group Co. Ltd. - Class H | | | 183,981 | | | | 270,997 | |
| Vestas Wind Systems A/S(a) | | | 57,058 | | | | 1,322,268 | |
| Schedules of Investments & Futures Contracts | RPAR ETFs |
| June 30, 2024 (Unaudited) | |
| Xinyi Solar Holdings Ltd. | | | 594,855 | | | | 299,431 | |
| | | | | | | | 3,656,623 | |
| Food - 0.1% | | | | | | | | |
| Salmar ASA | | | 8,062 | | | | 425,531 | |
| | | | | | | | | |
| Iron & Steel - 0.7% | | | | | | | | |
| Fortescue Ltd. | | | 123,001 | | | | 1,758,753 | |
| Mineral Resources Ltd. | | | 8,210 | | | | 295,646 | |
| Vale S.A. - ADR | | | 176,910 | | | | 1,976,085 | |
| | | | | | | | 4,030,484 | |
| Machinery - Diversified - 1.7% | | | | | | | | |
| AGCO Corp. | | | 5,131 | | | | 502,222 | |
| CNH Industrial NV - Class A | | | 81,944 | | | | 830,093 | |
| Deere & Co. | | | 16,401 | | | | 6,127,906 | |
| Husqvarna AB - Class B | | | 35,984 | | | | 288,614 | |
| IDEX Corp. | | | 1,822 | | | | 366,586 | |
| Kubota Corp. | | | 70,958 | | | | 992,512 | |
| The Toro Co. | | | 5,625 | | | | 525,994 | |
| Xylem, Inc. | | | 5,789 | | | | 785,162 | |
| | | | | | | | 10,419,089 | |
| | | | | | | | | |
| Mining - 4.0% | | | | | | | | |
| Antofagasta PLC | | | 39,915 | | | | 1,064,629 | |
| BHP Group Ltd. - ADR(b) | | | 94,974 | | | | 5,422,066 | |
| Boliden AB | | | 11,448 | | | | 366,567 | |
| Cameco Corp. | | | 15,507 | | | | 762,799 | |
| China Molybdenum Co. Ltd. - Class H | | | 908,407 | | | | 830,754 | |
| First Quantum Minerals Ltd. | | | 29,687 | | | | 389,868 | |
| Freeport-McMoRan, Inc. | | | 53,006 | | | | 2,576,092 | |
| Glencore PLC | | | 462,407 | | | | 2,636,798 | |
| GMK Norilskiy Nickel PAO - ADR(a)(c) | | | 181,762 | | | | 0 | |
| Ivanhoe Mines Ltd. - Class A(a) | | | 53,273 | | | | 687,155 | |
| Jiangxi Copper Co. Ltd. - Class H | | | 208,238 | | | | 415,548 | |
| Lundin Mining Corp. | | | 33,076 | | | | 368,142 | |
| NAC Kazatomprom PJSC - GDR | | | 10,891 | | | | 435,640 | |
| Pilbara Minerals Ltd. | | | 135,184 | | | | 277,168 | |
| Rio Tinto PLC - ADR | | | 62,464 | | | | 4,118,251 | |
| South32 Ltd. | | | 194,618 | | | | 475,711 | |
| Southern Copper Corp. | | | 28,845 | | | | 3,107,760 | |
| Sumitomo Metal Mining Co. Ltd. | | | 12,722 | | | | 385,788 | |
| | | | | | | | 24,320,736 | |
| | | | | | | | | |
| Oil & Gas - 5.1% | | | | | | | | |
| BP PLC - ADR | | | 41,839 | | | | 1,510,388 | |
| Canadian Natural Resources Ltd. | | | 30,908 | | | | 1,100,703 | |
| Cenovus Energy, Inc. | | | 28,409 | | | | 558,277 | |
| Chevron Corp. | | | 24,393 | | | | 3,815,553 | |
| ConocoPhillips | | | 17,469 | | | | 1,998,104 | |
| Coterra Energy, Inc. | | | 11,126 | | | | 296,730 | |
| Devon Energy Corp. | | | 9,329 | | | | 442,195 | |
| Diamondback Energy, Inc. | | | 2,617 | | | | 523,897 | |
| Ecopetrol S.A. - ADR(b) | | | 33,079 | | | | 370,154 | |
| Eni S.p.A - ADR(b) | | | 24,789 | | | | 763,253 | |
| EOG Resources, Inc. | | | 8,814 | | | | 1,109,418 | |
| | | | | | | | | |
| EQT Corp. | | | 5,950 | | | | 220,031 | |
| Equinor ASA - ADR(b) | | | 44,585 | | | | 1,273,348 | |
| Schedules of Investments & Futures Contracts | RPAR ETFs |
| June 30, 2024 (Unaudited) | |
| Exxon Mobil Corp. | | | 64,614 | | | | 7,438,364 | |
| Gazprom PJSC - ADR(a)(c) | | | 523,190 | | | | 0 | |
| Hess Corp. | | | 4,568 | | | | 673,871 | |
| Inpex Corp. | | | 20,463 | | | | 301,106 | |
| LUKOIL PJSC - ADR(a)(c) | | | 31,173 | | | | 0 | |
| Novatek PJSC - GDR(a)(c) | | | 13,358 | | | | 0 | |
| Occidental Petroleum Corp. | | | 13,319 | | | | 839,497 | |
| Repsol S.A. | | | 22,257 | | | | 351,489 | |
| Rosneft Oil Co. PJSC - GDR(a)(c) | | | 488,696 | | | | 0 | |
| Shell PLC - ADR | | | 45,084 | | | | 3,254,163 | |
| Suncor Energy, Inc. | | | 18,791 | | | | 716,155 | |
| Total S.A. - ADR | | | 33,641 | | | | 2,243,182 | |
| Tourmaline Oil Corp. | | | 5,519 | | | | 250,268 | |
| Woodside Energy Group Ltd. | | | 28,408 | | | | 535,209 | |
| | | | | | | | 30,585,355 | |
| | | | | | | | | |
| Water - 0.2% | | | | | | | | |
| American Water Works Co., Inc. | | | 4,467 | | | | 576,957 | |
| Veolia Environnement S.A. | | | 15,231 | | | | 455,763 | |
| | | | | | | | 1,032,720 | |
| TOTAL COMMON STOCKS (Cost $111,496,686) | | | | | | | 84,769,133 | |
| | | | | | | | | |
| SHORT-TERM INVESTMENTS - 18.8% | | | | | | | | |
| Investments Purchased with Proceeds from Securities Lending - 4.6% | | | | | | | | |
| First American Government Obligations Fund – Class X, 5.24%(e)(f) | | | 27,847,666 | | | | 27,847,666 | |
| | | | | | | | | |
| Money Market Funds - 14.2% | | | | | | | | |
| First American Government Obligations Fund – Class X, 5.24%(e) | | | 85,390,010 | | | | 85,390,010 | |
| TOTAL SHORT-TERM INVESTMENTS (Cost $113,237,676) | | | | | | | 113,237,676 | |
| | | | | | | | | |
| TOTAL INVESTMENTS - 103.3% (Cost $750,668,434) | | | | | | $ | 621,831,365 | |
| Liabilities in Excess of Other Assets - (3.3)% | | | | | | | (19,586,153 | ) |
| TOTAL NET ASSETS - 100.0% | | | | | | $ | 602,245,212 | |
Percentages are stated as a percent of net assets.
ADR - American Depositary Receipt
AG - Aktiengesellschaft
A/S - Aksjeselskap
ASA - Advanced Subscription Agreement
GDR - Global Depositary Receipt
NV - Naamloze Vennootschap
PJSC - Public Joint Stock Company
PLC - Public Limited Company
S.A. - Sociedad Anónima
| (a) | Non-income producing security. |
| (b) | All or a portion of this security is on loan as of June 30, 2024. The total market value of these securities was $27,164,155 which represented 4.5% of net assets. |
| (c) | Fair value determined using significant unobservable inputs in accordance with procedures established by and under the supervision of the Adviser, acting as Valuation Designee. These securities represented $0 or 0.0% of net assets as of June 30, 2024. |
| (d) | Represents less than 0.05% of net assets. |
| (e) | The rate shown represents the 7-day effective yield as of June 30, 2024. |
| (f) | All or a portion of security has been pledged as collateral. The total value of assets committed as collateral as of June 30, 2024 is $27,847,666. |
The accompanying notes are an integral part of these financial statements.
| Schedules of Investments & Futures Contracts | RPAR ETFs |
June 30, 2024 (Unaudited)
RPAR Risk Parity ETF
Schedule of Futures Contracts
| | | | | | | | | | | Value / Unrealized | |
| | | Contracts | | | | | | | | Appreciation | |
| Description | | Purchased | | | Expiration Date | | Notional | | | (Depreciation) | |
| U.S. Treasury 10 Year Notes | | | 961 | | | 09/19/2024 | | $ | 105,694,984 | | | $ | 1,818,993 | |
| U.S. Treasury Ultra Bonds | | | 854 | | | 09/19/2024 | | | 107,043,563 | | | | 3,932,131 | |
| Total Unrealized Appreciation (Depreciation) | | | | | | | | | | | | $ | 5,751,124 | |
The accompanying notes are an integral part of these financial statements.
| Schedules of Investments & Futures Contracts | RPAR ETFs |
June 30, 2024 (Unaudited)
UPAR Ultra Risk Parity ETF
Schedule of Investments
| U.S. TREASURY SECURITIES - 49.3% | | Par | | | Value | |
| United States Treasury Inflation Indexed Bonds | | | | | | | | |
| 2.13%, 02/15/2040 | | $ | 641,196 | | | $ | 638,163 | |
| 2.13%, 02/15/2041 | | | 3,606,654 | | | | 3,595,700 | |
| 0.75%, 02/15/2042 | | | 5,095,341 | | | | 4,007,909 | |
| 0.63%, 02/15/2043 | | | 5,385,567 | | | | 4,073,520 | |
| 1.38%, 02/15/2044 | | | 5,833,481 | | | | 5,033,974 | |
| 0.75%, 02/15/2045 | | | 5,603,036 | | | | 4,229,229 | |
| 1.00%, 02/15/2046 | | | 4,988,841 | | | | 3,923,021 | |
| 0.88%, 02/15/2047 | | | 4,944,950 | | | | 3,743,218 | |
| 1.00%, 02/15/2048 | | | 4,635,889 | | | | 3,579,042 | |
| 1.00%, 02/15/2049 | | | 3,171,172 | | | | 2,429,727 | |
| 0.25%, 02/15/2050 | | | 2,892,844 | | | | 1,783,941 | |
| 0.13%, 02/15/2051 | | | 2,012,435 | | | | 1,176,242 | |
| 0.13%, 02/15/2052 | | | 1,834,824 | | | | 1,053,299 | |
| 1.50%, 02/15/2053 | | | 854,404 | | | | 724,507 | |
| 2.13%, 02/15/2054 | | | 212,503 | | | | 208,544 | |
| TOTAL U.S. TREASURY SECURITIES (Cost $42,969,980) | | | | | | | 40,200,036 | |
| | | | | | | | | |
| EXCHANGE TRADED FUNDS - 24.9% | | | Shares | | | | | |
| SPDR Gold MiniShares Trust(a) | | | 245,189 | | | | 11,300,761 | |
| Vanguard Extended Market ETF | | | 16,985 | | | | 2,866,898 | |
| Vanguard FTSE Developed Markets ETF | | | 40,444 | | | | 1,998,743 | |
| Vanguard FTSE Emerging Markets ETF | | | 95,141 | | | | 4,163,370 | |
| TOTAL EXCHANGE TRADED FUNDS (Cost $17,433,521) | | | | | | | 20,329,772 | |
| | | | | | | | | |
| COMMON STOCKS - 19.7% | | | | | | | | |
| Biotechnology - 0.5% | | | | | | | | |
| Corteva, Inc. | | | 8,189 | | | | 441,715 | |
| | | | | | | | | |
| Building Materials - 0.1% | | | | | | | | |
| Geberit AG | | | 155 | | | | 91,558 | |
| | | | | | | | | |
| Chemicals - 1.5% | | | | | | | | |
| CF Industries Holdings, Inc. | | | 2,297 | | | | 170,254 | |
| Ecolab, Inc. | | | 1,263 | | | | 300,594 | |
| FMC Corp. | | | 1,367 | | | | 78,671 | |
| Nutrien Ltd. | | | 5,745 | | | | 292,425 | |
| OCI NV | | | 2,516 | | | | 61,454 | |
| PhosAgro PJSC - GDR(b) | | | 1,126 | | | | 0 | |
| Sociedad Quimica y Minera de Chile S.A. - ADR | | | 3,274 | | | | 133,415 | |
| Yara International ASA | | | 2,750 | | | | 79,446 | |
| | | | | | | | 1,227,350 | |
| | | | | | | | | |
| Coal - 0.2% | | | | | | | | |
| Teck Resources Ltd. - Class A(a) | | | 3,519 | | | | 168,601 | |
| | | | | | | | | |
| Distribution & Wholesale - 0.0%(c) | | | | | | | | |
| Ferguson PLC | | | 12 | | | | 2,311 | |
| | | | | | | | | |
| Energy - Alternate Sources - 0.9% | | | | | | | | |
| Enphase Energy, Inc.(a) | | | 1,310 | | | | 130,620 | |
| First Solar, Inc.(a) | | | 1,012 | | | | 228,166 | |
| Flat Glass Group Co. Ltd. - Class H | | | 39,260 | | | | 57,828 | |
| Ming Yang Smart Energy Group Ltd. - GDR | | | 17 | | | | 116 | |
| Vestas Wind Systems A/S(a) | | | 9,943 | | | | 230,420 | |
| Schedules of Investments & Futures Contracts | RPAR ETFs |
June 30, 2024 (Unaudited)
| Xinyi Solar Holdings Ltd. | | | 87,825 | | | | 44,208 | |
| | | | | | | | 691,358 | |
| | | | | | | | | |
| Food - 0.1% | | | | | | | | |
| Salmar ASA | | | 1,509 | | | | 79,648 | |
| | | | | | | | | |
| Iron & Steel - 0.9% | | | | | | | | |
| Fortescue Ltd. | | | 23,382 | | | | 334,332 | |
| Mineral Resources Ltd. | | | 1,481 | | | | 53,332 | |
| Vale S.A. - ADR | | | 33,643 | | | | 375,792 | |
| | | | | | | | 763,456 | |
| | | | | | | | | |
| Machinery - Diversified - 2.6% | | | | | | | | |
| AGCO Corp. | | | 804 | | | | 78,696 | |
| CNH Industrial NV - Class A | | | 15,041 | | | | 152,365 | |
| Deere & Co. | | | 3,436 | | | | 1,283,793 | |
| Husqvarna AB - Class B | | | 6,884 | | | | 55,214 | |
| IDEX Corp. | | | 363 | | | | 73,036 | |
| Kubota Corp. | | | 13,308 | | | | 186,143 | |
| The Toro Co. | | | 1,146 | | | | 107,162 | |
| Xylem, Inc. | | | 1,100 | | | | 149,193 | |
| | | | | | | | 2,085,602 | |
| | | | | | | | | |
| Mining - 5.6% | | | | | | | | |
| Antofagasta PLC | | | 7,489 | | | | 199,750 | |
| BHP Group Ltd. - ADR | | | 17,195 | | | | 981,662 | |
| Boliden AB | | | 2,229 | | | | 71,373 | |
| Cameco Corp. | | | 2,937 | | | | 144,473 | |
| China Molybdenum Co. Ltd. - Class H | | | 196,606 | | | | 179,799 | |
| First Quantum Minerals Ltd. | | | 5,642 | | | | 74,094 | |
| Freeport-McMoRan, Inc. | | | 9,599 | | | | 466,511 | |
| Glencore PLC | | | 87,907 | | | | 501,275 | |
| GMK Norilskiy Nickel PAO - ADR(a)(b) | | | 3,990 | | | | 0 | |
| Ivanhoe Mines Ltd. - Class A(a) | | | 8,557 | | | | 110,375 | |
| Jiangxi Copper Co. Ltd. - Class H | | | 40,454 | | | | 80,728 | |
| Lundin Mining Corp. | | | 6,257 | | | | 69,642 | |
| NAC Kazatomprom PJSC - GDR | | | 1,983 | | | | 79,320 | |
| NAC Kazatomprom PJSC - GDR | | | 340 | | | | 13,430 | |
| Pilbara Minerals Ltd. | | | 26,268 | | | | 53,857 | |
| Rio Tinto PLC - ADR | | | 12,130 | | | | 799,731 | |
| South32 Ltd. | | | 30,904 | | | | 75,540 | |
| Southern Copper Corp. | | | 5,274 | | | | 568,221 | |
| | | | | | | | 4,544,106 | |
| | | | | | | | | |
| Oil & Gas - 7.1% | | | | | | | | |
| Aker BP ASA | | | 28 | | | | 716 | |
| BP PLC - ADR | | | 7,528 | | | | 271,761 | |
| Canadian Natural Resources Ltd. | | | 5,884 | | | | 209,542 | |
| Cenovus Energy, Inc. | | | 5,501 | | | | 108,102 | |
| Chevron Corp. | | | 5,004 | | | | 782,726 | |
| ConocoPhillips | | | 3,319 | | | | 379,627 | |
| Coterra Energy, Inc. | | | 2,011 | | | | 53,633 | |
| Devon Energy Corp. | | | 1,778 | | | | 84,277 | |
| Diamondback Energy, Inc. | | | 541 | | | | 108,303 | |
| Eni S.p.A. - ADR | | | 4,721 | | | | 145,360 | |
| EOG Resources, Inc. | | | 1,663 | | | | 209,322 | |
| EQT Corp. | | | 1,119 | | | | 41,381 | |
| Equinor ASA - ADR | | | 8,553 | | | | 244,274 | |
| Exxon Mobil Corp. | | | 11,706 | | | | 1,347,595 | |
| Schedules of Investments & Futures Contracts | RPAR ETFs |
June 30, 2024 (Unaudited)
| Gazprom PJSC - ADR(a)(b) | | | 11,925 | | | | 0 | |
| Hess Corp. | | | 862 | | | | 127,162 | |
| Imperial Oil Ltd. | | | 1,397 | | | | 95,233 | |
| Inpex Corp. | | | 3,858 | | | | 56,769 | |
| LUKOIL PJSC - ADR(a)(b) | | | 818 | | | | 0 | |
| Novatek PJSC - GDR(a)(b) | | | 329 | | | | 0 | |
| Occidental Petroleum Corp. | | | 2,526 | | | | 159,214 | |
| Repsol S.A. | | | 3,470 | | | | 54,799 | |
| Rosneft Oil Co. PJSC - GDR(a)(b) | | | 10,479 | | | | 0 | |
| Shell PLC - ADR | | | 8,569 | | | | 618,510 | |
| Suncor Energy, Inc. | | | 3,542 | | | | 134,991 | |
| Total S.A. - ADR | | | 6,392 | | | | 426,218 | |
| Tourmaline Oil Corp. | | | 946 | | | | 42,898 | |
| Woodside Energy Group Ltd. | | | 5,473 | | | | 103,112 | |
| | | | | | | | 5,805,525 | |
| | | | | | | | | |
| Water - 0.2% | | | | | | | | |
| American Water Works Co., Inc. | | | 803 | | | | 103,715 | |
| Veolia Environnement S.A. | | | 3,137 | | | | 93,870 | |
| | | | | | | | 197,585 | |
| TOTAL COMMON STOCKS (Cost $16,933,909) | | | | | | | 16,098,815 | |
| | | | | | | | | |
| SHORT-TERM INVESTMENTS - 2.4% | | | | | | | | |
| Money Market Funds - 2.4% | | | | | | | | |
| First American Government Obligations Fund - Class X, 5.24%(d) | | | 1,989,887 | | | | 1,989,887 | |
| TOTAL SHORT-TERM INVESTMENTS (Cost $1,989,887) | | | | | | | 1,989,887 | |
| | | | | | | | | |
| TOTAL INVESTMENTS - 96.3% (Cost $79,327,297) | | | | | | $ | 78,618,510 | |
| Other Assets in Excess of Liabilities - 3.7% | | | | | | | 2,988,163 | |
| TOTAL NET ASSETS - 100.0% | | | | | | $ | 81,606,673 | |
Percentages are stated as a percent of net assets.
ADR - American Depositary Receipt
AG - Aktiengesellschaft
A/S - Aksjeselskap
ASA - Advanced Subscription Agreement
GDR - Global Depositary Receipt
NV - Naamloze Vennootschap
PJSC - Public Joint Stock Company
PLC - Public Limited Company
S.A. - Sociedad Anónima
| (a) | Non-income producing security. |
| (b) | Fair value determined using significant unobservable inputs in accordance with procedures established by and under the supervision of the Adviser, acting as Valuation Designee. These securities represented $0 or 0.0% of net assets as of June 30, 2024. |
| (c) | Represents less than 0.05% of net assets. |
| (d) | The rate shown represents the 7-day effective yield as of June 30, 2024. |
The accompanying notes are an integral part of these financial statements.
| Schedules of Investments & Futures Contracts | RPAR ETFs |
June 30, 2024 (Unaudited)
UPAR Ultra Risk Parity ETF
Schedule of Futures Contracts
| Description | | Contracts
Purchased | | | Expiration Date | | Notional | | | Value / Unrealized
Appreciation
(Depreciation) | |
| MSCI EAFE Index | | | 30 | | | 09/20/2024 | | $ | 3,514,800 | | | $ | (18,316 | ) |
| MSCI Emerging Markets Index | | | 83 | | | 09/20/2024 | | | 4,516,030 | | | | (23,239 | ) |
| S&P 500 Index | | | 424 | | | 09/20/2024 | | | 11,705,580 | | | | (23,913 | ) |
| U.S. Treasury 10 Year Notes | | | 182 | | | 09/19/2024 | | | 20,017,156 | | | | 341,596 | |
| U.S. Treasury Ultra Bonds | | | 162 | | | 09/19/2024 | | | 20,305,688 | | | | 749,093 | |
| Total Unrealized Appreciation (Depreciation) | | | | | | | | | | | | $ | 1,025,221 | |
The accompanying notes are an integral part of these financial statements.
| Statements of Assets and Liabilities | RPAR ETFs |
June 30, 2024 (Unaudited)
| | | RPAR Risk
Parity ETF | | | UPAR Ultra Risk
Parity ETF | |
| ASSETS: | | | | | | |
| Investments, at value (Note 2) | | $ | 621,831,365 | | | $ | 78,618,510 | |
| Variation margin on futures contracts | | | 5,751,124 | | | | 1,090,689 | |
| Dividends and interest receivable | | | 1,866,195 | | | | 243,553 | |
| Deposits at broker for other investments | | | 774,389 | | | | 1,762,471 | |
| Foreign currency, at value | | | 110,572 | | | | — | |
| Security lending income receivable (Note 5) | | | 1,927 | | | | — | |
| Total assets | | | 630,335,572 | | | | 81,715,223 | |
| | | | | | | | | |
| LIABILITIES: | | | | | | | | |
| Variation margin on futures contracts | | | — | | | | 65,468 | |
| Payable upon return of securities loaned | | | 27,847,666 | | | | — | |
| Payable to adviser (Note 4) | | | 242,694 | | | | 43,072 | |
| Payable to custodian foreign currency, at value | | | — | | | | 10 | |
| Total liabilities | | | 28,090,360 | | | | 108,550 | |
| NET ASSETS | | $ | 602,245,212 | | | $ | 81,606,673 | |
| | | | | | | | | |
| NET ASSETS CONSISTS OF: | | | | | | | | |
| Paid-in capital | | $ | 1,044,915,219 | | | $ | 90,705,090 | |
| Total accumulated losses | | | (442,670,007 | ) | | | (9,098,417 | ) |
| Total net assets | | $ | 602,245,212 | | | $ | 81,606,673 | |
| | | | | | | | | |
| Net asset | | $ | 602,245,212 | | | $ | 81,606,673 | |
| Shares issued and outstanding(a) | | | 31,425,000 | | | | 6,025,000 | |
| Net asset per share | | $ | 19.16 | | | $ | 13.54 | |
| | | | | | | | | |
| COST: | | | | | | | | |
| Investments, at cost | | $ | 750,668,434 | | | $ | 79,327,297 | |
| Foreign currency, at cost | | $ | 110,987 | | | $ | — | |
| | | | | | | | | |
| PROCEEDS: | | | | | | | | |
| Foreign currency proceeds | | $ | — | | | $ | 10 | |
| | | | | | | | | |
| LOANED SECURITIES: | | | | | | | | |
| at value (included in investments) | | $ | 27,164,155 | | | $ | — | |
| (a) | Unlimited shares authorized without par value. |
The accompanying notes are an integral part of these financial statements
| Statements of Operations | RPAR ETFs |
For the Six Months Ended June 30, 2024 (Unaudited)
| | | RPAR Risk Parity
ETF | | | UPAR Ultra Risk
Parity ETF | |
| INVESTMENT INCOME: | | | | | | |
| Dividend income | | $ | 3,066,865 | | | $ | 409,546 | |
| Less: Dividend withholding taxes | | | (60,833 | ) | | | (12,748 | ) |
| Less: Issuance fees | | | (7,525 | ) | | | (1,459 | ) |
| Interest income | | | 7,210,422 | | | | 1,415,813 | |
| Securities lending income | | | 24,333 | | | | — | |
| Other income | | | 3 | | | | 14 | |
| Total investment income | | | 10,233,265 | | | | 1,811,166 | |
| | | | | | | | | |
| EXPENSES: | | | | | | | | |
| Investment advisory fee (Note 4) | | | 1,555,226 | | | | 279,008 | |
| Interest expense | | | — | | | | 60 | |
| Other | | | 50 | | | | 122 | |
| Total expenses | | | 1,555,276 | | | | 279,190 | |
| Expense reimbursement by Adviser | | | (62,209 | ) | | | (8,585 | ) |
| Net expenses | | | 1,493,067 | | | | 270,605 | |
| NET INVESTMENT INCOME | | | 8,740,198 | | | | 1,540,561 | |
| | | | | | | | | |
| REALIZED AND UNREALIZED LOSS: | | | | | | | | |
| Net realized gain/(loss) from: | | | | | | | | |
| Investments | | | 466,718 | | | | (70,775 | ) |
| Futures contracts | | | (4,168,186 | ) | | | 1,442,376 | |
| Foreign currency translation | | | (15,740 | ) | | | (1,925 | ) |
| Net realized gain/(loss) | | | (3,717,208 | ) | | | 1,369,676 | |
| Net change in unrealized appreciation/(depreciation) on: | | | | | | | | |
| Investments | | | 10,221,581 | | | | (550,375 | ) |
| Future contracts | | | (8,484,512 | ) | | | (2,250,786 | ) |
| Foreign currency translation | | | 3,170 | | | | (99 | ) |
| Net change in unrealized appreciation/(depreciation) | | | 1,740,239 | | | | (2,801,260 | ) |
| Net realized and unrealized loss | | | (1,976,969 | ) | | | (1,431,584 | ) |
| NET INCREASE IN NET ASSETS RESULTING FROM OPERATIONS | | $ | 6,763,229 | | | $ | 108,977 | |
The accompanying notes are an integral part of these financial statements.
| Statements of Changes in Net Assets | RPAR ETFs |
| | | RPAR Risk Parity ETF | | | UPAR Ultra Risk Parity ETF | |
| | | Period ended
June 30, 2024
(Unaudited) | | | Year ended
December 31, 2023 | | | Period ended
June 30, 2024
(Unaudited) | | | Year ended
December 31, 2023 | |
| OPERATIONS: | | | | | | | | | | | | |
| Net investment income | | $ | 8,740,198 | | | $ | 27,828,894 | | | $ | 1,540,561 | | | $ | 2,380,294 | |
| Net realized gain/(loss) | | | (3,717,208 | ) | | | (44,913,367 | ) | | | 1,369,676 | | | | (3,527,171 | ) |
| Net change in unrealized appreciation/(depreciation) | | | 1,740,239 | | | | 47,168,665 | | | | (2,801,260 | ) | | | 9,857,117 | |
| Net increase in net assets from operations | | | 6,763,229 | | | | 30,084,192 | | | | 108,977 | | | | 8,710,240 | |
| | | | | | | | | | | | | | | | | |
| DISTRIBUTIONS TO SHAREHOLDERS: | | | | | | | | | | | | | | | | |
| Distributions to shareholders | | | (8,120,405 | ) | | | (28,777,261 | ) | | | (1,466,972 | ) | | | (2,373,772 | ) |
| Total distributions to shareholders | | | (8,120,405 | ) | | | (28,777,261 | ) | | | (1,466,972 | ) | | | (2,373,772 | ) |
| | | | | | | | | | | | | | | | | |
| CAPITAL TRANSACTIONS: | | | | | | | | | | | | | | | | |
| Subscriptions | | | 22,581,525 | | | | 141,044,910 | | | | 1,348,460 | | | | 37,165,712 | |
| Redemptions | | | (58,323,120 | ) | | | (451,180,012 | ) | | | (14,422,250 | ) | | | (65,158,210 | ) |
| Net decrease in net assets from capital transactions | | | (35,741,595 | ) | | | (310,135,102 | ) | | | (13,073,790 | ) | | | (27,992,498 | ) |
| | | | | | | | | | | | | | | | | |
| NET DECREASE IN NET ASSETS | | | (37,098,771 | ) | | | (308,828,171 | ) | | | (14,431,785 | ) | | | (21,656,030 | ) |
| | | | | | | | | | | | | | | | | |
| NET ASSETS: | | | | | | | | | | | | | | | | |
| Beginning of the period | | | 639,343,983 | | | | 948,172,154 | | | | 96,038,458 | | | | 117,694,488 | |
| End of the period | | $ | 602,245,212 | | | $ | 639,343,983 | | | $ | 81,606,673 | | | $ | 96,038,458 | |
| | | | | | | | | | | | | | | | | |
| SHARES TRANSACTIONS | | | | | | | | | | | | | | | | |
| Subscriptions | | | 1,200,000 | | | | 7,275,000 | | | | 100,000 | | | | 2,775,000 | |
| Redemptions | | | (3,075,000 | ) | | | (24,825,000 | ) | | | (1,075,000 | ) | | | (4,650,000 | ) |
| Total decrease in shares outstanding | | | (1,875,000 | ) | | | (17,550,000 | ) | | | (975,000 | ) | | | (1,875,000 | ) |
The accompanying notes are an integral part of these financial statements.
| Financial Highlights | RPAR Risk Parity ETF |
For a share outstanding throughout the periods presented
| | | Period ended June 30, 2024 (Unaudited) | | | Year Ended December 31, 2023 | | | Year Ended December 31, 2022 | | | Period Ended December 30, 2021(b) | | | Year Ended November 30, 2021 | | | Period ended November 30, 2020(a) | |
| PER SHARE DATA: | | | | | | | | | | | | | | | | | | |
| | | | | | | | | | | | | | | | | | | |
| Net asset, beginning of period/year | | $ | 19.20 | | | $ | 18.65 | | | $ | 25.10 | | | $ | 25.10 | | | $ | 23.00 | | | $ | 20.00 | |
| | | | | | | | | | | | | | | | | | | | | | | | | |
| INVESTMENTS OPERATIONS: | | | | | | | | | | | | | | | | | | | | | | | | |
| Net investment income(c)(e) | | | 0.27 | | | | 0.54 | | | | 0.77 | | | | 0.10 | | | | 0.48 | | | | 0.21 | |
| Net realized and unrealized gain (loss) on investments(d) | | | (0.06 | ) | | | 0.61 | | | | (6.47 | ) | | | 0.22 | | | | 1.88 | | | | 2.94 | |
| Total from investment operations | | | 0.21 | | | | 1.15 | | | | (5.70 | ) | | | 0.32 | | | | 2.36 | | | | 3.15 | |
| | | | | | | | | | | | | | | | | | | | | | | | | |
| LESS DISTRIBUTIONS FROM: | | | | | | | | | | | | | | | | | | | | | | | | |
| From net investment income | | | (0.25 | ) | | | (0.60 | ) | | | (0.75 | ) | | | (0.32 | ) | | | (0.26 | ) | | | (0.15 | ) |
| Total distributions | | | (0.25 | ) | | | (0.60 | ) | | | (0.75 | ) | | | (0.32 | ) | | | (0.26 | ) | | | (0.15 | ) |
| | | | | | | | | | | | | | | | | | | | | | | | | |
| Net asset, end of periodyear | | $ | 19.16 | | | $ | 19.20 | | | $ | 18.65 | | | $ | 25.10 | | | $ | 25.10 | | | $ | 23.00 | |
| | | | | | | | | | | | | | | | | | | | | | | | | |
| TOTAL RETURN(f) | | | 1.15 | % | | | 6.32 | % | | | -22.81 | % | | | 1.29 | % | | | 10.32 | % | | | 15.88 | % |
| | | | | | | | | | | | | | | | | | | | | | | | | |
| SUPPLEMENTAL DATA AND RATIOS: | | | | | | | | | | | | | | | | | | | | | | | | |
| Net assets, end of period/year (in thousands) | | $ | 602,245 | | | $ | 639,344 | | | $ | 948,172 | | | $ | 1,634,200 | | | $ | 1,549,300 | | | $ | 883,353 | |
| Ratio of expenses to average net assets: | | | | | | | | | | | | | | | | | | | | | | | | |
| Before expense reimbursement/recoupment(g)(h) | | | 0.50 | % | | | 0.50 | % | | | 0.50 | % | | | 0.50 | % | | | 0.50 | % | | | 0.50 | % |
| After expense reimbursement/recoupment(g)(h) | | | 0.48 | % | | | 0.48 | % | | | 0.48 | % | | | 0.47 | % | | | 0.47 | % | | | 0.47 | % |
| Ratio of dividends, interest and borrowing expense on securities sold short to average net assets(g)(h) | | | — | % | | | 0.00 | %(i) | | | 0.01 | % | | | 0.00 | %(i) | | | 0.00 | %(i) | | | — | % |
| Ratio of operational expenses to average net assets excluding dividends, interest, and borrowing expense on securities sold short(g)(h) | | | 0.48 | % | | | 0.48 | % | | | 0.48 | % | | | 0.47 | % | | | 0.47 | % | | | 0.47 | % |
| Ratio of net investment income to average net assets(g)(h) | | | 2.81 | % | | | 2.85 | % | | | 3.67 | % | | | 4.72 | % | | | 1.99 | % | | | 1.01 | % |
| Portfolio turnover rate(f)(j) | | | 5 | % | | | 14 | % | | | 28 | % | | | 1 | % | | | 16 | % | | | 65 | % |
| (a) | Inception date of the Fund was December 12, 2019. The information presented is from December 12, 2019 to November 30, 2020. |
| (b) | The Fund changed its fiscal year end from November 30 to December 31. The information presented is from December 1, 2021 to December 31, 2021. |
| (c) | Net investment income per share has been calculated based on average shares outstanding during the year. |
| (d) | Realized and unrealized gains and losses per share in the caption are balancing amounts necessary to reconcile the change in net asset value per share for the years, and may not reconcile with the aggregate gains and losses in the Statements of Operations due to share transactions for the year. |
| (e) | Recognition of net investment income by the Fund is affected by the timing of the declaration of dividends by the underlying exchange traded funds in which the Fund invests. The ratio does not include net investment income of the exchange traded funds in which the Fund invests. |
| (f) | Not annualized for periods less than one year. |
| (g) | Annualized for periods less than one year. |
| (h) | These ratios exclude the impact of expenses of the underlying exchange traded funds as represented in the Schedule of Investments. Recognition of net investment income by the Fund is affected by the timing of the underlying exchange traded funds in which the Fund invests. |
| (i) | Amount represents less than 0.005%. |
| (j) | Portfolio turnover rate exclude in-kind transactions. |
The accompanying notes are an integral part of these financial statements.
| Financial Highlights | UPAR Ultra Risk Parity ETF |
For a share outstanding throughout the periods presented
| | | Period ended
June 30, 2024 (Unaudited) | | | Year ended December 31, 2023 | | | Period ended December 31, 2022(a) | |
| PER SHARE DATA: | | | | | | | | | |
| | | | | | | | | | |
| Net asset, beginning of period/year | | $ | 13.72 | | | $ | 13.26 | | | $ | 20.00 | |
| | | | | | | | | | | | | |
| INVESTMENTS OPERATIONS: | | | | | | | | | | | | |
| Net investment income(b)(d) | | | 0.24 | | | | 0.43 | | | | 0.70 | |
| Net realized and unrealized gain (loss) on investments(c) | | | (0.18 | ) | | | 0.45 | | | | (6.81 | ) |
| Total from investment operations | | | 0.06 | | | | 0.88 | | | | (6.11 | ) |
| | | | | | | | | | | | | |
| LESS DISTRIBUTIONS FROM: | | | | | | | | | | | | |
| From net investment income | | | (0.24 | ) | | | (0.42 | ) | | | (0.59 | ) |
| Return of capital | | | — | | | | — | | | | (0.04 | ) |
| Total distributions | | | (0.24 | ) | | | (0.42 | ) | | | (0.63 | ) |
| | | | | | | | | | | | | |
| Net asset, end of period/year | | $ | 13.54 | | | $ | 13.72 | | | $ | 13.26 | |
| | | | | | | | | | | | | |
| TOTAL RETURN(e) | | | 0.48 | % | | | 6.74 | % | | | -30.62 | % |
| | | | | | | | | | | | | |
| SUPPLEMENTAL DATA AND RATIOS: | | | | | | | | | | | | |
| Net assets, end of period/year (in thousands) | | $ | 81,607 | | | $ | 96,038 | | | $ | 117,694 | |
| Ratio of expenses to average net assets: | | | | | | | | | | | | |
| Before expense reimbursement/recoupment (f)(g) | | | 0.65 | % | | | 0.65 | % | | | 0.65 | % |
| After expense reimbursement/recoupment (f)(g) | | | 0.63 | % | | | 0.63 | % | | | 0.62 | % |
| Ratio of dividends, interest and borrowing expense on securities sold short to average net assets(f)(g) | | | 0.00 | %(h) | | | 0.00 | %(h) | | | 0.00 | %(h) |
| Ratio of operational expenses to average net assets excluding dividends, interest, and borrowing expense on securities sold short(f)(g) | | | 0.63 | % | | | 0.63 | % | | | 0.62 | % |
| Ratio of net investment income to average net assets(f)(g) | | | 3.59 | % | | | 3.25 | % | | | 4.84 | % |
| Portfolio turnover rate(e)(i) | | | 5 | % | | | 36 | % | | | 39 | % |
| (a) | Inception date of the Fund was January 3, 2022. |
| (b) | Net investment income per share has been calculated based on average shares outstanding during the year. |
| (c) | Realized and unrealized gains and losses per share in the caption are balancing amounts necessary to reconcile the change in net asset value per share for the years and may not reconcile with the aggregate gains and losses in the Statements of Operations due to share transactions for the year. |
| (d) | Recognition of net investment income by the Fund is affected by the timing of the declaration of dividends by the underlying exchange traded funds in which the Fund invests. The ratio does not include net investment income of the exchange traded funds in which the Fund invests. |
| (e) | Not annualized for periods less than one year. |
| (f) | Annualized for periods less than one year. |
| (g) | These ratios exclude the impact of expenses of the underlying exchange traded funds as represented in the Schedule of Investments. Recognition of net investment income by the Fund is affected by the timing of the underlying exchange traded funds in which the Fund invests. |
| (h) | Amount represents less than 0.005%. |
| (i) | Portfolio turnover rate exclude in-kind transactions. |
The accompanying notes are an integral part of these financial statements.
| Notes to the Financial Statements | RPAR ETFs |
June 30, 2024 (Unaudited)
The RPAR Risk Parity ETF and UPAR Ultra Risk Parity ETF are each a series of shares (each, a “Fund”, and collectively, the “Funds”) of beneficial interest of Tidal ETF Trust (the “Trust”). The RPAR Risk Parity ETF is a diversified series and the UPAR Ultra Risk Party ETF is a non-diversified series of the Trust. The Trust was organized as a Delaware statutory trust on June 4, 2018 and is registered with the Securities and Exchange Commission (the “SEC”) under the Investment Company Act of 1940, as amended (the “1940 Act”), as an open-end management investment company and the offering of each Fund’s shares is registered under the Securities Act of 1933, as amended. The Trust is governed by the Board of Trustees (the “Board”). Tidal Investments LLC (f/k/aToroso Investments, LLC) (“Tidal Investments” or the “Adviser”), a Tidal Financial Group company, serves as investment adviser to the Funds. Each Fund is an investment company and accordingly follows the investment company accounting and reporting guidance of the Financial Accounting Standards Board (“FASB”) Accounting Standard Codification Topic 946 “Financial Services—Investment Companies.” The RPAR Risk Parity ETF commenced operations on December 12, 2019 and the UPAR Ultra Risk Parity ETF commenced operations on January 3, 2022.
The investment objective of each Fund is to seek to generate positive returns during periods of economic growth, preserve capital during periods of economic contraction, and preserve real rates of return during periods of heightened inflation.
| NOTE 2 – SIGNIFICANT ACCOUNTING POLICIES |
The following is a summary of significant accounting policies consistently followed by the Funds. These policies are in conformity with accounting principles generally accepted in the United States of America (“U.S. GAAP”).
A. Security Valuation. Equity securities, which may include Real Estate Investment Trusts (“REITs”), Business Development Companies (“BDCs”), and Master Limited Partnerships (“MLPs”), listed on a securities exchange, market or automated quotation system for which quotations are readily available (except for securities traded on the NASDAQ Stock Market, LLC (“NASDAQ”)), including securities traded over the counter, are valued at the last quoted sale price on the primary exchange or market (foreign or domestic) on which they are traded on the valuation date (or at approximately 4:00 p.m. EST if a security’s primary exchange is normally open at that time), or, if there is no such reported sale on the valuation date, at the most recent quoted bid price or mean between the most recent quoted bid and ask prices for long and short positions. For a security that trades on multiple exchanges, the primary exchange will generally be considered the exchange on which the security is generally most actively traded. For securities traded on NASDAQ, the NASDAQ Official Closing Price will be used. Prices of securities traded on the securities exchange will be obtained from recognized independent pricing agents (“Independent Pricing Agents”) each day that the Funds are open for business.
Debt securities are valued by using an evaluated mean of the bid and asked prices provided by Independent Pricing Agents. The Independent Pricing Agents may employ methodologies that utilize actual market transactions (if the security is actively traded), broker dealer supplied valuations, or other methodologies designed to identify the market value for such securities. In arriving at valuations, such methodologies generally consider factors such as security prices, yields, maturities, call features, ratings and developments relating to specific securities.
Futures contracts are priced by an approved independent pricing service. Futures contracts are valued at the settlement price on the exchange on which they are principally traded.
Under Rule 2a-5 of the 1940 Act, a fair value will be determined for securities for which quotations are not readily available by the Valuation Designee (as defined in Rule 2a-5) in accordance with the Pricing and Valuation Policy and Fair Value Procedures, as applicable, of the Adviser, subject to oversight by the Board. When a security is “fair valued,” consideration is given to the facts and circumstances relevant to the particular situation, including a review of various factors set forth in the Adviser’s Pricing and Valuation Policy and Fair Value Procedures, as applicable. Fair value pricing is an inherently subjective process, and no single standard exists for determining fair value. Different funds could reasonably arrive at different values for the same security. The use of fair value pricing by a Fund may cause the net asset value (“NAV”) of its shares to differ significantly from the NAV that would be calculated without regard to such considerations.
| Notes to the Financial Statements | RPAR ETFs |
June 30, 2024 (Unaudited)
As described above, the Funds utilize various methods to measure the fair value of its investments on a recurring basis. U.S. GAAP establishes a hierarchy that prioritizes inputs to valuation methods. The three levels of inputs are:
Level 1 – Unadjusted quoted prices in active markets for identical assets or liabilities that the Funds have the ability to access.
Level 2 – Observable inputs other than quoted prices included in Level 1 that are observable for the asset or liability, either directly or indirectly. These inputs may include quoted prices for the identical instrument on an inactive market, prices for similar instruments, interest rates, prepayment speeds, credit risk, yield curves, default rates and similar data.
Level 3 – Unobservable inputs for the asset or liability, to the extent relevant observable inputs are not available; representing the Funds’ own assumptions about the assumptions a market participant would use in valuing the asset or liability and would be based on the best information available.
The availability of observable inputs can vary from security to security and is affected by a wide variety of factors, including, for example, the type of security, whether the security is new and not yet established in the marketplace, the liquidity of markets, and other characteristics particular to the security. To the extent that valuation is based on models or inputs that are less observable or unobservable in the market, the determination of fair value requires more judgment. Accordingly, the degree of judgment exercised in determining fair value is greatest for instruments categorized in Level 3.
The inputs used to measure fair value may fall into different levels of the fair value hierarchy. In such cases, for disclosure purposes, the level in the fair value hierarchy within which the fair value measurement falls in its entirety, is determined based on the lowest level input that is significant to the fair value measurement in its entirety.
The following is a summary of the inputs used to value each Fund’s investments and other financial instruments as of June 30, 2024:
RPAR Risk Parity ETF
| | | Level 1 | | | Level 2 | | | Level 3 | | | Total | |
| Investments: | | | | | | | | | | | | |
| U.S. Treasury Securities | | $ | — | | | $ | 212,383,336 | | | $ | — | | | $ | 212,383,336 | |
| Exchange Traded Funds | | | 211,441,220 | | | | — | | | | — | | | | 211,441,220 | |
| Common Stocks(a) | | | 84,769,133 | | | | — | | | | 0 | (b) | | | 84,769,133 | |
| Investments Purchased with Proceeds from Securities Lending | | | — | | | | — | | | | — | | | | 27,847,666 | |
| Money Market Funds | | | 85,390,010 | | | | — | | | | — | | | | 85,390,010 | |
| Total Investments | | $ | 381,600,363 | | | $ | 212,383,336 | | | $ | 0 | (b) | | $ | 621,831,365 | |
| | | | | | | | | | | | | | | | | |
| Other Financial Instruments*: | | | | | | | | | | | | | | | | |
| Futures | | $ | 5,751,124 | | | $ | — | | | $ | — | | | $ | 5,751,124 | |
| Total Other Financial Instruments | | $ | 5,751,124 | | | $ | — | | | $ | — | | | $ | 5,751,124 | |
* The fair value of the Fund's other financial instruments represents the unrealized appreciation (depreciation) as of June 30, 2024.
Refer to the Schedule of Investments for additional information.
(a) Refer to the Schedule of Investments for industry classification.
(b) The Level 3 securities are fair valued at $0 due to a halt in trading of Russian securities as a result of the ongoing Ukrainian/ Russian conflict and the Russian markets being currently uninvestible.
The following is a reconciliation of the Fund’s Level 3 assets for which significant unobservable inputs were used to determine fair value:
| | | Common Stocks | |
| Balance as of December 31, 2023 | | $ | 218,088 | |
| Accrued discounts/premiums | | | — | |
| Realized gain (loss) | | | — | |
| Change in unrealized appreciation/depreciation | | | (218,088 | ) |
| Purchases | | | — | |
| Sales | | | — | |
| Transfer into and/or out of Level 3 | | | — | |
| Balance as of June 30, 2024 | | $ | 0 | |
| | | | | |
| Change in unrealized appreciation/depreciation during the period for Level 3 investments held at June 30, 2024: | | $ | 0 | |
| Notes to the Financial Statements | RPAR ETFs |
June 30, 2024 (Unaudited)
UPAR Ultra Risk Parity ETF
| | | Level 1 | | | Level 2 | | | Level 3 | | | Total | |
| Assets: | | | | | | | | | | | | |
| Investments: | | | | | | | | | | | | |
| U.S. Treasury Securities | | $ | — | | | $ | 40,200,036 | | | $ | — | | | $ | 40,200,036 | |
| Exchange Traded Funds | | | 20,329,772 | | | | — | | | | — | | | | 20,329,772 | |
| Common Stocks(a) | | | 16,085,385 | | | | 13,430 | | | | 0 | (b) | | | 16,098,815 | |
| Money Market Funds | | | 1,989,887 | | | | — | | | | — | | | | 1,989,887 | |
| Total Investments | | $ | 38,405,044 | | | $ | 40,213,466 | | | $ | 0 | (b) | | $ | 78,618,510 | |
| | | | | | | | | | | | | | | | | |
| Other Financial Instruments*: | | | | | | | | | | | | | | | | |
| Futures | | $ | 1,090,689 | | | $ | — | | | $ | — | | | $ | 1,090,689 | |
| Total Other Financial Instruments | | $ | 1,090,689 | | | $ | — | | | $ | — | | | $ | 1,090,689 | |
| | | | | | | | | | | | | | | | | |
| Liabilities: | | | | | | | | | | | | | | | | |
| Other Financial Instruments*: | | | | | | | | | | | | | | | | |
| Futures | | $ | (65,468 | ) | | $ | — | | | $ | — | | | $ | (65,468 | ) |
| Total Other Financial Instruments | | $ | (65,468 | ) | | $ | — | | | $ | — | | | $ | (65,468 | ) |
* The fair value of the Fund's other financial instruments represents the unrealized appreciation (depreciation) as of June 30, 2024.
Refer to the Schedule of Investments for additional information.
| (a) | Refer to the Schedule of Investments for industry classification. |
| (b) | The Level 3 securities are fair valued at $0 due to a halt in trading of Russian securities as a result of the ongoing Ukrainian/Russian conflict and the Russian markets being currently uninvestible. |
The following is a reconciliation of the Fund’s Level 3 assets for which significant unobservable inputs were used to determine fair value
| | | Common Stocks | |
| Balance as of December 31, 2023 | | $ | 35,389 | |
| Accrued discounts/premiums | | | — | |
| Realized gain (loss) | | | — | |
| Change in unrealized appreciation/depreciation | | | (35,389 | ) |
| Purchases | | | — | |
| Sales | | | — | |
| Transfer into and/or out of Level 3 | | | — | |
| Balance as of June 30, 2024 | | $ | 0 | |
| | | | | |
| Change in unrealized appreciation/depreciation during the period for Level 3 investments held at June 30, 2024: | | $ | 0 | |
| Notes to the Financial Statements | RPAR ETFs |
June 30, 2024 (Unaudited)
The Funds have provided additional disclosures below regarding derivatives and hedging activity intending to improve financial reporting by enabling investors to understand how and why the Funds use futures contracts (a type of derivative), how they are accounted for and how they affect an entity’s results of operations and financial position. The Funds may use derivatives for risk management purposes or as part of their investment strategies. Derivatives are financial contracts whose values depend on, or are derived from, the value of an underlying asset, reference rate or index. The Funds may use derivatives to earn income and enhance returns, to hedge or adjust the risk profile of its portfolio, to replace more traditional direct investments and to obtain exposure to otherwise inaccessible markets.
The average notional amount for futures contracts is based on the monthly notional amounts. The notional amount for futures contracts represents the U.S. dollar value of the contract as of the day of opening the transaction or latest contract reset date. The Funds’ average notional value of futures contracts outstanding during the six months ended June 30, 2024, was $216,215,217 for RPAR Risk Parity ETF and $61,636,072 for UPAR Ultra Risk Parity ETF. The following tables show the effects of derivative instruments on the financial statements.
Statements of Assets and Liabilities
Fair value of derivative instruments as of June 30, 2024:
RPAR Risk Parity ETF:
| | | Asset Derivatives | | | Liability Derivatives | |
| Instrument | | Balance Sheet Location | | Fair Value | | | Balance Sheet Location | | Fair Value | |
| Interest Rate Contracts - Futures | | Variation margin receivable (see Statements of Assets and Liabilities) | | $ | 5,751,124 | | | Variation margin payable (see Statements of Assets and Liabilities) | | $ | — | |
UPAR Ultra Risk Parity ETF:
| | | Asset Derivatives | | | Liability Derivatives | |
| Instrument | | Balance Sheet Location | | Fair Value | | | Balance Sheet Location | | Fair Value | |
| Interest Rate Contracts - Futures | | Variation margin receivable (see Statements of Assets and Liabilities) | | $ | 1,090,689 | | | Variation margin payable (see Statements of Assets and Liabilities) | | $ | 65,468 | |
Statements of Operations
The effect of derivative instruments on the Statements of Operations for the six months ended June 30, 2024:
RPAR Risk Parity ETF:
| Instrument | | Location of Gain (Loss) on
Derivatives
Recognized in Income | | Realized Gain (Loss) on
Derivatives
Recognized in Income | | | Change in Unrealized
Appreciation/Depreciation on
Derivatives
Recognized in Income | |
| Interest Rate Contracts - Futures | | Net Realized and Unrealized Gain (Loss) | | $ | (4,168,186 | ) | | $ | (8,484,512 | ) |
| | | | | | | | | | | |
| UPAR Ultra Risk Parity ETF: | | |
| Instrument | | Location of Gain (Loss) on
Derivatives
Recognized in Income | | Realized Gain (Loss) on
Derivatives
Recognized in Income | | | Change in Unrealized
Appreciation/Depreciation on
Derivatives
Recognized in Income | |
| Interest Rate Contracts - Futures | | Net Realized and Unrealized Gain (Loss) | | $ | 1,442,376 | | | $ | (2,250,786 | ) |
B. Federal Income Taxes. Each Fund has elected to be taxed as a “regulated investment company” and intends to distribute substantially all taxable income to its shareholders and otherwise comply with the provisions of the Internal Revenue Code applicable to regulated investment companies. Therefore, no provision for federal income taxes or excise taxes has been made. In order to avoid imposition of the excise tax applicable to regulated investment companies, each Fund intends to declare as dividends in each calendar year at least 98.0% of its net investment income (earned during the calendar year) and at least 98.2% of its net realized capital gains (earned during the twelve months ended October 31) plus undistributed amounts, if any, from prior years. As a registered investment company, each Fund is subject to a 4% excise tax that is imposed if a Fund does not distribute by the end of any calendar year at least the sum of (i) 98% of its ordinary income (not taking into account any capital gain or loss) for the calendar year and (ii) 98.2% of its capital gain in excess of its capital loss (adjusted for certain ordinary losses) for a one year period generally ending on October 31 of the calendar year (unless an election is made to use the fund’s fiscal year). The Funds generally intend to distribute income and capital gains in the manner necessary to minimize (but not necessarily eliminate) the imposition of such excise tax. The Funds may retain income or capital gains and pay excise tax when it is determined that doing so is in the best interest of shareholders. Management, in consultation with the Board of Trustees, evaluates the costs of the excise tax relative to the benefits of retaining income and capital gains, including that such undistributed amounts (net of the excise tax paid) remain available for investment by the Funds and are available to supplement future distributions. Tax expense is disclosed in the Statements of Operations, if applicable.
| Notes to the Financial Statements | RPAR ETFs |
June 30, 2024 (Unaudited)
As of June 30, 2024, the Funds did not have any tax positions that did not meet the threshold of being sustained by the applicable tax authority. Generally, tax authorities can examine all the tax returns filed for the last three years. Each Fund identifies its major tax jurisdiction as U.S. Federal and the Commonwealth of Delaware; however, the Funds are not aware of any tax positions for which it is reasonably possible that the total amounts of unrecognized tax benefits will change materially. The Funds recognize interest and penalties, if any, related to unrecognized tax benefits on uncertain tax positions as income tax expense in the Statements of Operations.
C. Securities Transactions and Investment Income. Investment securities transactions are accounted for on the trade date. Gains and losses realized on sales of securities are determined on a specific identification basis. Discounts/premiums on debt securities purchased are accreted/amortized over the life of the respective securities using the effective interest method. Dividend income is recorded on the ex-dividend date. Debt income is recorded on an accrual basis. Other non-cash dividends are recognized as investment income at the fair value of the property received. Withholding taxes on foreign dividends have been provided for in accordance with the each Fund’s understanding of the applicable country’s tax rules and rates.
D. Foreign Currency. Investment securities and other assets and liabilities denominated in foreign currencies are translated into U.S. dollar amounts at the date of valuation. Purchases and sales of investment securities and income and expense items denominated in foreign currencies are translated into U.S. dollar amounts on the respective dates of such transactions.
The Funds do not isolate that portion of the results of operations resulting from changes in foreign exchange rates on investments from the fluctuations arising from changes in market prices of securities held. Such fluctuations are included with the net realized and unrealized gain or loss from investments.
The Funds report net realized foreign exchange gains or losses that arise from sales of foreign currencies, currency gains or losses realized between the trade and settlement dates on securities transactions, and the difference between the amounts of dividends, interest, and foreign withholding taxes recorded on the Funds’ books and the U.S. dollar equivalent of the amounts actually received or paid. Net unrealized foreign exchange gains and losses arise from changes in the fair values of assets and liabilities, other than investments in securities at period end, resulting from changes in exchange rates.
E. Futures Contracts. The Funds may purchase futures contracts to gain long exposure to long-term U.S. Treasury bonds. The purchase of futures contracts may be more efficient or cost-effective than buying the underlying securities or assets. A futures contract is an agreement that obligates the buyer to buy and the seller to sell a specified quantity of an underlying asset (or settle for cash the value of a contract based on an underlying asset, rate, or index) at a specific price on the contract maturity date. Upon entering into a futures contract, the Funds are required to pledge to the counterparty an amount of cash, U.S. Government securities or other high-quality debt securities equal to the minimum “initial margin” requirements of the exchange or the broker. Pursuant to a contract entered into with a futures commission merchant, the Funds agree to receive from or pay to the firm an amount of cash equal to the cumulative daily fluctuation in the value of the contract. Such receipts or payments are known as “variation margin” and are recorded by the Funds as unrealized gains or losses. When the contract is closed, the Funds record a gain or loss equal to the difference between the value of the contract at the time it was opened and the value at the time it was closed. The Funds will cover their current obligations under futures contracts by the segregation of liquid assets or by entering into offsetting transactions or owning positions covering its obligations. The Funds’ use of futures contracts may involve risks that are different from, or possibly greater than, the risk associated with investing directly in securities or other more traditional instruments. These risks include the risk that the value of the futures contracts may not correlate perfectly, or at all, with the value of the assets, reference rates, or indices that they are designed to track. Other risks include: an illiquid secondary market for a particular instrument and possible exchange-imposed price fluctuation limits, either of which may make it difficult or impossible to close out a position when desired; the risk that adverse price movements in an instrument can result in a loss substantially greater than a Fund’s initial investment in that instrument (in some cases, the potential loss is unlimited); and the risk that a counterparty will not perform its obligations. The Funds had futures contracts activity during the six months ended June 30, 2024. Realized and unrealized gains and losses are included in the Statements of Operations. The futures contracts held by the Funds are exchange-traded with PhillipCapital, Inc. acting as the futures commission merchant.
| Notes to the Financial Statements | RPAR ETFs |
June 30, 2024 (Unaudited)
F. Offsetting Agreements. The Funds are subject to various netting arrangements, which govern the terms of certain transactions with counterparties. The arrangements allow a Fund to close out and net its total exposure to a counterparty in the event of a default with respect to all transactions governed under a single agreement with a counterparty. The following tables represent derivative financial statements that are subject to enforceable netting agreements, collateral arrangements, or other similar agreements as of June 30, 2024.
| RPAR Risk Parity ETF | | Gross
Amounts | | | Gross Amounts Offset in the Statements of Assets and Liabilities | | | Net Amounts Presented in the Statements of Assets and Liabilities | | | Financial Instruments | | | Cash Collateral Pledged (Received) | | | Net
Amount | |
| Assets | | | | | | | | | | | | | | | | | | |
| Interest Rate Contracts - Futures | | $ | 5,751,124 | | | $ | 5,751,124 | | | $ | — | | | $ | — | | | $ | — | | | $ | 5,751,124 | |
| Liabilities | | | | | | | | | | | | | | | | | | | | | | | | |
| Interest Rate Contracts - Futures | | $ | — | | | $ | — | | | $ | — | | | $ | — | | | $ | — | | | $ | — | |
| UPAR Ultra Risk Parity ETF | | Gross
Amounts | | | Gross Amounts Offset in the Statements of Assets and Liabilities | | | Net Amounts Presented in the Statements of Assets and Liabilities | | | Financial Instruments | | | Cash Collateral Pledged (Received) | | | Net
Amount | |
| Assets | | | | | | | | | | | | | | | | | | |
| Interest Rate Contracts - Futures | | $ | 1,090,689 | | | $ | 1,090,689 | | | $ | — | | | $ | — | | | $ | — | | | $ | 1,090,689 | |
| Liabilities | | | | | | | | | | | | | | | | | | | | | | | | |
| Interest Rate Contracts - Futures | | $ | 65,468 | | | $ | 65,468 | | | $ | — | | | $ | — | | | $ | — | | | $ | 65,468 | |
G. Deposits at Broker for Futures. Deposits at broker for futures represents amounts that are held by third parties under certain of the Funds’ derivative transactions. Such cash is excluded from cash and equivalents in the Statements of Assets and Liabilities.
H. Distributions to Shareholders. Distributions to shareholders from net investment income, if any, for the Funds are declared and paid at least quarterly. Distributions to shareholders from net realized gains on securities, if any, for the Funds normally are declared and paid on an annual basis. Distributions are recorded on the ex-dividend date.
I. Use of Estimates. The preparation of financial statements in conformity with U.S. GAAP requires management to make estimates and assumptions that affect the reported amounts of assets and liabilities and disclosure of contingent assets and liabilities at the date of the financial statements and the reported amounts of increases and decreases in net assets from operations during the reporting period. Actual results could differ from those estimates.
J. Share Valuation. The NAV per share of each Fund is calculated by dividing the sum of the value of the securities held by each Fund, plus cash or other assets, minus all liabilities by the total number of shares outstanding for each Fund, rounded to the nearest cent. The Funds’ shares will not be priced on the days on which the New York Stock Exchange (“NYSE”) is closed for trading.
K. Guarantees and Indemnifications. In the normal course of business, the Funds enter into contracts with service providers that contain general indemnification clauses. The Funds’ maximum exposure under these arrangements is unknown as this would involve future claims that may be made against the Funds that have not yet occurred. However, based on experience, the Funds expect the risk of loss to be remote.
L. Illiquid Securities. Pursuant to Rule 22e-4 under the 1940 Act, the Funds have adopted a Board-approved Liquidity Risk Management Program (the “Program”) that requires, among other things, that each Fund limit its illiquid investments that are assets to no more than 15% of the value of the Fund’s net assets. An illiquid investment is any security that a Fund reasonably expects cannot be sold or disposed of in current market conditions in seven calendar days or less without the sale or disposition significantly changing the market value of the investment. If either Fund should be in a position where the value of illiquid investments held by a Fund exceeds 15% of the Fund’s net assets, the Fund will take such steps as set forth in the Program.
| Notes to the Financial Statements | RPAR ETFs |
June 30, 2024 (Unaudited)
M. Derivatives Transactions. Pursuant to Rule 18f-4 under the 1940 Act, the SEC imposes limits on the amount of derivatives a fund can enter into, eliminates the asset segregation and cover framework arising from prior SEC guidance for covering derivatives and certain financial instruments currently used by funds to comply with Section 18 of the 1940 Act and treats derivatives as senior securities. Under Rule 18f-4, a fund’s derivatives exposure is limited through a value-at-risk test. Funds whose use of derivatives is more than a limited specified exposure amount are required to establish and maintain a comprehensive derivatives risk management program, subject to oversight by a fund’s board of trustees, and appoint a derivatives risk manager. The Funds implemented a Rule 18f-4 Derivative Risk Management Program that complies with Rule 18f-4.
N. Recently Issued Accounting Pronouncements. In June 2022, FASB issued Accounting Standards Update 2022-03, which amends Fair Value Measurement (Topic 820): Fair Value Measurement of Equity Securities Subject to Contractual Sale Restrictions (“ASU 2022- 03”). ASU 2022-03 clarifies guidance for fair value measurement of an equity security subject to a contractual sale restriction and establishes new disclosure requirements for such equity securities. ASU 2022-03 is effective for fiscal years beginning after December 15, 2023, and for interim periods within those fiscal years, with early adoption permitted. The Funds are currently evaluating the impact, if any, of these amendments on the financial statements.
| NOTE 3 – PRINCIPAL INVESTMENT RISKS |
A. Agriculture Risk. Companies in the agriculture industry are subject to risks such as adverse weather conditions, embargoes, tariffs, and adverse international economic, political, and regulatory developments.
B. Borrowing Risk (UPAR Ultra Risk Parity ETF only). The Fund’s use of reverse repurchase agreements in considered a form of borrowing money. Borrowing money to finance purchases of securities that exceed the Fund’s net assets creates leverage risk, which may magnify changes to the Fund’s NAV and its returns. The Fund bears the added price volatility risk of the securities purchased. Borrowing money will cost the Fund interest expense and other fees, which may reduce its returns.
C. Capital Controls and Sanctions Risk. Economic conditions, such as volatile currency exchanges and interest rates, political events, military action and other conditions may, without prior warning, lead to foreign government intervention (including intervention by the U.S. government with respect to foreign governments, economic sectors, foreign companies and related securities and interests) and the imposition of capital controls and/or sanctions, which may also include retaliatory actions of one government against another government, such as seizure of assets. Capital controls and/or sanctions include the prohibition of, or restrictions on, the ability to transfer currency, securities or other assets. Capital controls and/or sanctions may also impact the ability of the Funds to buy, sell, or otherwise transfer securities or currency, negatively impact the value and/or liquidity of such instruments, adversely affect the trading market and price for Shares of the Funds, and cause the Funds to decline in value.
D. Commodities Risk. The Funds’ exposure to investments in physical commodities subjects the Funds to greater volatility than investments in traditional securities, such as stocks and bonds. The commodities markets may fluctuate rapidly based on a variety of factors, including overall market movements; economic events and policies; changes in interest rates or inflation rates; changes in monetary and exchange control programs; war; acts of terrorism; natural disasters; and technological developments. Variables such as disease, drought, floods, weather, trade, embargoes, tariffs, and other political events, in particular, may have a larger impact on commodity prices than on traditional securities. The prices of commodities can also fluctuate widely due to supply and demand disruptions in major producing or consuming regions. Because certain commodities may be produced in a limited number of countries and may be controlled by a small number of producers, political, economic, and supply-related events in such countries could have a disproportionate impact on the prices of such commodities. These factors may affect the value of the Funds in varying ways, and different factors may cause the value and the volatility of the Funds to move in inconsistent directions at inconsistent rates. The current or “spot” prices of physical commodities may also affect, in a volatile and inconsistent manner, the prices of futures contracts in respect of the relevant commodity.
E. Credit Risk. An issuer or guarantor of debt instruments or the counterparty to a derivatives contract, repurchase agreement or loan of portfolio securities may be unable or unwilling to make its timely interest and/or principal payments or to otherwise honor its obligations. Debt instruments are subject to varying degrees of credit risk, which may be reflected in their credit ratings. There is the chance that the Funds’ portfolio holdings will have their credit ratings downgraded or will default (i.e., fail to make scheduled interest or principal payments), potentially reducing a Fund’s income level or share price.
F. Currency Exchange Rate Risk. The Funds invest, directly or indirectly, in investments denominated in non-U.S. currencies or in securities that provide exposure to such currencies. Changes in currency exchange rates and the relative value of non- U.S. currencies will affect the value of the Funds’ investments and the value of your shares of the Funds (“Shares”). Currency exchange rates can be very volatile and can change quickly and unpredictably. As a result, the value of an investment in a Fund may change quickly and without warning, and you may lose money.
| Notes to the Financial Statements | RPAR ETFs |
June 30, 2024 (Unaudited)
G. Depositary Receipt Risk. Depositary receipts involve risks similar to those associated with investments in foreign securities and certain additional risks. Depositary receipts listed on U.S. or foreign exchanges are issued by banks or trust companies, and entitle the holder to all dividends and capital gains that are paid out on the underlying foreign shares (“Underlying Shares”). When the Funds invest in depositary receipts as a substitute for an investment directly in the Underlying Shares, the Funds are exposed to the risk that the depositary receipts may not provide a return that corresponds precisely with that of the Underlying Shares.
H. Derivatives Risk. The Funds’ derivative investments have risks, including the imperfect correlation between the value of such instruments and the underlying assets or index; the loss of principal, including the potential loss of amounts greater than the initial amount invested in the derivative instrument; the possible default of the other party to the transaction; and illiquidity of the derivative investments. If a counterparty becomes bankrupt or otherwise fails to perform its obligations under a derivative contract due to financial difficulties, the Funds may experience significant delays in obtaining any recovery under the derivative contract in a bankruptcy or other reorganization proceeding. The derivatives used by the Funds may give rise to a form of leverage. Leverage magnifies the potential for gain and the risk of loss. Certain of the Funds’ transactions in derivatives could also affect the amount, timing, and character of distributions to shareholders, which may result in the Funds realizing more short-term capital gains and ordinary income subject to tax at ordinary income tax rates than they would if they did not engage in such transactions, which may adversely impact the Funds’ after-tax returns.
I. Emerging Markets Risk. The Funds may invest in securities issued by companies domiciled or headquartered in emerging market nations. Investments in securities traded in developing or emerging markets, or that provide exposure to such securities or markets, can involve additional risks relating to political, economic, currency, or regulatory conditions not associated with investments in U.S. securities and investments in more developed international markets. Such conditions may impact the ability of the Funds to buy, sell, or otherwise transfer securities, adversely affect the trading market and price for Shares and cause the Funds to decline in value.
J. Energy Producers Industry Risk. Companies in the energy producing industry are subject to risks associated with companies owning and/or operating pipelines, gathering and processing assets, power infrastructure, propane assets, as well as capital markets, terrorism, natural disasters, climate change, operating, regulatory, environmental, supply and demand, and price volatility risks. The volatility of energy commodity prices can significantly affect energy companies due to the impact of prices on the volume of commodities developed, produced, gathered, and processed. Historically, energy commodity prices have been cyclical and exhibited significant volatility, which may adversely impact the value, operations, cash flows, and financial performance of energy companies.
K. Equity Market Risk. The Funds will invest in common stocks directly or indirectly through ETFs. Common stocks are generally exposed to greater risk than other types of securities, such as preferred stock and debt obligations, because common stockholders generally have inferior rights to receive payment from issuers. The equity securities held in the Funds’ portfolio may experience sudden, unpredictable drops in value or long periods of decline in value. This may occur because of factors that affect securities markets generally or factors affecting specific issuers, industries, or sectors in which the Funds invest.
L. Exchange Traded Fund (“ETF”) Risks.
● Authorized Participants, Market Makers, and Liquidity Providers Concentration Risk. The Funds have a limited number of financial institutions that are authorized to purchase and redeem Shares directly from the Funds (known as “Authorized Participants” or “APs”). In addition, there may be a limited number of market makers and/or liquidity providers in the marketplace. To the extent either of the following events occur, Shares may trade at a material discount to NAV and possibly face delisting: (i) APs exit the business or otherwise become unable to process creation and/or redemption orders and no other APs step forward to perform these services; or (ii) market makers and/or liquidity providers exit the business or significantly reduce their business activities and no other entities step forward to perform their functions.
● Cash Redemption Risk. Each Fund’s investment strategy may require it to redeem Shares for cash or to otherwise include cash as part of its redemption proceeds. For example, a Fund may not be able to redeem in-kind certain securities held by the Fund (e.g., derivative instruments and bonds that cannot be broken up beyond certain minimum sizes needed for transfer and settlement). In such a case, a Fund may be required to sell or unwind portfolio investments to obtain the cash needed to distribute redemption proceeds. This may cause a Fund to recognize a capital gain that it might not have recognized if it had made a redemption in-kind. As a result, a Fund may pay out higher annual capital gain distributions than if the in-kind redemption process was used.
| Notes to the Financial Statements | RPAR ETFs |
June 30, 2024 (Unaudited)
● Costs of Buying or Selling Shares. Due to the costs of buying or selling Shares, including brokerage commissions imposed by brokers and bid-ask spreads, frequent trading of Shares may significantly reduce investment results and an investment in Shares may not be advisable for investors who anticipate regularly making small investments.
● Shares May Trade at Prices Other Than NAV. As with all ETFs, Shares may be bought and sold in the secondary market at market prices. Although it is expected that the market price of Shares will approximate a Fund’s NAV, there may be times when the market price of Shares is more than the NAV intra-day (premium) or less than the NAV intra-day (discount) due to supply and demand of Shares or during periods of market volatility. This risk is heightened in times of market volatility, periods of steep market declines, and periods when there is limited trading activity for Shares in the secondary market, in which case such premiums or discounts may be significant. Because securities held by the Funds may trade on foreign exchanges that are closed when the Funds’ primary listing exchange is open, the Funds are likely to experience premiums and discounts greater than those of ETFs holding only domestic securities.
● Trading. Although Shares are listed on a national securities exchange, such as NYSE Arca, Inc. (the “Exchange”), and may be traded on U.S. exchanges other than the Exchange, there can be no assurance that Shares will trade with any volume, or at all, on any stock exchange. In stressed market conditions, the liquidity of Shares may begin to mirror the liquidity of the Funds’ underlying portfolio holdings, which can be significantly less liquid than Shares. Also, in stressed market conditions, the market for Shares may become less liquid in response to deteriorating liquidity in the markets for a Fund’s underlying portfolio holdings. These adverse effects on liquidity for Shares, in turn, could lead to wider bid/ask spreads and differences between the market price of Shares and the underlying value of those Shares.
M. Exchanged Trade Vehicle (“ETV”) Risk. The Funds may invest in ETFs, Exchange Traded Notes (“ETN”), and exchange-listed trusts. Please see “ETF Risks”, above, for risks specific to investing in ETFs. The risks of owning interests of an ETV generally reflect the same risks as owning the underlying securities or other instruments that the ETF is designed to track and which are disclosed elsewhere in each Fund’s Prospectus. The shares of certain ETVs may trade at a premium or discount to their intrinsic value (i.e., the market value may differ from the NAV of an ETV’s shares). For example, the value of an ETV may drop due to a downgrade in the issuer’s credit rating. By investing in an ETV, the Fund indirectly bears the proportionate share of any fees and expenses of the ETV in addition to the Fund’s direct fees and expenses. Additionally, trading in an ETV may be halted by the exchange on which it trades.
● Exchange-Listed Trust Risk. Exchange-listed trusts are not registered as investment companies under the 1940 Act. Consequently, an investment in an exchange-listed trust will not have the regulatory protections provided to investors in registered investment companies. Some exchange-listed trusts may qualify as “emerging growth companies” and therefore may be subject to reduced public reporting requirements. Under certain circumstances, the exchange on which an exchange-listed trust trades may halt trading in the exchange-listed trust.
● ETN Risk. The value of an ETN may be influenced by time to maturity, level of supply and demand for the ETN, volatility and lack of liquidity in the underlying securities’ markets, changes in the applicable interest rates, changes in the issuer’s credit rating and economic, legal, political or geographic events that affect the referenced index. In addition, the notes issued by ETNs and held by the Funds are unsecured debts of the issuer.
N. Foreign Securities Risk. Investments in securities or other instruments of non-U.S. issuers involve certain risks not involved in domestic investments and may experience more rapid and extreme changes in value than investments in securities of U.S. companies. Financial markets in foreign countries often are not as developed, efficient, or liquid as financial markets in the United States, and therefore, the prices of non-U.S. securities and instruments can be more volatile. In addition, the Funds will be subject to risks associated with adverse political and economic developments in foreign countries, which may include the imposition of economic sanctions. Generally, there is less readily available and reliable information about non-U.S. issuers due to less rigorous disclosure or accounting standards and regulatory practices.
O. Futures Contracts Risk. A futures contract is a standardized agreement to buy or sell a specific quantity of an underlying instrument at a specific price at a specific future time. A decision as to whether, when, and how to use futures involves the exercise of skill and judgment and even a well-conceived futures transaction may be unsuccessful because of market behavior or unexpected events. In addition to the risks associated with all derivatives, the prices of futures can be highly volatile, using futures can lower total return, and the potential loss from futures can exceed a Fund’s initial investment in such contracts.
| Notes to the Financial Statements | RPAR ETFs |
June 30, 2024 (Unaudited)
P. Gold Risk. The prices of precious metals, such as gold, rise and fall in response to many factors, including: economic cycles; changes in inflation or expectations about inflation in various countries; interest rates; currency fluctuations; metal sales by governments, central banks, or international agencies; investment speculation; resource availability; fluctuations in industrial and commercial supply and demand; government regulation of the metals and materials industries; and government prohibitions or restrictions on the private ownership of certain precious and rare metals.
Q. Government Obligations Risk. The Funds may invest in securities issued by the U.S. government or its agencies or instrumentalities. There can be no guarantee that the United States will be able to meet its payment obligations with respect to such securities. Additionally, market prices and yields of securities supported by the full faith and credit of the U.S. government or other countries may decline or be negative for short or long periods of time.
R. Illiquid Investments Risk. The Funds may, at times, hold illiquid investments, by virtue of the absence of a readily available market for certain of their investments, or because of legal or contractual restrictions on sales. The Funds could lose money if they are unable to dispose of an investment at a time or price that is most beneficial to the Funds.
S. Interest Rate Risk. Generally, the value of fixed income securities will change inversely with changes in interest rates. As interest rates rise, the market value of fixed income securities tends to decrease. Conversely, as interest rates fall, the market value of fixed income securities tends to increase. This risk will be greater for long-term securities than for short-term securities. Changes in government intervention may have adverse effects on investments, volatility, and illiquidity in debt markets.
T. Leverage Risk. Using derivatives such as futures to increase a Fund’s combined long and short exposure creates leverage, which can magnify each Fund’s potential for gain or loss and, therefore, amplify the effects of market volatility on each Fund’s share price.
U. Management Risk. The Funds are actively-managed and may not meet their investment objectives based on the Adviser’s success or failure to implement investment strategies for the Funds.
V. Market Capitalization Risk.
● Large-Capitalization Investing. The securities of large-capitalization companies may be relatively mature compared to smaller companies and therefore subject to slower growth during times of economic expansion. Large-capitalization companies may also be unable to respond quickly to new competitive challenges, such as changes in technology and consumer tastes.
● Mid-Capitalization Investing. The securities of mid-capitalization companies may be more vulnerable to adverse issuer, market, political, or economic developments than securities of large-capitalization companies. The securities of midcapitalization companies generally trade in lower volumes and are subject to greater and more unpredictable price changes than large-capitalization stocks or the stock market as a whole.
● Small-Capitalization Investing. The securities of small-capitalization companies may be more vulnerable to adverse issuer, market, political, or economic developments than securities of large- or mid-capitalization companies. The securities of small-capitalization companies generally trade in lower volumes and are subject to greater and more unpredictable price changes than large-or mid-capitalization stocks or the stock market as a whole. There is typically less publicly available information concerning smaller- capitalization companies than for larger, more established companies.
W. Market Risk. The trading prices of securities and other instruments fluctuate in response to a variety of factors. Turbulence in financial markets and reduced liquidity in equity, credit, and fixed income markets may negatively affect many issuers worldwide, which could have an adverse effect on the Funds. Each Fund’s NAV and market price may fluctuate significantly in response to these and other factors. As a result, an investor could lose money over short or long periods of time.
X. Maturity Risk. Debt securities with a longer maturity, including U.S. Treasuries and TIPS, may fluctuate in value more than ones with a shorter maturity.
Y. Mining and Metal Industry Risk. Mining and metal companies can be significantly affected by international political and economic developments, energy conversion, the success of exploration projects, commodity prices, taxes and government regulations. Investments in mining and metal industry companies may be speculative and subject to greater price volatility than investments in other types of companies. Increased environmental or labor costs may depress the value of mining and metal investments. In addition, changes in international monetary policies or economic and political conditions can affect the supply of gold and precious metals, and consequently the value of mining and metal company investments. Further, the principal supplies of metal industries may be concentrated in a small number of countries and regions.
| Notes to the Financial Statements | RPAR ETFs |
June 30, 2024 (Unaudited)
Z. Newer Fund Risk (UPAR Ultra Risk Parity ETF only). The Fund is newer with a limited operating history. As a result, prospective investors have a limited track record or history on which to base their investment decisions. There can be no assurance that the Fund will grow to or maintain an economically viable size.
AA. Non-Diversification Risk (UPAR Ultra Risk Parity ETF only). The Fund is considered to be “non-diversified”, which means that it may invest a greater percentage of its assets in securities of a single issuer or a small number of issuers than if it was a diversified fund. As a result, a decline in the value of an investment in a single issuer or a smaller number of issuers could cause the Fund’s overall value to decline to a greater degree than if the Fund held a more diversified portfolio. This may increase the Fund’s volatility and have a greater impact on the Fund’s performance.
BB. Other Investment Companies Risk. By investing in another investment company, the Funds become a shareholder of that investment company and bears its proportionate share of the fees and expenses of the other investment company. The Funds may suffer losses due to the investment practices of the underlying funds as the Funds will be subject to substantially the same risks as those associated with the direct ownership of securities held by such investment companies. The Funds will incur higher and duplicative expenses when it invests in ETFs and other investment companies. ETFs may be less liquid than other investments, and thus their share values more volatile than the values of the investments they hold. Investments in ETFs are also subject to the “ETF Risks” described above.
CC. Real Estate Investment Trust (“REIT”) Investment Risk. Investments in REITs involve unique risks. REITs may have limited financial resources, may trade less frequently and in limited volume, and may be more volatile than other securities. REITs may be affected by changes in the value of their underlying properties or mortgages or by defaults by their borrowers or tenants. Furthermore, these entities depend upon specialized management skills, have limited diversification and are, therefore, subject to risks inherent in financing a limited number of projects. In addition, the performance of a REIT may be affected by changes in the tax laws or by its failure to qualify for tax-free pass-through of income.
DD. Reverse Repurchase Agreement Risk (UPAR Ultra Risk Parity ETF only). A reverse repurchase agreement is the sale by the Fund of a security to a party for a specified price, with the simultaneous agreement by the Fund to repurchase that security from that party on a future date at a higher price. Similar to borrowing, reverse repurchase agreements provide the Fund with cash for investment purposes, which creates leverage and subjects the Fund to the risks of leverage. Reverse repurchase agreements also involve the risk that the other party may fail to return the securities in a timely manner or at all. The Fund could lose money if it is unable to recover the securities and/or if the value of collateral held by the Fund, including the value of the investments made with cash collateral, is less than the value of securities.
EE. Tax Risk. To qualify for the favorable U.S. federal income tax treatment accorded to regulated investment companies (“RICs”), the Fund must derive at least 90% of its gross income in each taxable year from certain categories of income (“qualified income”) and must satisfy certain asset diversification requirements. Certain of each Fund’s investments may generate income that is not qualifying income. If the Funds were to fail to meet the qualifying income test or the asset diversification requirements and fail to qualify as a RIC, it would be taxed in the same manner as an ordinary corporation, and distributions to its shareholders would not be deductible by the Funds in computing their taxable income.
FF. United States Treasury Inflation Protected Securities (“TIPS”) Risk. Interest payments on TIPS are unpredictable and will fluctuate as the principal and corresponding interest payments are adjusted for inflation. There can be no assurance that the Consumer Price Index will accurately measure the real rate of inflation in the prices of goods and services. Any increases in the principal amount of TIPS will be considered taxable ordinary income, even though the Funds or applicable underlying ETF will not receive the principal until maturity. As a result, the Funds may make income distributions to shareholders that exceed the cash they receive. In addition, TIPS are subject to credit risk, interest rate risk, and maturity risk.
GG. Water Industry Risk. The water industry can be significantly affected by economic trends or other conditions or developments, such as the availability of water, the level of rainfall and occurrence of other climatic events, change in water consumption, new technologies relating to the supply of water, and water conversion. The industry can also be significantly affected by environmental considerations, taxation, government regulation (including the increased cost of compliance), inflation, increases in interest rates, price and supply fluctuations, increases in the cost of raw materials and other operating costs, technological advances, and competition from new market entrants.
| Notes to the Financial Statements | RPAR ETFs |
June 30, 2024 (Unaudited)
| NOTE 4 – COMMITMENTS AND OTHER RELATED PARTY TRANSACTIONS |
The Adviser serves as investment adviser to the Funds pursuant to an investment advisory agreement between the Adviser and the Trust, on behalf of the Funds (the “Advisory Agreement”) and, pursuant to the Advisory Agreement, has overall responsibility for the general management and administration of the Funds, subject to the direction and oversight of the Board. The Adviser is also responsible for trading portfolio securities on behalf of the Funds, including selecting broker-dealers to execute purchase and sale transactions, subject to the supervision of the Board.
Pursuant to the Advisory Agreement, each Fund pays the Adviser a unitary management fee (the “Management Fee”) based on the average daily net assets of the Funds as follows:
Fund | | Management Fee | | Management Fee After Waiver |
| RPAR Risk Parity ETF | | 0.50% | | 0.48% |
| UPAR Ultra Risk Parity ETF | | 0.65% | | 0.63% |
The Adviser has contractually agreed to reduce of its Management Fee for the RPAR Risk Parity ETF to 0.48% until at least April 30, 2025 and agreed to reduce its Management Fee for the UPAR Ultra Risk Parity ETF to 0.63% until at least April 30, 2025 (the “Fee Waiver Agreements”). The Fee Waiver Agreements may be terminated only by, or with the consent of, the Board. Any waived Management Fees are not able to be recouped by the Adviser under the Fee Waiver Agreements. Management Fees for the six months ended June 30, 2024 are disclosed in the Statements of Operations.
Out of the Management Fee, the Adviser is obligated to pay or arrange for the payment of substantially all expenses of the Funds, including the cost of sub-advisory, transfer agency, custody, fund administration, and all other related services necessary for the Funds to operate. Under the Advisory Agreement, the Adviser has agreed to pay all expenses incurred by the Funds except for interest charges on any borrowings, dividends and other expenses on securities sold short, taxes, brokerage commissions and other expenses incurred in placing orders for the purchase and sale of securities and other investment instruments, acquired fund fees and expenses, accrued deferred tax liability, extraordinary expenses, and distribution fees and expenses paid by the Funds under any distribution plan adopted pursuant to Rule 12b-1 under the 1940 Act (“Excluded Expenses”), and the Management Fee payable to the Adviser. To the extent a Fund incurs Excluded Expenses, the Fund’s Total Annual Fund Operating Expenses After Fee Waiver will be greater than 0.48% for the RPAR Risk Parity ETF and 0.63% for UPAR Ultra Risk Parity ETF. The Management Fees incurred are paid monthly to the Adviser.
The Adviser has entered into an agreement with RPAR, LLC under which RPAR, LLC assumes the obligation of the Adviser to pay all expenses of each Fund, except Excluded Expenses (such expenses of each Fund, except Excluded Expenses, the “Unitary Expenses”). Although RPAR, LLC has agreed to be responsible for the Unitary Expenses, the Adviser retains the ultimate obligation to each Fund to pay such expenses. For assuming the payment obligations, the Adviser has agreed to pay to RPAR, LLC the profits, if any, generated by each Fund’s unitary management fee less a contractual fee retained by the Adviser. RPAR, LLC does not make investment decisions, provide investment advice, participate in the active management of each Fund, or otherwise act in the capacity of an investment adviser to each Fund.
Tidal ETF Services LLC (“Tidal”), a Tidal Financial Group company and an affiliate of the Adviser, serves as the Funds’ administrator and, in that capacity, performs various administrative and management services for the Funds. Tidal coordinates the payment of Fund-related expenses and manages the Trust’s relationships with its various service providers.
U.S. Bancorp Fund Services, LLC, doing business as U.S. Bank Global Fund Services (“Fund Services”), serves as the Funds’ sub-administrator, fund accountant and transfer agent. In those capacities, Fund Services performs various administrative and accounting services for the Funds. Fund Services prepares various federal and state regulatory filings, reports and returns for the Funds, including regulatory compliance monitoring and financial reporting; prepares reports and materials to be supplied to the Board; and monitors the activities of the Funds’ custodian, U.S. Bank N.A. (the “Custodian”), an affiliate of Fund Services, serves as the Funds’ custodian. The Custodian acts as the securities lending agent (the “Securities Lending Agent”) for the RPAR Risk Parity ETF.
| Notes to the Financial Statements | RPAR ETFs |
June 30, 2024 (Unaudited)
Foreside Fund Services, LLC (the “Distributor”) acts as the Funds’ principal underwriter in a continuous public offering of the Funds’ shares.
Certain officers and a trustee of the Trust are affiliated with the Adviser. Neither the affiliated trustee nor the Trust’s officers receive compensation from the Funds.
NOTE 5 – SECURITIES LENDING |
Each Fund may lend up to 33 1/3% of the value of the securities in its portfolio to brokers, dealers and financial institutions (but not individuals) under terms of participation in a securities lending program administered by the Securities Lending Agent. The securities lending agreement requires that loans are collateralized at all times in an amount equal to at least the market value of the securities loaned by the Funds. The Funds receive compensation in the form of fees and earned interest on the cash collateral. Due to timing issues of when a security is recalled from loan, the financial statements may differ in presentation. The amount of fees depends on a number of factors including the type of security and length of the loan. The Funds continue to receive interest payments or dividends on the securities loaned during the borrowing period. Gain or loss in the value of securities loaned that may occur during the term of the loan will be for the accounts of the Funds. The Funds have the right under the terms of the securities lending agreements to recall the securities from the borrower on demand.
As of June 30, 2024, the market value of the securities on loan and payable on collateral received for securities lending for the RPAR Risk Parity ETF was as follows:
| Fund | | Market Value of
Securities on Loan | | | Payable on Collateral Received | | | Percentage of
Net Assets of
Securities on Loan | |
| RPAR Risk Parity ETF | | $ | 27,164,155 | | | $ | 27,847,666 | | | | 4.5 | % |
As of June 30, 2024, the RPAR Risk Parity ETF had loaned securities and received cash collateral for the loans. The cash collateral is invested in the First American Government Obligations Fund of which the investment objective is to seek to maximize income to the extent consistent with the preservation of capital and liquidity and maintain a stable NAV of $1.00. Although risk is mitigated by the collateral, the RPAR Risk Parity ETF could experience a delay in recovering its securities and possible loss of income or value if the borrower fails to return the borrowed securities. In addition, the RPAR Risk Parity ETF bears the risk of loss associated with the investment of cash collateral received.
The cash collateral invested in the First American Government Obligations Fund is listed in the RPAR Risk Parity ETF’s Schedule of Investments. Securities lending income is disclosed in the RPAR Risk Parity ETF’s Statements of Operations.
The RPAR Risk Parity ETF is not subject to a master netting agreement with respect to the RPAR Risk Parity ETF’s participation in securities lending; therefore, no additional disclosures regarding netting arrangements are required.
The UPAR Ultra Risk Parity ETF did not lend securities during the six months ended June 30, 2024.
| NOTE 6 – PURCHASES AND SALES OF SECURITIES |
For the six months ended June 30, 2024, the cost of purchases and proceeds from the sales or maturities of securities, excluding short-term investments, U.S. government securities and in-kind transactions were as follows:
| Fund | | Purchases | | | Sales | |
| RPAR Risk Parity ETF | | $ | 7,932,871 | | | $ | 27,315,996 | |
| UPAR Ultra Risk Parity ETF | | | 1,728,551 | | | | 3,132,349 | |
For the six months ended June 30, 2024, the cost of purchases and proceeds from the sales or maturities of long-term U.S. government investments were as follows:
| Fund | | Purchases | | | Sales | |
| RPAR Risk Parity ETF | | $ | 16,288,728 | | | $ | 22,531,680 | |
| UPAR Ultra Risk Parity ETF | | | 2,590,512 | | | | 6,927,798 | |
| Notes to the Financial Statements | RPAR ETFs |
June 30, 2024 (Unaudited)
For the six months ended June 30, 2024, in-kind transactions associated with creations and redemptions for the Funds were as follows:
| Fund | | Purchases | | | Sales | |
| RPAR Risk Parity ETF | | $ | 11,368,943 | | | $ | 33,467,606 | |
| UPAR Ultra Risk Parity ETF | | | 654,624 | | | | 7,305,454 | |
| NOTE 7 – INCOME TAXES AND DISTRIBUTIONS TO SHAREHOLDERS |
The tax character of distributions paid during the six months ended June 30, 2024 (estimated) and the year ended December 31, 2023, were as follows:
Fund | | Distributions paid from: | | June 30, 2024 | | | December 31, 2023 | |
| RPAR Risk Parity ETF | | Ordinary income | | $ | 8,120,405 | | | $ | 28,777,261 | |
| UPAR Ultra Risk Parity ETF | | Ordinary income | | $ | 1,466,972 | | | $ | 2,373,772 | |
As of December 31, 2023, the components of accumulated earnings (losses) on a tax basis were as follows:
| | | RPAR Risk Parity ETF | | | UPAR Ultra Risk Parity ETF | |
| Cost of investments(1) | | $ | 763,880,355 | | | $ | 95,761,818 | |
| Gross tax unrealized appreciation | | | 11,008,594 | | | | 3,362,138 | |
| Gross tax unrealized depreciation | | | (153,580,644 | ) | | | (6,279,016 | ) |
| Net tax unrealized appreciation (depreciation) | | | (142,572,050 | ) | | | (2,916,878 | ) |
| Undistributed ordinary income (loss) | | | 92,697 | | | | 8,586 | |
| Undistributed long-term capital gain (loss) | | | — | | | | — | |
| Total distributable earnings | | | 92,697 | | | | 8,586 | |
| Other accumulated gain (loss) | | | (235,689,804 | ) | | | (5,318,750 | ) |
| Total distributable (accumulated) earnings (losses) | | $ | (378,169,157 | ) | | $ | (8,227,042 | ) |
(1) The difference between book and tax-basis cost of investments was attributable primarily to the treatment of wash sales, PFIC adjustments and Grantor Trust adjustments.
Net capital losses and net investment losses incurred after December 31, and within the taxable year, are deemed to arise on the first business day of the Funds’ next taxable year. As of December 31, 2023, the Funds had no late year losses. As of December 31, 2023, there were short-term and long-term capital loss carryovers of the following, which do not expire:
| Fund | | Short-Term | | | Long-Term | |
| RPAR Risk Parity ETF | | $ | 108,709,254 | | | $ | 126,980,550 | |
| UPAR Ultra Risk Parity ETF | | | 3,129,323 | | | | 2,189,427 | |
U.S. Bank N.A. has made available to each Fund a credit facility pursuant to a Loan Agreement for temporary or extraordinary purposes. Credit facility details for the six months ended June 30, 2024 are as follows:
| Maximum available credit | | $ | 50,000,000 | |
| Largest amount outstanding on an individual day | | | — | |
| Average daily loan outstanding | | | — | |
| Credit facility outstanding as of June 30, 2024 | | | — | |
| Average interest rate, when in use | | | — | |
| Interest rate terms | | | Prime | |
| Interest rate as of June 30, 2024 | | | 8.50 | % |
| Expiration Date | | | June 26, 2025 | |
| Notes to the Financial Statements | RPAR ETFs |
June 30, 2024 (Unaudited)
Interest expense incurred for the six months ended June 30, 2024 is disclosed in the Statements of Operations, if applicable. The credit facility is an uncommitted, senior secured 364-day umbrella line of credit used for the benefit of certain funds in the Trust.
The maximum available credit is disclosed at the Trust level. Each Fund’s ability to borrow is therefore limited by borrowings of other funds within the Trust which are party to the agreement and to one-third of a Fund’s total assets.
| NOTE 9 – SHARE TRANSACTIONS |
Shares of the Funds are listed and traded on the Exchange. Market prices for the shares may be different from their NAV. The Funds issue and redeem shares on a continuous basis at NAV generally in large blocks of shares, called “Creation Units.” Creation Units are issued and redeemed principally in-kind for securities included in a specified universe. Once created, shares generally trade in the secondary market at market prices that change throughout the day. Except when aggregated in Creation Units, shares are not redeemable securities of the Funds. Creation Units may only be purchased or redeemed by Authorized Participants. An Authorized Participant is either (i) a broker-dealer or other participant in the clearing process through the Continuous Net Settlement System of the National Securities Clearing Corporation or (ii) a Depository Trust Company participant and, in each case, must have executed a Participant Agreement with the Distributor. Most retail investors do not qualify as Authorized Participants nor have the resources to buy and sell whole Creation Units. Therefore, they are unable to purchase or redeem the shares directly from the Funds. Rather, most retail investors may purchase shares in the secondary market with the assistance of a broker and are subject to customary brokerage commissions or fees.
Each Fund currently offers one class of shares, which has no front-end sales load, no deferred sales charge, and no redemption fee. A fixed transaction fee is imposed for the transfer and other transaction costs associated with the purchase or sale of Creation Units. The standard fixed transaction fee for the Funds is $750, payable to the Custodian. The fixed transaction fee may be waived on certain orders if the Funds’ Custodian has determined to waive some or all of the costs associated with the order or another party, such as the Adviser, has agreed to pay such fee. In addition, a variable fee may be charged on all cash transactions or substitutes for Creation Units and Redemption Units for the Funds of up to a maximum of 2% of the value of the Creation Units and Redemption Units, subject to the transaction. Variable fees are imposed to compensate the Funds for transaction costs associated with the cash transactions. Variable fees received by the Funds, if any, are disclosed in the capital shares transactions section of the Statements of Changes in Net Assets. The Funds may issue an unlimited number of shares of beneficial interest, with no par value. All shares of the Funds have equal rights and privileges.
| NOTE 10 – RECENT MARKET EVENTS |
U.S. international markets have experienced and may continue to experience significant periods of volatility in recent years and months due to a number of economic, political and global macro factors including rising inflation, uncertainty regarding central banks’ interest rate increases, the possibility of a national or global recession, trade tensions, political events, the war between Russia and Ukraine, significant conflict between Israel and Hamas in the Middle East, and the impact of COVID-19.The global recovery from COVID-19 may last for an extended period of time. As a result of continuing political tensions and armed conflicts, including the war between Ukraine and Russia, the U.S. and the European Union imposed sanctions on certain Russian individuals and companies, including certain financial institutions, and have limited certain exports and imports to and from Russia. The war has contributed to recent market volatility and may continue to do so. The Middle East conflict has led to significant loss of life, damaged infrastructure and escalated tensions both in the region and globally. These developments, as well as other events, could result in further market volatility and negatively affect financial asset prices, the liquidity of certain securities and the normal operations of securities exchanges and other markets, despite government efforts to address market disruptions. As a result, the risk environment remains elevated.
| NOTE 11 – SUBSEQUENT EVENTS |
In preparing these financial statements, the Funds have evaluated events and transactions for potential recognition or disclosure through the date the financial statements were issued. The Funds have determined that there are no subsequent events that would need to be disclosed in the Funds’ financial statements.
Item 8. Changes in and Disagreements with Accountants for Open-End Management Investment Companies | RPAR ETFs |
An open-end management investment company registered on Form N-1A [17 CFR 239.15A and 17 CFR 274.11A] must disclose the information concerning changes in and disagreements with accountants and on accounting and financial disclosure required by Item 304 of Regulation S-K [17 CFR 229.304].
Response: There have been no changes in or disagreements with the Funds’ accountants.
Item 9. Proxy Disclosures for Open-End Management Investment Companies | RPAR ETFs |
If any matter was submitted during the period covered by the report to a vote of shareholders of an open-end management investment company registered on Form N-1A [17 CFR 239.15A and 17 CFR 274.11A], through the solicitation of proxies or otherwise, the company must furnish the following information:
(1) The date of the meeting and whether it was an annual or special meeting.
(2) If the meeting involved the election of directors, the name of each director elected at the meeting and the name of each other director whose term of office as a director continued after the meeting.
(3) A brief description of each matter voted upon at the meeting and the number of votes cast for, against or withheld, as well as the number of abstentions and broker non-votes as to each such matter, including a separate tabulation with respect to each matter or nominee for office.
Response: There were no matters submitted to a vote of shareholders during the period covered by the report.
Item 10. Remuneration Paid to Directors, Officers, and Others of Open-End Management Investment Companies | RPAR ETFs |
Unless the following information is disclosed as part of the financial statements included in Item 7, an open-end management investment company registered on Form N-1A [17 CFR 239.15A and 17 CFR 274.11A] must disclose the aggregate remuneration paid by the company during the period covered by the report to:
(1) All directors and all members of any advisory board for regular compensation;
(2) Each director and each member of an advisory board for special compensation;
(3) All officers; and
(4) Each person of whom any officer or director of the Fund is an affiliated person
Response: See Item 7(a).
| (b) | Financial Highlights are included within the financial statements filed under Item 7(a) of this Form. |
Item 8. Changes in and Disagreements with Accountants for Open-End Investment Companies.
See Item 7(a).
There were no changes in or disagreements with accountants during the period covered by this report.
Item 9. Proxy Disclosure for Open-End Investment Companies.
There were no matters submitted to a vote of shareholders during the period covered by this report.
Item 10. Remuneration Paid to Directors, Officers, and Others of Open-End Investment Companies.
The aggregate remuneration paid to the Registrant’s trustees, officers and others, if any, is included in Item 7 of this report.
Item 11. Statement Regarding Basis for Approval of Investment Advisory Contract.
See Item 7(a).
Item 12. Disclosure of Proxy Voting Policies and Procedures for Closed-End Management Investment Companies.
Not applicable to open-end investment companies.
Item 13. Portfolio Managers of Closed-End Management Investment Companies.
Not applicable to open-end investment companies.
Item 14. Purchases of Equity Securities by Closed-End Management Investment Company and Affiliated Purchasers.
Not applicable to open-end investment companies.
Item 15. Submission of Matters to a Vote of Security Holders.
Not Applicable.
Item 16. Controls and Procedures.
| (a) | The Registrant’s President/Principal Executive Officer and Treasurer/Principal Financial Officer have reviewed the Registrant's disclosure controls and procedures (as defined in Rule 30a-3(c) under the Investment Company Act of 1940 (the “Act”)) as of a date within 90 days of the filing of this report, as required by Rule 30a-3(b) under the Act and Rules 13a-15(b) or 15d-15(b) under the Securities Exchange Act of 1934. Based on their review, such officers have concluded that the disclosure controls and procedures are effective in ensuring that information required to be disclosed in this report is appropriately recorded, processed, summarized and reported and made known to them by others within the Registrant and by the Registrant’s service provider. |
| (b) | There were no changes in the Registrant's internal control over financial reporting (as defined in Rule 30a-3(d) under the Act) that occurred during the period covered by this report that have materially affected, or are reasonably likely to materially affect, the Registrant's internal control over financial reporting. |
Item 17. Disclosure of Securities Lending Activities for Closed-End Management Investment Companies.
Not applicable to open-end investment companies.
Item 18. Recovery of Erroneously Awarded Compensation.
(a) Not Applicable.
(b) Not Applicable.
Item 19. Exhibits.
| (a) | (1) Any code of ethics or amendment thereto, that is the subject of the disclosure required by Item 2, to the extent that the registrant intends to satisfy Item 2 requirements through filing an exhibit. Not Applicable. |
(2) Any policy required by the listing standards adopted pursuant to Rule 10D-1 under the Exchange Act (17 CFR 240.10D-1) by the registered national securities exchange or registered national securities association upon which the registrant’s securities are listed. Filed herewith.
(3) A separate certification for each principal executive officer and principal financial officer pursuant to Section 302 of the Sarbanes-Oxley Act of 2002. Filed herewith.
(4) Any written solicitation to purchase securities under Rule 23c-1 under the Act sent or given during the period covered by the report by or on behalf of the registrant to 10 or more persons. Not applicable.
(5) Change in the registrant’s independent public accountant. Provide the information called for by Item 4 of Form 8-K under the Exchange Act (17 CFR 249.308). Unless otherwise specified by Item 4, or related to and necessary for a complete understanding of information not previously disclosed, the information should relate to events occurring during the reporting period. Not applicable.
SIGNATURES
Pursuant to the requirements of the Securities Exchange Act of 1934 and the Investment Company Act of 1940, the registrant has duly caused this report to be signed on its behalf by the undersigned, thereunto duly authorized.
| (Registrant) | Tidal ETF Trust |
| By (Signature and Title)* | /s/ Eric W. Falkeis |
| | Eric W. Falkeis, President/Principal Executive Officer |
Pursuant to the requirements of the Securities Exchange Act of 1934 and the Investment Company Act of 1940, this report has been signed below by the following persons on behalf of the registrant and in the capacities and on the dates indicated.
| By (Signature and Title)* | /s/ Eric W. Falkeis |
| | Eric W. Falkeis, President/Principal Executive Officer |
| By (Signature and Title)* | /s/ Aaron J. Perkovich |
| | Aaron J. Perkovich, Treasurer/Principal Financial Officer |
* Print the name and title of each signing officer under his or her signature.