Corporate Presentation Restoring Balance. Renewing Life. January 2025 Exhibit 99.3
Safe Harbor and Legal Disclaimers This presentation may contain “forward-looking statements” of Akero Therapeutics, Inc. (“we,” “us,” “our,” “Akero” or the “Company”) within the meaning of the Private Securities Litigation Reform Act of 1995 relating to our business, operations, and financial conditions, including but not limited to current express or implied beliefs, expectations and assumptions regarding: the future of our business; future plans and strategies, including our expectations around the therapeutic potential and clinical benefits of Efruxifermin (“EFX”), including in combination with GLP-1 receptor agonist therapies; our development plans for EFX, including our belief in the unique potential of EFX as a foundational metabolic dysfunction-associated steatohepatitis (“MASH”) therapy; our preclinical and clinical results, including our safety/tolerability, laboratory measures and histology data from our Phase 2b HARMONY study, Phase 2b SYMMETRY study, the Cohort D expansion of our Phase 2b SYMMETRY study, and the week 96 results of the SYMMETRY study, which are preliminary topline results that are subject to audit and verification procedures and additional data that could result in material changes in the final data; the potential benefits resulting from the PRIME, Breakthrough Therapy and Fast Track designations of EFX; the SYNCHRONY Phase 3 program, including the SYNCHRONY Histology, SYNCHRONY Real-World, and SYNCHRONY Outcomes studies, their respective trial designs and expected timing to report results for the respective primary endpoints; the availability of a new drug product formulation to support Phase 3 clinical trials; risks related to the competitive landscape; the timing and potential benefits of our regulatory interactions; and our use of capital, expenses and other future financial results, including the expected cash, cash equivalents and short-term marketable securities as of December 31, 2024, and cash runway. Words such as, but not limited to, “look forward to,” “believe,” “expect,” “anticipate,” “estimate,” “intend,” “plan,” “would,” “should” and “could,” and similar expressions or words, identify forward-looking statements. New risks and uncertainties may emerge from time to time, and it is not possible to predict all risks and uncertainties. Except as required by law, we assume no obligation to update these forward-looking statements publicly, or to update the reasons actual results could differ materially from those anticipated in the forward-looking statements, even if new information becomes available in the future. For a discussion of these and other risks and uncertainties, and other important factors, any of which could cause our actual results to differ from those contained in the forward-looking statements, see the section entitled “Risk Factors” in our most recent annual report on Form 10-K and quarterly report on Form 10-Q filed with the Securities and Exchange Commission (the “SEC”), as well as discussions of potential risks, uncertainties, and other important factors in our other subsequent filings with the SEC. All information in this presentation is as of the date hereof, and we undertake no duty to update this information unless required by law. Certain information contained in this presentation relates to or is based on studies, publications, surveys and other data obtained from third-party sources and the Company’s own internal estimates and research. While the Company believes these third-party sources to be reliable as of the date of this presentation, it has not independently verified, and makes no representation as to the adequacy, fairness, accuracy or completeness of, any information obtained from third-party sources. In addition, all of the market data included in this presentation involves a number of assumptions and limitations, and there can be no guarantee as to the accuracy or reliability of such assumptions. Finally, while we believe our own internal research is reliable, such research has not been verified by any independent source. ©2025 AKERO THERAPEUTICS.
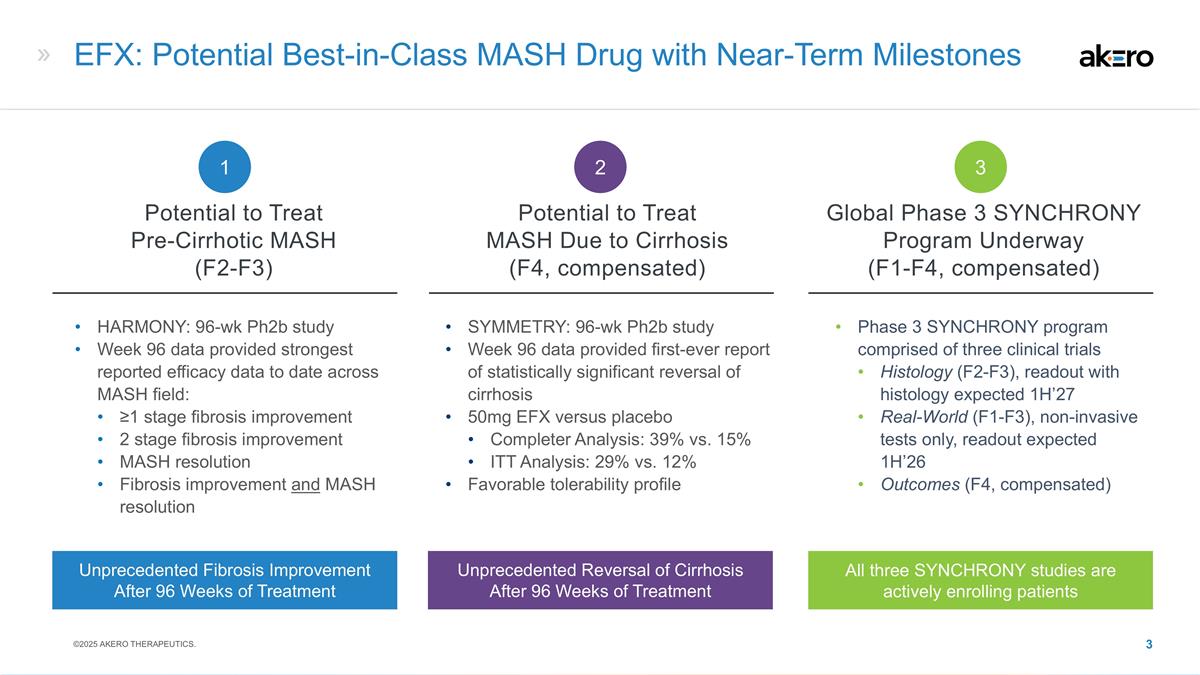
HARMONY: 96-wk Ph2b study Week 96 data provided strongest reported efficacy data to date across MASH field: ≥1 stage fibrosis improvement 2 stage fibrosis improvement MASH resolution Fibrosis improvement and MASH resolution SYMMETRY: 96-wk Ph2b study Week 96 data provided first-ever report of statistically significant reversal of cirrhosis 50mg EFX versus placebo Completer Analysis: 39% vs. 15% ITT Analysis: 29% vs. 12% Favorable tolerability profile EFX: Potential Best-in-Class MASH Drug with Near-Term Milestones Phase 3 SYNCHRONY program comprised of three clinical trials Histology (F2-F3), readout with histology expected 1H’27 Real-World (F1-F3), non-invasive tests only, readout expected 1H’26 Outcomes (F4, compensated) Potential to Treat Pre-Cirrhotic MASH (F2-F3) Potential to Treat MASH Due to Cirrhosis (F4, compensated) Global Phase 3 SYNCHRONY Program Underway (F1-F4, compensated) 1 2 3 Unprecedented Reversal of Cirrhosis After 96 Weeks of Treatment All three SYNCHRONY studies are actively enrolling patients Unprecedented Fibrosis Improvement After 96 Weeks of Treatment ©2025 AKERO THERAPEUTICS.
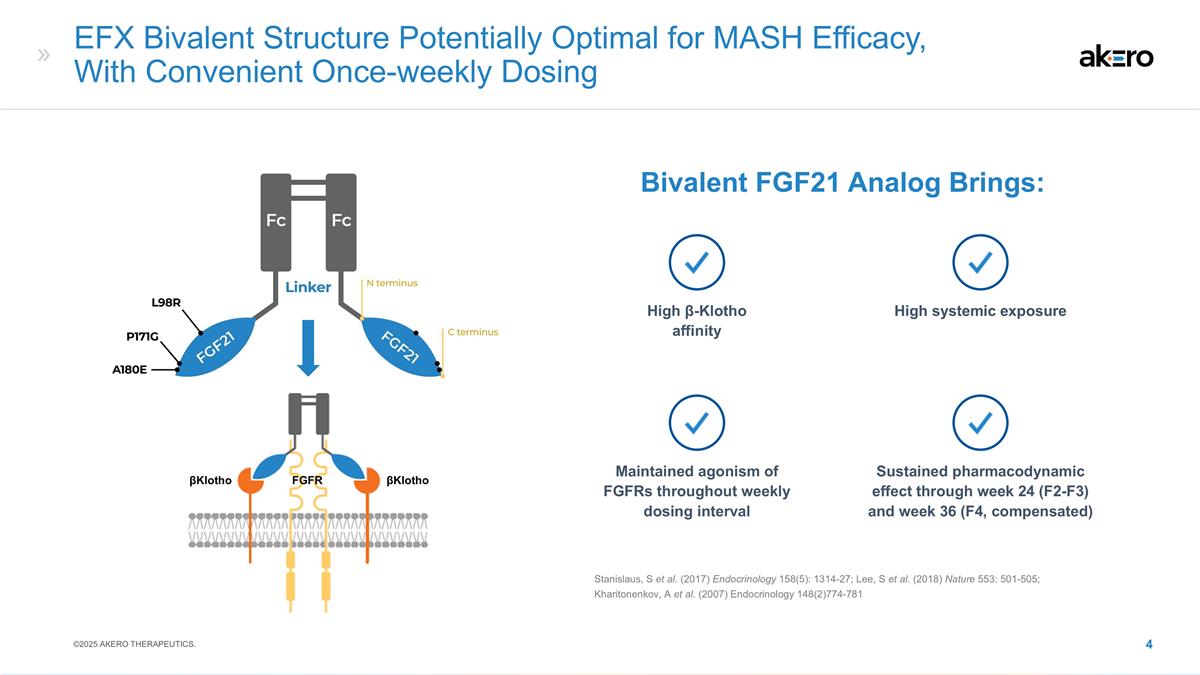
EFX Bivalent Structure Potentially Optimal for MASH Efficacy, With Convenient Once-weekly Dosing Bivalent FGF21 Analog Brings: Stanislaus, S et al. (2017) Endocrinology 158(5): 1314-27; Lee, S et al. (2018) Nature 553: 501-505; Kharitonenkov, A et al. (2007) Endocrinology 148(2)774-781 High β-Klotho affinity High systemic exposure Maintained agonism of FGFRs throughout weekly dosing interval Sustained pharmacodynamic effect through week 24 (F2-F3) and week 36 (F4, compensated) βKlotho FGFR βKlotho ©2025 AKERO THERAPEUTICS.
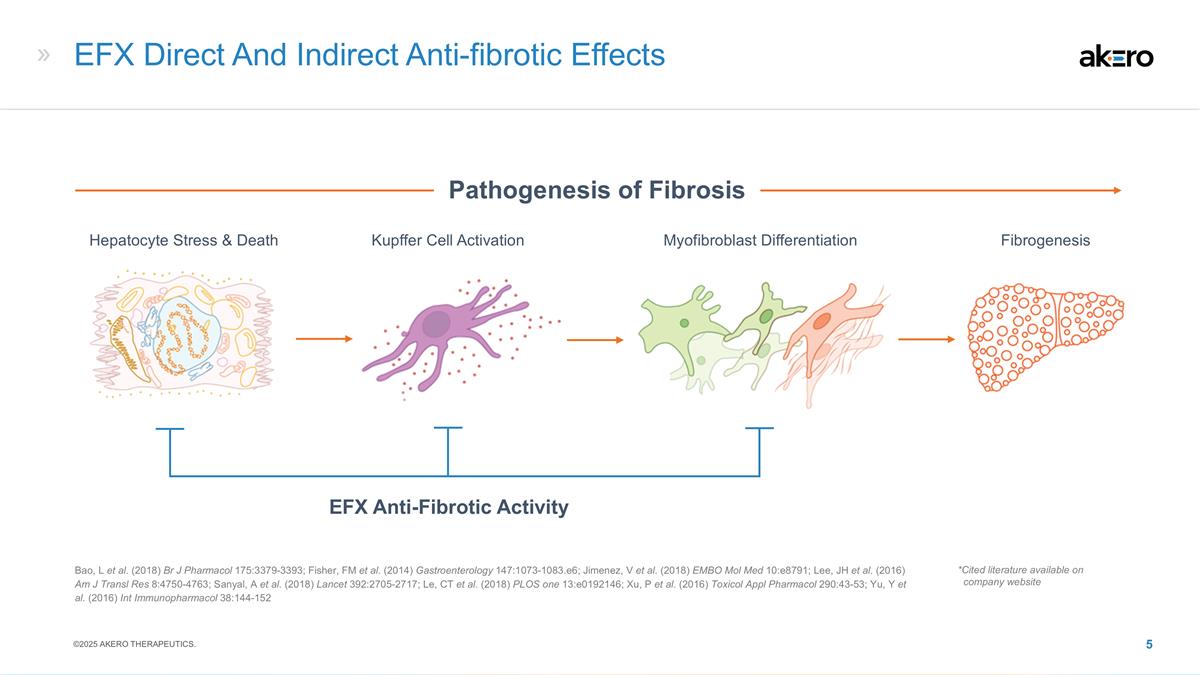
EFX Direct And Indirect Anti-fibrotic Effects EFX Anti-Fibrotic Activity Hepatocyte Stress & Death Myofibroblast Differentiation Kupffer Cell Activation Fibrogenesis Pathogenesis of Fibrosis Bao, L et al. (2018) Br J Pharmacol 175:3379-3393; Fisher, FM et al. (2014) Gastroenterology 147:1073-1083.e6; Jimenez, V et al. (2018) EMBO Mol Med 10:e8791; Lee, JH et al. (2016) Am J Transl Res 8:4750-4763; Sanyal, A et al. (2018) Lancet 392:2705-2717; Le, CT et al. (2018) PLOS one 13:e0192146; Xu, P et al. (2016) Toxicol Appl Pharmacol 290:43-53; Yu, Y et al. (2016) Int Immunopharmacol 38:144-152 *Cited literature available on company website ©2025 AKERO THERAPEUTICS.
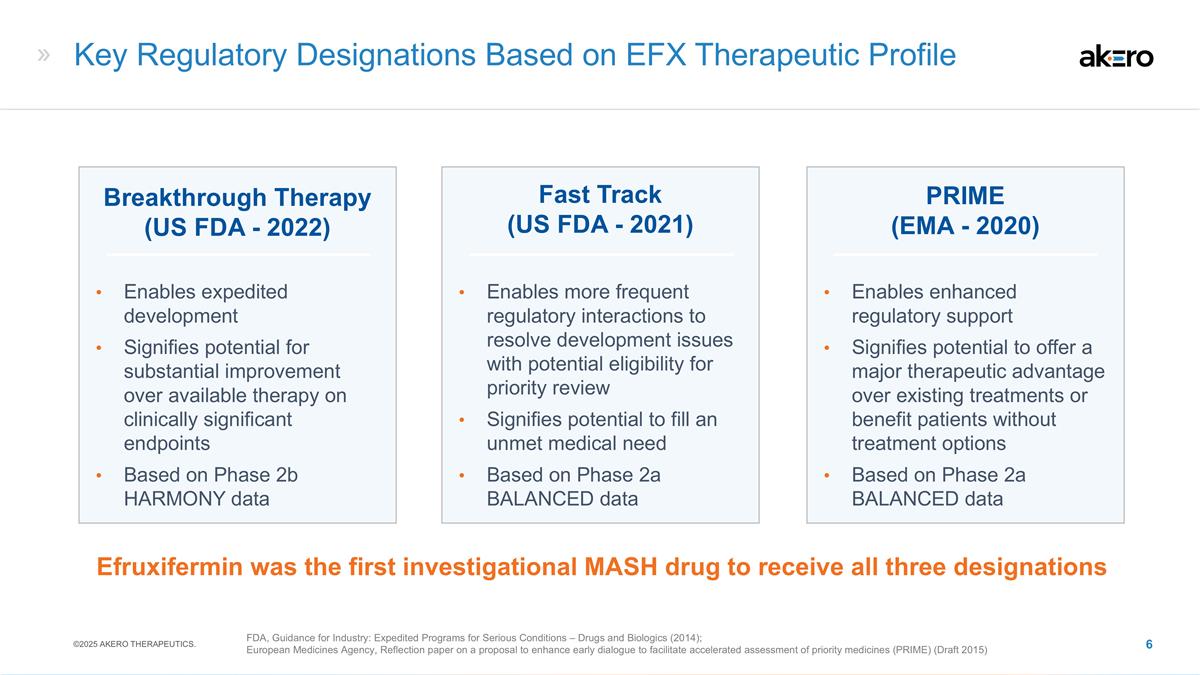
Key Regulatory Designations Based on EFX Therapeutic Profile Fast Track (US FDA - 2021) Breakthrough Therapy (US FDA - 2022) Enables expedited development Signifies potential for substantial improvement over available therapy on clinically significant endpoints Based on Phase 2b HARMONY data PRIME (EMA - 2020) Enables more frequent regulatory interactions to resolve development issues with potential eligibility for priority review Signifies potential to fill an unmet medical need Based on Phase 2a BALANCED data Enables enhanced regulatory support Signifies potential to offer a major therapeutic advantage over existing treatments or benefit patients without treatment options Based on Phase 2a BALANCED data Efruxifermin was the first investigational MASH drug to receive all three designations FDA, Guidance for Industry: Expedited Programs for Serious Conditions – Drugs and Biologics (2014); European Medicines Agency, Reflection paper on a proposal to enhance early dialogue to facilitate accelerated assessment of priority medicines (PRIME) (Draft 2015) ©2025 AKERO THERAPEUTICS.
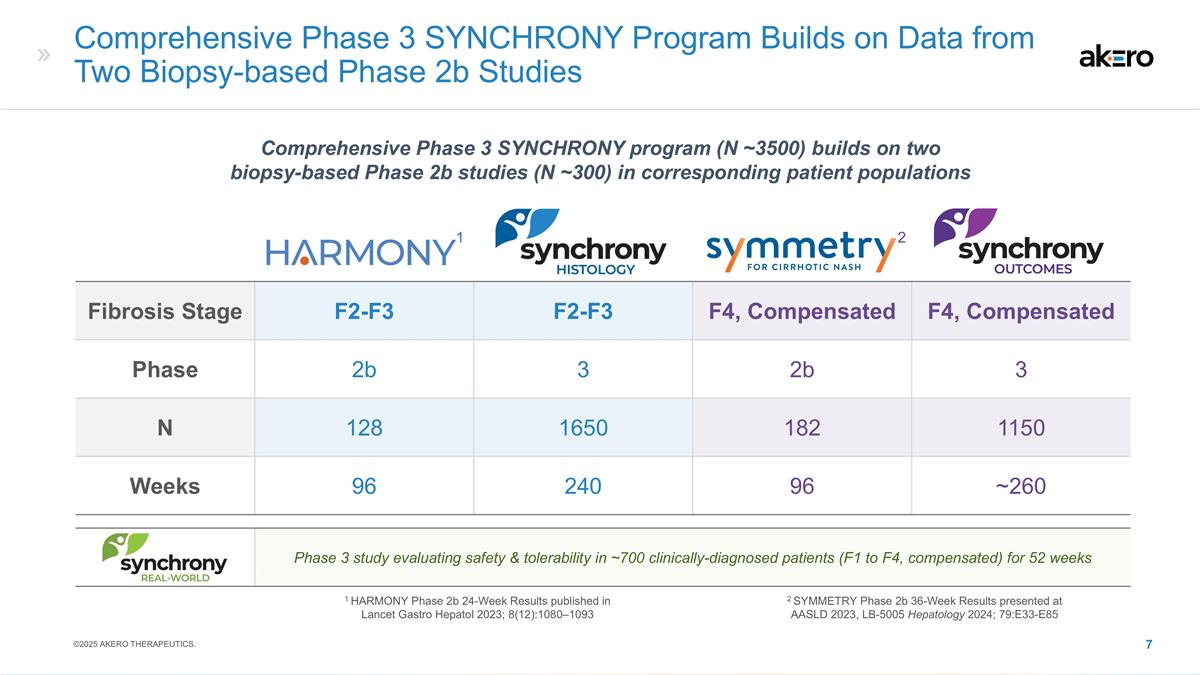
Fibrosis Stage F2-F3 F2-F3 F4, Compensated F4, Compensated Phase 2b 3 2b 3 N 128 1650 182 1150 Weeks 96 240 96 ~260 Phase 3 study evaluating safety & tolerability in ~700 clinically-diagnosed patients (F1 to F4, compensated) for 52 weeks Comprehensive Phase 3 SYNCHRONY Program Builds on Data from Two Biopsy-based Phase 2b Studies 1 HARMONY Phase 2b 24-Week Results published in Lancet Gastro Hepatol 2023; 8(12):1080–1093 Comprehensive Phase 3 SYNCHRONY program (N ~3500) builds on two biopsy-based Phase 2b studies (N ~300) in corresponding patient populations 1 2 2 SYMMETRY Phase 2b 36-Week Results presented at AASLD 2023, LB-5005 Hepatology 2024; 79:E33-E85 ©2025 AKERO THERAPEUTICS.
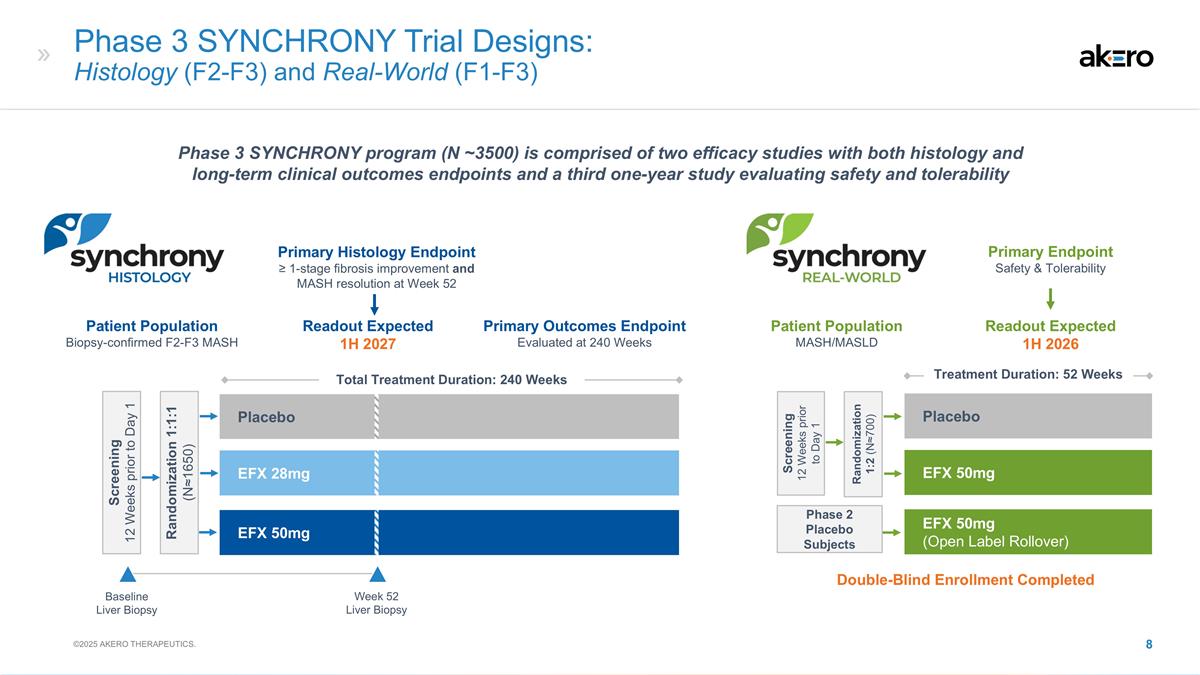
Phase 3 SYNCHRONY Trial Designs: Histology (F2-F3) and Real-World (F1-F3) Baseline Liver Biopsy Screening 12 Weeks prior to Day 1 Randomization 1:1:1 (N≈1650) EFX 28mg Placebo Total Treatment Duration: 240 Weeks EFX 50mg EFX 50mg Placebo EFX 50mg (Open Label Rollover) Primary Endpoint Safety & Tolerability Screening 12 Weeks prior to Day 1 Randomization 1:2 (N≈700) Week 52 Liver Biopsy Phase 2 Placebo Subjects Treatment Duration: 52 Weeks Patient Population Biopsy-confirmed F2-F3 MASH Patient Population MASH/MASLD Primary Histology Endpoint ≥ 1-stage fibrosis improvement and MASH resolution at Week 52 Primary Outcomes Endpoint Evaluated at 240 Weeks Readout Expected 1H 2027 Readout Expected 1H 2026 Phase 3 SYNCHRONY program (N ~3500) is comprised of two efficacy studies with both histology and long-term clinical outcomes endpoints and a third one-year study evaluating safety and tolerability ©2025 AKERO THERAPEUTICS. Double-Blind Enrollment Completed
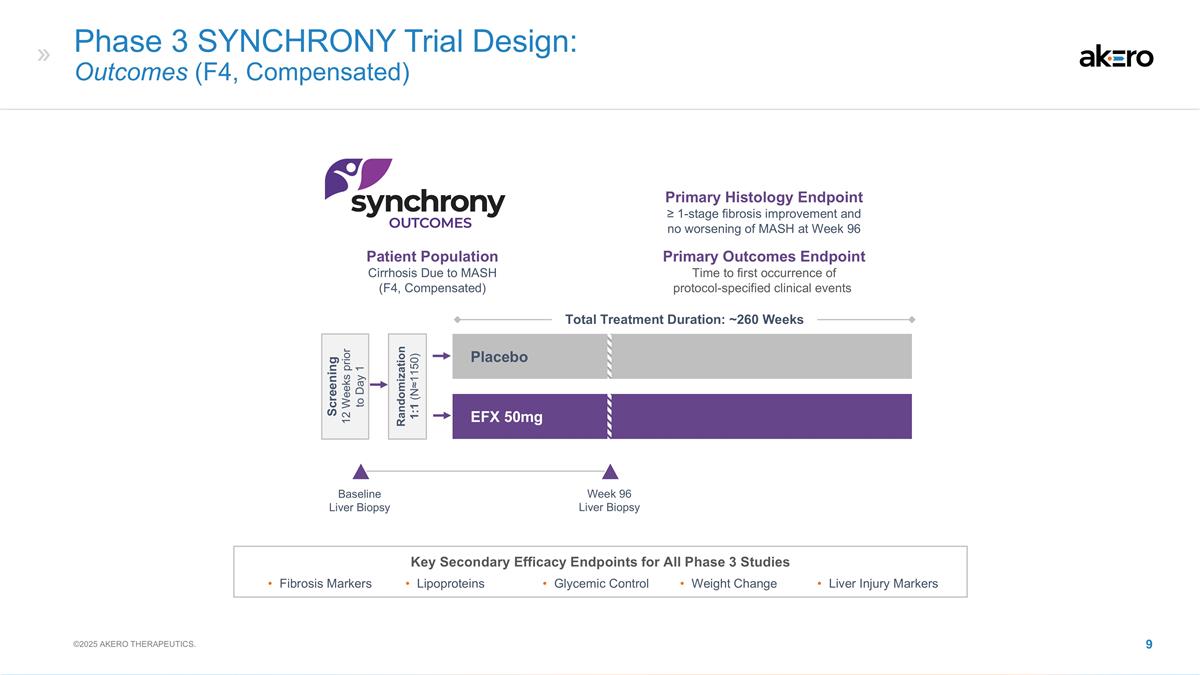
Phase 3 SYNCHRONY Trial Design: Outcomes (F4, Compensated) Key Secondary Efficacy Endpoints for All Phase 3 Studies Fibrosis Markers Lipoproteins Glycemic Control Weight Change Liver Injury Markers Baseline Liver Biopsy EFX 50mg Placebo Total Treatment Duration: ~260 Weeks Week 96 Liver Biopsy Patient Population Cirrhosis Due to MASH (F4, Compensated) Primary Histology Endpoint ≥ 1-stage fibrosis improvement and no worsening of MASH at Week 96 Primary Outcomes Endpoint Time to first occurrence of protocol-specified clinical events Screening 12 Weeks prior to Day 1 Randomization 1:1 (N≈1150) ©2025 AKERO THERAPEUTICS.
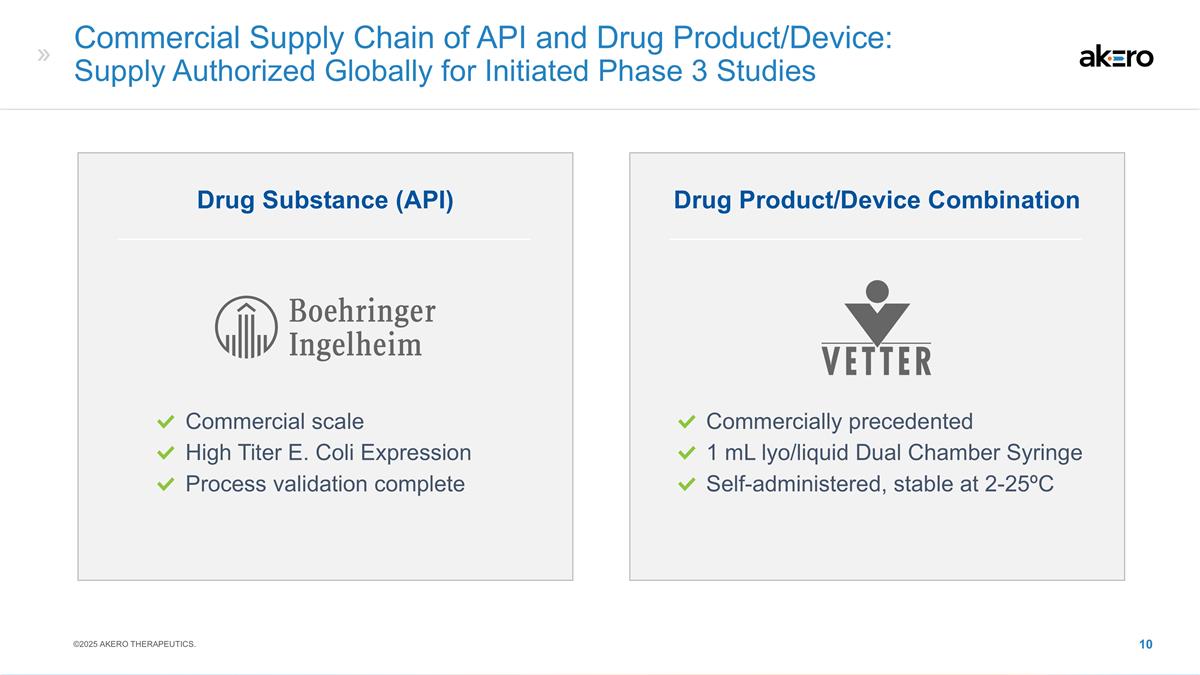
Commercial Supply Chain of API and Drug Product/Device: Supply Authorized Globally for Initiated Phase 3 Studies Drug Product/Device Combination Drug Substance (API) Commercial scale High Titer E. Coli Expression Process validation complete Commercially precedented 1 mL lyo/liquid Dual Chamber Syringe Self-administered, stable at 2-25ºC ©2025 AKERO THERAPEUTICS.
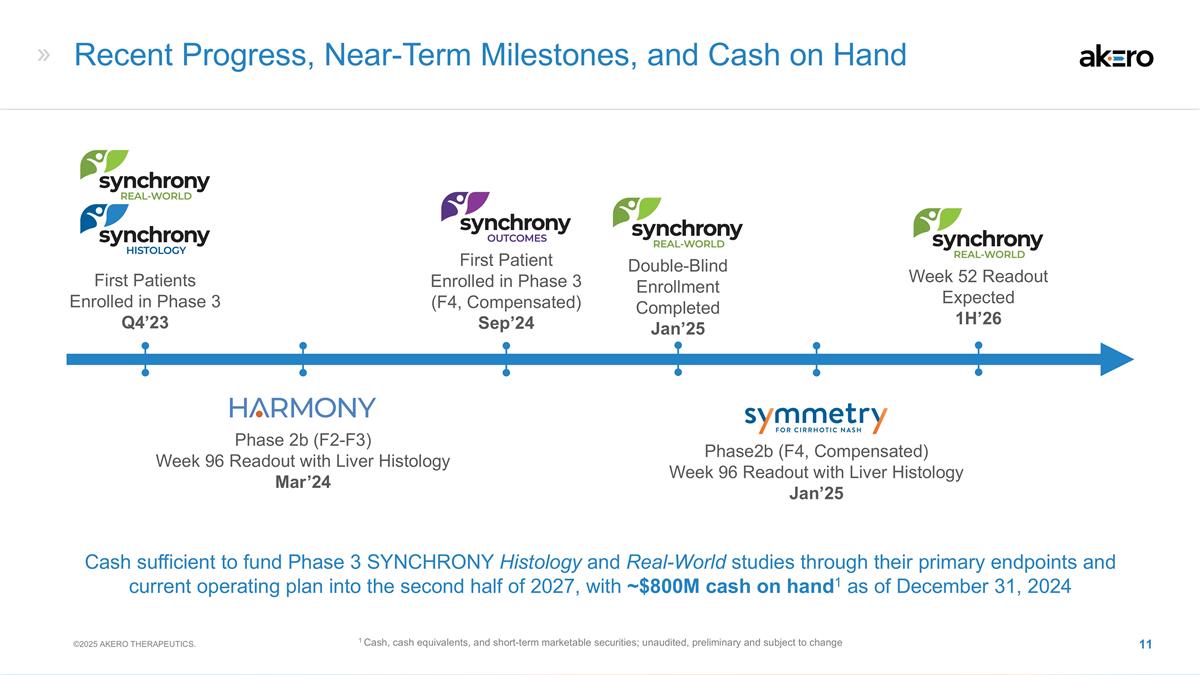
Recent Progress, Near-Term Milestones, and Cash on Hand First Patients Enrolled in Phase 3 Q4’23 Phase 2b (F2-F3) Week 96 Readout with Liver Histology Mar’24 Phase2b (F4, Compensated) Week 96 Readout with Liver Histology Jan’25 First Patient Enrolled in Phase 3 (F4, Compensated) Sep’24 Cash sufficient to fund Phase 3 SYNCHRONY Histology and Real-World studies through their primary endpoints and current operating plan into the second half of 2027, with ~$800M cash on hand1 as of December 31, 2024 1 Cash, cash equivalents, and short-term marketable securities; unaudited, preliminary and subject to change ©2025 AKERO THERAPEUTICS. Double-Blind Enrollment Completed Jan’25 Week 52 Readout Expected 1H’26
EFX: Treatment of Compensated Cirrhosis (F4) Due to MASH Statistically Significant Reversal of Cirrhosis after 96 Weeks ©2025 AKERO THERAPEUTICS.
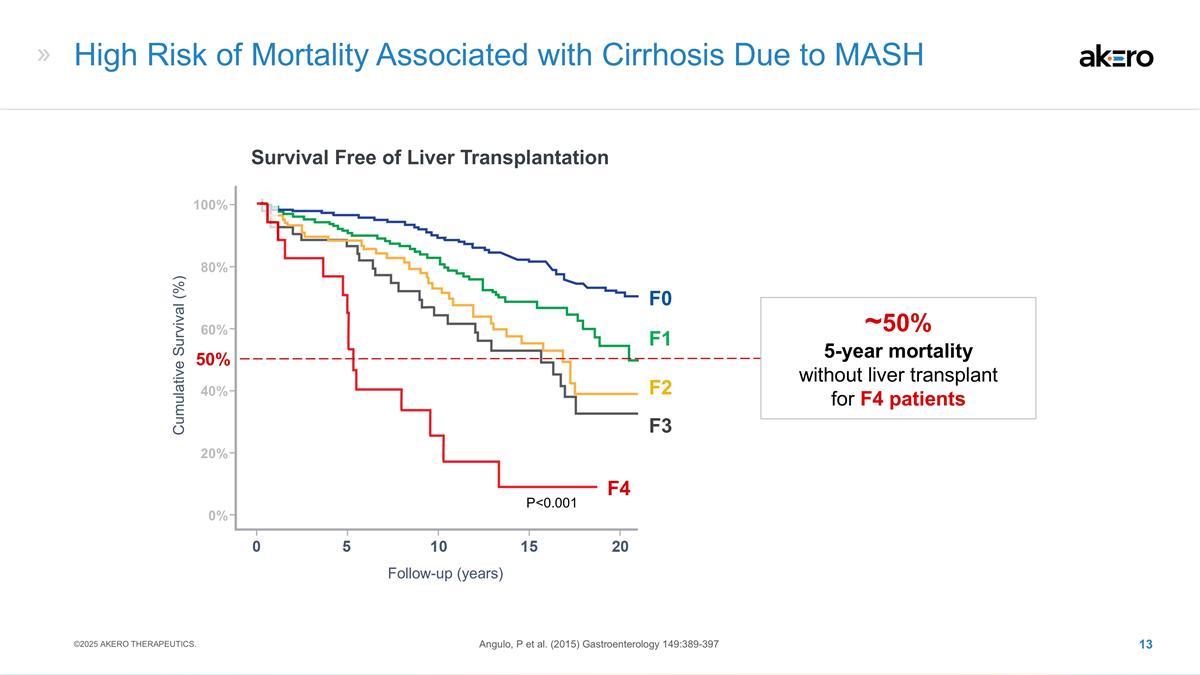
High Risk of Mortality Associated with Cirrhosis Due to MASH Survival Free of Liver Transplantation Follow-up (years) Cumulative Survival (%) Angulo, P et al. (2015) Gastroenterology 149:389-397 P<0.001 F4 50% ~50% 5-year mortality without liver transplant for F4 patients 40% 20% 0% 100% 80% 60% ©2025 AKERO THERAPEUTICS. F3 F2 F1 F0
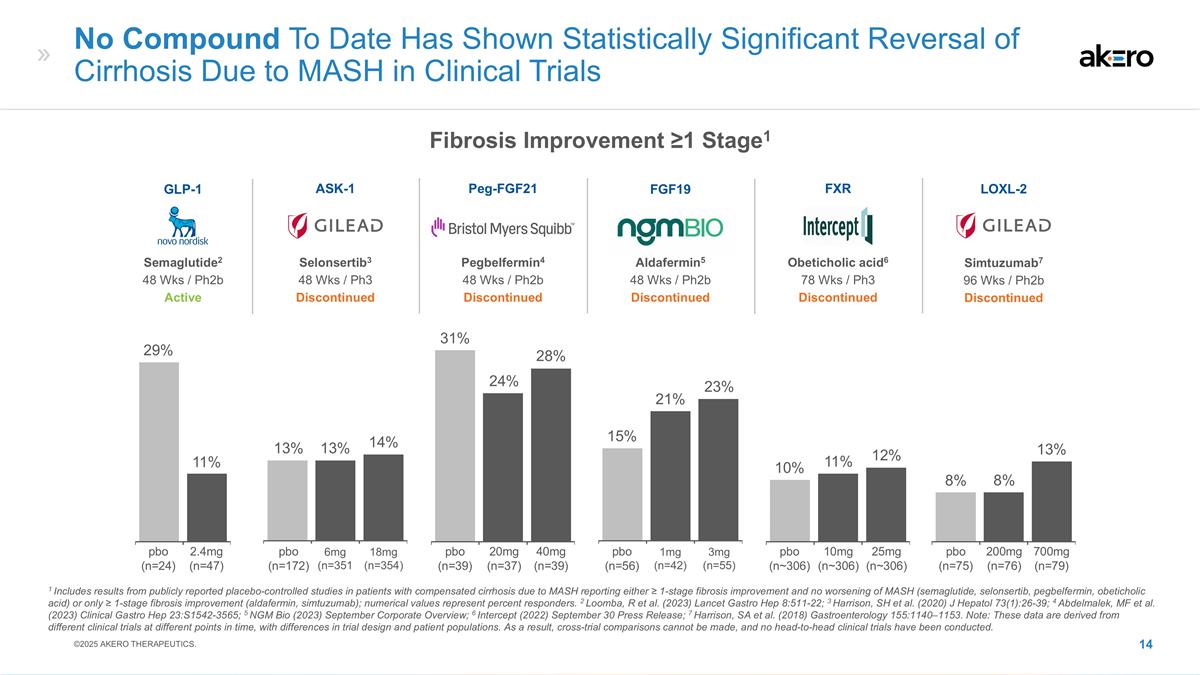
1mg (n=42) 3mg (n=55) 21% 15% No Compound To Date Has Shown Statistically Significant Reversal of Cirrhosis Due to MASH in Clinical Trials 6mg (n=351 18mg (n=354) 20mg (n=37) 40mg (n=39) 14% 13% 31% 24% 25mg (n~306) 10mg (n~306) 10% 12% 2.4mg (n=47) 11% 200mg (n=76) 700mg (n=79) 8% 8% Aldafermin5 48 Wks / Ph2b Discontinued FGF19 Selonsertib3 48 Wks / Ph3 Discontinued ASK-1 Peg-FGF21 Pegbelfermin4 48 Wks / Ph2b Discontinued FXR Obeticholic acid6 78 Wks / Ph3 Discontinued Semaglutide2 48 Wks / Ph2b Active GLP-1 Simtuzumab7 96 Wks / Ph2b Discontinued LOXL-2 1 Includes results from publicly reported placebo-controlled studies in patients with compensated cirrhosis due to MASH reporting either ≥ 1-stage fibrosis improvement and no worsening of MASH (semaglutide, selonsertib, pegbelfermin, obeticholic acid) or only ≥ 1-stage fibrosis improvement (aldafermin, simtuzumab); numerical values represent percent responders. 2 Loomba, R et al. (2023) Lancet Gastro Hep 8:511-22; 3 Harrison, SH et al. (2020) J Hepatol 73(1):26-39; 4 Abdelmalek, MF et al. (2023) Clinical Gastro Hep 23:S1542-3565; 5 NGM Bio (2023) September Corporate Overview; 6 Intercept (2022) September 30 Press Release; 7 Harrison, SA et al. (2018) Gastroenterology 155:1140–1153. Note: These data are derived from different clinical trials at different points in time, with differences in trial design and patient populations. As a result, cross-trial comparisons cannot be made, and no head-to-head clinical trials have been conducted. 29% 13% 28% 23% 11% 13% pbo (n=24) pbo (n=172) pbo (n=39) pbo (n=56) pbo (n~306) pbo (n=75) ©2025 AKERO THERAPEUTICS. Fibrosis Improvement ≥1 Stage1
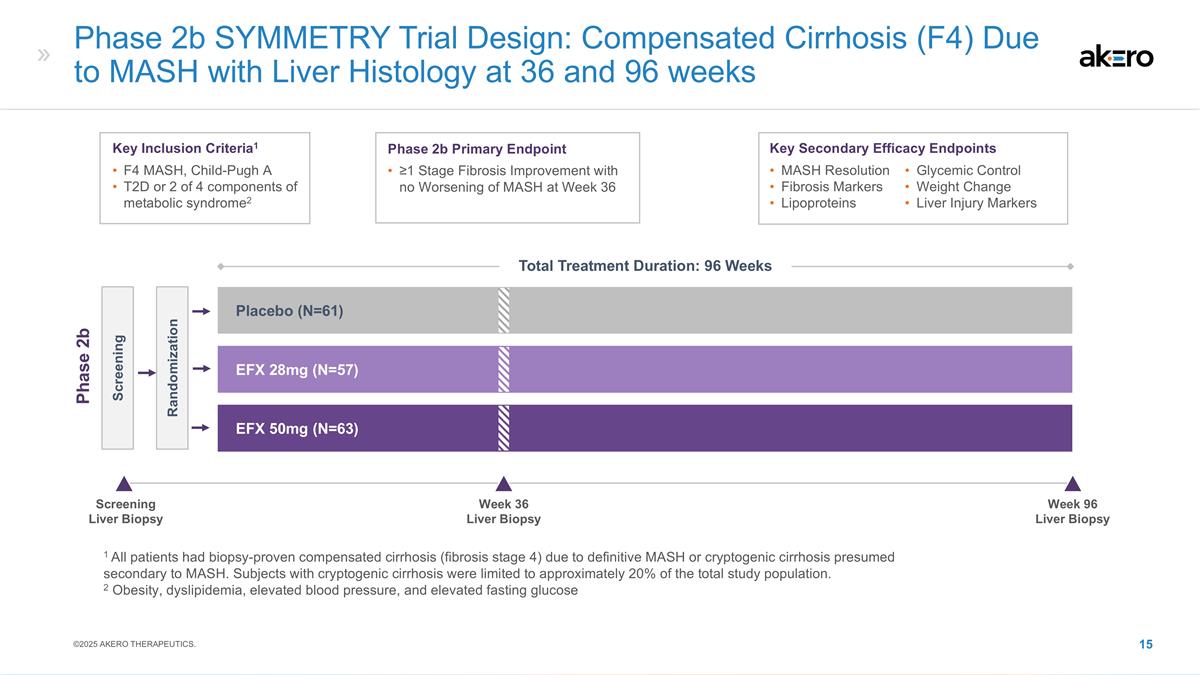
Phase 2b SYMMETRY Trial Design: Compensated Cirrhosis (F4) Due to MASH with Liver Histology at 36 and 96 weeks EFX 28mg (N=57) Placebo (N=61) EFX 50mg (N=63) Screening Randomization Phase 2b Key Inclusion Criteria1 F4 MASH, Child-Pugh A T2D or 2 of 4 components of metabolic syndrome2 Phase 2b Primary Endpoint ≥1 Stage Fibrosis Improvement with no Worsening of MASH at Week 36 Key Secondary Efficacy Endpoints MASH Resolution Fibrosis Markers Lipoproteins Glycemic Control Weight Change Liver Injury Markers 1 All patients had biopsy-proven compensated cirrhosis (fibrosis stage 4) due to definitive MASH or cryptogenic cirrhosis presumed secondary to MASH. Subjects with cryptogenic cirrhosis were limited to approximately 20% of the total study population. 2 Obesity, dyslipidemia, elevated blood pressure, and elevated fasting glucose Screening Liver Biopsy Week 36 Liver Biopsy Week 96 Liver Biopsy ©2025 AKERO THERAPEUTICS. Total Treatment Duration: 96 Weeks
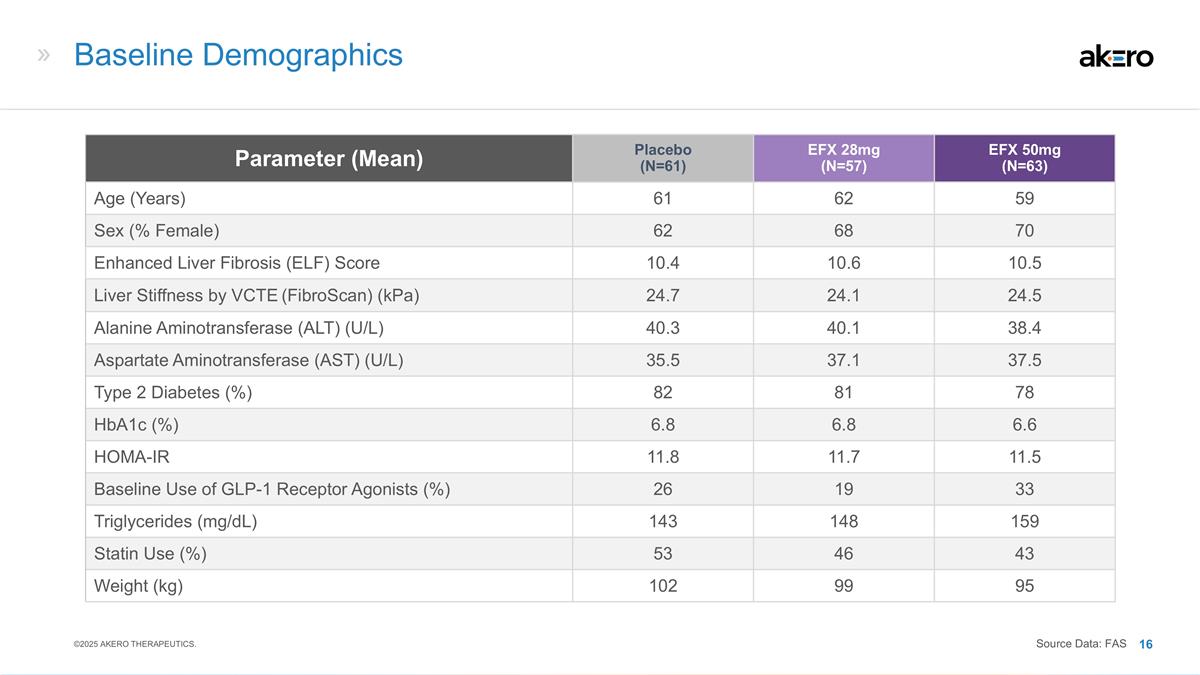
Baseline Demographics Parameter (Mean) Placebo (N=61) EFX 28mg (N=57) EFX 50mg (N=63) Age (Years) 61 62 59 Sex (% Female) 62 68 70 Enhanced Liver Fibrosis (ELF) Score 10.4 10.6 10.5 Liver Stiffness by VCTE (FibroScan) (kPa) 24.7 24.1 24.5 Alanine Aminotransferase (ALT) (U/L) 40.3 40.1 38.4 Aspartate Aminotransferase (AST) (U/L) 35.5 37.1 37.5 Type 2 Diabetes (%) 82 81 78 HbA1c (%) 6.8 6.8 6.6 HOMA-IR 11.8 11.7 11.5 Baseline Use of GLP-1 Receptor Agonists (%) 26 19 33 Triglycerides (mg/dL) 143 148 159 Statin Use (%) 53 46 43 Weight (kg) 102 99 95 ©2025 AKERO THERAPEUTICS. Source Data: FAS
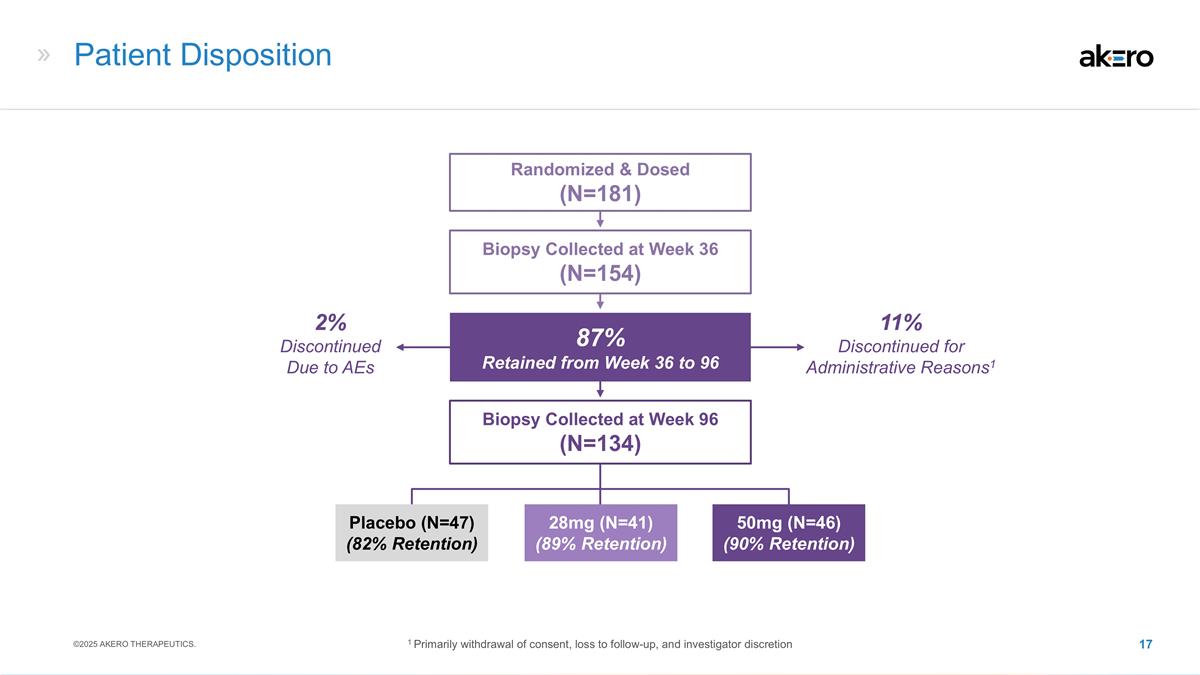
11% Discontinued for Administrative Reasons1 Patient Disposition 28mg (N=41) (89% Retention) 50mg (N=46) (90% Retention) Placebo (N=47) (82% Retention) Biopsy Collected at Week 36 (N=154) Randomized & Dosed (N=181) Biopsy Collected at Week 96 (N=134) 87% Retained from Week 36 to 96 2% Discontinued Due to AEs ©2025 AKERO THERAPEUTICS. 1 Primarily withdrawal of consent, loss to follow-up, and investigator discretion
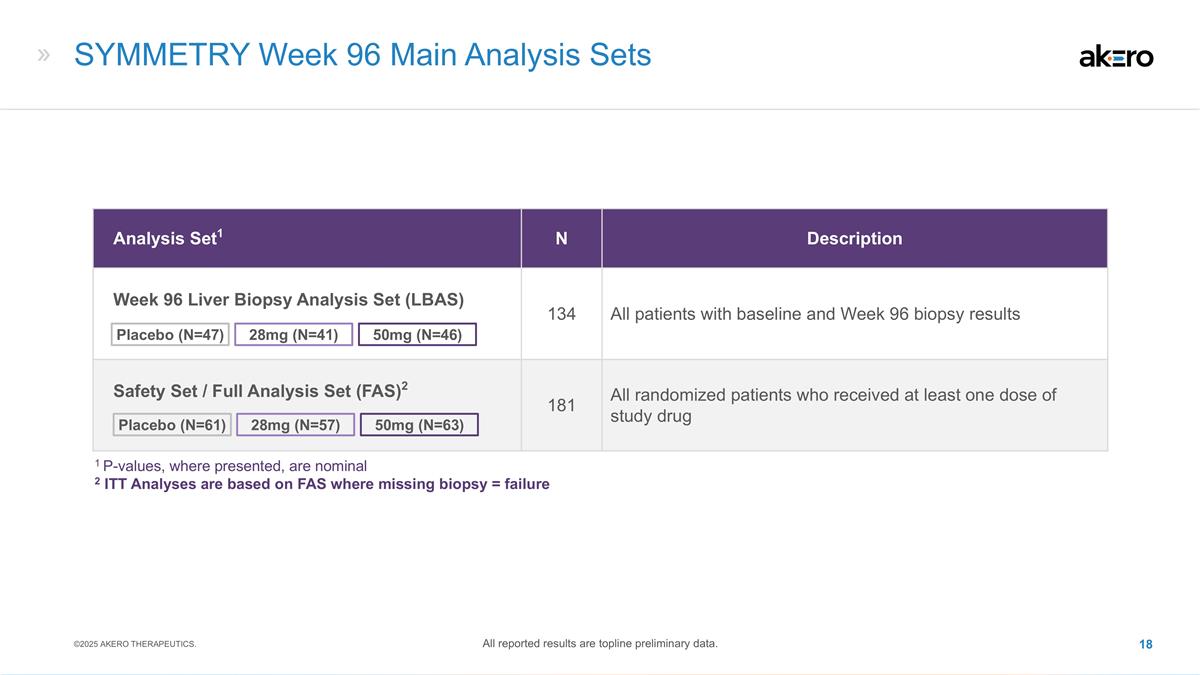
SYMMETRY Week 96 Main Analysis Sets Analysis Set1 N Description Week 96 Liver Biopsy Analysis Set (LBAS) 134 All patients with baseline and Week 96 biopsy results Safety Set / Full Analysis Set (FAS)2 181 All randomized patients who received at least one dose of study drug 28mg (N=41) 50mg (N=46) Placebo (N=47) 50mg (N=63) 28mg (N=57) Placebo (N=61) 1 P-values, where presented, are nominal 2 ITT Analyses are based on FAS where missing biopsy = failure ©2025 AKERO THERAPEUTICS. All reported results are topline preliminary data.
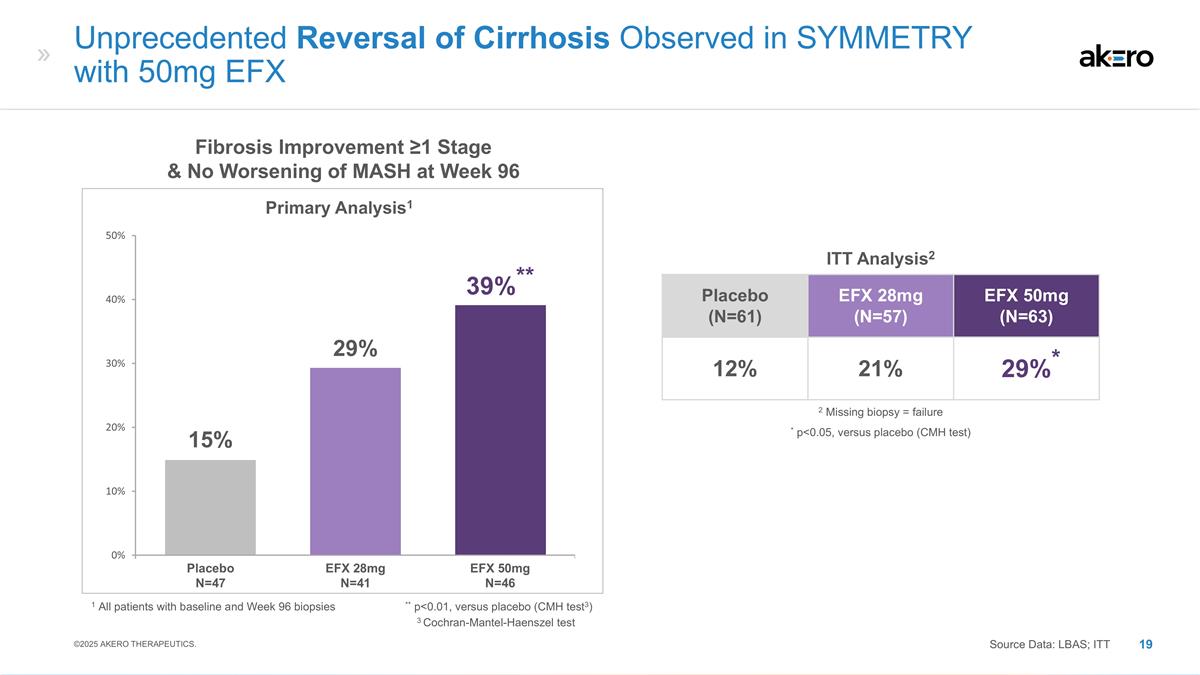
Placebo (N=61) EFX 28mg (N=57) EFX 50mg (N=63) 12% 21% *29%* EFX 28mg N=41 EFX 50mg N=46 Placebo N=47 Fibrosis Improvement ≥1 Stage & No Worsening of MASH at Week 96 Primary Analysis1 1 All patients with baseline and Week 96 biopsies ** p<0.01, versus placebo (CMH test3) 39%** 29% 15% Unprecedented Reversal of Cirrhosis Observed in SYMMETRY with 50mg EFX ITT Analysis2 * p<0.05, versus placebo (CMH test) 2 Missing biopsy = failure Source Data: LBAS; ITT ©2025 AKERO THERAPEUTICS. 3 Cochran-Mantel-Haenszel test
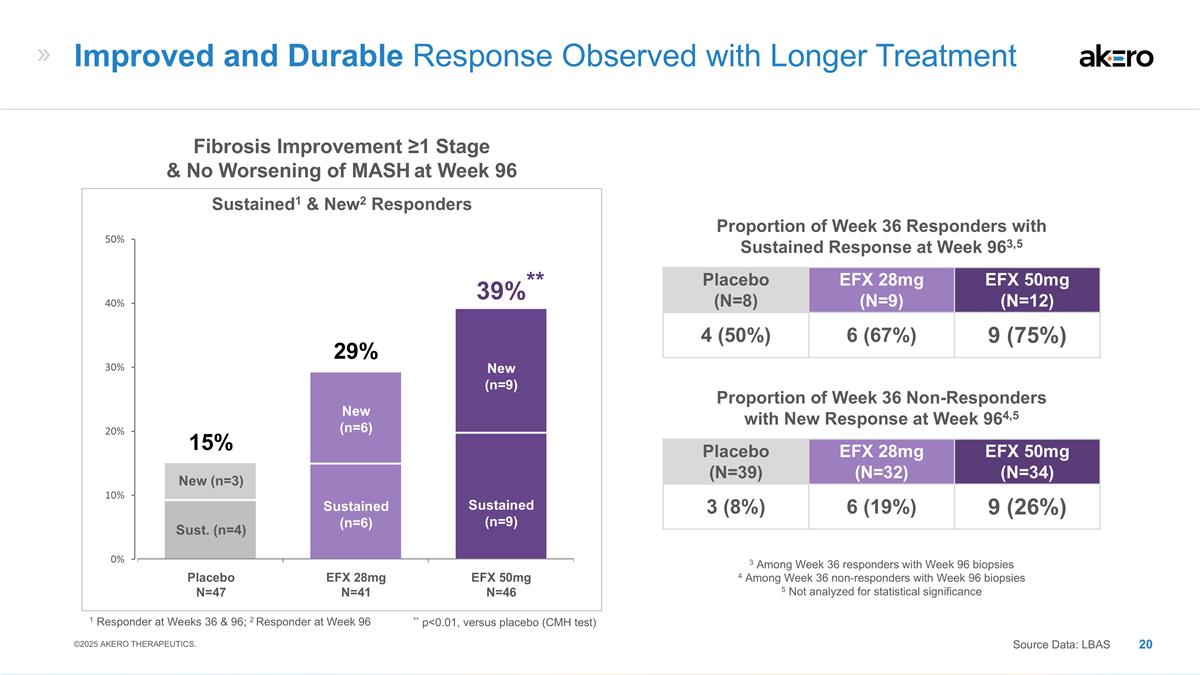
Sustained (n=6) New (n=6) Sustained (n=9) New (n=9) Sust. (n=4) New (n=3) **39%** EFX 28mg N=41 EFX 50mg N=46 Placebo N=47 29% 15% Fibrosis Improvement ≥1 Stage & No Worsening of MASH at Week 96 Sustained1 & New2 Responders Placebo (N=8) EFX 28mg (N=9) EFX 50mg (N=12) 4 (50%) 6 (67%) 9 (75%) Proportion of Week 36 Responders with Sustained Response at Week 963,5 Placebo (N=39) EFX 28mg (N=32) EFX 50mg (N=34) 3 (8%) 6 (19%) 9 (26%) Proportion of Week 36 Non-Responders with New Response at Week 964,5 3 Among Week 36 responders with Week 96 biopsies 4 Among Week 36 non-responders with Week 96 biopsies 5 Not analyzed for statistical significance Improved and Durable Response Observed with Longer Treatment Source Data: LBAS ©2025 AKERO THERAPEUTICS. 1 Responder at Weeks 36 & 96; 2 Responder at Week 96 ** p<0.01, versus placebo (CMH test)
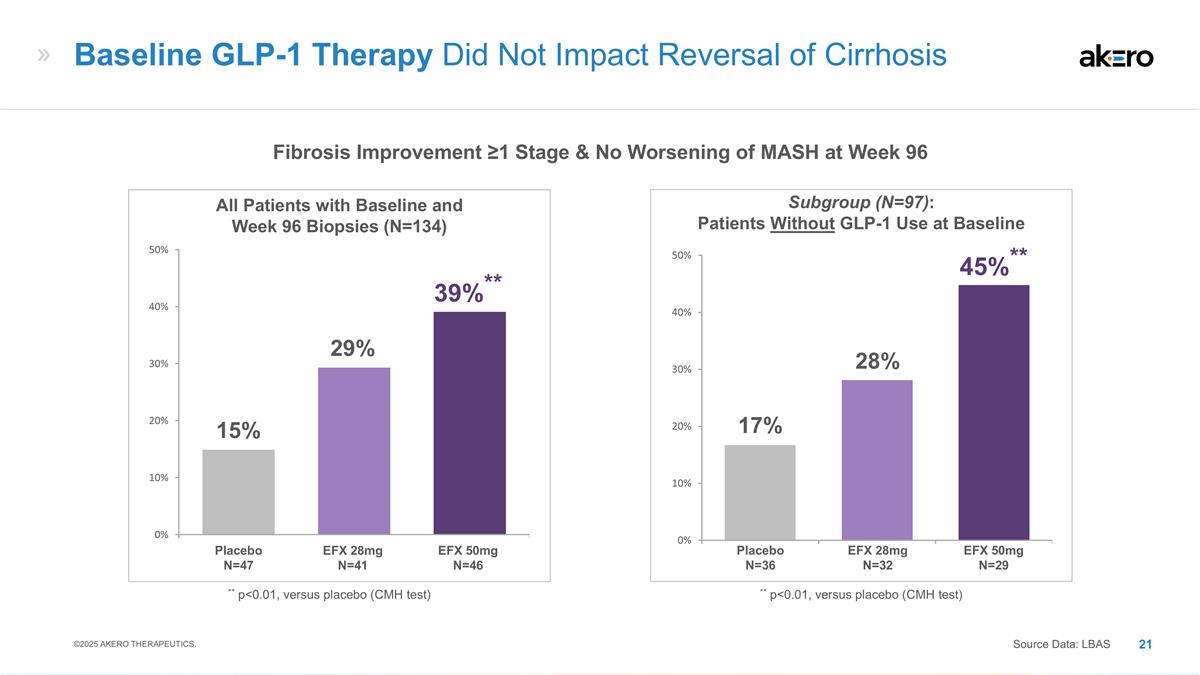
EFX 28mg N=32 EFX 50mg N=29 Placebo N=36 45%** 28% 17% Subgroup (N=97): Patients Without GLP-1 Use at Baseline EFX 28mg N=41 EFX 50mg N=46 Placebo N=47 ** p<0.01, versus placebo (CMH test) 39%** 29% 15% All Patients with Baseline and Week 96 Biopsies (N=134) Baseline GLP-1 Therapy Did Not Impact Reversal of Cirrhosis Source Data: LBAS ** p<0.01, versus placebo (CMH test) Fibrosis Improvement ≥1 Stage & No Worsening of MASH at Week 96 ©2025 AKERO THERAPEUTICS.
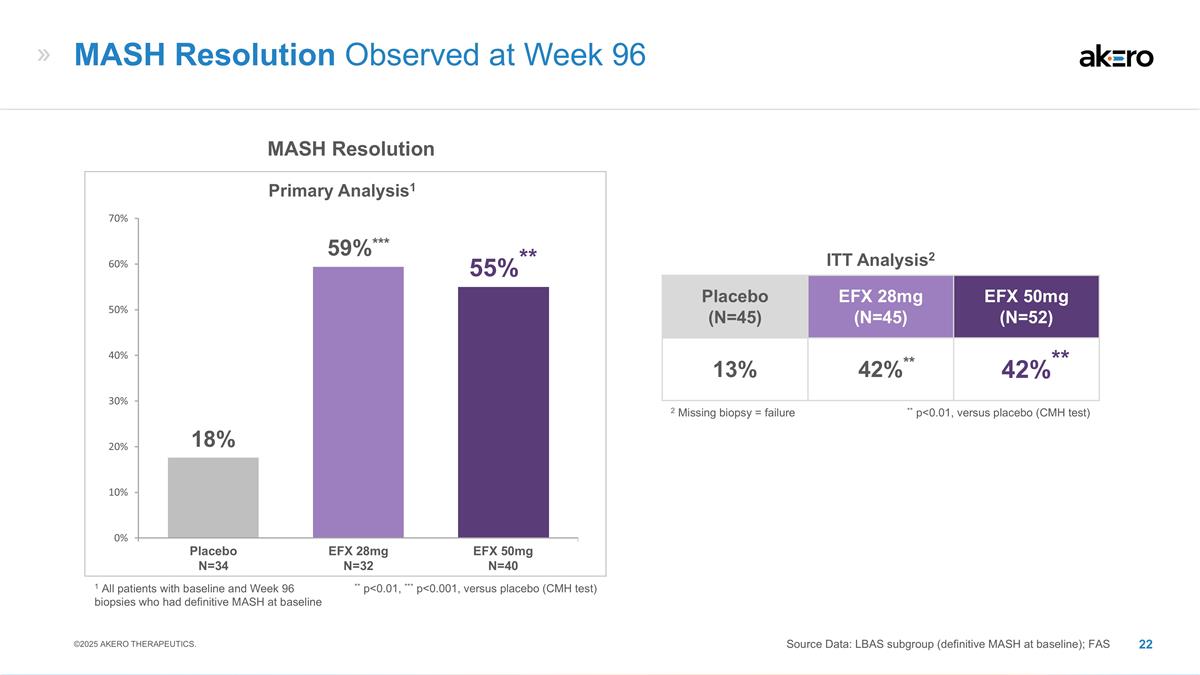
EFX 28mg N=32 EFX 50mg N=40 Placebo N=34 MASH Resolution Primary Analysis1 ** p<0.01, *** p<0.001, versus placebo (CMH test) 55%** 59%*** 18% MASH Resolution Observed at Week 96 Source Data: LBAS subgroup (definitive MASH at baseline); FAS ©2025 AKERO THERAPEUTICS. Placebo (N=45) EFX 28mg (N=45) EFX 50mg (N=52) 13% **42%** **42%** ITT Analysis2 ** p<0.01, versus placebo (CMH test) 2 Missing biopsy = failure 1 All patients with baseline and Week 96 biopsies who had definitive MASH at baseline
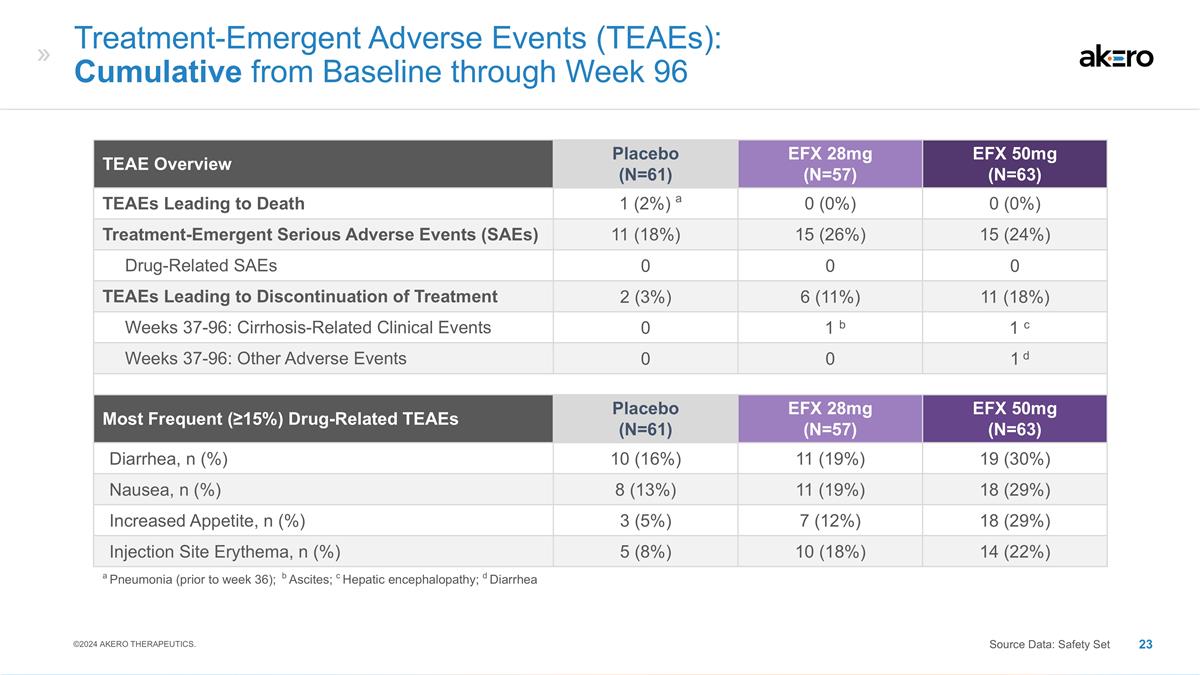
Treatment-Emergent Adverse Events (TEAEs): Cumulative from Baseline through Week 96 TEAE Overview Placebo (N=61) EFX 28mg (N=57) EFX 50mg (N=63) TEAEs Leading to Death a 1 (2%) a 0 (0%) 0 (0%) Treatment-Emergent Serious Adverse Events (SAEs) 11 (18%) 15 (26%) 15 (24%) Drug-Related SAEs 0 0 0 TEAEs Leading to Discontinuation of Treatment 2 (3%) 6 (11%) 11 (18%) Weeks 37-96: Cirrhosis-Related Clinical Events 0 b 1 b c 1 c Weeks 37-96: Other Adverse Events 0 0 d 1 d Most Frequent (≥15%) Drug-Related TEAEs Placebo (N=61) EFX 28mg (N=57) EFX 50mg (N=63) Diarrhea, n (%) 10 (16%) 11 (19%) 19 (30%) Nausea, n (%) 8 (13%) 11 (19%) 18 (29%) Increased Appetite, n (%) 3 (5%) 7 (12%) 18 (29%) Injection Site Erythema, n (%) 5 (8%) 10 (18%) 14 (22%) a Pneumonia (prior to week 36); b Ascites; c Hepatic encephalopathy; d Diarrhea ©2024 AKERO THERAPEUTICS. Source Data: Safety Set
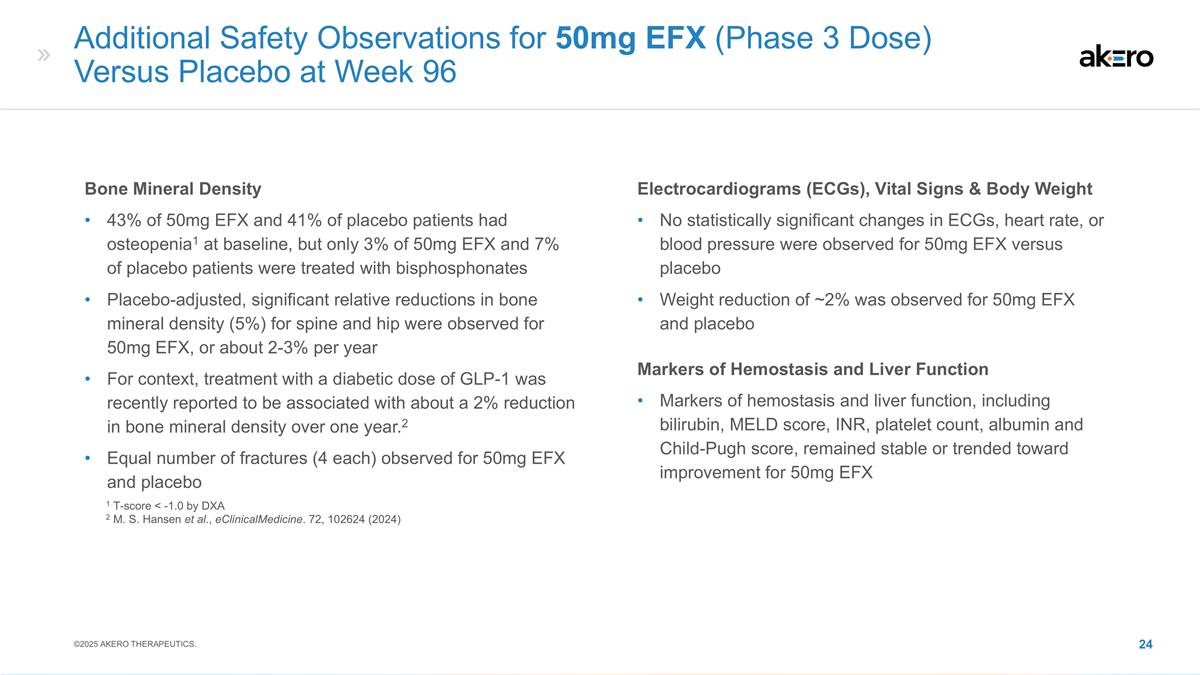
Additional Safety Observations for 50mg EFX (Phase 3 Dose) Versus Placebo at Week 96 Bone Mineral Density 43% of 50mg EFX and 41% of placebo patients had osteopenia1 at baseline, but only 3% of 50mg EFX and 7% of placebo patients were treated with bisphosphonates Placebo-adjusted, significant relative reductions in bone mineral density (5%) for spine and hip were observed for 50mg EFX, or about 2-3% per year For context, treatment with a diabetic dose of GLP-1 was recently reported to be associated with about a 2% reduction in bone mineral density over one year.2 Equal number of fractures (4 each) observed for 50mg EFX and placebo Markers of Hemostasis and Liver Function Markers of hemostasis and liver function, including bilirubin, MELD score, INR, platelet count, albumin and Child-Pugh score, remained stable or trended toward improvement for 50mg EFX Electrocardiograms (ECGs), Vital Signs & Body Weight No statistically significant changes in ECGs, heart rate, or blood pressure were observed for 50mg EFX versus placebo Weight reduction of ~2% was observed for 50mg EFX and placebo ©2025 AKERO THERAPEUTICS. 1 T-score < -1.0 by DXA 2 M. S. Hansen et al., eClinicalMedicine. 72, 102624 (2024)
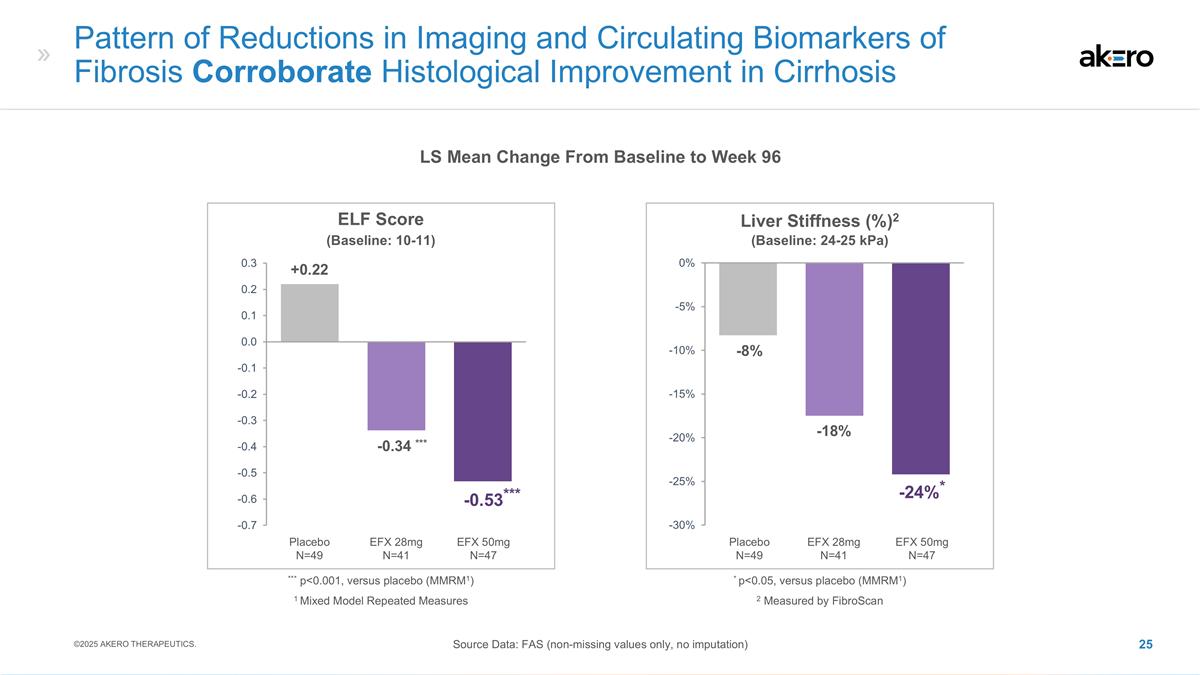
Pattern of Reductions in Imaging and Circulating Biomarkers of Fibrosis Corroborate Histological Improvement in Cirrhosis LS Mean Change From Baseline to Week 96 Source Data: FAS (non-missing values only, no imputation) ©2025 AKERO THERAPEUTICS. Liver Stiffness (%)2 -18% -8% EFX 50mg N=47 Placebo N=49 EFX 28mg N=41 -24%* 2 Measured by FibroScan * p<0.05, versus placebo (MMRM1) (Baseline: 24-25 kPa) ELF Score EFX 50mg N=47 Placebo N=49 EFX 28mg N=41 ***-0.34 *** +0.22 ***-0.53*** *** p<0.001, versus placebo (MMRM1) (Baseline: 10-11) 1 Mixed Model Repeated Measures
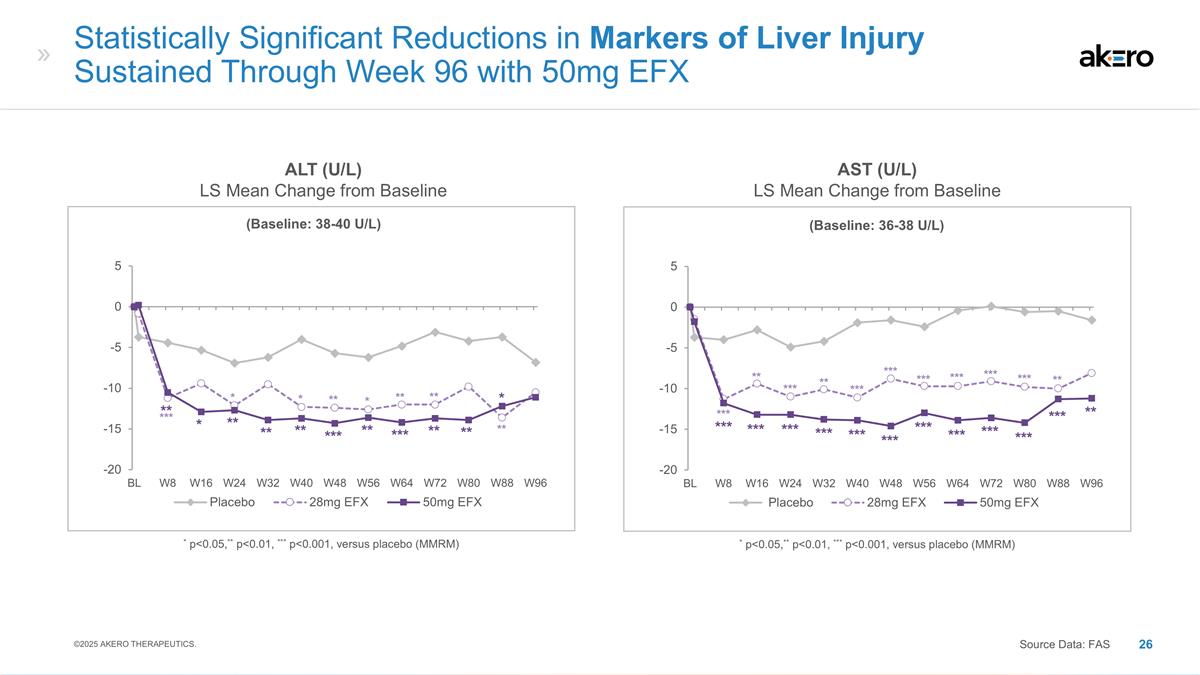
(Baseline: 38-40 U/L) * p<0.05,** p<0.01, *** p<0.001, versus placebo (MMRM) Statistically Significant Reductions in Markers of Liver Injury Sustained Through Week 96 with 50mg EFX ALT (U/L) LS Mean Change from Baseline AST (U/L) LS Mean Change from Baseline *** * * ** * ** ** ** ** * ** ** ** *** ** *** ** ** * ©2025 AKERO THERAPEUTICS. Source Data: FAS (Baseline: 36-38 U/L) * p<0.05,** p<0.01, *** p<0.001, versus placebo (MMRM) *** *** *** *** *** *** *** *** *** *** *** ** ** ** *** *** *** *** *** ** *** *** ***
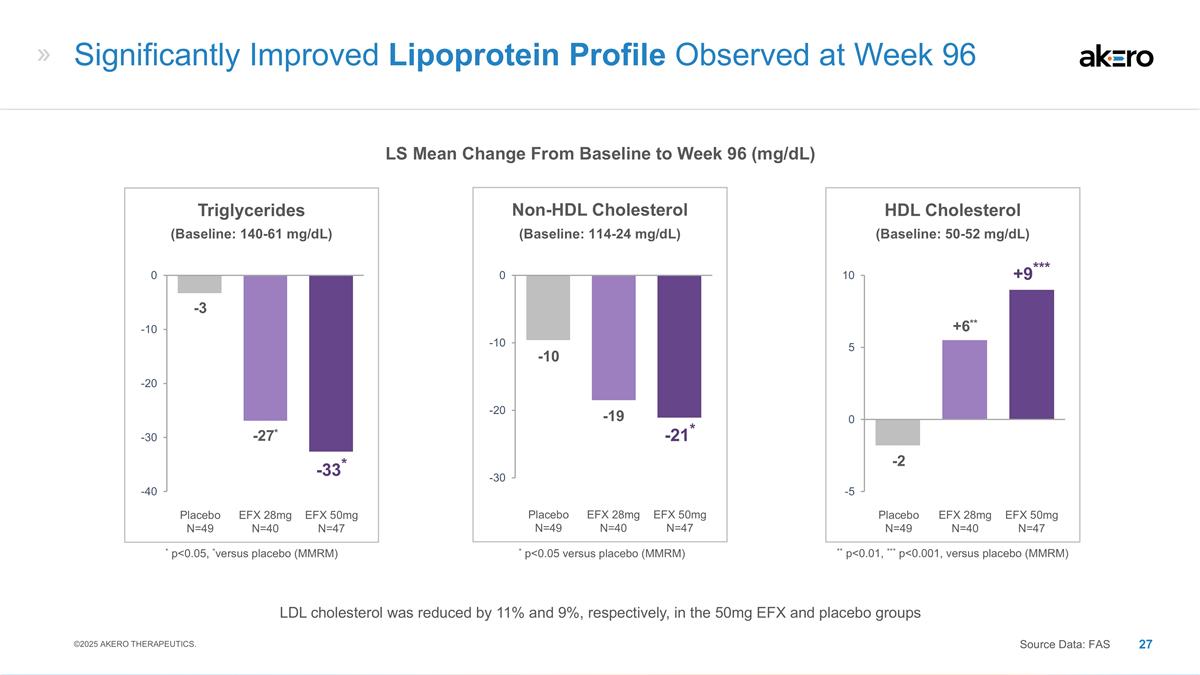
EFX 50mg N=47 Placebo N=49 EFX 28mg N=40 HDL Cholesterol +6** -2 +9*** ** p<0.01, *** p<0.001, versus placebo (MMRM) EFX 50mg N=47 Placebo N=49 EFX 28mg N=40 Non-HDL Cholesterol -19 -10 -21* EFX 50mg N=47 Placebo N=49 EFX 28mg N=40 Triglycerides -27* -3 -33* * p<0.05, *versus placebo (MMRM) Significantly Improved Lipoprotein Profile Observed at Week 96 LS Mean Change From Baseline to Week 96 (mg/dL) ©2025 AKERO THERAPEUTICS. Source Data: FAS * p<0.05 versus placebo (MMRM) (Baseline: 114-24 mg/dL) (Baseline: 50-52 mg/dL) (Baseline: 140-61 mg/dL) LDL cholesterol was reduced by 11% and 9%, respectively, in the 50mg EFX and placebo groups
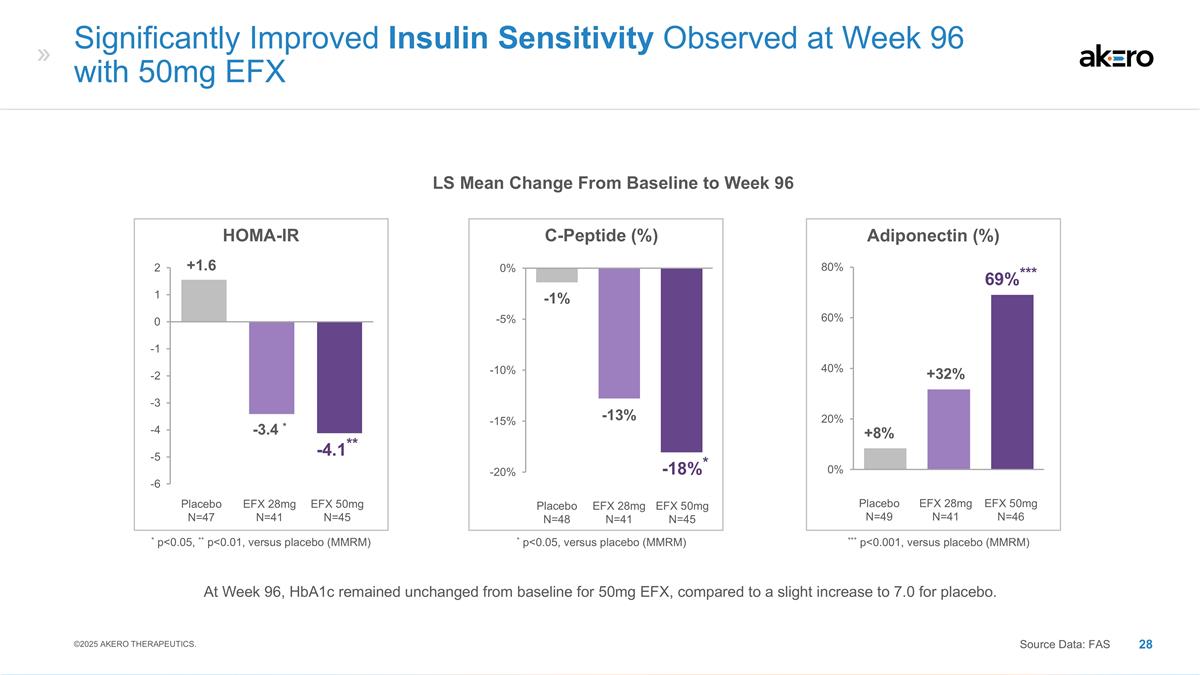
EFX 50mg N=45 Placebo N=48 EFX 28mg N=41 C-Peptide (%) * p<0.05, versus placebo (MMRM) -13% -1% *-18%* EFX 50mg N=46 Placebo N=49 EFX 28mg N=41 Adiponectin (%) +32% +8% 69%*** *** p<0.001, versus placebo (MMRM) Significantly Improved Insulin Sensitivity Observed at Week 96 with 50mg EFX Source Data: FAS LS Mean Change From Baseline to Week 96 EFX 50mg N=45 Placebo N=47 EFX 28mg N=41 HOMA-IR -3.4 * +1.6 -4.1** * p<0.05, ** p<0.01, versus placebo (MMRM) ©2025 AKERO THERAPEUTICS. At Week 96, HbA1c remained unchanged from baseline for 50mg EFX, compared to a slight increase to 7.0 for placebo.
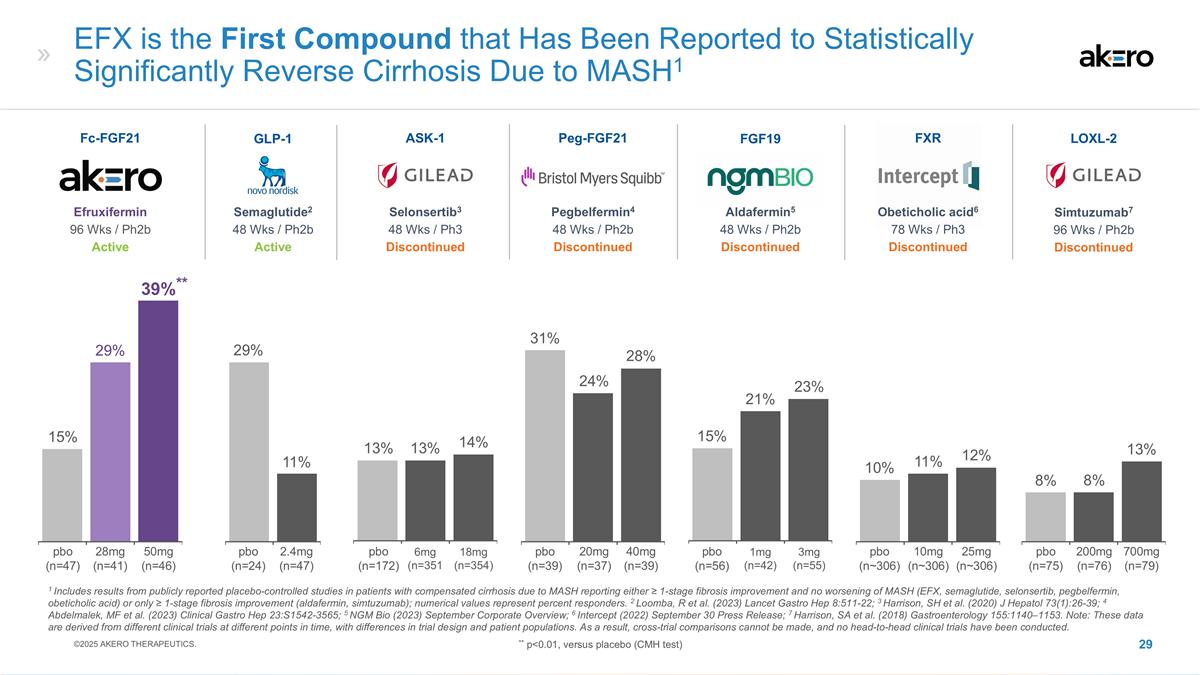
Aldafermin5 48 Wks / Ph2b Discontinued FGF19 1mg (n=42) 3mg (n=55) 21% 15% EFX is the First Compound that Has Been Reported to Statistically Significantly Reverse Cirrhosis Due to MASH1 Selonsertib3 48 Wks / Ph3 Discontinued ASK-1 Peg-FGF21 Pegbelfermin4 48 Wks / Ph2b Discontinued 6mg (n=351 18mg (n=354) 20mg (n=37) 40mg (n=39) 14% 13% 31% 24% FXR Obeticholic acid6 78 Wks / Ph3 Discontinued 25mg (n~306) 10mg (n~306) 10% 12% Semaglutide2 48 Wks / Ph2b Active GLP-1 2.4mg (n=47) 11% Simtuzumab7 96 Wks / Ph2b Discontinued LOXL-2 200mg (n=76) 700mg (n=79) 8% 8% 1 Includes results from publicly reported placebo-controlled studies in patients with compensated cirrhosis due to MASH reporting either ≥ 1-stage fibrosis improvement and no worsening of MASH (EFX, semaglutide, selonsertib, pegbelfermin, obeticholic acid) or only ≥ 1-stage fibrosis improvement (aldafermin, simtuzumab); numerical values represent percent responders. 2 Loomba, R et al. (2023) Lancet Gastro Hep 8:511-22; 3 Harrison, SH et al. (2020) J Hepatol 73(1):26-39; 4 Abdelmalek, MF et al. (2023) Clinical Gastro Hep 23:S1542-3565; 5 NGM Bio (2023) September Corporate Overview; 6 Intercept (2022) September 30 Press Release; 7 Harrison, SA et al. (2018) Gastroenterology 155:1140–1153. Note: These data are derived from different clinical trials at different points in time, with differences in trial design and patient populations. As a result, cross-trial comparisons cannot be made, and no head-to-head clinical trials have been conducted. 29% 13% 28% 23% 11% 13% Efruxifermin 96 Wks / Ph2b Active Fc-FGF21 50mg (n=46) 28mg (n=41) **39%** 29% 15% pbo (n=47) pbo (n=24) pbo (n=172) pbo (n=39) pbo (n=56) pbo (n~306) pbo (n=75) ©2025 AKERO THERAPEUTICS. ** p<0.01, versus placebo (CMH test)
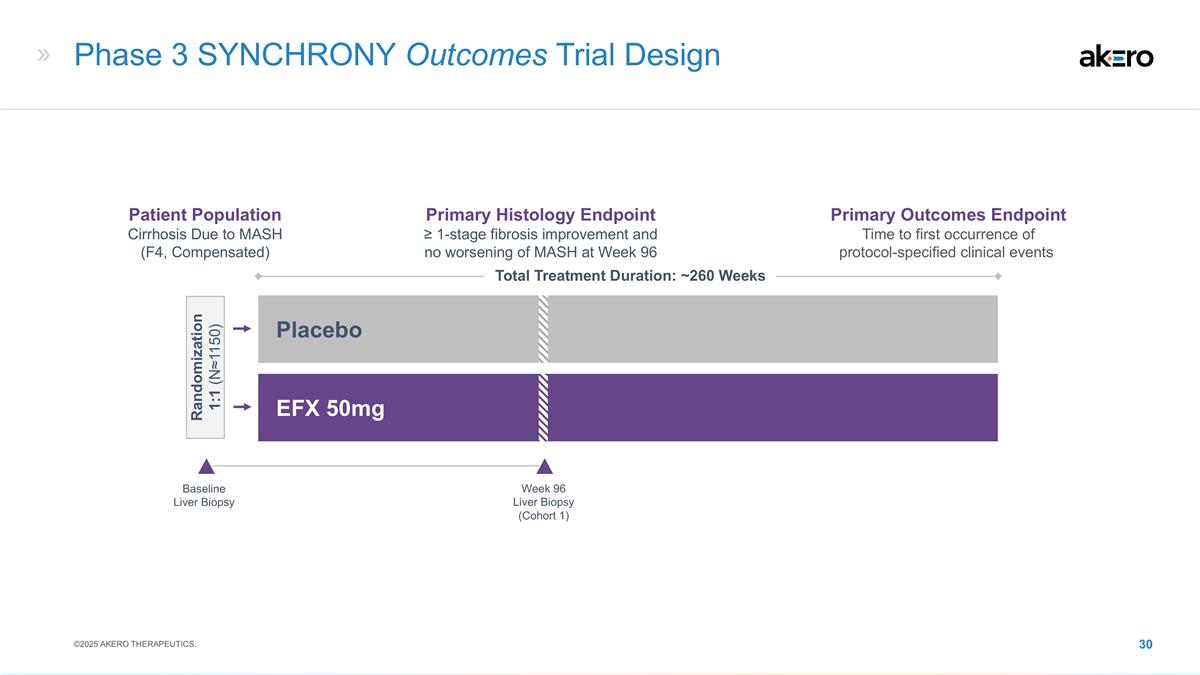
Phase 3 SYNCHRONY Outcomes Trial Design Baseline Liver Biopsy EFX 50mg Placebo Total Treatment Duration: ~260 Weeks Week 96 Liver Biopsy (Cohort 1) Patient Population Cirrhosis Due to MASH (F4, Compensated) Primary Histology Endpoint ≥ 1-stage fibrosis improvement and no worsening of MASH at Week 96 Primary Outcomes Endpoint Time to first occurrence of protocol-specified clinical events Randomization 1:1 (N≈1150) ©2025 AKERO THERAPEUTICS.
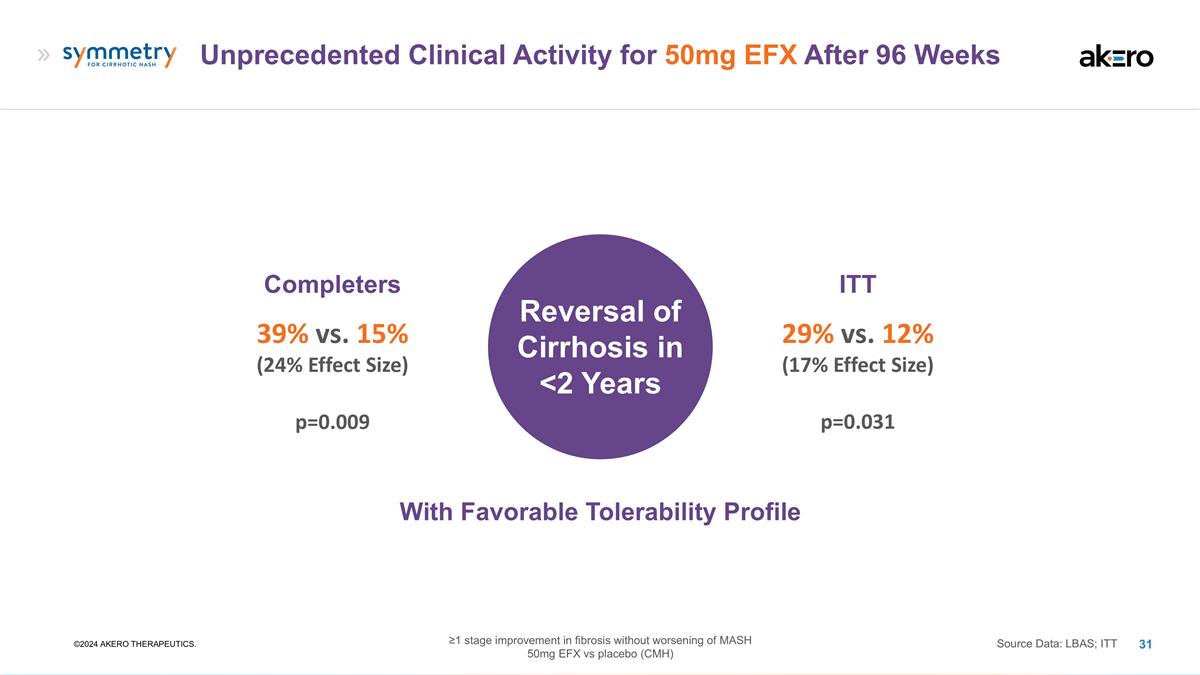
Unprecedented Clinical Activity for 50mg EFX After 96 Weeks ©2024 AKERO THERAPEUTICS. Completers 39% vs. 15% (24% Effect Size) Source Data: LBAS; ITT ITT 29% vs. 12% (17% Effect Size) Reversal of Cirrhosis in <2 Years p=0.009 p=0.031 With Favorable Tolerability Profile ≥1 stage improvement in fibrosis without worsening of MASH 50mg EFX vs placebo (CMH)
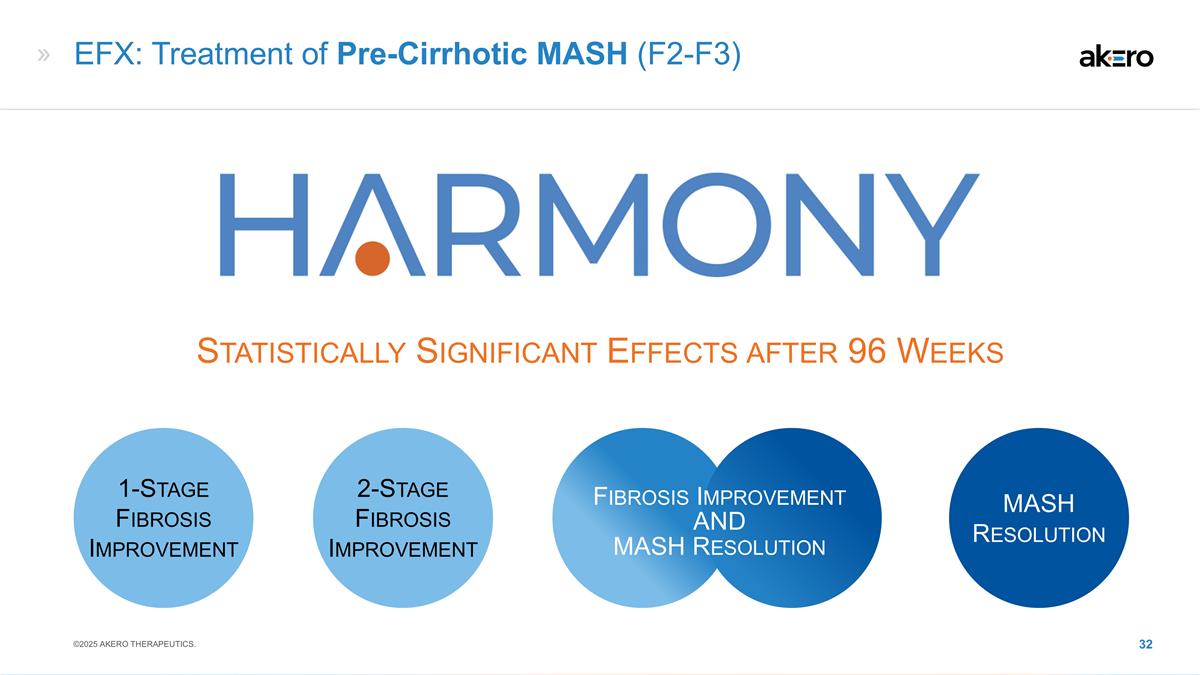
EFX: Treatment of Pre-Cirrhotic MASH (F2-F3) Statistically Significant Effects after 96 Weeks 1-Stage Fibrosis Improvement MASH Resolution Fibrosis Improvement AND MASH Resolution 2-Stage Fibrosis Improvement ©2025 AKERO THERAPEUTICS.
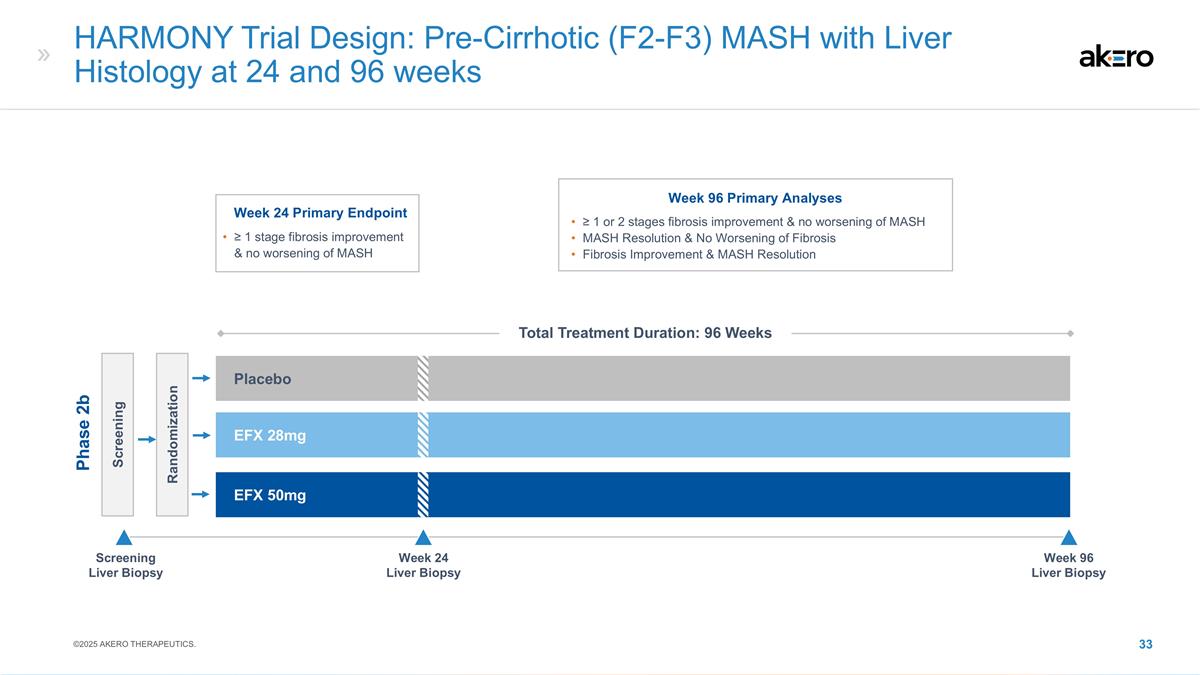
HARMONY Trial Design: Pre-Cirrhotic (F2-F3) MASH with Liver Histology at 24 and 96 weeks Screening Randomization EFX 28mg Placebo EFX 50mg Phase 2b Screening Liver Biopsy Week 24 Liver Biopsy Week 96 Liver Biopsy Week 96 Primary Analyses ≥ 1 or 2 stages fibrosis improvement & no worsening of MASH MASH Resolution & No Worsening of Fibrosis Fibrosis Improvement & MASH Resolution Week 24 Primary Endpoint ≥ 1 stage fibrosis improvement & no worsening of MASH ©2025 AKERO THERAPEUTICS. Total Treatment Duration: 96 Weeks
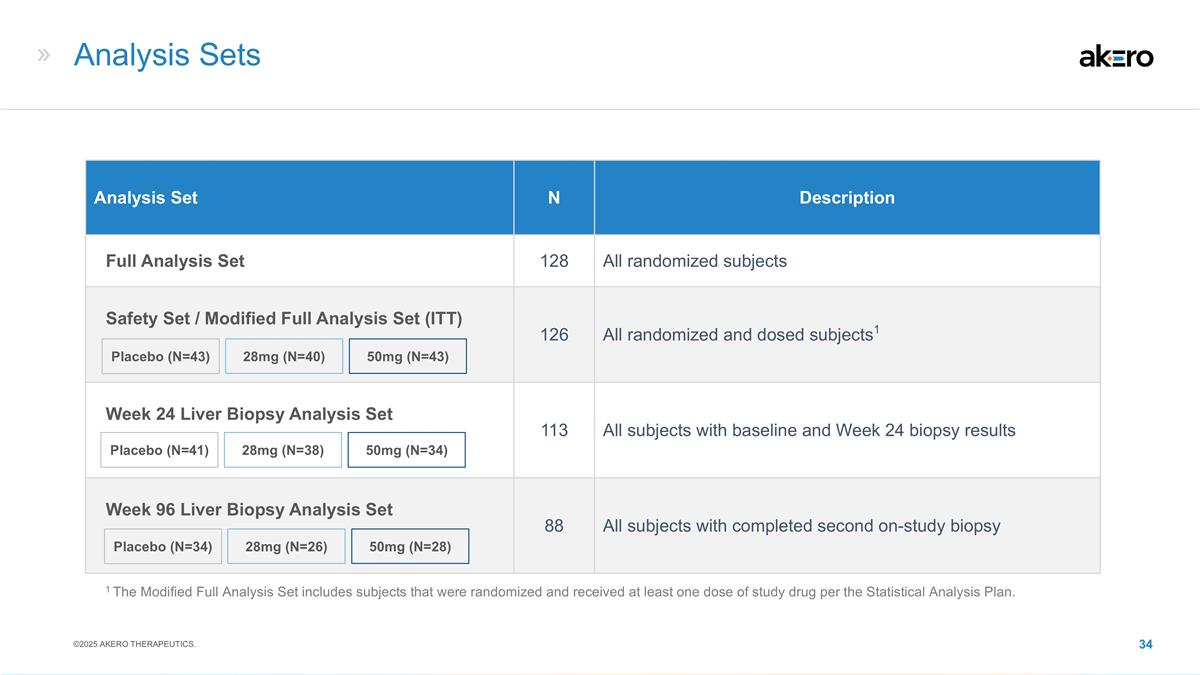
Analysis Sets Analysis Set N Description Full Analysis Set 128 All randomized subjects Safety Set / Modified Full Analysis Set (ITT) 126 All randomized and dosed subjects1 Week 24 Liver Biopsy Analysis Set 113 All subjects with baseline and Week 24 biopsy results Week 96 Liver Biopsy Analysis Set 88 All subjects with completed second on-study biopsy 28mg (N=26) 50mg (N=28) Placebo (N=34) 28mg (N=40) 50mg (N=43) Placebo (N=43) 28mg (N=38) 50mg (N=34) Placebo (N=41) 1 The Modified Full Analysis Set includes subjects that were randomized and received at least one dose of study drug per the Statistical Analysis Plan. ©2025 AKERO THERAPEUTICS.
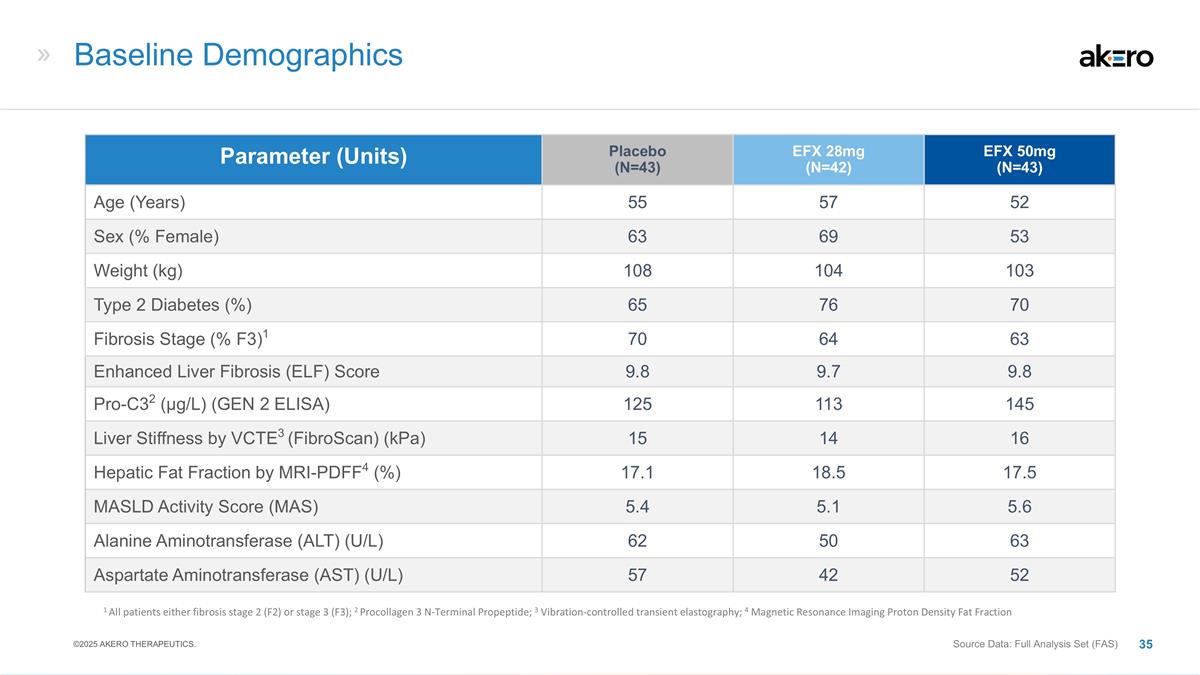
Baseline Demographics Parameter (Units) Placebo (N=43) EFX 28mg (N=42) EFX 50mg (N=43) Age (Years) 55 57 52 Sex (% Female) 63 69 53 Weight (kg) 108 104 103 Type 2 Diabetes (%) 65 76 70 Fibrosis Stage (% F3)1 70 64 63 Enhanced Liver Fibrosis (ELF) Score 9.8 9.7 9.8 Pro-C32 (μg/L) (GEN 2 ELISA) 125 113 145 Liver Stiffness by VCTE3 (FibroScan) (kPa) 15 14 16 Hepatic Fat Fraction by MRI-PDFF4 (%) 17.1 18.5 17.5 MASLD Activity Score (MAS) 5.4 5.1 5.6 Alanine Aminotransferase (ALT) (U/L) 62 50 63 Aspartate Aminotransferase (AST) (U/L) 57 42 52 1 All patients either fibrosis stage 2 (F2) or stage 3 (F3); 2 Procollagen 3 N-Terminal Propeptide; 3 Vibration-controlled transient elastography; 4 Magnetic Resonance Imaging Proton Density Fat Fraction Source Data: Full Analysis Set (FAS) ©2025 AKERO THERAPEUTICS.
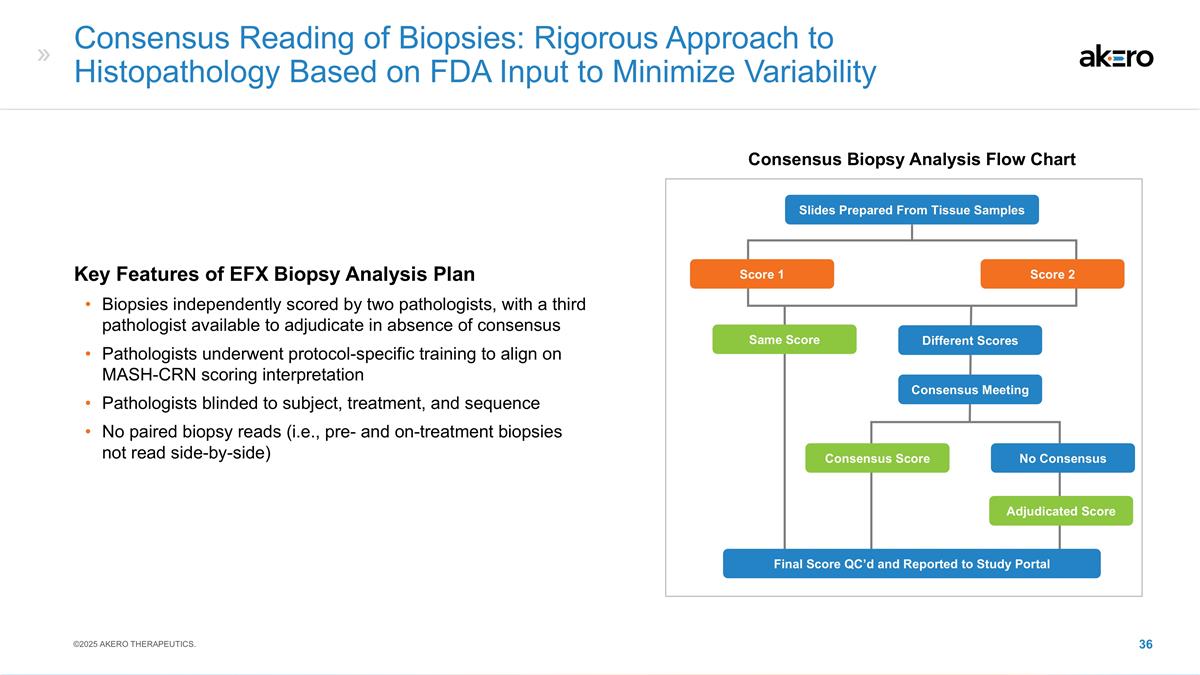
Consensus Reading of Biopsies: Rigorous Approach to Histopathology Based on FDA Input to Minimize Variability Different Scores Slides Prepared From Tissue Samples Score 1 Score 2 Same Score Consensus Score Adjudicated Score No Consensus Consensus Meeting Final Score QC’d and Reported to Study Portal Key Features of EFX Biopsy Analysis Plan Biopsies independently scored by two pathologists, with a third pathologist available to adjudicate in absence of consensus Pathologists underwent protocol-specific training to align on MASH-CRN scoring interpretation Pathologists blinded to subject, treatment, and sequence No paired biopsy reads (i.e., pre- and on-treatment biopsies not read side-by-side) Consensus Biopsy Analysis Flow Chart ©2025 AKERO THERAPEUTICS.
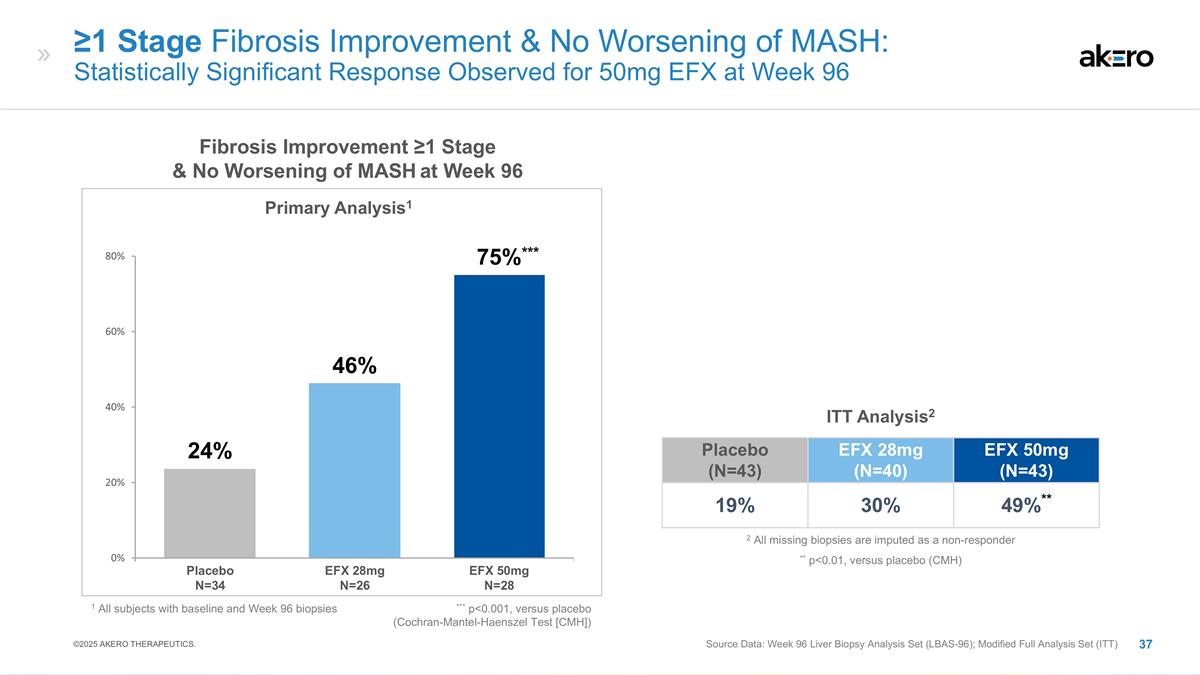
***75%*** ≥1 Stage Fibrosis Improvement & No Worsening of MASH: Statistically Significant Response Observed for 50mg EFX at Week 96 Source Data: Week 96 Liver Biopsy Analysis Set (LBAS-96); Modified Full Analysis Set (ITT) EFX 28mg N=26 EFX 50mg N=28 Placebo N=34 Fibrosis Improvement ≥1 Stage & No Worsening of MASH at Week 96 Placebo (N=43) EFX 28mg (N=40) EFX 50mg (N=43) 19% 30% 49%** ITT Analysis2 Primary Analysis1 ** p<0.01, versus placebo (CMH) 2 All missing biopsies are imputed as a non-responder 1 All subjects with baseline and Week 96 biopsies 46% 24% *** p<0.001, versus placebo (Cochran-Mantel-Haenszel Test [CMH]) ©2025 AKERO THERAPEUTICS.
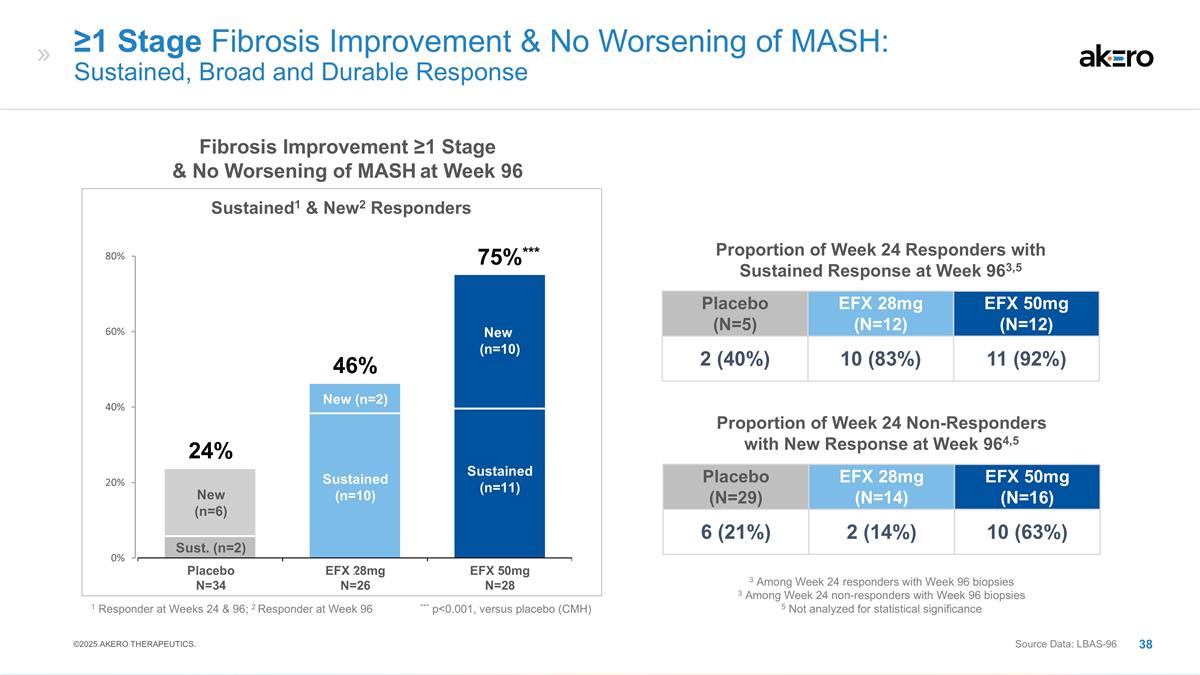
Placebo (N=29) EFX 28mg (N=14) EFX 50mg (N=16) 6 (21%) 2 (14%) 10 (63%) Proportion of Week 24 Non-Responders with New Response at Week 964,5 3 Among Week 24 responders with Week 96 biopsies 3 Among Week 24 non-responders with Week 96 biopsies 5 Not analyzed for statistical significance ≥1 Stage Fibrosis Improvement & No Worsening of MASH: Sustained, Broad and Durable Response Sustained (n=10) New (n=2) Sustained (n=11) New (n=10) Sust. (n=2) New (n=6) ***75%*** EFX 28mg N=26 EFX 50mg N=28 Placebo N=34 46% 24% 1 Responder at Weeks 24 & 96; 2 Responder at Week 96 *** p<0.001, versus placebo (CMH) Placebo (N=5) EFX 28mg (N=12) EFX 50mg (N=12) 2 (40%) 10 (83%) 11 (92%) Proportion of Week 24 Responders with Sustained Response at Week 963,5 Fibrosis Improvement ≥1 Stage & No Worsening of MASH at Week 96 Sustained1 & New2 Responders Source Data: LBAS-96 ©2025 AKERO THERAPEUTICS.
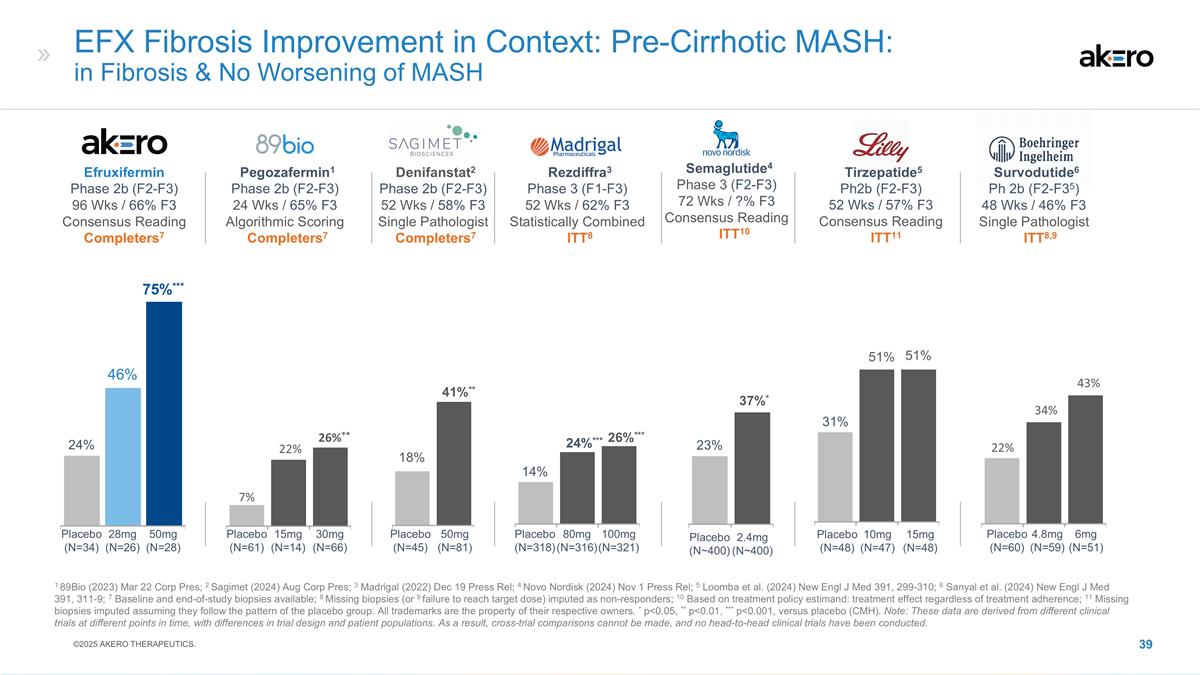
EFX Fibrosis Improvement in Context: Pre-Cirrhotic MASH: in Fibrosis & No Worsening of MASH 1 89Bio (2023) Mar 22 Corp Pres; 2 Sagimet (2024) Aug Corp Pres; 3 Madrigal (2022) Dec 19 Press Rel; 4 Novo Nordisk (2024) Nov 1 Press Rel; 5 Loomba et al. (2024) New Engl J Med 391, 299-310; 6 Sanyal et al. (2024) New Engl J Med 391, 311-9; 7 Baseline and end-of-study biopsies available; 8 Missing biopsies (or 9 failure to reach target dose) imputed as non-responders; 10 Based on treatment policy estimand: treatment effect regardless of treatment adherence; 11 Missing biopsies imputed assuming they follow the pattern of the placebo group. All trademarks are the property of their respective owners. * p<0.05, ** p<0.01, *** p<0.001, versus placebo (CMH). Note: These data are derived from different clinical trials at different points in time, with differences in trial design and patient populations. As a result, cross-trial comparisons cannot be made, and no head-to-head clinical trials have been conducted. 2Denifanstat2 Phase 2b (F2-F3) 52 Wks / 58% F3 Single Pathologist 7Completers7 18% **41%** Placebo (N=45) 50mg (N=81) Efruxifermin Phase 2b (F2-F3) 96 Wks / 66% F3 Consensus Reading Completers7 75%*** 46% 24% 28mg (N=26) 50mg (N=28) Placebo (N=34) 3Rezdiffra3 Phase 3 (F1-F3) 52 Wks / 62% F3 Statistically Combined 8ITT8 Placebo (N=318) 80mg (N=316) 100mg (N=321) ***26%*** ***%*** 14% 1Pegozafermin1 Phase 2b (F2-F3) 24 Wks / 65% F3 Algorithmic Scoring 7Completers7 **26%** Placebo (N=61) 15mg (N=14) 30mg (N=66) *22% 7% 5Tirzepatide5 Ph2b (F2-F3) 52 Wks / 57% F3 Consensus Reading 11ITT11 Placebo (N=48) 10mg (N=47) 15mg (N=48) 31% 51% 51% 6Survodutide6 Ph 2b (F2-F35) 48 Wks / 46% F3 Single Pathologist 8,9ITT8,9 **43% *34% 22% Placebo (N=60) 4.8mg (N=59) 6mg (N=51) Placebo (N~400) 4Semaglutide4 Phase 3 (F2-F3) 72 Wks / ?% F3 Consensus Reading 510ITT10 23% *37%* 2.4mg (N~400) ©2025 AKERO THERAPEUTICS.
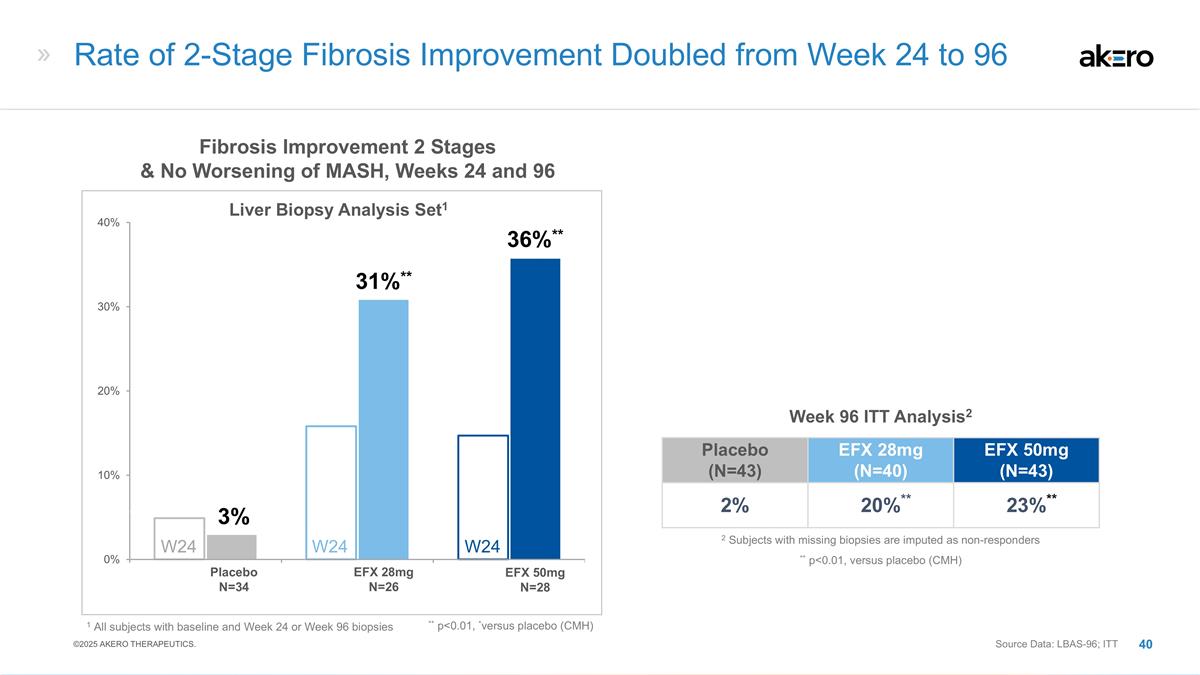
Fibrosis Improvement 2 Stages & No Worsening of MASH, Weeks 24 and 96 1 All subjects with baseline and Week 24 or Week 96 biopsies ** p<0.01, *versus placebo (CMH) Placebo N=34 EFX 28mg N=26 EFX 50mg N=28 3% 31%** 36%** W24 W24 W24 Rate of 2-Stage Fibrosis Improvement Doubled from Week 24 to 96 Placebo (N=43) EFX 28mg (N=40) EFX 50mg (N=43) 2% **20%** **23%** Week 96 ITT Analysis2 ** p<0.01, versus placebo (CMH) 2 Subjects with missing biopsies are imputed as non-responders Source Data: LBAS-96; ITT Liver Biopsy Analysis Set1 ©2025 AKERO THERAPEUTICS.
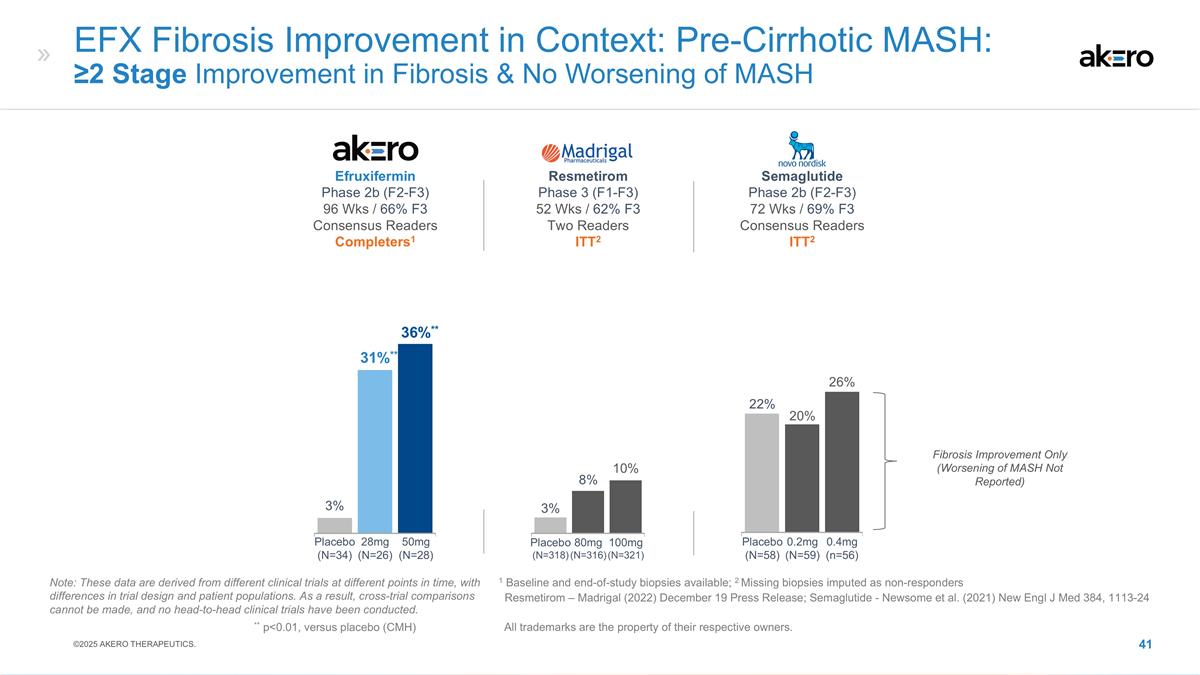
Efruxifermin Phase 2b (F2-F3) 96 Wks / 66% F3 Consensus Readers Completers1 **36%** **31%** 3% 28mg (N=26) 50mg (N=28) Placebo (N=34) EFX Fibrosis Improvement in Context: Pre-Cirrhotic MASH: ≥2 Stage Improvement in Fibrosis & No Worsening of MASH Semaglutide Phase 2b (F2-F3) 72 Wks / 69% F3 Consensus Readers ITT2 Resmetirom Phase 3 (F1-F3) 52 Wks / 62% F3 Two Readers ITT2 Placebo (N=318) 80mg (N=316) 100mg (N=321) 10% 8% 3% Placebo (N=58) 22% 26% 0.2mg (N=59) 0.4mg (n=56) 20% Fibrosis Improvement Only (Worsening of MASH Not Reported) 1 Baseline and end-of-study biopsies available; 2 Missing biopsies imputed as non-responders Resmetirom – Madrigal (2022) December 19 Press Release; Semaglutide - Newsome et al. (2021) New Engl J Med 384, 1113-24 Note: These data are derived from different clinical trials at different points in time, with differences in trial design and patient populations. As a result, cross-trial comparisons cannot be made, and no head-to-head clinical trials have been conducted. ** p<0.01, versus placebo (CMH) All trademarks are the property of their respective owners. ©2025 AKERO THERAPEUTICS.
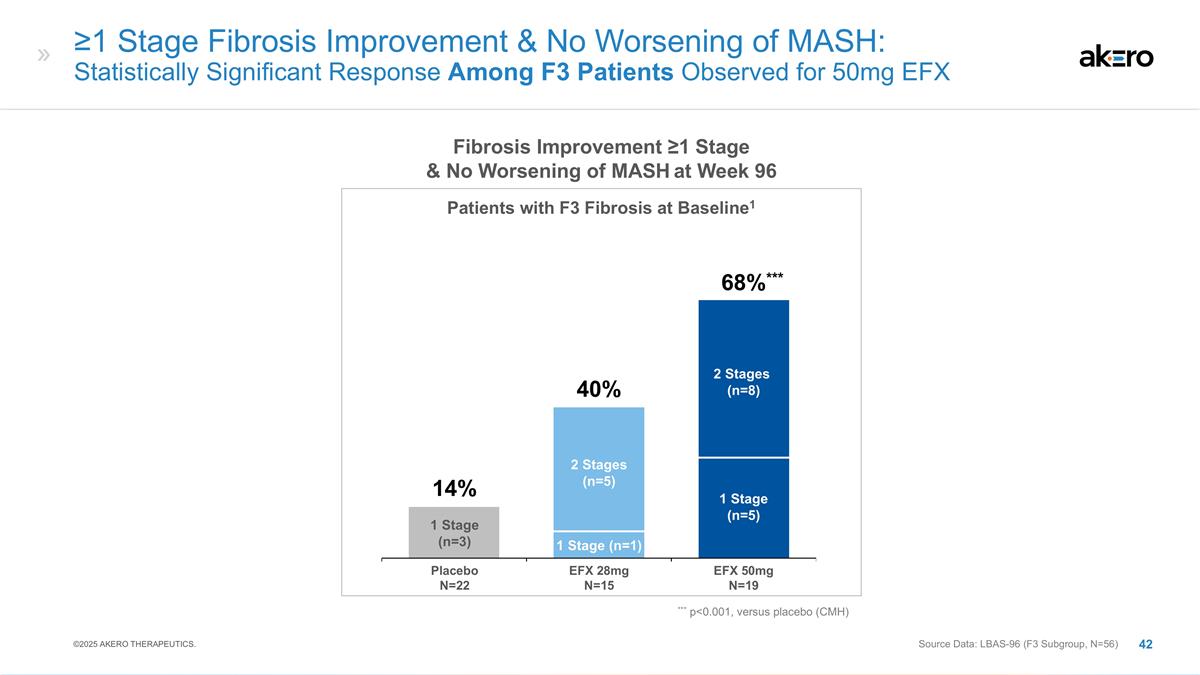
≥1 Stage Fibrosis Improvement & No Worsening of MASH: Statistically Significant Response Among F3 Patients Observed for 50mg EFX 2 Stages (n=5) 1 Stage (n=1) 1 Stage (n=5) 2 Stages (n=8) 1 Stage (n=3) ***68%*** EFX 28mg N=15 EFX 50mg N=19 Placebo N=22 40% 14% *** p<0.001, versus placebo (CMH) Fibrosis Improvement ≥1 Stage & No Worsening of MASH at Week 96 Patients with F3 Fibrosis at Baseline1 Source Data: LBAS-96 (F3 Subgroup, N=56) ©2025 AKERO THERAPEUTICS.
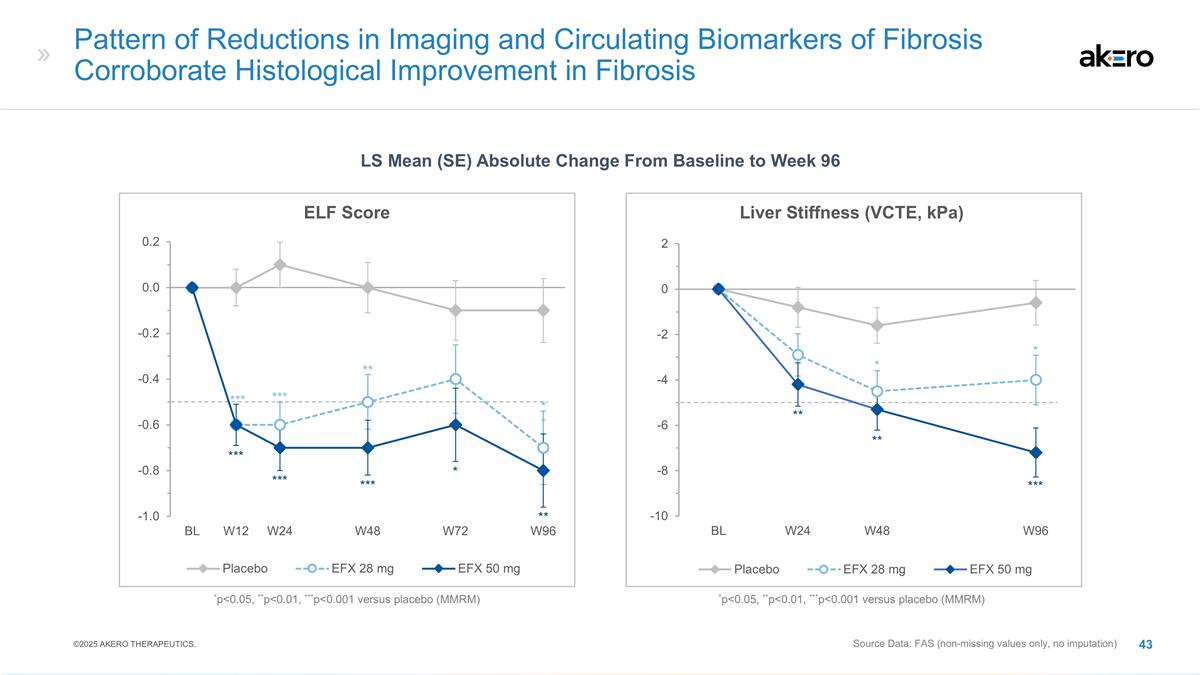
Pattern of Reductions in Imaging and Circulating Biomarkers of Fibrosis Corroborate Histological Improvement in Fibrosis Source Data: FAS (non-missing values only, no imputation) LS Mean (SE) Absolute Change From Baseline to Week 96 Liver Stiffness (VCTE, kPa) ** ** * * *** *p<0.05, **p<0.01, ***p<0.001 versus placebo (MMRM) ELF Score *** *** * ** *** *** *** ** *p<0.05, **p<0.01, ***p<0.001 versus placebo (MMRM) ** ©2025 AKERO THERAPEUTICS.
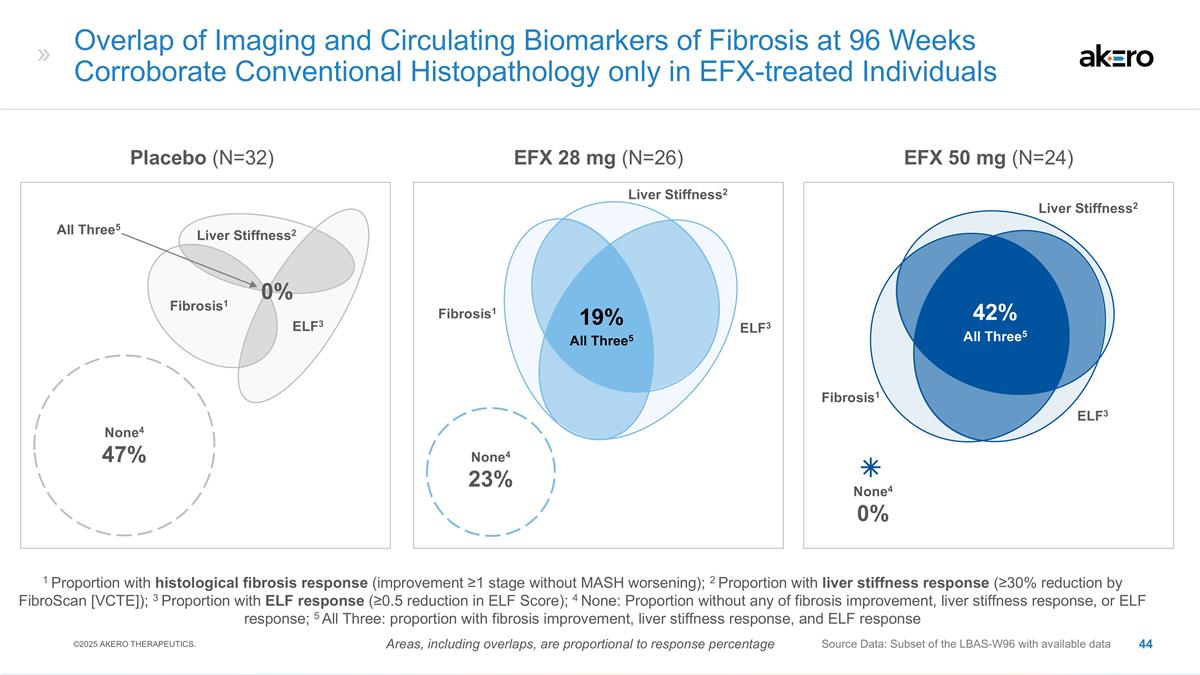
None4 0% Liver Stiffness2 Fibrosis1 ELF3 Liver Stiffness2 Fibrosis1 ELF3 EFX 28 mg (N=26) EFX 50 mg (N=24) Source Data: Subset of the LBAS-W96 with available data Overlap of Imaging and Circulating Biomarkers of Fibrosis at 96 Weeks Corroborate Conventional Histopathology only in EFX-treated Individuals 1 Proportion with histological fibrosis response (improvement ≥1 stage without MASH worsening); 2 Proportion with liver stiffness response (≥30% reduction by FibroScan [VCTE]); 3 Proportion with ELF response (≥0.5 reduction in ELF Score); 4 None: Proportion without any of fibrosis improvement, liver stiffness response, or ELF response; 5 All Three: proportion with fibrosis improvement, liver stiffness response, and ELF response Placebo (N=32) None4 47% None4 23% Liver Stiffness2 Fibrosis1 ELF3 19% All Three5 All Three5 0% Areas, including overlaps, are proportional to response percentage 42% All Three5 ©2025 AKERO THERAPEUTICS.
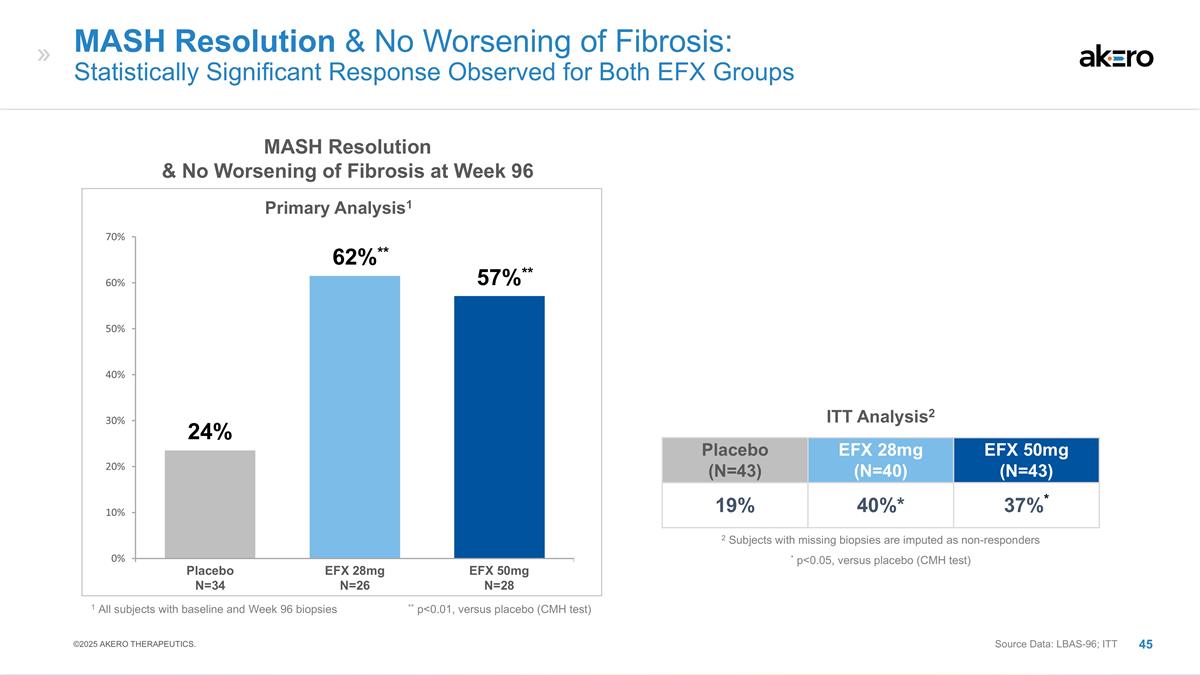
MASH Resolution & No Worsening of Fibrosis: Statistically Significant Response Observed for Both EFX Groups EFX 28mg N=26 EFX 50mg N=28 Placebo N=34 MASH Resolution & No Worsening of Fibrosis at Week 96 Primary Analysis1 1 All subjects with baseline and Week 96 biopsies ** p<0.01, versus placebo (CMH test) **57%** **62%** 24% Placebo (N=43) EFX 28mg (N=40) EFX 50mg (N=43) 19% 40%* 37%* ITT Analysis2 * p<0.05, versus placebo (CMH test) 2 Subjects with missing biopsies are imputed as non-responders Source Data: LBAS-96; ITT ©2025 AKERO THERAPEUTICS.
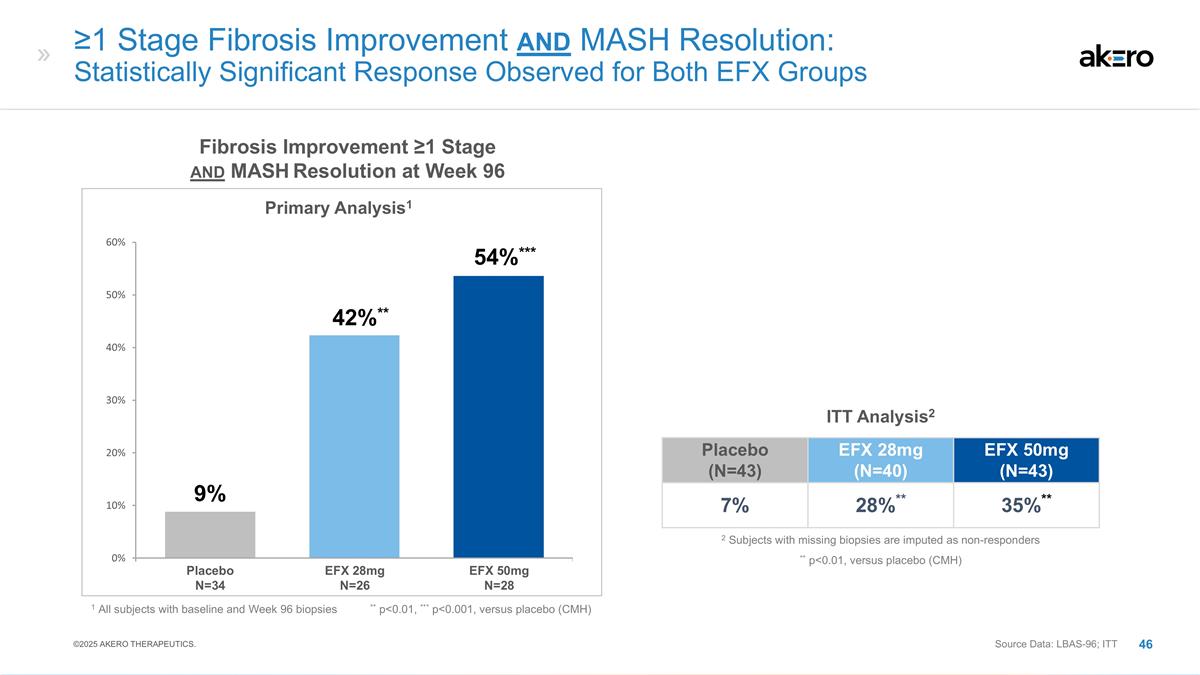
≥1 Stage Fibrosis Improvement and MASH Resolution: Statistically Significant Response Observed for Both EFX Groups Placebo (N=43) EFX 28mg (N=40) EFX 50mg (N=43) 7% 28%** 35%** ITT Analysis2 ** p<0.01, versus placebo (CMH) 2 Subjects with missing biopsies are imputed as non-responders **54%*** EFX 28mg N=26 EFX 50mg N=28 Placebo N=34 Fibrosis Improvement ≥1 Stage and MASH Resolution at Week 96 Primary Analysis1 1 All subjects with baseline and Week 96 biopsies **42%** 9% ** p<0.01, *** p<0.001, versus placebo (CMH) Source Data: LBAS-96; ITT ©2025 AKERO THERAPEUTICS.
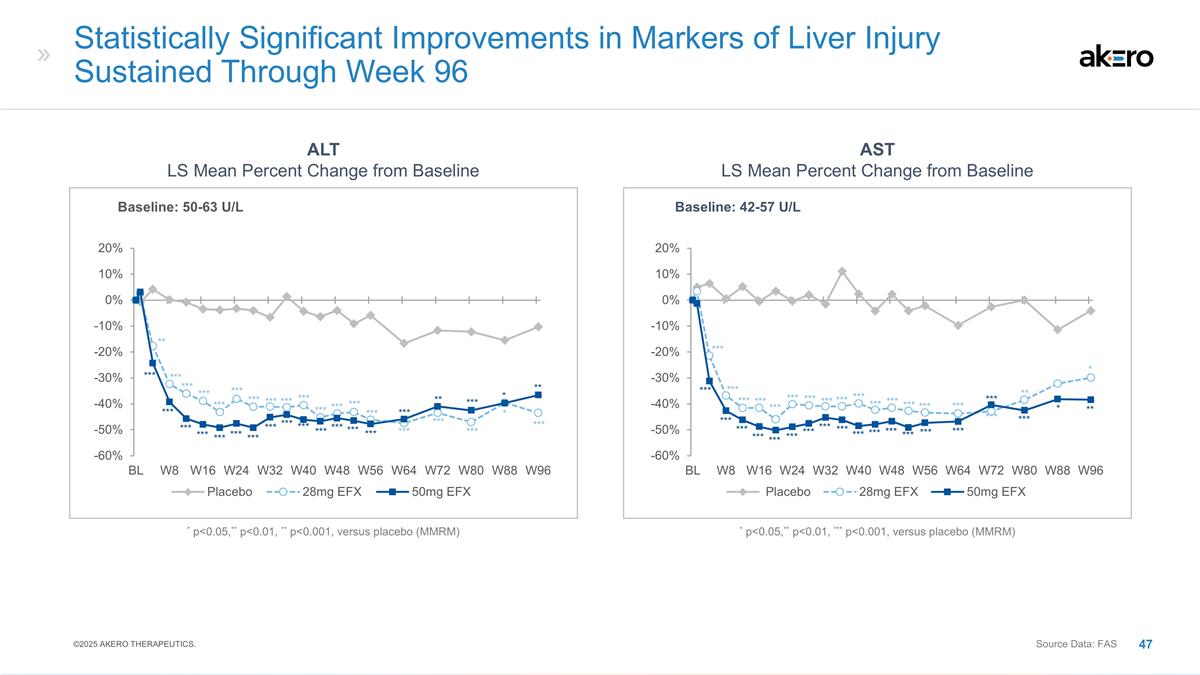
Statistically Significant Improvements in Markers of Liver Injury Sustained Through Week 96 Source Data: FAS ALT LS Mean Percent Change from Baseline AST LS Mean Percent Change from Baseline Baseline: 50-63 U/L Baseline: 42-57 U/L *** *** *** *** *** *** *** *** *** *** *** *** *** *** *** *** *** ** ** *** *** *** *** *** *** *** *** *** *** *** *** *** *** * *** *** *** *** *** *** *** *** *** *** *** *** *** *** *** *** *** *** *** *** *** *** *** *** *** *** *** *** *** *** * ** * *** *** *** *** ** *** * ** * p<0.05,** p<0.01, *** p<0.001, versus placebo (MMRM) * p<0.05,** p<0.01, ** p<0.001, versus placebo (MMRM) ©2025 AKERO THERAPEUTICS.
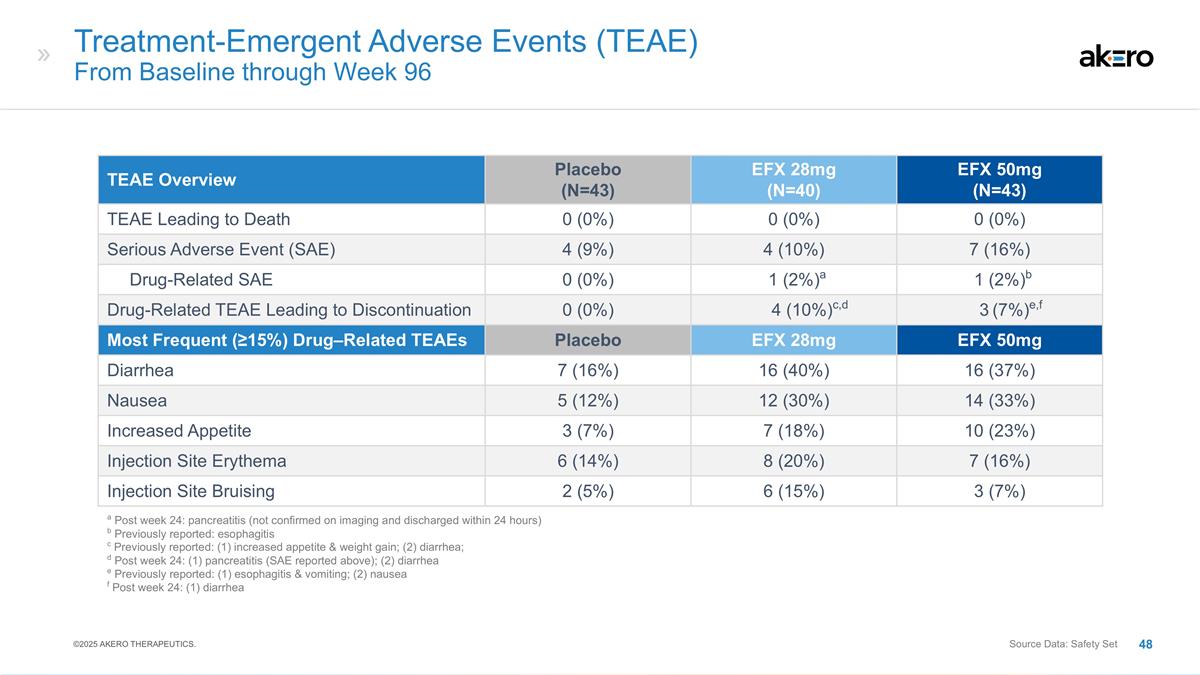
Treatment-Emergent Adverse Events (TEAE) From Baseline through Week 96 TEAE Overview Placebo (N=43) EFX 28mg (N=40) EFX 50mg (N=43) TEAE Leading to Death 0 (0%) 0 (0%) 0 (0%) Serious Adverse Event (SAE) 4 (9%) 4 (10%) 7 (16%) Drug-Related SAE 0 (0%) a1 (2%)a b1 (2%)b Drug-Related TEAE Leading to Discontinuation 0 (0%) c,d,e,f4 (10%)c,d g,h,i3 (7%)e,f Most Frequent (≥15%) Drug–Related TEAEs Placebo EFX 28mg EFX 50mg Diarrhea 7 (16%) 16 (40%) 16 (37%) Nausea 5 (12%) 12 (30%) 14 (33%) Increased Appetite 3 (7%) 7 (18%) 10 (23%) Injection Site Erythema 6 (14%) 8 (20%) 7 (16%) Injection Site Bruising 2 (5%) 6 (15%) 3 (7%) c Previously reported: (1) increased appetite & weight gain; (2) diarrhea; d Post week 24: (1) pancreatitis (SAE reported above); (2) diarrhea e Previously reported: (1) esophagitis & vomiting; (2) nausea f Post week 24: (1) diarrhea Source Data: Safety Set a Post week 24: pancreatitis (not confirmed on imaging and discharged within 24 hours) b Previously reported: esophagitis ©2025 AKERO THERAPEUTICS.
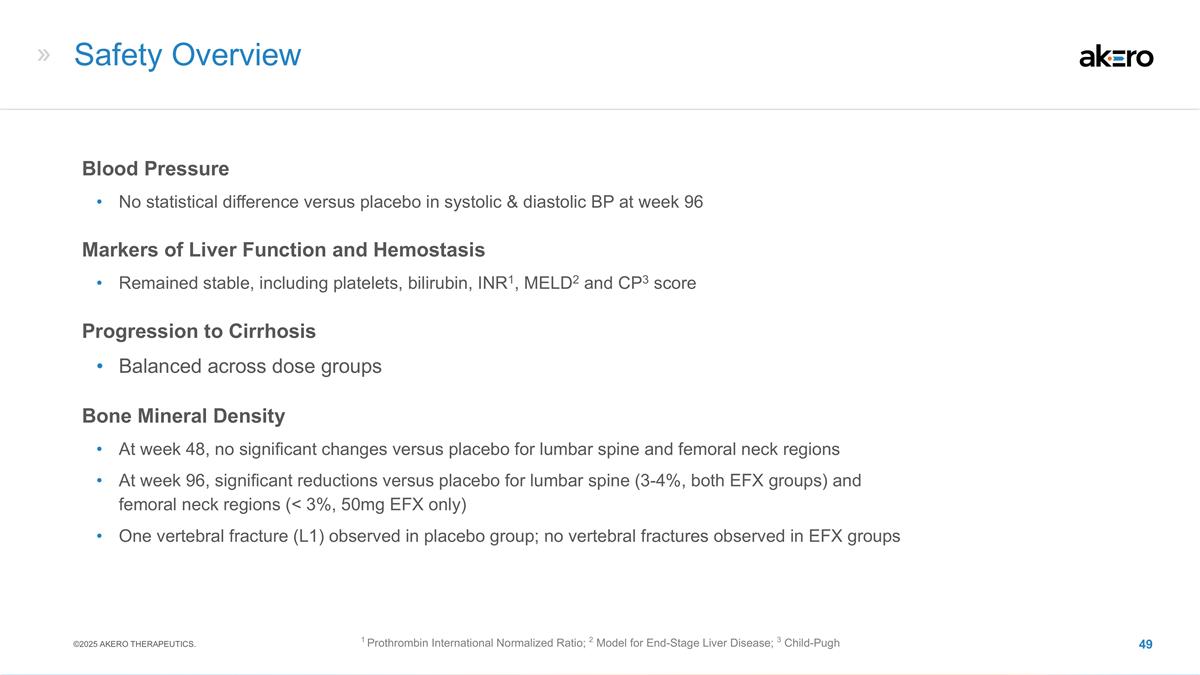
Safety Overview Blood Pressure No statistical difference versus placebo in systolic & diastolic BP at week 96 Markers of Liver Function and Hemostasis Remained stable, including platelets, bilirubin, INR1, MELD2 and CP3 score Progression to Cirrhosis Balanced across dose groups Bone Mineral Density At week 48, no significant changes versus placebo for lumbar spine and femoral neck regions At week 96, significant reductions versus placebo for lumbar spine (3-4%, both EFX groups) and femoral neck regions (< 3%, 50mg EFX only) One vertebral fracture (L1) observed in placebo group; no vertebral fractures observed in EFX groups 1 Prothrombin International Normalized Ratio; 2 Model for End-Stage Liver Disease; 3 Child-Pugh ©2025 AKERO THERAPEUTICS.
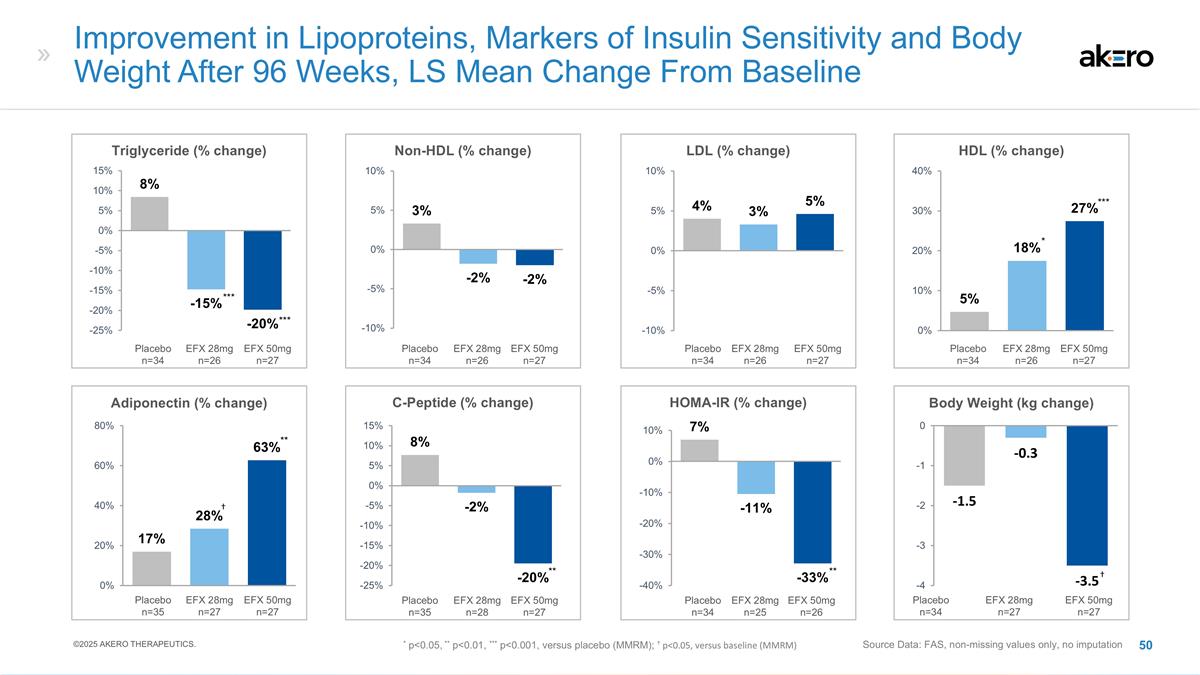
Improvement in Lipoproteins, Markers of Insulin Sensitivity and Body Weight After 96 Weeks, LS Mean Change From Baseline Source Data: FAS, non-missing values only, no imputation Non-HDL (% change) LDL (% change) Triglyceride (% change) HDL (% change) C-Peptide (% change) HOMA-IR (% change) Adiponectin (% change) Body Weight (kg change) EFX 28mg n=26 Placebo n=34 EFX 50mg n=27 EFX 28mg n=26 Placebo n=34 EFX 50mg n=27 EFX 28mg n=26 Placebo n=34 EFX 50mg n=27 EFX 28mg n=26 Placebo n=34 EFX 50mg n=27 EFX 28mg n=25 Placebo n=34 EFX 50mg n=26 EFX 28mg n=28 Placebo n=35 EFX 50mg n=27 EFX 28mg n=27 Placebo n=35 EFX 50mg n=27 EFX 28mg n=27 Placebo n=34 EFX 50mg n=27 * p<0.05, ** p<0.01, *** p<0.001, versus placebo (MMRM); † p<0.05, versus baseline (MMRM) *** *** *** * ** † ** ** † ©2025 AKERO THERAPEUTICS.
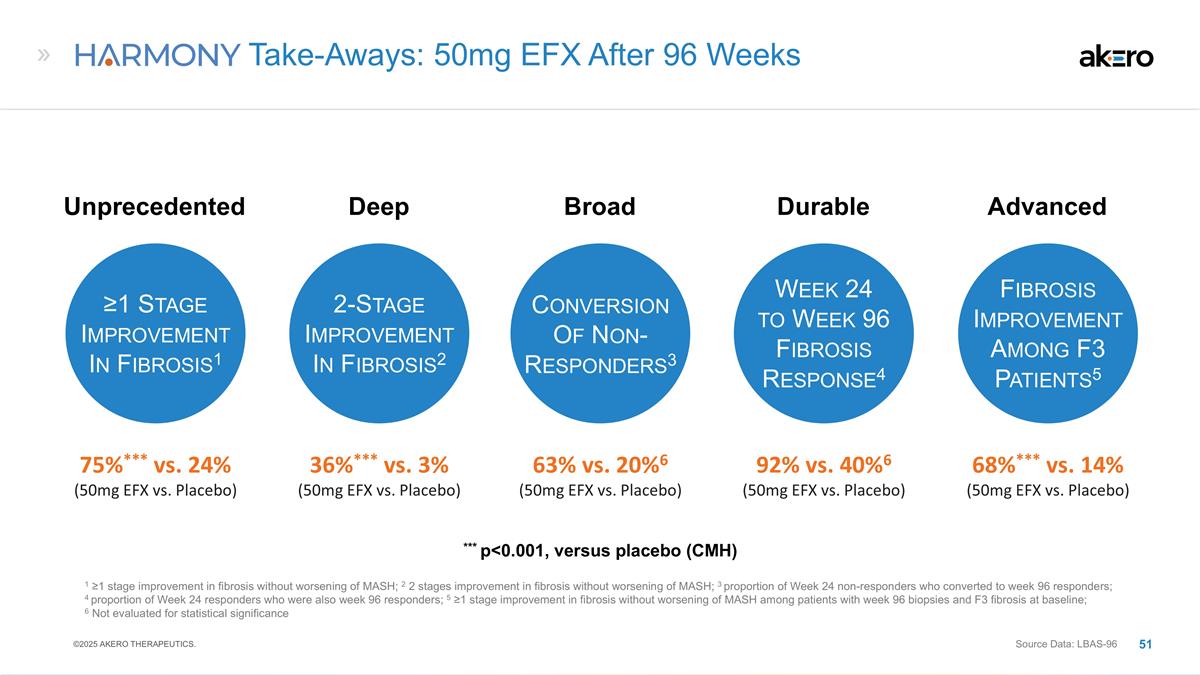
Fibrosis Improvement Among F3 Patients5 Advanced 68%*** vs. 14% (50mg EFX vs. Placebo) Take-Aways: 50mg EFX After 96 Weeks Unprecedented 75%*** vs. 24% (50mg EFX vs. Placebo) ≥1 Stage Improvement In Fibrosis1 Deep 36%*** vs. 3% (50mg EFX vs. Placebo) 2-Stage Improvement In Fibrosis2 Week 24 to Week 96 Fibrosis Response4 Durable 92% vs. 40%6 (50mg EFX vs. Placebo) 1 ≥1 stage improvement in fibrosis without worsening of MASH; 2 2 stages improvement in fibrosis without worsening of MASH; 3 proportion of Week 24 non-responders who converted to week 96 responders; 4 proportion of Week 24 responders who were also week 96 responders; 5 ≥1 stage improvement in fibrosis without worsening of MASH among patients with week 96 biopsies and F3 fibrosis at baseline; 6 Not evaluated for statistical significance *** p<0.001, versus placebo (CMH) Conversion Of Non-Responders3 Broad 63% vs. 20%6 (50mg EFX vs. Placebo) Source Data: LBAS-96 ©2025 AKERO THERAPEUTICS.

Backup Slides
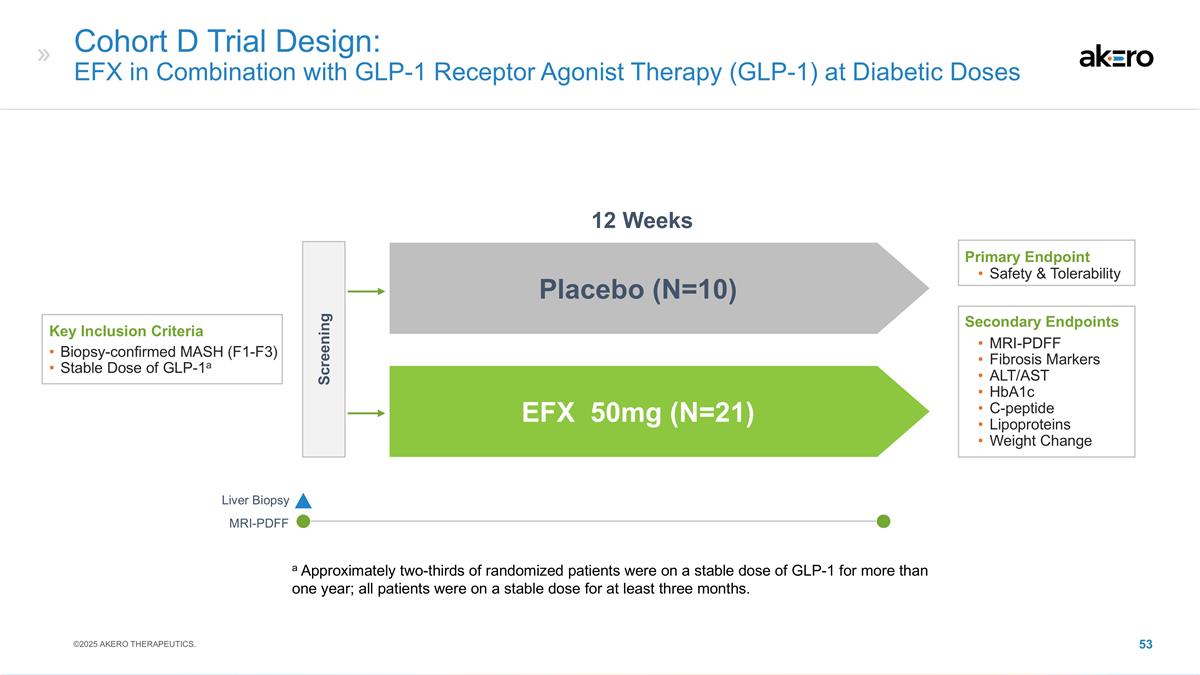
Cohort D Trial Design: EFX in Combination with GLP-1 Receptor Agonist Therapy (GLP-1) at Diabetic Doses Screening 12 Weeks EFX 50mg (N=21) Placebo (N=10) Key Inclusion Criteria Biopsy-confirmed MASH (F1-F3) Stable Dose of GLP-1a Primary Endpoint Safety & Tolerability Secondary Endpoints MRI-PDFF Fibrosis Markers ALT/AST HbA1c C-peptide Lipoproteins Weight Change MRI-PDFF Liver Biopsy a Approximately two-thirds of randomized patients were on a stable dose of GLP-1 for more than one year; all patients were on a stable dose for at least three months. ©2025 AKERO THERAPEUTICS.
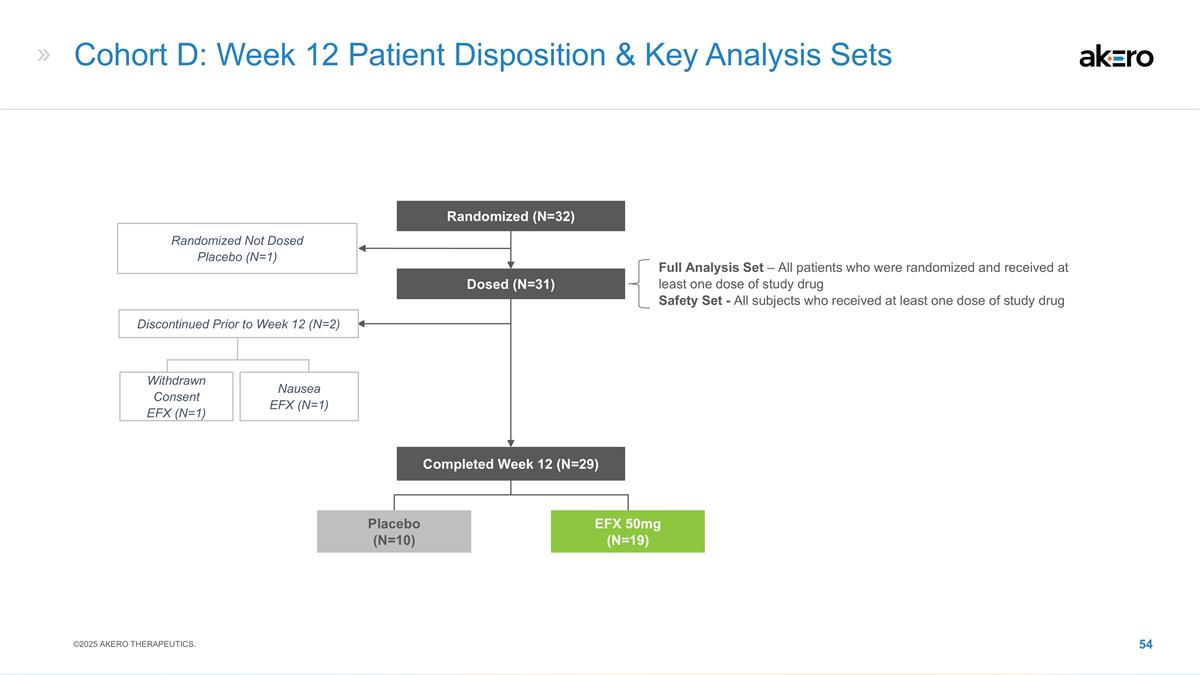
Cohort D: Week 12 Patient Disposition & Key Analysis Sets Randomized (N=32) Completed Week 12 (N=29) Randomized Not Dosed Placebo (N=1) Dosed (N=31) Full Analysis Set – All patients who were randomized and received at least one dose of study drug Safety Set - All subjects who received at least one dose of study drug EFX 50mg (N=19) Placebo (N=10) Discontinued Prior to Week 12 (N=2) Nausea EFX (N=1) Withdrawn Consent EFX (N=1) ©2025 AKERO THERAPEUTICS.
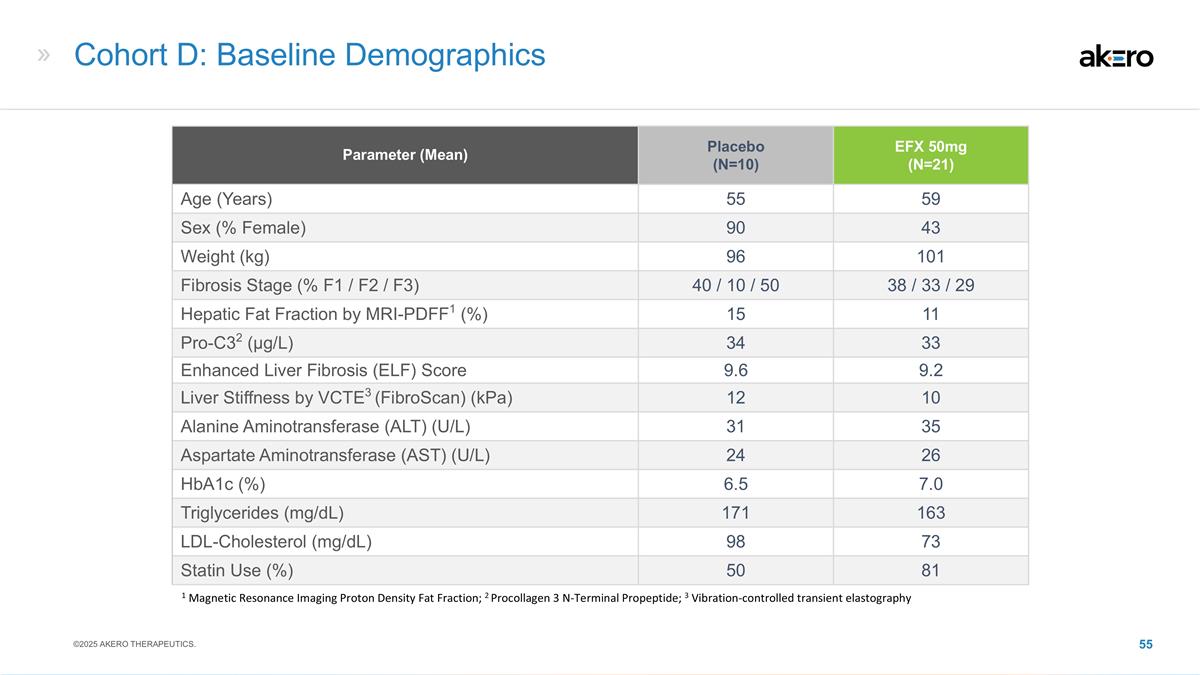
Cohort D: Baseline Demographics Parameter (Mean) Placebo (N=10) EFX 50mg (N=21) Age (Years) 55 59 Sex (% Female) 90 43 Weight (kg) 96 101 Fibrosis Stage (% F1 / F2 / F3) 40 / 10 / 50 38 / 33 / 29 Hepatic Fat Fraction by MRI-PDFF1 (%) 15 11 Pro-C32 (μg/L) 34 33 Enhanced Liver Fibrosis (ELF) Score 9.6 9.2 Liver Stiffness by VCTE3 (FibroScan) (kPa) 12 10 Alanine Aminotransferase (ALT) (U/L) 31 35 Aspartate Aminotransferase (AST) (U/L) 24 26 HbA1c (%) 6.5 7.0 Triglycerides (mg/dL) 171 163 LDL-Cholesterol (mg/dL) 98 73 Statin Use (%) 50 81 1 Magnetic Resonance Imaging Proton Density Fat Fraction; 2 Procollagen 3 N-Terminal Propeptide; 3 Vibration-controlled transient elastography ©2025 AKERO THERAPEUTICS.
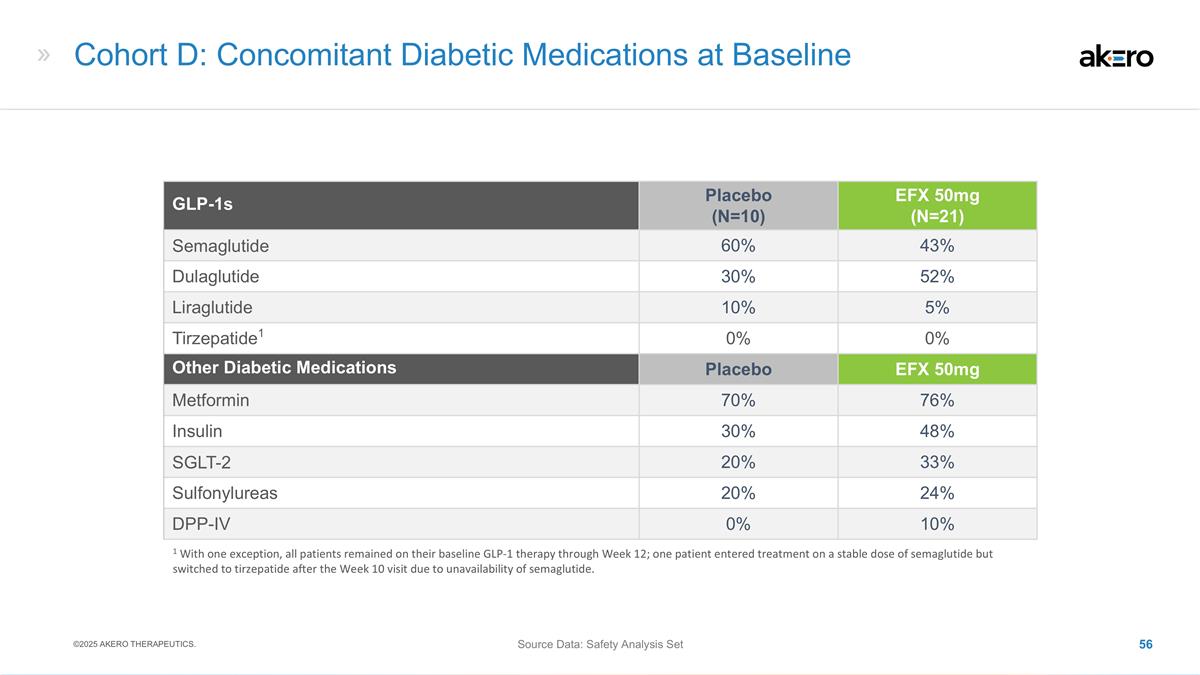
Cohort D: Concomitant Diabetic Medications at Baseline GLP-1s Placebo (N=10) EFX 50mg (N=21) Semaglutide 60% 43% Dulaglutide 30% 52% Liraglutide 10% 5% Tirzepatide1 0% 0% Other Diabetic Medications Placebo EFX 50mg Metformin 70% 76% Insulin 30% 48% SGLT-2 20% 33% Sulfonylureas 20% 24% DPP-IV 0% 10% Source Data: Safety Analysis Set 1 With one exception, all patients remained on their baseline GLP-1 therapy through Week 12; one patient entered treatment on a stable dose of semaglutide but switched to tirzepatide after the Week 10 visit due to unavailability of semaglutide. ©2025 AKERO THERAPEUTICS.
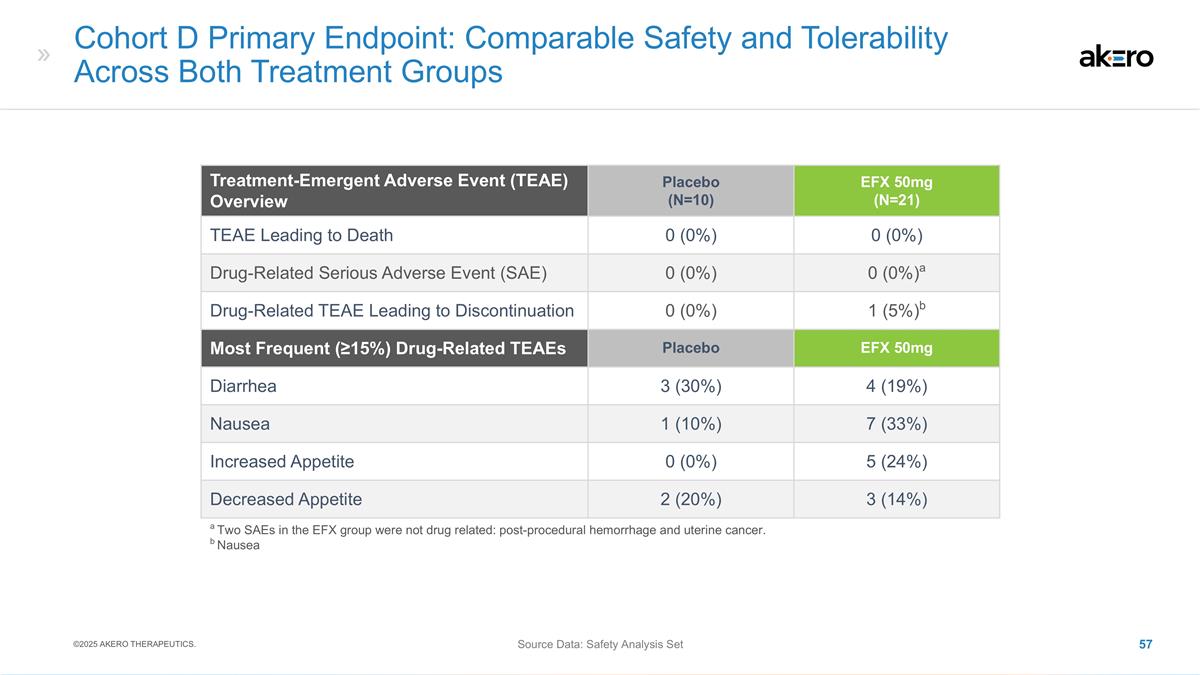
Cohort D Primary Endpoint: Comparable Safety and Tolerability Across Both Treatment Groups Source Data: Safety Analysis Set Treatment-Emergent Adverse Event (TEAE) Overview Placebo (N=10) EFX 50mg (N=21) TEAE Leading to Death 0 (0%) 0 (0%) Drug-Related Serious Adverse Event (SAE) 0 (0%) 0 (0%)a Drug-Related TEAE Leading to Discontinuation 0 (0%) 1 (5%)b Most Frequent (≥15%) Drug-Related TEAEs Placebo EFX 50mg Diarrhea 3 (30%) 4 (19%) Nausea 1 (10%) 7 (33%) Increased Appetite 0 (0%) 5 (24%) Decreased Appetite 2 (20%) 3 (14%) a Two SAEs in the EFX group were not drug related: post-procedural hemorrhage and uterine cancer. b Nausea ©2025 AKERO THERAPEUTICS.
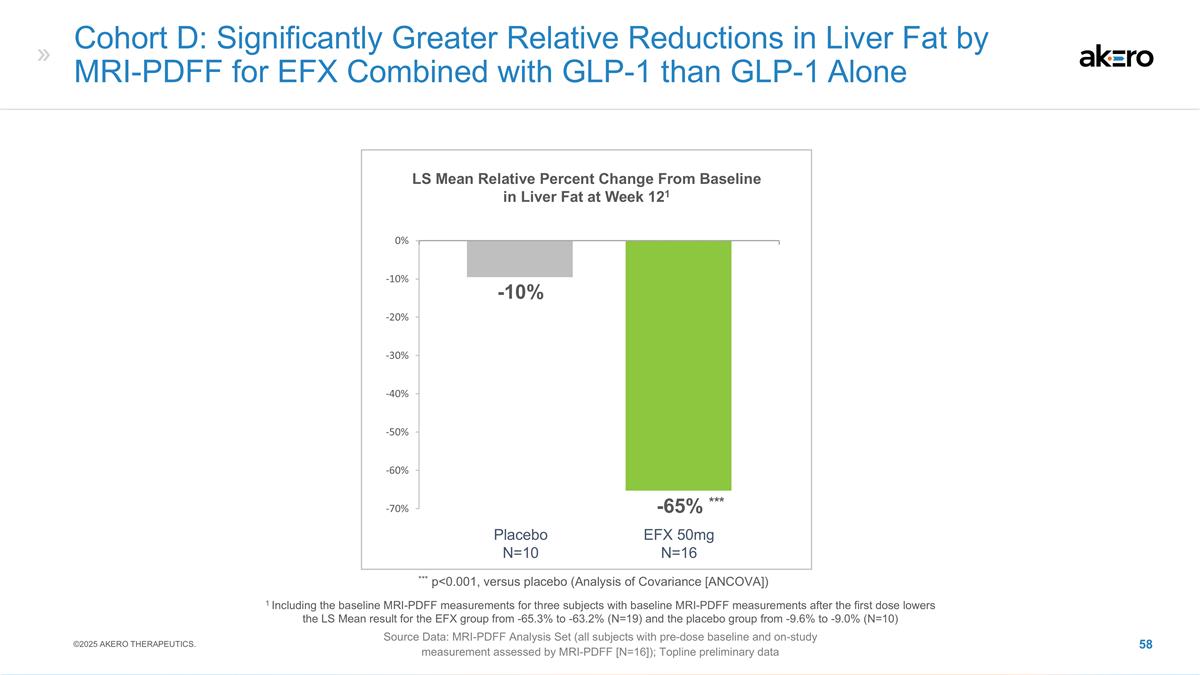
Cohort D: Significantly Greater Relative Reductions in Liver Fat by MRI-PDFF for EFX Combined with GLP-1 than GLP-1 Alone -10% LS Mean Relative Percent Change From Baseline in Liver Fat at Week 121 *** p<0.001, versus placebo (Analysis of Covariance [ANCOVA]) *** -65% *** Source Data: MRI-PDFF Analysis Set (all subjects with pre-dose baseline and on-study measurement assessed by MRI-PDFF [N=16]); Topline preliminary data EFX 50mg Placebo N=16 N=10 1 Including the baseline MRI-PDFF measurements for three subjects with baseline MRI-PDFF measurements after the first dose lowers the LS Mean result for the EFX group from -65.3% to -63.2% (N=19) and the placebo group from -9.6% to -9.0% (N=10) ©2025 AKERO THERAPEUTICS.
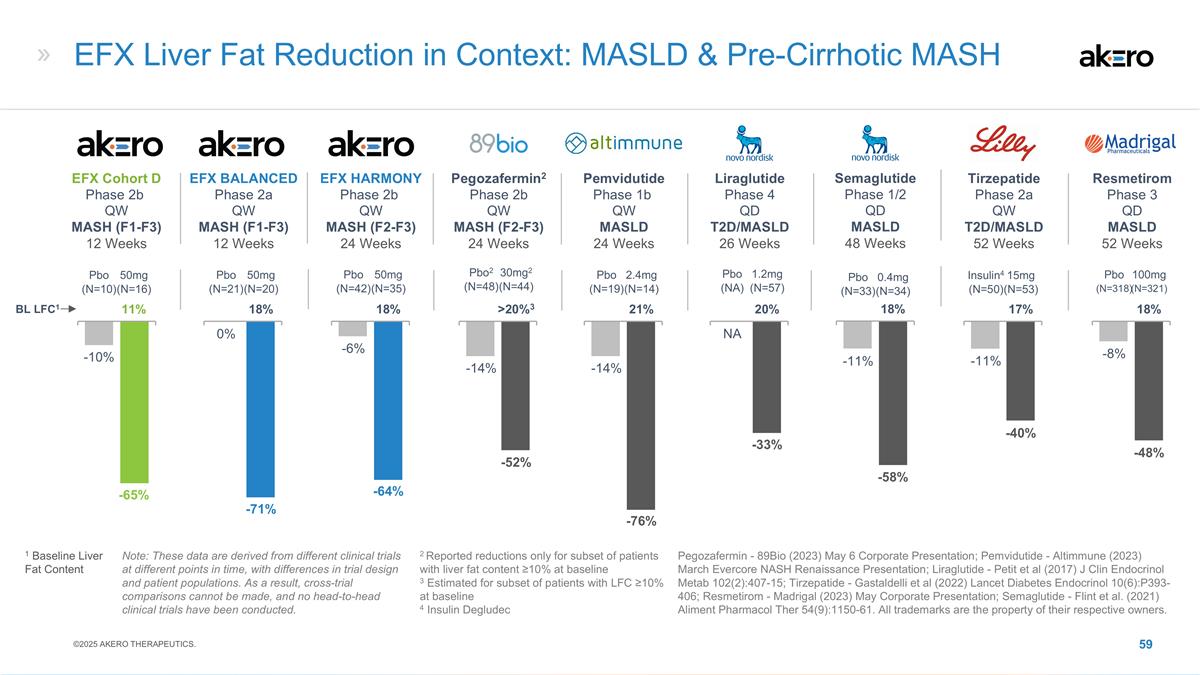
Madrigal Resmetirom Phase 3 QD MASLD 52 Weeks (N=318) (N=321) 100mg Pbo -48% -8% 18% Semaglutide Phase 1/2 QD MASLD 48 Weeks (N=33) (N=34) 0.4mg Pbo -58% -11% 18% Inventiva Pemvidutide Phase 1b QW MASLD 24 Weeks (N=19) (N=14) 2.4mg Pbo -76% -14% 21% Akero EFX HARMONY Phase 2b QW MASH (F2-F3) 24 Weeks (N=42) (N=35) 50mg Pbo -64% -6% 18% Novo Nordisk Liraglutide Phase 4 QD T2D/MASLD 26 Weeks (NA) (N=57) 1.2mg Pbo -33% NA 20% EFX Liver Fat Reduction in Context: MASLD & Pre-Cirrhotic MASH Pegozafermin - 89Bio (2023) May 6 Corporate Presentation; Pemvidutide - Altimmune (2023) March Evercore NASH Renaissance Presentation; Liraglutide - Petit et al (2017) J Clin Endocrinol Metab 102(2):407-15; Tirzepatide - Gastaldelli et al (2022) Lancet Diabetes Endocrinol 10(6):P393-406; Resmetirom - Madrigal (2023) May Corporate Presentation; Semaglutide - Flint et al. (2021) Aliment Pharmacol Ther 54(9):1150-61. All trademarks are the property of their respective owners. Note: These data are derived from different clinical trials at different points in time, with differences in trial design and patient populations. As a result, cross-trial comparisons cannot be made, and no head-to-head clinical trials have been conducted. Novo Nordisk Tirzepatide Phase 2a QW T2D/MASLD 52 Weeks (N=50) (N=53) 15mg Insulin4 -40% -11% 17% Madrigal Pegozafermin2 Phase 2b QW MASH (F2-F3) 24 Weeks (N=48) (N=44) 30mg2 Pbo2 -52% -14% >20%3 Akero EFX Cohort D Phase 2b QW MASH (F1-F3) 12 Weeks (N=10) (N=16) 50mg Pbo -65% -10% 11% Akero EFX BALANCED Phase 2a QW MASH (F1-F3) 12 Weeks (N=21) (N=20) 50mg Pbo -71% 0% 18% BL LFC1 1 Baseline Liver Fat Content 2 Reported reductions only for subset of patients with liver fat content ≥10% at baseline 3 Estimated for subset of patients with LFC ≥10% at baseline 4 Insulin Degludec ©2025 AKERO THERAPEUTICS.
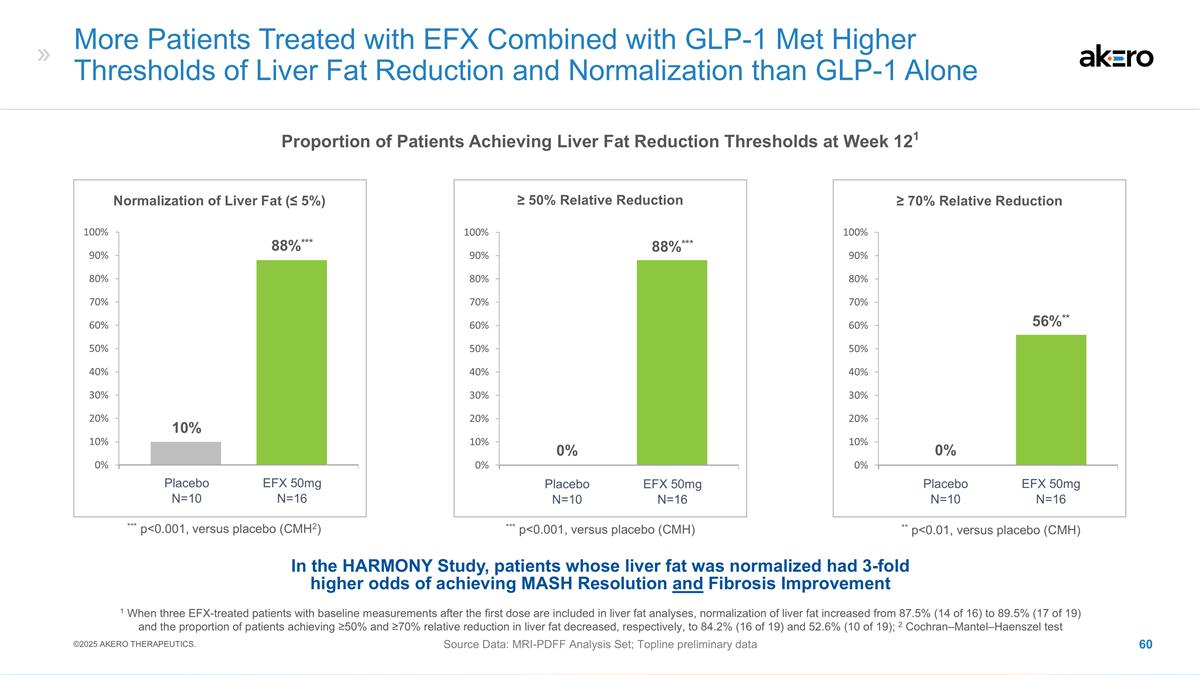
*** p<0.001, versus placebo (CMH) ≥ 50% Relative Reduction EFX 50mg Placebo N=16 N=10 ≥ 70% Relative Reduction 0% 88%*** EFX 50mg Placebo N=16 N=10 0% 56%** ** p<0.01, versus placebo (CMH) Normalization of Liver Fat (≤ 5%) EFX 50mg Placebo N=16 N=10 10% 88%*** *** p<0.001, versus placebo (CMH2) More Patients Treated with EFX Combined with GLP-1 Met Higher Thresholds of Liver Fat Reduction and Normalization than GLP-1 Alone Source Data: MRI-PDFF Analysis Set; Topline preliminary data Proportion of Patients Achieving Liver Fat Reduction Thresholds at Week 121 In the HARMONY Study, patients whose liver fat was normalized had 3-fold higher odds of achieving MASH Resolution and Fibrosis Improvement 1 When three EFX-treated patients with baseline measurements after the first dose are included in liver fat analyses, normalization of liver fat increased from 87.5% (14 of 16) to 89.5% (17 of 19) and the proportion of patients achieving ≥50% and ≥70% relative reduction in liver fat decreased, respectively, to 84.2% (16 of 19) and 52.6% (10 of 19); 2 Cochran–Mantel–Haenszel test ©2025 AKERO THERAPEUTICS.
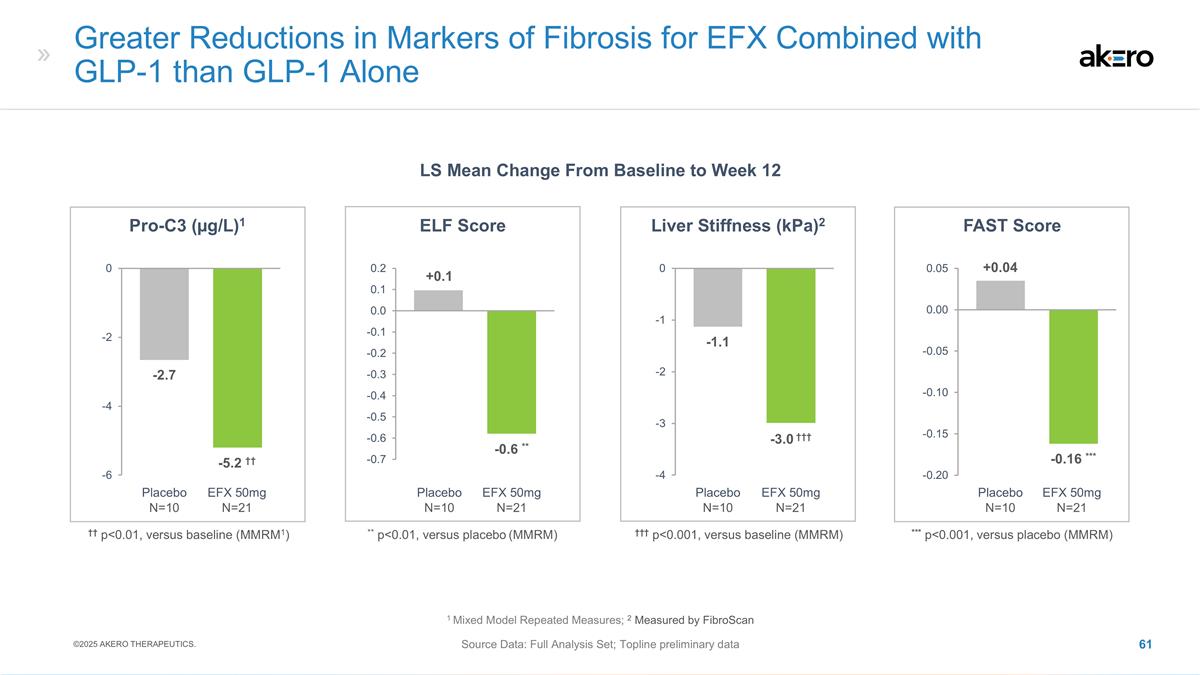
Greater Reductions in Markers of Fibrosis for EFX Combined with GLP-1 than GLP-1 Alone Source Data: Full Analysis Set; Topline preliminary data ELF Score -0.6 ** +0.1 EFX 50mg Placebo N=21 N=10 ** p<0.01, versus placebo (MMRM) -5.2 †† -2.7 Pro-C3 (µg/L)1 EFX 50mg Placebo N=21 N=10 †† p<0.01, versus baseline (MMRM1) -3.0 ††† -1.1 Liver Stiffness (kPa)2 EFX 50mg Placebo N=21 N=10 ††† p<0.001, versus baseline (MMRM) -0.16 *** +0.04 FAST Score EFX 50mg Placebo N=21 N=10 *** p<0.001, versus placebo (MMRM) LS Mean Change From Baseline to Week 12 1 Mixed Model Repeated Measures; 2 Measured by FibroScan ©2025 AKERO THERAPEUTICS.
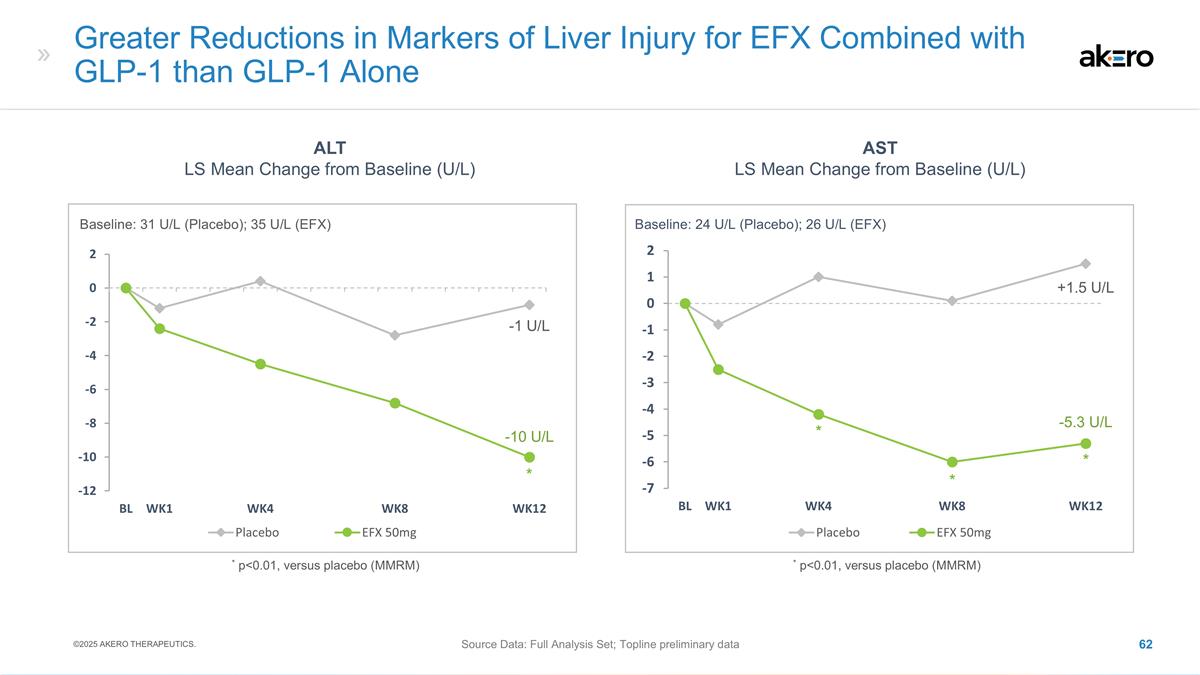
Greater Reductions in Markers of Liver Injury for EFX Combined with GLP-1 than GLP-1 Alone * p<0.01, versus placebo (MMRM) * p<0.01, versus placebo (MMRM) * * ALT LS Mean Change from Baseline (U/L) * * AST LS Mean Change from Baseline (U/L) Baseline: 31 U/L (Placebo); 35 U/L (EFX) Baseline: 24 U/L (Placebo); 26 U/L (EFX) -10 U/L -5.3 U/L Source Data: Full Analysis Set; Topline preliminary data -1 U/L +1.5 U/L ©2025 AKERO THERAPEUTICS.
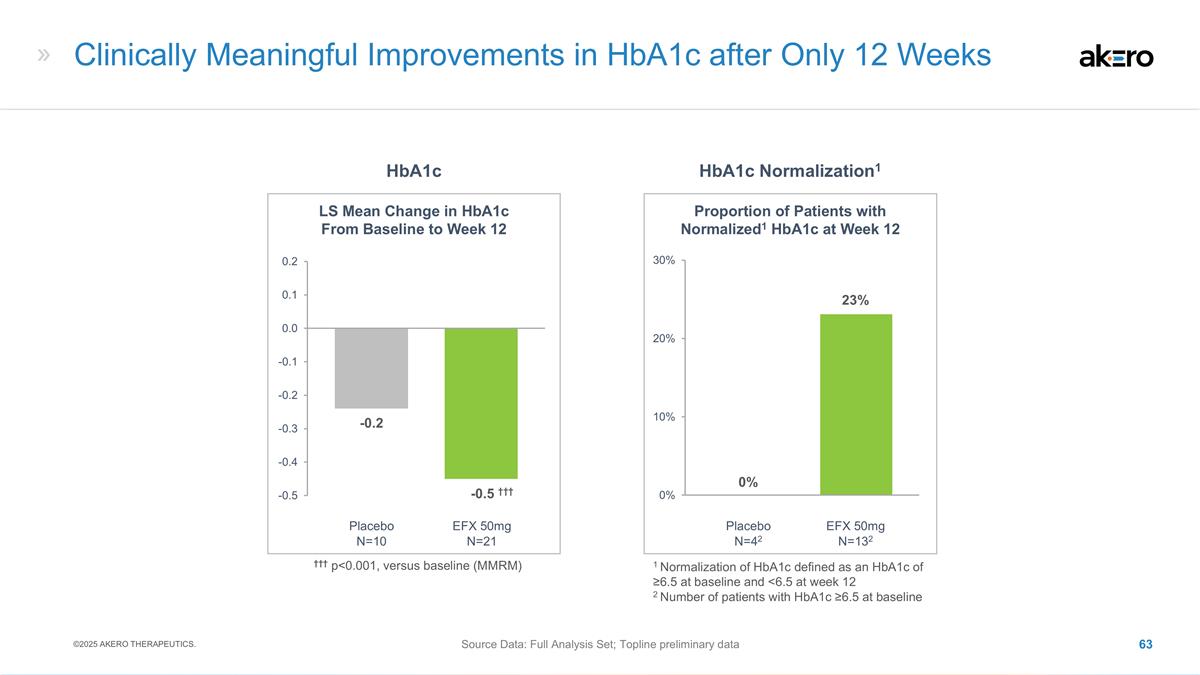
Clinically Meaningful Improvements in HbA1c after Only 12 Weeks Source Data: Full Analysis Set; Topline preliminary data 23% 0% -0.2 LS Mean Change in HbA1c From Baseline to Week 12 Proportion of Patients with Normalized1 HbA1c at Week 12 EFX 50mg Placebo N=21 N=10 EFX 50mg Placebo N=132 N=42 1 Normalization of HbA1c defined as an HbA1c of ≥6.5 at baseline and <6.5 at week 12 2 Number of patients with HbA1c ≥6.5 at baseline ††† p<0.001, versus baseline (MMRM) ††† -0.5 ††† HbA1c HbA1c Normalization1 ©2025 AKERO THERAPEUTICS.
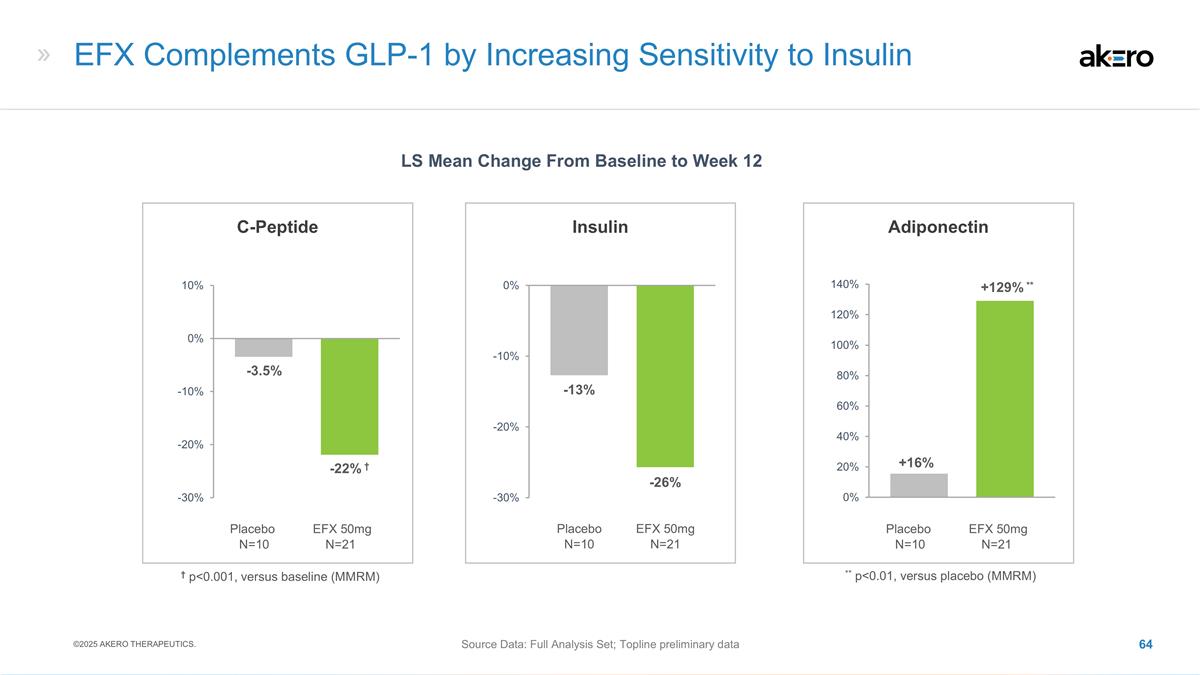
C-Peptide -3.5% EFX 50mg Placebo N=21 N=10 -22% † † p<0.001, versus baseline (MMRM) EFX Complements GLP-1 by Increasing Sensitivity to Insulin Source Data: Full Analysis Set; Topline preliminary data +16% Adiponectin LS Mean Change From Baseline to Week 12 EFX 50mg Placebo N=21 N=10 +129% ** +129% ** p<0.01, versus placebo (MMRM) Insulin EFX 50mg Placebo N=21 N=10 -13% -26% ©2025 AKERO THERAPEUTICS.
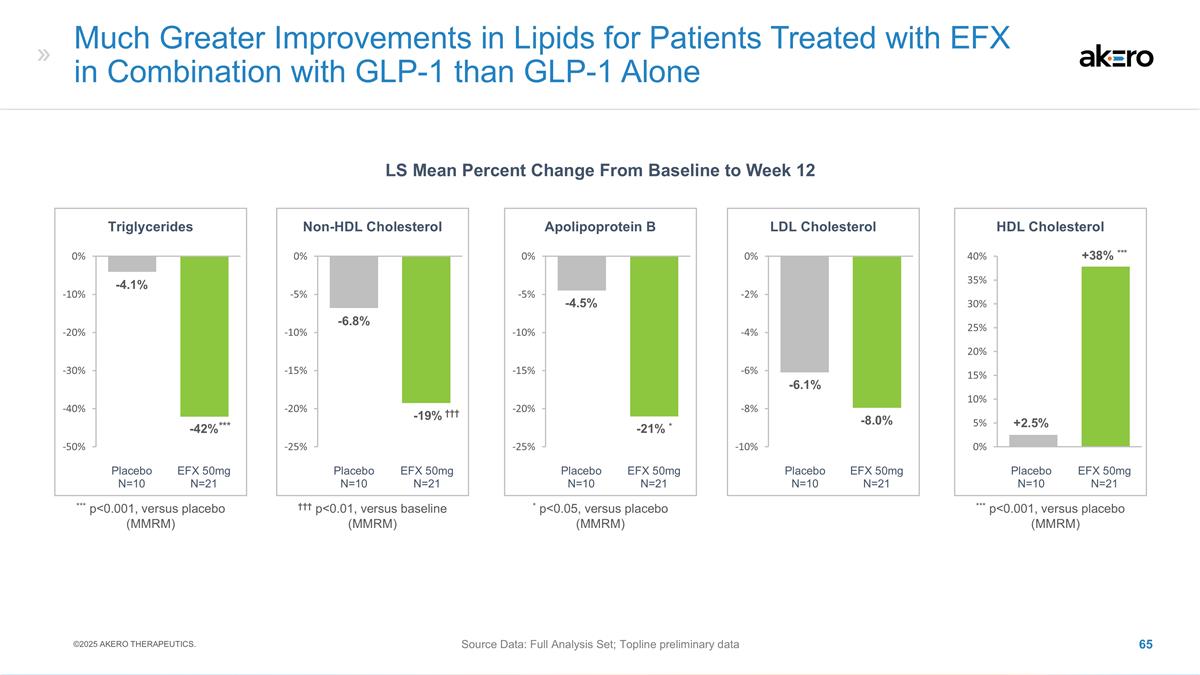
*** p<0.001, versus placebo (MMRM) *** p<0.001, versus placebo Much Greater Improvements in Lipids for Patients Treated with EFX in Combination with GLP-1 than GLP-1 Alone LS Mean Percent Change From Baseline to Week 12 Source Data: Full Analysis Set; Topline preliminary data ††† p<0.01, versus baseline HDL Cholesterol LDL Cholesterol Non-HDL Cholesterol Triglycerides EFX 50mg Placebo N=21 N=10 EFX 50mg Placebo N=21 N=10 EFX 50mg Placebo N=21 N=10 EFX 50mg Placebo N=21 N=10 EFX 50mg Placebo N=21 N=10 (MMRM) Apolipoprotein B * p<0.05, versus placebo (MMRM) (MMRM) -4.1% ***-42%*** -42% -6.8% † †† -19% ††† -6.1% -8.0% -4.5% -21% * +2.5% +38% *** ©2025 AKERO THERAPEUTICS.
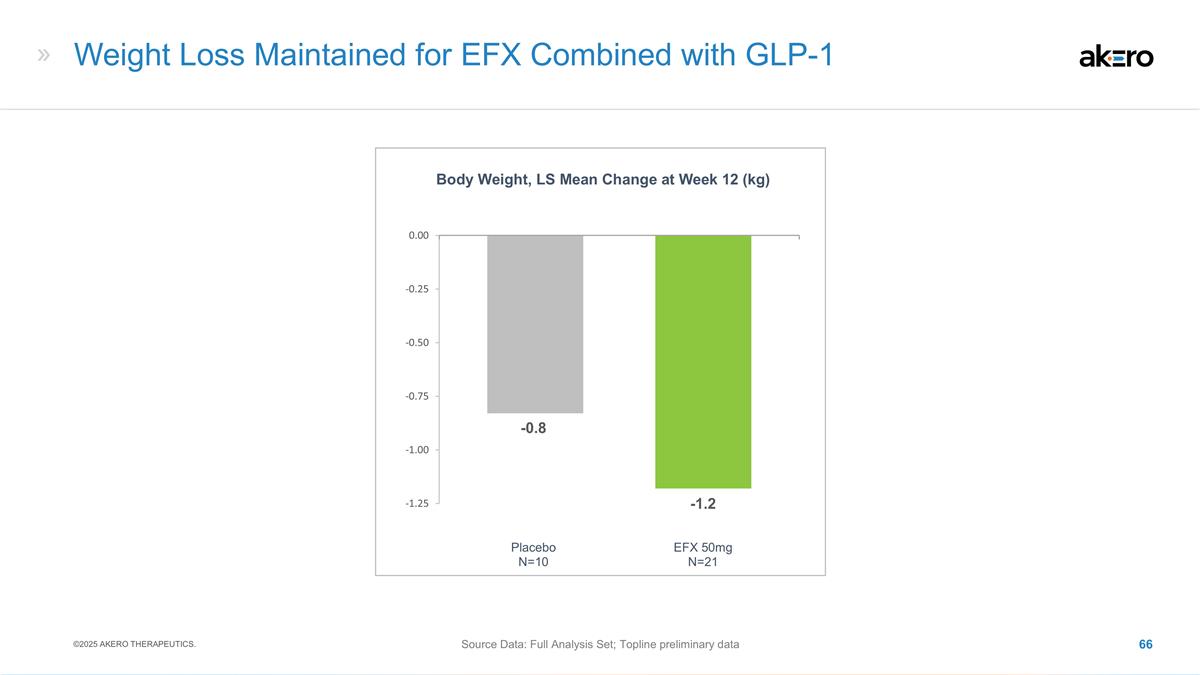
Weight Loss Maintained for EFX Combined with GLP-1 Source Data: Full Analysis Set; Topline preliminary data -0.8 Body Weight, LS Mean Change at Week 12 (kg) -1.2 EFX 50mg Placebo N=21 N=10 ©2025 AKERO THERAPEUTICS.
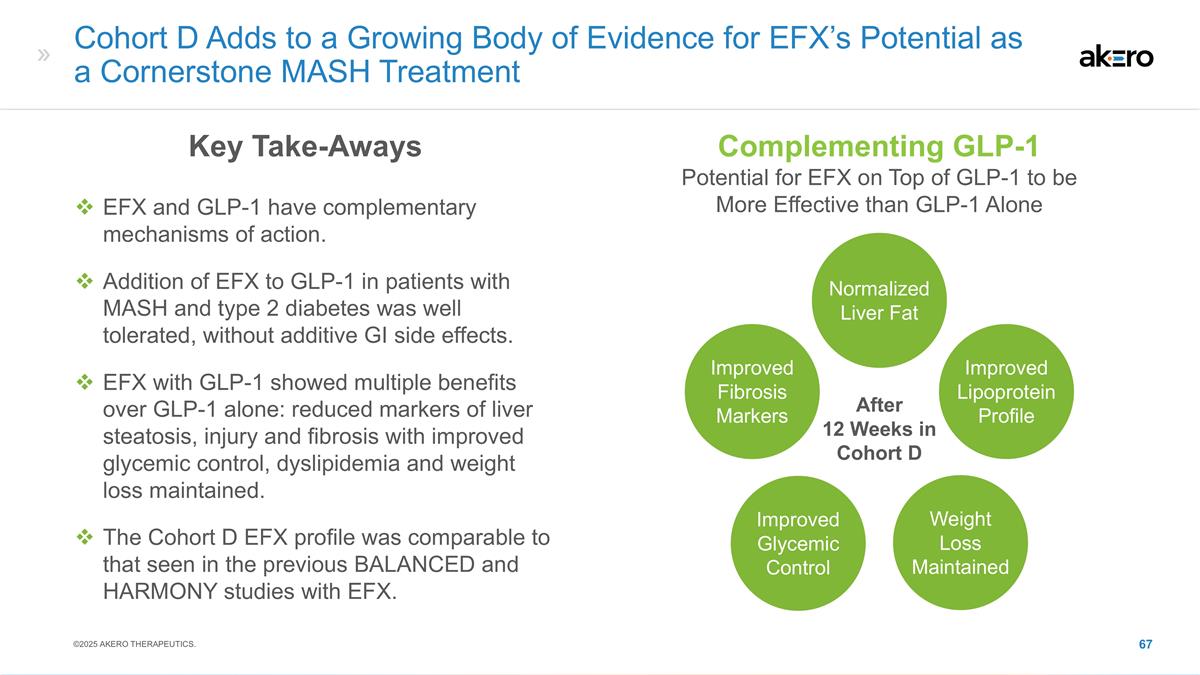
Normalized Liver Fat Complementing GLP-1 Potential for EFX on Top of GLP-1 to be More Effective than GLP-1 Alone Improved Lipoprotein Profile Improved Fibrosis Markers Improved Glycemic Control Weight Loss Maintained Cohort D Adds to a Growing Body of Evidence for EFX’s Potential as a Cornerstone MASH Treatment Key Take-Aways EFX and GLP-1 have complementary mechanisms of action. Addition of EFX to GLP-1 in patients with MASH and type 2 diabetes was well tolerated, without additive GI side effects. EFX with GLP-1 showed multiple benefits over GLP-1 alone: reduced markers of liver steatosis, injury and fibrosis with improved glycemic control, dyslipidemia and weight loss maintained. The Cohort D EFX profile was comparable to that seen in the previous BALANCED and HARMONY studies with EFX. After 12 Weeks in Cohort D ©2025 AKERO THERAPEUTICS.
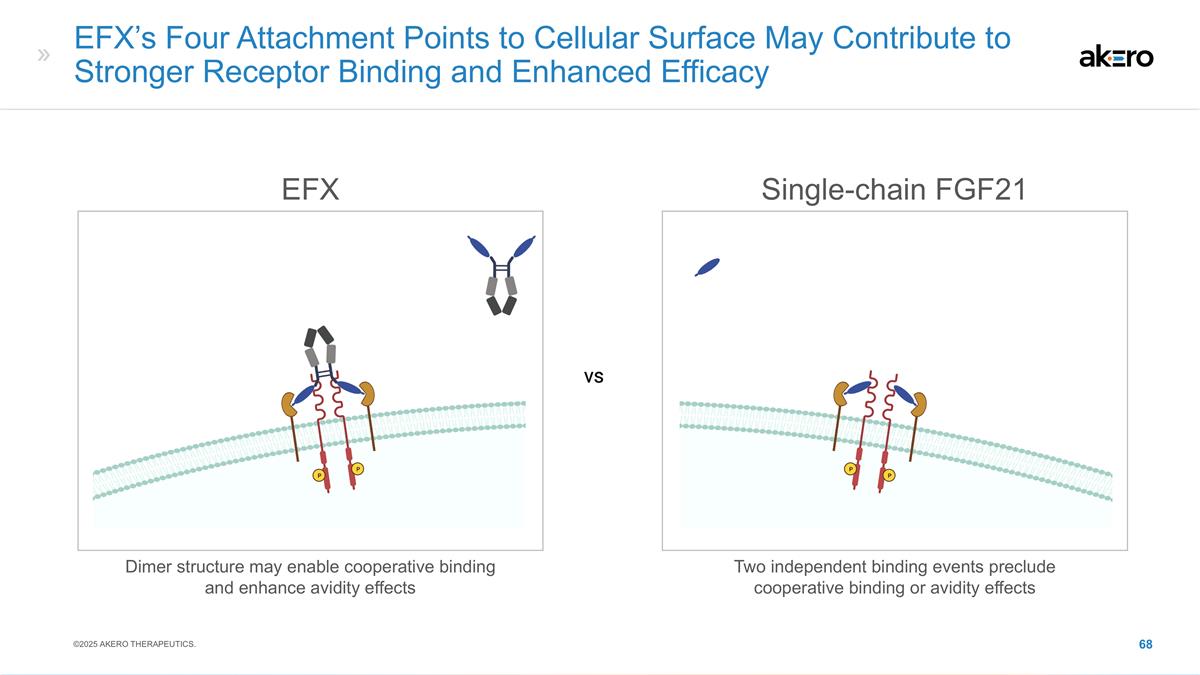
EFX’s Four Attachment Points to Cellular Surface May Contribute to Stronger Receptor Binding and Enhanced Efficacy Dimer structure may enable cooperative binding and enhance avidity effects EFX Single-chain FGF21 Two independent binding events preclude cooperative binding or avidity effects ©2025 AKERO THERAPEUTICS.
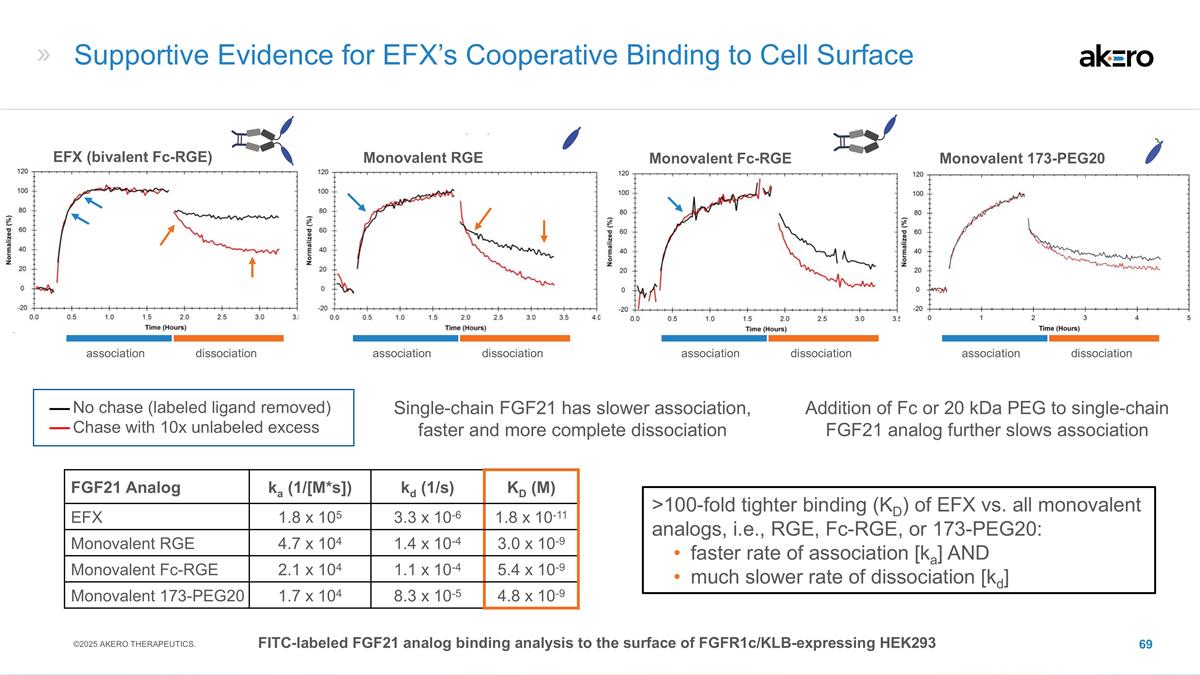
Supportive Evidence for EFX’s Cooperative Binding to Cell Surface Single-chain FGF21 has slower association, faster and more complete dissociation Addition of Fc or 20 kDa PEG to single-chain FGF21 analog further slows association FGF21 Analog ka (1/[M*s]) kd (1/s) KD (M) EFX 1.8 x 10⁵ 3.3 x 10⁻⁶ 1.8 x 10⁻¹¹ Monovalent RGE 4.7 x 10⁴ 1.4 x 10⁻⁴ 3.0 x 10⁻⁹ Monovalent Fc-RGE 2.1 x 10⁴ 1.1 x 10⁻⁴ 5.4 x 10⁻⁹ Monovalent 173-PEG20 1.7 x 10⁴ 8.3 x 10⁻⁵ 4.8 x 10⁻⁹ association dissociation Monovalent RGE No chase (labeled ligand removed) Chase with 10x unlabeled excess FITC-labeled FGF21 analog binding analysis to the surface of FGFR1c/KLB-expressing HEK293 EFX (bivalent Fc-RGE) >100-fold tighter binding (KD) of EFX vs. all monovalent analogs, i.e., RGE, Fc-RGE, or 173-PEG20: faster rate of association [ka] AND much slower rate of dissociation [kd] association dissociation association dissociation association dissociation Monovalent Fc-RGE Monovalent 173-PEG20 ©2025 AKERO THERAPEUTICS.
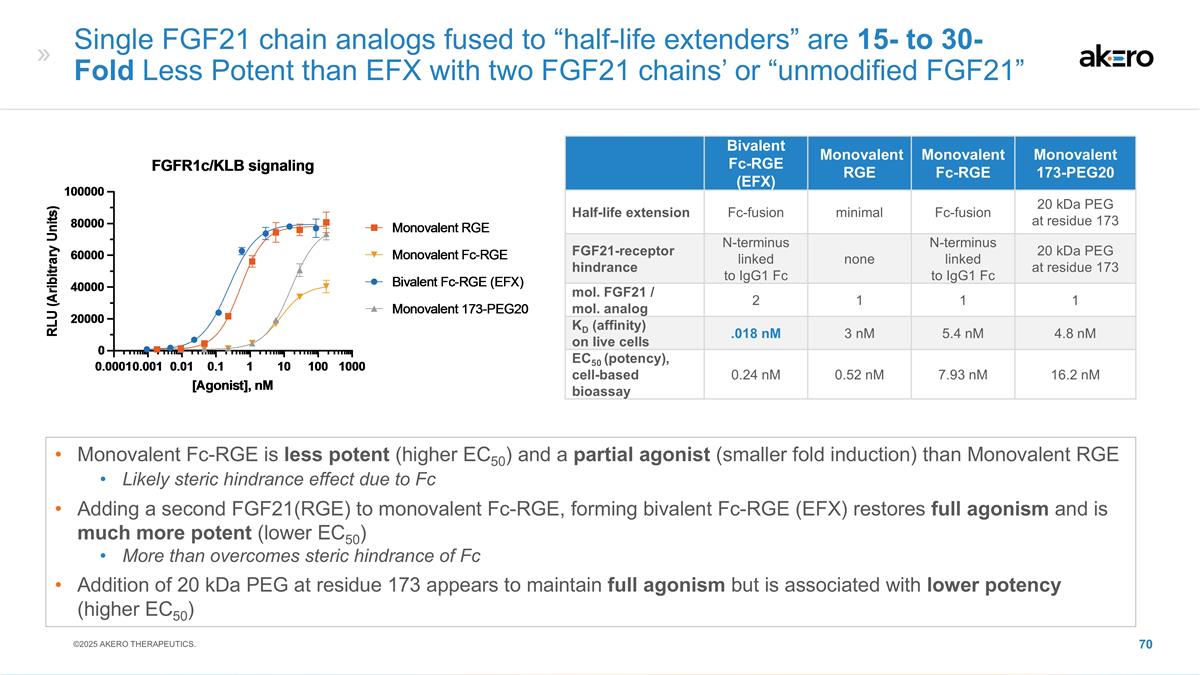
Single FGF21 chain analogs fused to “half-life extenders” are 15- to 30-Fold Less Potent than EFX with two FGF21 chains’ or “unmodified FGF21” Monovalent Fc-RGE is less potent (higher EC50) and a partial agonist (smaller fold induction) than Monovalent RGE Likely steric hindrance effect due to Fc Adding a second FGF21(RGE) to monovalent Fc-RGE, forming bivalent Fc-RGE (EFX) restores full agonism and is much more potent (lower EC50) More than overcomes steric hindrance of Fc Addition of 20 kDa PEG at residue 173 appears to maintain full agonism but is associated with lower potency (higher EC50) Bivalent Fc-RGE (EFX) Monovalent RGE Monovalent Fc-RGE Monovalent 173-PEG20 Half-life extension Fc-fusion minimal Fc-fusion 20 kDa PEG at residue 173 FGF21-receptor hindrance N-terminus linked to IgG1 Fc none N-terminus linked to IgG1 Fc 20 kDa PEG at residue 173 mol. FGF21 / mol. analog 2 1 1 1 KD (affinity) on live cells .018 nM 3 nM 5.4 nM 4.8 nM EC50 (potency), cell-based bioassay 0.24 nM 0.52 nM 7.93 nM 16.2 nM ©2025 AKERO THERAPEUTICS.

AKERO THERAPEUTICS 601 Gateway Boulevard Suite 350 South San Francisco, CA 94080


