UNITED STATES
SECURITIES AND EXCHANGE COMMISSION
Washington, D.C. 20549
FORM N-CSR
CERTIFIED SHAREHOLDER REPORT OF REGISTERED
MANAGEMENT INVESTMENT COMPANIES
Investment Company Act file number: 811-23360
Broadstone Real Estate Access Fund
(Exact name of registrant as specified in charter)
1345 Avenue of the Americas, Suite 32A
New York, NY 10105
(Address of principal executive offices) (Zip code)
Richard J. Byrne, Chief Executive Officer
c/o Benefit Street Partners L.L.C.
9 West 57th Street, Suite 4920
New York, New York 10019
(212)588-6770
(Name and Address of Agent for Service)
COPIES TO:
JoAnn M. Strasser
Thompson Hine LLP
41 South High Street, Suite 1700
Columbus, Ohio 43215
(641)469-3265
Registrant’s telephone number, including area code: (585)287-6500
Date of fiscal year end: September 30
Date of reporting period: October 1, 2019 – March 31, 2020
| Item 1. | Reports to Stockholders. |

TABLE OF CONTENTS
Shareholder Letter | 1 |
Portfolio Update | 3 |
Schedule of Investments | 5 |
Statement of Assets and Liabilities | 8 |
Statement of Operations | 9 |
Statement of Changes in Net Assets | 10 |
Statement of Cash Flows | 11 |
Financial Highlights | 12 |
Notes to Financial Statements | 16 |
Additional Information | 25 |
Board Considerations Regarding Approval of Advisory and Sub-Advisory Agreements | 26 |
Privacy Notice | 28 |
Beginning on January 1, 2021, as permitted by regulations adopted by the U.S. Securities and Exchange Commission, paper copies of the Fund’s annual and semi-annual shareholder reports will no longer be sent by mail, unless you specifically request paper copies of the reports. Instead, the reports will be made available on the Fund’s website at www.bdrex.com, and you will be notified by mail each time a report is posted and provided with a website link to access the report.
You may, notwithstanding the availability of shareholder reports online, elect to receive all future shareholder reports in paper free of charge. If you invest through a financial intermediary, you can contact your financial intermediary to request that you continue to receive paper copies of your shareholder reports. If you invest directly with the Fund, you can call (833) 280-4479 to let the Fund know you wish to continue receiving paper copies of your shareholder reports.
If you already elected to receive shareholder reports electronically, you will not be affected by this change and you need not take any action. You may elect to receive shareholder reports and other communications from the Fund electronically anytime by contacting your financial intermediary (such as a broker-dealer or bank) or, if you are a direct investor, by calling (833) 280-4479.
Broadstone Real Estate Access Fund | Shareholder Letter |
| March 31, 2020 (Unaudited) |
Dear Shareholders:
We want to first say that it is our hope that this letter finds you and your family safe and healthy. At the time of drafting this letter, we are living in unprecedented circumstances, and we recognize that many of you are experiencing a significant disruption to everyday life. As events continue to unfold, our thoughts always return to our shareholders and their well-being.
The following is the Broadstone Real Estate Access Fund (the “Fund”) Semiannual Report. In the first quarter of this year, Benefit Street Partners (“BSP”) became the investment adviser for the Fund. BSP is a leading alternative asset manager with approximately $28 billion in assets under management as of March 31, 2020. BSP is a wholly owned subsidiary of Franklin Resources, Inc. that, with its various subsidiaries, operates as Franklin Templeton. BSP closed and became the new manager effective February 7th, 2020. Despite COVID-19, it was a relatively seamless transition, and we were able to shift to a work-from-home environment and maintain our same level of portfolio management. Our key third party providers and investment managers also remained fully operational and accessible.
Also in February 2020, the Fund closed on its first direct asset. As you know, the Broadstone Real Estate Access Fund was built to provide investors unique access to a broadly diversified portfolio of real estate investments via three sleeves: Public Real Estate Equities; Private Real Estate Funds; and Direct Real Estate Transactions. With this acquisition, the Fund now has investments in all three sleeves. We have positioned investments across the strategy in the following ways:
| 1) | We believe one advantage of the Public Real Estate Equities sleeve is the ability to be nimble in our investment strategy. In response to market conditions, we adjusted some of our allocations, increasing our exposure to data centers and industrial assets while reducing exposure to sectors like retail, hospitality, and healthcare. In the first quarter of 2020, we also increased our call writing activity to take advantage of outsized volatility. |
| 2) | The Private Real Estate Fund sleeve was built with the goal of being recession resistant. For example, investments like the USAA Government Building Fund (“USAA”) were selected, because their performance should be less susceptible to economic disruptions. In the USAA portfolio, the main tenant is the GSA1, which continues to be 100% current on its rent payments to date. Our investments in funds focused on core real estate assets were chosen, in part, because they have minimal exposure to hospitality and retail assets, and no exposure to malls. We also have made investments in pure play strategies focused on industrial and multifamily assets which we believe may weather a recession and rebound more quickly, or even outperform other asset classes. Our real estate debt exposure continues to provide access to income-generating commercial real estate loans. |
| 3) | As mentioned above, we closed on our first asset in the Direct Real Estate Transactions sleeve. The Fund acquired a single-tenant net lease medical office property near Indianapolis at a 7.3% yield. The building is fully leased to a medical office tenant with attractive credit and nine years of lease term remaining. While this investment closed prior to the COVID-19 disruptions, it provides a good example of our ability to find investments that should perform well in adverse conditions. We look forward to further building out this part of the strategy. |
The Fund seeks to mitigate risk for investors through the portfolio diversification we have achieved. While providing access to the core real estate asset classes, the strategy also provides investment in more niche property types like data centers and self-storage, which we believe may generate alpha over the long-term. Additionally, the Fund is designed to avoid being overexposed to market specific trends by being geographically diverse. Over the longer-term, we continue to believe that the right investments to focus on are real estate markets and assets that are supported by demographic growth and which provide a favorable quality of life.
Thank you for being a shareholder. We continue to remain focused on providing you a well-diversified and resilient real estate portfolio that continues to meet the Fund’s investment objectives of income and long-term capital appreciation.
Kate Davis
President and Portfolio Manager
Broadstone Real Estate Access Fund
1 | GSA is the Government Services Agency, which is the US Federal Government agency that manages federal property for the Government’s various organizations and military. |
Semi-Annual Report | March 31, 2020 (Unaudited) | 1 |
Broadstone Real Estate Access Fund | Shareholder Letter |
| March 31, 2020 (Unaudited) |
Past performance is no guarantee of future results.
The Fund intends to make a dividend distribution each quarter to its shareholders. As portfolio and market conditions change, distributions will vary and targeted quarterly distributions may not be obtained in the future. Dividends are not guaranteed and a company’s future abilities to pay dividends may be limited. Portions of the distributions that the Fund makes may be a return of the money that shareholders originally invested and represent a return of capital to shareholders for tax purposes.
The views in this shareholder letter were as of the letter’s publication date and may not reflect the views on the date this letter is first distributed or anytime thereafter. These views are intended to assist readers in understanding the Fund’s investment methodology and do not constitute investment advice.
Diversification does not ensure profit or prevent loss.
Call writing activity refers to an investment contract in which a fee, or premium, is paid to the writer in exchange for the right to buy or sell shares at a future price and date. Put and call options for stocks are typically written in lots, with each lot representing 100 shares.
Yield refers to the earnings generated and realized on an investment over a particular period of time. It’s expressed as a percentage based on the invested amount, current market value, or face value of the security. It includes the interest earned or dividends received from holding a particular security. Depending on the valuation (fixed vs. fluctuating) of the security, yields may be classified as known or anticipated.
2 | www.bdrex.com |
Broadstone Real Estate Access Fund | Portfolio Update |
| March 31, 2020 (Unaudited) |
Investment Objective
The Fund’s investment objective is to seek to generate a return comprised of both current income and long-term capital appreciation with low to moderate volatility and low correlation to the broader markets. There can be no assurance that the Fund will achieve its investment objective.
Average Annual Total Returns (as of March 31, 2020)
| 6 Month | 1 Year | Since Inception* |
Broadstone Real Estate Access Fund - Class I | -9.21% | -3.61% | 2.92%(a) |
Broadstone Real Estate Access Fund - Class W | -9.32% | -3.89% | 2.70%(a) |
Bloomberg Barclays US Aggregate Bond Index(b) | 3.33% | 8.93% | 9.75% |
Wilshire US Real Estate Securities Index(c) | -26.53% | -19.47% | -7.08% |
FTSE NAREIT Equity REITs Index(d)(e) | -27.86% | -21.26% | -7.88% |
* | Fund’s inception date is October 4, 2018, with commencement of operations on October 5, 2018. |
(a) | Excludes adjustments in accordance with accounting principles generally accepted in the United States of America and as such, the net asset value and total return for shareholder transactions reported to the market may differ from the net asset value for financial reporting purposes. |
(b) | The Bloomberg Barclays US Aggregate Bond Index is a broad-based flagship benchmark that measures the investment grade, US dollar-denominated, fixed-rate taxable bond market. The index includes Treasuries, government-related and corporate securities, mortgage-backed securities (agency fixed-rate and hybrid adjustable-rate mortgage pass-throughs), asset-backed securities and commercial mortgage-backed securities (agency and non-agency). |
(c) | The Wilshire US Real Estate Securities Index measures U.S. publicly-traded real estate securities. Designed to offer a market-based index that is more reflective of real estate held by pension funds, the index is comprised of publicly-traded real estate equity securities and unencumbered by limitations of other appraisal-based indexes. It can serve as a proxy for direct real estate investing by excluding securities whose value is not always tied to the value of the underlying real estate. |
(d) | The FTSE Nareit All Equity REITs Index is a free-float adjusted, market capitalization-weighted index of U.S. equity REITs. Constituents of the index include all tax-qualified REITs with more than 50 percent of total assets in qualifying real estate assets other than mortgages secured by real property. |
(e) | The Fund changed its benchmark from Wilshire US Real Estate Securities Index to the FTSE NAREIT Equity REITs Index because the Adviser believes the new benchmark represents a better comparison against which to measure the Fund’s performance. |
The performance data quoted above represents past performance. Past performance is not a guarantee of future results. Current performance may be lower or higher than the performance quoted. Investment return and value of the Fund shares will fluctuate so that an investor’s shares, when sold or redeemed, may be worth more or less than their original cost. Total return measures net investment income and capital gain or loss from portfolio investments. All performance shown assumes reinvestment of dividends and capital gains distributions. Fund performance current to the most recent month-end is available by calling (833) 280-4479 or by visiting www.bdrex.com.
The Broadstone Real Estate Access Fund is a continuously offered, non-diversified, closed-end management investment company that is operated as an interval fund. The Fund is suitable only for investors who can bear the risks associated with the Fund’s limited liquidity and should be viewed as a long-term investment. The Fund’s shares have no history of public trading, nor is it intended that its shares will be listed on a national securities exchange at this time, if ever. Investing in the Fund’s shares may be speculative and involves a high degree of risk, including the risks associated with leverage. Investing in the Fund involves risk, including the risk that shareholders may receive little or no return on their investment or that shareholders may lose part or all of their investment.
Semi-Annual Report | March 31, 2020 (Unaudited) | 3 |
Broadstone Real Estate Access Fund | Portfolio Update |
| March 31, 2020 (Unaudited) |
Performance of $1,000,000 Initial Investment (as of March 31, 2020)
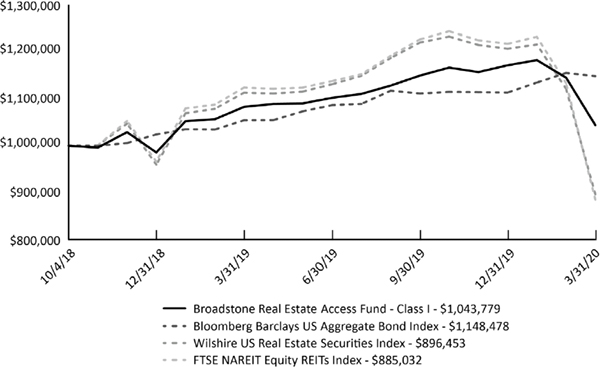
The graph shown above represents historical performance of a hypothetical investment of $1,000,000 in the Fund since inception. Past performance does not guarantee future results. All returns reflect reinvested dividends, but do not reflect the deduction of taxes that a shareholder would pay on Fund distributions or the redemption of Fund shares.
Sector Allocation (as a % of Net Assets)*
Private Real Estate Funds | 67.94% |
Public Equity Real Estate Securities | 41.91% |
Direct Real Estate | 4.22% |
Cash, Cash Equivalents, Leverage, & Other Net Assets | -14.07% |
| 100.00% |
Top Ten Holdings (as a % of Net Assets)*
TCM CRE Credit Fund, LP | 23.26% |
USAA US Government Building Open-End Feeder, LP | 9.45% |
CBRE U.S. Core Partners, LP | 9.22% |
Clarion Lion Properties Fund | 7.76% |
Sentinel Real Estate Fund, LP | 6.36% |
Voya Commercial Mortgage Lending Fund, LP | 5.65% |
Prologis, Inc. | 4.43% |
Ent Noblesville | 4.22% |
Clarion Lion Industrial Trust | 3.87% |
Equinix, Inc. | 3.53% |
Top Ten Holdings | 77.75% |
* | Holdings are subject to change, and may not reflect the current or future position of the portfolio. Tables present indicative values only. |
4 | www.bdrex.com |
Broadstone Real Estate Access Fund | Schedule of Investments |
March 31, 2020 (Unaudited)
|
| Shares |
| Value |
| ||
PRIVATE REAL ESTATE SECURITIES (67.94%) |
|
|
|
|
|
|
|
CBRE U.S. Core Partners, LP(a) |
|
| 3,342,469 |
| $ | 4,895,307 |
|
Clarion Lion Industrial Trust |
|
| 1,000 |
|
| 2,054,616 |
|
Clarion Lion Properties Fund(a) |
|
| 2,648 |
|
| 4,122,509 |
|
PA MAC FUND, LP(b) |
|
| N/A |
|
| 1,259,729 |
|
Sentinel Real Estate Fund, LP(a) |
|
| 37 |
|
| 3,377,913 |
|
TCM CRE Credit Fund, LP(a) |
|
| 12,478 |
|
| 12,353,100 |
|
USAA US Government Building Open-End Feeder, LP(b) |
|
| N/A |
|
| 5,020,544 |
|
Voya Commercial Mortgage Lending Fund, LP(b) |
|
| N/A |
|
| 2,999,156 |
|
TOTAL PRIVATE REAL ESTATE SECURITIES (Cost $35,231,298) |
|
|
|
|
| 36,082,874 |
|
PUBLIC EQUITY REAL ESTATE SECURITIES (41.91%)(c) |
|
|
|
|
|
|
|
Agree Realty Corp. |
|
| 6,100 |
|
| 377,590 |
|
Alexandria Real Estate Equities, Inc. |
|
| 3,200 |
|
| 438,592 |
|
American Assets Trust, Inc. |
|
| 5,200 |
|
| 130,000 |
|
American Campus Communities, Inc. |
|
| 18,900 |
|
| 524,475 |
|
Apartment Investment & Management Co., Class A |
|
| 22,700 |
|
| 797,905 |
|
AvalonBay Communities, Inc. |
|
| 2,300 |
|
| 338,491 |
|
Boston Properties, Inc. |
|
| 10,500 |
|
| 968,415 |
|
Brixmor Property Group, Inc. |
|
| 23,300 |
|
| 221,350 |
|
Camden Property Trust |
|
| 8,400 |
|
| 665,616 |
|
Columbia Property Trust, Inc. |
|
| 16,700 |
|
| 208,750 |
|
CubeSmart |
|
| 19,048 |
|
| 510,296 |
|
CyrusOne, Inc. |
|
| 21,000 |
|
| 1,296,750 |
|
DiamondRock Hospitality Co. |
|
| 65,183 |
|
| 331,130 |
|
Duke Realty Corp. |
|
| 36,500 |
|
| 1,181,870 |
|
Equinix, Inc. |
|
| 3,000 |
|
| 1,873,710 |
|
Equity LifeStyle Properties, Inc. |
|
| 8,000 |
|
| 459,840 |
|
Equity Residential |
|
| 6,400 |
|
| 394,944 |
|
Extra Space Storage, Inc. |
|
| 10,000 |
|
| 957,600 |
|
Federal Realty Investment Trust |
|
| 2,600 |
|
| 193,986 |
|
Four Corners Property Trust, Inc. |
|
| 29,319 |
|
| 548,558 |
|
Healthpeak Properties, Inc. |
|
| 44,600 |
|
| 1,063,710 |
|
Highwoods Properties, Inc. |
|
| 17,400 |
|
| 616,308 |
|
Host Hotels & Resorts, Inc. |
|
| 10,268 |
|
| 113,359 |
|
Hudson Pacific Properties, Inc. |
|
| 24,600 |
|
| 623,856 |
|
Invitation Homes, Inc. |
|
| 47,248 |
|
| 1,009,690 |
|
Life Storage, Inc. |
|
| 2,163 |
|
| 204,512 |
|
National Retail Properties, Inc. |
|
| 24,900 |
|
| 801,531 |
|
New Senior Investment Group, Inc. |
|
| 28,100 |
|
| 71,936 |
|
Pebblebrook Hotel Trust |
|
| 28,117 |
|
| 306,194 |
|
Physicians Realty Trust |
|
| 32,500 |
|
| 453,050 |
|
Prologis, Inc. |
|
| 29,300 |
|
| 2,354,841 |
|
Simon Property Group, Inc. |
|
| 5,976 |
|
| 327,843 |
|
UDR, Inc. |
|
| 21,500 |
|
| 785,610 |
|
Weingarten Realty Investors |
|
| 19,600 |
|
| 282,828 |
|
See Notes to Unaudited Financial Statements.
Semi-Annual Report | March 31, 2020 (Unaudited) | 5 |
Broadstone Real Estate Access Fund | Schedule of Investments |
March 31, 2020 (Unaudited)
|
| Shares |
| Value (Note 2) |
| ||
PUBLIC EQUITY REAL ESTATE SECURITIES (continued) |
|
|
|
|
|
|
|
Welltower, Inc. |
|
| 18,000 |
| $ | 824,040 |
|
TOTAL PUBLIC EQUITY REAL ESTATE SECURITIES (Cost $26,461,686) |
|
|
|
|
| 22,259,176 |
|
DIRECT REAL ESTATE (4.22%) |
|
|
|
|
|
|
|
Ent Noblesville |
|
| 2,211,142 |
|
| 2,242,702 |
|
TOTAL DIRECT REAL ESTATE (Cost $2,242,702) |
|
|
|
|
| 2,242,702 |
|
SHORT TERM INVESTMENTS (1.97%) |
|
|
|
|
|
|
|
Fidelity Government Portfolio, Class I, 0.300%(d) (Cost $1,047,387) |
|
| 1,047,387 |
|
| 1,047,387 |
|
TOTAL SHORT TERM INVESTMENTS (Cost $1,047,387) |
|
|
|
|
| 1,047,387 |
|
TOTAL INVESTMENTS (116.04%) (Cost $64,983,073) |
|
|
|
| $ | 61,632,139 |
|
Liabilities In Excess Of Other Assets (-16.04%) |
|
|
|
|
| (8,519,706 | ) |
NET ASSETS (100.00%) |
|
|
|
| $ | 53,112,433 |
|
(a) | Security is unitized. |
(b) | Investment represents a non-public partnership interest and is not unitized. |
(c) | Securities are segregated as collateral for the Line of Credit as of March 31, 2020. |
(d) | Money market fund; interest rate reflects seven-day yield as of March 31, 2020. |
Common Abbreviations
LP - Limited Partnership.
See Notes to Unaudited Financial Statements.
6 | www.bdrex.com |
Broadstone Real Estate Access Fund | Schedule of Investments |
March 31, 2020 (Unaudited)
WRITTEN OPTION CONTRACTS
|
| Expiration Date |
| Exercise Price |
| Contracts |
| Premiums |
| Notional Value |
| Value |
| ||||||
WRITTEN CALL OPTIONS |
|
|
|
|
|
|
|
|
|
|
|
|
|
|
|
|
|
|
|
Alexandria Real Estate Equities, Inc. |
|
| 04/17/2020 |
| $ | 150.00 |
|
| (25 | ) | $ | 5,449 |
| $ | (342,650 | ) | $ | (7,782 | ) |
American Campus Communities, Inc. |
|
| 04/17/2020 |
|
| 30.00 |
|
| (18 | ) |
| 2,213 |
|
| (49,950 | ) |
| (1,175 | ) |
Apartment Investment & Management Co. |
|
| 04/17/2020 |
|
| 35.00 |
|
| (91 | ) |
| 14,559 |
|
| (319,865 | ) |
| (23,157 | ) |
AvalonBay Communities, Inc. |
|
| 04/17/2020 |
|
| 160.00 |
|
| (18 | ) |
| 4,733 |
|
| (264,906 | ) |
| (4,932 | ) |
Boston Properties, Inc. |
|
| 04/17/2020 |
|
| 95.00 |
|
| (15 | ) |
| 4,789 |
|
| (138,345 | ) |
| (5,099 | ) |
Boston Properties, Inc. |
|
| 04/17/2020 |
|
| 100.00 |
|
| (69 | ) |
| 11,494 |
|
| (636,387 | ) |
| (11,608 | ) |
Camden Property Trust |
|
| 04/17/2020 |
|
| 85.00 |
|
| (67 | ) |
| 40,732 |
|
| (530,908 | ) |
| (32,022 | ) |
DiamondRock Hospitality Co. |
|
| 04/17/2020 |
|
| 7.50 |
|
| (443 | ) |
| 5,742 |
|
| (225,044 | ) |
| (10,516 | ) |
Duke Realty Corp. |
|
| 04/17/2020 |
|
| 35.00 |
|
| (272 | ) |
| 20,645 |
|
| (880,736 | ) |
| (23,751 | ) |
Equinix, Inc. |
|
| 04/17/2020 |
|
| 640.00 |
|
| (24 | ) |
| 32,320 |
|
| (1,498,968 | ) |
| (56,378 | ) |
Extra Space Storage, Inc. |
|
| 04/17/2020 |
|
| 105.00 |
|
| (18 | ) |
| 1,583 |
|
| (172,368 | ) |
| (1,857 | ) |
Four Corners Property Trust, Inc. |
|
| 04/17/2020 |
|
| 20.00 |
|
| (235 | ) |
| 18,661 |
|
| (439,685 | ) |
| (22,953 | ) |
Highwoods Properties, Inc. |
|
| 04/17/2020 |
|
| 45.00 |
|
| (58 | ) |
| 12,351 |
|
| (205,436 | ) |
| (393 | ) |
Highwoods Properties, Inc. |
|
| 04/17/2020 |
|
| 40.00 |
|
| (81 | ) |
| 7,785 |
|
| (286,902 | ) |
| (2,929 | ) |
Hudson Pacific Properties, Inc. |
|
| 04/17/2020 |
|
| 25.00 |
|
| (197 | ) |
| 24,223 |
|
| (499,592 | ) |
| (46,220 | ) |
Invitation Homes, Inc. |
|
| 04/17/2020 |
|
| 30.00 |
|
| (247 | ) |
| 14,566 |
|
| (527,839 | ) |
| (1,137 | ) |
Pebblebrook Hotel Trust |
|
| 04/17/2020 |
|
| 12.50 |
|
| (270 | ) |
| 6,823 |
|
| (294,030 | ) |
| (11,375 | ) |
Prologis, Inc. |
|
| 04/17/2020 |
|
| 80.00 |
|
| (234 | ) |
| 69,303 |
|
| (1,880,658 | ) |
| (107,487 | ) |
Simon Property Group, Inc. |
|
| 04/17/2020 |
|
| 65.00 |
|
| (48 | ) |
| 22,462 |
|
| (263,328 | ) |
| (5,700 | ) |
Welltower, Inc. |
|
| 04/17/2020 |
|
| 50.00 |
|
| (144 | ) |
| 66,825 |
|
| (659,232 | ) |
| (20,325 | ) |
Total Written Call Options |
|
|
|
|
|
|
|
|
|
| $ | 387,258 |
|
|
|
| $ | (396,796 | ) |
Additional information on investments in Private Real Estate Securities:
Value |
|
| Security |
|
| Redemption Frequency |
|
| Redemption Notice |
| Unfunded Commitments March 31, 2020 |
| ||
$ | 4,895,307 |
|
| CBRE U.S. Core Partners, LP |
|
| Quarterly |
|
| 60 |
| $ | 2,000,000 |
|
| 4,122,509 |
|
| Clarion Lion Properties Fund |
|
| Quarterly |
|
| 90 |
|
| – |
|
| 3,377,913 |
|
| Sentinel Real Estate Fund, LP |
|
| Quarterly |
|
| N/A* |
|
| – |
|
| 12,353,100 |
|
| TCM CRE Credit Fund, LP |
|
| Quarterly |
|
| 90 |
|
| – |
|
| 5,020,544 |
|
| USAA US Government Building Fund Open-End Feeder, LP |
|
| Quarterly |
|
| 60 |
|
| – |
|
| 1,259,729 |
|
| PA MAC FUND, LP |
|
| N/A |
|
| N/A |
|
| 8,194,976 |
|
| 2,054,616 |
|
| Clarion Lion Industrial Trust |
|
| Quarterly |
|
| 90 |
|
| 4,000,000 |
|
| 2,999,156 |
|
| Voya Commercial Mortgage Lending Fund, LP |
|
| Quarterly |
|
| 90 |
|
| – |
|
$ | 36,082,874 |
|
|
|
|
|
|
|
|
|
| $ | 14,194,976 |
|
* | Written notice required for redemption, no minimum timeline required. |
See Notes to Unaudited Financial Statements.
Semi-Annual Report | March 31, 2020 (Unaudited) | 7 |
Broadstone Real Estate Access Fund | Statement of |
March 31, 2020 (Unaudited)
ASSETS |
|
|
|
|
Investments, at value (Cost $62,740,371) |
| $ | 59,389,437 |
|
Real estate investments, at value (Cost $2,242,702) |
|
| 2,242,702 |
|
Receivable for investments sold |
|
| 324,002 |
|
Receivable for shares sold |
|
| 632,133 |
|
Dividends and interest receivable |
|
| 514,506 |
|
Interest receivable, Real estate investments |
|
| 3 |
|
Prepaid expenses and other assets |
|
| 41,376 |
|
Prepaid expenses and other assets, Real estate investments |
|
| 918 |
|
Total Assets |
|
| 63,145,077 |
|
LIABILITIES |
|
|
|
|
Written options, at value (premiums received $387,258) |
|
| 396,796 |
|
Payable for investments purchased |
|
| 208,042 |
|
Shareholder servicing fees payable (Note 4) |
|
| 235 |
|
Lines of credit payable (Note 9) |
|
| 8,584,553 |
|
Lines of credit interest payable (Note 9) |
|
| 16,502 |
|
Investment advisory fees payable (Note 4) |
|
| 31,680 |
|
Administration fees payable (Note 4) |
|
| 13,715 |
|
Transfer agency fees payable (Note 4) |
|
| 8,007 |
|
Payable for distributions |
|
| 674,881 |
|
Chief compliance officer fees payable (Note 4) |
|
| 3,545 |
|
Trustees’ fees payable (Note 4) |
|
| 30,235 |
|
Professional fees payable |
|
| 54,660 |
|
Custody fees payable |
|
| 7,744 |
|
Accrued expenses and other liabilities |
|
| 2,049 |
|
Total Liabilities |
|
| 10,032,644 |
|
Total Commitments and Contingencies (Note 2) |
|
| – |
|
NET ASSETS |
| $ | 53,112,433 |
|
NET ASSETS CONSIST OF |
|
|
|
|
Paid-in capital |
| $ | 58,281,936 |
|
Total distributable earnings |
|
| (5,169,503 | ) |
NET ASSETS |
| $ | 53,112,433 |
|
PRICING OF SHARES |
|
|
|
|
Class I |
|
|
|
|
Net asset value and offering |
| $ | 9.34 |
|
Net assets |
| $ | 52,584,530 |
|
Shares of beneficial interest outstanding (unlimited number of shares, no par value common stock authorized) |
|
| 5,632,721 |
|
Class W |
|
|
|
|
Net asset value and offering |
| $ | 9.34 |
|
Net assets |
| $ | 527,903 |
|
Shares of beneficial interest outstanding (unlimited number of shares, no par value common stock authorized) |
|
| 56,538 |
|
See Notes to Unaudited Financial Statements.
8 | www.bdrex.com |
Broadstone Real Estate Access Fund | Statement of Operations |
|
| For the Six |
| |
INVESTMENT INCOME |
|
|
|
|
Dividend income |
| $ | 1,467,499 |
|
Income distributions from Real estate |
|
| 24,506 |
|
Interest, Real estate investments |
|
| 3 |
|
Total Investment Income |
|
| 1,492,008 |
|
EXPENSES |
|
|
|
|
Investment advisory fees (Note 4) |
|
| 340,739 |
|
Administration fees (Note 4) |
|
| 88,976 |
|
Transfer agency fees (Note 4) |
|
| 34,055 |
|
Shareholder servicing fees (Note 4) |
|
|
|
|
Class W |
|
| 596 |
|
Professional fees |
|
| 85,046 |
|
Reports to shareholders and printing fees |
|
| 6,826 |
|
State registration fees |
|
| 22,098 |
|
Insurance fees |
|
| 20,695 |
|
Custody fees |
|
| 22,814 |
|
Chief compliance officer fees (Note 4) |
|
| 21,253 |
|
Offering cost (Note 2) |
|
| 5,751 |
|
Interest expense (Note 9) |
|
| 149,195 |
|
Trustees’ fees (Note 4) |
|
| 49,335 |
|
Other expenses |
|
| 4,796 |
|
Total Expenses |
|
| 852,175 |
|
Fees waived/expenses reimbursed by Adviser (Note 4) |
|
| (227,857 | ) |
Net Expenses |
|
| 624,318 |
|
Net Investment Income |
|
| 867,690 |
|
Net realized loss on investments |
|
| (2,904,756 | ) |
Net realized gain on written options |
|
| 1,405,652 |
|
Net realized loss |
|
| (1,499,104 | ) |
Net change in unrealized depreciation on investments |
|
| (4,978,338 | ) |
Net change in unrealized depreciation on written options |
|
| (9,084 | ) |
Net change in unrealized depreciation |
|
| (4,987,422 | ) |
NET REALIZED AND UNREALIZED LOSS ON INVESTMENTS |
|
| (6,486,526 | ) |
NET DECREASE IN NET ASSETS RESULTING FROM OPERATIONS |
| $ | (5,618,836 | ) |
See Notes to Unaudited Financial Statements.
Semi-Annual Report | March 31, 2020 (Unaudited) | 9 |
Broadstone Real Estate Access Fund | Statement of |
|
| For the Six |
| For the Period |
| ||
OPERATIONS |
|
|
|
|
|
|
|
Net investment income |
| $ | 867,690 |
| $ | 910,208 |
|
Net realized gain/(loss) on investments |
|
| (1,499,104 | ) |
| 2,673,730 |
|
Net change in unrealized appreciation/(depreciation) on investments |
|
| (4,987,422 | ) |
| 1,626,949 |
|
Net Increase/(Decrease) in Net Assets Resulting from Operations |
|
| (5,618,836 | ) |
| 5,210,887 |
|
DISTRIBUTIONS TO SHAREHOLDERS |
|
|
|
|
|
|
|
Class I |
|
|
|
|
|
|
|
From distributable earnings |
|
| (2,622,172 | ) |
| (2,362,633 | ) |
Class W |
|
|
|
|
|
|
|
From distributable earnings |
|
| (25,391 | ) |
| (10,791 | ) |
Total Distributions to Shareholders |
|
| (2,647,563 | ) |
| (2,373,424 | ) |
BENEFICIAL INTEREST TRANSACTIONS, IN DOLLARS |
|
|
|
|
|
|
|
Class I |
|
|
|
|
|
|
|
Shares sold |
| $ | 10,755,891 |
| $ | 46,018,922 |
|
Distributions reinvested |
|
| 872,342 |
|
| 742,436 |
|
Shares redeemed, net of redemption fees (Note 8) |
|
| (33,958 | ) |
| (413,744 | ) |
Class W |
|
|
|
|
|
|
|
Shares sold |
|
| 351,012 |
|
| 235,075 |
|
Distributions reinvested |
|
| 9,717 |
|
| 3,676 |
|
Shares redeemed |
|
| – |
|
| – |
|
Net Increase in Net Assets Derived from Beneficial Interest Transactions |
|
| 11,955,004 |
|
| 46,586,365 |
|
Net increase in net assets |
|
| 3,688,605 |
|
| 49,423,828 |
|
NET ASSETS |
|
|
|
|
|
|
|
Beginning of period |
|
| 49,423,828 |
|
| – |
|
End of period |
| $ | 53,112,433 |
| $ | 49,423,828 |
|
Other Information |
|
|
|
|
|
|
|
BENEFICIAL INTEREST TRANSACTIONS, IN SHARES |
|
|
|
|
|
|
|
Class I |
|
|
|
|
|
|
|
Beginning shares |
|
| 4,542,800 |
|
| – |
|
Shares sold |
|
| 1,010,627 |
|
| 4,511,912 |
|
Distributions reinvested |
|
| 82,452 |
|
| 69,874 |
|
Shares redeemed |
|
| (3,158 | ) |
| (38,986 | ) |
Net increase in shares outstanding |
|
| 1,089,921 |
|
| 4,542,800 |
|
Ending shares |
|
| 5,632,721 |
|
| 4,542,800 |
|
Class W |
|
|
|
|
|
|
|
Beginning shares |
|
| 23,010 |
|
| – |
|
Shares sold |
|
| 32,610 |
|
| 22,665 |
|
Distributions reinvested |
|
| 918 |
|
| 345 |
|
Net increase in shares outstanding |
|
| 33,528 |
|
| 23,010 |
|
Ending shares |
|
| 56,538 |
|
| 23,010 |
|
See Notes to Unaudited Financial Statements.
10 | www.bdrex.com |
Broadstone Real Estate Access Fund | Statement of Cash Flows |
|
| For the Six Months March 31, (Unaudited) |
| |
Cash Flows from Operating Activities: |
|
|
|
|
Net decrease in net assets resulting from operations |
| $ | (5,618,836 | ) |
Purchase of investments |
|
| (60,081,195 | ) |
Purchase of Real estate investments |
|
| (2,242,702 | ) |
Proceeds from sales |
|
| 55,103,182 |
|
Premiums received on closing written options transactions |
|
| 1,806,660 |
|
Net purchases of short-term investment securities |
|
| (564,354 | ) |
Net realized loss on investments |
|
| 2,904,756 |
|
Net realized gain on written options |
|
| (1,405,652 | ) |
Net change in unrealized depreciation on investments |
|
| 4,978,338 |
|
Net change in unrealized depreciation on written options |
|
| 9,084 |
|
(Increase)/Decrease in Assets: |
|
|
|
|
Dividends and interest receivable |
|
| (42,878 | ) |
Interest receivable, Real estate investments |
|
| (3 | ) |
Receivable due from Adviser |
|
| 5,426 |
|
Prepaid offering costs |
|
| 5,751 |
|
Prepaid expenses and other assets |
|
| (28,519 | ) |
Prepaid expenses and other assets, Real estate investments |
|
| (918 | ) |
Increase/(Decrease) in Liabilities: |
|
|
|
|
Shareholder servicing fees payable |
|
| 141 |
|
Investment advisory fees payable |
|
| 31,680 |
|
Administration fees payable |
|
| (2,368 | ) |
Transfer agency fees payable |
|
| (2,862 | ) |
Chief compliance officer fees payable |
|
| 3 |
|
Trustees’ fees payable |
|
| 4,775 |
|
Professional fees payable |
|
| (70,940 | ) |
Custody fees payable |
|
| (1,628 | ) |
Interest due on loan payable |
|
| (12,957 | ) |
Organizational fees payable |
|
| (119,643 | ) |
Accrued expenses and other liabilities |
|
| (288,022 | ) |
Net cash used for operating activities |
|
| (5,633,681 | ) |
Cash Flows from Financing Activities: |
|
|
|
|
Lines of credit borrowings |
|
| 10,548,415 |
|
Lines of credit repayment |
|
| (13,642,403 | ) |
Proceeds from shares sold |
|
| 10,915,467 |
|
Payment on shares redeemed |
|
| (33,958 | ) |
Cash distributions paid |
|
| (2,153,840 | ) |
Net cash provided by financing activities |
|
| 5,633,681 |
|
Net Change in Cash and Cash Equivalents |
|
| – |
|
Cash and cash equivalents, beginning of period |
| $ | – |
|
Cash and cash equivalents, end of period |
| $ | – |
|
Non-cash financing activities herein consist of reinvestment of distributions of: |
| $ | 882,059 |
|
Cash paid during the period for interest from bank borrowing: |
| $ | 162,152 |
|
See Notes to Unaudited Financial Statements.
Semi-Annual Report | March 31, 2020 (Unaudited) | 11 |
Broadstone Real Estate Access Fund – Class I | Financial Highlights |
For a Share Outstanding Throughout the Period Presented
|
| For the |
| For the Period |
| ||
Net asset value, beginning of period |
| $ | 10.82 |
| $ | 10.00 |
|
INCOME FROM INVESTMENT OPERATIONS |
|
|
|
|
|
|
|
Net investment income(a) |
|
| 0.17 |
|
| 0.28 |
|
Net realized and unrealized gain/(loss) |
|
| (1.15 | ) |
| 1.19 |
|
Total from investment operations |
|
| (0.98 | ) |
| 1.47 |
|
DISTRIBUTIONS |
|
|
|
|
|
|
|
From net investment income |
|
| (0.18 | ) |
| (0.06 | ) |
From net realized gain on investments |
|
| (0.32 | ) |
| (0.59 | ) |
Total distributions(b)(c) |
|
| (0.50 | ) |
| (0.65 | ) |
REDEMPTION FEES ADDED TO PAID-IN CAPITAL (NOTE 8) |
|
| – |
|
| – |
|
Net increase/(decrease) in net asset value |
|
| (1.48 | ) |
| 0.82 |
|
Net asset value, end of period |
| $ | 9.34 |
| $ | 10.82 |
|
TOTAL RETURN(d) |
|
| (9.39 | )% |
| 15.07 | % |
RATIOS/SUPPLEMENTAL DATA |
|
|
|
|
|
|
|
Net assets, end of period (000s) |
| $ | 52,585 |
| $ | 49,175 |
|
Ratios to Average Net Assets (including interest expense) |
|
|
|
|
|
|
|
Ratio of expenses to average net assets excluding fee waivers and reimbursements(e) |
|
| 3.12 | %(f) |
| 5.98 | %(f) |
Ratio of expenses to average net assets including fee waivers and reimbursements(e) |
|
| 2.29 | %(f) |
| 2.70 | %(f) |
Ratio of net investment income to average net assets(e)(g) |
|
| 3.18 | %(f) |
| 2.67 | %(f) |
Ratios to Average Net Assets (excluding interest expense) |
|
|
|
|
|
|
|
Ratio of expenses to average net assets excluding fee waivers and reimbursements(e) |
|
| 2.57 | %(f) |
| 5.02 | %(f) |
Ratio of expenses to average net assets including fee waivers and reimbursements(e) |
|
| 1.74 | %(f) |
| 1.74 | %(f) |
Ratio of net investment income to average net assets(e)(g) |
|
| 2.35 | %(f) |
| 1.71 | %(f) |
Portfolio turnover rate |
|
| 84 | %(h) |
| 123 | %(h) |
See Notes to Unaudited Financial Statements.
12 | www.bdrex.com |
Broadstone Real Estate Access Fund – Class I | Financial Highlights |
For a Share Outstanding Throughout the Period Presented
(a) | Calculated using the average shares method. |
(b) | Total distributions during a calendar year generally will be made from the Fund’s net investment income, net realized gains on investments and net unrealized gains on investments, if any. The portion of distributions paid not attributable to net investment income or net realized gains on investments, if any, is distributed from the Fund’s assets and is treated by shareholders as a nontaxable distribution (“Return of Capital”) for tax purposes. Return of Capital is a tax concept, not an economic concept. The tax character of the Fund’s distributions, in isolation, does not reveal much information about whether the distributions are supported by the Fund’s returns. Reported distributions from net investment income and realized gains on investments are not an indication as to whether or not the Fund’s distributions are supported by the Fund’s returns. A Fund can have distributions from net investment income and realized capital gains in years in which it incurs an economic loss due to unrealized losses not being recognized for tax purposes. A common method in which to determine if the Fund’s distributions are supported by economic returns is to examine the Fund’s Net Asset Value (“NAV”) over the course of a year. If the Fund’s NAV has increased, the Fund will have economically earned more than it has distributed, regardless of whether such distributions are reported as being from net investment income, net realized gains on investments or return of capital. If a Fund’s NAV decreases, the Fund will have distributed more than it has economically earned or it will have incurred an economic loss. |
(c) | The Fund has substantial investments in real estate investment trusts, or REITs, which are generally not subject to federal income taxes. Distributions that the Fund receives from REITs can be classified as ordinary income, capital gain income or return of capital by the REITs that make these distributions to the Fund. However, it is not possible for the Fund to characterize distributions received from REITs during interim periods because the REIT issuers do not report their tax characterizations until after year end. Final characterization of the Fund’s distributions to its common shareholders is also dependent upon the size or timing of the Fund’s securities transactions prior to year-end. Therefore, it is likely that some portion of the Fund’s investment income and distributions to its common shareholders will be recharacterized as long term capital gain and return of capital for financial statement and U.S. federal income tax purposes subsequent to year end and reflected accordingly in the Fund’s year-end financial statements. |
(d) | Total returns are calculated based on the October 5, 2018 commencement date and have not been annualized and do not reflect the impact of sales charge. Total returns would have been lower had certain expenses not been waived during the period. Returns shown do not reflect the deduction of taxes that a shareholder would pay on Fund distributions or the redemption of Fund shares. |
(e) | The ratios of expenses to average net assets and net investment income to average net assets do not reflect the expenses of the underlying private real estate funds in which the Fund invests which typically range from 0.80% to 1.25% on an annual basis. However, the Fund invests in each underlying private real estate investment fund based upon the NAV of each such fund which reflects the costs of investing in the applicable fund, including the management fee of the underlying fund and other operating expenses. |
(f) | Annualized. |
(g) | Recognition of net investment income is affected by the timing and declaration of dividends by the underlying investment companies in which the Fund invests. |
(h) | Not annualized. |
See Notes to Unaudited Financial Statements.
Semi-Annual Report | March 31, 2020 (Unaudited) | 13 |
Broadstone Real Estate Access Fund – Class W | Financial Highlights |
For a Share Outstanding Throughout the Period Presented
|
| For the |
| For the Period |
| ||
Net asset value, beginning of period |
| $ | 10.82 |
| $ | 10.00 |
|
INCOME FROM INVESTMENT OPERATIONS |
|
|
|
|
|
|
|
Net investment income(a) |
|
| 0.16 |
|
| 0.25 |
|
Net realized and unrealized gain/(loss) |
|
| (1.15 | ) |
| 1.20 |
|
Total from investment operations |
|
| (0.99 | ) |
| 1.45 |
|
DISTRIBUTIONS |
|
|
|
|
|
|
|
From net investment income |
|
| (0.17 | ) |
| (0.05 | ) |
From net realized gain on investments |
|
| (0.32 | ) |
| (0.58 | ) |
Total distributions(b)(c) |
|
| (0.49 | ) |
| (0.63 | ) |
REDEMPTION FEES ADDED TO PAID-IN CAPITAL (NOTE 8) |
|
| – |
|
| – |
|
Net increase/(decrease) in net asset value |
|
| (1.48 | ) |
| 0.82 |
|
Net asset value, end of period |
| $ | 9.34 |
| $ | 10.82 |
|
TOTAL RETURN(d) |
|
| (9.50 | )% |
| 14.85 | % |
RATIOS/SUPPLEMENTAL DATA |
|
|
|
|
|
|
|
Net assets, end of period (000s) |
| $ | 528 |
| $ | 249 |
|
Ratios to Average Net Assets (including interest expense) |
|
|
|
|
|
|
|
Ratio of expenses to average net assets excluding fee waivers and reimbursements(e) |
|
| 3.35 | %(f) |
| 6.54 | %(f) |
Ratio of expenses to average net assets including fee waivers and reimbursements(e) |
|
| 2.52 | %(f) |
| 2.95 | %(f) |
Ratio of net investment income to average net assets(e)(g) |
|
| 3.02 | %(f) |
| 2.40 | %(f) |
Ratios to Average Net Assets (excluding interest expense) |
|
|
|
|
|
|
|
Ratio of expenses to average net assets excluding fee waivers and reimbursements(e) |
|
| 2.82 | %(f) |
| 5.58 | %(f) |
Ratio of expenses to average net assets including fee waivers and reimbursements(e) |
|
| 1.99 | %(f) |
| 1.99 | %(f) |
Ratio of net investment income to average net assets(e)(g) |
|
| 2.19 | %(f) |
| 1.44 | %(f) |
Portfolio turnover rate |
|
| 84 | %(h) |
| 123 | %(h) |
See Notes to Unaudited Financial Statements.
14 | www.bdrex.com |
Broadstone Real Estate Access Fund – Class W | Financial Highlights |
For a Share Outstanding Throughout the Period Presented
(a) | Calculated using the average shares method. |
(b) | Total distributions during a calendar year generally will be made from the Fund’s net investment income, net realized gains on investments and net unrealized gains on investments, if any. The portion of distributions paid not attributable to net investment income or net realized gains on investments, if any, is distributed from the Fund’s assets and is treated by shareholders as a nontaxable distribution (“Return of Capital”) for tax purposes. Return of Capital is a tax concept, not an economic concept. The tax character of the Fund’s distributions, in isolation, does not reveal much information about whether the distributions are supported by the Fund’s returns. Reported distributions from net investment income and realized gains on investments are not an indication as to whether or not the Fund’s distributions are supported by the Fund’s returns. A Fund can have distributions from net investment income and realized capital gains in years in which it incurs an economic loss due to unrealized losses not being recognized for tax purposes. A common method in which to determine if the Fund’s distributions are supported by economic returns is to examine the Fund’s Net Asset Value (“NAV”) over the course of a year. If the Fund’s NAV has increased, the Fund will have economically earned more than it has distributed, regardless of whether such distributions are reported as being from net investment income, net realized gains on investments or return of capital. If a Fund’s NAV decreases, the Fund will have distributed more than it has economically earned or it will have incurred an economic loss. |
(c) | The Fund has substantial investments in real estate investment trusts, or REITs, which are generally not subject to federal income taxes. Distributions that the Fund receives from REITs can be classified as ordinary income, capital gain income or return of capital by the REITs that make these distributions to the Fund. However, it is not possible for the Fund to characterize distributions received from REITs during interim periods because the REIT issuers do not report their tax characterizations until after year end. Final characterization of the Fund’s distributions to its common shareholders is also dependent upon the size or timing of the Fund’s securities transactions prior to year-end. Therefore, it is likely that some portion of the Fund’s investment income and distributions to its common shareholders will be recharacterized as long term capital gain and return of capital for financial statement and U.S. federal income tax purposes subsequent to year end and reflected accordingly in the Fund’s year-end financial statements. |
(d) | Total returns are calculated based on the October 5, 2018 commencement date and have not been annualized and do not reflect the impact of sales charge. Total returns would have been lower had certain expenses not been waived during the period. Returns shown do not reflect the deduction of taxes that a shareholder would pay on Fund distributions or the redemption of Fund shares. |
(e) | The ratios of expenses to average net assets and net investment income to average net assets do not reflect the expenses of the underlying private real estate funds in which the Fund invests which typically range from 0.80% to 1.25% on an annual basis. However, the Fund invests in each underlying private real estate investment fund based upon the NAV of each such fund which reflects the costs of investing in the applicable fund, including the management fee of the underlying fund and other operating expenses. |
(f) | Annualized. |
(g) | Recognition of net investment income is affected by the timing and declaration of dividends by the underlying investment companies in which the Fund invests. |
(h) | Not annualized. |
See Notes to Unaudited Financial Statements.
Semi-Annual Report | March 31, 2020 (Unaudited) | 15 |
Broadstone Real Estate Access Fund | Notes to Financial Statements |
March 31, 2020 (Unaudited)
1. ORGANIZATION
Broadstone Real Estate Access Fund (the “Fund”) was organized as a Delaware statutory trust on May 25, 2018 and is registered with the U.S. Securities and Exchange Commission (“SEC”) under the Investment Company Act of 1940, as amended, (the “1940 Act”), as a non-diversified, closed-end management investment company. The Fund operates as an interval fund with a continuous offering of Fund shares and will offer to make quarterly repurchases of shares at net asset value (“NAV”). The Fund’s investment adviser is Benefit Street Partners, L.L.C. (the “Adviser”). The Fund’s investment objective is to seek to generate a return comprised of both current income and long-term capital appreciation with low-to-moderate volatility and low correlation to the broader markets. The Fund intends to pursue its investment objective by strategically investing across Public Real Estate Equities, Private Real Estate Funds, and Direct Real Estate Transactions.
The Fund currently offers Class W and Class I shares. Class W and Class I shares commenced operations on October 5, 2018 and are offered at NAV. Prior to that the Fund had no operations other than matters relating to its organization. Each class represents an interest in the same assets of the Fund and classes are identical except for differences in their ongoing shareholder service plan charges. Both classes of shares have equal voting privileges except that each class has exclusive voting rights with respect to its shareholder servicing plan. The Fund’s income, expenses (other than class specific shareholder servicing fees) and realized and unrealized gains and losses are allocated proportionately each day based upon the relative net assets of each class.
2. SIGNIFICANT ACCOUNTING POLICIES
Basis of Presentation – The following is a summary of significant accounting policies followed by the Fund in preparation of its financial statements. These policies are in conformity with accounting principles generally accepted in the United States of America (“U.S. GAAP”). The Fund is an investment company and accordingly follows the investment company accounting and reporting guidance of the Financial Accounting Standards Board (“FASB”) Accounting Standards Codification (“ASC”) Topic 946 “Financial Services – Investment Companies” including FASB Accounting Standards Update (“ASU”) 2013-08.
Use of Estimates – The preparation of the financial statements requires management to make estimates and assumptions that affect the reported amounts of assets and liabilities and disclosure of contingent assets and liabilities at the date of the financial statements. Actual results could differ from these estimates.
Securities Valuation – Investments in securities are valued at fair value as determined by the Valuation Committee of the Adviser (the “Valuation Committee”), pursuant to delegation from the Fund’s Board of Trustees (the “Board”). Investments in securities listed on an exchange are valued at the last reported sale price at the close of the regular trading session of the exchange on the business day the value is being determined, or in the case of securities listed on NASDAQ, at the NASDAQ Official Closing Price (“NOCP”). Short-term investments that mature in 60 days or less may be valued at amortized cost, provided such valuations represent fair value.
When price quotations for certain securities are not readily available, or if the available quotations are not believed to be reflective of market value by the Adviser, those securities will be valued at fair value as determined in good faith by the Valuation Committee, using procedures adopted by and under the supervision of the Board. There can be no assurance that the Fund could purchase or sell a portfolio security at the price used to calculate the Fund’s NAV.
Fair valuation procedures may be used to value a substantial portion of the assets of the Fund. The Fund may use the fair value of a security to calculate its NAV when, for example, (1) a portfolio security is not traded in a public market or the principal market in which the security trades is closed, (2) trading in a portfolio security is suspended and not resumed prior to the normal market close, (3) a portfolio security is not traded in significant volume for a substantial period, or (4) the Adviser determines that the quotation or price for a portfolio security provided by a broker-dealer or independent pricing service is inaccurate.
The fair value of securities may be difficult to determine and thus judgment plays a greater role in the valuation process. The fair value methodology may include or consider the following guidelines, as appropriate: (1) evaluation of all relevant factors, including but not limited to, pricing history, current market level, supply and demand of the respective security; (2) comparison to the values and current pricing of securities that have comparable characteristics; (3) knowledge of historical market information with respect to the security; (4) other factors relevant to the security which would include, but not be limited to, duration, yield, fundamental analytical data, the U.S. Treasury yield curve, and credit quality.
In making its determination of fair value, the Valuation Committee may retain and rely upon valuations obtained from independent valuation firms; provided that the Valuation Committee shall not be required to determine fair value in accordance with the valuation provided by any single source, and the Valuation Committee shall retain the discretion to use any relevant data, including information obtained from any independent third-party valuation or pricing service, that the Valuation Committee deems to be reliable in determining fair value under the circumstances.
16 | www.bdrex.com |
Broadstone Real Estate Access Fund | Notes to Financial Statements |
March 31, 2020 (Unaudited)
Valuation of Private Real Estate Investment Trusts – The Fund may invest a portion of its assets in Private Real Estate Investment Trusts (each, a “Private REIT”). The Private REITs measure their investment assets at fair value, and report a NAV on a calendar quarter basis. In accordance with ASC 820, the Fund has elected to apply the practical expedient and to value its investments in Private REITs at their respective NAVs at each quarter. As of March 31, 2020, all of the Fund’s investments in Private REITs were valued at their respective sponsor issued NAVs and have not been classified in the fair value hierarchy.
Fair Value Measurements – A three-tier hierarchy has been established to classify fair value measurements for disclosure purposes. Inputs refer broadly to the assumptions that market participants would use in pricing the asset or liability, including assumptions about risk. Inputs may be observable or unobservable. Observable inputs are inputs that reflect the assumptions market participants would use in pricing the asset or liability that are developed based on market data obtained from sources independent of the reporting entity. Unobservable inputs are inputs that reflect the reporting entity’s own assumptions about the assumptions market participants would use in pricing the asset or liability that are developed based on the best information available.
The Fund utilizes various methods to measure the fair value of most of its investments on a recurring basis. U.S. GAAP establishes a hierarchy that prioritizes inputs to valuation methods as follows:
Level 1 - | Unadjusted quoted prices in active markets for identical assets and liabilities that the Fund has the ability to access on the measurement date and on an on-going basis |
Level 2 - | Quoted prices which are not active, quoted prices for similar assets or liabilities in active markets or inputs other than quoted prices that are observable (either directly or indirectly) for substantially the full term of the asset or liability at the measurement date; and |
Level 3 - | Significant unobservable inputs for the asset or liability, to the extent relevant observable inputs are not available, representing the Fund’s own assumptions about the assumptions a market participant would use in valuing the asset or liability, and would be based on the best information available. |
The availability of observable inputs can vary from security to security and is affected by a wide variety of factors, including, for example, the type of security, whether the security is new and not yet established in the marketplace, the liquidity of markets, and other characteristics particular to the security. To the extent that valuation is based on models or inputs that are less observable or unobservable in the market, the determination of fair value requires more judgment. Accordingly, the degree of judgment exercised in determining fair value is greatest for instruments categorized in Level 3.
The inputs used to measure fair value may fall into different levels of the fair value hierarchy. In such cases, for disclosure purposes, the level in the fair value hierarchy within which the fair value measurement falls in its entirety, is determined based on the lowest level input that is significant to the fair value measurement in its entirety.
Semi-Annual Report | March 31, 2020 (Unaudited) | 17 |
Broadstone Real Estate Access Fund | Notes to Financial Statements |
March 31, 2020 (Unaudited)
The inputs or methodology used for valuing securities are not necessarily an indication of the risk or liquidity associated with investing in those securities. The following tables summarize the valuation of the Fund’s investments under the fair value hierarchy levels as of March 31, 2020:
Investments in Securities at Value |
| Level 1 - Unadjusted Quoted Prices |
| Level 2 - Other Significant Observable Inputs |
| Level 3 - Significant Unobservable Inputs |
| Total |
| ||||
Private Real Estate Securities(a) |
| $ | – |
| $ | – |
| $ | – |
| $ | 36,082,874 |
|
Public Equity Real Estate Securities |
|
| 22,259,176 |
|
| — |
|
| – |
|
| 22,259,176 |
|
Direct Real Estate |
|
| – |
|
| 2,242,702 |
|
| – |
|
| 2,242,702 |
|
Short Term Investments |
|
| 1,047,387 |
|
| – |
|
| – |
|
| 1,047,387 |
|
Total |
| $ | 23,306,563 |
| $ | 2,242,702 |
| $ | – |
| $ | 61,632,139 |
|
Other Financial Instruments |
|
|
|
|
|
|
|
|
|
|
|
|
|
Liabilities |
|
|
|
|
|
|
|
|
|
|
|
|
|
Written Call Options |
| $ | – |
| $ | (396,796 | ) | $ | – |
| $ | (396,796 | ) |
Total |
| $ | – |
| $ | (396,796 | ) | $ | – |
| $ | (396,796 | ) |
(a) | In accordance with Subtopic 820-10, certain investments that are measured at fair value using the net asset value per share (or its equivalent) practical expedient have not been categorized in the fair value hierarchy. The fair value amounts presented in this table are intended to permit reconciliation of the fair value hierarchy to the amounts presented in the Statement of Assets and Liabilities. |
For the six months ended March 31, 2020, the Fund did not use any significant unobservable inputs (Level 3) when determining fair value.
Unfunded Commitments – Typically, when the Fund invests in a Private REIT, the Fund makes a commitment to invest a specified amount of capital in the applicable Private REIT. The capital commitment may be drawn by the general partner of the Private REIT either all at once or through a series of capital calls at the discretion of the general partner. Thus, an unfunded commitment represents the portion of the Fund’s overall capital commitment to a particular Private REIT that has not yet been called by the general partner of the Private REIT. Unfunded commitments may subject the Fund to certain risks. For example, the Fund may be required to: liquidate other portfolio investments, potentially at inopportune times, in order to obtain the cash needed to satisfy its obligations with respect to a capital call; borrow under a credit facility which may result in additional expenses to the Fund; or, to the extent a buyer can be identified and subject to the provisions of the limited partnership agreement of the relevant Private REIT, seek to sell/assign the interest subject to the capital call to a third party thereby eliminating the obligation. Fund management recognizes these risks as potentially detrimental to the overall strategy and so has structured its current agreements around capital commitments in such a way so as to mitigate these risks. As of March 31, 2020, the Fund had total unfunded commitments in the amount of $14,194,976.
Securities Transactions and Investment Income – Investment security transactions are accounted for on a trade date basis. Gains and losses on securities sold are determined on a specific identification basis. Dividend income is recorded on the ex-dividend date and interest income is recorded on the accrual basis.
Real Estate Industry Concentration – Because the Fund will concentrate its investments in real estate securities, its portfolio will be significantly impacted by the performance of the real estate market and may experience more volatility and be exposed to greater risk than a more diversified portfolio. Significant investments in the securities of issuers within the real estate industry and any development affecting the real estate industry will have a greater impact on the value of the net assets of the Fund than would be the case if the Fund did not have significant investments in the real estate industry. The Fund’s investment in real estate equity or debt may be subject to risks similar to those associated with direct investment in real property. The value of the Fund’s shares will be impacted by factors affecting the value of real estate and the earnings of companies engaged in the real estate industry. These factors include, among others: (i) changes in general economic and market conditions; (ii) changes in the value of real estate properties; (iii) risks related to local economic conditions, overbuilding and increased competition; (iv) increases in property taxes and operating expenses; (v) changes in zoning laws; (vi) casualty and condemnation losses; (vii) variations in rental income, neighborhood values or the appeal of property to tenants; (viii) the availability of financing and (ix) changes in interest rates. Many real estate companies utilize leverage, which increases investment risk and could adversely affect a company’s operations and market value in periods of rising interest rates. The value of securities of companies in the real estate industry may go through cycles of relative under-performance and outperformance in comparison to equity securities markets in general. As of March 31, 2020, the Fund had 114.07% of the value of its net assets invested within the real estate industry.
18 | www.bdrex.com |
Broadstone Real Estate Access Fund | Notes to Financial Statements |
March 31, 2020 (Unaudited)
Concentration of Credit Risk – The Fund places its cash with one banking institution, which is insured by Federal Deposit Insurance Corporation (“FDIC”). The FDIC limit is $250,000. At various times throughout the year, the amount on deposit may exceed the FDIC limit and subject the Fund to credit risk. The Fund does not believe that such deposits are subject to any unusual risk associated with investment activities.
Distributions to Shareholders – Distributions from investment income are declared and paid quarterly. The character of income and gains to be distributed is determined in accordance with income tax regulations, which may differ from U.S. GAAP.
Distributions from Underlying REITS – Distributions made to the Fund by the underlying REITs in which the Fund invests may take several forms. The Fund re-characterizes distributions received from the underlying REIT investments based on information provided by the REIT into the following categories: ordinary income, long-term capital gains, and return of capital. If information is not available on a timely basis from the REIT, the re-characterization will be estimated based on available information which may include the previous year’s allocation. If new or additional information becomes available from the REIT at a later date, a re-characterization will be made in the following year.
Offering Costs – Offering costs incurred by the Fund were treated as deferred charges until operations commenced and are being amortized over a 12-month period using the straight line method. As of March 31, 2020, all remaining offering costs, in the amount of $5,751, have been amortized.
Indemnification –The Fund indemnifies its Officers and Trustees for certain liabilities that may arise from the performance of their duties to the Fund. Additionally, in the normal course of business, the Fund enters into contracts that contain a variety of representations and warranties and which provide general indemnities. The Fund’s maximum exposure under these arrangements is unknown, as this would involve future claims that may be made against the Fund that have not yet occurred. However, based on experience, the Fund expects the risk of loss due to these warranties and indemnities to be remote.
Federal Income Taxes – The Fund intends to comply with the requirements of Subchapter M of the Internal Revenue Code applicable to regulated investment companies and will distribute substantially all of its taxable income, if any to shareholders. Accordingly, no provision for Federal income taxes is required in the financial statements.
The Fund has a wholly owned subsidiary that is used to hold Direct Real Estate Investments and qualifies as a REIT for federal income tax purposes (a “REIT Subsidiary”). REITs are companies that invest primarily in real estate or real estate-related assets. To qualify as a REIT for U.S. federal income tax purposes, a company must meet certain requirements, including, among other things, distributing at least 90 percent of its taxable income to its stockholders annually in the form of dividends.
As of and during the six months ended March 31, 2020, the Fund did not have a liability for any unrecognized tax benefits in the accompanying financial statements. The Fund files U.S. federal, state, and local tax returns as required. The Fund’s tax returns are subject to examination by the relevant tax authorities until expiration of the applicable statute of limitations, which is generally three years after the filing of the tax return but which can be extended to six years in certain circumstances. Tax returns for open years have incorporated no uncertain tax positions that require a provision for income taxes.
Market and Geopolitical Risk – The increasing interconnectivity between global economies and financial markets increases the likelihood that events or conditions in one region or financial market may adversely impact issuers in a different country, region or financial market. Securities and other investments in the Fund’s portfolio may underperform due to inflation (or expectations for inflation), interest rates, global demand for particular products or resources, natural disasters, pandemics, epidemics, terrorism, regulatory events and governmental or quasi-governmental actions. The occurrence of global events similar to those in recent years, such as terrorist attacks around the world, natural disasters, social and political discord or debt crises and downgrades, among others, may result in market volatility and may have long term effects on both the U.S. and global financial markets. It is difficult to predict when similar events affecting the U.S. or global financial markets may occur, the effects that such events may have and the duration of those effects. Any such event(s) could have a significant adverse impact on the value and risk profile of the Fund’s portfolio.
The current novel coronavirus (COVID-19) global pandemic and the aggressive responses taken by many governments, including closing borders, restricting international and domestic travel, and the imposition of prolonged quarantines or similar restrictions, as well as the forced or voluntary closure of, or operational changes to, many retail and other businesses, has had negative impacts, and in many cases severe negative impacts, on markets worldwide. It is not known how long such impacts, or any future impacts of other significant events described above, will or would last, but there could be a prolonged period of global economic slowdown, which may impact your investment. Therefore, the Fund could lose money over short periods due to short-term market movements and over longer periods during more prolonged market downturns.
Semi-Annual Report | March 31, 2020 (Unaudited) | 19 |
Broadstone Real Estate Access Fund | Notes to Financial Statements |
March 31, 2020 (Unaudited)
3. DERIVATIVE TRANSACTIONS
The Fund may engage in transactions involving options and futures and other derivative financial instruments. Derivatives can be volatile and involve various types and degrees of risk. By using derivatives, the Fund may be permitted to increase or decrease the level of risk, or change the character of the risk, to which the portfolio is exposed.
When the Fund writes (sells) an option, an amount equal to the premium received by the Fund is recorded on the Statement of Assets and Liabilities as a liability. The amount of the liability is subsequently marked-to-market to reflect the current market value of the option written. When an option expires, the Fund realizes a gain on the option to the extent of the premium received. Premiums received from writing options which are exercised or closed are added to or offset against the proceeds or amount paid on the transaction to determine the realized gain or loss. The Fund, as writer of an option, might be exposed to other risks, such as being required to continue holding a security that the Fund might otherwise have sold to protect against depreciation in the market price of the security.
When writing options, the Fund may economically offset its position by purchasing an option on the same security or commodity with the same exercise price and expiration date as the option that it has previously written on the security. If the amount paid to purchase an option is less or more than the amount received from the sale, the Fund will, accordingly, realize a profit or loss. To close out a position as a purchaser of an option, the Fund would liquidate the position by selling the option previously purchased.
The Fund also uses Flexible Exchange-Traded Options (“FLEX Options”), which are customized equity or index option contracts that trade on an exchange that provide the writer of the purchaser with the ability to customize key contract terms like exercise prices, styles and expiration dates. Like standardized exchange-traded options, FLEX Options are guaranteed for settlement by The Options Clearing Corporation (“OCC”), a market clearinghouse. FLEX Options are valued by a third-party pricing service using techniques that consider factors including the value of the underlying instrument, the volatility of the underlying instrument and the period of time until option expiration.
The effect of derivative instruments on the Statement of Assets and Liabilities as of March 31, 2020:
|
| Liability Derivatives |
| |||
Risk Exposure |
| Statement of Assets and Liabilities Location |
| Fair Value |
| |
Equity Contracts (Written Options) |
| Written Options, at value |
| $ | (396,796 | ) |
Total |
|
|
| $ | (396,796 | ) |
The effect of derivative instruments on the Statement of Operations for the six months ended March 31, 2020:
Risk Exposure |
| Statement of Operations Location |
| Realized Gain/(Loss) on Derivatives |
| Change in Unrealized Appreciation/(Depreciation) on Derivatives Recognized in Income |
| ||
Equity Contracts (Written Options) |
| Net realized gain on written options/Net change in unrealized (depreciation) on written options |
| $ | 1,405,652 |
| $ | (9,084 | ) |
Total |
|
|
| $ | 1,405,652 |
| $ | (9,084 | ) |
The monthly average notional amount and monthly average number of contracts of written options held by the Fund during the six months ended March 31, 2020 was $10,561,176 and 1,760, respectively.
20 | www.bdrex.com |
Broadstone Real Estate Access Fund | Notes to Financial Statements |
March 31, 2020 (Unaudited)
Certain derivative contracts are executed under either standardized netting agreements or, for exchange-traded derivatives, the relevant contracts for a particular exchange which contain enforceable netting provisions. A derivative netting arrangement creates an enforceable right of set-off that becomes effective, and affects the realization of settlement on individual assets, liabilities and collateral amounts, only following a specified event of default or early termination. Default events may include the failure to make payments or deliver securities timely, material adverse changes in financial condition or insolvency, the breach of minimum regulatory capital requirements, or loss of license, charter or other legal authorization necessary to perform under the contract. The following table presents derivative financial instruments that are subject to enforceable netting arrangements or other similar agreements as of March 31, 2020:
|
|
|
|
|
|
|
| Gross Amounts Not Offset in the Statement of Financial Position |
| ||||||||||
|
| Gross Amounts of Recognized Liabilities |
| Gross Amounts Offset in the Statement of Assets and Liabilities |
| Net Amounts Presented in the Statement of Assets and Liabilities |
| Financial Instruments(a) |
| Cash Collateral Pledged(a) |
| Net Amount |
| ||||||
Written Option Contracts |
| $ | 396,796 |
| $ | – |
| $ | 396,796 |
| $ | (396,796 | ) | $ | – |
| $ | – |
|
Total |
| $ | 396,796 |
| $ | – |
| $ | 396,796 |
| $ | (396,796 | ) | $ | – |
| $ | – |
|
(a) | These amounts are limited to the derivative asset/liability balance and, accordingly, do not include excess collateral received/pledged. |
4. ADVISORY FEE AND OTHER RELATED PARTY TRANSACTIONS
Advisory Fees – Pursuant to an investment advisory agreement with the Fund (the “Advisory Agreement”), investment advisory services are provided to the Fund by the Adviser. Under the terms of the Advisory Agreement, the Adviser receives monthly fees calculated at an annual rate of 1.25% of the average daily net assets of the Fund. The advisory fee is paid on a monthly basis.
The Adviser and the Fund have entered into an operating expenses limitation and reimbursement agreement (the “Expense Limitation Agreement”) pursuant to which the Adviser has contractually agreed to waive its fees and to defer reimbursement for the ordinary operating expenses of the Fund (including all expenses necessary or appropriate for the operation of the Fund and including the Adviser’s investment advisory or management fee detailed in the Advisory Agreement, any other expenses described in the Advisory Agreement as well as any shareholder servicing or distribution fee, but does not include any front-end or contingent deferred loads, brokerage fees and commissions, acquired fund fees and expenses, borrowing costs (such as interest and dividend expense on securities sold short), taxes and extraordinary expenses such as litigation), to the extent that such expenses exceed 1.99% and 1.74% per annum of the Fund’s average daily net assets attributable to Class W and Class I shares, respectively. In consideration of the Adviser’s agreement to limit the Fund’s expenses, the Fund has agreed to repay the Adviser in the amount of any fees waived and Fund expenses paid or absorbed, subject to the limitations that: (1) the reimbursement for fees and expenses will be made only if payable within three years from the date on which they were incurred; and (2) the reimbursement may not be made if it would cause the Expense Limitation in effect at the time of the waiver or currently in effect, whichever is lower, to be exceeded. The Expense Limitation Agreement will remain in effect through at least February 7, 2020.
During the six months ended March 31, 2020, the fees waived/reimbursed and recoupment of previously waived fees under the Expense Limitation Agreement were as follows:
|
| Fees Waived/Reimbursed By Adviser |
| |
Class I |
| $ | 225,877 |
|
Class W |
|
| 1,980 |
|
Semi-Annual Report | March 31, 2020 (Unaudited) | 21 |
Broadstone Real Estate Access Fund | Notes to Financial Statements |
March 31, 2020 (Unaudited)
As of March 31, 2020, the balances of recoupable expenses for the Fund were as follows:
Fund |
| Expires 2022 |
| |
Class I |
| $ | 1,113,394 |
|
Class W |
|
| 5,362 |
|
Sub-advisory services are provided to the Fund pursuant to an agreement between the Adviser and Heitman Real Estate Securities, LLC (the “Sub-Adviser” or “Heitman”). Under the terms of the sub-advisory agreement, the Adviser compensates the Sub-Adviser based on the Fund’s assets allocated to the Sub-Adviser.
Distributor – The distributor of the Fund is ALPS Distributors, Inc. (the “Distributor”). The Board has adopted, on behalf of the Fund, a Shareholder Services Plan (the “Plan”) and a Distribution Plan under which the Fund may compensate financial industry professionals for providing ongoing services in respect to clients with whom they have distributed shares of the Fund. Under the Plan, the Fund pays up to 0.25% per year of the average daily net assets of Class W shares for such services. Class I shares are not subject to a fee for such services. Plan fees in the amount of $596 are disclosed in the Statement of Operations for the six months ended March 31, 2020 as shareholder servicing fees.
Officer and Trustee Compensation – Each Independent Trustee who is not affiliated with the Fund or Adviser receives an annual retainer of $25,000, (to be pro-rated for a partial term), as well as reimbursement for any reasonable expenses incurred attending the meetings. Each Independent Trustee also receives a fee of $1,000 for each meeting of the Board (or committees of our Board) attended, provided that an Independent Trustee will not receive separate meeting fees for attending committee meetings held on the same day that the Independent Trustee received a fee for attending a meeting of our Board. In addition, the chairman of each of the Audit Committee and the Nominating and Corporate Governance Committee will receive an annual retainer of $5,000. None of the Fund’s executive officers receive compensation from the Fund.
Certain Trustees and officers of the Fund are also officers of the Adviser and are not paid by the Fund for serving in such capacities.
ALPS Fund Services, Inc. (“ALPS”) – ALPS provides administration and fund accounting services to the Fund. Pursuant to separate servicing agreements with ALPS, the Fund pays ALPS customary fees for providing administration and fund accounting services to the Fund.
Transfer Agent – DST Systems, Inc. serves as transfer, dividend paying and shareholder servicing agent for the Fund (“Transfer Agent”).
5. PURCHASES AND SALES OF INVESTMENT SECURITIES
The cost of purchases and proceeds from the sale of securities, other than short-term securities, for the six months ended March 31, 2020, were as follows:
|
| Purchases of Securities |
| Proceeds from Sales of Securities |
| ||
Broadstone Real Estate Access Fund |
| $ | 62,439,834 |
| $ | 53,932,991 |
|
6. REPURCHASE OFFERS
Pursuant to Rule 23c-3 under the 1940 Act, the Fund offers shareholders on a quarterly basis the option of having their shares repurchased, at NAV, of no less than 5% and no more than 25% of the shares outstanding on the Repurchase Request Deadline. There is no guarantee that shareholders will be able to sell all of the shares they desire to sell in a quarterly repurchase offer, although each shareholder will have the right to require the Fund to purchase at least 5% of such shareholder’s shares in each quarterly repurchase. Limited liquidity will be provided to shareholders only through the Fund’s quarterly repurchases.
22 | www.bdrex.com |
Broadstone Real Estate Access Fund | Notes to Financial Statements |
March 31, 2020 (Unaudited)
During the six months ended March 31, 2020, the Fund completed two quarterly repurchase offers. The result of those repurchase offers were as follows:
| Repurchase Offer #1 | Repurchase Offer #2 |
Commencement Date | September 16, 2019 | December 16, 2019 |
Repurchase Request Deadline | October 16, 2019 | January 15, 2020 |
Repurchase Pricing Date | October 16, 2019 | January 15, 2020 |
Amount Repurchased | $13,274 | $20,665 |
Shares Repurchased | 1,223 | 1,933 |
Percentage of Outstanding Shares the Fund Offered by Repurchase | 5.00% | 5.00% |
Percentage of Outstanding Shares Repurchased | 0.03% | 0.04% |
7. TAX BASIS INFORMATION
Distributions are determined in accordance with federal income tax regulations, which differ from U.S. GAAP, and, therefore, may differ significantly in amount or character from net investment income and realized gains for financial reporting purposes. Financial reporting records are adjusted for permanent book/tax differences to reflect tax character but are not adjusted for temporary differences. The amounts and characteristics of tax basis distributions and composition of distributable earnings/(accumulated losses) are finalized at fiscal year-end.
The tax character of Fund distributions for the following year was as follows:
Year |
| Ordinary Income |
| Long-Term Capital Gain |
| Return of Capital |
| |||
2019 |
| $ | 2,373,424 |
| $ | – |
| $ | – |
|
For the period ended September 30, 2019, the following reclassifications, which had no impact on results of operations or net assets, were recorded to reflect tax character.
|
| Paid-in Capital |
| Total Distributable Earnings |
| ||
Broadstone Real Estate Access Fund |
| $ | (259,433 | ) | $ | 259,433 |
|
As of September 30, 2019, the components of accumulated earnings/(deficit) on a tax basis were as follows:
|
| Undistributed net investment income |
| Undistributed long-term capital gain |
| Other cumulative effect of timing differences |
| Net unrealized appreciation/ |
| Total |
| |||||
Broadstone Real Estate Access Fund |
| $ | 618,898 |
| $ | 68,325 |
| $ | – |
| $ | 2,409,673 |
| $ | 3,096,896 |
|
As of March 31, 2020, the components of accumulated earnings/(deficit) on a tax basis were as follows:
|
| Gross Appreciation (excess of value over tax cost) |
| Gross Depreciation (excess of tax cost over value) |
| Net Unrealized Appreciation/ (Depreciation) |
| Cost of Investments for Income Tax Purposes |
| ||||
Broadstone Real Estate Access Fund |
| $ | 304,082 |
| $ | (5,058,863 | ) | $ | (4,754,781 | ) | $ | 66,412,597 |
|
The difference between book basis and tax basis net unrealized appreciation is primarily attributable to the investments in partnerships, wash sales and certain other investments.
Semi-Annual Report | March 31, 2020 (Unaudited) | 23 |
Broadstone Real Estate Access Fund | Notes to Financial Statements |
March 31, 2020 (Unaudited)
8. REPURCHASE FEES
Shareholders of the Fund who tender for repurchase shares that have been held less than 90 days from the purchase date will be subject to an early withdrawal charge of 2.00% as a percent of proceeds with respect to such shares. The redemption fee does not apply to shares that were acquired through reinvestment of distributions or in connection with the death or disability of the shareholder. The redemption fee is paid directly to the Fund. For the six months ended March 31, 2020, the Fund received $3 in redemption fees, which is reflected in “Shares redeemed, net of redemption fees” in the Statement of Changes in Net Assets.
9. LINE OF CREDIT
The Fund has a secured revolving bank line of credit through BNP Paribas Prime Brokerage International, Ltd. (the “Bank”) for the purpose of investment purchases subject to the limitations of the 1940 Act for borrowings.
Borrowings under this arrangement bear interest at the Bank’s 1 month LIBOR plus 95 basis points at the time of borrowing. As of March 31, 2020, the Fund had $8,584,553 of outstanding borrowings with an average interest rate of 2.581%.
During the six months ended March 31, 2020, the Fund incurred $149,195 of interest expense related to the borrowings. As collateral security for the revolving line of credit, the Fund grants the Bank a first position security interest in and lien on all securities of any kind or description held by the Fund in the pledge account. As of March 31, 2020, the Fund had $22,259,176 in securities pledged as collateral for the line of credit.
10. NEW ACCOUNTING PRONOUNCEMENTS
The Fund considers the applicability and impact of all Accounting Standard Updates (“ASU”) issued by the Financial Accounting Standards Board (“FASB”). There have been no new or material changes to the significant accounting policies discussed in Note 2 for the six months ended March 31, 2020, that are of significance, or potential significance, to the Fund.
11. SUBSEQUENT EVENTS
After March 31, 2020, Heitman resigned as the sub-advisor to the Fund.
Subsequent events after the date of the Statement of Assets and Liabilities have been evaluated through the date the financial statements were issued.
The Fund completed a quarterly repurchase offer on April 16, 2020, which resulted in 133,457 Fund shares being repurchased for $1,275,853.
Management has determined that there were no other subsequent events to report through the issuance of these financial statements.
24 | www.bdrex.com |
Broadstone Real Estate Access Fund | Additional Information |
March 31, 2020 (Unaudited)
1. PROXY VOTING POLICIES AND VOTING RECORD
A description of the Fund’s proxy voting policies and procedures is available without charge, upon request by calling 1-833-280-4479, or on the SEC’s website at http://www.sec.gov. Information regarding how the Fund voted proxies relating to portfolio securities during the most recent 12 month period ended June 30th is available on the SEC’s website at http://www.sec.gov.
2. QUARTERLY PORTFOLIO HOLDINGS
The Fund’s portfolio holdings are made available semi-annually in shareholder reports within 60 days after the close of the period for which the report is being made, as required by federal securities laws. The Fund also files a complete schedule of portfolio holdings with the commission for the first and third quarters of the Fund’s fiscal year on Part F of Form N-PORT. Portfolio holdings filed on Form N-PORT become publicly available on the commissions website at www.sec.gov within 60 days after the end of that Funds’ fiscal quarter. Schedules of portfolio holdings are also available upon request, without charge by contacting the Fund at 1-888-280-4479.
Semi-Annual Report | March 31, 2020 (Unaudited) | 25 |
Board Considerations Regarding Approval | |
Broadstone Real Estate Access Fund | of Advisory and Sub-Advisory Agreements |
March 31, 2020 (Unaudited)
At an in-person meeting held on December 23, 2019 (the “Meeting”), at which all of the Trustees were present the Board of Trustees (the “Board”), including the Trustees who are not “interested persons,” as defined by the Investment Company Act of 1940 (the “1940 Act”), of the Trust (the “Independent Trustees”) voting separately, reviewed and approved the Interim Investment Advisory Agreement (the “Interim Advisory Agreement”) and the definitive Investment Advisory Agreement (the “Investment Advisory Agreement” together with the Interim Advisory Agreement, the “Advisory Agreements”) between the Broadstone Real Estate Access Fund (the “Fund”) (including its wholly owned subsidiary) and Benefit Street Partners L.L.C (“BSP”).
In the course of their deliberations, the Board was advised by legal counsel and the Independent Trustees were advised by independent legal counsel. The Board received and reviewed a substantial amount of information provided by BSP in response to requests of the Board and counsel.
In considering the approval of the Advisory Agreements and reaching their conclusions with respect thereto, the Board reviewed and analyzed various factors that they determined were relevant, including the factors described below with respect to BSP:
Nature, Extent and Quality of Services. The Board considered that BSP was a leading credit-focused alternative asset management firm with approximately $27 billion in assets under management as of September 30, 2019. The Board further noted that BSP was owned by Franklin Resources, Inc., that together with its subsidiaries operated as Franklin Templeton, one of the world’s largest asset managers. The Board discussed BSP’s existing credit and real estate products and BSP’s depth of experience with commercial real estate and credit strategies. The Board reviewed BSP’s personnel, noting that each individual had several years of industry experience, and expressed satisfaction that the current portfolio management team of the Fund would continue to manage the Fund’s investments, providing the shareholders with continuity. The Board reviewed BSP’s proposed services, including research, selection and approval of investments, and the oversight of sub-advisers. The Board discussed BSP’s clearly articulated risk mitigation strategies and reviewed its compliance policies and procedures. The Board considered that there were no pending material litigation matters, regulatory actions or compliance matters that would adversely impact BSP’s ability to serve as adviser to the Fund. The Board concluded that BSP had sufficient quality and depth of personnel, resources, investment methods and compliance policies and procedures essential to performing its duties under the Advisory Agreements and that the nature, overall quality and extent of the management services to be provided by the BSP to the Fund were satisfactory.
Performance. The Board discussed that the current portfolio management team of the Fund would continue to manage the Fund’s investments if BSP were approved as adviser to the Fund. The Board considered that the Fund outperformed its peer group and the Bloomberg Barclays Aggregate Bond Index for the period since inception and for the three calendar quarters ended September 30, 2019. For the same periods, the Fund underperformed the FTSE NAREIT Equity REITs Index. The Board considered the composition of the peer group and noted that it appeared reasonable. The Board commented on the Fund’s strong positive performance since its inception and expressed satisfaction with the portfolio management team. The Board concluded that the investment performance of the Fund was consistent with the Fund’s investment objectives and policies and agreed that the Fund’s performance was satisfactory.
Fees and Expenses. The Board noted that BSP proposed to charge a 1.25% advisory fee, which was higher than the average of the Fund’s peer group, but lower than the average of the Morningstar Interval Fund database, which represented all interval funds available in Morningstar’s database. The Board acknowledged that the proposed advisory fee was consistent with the fee charged by BAM. The Board discussed the Fund’s current net expense ratio of 1.74% for Class I shares, noting that it was higher than the peer group but consistent with the Morningstar Interval Fund Database. The Board also noted that BSP proposed to limit total annual Fund operating expenses, exclusive of certain fees so as not to exceed 1.99% and 1.74% of average daily net assets for Class W and Class I shares, respectively. The Board remarked that the expense limits proposed by BSP were consistent with the Fund’s current expense limits. The Board then discussed the potential reduction in expense ratios that could result from exposure to the Franklin Templeton platform. The Board considered the costs associated with the trading strategies of the Fund and the overall expenses of the Fund. The Board concluded that the proposed fees and expense ratio were not unreasonable.
Profitability. The Board reviewed the pro-forma financial information provided by BSP, noting that BSP did not expect to make a profit related to the Fund during the first year of managing the Fund but expected to make a modest profit in the second year when excluding the cost of distribution. The Board reviewed the underlying assumptions used by BSP in their calculations and discussed the costs associated with managing the Fund. The Board considered that BSP had sufficient resources to support the Fund. The Board concluded that excessive profitability was not a concern at this time.
Economies of Scale. The Board discussed the growth and profitability projections provided by BSP, noting that the Fund was not expected to break even for two years. The Board discussed BSP’s relationship with Franklin Templeton and the impact the Franklin Templeton platform could have on the growth of the Fund. The Board concluded that it would continue to assess economies of scale as the Fund grew, noting that given the Fund’s size, the absence of breakpoints was reasonable at this time.
26 | www.bdrex.com |
Board Considerations Regarding Approval | |
Broadstone Real Estate Access Fund | of Advisory and Sub-Advisory Agreements |
March 31, 2020 (Unaudited)
After full consideration of the above factors as well as other factors, the Board unanimously concluded that approval of the Advisory Agreements was in the best interest of the Fund and its shareholders. No single factor was considered in isolation or to be determinative to the decision of the Trustees to approve the Advisory Agreements. Rather, the Trustees concluded, in light of their weighing and balancing all factors, that approval of the Advisory Agreements was in the best interest of the Fund and its shareholders.
Further, at the Meeting at which all of the Trustees were present, the Board, including the Independent Trustees voting separately, reviewed and approved the Interim Sub-advisory Agreement (the “Interim Sub-advisory Agreement”) and the definitive Sub-advisory Agreement (the “Sub-advisory Agreement” together with the Interim Sub-advisory Agreement, the “Sub-advisory Agreements”) between BSP and Heitman Real Estate Securities, LLC (the “Sub-Adviser”) with respect to the Fund.
In the course of their deliberations, the Board was advised by legal counsel and the Independent Trustees were advised by independent legal counsel. The Board received and reviewed a substantial amount of information provided by the Sub-Adviser in response to requests of the Board and counsel.
In considering the approval of the Sub-advisory Agreements and reaching their conclusions with respect thereto, the Board reviewed and analyzed various factors that they determined were relevant, including the factors described below with respect to the Sub-Adviser:
Nature, Extent and Quality of Services. The Board considered that the Sub-Adviser was a wholly-owned subsidiary of Heitman LLC, a global real estate investment management firm founded in 1966 with over $44 billion in assets under management. The Board reviewed the services provided by the Sub-Adviser to the Fund since the Fund’s inception. The Board considered that there were no pending litigation matters, regulatory actions or material compliance matters that would adversely impact the Sub-Adviser or the Fund. The Board also considered the risk mitigation philosophy of the Sub-Adviser and its incorporation of risk mitigation principles into the implementation of its investment strategy. The Board discussed the continuity of management and the investment team at the Sub-Adviser since the Fund’s inception, and reviewed the background of the Sub-Adviser’s CCO who joined the firm in 2019. The Board concluded that the nature, extent, and quality of services provided by the Sub-Adviser were satisfactory.
Performance. The Board considered that the portion of the Fund managed by the Sub-Adviser returned 24.87% and 21.47% over the three quarters ended September 30, 2019 and since inception, respectively. The Board noted that during both periods, the FTSE NAREIT Equity REITs Index slightly outperformed the Subadviser Assets. The Board acknowledged that the underperformance relative to the benchmark was by design, and was attributable to the covered call overlay. The Board commented on the strong positive performance of the Subadviser Assets since the Fund’s inception and expressed satisfaction with the Sub-Adviser’s management team. The Board concluded that the investment performance of the Sub-Adviser was satisfactory.
Fees and Expenses. The Board considered the total expense ratio of the Fund and the fees paid to the Sub-Adviser. They discussed the reasonableness of the Sub-advisory fee in relation to the allocation of duties between BSP and the Sub-Adviser. The Board considered the quality and experience of the Sub-Adviser’s personnel, and concluded that the proposed fee was not unreasonable in light of the quality of services provided, amount of assets under management, and costs associated with implementing the investment strategy.
Profitability. The Board reviewed the financial information provided by the Sub-Adviser, noting that for the year ended September 30, 2019, the Sub-Adviser earned a modest profit for its services to the Fund. The Board considered the quality of the Sub-Adviser and its track record of positive returns since the Fund’s inception. The Board further discussed the costs associated with managing the Subadviser Assets and concluded that excessive profitability was not a concern at this time.
Economies of Scale. The Board considered whether economies of scale had been achieved by the Sub-Adviser and whether the fee levels reflect these economies of scale in a manner that is fair and reasonable. The Board concluded that the fees appeared reasonable given the size of the Subadviser Assets and agreed to revisit the discussion of economies of scale if the assets managed by the Sub-Adviser grew in size.
After full consideration of the above factors as well as other factors, the Board unanimously concluded that approval of the Sub-Advisory Agreements was in the best interest of the Fund and its shareholders. No single factor was considered in isolation or to be determinative to the decision of the Trustees to approve the Sub-Advisory Agreements. Rather, the Trustees concluded, in light of their weighing and balancing all factors, that approval of the Sub-Advisory Agreements was in the best interest of the Fund and its shareholders.
Semi-Annual Report | March 31, 2020 (Unaudited) | 27 |
Broadstone Real Estate Access Fund | Privacy Notice |
July 2018 (Unaudited)
FACTS | What does Broadstone Real Estate Access Fund (the “Fund”) do with your personal information? |
WHY? | Financial companies choose how they share your personal information. Federal law gives consumers the right to limit some but not all sharing. Federal law also requires us to tell you how we collect, share, and protect your personal information. Please read this notice carefully to understand what we do. |
WHAT? | The types of personal information we collect and share depend on the product or service you have with us. This information can include:
● Social Security number and account transactions ● Account balances and transaction history ● Wire transfer instructions |
HOW? | All financial companies need to share customers’ personal information to run their everyday business. In the section below, we list the reasons financial companies can share their customers’ personal information; the Broadstone Real Estate Access Fund chooses to share; and whether you can limit this sharing. |
Reasons we can share your personal information | Does Broadstone Real Estate Access Fund Share? | Can you limit this sharing? |
For our everyday business purposes — such as to process your transactions, maintain your account(s), respond to court orders and legal investigations, or report to credit bureaus | Yes | No |
For our marketing purposes — to offer our products and services to you | No | We do not share. |
For joint marketing with other financial companies | No | We do not share. |
For our affiliates’ everyday business purposes — information about your transactions and experiences | Yes | No |
For our affiliates’ everyday business purposes — information about your creditworthiness | No | We do not share. |
For nonaffiliates to market to you | No | We do not share. |
QUESTIONS? | Call 833-280-4479 |
28 | www.bdrex.com |
Broadstone Real Estate Access Fund | Privacy Notice |
July 2018 (Unaudited)
Who We Are |
|
Who is providing this notice? | Broadstone Real Estate Access Fund (the “Fund”) |
What We Do |
|
How does Broadstone Real Estate Access Fund protect my personal information? | To protect your personal information from unauthorized access and use, we use security measures that comply with federal law. These measures include computer safeguards and secured files and buildings. |
How does Broadstone Real Estate Access Fund collect my personal information? | We collect your personal information, for example, when you
● open an account ● provide account information or give us your contact information ● make a wire transfer or deposit money |
Why can’t I limit all sharing? | Federal law gives you the right to limit only
● sharing for affiliates’ everyday business purposes-information about your creditworthiness ● affiliates from using your information to market to you ● sharing for nonaffiliates to market to you
State laws and individual companies may give you additional rights to limit sharing. |
Definitions |
|
Affiliates | Companies related by common ownership or control. They can be financial and nonfinancial companies. |
Nonaffiliates | Companies not related by common ownership or control. They can be financial and nonfinancial companies.
● Broadstone Real Estate Access Fund does not share with nonaffiliates so they can market to you. |
Joint marketing | A formal agreement between nonaffiliated financial companies that together market financial products or services to you.
● Broadstone Real Estate Access Fund does not jointly market. |
Semi-Annual Report | March 31, 2020 (Unaudited) | 29 |

| Item 2. | Code of Ethics. |
Not applicable to semi-annual report.
| Item 3. | Audit Committee Financial Expert. |
Not applicable to semi-annual report.
| Item 4. | Principal Accountant Fees and Services. |
Not applicable to semi-annual report.
| Item 5. | Audit Committee of Listed Registrants. |
Not applicable to semi-annual report.
| Item 6. | Schedule of Investments. |
| (a) | The Registrant’s “Schedule I – Investments in securities of unaffiliated issuers” (as set forth in 17 CFR 210.12-12) is included in Item 1 of this Form N-CSR. |
| (b) | Not applicable to the Registrant. |
| Item 7. | Disclosure of Proxy Voting Policies and Procedures for Closed-End Management Investment Companies. |
Not applicable to semi-annual report.
| Item 8. | Portfolio Managers of Closed-End Management Investment Companies. |
| (a) | Not applicable to semi-annual report. |
| (b) | Not applicable to the Registrant. |
| Item 9. | Purchases of Equity Securities by Closed-End Management Investment Company and Affiliated Purchasers. |
Not applicable to the Registrant.
| Item 10. | Submission of Matters to a Vote of Security Holders. |
No material changes to the procedures by which the shareholders may recommend nominees to the registrant’s Board of Trustees have been implemented after the registrant last provided disclosure in response to the requirements of Item 407(c)(2)(iv) of Regulation S-K (17 CFR 229.407) (as required by Item 22(b)(15) of Schedule 14A (17 CFR 240.14a-101)), or this Item.
| Item 11. | Controls and Procedures. |
| (a) | The Registrant’s principal executive officer and principal financial officer have evaluated the Registrant’s disclosure controls and procedures (as defined in Rule 30a-3(c) under the Investment Company Act of 1940, as amended (the “1940 Act”)) within 90 days of the filing of this report, as required by Rule 30a-3(b) under the Act and Rules 13a-15(b) or 15d-15(b) under the Securities Exchange Act of 1934, and have concluded that the Registrant’s disclosure controls and procedures were effective as of that date. |
| (b) | There was no change in the Registrant’s internal control over financial reporting (as defined in Rule 30a-3(d) under the Act, as amended) during the second fiscal quarter of the period covered by this report that has materially affected, or is reasonably likely to materially affect, the Registrant’s internal control over financial reporting. |
| Item 12. | Disclosure of Securities Lending Activities for Closed-End Management Investment Companies. |
Not applicable to the Registrant.
| Item 13. | Exhibits. |
| (a)(1) | Not applicable to semi-annual report. |
| (a)(2) | A separate certification for the Registrant’s Principal Executive Officer and Principal Financial Officer as required by Rule 30a-2(a) under the 1940 Act (17 CFR 270.30a-2(a)), are attached hereto as Ex99.Cert. |
| (a)(3) | None. |
| (b) | The certifications by the Registrant’s Principal Executive Officer and Principal Financial Officer, as required by Rule 30a-2(b) of the 1940 Act, and Section 906 of the Sarbanes-Oxley Act of 2002 are attached hereto as Ex99.906Cert. |
SIGNATURES
Pursuant to the requirements of the Securities Exchange Act of 1934 and the Investment Company Act of 1940, the Registrant has duly caused this report to be signed on its behalf by the undersigned, thereunto duly authorized.
Broadstone Real Estate Access Fund
By: | /s/ Richard J. Byrne |
|
| Richard J. Byrne, Chief Executive Officer |
|
| (Principal Executive Officer) |
|
Date: | June 5, 2020 |
|
Pursuant to the requirements of the Securities Exchange Act of 1934 and the Investment Company Act of 1940, this report has been signed below by the following persons on behalf of the Registrant and in the capacities and on the dates indicated.
By: | /s/ Richard J. Byrne |
|
| Richard J. Byrne, Chief Executive Officer |
|
| (Principal Executive Officer) |
|
Date: | June 5, 2020 |
|
By: | /s/ Jerome S. Baglien |
|
| Jerome S. Baglien, Chief Financial Officer |
|
| (Principal Financial Officer) |
|
Date: | June 5, 2020 |
|