UNITED STATES
SECURITIES AND EXCHANGE COMMISSION
Washington, D.C. 20549
FORM N-CSR
CERTIFIED SHAREHOLDER REPORT OF REGISTERED
MANAGEMENT INVESTMENT COMPANIES
Investment Company Act file number: 811-23360
Broadstone Real Estate Access Fund
(Exact name of registrant as specified in charter)
1325 Avenue of the Americas, Suite 32A
New York, NY 10105
(Address of principal executive offices) (Zip code)
Richard J. Byrne, Chief Executive Officer
c/o Benefit Street Partners L.L.C.
9 West 57th Street, Suite 4920
New York, New York 10019
(212) 588-6770
(Name and Address of Agent for Service)
COPIES TO:
Thomas J. Friedmann, Esq. Dechert LLP One International Place, 40th Floor 100 Oliver Street Boston, MA 02110-2605 (617) 728-7120 | Jonathan H. Gaines, Esq. Dechert LLP Three Bryant Park 1095 Avenue of the Americas New York, NY 10036-6797 (212) 641-5600 |
Registrant’s telephone number, including area code: (585) 287-6500
Date of fiscal year end: September 30
Date of reporting period: October 1, 2020 – March 31, 2021
| Item 1. | Reports to Stockholders. |

TABLE OF CONTENTS
| Shareholder Letter | 1 |
| Portfolio Update | 2 |
| Consolidated Schedule of Investments | 4 |
| Consolidated Statement of Assets and Liabilities | 6 |
| Consolidated Statement of Operations | 7 |
| Consolidated Statement of Changes in Net Assets | 8 |
| Consolidated Statement of Cash Flows | 10 |
| Consolidated Financial Highlights | 11 |
| Notes to Consolidated Financial Statements | 15 |
| Additional Information | 25 |
| Broadstone Real Estate Access Fund | Shareholder Letter |
| March 31, 2021 (Unaudited) |
Dear Shareholder:
We are pleased to present the Broadstone Real Estate Access Fund (the “Fund”) Semi-Annual Report.
The Broadstone Real Estate Access Fund was formed to provide investors with unique access to a broadly diversified portfolio of real estate investments via three sleeves: Public Real Estate Equities (“Public Equities Sleeve”); Private Real Estate Funds (“Private Funds Sleeve”); and Direct Real Estate Transactions (“Direct Investments Sleeve”).
On March 3, 2021 the Board of Trustees of the Fund approved a Plan of Liquidation (“the Plan”) for the Fund, which authorizes the liquidation and dissolution of the Fund in accordance with the Delaware Statutory Trust Act, as amended, and the Fund’s Agreement and Declaration of Trust dated June 19, 2018. Pursuant to the Plan, the Fund will not engage in any business activities, except for the purposes of winding down its business and affairs. The Fund will convert all its portfolio securities and other assets for cash and cash equivalents and reserve a portion of the proceeds to pay all the outstanding debts, claims and obligations of the Fund, together with the expenses related to carrying out the Plan.
BDREX announced a liquidating distribution of $3.1593 per share for Class I and Class W in April. This represents a distribution of $16Million or 34% of the Fund’s net asset value as of April 19, 2021. The distribution was paid on April 21, 2021 to shareholders of record as of April 19, 2021.
BDREX will continue to focus on the Plan and announce future distributions to investors as they become available.
Broadstone Real Estate Access Fund
Past performance is no guarantee of future results.
All future distributions by the Fund are expected to be liquidation distributions that will be paid in cash. Distributions are not guaranteed and the Fund's future ability to pay distributions may be limited. Portions of the distributions that the Fund makes may be a return of the money that shareholders originally invested and represent a return of capital to shareholders for tax purposes.
The views in this shareholder letter were as of the letter’s publication date and may not reflect the views on the date this letter is first distributed or anytime thereafter. These views are intended to assist readers in understanding the Fund’s investment methodology and do not constitute investment advice.
Diversification does not ensure profit or prevent loss.
| Semi-Annual Report | March 31, 2021 (Unaudited) | 1 |
| Broadstone Real Estate Access Fund | Portfolio Update |
| March 31, 2021 (Unaudited) |
Investment Objective
The Fund’s investment objective is to seek to generate a return comprised of both current income and long-term capital appreciation with low to moderate volatility and low correlation to the broader markets. There can be no assurance that the Fund will achieve its investment objective.
Average Annual Total Returns (as of March 31, 2021)
| Expense Ratios(a) | |||||
| 6 Month* | 1 Year | Since Inception** | Total | Net(b) | |
| Broadstone Real Estate Access Fund - Class I | 3.09% | 6.98%(c) | 4.53%(c) | 3.06% | 2.40% |
| Broadstone Real Estate Access Fund - Class W | 2.92% | 6.67%(c) | 4.28%(c) | 3.31% | 2.65% |
| Bloomberg Barclays US Aggregate Bond Index(d) | -2.73% | 0.71% | 6.02% | ||
| FTSE NAREIT ALL Equity REITs Index(e) | 21.47% | 37.78% | 8.30% | ||
| * | Cumulative returns. |
| ** | Fund’s inception date is October 4, 2018, with commencement of operations on October 5, 2018. |
| (a) | Ratios as of the Prospectus dated January 29, 2021 and may differ from the ratios presented in the Financial Highlights. |
| (b) | Benefit Street Partners L.L.C. (the "Investment Adviser" or "Adviser") and the Fund have entered into the Expense Limitation Agreement pursuant to which the Investment Adviser has contractually agreed to waive its fees and to defer reimbursement for the ordinary operating expenses of the Fund (including all expenses necessary or appropriate for the operation of the Fund and including the Investment Adviser’s Management Fee detailed in the Investment Advisory Agreement, any other expenses described in the Investment Advisory Agreement as well as any shareholder servicing fee or distribution fee, but does not include any front-end or contingent deferred loads, brokerage fees and commissions, acquired fund fees and expenses, borrowing costs (such as interest and dividend expense on securities sold short), taxes and extraordinary expenses such as litigation), to the extent that such expenses exceed 1.99% and 1.74% per annum of the Fund’s average daily net assets attributable to Class W and Class I shares, respectively. In consideration of the Investment Adviser’s agreement to limit the Fund’s expenses, the Fund has agreed to repay the Investment Adviser in the amount of any fees waived and Fund expenses paid or absorbed, subject to the limitations that: (1) the reimbursement for fees and expenses will be made only if payable within three years from the date on which they were incurred; and (2) the reimbursement may not be made if it would cause the Expense Limitation in effect at the time of the waiver or currently in effect, whichever is lower, to be exceeded. The Expense Limitation Agreement will remain in effect through February 7, 2022. The Fund does not anticipate that the Board will terminate the Expense Limitation Agreement during this period. The Expense Limitation Agreement may be terminated only by the Board on 60 days’ written notice to the Investment Adviser. After February 7, 2022, the Expense Limitation Agreement may be renewed at the Investment Adviser’s and Board’s discretion. |
| (c) | Excludes adjustments in accordance with accounting principles generally accepted in the United States of America and as such, the net asset value and total return for shareholder transactions reported to the market may differ from the net asset value for financial reporting purposes. |
| (d) | The Bloomberg Barclays US Aggregate Bond Index is a broad-based flagship benchmark that measures the investment grade, US dollar-denominated, fixed-rate taxable bond market. The index includes Treasuries, government-related and corporate securities, mortgage-backed securities (agency fixed-rate and hybrid adjustable-rate mortgage pass-throughs), asset-backed securities and commercial mortgage-backed securities (agency and non-agency). |
| (e) | The FTSE Nareit All Equity REITs Index is a free-float adjusted, market capitalization-weighted index of U.S. equity Real Estate Investment Trusts ("REITs"). Constituents of the index include all tax-qualified REITs with more than 50 percent of total assets in qualifying real estate assets other than mortgages secured by real property. |
The performance data quoted above represents past performance. Past performance is not a guarantee of future results. Current performance may be lower or higher than the performance quoted. Investment return and value of the Fund shares will fluctuate so that an investor’s shares, when sold or repurchased, may be worth more or less than their original cost. Total return measures net investment income and capital gain or loss from portfolio investments. All performance shown assumes reinvestment of dividends and capital gains distributions. Fund performance current to the most recent month-end is available by calling (833) 280-4479 or by visiting www.bdrex.com.
The Broadstone Real Estate Access Fund is a non-diversified, closed-end management investment company that is operated as an interval fund. The Fund is suitable only for investors who can bear the risks associated with the Fund's limited liquidity and should be viewed as a long-term investment. The Fund’s shares have no history of public trading, nor is it intended that its shares will be listed on a national securities exchange at this time, if ever. Investing in the Fund’s shares may be speculative and involves a high degree of risk, including the risks associated with leverage. Investing in the Fund involves risk, including the risk that shareholders may receive little or no return on their investment or that shareholders may lose part or all of their investment.
The Fund's investment adviser is Benefit Street Partners L.L.C. Prior to February 7, 2020, Broadstone Asset Management, LLC served as the Fund's investment adviser, and prior to June 9, 2020, Heitman Real Estate Securities, LLC served as the Fund's sub-adviser. The performance information set forth in this report prior to these dates reflects the Fund’s performance while managed by the prior investment adviser and/or sub-adviser. As a result, the Fund’s performance may differ substantially from what is shown for periods prior to June 9, 2020.
| 2 | www.bdrex.com |
| Broadstone Real Estate Access Fund | Portfolio Update |
| March 31, 2021 (Unaudited) |
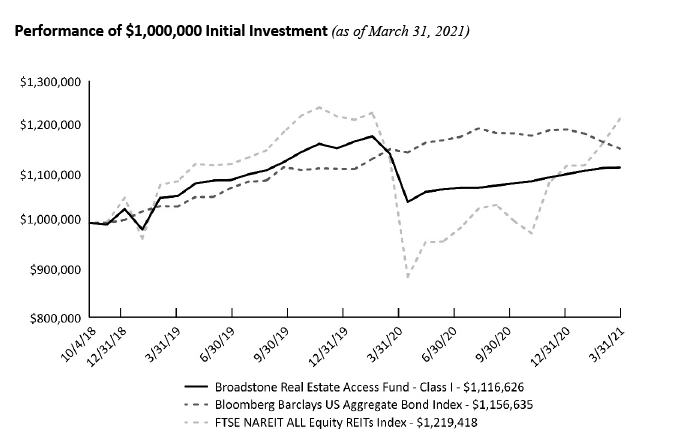
The graph shown above represents historical performance of a hypothetical investment of $1,000,000 in the Fund since inception. Past performance does not guarantee future results. All returns reflect reinvested dividends, but do not reflect the deduction of taxes that a shareholder would pay on Fund distributions or the repurchase of Fund shares.
Sector Allocation (as a % of Net Assets)*
| Private Real Estate Funds | 61.36% |
| Cash, Cash Equivalents, Leverage, & Other Net Assets | 38.64% |
| 100.00% |
Top Nine Holdings (as a % of Net Assets)*
| TCM CRE Credit Fund, LP | 14.46% |
| CBRE U.S. Core Partners, LP | 9.91% |
| PA MAC FUND, LP | 8.76% |
| Clarion Lion Industrial Trust | 6.38% |
| Voya Commercial Mortgage Lending Fund, LP | 5.83% |
| USAA US Government Building Open-End Feeder, LP | 5.45% |
| Sentinel Real Estate Fund, LP | 4.66% |
| Clarion Lion Properties Fund | 3.93% |
| Goldman Sachs U.S. Real Property Income Fund | 1.98% |
| Top Ten Holdings | 61.36% |
| * | Holdings are subject to change, and may not reflect the current or future position of the portfolio. Tables present indicative values only. |
| Semi-Annual Report | March 31, 2021 (Unaudited) | 3 |
| Broadstone Real Estate Access Fund | Consolidated Schedule of Investments |
| March 31, 2021 (Unaudited) |
| Shares | Value (Note 2) | |||||||
| PRIVATE REAL ESTATE SECURITIES (61.36%)* | ||||||||
| CBRE U.S. Core Partners, LP(a) | 3,521,629 | $ | 5,134,115 | |||||
| Clarion Lion Industrial Trust(a)(b) | 1,352 | 3,305,000 | ||||||
| Clarion Lion Properties Fund(a)(b) | 1,317 | 2,037,597 | ||||||
| Goldman Sachs U.S. Real Property Income Fund(c) | N/A | 1,025,829 | ||||||
| PA MAC FUND, LP(c) | N/A | 4,538,624 | ||||||
| Sentinel Real Estate Fund, LP(a) | 26 | 2,417,214 | ||||||
| TCM CRE Credit Fund, LP(a) | 7,446 | 7,492,137 | ||||||
| USAA US Government Building Open-End Feeder, LP(c) | N/A | 2,825,252 | ||||||
| Voya Commercial Mortgage Lending Fund, LP(c) | N/A | 3,019,656 | ||||||
| TOTAL PRIVATE REAL ESTATE SECURITIES (Cost $30,336,282) | 31,795,424 | |||||||
| SHORT TERM INVESTMENTS (34.67%) | ||||||||
| Fidelity Government Portfolio, Class I, 0.010%(d) (Cost $17,964,688) | 17,964,688 | 17,964,688 | ||||||
| TOTAL SHORT TERM INVESTMENTS (Cost $17,964,688) | 17,964,688 | |||||||
| TOTAL INVESTMENTS (96.03%) (Cost $48,300,970) | $ | 49,760,112 | ||||||
| Other Assets In Excess Of Liabilities 3.97% | 2,059,632 | |||||||
| NET ASSETS (100.00%) | $ | 51,819,744 | ||||||
| * | Restricted securities are not registered under the Securities Act of 1933 and are subject to legal restrictions on sale. These securities generally may be resold in transactions exempt from registration or to the public if the securities are subsequently registered and the registration statement is effective. Disposal of these securities may involve time consuming negotiations and prompt sale at an acceptable price may be difficult. Total market value of restricted securities amounts to $31,795,424, which represents approximately 61.36% of net assets as of March 31, 2021. |
| (a) | Security is unitized. |
| (b) | Affiliated company. See Note 5 in Notes to Consolidated Financial Statements. |
| (c) | Investment represents a non-public partnership interest and is not unitized. |
| (d) | Money market fund; interest rate reflects seven-day yield as of March 31, 2021. |
Common Abbreviations
LP - Limited Partnership.
See Notes to Unaudited Consolidated Financial Statements.
| 4 | www.bdrex.com |
| Broadstone Real Estate Access Fund | Consolidated Schedule of Investments |
| March 31, 2021 (Unaudited) |
Additional information on investments in Private Real Estate Securities:
| Value | Security | Redemption Frequency | Redemption Notice (Days) | Unfunded Commitments as of March 31, 2021 | ||||||||||
| $ | 5,134,115 | CBRE U.S. Core Partners, LP | Quarterly | 60 | $ | – | ||||||||
| 3,305,000 | Clarion Lion Industrial Trust | Quarterly | 90 | – | ||||||||||
| 2,037,597 | Clarion Lion Properties Fund | Quarterly | 90 | – | ||||||||||
| 1,025,829 | Goldman Sachs U.S. Real Property Income Fund, LP | Quarterly | 90 | – | ||||||||||
| 4,538,624 | PA Mac Fund, LP | N/A** | N/A | 4,900,000 | ||||||||||
| 2,417,214 | Sentinel Real Estate Fund, LP | Quarterly | N/A* | – | ||||||||||
| 7,492,137 | TCM CRE Credit Fund, LP | Quarterly | 90 | – | ||||||||||
| 2,825,252 | USAA US Government Building Fund Open-End Feeder, LP | Quarterly | 60 | – | ||||||||||
| 3,019,656 | Voya Commercial Mortgage Lending Fund, LP*** | Quarterly | 90 | – | ||||||||||
| $ | 31,795,424 | $ | 4,900,000 | |||||||||||
| * | Written notice required for redemption, no minimum timeline required. |
| ** | Closed-end fund that does not permit redemptions. |
| *** | Redemption policy applies after two year lock out period. |
| (a) | Affilaited company. See Note 5 in Notes to Consolidated Financial Statements. |
See Notes to Unaudited Consolidated Financial Statements.
| Semi-Annual Report | March 31, 2021 (Unaudited) | 5 |
| Broadstone Real Estate Access Fund | Consolidated Statement of Assets and Liabilities |
| March 31, 2021 (Unaudited) |
| ASSETS | ||||
| Investments in unaffiliated securities, at value (Cost $43,292,873) | $ | 44,417,515 | ||
| Investments in affiliates, at value (Cost $5,008,097) | 5,342,597 | |||
| Receivable for investments sold | 1,887,886 | |||
| Dividends receivable | 383,249 | |||
| Prepaid expenses and other assets | 84,497 | |||
| Total Assets | 52,115,744 | |||
| LIABILITIES | ||||
| Payable for investments purchased | 1,800 | |||
| Shareholder servicing fees payable (Note 5) | 219 | |||
| Investment advisory fees payable (Note 5) | 24,168 | |||
| Administration fees payable (Note 5) | 33,166 | |||
| Transfer agency fees payable (Note 5) | 1,127 | |||
| Chief compliance officer fees payable (Note 5) | 6,850 | |||
| Trustees' fees payable (Note 5) | 32,706 | |||
| Professional fees payable | 164,290 | |||
| Custody fees payable | 13,471 | |||
| Accrued expenses and other liabilities | 18,203 | |||
| Total Liabilities | 296,000 | |||
| Total Commitments and Contingencies (Note 2) | – | |||
| NET ASSETS | $ | 51,819,744 | ||
| NET ASSETS CONSIST OF | ||||
| Paid-in capital | $ | 54,222,182 | ||
| Total distributable earnings | (2,402,438 | ) | ||
| NET ASSETS | $ | 51,819,744 | ||
| PRICING OF SHARES | ||||
| Class I | ||||
| Net asset value and offering | $ | 9.72 | ||
| Net assets | $ | 51,270,195 | ||
| Shares of beneficial interest outstanding (unlimited number of shares, no par value common stock authorized) | 5,274,579 | |||
| Class W | ||||
| Net asset value and offering | $ | 9.71 | ||
| Net assets | $ | 549,549 | ||
| Shares of beneficial interest outstanding (unlimited number of shares, no par value common stock authorized) | 56,587 | |||
See Notes to Unaudited Consolidated Financial Statements.
| 6 | www.bdrex.com |
| Broadstone Real Estate Access Fund | Consolidated Statement of Operations |
| For the Six Months Ended March 31, 2021 (Unaudited) | ||||
| INVESTMENT INCOME | ||||
| Dividend income, unafilliated securities | $ | 810,375 | ||
| Dividends income, affiliated securities | 41,347 | |||
| Rental income | 35,383 | |||
| Total Investment Income | 887,105 | |||
| EXPENSES | ||||
| Investment advisory fees (Note 5) | 321,581 | |||
| Administration fees (Note 5) | 94,221 | |||
| Transfer agency fees (Note 5) | 32,290 | |||
| Shareholder servicing fees (Note 5) | ||||
| Class W | 669 | |||
| Professional fees | 154,417 | |||
| Reports to shareholders and printing fees | 15,056 | |||
| State registration fees | 15,989 | |||
| Insurance fees | 6,124 | |||
| Custody fees | 19,597 | |||
| Chief compliance officer fees (Note 5) | 21,271 | |||
| Interest expense (Note 10) | 8,946 | |||
| Trustees' fees (Note 5) | 61,706 | |||
| Other expenses | 9,418 | |||
| Total Expenses | 761,285 | |||
| Fees waived/expenses reimbursed by Adviser (Note 5) | (305,545 | ) | ||
| Net Expenses | 455,740 | |||
| Net Investment Income | 431,365 | |||
| Net realized gain on investments - unafilliated securities | 647,299 | |||
| Net realized gain on investments - affiliated securities | 31,988 | |||
| Net realized gain | 679,287 | |||
| Net change in unrealized appreciation on unaffiliated investments | 358,546 | |||
| Net change in unrealized appreciation on affiliated investments | 292,293 | |||
| Net change in unrealized depreciation on real estate investments | (77,298 | ) | ||
| Net change in unrealized appreciation on written options | 118,768 | |||
| Net change in unrealized appreciation | 692,309 | |||
| NET REALIZED AND UNREALIZED GAIN ON INVESTMENTS | 1,371,596 | |||
| NET INCREASE IN NET ASSETS RESULTING FROM OPERATIONS | $ | 1,802,961 | ||
See Notes to Unaudited Consolidated Financial Statements.
| Semi-Annual Report | March 31, 2021 (Unaudited) | 7 |
| Broadstone Real Estate Access Fund | Consolidated Statement of Changes in Net Assets |
For the Six Months Ended March 31, 2021 (Unaudited) | For the Year Ended September 30, 2020 | |||||||
| OPERATIONS | ||||||||
| Net investment income | $ | 431,365 | $ | 1,309,029 | ||||
| Net realized gain/(loss) on investments | 679,287 | (4,076,779 | ) | |||||
| Long-term capital gain distributions | – | 297,684 | ||||||
| Net change in unrealized appreciation/(depreciation) on investments | 692,309 | (860,117 | ) | |||||
| Net Increase/(Decrease) in Net Assets Resulting from Operations | 1,802,961 | (3,330,183 | ) | |||||
| DISTRIBUTIONS TO SHAREHOLDERS | ||||||||
| Class I | ||||||||
| From distributable earnings | (652,596 | ) | (3,301,706 | ) | ||||
| From return of capital | – | (638,588 | ) | |||||
| Class W | ||||||||
| From distributable earnings | (6,503 | ) | (32,234 | ) | ||||
| From return of capital | – | (6,243 | ) | |||||
| Total Distributions to Shareholders | (659,099 | ) | (3,978,771 | ) | ||||
| BENEFICIAL INTEREST TRANSACTIONS, IN DOLLARS | ||||||||
| Class I | ||||||||
| Shares sold | $ | 724,248 | $ | 10,969,569 | ||||
| Distributions reinvested | 325,671 | 2,075,723 | ||||||
| Shares repurchased, net of repurchase fees (Note 9) | (2,441,982 | ) | (3,454,775 | ) | ||||
| Class W | ||||||||
| Shares sold | 48,462 | 364,755 | ||||||
| Distributions reinvested | 3,681 | 21,058 | ||||||
| Shares repurchased | (53,473 | ) | (21,929 | ) | ||||
| Net Increase/(Decrease) in Net Assets Derived from Beneficial Interest Transactions | (1,393,393 | ) | 9,954,401 | |||||
| Net increase/(decrease) in net assets | (249,531 | ) | 2,645,447 | |||||
| NET ASSETS | ||||||||
| Beginning of period | 52,069,275 | 49,423,828 | ||||||
| End of period | $ | 51,819,744 | $ | 52,069,275 | ||||
See Notes to Unaudited Consolidated Financial Statements.
| 8 | www.bdrex.com |
| Broadstone Real Estate Access Fund | Consolidated Statement of Changes in Net Assets |
For the Six Months Ended March 31, 2021 (Unaudited) | For the Year Ended September 30, 2020 | |||||||
| Other Information | ||||||||
| BENEFICIAL INTEREST TRANSACTIONS, IN SHARES | ||||||||
| Class I | ||||||||
| Beginning shares | 5,421,346 | 4,542,800 | ||||||
| Shares sold | 75,851 | 1,031,937 | ||||||
| Distributions reinvested | 34,245 | 210,218 | ||||||
| Shares repurchased | (256,863 | ) | (363,609 | ) | ||||
| Net increase/(decrease) in shares outstanding | (146,767 | ) | 878,546 | |||||
| Ending shares | 5,274,579 | 5,421,346 | ||||||
| Class W | ||||||||
| Beginning shares | 56,746 | 23,010 | ||||||
| Shares sold | 5,089 | 33,923 | ||||||
| Distributions reinvested | 387 | 2,121 | ||||||
| Shares repurchased | (5,635 | ) | (2,308 | ) | ||||
| Net increase/(decrease) in shares outstanding | (159 | ) | 33,736 | |||||
| Ending shares | 56,587 | 56,746 | ||||||
See Notes to Unaudited Consolidated Financial Statements.
| Semi-Annual Report | March 31, 2021 (Unaudited) | 9 |
| Broadstone Real Estate Access Fund | Consolidated Statement of Cash Flows |
For the Six Months Ended March 31, 2021(Unaudited) | ||||
| Cash Flows from Operating Activities: | ||||
| Net increase in net assets resulting from operations | $ | 1,802,961 | ||
| Purchase of investments | (49,503,021 | ) | ||
| Proceeds from sales and return of capital distributions | 62,231,929 | |||
| Premiums received on closing written options transactions | 3,018,324 | |||
| Net purchases of short-term investment securities | (9,685,916 | ) | ||
| Net realized gain on investments | (679,287 | ) | ||
| Net change in unrealized appreciation on investments | (650,839 | ) | ||
| Net change in unrealized depreciation on real estate investments | 77,298 | |||
| Net change in unrealized appreciation on written options | (118,768 | ) | ||
| (Increase)/Decrease in Assets: | ||||
| Dividends receivable | 84,050 | |||
| Receivable for investments sold | (1,343,037 | ) | ||
| Receivable due from Adviser | 139,008 | |||
| Prepaid expenses and other assets | (15,257 | ) | ||
| Increase/(Decrease) in Liabilities: | ||||
| Shareholder servicing fees payable | 109 | |||
| Investment advisory fees payable | 24,168 | |||
| Administration fees payable | (1,330 | ) | ||
| Transfer agency fees payable | (4,194 | ) | ||
| Chief compliance officer fees payable | (361 | ) | ||
| Trustees' fees payable | 3,706 | |||
| Professional fees payable | (108,800 | ) | ||
| Custody fees payable | 2,530 | |||
| Lines of credit interest payable | (5,026 | ) | ||
| Accrued expenses and other liabilities | 11,263 | |||
| Net cash provided by operating activities | 5,279,510 | |||
| Cash Flows from Financing Activities: | ||||
| Lines of credit borrowings | 4,983,961 | |||
| Lines of credit repayment | (9,080,326 | ) | ||
| Proceeds from shares sold | 772,710 | |||
| Payment on shares repurchased | (2,495,455 | ) | ||
| Cash distributions paid | (660,400 | ) | ||
| Net cash used by financing activities | (6,479,510 | ) | ||
| Net Change in Cash | (1,200,000 | ) | ||
| Cash, beginning of period | $ | 1,200,000 | ||
| Cash, end of period | $ | – | ||
| Non-cash financing activities herein consist of reinvestment of distributions of: | $ | 329,352 | ||
| Cash paid during the period for interest from line of credit borrowing: | $ | 13,972 | ||
See Notes to Unaudited Consolidated Financial Statements.
| 10 | www.bdrex.com |
| Broadstone Real Estate Access Fund – Class I | Consolidated Financial Highlights |
| For a Share Outstanding Throughout the Year and Period Presented | |
For the Six Months Ended March 31, 2021 (Unaudited) | For the Year Ended September 30, 2020 | For the Period October 5, 2018 (Commencement of Operations) to September 30, 2019 | ||||||||||
| Net asset value, beginning of period | $ | 9.51 | $ | 10.82 | $ | 10.00 | ||||||
| INCOME FROM INVESTMENT OPERATIONS | ||||||||||||
| Net investment income(a) | 0.08 | 0.25 | 0.28 | |||||||||
| Net realized and unrealized gain/(loss) | 0.25 | (0.82 | ) | 1.19 | ||||||||
| Total from investment operations | 0.33 | (0.57 | ) | 1.47 | ||||||||
| DISTRIBUTIONS | ||||||||||||
| From net investment income | (0.12 | ) | (0.30 | ) | (0.06 | ) | ||||||
| From net realized gain on investments | – | (0.32 | ) | (0.59 | ) | |||||||
| Return of capital | – | (0.12 | ) | – | ||||||||
| Total distributions(b)(c) | (0.12 | ) | (0.74 | ) | (0.65 | ) | ||||||
| REPURCHASE FEES ADDED TO PAID-IN CAPITAL (NOTE 9) | 0.00 | (d) | 0.00 | (d) | – | |||||||
| Net increase/(decrease) in net asset value | 0.21 | (1.31 | ) | 0.82 | ||||||||
| Net asset value, end of period | $ | 9.72 | $ | 9.51 | $ | 10.82 | ||||||
| TOTAL RETURN(e) | 3.51 | % | (5.37 | )% | 15.07 | % | ||||||
| RATIOS/SUPPLEMENTAL DATA | ||||||||||||
| Net assets, end of period (000s) | $ | 51,270 | $ | 51,530 | $ | 49,175 | ||||||
| Ratios to Average Net Assets (including interest expense) | ||||||||||||
| Ratio of expenses to average net assets excluding fee waivers and reimbursements(f) | 2.96 | %(g) | 3.44 | % | 5.98 | %(g) | ||||||
| Ratio of expenses to average net assets including fee waivers and reimbursements(f) | 1.77 | %(g) | 2.09 | % | 2.70 | %(g) | ||||||
| Ratio of net investment income to average net assets(f) | 1.68 | %(g) | 2.44 | % | 2.67 | %(g) | ||||||
| Ratios to Average Net Assets (excluding interest expense) | ||||||||||||
| Ratio of expenses to average net assets excluding fee waivers and reimbursements(f) | 2.93 | %(g) | 3.10 | % | 5.02 | %(g) | ||||||
| Ratio of expenses to average net assets including fee waivers and reimbursements(f) | 1.74 | %(g) | 1.74 | % | 1.74 | %(g) | ||||||
| Ratio of net investment income to average net assets(f) | 1.71 | %(g) | 2.78 | % | 1.71 | %(g) | ||||||
| Portfolio turnover rate | 109 | %(h) | 356 | % | 123 | %(h) | ||||||
See Notes to Unaudited Consolidated Financial Statements.
| Semi-Annual Report | March 31, 2021 (Unaudited) | 11 |
| Broadstone Real Estate Access Fund – Class I | Consolidated Financial Highlights |
| For a Share Outstanding Throughout the Year and Period Presented | |
| (a) | Calculated using the average shares method. |
| (b) | Total distributions during a calendar year generally will be made from the Fund’s net investment income, net realized gains on investments and net unrealized gains on investments, if any. The portion of distributions paid not attributable to net investment income or net realized gains on investments, if any, is distributed from the Fund’s assets and is treated by shareholders as a nontaxable distribution (“Return of Capital”) for tax purposes. Return of Capital is a tax concept, not an economic concept. The tax character of the Fund’s distributions, in isolation, does not reveal much information about whether the distributions are supported by the Fund’s returns. Reported distributions from net investment income and realized gains on investments are not an indication as to whether or not the Fund’s distributions are supported by the Fund’s returns. A Fund can have distributions from net investment income and realized capital gains in years in which it incurs an economic loss due to unrealized losses not being recognized for tax purposes. A common method in which to determine if the Fund’s distributions are supported by economic returns is to examine the Fund’s Net Asset Value (“NAV”) over the course of a year. If the Fund’s NAV has increased, the Fund will have economically earned more than it has distributed, regardless of whether such distributions are reported as being from net investment income, net realized gains on investments or return of capital. If a Fund’s NAV decreases, the Fund will have distributed more than it has economically earned or it will have incurred an economic loss. |
| (c) | The Fund has substantial investments in REITs, which are generally not subject to federal income taxes. Distributions that the Fund receives from REITs can be classified as ordinary income, capital gain income or return of capital by the REITs that make these distributions to the Fund. However, it is not possible for the Fund to characterize distributions received from REITs during interim periods because the REIT issuers do not report their tax characterizations until after year end. Final characterization of the Fund’s distributions to its common shareholders is also dependent upon the size or timing of the Fund’s securities transactions prior to year-end. Therefore, it is likely that some portion of the Fund’s investment income and distributions to its common shareholders will be recharacterized as long term capital gain and return of capital for financial statement and U.S. federal income tax purposes subsequent to year end and reflected accordingly in the Fund’s year-end financial statements. |
| (d) | Less than $0.005 per share. |
| (e) | Total returns are not annualized for periods less than one year and do not reflect the impact of sales charge. Total returns would have been lower had certain expenses not been waived during the period. Returns shown do not reflect the deduction of taxes that a shareholder would pay on Fund distributions or the repurchase of Fund shares. |
| (f) | The ratios of expenses to average net assets and net investment income to average net assets do not reflect the expenses of the underlying private real estate funds in which the Fund invests, which could include management and incentive fees and other expenses. Management fees of the underlying private real estate funds typically range from 0.70% to 1.50% on an annual basis. However, the Fund invests in each underlying private real estate investment fund based upon the NAV of each such fund which reflects the costs of investing in the applicable fund, including the management fee of the underlying fund and other operating expenses. |
| (g) | Annualized. |
| (h) | Not Annualized. |
See Notes to Unaudited Consolidated Financial Statements.
| 12 | www.bdrex.com |
| Broadstone Real Estate Access Fund – Class W | Consolidated Financial Highlights |
| For a Share Outstanding Throughout the Year and Period Presented | |
For the Six Months Ended March 31, 2021 (Unaudited) | For the Year Ended September 30, 2020 | For the Period October 5, 2018 (Commencement of Operations) to September 30, 2019 | ||||||||||
| Net asset value, beginning of period | $ | 9.50 | $ | 10.82 | $ | 10.00 | ||||||
| INCOME FROM INVESTMENT OPERATIONS | ||||||||||||
| Net investment income(a) | 0.07 | 0.22 | 0.25 | |||||||||
| Net realized and unrealized gain/(loss) | 0.25 | (0.82 | ) | 1.20 | ||||||||
| Total from investment operations | 0.32 | (0.60 | ) | 1.45 | ||||||||
| DISTRIBUTIONS | ||||||||||||
| From net investment income | (0.11 | ) | (0.29 | ) | (0.05 | ) | ||||||
| From net realized gain on investments | – | (0.32 | ) | (0.58 | ) | |||||||
| Return of capital | – | (0.11 | ) | �� | ||||||||
| Total distributions(b)(c) | (0.11 | ) | (0.72 | ) | (0.63 | ) | ||||||
| REPURCHASE FEES ADDED TO PAID-IN CAPITAL (NOTE 9) | – | (0.00 | )(d) | – | ||||||||
| Net increase/(decrease) in net asset value | 0.21 | (1.32 | ) | 0.82 | ||||||||
| Net asset value, end of period | $ | 9.71 | $ | 9.50 | $ | 10.82 | ||||||
| TOTAL RETURN(e) | 3.45 | % | (5.71 | )% | 14.85 | % | ||||||
| RATIOS/SUPPLEMENTAL DATA | ||||||||||||
| Net assets, end of period (000s) | $ | 550 | $ | 539 | $ | 249 | ||||||
| Ratios to Average Net Assets (including interest expense) | ||||||||||||
| Ratio of expenses to average net assets excluding fee waivers and reimbursements(f) | 3.20 | %(g) | 3.70 | % | 6.54 | %(g) | ||||||
| Ratio of expenses to average net assets including fee waivers and reimbursements(f) | 2.02 | %(g) | 2.31 | % | 2.95 | %(g) | ||||||
| Ratio of net investment income to average net assets(f) | 1.42 | %(g) | 2.18 | % | 2.40 | %(g) | ||||||
| Ratios to Average Net Assets (excluding interest expense) | ||||||||||||
| Ratio of expenses to average net assets excluding fee waivers and reimbursements(f) | 3.17 | %(g) | 3.38 | % | 5.58 | %(g) | ||||||
| Ratio of expenses to average net assets including fee waivers and reimbursements(f) | 1.99 | %(g) | 1.99 | % | 1.99 | %(g) | ||||||
| Ratio of net investment income to average net assets(f) | 1.45 | %(g) | 2.50 | % | 1.44 | %(g) | ||||||
| Portfolio turnover rate | 109 | %(h) | 356 | % | 123 | %(h) | ||||||
See Notes to Unaudited Consolidated Financial Statements.
| Semi-Annual Report | March 31, 2021 (Unaudited) | 13 |
| Broadstone Real Estate Access Fund – Class W | Consolidated Financial Highlights |
| For a Share Outstanding Throughout the Year and Period Presented | |
| (a) | Calculated using the average shares method. |
| (b) | Total distributions during a calendar year generally will be made from the Fund’s net investment income, net realized gains on investments and net unrealized gains on investments, if any. The portion of distributions paid not attributable to net investment income or net realized gains on investments, if any, is distributed from the Fund’s assets and is treated by shareholders as a nontaxable distribution (“Return of Capital”) for tax purposes. Return of Capital is a tax concept, not an economic concept. The tax character of the Fund’s distributions, in isolation, does not reveal much information about whether the distributions are supported by the Fund’s returns. Reported distributions from net investment income and realized gains on investments are not an indication as to whether or not the Fund’s distributions are supported by the Fund’s returns. A Fund can have distributions from net investment income and realized capital gains in years in which it incurs an economic loss due to unrealized losses not being recognized for tax purposes. A common method in which to determine if the Fund’s distributions are supported by economic returns is to examine the Fund’s Net Asset Value (“NAV”) over the course of a year. If the Fund’s NAV has increased, the Fund will have economically earned more than it has distributed, regardless of whether such distributions are reported as being from net investment income, net realized gains on investments or return of capital. If a Fund’s NAV decreases, the Fund will have distributed more than it has economically earned or it will have incurred an economic loss. |
| (c) | The Fund has substantial investments in REITs, which are generally not subject to federal income taxes. Distributions that the Fund receives from REITs can be classified as ordinary income, capital gain income or return of capital by the REITs that make these distributions to the Fund. However, it is not possible for the Fund to characterize distributions received from REITs during interim periods because the REIT issuers do not report their tax characterizations until after year end. Final characterization of the Fund’s distributions to its common shareholders is also dependent upon the size or timing of the Fund’s securities transactions prior to year-end. Therefore, it is likely that some portion of the Fund’s investment income and distributions to its common shareholders will be recharacterized as long term capital gain and return of capital for financial statement and U.S. federal income tax purposes subsequent to year end and reflected accordingly in the Fund’s year-end financial statements. |
| (d) | Less than $0.005 per share. |
| (e) | Total returns are not annualized for periods less than one year and do not reflect the impact of sales charge. Total returns would have been lower had certain expenses not been waived during the period. Returns shown do not reflect the deduction of taxes that a shareholder would pay on Fund distributions or the repurchase of Fund shares. |
| (f) | The ratios of expenses to average net assets and net investment income to average net assets do not reflect the expenses of the underlying private real estate funds in which the Fund invests, which could include management and incentive fees and other expenses. Management fees of the underlying private real estate funds typically range from 0.70% to 1.50% on an annual basis. However, the Fund invests in each underlying private real estate investment fund based upon the NAV of each such fund which reflects the costs of investing in the applicable fund, including the management fee of the underlying fund and other operating expenses. |
| (g) | Annualized. |
| (h) | Not Annualized. |
See Notes to Unaudited Consolidated Financial Statements.
| 14 | www.bdrex.com |
| Broadstone Real Estate Access Fund | Notes to Consolidated Financial Statements |
| March 31, 2021 (Unaudited) |
1. ORGANIZATION
Broadstone Real Estate Access Fund (the “Fund”) was organized as a Delaware statutory trust on May 25, 2018 and is registered with the U.S. Securities and Exchange Commission (“SEC”) under the Investment Company Act of 1940, as amended, (the “1940 Act”), as a non-diversified, closed-end management investment company. The Fund operates as an interval fund and will offer to make quarterly repurchases of shares at net asset value (“NAV”). The Fund’s investment adviser is Benefit Street Partners, L.L.C. (the “Adviser”). The Fund’s investment objective is to seek to generate a return comprised of both current income and long-term capital appreciation with low-to-moderate volatility and low correlation to the broader markets. The Fund intends to pursue its investment objective by strategically investing across Public Equity Real Estate Securities, Private Real Estate Securities, and Direct Real Estate.
The Fund has registered Class W and Class I shares. Class W and Class I shares commenced operations on October 5, 2018 and are offered at NAV. Prior to October 5, 2018, the Fund had no operations other than matters relating to its organization. Each class represents an interest in the same assets of the Fund and classes are identical except for differences in their ongoing shareholder services plan ("Shareholder Services Plan") charges. Both classes of shares have equal voting privileges except that each class has exclusive voting rights with respect to its Shareholder Services Plan. The Fund’s income, expenses (other than class specific shareholder servicing fees) and realized and unrealized gains and losses are allocated proportionately each day based upon the relative net assets of each class. On March 3, 2021 the Fund's Board of Trustees (the "Board") approved a Plan of Liquidation (the “Plan”) for the Fund, which authorizes the liquidation and dissolution of the Fund in accordance with the Delaware Statutory Trust Act, as amended, and the Fund’s Agreement and Declaration of Trust dated June 19, 2018. Pursuant to the Plan, the Fund will not engage in any business activities, except for the purposes of winding down its business and affairs. The Fund will convert all its portfolio securities and other assets for cash and cash equivalents and reserve a portion of the proceeds to pay all the outstanding debts, claims and obligations of the Fund, together with the expenses related to carrying out the Plan.
2. SIGNIFICANT ACCOUNTING POLICIES
Basis of Presentation – The following is a summary of significant accounting policies followed by the Fund in preparation of its financial statements. These policies are in conformity with accounting principles generally accepted in the United States of America (“U.S. GAAP”). The Fund is an investment company and accordingly follows the investment company accounting and reporting guidance of the Financial Accounting Standards Board (“FASB”) Accounting Standards Codification (“ASC”) Topic 946 “Financial Services – Investment Companies”.
Consolidation – Broadstone Real Estate Access REIT, Inc. ("REIT Subsidiary") is a wholly-owned subsidiary of the Fund formed to hold Direct Real Estate. All significant intercompany balances and transactions between the Fund and the REIT Subsidiary have been eliminated in consolidation.
Use of Estimates – The preparation of the financial statements requires management to make estimates and assumptions that affect the reported amounts of assets, liabilities, revenues, expenses and disclosure of contingent assets and liabilities at the date of the consolidated financial statements. Actual results could differ from these estimates and those differences could be material.
Valuation of Investments – Investments are valued at fair value as determined by the Valuation Committee of the Adviser (the “Valuation Committee”), pursuant to delegation from the Board. Investments in securities listed on an exchange are valued at the last reported sale price at the close of the regular trading session of the exchange on the business day the value is being determined, or in the case of securities listed on NASDAQ, at the NASDAQ Official Closing Price (“NOCP”). Investments in open-end mutual funds are valued at the closing NAV.
When price quotations for certain securities are not readily available, or if the available quotations are not believed to be reflective of market value by the Adviser, those securities will be valued at fair value as determined in good faith by the Valuation Committee, using procedures adopted by and under the supervision of the Board. There can be no assurance that the Fund could purchase or sell a portfolio investment at the price used to calculate the Fund’s NAV.
Fair valuation procedures may be used to value a substantial portion of the assets of the Fund. The Fund may use the fair value of an investment to calculate its NAV when, for example: (1) a portfolio investment is not traded in a public market or the principal market in which the investment trades is closed; (2) trading in a portfolio investment is suspended and not resumed prior to the normal market close; (3) a portfolio investment is not traded in significant volume for a substantial period; or (4) the Adviser determines that the quotation or price for a portfolio investment provided by a broker-dealer or independent pricing service is inaccurate.
The fair value of securities, including direct real estate investments, may be difficult to determine and thus judgment plays a greater role in the valuation process. The fair value methodology may include or consider the following guidelines, as appropriate: (1) evaluation of all relevant factors, including but not limited to, pricing history, current market level, supply and demand of the respective investment; (2) comparison to the values and current pricing of investments that have comparable characteristics; (3) knowledge of historical market information with respect to the investment; and (4) other factors relevant to the investment which would include, but not be limited to, duration, yield, fundamental analytical data, the U.S. Treasury yield curve, capitalization rate, and credit quality.
| Semi-Annual Report | March 31, 2021 (Unaudited) | 15 |
| Broadstone Real Estate Access Fund | Notes to Consolidated Financial Statements |
| March 31, 2021 (Unaudited) |
In making its determination of fair value, the Valuation Committee may retain and rely upon valuations obtained from independent valuation firms; provided that the Valuation Committee shall not be required to determine fair value in accordance with the valuation provided by any single method, and the Valuation Committee shall retain the discretion to use any relevant data, including information obtained from any independent third-party valuation or pricing service, that the Valuation Committee deems to be reliable in determining fair value under the circumstances.
The Fund invests a significant portion of its assets in Private Real Estate Securities (“Private Funds"). The Private Funds measure their investment assets at fair value, and report a NAV on a calendar quarter basis. In accordance with FASB ASC 820, the Fund has elected to apply the practical expedient and to value its investments in Private Funds at their respective NAVs at each quarter. As of March 31, 2021, all of the Fund’s investments in Private Funds were valued at their respective sponsor issued NAVs and have not been classified in the fair value hierarchy. If the Valuation Committee is aware of facts that suggest that a Private Fund’s valuation does not reflect the fair value of the Fund's ownership interest in the Private Fund, the Valuation Committee shall determine in good faith the fair value of the Fund's ownership interest in the Private Fund.
Fair Value Measurements – A three-tier hierarchy has been established to classify fair value measurements for disclosure purposes. Inputs refer broadly to the assumptions that market participants would use in pricing the asset or liability, including assumptions about risk. Inputs may be observable or unobservable. Observable inputs are inputs that reflect the assumptions market participants would use in pricing the asset or liability that are developed based on market data obtained from sources independent of the reporting entity. Unobservable inputs are inputs that reflect the reporting entity’s own assumptions about the assumptions market participants would use in pricing the asset or liability that are developed based on the best information available.
The Fund utilizes various methods to measure the fair value of most of its investments on a recurring basis. U.S. GAAP establishes a hierarchy that prioritizes inputs to valuation methods as follows:
| Level 1 - | Unadjusted quoted prices in active markets for identical assets and liabilities that the Fund has the ability to access on the measurement date and on an on-going basis; |
| Level 2 - | Quoted prices which are not active, quoted prices for similar assets or liabilities in active markets or inputs other than quoted prices that are observable (either directly or indirectly) for substantially the full term of the asset or liability at the measurement date; and |
| Level 3 - | Significant unobservable inputs for the asset or liability, to the extent relevant observable inputs are not available, representing the Fund's own assumptions about the assumptions a market participant would use in valuing the asset or liability, and would be based on the best information available. |
The availability of observable inputs can vary from investment to investment and is affected by a wide variety of factors, including, for example, the type of investment, whether the investment is new and not yet established in the marketplace, the liquidity of markets, and other characteristics particular to the investment. To the extent that valuation is based on models or inputs that are less observable or unobservable in the market, the determination of fair value requires more judgment. Accordingly, the degree of judgment exercised in determining fair value is greatest for instruments categorized in Level 3.
The inputs used to measure fair value may fall into different levels of the fair value hierarchy. In such cases, for disclosure purposes, the level in the fair value hierarchy within which the fair value measurement falls in its entirety, is determined based on the lowest level input that is significant to the fair value measurement in its entirety.
| 16 | www.bdrex.com |
| Broadstone Real Estate Access Fund | Notes to Consolidated Financial Statements |
| March 31, 2021 (Unaudited) |
The inputs or methodology used for valuing securities are not necessarily an indication of the risk or liquidity associated with investing in those securities. The following tables summarize the valuation of the Fund’s investments under the fair value hierarchy levels as of March 31, 2021:
| Investments in Securities at Value | Level 1 - Unadjusted Quoted Prices | Level 2 - Other Significant Observable Inputs | Level 3 - Significant Unobservable Inputs | Total | ||||||||||||
| Private Real Estate Securities(a) | $ | – | $ | – | $ | – | $ | 31,795,424 | ||||||||
| Short Term Investments | 17,964,688 | – | – | 17,964,688 | ||||||||||||
| Total | $ | 17,964,688 | $ | – | $ | – | $ | 49,760,112 | ||||||||
| (a) | In accordance with Subtopic 820-10, certain investments that are measured at fair value using the net asset value per share (or its equivalent) practical expedient have not been categorized in the fair value hierarchy. The fair value amounts presented in this table are intended to permit reconciliation of the fair value hierarchy to the amounts presented in the Consolidated Statement of Assets and Liabilities. |
As of March 31, 2021, the Fund did not use any significant unobservable inputs (Level 3) when determining fair value.
The following is a reconciliation of the investments in which significant unobservable inputs (Level 3) were used in determining fair value:
| Asset Type | Balance as of September 30, 2020 | Accrued Discount/ premium | Realized Gain/(Loss) | Change in Unrealized Appreciation/ Depreciation | Purchases | Sales Proceeds | Balance as of March 31, 2021 | Net change in unrealized appreciation/(depreciation) included in the Consolidated Statement of Operations attributable to Level 3 investments held at March 31, 2021 | ||||||||||||||||||||||||
| Direct Real Estate | $ | 2,320,000 | $ | – | $ | 319,002 | $ | (77,298 | ) | $ | – | $ | (2,561,704 | ) | $ | – | $ | – | ||||||||||||||
Change in unrealized appreciation/depreciation on Level 3 securities is included on the Consolidated Statement of Operations under Net change in unrealized appreciation/(depreciation) on real estate investments.
Unfunded Commitments – Typically, when the Fund invests in Private Funds, the Fund makes a commitment to invest a specified amount of capital in the applicable Private Funds. The capital commitment may be drawn by the general partner of the Private Funds either all at once or through a series of capital calls at the discretion of the general partner. Thus, an unfunded commitment represents the portion of the Fund’s overall capital commitment to the Private Funds that has not yet been called by the general partner of the Private Funds. Unfunded commitments may subject the Fund to certain risks. For example, the Fund may be required to: (1) liquidate other portfolio investments, potentially at inopportune times, in order to obtain the cash needed to satisfy its obligations with respect to a capital call; (2) borrow under a credit facility which may result in additional expenses to the Fund; or, (3) to the extent a buyer can be identified and subject to the provisions of the limited partnership agreement of the relevant Private Funds, seek to sell/assign the interest subject to the capital call to a third party thereby eliminating the obligation. Fund management recognizes these risks as potentially detrimental to the overall strategy and so has structured its current agreements around capital commitments in such a way so as to mitigate these risks. As of March 31, 2021, the Fund had total unfunded commitments in the amount of $4,900,000.
Securities Transactions and Investment Income – Investment security transactions are accounted for on a trade date basis. Gains and losses on securities sold are determined on a specific identification basis. Dividend income is recorded on the ex-dividend date for public securities and interest income is recorded on the accrual basis. Rental income earned from real estate investments is recognized on an accrual basis in accordance with the terms of the underlying lease agreement.
Distributions made to the Fund in which the Fund invests may take several forms. The Fund re-characterizes distributions received from the underlying investments based on information provided by the investment into the following categories: dividend income, long-term capital gains, and return of capital. If information is not available on a timely basis from the investment, the re-characterization will be estimated based on available information which may include the previous year’s allocation. If new or additional information becomes available from the investment at a later date, a re-characterization will be made in the following year.
Distributions to Shareholders – Distributions are declared and paid quarterly. The character of income and gains to be distributed is determined in accordance with income tax regulations, which may differ from U.S. GAAP.
| Semi-Annual Report | March 31, 2021 (Unaudited) | 17 |
| Broadstone Real Estate Access Fund | Notes to Consolidated Financial Statements |
| March 31, 2021 (Unaudited) |
Indemnification – The Fund indemnifies its Officers and Trustees for certain liabilities that may arise from the performance of their duties to the Fund. Additionally, in the normal course of business, the Fund enters into contracts that contain a variety of representations and warranties and which provide general indemnities. The Fund’s maximum exposure under these arrangements is unknown, as this would involve future claims that may be made against the Fund that have not yet occurred. However, based on experience, the Fund expects the risk of loss due to these warranties and indemnities to be remote.
Federal Income Taxes – The Fund intends to comply with the requirements of Subchapter M of the Internal Revenue Code applicable to regulated investment companies and will distribute substantially all of its taxable income, if any, to shareholders. Accordingly, no provision for Federal income taxes is required in the consolidated financial statements.
The Fund has a wholly owned REIT Subsidiary and qualifies as a REIT for federal income tax purposes. REITs are companies that invest primarily in real estate or real estate-related assets. To qualify as a REIT for U.S. federal income tax purposes, a company must meet certain requirements, including, among other things, distributing at least 90 percent of its taxable income to its stockholders annually in the form of dividends. The Fund intends to make distributions to shareholders on a regular basis as necessary to avoid material U.S. federal income tax and to comply with the REIT distribution requirements.
As of and during the six months ended March 31, 2021, the Fund did not have a liability for any unrecognized tax benefits in the accompanying consolidated financial statements. The Fund files U.S. federal, state, and local tax returns as required. The Fund’s tax returns are subject to examination by the relevant tax authorities until expiration of the applicable statute of limitations, which is generally three years after the filing of the tax return but which can be extended to six years in certain circumstances. Tax returns for open years have incorporated no uncertain tax positions that require a provision for income taxes.
3. RISK FACTORS
Real Estate Industry Concentration – Because the Fund will concentrate its investments in real estate securities, its portfolio will be significantly impacted by the performance of the real estate market and may experience more volatility and be exposed to greater risk than a more diversified portfolio. Significant investments in the securities of issuers within the real estate industry and any development affecting the real estate industry will have a greater impact on the value of the net assets of the Fund than would be the case if the Fund did not have significant investments in the real estate industry. The Fund’s investment in real estate equity or debt may be subject to risks similar to those associated with direct investment in real property. The value of the Fund’s shares will be impacted by factors affecting the value of real estate and the earnings of companies engaged in the real estate industry. These factors include, among others: (i) changes in general economic and market conditions; (ii) changes in the value of real estate properties; (iii) risks related to local economic conditions, overbuilding and increased competition; (iv) increases in property taxes and operating expenses; (v) changes in zoning laws; (vi) casualty and condemnation losses; (vii) variations in rental income, neighborhood values or the appeal of property to tenants; (viii) the availability of financing; and (ix) changes in interest rates. Many real estate companies utilize leverage, which increases investment risk and could adversely affect a company’s operations and market value in periods of rising interest rates. The value of securities of companies in the real estate industry may go through cycles of relative under-performance and outperformance in comparison to equity securities markets in general. As of March 31, 2021, the Fund had 64.72% of the value of its net assets invested within the real estate industry.
Concentration of Credit Risk – The Fund places its cash with one banking institution, which is insured by Federal Deposit Insurance Corporation (“FDIC”). The FDIC limit is $250,000. At various times throughout the year, the amount on deposit may exceed the FDIC limit and subject the Fund to credit risk. The Fund does not believe that such deposits are subject to any unusual risk associated with investment activities.
Market and Geopolitical Risk – The increasing interconnectivity between global economies and financial markets increases the likelihood that events or conditions in one region or financial market may adversely impact issuers in a different country, region or financial market. The Fund's investments may underperform due to inflation (or expectations for inflation), interest rates, global demand for particular products or resources, natural disasters, pandemics, epidemics, terrorism, regulatory events and governmental or quasi-governmental actions. The occurrence of global events similar to those in recent years, such as terrorist attacks around the world, natural disasters, social and political discord or debt crises and downgrades, among others, may result in market volatility and may have long term effects on both the U.S. and global financial markets. It is difficult to predict when similar events affecting the U.S. or global financial markets may occur, the effects that such events may have and the duration of those effects. Any such event(s) could have a significant adverse impact on the value and risk profile of the Fund’s portfolio.
The current novel coronavirus (COVID-19) global pandemic and the aggressive responses taken by many governments, including closing borders, restricting international and domestic travel, and the imposition of prolonged quarantines or similar restrictions, as well as the forced or voluntary closure of, or operational changes to, many retail and other businesses, has had negative impacts, and in many cases severe negative impacts, on markets worldwide. It is not known how long such impacts, or any future impacts of other significant events described above, will or would last, but there could be a prolonged period of global economic slowdown, which may impact your investment. Therefore, the Fund could lose money over short periods due to short-term market movements and over longer periods during more prolonged market downturns.
| 18 | www.bdrex.com |
| Broadstone Real Estate Access Fund | Notes to Consolidated Financial Statements |
| March 31, 2021 (Unaudited) |
Leveraging Risk – The use of leverage, such as in connection with options and borrowing money to purchase securities, by the Fund will magnify the Fund’s gains or losses. Generally, the use of leverage also will cause the Fund to have higher expenses (especially interest and/or short selling related dividend expenses) than those of funds that do not use such techniques. In addition, a lender to the Fund may terminate or refuse to renew any credit facility. If the Fund is unable to access additional credit, it may be forced to sell investments at inopportune times, which may further depress the returns of the Fund.
Liquidation Risk – The Fund is in the process of liquidation and dissolution. The Fund is dependent on the Adviser’s expertise in the real estate market and its ability to liquidate the Fund’s portfolio in an orderly fashion to maximize value for shareholders and provide shareholders with liquidity. Although the Adviser is conducting an orderly disposal of the Fund’s investments, it is possible that, due to a market or political disruption during the liquidation of the Fund, including a potential resurgence of COVID-19, the Fund may receive depressed prices for its securities below what the Adviser believes it would receive in the absence of any disruption. Although the Adviser and the Fund have entered into an expense limitation and reimbursement agreement, the reduction in the Fund’s net assets may result in increased expense ratios, as certain fixed expenses would be spread across a smaller asset base, and the Fund may bear costs and expenses relating to the liquidation, including increased legal fees and costs of insurance.
Valuation of Private Investments – While the valuation of publicly traded securities held by the Fund are more readily ascertainable, the Fund expects to make investments in securities that are not publicly traded and for which no market based price quotations are available. The Fund expects that inputs into the determination of fair value of the Fund’s private investments will require significant management judgment or estimation. Because such valuations, and particularly valuations of private securities and private companies, are inherently uncertain, may fluctuate over short periods of time and may be based on estimates, the Fund’s determinations of fair value may differ materially from the values that would have been used if a ready market for these securities existed. The Fund’s net asset value could be adversely affected if the determinations regarding the fair value of the Fund’s investments were materially higher than the values that the Fund ultimately realizes upon the disposal of such securities.
Libor Risk – In March 2020, the FASB issued Accounting Standards Update (“ASU”) No. 2020-04, Reference Rate Reform (Topic 848): Facilitation of the Effects of Reference Rate Reform on Financial Reporting. The Fund’s investments, payment obligations, and financing terms may be based on floating rates, such as the London Interbank Offered Rate, or “LIBOR,” which is the offered rate for short-term Eurodollar deposits between major international banks. Plans are underway to phase out the use of LIBOR by the end of 2021. There remains uncertainty regarding the nature of any replacement rate and the impact of the transition from LIBOR on the Fund’s transactions and the financial markets generally. As such, the potential effect of a transition away from LIBOR on the Fund or the Fund’s investments cannot yet be determined.
4. DERIVATIVE TRANSACTIONS
The Fund may engage in transactions involving options and other derivative financial instruments. Derivatives can be volatile and involve various types and degrees of risk. By using derivatives, the Fund may be permitted to increase or decrease the level of risk, or change the character of the risk, to which the portfolio is exposed.
When the Fund writes (sells) an option, an amount equal to the premium received by the Fund is recorded on the Consolidated Statement of Assets and Liabilities as a liability. The amount of the liability is subsequently marked-to-market to reflect the current market value of the option written. When an option expires, the Fund realizes a gain on the option to the extent of the premium received. Premiums received from writing options which are exercised or closed are added to or offset against the proceeds or amount paid on the transaction to determine the realized gain or loss. The Fund, as writer of an option, might be exposed to other risks, such as being required to continue holding a security that the Fund might otherwise have sold to protect against depreciation in the market price of the security.
When writing options, the Fund may, but is not required to, economically offset its position by purchasing an option on the same security or commodity with the same exercise price and expiration date as the option that it has previously written on the security. If the amount paid to purchase an option is less or more than the amount received from the sale, the Fund will, accordingly, realize a profit or loss. To close out a position as a purchaser of an option, the Fund would liquidate the position by selling the option previously purchased.
| Semi-Annual Report | March 31, 2021 (Unaudited) | 19 |
| Broadstone Real Estate Access Fund | Notes to Consolidated Financial Statements |
| March 31, 2021 (Unaudited) |
The effect of derivative instruments on the Consolidated Statement of Operations for the six months ended March 31, 2021:
| Risk Exposure | Consolidated Statement of Operations Location | Realized Gain/(Loss) on Derivatives | Change in Unrealized Appreciation/(Depreciation) on Derivatives Recognized in Income | |||||||
| Equity Contracts (Written Options) | Net realized gain on written options/Net change in unrealized (depreciation) on written options | $ | – | $ | 118,768 | |||||
| Total | $ | – | $ | 118,768 | ||||||
The monthly average notional amount and monthly average number of contracts of written options held by the Fund during the six months ended March 31, 2021 was $5,771,929 and 727, respectively.
5. ADVISORY FEE AND OTHER RELATED PARTY TRANSACTIONS
Advisory Fees – Pursuant to an investment advisory agreement with the Fund and the Adviser (the “Advisory Agreement”), investment advisory services are provided to the Fund by the Adviser. The previous investment adviser, Broadstone Asset Management, LLC, was terminated as of February 7, 2020 and a new Advisory Agreement was established with the Adviser under the same terms. Under the terms of the Advisory Agreement, the Adviser receives monthly fees calculated at an annual rate of 1.25% of the average daily net assets of the Fund. The advisory fee is accrued daily and paid on a monthly basis.
The Adviser and the Fund have entered into an operating expenses limitation and reimbursement agreement (the “Expense Limitation Agreement”) pursuant to which the Adviser has contractually agreed to waive its fees and to defer reimbursement for the ordinary operating expenses of the Fund (including all expenses necessary or appropriate for the operation of the Fund and including the Adviser’s investment advisory or management fee detailed in the Advisory Agreement, any other expenses described in the Advisory Agreement as well as any shareholder servicing or distribution fee, but does not include any front-end or contingent deferred loads, brokerage fees and commissions, acquired fund fees and expenses, borrowing costs (such as interest and dividend expense on securities sold short), taxes and extraordinary expenses such as litigation), to the extent that such expenses exceed 1.99% and 1.74% per annum of the Fund’s average daily net assets attributable to Class W and Class I shares, respectively. In consideration of the Adviser’s agreement to limit the Fund’s expenses, the Fund has agreed to repay the Adviser in the amount of any fees waived and Fund expenses paid or absorbed, subject to the limitations that: (1) the reimbursement for fees and expenses will be made only if payable within three years from the date on which they were incurred; and (2) the reimbursement may not be made if it would cause the Expense Limitation in effect at the time of the waiver or currently in effect, whichever is lower, to be exceeded. The Expense Limitation Agreement will remain in effect through February 7, 2022. Previously waived fees from inception (October 5, 2018) through February 7, 2020 are no longer entitled to be recaptured by the previous investment adviser. Any waived fees subject to the new Expense Limitation Agreement are subject to the same terms.
During the six months ended March 31, 2021, the fees waived/reimbursed under the Expense Limitation Agreement were as follows:
Fees Waived/Reimbursed By Adviser | ||||
| Class I | $ | 302,379 | ||
| Class W | 3,166 | |||
As of March 31, 2021, the balances of recoupable expenses for the Fund were as follows:
| Fund | Expires 2023 | Expires 2024 | ||||||
| Class I | $ | 575,560 | $ | 302,379 | ||||
| Class W | 5,977 | 3,166 | ||||||
At March 31, 2021 the Adviser owned 38% and 18% of Class I and Class W outstanding shares, respectively. Investment activities of significant shareholders could have a material impact on the Fund.
| 20 | www.bdrex.com |
| Broadstone Real Estate Access Fund | Notes to Consolidated Financial Statements |
| March 31, 2021 (Unaudited) |
Affiliated Companies – Clarion Lion Industrial Trust and Clarion Lion Properties Fund are investments of the Fund as of March 31, 2021. These funds were not related parties as of the time that the Fund's respective capital commitments were made. Following the recent acquisition of Clarion's parent company by the parent company of the Adviser, these funds may be considered to be related parties of the Fund.
| Security Name | Market Value as of September 30, 2020 | Purchases | Sales | Market Value as of March 31, 2021 | Share Balance as of March 31, 2021 | Dividends | Change in Unrealized Gain (Loss) | Realized Gain/Loss | ||||||||||||||||||||||||
| Clarion Lion Industrial Trust | $ | 2,384,285 | $ | 666,667 | $ | – | $ | 3,305,000 | 1,352 | $ | 41,785 | $ | 254,048 | $ | – | |||||||||||||||||
| Clarion Lion Properties Fund | 3,051,534 | – | (1,084,171 | ) | 2,037,597 | 1,317 | 39,925 | 38,246 | 31,988 | |||||||||||||||||||||||
| Total | $ | 5,342,597 | 2,669 | $ | 81,710 | $ | 292,294 | $ | 31,988 | |||||||||||||||||||||||
Distributor – The distributor of the Fund is ALPS Distributors, Inc. (the “Distributor”). The Board has adopted, on behalf of the Fund, a Shareholder Services Plan (the “Plan”) and a Distribution Plan under which the Fund may compensate financial industry professionals for providing ongoing services in respect to clients with whom they have distributed shares of the Fund. Under the Plan, the Fund pays up to 0.25% per year of the average daily net assets of Class W shares for such services. Class I shares are not subject to a fee for such services. Plan fees in the amount of $219 are disclosed in the Consolidated Statement of Operations for the six months ended March 31, 2021, as shareholder servicing fees.
Officer and Trustee Compensation – Each Independent Trustee who is not affiliated with the Fund or Adviser receives an annual retainer of $25,000, (to be pro-rated for a partial term), as well as reimbursement for any reasonable expenses incurred attending the meetings. Each Independent Trustee also receives a fee of $1,000 for each meeting of the Board (or committees of our Board) attended, provided that an Independent Trustee will not receive separate meeting fees for attending committee meetings held on the same day that the Independent Trustee received a fee for attending a meeting of our Board. In addition, the chairman of each of the Audit Committee and the Nominating and Corporate Governance Committee will receive an annual retainer of $5,000. None of the Fund’s executive officers receive compensation from the Fund. Fees are disclosed in the Consolidated Statement of Operations.
Certain Trustees and officers of the Fund are also officers of the Adviser and are not paid by the Fund for serving in such capacities.
ALPS Fund Services, Inc. (“ALPS”) – ALPS provides administration and fund accounting services to the Fund. Pursuant to separate servicing agreements with ALPS, the Fund pays ALPS customary fees for providing administration and fund accounting services to the Fund. Fees are disclosed in the Consolidated Statement of Operations.
Transfer Agent – DST Systems, Inc. serves as transfer, dividend paying and shareholder servicing agent for the Fund (“Transfer Agent”) and receives customary fees from the Fund for such services. Fees are disclosed in the Consolidated Statement of Operations.
6. PURCHASES AND SALES OF INVESTMENT SECURITIES
The cost of purchases and proceeds from the sale of securities, other than short-term securities, for the six months ended March 31, 2021, were as follows:
| Purchases of Securities | Proceeds from Sales of Securities | |||||||
| Broadstone Real Estate Access Fund | $ | 44,682,269 | $ | 61,383,020 | ||||
7. REPURCHASE OFFERS
Pursuant to Rule 23c-3 under the 1940 Act, the Fund offers shareholders on a quarterly basis the option of having their shares repurchased, at NAV, of no less than 5% and no more than 25% of the outstanding shares. Shareholders will be notified in writing of each quarterly repurchase offer and the date the repurchase offer ends (the “Repurchase Request Deadline”). Shares will be repurchased at the NAV per share determined as of the close of regular trading on the NYSE no later than the 14th day after the Repurchase Request Deadline, or the next business day if the 14th day is not a business day (each a “Repurchase Pricing Date”). There is no guarantee that shareholders will be able to sell all of the shares they desire to sell in a quarterly repurchase offer, although each shareholder will have the right to require the Fund to purchase at least 5% of such shareholder’s shares in each quarterly repurchase. Limited liquidity will be provided to shareholders only through the Fund's quarterly repurchases.
| Semi-Annual Report | March 31, 2021 (Unaudited) | 21 |
| Broadstone Real Estate Access Fund | Notes to Consolidated Financial Statements |
| March 31, 2021 (Unaudited) |
During the six months ended March 31, 2021, the Fund completed the quarterly repurchase offers in the table below. The result of those repurchase offers were as follows:
| Repurchase Offer #1 | Repurchase Offer #2 | |
| Commencement Date | September 14, 2020 | December 14, 2020 |
| Repurchase Request Deadline | October 14, 2020 | January 13, 2021 |
| Repurchase Pricing Date | October 14, 2020 | January 13, 2021 |
| Amount Repurchased | $835,382 | $1,660,077 |
| Shares Repurchased | 88,121 | 174,378 |
| Percentage of Outstanding Shares the Fund Offered by Repurchase | 5.00% | 5.00% |
| Percentage of Outstanding Shares Repurchased | 1.61% | 3.18% |
8. TAX BASIS INFORMATION
Distributions are determined in accordance with federal income tax regulations, which differ from U.S. GAAP, and, therefore, may differ significantly in amount or character from net investment income and realized gains for financial reporting purposes. Financial reporting records are adjusted for permanent book/tax differences to reflect tax character but are not adjusted for temporary differences. The amounts and characteristics of tax basis distributions and composition of distributable earnings/(accumulated losses) are finalized at fiscal year-end.
The tax character of Fund distributions for the following year was as follows:
| Year | Ordinary Income | Long-Term Capital Gain | Return of Capital | |||||||||
| 2020 | $ | 2,993,656 | $ | 340,284 | $ | 644,831 | ||||||
For the year ended September 30, 2020, the following reclassifications, which had no impact on results of operations or net assets, were recorded to reflect tax character.
| Paid-in Capital | Total Distributable Earnings | |||||||
| Broadstone Real Estate Access Fund | $ | (20,927 | ) | $ | 20,927 | |||
As of September 30, 2020, the components of accumulated earnings/(deficit) on a tax basis were as follows:
Undistributed long-term capital gain | Other cumulative effect of timing differences | Net unrealized appreciation/(depreciation) on investments | Total | |||||||||||||
| Broadstone Real Estate Access Fund | $ | (4,721,504 | ) | $ | – | $ | 1,175,204 | $ | (3,546,300 | ) | ||||||
Tax Basis of Investments: As of March 31, 2021, the aggregate cost of investments, gross unrealized appreciation/(depreciation) and net unrealized appreciation/(depreciation) for Federal tax purposes was as follows:
Gross Appreciation (excess of value over tax cost) | Gross Depreciation (excess of tax cost over value) | Net Unrealized Appreciation/(Depreciation) | Cost of Investments for Income Tax Purposes | |||||||||||||
| Broadstone Real Estate Access Fund | $ | 1,464,674 | $ | (5,532 | ) | $ | 1,459,142 | $ | 48,300,970 | |||||||
The difference between book basis and tax basis net unrealized appreciation is primarily attributable to the investments in partnerships, wash sales and certain other investments.
| 22 | www.bdrex.com |
| Broadstone Real Estate Access Fund | Notes to Consolidated Financial Statements |
| March 31, 2021 (Unaudited) |
9. REPURCHASE FEES
Shareholders of the Fund who tender shares for repurchase during the first 90 days following such shareholder’s initial purchase will be subject to a repurchase fee of 2.00%, deductible from repurchase proceeds. The repurchase fee does not apply to shares that were acquired through reinvestment of distributions or in connection with the death or disability of the shareholder. The repurchase fee is paid directly to the Fund. For the six months ended March 31, 2021, the Fund received $3.98 in repurchase fees, which is reflected in “Shares repurchased, net of repurchase fees” in the Consolidated Statement of Changes in Net Assets.
10. LINE OF CREDIT
The Fund has a secured revolving bank line of credit through BNP Paribas Prime Brokerage International, Ltd. (the “Bank”) for the purpose of investment purchases subject to the limitations of the 1940 Act for borrowings.
Borrowings under this arrangement bear interest at the Bank's 1 month LIBOR plus 95 basis points at the time of borrowing. As of March 31, 2021, the Fund had $0 of outstanding borrowings. During the six months ended March 31, 2021, the Fund had average borrowings of $1,599,206 and an average interest rate of 0.55%.
During the six months ended March 31, 2021, the Fund incurred $8,946 of interest expense related to the borrowings. As collateral security for the revolving line of credit, the Fund grants the Bank a first position security interest in and lien on all securities of any kind or description held by the Fund in the pledge account. As of March 31, 2021, the Fund did not have securities pledged as collateral for the line of credit.
11. CREDIT FACILITIES
Information about the Fund's senior securities as of March 31, 2021 and September 30, 2020 is shown in the following table.
| Credit Facility at BNP Paribas | Total Amount Outstanding(1) | Asset Coverage Per Unit(2) | Involuntary Liquidating Preference per Unit(3) | Average Market Value per Unit(4) | ||||||||||||
| September 30 2020 | 4,096,365 | $ | 13,711 | – | N/A | |||||||||||
| March 31 2021 | – | $ | – | – | N/A | |||||||||||
| September 30, 2020 | March 31, 2021 | |||||||||||||||
| Asset Coverage per Unit: | ||||||||||||||||
| Net Assets | $ | 52,069,275 | $ | – | – | N/A | ||||||||||
| Line of Credit | $ | 4,096,365 | $ | – | – | N/A | ||||||||||
| Total | $ | 5,232 | $ | – | – | N/A | ||||||||||
| (1) | Total amount of each class of senior securities outstanding at principal value at the end of the period presented. |
| (2) | The asset coverage ratio for a class of senior securities representing indebtedness is calculated as the Fund's consolidated total assets, less all liabilities and indebtedness not represented by senior securities, divided by total senior securities representing indebtedness. This asset coverage ratio is multiplied by $1,000 to determine the "Asset Coverage Per Unit''. |
| (3) | The amount to which such class of senior security would be entitled upon the Fund's involuntary liquidation in preference to any security junior to it. The "—" in this column indicates that the SEC expressly does not require this information to be disclosed for certain types of senior securities. |
| (4) | Not applicable to senior securities outstanding as of period end. |
12. SUBSEQUENT EVENTS
Subsequent events after the date of the Consolidated Statement of Assets and Liabilities have been evaluated through the date the consolidated financial statements were issued.
The Fund completed a quarterly repurchase offer on April 14, 2021, which resulted in 266,735 Fund shares being repurchased for $2,496,630.
The Fund completed a liquidating distribution of $3.1593 per share for Class I and Class W on April 21, 2021. The $15,999,547 distribution was payable to shareholders of record as of April 19, 2021.
| Semi-Annual Report | March 31, 2021 (Unaudited) | 23 |
| Broadstone Real Estate Access Fund | Notes to Consolidated Financial Statements |
| March 31, 2021 (Unaudited) |
On March 3, 2021, the Board approved a Plan of Liquidation (the “Plan”) for the Fund, which authorizes the liquidation and dissolution of the Fund in accordance with the Delaware Statutory Trust Act, as amended, and the Fund’s Agreement and Declaration of Trust dated June 19, 2018. As of March 3, 2021 the Fund was closed to new investors and shares of the Fund are no longer available for purchase including shares purchased through the Fund’s automatic investment plan. In addition, effective March 3, 2021, the Board terminated the Fund’s Dividend Reinvestment Policy. As a result of this termination, all future distributions are expected to be liquidation distributions that will be paid in cash. There are no changes to the quarterly repurchase policy at this time.
Management has determined that there were no other subsequent events to report through the issuance of these consolidated financial statements.
| 24 | www.bdrex.com |
| Broadstone Real Estate Access Fund | Additional Information |
| March 31, 2021 (Unaudited) |
1. PROXY VOTING POLICIES AND VOTING RECORD
A description of the Fund’s proxy voting policies and procedures is available without charge, upon request by calling 1-833-280-4479, or on the SEC’s website at http://www.sec.gov. Information regarding how the Fund voted proxies relating to portfolio securities during the most recent 12 month period ended June 30th is available on the SEC’s website at http://www.sec.gov.
2. QUARTERLY PORTFOLIO HOLDINGS
The Fund’s portfolio holdings are made available semi-annually in shareholder reports within 60 days after the close of the period for which the report is being made, as required by federal securities laws. The Fund also files a complete schedule of portfolio holdings with the commission for the first and third quarters of the Fund’s fiscal year on Part F of Form N-PORT. Portfolio holdings filed on Form N-PORT become publicly available on the commissions website at www.sec.gov within 60 days after the end of that Funds’ fiscal quarter. Schedules of portfolio holdings are also available upon request, without charge by contacting the Fund at 1-833-280-4479.
| Semi-Annual Report | March 31, 2021 (Unaudited) | 25 |

| Item 2. | Code of Ethics. |
Not applicable to semi-annual report.
| Item 3. | Audit Committee Financial Expert. |
Not applicable to semi-annual report.
| Item 4. | Principal Accountant Fees and Services. |
Not applicable to semi-annual report.
| Item 5. | Audit Committee of Listed Registrants. |
Not applicable to the Registrant.
| Item 6. | Schedule of Investments. |
| (a) | The Registrant’s “Schedule I – Investments in securities of unaffiliated issuers” (as set forth in 17 CFR 210.12-12) is included in Item 1 of this Form N-CSR. |
| (b) | Not applicable to the Registrant. |
| Item 7. | Disclosure of Proxy Voting Policies and Procedures for Closed-End Management Investment Companies. |
Not applicable to semi-annual report.
| Item 8. | Portfolio Managers of Closed-End Management Investment Companies. |
(a) Not applicable to semi-annual report.
(b) Not applicable to the Registrant.
| Item 9. | Purchases of Equity Securities by Closed-End Management Investment Company and Affiliated Purchasers. |
Not applicable to the Registrant.
| Item 10. | Submission of Matters to a Vote of Security Holders. |
No material changes to the procedures by which the shareholders may recommend nominees to the Registrant’s Board of Trustees have been implemented after the Registrant last provided disclosure in response to the requirements of Item 407(c)(2)(iv) of Regulation S-K (17 CFR 229.407) (as required by Item 22(b)(15) of Schedule 14A (17 CFR 240.14a-101)), or this Item.
| Item 11. | Controls and Procedures. |
| (a) | The Registrant’s principal executive officer and principal financial officer have concluded that the Registrant’s disclosure controls and procedures (as defined in Rule 30a-3(c) under the Investment Company Act of 1940, as amended (the “1940 Act”), are effective as of a date within 90 days of the filing date of this Report, based on the evaluation of these controls and procedures required by Rule 30a-3(b) under the 1940 Act and Rules 13a-15(b) or 15d-15(b) under the Securities Exchange Act of 1934, as amended. |
| (b) | There was no change in the Registrant’s internal control over financial reporting (as defined in Rule 30a-3(d) under the 1940 Act, as amended) during the period covered by this report that has materially affected, or is reasonably likely to materially affect, the Registrant’s internal control over financial reporting. |
| Item 12. | Disclosure of Securities Lending Activities for Closed-End Management Investment Companies. |
Not applicable to the Registrant.
Item 13. Exhibits.
| (a)(1) | Not applicable to semi-annual report. |
| (a)(3) | None. |
| (a)(4) | There was no change in the Registrant’s independent public accountant for the period covered by this report. |
SIGNATURES
Pursuant to the requirements of the Securities Exchange Act of 1934 and the Investment Company Act of 1940, the Registrant has duly caused this report to be signed on its behalf by the undersigned, thereunto duly authorized.
Broadstone Real Estate Access Fund
| By: | /s/ Richard J. Byrne | |
| Richard J. Byrne, Chief Executive Officer | ||
| (Principal Executive Officer) | ||
| Date: | June 7, 2021 |
Pursuant to the requirements of the Securities Exchange Act of 1934 and the Investment Company Act of 1940, this report has been signed below by the following persons on behalf of the Registrant and in the capacities and on the dates indicated.
| By: | /s/ Richard J. Byrne | |
| Richard J. Byrne, Chief Executive Officer | ||
| (Principal Executive Officer) | ||
| Date: | June 7, 2021 |
| By: | /s/ Jerome S. Baglien | |
| Jerome S. Baglien, Chief Financial Officer | ||
| (Principal Financial Officer) | ||
| Date: | June 7, 2021 |