As filed with the U.S. Securities and Exchange Commission on September 5, 2019
UNITED STATES
SECURITIES AND EXCHANGE COMMISSION
Washington, D.C. 20549
FORM N-CSR
CERTIFIED SHAREHOLDER REPORT OF REGISTERED MANAGEMENT INVESTMENT COMPANIES
Investment Company Act file number 811-23376
Pacific Global ETF Trust
(Exact name of registrant as specified in charter)
840 Newport Center Drive, 7th Floor
Newport Beach, California 92660
(Address of principal executive offices) (Zip code)
National Registered Agents, Inc.
160 Greentree Drive, Suite 101
Dover, DE 19904
(Name and address of agent for service)
(949) 219-3391
Registrant’s telephone number, including area code
Date of fiscal year end: June 30
Date of reporting period: June 30, 2019
Item 1. Reports to Stockholders.

ANNUAL REPORT
June 30, 2019
Pacific Global US Equity Income ETF
Ticker: USDY
Beginning on January 1, 2021, as permitted by regulations adopted by the Securities and Exchange Commission, paper copies of the Fund's shareholder reports may no longer be sent by mail, unless you specifically request paper copies of the reports from the Fund or from the financial intermediary that services your shareholder account. Instead, the reports may be made available on a website, and you will be notified by mail each time a report is posted and provided with a website link to access the report.
If you already elected to receive shareholder reports electronically, you will not be affected by this change and you need not take any action. You may be eligible to elect to receive shareholder reports and other communications from the Fund or the financial intermediary that services your shareholder account electronically. If you would like to sign up for electronic delivery of shareholder communications, please contact the Fund or your financial intermediary for instructions.
You may elect to receive all future reports in paper free of charge. You can inform the Fund that you wish to continue receiving paper copies of your shareholder reports by calling Shareholder Services at (866) 933-2398. If you hold your account with a financial intermediary, you will need to contact that intermediary to continue receiving paper copies of shareholder reports. Your election to receive reports in paper will apply to all funds held with your financial intermediary.
PACIFIC GLOBAL ETFs
TABLE OF CONTENTS
Letter to Shareholders | A-1 | ||||||
Performance Summary | A-2 | ||||||
Portfolio Allocation | B-1 | ||||||
Portfolio of Investments | B-2 | ||||||
Statement of Assets and Liabilities | C-1 | ||||||
Statement of Operations | C-2 | ||||||
Statement of Changes in Net Assets | C-3 | ||||||
Financial Highlights | C-4 | ||||||
Notes to Financial Statements | D-1 | ||||||
Report of Independent Registered Public Accounting Firm | E-1 | ||||||
Trustees and Officers | F-1 | ||||||
Expense Examples | F-3 | ||||||
Approval of Advisory Agreement and Board Considerations | F-4 | ||||||
| Federal Tax Information | F-6 | ||||||
| Additional Information | F-7 | ||||||
LETTER TO SHAREHOLDERS—PACIFIC GLOBAL ETFs
Dear Shareholder:
We are pleased to share with you the annual report for the Pacific Global US Equity Income ETF (the "Fund"), a series of the Pacific Global ETF Trust. The report covers performance for the reporting period beginning February 11, 2019 (the Fund's inception) and ending June 30, 2019.
Over the reporting period, U.S. equity markets staged a strong rebound from the sharp contraction in the fourth quarter of 2018. The surge in equity prices in the first half of this year was fueled largely by expectations (now realized) that the U.S. Federal Reserve would ease monetary policy enough to offset the slowdown in global economic growth. Another factor for the rebound was growing optimism over a resolution to the escalating U.S.-China trade war. Additionally, unemployment remained low, job creation continued to be strong and the U.S. economy saw sustained growth, albeit at a slower rate than the year before.
Specific to U.S. equity markets, the rebound was narrowly driven by large-cap growth stocks, while investors shunned value-oriented investments. High-dividend paying companies (those with a history of generating strong performance with lower levels of volatility) have not held up as well as investors preferred riskier securities. While most equity indices closed in on record levels during the second quarter of this year, we believe the remainder of 2019 will see increased volatility due to various economic factors.
On the following pages, you will find the performance discussion and financial statements for the Fund. We value your continued confidence in us and look forward to helping you meet your investment goals in the future.
Michael J. Skillman,
CEO and President,
Pacific Global ETFs
A-1
PERFORMANCE SUMMARY—PACIFIC GLOBAL ETFs
June 30, 2019 (Unaudited)
The Pacific Global US Equity Income ETF (the "Fund") is an actively managed exchange-traded fund whose investment objective is to seek income and long-term growth of capital. The Fund seeks to achieve its investment objective by investing in common stocks of U.S. companies that have above average dividend yield and demonstrate financial strength—strong balance sheets, predictable earnings, and cash-flow and dividend growth. The Fund invests at least 80% of its assets in equity securities of U.S. companies that pay regular dividends. When selecting portfolio companies, Cadence Capital Management LLC, the Fund's subadvisor, emphasizes companies that have a history of paying and/or growing dividends.
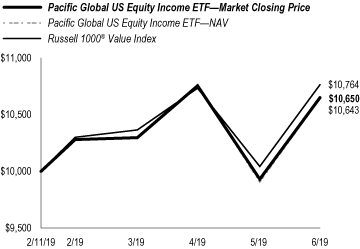
From February 11, 2019 (the Fund's inception) through the fiscal year end of June 30, 2019, on a market closing price basis, the Fund returned 6.50%. On a net asset value ("NAV") basis, the Fund returned 6.43%. During the same period, the Russell 1000 Value Index (the "Benchmark Index") returned 7.64%.
The Fund's strategy to invest in premium dividend yielding stocks was a headwind to performance during the reporting period, as the strongest performing stocks in the Benchmark Index paid low dividends. The Fund's underperformance relative to the Benchmark Index during the period was primarily due to an underweight of approximately 19% to stocks that paid dividends below 2.2%.
The Fund's exposure to four major areas: Financials, Industrials, Technology and Consumer contributed approximately 80% of the returns.
From a portfolio allocation perspective, the largest weightings in the Fund were Financials, Industrials and Consumer Staples.
A-2
PERFORMANCE SUMMARY—PACIFIC GLOBAL ETFs
June 30, 2019 (Unaudited) (Continued)
The graph below shows the historical performance of a hypothetical $10,000 investment in the Fund at inception (February 11, 2019) to June 30, 2019, assuming the reinvestment of distributions. The results shown below do not reflect the deduction of taxes that a shareholder would pay on fund distributions or the redemption of fund shares. Fund returns based on the market closing price do not include brokerage commissions that may be payable on secondary market transactions.
Total Cumulative Return Period Ended June 30, 2019(1)
| One Month | Three Months | Since Inception(2) | |||||||||||||
Pacific Global US Equity Income ETF—NAV | 7.43 | % | 3.36 | % | 6.43 | % | |||||||||
Pacific Global US Equity Income ETF—Market | 7.24 | % | 3.43 | % | 6.50 | % | |||||||||
Russell 1000® Value Index | 7.18 | % | 3.84 | % | 7.64 | % | |||||||||
(1) Not annualized.
(2) Commencement of operations on February 11, 2019.
The performance data quoted represents past performance and does not guarantee future results. Current performance may be lower or higher. The investment return and net asset value of an investment will fluctuate so that shares, when redeemed or sold, may be worth more or less than their original cost.
Benchmark index performance is from inception date of the Fund only and is not the inception date of the benchmark index itself.
The expense ratios of the Fund are set forth according to the February 7, 2019 Prospectus for the Fund and may differ from the expense ratio disclosed in the Financial Highlights table in this report. See the Financial Highlights for most current expense ratio.
The Russell 1000® Value Index measures the performance of the large-cap value segment of the US equity universe. It includes those Russell 1000® companies with lower price-to-book ratios and lower expected growth values. The Russell 1000® Value Index is constructed to provide a comprehensive and unbiased barometer for the large-cap value segment. The index is completely reconstituted annually to ensure new and growing equities are included and that the represented companies continue to reflect value characteristics. The volatility of the index may be materially different from that of the Fund. You cannot invest directly in an index. Index results assume the re-investment of all dividends and capital gains, but do not reflect operating expenses such as transaction costs and invest investment advisory fees. In addition, the Fund's holdings will differ significantly from the securities that comprise the index.
The price used to calculate Market Price return is based on the midpoint of the 4:00 PM Eastern (U.S.) bid/ask spread on the NYSE and does not represent returns an investor would receive if shares were traded at other times.
The Fund's shares may trade above or below their net asset value. The net asset value of the Fund will generally fluctuate with changes in the market value of the Fund's holdings. The market prices of shares, however, will generally fluctuate in accordance with changes in net asset value as well as the relative supply of, and demand for, shares on the exchange. The trading price of shares may deviate significantly from the net asset value.
A-3
PACIFIC GLOBAL ETFs
PACIFIC GLOBAL US EQUITY INCOME ETF
Portfolio Allocation
June 30, 2019
Financials | 26.3 | % | |||||
Consumer, Non-cyclical | 23.5 | % | |||||
Consumer, Cyclical | 12.0 | % | |||||
Industrial | 11.7 | % | |||||
Technology | 8.1 | % | |||||
Energy | 7.6 | % | |||||
Communications | 5.7 | % | |||||
Basic Materials | 3.2 | % | |||||
Utilities | 1.7 | % | |||||
Short Term Investments | 0.1 | % | |||||
Total Investments | 99.9 | % | |||||
Other Assets in Excess of Liabilities | 0.1 | % | |||||
Net Assets | 100.0 | % | |||||
Percentages indicated are based upon net assets.
See Notes to Financial Statements
B-1
PACIFIC GLOBAL ETFs
PACIFIC GLOBAL US EQUITY INCOME ETF
Portfolio of Investments
June 30, 2019
Security Description | Shares | Fair Value | |||||||||
COMMON STOCKS - 99.8% | |||||||||||
Basic Materials - 3.2% | |||||||||||
Air Products & Chemicals, Inc. | 603 | $ | 136,501 | ||||||||
Albemarle Corp. | 368 | 25,911 | |||||||||
Cabot Corp. | 299 | 14,265 | |||||||||
Celanese Corp. | 474 | 51,097 | |||||||||
CF Industries Holdings, Inc. | 722 | 33,725 | |||||||||
Chemours Co. | 540 | 12,960 | |||||||||
Domtar Corp. | 192 | 8,550 | |||||||||
Dow, Inc. | 2,183 | 107,644 | |||||||||
DuPont de Nemours, Inc. | 2,112 | 158,548 | |||||||||
Eastman Chemical Co. | 815 | 63,431 | |||||||||
Huntsman Corp. | 702 | 14,349 | |||||||||
International Paper Co. | 3,130 | 135,591 | |||||||||
LyondellBasell Industries NV | 1,032 | 88,886 | |||||||||
Nucor Corp. | 1,037 | 57,139 | |||||||||
Olin Corp. | 471 | 10,320 | |||||||||
Reliance Steel & Aluminum Co. | 228 | 21,573 | |||||||||
RPM International, Inc. | 424 | 25,911 | |||||||||
Steel Dynamics, Inc. | 878 | 26,515 | �� | ||||||||
Valvoline, Inc. | 762 | 14,882 | |||||||||
1,007,798 | |||||||||||
Communications - 5.7% | |||||||||||
AT&T, Inc. | 12,005 | 402,288 | |||||||||
CenturyLink, Inc. | 3,975 | 46,746 | |||||||||
Cisco Systems, Inc. | 6,906 | 377,965 | |||||||||
Corning, Inc. | 2,881 | 95,736 | |||||||||
Interpublic Group of Cos., Inc. | 15,172 | 342,735 | |||||||||
John Wiley & Sons, Inc. | 229 | 10,502 | |||||||||
Juniper Networks, Inc. | 1,871 | 49,825 | |||||||||
Omnicom Group, Inc. | 652 | 53,431 | |||||||||
Verizon Communications, Inc. | 6,733 | 384,656 | |||||||||
Viacom, Inc. | 1,110 | 33,156 | |||||||||
1,797,040 | |||||||||||
Consumer, Cyclical - 12.0% | |||||||||||
Best Buy Co, Inc. | 779 | 54,320 | |||||||||
Carnival Corp. | 1,870 | 87,048 | |||||||||
Cinemark Holdings, Inc. | 396 | 14,296 | |||||||||
Copa Holdings SA | 88 | 8,586 | |||||||||
Darden Restaurants, Inc. | 330 | 40,171 | |||||||||
Delta Air Lines, Inc. | 5,639 | 320,013 | |||||||||
Dick's Sporting Goods, Inc. | 551 | 19,081 | |||||||||
Extended Stay America, Inc. | 763 | 12,887 | |||||||||
Fastenal Co. | 1,868 | 60,878 | |||||||||
Foot Locker, Inc. | 511 | 21,421 | |||||||||
Ford Motor Co. | 15,615 | 159,741 | |||||||||
Gap, Inc. | 976 | 17,539 | |||||||||
General Motors Co. | 3,747 | 144,372 | |||||||||
Genuine Parts Co. | 493 | 51,065 | |||||||||
Goodyear Tire & Rubber Co. | 2,221 | 33,981 | |||||||||
Hanesbrands, Inc. | 1,878 | 32,339 | |||||||||
Harley-Davidson, Inc. | 6,085 | 218,026 | |||||||||
Hasbro, Inc. | 319 | 33,712 | |||||||||
Home Depot, Inc. | 1,905 | 396,183 | |||||||||
IAA, Inc. * | 384 | 14,892 | |||||||||
International Game Technology Plc | 330 | 4,280 | |||||||||
KAR Auction Services, Inc. | 384 | 9,600 | |||||||||
Kohl's Corp. | 547 | 26,010 | |||||||||
L Brands, Inc. | 672 | 17,539 | |||||||||
Las Vegas Sands Corp. | 1,122 | 66,299 | |||||||||
Lear Corp. | 283 | 39,413 | |||||||||
Leggett & Platt, Inc. | 464 | 17,804 | |||||||||
Lowe's Cos, Inc. | 2,702 | 272,659 | |||||||||
Macy's, Inc. | 1,490 | 31,975 | |||||||||
McDonald's Corp. | 1,901 | 394,762 | |||||||||
Security Description | Shares | Fair Value | |||||||||
MSC Industrial Direct Co., Inc. | 317 | $ | 23,540 | ||||||||
Newell Brands, Inc. | 4,422 | 68,187 | |||||||||
Nordstrom, Inc. | 477 | 15,197 | |||||||||
Nu Skin Enterprises, Inc. | 224 | 11,048 | |||||||||
Polaris Industries, Inc. | 317 | 28,920 | |||||||||
Ralph Lauren Corp. | 172 | 19,537 | |||||||||
Royal Caribbean Cruises Ltd. | 613 | 74,302 | |||||||||
Scotts Miracle-Gro Co. | 124 | 12,214 | |||||||||
Six Flags Entertainment Corp. | 592 | 29,411 | |||||||||
Tapestry, Inc. | 872 | 27,669 | |||||||||
Target Corp. | 1,863 | 161,354 | |||||||||
Thor Industries, Inc. | 191 | 11,164 | |||||||||
Tiffany & Co. | 419 | 39,235 | |||||||||
Vail Resorts, Inc. | 205 | 45,752 | |||||||||
VF Corp. | 1,110 | 96,959 | |||||||||
Walgreens Boots Alliance, Inc. | 4,613 | 252,193 | |||||||||
Watsco, Inc. | 511 | 83,564 | |||||||||
Whirlpool Corp. | 212 | 30,180 | |||||||||
Williams-Sonoma, Inc. | 269 | 17,485 | |||||||||
Wyndham Destinations, Inc. | 1,642 | 72,084 | |||||||||
Wyndham Hotels & Resorts, Inc. | 276 | 15,384 | |||||||||
Wynn Resorts Ltd. | 303 | 37,569 | |||||||||
3,793,840 | |||||||||||
Consumer, Non-cyclical - 23.5% | |||||||||||
AbbVie, Inc. | 5,904 | 429,339 | |||||||||
Alaska Air Group, Inc. | 432 | 27,609 | |||||||||
Altria Group, Inc. | 7,860 | 372,171 | |||||||||
Amgen, Inc. | 2,107 | 388,278 | |||||||||
Archer-Daniels-Midland Co. | 2,851 | 116,321 | |||||||||
Bristol-Myers Squibb Co. | 5,461 | 247,656 | |||||||||
Bunge Ltd. | 4,870 | 271,308 | |||||||||
Campbell Soup Co. | 514 | 20,596 | |||||||||
Cardinal Health, Inc. | 8,507 | 400,680 | |||||||||
Clorox Co. | 377 | 57,722 | |||||||||
Coca-Cola Co. | 7,524 | 383,122 | |||||||||
Colgate-Palmolive Co. | 2,734 | 195,946 | |||||||||
Conagra Brands, Inc. | 1,369 | 36,306 | |||||||||
Coty, Inc. | 1,486 | 19,912 | |||||||||
CVS Health Corp. | 4,780 | 260,462 | |||||||||
Eli Lilly & Co. | 2,822 | 312,649 | |||||||||
Flowers Foods, Inc. | 567 | 13,194 | |||||||||
General Mills, Inc. | 1,931 | 101,416 | |||||||||
Gilead Sciences, Inc. | 3,928 | 265,376 | |||||||||
Hershey Co. | 394 | 52,808 | |||||||||
Ingredion, Inc. | 356 | 29,366 | |||||||||
JM Smucker Co. | 354 | 40,777 | |||||||||
Johnson & Johnson | 2,708 | 377,170 | |||||||||
Kellogg Co. | 2,142 | 114,747 | |||||||||
Kimberly-Clark Corp. | 991 | 132,081 | |||||||||
Kraft Heinz Co. | 2,560 | 79,462 | |||||||||
Kroger Co. | 3,297 | 71,578 | |||||||||
Macquarie Infrastructure Corp. | 857 | 34,742 | |||||||||
ManpowerGroup, Inc. | 206 | 19,900 | |||||||||
Medtronic Plc | 3,932 | 382,938 | |||||||||
Merck & Co, Inc. | 4,583 | 384,285 | |||||||||
Molson Coors Brewing Co. | 520 | 29,120 | |||||||||
Nielsen Holdings Plc | 1,138 | 25,719 | |||||||||
PepsiCo, Inc. | 2,911 | 381,719 | |||||||||
Pfizer, Inc. | 8,893 | 385,245 | |||||||||
Philip Morris International, Inc. | 4,976 | 390,765 | |||||||||
Procter & Gamble Co. | 3,494 | 383,117 | |||||||||
Quest Diagnostics, Inc. | 401 | 40,826 | |||||||||
Robert Half International, Inc. | 410 | 23,374 | |||||||||
Sabre Corp. | 844 | 18,737 | |||||||||
Southern Copper Corp. | 240 | 9,324 | |||||||||
Spectrum Brands Holdings, Inc. | 122 | 6,560 | |||||||||
Sysco Corp. | 1,243 | 87,905 | |||||||||
7,422,328 | |||||||||||
See Notes to Financial Statements
B-2
PACIFIC GLOBAL ETFs
PACIFIC GLOBAL US EQUITY INCOME ETF
Portfolio of Investments (Continued)
June 30, 2019
Security Description | Shares | Fair Value | |||||||||
Energy - 7.6% | |||||||||||
Apache Corp. | 1,198 | $ | 34,706 | ||||||||
Baker Hughes a GE Co. | 1,891 | 46,575 | |||||||||
Chevron Corp. | 3,152 | 392,235 | |||||||||
Exxon Mobil Corp. | 5,110 | 391,579 | |||||||||
Halliburton Co. | 2,606 | 59,261 | |||||||||
Helmerich & Payne, Inc. | 369 | 18,679 | |||||||||
HollyFrontier Corp. | 450 | 20,826 | |||||||||
Kinder Morgan, Inc. | 5,394 | 112,627 | |||||||||
Kosmos Energy Ltd. | 680 | 4,264 | |||||||||
Marathon Petroleum Corp. | 3,173 | 177,307 | |||||||||
Murphy Oil Corp. | 551 | 13,582 | |||||||||
Noble Energy, Inc. | 1,393 | 31,203 | |||||||||
Occidental Petroleum Corp. | 3,526 | 177,287 | |||||||||
ONEOK, Inc. | 1,292 | 88,903 | |||||||||
PBF Energy, Inc. | 364 | 11,393 | |||||||||
Phillips 66 | 1,789 | 167,343 | |||||||||
RPC, Inc. | 192 | 1,384 | |||||||||
Schlumberger Ltd. | 7,595 | 301,825 | |||||||||
Valero Energy Corp. | 2,906 | 248,783 | |||||||||
Williams Cos., Inc. | 3,640 | 102,066 | |||||||||
2,401,828 | |||||||||||
Financials - 26.3% | |||||||||||
Alexandria Real Estate Equities, Inc. | 129 | 18,201 | |||||||||
Ally Financial, Inc. | 2,603 | 80,667 | |||||||||
American Campus Communities, Inc. | 178 | 8,216 | |||||||||
American International Group, Inc. | 2,745 | 146,254 | |||||||||
Ameriprise Financial, Inc. | 508 | 73,741 | |||||||||
Apartment Investment Management Co. | 181 | 9,072 | |||||||||
Apple Hospitality REIT, Inc. | 299 | 4,742 | |||||||||
Associated Banc-Corp | 929 | 19,639 | |||||||||
Assurant, Inc. | 199 | 21,170 | |||||||||
AvalonBay Communities, Inc. | 164 | 33,322 | |||||||||
AXA Equitable Holdings, Inc. | 966 | 20,189 | |||||||||
Axis Capital Holdings Ltd. | 262 | 15,628 | |||||||||
Bank of America Corp. | 14,044 | 407,276 | |||||||||
Bank of Hawaii Corp. | 125 | 10,364 | |||||||||
Bank of New York Mellon Corp. | 4,227 | 186,622 | |||||||||
BANK OZK | 419 | 12,608 | |||||||||
BankUnited, Inc. | 338 | 11,404 | |||||||||
BB&T Corp. | 8,049 | 395,447 | |||||||||
BGC Partners, Inc. | 751 | 3,928 | |||||||||
BlackRock, Inc. | 390 | 183,027 | |||||||||
BOK Financial Corp. | 99 | 7,473 | |||||||||
Boston Properties, Inc. | 185 | 23,865 | |||||||||
Brandywine Realty Trust | 219 | 3,136 | |||||||||
Brixmor Property Group, Inc. | 362 | 6,473 | |||||||||
Brookfield Property REIT, Inc. | 146 | 2,758 | |||||||||
Camden Property Trust | 92 | 9,604 | |||||||||
Cincinnati Financial Corp. | 374 | 38,773 | |||||||||
CIT Group, Inc. | 451 | 23,696 | |||||||||
Citigroup, Inc. | 5,828 | 408,135 | |||||||||
Citizens Financial Group, Inc. | 5,214 | 184,367 | |||||||||
CNA Financial Corp. | 72 | 3,389 | |||||||||
Colony Capital, Inc. | 573 | 2,865 | |||||||||
Columbia Property Trust, Inc. | 113 | 2,344 | |||||||||
Comerica, Inc. | 1,365 | 99,154 | |||||||||
CoreSite Realty Corp. | 48 | 5,528 | |||||||||
Corporate Office Properties Trust | 114 | 3,006 | |||||||||
Crown Castle International Corp. | 520 | 67,782 | |||||||||
CubeSmart | 236 | 7,892 | |||||||||
Cullen/Frost Bankers, Inc. | 241 | 22,572 | |||||||||
CyrusOne, Inc. | 144 | 8,312 | |||||||||
Digital Realty Trust, Inc. | 229 | 26,974 | |||||||||
Discover Financial Services | 1,179 | 91,479 | |||||||||
Douglas Emmett, Inc. | 176 | 7,012 | |||||||||
Duke Realty Corp. | 349 | 11,032 | |||||||||
Security Description | Shares | Fair Value | |||||||||
East West Bancorp, Inc. | 438 | $ | 20,485 | ||||||||
Eaton Vance Corp. | 579 | 24,972 | |||||||||
Empire State Realty Trust, Inc. | 192 | 2,844 | |||||||||
EPR Properties | 106 | 7,907 | |||||||||
Equity Residential | 429 | 32,570 | |||||||||
Essex Property Trust, Inc. | 79 | 23,062 | |||||||||
Evercore, Inc. | 129 | 11,426 | |||||||||
Everest Re Group Ltd. | 124 | 30,650 | |||||||||
Extra Space Storage, Inc. | 148 | 15,703 | |||||||||
Federal Realty Investment Trust | 106 | 13,649 | |||||||||
Fidelity National Financial, Inc. | 843 | 33,973 | |||||||||
Fifth Third Bancorp | 4,090 | 114,111 | |||||||||
First American Financial Corp. | 336 | 18,043 | |||||||||
First Hawaiian, Inc. | 360 | 9,313 | |||||||||
First Horizon National Corp. | 1,693 | 25,277 | |||||||||
FNB Corp. | 960 | 11,299 | |||||||||
Franklin Resources, Inc. | 1,036 | 36,053 | |||||||||
Gaming and Leisure Properties, Inc. | 238 | 9,277 | |||||||||
H&R Block, Inc. | 592 | 17,346 | |||||||||
Hartford Financial Services Group, Inc. | 1,154 | 64,301 | |||||||||
HCP, Inc. | 476 | 15,222 | |||||||||
Healthcare Trust of America, Inc. | 231 | 6,336 | |||||||||
Highwoods Properties, Inc. | 130 | 5,369 | |||||||||
Hospitality Properties Trust | 230 | 5,750 | |||||||||
Host Hotels & Resorts, Inc. | 853 | 15,542 | |||||||||
Hudson Pacific Properties, Inc. | 182 | 6,055 | |||||||||
Huntington Bancshares, Inc. | 12,676 | 175,182 | |||||||||
Invesco Ltd. | 2,998 | 61,339 | |||||||||
Iron Mountain, Inc. | 427 | 13,365 | |||||||||
JBG SMITH Properties | 119 | 4,681 | |||||||||
Jefferies Financial Group, Inc. | 1,772 | 34,076 | |||||||||
JPMorgan Chase & Co. | 3,601 | 402,592 | |||||||||
KeyCorp | 12,343 | 219,088 | |||||||||
Kilroy Realty Corp. | 112 | 8,267 | |||||||||
Kimco Realty Corp. | 496 | 9,166 | |||||||||
Lamar Advertising Co. | 96 | 7,748 | |||||||||
Lazard Ltd. | 462 | 15,888 | |||||||||
Legg Mason, Inc. | 275 | 10,527 | |||||||||
Liberty Property Trust | 135 | 6,755 | |||||||||
Life Storage, Inc. | 48 | 4,564 | |||||||||
Lincoln National Corp. | 1,190 | 76,696 | |||||||||
M&T Bank Corp. | 440 | 74,831 | |||||||||
Macerich Co. | 190 | 6,363 | |||||||||
Medical Properties Trust, Inc. | 420 | 7,325 | |||||||||
Mercury General Corp. | 72 | 4,500 | |||||||||
MetLife, Inc. | 2,617 | 129,986 | |||||||||
Mid-America Apartment Communities, Inc. | 120 | 14,131 | |||||||||
Morgan Stanley | 8,855 | 387,938 | |||||||||
National Retail Properties, Inc. | 183 | 9,701 | |||||||||
Navient Corp. | 776 | 10,592 | |||||||||
New York Community Bancorp, Inc. | 1,577 | 15,738 | |||||||||
Northern Trust Corp. | 897 | 80,730 | |||||||||
Old Republic International Corp. | 838 | 18,754 | |||||||||
Omega Healthcare Investors, Inc. | 251 | 9,224 | |||||||||
OneMain Holdings, Inc. | 215 | 7,269 | |||||||||
Outfront Media, Inc. | 162 | 4,178 | |||||||||
PacWest Bancorp | 895 | 34,753 | |||||||||
Paramount Group, Inc. | 288 | 4,035 | |||||||||
Park Hotels & Resorts, Inc. | 253 | 6,973 | |||||||||
Penske Automotive Group, Inc. | 288 | 13,622 | |||||||||
People's United Financial, Inc. | 1,223 | 20,522 | |||||||||
Pinnacle West Capital Corp. | 72 | 6,774 | |||||||||
PNC Financial Services Group, Inc. | 2,913 | 399,897 | |||||||||
Popular, Inc. | 407 | 22,076 | |||||||||
Principal Financial Group, Inc. | 1,014 | 58,731 | |||||||||
Prologis, Inc. | 662 | 53,026 | |||||||||
Prosperity Bancshares, Inc. | 216 | 14,267 | |||||||||
Prudential Financial, Inc. | 2,278 | 230,078 | |||||||||
Public Storage | 173 | 41,203 | |||||||||
See Notes to Financial Statements
B-3
PACIFIC GLOBAL ETFs
PACIFIC GLOBAL US EQUITY INCOME ETF
Portfolio of Investments (Continued)
June 30, 2019
Security Description | Shares | Fair Value | |||||||||
Rayonier, Inc. | 146 | $ | 4,424 | ||||||||
Realty Income Corp. | 352 | 24,277 | |||||||||
Regency Centers Corp. | 180 | 12,013 | |||||||||
Regions Financial Corp. | 9,392 | 140,316 | |||||||||
Retail Properties of America, Inc. | 278 | 3,269 | |||||||||
Santander Consumer USA Holdings, Inc. | 360 | 8,626 | |||||||||
Senior Housing Properties Trust | 296 | 2,448 | |||||||||
Simon Property Group, Inc. | 461 | 73,649 | |||||||||
SITE Centers Corp. | 197 | 2,608 | |||||||||
SL Green Realty Corp. | 107 | 8,600 | |||||||||
Spirit Realty Capital, Inc | 93 | 3,967 | |||||||||
Starwood Property Trust, Inc. | 744 | 16,904 | |||||||||
State Street Corp. | 1,835 | 102,870 | |||||||||
STORE Capital Corp. | 209 | 6,937 | |||||||||
Sun Communities, Inc. | 76 | 9,742 | |||||||||
SunTrust Banks, Inc. | 3,872 | 243,355 | |||||||||
Synchrony Financial | 4,635 | 160,695 | |||||||||
Synovus Financial Corp. | 681 | 23,835 | |||||||||
T Rowe Price Group, Inc. | 706 | 77,455 | |||||||||
Targa Resources Corp. | 686 | 26,932 | |||||||||
Taubman Centers, Inc. | 72 | 2,940 | |||||||||
TCF Financial Corp. | 1,379 | 28,669 | |||||||||
TD Ameritrade Holding Corp. | 850 | 42,432 | |||||||||
Travelers Cos., Inc. | 791 | 118,270 | |||||||||
UDR, Inc. | 315 | 14,140 | |||||||||
Umpqua Holdings Corp. | 639 | 10,601 | |||||||||
Unum Group | 1,872 | 62,806 | |||||||||
US Bancorp | 7,476 | 391,742 | |||||||||
Ventas, Inc. | 386 | 26,383 | |||||||||
VEREIT, Inc. | 1,145 | 10,316 | |||||||||
VICI Properties, Inc. | 457 | 10,072 | |||||||||
Virtu Financial, Inc. | 96 | 2,091 | |||||||||
Vornado Realty Trust | 248 | 15,897 | |||||||||
Webster Financial Corp. | 288 | 13,758 | |||||||||
Weingarten Realty Investors | 173 | 4,744 | |||||||||
Wells Fargo & Co. | 8,420 | 398,434 | |||||||||
Welltower, Inc. | 382 | 31,144 | |||||||||
Western Union Co. | 1,467 | 29,179 | |||||||||
Weyerhaeuser Co. | 858 | 22,600 | |||||||||
WP Carey, Inc. | 152 | 12,339 | |||||||||
Zions Bancorp NA | 1,446 | 66,487 | |||||||||
8,310,790 | |||||||||||
Industrial - 11.7% | |||||||||||
3M Co. | 2,061 | 357,254 | |||||||||
Boeing Co. | 1,054 | 383,667 | |||||||||
Caterpillar, Inc. | 1,841 | 250,910 | |||||||||
CH Robinson Worldwide, Inc. | 426 | 35,933 | |||||||||
Cummins, Inc. | 544 | 93,209 | |||||||||
Eaton Corp Plc | 1,360 | 113,261 | |||||||||
Emerson Electric Co. | 1,992 | 132,906 | |||||||||
Energizer Holdings, Inc. | 220 | 8,501 | |||||||||
Fluor Corp. | 398 | 13,409 | |||||||||
Garmin Ltd. | 293 | 23,381 | |||||||||
General Dynamics Corp. | 809 | 147,092 | |||||||||
GrafTech International Ltd. | 144 | 1,656 | |||||||||
Graphic Packaging Holding Co. | 1,853 | 25,905 | |||||||||
Hubbell, Inc. | 284 | 37,034 | |||||||||
Illinois Tool Works, Inc. | 1,450 | 218,675 | |||||||||
Johnson Controls International Plc | 2,642 | 109,141 | |||||||||
Lincoln Electric Holdings, Inc. | 282 | 23,214 | |||||||||
Lockheed Martin Corp. | 675 | 245,390 | |||||||||
MDU Resources Group, Inc. | 168 | 4,334 | |||||||||
National Instruments Corp. | 376 | 15,788 | |||||||||
Security Description | Shares | Fair Value | |||||||||
nVent Electric Plc | 456 | $ | 11,304 | ||||||||
Packaging Corp of America | 279 | 26,594 | |||||||||
Rockwell Automation, Inc. | 403 | 66,023 | |||||||||
Ryder System, Inc. | 608 | 35,446 | |||||||||
Snap-on, Inc. | 261 | 43,232 | |||||||||
Sonoco Products Co. | 264 | 17,250 | |||||||||
Timken Co. | 192 | 9,857 | |||||||||
Trinity Industries, Inc. | 628 | 13,031 | |||||||||
Union Pacific Corp. | 2,345 | 396,563 | |||||||||
United Parcel Service, Inc. | 4,005 | 413,596 | |||||||||
United Technologies Corp. | 2,491 | 324,328 | |||||||||
Westrock Co. | 2,516 | 91,759 | |||||||||
3,689,643 | |||||||||||
Technology - 8.1% | |||||||||||
Broadcom, Inc. | 1,402 | 403,580 | |||||||||
Hewlett Packard Enterprise Co. | 8,311 | 124,249 | |||||||||
HP, Inc. | 5,215 | 108,420 | |||||||||
IntelCorp. | 8,261 | 395,454 | |||||||||
International Business Machines Corp. | 2,816 | 388,326 | |||||||||
KLA-Tencor Corp. | 458 | 54,136 | |||||||||
Lam Research Corp. | 678 | 127,355 | |||||||||
Maxim Integrated Products, Inc. | 802 | 47,976 | |||||||||
NetApp, Inc. | 1,047 | 64,600 | |||||||||
Paychex, Inc. | 890 | 73,238 | |||||||||
QUALCOMM, Inc. | 4,042 | 307,475 | |||||||||
Texas Instruments, Inc. | 3,476 | 398,906 | |||||||||
Western Digital Corp. | 905 | 43,033 | |||||||||
Xerox Corp. | 640 | 22,662 | |||||||||
2,559,410 | |||||||||||
Utilities - 1.7% | |||||||||||
AES Corp. | 500 | 8,380 | |||||||||
Alliant Energy Corp. | 168 | 8,245 | |||||||||
Ameren Corp. | 144 | 10,816 | |||||||||
American Electric Power Co., Inc. | 305 | 26,843 | |||||||||
Aqua America, Inc. | 144 | 5,957 | |||||||||
Avangrid, Inc. | 24 | 1,212 | |||||||||
CenterPoint Energy, Inc. | 407 | 11,652 | |||||||||
CMS Energy Corp. | 192 | 11,119 | |||||||||
Consolidated Edison, Inc. | 216 | 18,939 | |||||||||
Dominion Energy, Inc. | 643 | 49,717 | |||||||||
DTE Energy Co. | 120 | 15,346 | |||||||||
Duke Energy Corp. | 552 | 48,709 | |||||||||
Edison International | 283 | 19,077 | |||||||||
Entergy Corp. | 108 | 11,116 | |||||||||
Evergy, Inc. | 173 | 10,406 | |||||||||
Eversource Energy | 216 | 16,364 | |||||||||
Exelon Corp. | 654 | 31,353 | |||||||||
FirstEnergy Corp. | 300 | 12,843 | |||||||||
Hawaiian Electric Industries, Inc. | 48 | 2,090 | |||||||||
National Fuel Gas Co. | 62 | 3,271 | |||||||||
NextEra Energy, Inc. | 334 | 68,423 | |||||||||
OGE Energy Corp. | 144 | 6,129 | |||||||||
PPL Corp. | 560 | 17,366 | |||||||||
Public Service Enterprise Group, Inc. | 329 | 19,352 | |||||||||
Sempra Energy | 192 | 26,388 | |||||||||
Southern Co. | 772 | 42,676 | |||||||||
UGI Corp. | 139 | 7,424 | |||||||||
WEC Energy Group, Inc. | 216 | 18,008 | |||||||||
Xcel Energy, Inc. | 335 | 19,929 | |||||||||
549,150 | |||||||||||
| Total Common Stocks (Cost $30,991,106) | 31,531,827 | ||||||||||
See Notes to Financial Statements
B-4
PACIFIC GLOBAL ETFs
PACIFIC GLOBAL US EQUITY INCOME ETF
Portfolio of Investments (Continued)
June 30, 2019
Security Description | Shares | Fair Value | |||||||||
SHORT TERM INVESTMENTS - 0.1% | |||||||||||
| First American Treasury Obligations Fund - Class X, 2.27% (a) | 19,052 | $ | 19,052 | ||||||||
| Total Short Term Investments (Cost $19,052) | 19,052 | ||||||||||
| TOTAL INVESTMENTS - 99.9% (Cost $31,010,158) | 31,550,879 | ||||||||||
OTHER ASSETS IN EXCESS OF LIABILITIES - 0.1% | 48,854 | ||||||||||
TOTAL NET ASSETS - 100.0% | $ | 31,599,733 | |||||||||
* Non-income producing security.
(a) Seven-day yield of June 30, 2019
Glossary:
Ltd. - Private Limited Company
Plc - Public Limited Company
See Notes to Financial Statements
B-5
PACIFIC GLOBAL ETFs
STATEMENT OF ASSETS AND LIABILITIES
JUNE 30, 2019
| Pacific Global US Equity Income ETF | |||||||
ASSETS | |||||||
Investments in Securities, at Value (cost $30,991,106) | $ | 31,531,827 | |||||
Short Term Investments, at Value (cost $19,052) | 19,052 | ||||||
Receivables for: | |||||||
Dividends and Interest | 56,260 | ||||||
Total Assets | 31,607,139 | ||||||
LIABILITIES | |||||||
Payables for: | |||||||
Investment Advisory Fees | 7,406 | ||||||
Total Liabilities | 7,406 | ||||||
NET ASSETS | $ | 31,599,733 | |||||
NET ASSETS CONSIST OF: | |||||||
Paid-in Capital | $ | 30,721,639 | |||||
Total Distributable Earnings (See Note 5) | 878,094 | ||||||
NET ASSETS | $ | 31,599,733 | |||||
Shares Outstanding (No Par Value, Unlimited Shares Authorized) | 1,200,000 | ||||||
Net Asset Value, Price Per Share | 26.33 | ||||||
See Notes to Financial Statements
C-1
PACIFIC GLOBAL ETFs
STATEMENT OF OPERATIONS
FOR THE PERIOD ENDED JUNE 30, 2019 (1)
| Pacific Global US Equity Income ETF | |||||||
INVESTMENT INCOME | |||||||
Dividends | $ | 356,641 | |||||
Interest | 1,253 | ||||||
Total Investment Income | 357,894 | ||||||
EXPENSES | |||||||
Investment Advisory Fees | 30,074 | ||||||
Total Expenses | 30,074 | ||||||
NET INVESTMENT INCOME (LOSS) | 327,820 | ||||||
REALIZED & UNREALIZED GAIN (LOSS) ON INVESTMENTS | |||||||
Net Realized Gain (Loss) On: | |||||||
Investments in Securities | 326,736 | ||||||
In-Kind Transactions | 86,742 | ||||||
Net Change in Unrealized Appreciation (Depreciation) On: | |||||||
Investments in Securities | 540,721 | ||||||
NET REALIZED AND UNREALIZED GAIN (LOSS) ON INVESTMENTS | 954,199 | ||||||
NET INCREASE (DECREASE) IN NET ASSETS RESULTING FROM OPERATIONS | $ | 1,282,019 | |||||
(1) Commencement of operations on February 11, 2019.
See Notes to Financial Statements
C-2
PACIFIC GLOBAL ETFs
STATEMENT OF CHANGES IN NET ASSETS
| Pacific Global US Equity Income ETF | |||||||
| Period Ended June 30, 2019 (1) | |||||||
OPERATIONS | |||||||
Net Investment Income (Loss) | $ | 327,820 | |||||
Net Realized Gain (Loss) on Investments | 413,478 | ||||||
Net Change in Unrealized Appreciation (Depreciation) on Investments | 540,721 | ||||||
Net Increase (Decrease) in Net Assets Resulting From Operations | 1,282,019 | ||||||
DISTRIBUTIONS TO SHAREHOLDERS | |||||||
From Earnings | (317,509 | ) | |||||
Total Distributions to Shareholders | (317,509 | ) | |||||
CAPTIAL SHARE TRANSACTIONS | |||||||
Proceeds from Shares Sold | 31,944,555 | ||||||
Payments for Shares Redeemed | (1,309,340 | ) | |||||
Transaction Fees (Note 6) | 8 | ||||||
Net Increase (Decrease) in Net Assets Derived from Capital Shares Transactions (a) | 30,635,223 | ||||||
Total Increase (Decrease) in Net Assets | 31,599,733 | ||||||
NET ASSETS: | |||||||
Beginning of Period | $ | — | |||||
End of Period | $ | 31,599,733 | |||||
(a) Summary of Capital Share Transactions is as Follows: | |||||||
Shares Sold | 1,250,000 | ||||||
Shares Redeemed | (50,000 | ) | |||||
NET INCREASE (DECREASE) | 1,200,000 | ||||||
(1) Commencement of operations on February 11, 2019.
See Notes to Financial Statements
C-3
PACIFIC GLOBAL ETFs
FINANCIAL HIGHLIGHTS
| Pacific Global US Equity Income ETF | |||||||
| Period Ended June 30, 2019 (1) | |||||||
Net Asset Value, Beginning of Period | $ | 25.00 | |||||
Income (Loss) from Investment Operations: | |||||||
Net Investment Income (Loss) (2) | 0.32 | ||||||
Net Gain (Loss) on Investments (Realized and Unrealized) | 1.28 | ||||||
Total from Investment Operations | 1.60 | ||||||
Less Distributions: | |||||||
From Net Investment Income | (0.27 | ) | |||||
Total Distributions | (0.27 | ) | |||||
Capital Share Transactions: | |||||||
Transaction Fees (See Note 6) | — | (3) | |||||
Net Asset Value, End of Period | $ | 26.33 | |||||
Net Asset Value Total Return (4) | 6.43 | % | |||||
Ratio / Supplemental Data: | |||||||
Net Assets, End of Period (000's) | $ | 31,600 | |||||
Ratio of Expenses to Average Net Assets (5) | 0.29 | % | |||||
Ratio of Net Investment Income (Loss) to Average Net Assets (5) | 3.19 | % | |||||
Portfolio Turnover Rate (4)(6) | 21 | % | |||||
(1) Commencement of operations on February 11, 2019.
(2) Calculated based on average shares outstanding during the period.
(3) Less than $0.005 per share.
(4) Not annualized.
(5) Annualized.
(6) In-kind transactions are not included in portfolio turnover calculations.
See Notes to Financial Statements
C-4
PACIFIC GLOBAL ETFs
NOTES TO FINANCIAL STATEMENTS
NOTE 1—ORGANIZATION
Pacific Global US Equity Income ETF ("USDY" or the "Fund') is a diversified fund of Pacific Global ETF Trust (the "Trust"), an open-end management investment company, currently consisting of one investment series, organized as a Delaware statutory trust on June 26, 2018. The Trust is registered with the Securities and Exchange Commission ("SEC") under the Investment Company Act of 1940, as amended (the "1940 Act"), as an open-end management investment company and the offering of the Fund's shares is registered under the Securities Act of 1933, as amended (the "Securities Act"). The investment objective of Pacific Global US Equity Income ETF is to seek income and long-term growth of capital. The inception date of the Fund is February 11, 2019.
NOTE 2—SIGNIFICANT ACCOUNTING POLICIES
The Fund is an investment company. Accordingly, the Fund follows the investment company accounting and reporting guidance of the Financial Accounting Standards Board ("FASB") Accounting Standards codification Topic 946 Financial Services-Investment Companies.
The following is a summary of significant accounting policies consistently followed by the Fund. These policies are in conformity with accounting principles generally accepted in the United States of America ("U.S. GAAP").
A. SECURITIES VALUATION
All equity securities, including domestic and foreign common stocks, preferred stocks, and exchange traded funds that are traded on a national securities exchange, except those listed on the Nasdaq Global Market®, Nasdaq Global Select Market® and Nasdaq Capital Market Exchange® (collectively "Nasdaq"), are valued at the last reported sale price on the exchange on which the security is principally traded. Securities traded on Nasdaq will be valued at the Nasdaq Official Closing Price ("NOCP"). If, on a particular day, an exchange traded or Nasdaq security does not trade, then the mean between the most recent quoted bid and asked prices will be used. All equity securities that are not traded on a listed exchange are valued at the last sale price in the over-the-counter market. If a non-exchange traded security does not trade on a particular day, then the mean between the last quoted closing bid and asked price will be used. Prices denominated in foreign currencies are converted to U.S. dollar equivalents at the current exchange rate, which approximates fair value.
Short-term securities, including repurchase agreements, that have maturities of less than 60 days at the time of purchase, are valued at amortized cost, which, when combined with accrued interest, approximates fair value.
Securities for which quotations are not readily available are valued at their respective fair values in accordance with pricing procedures adopted by the Trust's Board of Trustees (the "Board"). When a security is "fair valued," consideration is given to the facts and circumstances relevant to the particular situation, including a review of various factors set forth in the pricing procedures adopted by the Board. The use of fair value pricing by the Fund may cause the net asset value ("NAV") of its shares to differ significantly from the NAV that would be calculated without regard to such considerations.
Various inputs may be used to determine the value of the Fund's investments. These inputs are summarized in three broad levels for financial statement purposes. The inputs or methodologies used to value securities are not necessarily an indication of the risk associated with investing in those securities.
• Level 1 - Quoted prices in active markets for identical securities.
• Level 2 - Other significant observable inputs (including quoted prices for similar securities, interest rates, prepayment speeds, credit risk, etc.).
• Level 3 - Significant unobservable inputs (including the Fund's own assumptions used to determine the fair value of investments).
The following table summarizes the market value of the Fund's investments as of June 30, 2019, based on the inputs used to value them:
Pacific Global US Equity Income ETF
Assets | Level 1 | Level 2 | Level 3 | Total | |||||||||||||||
Common Stocks | $ | 31,531,827 | $ | — | $ | — | $ | 31,531,827 | |||||||||||
Short Term Investments | 19,052 | — | — | 19,052 | |||||||||||||||
Total | $ | 31,550,879 | $ | — | $ | — | $ | 31,550,879 | |||||||||||
B. FOREIGN CURRENCY
Investment securities and other assets and liabilities denominated in foreign currencies are translated into U.S. dollar amounts at the date of valuation. Purchases and sales of investment securities and income and expense items denominated in foreign currencies are translated into U.S. dollar amounts on the respective dates of such transactions. The Fund does not isolate the portion of the results of operations resulting from changes in foreign exchange rates on investments and currency gains or losses realized between the trade and settlement dates on securities transactions from the fluctuations arising from changes in market prices of securities held. Such fluctuations are included with the net realized and unrealized gain or loss on investments. The Fund reports net realized foreign exchange gains or losses that arise from sales of foreign currencies, currency gains or losses realized between the trade and settlement dates on foreign currency transactions, and the difference between the amounts of dividends, interest, and foreign withholding taxes recorded on the Fund's books and the U.S. dollar equivalent of the amounts actually received or paid. Net unrealized foreign exchange gains and losses arise from changes in the values of assets and liabilities, other than investments in securities at fiscal period end, resulting from changes in exchange rates.
D-1
PACIFIC GLOBAL ETFs
NOTES TO FINANCIAL STATEMENTS (Continued)
C. FEDERAL INCOME TAXES
The Fund's policy is to comply with the provisions of Subchapter M of the Internal Revenue Code of 1986, as amended, applicable to regulated investment companies, and to distribute substantially all of its net investment income and net capital gains to shareholders. Therefore, no federal income tax provision is required. The Fund plans to file U.S. Federal and various state and local tax returns.
The Fund recognizes the tax benefits of uncertain tax positions only when the position is more likely than not to be sustained. Management has analyzed the Fund's uncertain tax positions and concluded that no liability for unrecognized tax benefits should be recorded related to uncertain tax positions. Management is not aware of any tax positions for which it is reasonably possible that the total amounts of unrecognized tax benefits will change materially in the next 12 months. Income and capital gain distributions are determined in accordance with federal income tax regulations, which may differ from U.S. GAAP. The Fund recognizes interest and penalties, if any, related to unrecognized tax benefits on uncertain tax positions as income tax expenses in the Statement of Operations. During the period ended June 30, 2019, the Fund did not incur any interest or penalties.
D. SECURITY TRANSACTIONS AND INVESTMENT INCOME
Investment securities transactions are accounted for on the trade date. Gains and losses realized on sales of securities are determined on a specific identification basis. Dividend income is recorded on the ex-dividend date. Interest income is recorded on an accrual basis. Withholding taxes on foreign dividends have been provided for in accordance with the Fund's understanding of the applicable tax rules and regulations.
Distributions received from the Fund's investments in real estate investment trusts ("REITs") may be characterized as ordinary income, net capital gain, or a return of capital. The proper characterization of REIT distributions is generally not known until after the end of each calendar year. As such, the Fund must use estimates in reporting the character of its income and distributions for financial statement purposes. The actual character of distributions to the Fund's shareholders will be reflected on the Form 1099 received by shareholders after the end of the calendar year. Due to the nature of REIT investments, a portion of the distributions received by the Fund's shareholders may represent a return of capital.
E. DISTRIBUTIONS TO SHAREHOLDERS
Distributions to shareholders from net investment income are declared and paid by the Fund on a quarterly basis. Distributions to shareholders from capital gains will be declared and paid at least annually. Distributions are recorded on the ex-dividend date.
F. USE OF ESTIMATES
The preparation of financial statements in conformity with U.S. GAAP requires management to make estimates and assumptions that affect the reported amounts of assets and liabilities and disclosure of contingent assets and liabilities at the date of the financial statement, as well as the reported amount of revenues and expenses during the reporting period. Actual results could differ from those estimates.
G. SHARE VALUATION
The NAV per share of the Fund is calculated by dividing the sum of the value of the securities held by the Fund, plus cash and other assets, minus all liabilities (including estimated accrued expenses) by the total number of outstanding shares for the Fund, rounded to the nearest cent. The Fund's shares will not be priced on the days on which the New York Stock Exchange, Inc. ("NYSE") is closed for trading. The offering and redemption price per share of the Fund in Creation Unit transactions is equal to the Fund's NAV per share.
H. GUARANTEES AND INDEMNIFICATIONS
In the normal course of business, the Trust, on behalf of the Fund, enters into contracts with service providers that contain general indemnification clauses. The Fund's maximum exposure under these arrangements is unknown as this would involve future claims that may be made against the Fund that have not yet occurred. However, based on experience, the Fund expects the risk of loss to be remote.
I. SUBSEQUENT EVENTS
In preparing these financial statements, management has evaluated events and transactions for potential recognition or disclosure through the date the financial statements were issued. There were no events or transactions that occurred during the period subsequent to June 30, 2019, that materially impacted the amounts or disclosures in the Fund's financial statements.
J. NEW ACCOUNTING PRONOUNCEMENTS AND OTHER MATTERS
In August 2018, the FASB issued ASU 2018-13, Fair Value Measurement (Topic 820): Disclosure Framework-Changes to the Disclosure Requirements for Fair Value Measurement. ASU 2018-13 removes or modifies certain current disclosures and adds additional disclosures. The changes are meant to provide more relevant information regarding valuation techniques and inputs used to arrive at measures of fair value, uncertainty in the fair value measurements, and how changes in fair value measurements impact an entity's performance and cash flows. Certain disclosures in ASU 2018-13 will need to be applied on a retrospective basis and others on a prospective basis. Early adoption is permitted. The Fund has evaluated the impact of ASU 2018-13 and it has determined that it will not have any effect.
D-2
PACIFIC GLOBAL ETFs
NOTES TO FINANCIAL STATEMENTS (Continued)
NOTE 3—COMMITMENTS AND OTHER RELATED PARTY TRANSACTIONS
Pacific Global Advisors LLC (the "Adviser") acts as the investment adviser to the Fund. Pursuant to the management agreement between the Trust and the Adviser with respect to the Fund ("the Management Agreement") and subject to the oversight of the Board, the Adviser provides services reasonably necessary for the operation of the Fund, including audit, portfolio accounting, legal transfer agency, custody, printing costs and certain distribution-related services (pursuant to separate agreements), under what is essentially an all-in fee. The Fund may bear other expenses which are not covered under the Management Agreement that may vary and will affect the total level of expenses paid by the Fund, such as taxes and government fees, brokerage fees, commissions and other transaction expenses, costs of borrowing money, including interest expenses, certain custody expenses and extraordinary expenses (such as litigation and indemnification expenses). Pursuant to the Management Agreement, and subject to the Board's approval, the Adviser is authorized to delegate the day-to-day management of the Fund's investment program. The Adviser has appointed Cadence Capital Management LLC as the sub-adviser ("Sub-Adviser") to manage the Fund's investment program. The Adviser oversees and monitors the nature and quality of the services provided by the Sub-Adviser, including investment performance and execution of investment strategies. The Adviser performs compliance monitoring services to help the Fund maintain compliance with applicable laws and regulations and provides services related to, among others, the valuation of Fund securities, risk management and oversight of trade execution and brokerage services. For services provided to the Fund, the Fund pays the Adviser 0.29% at an annual rate based on the Fund's average daily net assets.
U.S. Bancorp Fund Services, LLC, doing business as U.S. Bank Global Fund Services ("Fund Services" or the "Administrator") acts as the Fund's Administrator and, in that capacity, performs various administrative and accounting services for the Fund. The Administrator prepares various federal and state regulatory filings, reports and returns for the Fund, including regulatory compliance monitoring and financial reporting; prepares reports and materials to be supplied to the Board; and monitors the activities of the Fund's Custodian, transfer agent and accountants. Fund Services also serves as the transfer agent and fund accountant to the Fund. U.S. Bank N.A. (the "Custodian"), an affiliate of Fund Services, serves as the Fund's Custodian.
Foreside Fund Services, LLC (the "Distributor") acts as the Fund's principal underwriter in a continuous public offering of the Fund's shares.
Each of the Trustees who are not "interested persons" as that term is defined in the 1940 Act ("Independent Trustees") will receive a fee of $10,000 per year from Pacific Global Advisors LLC, out of its unitary fee received from the Trust, the amount set forth in the Statement of Additional Information for the Fund as compensation for their service on the Board of Trustees of the Trust. Additionally, no interested Trustee or officer of the Trust shall receive any compensation from the Trust. The Trustees are paid on a quarterly basis. Both the Fund and the Trust are new and thus information about the compensation paid to the Trustees by the Trust for its most recent fiscal year is not available.
NOTE 4—PURCHASES AND SALES OF SECURITIES
During the period ended June 30, 2019, purchases and sales of securities by the Fund, excluding short-term securities and in-kind transactions were as follows:
Fund | Purchases | Sales | |||||||||
Pacific Global US Equity Income ETF | $ | 6,262,470 | $ | 5,936,842 | |||||||
During the period ended June 30, 2019, there were no purchases or sales of U.S. Government securities.
During the period ended June 30, 2019, the in-kind security transactions associated with creations and redemptions were as follows:
Fund | In-Kind Purchases | In-Kind Redemptions | |||||||||
Pacific Global US Equity Income ETF | $ | 31,553,880 | $ | 1,293,795 | |||||||
NOTE 5—INCOME AND TAX INFORMATION
The components of tax basis cost of investments and net unrealized appreciation (depreciation) for federal income tax purposes as of June 30, 2019, were as follows:
Pacific Global US Equity Income ETF | |||||||
Tax cost of investment | $ | 31,010,158 | |||||
| Gross tax unrealized appreciation | 1,489,502 | ||||||
Gross tax unrealized depreciation | (948,781 | ) | |||||
Net unrealized appreciation (depreciation) | $ | 540,721 | |||||
Undistributed ordinary income | $ | 334,749 | |||||
Undistributed long-term gain (loss) | 2,624 | ||||||
Total distribution earnings | $ | 337,373 | |||||
Other accumulated gain (loss) | — | ||||||
Total accumulated gain (loss) | $ | 878,094 | |||||
D-3
PACIFIC GLOBAL ETFs
NOTES TO FINANCIAL STATEMENTS (Continued)
U.S. GAAP requires that certain components of net assets relating to permanent differences be reclassified between financial and tax reporting. These reclassifications have no effect on net assets or NAV per share. The permanent differences are primarily due to differing book and tax treatments for in-kind transactions. For the period ended June 30, 2019, the following table shows the reclassifications made:
| Undistributed (Accumulated) Net Investment Income (Loss) | Accumulated Net Realized Gain (Loss) | Paid-in Capital | |||||||||||||
Pacific Global US Equity Income ETF | $ | — | $ | (86,416 | ) | $ | 86,416 | ||||||||
During the period ended June 30, 2019 the Fund realized the following net capital gains resulting from in-kind redemptions, in which shareholders exchanged Fund shares for securities held by the Fund rather than for cash. Because such gains are not taxable to the Fund, and are not distributed to shareholders, they have been reclassified from accumulated net realized gain (loss) to paid-in capital. For the period ended June 30, 2019, the following table shows the reclassification made:
Pacific Global US Equity Income ETF $86,742
As of June 30, 2019, the Fund deferred, on a tax-basis, no post-October or late year ordinary losses.
As of June 30, 2019, the Fund had no capital loss carryforward available for federal income tax purposes.
The tax character of distributions declared by the Fund during the period ended June 30, 2019 were as follows:
| Fund | Ordinary Income | Long Term Capital Gain | Return of Capital | ||||||||||||
Pacific Global US Equity Income ETF | $ | 317,509 | — | — | |||||||||||
NOTE 6—SHARE TRANSACTIONS
Shares of the Fund are only purchased and sold on a national securities exchange through brokers. Shares of the Fund are listed on NYSE Arca, Inc. (the "Exchange") and because Shares trade at market prices rather than NAV, Shares of the Fund may trade at a price greater than or less than NAV. The Fund issues and redeems shares on a continuous basis at NAV generally in blocks of 50,000 shares called "Creation Units." Creation Unit transactions are expected to be typically conducted in exchange for the deposit or delivery of in-kind securities in the Fund's portfolio. Once created, shares generally trade in the secondary market at market process that change throughout the day. Except when aggregated in Creation Units, shares are not redeemable securities of the Fund. Creation Units may only be purchased or redeemed by certain financial institutions ("Authorized Participants"). An Authorized Participant is either (i) a broker-dealer or other participant in the clearing process through the Continuous Net Settlement System of the National Securities Clearing Corporation or (ii) a Depository Trust Company participant and, in each case, must have executed an authorized participant agreement with the Distributor. Most retail investors do not qualify as Authorized Participants nor have the resources to buy and sell whole Creation Units. Therefore, they are unable to purchase or redeem shares directly from the Fund. Rather, most retail investors may purchase shares in the secondary market with the assistance of a broker and are subject to customary brokerage commissions or fees.
The Fund currently offers one class of shares, which has no front-end sales load, no deferred sales charge, and no redemption fee. A fixed transaction fee is imposed for the transfer and other transaction costs associated with the purchase or sale of Creation Units. The standard fixed transaction fee for is $500, payable to the Custodian. The fixed transaction fee may be waived on certain orders if the Fund's Custodian has determined to waive some or all of the costs associated with the order, or another party, such as the Adviser, has agreed to pay such fee. Transaction fees received by the Fund, if any, are displayed in the Capital Shares Transaction section of each Statement of Changes in Net Assets. The Fund may issue an unlimited number of shares of beneficial interest, with no par value. Shares of the Fund have equal rights and privileges.
NOTE 7—BENEFICIAL OWNERSHIP
The beneficial ownership, either directly or indirectly, of 25% or more of the voting securities of a fund creates a presumption of control of a fund, under section 2(a)(9) of the Investment Company Act of 1940. As of June 30, 2019, Pacific Life Insurance Company, the Adviser's indirect parent company, owned 1,046,850 shares or 87.24% of the outstanding shares of the Fund.
NOTE 8—PRINCIPAL RISKS
There is no assurance that the Fund will meet its investment objective. The value of your investment in the Fund, as well as the amount of return you receive on your investment in the Fund, may fluctuate significantly. You may lose part or all of your investment in the Fund or your investment may not perform as well as other similar investments. Therefore, you should consider carefully the following risks before investing in the Fund. An investment in the Fund is not a bank deposit and is not insured or guaranteed by the FDIC or any government agency.
Active Management Risk. The Fund is actively managed, which means that investment decisions are made based on investment views. There is no guarantee that the investment views will produce the desired results or expected returns, which may cause the Fund to fail to meet its investment objective or to underperform its benchmark index or funds with similar investment objectives and strategies. Furthermore, active trading that can accompany active management may result in high portfolio turnover, which may have a negative impact on performance. Active
D-4
PACIFIC GLOBAL ETFs
NOTES TO FINANCIAL STATEMENTS (Continued)
trading may result in higher brokerage costs or mark-up charges, which are ultimately passed on to shareholders of the Fund. Active trading may also result in adverse tax consequences.
Dividend-Paying Stock Risk. While the Fund may hold securities of companies that have historically paid a high dividend yield, those companies may reduce or discontinue their dividends, reducing the yield of the Fund. Low priced securities in the Fund may be more susceptible to these risks. Past dividend payments are not a guarantee of future dividend payments. Also, the market return of high dividend yield securities, in certain market conditions, may perform worse than other investment strategies or the overall stock market. The Fund's emphasis on dividend-paying stocks involves the risk that such stocks may fall out of favor with investors and underperform the market. Also, a company may reduce or eliminate its dividend.
Equity Risk. The net asset value of the Fund will fluctuate based on changes in the value of the U.S. equity securities held by the Fund. Equity prices can fall rapidly in response to developments affecting a specific company or industry, or to changing economic, political or market conditions.
Issuer Risk. Fund performance depends on the performance of individual securities that the Fund holds. Changes in the financial condition or credit rating of an issuer of those securities may cause the value of the securities to decline.
Large Capitalization Company Risk. Larger, more established companies may be unable to attain the high growth rates of successful, smaller companies during periods of economic expansion.
Limited History of Operations Risk. The Fund is a new ETF and has a limited history of operations for investors to evaluate.
Market Risk. Overall market risks may affect the value of the Fund. Factors such as U.S. economic growth and market conditions, interest rate levels and political events affect the securities markets.
Market Trading Risk. The Fund faces numerous market trading risks, including the potential lack of an active market for the Shares, losses from trading in secondary markets, and disruption in the creation/redemption process of the Fund. Any of these factors may lead to the Shares trading at a premium or discount to the Fund's net asset value ("NAV").
Sector Risk. Sector risk is the possibility that securities within the same group of industries will decline in price due to sector-specific market or economic developments. If the Fund invests more heavily in a particular sector, the value of its shares may be especially sensitive to factors and economic risks that specifically affect that sector. As a result, the Fund's share price may fluctuate more widely than the value of shares of a fund that invests in a broader range of industries.
Consumer Discretionary Sector Risk. These companies may be adversely affected by changes in the worldwide economy, consumer spending, competition, demographics and consumer preferences, exploration and production spending. Companies in this sector are also affected by changes in government regulation, world events and economic conditions.
Consumer Staples Sector Risk. Companies engaged in the production and distribution of basic materials may be adversely affected by changes in world events, political and economic conditions, energy conservation, environmental policies, commodity price volatility, changes in exchange rates, imposition of import controls, increased competition, depletion of resources and labor relations.
Financial Services Sector Risk. Companies in the financial sector are often subject to extensive governmental regulation and, recently, government intervention and the potential for additional regulation, which may adversely affect the scope of their activities, the prices they can charge and the amount of capital they must maintain. Governmental regulation may change frequently and may have significant adverse consequences for companies in the financial sector, including effects not intended by such regulation.
Industrial Sector Risk. Industrial companies are affected by supply and demand both for their specific product or service and for industrial sector products in general. Government regulation, world events, exchange rates and economic conditions, technological developments and liabilities for environmental damage and general civil liabilities will likewise affect the performance of these companies.
Information Technology Sector Risk. Information technology companies face intense competition, both domestically and internationally, which may have an adverse effect on profit margins. Information technology companies may have limited product lines, markets, financial resources or personnel. The products of information technology companies may face product obsolescence due to rapid technological developments and frequent new product introduction, unpredictable changes in growth rates and competition for the services of qualified personnel.
D-5
REPORT OF INDEPENDENT REGISTERED PUBLIC ACCOUNTING FIRM
To the Shareholders and Board of Trustees of
Pacific Global ETF Trust:
Opinion on the Financial Statements and Financial Highlights
We have audited the accompanying statement of assets and liabilities, including the portfolio of investments, of Pacific Global US Equity Income ETF, the portfolio constituting the Pacific Global ETF Trust (the "Trust"), as of June 30, 2019, the related statement of operations, the statements of changes in net assets, and the financial highlights for the period from February 11, 2019 (commencement of operations) to June 30, 2019, and the related notes. In our opinion, the financial statements and financial highlights present fairly, in all material respects, the financial position of the Pacific Global US Equity Income ETF of the Trust as of June 30, 2019, and the results of its operations, the changes in its net assets, and the financial highlights for the period from February 11, 2019 (commencement of operations) to June 30, 2019, in conformity with accounting principles generally accepted in the United States of America.
Basis for Opinion
These financial statements and financial highlights are the responsibility of the Trust's management. Our responsibility is to express an opinion on the Trust's financial statements and financial highlights based on our audits. We are a public accounting firm registered with the Public Company Accounting Oversight Board (United States) (PCAOB) and are required to be independent with respect to the Trust in accordance with the U.S. federal securities laws and the applicable rules and regulations of the Securities and Exchange Commission and the PCAOB.
We conducted our audits in accordance with the standards of the PCAOB. Those standards require that we plan and perform the audit to obtain reasonable assurance about whether the financial statements and financial highlights are free of material misstatement, whether due to error or fraud. The Trust is not required to have, nor were we engaged to perform, an audit of its internal control over financial reporting. As part of our audits we are required to obtain an understanding of internal control over financial reporting but not for the purpose of expressing an opinion on the effectiveness of the Trust's internal control over financial reporting. Accordingly, we express no such opinion.
Our audits included performing procedures to assess the risks of material misstatement of the financial statements and financial highlights, whether due to error or fraud, and performing procedures that respond to those risks. Such procedures included examining, on a test basis, evidence regarding the amounts and disclosures in the financial statements and financial highlights. Our audits also included evaluating the accounting principles used and significant estimates made by management, as well as evaluating the overall presentation of the financial statements and financial highlights. Our procedures included confirmation of securities owned as of June 30, 2019, by correspondence with the custodian and brokers. We believe that our audits provide a reasonable basis for our opinion.

Costa Mesa, California
August 29, 2019
We have served as the auditor of the Trust since 2018.
E-1
PACIFIC GLOBAL ETFs
TRUSTEES AND OFFICERS
(Unaudited)
Additional information about each trustee of the Trust is set forth below. The address of each trustee is c/o Pacific Global ETF Trust, 840 Newport Center Drive, 7th Floor, Newport Beach, CA 92660. Each trustee serves for the life of the Trust, subject to their earlier death, incapacitation, resignation, retirement or removal as more specifically provided in the Trust's organization documents.
| Name and Year of Birth | Position Held with the Trust | Term of Office and Length of Time Served | Principal Occupation(s) During Past 5 Years | Number of Portfolios in Fund Complex Overseen by Trustee | Other Directorships Held by Trustee During Past 5 Years | ||||||||||||||||||
INDEPENDENT TRUSTEES | |||||||||||||||||||||||
| Robert J. Blattenberg Born: 1950 | Trustee | Indefinite term; since 2018 | Consultant, Ringler Associates Inc. (April 2016-Present); Chief Executive Officer, Ringler Associates (February 1983-April 2016). | 1 | None | ||||||||||||||||||
| D. Robinson Cluck Born: 1956 | Trustee | Indefinite term; since 2018 | Chairman, Canterbury Consulting, Inc. (December 1988-Present). | 1 | None | ||||||||||||||||||
| John C. Siciliano Born: 1954 | Trustee | Indefinite term; since 2018 | Chairman, Avondale Strategies, LLC (May 2019-Present); Senior Advisor, Bonaccord Capital Partners (2019-Present); Senior Managing Director, PwC Advisory, LLC (September 2012-2019). | 1 | None | ||||||||||||||||||
INTERESTED TRUSTEES | |||||||||||||||||||||||
| Kevin R. Byrne Born: 1955 | Trustee and Chair | Indefinite term; since 2018 | Chief Executive Officer, Pacific Global Asset Management LLC (November 2018-Present): Senior Vice President, Pacific Life Insurance Company (August 2012-November 2018). | 1 | None | ||||||||||||||||||
| Sharon A. Cheever Born: 1955 | Trustee | Indefinite term; since 2018 | Director, Senior Vice President and General Counsel, Pacific Life Insurance Company (Jan. 2008-Present); Senior Vice President and General Counsel, Pacific Global Asset Management LLC (August 2012-Present); Senior Vice President and General Counsel, Cadence Capital Management LLC (July 2016-August 2016); Senior Vice President and General Counsel, Pacific Life Fund Advisors LLC (January 2008-October 2015); Senior Vice President and General Counsel, Pacific Private Fund Advisors LLC (August 2013-March 2015). | 1 | None | ||||||||||||||||||
F-1
PACIFIC GLOBAL ETFs
TRUSTEES AND OFFICERS (Continued)
(Unaudited)
The officers of the Trust conduct and supervise its daily business. The address of each officer of the Trust is c/o Pacific Global ETF Trust, 840 Newport Center Drive, 7th Floor, Newport Beach, CA 92660. Each officer serves for a one year term or until their successors are elected and qualified.
| Name and Year of Birth | Position(s) Held with the Trust | Length of Time Served | Principal Occupation(s) During Past 5 Years | ||||||||||||
| Joshua B. Schwab Born: 1981 | Vice President, Treasurer and Principal Finance Officer | Since 2018 | Assistant Vice President, Pacific Global Asset Management LLC (2015-Present); Assistant Vice President, Pacific Life Insurance Company, (2015-Present); Associate Vice President, Pacific Alternative Asset Management Company, LLC (2007-2015). | ||||||||||||
| Jane M. Guon Born: 1964 | Vice President and Secretary | Since 2018 | Vice President and Secretary, Pacific Life Insurance Company (2011-Present); Vice President and Secretary, Pacific Global Asset Management LLC (2013-Present). | ||||||||||||
| Carol E. Rumsey Born: 1960 | Vice President and Chief Compliance Officer | Since 2018 | Chief Compliance Officer, Pacific Private Fund Advisors LLC (2014-Present); Assistant Vice President, Pacific Global Asset Management LLC (2014-Present); Chief Compliance Officer, Pacific Asset Management (2013-Present); Assistant Vice President, Pacific Life Insurance Company (1991-Present). | ||||||||||||
| Michael J. Skillman Born: 1963 | Chief Executive Officer and President | Since 2018 | CEO & Managing Director, Cadence Capital Management LLC (2004-Present); Vice President, Pacific Life Insurance Company (2016-Present). | ||||||||||||
| Anthony J. Dufault Born: 1971 | Vice President | Since 2018 | Assistant Vice President, Pacific Global Asset Management LLC, (2018-Present); Assistant Vice President, Pacific Life Insurance Company (2007-Present). | ||||||||||||
| Joseph G. Lallande Born: 1970 | Vice President and Assistant Secretary | Since 2018 | AVP & Counsel, Pacific Life Insurance Company (2010-Present). | ||||||||||||
The Statement of Additional Information includes additional information about the Trustees and is available without charge, upon request, by calling toll free at (866) 933-2398, or by accessing the SEC's website at www.sec.gov, or by accessing the Fund's website at www.pacificglobaletfs.com.
F-2
PACIFIC GLOBAL ETFs
EXPENSE EXAMPLES
For the Period Ended June 30, 2019 (Unaudited)
As a shareholder of Pacific Global US Equity Income ETF, you incur two types of costs: (1) transaction costs, including brokerage commissions on purchases and sales of Fund shares, and (2) ongoing costs, including management fees and other Fund expenses. This Example is intended to help you understand your ongoing costs (dollars) of investing in the Fund and to compare these costs with the ongoing costs of investing in other funds. The example is based on an investment of $1,000 invested at the beginning of the period and held for the entire six-month period (January 1, 2019-June 30, 2019). The actual dollar amounts shown as expenses paid during the period for the Pacific Global US Equity Income ETF are multiplied by 140/365, which is based on the date of inception (February 11, 2019).
ACTUAL EXPENSES
The first line of the table provides information about actual account values based on actual returns and actual expenses. You may use the information in this line, together with the amount you invested, to estimate the expenses that you paid over the period. Simply divide your account value by $1,000 (for example, an $8,600 account value divided by $1,000 = 8.6), then, multiply the result by the number in the first line under the heading entitled "Expenses Paid During the Period" to estimate the expenses you paid on your account during this period.
HYPOTHETICAL EXAMPLE FOR COMPARISON PURPOSES
The second line of the table provides information about hypothetical account values based on a hypothetical return and hypothetical expenses based on the Fund's actual expense ratio and an assumed rate of return of 5% per year before expenses, which is not the Fund's actual return. The hypothetical account values and expenses may not be used to estimate the actual ending account balance or expenses you paid for the period. You may use this information to compare the ongoing costs of investing in the Fund and other funds. To do so, compare this 5% hypothetical example with the 5% hypothetical examples that appear in the shareholder reports of the other funds. Please note that the expenses shown in the table are meant to highlight your ongoing costs only and do not reflect any transactional costs, such as brokerage commissions paid on purchases and sales of
Fund shares. Therefore, the second line of the table is useful in comparing ongoing costs only and will not help you determine the relative total costs of owning different funds. If these transactional costs were included, your costs would have been higher.
| Beginning Account Value | Ending Account Value June 30, 2019 | Expenses Paid During the Period (1) | |||||||||||||
Pacific Global US Equity Income ETF | |||||||||||||||
Actual | $ | 1,000.00 | $ | 1,064.30 | $ | 1.15 | |||||||||
| Hypothetical (5% annual return before expenses) | $ | 1,000.00 | $ | 1,023.36 | $ | 1.45 | |||||||||
(1) The dollar amounts shown as expenses paid during the period are equal to the annualized expense ratio, 0.29%, multiplied by the average account value during the six-month period, multiplied by the number of days in the six-month period, 181 days, and divided by the number of days in the most recent twelve-month period, 365 days. The actual dollar amounts shown as expenses paid during the period for Pacific Global US Equity Income ETF are multiplied by 140/365, which is based on the date of inception (February 11, 2019).
F-3
PACIFIC GLOBAL ETFs
APPROVAL OF ADVISORY AGREEMENT
AND BOARD CONSIDERATIONS
(Unaudited)
During the Meeting, the Board of the Trustees of the Pacific Global ETF Trust reviewed and discussed the written materials that were provided by Pacific Global Asset Management LLC (the "Adviser") in advance of the Meeting and deliberated on the approval of the Management Agreement between the Adviser and the Pacific Global ETF Trust on behalf of Pacific Global US Equity Income ETF (the "Fund"). The Board reviewed: (i) the nature and quality of the advisory services to be provided by the Adviser, including the experience and qualifications of the personnel providing such services; (ii) the performance history of the Fund, noting that it had not yet launched; (iii) the proposed fees and expense of the Fund, including the proposed advisory fee to be paid by the Fund to the Adviser; and (iv) the anticipated profitability of the Fund to the Adviser. In considering the approval of the Management Agreement, the Board reviewed and analyzed various factors that they determined were relevant, including the factors enumerated below.
Nature, Extent and Quality of Services
The Board reviewed materials provided by the Adviser related to the proposed approval of the Management Agreement, including a description of its oversight of Cadence Capital Management LLC (the "Sub-Adviser"), a review of the professional personnel who will be performing services for the Trust, and how it will monitor the Sub-Adviser's investment process. The Board also noted the extensive responsibilities that the Adviser will have as investment adviser to the Fund, including: the oversight of the Sub-Adviser's adherence to the Fund's investment strategy and restrictions, monitoring of the Sub-Adviser's buying and selling of securities and other transactions, review of Sub-Adviser performance, review of proxies voted by the Sub-Adviser and oversight of, and the provision of consultation to, the Sub-Adviser with respect to the creation of custom creation or redemption baskets for authorized participants; oversight of the daily valuation of the Fund's portfolio holdings; oversight of general Fund compliance with federal and state laws; and implementation of Board directives as they relate to the Fund. The Board also considered research support available to, and management capabilities of, the Fund's management personnel and that the Adviser will provide oversight of day-to-day Fund operations, including fund accounting, tax matters, administration, compliance and legal assistance in meeting disclosure and regulatory requirements. The Board discussed the extent of the Adviser's research capabilities, the quality of its compliance infrastructure and the experience of its fund management personnel.
Additionally, the Board received satisfactory responses from the representatives of the Adviser with respect to a series of questions, including: whether the Adviser was involved in any lawsuits or pending regulatory actions; whether the management of other accounts would conflict with its management of the Trust; and whether there are procedures in place to adequately allocate trades among its respective clients.
The Board reviewed the description provided on the practices for monitoring compliance with the Trust's investment limitations, noting that the Adviser's CCO would periodically review the portfolio managers' performance of their duties to ensure compliance under the Adviser's compliance program. The Board concluded that the Adviser had sufficient quality and depth of personnel, resources, investment methods and compliance policies and procedures essential to performing its duties under the Advisory Agreement and that the nature, overall quality and extent of the management services to be provided by the Adviser to the Trust would be satisfactory.
Performance
Because the Trust and the Fund had not yet commenced operations, the Trustees could not consider the Fund's past performance. However, the Trustees considered the performance of another registered fund with a slightly different investment strategy previously managed by the Sub-Adviser. The Trustees also considered the Sub-Adviser's performance composite for the strategy provided in connection with the Sub-Adviser's responses to the Board's requests for information related to the Board's consideration of the sub-advisory agreement.
Fees and Expenses
As to the costs of the services to be provided by the Adviser, the Board discussed the comparison of advisory fees and total operating expense data and reviewed the Trust's advisory fee, which is a unitary fee, and overall expenses compared to a peer group comprised of funds constructed by the Adviser and the Sub-Adviser with similar investment objectives and strategies. The Board was aware that under the unitary fee arrangement, the Adviser is contractually obligated to pay the fees of each of the Fund's service providers, with the exception of the Adviser, and certain other expenses. The Board noted that the advisory fee for the Trust was below the peer group average. In considering whether to approve the Agreements, the Trustees also considered and discussed information and analysis provided by the Adviser, based on data from Morningstar, an independent provider of investment company data. The Board concluded that based on the Adviser's services to be provided to the Trust and comparative fee and expense data, the advisory fee charged by the Adviser and the estimated expenses for the Trust were reasonable.
Profitability
The Board considered the level of profits that could be expected to accrue to the Adviser with respect to the Trust based on profitability projections and analyses reviewed by the Board and the selected financial information of the Adviser provided by the Adviser to the Board. After review and discussion, the Board concluded the investment advisory relationship would initially be unprofitable to the Adviser and, once the Trust had sufficient assets, the anticipated profit from the Adviser's relationship with the Trust would not be excessive.
Economies of Scale
As to the extent to which the Trust will realize economies of scale as it grows, and whether the fee levels reflect these economies of scale for the benefit of investors, the Board discussed the Adviser's expectations for growth of the Trust. The Board determined that because the Fund had not yet commenced operations, economies of scale were not a factor. The Board further determined, however, that to the extent that material economies of scale were to be achieved in the future, and such economies of scale had not been shared with the Fund, the Board would seek to have those economies of scale shared with the Fund in connection with future renewals of the Management Agreement.
Fall-Out Benefits
The Board considered potential benefits to the Adviser and the Sub-Adviser from acting as investment adviser and sub-adviser, respectively.
* * * * *
F-4
PACIFIC GLOBAL ETFs
APPROVAL OF ADVISORY AGREEMENT
AND BOARD CONSIDERATIONS (Continued)
(Unaudited)
During the Meeting, the Board reviewed and discussed the written materials that were provided by the Sub-Adviser in advance of the Meeting and deliberated on the approval of the Sub-Advisory Agreement between the Adviser and the Sub-Adviser on behalf of the Fund. The Board reviewed: (i) the nature and quality of the advisory services to be provided by the Sub-Adviser, including the experience and qualifications of the personnel providing such services; (ii) the performance history of the Fund, noting that it had not yet launched; (iii) the proposed fees and expense of the Fund, including the proposed sub-advisory fee to be paid by the Adviser to the Sub-Adviser; and (iv) the anticipated profitability of the Fund to the Sub-Adviser. In considering the approval of the Sub-Advisory Agreement, the Board reviewed and analyzed various factors that they determined were relevant, including the factors enumerated below.
Nature, Extent and Quality of Services
As to the nature, quality and extent of the services to be provided by the Sub-Adviser, the Board noted the experience of the portfolio management and research personnel of the Sub-Adviser, including their experience in the investment field, education and industry credentials. The Board reviewed the presentation materials prepared by the Sub-Adviser describing its investment process. The Board received satisfactory responses from the Sub-Adviser with respect to a series of questions, including: whether the Sub-Adviser is involved in any lawsuits or pending regulatory actions. The Board discussed the Sub-Adviser's compliance structure and broker-dealer selection process noting that the Fund would be an actively managed equity fund. In consideration of the compliance policies and procedures for the Sub-Adviser included in the Board Materials, the Board concluded that the Sub-Adviser had sufficient quality and depth of personnel, resources, investment methods and compliance policies and procedures essential to performing their duties under the Sub-Advisory Agreement and that the nature, overall quality and extent of investment management services to be provided to the Trust would be satisfactory.
Performance
As the Fund had not yet commenced operations, the Board was not able to review the Fund's performance. However, the Trustees considered the performance of another registered fund with a slightly different investment strategy previously managed by the Sub-Adviser and the Sub-Adviser's performance composite for the strategy. The Board discussed with the Sub-Adviser representatives the portfolio management team and the investment strategies to be employed in the management of the Fund's assets. The Board noted the reputation and experience of the Sub-Adviser. The Board recognized the skill and successful management of the other registered fund by the Sub-Adviser.
Fees and Expenses
As to the costs of the services to be provided by the Sub-Adviser, the Board discussed the sub-advisory fee payable by the Adviser to Sub-Adviser, pursuant to the Sub-Advisory Agreement. The Board considered that Sub-Adviser is to be paid by the Adviser and not by the Trust. The Adviser confirmed to the Board that the Adviser was of the opinion that the sub-advisory fees to be paid to the Sub-Adviser were reasonable in light of the anticipated quality of the services to be performed by the Sub-Adviser and the proposed division of services between the Adviser and Sub-Adviser. It was noted that the Adviser and Sub-Adviser were affiliated companies. The Trustees discussed the total fees expected to be paid to the Sub-Adviser, and noted that the Sub-Adviser will receive no other compensation from the Trust or the Adviser, except the sub-advisory fee earned pursuant to the Sub-Advisory Agreement and payable by the Adviser. Based on the representations of the Adviser and Sub-Adviser and the materials provided, the Board concluded that the sub-advisory fee to be paid to the Sub-Adviser was reasonable.
Profitability
As to profits to be realized by the Sub-Adviser, the Trustees noted that all sub-advisory fees will be paid by the Adviser, and not directly paid by the Trust. Consequently, the Board did not consider the costs of services provided by the Sub-Adviser or its profitability to be significant factors.
Economies of Scale.
The Board determined that because the Fund had not yet commenced operations, economies of scale were not a factor. The Board further determined, however, that to the extent that material economies of scale were to be achieved in the future, and such economies of scale had not been shared with the Fund, the Board would seek to have those economies of scale shared with the Fund in connection with future renewals of the Sub-Advisor Agreement.
Fall-Out Benefits.
The Board considered potential benefits to the Sub-Adviser from acting as sub-adviser to the Fund.
F-5
PACIFIC GLOBAL ETFs
FEDERAL TAX INFORMATION
(Unaudited)
For the period ended June 30, 2019, certain dividends paid by the Fund may be subject to a maximum tax rate of 15% (20% for taxpayers with taxable income greater than $425,800 for single individuals and $479,000 for married couples filling jointly), as provided for by the Jobs and Growth Tax Relief Reconciliation Act of 2003 and The Tax Cuts and Jobs Act of 2017. The Percentage of dividends declared from ordinary income designated as qualified dividend income was as follows:
Pacific Global US Equity Income ETF | 47.94 | % | |||||
For corporate shareholders, the percent of ordinary income distributions qualifying for the corporate dividends received deduction for the period ended June 30, 2019 was as follows:
Pacific Global US Equity Income ETF | 47.72 | % | |||||
The percentage of taxable ordinary income distributions that are designated as short-term capital gain distributions under Internal Revenue Section 871(k)(2) was as follows:
Pacific Global US Equity Income ETF | 0.00 | % | |||||
F-6
PACIFIC GLOBAL ETFs
ADDITIONAL INFORMATION
(Unaudited)
Information About Portfolio Holdings
The Fund files the complete schedule of portfolio holdings for the first and third fiscal quarters with the SEC on Part F of Form N-PORT. When available, Part F of Form N-PORT is available on the SEC's website at www.sec.gov. The Fund's portfolio holdings are posted on its website, at www.pacificglobaletfs.com, daily.
Information About Proxy Voting
A description of the policies and procedures the Fund uses to determine how to vote proxies relating to portfolio securities is provided in the Statement of Additional Information ("SAI"). The SAI is available without charge, upon request, by calling toll-free at (866) 933-2398, by accessing the SEC's website at www.sec.gov, or by accessing the Fund's website at www.pacificglobaletfs.com.
Information regarding how the Fund voted proxies relating to portfolio securities during the most recent period ending June 30 is available no later than the following August 31st by calling toll-free at (866) 933-2398 or by accessing the SEC's website at www.sec.gov.
Frequency Distribution of Premiums and Discounts
The following Frequency Distribution of Premium and Discount chart is provided to show the frequency at which the closing price of the for the Fund was at a premium or discount to its daily NAV. The chart presented represents past performance and cannot be used to predict future results. Further information regarding premiums and discounts is available, without charge, on the Fund's website at www.pacificglobaletfs.com
Pacific Global US Equity Income ETF
Period covered February 11, 2019 through June 30, 2019
Premium/Discount Range | Number of Trading Days | % of Total Trade Days | |||||||||
| 1.00% or more | 0 | 0.00 | % | ||||||||
| 0.75% to 0.999% | 0 | 0.00 | % | ||||||||
| 0.50% to 0.749% | 1 | 0.71 | % | ||||||||
| 0.25% to 0.499% | 1 | 0.71 | % | ||||||||
| 0.00% to 0.249% | 95 | 67.87 | % | ||||||||
| -0.001% to -0.249% | 42 | 30.00 | % | ||||||||
| -0.25% to -0.499% | 1 | 0.71 | % | ||||||||
| -0.50% to -0.749% | 0 | 0.00 | % | ||||||||
| -0.75% to -0.999% | 0 | 0.00 | % | ||||||||
| -1.00% or more | 0 | 0.00 | % | ||||||||
F-7
Investment Adviser
Pacific Global Advisors LLC
840 Newport Center Drive, 7th Floor
Newport Beach, CA 92660
Sub-Adviser
Cadence Capital Management LLC
265 Franklin Street, 4th Floor
Boston, MA 02110
Custodian
U.S. Bank, N.A.
1555 N. Rivercenter Drive
Milwaukee, WI 53212
Administrator/Transfer Agent
U.S. Bancorp Fund Services, LLC
615 East Michigan Street
Milwaukee, WI 53202
Distributor
Foreside Fund Services, LLC
Three Canal Plaza, Suite 100
Portland, ME 04101
Independent Registered Public Accounting Firm
Deloitte & Touche, LLP
695 Town Center Drive, Suite 1000
Costa Mesa, CA 92626
Legal Counsel
Thompson Hine LLP
1919 M Street, N.W., Suite 700
Washington, D.C. 20036
Pacific Global US Equity Income ETF
Symbol—USDY
CUSIP—69434K106
Item 2. Code of Ethics.
The registrant has adopted a code of ethics that applies to the registrant’s principal executive officer and principal financial officer. The registrant has not made any substantive amendments to its code of ethics during the period covered by this report. The registrant has not granted any waivers from any provisions of the code of ethics during the period covered by this report. A copy of the registrant’s Code of Ethics is filed herewith.
Item 3. Audit Committee Financial Expert.
The registrant’s board of trustees has determined that there is at least one audit committee financial expert serving on its audit committee. John Siciliano is the “audit committee financial expert” and is considered to be “independent” as each term is defined in Item 3 of Form N-CSR.
Item 4. Principal Accountant Fees and Services.
The registrant has engaged its principal accountant to perform audit services, audit-related services, tax services and other services during the past two fiscal years. “Audit services” refer to performing an audit of the registrant’s annual financial statements or services that are normally provided by the accountant in connection with statutory and regulatory filings or engagements for those fiscal years. “Audit-related services” refer to the assurance and related services by the principal accountant that are reasonably related to the performance of the audit. “Tax services” refer to professional services rendered by the principal accountant for tax compliance, tax advice, and tax planning. “Other services” provided by the principal accountant. The following table details the aggregate fees billed or expected to be billed for each of the last two fiscal years for audit fees, audit-related fees, tax fees and other fees by the principal accountant. Note, the registrant has completed only one fiscal year as of the date of this report.
| FYE 6/30/2019 | FYE 6/30/2018 |
Audit Fees | $15,000 | N/A |
Audit-Related Fees | N/A | N/A |
Tax Fees | $10,000 | N/A |
All Other Fees | N/A | N/A |
The audit committee has adopted pre-approval policies and procedures that require the audit committee to pre-approve all audit and non-audit services of the registrant, including services provided to any entity affiliated with the registrant.
The percentage of fees billed by Deloitte & Touche LLP applicable to non-audit services pursuant to waiver of pre-approval requirement were as follows:
| FYE 6/30/2019 | FYE 6/30/2018 |
Audit-Related Fees | 0% | N/A |
Tax Fees | 0% | N/A |
All Other Fees | 0% | N/A |
All of the principal accountant’s hours spent on auditing the registrant’s financial statements were attributed to work performed by full-time permanent employees of the principal accountant. (If more than 50 percent of the accountant’s hours were spent to audit the registrant’s financial statements for the most recent fiscal year, state how many hours were attributed to work performed by persons other than the principal accountant’s full-time, permanent employees.)
The following table indicates the non-audit fees billed or expected to be billed by the registrant’s accountant for services to the registrant and to the registrant’s investment adviser (and any other controlling entity, etc.—not sub-adviser) for the last two years. The audit committee of the board of trustees/directors has considered whether the provision of non-audit services that were rendered to the registrant’s investment adviser is compatible with maintaining the principal accountant’s independence and has concluded that the provision of such non-audit services by the accountant has not compromised the accountant’s independence.
Non-Audit Related Fees | FYE 6/30/2019 | FYE 6/30/2018 |
Registrant | N/A | N/A |
Registrant’s Investment Adviser | N/A | N/A |
Item 5. Audit Committee of Listed Registrants.
The registrant is an issuer as defined in Rule 10A-3 under the Securities Exchange Act of 1934, (the “Act”) and has a separately-designated standing audit committee established in accordance with Section 3(a)(58)(A) of the Act. The independent members of the committee are as follows: Robert J. Blattenberg, D. Robinson Cluck and John C. Siciliano.
Item 6. Investments.
(a) Schedule of Investments is included as part of the report to shareholders filed under Item 1 of this Form.
(b) Not Applicable.
Item 7. Disclosure of Proxy Voting Policies and Procedures for Closed-End Management Investment Companies.
Not applicable to open-end investment companies.
Item 8. Portfolio Managers of Closed-End Management Investment Companies.
Not applicable to open-end investment companies.
Item 9. Purchases of Equity Securities by Closed-End Management Investment Company and Affiliated Purchasers.
Not applicable to open-end investment companies.
Item 10. Submission of Matters to a Vote of Security Holders.
There have been no material changes to the procedures by which shareholders may recommend nominees to the registrant’s board of trustees.
Item 11. Controls and Procedures.
(a) The Registrant’s President/Chief Executive Officer and Treasurer/Principal Finance Officer have reviewed the Registrant’s disclosure controls and procedures (as defined in Rule 30a-3(c) under the Investment Company Act of 1940, as amended, (the “Act”)) as of a date within 90 days of the filing of this report, as required by Rule 30a-3(b) under the Act and Rules 13a-15(b) or 15d-15(b) under the Securities Exchange Act of 1934. Based on their review, such officers have concluded that the disclosure controls and procedures are effective in ensuring that information required to be disclosed in this report is appropriately recorded, processed, summarized and reported and made known to them by others within the Registrant and by the Registrant’s service provider.
(b) There were no changes in the Registrant’s internal control over financial reporting (as defined in Rule 30a-3(d) under the Act) that occurred during the second fiscal quarter of the period covered by this report that have materially affected, or are reasonably likely to materially affect, the Registrant’s internal control over financial reporting.
Item 12. Disclosure of Securities Lending Activities for Closed-End Management Investment Companies
Not applicable to open-end investment companies.
Item 13. Exhibits.
(a) (1) Any code of ethics or amendment thereto, that is the subject of the disclosure required by Item 2, to the extent that the registrant intends to satisfy Item 2 requirements through filing an exhibit. Filed herewith.
(2) A separate certification for each principal executive officer and principal financial officer pursuant to Section 302 of the Sarbanes-Oxley Act of 2002. Filed herewith.
(3) Any written solicitation to purchase securities under Rule 23c-1 under the Act sent or given during the period covered by the report by or on behalf of the registrant to 10 or more persons. Not applicable to open-end investment companies.
(4) Change in the registrant’s independent public accountant. There was no change in the registrant’s independent public accountant for the period covered by this report.
(b) Certifications pursuant to Section 906 of the Sarbanes-Oxley Act of 2002. Furnished herewith.
SIGNATURES
Pursuant to the requirements of the Securities Exchange Act of 1934 and the Investment Company Act of 1940, the registrant has duly caused this report to be signed on its behalf by the undersigned, thereunto duly authorized.
(Registrant) | Pacific Global ETF Trust |
| ||
| ||||
By (Signature and Title)* | /s/ Michael J. Skillman |
| ||
| Michael J. Skillman, President |
| ||
|
|
| ||
Date | August 27, 2019 |
| ||
Pursuant to the requirements of the Securities Exchange Act of 1934 and the Investment Company Act of 1940, this report has been signed below by the following persons on behalf of the registrant and in the capacities and on the dates indicated.
By (Signature and Title)* | /s/ Michael J. Skillman |
| |||
| Michael J. Skillman, President |
| |||
|
|
| |||
Date | August 27, 2019 |
| |||
|
|
| |||
By (Signature and Title)* | /s/ Joshua B. Schwab |
| |||
| Joshua B. Schwab, Treasurer |
| |||
|
|
| |||
Date | August 27, 2019 |
| |||
* Print the name and title of each signing officer under his or her signature.