As filed with the U.S. Securities and Exchange Commission on August 17, 2021
UNITED STATES
SECURITIES AND EXCHANGE COMMISSION
Washington, D.C. 20549
FORM N-CSR
CERTIFIED SHAREHOLDER REPORT OF REGISTERED
MANAGEMENT INVESTMENT COMPANIES
Investment Company Act file number 811-23376
Pacific Global ETF Trust
(Exact name of registrant as specified in charter)
840 Newport Center Drive, 7th Floor
Newport Beach, California 92660
(Address of principal executive offices) (Zip code)
Corporation Service Company
251 Little Falls Drive
Wilmington, DE 19808
(Name and address of agent for service)
(949) 219-3391
Registrant's telephone number, including area code
Date of fiscal year end: June 30
Date of reporting period: June 30, 2021
Item 1. Reports to Stockholders.

ANNUAL REPORT
June 30, 2021
Pacific Global Focused High Yield ETF - FJNK
Pacific Global Senior Loan ETF - FLRT
PACIFIC GLOBAL ETFs
TABLE OF CONTENTS
Letter to Shareholders | A-1 | ||||||
Performance Summary | A-2 | ||||||
Portfolios of Investments | B-1 | ||||||
Statements of Assets and Liabilities | C-1 | ||||||
Statements of Operations | C-2 | ||||||
Statements of Changes in Net Assets | C-3 | ||||||
Financial Highlights | C-4 | ||||||
Notes to Financial Statements | D-1 | ||||||
Report of Independent Registered Public Accounting Firm | E-1 | ||||||
Trustees and Officers | F-1 | ||||||
| Statement Regarding the Funds' Liquidity Risk Program | F-3 | ||||||
| Expense Examples | F-4 | ||||||
| Federal Tax Information | F-5 | ||||||
| Additional Information | F-6 | ||||||
LETTER TO SHAREHOLDERS—PACIFIC GLOBAL ETFs
Dear Shareholders:
We are pleased to share with you the Pacific Global ETF Trust's Annual Report for the fiscal year ended June 30, 2021, including performance data, management's discussion of fund performance and a complete list of investments. The past year has been unprecedented for many reasons, but the Pacific Global ETFs continue to deliver diversified income for investors over a spectrum of investment horizons.
Pacific Global Advisors LLC (the "Adviser") continues to rely upon its affiliate, Pacific Asset Management LLC, to serve as sub-adviser to Pacific Global Focused High Yield ETF ("FJNK") and Pacific Global Senior Loan ETF ("FLRT" and with FJNK, the "Funds"). Under the Adviser's supervision, Pacific Asset Management is responsible for the day-to-day management of the Funds. Pacific Asset Management has prepared a discussion regarding the performance of the Funds, including commentary discussing positive and negative factors affecting their performance over the past 12 months. We appreciate your confidence in Pacific Global ETFs.
Sincerely,
J. G. Lallande, CEO
Pacific Global ETF Trust
Market Summary
The 12-month period ended June 30, 2021 (the "Reporting Period") proved to be highly volatile for credit investors. Global risk assets posted gains during the second half of 2020 and into 2021, rising in the face of a continuing pandemic, a disruptive presidential election cycle, and other geopolitical tensions.
Bank Loan Market
Over the last 12 months (ending 6/30/2021) the bank loan market (as measured by the S&P/LSTA US Leveraged Loan 100 Index) has experienced one of its robust and quickest rebounds. The market experienced a sharp sell-off in March 2020 related to the proliferation of COVID-19 and the shuttering off the economy. The strain on corporations was widespread and immediate as consumer support waned.
Markets reacted positively to immense fiscal and monetary stimulus quickly resulting in higher asset prices within the loan market. On a one-year basis, the S&P/LSTA US Leveraged Loan 100 Index returned 9.37%. This return was largely led by lower credit quality, distressed loans (those trading less than $80), and smaller facility sized loans. Fundamentally, the market has regained its footing as companies have created large cash runways through increased debt issuance at historically low rates. A downstream effect of positive corporate fundamentals is a lower default rate. One year ago, the asset class default rate was at a 5 year high of near 4%. Current default rates for the loan asset class is below 1.5% (long term historical average is 3.6%). Technicals and relative value are also in support of the asset class with near record levels of collateralized loan obligation origination and retail inflows (on the fear of a future rise in interest rates).
FJNK
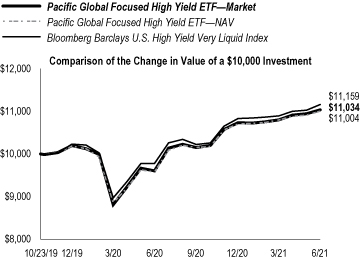
During the Reporting Period, the FJNK posted cumulative total returns of 14.90% based on market price and net asset value ("NAV"). In comparison the Bloomberg Barclays U.S. High Yield Very Liquid Index, FJNK's benchmark, posted a 14.12% return for the same Period.
FJNK seeks to provide income and long-term capital growth by investing in a focused portfolio of liquid, high-yield debt securities. Using a structured, actively managed approach, the fund is designed to outperform its benchmark while providing ample liquidity to investors.
The primary drivers of FJNK's outperformance included the fund's credit-quality allocations and security selection. FJNK's overweight exposure to specific CCC rated securities served as a contributor during the period. Credit ratings represent a measure of the quality of underlying securities in the Fund based on the evaluations from third-party vendors. CCC is a rating on a scale that ranges from AAA (the highest rating) to D (the lowest rating), any rating BB or lower is considered to be of a low credit quality. Further, exposures to certain machine rental, home construction, and transportation bonds added to performance on the back of the economic recovery. Exposure to certain media and manufacturing credits detracted from performance over the period.
FLRT
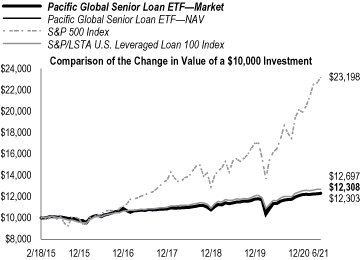
During the 12-month Period, FLRT posted cumulative total returns of 8.48% based on market price and 8.63% based on net asset value (NAV). In comparison, the S&P/LSTA US Leveraged Loan 100 Index, FLRT's benchmark, posted a 9.37% total return for the same Period.
During the Period, FLRT performed in-line with the benchmark after fees. Therefore, performance contributors and detractors were relatively balanced during the Reporting Period. Contributors to FLRT's performance included its credit-quality allocations and an underweight to the underperforming energy sector. FLRT's underweight exposure to BB and CCC rated loans and overweight exposure to B rated loans served as a contributor. Conversely, FLRT's exposure to certain leisure and gaming/casino bonds served as a detractor from performance during the Reporting Period.
A-1
PACIFIC GLOBAL ETFs
PERFORMANCE SUMMARY
June 30, 2021 (Unaudited)
Average Annual Total Returns for Periods Ended June 30, 2021
| One Year | Since Inception(1) | ||||||||||
Pacific Global Focused High Yield ETF—NAV | 14.90 | % | 5.83 | % | |||||||
Pacific Global Focused High Yield ETF—Market | 14.90 | % | 6.01 | % | |||||||
Bloomberg Barclays U.S. High Yield Very Liquid Index | 14.12 | % | 6.71 | % | |||||||
Average Annual Total Returns for Periods Ended June 30, 2021
| One Year | Three Years | Five Years | Since Inception(2)(3) | ||||||||||||||||
Pacific Global Senior Loan ETF—NAV | 8.63 | % | 3.94 | % | 3.79 | % | 3.31 | % | |||||||||||
Pacific Global Senior Loan ETF—Market | 8.48 | % | 3.87 | % | 4.00 | % | 3.32 | % | |||||||||||
S&P/LSTA U.S. Leveraged Loan 100 Index | 9.37 | % | 4.30 | % | 4.67 | % | 3.82 | % | |||||||||||
S&P 500 Index | 40.79 | % | 18.67 | % | 17.65 | % | 14.14 | % | |||||||||||
(1) Commencement of operations on October 23, 2019.
(2) Commencement of operations on February 18, 2015.
(3) Pacific Global Senior Loan ETF is the successor in interest to AdvisorShares Pacific Asset Enhanced Floating Rate ETF (the "Predecessor Fund"), which was advised by AdvisorShares Investment, LLC. Performance prior to December 27, 2019 reflects that of the Predecessor Fund.
The Pacific Global Focus High Yield ETF and Pacific Global Senior Loan ETF pay the advisor a unitary fee of 0.39% and 0.68% of average daily net assets, respectively. See Note 1 in the Notes to Financial Statements for more information.
A-2
PACIFIC GLOBAL ETFs
PERFORMANCE SUMMARY
June 30, 2021 (Unaudited)
NAV—Net Asset Value Per Share: the NAV return shown is based on net asset value calculated for shareholder transactions and may differ from the return shown in the Financial Highlights, which reflects adjustments made to the net asset value in accordance with U.S. GAAP.
Market—Market Price: the market price return is calculated assuming an initial investment made at the market price at the beginning of the period, reinvestment of all dividends and distributions at market price during the period, and sale at the market price on the last day of the period. The price used to calculate the market price return is the midpoint of the bid/ask spread at the close of business on NYSE Arca and does not represent the returns an investor would receive if the shares were traded at other times.
Benchmark index performance is from inception date of the Fund only and is not the inception date of the benchmark index itself.
The expense ratios of the Funds are set forth in the most recently filed Prospectus for each Fund and may differ from the expense ratios disclosed in the Financial Highlights included in this report. See the Financial Highlights for most current expense ratio.
The Bloomberg Barclays U.S. High Yield Very Liquid Index includes publicly issued US dollar denominated, non-investment grade, fixed-rate, taxable corporate bonds that have a remaining maturity of at least one year, regardless of optionality, are rated high-yield (Ba1/BB+/BB+ or below) using the middle rating of Moody's, S&P, and Fitch, respectively (before July 1, 2005, the lower of Moody's and S&P was used), and have $600 million or more of outstanding face value.
The S&P/LSTA U.S. Leveraged Loan 100 Index is designed to track the market-weighted performance of the largest institutional leveraged loans based on market weightings, spreads and interest payments.
The S&P 500 Index is a broad-based, unmanaged measurement of changes in stock market conditions based on the average of 500 widely held common stocks.
The volatility of the index may be materially different from that of the Fund. You cannot invest directly in an index. Index results assume the re-investment of all dividends and capital gains, but do not reflect operating expenses such as transaction costs and invest investment advisory fees. In addition, the Funds' holdings will differ significantly from the securities that comprise the indices.
The shares of a Fund may trade above or below their net asset value. The net asset value of a Fund will generally fluctuate with changes in the market value of the Fund's holdings. The market prices of shares, however, will generally fluctuate in accordance with changes in net asset value as well as the relative supply of, and demand for, shares on the exchange. The trading price of shares may deviate significantly from the net asset value of the same shares.
Pacific Global Focused High Yield ETF is a diversified fund of the Trust. The investment objective of FJNK is to seek income and long-term growth of capital. The inception date was October 23, 2019.
Pacific Global Senior Loan ETF is a diversified fund of the Trust. The investment objective of FLRT seeks to provide a high level of current income. The inception date was February 18, 2015.
Performance data quoted represents past performance and is no guarantee of future results. Current performance may be lower or higher than the performance data quoted. Investment return and principal value will fluctuate so that an investor's shares, when redeemed, may be worth more or less than original cost. Returns less than one year are not annualized. For most recent month end performance visit www.pacificglobaletfs.com.
A-3
PACIFIC GLOBAL ETFs
PACIFIC GLOBAL FOCUSED HIGH YIELD ETF
Portfolio of Investments
June 30, 2021
Security Description | Principal Amount | Fair Value | |||||||||
CORPORATE BONDS - 81.1% | |||||||||||
Communications - 15.1% | |||||||||||
| CenturyLink, Inc. 7.50%, 04/01/2024 | $ | 500,000 | $ | 561,875 | |||||||
| CommScope Technologies LLC 6.00%, 06/15/2025 (a) | 410,000 | 419,225 | |||||||||
| CSC Holdings LLC 5.38%, 02/01/2028 (a) | 275,000 | 291,178 | |||||||||
| CSC Holdings LLC 6.50%, 02/01/2029 (a) | 500,000 | 554,430 | |||||||||
| Diamond Sports Group LLC / Diamond Sports Finance Co. 12.75%, 12/01/2026 (a) | 245,000 | 189,875 | |||||||||
| iHeartCommunications, Inc. 8.38%, 05/01/2027 | 200,000 | 214,502 | |||||||||
| LogMeIn, Inc. 5.50%, 09/01/2027 (a) | 300,000 | 311,115 | |||||||||
| Netflix, Inc. 4.88%, 06/15/2030 (a) | 325,000 | 387,458 | |||||||||
| Outfront Media, Inc. 5.00%, 08/15/2027 (a) | 325,000 | 336,984 | |||||||||
| Sprint Corp. 7.88%, 09/15/2023 | 250,000 | 284,332 | |||||||||
| Uber Technologies, Inc. 8.00%, 11/01/2026 (a) | 300,000 | 324,108 | |||||||||
3,875,082 | |||||||||||
Consumer, Cyclical - 15.6% | |||||||||||
| Aramark Services, Inc. 5.00%, 02/01/2028 (a) | 275,000 | 287,719 | |||||||||
| Beazer Homes USA, Inc. 7.25%, 10/15/2029 | 250,000 | 278,480 | |||||||||
| Caesars Resort Collection LLC 5.25%, 10/15/2025 (a) | 400,000 | 406,178 | |||||||||
| Cedar Fair LP 5.25%, 07/15/2029 | 500,000 | 516,095 | |||||||||
| Core & Main LP 6.125%, 08/15/2025 (a) | 275,000 | 281,471 | |||||||||
| Ford Motor Co. 4.35%, 12/08/2026 | 250,000 | 268,128 | |||||||||
| Ford Motor Co. 7.45%, 07/16/2031 | 425,000 | 559,406 | |||||||||
| Golden Nugget, Inc. 6.75%, 10/15/2024 (a) | 325,000 | 328,728 | |||||||||
| MajorDrive Holdings IV LLC 6.38%, 06/01/2029 (a) | 250,000 | 249,688 | |||||||||
| Scientific Games International, Inc. 8.25%, 03/15/2026 (a) | 250,000 | 268,432 | |||||||||
| SeaWorld Parks & Entertainment, Inc. 9.50%, 08/01/2025 (a) | 250,000 | 268,441 | |||||||||
| Tesla, Inc. 5.30%, 08/15/2025 (a) | 275,000 | 284,595 | |||||||||
3,997,361 | |||||||||||
Consumer, Non-cyclical - 16.2% | |||||||||||
| Ahern Rentals, Inc. 7.38%, 05/15/2023 (a) | 400,000 | 362,564 | |||||||||
| Albertsons LLC 5.88%, 02/15/2028 (a) | 325,000 | 350,678 | |||||||||
| Allied Universal Holdco LLC 9.75%, 07/15/2027 (a) | 350,000 | 385,875 | |||||||||
| Bausch Health Americas, Inc. 8.50%, 01/31/2027 (a) | 325,000 | 354,052 | |||||||||
| Charles River Laboratories International, Inc. 4.25%, 05/01/2028 (a) | 275,000 | 284,713 | |||||||||
Security Description | Principal Amount | Fair Value | |||||||||
| CHS/Community Health Systems, Inc. 6.63%, 02/15/2025 (a) | $ | 375,000 | $ | 397,028 | |||||||
| JBS Investments II GMBH 7.00%, 01/15/2026 (a) | 275,000 | 292,258 | |||||||||
| JBS Investments II GMBH 5.75%, 01/15/2028 (a) | 275,000 | 295,410 | |||||||||
| Kraft Heinz Foods Co. 4.25%, 03/01/2031 | 350,000 | 398,403 | |||||||||
| Prime Security Services Borrower LLC 5.75%, 04/15/2026 (a) | 275,000 | 304,508 | |||||||||
| RegionalCare Hospital Partners Holdings, Inc. 9.75%, 12/01/2026 (a) | 200,000 | 215,845 | |||||||||
| Tenet Healthcare Corp. 6.75%, 06/15/2023 | 450,000 | 491,625 | |||||||||
4,132,959 | |||||||||||
Energy - 14.3% | |||||||||||
| Antero Resources Corp. 5.38%, 03/01/2030 (a) | 350,000 | 357,658 | |||||||||
| Cheniere Corpus Christi Holdings LLC 5.13%, 06/30/2027 | 300,000 | 349,659 | |||||||||
| Chesapeake Energy Corp. 5.88%, 02/01/2029 (a) | 275,000 | 298,031 | |||||||||
| Endeavor Energy Resources LP / EER Finance, Inc. 5.75%, 01/30/2028 (a) | 350,000 | 373,128 | |||||||||
| EnLink Midstream Partners LP 4.15%, 06/01/2025 | 425,000 | 445,651 | |||||||||
| Genesis Energy LP / Genesis Energy Finance Corp. 7.75%, 02/01/2028 | 275,000 | 283,624 | |||||||||
| Occidental Petroleum Corp. 2.90%, 08/15/2024 | 400,000 | 409,500 | |||||||||
| SM Energy Co. 6.50%, 07/15/2028 | 250,000 | 257,193 | |||||||||
| Southwestern Energy Co. 6.20%, 01/23/2025 | 175,000 | 194,086 | |||||||||
| Targa Resources Partners Corp. 5.88%, 04/15/2026 | 450,000 | 473,879 | |||||||||
| USA Compression Partners LP 6.88%, 09/01/2027 | 200,000 | 214,056 | |||||||||
3,656,465 | |||||||||||
Financial - 6.9% | |||||||||||
| Ally Financial, Inc. 5.75%, 11/20/2025 | 500,000 | 574,817 | |||||||||
| Iron Mountain, Inc. 5.25%, 03/15/2028 (a) | 400,000 | 419,420 | |||||||||
| OneMain Finance Corp. 6.13%, 03/15/2024 | 400,000 | 431,000 | |||||||||
| OneMain Finance Corp. 7.13%, 03/15/2026 | 300,000 | 349,788 | |||||||||
1,775,025 | |||||||||||
Industrial - 10.5% | |||||||||||
| Berry Global, Inc. 4.50%, 02/15/2026 (a) | 240,000 | 245,729 | |||||||||
| Cargo Aircraft Management, Inc. 4.75%, 02/01/2028 (a) | 250,000 | 255,760 | |||||||||
| Gates Global LLC / Gates Corp. 6.25%, 01/15/2026 (a) | 250,000 | 262,722 | |||||||||
| Mauser Packaging Solutions Holding Co. 5.50%, 04/15/2024 (a) | 200,000 | 202,250 | |||||||||
| Mauser Packaging Solutions Holding Co. 7.25%, 04/15/2025 (a) | 275,000 | 270,050 | |||||||||
| Standard Industries, Inc. 4.75%, 01/15/2028 (a) | 375,000 | 392,981 | |||||||||
See Notes to Financial Statements
B-1
PACIFIC GLOBAL ETFs
PACIFIC GLOBAL FOCUSED HIGH YIELD ETF
Portfolio of Investments (Continued)
June 30, 2021
Security Description | Principal Amount | Fair Value | |||||||||
| TransDigm, Inc. 6.25%, 03/15/2026 (a) | $ | 500,000 | $ | 528,125 | |||||||
| TransDigm, Inc. 6.38%, 06/15/2026 | 250,000 | 259,305 | |||||||||
| Vertical US Newco, Inc. 5.25%, 07/15/2027 (a) | 250,000 | 263,750 | |||||||||
2,680,672 | |||||||||||
Utilities - 2.5% | |||||||||||
| Talen Energy Supply LLC 7.25%, 05/15/2027 (a) | 275,000 | 256,953 | |||||||||
| Vistra Operations Co. LLC 5.63%, 02/15/2027 (a) | 375,000 | 389,531 | |||||||||
646,484 | |||||||||||
| Total Corporate Bonds (Cost $20,152,308) | 20,764,048 | ||||||||||
FOREIGN BONDS - 13.0% | |||||||||||
Basic Materials - 1.2% | |||||||||||
| Alcoa Nederland Holding BV 5.50%, 12/15/2027 (a) | 275,000 | 298,664 | |||||||||
Communications - 2.1% | |||||||||||
| Altice France SA 7.38%, 05/01/2026 (a) | 200,000 | 208,236 | |||||||||
| Virgin Media Secured Finance Plc 5.50%, 08/15/2026 (a) | 325,000 | 336,213 | |||||||||
544,449 | |||||||||||
Consumer, Cyclical - 3.2% | |||||||||||
| 1011778 BC ULC / New Red Finance, Inc. 4.38%, 01/15/2028 (a) | 250,000 | 253,787 | |||||||||
| Panther Finance Co., Inc. 6.25%, 05/15/2026 (a) | 291,000 | 310,279 | |||||||||
| Viking Cruises Ltd. 5.88%, 09/15/2027 (a) | 250,000 | 247,362 | |||||||||
811,428 | |||||||||||
Consumer, Non-cyclical - 1.8% | |||||||||||
| Bausch Health Cos., Inc. 6.13%, 04/15/2025 (a) | 461,000 | 473,101 | |||||||||
Financial - 1.2% | |||||||||||
| Barclays Plc 5.20%, 05/12/2026 | 275,000 | 314,810 | |||||||||
Industrial - 3.5% | |||||||||||
| Ardagh Packaging Finance Plc 5.25%, 08/15/2027 (a) | 275,000 | 280,866 | |||||||||
| Bombardier, Inc. 7.50%, 03/15/2025 (a) | 275,000 | 283,422 | |||||||||
| Titan Acquisition Ltd. / Titan Co-Borrower LLC 7.75%, 04/15/2026 (a) | 300,000 | 311,724 | |||||||||
876,012 | |||||||||||
| Total Foreign Bonds (Cost $3,258,465) | 3,318,464 | ||||||||||
Security Description | Shares | Fair Value | |||||||||
SHORT TERM INVESTMENTS - 4.4% | |||||||||||
| First American Treasury Obligations Fund - Class X, 0.01% (b) | 1,124,921 | $ | 1,124,921 | ||||||||
| Total Short Term Investments (Cost $1,124,921) | 1,124,921 | ||||||||||
| TOTAL INVESTMENTS - 98.5% (Cost $24,535,694) | 25,207,433 | ||||||||||
OTHER ASSETS IN EXCESS OF LIABILITIES - 1.5% | 382,370 | ||||||||||
TOTAL NET ASSETS - 100.0% | $ | 25,589,803 | |||||||||
(a) Security exempt from registration under Rule 144A of the Securities Act of 1933. These securities may be resold in transactions exempt from registration to qualified institutional buyers.
(b) Seven-day yield as of June 30, 2021
Glossary:
Ltd. - Private Limited Company
Plc - Public Limited Company
LP - Limited Partnership
See Notes to Financial Statements
B-2
PACIFIC GLOBAL ETFs
PACIFIC GLOBAL FOCUSED HIGH YIELD ETF
Portfolio Allocations
June 30, 2021
Asset Type Allocation | |||||||
Corporate Bonds | 81.1 | % | |||||
Foreign Bonds | 13.0 | % | |||||
Short Term Investments | 4.4 | % | |||||
Total Investments | 98.5 | % | |||||
Other Assets in Excess of Liabilities | 1.5 | % | |||||
Net Assets | 100.0 | % | |||||
Sector Allocation | |||||||
Consumer, Cyclical | 18.8 | % | |||||
Consumer, Non-cyclical | 18.0 | % | |||||
Communications | 17.2 | % | |||||
Energy | 14.3 | % | |||||
Industrial | 14.0 | % | |||||
Financial | 8.1 | % | |||||
Short Term Investments | 4.4 | % | |||||
Utilities | 2.5 | % | |||||
Basic Materials | 1.2 | % | |||||
Total Investments | 98.5 | % | |||||
Other Assets in Excess of Liabilities | 1.5 | % | |||||
Net Assets | 100.0 | % | |||||
Percentages indicated are based upon net assets.
Refer to the Fund's Portfolio of Investment in this annual report for a detailed listing of the Fund's holdings.
See Notes to Financial Statements
B-3
PACIFIC GLOBAL ETFs
PACIFIC GLOBAL SENIOR LOAN ETF
Portfolio of Investments
June 30, 2021
Security Description | Principal Amount | Fair Value | |||||||||
BANK LOANS - 82.9% | |||||||||||
Basic Materials - 3.7% | |||||||||||
| Diamond BC BV 3.19% (3 Month LIBOR USD + 3.00%), 09/06/2024 (a) | $ | 246,803 | $ | 245,850 | |||||||
| Starfruit US Holdco 2.85% (1 Month LIBOR USD + 2.75%), 10/01/2025 (a) | 399,174 | 396,763 | |||||||||
5.00% (Prime + 1.75%), 10/01/2025 (a) | 61,926 | 61,552 | |||||||||
| Solenis International LP 4.14% (3 Months LIBOR USD + 4.00%), 06/26/2025 (a) | 241,667 | 241,925 | |||||||||
| US Silica Co. 5.00% (1 Month LIBOR USD + 4.00%), 05/01/2025 (a) | 248,704 | 238,446 | |||||||||
1,184,536 | |||||||||||
Communications - 11.7% | |||||||||||
| Arches Buyer, Inc. 3.75% (1 Month LIBOR USD + 3.25%), 12/06/2027 (a) | 498,747 | 498,158 | |||||||||
| Charter Communications Operating LLC 1.86% (1 Month LIBOR USD + 1.75%), 02/01/2027 (a) | 490,003 | 486,838 | |||||||||
| Clear Channel Outdoor Holdings, Inc. 3.69% (1 Month LIBOR USD + 3.50%), 08/21/2026 (a) | 246,859 | 241,305 | |||||||||
| CSC Holdings LLC 2.32% (1 Month LIBOR USD + 2.25%), 07/17/2025 (a) | 487,310 | 481,767 | |||||||||
| Intelsat Jackson Holdings SA 8.00% (Prime Rate + 4.75%), 11/27/2023 (a) | 500,000 | 509,168 | |||||||||
| Level 3 Parent LLC 1.85% (1 Month LIBOR USD + 1.75%), 03/01/2027 (a) | 337,328 | 332,531 | |||||||||
| SBA Senior Finance II LLC 1.86% (1 Month LIBOR USD + 1.75%), 04/11/2025 (a) | 475,300 | 471,835 | |||||||||
| Uber Technologies, Inc. 3.60% (1 Month LIBOR USD + 3.50%), 02/25/2027 (a) | 476,250 | 476,919 | |||||||||
| Zayo Group Holdings, Inc. 3.10% (1 Month LIBOR USD + 3.00%), 03/09/2027 (a) | 222,697 | 220,627 | |||||||||
3,719,148 | |||||||||||
Consumer, Cyclical - 18.7% | |||||||||||
| 1011778 BC ULC 1.85% (1 Month LIBOR USD + 1.75%), 11/19/2026 (a) | 329,132 | 325,172 | |||||||||
| American Airlines, Inc. 5.50% (3 Month LIBOR USD + 4.75%), 04/20/2028 (a) | 500,000 | 521,908 | |||||||||
| Bombardier Recreational Products, Inc. 2.10% (1 Month LIBOR USD + 2.00%), 05/24/2027 (a) | 239,526 | 237,056 | |||||||||
| Caesars Resort Collection LLC 2.85% (1 Month LIBOR USD + 2.75%), 12/23/2024 (a) | 482,500 | 478,946 | |||||||||
| ClubCorp Holdings, Inc. 2.90% (3 Month LIBOR USD + 2.75%), 09/18/2024 (a) | 482,500 | 464,652 | |||||||||
| HD Supply Waterworks 3.75% (1 Month LIBOR USD + 2.75%), 08/01/2024 (a) | 300,472 | 300,754 | |||||||||
| 3.75% (3 Month LIBOR USD + 2.75%), 08/01/2024 (a) | 198,236 | 198,423 | |||||||||
Security Description | Principal Amount | Fair Value | |||||||||
| Diamond Resorts International, Inc. 4.75% (1 Month LIBOR USD + 3.75%), 09/01/2023 (a) | $ | 497,429 | $ | 498,051 | |||||||
| Formula One Management Ltd. 3.50% (1 Month LIBOR USD + 2.50%), 02/01/2024 (a) | 500,000 | 498,555 | |||||||||
| Hilton Worldwide Finance LLC 1.84% (1 Month LIBOR USD + 1.75%), 06/22/2026 (a) | 461,991 | 458,773 | |||||||||
| Mileage Plus Holdings LLC 6.25%, 07/30/2027 (a) (b) | 500,000 | 534,660 | |||||||||
| Navistar, Inc. 3.60% (1 Month LIBOR USD + 3.50%), 11/06/2024 (a) | 241,875 | 242,359 | |||||||||
| Playa Resorts Holding BV 3.75% (1 Month LIBOR USD + 2.75%), 04/29/2024 (a) | 227,966 | 219,489 | |||||||||
| Scientific Games International, Inc. 2.85% (1 Month LIBOR USD + 2.75%), 08/14/2024 (a) | 486,181 | 483,278 | |||||||||
| SeaWorld Parks & Entertainment, Inc. 3.75% (1 Month LIBOR USD + 3.00%), 04/01/2024 (a) | 491,026 | 488,264 | |||||||||
5,950,340 | |||||||||||
Consumer, Non-cyclical - 9.5% | |||||||||||
| Alphabet Holding Co., Inc. 3.60% (1 Month LIBOR USD + 3.50%), 09/26/2024 (a) | 497,416 | 497,433 | |||||||||
| Avantor, Inc. 3.00% (1 Month LIBOR USD + 2.00%), 11/21/2024 (a) | 45,733 | 45,838 | |||||||||
| Bausch Health Americas, Inc. 3.10% (1 Month LIBOR USD + 3.00%), 06/02/2025 (a) | 361,401 | 360,250 | |||||||||
| Da Vinci Purchaser Holdings LP 5.00% (6 Months LIBOR USD + 4.00%), 01/08/2027 (a) | 496,241 | 498,489 | |||||||||
| Prestige Brands, Inc. 2.09% (1 Month LIBOR USD + 2.00%), 01/26/2024 (a) | 190,021 | 190,333 | |||||||||
| Sunshine Luxembourg VII Sarl 4.50% (3 Month LIBOR USD + 3.75%), 10/01/2026 (a) | 496,244 | 498,693 | |||||||||
| US Foods, Inc. 1.84% (1 Month LIBOR USD + 1.75%), 06/27/2023 (a) | 436,548 | 432,940 | |||||||||
| Verscend Holding Corp. 4.10% (1 Month LIBOR USD + 4.00%), 08/27/2025 (a) | 500,000 | 501,965 | |||||||||
3,025,941 | |||||||||||
Energy - 1.5% | |||||||||||
| Arch Coal, Inc. 3.75% (1 Month LIBOR USD + 2.75%), 03/07/2024 (a) | 239,975 | 225,177 | |||||||||
| Traverse Midstream Partners LLC 6.50% (1 Month LIBOR USD + 5.50%), 09/27/2024 (a) | 243,508 | 245,031 | |||||||||
470,208 | |||||||||||
Financial - 4.1% | |||||||||||
| Avolon TLB Borrower 1 US LLC 2.50% (1 Month LIBOR USD + 1.75%), 01/15/2025 (a) | 175,812 | 175,629 | |||||||||
| Deerfield Dakota Holding LLC 4.75% (1 Month LIBOR USD + 3.75%), 04/09/2027 (a) | 495,000 | 498,005 | |||||||||
See Notes to Financial Statements
B-4
PACIFIC GLOBAL ETFs
PACIFIC GLOBAL SENIOR LOAN ETF
Portfolio of Investments (Continued)
June 30, 2021
Security Description | Principal Amount | Fair Value | |||||||||
| HUB International Ltd. 2.93% (3 Month LIBOR USD + 2.75%), 04/25/2025 (a) | $ | 242,500 | $ | 240,097 | |||||||
| USI, Inc. 3.15% (3 Month LIBOR USD + 3.00%), 05/16/2024 (a) | 385,000 | 381,872 | |||||||||
1,295,603 | |||||||||||
Industrial - 21.3% | |||||||||||
| Apex Tool Group LLC 6.50% (1 Month LIBOR USD + 5.25%), 08/01/2024 (a) | 437,209 | 439,607 | |||||||||
| Brand Industrial Services, Inc. 5.25% (3 Month LIBOR USD + 4.25%), 06/21/2024 (a) | 486,076 | 478,860 | |||||||||
| Dynasty Acquisition Co., Inc. 3.70% (3 Month LIBOR USD + 3.50%), 04/06/2026 (a) | 319,484 | 311,697 | |||||||||
| Gardner Denver, Inc. 2.85% (1 Month LIBOR USD + 2.75%), 03/01/2027 (a) | 495,000 | 495,257 | |||||||||
| Gates Global LLC 3.50% (1 Month LIBOR USD + 2.75%), 03/31/2027 (a) | 236,509 | 236,304 | |||||||||
| GFL Environmental, Inc. 3.50% (3 Month LIBOR USD + 3.00%), 05/30/2025 (a) | 251,872 | 252,309 | |||||||||
| Graham Packaging Co., Inc. 3.75% (1 Month LIBOR USD + 3.00%), 08/04/2027 (a) | 488,606 | 488,745 | |||||||||
| Kloeckner Pentaplast of America, Inc. 5.25% (3 Month LIBOR USD + 4.75%), 02/12/2026 (a) | 498,750 | 502,491 | |||||||||
| Madison IAQ LLC 3.75%, 06/16/2028 (a) (b) | 500,000 | 500,860 | |||||||||
| Plastipak Holdings, Inc. 2.61% (1 Month LIBOR USD + 2.50%), 10/15/2024 (a) | 223,717 | 223,257 | |||||||||
| Pregis TopCo LLC 4.10% (1 Month LIBOR USD + 4.00%), 07/31/2026 (a) | 497,475 | 497,972 | |||||||||
| Proampac PG Borrower LLC 4.50% (1 Month LIBOR USD + 3.75%), 11/03/2025 (a) | 132,608 | 132,724 | |||||||||
| 4.50% (2 Months LIBOR USD + 3.75%), 11/03/2025 (a) | 236,049 | 236,255 | |||||||||
| 4.50% (3 Months LIBOR USD + 3.75%), 11/03/2025 (a) | 111,390 | 111,488 | |||||||||
| Quikrete Holdings, Inc. 2.60% (1 Month LIBOR USD + 2.50%), 02/01/2027 (a) | 484,219 | 480,587 | |||||||||
| RBS Global, Inc. 1.85% (1 Month LIBOR USD + 1.75%), 08/21/2024 (a) | 162,285 | 162,357 | |||||||||
| Reynolds Group Holdings, Inc. 2.85% (1 Month LIBOR USD + 2.75%), 02/06/2023 (a) | 164,135 | 163,956 | |||||||||
| Standard Aero Ltd. 3.70% (3 Month LIBOR USD + 3.50%), 04/06/2026 (a) | 171,766 | 167,579 | |||||||||
| Titan Acquisition Ltd. 3.17% (6 Month LIBOR USD + 3.00%), 03/28/2025 (a) | 486,180 | 478,758 | |||||||||
| TransDigm, Inc. 2.35% (1 Month LIBOR USD + 2.25%), 12/09/2025 (a) | 418,475 | 412,775 | |||||||||
6,773,838 | |||||||||||
Security Description | Principal Amount | Fair Value | |||||||||
Technology - 12.4% | |||||||||||
| Applied Systems, Inc. 3.75% (3 Months LIBOR USD + 3.25%), 09/19/2024 (a) | $ | 244,676 | $ | 244,463 | |||||||
5.50% (Prime + 2.25%), 09/19/2024 (a) | 539 | 539 | |||||||||
| athenahealth, Inc. 4.41% (3 Month LIBOR USD + 4.25%), 02/11/2026 (a) | 498,750 | 500,777 | |||||||||
| CCC Information Services, Inc. 4.00% (1 Month LIBOR USD + 3.00%), 04/29/2024 (a) | 236,907 | 237,165 | |||||||||
| Dun & Bradstreet Corp. 3.35% (1 Month LIBOR USD + 3.25%), 02/06/2026 (a) | 493,769 | 491,994 | |||||||||
| Epicor Software Corp. 4.00% (1 Month LIBOR USD + 3.25%), 07/30/2027 (a) | 496,250 | 496,297 | |||||||||
| Finastra USA, Inc. 4.50% (6 Month LIBOR USD + 3.50%), 06/13/2024 (a) | 247,293 | 243,809 | |||||||||
| McAfee LLC 3.85% (1 Month LIBOR USD + 3.75%), 09/30/2024 (a) | 214,334 | 214,616 | |||||||||
| ON Semiconductor Corp. 2.10% (1 Month LIBOR USD + 2.00%), 09/18/2026 (a) | 175,229 | 174,764 | |||||||||
| Sophia LP 3.90% (3 Month LIBOR USD + 3.75%), 10/07/2027 (a) | 497,500 | 498,537 | |||||||||
| Tempo Acquisition LLC 3.35% (1 Month LIBOR USD + 3.25%), 11/02/2026 (a) | 432,410 | 433,491 | |||||||||
| Ultimate Software Group, Inc. 3.85% (1 Month LIBOR USD + 3.75%), 05/04/2026 (a) | 246,859 | 247,322 | |||||||||
| Western Digital Corp. 1.84% (1 Month LIBOR USD + 1.75%), 04/28/2023 (a) | 145,784 | 145,953 | |||||||||
3,929,727 | |||||||||||
| Total Bank Loans (Cost $26,321,118) | 26,349,341 | ||||||||||
CORPORATE BONDS - 14.2% | |||||||||||
Communications - 0.8% | |||||||||||
| Sprint Communications, Inc. 6.00%, 11/15/2022 | 250,000 | 265,000 | |||||||||
Consumer, Cyclical - 7.3% | |||||||||||
| American Builders & Contractors Supply Co., Inc. 4.00%, 01/15/2028 (c) | 250,000 | 256,526 | |||||||||
| Cedar Fair LP 5.38%, 04/15/2027 | 500,000 | 515,743 | |||||||||
| Golden Nugget, Inc. 6.75%, 10/15/2024 (c) | 250,000 | 252,867 | |||||||||
| MajorDrive Holdings IV LLC 6.38%, 06/01/2029 (c) | 250,000 | 249,688 | |||||||||
| Scientific Games International, Inc. 5.000%, 10/15/2025 (c) | 250,000 | 258,789 | |||||||||
| Six Flags Entertainment Corp. 5.50%, 04/15/2027 (c) | 500,000 | 517,145 | |||||||||
| Viking Cruises Ltd. 7.00%, 02/15/2029 (c) | 250,000 | 260,835 | |||||||||
2,311,593 | |||||||||||
See Notes to Financial Statements
B-5
PACIFIC GLOBAL ETFs
PACIFIC GLOBAL SENIOR LOAN ETF
Portfolio of Investments (Continued)
June 30, 2021
Security Description | Principal Amount | Fair Value | |||||||||
Consumer, Non-cyclical - 2.6% | |||||||||||
| Ahern Rentals, Inc. 7.38%, 05/15/2023 (c) | $ | 250,000 | $ | 226,603 | |||||||
| Allied Universal Holdco LLC 9.75%, 07/15/2027 (c) | 250,000 | 275,625 | |||||||||
| JBS USA LUX SA/JBS USA Finance, Inc. 6.75%, 02/15/2028 (c) | 250,000 | 275,000 | |||||||||
| Teva Pharmaceutical Finance Netherlands III BV 2.20%, 07/21/2021 | 65,000 | 64,778 | |||||||||
842,006 | |||||||||||
Energy - 0.9% | |||||||||||
| Range Resources Corp. 9.25%, 02/01/2026 | 250,000 | 276,062 | |||||||||
Financial - 0.9% | |||||||||||
| Ally Financial, Inc. 5.75%, 11/20/2025 | 250,000 | 287,408 | |||||||||
Industrial - 1.7% | |||||||||||
| Sensata Technologies BV 5.63%, 11/01/2024 (c) | 250,000 | 278,591 | |||||||||
| TransDigm, Inc. 5.50%, 11/15/2027 | 250,000 | 260,938 | |||||||||
539,529 | |||||||||||
| Total Corporate Bonds (Cost $4,465,364) | 4,521,598 | ||||||||||
Security Description | Shares | Fair Value | |||||||||
CLOSED-END FUNDS - 0.1% | |||||||||||
Eagle Point Credit Co., Inc. | 1,905 | $ | 25,813 | ||||||||
| Total Closed-End Funds (Cost $28,529) | 25,813 | ||||||||||
SHORT TERM INVESTMENTS - 3.7% | |||||||||||
| First American Treasury Obligations Fund - Class X, 0.01% (d) | 1,168,783 | 1,168,783 | |||||||||
| Total Short Term Investments (Cost $1,168,783) | 1,168,783 | ||||||||||
| TOTAL INVESTMENTS - 100.9% (Cost $31,983,794) | 32,065,535 | ||||||||||
LIABILITIES IN EXCESS OF OTHER ASSETS - (0.9%) | (277,345 | ) | |||||||||
TOTAL NET ASSETS - 100.0% | $ | 31,788,190 | |||||||||
(a) Variable rate instrument. The interest rate shown reflects the rate in effect at June 30, 2021.
(b) The loan will settle after June 30, 2021 at which time the interest rate terms will be determined.
(c) Security exempt from registration under Rule 144A of the Securities Act of 1933. These securities may be resold in transactions exempt from registration to qualified institutional buyers.
(d) Seven-day yield as of June 30, 2021.
Glossary:
Ltd. - Private Limited Company
Plc - Public Limited Company
LP - Limited Partnership
LIBOR - London Interbank Offered Rate
USD - United States Dollar
See Notes to Financial Statements
B-6
PACIFIC GLOBAL ETFs
PACIFIC GLOBAL SENIOR LOAN ETF
Portfolio Allocations
June 30, 2021
Asset Type Allocation | |||||||
Bank Loans | 82.9 | % | |||||
Corporate Bonds | 14.2 | % | |||||
Short Term Investments | 3.7 | % | |||||
Closed-End Funds | 0.1 | % | |||||
Total Investments | 100.9 | % | |||||
Other Assets in Excess of Liabilities | (0.9 | )% | |||||
Net Assets | 100.0 | % | |||||
Sector Allocation | |||||||
Consumer, Cyclical | 26.0 | % | |||||
Industrial | 23.0 | % | |||||
Communications | 12.5 | % | |||||
Technology | 12.4 | % | |||||
Consumer, Non-cyclical | 12.1 | % | |||||
Financial | 5.0 | % | |||||
Short Term Investments | 3.7 | % | |||||
Basic Materials | 3.7 | % | |||||
Energy | 2.4 | % | |||||
Closed-End Funds | 0.1 | % | |||||
Total Investments | 100.9 | % | |||||
Other Assets in Excess of Liabilities | (0.9 | )% | |||||
Net Assets | 100.0 | % | |||||
Percentages indicated are based upon net assets.
Refer to the Fund's Portfolio of Investment in this annual report for a detailed listing of the Fund's holdings.
See Notes to Financial Statements
B-7
PACIFIC GLOBAL ETFs
STATEMENTS OF ASSETS AND LIABILITIES
JUNE 30, 2021
| Pacific Global Focused High Yield ETF | Pacific Global Senior Loan ETF | ||||||||||
ASSETS | |||||||||||
Investments in Securities, at Value* | $ | 24,082,512 | $ | 30,896,752 | |||||||
Short Term Investments, at Value* | 1,124,921 | 1,168,783 | |||||||||
Cash | — | 609,935 | |||||||||
Receivables for: | |||||||||||
Investments Sold | — | 47,074 | |||||||||
Dividends and Interest | 390,561 | 118,436 | |||||||||
Total Assets | 25,597,994 | 32,840,980 | |||||||||
LIABILITIES | |||||||||||
Payables for: | |||||||||||
Investment Advisory Fees | 8,191 | 17,790 | |||||||||
Investments Purchased | — | 1,035,000 | |||||||||
Total Liabilities | 8,191 | 1,052,790 | |||||||||
Commitments and Contingencies (See Note 2) | |||||||||||
NET ASSETS | $ | 25,589,803 | $ | 31,788,190 | |||||||
NET ASSETS CONSIST OF: | |||||||||||
Paid-in Capital | $ | 24,967,060 | $ | 32,401,879 | |||||||
Total Distributable Earnings (See Note 5) | 622,743 | (613,689 | ) | ||||||||
NET ASSETS | $ | 25,589,803 | $ | 31,788,190 | |||||||
Shares Outstanding (No Par Value, Unlimited Shares Authorized) | 1,000,000 | 650,000 | |||||||||
Net Asset Value, Price Per Share | 25.59 | 48.90 | |||||||||
*Identified Cost: | |||||||||||
Investments in Securities | $ | 23,410,773 | $ | 30,815,011 | |||||||
Short Term Investments | 1,124,921 | 1,168,783 | |||||||||
See Notes to Financial Statements
C-1
PACIFIC GLOBAL ETFs
STATEMENTS OF OPERATIONS
FOR THE YEAR ENDED JUNE 30, 2021
| Pacific Global Focused High Yield ETF | Pacific Global Senior Loan ETF | ||||||||||
INVESTMENT INCOME | |||||||||||
Interest | $ | 1,173,402 | $ | 1,097,421 | |||||||
Dividends | — | 359 | |||||||||
Foreign Taxes Withheld | — | (285 | ) | ||||||||
Total Investment Income | 1,173,402 | 1,097,495 | |||||||||
EXPENSES | |||||||||||
Investment Advisory Fees | 105,382 | 201,085 | |||||||||
Total Expenses | 105,382 | 201,085 | |||||||||
NET INVESTMENT INCOME (LOSS) | 1,068,020 | 896,410 | |||||||||
REALIZED & UNREALIZED GAIN (LOSS) ON INVESTMENTS | |||||||||||
Net Realized Gain (Loss) On: | |||||||||||
Investments in Securities | 257,647 | (23,314 | ) | ||||||||
Net Change in Unrealized Appreciation (Depreciation) On: | |||||||||||
Investments in Securities | 2,393,655 | 1,513,865 | |||||||||
NET REALIZED AND UNREALIZED GAIN (LOSS) ON INVESTMENTS | 2,651,302 | 1,490,551 | |||||||||
NET INCREASE (DECREASE) IN NET ASSETS RESULTING FROM OPERATIONS | $ | 3,719,322 | $ | 2,386,961 | |||||||
See Notes to Financial Statements
C-2
PACIFIC GLOBAL ETFs
STATEMENTS OF CHANGES IN NET ASSETS
| Pacific Global Focused High Yield ETF | Pacific Global Senior Loan ETF | ||||||||||||||||||
| Year Ended June 30, 2021 | Period Ended June 30, 2020 (1) | Year Ended June 30, 2021 | Year Ended June 30, 2020 (2) | ||||||||||||||||
OPERATIONS | |||||||||||||||||||
Net Investment Income (Loss) | $ | 1,068,020 | $ | 897,569 | $ | 896,410 | $ | 1,142,713 | |||||||||||
Net Realized Gain (Loss) on Investments | 257,647 | (350,801 | ) | (23,314 | ) | (66,878 | ) | ||||||||||||
Net Change in Unrealized Appreciation (Depreciation) on Investments | 2,393,655 | (1,721,916 | ) | 1,513,865 | (1,259,441 | ) | |||||||||||||
Net Increase (Decrease) in Net Assets Resulting From Operations | 3,719,322 | (1,175,148 | ) | 2,386,961 | (183,606 | ) | |||||||||||||
DISTRIBUTIONS TO SHAREHOLDERS | |||||||||||||||||||
From Earnings | (1,114,770 | ) | (806,661 | ) | (953,333 | ) | (1,145,455 | ) | |||||||||||
Total Distributions to Shareholders | (1,114,770 | ) | (806,661 | ) | (953,333 | ) | (1,145,455 | ) | |||||||||||
CAPTIAL SHARE TRANSACTIONS | |||||||||||||||||||
Proceeds from Shares Sold | — | 27,517,740 | 2,443,495 | — | |||||||||||||||
Payments for Shares Redeemed | (2,550,680 | ) | — | — | — | ||||||||||||||
Net Increase (Decrease) in Net Assets Derived from Capital Shares Transactions (a) | (2,550,680 | ) | 27,517,740 | 2,443,495 | — | ||||||||||||||
Total Increase (Decrease) in Net Assets | 53,872 | 25,535,931 | 3,877,123 | (1,329,061 | ) | ||||||||||||||
NET ASSETS: | |||||||||||||||||||
Beginning of Period | $ | 25,535,931 | $ | — | $ | 27,911,067 | $ | 29,240,128 | |||||||||||
End of Period | $ | 25,589,803 | $ | 25,535,931 | $ | 31,788,190 | $ | 27,911,067 | |||||||||||
(a) Summary of Capital Share Transactions is as Follows: | |||||||||||||||||||
Shares Sold | — | 1,100,000 | 50,000 | — | |||||||||||||||
Shares Redeemed | (100,000 | ) | — | — | — | ||||||||||||||
NET INCREASE (DECREASE) | (100,000 | ) | 1,100,000 | 50,000 | — | ||||||||||||||
(1) Commencement of operations on October 23, 2019.
(2) Shares of Perdecessor Fund converted into Fund Shares at the close of business on December 27, 2019.
See Notes to Financial Statements
C-3
PACIFIC GLOBAL ETFs
FINANCIAL HIGHLIGHTS
| Pacific Global Focused High Yield ETF | |||||||||||
| Year Ended June 30, 2021 | Period Ended June 30, 2020 (1) | ||||||||||
Net Asset Value, Beginning of Period | $ | 23.21 | $ | 25.00 | |||||||
Income (Loss) from Investment Operations: | |||||||||||
Net Investment Income (Loss) (2) | 0.99 | 0.83 | |||||||||
Net Gain (Loss) on Investments (Realized and Unrealized) | 2.43 | (1.89 | ) | ||||||||
Total from Investment Operations | 3.42 | (1.06 | ) | ||||||||
Less Distributions: | |||||||||||
From Net Investment Income | (1.04 | ) | (0.73 | ) | |||||||
Total Distributions | (1.04 | ) | (0.73 | ) | |||||||
Capital Share Transactions: | |||||||||||
Total Capital Transactions | — | — | |||||||||
Net Asset Value, End of Period | $ | 25.59 | $ | 23.21 | |||||||
Net Asset Value Total Return | 14.90 | % | -4.23 | % (3) | |||||||
Ratio / Supplemental Data: | |||||||||||
Net Assets, End of Period (000's) | $ | 25,590 | $ | 25,536 | |||||||
Ratio of Expenses to Average Net Assets | 0.39 | % | 0.39 | % (4) | |||||||
Ratio of Net Investment Income (Loss) to Average Net Assets | 3.95 | % | 5.06 | % (4) | |||||||
Portfolio Turnover Rate (5) | 25 | % | 13 | % (3) | |||||||
(1) Commencement of operations on October 23, 2019.
(2) Calculated based on average shares outstanding during the period.
(3) Not annualized.
(4) Annualized.
(5) In-kind transactions are not included in portfolio turnover calculations.
See Notes to Financial Statements
C-4
PACIFIC GLOBAL ETFs
FINANCIAL HIGHLIGHTS (Continued)
Pacific Global Senior Loan ETF (formerly Pacific Asset Enhanced Floating Rate ETF) | |||||||||||||||||||||||
| Year Ended June 30, 2021 | Year Ended June 30, 2020 | Year Ended June 30, 2019 | Year Ended June 30, 2018 | Year Ended June 30, 2017 | |||||||||||||||||||
Net Asset Value, Beginning of Period | $ | 46.52 | $ | 48.73 | $ | 48.87 | $ | 49.35 | $ | 48.73 | |||||||||||||
Income (Loss) from Investment Operations: | |||||||||||||||||||||||
Net Investment Income (1) | 1.47 | 1.90 | 2.10 | 1.78 | 1.73 | ||||||||||||||||||
Net Gain (Loss) on Investments (Realized and Unrealized) | 2.47 | (2.20 | ) | (0.15 | ) | (0.63 | ) | 0.58 | |||||||||||||||
Total from Investment Operations | 3.94 | (0.30 | ) | 1.95 | 1.15 | 2.31 | |||||||||||||||||
Less Distributions: | |||||||||||||||||||||||
From Net Investment Income | (1.56 | ) | (1.91 | ) | (2.09 | ) | (1.63 | ) | (1.69 | ) | |||||||||||||
Total Distributions | (1.56 | ) | (1.91 | ) | (2.09 | ) | (1.63 | ) | (1.69 | ) | |||||||||||||
Capital Share Transactions: | |||||||||||||||||||||||
Net Asset Value, End of Period | $ | 48.90 | $ | 46.52 | $ | 48.73 | $ | 48.87 | $ | 49.35 | |||||||||||||
Net Asset Value Total Return | 8.63 | % | -0.70 | % | 4.09 | % | 2.36 | % | 4.78 | % | |||||||||||||
Ratio / Supplemental Data: | |||||||||||||||||||||||
Net Assets, End of Period (000's) | $ | 31,788 | $ | 27,911 | $ | 29,240 | $ | 29,323 | $ | 27,143 | |||||||||||||
Ratio of Expenses to Average Net Assets | 0.68 | % | 1.06 | % | 1.63 | % | 1.62 | % | 1.39 | % | |||||||||||||
| Expenses After Advisory Fees (Waived) and Other Fees (Reimbursed)/Recouped (2) | 0.68 | % | 0.86 | % | 1.10 | % | 1.10 | % | 1.10 | % | |||||||||||||
| Ratio of Net Investment Income (Loss) to Average Net Assets | 3.04 | % | 3.98 | % | 4.31 | % | 3.61 | % | 3.49 | % | |||||||||||||
Portfolio Turnover Rate (3) | 35 | % | 48 | % | 70 | % | 73 | % | 52 | % | |||||||||||||
(1) Calculated based on average shares outstanding during the period.
(2) As of December 30, 2019, the expense ratio for the Fund changed from 1.10% (as a result of an expense cap in place for for the Predecessor Fund) to 0.68%
(3) In-kind transactions are not included in portfolio turnover calculations.
See Notes to Financial Statements
C-5
PACIFIC GLOBAL ETFs
NOTES TO FINANCIAL STATEMENTS
NOTE 1—ORGANIZATION
Pacific Global ETF Trust (the "Trust"), organized as a Delaware statutory trust on June 26, 2018, consists of 2 investment series: Pacific Global Focused High Yield ETF ("FJNK") and Pacific Global Senior Loan ETF ("FLRT") (each, a "Fund" and, collectively, the "Funds"). The Trust is registered with the Securities and Exchange Commission ("SEC") under the Investment Company Act of 1940, as amended (the "1940 Act"), as an open-end management investment company and the continuous offering of the Funds' shares is registered under the Securities Act of 1933, as amended (the "Securities Act").
FJNK is a diversified fund of the Trust. FJNK pays the Adviser a unitary fee at an annual rate of 0.39% of average daily net assets, out of which the Adviser will pay substantially all operating expenses of FJNK excluding interest expenses, taxes, acquired fund fees and expenses, brokerage fees, extraordinary expenses, fees payable pursuant to a Rule 12b-1 plan, if any, and costs of shareholder meetings, litigation, and indemnification. The investment objective of FJNK is to seek income and long-term growth of capital.
FLRT, a diversified fund of the Trust, is the successor in interest to AdvisorShares Pacific Asset Enhanced Floating Rate ETF (the "Predecessor Fund") and has the same investment objective as the Predecessor Fund. The Predecessor Fund was a series of AdvisorShares Trust, and was advised by AdvisorShares Investments, LLC (the "Previous Adviser"). Pacific Global Advisors LLC (the "Adviser") replaced the Previous Adviser as investment adviser of FLRT. At a special meeting on December 26, 2019, the shareholders of the Predecessor Fund approved the tax-free reorganization of the Predecessor Fund into the Pacific Global ETF Trust. Effective as of the close of business on December 27, 2019, the assets and liabilities of the Predecessor Fund were transferred to the Trust in exchange for shares of the Pacific Global Senior Loan ETF. For financial reporting purposes, assets received and shares issued by FLRT were recorded at fair value; however, the cost basis of the investments received from the Predecessor Fund was carried forward to align ongoing reporting of FLRT's realized and unrealized gains and losses with amounts distributable to shareholders for tax purposes. FLRT pays the Adviser a unitary fee at an annual rate of 0.68% of average daily net assets, out of which the Adviser will pay substantially all operating expenses of FLRT excluding interest expenses, taxes, acquired fund fees and expenses, brokerage fees, extraordinary expenses, fees payable pursuant to a Rule 12b-1 plan, if any, and costs of shareholder meetings, litigation, and indemnification. The fiscal year end of the Predecessor Fund was June 30. Operations prior to the close of business on December 27, 2019 were for the Predecessor Fund. The investment objective of FLRT is to provide a high level of current income. The inception date of the Predecessor Fund was February 18, 2015. The Pacific Global Senior Loan ETF has been managed as single integrated portfolio since the acquisition was completed.
NOTE 2—SIGNIFICANT ACCOUNTING POLICIES
The Funds are investment companies. Accordingly, the Funds follow the investment company accounting and reporting guidance of the Financial Accounting Standards Board ("FASB") Accounting Standards codification Topic 946 Financial Services-Investment Companies.
The following is a summary of significant accounting policies consistently followed by the Funds. These policies are in conformity with accounting principles generally accepted in the United States of America ("U.S. GAAP").
A. SECURITIES VALUATION
All equity securities, including domestic and foreign common stocks, preferred stocks, and exchange traded funds that are traded on a national securities exchange, except those listed on the Nasdaq Global Market®, Nasdaq Global Select Market® and Nasdaq Capital Market Exchange® (collectively "Nasdaq"), are valued at the last reported sale price on the exchange on which the security is principally traded. Securities traded on Nasdaq will be valued at the Nasdaq Official Closing Price ("NOCP"). If, on a particular day, an exchange traded or Nasdaq security does not trade, then the mean between the most recent quoted bid and asked prices will be used. All equity securities that are not traded on a listed exchange are valued at the last sale price in the over-the-counter market. If a non-exchange traded security does not trade on a particular day, then the mean between the last quoted closing bid and asked price will be used. Prices denominated in foreign currencies are converted to U.S. dollar equivalents at the current exchange rate, which approximates fair value.
Market values for domestic and foreign fixed income securities are normally determined on the basis of valuations provided by independent pricing services. Vendors typically value such securities based on one or more inputs. These inputs may include executed transactions in securities of the issuer or comparable issuers, market price quotations (where observable), bond spreads, and fundamental data relating to the issuer. In addition, the model may incorporate market observable data such as reported sales of similar securities, broker quotes, yields, bids, offers, and reference data. Certain securities are valued principally using dealer quotations. These classifications are not exclusive, and any of the inputs may be used to value any other class of fixed-income securities. Securities that use similar valuation techniques and inputs as described before are categorized as Level 2 of the fair value hierarchy. To the extent the significant inputs are unobservable, the values generally would be categorized as Level 3. Assets and liabilities may be transferred between levels.
Short-term securities, including repurchase agreements, that have maturities of less than 60 days at the time of purchase, are valued at amortized cost, which, when combined with accrued interest, approximates fair value.
Securities for which quotations are not readily available are valued by the investment adviser or the applicable sub-adviser at their respective fair values in accordance with pricing procedures adopted by the Trust's Board of Trustees (the "Board"). When a security is fair valued, consideration is given to the facts and circumstances relevant to the particular situation, including a review of various factors set forth in the pricing procedures adopted by the Board. The use of fair value pricing by the Funds may cause the net asset value ("NAV") of its shares to differ significantly from the NAV that would be calculated without regard to such considerations.
D-1
PACIFIC GLOBAL ETFs
NOTES TO FINANCIAL STATEMENTS (Continued)
Various inputs may be used to determine the value of the Funds' investments. These inputs are summarized in three broad levels for financial statement purposes. The inputs or methodologies used to value securities are not necessarily an indication of the risk associated with investing in those securities.
• Level 1 - Quoted prices in active markets for identical securities.
• Level 2 - Other significant observable inputs (including quoted prices for similar securities, interest rates, prepayment speeds, credit risk, etc.).
• Level 3 - Significant unobservable inputs (including the Funds' own assumptions used to determine the fair value of investments).
The following table summarizes the market value of the Funds' investments as of June 30, 2021, based on the inputs used to value them:
Pacific Global Focused High Yield ETF
Assets | Level 1 | Level 2 | Level 3 | Total | |||||||||||||||
Corporate Bonds | $ | — | $ | 20,764,048 | $ | — | $ | 20,764,048 | |||||||||||
Foreign Bonds | — | 3,318,464 | — | 3,318,464 | |||||||||||||||
Short Term Investments | 1,124,921 | — | — | 1,124,921 | |||||||||||||||
Total | $ | 1,124,921 | $ | 24,082,512 | $ | — | $ | 25,207,433 | |||||||||||
Pacific Global Senior Loan ETF
Assets | Level 1 | Level 2 | Level 3 | Total | |||||||||||||||
Bank Loans | $ | — | $ | 26,349,341 | $ | — | $ | 26,349,341 | |||||||||||
Corporate Bonds | — | 4,521,598 | — | 4,521,598 | |||||||||||||||
Closed-End Funds | 25,813 | — | — | 25,813 | |||||||||||||||
Short Term Investments | 1,168,783 | — | — | 1,168,783 | |||||||||||||||
Total | $ | 1,194,596 | $ | 30,870,939 | $ | — | $ | 32,065,535 | |||||||||||
B. FOREIGN CURRENCY
Investment securities and other assets and liabilities denominated in foreign currencies are translated into U.S. dollar amounts at the date of valuation. Purchases and sales of investment securities and income and expense items denominated in foreign currencies are translated into U.S. dollar amounts on the respective dates of such transactions. The Funds do not isolate the portion of the results of operations resulting from changes in foreign exchange rates on investments and currency gains or losses realized between the trade and settlement dates on securities transactions from the fluctuations arising from changes in market prices of securities held. Such fluctuations are included with the net realized and unrealized gain or loss on investments. The Funds report net realized foreign exchange gains or losses that arise from sales of foreign currencies, currency gains or losses realized between the trade and settlement dates on foreign currency transactions, and the difference between the amounts of dividends, interest, and foreign withholding taxes recorded on the Funds' books and the U.S. dollar equivalent of the amounts actually received or paid. Net unrealized foreign exchange gains and losses arise from changes in the values of assets and liabilities, other than investments in securities at fiscal period end, resulting from changes in exchange rates.
C. FEDERAL INCOME TAXES
The Funds' policy is to comply with the provisions of Subchapter M of the Internal Revenue Code of 1986, as amended, applicable to regulated investment companies, and to distribute substantially all of its net investment income and net capital gains to shareholders. Therefore, no federal income tax provision is required.
The Funds recognize the tax benefits of uncertain tax positions only when the position is more likely than not to be sustained. Management has analyzed the Funds' uncertain tax positions and concluded that no liability for unrecognized tax benefits should be recorded related to uncertain tax positions. Management is not aware of any tax positions for which it is reasonably possible that the total amounts of unrecognized tax benefits will change materially in the next 12 months. Income and capital gain distributions are determined in accordance with federal income tax regulations, which may differ from U.S. GAAP. The Funds recognize interest and penalties, if any, related to unrecognized tax benefits on uncertain tax positions as income tax expenses in the Statements of Operations. During the period ended June 30, 2021, the Funds did not incur any interest or penalties.
D. SECURITY TRANSACTIONS AND INVESTMENT INCOME
Investment transactions are accounted for on the trade date. Gains and losses realized on sales of securities are determined on a specific identification basis. Dividend income is recorded on the ex-dividend date. Interest income is recorded on an accrual basis. Withholding taxes on foreign dividends have been provided for in accordance with the Funds' understanding of the applicable tax rules and regulations.
E. DISTRIBUTIONS TO SHAREHOLDERS
Distributions to shareholders from net investment income are declared and paid by FJNK and FLRT on a monthly basis. Distributions to shareholders from capital gains will be declared and paid at least annually. Distributions are recorded on the ex-dividend date.
D-2
PACIFIC GLOBAL ETFs
NOTES TO FINANCIAL STATEMENTS (Continued)
F. USE OF ESTIMATES
The preparation of financial statements in conformity with U.S. GAAP requires management to make estimates and assumptions that affect the reported amounts of assets and liabilities and disclosure of contingent assets and liabilities at the date of the financial statement, as well as the reported amount of revenues and expenses during the reporting period. Actual results could differ from those estimates.
G. SHARE VALUATION
The NAV per share of a Fund is calculated by dividing the sum of the value of the securities held by the Fund, plus cash and other assets, minus all liabilities (including estimated accrued expenses) by the total number of outstanding shares for the Fund, rounded to the nearest cent. The Funds' shares will not be priced on the days on which the New York Stock Exchange, Inc. ("NYSE") is closed for trading. The offering and redemption price per share of a Fund in Creation Unit transactions is equal to the Fund's NAV per share.
H. GUARANTEES AND INDEMNIFICATIONS
In the normal course of business, the Trust, on behalf of the Funds, enters into contracts with service providers that contain general indemnification clauses. The Funds' maximum exposure under these arrangements is unknown as this would involve future claims that may be made against the Funds that have not yet occurred. However, based on experience, the Funds expects the risk of loss to be remote.
I. SUBSEQUENT EVENTS
In preparing these financial statements, management has evaluated events and transactions for potential recognition or disclosure through the date the financial statements were issued. Except for what is listed below, there were no other events or transactions that occurred during the period subsequent to June 30, 2021 that materially impacted the amounts or disclosures in the Funds' financial statements.
On July 7, 2021, Foreside Fund Services, LLC ("Foreside"), the Fund's distributor, announced that it had entered into a definitive purchase and sale agreement with Genstar Capital ("Genstar") such that Genstar would acquire a majority stake in Foreside. The transaction is expected to close at the end of the third quarter of 2021. Foreside will remain the Funds' distributor at the close of the transaction, subject to Board approval.
On June 25, 2021, the Board of Trustees of the Funds approved the liquidation of FJNK. Shareholder of the Fund received a final distribution payment, equal to the amount of the net asset value of their shares, on August 5, 2021.
On August 12, 2021, the Board of Trustees of the Funds approved the re-organization of FLRT into a new series of the Pacer Funds Trust. Subject to shareholder approval, the re-organization of the Fund is expected to close at the end of the third quarter 2021.
NOTE 3—COMMITMENTS AND OTHER RELATED PARTY TRANSACTIONS
Pacific Global Advisors LLC acts as the investment adviser to the Funds. Pursuant to the management agreement between the Trust and the Adviser with respect to the Funds (the "Management Agreement") and subject to the oversight of the Board, the Adviser provides services reasonably necessary for the operation of the Funds, including audit, portfolio accounting, legal, transfer agency, custody, printing costs and certain distribution-related services (pursuant to separate agreements), under what is essentially an all-in fee. The Funds may bear other expenses which are not covered under the Management Agreement that may vary and will affect the total level of expenses paid by the Funds such as taxes and government fees, brokerage fees, commissions and other transaction expenses, costs of borrowing money, including interest expenses, certain custody expenses and extraordinary expenses (such as litigation and indemnification expenses). Pursuant to the Management Agreement, and subject to the Board's approval, the Adviser is authorized to delegate the day-to-day management of the Funds' investment program. The Adviser has appointed Pacific Asset Management LLC as sub-adviser (the "Sub-Adviser") to manage the FJNK and FLRT investment programs. The Adviser oversees and monitors the nature and quality of the services provided by the Sub-Advisers, including investment performance and execution of investment strategies. The Adviser performs compliance monitoring services to help the Funds maintain compliance with applicable laws and regulations and provides services related to, among others, the valuation of Funds securities, risk management and oversight of trade execution and brokerage services. For services provided to the Funds, the Funds pay the Adviser at an annual rate based on each Fund's average daily net assets. See the Statements of Operations for the advisory fees paid by each Fund. The advisory fee rates paid to the Adviser are as follows:
Fund | Annual Rate of Average Daily Net Assets | ||||||
Pacific Global Focused High Yield ETF | 0.39 | % | |||||
Pacific Global Senior Loan ETF | 0.68 | % | |||||
The Predecessor Fund to FLRT was obligated to pay its investment adviser, AdvisorShares Investments, LLC, an annual rate of 0.95% based on the average daily net assets. Subsequent to business close on December 27, 2019, the annual rate in which FLRT was obligated to pay its investment adviser decreased to 0.68% of average daily net assets. The Previous Adviser contractually agreed to limit certain expenses of the Predecessor Fund's ordinary operating expenses so that its ratio of such expenses to average net assets would not exceed 1.10%. The Previous Adviser does not have the ability to recoup amounts previously waived for the Predecessor Fund.
U.S. Bancorp Fund Services, LLC, doing business as U.S. Bank Global Fund Services ("Fund Services" or the "Administrator") acts as the Funds' Administrator and, in that capacity, performs various administrative and accounting services for the Funds. The Administrator prepares various federal and state regulatory filings, reports and returns for the Funds, including regulatory compliance monitoring and financial reporting;
D-3
PACIFIC GLOBAL ETFs
NOTES TO FINANCIAL STATEMENTS (Continued)
prepares certain reports and materials to be supplied to the Board; and monitors the activities of the Funds' Custodian, transfer agent and accountants. Fund Services also serves as the transfer agent and fund accountant to the Funds. U.S. Bank N.A. (the "Custodian"), an affiliate of Fund Services, serves as the Funds' Custodian.
Foreside Fund Services, LLC (the "Distributor") acts as the Funds' principal underwriter in a continuous public offering of the Funds' shares.
Each of the Trustees who are not "interested persons" as that term is defined in the 1940 Act ("Independent Trustees") will receive a fee of $10,000 per year, the amount set forth in the Statement of Additional Information for the Funds, from Pacific Global Advisors LLC, out of its unitary fee received from the Trust, as compensation for their service on the Board of the Trust. Additionally, no interested Trustee or officer of the Trust shall receive any compensation from the Trust. The Independent Trustees are paid on a quarterly basis. For the most recently completed fiscal year ended June 30, 2021, the Independent Trustees received $30,000 as a group.
NOTE 4—PURCHASES AND SALES OF SECURITIES
During the year ended June 30, 2021, purchases and sales of securities by the Funds, excluding short-term securities and in-kind transactions were as follows:
Fund | Purchases | Sales | |||||||||
Pacific Global Focused High Yield ETF | $ | 6,458,235 | $ | 8,500,064 | |||||||
Pacific Global Senior Loan ETF | 12,324,842 | 9,884,006 | |||||||||
During the year ended June 30, 2021, there were no purchases or sales of U.S. Government securities.
During the year ended June 30, 2021, there were no in-kind security transaction associated with creations and redemptions.
NOTE 5—INCOME AND TAX INFORMATION
The components of tax basis cost of investments and net unrealized appreciation (depreciation) for federal income tax purposes as of June 30, 2021, were as follows:
Pacific Global Focused High Yield ETF | Pacific Global Senior Loan ETF | ||||||||||
Tax costs of investments | $ | 24,512,504 | $ | 31,983,794 | |||||||
Gross tax unrealized appreciation | 940,017 | 238,933 | |||||||||
Gross tax unrealized depreciation | (245,088 | ) | (157,192 | ) | |||||||
Net unrealized appreciation (depreciation) | 694,929 | 81,741 | |||||||||
Undistributed ordinary income | 16,354 | 22,252 | |||||||||
Undistributed long-term gain (loss) | — | — | |||||||||
Total distributable earnings | 16,354 | 22,252 | |||||||||
Other accumulated gain (loss) | (88,540 | ) | (717,682 | ) | |||||||
Total accumulated gain (loss) | $ | 622,743 | $ | (613,689 | ) | ||||||
U.S. GAAP requires that certain components of net assets relating to permanent differences be reclassified between financial and tax reporting. These reclassifications have no effect on net assets or NAV per share. The permanent differences are primarily related to adjustments for amortization from ASU 2017-08, non-Real Estate Investment Trust return of capital, and paydowns. For the year ended June 30, 2021, the following table shows the reclassifications made:
Fund | Undistributed (Accumulated) Net Investment Income (Loss) | Accumulated Net Realized Gain (Loss) | Paid-in Capital | ||||||||||||
Pacific Global Focused High Yield ETF | $ | (4,614 | ) | $ | 4,614 | $ | — | ||||||||
Pacific Global Senior Loan ETF | (8,720 | ) | 8,720 | — | |||||||||||
During the period ended June 30, 2021, the following Fund realized the following net capital gains resulting from in-kind redemptions, in which shareholders exchanged Fund shares for securities held by the fund rather than for cash. Because such gains are not taxable to the Fund, and are not distributed to shareholders, they have been reclassified from accumulated net realized gain (loss) to paid-in capital. For the year ended June 30, 2021, there were no reclassifications made.
As of June 30, 2021, the Funds deferred, on a tax-basis, no post-October or late year ordinary losses.
As of June 30, 2021, the following Funds have capital loss carryforwards available to offset future gains of:
Fund | Short-Term (No Expiration) | Long-Term (No Expiration) | Total | ||||||||||||
Pacific Global Focused High Yield ETF | $ | 88,540 | $ | — | $ | 88,540 | |||||||||
Pacific Global Senior Loan ETF | 315,620 | 402,062 | 717,682 | ||||||||||||
D-4
PACIFIC GLOBAL ETFs
NOTES TO FINANCIAL STATEMENTS (Continued)
The tax character of distributions for the following Funds were as follows:
| Period ended June 30, 2021 | Period ended June 30, 2020 | ||||||||||||||||||
Fund | Ordinary Income | Long Term Capital Gain | Ordinary Income | Long Term Capital Gain | |||||||||||||||
Pacific Global Focused High Yield ETF | $ | 1,114,770 | $ | — | $ | 806,661 | $ | — | |||||||||||
Pacific Global Senior Loan ETF(1) | 953,333 | — | 1,145,455 | — | |||||||||||||||
NOTE 6—SHARE TRANSACTIONS
Shares of the Funds are purchased and sold on both a primary market and secondary market. With respect to the secondary market, shares of the Funds are listed on NYSE Arca, Inc. (the "Exchange") and because Shares trade at market prices rather than NAV, Shares of the Funds may trade at a price greater than or less than NAV. With respect to the primary market, the Funds issue and redeem shares on a continuous basis at NAV generally in blocks of 50,000 or 100,000 shares called "Creation Units." Creation Unit transactions are expected to be conducted in exchange for a specified amount of cash totaling the NAV of the Creation Unit(s). Once created, shares generally trade in the secondary market at market prices that change throughout the trading day. Except when aggregated in Creation Units, shares are not redeemable securities of the Funds. Creation Units may only be purchased or redeemed by certain financial institutions ("Authorized Participants"). An Authorized Participant is either (i) a broker-dealer or other participant in the clearing process through the Continuous Net Settlement System of the National Securities Clearing Corporation or (ii) a Depository Trust Company participant and, in each case, must have executed an authorized participant agreement with the Distributor. Most retail investors do not qualify as Authorized Participants nor have the resources to buy and sell whole Creation Units. Therefore, they are unable to purchase or redeem shares directly from the Funds. Rather, retail investors may purchase shares in the secondary market with the assistance of a broker and such purchases are subject to customary brokerage commissions or fees.
Each Fund currently offers one class of shares, which has no front-end sales load, no deferred sales charge, and no redemption fee. A fixed transaction fee is imposed for the transfer and other transaction costs associated with the purchase or sale of Creation Units. The standard fixed transaction fees for the Funds are as follows and are payable to the Custodian.
Pacific Global Focused High Yield ETF - $500
Pacific Global Senior Loan ETF - $250
The fixed transaction fee may be waived on certain orders if the Funds' Custodian has determined to waive some or all of the costs associated with the order, or another party, such as the Adviser, has agreed to pay such fee. Transaction fees received by the Funds, if any, are displayed in the Capital Share Transactions section of each Statement of Changes in Net Assets. The Funds may issue an unlimited number of shares of beneficial interest, with no par value. Shares of the Funds have equal rights and privileges.
NOTE 7—BENEFICIAL OWNERSHIP
The beneficial ownership, either directly or indirectly, of 25% or more of the voting securities of a fund creates a presumption of control of a fund, under Section 2(a)(9) of the 1940 Act. As of June 30, 2021, Pacific Life Insurance Company, the Adviser's indirect parent company, owned shares of each Fund as follows:
Fund | Shares Owned | Percent of Shares Outstanding | |||||||||
Pacific Global Focused High Yield ETF | 994,200 | 99.42 | % | ||||||||
Pacific Global Senior Loan ETF | 499,950 | 76.92 | % | ||||||||
NOTE 8—CREDIT FACILITY
The Funds had a line of credit in the amount of $10,000,000, which had a one-year term and was reviewed annually by the Board. This uncommitted, secured line of credit was intended to provide short-term financing, if necessary, subject to certain restrictions, in connection with shareholder redemptions. The line of credit shall bear interest at a rate per annum equal to the Prime Rate, which interest shall be payable monthly. There are no commitment fees associated with this line of credit. The credit facility was with the Funds' custodian, U.S. Bank, N.A. As of April 26, 2021, the line of credit matured and was terminated. From July 1, 2020 through April 26, 2021, the Funds had not utilized the line of credit.
NOTE 9—PRINCIPAL RISKS
There is no assurance that the Funds will meet their investment objective. The value of your investment in the Funds, as well as the amount of return you receive on your investment in the Funds, may fluctuate significantly. You may lose part or all of your investment in the Funds or your investment may not perform as well as other similar investments. Therefore, you should consider carefully the following risks before investing in the Funds. An investment in the Funds is not a bank deposit and is not insured or guaranteed by the FDIC or any government agency. The following list describes certain risks of investing in the Funds but is not exhaustive. Refer to each Fund's current Prospectus for more detail regarding each Fund's risks.
D-5
PACIFIC GLOBAL ETFs
NOTES TO FINANCIAL STATEMENTS (Continued)
Active Management Risk. The Funds are actively managed, which means that investment decisions are made based on investment views. There is no guarantee that the investment views will produce the desired results or expected returns, which may cause the Funds to fail to meet their investment objective or to underperform their benchmark index or funds with similar investment objectives and strategies. Furthermore, active trading that can accompany active management may result in high portfolio turnover, which may have a negative impact on performance. Active trading may result in higher brokerage costs or mark-up charges, which are ultimately passed on to shareholders of the Funds. Active trading may also result in adverse tax consequences.
Authorized Participant Concentration Risk. Only an Authorized Participant may engage in creation or redemption transactions directly with the Fund, and none of those Authorized Participants is obligated to engage in creation and/or redemption transactions. The Fund has a limited number of institutions that may act as Authorized Participants on an agency basis (i.e., on behalf of other market participants). To the extent that Authorized Participants exit the business or are unable to proceed with creation or redemption orders with respect to the Fund and no other Authorized Participant is able to step forward to create or redeem Creation Units (as defined in the Purchase and Sale of Fund Shares section of the Prospectus), Fund shares may be more likely to trade at a premium or discount to NAV and possibly face trading halts or delisting.
Bank Loan Risk. The market for bank loans may lack liquidity and the Fund may have difficulty selling them. These investments expose the Fund to the credit risk of both the financial institution and the underlying borrower.
Credit Risk. Credit risk is the risk that an issuer or guarantor of debt instruments, is unable or unwilling to make timely interest and/or principal payments or to otherwise honor its obligations. The extent of each Funds' exposure to credit risk with respect to those financial assets is approximated by their value recorded in its Statement of Assets and Liabilities. High yield securities may also be subject to greater levels of credit or default risk than higher-rated securities. In particular, high yield securities are often issued by smaller, less creditworthy companies or by highly leveraged (indebted) companies, which are generally less able than more financially stable companies to make scheduled payments of interest and principal.
Currency Risk. If the Fund invests in securities that trade in, and receive revenues in, foreign currencies, it will be subject to the risk that those currencies will decline in value relative to the U.S. dollar, or, in the case of hedging positions, that the U.S. dollar will decline in value relative to the currency being hedged. As a result, the Fund's investments in foreign currency-denominated securities may reduce the Fund's returns.
High Yield Securities Risk. The Fund's investments in high yield securities or "junk bonds" are subject to a greater risk of loss of income and principal than higher grade debt securities. Issuers of lower-quality debt securities may have substantially greater risk of default than higher quality debt securities. These securities may be less liquid and more difficult to sell at an advantageous time or price or to value than higher rated securities. They can be illiquid, and their values can have significant volatility and may decline significantly over short periods of time. Lower-quality debt securities tend to be more sensitive to adverse news about the issuer, the market or the economy in general. These securities are considered predominately speculative with respect to the issuer's continuing ability to make principal and interest payments.
Issuer Risk. Fund performance depends on the performance of individual securities that the Funds hold. Changes in the financial condition or credit rating of an issuer of those securities may cause the value of the securities to decline.
Large Shareholder Risk. The risk that certain account holders, including an adviser or funds or accounts over which an adviser (or related parties of an adviser) has investment discretion, may from time to time own or control a significant percentage of a Fund's shares. A Fund is subject to the risk that a redemption by those shareholders of all or a portion of their Fund shares, including as a result of an asset allocation decision made by an adviser (or related parties of an adviser), will adversely affect the Fund's performance if it is forced to sell portfolio securities or invest cash when the adviser would not otherwise choose to do so. Redemptions of a large number of shares may affect the liquidity of a Fund's portfolio, increase a Fund's transaction costs, and accelerate the realization of taxable income and/or gains to shareholders.
Liquidity Risk. In certain circumstances, it may be difficult for the Fund to purchase and sell particular investments within a reasonable time at a fair price. To the extent that there is not an established retail market for instruments in which the Funds may invest, trading in such instruments may be relatively inactive. Trading in shares may be halted because of market conditions or for reasons that, in the view of the Exchange, make trading in shares inadvisable. In addition, trading in shares is subject to trading halts caused by extraordinary market volatility pursuant to ''circuit breaker'' rules. There can be no assurance that the requirements necessary to maintain the listing of the shares of the Funds will continue to be met or will remain unchanged.
Market Risk. Overall market risks may affect the value of the Funds. Factors such as country specific economic growth and market conditions, interest rate levels and political events affect the securities markets.
Market Trading Risk. The Funds face numerous market trading risks, including the potential lack of an active market for the Shares, losses from trading in secondary markets, and disruption in the creation/redemption process of the Funds. Any of these factors may lead to the Shares trading at a premium or discount to the Funds' net asset value ("NAV").
Natural Disaster and Pandemic Risk. Natural disasters occur throughout the world and include events such as blizzards and ice storms, earthquakes, floods, hurricanes, pandemics, tidal waves, tornadoes, tsunamis, typhoons, volcanic eruptions, and wildfires. Although specific types of natural disasters may occur more frequently in certain geographic locations, such events are by their nature unpredictable and may cause sudden, severe and widespread damage that negatively impacts issuers, regions and economies in which a Fund invests. Should a Fund hold significant investments in, or have significant exposure to, an issuer, region or economy affected by a natural disaster, the Fund may lose money. Due to the interconnectedness of the global economy, natural disasters in one location may negatively impact issuers in other locations.
D-6
PACIFIC GLOBAL ETFs
NOTES TO FINANCIAL STATEMENTS (Continued)
An outbreak of infectious respiratory illness caused by the novel Coronavirus known as COVID-19 was declared a global pandemic by the World Health Organization in March 2020. COVID-19 has resulted in travel restrictions, closed international borders, enhanced health screenings, disruption and delays in healthcare services, prolonged quarantines, cancellations, temporary store closures, social distancing, government ordered curfews and business closures, disruptions to supply chains and consumer activity, shortages, highly volatile financial markets, and general concern and uncertainty. The impact of COVID-19 could adversely affect the economies and capital markets of many nations or the entire global economy, as well as individual companies, entire sectors, and securities and commodities markets (including liquidity), in ways that may not necessarily be foreseen at the present time, which could result in losses to a Fund.
Sector Risk. Sector risk is the possibility that securities within the same group of industries will decline in price due to sector-specific market or economic developments. If the Funds invest more heavily in a particular sector, the value of its shares may be especially sensitive to factors and economic risks that specifically affect that sector. As a result, the Funds' share price may fluctuate more widely than the value of shares of a fund that invests in a broader range of industries.
Communications Sector Risk. Companies in the communications sector may be affected by industry competition, substantial capital requirements, government regulation, cyclicality of revenues and earnings, obsolescence of communications products and services due to technological advancement, a potential decrease in the discretionary income of targeted individuals and changing consumer tastes and interests.
Consumer Cyclical Sector Risk. Consumer cyclical companies rely heavily on the business cycle and economic conditions. Consumer cyclical companies may be adversely affected by domestic and international economic downturns, changes in exchange and interest rates, competition, consumers' disposable income and consumer preferences, social trends and marketing campaigns.
Consumer Discretionary Sector Risk. These companies may be adversely affected by changes in the worldwide economy, consumer spending, competition, demographics and consumer preferences, exploration and production spending. Companies in this sector are also affected by changes in government regulation, world events and economic conditions.
Industrial Sector Risk. Industrial companies are affected by supply and demand both for their specific product or service and for industrial sector products in general. Government regulation, world events, exchange rates and economic conditions, technological developments and liabilities for environmental damage and general civil liabilities will likewise affect the performance of these companies.
Small Fund Risk. When the Fund's size is small, the Fund may experience low trading volume and wide bid/ask spreads. In addition, the Fund may face the risk of being delisted if the Fund does not meet certain conditions of the listing exchange. Any resulting liquidation of the Fund could cause the Fund to incur elevated transaction costs for the Fund and negative tax consequences for its shareholders.
NOTE 10—BANK LOANS
FLRT invests in senior secured corporate loans or bank loans, some of which may be partially or entirely unfunded and purchased on a when-issued or delayed delivery basis, that pay interest at rates which are periodically reset by reference to a base lending rate plus a spread. Bank loans generally pay interest at rates which are periodically determined by reference to a base lending rate plus a premium. The majority of loans carry a variable rate of interest. These base lending rates are generally (i) the Prime Rate offered by one or more major United States banks, (ii) the lending rate offered by one or more European banks such as the London Interbank Offered Rate ("LIBOR") or (iii) the Certificate of Deposit rate. Bank Loans, while exempt from registration under the Securities Act, contain certain restrictions on resale and cannot be sold publicly. Floating rate bank loans often require prepayments from excess cash flow or permit the borrower to repay at its election. The degree to which borrowers repay, whether as a contractual requirement or at their election, cannot be predicted with accuracy. As a result, actual maturity may be substantially less than the stated maturity. Bank loans in which the Fund invests are generally readily marketable, but may be subject to certain restrictions on resale.
NOTE 11—LIBOR RISK
The United Kingdom's Financial Conduct Authority, which regulates London Interbank Offered Rates ("LIBOR"), announced plans to phase out the use of LIBOR by the end of 2021. The administrator of LIBOR recently announced a delay in the phase out of a majority of the U.S. dollar LIBOR publications until mid-2023, with the remainder of the LIBOR publications to end of 2021. There remains uncertainty regarding the transition to, and nature of, any selected replacement rates for LIBOR. There is no assurance that the composition or characteristics of any such alternative reference rate will be similar to or produce the same value or economic equivalence as LIBOR or that it will have the same volume or liquidity as did LIBOR prior to its discontinuance or unavailability, which may affect the value, liquidity or return on certain of the Fund's investments. The transition process away from LIBOR may also result in increased volatility or illiquidity in markets for the Fund's investments that currently rely on LIBOR as well as a reduction in the value of these investments. The potential risk of reduction in value of these investments may be heightened for those investments that do not include fallback provisions that address the cessation of LIBOR. For investments that do not have appropriate fallback provisions addressing the cessation of LIBOR, the Fund could incur additional costs in connection with closing out positions that reference LIBOR and entering into new trades referencing an alternative rate.
NOTE 12—NEW ACCOUNTING PRONOUNCEMENTS
In March 2020, FASB issued ASU 2020-04, Reference Rate Reform (Topic 848)—Facilitation of the Effects of Reference Rate Reform on Financial Reporting. The amendments in ASU 2020-04 provides optional temporary financial reporting relief from the effect of certain types of
D-7
PACIFIC GLOBAL ETFs
NOTES TO FINANCIAL STATEMENTS (Continued)
contract modifications due to the planned discontinuation of LIBOR and other interbank-offered based reference rates as of the end of 2021. ASU 2020-04 is effective for certain reference rate-related contract modifications that occur during the period March 12, 2020 through December 31, 2022. Management is currently evaluating the impact, if any, of applying this ASU.
In October 2020, FASB issued ASU 2020-08, Receivables—Nonrefundable Fees and Other Costs (Codification Improvements Subtopic 310-20), Premium Amortization on Purchased Callable Debt Securities. ASU 2020-08 is an update of ASU No. 2017-08, which amends the amortization period of certain purchased callable debt securities held at a premium, shortening such period to the earliest call date. The ASU 2017-08 does not require any accounting change for debt securities held at a discount; the discount continues to be amortized to maturity. ASU 2020-08 updates the amortization period for callable debt securities to be amortized to the next call date. For purposes of this update, the next call date is the first date when a call option at a specified price becomes exercisable. Once that date has passed, the next call date is when the next call option at a specified price becomes exercisable, if applicable. The amendments are effective for fiscal years, and interim periods within those fiscal years, beginning after December 15, 2020. Management is currently evaluating the impact, if any, of applying this ASU.
D-8
REPORT OF INDEPENDENT REGISTERED PUBLIC ACCOUNTING FIRM
To the Shareholders and Board of Trustees of
Pacific Global ETF Trust:
Opinion on the Financial Statements and Financial Highlights
We have audited the accompanying statements of assets and liabilities of Pacific Global ETF Trust (the "Trust") comprising the Pacific Global Focused High Yield ETF and Pacific Global Senior Loan ETF (each a "Portfolio," and collectively, the "Portfolios"), including the portfolio of investments, as of June 30, 2021; the related statements of operations for the year then ended, the statements of changes in net assets and financial highlights for each of the two years in the period then ended for Pacific Global Senior Loan ETF (formerly known as AdvisorShares Pacific Asset Enhanced Floating Rate ETF); the related statements of operations, changes in net assets, and the financial highlights for the periods indicated in the table below for Pacific Global Focused High Yield ETF; and the related notes. In our opinion, the financial statements and financial highlights present fairly, in all material respects, the financial position of each of the Portfolios listed above constituting the Trust as of June 30, 2021, and the results of their operations for the year then ended (or for the period listed in the table below), changes in their net assets and financial highlights for each of the two years in the period then ended (or for the period listed in the table below), in conformity with accounting principles generally accepted in the United States of America.
| Individual Portfolios of Pacific Global ETF Trust | Statement of Operations | Statements of Changes in Net Assets | Financial Highlights | ||||||||||||
Pacific Global Focused High Yield ETF | For the year ended June 30, 2021 | For the year ended June 30, 2021 and for the period October 23, 2019 (commencement of operations) through June 30, 2020 | For the year ended June 30, 2021 and for the period October 23, 2019 (commencement of operations) through June 30, 2020 | ||||||||||||
The financial highlights for each of the three years in the period ended June 30, 2019 for Pacific Global Senior Loan ETF (formerly known as AdvisorShares Pacific Asset Enhanced Floating Rate ETF), were audited by other auditors whose report, dated August 26, 2019, expressed an unqualified opinion on those statements.
Basis for Opinion
These financial statements and financial highlights are the responsibility of the Trust's management. Our responsibility is to express an opinion on the Trust's financial statements and financial highlights based on our audits. We are a public accounting firm registered with the Public Company Accounting Oversight Board (United States) (PCAOB) and are required to be independent with respect to the Trust in accordance with the U.S. federal securities laws and the applicable rules and regulations of the Securities and Exchange Commission and the PCAOB. We conducted our audits in accordance with the standards of the PCAOB. Those standards require that we plan and perform the audit to obtain reasonable assurance about whether the financial statements and financial highlights are free of material misstatement, whether due to error or fraud. The Trust is not required to have, nor were we engaged to perform, an audit of their internal control over financial reporting. As part of our audits we are required to obtain an understanding of internal control over financial reporting but not for the purpose of expressing an opinion on the effectiveness of the Trusts' internal control over financial reporting. Accordingly, we express no such opinion.
Our audits included performing procedures to assess the risks of material misstatement of the financial statements and financial highlights, whether due to error or fraud, and performing procedures that respond to those risks. Such procedures included examining, on a test basis, evidence regarding the amounts and disclosures in the financial statements and financial highlights. Our audits also included evaluating the accounting principles used and significant estimates made by management, as well as evaluating the overall presentation of the financial statements and financial highlights. Our procedures included confirmation of securities owned as of June 30, 2021, by correspondence with the custodian and agent banks. We believe that our audits provide a reasonable basis for our opinion.

Costa Mesa, California
August 16, 2021
We have served as the auditor of the Trust since 2018.
E-1
PACIFIC GLOBAL ETFs
TRUSTEES AND OFFICERS
(Unaudited)
Additional information about each trustee of the Trust is set forth below. The address of each trustee is c/o Pacific Global ETF Trust, 840 Newport Center Drive, 7th Floor, Newport Beach, CA 92660. Each trustee serves for the life of the Trust, subject to their earlier death, incapacitation, resignation, retirement or removal as more specifically provided in the Trust's organization documents.
| Name and Year of Birth | Position Held with the Trust | Term of Office and Length of Time Served | Principal Occupation(s) During Past 5 Years | Number of Portfolios in Fund Complex Overseen by Trustee | Other Directorships Held by Trustee During Past 5 Years | ||||||||||||||||||
INDEPENDENT TRUSTEES | |||||||||||||||||||||||
| Robert J. Blattenberg Born: 1950 | Trustee | Indefinite term; since 2018 | Consultant, Ringler Associates Inc. (April 2016-Present); Chief Executive Officer, Ringler Associates (February 1983-April 2016). | 2 | None | ||||||||||||||||||
| D. Robinson Cluck Born: 1956 | Trustee | Indefinite term; since 2018 | Chairman, Canterbury Consulting, Inc. (December 1988-Present). | 2 | None | ||||||||||||||||||
| John C. Siciliano Born: 1954 | Trustee | Indefinite term; since 2018 | Chairman, Avondale Strategies, LLC (May 2019-Present); Senior Advisor, Bonaccord Capital Partners (2019-Present); Senior Managing Director, PwC Advisory, LLC (September 2012-2019). | 2 | None | ||||||||||||||||||
INTERESTED TRUSTEES | |||||||||||||||||||||||
| Kevin R. Byrne Born: 1955 | Trustee and Chair | Indefinite term; since 2018 | Chief Executive Officer, Pacific Global Asset Management LLC (November 2018-Present): Senior Vice President, Pacific Life Insurance Company (August 2012-November 2018). | 2 | None | ||||||||||||||||||
| Sharon A. Cheever Born: 1955 | Trustee | Indefinite term; since 2018 | Director, Senior Vice President and General Counsel, Pacific Life Insurance Company (Jan. 2008-Dec. 2020); Senior Vice President and General Counsel, Pacific Global Asset Management LLC (August 2012-Dec. 2020); Senior Vice President and General Counsel, Cadence Capital Management LLC (July 2016-August 2016); Senior Vice President and General Counsel, Pacific Life Fund Advisors LLC (January 2008-October 2015); Senior Vice President and General Counsel, Pacific Private Fund Advisors LLC (August 2013-March 2015). | 2 | None | ||||||||||||||||||
F-1
PACIFIC GLOBAL ETFs
TRUSTEES AND OFFICERS (Continued)
(Unaudited)
The officers of the Trust conduct and supervise its daily business. The address of each officer of the Trust is c/o Pacific Global ETF Trust, 840 Newport Center Drive, 7th Floor, Newport Beach, CA 92660. Each officer serves for a one year term or until their successors are elected and qualified.
| Name and Year of Birth | Position(s) Held with the Trust | Length of Time Served | Principal Occupation(s) During Past 5 Years | ||||||||||||
| Joshua B. Schwab Born: 1981 | Vice President, Treasurer and Principal Financial Officer | Since 2018 | Assistant Vice President, Pacific Global Asset Management LLC (2015-Present); Assistant Vice President, Pacific Life Insurance Company, (2015-Present); Associate Vice President, Pacific Alternative Asset Management Company, LLC (2007-2015). | ||||||||||||
| Jane M. Guon Born: 1964 | Vice President and Secretary | Since 2018 | Vice President and Secretary, Pacific Life Insurance Company (2011-Present); Vice President and Secretary, Pacific Global Asset Management LLC (2013-Present). | ||||||||||||
| Carol E. Rumsey Born: 1960 | Vice President and Chief Compliance Officer | Since 2018 | Chief Compliance Officer, Pacific Private Fund Advisors LLC (2014-Present); Assistant Vice President, Pacific Global Asset Management LLC (2014-Present); Chief Compliance Officer, Pacific Asset Management (2013-Present); Assistant Vice President, Pacific Life Insurance Company (1991-Present). | ||||||||||||
| Joseph G. Lallande Born: 1970 | Chief Executive Officer and President | Since 2018 | AVP & Counsel, Pacific Life Insurance Company (2010-Present). | ||||||||||||
| Joanne Chyun Born: 1978 | Assistant Treasurer | Since 2019 | Director of Finance, Pacific Global Asset Management LLC (2018-Present); Interim Controller, One01 Capital (2017-2018); Associate VP, PAAMCO (2006-2017) | ||||||||||||
| Kristie Sykes Born: 1988 | Assistant Treasurer | Since 2019 | Finance Manager, Pacific Global Asset Management LLC (2018-Present); Senior Analyst, Pricing & Valuation, Pacific Life Fund Advisors (2017-2018); Manager, Accounting and Operational Due Diligence, PAAMCO (2012-2017) | ||||||||||||
Information about Trustees and Officers
The Statement of Additional Information ("SAI") includes additional information about the Funds' Trustees and is available without charge, upon request, by calling (866) 933-2398. Furthermore, you can obtain the SAI by accessing the SEC's website at www.sec.gov or by accessing the Funds' website at www.pacificglobaletfs.com.
F-2
PACIFIC GLOBAL ETFs
STATEMENT REGARDING THE FUNDS' LIQUIDITY RISK PROGRAM
Pacific Global ETF Trust (the "Trust") has adopted a liquidity risk management program (the "Program") pursuant to Rule 22e-4 under the Investment Company Act of 1940, as amended (the "Liquidity Rule"). The Trust's Board of Trustees (the "Board") has designated Pacific Global Advisors LLC, the investment adviser (the "Adviser") to the Trust's series (each a "Fund"), as the liquidity program administrator ("LPA") of the Program. Personnel of the Adviser conduct the day-to-day operation of the Program pursuant to the Trust's policies and procedures.
Under the Program, the LPA manages the liquidity risk of each Fund of the Trust. Liquidity risk is the risk that a Fund could not meet shareholder redemption requests without significant dilution of remaining shareholders' interests in that Fund. This risk is managed by monitoring the degree of liquidity of each Fund's investments, limiting the amount of the Fund's illiquid investments, and utilizing various risk management tools and facilities available to the Fund for meeting shareholder redemptions, among other means. The LPA's process for determining the degree of liquidity of each Fund's investments is supported by one or more third-party liquidity assessment vendors.
The Board reviewed a report prepared by the LPA regarding the operation and effectiveness of the Program for the period April 1, 2020, through March 31, 2021 ("Program Reporting Period"). The report included, among other information, the LPA's evaluation of each Fund's (i) investment strategy and the liquidity of its portfolio investments including the Fund's objective, portfolio composition, portfolio concentration and known or identifiable risks to liquidity; (ii) redemption activity and the source and composition of shareholders as predictors of cash flow trends; and (iii) holdings of cash and cash equivalents. The report also included information about the Program management and operations. This information and other factors were used as inputs to establish each Fund's reasonably anticipated trading size ("RATS").
There were no material changes to the Program during the Program Reporting Period. No significant liquidity events impacting any Fund were noted in the report. In addition, the LPA provided its assessment that the Program is adequately designed and had been effective in managing each Fund's liquidity risk and in implementing the requirements of the Liquidity Rule.
F-3
PACIFIC GLOBAL ETFs
EXPENSE EXAMPLES
For the Period Ended June 30, 2021 (Unaudited)
As a shareholder of one or more of the Funds, you incur two types of costs: (1) transaction costs, including brokerage commissions on purchases and sales of Funds shares, and (2) ongoing costs, reflected as a fixed unitary fee. This Example is intended to help you understand your ongoing costs (dollars) (excluding transaction costs) of investing in the Funds and to compare these costs with the ongoing costs of investing in other funds. The example is based on an investment of $1,000 invested at the beginning of the period and held for the entire six-month period (January 1, 2021 - June 30, 2021).
ACTUAL EXPENSES
The first line of each table provides information about actual account values based on actual returns and actual expenses. You may use the information in this line, together with the amount you invested, to estimate the expenses that you paid over the period. Simply divide your account value by $1,000 (for example, an $8,600 account value divided by $1,000 = 8.6), then, multiply the result by the number in the first line under the heading entitled "Expenses Paid During the Period" to estimate the expenses you paid on your account during this period.
HYPOTHETICAL EXAMPLE FOR COMPARISON PURPOSES
The second line of each table provides information about hypothetical account values based on a hypothetical return and hypothetical expenses based on the Funds' actual expense ratio and an assumed rate of return of 5% per year before expenses, which is not the Funds' actual return. The hypothetical account values and expenses may not be used to estimate the actual ending account balance or expenses you paid for the period. You may use this information to compare the ongoing costs of investing in the Funds and other funds. To do so, compare this 5% hypothetical example with the 5% hypothetical examples that appear in the shareholder reports of the other funds. Please note that the expenses shown in each table are
meant to highlight your ongoing costs only and do not reflect any transactional costs, such as brokerage commissions paid on purchases and sales of Funds shares. Therefore, the second line of each table is useful in comparing ongoing costs only and will not help you determine the relative total costs of owning different funds. If these transactional costs were included, your costs would have been higher.
| Beginning Account Value | Ending Account Value June 30, 2021 | Expenses Paid During the Period (1) | |||||||||||||
Pacific Global Focused High Yield ETF | |||||||||||||||
Actual | $ | 1,000.00 | $ | 1,028.20 | $ | 1.96 | |||||||||
| Hypothetical (5% Annual return before expenses) | $ | 1,000.00 | $ | 1,022.86 | $ | 1.96 | |||||||||
| Beginning Account Value | Ending Account Value June 30, 2021 | Expenses Paid During the Period (2) | |||||||||||||
Pacific Global Senior Loan ETF | |||||||||||||||
Actual | $ | 1,000.00 | $ | 1,019.70 | $ | 3.41 | |||||||||
| Hypothetical (5% Annual return before expenses) | $ | 1,000.00 | $ | 1,021.42 | $ | 3.41 | |||||||||
(1) The dollar amounts shown as expenses paid during the period are equal to the annualized expense ratio, 0.39%, multiplied by the average account value during the six-month period, multiplied by 181/365 (to reflect the one-half year period).
(2) The dollar amounts shown as expenses paid during the period are equal to the annualized expense ratio, 0.68%, multiplied by the average account value during the six-month period, multiplied by 181/365 (to reflect the one-half year period).
F-4
PACIFIC GLOBAL ETFs
FEDERAL TAX INFORMATION
(Unaudited)
For the period ended June 30, 2021, certain dividends paid by the Funds may be subject to a maximum tax rate of 15% (20% for taxpayers with taxable income greater than $425,800 for single individuals and $479,000 for married couples filling jointly), as provided for by the Jobs and Growth Tax Relief Reconciliation Act of 2003 and The Tax Cuts and Jobs Act of 2017. There are no dividends declared from ordinary income.
For corporate shareholders, There are no ordinary income distributions qualifying of the corporate dividends received deduction for the period ended June 30, 2021.
There are no taxable ordinary income distributions that are designated as short-term capital gain distributions under Code Section 871(k)(2)(C).
Pursuant to Section 853 of the Internal Revenue code, the Funds designate the following amounts as foreign taxes paid for the period ended June 30, 2021.
There are no foreign taxes paid for purposes of Section 853.
Above figures may differ from those cited elsewhere in this report due to difference in the calculation of income and gains under U.S. GAAP purposes and Internal Revenue Service purposes.
Shareholders are strongly advised to consult their own tax advisers with respect to the tax consequences of their investments in the Funds.
F-5
PACIFIC GLOBAL ETFs
ADDITIONAL INFORMATION
(Unaudited)
Information About Portfolio Holdings
The Funds file the complete schedule of portfolio holdings for the first and third fiscal quarters with the SEC on Part F of Form N-PORT. When available, Part F of Form N-PORT may be found on the SEC's website at www.sec.gov. The Funds' portfolio holdings are posted on their website, at www.pacificglobaletfs.com, daily.
Information About Proxy Voting
A description of the policies and procedures the Funds use to determine how to vote proxies relating to portfolio securities is provided in the applicable Statement of Additional Information ("SAI"). The SAI is available without charge, upon request, by calling toll-free at (866) 933-2398, by accessing the SEC's website at www.sec.gov, or by accessing the Funds' website at www.pacificglobaletfs.com.
Information regarding how the Funds voted proxies relating to portfolio securities during the most recent 12 month period ending June 30 is available no later than the following August 31st by calling toll-free at (866) 933-2398 or by accessing the SEC's website at www.sec.gov.
Frequency Distribution of Premiums and Discounts
The following Frequency Distribution of Premium and Discount chart is provided to show the frequency at which the closing price for the Funds was at a premium or discount to its daily NAV. The charts presented below represent past performance and cannot be used to predict future results. Further information regarding premiums and discounts is available, without charge, on the Funds' website at www.pacificglobaletfs.com
Pacific Global Focused High Yield ETF
Period Covered July 1, 2020 through June 30, 2021
Premium/Discount Range | Number of Trading Days | % of Total Trade Days | |||||||||
1.00 | % or more | 0 | 0.00 | % | |||||||
0.75 | % to 0.999% | 0 | 0.00 | % | |||||||
0.50 | % to 0.749% | 3 | 1.19 | % | |||||||
0.25 | % to 0.499% | 75 | 29.76 | % | |||||||
0.00 | % to 0.249% | 139 | 55.17 | % | |||||||
-0.001 | % to -0.249% | 30 | 11.90 | % | |||||||
-0.25 | % to -0.499% | 5 | 1.98 | % | |||||||
-0.50 | % to -0.749% | 0 | 0.00 | % | |||||||
-0.75 | % to -0.999% | 0 | 0.00 | % | |||||||
-1.00 | % or more | 0 | 0.00 | % | |||||||
252 | 100.00 | % | |||||||||
Pacific Global Senior Loan ETF
Period Covered July 1, 2020 through June 30, 2021
Premium/Discount Range | Number of Trading Days | % of Total Trade Days | |||||||||
1.00 | % or more | 22 | 8.73 | % | |||||||
0.75 | % to 0.999% | 21 | 8.33 | % | |||||||
0.50 | % to 0.749% | 12 | 4.76 | % | |||||||
0.25 | % to 0.499% | 53 | 21.03 | % | |||||||
0.00 | % to 0.249% | 125 | 49.60 | % | |||||||
-0.001 | % to -0.249% | 17 | 6.75 | % | |||||||
-0.25 | % to -0.499% | 1 | 0.40 | % | |||||||
-0.50 | % to -0.749% | 1 | 0.40 | % | |||||||
-0.75 | % to -0.999% | 0 | 0.00 | % | |||||||
-1.00 | % or more | 0 | 0.00 | % | |||||||
252 | 100.00 | % | |||||||||
F-6
Investment Adviser
Pacific Global Advisors LLC
840 Newport Center Drive, 7th Floor
Newport Beach, CA 92660
Sub-Adviser
Pacific Asset Management LLC
840 Newport Center Drive, 7th Floor
Newport Beach, CA 92660
Custodian
U.S. Bank, N.A.
1555 N. Rivercenter Drive
Milwaukee, WI 53212
Administrator/Transfer Agent
U.S. Bancorp Fund Services, LLC
615 East Michigan Street
Milwaukee, WI 53202
Distributor
Foreside Fund Services, LLC
Three Canal Plaza, Suite 100
Portland, ME 04101
Independent Registered Public Accounting Firm
Deloitte & Touche, LLP
695 Town Center Drive, Suite 1000
Costa Mesa, CA 92626
Legal Counsel
Thompson Hine LLP
1919 M Street, N.W., Suite 700
Washington, D.C. 20036
Pacific Global Focused High Yield ETF
Symbol—FJNK
CUSIP—69434K205
Pacific Global Senior Loan ETF
Symbol—FLRT
CUSIP—69434K403
Item 2. Code of Ethics.
The registrant has adopted a code of ethics that applies to the registrant’s principal executive officer and principal financial officer. The registrant has not made any substantive amendments to its code of ethics during the period covered by this report. The registrant has not granted any waivers from any provisions of the code of ethics during the period covered by this report. A copy of the registrant’s Code of Ethics is filed herewith.
Item 3. Audit Committee Financial Expert.
The registrant’s board of trustees has determined that there is at least one audit committee financial expert serving on its audit committee. John Siciliano is the “audit committee financial expert” and is considered to be “independent” as each term is defined in Item 3 of Form N-CSR.
Item 4. Principal Accountant Fees and Services.
The registrant has engaged its principal accountant to perform audit services, audit-related services, tax services and other services during the past two fiscal years. “Audit services” refer to performing an audit of the registrant's annual financial statements or services that are normally provided by the accountant in connection with statutory and regulatory filings or engagements for those fiscal years. “Audit-related services” refer to the assurance and related services by the principal accountant that are reasonably related to the performance of the audit. “Tax services” refer to professional services rendered by the principal accountant for tax compliance, tax advice, and tax planning. The following table details the aggregate fees billed or expected to be billed for each of the last two fiscal years for audit fees, audit-related fees, tax fees and other fees by the principal accountant. Note, the registrant has completed only one fiscal year as of the date of this report.
| FYE 6/30/2021 | FYE 6/30/2020 | |||||||
| Audit Fees | $ | 54,950 | $ | 73,600 | ||||
| Audit-Related Fees | N/A | N/A | ||||||
| Tax Fees | $ | 13,802 | $ | 32,000 | ||||
| All Other Fees | N/A | N/A | ||||||
The audit committee has adopted pre-approval policies and procedures that require the audit committee to pre-approve all audit and non-audit services of the registrant, including services provided to any entity affiliated with the registrant.
The percentage of fees billed by Deloitte & Touche LLP applicable to non-audit services pursuant to waiver of pre-approval requirement were as follows:
| FYE 6/30/2021 | FYE 6/30/2020 | |||||||
| Audit-Related Fees | 0 | % | 0 | % | ||||
| Tax Fees | 0 | % | 0 | % | ||||
| All Other Fees | 0 | % | 0 | % | ||||
All of the principal accountant’s hours spent on auditing the registrant’s financial statements were attributed to work performed by full-time permanent employees of the principal accountant.
The following table indicates the non-audit fees billed or expected to be billed by the registrant’s accountant for services to the registrant and to the registrant’s investment adviser (and any other controlling entity, etc.—not sub-adviser) for the last two years. The audit committee of the board of trustees/directors has considered whether the provision of non-audit services that were rendered to the registrant's investment adviser is compatible with maintaining the principal accountant's independence and has concluded that the provision of such non-audit services by the accountant has not compromised the accountant’s independence.
| Non-Audit Related Fees | FYE 6/30/2021 | FYE 6/30/2020 | ||||||
| Registrant | N/A | N/A | ||||||
| Registrant’s Investment Adviser | N/A | N/A |
Item 5. Audit Committee of Listed Registrants.
The registrant is an issuer as defined in Rule 10A-3 under the Securities Exchange Act of 1934, (the “Act”) and has a separately-designated standing audit committee established in accordance with Section 3(a)(58)(A) of the Act. The independent members of the committee are as follows: Robert J. Blattenberg, D. Robinson Cluck, and John C. Siciliano.
Item 6. Investments.
| (a) | Schedule of Investments is included as part of the report to shareholders filed under Item 1 of this Form. |
| (b) | Not Applicable. |
Item 7. Disclosure of Proxy Voting Policies and Procedures for Closed-End Management Investment Companies.
Not applicable to open-end investment companies.
Item 8. Portfolio Managers of Closed-End Management Investment Companies.
Not applicable to open-end investment companies.
Item 9. Purchases of Equity Securities by Closed-End Management Investment Company and Affiliated Purchasers.
Not applicable to open-end investment companies.
| 2 |
Item 10. Submission of Matters to a Vote of Security Holders.
There have been no material changes to the procedures by which shareholders may recommend nominees to the registrant’s board of trustees.
Item 11. Controls and Procedures.
| (a) | The Registrant’s President/Chief Executive Officer and Treasurer/Principal Finance Officer have reviewed the Registrant's disclosure controls and procedures (as defined in Rule 30a-3(c) under the Investment Company Act of 1940, as amended, (the “Act”)) as of a date within 90 days of the filing of this report, as required by Rule 30a-3(b) under the Act and Rules 13a-15(b) or 15d-15(b) under the Securities Exchange Act of 1934. Based on their review, such officers have concluded that the disclosure controls and procedures are effective in ensuring that information required to be disclosed in this report is appropriately recorded, processed, summarized and reported and made known to them by others within the Registrant and by the Registrant’s service provider. |
| (b) | There were no changes in the Registrant's internal control over financial reporting (as defined in Rule 30a-3(d) under the Act) that occurred during the period covered by this report that have materially affected, or are reasonably likely to materially affect, the Registrant's internal control over financial reporting. |
Item 12. Disclosure of Securities Lending Activities for Closed-End Management Investment Companies
Not applicable to open-end investment companies.
Item 13. Exhibits.
(3) Any written solicitation to purchase securities under Rule 23c-1 under the Act sent or given during the period covered by the report by or on behalf of the registrant to 10 or more persons. Not applicable to open-end investment companies.
(4) Change in the registrant’s independent public accountant. There was no change in the registrant’s independent public accountant for the period covered by this report.
| (b) | Certifications pursuant to Section 906 of the Sarbanes-Oxley Act of 2002. Furnished herewith. |
| 3 |
SIGNATURES
Pursuant to the requirements of the Securities Exchange Act of 1934 and the Investment Company Act of 1940, the registrant has duly caused this report to be signed on its behalf by the undersigned, thereunto duly authorized.
| (Registrant) | Pacific Global ETF Trust | |
| By (Signature and Title)* | /s/ J.G. Lallande | |
| J. G. Lallande, President/Principal Executive Officer | ||
| Date | August 16, 2021 | |
Pursuant to the requirements of the Securities Exchange Act of 1934 and the Investment Company Act of 1940, this report has been signed below by the following persons on behalf of the registrant and in the capacities and on the dates indicated.
| By (Signature and Title)* | /s/ J.G. Lallande | |
| J.G. Lallande, President/Principal Executive Officer | ||
| Date | August 16, 2021 | |
| By (Signature and Title)* | /s/ Joshua B. Schwab | |
| Joshua B. Schwab, Treasurer/Principal Financial Officer | ||
| Date | August 16, 2021 |
* Print the name and title of each signing officer under his or her signature.
| 4 |