Filed by Blue Owl Technology Finance Corp.
pursuant to Rule 425 under the Securities Act of 1933
and deemed filed under Rule 14a-12 of the Securities Exchange Act of 1934
Subject Company: Blue Owl Technology Finance Corp. II
Commission File No. 000-56371
November 13, 2024 Blue Owl Technology Finance Corp. (“OTF”) and Blue Owl Technology Finance Corp. II (“OTF II”) Overview of Proposed Merger Between OTF and OTF II Highly Confidential. Trade Secret.
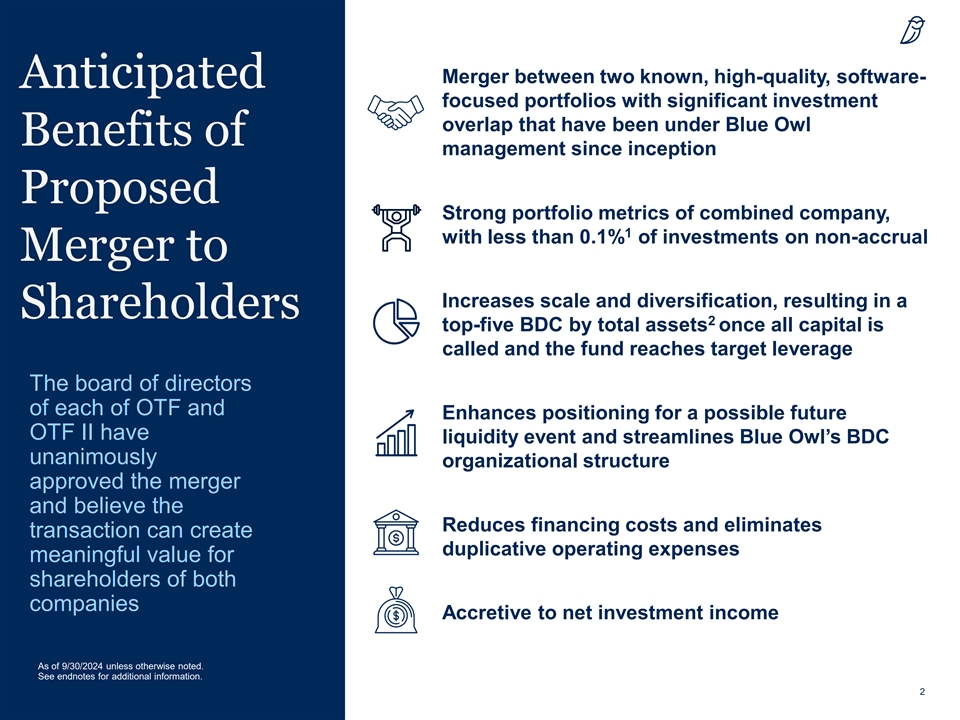
Merger between two known, high-quality, software- Anticipated focused portfolios with significant investment overlap that have been under Blue Owl Benefits of management since inception Proposed Strong portfolio metrics of combined company, 1 with less than 0.1% of investments on non-accrual Merger to Increases scale and diversification, resulting in a Shareholders 2 top-five BDC by total assets once all capital is called and the fund reaches target leverage The board of directors of each of OTF and Enhances positioning for a possible future OTF II have liquidity event and streamlines Blue Owl’s BDC unanimously organizational structure approved the merger and believe the Reduces financing costs and eliminates transaction can create duplicative operating expenses meaningful value for shareholders of both companies Accretive to net investment income As of 9/30/2024 unless otherwise noted. See endnotes for additional information. 2 2
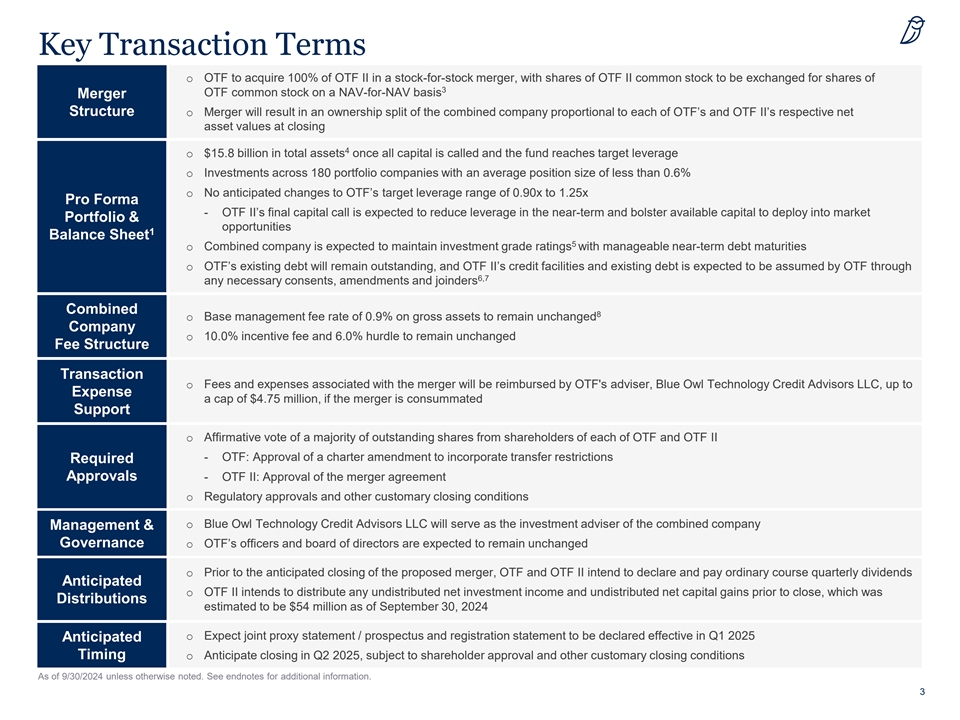
Key Transaction Terms o OTF to acquire 100% of OTF II in a stock-for-stock merger, with shares of OTF II common stock to be exchanged for shares of 3 OTF common stock on a NAV-for-NAV basis Merger Structure o Merger will result in an ownership split of the combined company proportional to each of OTF’s and OTF II’s respective net asset values at closing 4 o $15.8 billion in total assets once all capital is called and the fund reaches target leverage o Investments across 180 portfolio companies with an average position size of less than 0.6% o No anticipated changes to OTF’s target leverage range of 0.90x to 1.25x Pro Forma - OTF II’s final capital call is expected to reduce leverage in the near-term and bolster available capital to deploy into market Portfolio & opportunities 1 Balance Sheet 5 o Combined company is expected to maintain investment grade ratings with manageable near-term debt maturities o OTF’s existing debt will remain outstanding, and OTF II’s credit facilities and existing debt is expected to be assumed by OTF through 6,7 any necessary consents, amendments and joinders Combined 8 o Base management fee rate of 0.9% on gross assets to remain unchanged Company o 10.0% incentive fee and 6.0% hurdle to remain unchanged Fee Structure Transaction o Fees and expenses associated with the merger will be reimbursed by OTF's adviser, Blue Owl Technology Credit Advisors LLC, up to Expense a cap of $4.75 million, if the merger is consummated Support o Affirmative vote of a majority of outstanding shares from shareholders of each of OTF and OTF II - OTF: Approval of a charter amendment to incorporate transfer restrictions Required Approvals - OTF II: Approval of the merger agreement o Regulatory approvals and other customary closing conditions o Blue Owl Technology Credit Advisors LLC will serve as the investment adviser of the combined company Management & Governance o OTF’s officers and board of directors are expected to remain unchanged o Prior to the anticipated closing of the proposed merger, OTF and OTF II intend to declare and pay ordinary course quarterly dividends Anticipated o OTF II intends to distribute any undistributed net investment income and undistributed net capital gains prior to close, which was Distributions estimated to be $54 million as of September 30, 2024 o Expect joint proxy statement / prospectus and registration statement to be declared effective in Q1 2025 Anticipated Timing o Anticipate closing in Q2 2025, subject to shareholder approval and other customary closing conditions As of 9/30/2024 unless otherwise noted. See endnotes for additional information. 3

Transaction Rationale Seamless Portfolio • Significant portfolio overlap: approximately 84% of OTF II’s investments are also in OTF’s portfolio Integration and Strong • Attractive asset mix on a combined basis with 77% first lien investments and 81% senior secured investments • Strong credit quality in expected combined portfolio with less than 0.1% of investments on non-accrual and 93% 1- and Combined Portfolio 9 1 2-rated investments at fair value Metrics 2 Increased Scale and • Top five BDC and the largest dedicated software-focused BDC by total assets, with $15.8 billion of total assets on 4 a pro forma basis once all capital is called and the fund reaches target leverage Portfolio 1 • Average investment size of less than 0.6% on a pro forma basis Diversification • The larger scale of the combined company compared to either fund standalone should create enhanced trading liquidity Enhanced for a possible future liquidity event and a broader investor base Positioning for a • Nearly $300 million in estimated undistributed net investment income and undistributed net capital gains at the combined company as of September 30, 2024 will support a strong and predictable potential future public company dividend Possible Future • Elimination of a second private-to-public software-focused BDC should reduce potential arbitrage opportunities while Liquidity Event streamlining Blue Owl’s BDC organizational structure Greater Access to • Enhanced scale creates potential for more diverse funding sources, while consolidating existing facilities Debt Markets and • Greater scale could improve cost of debt and allow for more favorable terms over time Financing Cost Savings • Operational synergies through the elimination of duplicative operational expenses Accretive to Net • Lower cost of financing from streamlining and optimizing capital structure Investment Income • Improved portfolio-level asset yields We believe the increased scale from the transaction should drive lower costs of funds, generate meaningful operational synergies and enhance positioning in advance of a possible future liquidity event As of 9/30/2024 unless otherwise noted. See endnotes for additional information. 4

OTF at a Glance $690mm $201mm 146 31% 11.4% $6.4bn Portfolio Portfolio Portfolio Net Loan-to- Debt Portfolio Portfolio Size Company Company 11 12 Companies Value Yield 10 10 Revenue EBITDA Portfolio Mix by Asset Class Portfolio Mix by Industry <1% 9% 24% 21% 11% 5% 4% 32 Portfolio 75% Senior Industries 4% 5% Secured 4% 16% 70% 6% 7% 14% Systems Software Health Care Technology 1st Lien 2nd Lien Application Software Diversified Financial Services Professional Services Internet & Direct Marketing Retail Unsecured Preferred Equity Diversified Consumer Services IT Services Common Equity Joint Ventures Other (24 Industries) As of 9/30/2024 unless otherwise noted. Numbers may not sum due to rounding. See endnotes for additional information. 5
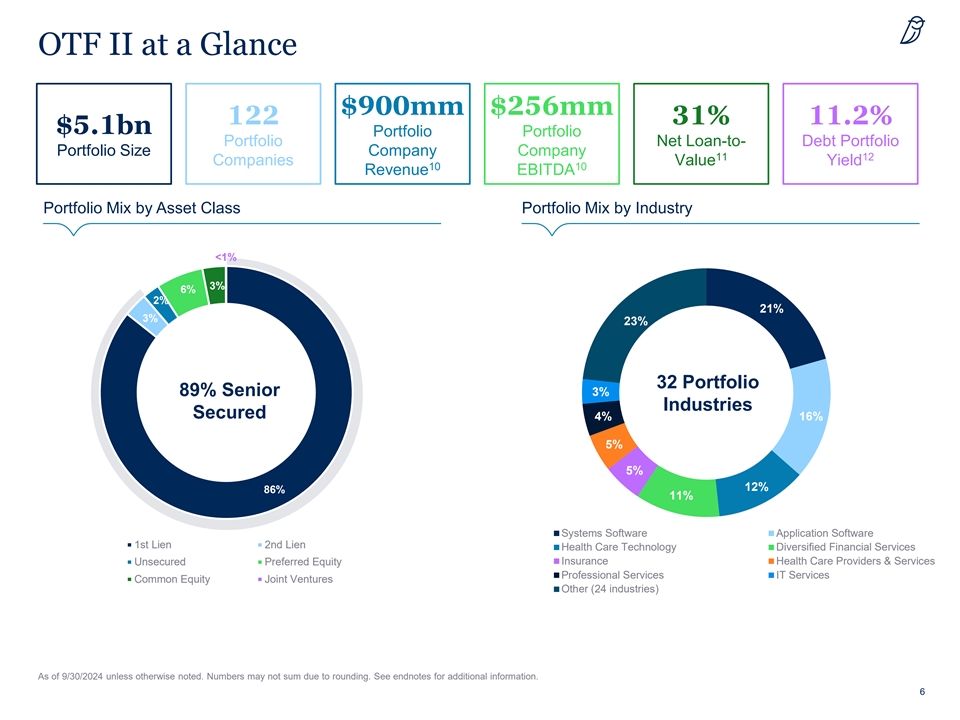
OTF II at a Glance $900mm $256mm 122 31% 11.2% $5.1bn Portfolio Portfolio Portfolio Net Loan-to- Debt Portfolio Portfolio Size Company Company 11 12 Companies Value Yield 10 10 Revenue EBITDA Portfolio Mix by Asset Class Portfolio Mix by Industry <1% 3% 6% 2% 21% 3% 23% 32 Portfolio 89% Senior 3% Industries Secured 4% 16% 5% 5% 12% 86% 11% Systems Software Application Software 1st Lien 2nd Lien Health Care Technology Diversified Financial Services Unsecured Preferred Equity Insurance Health Care Providers & Services Professional Services IT Services Common Equity Joint Ventures Other (24 industries) As of 9/30/2024 unless otherwise noted. Numbers may not sum due to rounding. See endnotes for additional information. 6

Combined Company Has Enhanced Portfolio Diversification 1 OTF OTF II Combined Entity At Fair Value Investments (in Millions) $6,397 $5,084 $11,481 Top 10 Investments (%) 26% 28% 18% Top 25 Investments (%) 49% 53% 40% Number of Portfolio Companies 146 122 180 Average Position Size 0.7% 0.8% 0.6% 10 Weighted Average EBITDA (in Millions) $201 $256 $228 10 Weighted Average Revenue (in Millions) $690 $900 $792 12 Debt Portfolio Yield 11.4% 11.2% 11.3% 11 Net Loan-to-Value Ratio 31% 31% 31% Non-Accruals (% of Total Portfolio) 0.1% -- <0.1% Internal 1- and 2-Rated Investments (%) 90% 97% 93% Assets by Type 2% 3% 3% 9% 6% 6% 1st Lien 9% 11% 2nd Lien <1% <1% 4% <1% Unsecured 4% 5% Preferred Equity 5% Common Equity 70% 77% Joint Ventures 86% Industry Diversification Systems Software Application Software 21% 24% 24% 22% 25% 26% Health Care Technology Diversified Financial Services Professional Services 4% 3% 2% 16% Insurance 4% 3% 15% 14% 3% 2% 4% IT Services 5% 6% 5% 4% Diversified Consumer Services 12% 7% 9% 14% 16% 11% Other 7 As of 9/30/2024 unless otherwise noted. Numbers may not sum due to rounding. See endnotes for additional information.
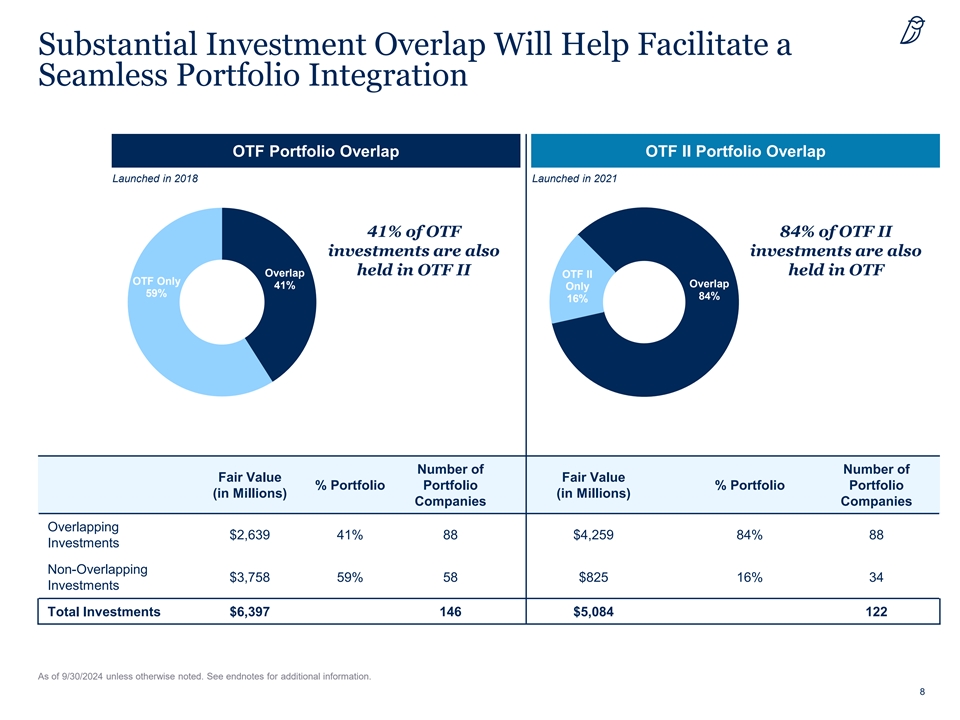
Substantial Investment Overlap Will Help Facilitate a Seamless Portfolio Integration OTF Portfolio Overlap OTF II Portfolio Overlap Launched in 2018 Launched in 2021 41% of OTF 84% of OTF II investments are also investments are also held in OTF II held in OTF Overlap OTF II OTF Only Overlap 41% Only 59% 84% 16% Number of Number of Fair Value Fair Value % Portfolio Portfolio % Portfolio Portfolio (in Millions) (in Millions) Companies Companies Overlapping $2,639 41% 88 $4,259 84% 88 Investments Non-Overlapping $3,758 59% 58 $825 16% 34 Investments Total Investments $6,397 146 $5,084 122 As of 9/30/2024 unless otherwise noted. See endnotes for additional information. 8
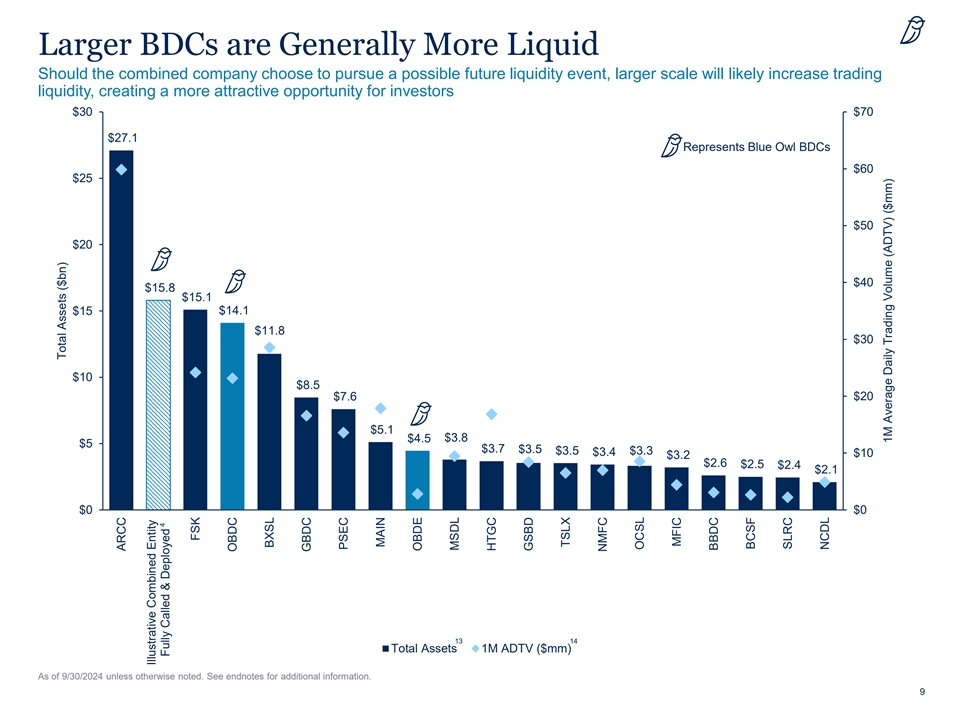
Larger BDCs are Generally More Liquid Should the combined company choose to pursue a possible future liquidity event, larger scale will likely increase trading liquidity, creating a more attractive opportunity for investors $30 $70 $27.1 Represents Blue Owl BDCs $60 $25 $50 $20 $40 $15.8 $15.1 $15 $14.1 $11.8 $30 $10 $8.5 $20 $7.6 $5.1 $3.8 $4.5 $5 $3.7 $3.5 $3.5 $3.3 $3.4 $10 $3.2 $2.6 $2.5 $2.4 $2.1 $0 $0 13 14 Total Assets 1M ADTV ($mm) As of 9/30/2024 unless otherwise noted. See endnotes for additional information. 9 Total Assets ($bn) ARCC Illustrative Combined Entity 4 Fully Called & Deployed FSK OBDC BXSL GBDC PSEC MAIN OBDE MSDL HTGC GSBD TSLX NMFC OCSL MFIC BBDC BCSF SLRC NCDL 1M Average Daily Trading Volume (ADTV) ($mm)
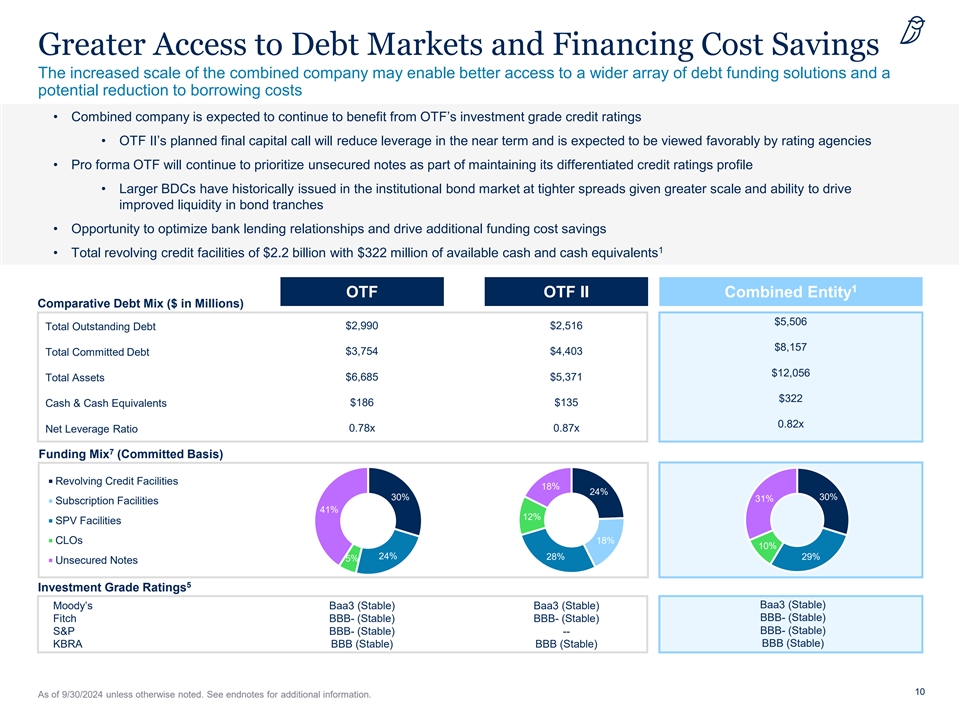
Greater Access to Debt Markets and Financing Cost Savings The increased scale of the combined company may enable better access to a wider array of debt funding solutions and a potential reduction to borrowing costs • Combined company is expected to continue to benefit from OTF’s investment grade credit ratings • OTF II’s planned final capital call will reduce leverage in the near term and is expected to be viewed favorably by rating agencies • Pro forma OTF will continue to prioritize unsecured notes as part of maintaining its differentiated credit ratings profile • Larger BDCs have historically issued in the institutional bond market at tighter spreads given greater scale and ability to drive improved liquidity in bond tranches • Opportunity to optimize bank lending relationships and drive additional funding cost savings 1 • Total revolving credit facilities of $2.2 billion with $322 million of available cash and cash equivalents 1 OTF OTF II Combined Entity Comparative Debt Mix ($ in Millions) $5,506 $2,990 $2,516 Total Outstanding Debt $8,157 $3,754 $4,403 Total Committed Debt $12,056 Total Assets $6,685 $5,371 $322 Cash & Cash Equivalents $186 $135 0.82x 0.78x 0.87x Net Leverage Ratio 7 Funding Mix (Committed Basis) Revolving Credit Facilities 18% 24% 30% 30% 31% Subscription Facilities 41% 12% SPV Facilities CLOs 18% 10% 24% 28% 29% 5% Unsecured Notes 5 Investment Grade Ratings Baa3 (Stable) Moody’s Baa3 (Stable) Baa3 (Stable) BBB- (Stable) Fitch BBB- (Stable) BBB- (Stable) S&P BBB- (Stable) -- BBB- (Stable) BBB (Stable) KBRA BBB (Stable) BBB (Stable) 10 As of 9/30/2024 unless otherwise noted. See endnotes for additional information.
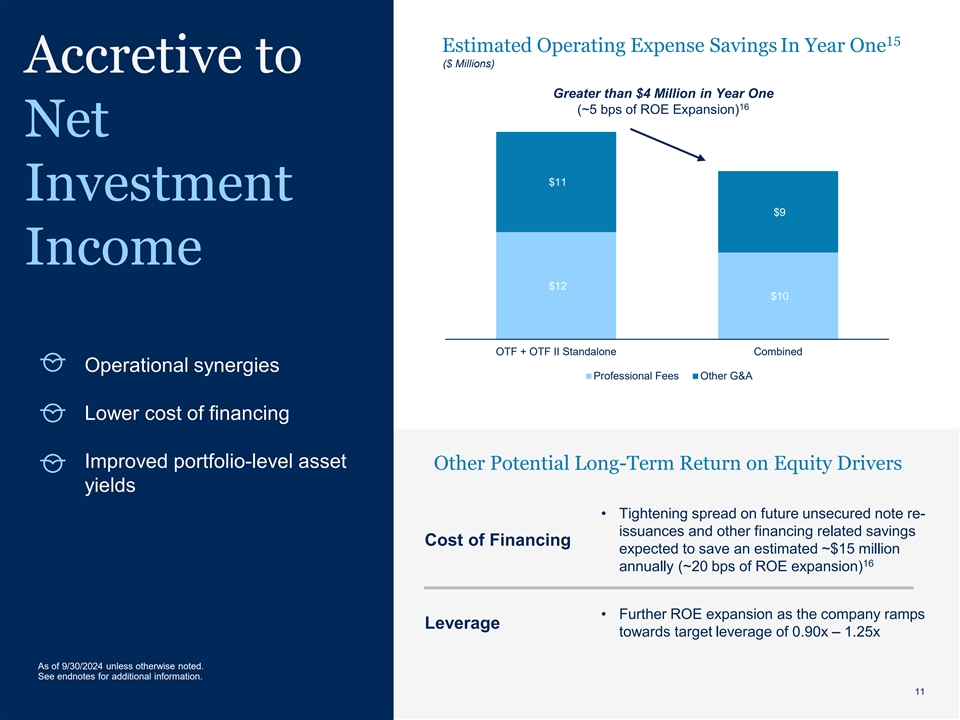
15 Estimated Operating Expense Savings In Year One ($ Millions) Accretive to Greater than $4 Million in Year One 16 (~5 bps of ROE Expansion) Net $11 Investment $9 Income $12 $10 OTF + OTF II Standalone Combined Operational synergies Professional Fees Other G&A Lower cost of financing Improved portfolio-level asset Other Potential Long-Term Return on Equity Drivers yields • Tightening spread on future unsecured note re- issuances and other financing related savings Cost of Financing expected to save an estimated ~$15 million 16 annually (~20 bps of ROE expansion) • Further ROE expansion as the company ramps Leverage towards target leverage of 0.90x – 1.25x As of 9/30/2024 unless otherwise noted. See endnotes for additional information. 11 11

Merger Consideration Structure Total merger consideration will be based on the net asset values of OTF and OTF II • OTF to acquire 100% of OTF II in a stock-for-stock merger, with shares of OTF II common stock to be exchanged for shares of OTF common stock on a NAV-for-NAV basis Merger Consideration • Proposed merger will result in an ownership split of the combined company proportional to Description each of OTF’s and OTF II’s respective net asset values at close • At closing, NAV per share used in determining the exchange ratio will reflect transaction expenses net of advisor reimbursement and any tax-related distributions $15.77 $16.95 OTF II NAV Per Share OTF NAV Per Share 0.9305x Merger Consideration Exchange Ratio 17 Illustrative Example 18 OTF OTF II Combined Total NAV ($mm) $3,576 $4,313 $7,888 Shares Outstanding (mm) 211 274 465 NAV Per Share $16.95 $15.77 $16.95 As of 9/30/2024 unless otherwise noted. Numbers may not sum due to rounding. See endnotes for additional information. 12
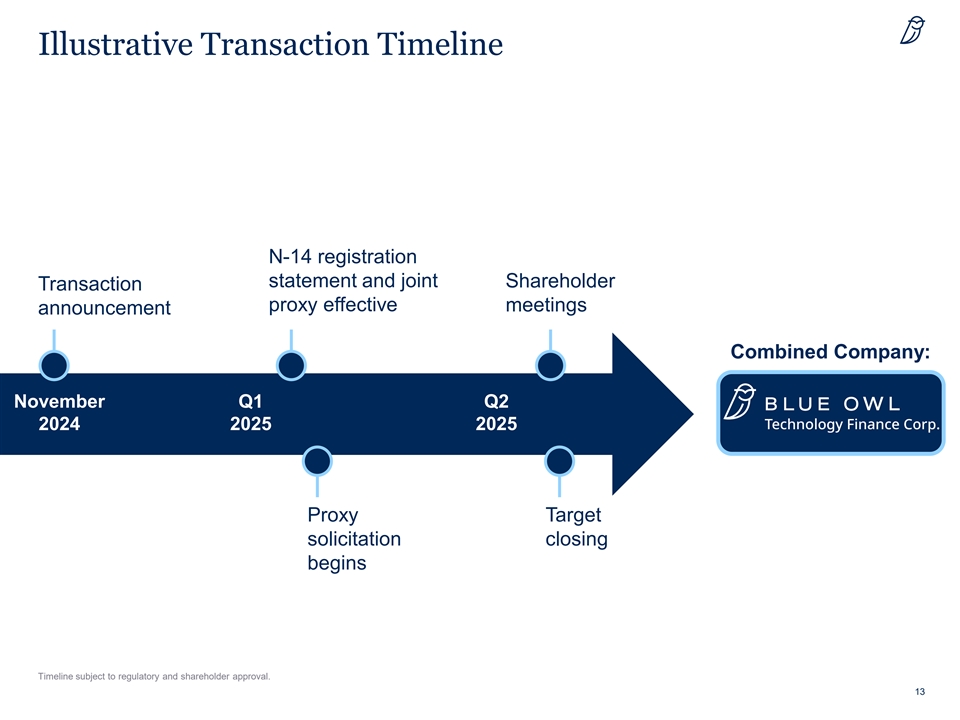
Illustrative Transaction Timeline N-14 registration statement and joint Shareholder Transaction proxy effective meetings announcement Combined Company: November Q1 Q2 2024 2025 2025 Proxy Target solicitation closing begins Timeline subject to regulatory and shareholder approval. 13
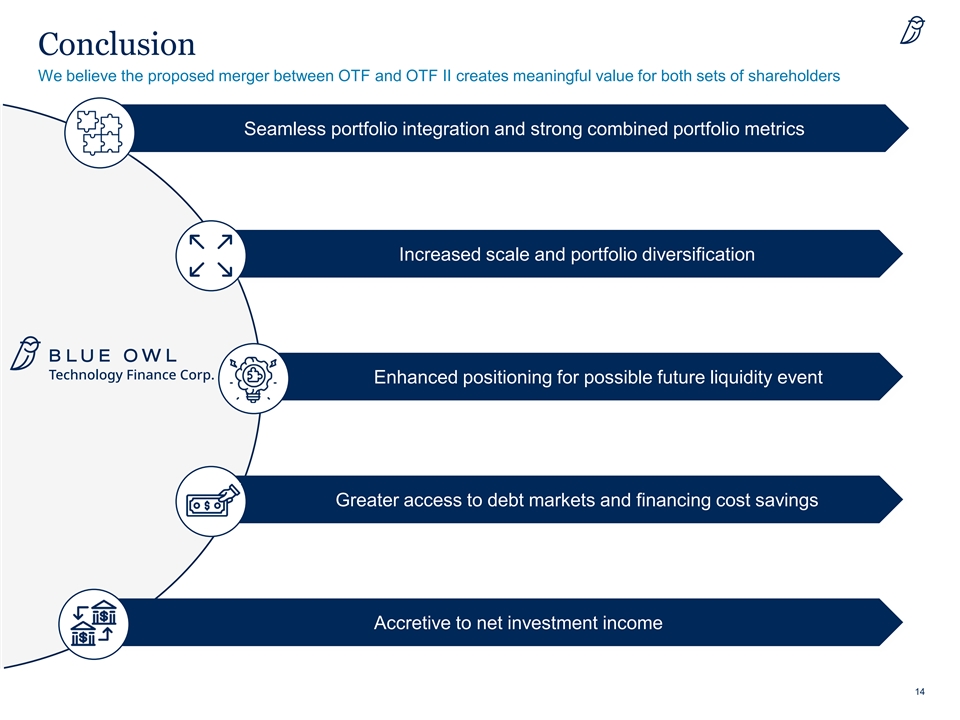
Conclusion We believe the proposed merger between OTF and OTF II creates meaningful value for both sets of shareholders XX Seamless portfolio integration and strong combined portfolio metrics 1 Increased scale and portfolio diversification 1 Enhanced positioning for possible future liquidity event 1 Greater access to debt markets and financing cost savings 1 Accretive to net investment income 1 14
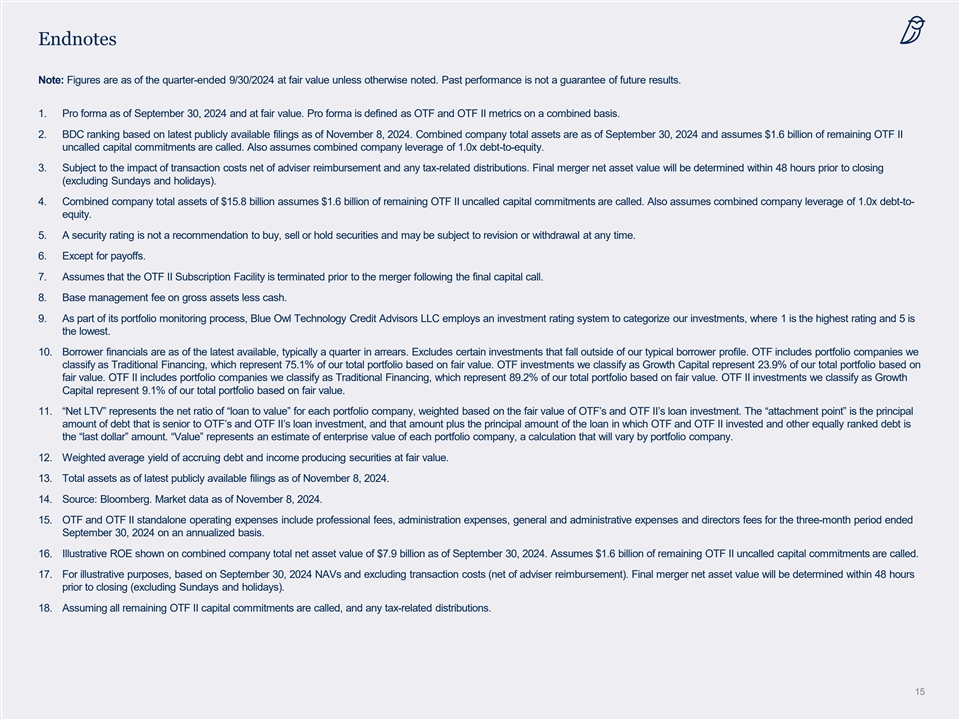
Endnotes Note: Figures are as of the quarter-ended 9/30/2024 at fair value unless otherwise noted. Past performance is not a guarantee of future results. 1. Pro forma as of September 30, 2024 and at fair value. Pro forma is defined as OTF and OTF II metrics on a combined basis. 2. BDC ranking based on latest publicly available filings as of November 8, 2024. Combined company total assets are as of September 30, 2024 and assumes $1.6 billion of remaining OTF II uncalled capital commitments are called. Also assumes combined company leverage of 1.0x debt-to-equity. 3. Subject to the impact of transaction costs net of adviser reimbursement and any tax-related distributions. Final merger net asset value will be determined within 48 hours prior to closing (excluding Sundays and holidays). 4. Combined company total assets of $15.8 billion assumes $1.6 billion of remaining OTF II uncalled capital commitments are called. Also assumes combined company leverage of 1.0x debt-to- equity. 5. A security rating is not a recommendation to buy, sell or hold securities and may be subject to revision or withdrawal at any time. 6. Except for payoffs. 7. Assumes that the OTF II Subscription Facility is terminated prior to the merger following the final capital call. 8. Base management fee on gross assets less cash. 9. As part of its portfolio monitoring process, Blue Owl Technology Credit Advisors LLC employs an investment rating system to categorize our investments, where 1 is the highest rating and 5 is the lowest. 10. Borrower financials are as of the latest available, typically a quarter in arrears. Excludes certain investments that fall outside of our typical borrower profile. OTF includes portfolio companies we classify as Traditional Financing, which represent 75.1% of our total portfolio based on fair value. OTF investments we classify as Growth Capital represent 23.9% of our total portfolio based on fair value. OTF II includes portfolio companies we classify as Traditional Financing, which represent 89.2% of our total portfolio based on fair value. OTF II investments we classify as Growth Capital represent 9.1% of our total portfolio based on fair value. 11. “Net LTV” represents the net ratio of “loan to value” for each portfolio company, weighted based on the fair value of OTF’s and OTF II’s loan investment. The “attachment point” is the principal amount of debt that is senior to OTF’s and OTF II’s loan investment, and that amount plus the principal amount of the loan in which OTF and OTF II invested and other equally ranked debt is the “last dollar” amount. “Value” represents an estimate of enterprise value of each portfolio company, a calculation that will vary by portfolio company. 12. Weighted average yield of accruing debt and income producing securities at fair value. 13. Total assets as of latest publicly available filings as of November 8, 2024. 14. Source: Bloomberg. Market data as of November 8, 2024. 15. OTF and OTF II standalone operating expenses include professional fees, administration expenses, general and administrative expenses and directors fees for the three-month period ended September 30, 2024 on an annualized basis. 16. Illustrative ROE shown on combined company total net asset value of $7.9 billion as of September 30, 2024. Assumes $1.6 billion of remaining OTF II uncalled capital commitments are called. 17. For illustrative purposes, based on September 30, 2024 NAVs and excluding transaction costs (net of adviser reimbursement). Final merger net asset value will be determined within 48 hours prior to closing (excluding Sundays and holidays). 18. Assuming all remaining OTF II capital commitments are called, and any tax-related distributions. 15
Disclosures Forward-Looking Statements Certain statements made in this presentation are “forward looking statements” within the meaning of the “safe harbor” provisions of the United States Private Securities Litigation Reform Act of 1995 because they relate to future events, future performance or financial condition of Blue Owl Technology Finance Corp. (“OTF”) or Blue Owl Technology Finance Corp. II (“OTF II”) or the proposed two-step merger of OTF and OTF II (the “Mergers”). When used in this presentation, the words “estimates,” “projected,” “expects,” “anticipates,” “forecasts,” “plans,” “intends,” “believes,” “seeks,” “may,” “will,” “would,” “should,” “future,” “propose,” “target,” “goal,” “objective,” “outlook” and variations of these words or similar expressions (or the negative versions of such words or expressions) are intended to identify forward-looking statements. These forward-looking statements are not guarantees of future performance, conditions or results, and involve a number of known and unknown risks, uncertainties, assumptions and other important factors, many of which are outside OTF’s and OTF II’s control, that could cause actual results or outcomes to differ materially from those discussed in the forward-looking statements. Any such forward-looking statements are made pursuant to the safe harbor provisions available under applicable securities laws and speak only as of the date of this presentation. OTF and OTF II assume no obligation to update or revise any such forward-looking statements except as required by law. Certain factors could cause actual results and conditions to differ materially from those projected, including the uncertainties associated with (i) the timing or likelihood of the Merger closing; (ii) the expected synergies and savings associated with the Mergers; (iii) the ability to realize the anticipated benefits of the Mergers, including the expected accretion to net investment income and the elimination or reduction of certain expenses and costs due to the Mergers; (iv) the percentage of OTF and OTF II shareholders voting in favor of the proposals submitted for their approval; (v) the possibility that competing offers or acquisition proposals will be made; (vi) the possibility that any or all of the various conditions to the consummation of the Mergers may not be satisfied or waived; (vii) risks related to diverting management’s attention from ongoing business operations; (viii) the risk that shareholder litigation in connection with the Mergers may result in significant costs of defense and liability; (ix) changes in the economy, financial markets and political environment; (x) the impact of geo-political conditions, including revolution, insurgency, terrorism or war, including those arising out of the ongoing war between Russia and Ukraine and the escalated conflict in the Middle-East, including the Israel-Hamas conflict, and general uncertainty surrounding the financial and political stability of the United States (including uncertainties related to the incoming administration), the United Kingdom, the European Union and China, on financial market volatility, global economic markets, and various markets for commodities globally such as oil and natural gas; (xi) future changes in law or regulations; (xii) conditions to OTF’s and OTF II’s operating areas, particularly with respect to business development companies or regulated investment companies; (xiii) an economic downturn, elevated interest and inflation rates, ongoing supply chain and labor market disruptions, including those as a result of strikes, work stoppages or accidents, instability in the U.S. and international banking systems, and the risk of recession or a shutdown of government services could impact business prospects of OTF and OTF II and their portfolio companies or following the closing of the Mergers, the combined company; (xiv) the ability of Blue Owl Technology Credit Advisors LLC to locate suitable investments for the combined company and to monitor and administer its investments; (xv) the ability of Blue Owl Technology Credit Advisors LLC to attract and retain highly talented professionals; and (xvi) other considerations that may be disclosed from time to time in OTF’s and OTF II’s publicly disseminated documents and filings with the Securities and Exchange Commission (“SEC”). The information contained in this presentation is summary information that is intended to be considered in the context of OTF’s and OTF II’s filings with the SEC and other public announcements that OTF or OTF II may make, by press release or otherwise, from time to time. OTF and OTF II also use their websites to distribute company information, including performance information, and such information may be deemed material. Accordingly, investors should monitor OTF’s and OTF II’s website (blueowlproducts.com/otf-otf-ii-merger). OTF and OTF II undertake no duty or obligation to publicly update or revise the forward-looking statements or other information contained in this presentation. These materials contain information about OTF, OTF II and their respective affiliates and certain of their respective personnel and affiliates, information about their respective historical performance and general information about the market. You should not view information related to the past performance of OTF and OTF II or information about the market, as indicative of future results, the achievement of which cannot be assured. 16
Disclosures Important Notice; No Offer or Solicitation No representations or warranties, express or implied are given in, or in respect of, this presentation. To the fullest extent permitted by law, in no circumstances will OTF, OTF II or any of their respective subsidiaries, shareholders, affiliates, representatives, partners, directors, officers, employees, advisers or agents be responsible or liable for any direct, indirect or consequential loss or loss of profit arising from use of this presentation, its contents, its omissions, reliance on the information contained within it, or on opinions communicated in relation thereto or otherwise arising in connection therewith. This presentation does not purport to be all-inclusive or to contain all of the information that may be required to make a full analysis of OTF and OTF II or the Mergers. Viewers of this presentation should each make their own evaluation of OTF, OTF II and the Mergers and of the relevance and adequacy of the information contained herein and should make sure other investigations as they deem necessary. This presentation does not constitute an offer to sell, or the solicitation of an offer to buy or sell, any securities, investment funds, vehicles or accounts, investment advice or any other service by OTF, OTF II or any of their respective affiliates or subsidiaries. Nothing in this presentation constitutes the provision of tax, accounting, financial, investment, regulatory, legal or other advice by OTF, OTF II or their respective advisors. Industry and Market Data This presentation may contain information obtained from third parties. Such information has not been independently verified and, accordingly, OTF and OTF II make no representation or warranty in respect of this information. Reproduction and distribution of third party content in any form is prohibited except with the prior written permission of the related third party. Third party content providers do not guarantee the accuracy, completeness, timeliness or availability of any information, including ratings, and are not responsible for any errors or omissions (negligent or otherwise), regardless of the cause, or for the results obtained from the use of such content. THIRD PARTY CONTENT PROVIDERS GIVE NO EXPRESS OR IMPLIED WARRANTIES, INCLUDING, BUT NOT LIMITED TO, ANY WARRANTIES OF MERCHANTABILITY OR FITNESS FOR A PARTICULAR PURPOSE OR USE. THIRD PARTY CONTENT PROVIDERS SHALL NOT BE LIABLE FOR ANY DIRECT, INDIRECT, INCIDENTAL, EXEMPLARY, COMPENSATORY, PUNITIVE, SPECIAL OR CONSEQUENTIAL DAMAGES, COSTS, EXPENSES, LEGAL FEES, OR LOSSES (INCLUDING LOST INCOME OR PROFITS AND OPPORTUNITY COSTS OR LOSSES CAUSED BY NEGLIGENCE) IN CONNECTION WITH ANY USE OF THEIR CONTENT, INCLUDING RATINGS. Credit ratings are statements of opinions and are not statements of fact or recommendations to purchase, hold or sell securities. They do not address the suitability of securities or the suitability of securities for investment purposes, and should not be relied on as investment advice. Additional Information and Where to Find It In connection with the Mergers, OTF and OTF II plan to file with the SEC and mail to their respective shareholders a joint proxy statement/prospectus (the “Joint Proxy Statement”) and OTF plans to file with the SEC a registration statement on Form N-14 (the “Registration Statement”) that will include the Joint Proxy Statement and a prospectus of OTF. The Joint Proxy Statement and Registration Statement will each contain important information about OTF, OTF II, the Mergers and related matters. This presentation does not constitute an offer to sell or the solicitation of an offer to buy any securities or a solicitation of any vote or approval. No offer of securities shall be made except by means of a prospectus meeting the requirements of Section 10 of the Securities Act of 1933, as amended. SHAREHOLDERS OF OTF AND OTF II ARE URGED TO READ THE JOINT PROXY STATEMENT AND THE REGISTRATION STATEMENT AND OTHER DOCUMENTS THAT ARE FILED OR WILL BE FILED WITH THE SEC AS WELL AS ANY AMENDMENTS OR SUPPLEMENTS TO THESE DOCUMENTS CAREFULLY AND IN THEIR ENTIRETY WHEN THEY BECOME AVAILABLE BECAUSE THEY WILL CONTAIN IMPORTANT INFORMATION ABOUT OTF, OTF II, THE MERGERS AND RELATED MATTERS. Investors and security holders will be able to obtain the documentation filed with the SEC free of charge at the SEC’s website, http://www.sec.gov and for documents filed by OTF and OTF II. Participation in the Solicitation OTF, its directors, certain of its executive officers and certain employees and officers of Blue Owl Technology Credit Advisors LLC and its affiliates may be deemed to be participants in the solicitation of proxies in connection with the Mergers. Information about directors and executive officers of OTF is set forth in its proxy statement for its 2024 Annual Meeting of Shareholders, which was filed with the SEC on March 28, 2024. OTF II, its directors, certain of its executive officers and certain employees and officers of Blue Owl Technology Credit Advisors II LLC and its affiliates may be deemed to be participants in the solicitation of proxies in connection with the Mergers. Information about directors and executive officers of OTF II is set forth in its proxy statement for its 2024 Annual Meeting of Shareholders, which was filed with the SEC on March 28, 2024. Information regarding the persons who may, under the rules of the SEC, be considered participants in the solicitation of the OTF and OTF II shareholders in connection with the Mergers will be contained in the Joint Proxy Statement when such document becomes available. These documents may be obtained free of charge from the sources indicated above. 17
Disclaimer Past performance is not a guide to future results and is not indicative of expected realized returns. As of September 30, 2024. Assets Under Management (“AUM”) refers to the assets that Credit manages and are generally equal to the sum of (i) net asset value (“NAV”); (ii) drawn and undrawn debt; and (iii) uncalled capital commitments. This presentation contains proprietary information regarding Blue Owl Capital Inc. (“Blue Owl”), its affiliates and investment program, funds sponsored by Blue Owl, including the Credit Funds, the GP Strategic Capital Funds and the Real Estate Funds (collectively the “Blue Owl Funds”) as well as investment held by the Blue Owl Funds. This presentation and the information contained in this presentation may not be reproduced or distributed to persons other than the recipient or its advisors. The views expressed and, except as otherwise indicated, the information provided are as of the report date and are subject to change, update, revision, verification, and amendment, materially or otherwise, without notice, as market or other conditions change. Since these conditions can change frequently, there can be no assurance that the trends described herein will continue or that any forecasts are accurate. In addition, certain of the statements contained in this presentation may be statements of future expectations and other forward-looking statements that are based on the current views and assumptions of Blue Owl and involve known and unknown risks and uncertainties (including those discussed below) that could cause actual results, performance, or events to differ materially from those expressed or implied in such statements. These statements may be forward-looking by reason of context or identified by words such as “may, will, should, expects, plans, intends, anticipates, believes, estimates, predicts, potential or continue” and other similar expressions. Neither Blue Owl, its affiliates, nor any of Blue Owl’s or its affiliates' respective advisers, members, directors, officers, partners, agents, representatives or employees or any other person (collectively the “Blue Owl Entities”) is under any obligation to update or keep current the information contained in this document. This presentation contains information from third party sources which Blue Owl has not verified. No representation or warranty, express or implied, is given by or on behalf of the Blue Owl Entities as to the accuracy, fairness, correctness or completeness of the information or opinions contained in this presentation and no liability whatsoever (in negligence or otherwise) is accepted by the Blue Owl Entities for any loss howsoever arising, directly or indirectly, from any use of this presentation or its contents, or otherwise arising in connection therewith. This presentation contains certain prospective financial information with respect to OTF’s estimated future performance. OTF’s independent auditors have not audited, reviewed, compiled, or performed any procedures with respect to such information for the purpose of their inclusion in this presentation and, accordingly, have not expressed an opinion or provided any other form of assurance with respect thereto for purposes of the presentation. In this presentation, certain of such prospective financial information has been included (in each case, with an indication that the information is an estimate and is subject to the qualifications presented herein) for purposes of providing comparisons with historical data. The assumptions and estimates underlying the prospective financial information are inherently uncertain and are subject to a wide variety of significant business, economic and competitive risks and uncertainties that could cause actual results to differ materially from those contained in the prospective financial information. There can be no assurance that the prospective financial information is indicative of the future performance of OTF or that actual results will not differ materially from those presented in the prospective financial information. Inclusion of prospective financial information in this presentation should not be regarded as a representation by any person that the results contained in the prospective financial information will be achieved. The prospective financial information reflects assumptions that are subject to change, and there can be no assurance that OTF’s financial condition or results of operations will be consistent with those set forth in such prospective financial information. The prospective financial information, guidance and other forward-looking statements included herein are effective only on the date given. We will not update, reaffirm or otherwise comment on any prospective financial information, guidance or other forward-looking statements in connection with this presentation, except as may be required by law. No reference made to any prior financial guidance or other forward-looking statements in connection with this presentation should be construed to update, reaffirm or otherwise comment on such prior financial guidance or other forward-looking statements. All investments are subject to risk, including the loss of the principal amount invested. These risks may include limited operating history, uncertain distributions, inconsistent valuation of the portfolio, changing interest rates, leveraging of assets, reliance on the investment advisor, potential conflicts of interest, payment of substantial fees to the investment advisor and the dealer manager, potential illiquidity, and liquidation at more or less than the original amount invested. Diversification will not guarantee profitability or protection against loss. Performance may be volatile, and the NAV may fluctuate. Performance Information: Where performance returns have been included in this presentation, Blue Owl has included herein important information relating to the calculation of these returns as well as other pertinent performance related definitions. All investments are subject to risk, including the loss of the principal amount invested. These risks may include limited operating history, uncertain distributions, inconsistent valuation of the portfolio, changing interest rates, leveraging of assets, reliance on the investment advisor, potential conflicts of interest, payment of substantial fees to the investment advisor and the dealer manager, potential illiquidity, and liquidation at more or less than the original amount invested. Diversification will not guarantee profitability or protection against loss. Performance may be volatile, and the NAV may fluctuate. This material is for informational purposes only and is not an offer or a solicitation to sell or subscribe for any fund and does not constitute investment, legal, regulatory, business, tax, financial, accounting, or other advice or a recommendation regarding any securities of Blue Owl, of any fund or vehicle managed by Blue Owl, or of any other issuer of securities. Only a definitive offering document (i.e.: Prospectus or Private Placement Memorandum) can make such an offer. Neither the Securities and Exchange Commission, the Attorney General of the State of New York nor any state securities commission has approved or disapproved of these securities or determined if the Prospectus or Private Placement Memorandum is truthful or complete. Any representation to the contrary is a criminal offense. Securities are offered through Blue Owl Securities LLC, member of FINRA/SIPC, as Dealer Manager. Copyright© Blue Owl Capital Inc. 2024 All rights reserved. This presentation is proprietary and may not be reproduced, transferred, or distributed in any form without prior written permission from Blue Owl. It is delivered on an “as is” basis without warranty or liability by accepting the information, you agree to abide by all applicable copyright and other laws, as well as any additional copyright notices or restrictions contained in the information. 18