As filed with the U.S. Securities and Exchange Commission on March 12, 2024
UNITED STATES
SECURITIES AND EXCHANGE COMMISSION
Washington, D.C. 20549
FORM N-CSR
CERTIFIED SHAREHOLDER REPORT OF REGISTERED
MANAGEMENT INVESTMENT COMPANIES
Investment Company Act file number: 811-23389
Ellington Income Opportunities Fund
(Exact name of registrant as specified in charter)
8500 Normandale Lake Blvd. Ste 1900
Minneapolis, MN 55437
(Address of principal executive offices) (Zip code)
John L. Sabre
8500 Normandale Lake Blvd. Ste 1900
Minneapolis, MN 55437
(Name and address of agent for service)
952-897-5390
Registrant's telephone number, including area code
Date of fiscal year end: December 31
Date of reporting period: December 31, 2023
Item 1. Reports to Stockholders.

ANNUAL REPORT
December 31, 2023
Ellington Income Opportunities Fund
Table OF CONTENTS
| Shareholder Letter (Unaudited) | 1 |
| Allocation of Portfolio Assets (Unaudited) | 4 |
| Schedule of Investments | 5 |
| Statement of Assets and Liabilities | 8 |
| Statement of Operations | 9 |
| Statements of Changes in Net Assets | 10 |
| Statement of Cash Flows | 11 |
| Financial Highlights | 12 |
| Notes to Financial Statements | 14 |
| Report of the Independent Registered Public Accounting Firm | 27 |
| Additional Information | 28 |
| Broad Approval of Management Agreement (Unaudited) | 29 |
| Trustees and Executive Officers (Unaudited) | 31 |
Ellington Income Opportunities Fund
SHAREHOLDER LETTER (Unaudited)
December 31, 2023

Dear Shareholder,
We are pleased to present the annual report for the Ellington Income Opportunities Fund (the “Fund”). The Fund’s Class M shares generated a net return of 17.57% and a 12-month distribution rate of 9.50% for the year ended December 31, 2023. Since its November 13, 2018 inception, the Class M share had an annualized return of 4.64%.
The Ellington Income Opportunities Fund invests opportunistically across Ellington’s global credit platform to provide investors with exposure to structured credit and other non-traditional credit sectors. Within the structured credit universe, the Fund targets legacy, floating-rate, asset-backed securities which are not broadly correlated to credit markets and rates. Target sectors include pre-crisis non-agency RMBS, secondary CLOs, and CMBS securities. In addition to liquid structured credit, the Fund’s quarterly liquidity profile allows the Fund to provide access to niche opportunistic credit strategies not widely available in the registered fund space. Within this portion of the portfolio, we target sectors where post-crisis regulation limits bank competition and where opportunities are not sufficiently scalable to attract large investment managers. The Fund seeks total return through both current income and capital gains.
The theme of market volatility and investor uncertainty continued as 2023 kicked off with a regional banking crisis in March, a debt ceiling standoff with the threat of a government shutdown, and the Federal Reserve raising rates four times, bringing the Federal Funds rate to its highest level in 22 years. Despite these negative headwinds, markets were able to look past the uncertainty and ended the year just off all-time highs. In the equities markets, the S&P 500 driven by the Magnificent 71 generated a 26.29% return, while the MSCI ACWI returned 22.81% for the year. In the credit markets, performance lagged equities but remained positive, with the Bloomberg US Corporate High Yield Index posting a 13.45% return while the Bloomberg US Aggregate Index produced a return of 5.53% for the year.
After seven rate hikes in 2022, the Federal Reserve continued to raise rates four more times, pushing the Federal Funds rate to a level not seen since 2001. The July rate hike proved to be the last of the year, as the Federal Reserve held rates steady through the December meeting. During the December Federal Open Market Committee meeting, participants acknowledged that inflation was coming under control and projected rate cuts to begin in 2024. A majority of policymakers anticipate at least three rate cuts in 2024 and now view overly restrictive monetary policy as a primary risk to the economy moving forward. The rate cuts are supported by the Personal Consumption Expenditures Price index which saw inflation fall to 2.6% in November. The series recorded a negative print for the month, which was the first occurrence since April 2020. Additionally, the December preliminary reading of the University of Michigan’s consumer-confidence survey continued to defy expectations of a weaking U.S. consumer and saw a 13% increase over the prior month. These data points further solidified confidence in the Federal Reserve's ability to achieve a soft landing.
| 1 | The “Magnificent 7” is a group of U.S. stocks consisting of Microsoft (MSFT), Amazon (AMZN), Meta (META), Apple (AAPL), Google parent Alphabet (GOOGL), Nvidia (NVDA), and Tesla (TSLA) |
Ellington Income Opportunities Fund
SHAREHOLDER LETTER (Unaudited)
December 31, 2023
Despite broad market volatility in the first half of the year the Fund was able to significantly outperform its benchmarks on an absolute and risk adjusted basis. We expect to see further outperformance as the Fund’s current positioning is benefiting from multiple tailwinds while also continuing to generate significant income with the 12-month distribution yield currently at 9.50%.
We expect structured credit markets to outperform in the near term driven by money managers putting cash to work and dealers seeking to replenish inventories. A flattening of the credit curve is underway as some managers reach for riskier assets due to low aggregate supply. In response to strong demand, we intend to strategically upgrade the portfolio where possible. The preferred strategy is selling new issue bonds with higher potential downside risk and retaining seasoned assets. We believe seasoned assets with lower credit sensitivity will outperform if credit conditions deteriorate without a substantial reduction in expected return in an upside scenario. Given the market’s current lack of consensus on the speed and direction of future rate movements we will continue to have a bias towards floating rate assets which will benefit the Fund should higher interest rates last longer than anticipated.
Within the Fund’s residential mortgage holdings, Credit Risk Transfers (CRT) securities contributed to outperformance throughout 2023. The sector experienced increased tender offers, resulting in a reduction of supply, and driving the overall net supply to approximately negative $2 billion by year end. This technical factor in combination with strong fundamental performance in the U.S. housing market drove the positive price action and outperformance. We expect this trend to continue due to robust housing market fundamentals, strong credit performance, and net negative supply leading to an increased investor appetite for the sector.
Lastly, in our view, the conservative risk positioning and the focus on defensive sectors will allow the fund to take advantage of any potential dislocations resulting from future market movements. One area we see potential for advantageous investment conditions is in the commercial real estate sector due to continuing stress from depressed property valuations and increased vacancies. Though we expect to maintain a bias towards high quality residential-backed floating rate assets, we believe this positioning allows us flexibility to move into more opportunistic sectors as circumstances evolve. Furthermore, we are excited about the Fund’s ability to continue aggregating niche, less-scalable opportunistic credit strategies as we seek to add substantial alpha to the overall portfolio.
Thank you for your investment in and support of the Fund.
Ellington Income Opportunities Fund
SHAREHOLDER LETTER (Unaudited)
December 31, 2023
PERFORMANCE2 as of December 31, 2023
| | 1 Month | QTD | YTD | 1 Year | Since Inception3 |
| Class M (EIOMX) | 2.61% | 4.72% | 17.57% | 17.57% | 4.64% |
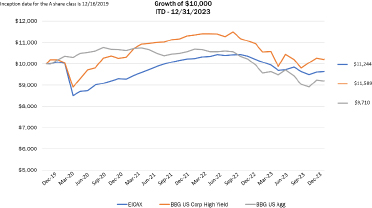
| Class A (EIOAX) | 2.56% | 4.52% | 16.89% | 16.89% | 3.00% |
| Bloomberg US Corporate High Yield Index | 3.73% | 7.16% | 13.45% | 13.45% | 4.63% |
| Bloomberg US Aggregate Bond Index | 3.83% | 6.82% | 5.53% | 5.53% | 1.53% |
Class M Growth of $10,000,000 initial investment

Class A Growth of $10,000
| 2 | The performance data quoted here represents past performance. Beginning November 13, 2018, the Fund was offered through a confidential private placement memorandum and became registered under the Investment Company Act of 1940. On June 10, 2019, the Fund became registered under the Securities and Exchange Act of 1933. The performance history is net of all fees (including a monthly advisory fee of 1.85% per annum) and expenses and reflects the reinvestment of dividends and investment income. Depending on an investor’s investment date, holding period, and other factors, an investor may have an overall performance that underperforms or outperforms that reflected above. Investment return and principal value will fluctuate so that shares, when redeemed may be worth more or less than their original cost. Had the Adviser not waived its fees and reimbursed expenses, the Fund's total returns would have been lower. Past performance is no guarantee of future results. |
| | The Bloomberg US Corporate High Yield Bond Index measures the USD-denominated, high yield, fixed-rate corporate bond market. The Bloomberg US Aggregate Bond Index is a broad-based benchmark that measures the investment-grade, US dollar-denominated, fixed-rate taxable bond market. Investors cannot invest directly in an index. |
| 3 | The Fund commenced operations on November 13, 2018. Since Inception returns are presented on an annualized basis. |
Ellington Income Opportunities Fund
ALLOCATION OF PORTFOLIO ASSETS(1)
December 31, 2023 (Unaudited)
(Expressed as a Percentage of Net Assets)

| (1) | Fund holdings are subject to change and there is no assurance that the Fund will continue to hold any particular security. |
Please see the Schedule of Investments for a detailed listing of the Fund's holdings.
Ellington Income Opportunities Fund
SCHEDULE OF INVESTMENTS
December 31, 2023
Current Principal Amount/
Shares | | | Description | | Rate (2) | | | Maturity | | | Percentage of Net Assets | | | Fair Value | |
| Asset Backed Securities (111.13%)(1) | | | | | | | | | | | | | | | | |
| Aircraft (25.61%) | | | | | | | | | | | | | | | | |
| | 1,743,756 | | | AASET 2021-1A C (4) | | | 5.82 | % | | | 11/16/2041 | | | | 4.83 | % | | $ | 1,304,150 | |
| | 778,125 | | | Blackbird Capital Aircraft 2021-1A B (4) | | | 3.45 | % | | | 07/15/2046 | | | | 2.46 | % | | | 664,127 | |
| | 1,310,000 | | | Midland Loan Services LP - Rental ABS (4) | | | 8.19 | % | | | 04/17/2037 | | | | 4.77 | % | | | 1,286,678 | |
| | 837,227 | | | Raptor Aircraft Finance LLC 2019-1 A (4) | | | 4.21 | % | | | 08/23/2044 | | | | 2.55 | % | | | 686,686 | |
| | 1,201,071 | | | SALTT 2021-1A D 02/28/2033(4) | | | 7.14 | % | | | 02/28/2033 | | | | 3.50 | % | | | 943,092 | |
| | 1,050,000 | | | Skyline Aircraft Finance LLC (Westjet) (6) | | | 0.00 | % | | | 07/15/2029 | | | | 3.43 | % | | | 924,000 | |
| | 1,286,985 | | | SOLRR Aircraft 2021-1 C (4) | | | 5.68 | % | | | 10/15/2046 | | | | 4.07 | % | | | 1,097,683 | |
| | | | | | | | | | | | | | | 6,906,416 | |
| Collateralized Loan Obligations (20.95%) | | | | | | | | | | | | | | | | |
| | 2,100,000 | | | AXA Investment managers - Allegro CLO Ltd. 2018-1A SUB (4) | | | 0.00 | % | | | 06/13/2031 | | | | 1.83 | % | | | 493,500 | |
| | 1,000,000 | | | Blue Mountain Capital Management CLO 2018-2A SUB (4)(6) | | | 0.00 | % | | | 08/15/2031 | | | | 0.48 | % | | | 128,482 | |
| | 1,000,000 | | | Diamond CLO 2019-1A E (3 Month LIBOR USD + 8.05%, 8.05% Floor) (4)(5) | | | 13.69 | % | | | 04/25/2029 | | | | 3.66 | % | | | 986,770 | |
| | 1,250,000 | | | Greywolf Capital Management CLO 2019-1A SUBB (4) | | | 0.00 | % | | | 04/17/2034 | | | | 2.18 | % | | | 587,500 | |
| | 600,000 | | | MJX Asset Management - Venture CDO Ltd. 2018-32A SUB (4)(6) | | | 0.00 | % | | | 07/18/2031 | | | | 0.36 | % | | | 96,121 | |
| | 1,100,000 | | | MJX Asset Management - Venture XXIV CDO Ltd. 2016-24A SUB (4)(6) | | | 0.00 | % | | | 10/20/2028 | | | | 0.18 | % | | | 49,500 | |
| | 470,000 | | | MJX Asset Management - Venture CDO Ltd. 2018-34A SUB (4) | | | 0.00 | % | | | 10/15/2031 | | | | 0.44 | % | | | 117,500 | |
| | 5,000,000 | | | Neuberger Berman CLO Series 2019-35A(4)(6) | | | 3.64 | % | | | 01/19/2033 | | | | 2.51 | % | | | 680,735 | |
| | 1,400,000 | | | OFS Capital Management CLO 2018-1A SUB (4)(6) | | | 0.00 | % | | | 07/31/2118 | | | | 1.04 | % | | | 280,000 | |
| | 1,332,000 | | | OFSBS-2018-1A-FEE (6) | | | | | | | | | | | 0.02 | % | | | 6,660 | |
| | 800,000 | | | Par-Four Investment Managers -Tralee CDO 2018-5A SUB (4) | | | 0.00 | % | | | 10/20/2034 | | | | 1.16 | % | | | 312,000 | |
| | 50,000 | | | Par-Four Investment Managers - Tralee CDO 2018-5A FR (3 Month LIBOR USD + 8.89%, 8.89% Floor) (4)(6) | | | 14.57 | % | | | 10/20/2034 | | | | 0.14 | % | | | 37,278 | |
| | 1,000,000 | | | Venture CDO Ltd 2016-25A E (4)(5) | | | 12.88 | % | | | 04/20/2029 | | | | 3.28 | % | | | 885,261 | |
| | 1,200,000 | | | Vibrant CLO Ltd 2018-8A SUB (4)(6) | | | 0.00 | % | | | 01/20/2031 | | | | 0.20 | % | | | 54,000 | |
| | 1,100,000 | | | Voya Alternative Asset Management CLO 2018-1A SUB (4) | | | 0.00 | % | | | 04/19/2031 | | | | 0.86 | % | | | 231,000 | |
| | 1,000,000 | | | Zais Group CLO Ltd. 2017-1A E (4)(5) | | | 12.66 | % | | | 07/15/2029 | | | | 2.61 | % | | | 704,808 | |
| | | | | | | | | | | | | | | 5,651,115 | |
| Commercial Mortgage Backed Securities (18.34%) | | | | | | | | | | | | | | | | |
| | 1,000,000 | | | AMSR Mortgage Trust 2020-SFR1 Class H (4) | | | 5.30 | % | | | 04/17/2037 | | | | 3.54 | % | | | 955,238 | |
| | 1,100,000 | | | Cross Harbor CP 2021-FL1 D (1 Month LIBOR USD + 3.00%, 3.00% Floor) (4)(5) | | | 8.47 | % | | | 02/15/2038 | | | | 3.89 | % | | | 1,050,614 | |
| | 750,000 | | | Progress Residential Trust 2021 - SFR3 H (4) | | | 4.75 | % | | | 05/17/2026 | | | | 2.52 | % | | | 679,314 | |
| | 2,500,000 | | | TPG Real Estate Finance 2021-FL4 Class D (1 Month LIBOR + 3.60%, 3.60% Floor) (4)(5) | | | 9.08 | % | | | 03/15/2038 | | | | 8.39 | % | | | 2,263,478 | |
| | | | | | | | | | | | | | | 4,948,644 | |
| Confirmation of Originator Fee Certificates (2.55%) | | | | | | | | | | | | | | | | |
| | 8,560,740 | | | SBA Confirmation of Originator Fee Certificates (6)(7) | | | Various(7) | | | | Various(7) | | | | 2.55 | % | | | 686,434 | |
| | | | | | | | | | | | | | | | | | | | | |
| Residential Mortgage-Backed Securities (43.68%) | | | | | | | | | | | | | | | | |
| | 192,300 | | | Bear Stearns Mortgage Funding Series 2007-AR1 (1 Month LIBOR + 0.20%, 0.20% Floor, 11.50% Cap) (3)(6) | | | 5.67 | % | | | 02/25/2037 | | | | 0.69 | % | | | 185,599 | |
| | 158,209 | | | Countrywide Alternative Loan Trust Series 2006-J5 | | | 6.50 | % | | | 09/25/2036 | | | | 0.34 | % | | | 88,814 | |
| | 258,531 | | | Countrywide Home Loan Series 2002-19 (6) | | | 6.25 | % | | | 11/25/2032 | | | | 0.91 | % | | | 246,618 | |
| | 51,888 | | | Countrywide Home Loan Series 2003-49 | | | 5.26 | % | | | 12/19/2033 | | | | 0.18 | % | | | 47,870 | |
| | 577,902 | | | Countrywide Home Loan Series 2004-18 (6) | | | 6.00 | % | | | 10/25/2034 | | | | 1.65 | % | | | 445,172 | |
| | 1,080,000 | | | Fannie Mae Series 22-R04 (1 Month SOFR + 9.50%, 0.00% Floor) (4)(5) | | | 14.84 | % | | | 03/25/2042 | | | | 4.48 | % | | | 1,209,600 | |
| | 1,000,000 | | | Countrywide Home Loan Series 2003-49(4) | | | 10.84 | % | | | 12/25/2041 | | | | 3.73 | % | | | 1,006,250 | |
| | 5,879 | | | HarborView Mortgage Loan Trust Series 2004-9 (6) | | | 7.06 | % | | | 12/19/2034 | | | | 0.02 | % | | | 5,080 | |
| | 58,056 | | | IndyMac INDX Mortgage Loan Trust Series 2006-AR25 | | | 3.18 | % | | | 09/25/2036 | | | | 0.19 | % | | | 52,267 | |
| | 23,778 | | | JP Morgan Mortgage Trust Series 2006-A1 | | | 5.77 | % | | | 02/25/2036 | | | | 0.07 | % | | | 17,614 | |
| | 1,692,863 | | | LMAT 2017 - RPL1 B (4)(5) | | | 4.91 | % | | | 01/28/2070 | | | | 5.68 | % | | | 1,532,069 | |
| | 29,084 | | | Prime Mortgage Trust Series 2003-3(4) | | | 5.98 | % | | | 01/25/2034 | | | | 0.05 | % | | | 13,478 | |
| | 365,884 | | | Residential Asset Securitization Trust (6) | | | 5.60 | % | | | 02/25/2034 | | | | 0.91 | % | | | 245,142 | |
| | 2,020,000 | | | STAR 2022-SFR3 F (4)(5) | | | 9.86 | % | | | 05/17/2024 | | | | 7.28 | % | | | 1,962,513 | |
| | 118,192 | | | Structured Asset Securities Corporation 2003-9A | | | 6.60 | % | | | 03/25/2033 | | | | 0.24 | % | | | 64,712 | |
| | 1,000,000 | | | US Uninsured Agency 2020-DNA1 B2 (1 Month LIBOR + 5.25%, 0.00% Floor) (4) | | | 10.70 | % | | | 01/25/2050 | | | | 3.83 | % | | | 1,033,750 | |
| | 500,000 | | | US Uninsured Agency 2019-DNA3 B2 (1 Month LIBOR + 8.15%, 0.00% Floor) (4)(5) | | | 13.60 | % | | | 07/25/2049 | | | | 2.09 | % | | | 563,750 | |
| | 1,000,000 | | | US Uninsured Agency2020-HQA2 (1 Month LIBOR + 7.60%, 0.00% Floor) (4)(5) | | | 13.05 | % | | | 03/25/2050 | | | | 4.12 | % | | | 1,111,297 | |
| | 1,000,000 | | | US Uninsured Agency2020-HQA2 (1 Month LIBOR + 7.60%, 0.00% Floor) (4) | | | 11.59 | % | | | 10/25/2033 | | | | 4.00 | % | | | 1,080,000 | |
| | 899,955 | | | Raistone - First Brands Supply Chain Finance Program(6) | | | 0.00 | % | | | 04/03/2024 | | | | 3.22 | % | | | 871,508 | |
| | | | | | | | | | | | | | | | | | | | 11,783,103 | |
| | | | | | | | | | | | | | | | | | | | | |
| Total Asset Backed Securities (Cost $34,763,016) | | | | | | | | | | | | | | | 29,975,712 | |
See Accompanying Notes to the Financial Statements
Ellington Income Opportunities Fund
SCHEDULE OF INVESTMENTS (continued)
December 31, 2023
| Quantity | | | Description | | Rate | | | Percentage of Net | | | Fair Value | |
| Preferred Stocks (5.58%) (1) | | | | | | | | | | | | |
| Other REITS (5.58%) | | | | | | | | | | | | |
| | 49,521 | | | AGNC Investment Corp, Class B, Series F | | | 6.13 | % | | | 3.99 | % | | $ | 1,077,577 | |
| | 1,594 | | | Annaly Capital Management, Class B | | | 6.50 | % | | | 0.15 | % | | | 39,372 | |
| | 11,334 | | | MFA Financial Inc., Class B | | | 6.50 | % | | | 0.89 | % | | | 240,281 | |
| | 7,054 | | | New Residential Inv Corp, Class B | | | 6.38 | % | | | 0.55 | % | | | 148,345 | |
| | | | | | | | | | | | | | | | 1,505,575 | |
| | | | | | | | | | | | | | | | | |
| Total Preferred Stocks (Cost $1,742,244) | | | | | | | | | | | 1,505,575 | |
| | | | | | | | | | | | | | | | | |
| Short-Term Investments - Investment Companies (13.64%) (1) | | | | | | | | | | | | |
| | 3,680,290 | | | First American Government Obligation - Class X | | | 5.29 | % | | | 13.64 | % | | | 3,680,290 | |
| Total Short-Term Investments - Investment Companies (Cost $3,680,290) | | | | | | | | | | | 3,680,290 | |
| | | | | | | | | | | | | | | | | |
| Total Investments (130.35%) (1) (Cost $40,185,550) | | | | | | | | | | | 35,161,577 | |
| Reverse Purchase Agreements (-31.50%) | | | | | | | | | | | (8,498,000 | ) |
| Other Assets in Excess of Liabilities (1.15%) (1) | | | | | | | | | | | 310,781 | |
| Total Net Assets Applicable to Unitholders (100.00%) (1) | | | | | | | | | | $ | 26,974,358 | |
| (1) | Percentages are stated as a percent of net assets. |
| (2) | Rate reported is the current yield as of December 31, 2023. |
| (3) | Step-up bond that pays an initial spread for the first period and then a higher spread for the following periods. Spread shown is as of period end. |
| (4) | 144(a) - Security was purchased pursuant to Rule 144a under the Securities Act of 1933 and may not be resold subject to that rule, except to qualified institutional buyers. As of December 31, 2023, these securities amounted to $26,088,222 or 96.71% of net assets. |
| (5) | Collateral or partial collateral for securities sold subject to repurchase. As of December 31, 2023, these securities amounted to $12,270,160 or 45.49% of net assets. |
| (6) | Security is categorized as Level 3 per the Fund's fair value hierarchy. As of December 31, 2023, these securities amounted to $4,942,329 or 18.32% of net assets. |
| (7) | This security represents a basket of interest only strips. Please refer to Note 7 in these financial statements regarding "Additional Disclosure of SBA Confirmation of Originator Fee Certificates Custom Basket Holdings" for additional information. |
See Accompanying Notes to the Financial Statements
Ellington Income Opportunities Fund
SCHEDULE OF INVESTMENTS (continued)
December 31, 2023
Centrally Cleared Interest Rate Swaps
| Counterparty | | Fixed Annual Rate | | | Floating Rate Index | | Floating Rate Paid or Received | | Payment Frequency | | Maturity Date | | Notional Amount | | | Upfront Premium Paid / (Received) | | | Unrealized Appreciation / (Depreciation) | | | Fair Value | |
| J.P. Morgan | | | 2.61 | % | | SOFR | | Received | | Annually | | 08/09/2032 | | $ | 758,511 | | | $ | (1,999 | ) | | $ | 49,602 | | | $ | 47,603 | |
| | | | | | | | | | | | | | | | | | | $ | (1,999 | ) | | $ | 49,602 | | | $ | 47,603 | |
See Accompanying Notes to the Financial Statements
Ellington Income Opportunities Fund
STATEMENT OF ASSETS AND LIABILITIES
December 31, 2023
| Assets | | | |
| Investments at fair value (cost $40,185,550) | | $ | 35,161,577 | |
| Cash & cash equivalents | | | 94,114 | |
| Centrally cleared interest rate swap contracts, at fair value | | | 47,603 | |
| Deposits at broker | | | 158,718 | |
| Due from Adviser, net | | | 198,340 | |
| Interest Receivable | | | 252,208 | |
| Dividend receivable | | | 18,957 | |
| Other assets | | | 42,975 | |
| Total assets | | | 35,974,492 | |
| | | | | |
| Liabilities | | | | |
| Reverse repurchase agreements | | | 8,498,000 | |
| Due to broker | | | 27,270 | |
| Accrued expenses | | | 474,864 | |
| Total liabilities | | | 9,000,134 | |
| Net assets | | $ | 26,974,358 | |
| | | | | |
| Net Assets Consisting of | | | | |
| Paid-in capital | | $ | 32,528,051 | |
| Total accumulated losses | | | (5,553,693 | ) |
| Net assets | | $ | 26,974,358 | |
| | | | | |
| Class A | | | | |
| Net Assets | | $ | 162,714 | |
| Shares outstanding, unlimited shares authorized | | | 18,095 | |
| Net Asset Value per Share | | $ | 8.99 | |
| Maximum Offering Price (net asset value plus maximum sales charge of 5.75%) | | $ | 9.54 | |
| | | | | |
| Class M | | | | |
| Net Assets | | $ | 26,811,644 | |
| Shares outstanding, unlimited shares authorized | | | 3,025,665 | |
| Net Asset Value per Share | | $ | 8.86 | |
See Accompanying Notes to the Financial Statements.
Ellington Income Opportunities Fund
STATEMENT OF OPERATIONS
For the Year Ended December 31, 2023
| Investment Income | | | |
| Interest income | | $ | 4,661,945 | |
| Dividend income | | | 109,044 | |
| Total Investment Income | | | 4,770,989 | |
| | | | | |
| Expenses | | | | |
| Management fees | | | 498,842 | |
| Administrator fees | | | 289,836 | |
| Professional fees | | | 100,992 | |
| Transfer agent fees | | | 129,117 | |
| Interest expense | | | 770,214 | |
| Registration fees | | | 45,152 | |
| Trustees' fees | | | 55,056 | |
| Sub-accounting transfer agency fees | | | 63,040 | |
| Compliance fees | | | 64,400 | |
| Insurance expense | | | 41,703 | |
| Research and trade expenses | | | 66,287 | |
| Custodian fees and expenses | | | 10,573 | |
| Shareholder reporting expense | | | 17,044 | |
| Shareholder servicing fees - Class A | | | 372 | |
| Other expenses | | | 2,800 | |
| Total Expenses | | | 2,155,428 | |
| Less: fees waived/expenses reimbursed by Adviser | | | (724,743 | ) |
| Net Expenses | | | 1,430,685 | |
| Net Investment Income/(Loss) | | | 3,340,304 | |
| | | | | |
| Realized and Change in Unrealized Gain/(Loss) on Investments | | | | |
| Net realized gain/(loss) on: | | | | |
| Investments | | | (932,948 | ) |
| Credit Default Swaps | | | 110,003 | |
| Interest Rate Swaps | | | 102,524 | |
| Net realized gain/(loss) | | | (720,421 | ) |
| Net change in unrealized appreciation/(depreciation) of: | | | | |
| Investments | | | 1,738,909 | |
| Credit Default Swaps | | | 39,130 | |
| Interest Rate Swaps | | | (107,793 | ) |
| Net unrealized appreciation/(depreciation) | | | 1,670,246 | |
| Net Realized and Change in Unrealized Gain/(Loss) on Investments | | | 949,825 | |
| | | | | |
| Increase/(Decrease) in Net Assets Resulting from Operations | | $ | 4,290,129 | |
See Accompanying Notes to the Financial Statements.
Ellington Income Opportunities Fund
STATEMENTS OF CHANGES IN NET ASSETS
| | | For the Year Ended December 31, 2023 | | | For the Year Ended December 31, 2022 | |
| From Operations | | | | | | | | |
| Net investment income/(loss) | | $ | 3,340,304 | | | $ | 2,631,717 | |
| Net realized gain/(loss) | | | (720,421 | ) | | | 562,669 | |
| Net change in unrealized appreciation/(depreciation) on investments | | | 1,670,246 | | | | (6,198,902 | ) |
| Net increase/(decrease) in net assets resulting from operations | | | 4,290,129 | | | | (3,004,516 | ) |
| Distributions and Dividends to Shareholders | | | | | | | | |
| From distributable earnings | | | (2,533,486 | ) | | | (2,576,908 | ) |
| From return of capital | | | - | | | | - | |
| Total distributions and dividends to common shareholders | | | (2,533,486 | ) | | | (2,576,908 | ) |
| Capital Share Transactions(1) | | | | | | | | |
| Proceeds from Class A shareholder subscriptions | | | - | | | | - | |
| Class A distribution reinvestments | | | 13,307 | | | | 8,919 | |
| Payments for Class A redemptions | | | - | | | | - | |
| Proceeds from Class M shareholder subscriptions | | | 2,173,474 | | | | 4,331,857 | |
| Class M distribution reinvestments | | | 791,055 | | | | 811,671 | |
| Payments for Class M redemptions | | | (7,532,977 | ) | | | (14,121,029 | ) |
| Net increase/(decrease) in net assets from capital share transactions | | | (4,555,141 | ) | | | (8,968,582 | ) |
| Total increase/(decrease) in net assets | | | (2,798,498 | ) | | | (14,550,006 | ) |
| Net Assets | | | | | | | | |
| Beginning of fiscal period | | | 29,772,856 | | | | 44,322,862 | |
| End of fiscal period | | $ | 26,974,358 | | | $ | 29,772,856 | |
| (1) | For shareholder transaction activity, please see Note 9. |
See Accompanying Notes to the Financial Statements.
Ellington Income Opportunities Fund
STATEMENT OF CASH FLOWS
For the Year Ended December 31, 2023
| Cash Flows From Operating Activities | | | |
| Increase/(decrease) in Net Assets Resulting from Operations | | $ | 4,290,129 | |
| Adjustments to reconcile increase/(decrease) in net assets resulting from operations to net cash provided by operating activities: | | | | |
| Net realized (gain)/loss on investments and swap contracts | | | 720,421 | |
| Net change in unrealized (appreciation)/depreciation of investments and swap contracts | | | (1,670,246 | ) |
| Net sales of short term investments | | | (2,050,809 | ) |
| Purchases of investments in securities | | | (6,104,912 | ) |
| Proceeds from sales and paydowns of investments in securities | | | 17,801,599 | |
| Net payments related to swap contracts | | | 229,527 | |
| Amortization and accretion on investments | | | 141,893 | |
| Changes in operating assets and liabilities: | | | | |
| Deposits at broker | | | 174,468 | |
| Due from broker | | | 227 | |
| Interest receivable | | | (36,256 | ) |
| Due from Adviser, net | | | (161,012 | ) |
| Other assets | | | (4,825 | ) |
| Due to broker | | | (506,373 | ) |
| Accrued expenses | | | 85,910 | |
| Net cash provided by operating activities | | | 12,909,741 | |
| Cash Flows From Financing Activities | | | | |
| Net payments from reverse repurchase agreements | | | (5,727,000 | ) |
| Proceeds from issuance of shares | | | 2,173,474 | |
| Payments for redemptions of shares | | | (7,532,977 | ) |
| Distributions paid, net of reinvestments | | | (1,729,124 | ) |
| Net cash used in financing activities | | | (12,815,627 | ) |
| Net Increase/(Decrease) in Cash | | | 94,114 | |
| | | | | |
| Cash: | | | | |
| Beginning of fiscal period | | | - | |
| End of fiscal period | | $ | 94,114 | |
| | | | | |
| Supplemental Disclosure of Cash Flow and Non-Cash Information | | | | |
| Reinvested distributions | | $ | 804,362 | |
See Accompanying Notes to the Financial Statements.
Ellington Income Opportunities Fund
FINANCIAL HIGHLIGHTS - Class A
| | | For the Year Ended | |
| | | December 31, 2023 | | | December 31, 2022 | | | December 31, 2021 | | | December 31, 2020 | | | December 31, 2019 (1) | |
| Per Share Data (2) | | | | | | | | | | | | | | | |
| Net Asset Value, beginning of fiscal period | | $ | 8.40 | | | $ | 9.68 | | | $ | 9.35 | | | $ | 10.33 | | | $ | 10.47 | |
| Activity from Investment Operations: | | | | | | | | | | | | | | | | | | | | |
| Net investment income/(loss) | | | 1.02 | | | | 0.55 | | | | 0.41 | | | | 0.45 | | | | (0.04 | ) |
| Net realized and unrealized gain/(loss) on investments | | | 0.35 | | | | (1.27 | ) | | | 0.40 | | | | (0.90 | ) | | | 0.05 | |
| Total increase (decrease) from investment operations | | | 1.37 | | | | (0.72 | ) | | | 0.81 | | | | (0.45 | ) | | | 0.01 | |
| Less Distributions and Dividends to Unitholders: | | | | | | | | | | | | | | | | | | | | |
| Net investment income | | | (0.78 | ) | | | (0.56 | ) | | | (0.48 | ) | | | (0.53 | ) | | | (0.05 | ) |
| Return of Capital | | | - | | | | - | | | | - | | | | - | | | | (0.10 | ) |
| Total distributions and dividends to shareholders | | | (0.78 | ) | | | (0.56 | ) | | | (0.48 | ) | | | (0.53 | ) | | | (0.15 | ) |
| Net Asset Value, end of fiscal period | | $ | 8.99 | | | $ | 8.40 | | | $ | 9.68 | | | $ | 9.35 | | | $ | 10.33 | |
| Total Investment Return (2)(5) | | | 16.89 | % | | | (7.52 | %) | | | 8.69 | % | | | (4.20 | %) | | | 0.12 | %(3) |
| Supplemental Data and Ratios | | | | | | | | | | | | | | | | | | | | |
| Net assets, end of fiscal period (in 000s) | | $ | 163 | | | $ | 139 | | | $ | 150 | | | $ | 138 | | | $ | 144 | |
| Ratio of expenses to average net assets before waiver | | | 8.23 | % | | | 5.37 | % | | | 4.69 | % | | | 4.69 | % | | | 5.68 | %(4) |
| Ratio of expenses to average net assets after waiver | | | 5.89 | % | | | 4.07 | % | | | 3.54 | % | | | 3.09 | % | | | 3.27 | %(4) |
| Ratio of net investment income/(loss) to average net assets before waiver | | | 9.44 | % | | | 4.62 | % | | | 2.44 | % | | | 3.09 | % | | | 1.73 | %(4) |
| Ratio of net investment income/(loss) to average net assets after waiver | | | 11.78 | % | | | 5.91 | % | | | 3.88 | % | | | 4.69 | % | | | 4.14 | %(4) |
| Portfolio turnover rate | | | 17.19 | % | | | 40.45 | % | | | 46.81 | % | | | 34.71 | % | | | 64.79 | %(3) |
| (1) | Class A commenced operations on December 17, 2019. |
| (2) | Information presented relates to a unit outstanding for the period presented and assumes the reinvestment of dividends and capital gain distributions. Had the adviser not waived a portion of fees, total returns would have been lower. |
| (3) | Not annualized. |
| (4) | All income and expenses are annualized for periods less than one full year with the exception of organizational costs. |
| (5) | The total investment return does not reflect the application of a sales load. |
See Accompanying Notes to the Financial Statements.
Ellington Income Opportunities Fund
FINANCIAL HIGHLIGHTS - Class M
| | | For the Year Ended | |
| | | December 31, 2023 | | | December 31, 2022 | | | December 31, 2021 | | | December 31, 2020 | | | December 31, 2019 | |
| Per Share Data (2) | | | | | | | | | | | | | | | |
| Net Asset Value, beginning of fiscal period | | $ | 8.30 | | | $ | 9.56 | | | $ | 9.25 | | | $ | 10.23 | | | $ | 9.97 | |
| Activity from Investment Operations: | | | | | | | | | | | | | | | | | | | | |
| Net investment income/(loss) | | | 1.06 | | | | 0.64 | | | | 0.43 | | | | 0.50 | | | | 0.54 | |
| Net realized and unrealized gain/(loss) on investments | | | 0.34 | | | | (1.29 | ) | | | 0.43 | | | | (0.89 | ) | | | 0.36 | |
| Total increase (decrease) from investment operations | | | 1.40 | | | | (0.65 | ) | | | 0.86 | | | | (0.39 | ) | | | 0.90 | |
| Less Distributions and Dividends to Unitholders: | | | | | | | | | | | | | | | | | | | | |
| Net investment income | | | (0.84 | ) | | | (0.61 | ) | | | (0.55 | ) | | | (0.59 | ) | | | (0.54 | ) |
| Return of Capital | | | - | | | | - | | | | - | | | | - | | | | (0.10 | ) |
| | | | | | | | | | | | | | | | | | | | | |
| Total distributions and dividends to shareholders | | | (0.84 | ) | | | (0.61 | ) | | | (0.55 | ) | | | (0.59 | ) | | | (0.64 | ) |
| Net Asset Value, end of fiscal period | | $ | 8.86 | | | $ | 8.30 | | | $ | 9.56 | | | $ | 9.25 | | | $ | 10.23 | |
| Total Investment Return (1) | | | 17.57 | % | | | (6.98 | %) | | | 9.40 | % | | | 3.56 | % | | | 9.16 | % |
| Supplemental Data and Ratios | | | | | | | | | | | | | | | | | | | | |
| Net assets, end of fiscal period (in 000s) | | $ | 26,812 | | | $ | 29,634 | | | $ | 44,172 | | | $ | 28,733 | | | $ | 26,184 | |
| Ratio of expenses to average net assets before waiver | | | 7.98 | % | | | 5.39 | % | | | 4.70 | % | | | 4.51 | % | | | 6.50 | % |
| Ratio of expenses to average net assets after waiver | | | 5.29 | % | | | 3.75 | % | | | 2.86 | % | | | 2.51 | % | | | 2.62 | % |
| Ratio of net investment income/(loss) to average net assets before waiver | | | 9.69 | % | | | 5.13 | % | | | 2.67 | % | | | 3.39 | % | | | 2.04 | % |
| Ratio of net investment income/(loss) to average net assets after waiver | | | 12.37 | % | | | 6.77 | % | | | 4.51 | % | | | 5.39 | % | | | 5.92 | % |
| Portfolio turnover rate | | | 17.19 | % | | | 40.45 | % | | | 46.81 | % | | | 34.71 | % | | | 64.79 | % |
| (1) | Information presented relates to a unit outstanding for the period presented and assumes the reinvestment of dividends and capital gain distributions. Had the adviser not waived a portion of fees, total returns would have been lower. |
See Accompanying Notes to the Financial Statements.
Ellington Income Opportunities Fund
NOTES TO FINANCIAL STATEMENTS
December 31, 2023
1. ORGANIZATION
Ellington Income Opportunities Fund (the “Fund”) is registered under the Investment Company Act of 1940, as amended (the “1940 Act”), as a continuously offered, closed -end management company, and is diversified. The Fund is an interval fund that offers to make quarterly repurchases of shares at the net asset value (“NAV”) of Class A shares, Class C shares, Class I shares, and Class M shares. Its four classes of shares: Class A shares are offered at NAV plus a maximum sales charge of 5.75%. Class C, I, and M are offered at NAV. Currently the Fund has two classes of shares operational: Class A and Class M.
Princeton Fund Advisors, LLC (the “Adviser”) serves as the Fund’s investment adviser. Ellington Global Asset Management, LLC (the “Sub-Adviser” or “Ellington”) serves as the Fund’s investment sub-adviser. The Fund’s investment objective is to seek total return, including capital gains and current income.
The Fund is organized as a statutory trust under the laws of the State of Delaware. The Fund’s Class M shares commenced operations on November 13, 2018 and the Fund’s Class A shares commenced operations on December 17, 2019.
2. SIGNIFICANT ACCOUNTING POLICIES
The Fund’s financial statements have been prepared in conformity with accounting principles generally accepted in the United States of America (“GAAP”). The Fund is an investment company and, accordingly, follows the investment company accounting and reporting guidance of the Financial Accounting Standards Board (“FASB”) Accounting Standards Codification (“ASC”) Topic 946, Financial Services - Investment Companies including FASB Accounting Standards Update (“ASU”) 2013-08. The preparation of financial statements in conformity with GAAP requires management to make estimates and assumptions that affect the reported amounts of assets and liabilities, the disclosure of contingent assets and liabilities at the date of the financial statements and the reported amounts of income and expenses during the reporting period. Actual results could differ from those estimates and such differences could be material to the financial statements.
The following is a summary of the significant accounting policies followed by the Fund:
(A) Investments: In accordance with the authoritative guidance on fair value measurements and disclosures under GAAP, the Fund discloses the fair value of its investments in a hierarchy that prioritizes the inputs to valuation techniques used to measure fair value. The hierarchy gives the highest priority to valuations based upon unadjusted quoted prices in active markets for identical assets or liabilities (Level 1 measurements) and the lowest priority to valuations based upon unobservable inputs that are significant to the valuation (Level 3 measurements). The investment valuation methodologies are discussed further in Note 3.
(B) Investment Transactions, Investment Income and Expense Recognition: Investment transactions are recorded on the trade date. Realized and unrealized gains and losses are calculated based on identified cost. Principal write-offs are treated as realized losses. Interest income is recorded as earned unless ultimate collection is in doubt. Generally, the Fund accretes market discounts and amortizes market premiums on debt securities using the effective yield method. Accretion of market discount and amortization of market premiums requires the use of a significant amount of judgment and the application of several assumptions including, but not limited to, prepayment assumptions and default rate assumptions. Swap contracts are valued using market-standard sources and unrealized appreciation or depreciation is recorded daily as the difference between the prior day and current day closing price. Expenses that are directly attributable to the Fund (the “Fund Expenses”) consist of permitted expenses determined in accordance with the terms of the governing documents. Fund Expenses are charged when incurred. Fund Expenses include, but are not limited to, operational expenses and other expenses associated with the operation of the Fund. Fund Expenses (other than class specific distribution fees) and realized and unrealized gains and losses are allocated proportionately among the share classes each day based upon the relative net assets of each class.
Ellington Income Opportunities Fund
NOTES TO FINANCIAL STATEMENTS (continued)
December 31, 2023
(C) Cash: Cash includes cash and cash equivalents. Cash is maintained at U.S. Bank National Association, a member of FDIC. Balances might exceed federally insured limits. Deposits at broker represent margin collateral for the derivative positions held as of December 31, 2023, as shown on the Statement of Assets and Liabilities.
(D) Income Taxes: The Fund has elected to be treated as, and to qualify each year for special tax treatment afforded to, a regulated investment company (“RIC”) under Subchapter M of the Internal Revenue Code (“IRC”). In order to qualify as a RIC, the Fund must, among other things, satisfy income, asset diversification and distribution requirements. As long as it so qualifies, the Fund will not be subject to U.S. federal income tax to the extent that it distributes annually its investment company taxable income and its net capital gain. The Fund intends to distribute at least annually all or substantially all of such income and gain. If the Fund retains any investment company taxable income or net capital gain, it will be subject to U.S. federal income tax on the retained amount at regular corporate tax rates. In addition, if the Fund fails to qualify as a RIC for any taxable year, it will be subject to U.S. federal income tax on all of its income and gains at regular corporate tax rates. The Fund’s 2023, 2022, 2021, and 2020 tax filings are still open for examination.
Management has reviewed the Fund’s tax positions for all open tax years and has concluded that there is no tax liability/benefit resulting from uncertain income tax positions taken or expected to be taken in the future tax returns. The Fund is not aware of any tax positions for which it is reasonably possible that the total amounts of unrecognized tax expense will significantly change in the next twelve months.
(E) Distributions to Shareholders: Distributions from investment income are declared and paid quarterly. Distributions from net realized capital gains, if any, are declared and paid annually and are recorded on the ex-dividend date. The character of income and gains to be distributed is determined in accordance with income tax regulations, which may differ from GAAP.
(F) Indemnifications: In the normal course of business, the Fund enters into contracts that contain a variety of representations which provide general indemnifications. The Fund’s maximum exposure under these arrangements is unknown as this would involve future claims that may be made against the Fund that have not yet occurred. However, the Fund expects the risk of loss to be remote.
3. VALUATION
The following is a description of the valuation methodologies used for the Fund’s financial instruments. GAAP establishes a hierarchy that prioritizes inputs to valuation methods. The three levels of inputs are:
Level 1 valuation methodologies include the observation of quoted prices (unadjusted) for identical assets or liabilities in active markets.
Level 2 valuation methodologies include the observation of (i) quoted prices for similar assets or liabilities in active markets, (ii) inputs other than quoted prices that are observable for the asset or liability (for example, interest rates and yield curves) in active markets, and (iii) quoted prices for identical or similar assets or liabilities in markets that are not active.
Level 3 fair value methodologies include (i) the solicitation of valuations from third parties (typically, broker-dealers), (ii) the use of proprietary models that require the use of a significant amount of judgment and the application of various assumptions including, but not limited to, prepayment assumptions and default rate assumptions, and (iii) the assessment of observable or reported recent trading activity. The Fund utilizes such information to assign a good faith fair value (the estimated price that would be received to sell an asset or paid to transfer a liability in an orderly transaction at the valuation date) to each such financial instrument.
Ellington Income Opportunities Fund
NOTES TO FINANCIAL STATEMENTS (continued)
December 31, 2023
Market quotations are not typically readily available for the majority of the Fund’s securities, they are often valued at fair value as determined by the Adviser, in its capacity as Valuation Designee (the “Valuation Designee”). The Valuation Designee seeks to obtain at least one third-party indicative valuation for each instrument and obtains multiple indicative valuations when available. Third-party valuation providers often utilize proprietary models that are highly subjective and also require the use of a significant amount of judgment and the application of various assumptions including, but not limited to, prepayment and default rate assumptions. The Valuation Designee has been able to obtain third-party indicative valuations on the vast majority of the Fund’s investments and expects to continue to solicit third-party valuations on substantially all investments in the future to the extent practical. The Valuation Designee generally values each financial instrument using a third-party valuation received. However, such third-party valuations are not binding, and while the Valuation Designee generally does not adjust such valuations, the Valuation Designee may challenge or reject a valuation when, based on validation criteria, the Valuation Designee determines that such valuation is unreasonable or erroneous. Furthermore, the Valuation Designee may determine, based on validation criteria, that for a given instrument the third-party valuations received does not result in what the Valuation Designee believes to be fair value, and in such circumstances the Valuation Designee may override the third-party valuation with its own good faith valuation. The validation criteria include the use of the Valuation Designee’s own models, recent trading activity in the same or similar instruments, and valuations received from third parties.
The Valuation Designee’s valuation process, including the application of validation criteria, is overseen and periodically reviewed by the Fund’s Board of Trustees. Because of the inherent uncertainty of valuations, these estimated values may differ significantly from the values that would have been used had a ready market for the financial instruments existed, and the differences could be material to the financial statements.
The table below reflects the value of the Fund’s Level 1, Level 2 and Level 3 financial instruments measured at fair value as of December 31, 2023:
| Description | | Level 1 | | | Level 2 | | | Level 3 | | | Total | |
| Investments | | | | | | | | | | | | | | | | |
| Asset Backed Securities | | $ | - | | | $ | 25,033,383 | | | $ | 4,942,329 | | | $ | 29,975,712 | |
| Preferred Stocks | | | 1,505,575 | | | | - | | | | - | | | | 1,505,575 | |
| Short-Term Investments | | | 3,680,290 | | | | - | | | | - | | | | 3,690,290 | |
| Total Investments | | $ | 5,185,865 | | | $ | 25,033,383 | | | $ | 4,942,329 | | | $ | 35,161,577 | |
| | | | | | | | | | | | | | | | | |
| Other Financial Instruments* | | | | | | | | | | | | | | | | |
| Interest Rate Swaps | | $ | - | | | $ | 47,603 | | | $ | - | | | $ | 47,603 | |
| Total Swaps Contracts | | $ | - | | | $ | 47,603 | | | $ | - | | | $ | 47,603 | |
| * | Other financial instruments are derivative instruments, such as swap contacts, which are reported at market value. |
The Fund generally uses prices provided by an independent pricing service, broker, or agent bank, which provide non-binding indicative prices on or near the valuation date as the primary basis for fair value determinations for certain instruments. The independent pricing services typically value such securities based on one or more inputs, including but not limited to benchmark yields, transactions, bids, offers, quotations from dealers and trading systems, new issues, spreads and other relationships observed in the markets among comparable securities, and pricing models such as yield measurers calculated using factors such as cash flows, financial or collateral performance and other reference data. In addition to these inputs, mortgage-backed and asset-backed obligations may utilize cash flows, prepayment information, default rates, delinquency and loss assumptions, collateral characteristics, credit enhancements, and specific deal information. These values are non-binding and may not be determinative of fair value. Values are evaluated during the Fund's valuation process by the Valuation Designee in conjunction with additional information about the instrument, similar instruments, market indicators and other information.
Ellington Income Opportunities Fund
NOTES TO FINANCIAL STATEMENTS (continued)
December 31, 2023
Below is a reconciliation of Level 3 assets for which significant unobservable inputs were used to determine fair value:
| Description | | | |
| Balance as of December 31, 2022 | | $ | 11,458,578 | |
| Purchases | | | 1,580,328 | |
| Sales proceeds and paydowns | | | (6,046,204 | ) |
| Realized gain / (loss) | | | (974,426 | ) |
| Change in unrealized gain / (loss) | | | 517,294 | |
| Transfers into Level 3 | | | 329,500 | |
| Transfers out of Level 3 | | | (1,922,741 | ) |
| Ending Balance – December 31, 2023 | | $ | 4,942,329 | |
| | | | | |
| Change in unrealized appreciation / (depreciation) during the year for Level 3 investments held at December 31, 2023 | | $ | (558,485 | ) |
The following table presents information about unobservable inputs related to the Fund’s categories of Level 3 investments as of December 31, 2023:
| Security | Fair Value at 12/31/2023 | Valuation Methodology | Unobservable Inputs | Input Value / Range | Weighted Average | |
| Asset Backed Securities | $924,000 | Discounted Cash Flows | Yield | 12.33% - 12.33% | 12.33% | |
| Collateralized Loan Opportunities | 846,495 | Dealer Marked with Odd Lot Sizing Adjustment | Odd Lot Sizing Adjustment | (0.85)% - (1.50)% | (1.14)% | |
| | 486,281 | Discounted Cash Flows | Yield | 40.85% - 123.18% | 68.77% | |
| Confirmation of Originator Fee Certificates | 686,434 | Option Adjusted Spread ("OAS") | OAS | 8.08 - 8.08 | 8.08 | |
| Residential Mortgage-Backed Securities | 882,469 | Dealer Marked with Odd Lot Sizing Adjustment | Odd Lot Sizing Adjustment | (0.27)% - (3.00)% | (1.86)% | |
| | 245,142 | Discounted Cash Flows | Yield | 9.4% - 9.4% | 9.40% | |
| | | | Projected Collateral Prepayments | 37.6% - 37.6% | 37.60% | |
| | | | Projected Collateral Losses | 0.0% - 0.0% | 0.00% | |
| | | | Projected Collateral Recoveries | 10.1% - 10.1% | 10.10% | |
| | | | Projected Collateral Scheduled Amortization | 52.3% - 52.3% | 52.30% | |
| Supply Chain Receivable | 871,508 | Discounted Cash Flows | Yield | 13.28% - 13.28% | 13.28% | |
| Total Fair Value | $4,942,329 | | | | | |
A change in unobserved inputs might result in significantly higher or lower fair value measurement as of December 31, 2023.
4. RELATED PARTY AGREEMENTS AND FEES
The Adviser serves as the investment adviser to the Fund. Under the terms of the management agreement between the Fund and the Adviser dated October 17, 2018 (the “Agreement”), the Adviser, subject to the oversight of the Board of Trustees (the “Board”), provides or arranges to be provided to the Fund such investment advice as it deems advisable and will furnish or arrange to be furnished a continuous investment program for the Fund consistent with the Fund’s investment objectives and policies. As compensation for its management services, the Fund agrees to pay to the Adviser a monthly fee at the annual rate of 1.85% of the Fund’s average daily net assets. For the year ended December 31, 2023, the Fund incurred $498,842 in management fees under the Agreement.
The Adviser and the Fund have entered into an expense limitation and reimbursement agreement under which the Adviser has agreed, until at least April 30, 2024, to waive its management fees and to pay or absorb the ordinary operating expenses of the Fund (excluding (i) interest expense, and any fees and expenses incurred in connection with credit facilities, if any, obtained by the Fund; (ii) transaction costs and other expenses incurred in connection with the acquisition, financing, maintenance, and disposition of the Fund’s investments and prospective investments, including without limitation bank and custody fees, brokerage commissions, legal, data, consulting and due diligence costs, servicing and property management costs; (iii) acquired fund fees and expenses; (iv) taxes; and (v) extraordinary expenses), to the extent that its management fees plus applicable distribution and shareholder servicing fees and the Fund’s ordinary operating expenses would otherwise exceed, on a year-to-date basis, 2.85%, 3.60%, 2.60%, and 2.20% per annum of the Fund’s average daily net assets attributable to Class A, Class C, Class I, and Class M shares, respectively. The Expense Limitation Agreement may not be terminated by the Adviser, but it may be terminated by the Board, on 60 days’ written notice to the Adviser. Any waiver or reimbursement by the Adviser is subject to repayment by the Fund within the three years from the date the Adviser waived any payment or reimbursed any expense, if (after taking the repayment into account) the Fund is able to make the repayment without exceeding the expense limitation in place at the time of the waiver or at the time of the reimbursement payment. The Adviser’s waived fees and reimbursed expenses that are subject to potential recoupment are as follows:
Ellington Income Opportunities Fund
NOTES TO FINANCIAL STATEMENTS (continued)
December 31, 2023
| Fiscal Year Incurred | Amount Waived or Expenses Reimbursed by the Advisor | Amount Recouped | Amount Subject to Potential Reimbursement | Expiration Date |
| December 31, 2021 | $600,842 | $- | $600,842 | December 31, 2024 |
| December 31, 2022 | $638,243 | $- | $638,243 | December 31, 2025 |
| December 31, 2023 | $724,743 | $- | $724,743 | December 31, 2026 |
On the Statement of Assets & Liabilities, “Due from Adviser, net” represents the management fees incurred and the fees waived/expenses reimbursed by the Adviser.
The Adviser engaged Ellington, an investment adviser registered with the U.S. Securities & Exchange Commission, to serve as the Fund’s sub-adviser pursuant to a Subadvisory Agreement dated October 17, 2018 between Ellington and the Adviser (the “Subadvisory Agreement”). Under the terms of the Subadvisory Agreement, the Sub-Adviser is paid directly by the Adviser.
Under Administration, Fund Accounting and Transfer Agent Servicing Agreements between the Fund and U.S. Bancorp Fund Services, LLC doing business as U.S. Bancorp Global Fund Services, LLC (“Global Fund Services”), Global Fund Services is paid a monthly fee based on the NAV of the Fund. Global Fund Services serves as fund administrator, fund accountant, registrar, and transfer agent to the Fund.
For the year ended December 31, 2023, the Fund used U.S. Bank National Association (“U.S. Bank”) as its custodian pursuant to a Custody Agreement between U.S. Bank and the Fund.
Northern Lights Compliance Services, LLC (“NLCS”) provides a Chief Compliance Officer to the Fund as well as related compliance services pursuant to a consulting agreement between NLCS and the Fund.
For the year ended December 31, 2023, the Fund used Foreside Funds, LLC (“Foreside”) as its distributor pursuant to a Distribution Agreement between Foreside and the Fund.
Two Trustees and certain Officers of the Fund are also Officers of the Adviser or Sub-Adviser. Trustees and Officers, other than the Chief Compliance Officer, who are affiliated with the Adviser or the Sub-Adviser are not compensated by the Fund for their services.
Ellington Income Opportunities Fund
NOTES TO FINANCIAL STATEMENTS (continued)
December 31, 2023
5. INVESTMENT TRANSACTIONS
The cost of purchases and proceeds from the sale of securities, other than short-term securities, for the year ended December 31, 2023 amounted to $6,104,912 and $17,801,599, respectively.
6. DERIVATIVE INSTRUMENTS
The Fund uses derivative instruments as part of its investment strategy to achieve its stated investment objective. The Fund’s derivative contracts held at year end are not accounted for as hedging instruments under GAAP. For financial reporting purposes, the Fund does not offset derivative assets and liabilities across derivative types that are subject to a master netting arrangement in the Statement of Assets and Liabilities.
The following table lists the fair value of derivative instruments held by the Fund by primary underlying risk and contract type on the Statement of Assets and Liabilities at year end:
| Primary Underlying Risk | Centrally cleared interest rate swap contracts, at fair value | Over-the-counter credit default swap contracts, at fair value |
| Credit Default Swaps | $- | $- |
| Interest Rate Risk Swaps | 47,603 | - |
The following table lists the effect of derivative instruments held by the Fund by primary underlying risk and contract type on the Statement of Operations for the year ended December 31, 2023:
| Primary Underlying Risk | Realized Gain/(Loss) on: | Net Change in Unrealized Appreciation/(Depreciation) on: |
| Credit Default Swaps | $110,003 | $39,130 |
| Interest Rate Swaps | 102,524 | (107,793) |
The Fund’s average monthly notional amount of derivatives during the year ended December 31, 2023 were:
| Derivative Type | Average Monthly Notional Amount |
| Credit Default Swaps | $923,077 |
| Interest Rate Swaps | 1,185,622 |
Derivatives Risk. The use of derivative instruments may expose the Fund to additional risks that it would not be subject to if it invested directly in the securities or other instruments underlying those derivatives, including the high degree of leverage often embedded in such instruments, and potential material and prolonged deviations between the theoretical value and realizable value of a derivative. When used as hedging instruments, derivatives subject the Fund to the risk that there will be an imperfect correlation between the value of the derivative and the positions of the Fund being hedged by the derivative. Some derivatives have the potential for unlimited loss, regardless of the size of the Fund’s initial investment. Derivatives may be illiquid and may be more volatile than other types of investments. The Fund may buy or sell derivatives not traded on an exchange and which may be subject to heightened liquidity and valuation risk. There may not be a liquid secondary market for the derivative instruments traded by the Fund. Derivative investments can increase portfolio turnover and transaction costs. Derivatives also are subject to counterparty risk. As a result, the Fund may obtain no recovery of its investment or may only obtain a limited recovery, and any recovery may be delayed. Not all derivative transactions require a counterparty to post collateral, which may expose the Fund to greater losses in the event of a default by a counterparty.
Ellington Income Opportunities Fund
NOTES TO FINANCIAL STATEMENTS (continued)
December 31, 2023
The Fund’s use of derivatives is also subject to the following additional risks:
Counterparty Risk. The Fund’s investments may be exposed to the credit risk of the counterparties with which, or the dealers, brokers and exchanges through which, the Fund deals, whether in exchange-traded or OTC transactions. The Fund may be subject to the risk of loss of Fund assets on deposit or being settled or cleared with a broker in the event of the broker’s bankruptcy, the bankruptcy of any clearing broker through which the broker executes and clears transactions on behalf of the Fund, the bankruptcy of an exchange clearing house or the bankruptcy of any other counterparty. To the extent that the Fund has posted margin or has other amounts held by a counterparty that becomes insolvent, the Fund may be deemed to be an unsecured creditor of the counterparty and would need to pursue its claim in bankruptcy or liquidation proceedings. Amounts for any such claims may be less than the amounts owed to the Fund. Such events would have an adverse effect on the Fund’s NAV.
Swap Agreements. A swap is an agreement between two parties to exchange a sequence of cash flows (or other assets) for a set period of time. Swaps can involve greater risks than a direct investment in an underlying asset because swaps typically include a certain amount of embedded leverage and, as such, are subject to leveraging risk. If swaps are used as a hedging strategy, the Fund is subject to the risk that the hedging strategy may not eliminate the risk that it is intended to offset, due to, among other reasons, the occurrence of unexpected price movements or the non-occurrence of expected price movements. Swaps also may be difficult to value. Total return swaps and credit default swaps are subject to counterparty risk, credit risk and liquidity risk. In addition, total return swaps are subject to market risk and credit default swaps are subject to the risks associated with the purchase and sale of credit protection. With respect to a credit default swap, if the Fund is selling credit protection, there is a risk that a credit event will occur and that the Fund will have to pay the counterparty. Additionally, the Fund is exposed to many of the same risks of leverage since if an event of default occurs, the seller must pay the buyer the full notional value of the reference obligation. There is also the risk that the transaction may be closed out at a time when the credit quality of the underlying investment has deteriorated, in which case the Fund may need to make an early termination payment. The protection buyer in a credit default swap may be obligated to pay the protection seller an upfront payment or a periodic stream of payments over the term of the contract provided generally that no credit event on a reference obligation has occurred. If the Fund is buying credit protection, there is the risk that no credit event will occur and the Fund will receive no benefit (other than any hedging benefit) for the premium paid. There is also the risk that the transaction may be closed out at a time when the credit quality of the underlying investment has improved, in which case the Fund may need to make an early termination payment. If a credit event were to occur, the value of any deliverable obligation received by the seller (if any), coupled with the upfront or periodic payments previously received, may be less than the full notional value it pays to the buyer, resulting in a loss of value to the seller. There is a risk that based on movements of interest rates, the payments made under a swap agreement will be greater than the payments received.
Regulation as a Commodity Pool. The Fund has filed a notice of eligibility for exclusion from the definition of the term “commodity pool operator” (“CPO”) with the U.S. Commodity Futures Trading Commission (the “CFTC”) and the National Futures Association (“NFA”), which regulate trading in the futures markets. Pursuant to CFTC Regulation 4.5, the Fund is not subject to regulation as a commodity pool under the Commodity Exchange Act (the “CEA”). As a result, neither the Adviser nor the Sub-Adviser is a CPO with respect to the Fund. The Fund reserves the right to elect to rely on other applicable exemptions under CEA rules, which may increase the Fund’s regulatory compliance obligations and expenses. In the event the Fund, the Adviser or the Sub-Adviser fails to qualify for the exclusion and is required to register as a CPO, the Fund may become subject to additional disclosure, recordkeeping and reporting requirements, which may increase the Fund’s regulatory compliance obligations and expenses.
Ellington Income Opportunities Fund
NOTES TO FINANCIAL STATEMENTS (continued)
December 31, 2023
7. ADDITIONAL DISCLOSURE OF SBA CONFIRMATION OF ORIGINATOR FEE CERTIFICATES CUSTOM BASKET HOLDINGS
| Current Principal Amount | | | Description | | Rate | | | Maturity | | | Fair Value as a Percentage of Custom Basket | | | Fair Value | |
| | 782,180 | | | SBA Confirmation of Originator Fee Certificate 344019 | | | 1.56 | % | | | 08/15/2044 | | | | 9.15 | % | | $ | 62,718 | |
| | 585,621 | | | SBA Confirmation of Originator Fee Certificate 344020 | | | 2.31 | % | | | 09/15/2044 | | | | 6.84 | % | | | 46,957 | |
| | 611,638 | | | SBA Confirmation of Originator Fee Certificate 344021 | | | 3.56 | % | | | 10/15/2044 | | | | 7.14 | % | | | 49,044 | |
| | 270,628 | | | SBA Confirmation of Originator Fee Certificate 344022 | | | 3.06 | % | | | 09/15/2044 | | | | 3.16 | % | | | 21,700 | |
| | 986,595 | | | SBA Confirmation of Originator Fee Certificate 344023 | | | 3.31 | % | | | 09/15/2044 | | | | 11.52 | % | | | 79,109 | |
| | 921,843 | | | SBA Confirmation of Originator Fee Certificate 344025 | | | 2.31 | % | | | 10/15/2044 | | | | 10.77 | % | | | 73,917 | |
| | 2,308,825 | | | SBA Confirmation of Originator Fee Certificate 344027 | | | 2.06 | % | | | 10/15/2044 | | | | 26.97 | % | | | 185,131 | |
| | 2,093,410 | | | SBA Confirmation of Originator Fee Certificate 344028 | | | 2.81 | % | | | 10/15/2044 | | | | 24.45 | % | | | 167,858 | |
| | 8,560,740 | | | | | | | | | | | | | | 100.00 | % | | $ | 686,434 | |
8. TAX BASIS INFORMATION
It is the Fund’s intention to continue to qualify as a RIC under Subchapter M of the IRC and distribute all of its taxable income. Accordingly, no provision for federal income taxes is required in its financial statements.
The tax character of distributions paid to shareholders during the years ended December 31, 2023 and December 31, 2022, were as follows:
| | | 2023 | | | 2022 | |
| Ordinary Income | | $ | 2,533,486 | | | $ | 2,576,908 | |
| Net Long-Term Capital Gains | | | - | | | | - | |
| Return of Capital | | | - | | | | - | |
| Total Distributions Paid | | $ | 2,533,486 | | | $ | 2,576,908 | |
The amount and character of income and capital gain distributions to be paid, if any, are determined in accordance with federal income tax regulations, which may differ from U.S. GAAP. These differences are primarily due to differences in the timing of recognition of gains or losses on investments.
GAAP requires that certain components of net assets be reclassified between financial and tax reporting. Temporary differences do not require reclassification. Temporary and permanent differences have no effect on net assets or NAV per share. For the year ended December 31, 2023, the Fund made the following permanent book to tax reclassification primarily related to excise tax:
| Distributable Earnings | Paid-In Capital |
| $- | $(-) |
Ellington Income Opportunities Fund
NOTES TO FINANCIAL STATEMENTS (continued)
December 31, 2023
The following information is provided on a tax basis (including reverse repurchase agreements) as of December 31, 2023:
| Tax cost of investments | | $ | 40,394,704 | |
| Total tax cost of portfolio | | $ | 40,394,704 | |
| Gross unrealized appreciation | | | 1,621,140 | |
| Gross unrealized depreciation | | | (6,854,265 | ) |
| Net unrealized appreciation / (depreciation) | | | (5,233,125 | ) |
| Undistributed ordinary income / (loss) | | | 875,672 | |
| Undistributed long-term gain / (loss) | | | - | |
| Other temporary differences | | | (1,245,842 | ) |
| Total accumulated gain / (loss) | | $ | (5,603,295 | ) |
The difference between book basis and tax basis unrealized appreciation / (depreciation) on investments is primarily attributable to mark to market on derivatives.
As of December 31, 2023, for federal income tax purposes, there were capital loss carryforwards of $1,245,842. The capital loss carryforwards do not have an expiration date and will retain their character as either short-term or long-term capital losses. The ability to utilize capital loss carryforwards in the future may be limited under the Internal Revenue Code and related regulations based on the results of future transactions.
The Fund follows the authoritative guidance on accounting for and disclosure of uncertainty on tax positions, which requires management to determine whether a tax position of the Fund is more likely than not to be sustained upon examination by the applicable taxing authority, including resolution of any related appeals of litigation process, based on the technical merits of the position. The tax benefit to be recognized is measured as the largest amount of benefit that is greater than fifty percent likely of being realized upon ultimate settlement. The Fund did not have any unrecognized tax benefits or unrecognized tax liabilities as of December 31, 2023. The Fund does not expect any change in unrecognized tax benefits or unrecognized tax liabilities within the next year. In the normal course of business, the Fund may be subject to examination by federal, state, local and foreign jurisdictions, where applicable, for the open tax years of 2023, 2022, 2021, and 2020.
9. SHAREHOLDER TRANSACTIONS
The Fund operates as an interval fund pursuant to Rule 23c-3 under the 1940 Act and, as such, has adopted a fundamental policy to make quarterly repurchase offers, at NAV, of no less than 5% and no more than 25% of the Fund’s shares outstanding on the Repurchase Request Deadline (as defined below). There is no guarantee that shareholders will be able to sell all of the shares they desire to sell in a quarterly repurchase offer, although each shareholder will have the right to require the Fund to purchase at least 5% of such shareholder’s shares in each quarterly repurchase. Liquidity will be provided to shareholders only through the Fund’s quarterly repurchases. Shareholders will be notified in writing of each quarterly repurchase offer and the date the repurchase offer ends (the “Repurchase Request Deadline”). Shares will be repurchased at the NAV per share determined as of the close of regular trading on the NYSE no later than the 14th day after the Repurchase Request Deadline, or the next business day if the 14th day is not a business day.
Ellington Income Opportunities Fund
NOTES TO FINANCIAL STATEMENTS (continued)
December 31, 2023
During the year ended December 31, 2023, the Fund completed four repurchase offers. In the offers that commenced on February 17, 2023, May 19, 2023, August 18, 2023, and November 9, 2023 the Fund offered to repurchase up to 10% of the number of its outstanding shares as of the applicable Repurchase Pricing Date. The results of these repurchase offers are as follows:
| Commencement Date | February 17, 2023 | May 19, 2023 | August 18, 2023 | November 9, 2023 |
| Repurchase Request Deadline | March 17, 2023 | June 16, 2023 | September 15, 2023 | December 8, 2023 |
| Repurchase Pricing Date | March 17, 2023 | June 16, 2023 | September 15, 2023 | December 8, 2023 |
| Amount Repurchased | $3,001,221 | $2,757,214 | $1,599,527 | $175,015 |
| Shares Repurchased | 358,998 | 326,684 | 178,519 | 19,489 |
Class A had 18,095 shares outstanding as of December 31, 2023. Class A did not issue any shares through shareholder subscriptions, issued 1,527 shares through dividend reinvestments, and did not repurchase any shares through shareholder redemptions during the year ended December 31, 2023.
Class M had 3,025,665 shares outstanding as of December 31, 2023. Class M issued 224,982 shares through shareholder subscriptions, 92,477 shares through dividend reinvestments and repurchased 883,689 shares through shareholder redemptions during the year ended December 31, 2023.
10. BORROWING
Reverse Repurchase Agreements: The Fund may enter into reverse repurchase agreements. In a reverse repurchase agreement, the Fund delivers a security in exchange for cash to a financial institution, the counterparty, with a simultaneous agreement to repurchase the same or substantially the same security at an agreed upon price and date. The Fund is entitled to receive the principal and interest payments, if any, made on the security delivered to the counterparty during the term of the agreement. Cash received in exchange for securities delivered plus accrued interest payments to be made by the Fund to counterparties are reflected as a liability on the Statement of Assets and Liabilities. Interest payments made by the Fund to counterparties are recorded as a component of interest expense on the Statement of Operations. The Fund will segregate assets determined to be liquid by the Adviser or will otherwise cover its obligations under reverse repurchase agreements.
Reverse repurchase agreements involve the risk that the market value of the securities retained in lieu of sale by the Fund may decline below the price of the securities the Fund has sold but is obligated to repurchase. In the event the buyer of securities under a reverse repurchase agreement files for bankruptcy or becomes insolvent, such buyer or its trustee or receiver may receive an extension of time to determine whether to enforce the Fund's obligation to repurchase the securities, and the Fund's use of the proceeds of the reverse repurchase agreement may effectively be restricted pending such decision. Also, the Fund would bear the risk of loss to the extent that the proceeds of the reverse repurchase agreement are less than the value of the securities subject to such agreements.
Ellington Income Opportunities Fund
NOTES TO FINANCIAL STATEMENTS (continued)
December 31, 2023
As of December 31, 2023, the Fund had the following reverse repurchase agreements outstanding, which were equal to 31.50% of the Fund’s net assets:
| Counterparty | | Amount Borrowed | | | Borrowing Rate | | | Borrowing Date | | Maturity Date | | Maturity Amount | |
| RBC Capital Markets | | $ | 653,000 | | | | 6.99 | % | | 11/29/2023 | | 01/29/2024 | | $ | 657,184 | |
| RBC Capital Markets | | | 313,000 | | | | 6.92 | % | | 11/13/2023 | | 01/16/2024 | | | 315,948 | |
| RBC Capital Markets | | | 654,000 | | | | 6.99 | % | | 11/29/2023 | | 01/29/2024 | | | 658,191 | |
| RBC Capital Markets | | | 1,051,000 | | | | 6.84 | % | | 11/29/2023 | | 01/29/2024 | | | 1,057,590 | |
| JP Morgan | | | 1,466,000 | | | | 6.68 | % | | 12/07/2023 | | 03/07/2024 | | | 1,472,797 | |
| LUCID Management | | | 787,000 | | | | 6.67 | % | | 12/14/2023 | | 01/18/2024 | | | 789,623 | |
| RBC Capital Markets | | | 754,000 | | | | 6.80 | % | | 10/23/2023 | | 01/04/2024 | | | 763,970 | |
| JP Morgan | | | 1,717,000 | | | | 6.78 | % | | 12/07/2023 | | 03/07/2024 | | | 1,725,080 | |
| RBC Capital Markets | | | 573,000 | | | | 6.84 | % | | 10/30/2023 | | 01/04/2024 | | | 579,859 | |
| RBC Capital Markets | | | 530,000 | | | | 6.92 | % | | 12/11/2023 | | 02/12/2024 | | | 532,139 | |
| Totals | | $ | 8,498,000 | | | | | | | | | | | $ | 8,552,381 | |
As of December 31, 2023, the fair value of securities held as collateral for reverse repurchase agreements was $12,270,160, as noted on the Schedule of Investments. For the year ended December 31, 2023, the average daily balance and average interest rate in effect for reverse repurchase agreements were $10,435,212 and 6.48%, respectively.
The following is a summary of the reverse repurchase agreements by the type of collateral and the remaining contractual maturity of the agreements:
| | Overnight and Continuous | Up to 30 Days | 30 to 90 Days | Greater than 90 Days | Total |
| Collateral Loan Obligation | $- | $1,327,000 | $530,000 | $- | $1,857,000 |
| Commercial Mortgage Backed Securities | - | 787,000 | 1,717,000 | - | 2,504,000 |
| Residential Mortgage Backed Securities | - | 2,671,000 | 1,466,000 | - | 4,137,000 |
| Totals | $- | $4,785,000 | $3,713,000 | $- | $8,498,000 |
Ellington Income Opportunities Fund
NOTES TO FINANCIAL STATEMENTS (continued)
December 31, 2023
Below is the gross and net information about instruments and transactions eligible for offset in the Statement of Assets and Liabilities as well as instruments and transactions subject to an agreement similar to a master netting arrangement:
| | | | | Gross Amounts of Collateral Not Offset on the Statement of Assets & Liabilities | |
| Description | Gross Amounts of Recognized Liabilities | Gross Amounts offset in the Statement of Assets & Liabilities | Net Amounts Presented in the Statement of Assets & Liabilities | Non-Cash Collateral (Pledged) / Received | Cash Collateral (Pledged) / Received | Net Amount |
| Reverse Repurchase Agreements | $8,498,000 | $- | $8.498,000 | $(8,498,000)(1) | $- | $- |
| (1) | Refer to the Schedule of Investments for the Securities pledged as collateral. The value of these securities is $12,270,160. |
Reverse repurchase transactions are entered into by the Fund under Master Repurchase Agreements (“MRA”) which permit the Fund, under certain circumstances, including an event of default of the Fund (such as bankruptcy or insolvency), to offset payables under the MRA with collateral held with the counterparty and create one single net payment from the Fund. Upon a bankruptcy or insolvency of the MRA counterparty, the Fund is considered an unsecured creditor with respect to excess collateral and, as such, the return of excess collateral may be delayed. In the event the buyer of securities (i.e. the MRA counterparty) under a MRA files for bankruptcy or becomes insolvent, the Fund’s use of the proceeds of the agreement may be restricted while the other party, or its trustee or receiver, determines whether or not to enforce the Fund’s obligation to repurchase the securities.
11. CONTROL OWNERSHIP
The beneficial ownership, either directly or indirectly, of more than 25% of the voting securities of a fund creates presumption of control of the fund, under Section 2(a)(9) of the 1940 Act. As of December 31, 2023, National Financial Services held approximately 97.03% of the voting securities of the Fund.
12. MARKET RISK
An investment in the Fund’s shares is subject to investment risk, including the possible loss of the entire amount invested. Global, national, regional and local reaction to any market events, natural disasters or a pandemic could impact the health of the economy, and the Fund, temporarily or for an extended period. An investment in the Fund’s shares represents an indirect investment in the investments owned by the Fund. The value of these securities, like other market investments, may move up or down, sometimes rapidly and unpredictably. In addition, the Fund is subject to the risk that geopolitical and other events will disrupt the economy on a national or global level. For instance, war, terrorism, market manipulation, government defaults, government shutdowns, political changes or diplomatic developments, public health emergencies (such as the spread of infectious diseases, pandemics and epidemics), climate-change and climate related events, and natural/environmental disasters can all negatively impact the securities markets, which could cause the Fund to lose value.
Ellington Income Opportunities Fund
NOTES TO FINANCIAL STATEMENTS (continued)
December 31, 2023
13. SUBSEQUENT EVENTS
Subsequent events after the date of these financial statements have been evaluated through the date the financial statements were issued.
Management has determined that there were no subsequent events to disclose in the financial statements.
Ellington Income Opportunities Fund
REPORT OF INDEPENDENT REGISTERED ACCOUNTING FIRM
December 31, 2023
Report of Independent Registered Public Accounting Firm
To the Board of Trustees and Shareholders of Ellington Income Opportunities Fund
Opinion on the Financial Statements
We have audited the accompanying statement of assets and liabilities of Ellington Income Opportunities Fund (the Fund), including the schedule of investments, as of December 31, 2023, the related statements of operations and cash flows for the year then ended, the statements of changes in net assets for each of the two years in the period then ended, and the related notes to the financial statements (collectively, the financial statements), and the financial highlights for each of the five years in the period then ended. In our opinion, the financial statements and financial highlights present fairly, in all material respects, the financial position of the Fund as of December 31, 2023, the results of its operations and its cash flows for the year then ended, the changes in net assets for each of the two years in the period then ended, and the financial highlights for each of the five years in the period then ended, in conformity with accounting principles generally accepted in the United States of America.
Basis for Opinion
These financial statements are the responsibility of the Fund’s management. Our responsibility is to express an opinion on the Fund’s financial statements and financial highlights based on our audits. We are a public accounting firm registered with the Public Company Accounting Oversight Board (United States) (PCAOB) and are required to be independent with respect to the Fund in accordance with U.S. federal securities laws and the applicable rules and regulations of the Securities and Exchange Commission and the PCAOB.
We conducted our audit in accordance with the standards of the PCAOB. Those standards require that we plan and perform the audit to obtain reasonable assurance about whether the financial statements are free of material misstatement, whether due to error or fraud. The Fund is not required to have, nor were we engaged to perform, an audit of its internal control over financial reporting. As part of our audit, we are required to obtain an understanding of internal control over financial reporting but not for the purpose of expressing an opinion on the effectiveness of the Fund’s internal control over financial reporting. Accordingly, we express no such opinion.
Our audit included performing procedures to assess the risks of material misstatement of the financial statements, whether due to error or fraud, and performing procedures that respond to those risks. Such procedures included examining, on a test basis, evidence regarding the amounts and disclosures in the financial statements. Our procedures included confirmation of securities owned as of December 31, 2023, by correspondence with the custodian, brokers and counterparties. Our audit also included evaluating the accounting principles used and significant estimates made by management, as well as evaluating the overall presentation of the financial statements. We believe that our audit provides a reasonable basis for our opinion.
/s/ RSM US LLP
We have served as the auditor of one or more Princeton Fund Advisors, LLC investment companies since 2017.
Denver, Colorado
March 11, 2024
Ellington Income Opportunities Fund
ADDITIONAL INFORMATION
December 31, 2023
Form N-PORT
The Fund files its complete schedule of portfolio holdings for the first and third quarters of each fiscal year with the SEC on Form N-PORT. The Fund’s Form N-PORT is available without charge by visiting the SEC’s Website at www.sec.gov.
Proxy Voting
A description of the policies and procedures that the Fund uses to determine how to vote proxies relating to portfolio securities owned by the Fund and information regarding how the Fund voted proxies relating to the portfolio of securities for the most recent 12-month period ended June 30 are available to stockholders without charge, upon request by calling the Adviser at (888) 862-3690.
Board of Trustees
The Fund’s prospectus and statement of additional information includes information about the Fund’s Trustees and is available upon request without charge by calling the Adviser at (888) 862-3690 or by visiting the SEC’s Website at www.sec.gov.
Forward-Looking Statements
This report contains “forward-looking statements,’’ which are based on current management expectations. Actual future results, however, may prove to be different from expectations. You can identify forward-looking statements by words such as “may’’, “will’’, “believe’’, “attempt’’, “seem’’, “think’’, “ought’’, “try’’ and other similar terms. The Fund cannot promise future returns. Management’s opinions are a reflection of its best judgment at the time this report is compiled, and it disclaims any obligation to update or alter forward-looking statements as a result of new information, future events, or otherwise.
Tax Notice
The percentage of taxable ordinary income distributions that are designated as short-term capital gain distributions under Internal Revenue Section 871 (k)(2)(c) for the fiscal year ended December 31, 2023 was 0.00%.
Ellington Income Opportunities Fund
BOARD APPROVAL OF MANAGEMENT AGREEMENT (Unaudited)
December 31, 2023
Consideration of Management Agreement between the Adviser and the Fund
At a meeting held on August 22, 2023, the Board, including the Independent Trustees, considered the following material factors during their deliberations in considering whether to renew the Management Agreement between the Adviser and the Fund: (i) the nature, extent and quality of services provided by the Adviser; (ii) the investment performance of the Fund and the Adviser; (iii) the estimated cost of services to be provided and any profits to be realized by the Adviser and its affiliates; (iv) the extent to which economies of scale will be realized as the Fund grows; and (v) whether the fee levels reflect these economies of scale for the benefit of investors.
Nature, Extent and Quality of Services. The Board considered the nature, extent, and quality of the services provided by the Adviser. The Board reviewed a copy of the Adviser’s current Form ADV and information regarding the Adviser’s organizational structure. The Board reviewed the backgrounds of the key personnel serving the Fund, and observed that they had deep and extensive asset management and compliance expertise. The Board acknowledged that the team managing the Fund remained consistent from year to year. The Board discussed the Adviser’s oversight role of the Sub-Adviser, noting how the Adviser regularly communicated with the Sub-Adviser and continuously reviewed the Fund’s holdings for compliance with investment limitations and legal requirements. The Board highlighted that the Adviser reviewed underlying fund investments both with, and independent of, the Sub-Adviser. The Board noted that the Adviser reported no material litigation or administrative matters involving the Adviser or any affiliate and observed that the Adviser had an adequate business continuity plan.
Performance. The Board considered the performance of the Fund, noting that the Fund had positive performance of the one-year period, but had underperformed its peer group and benchmark over the one-year and since inception periods. The Board noted that the Adviser expressed confidence in the Sub-Adviser’s ability to navigate credit cycles and its belief that Fund performance would be strong relative to the benchmark upon completion of the current credit cycle. After discussion and consideration of the Fund’s strategy, the Board concluded that Adviser should be given the opportunity to manage the Fund for a full market cycle.
Fees and Expenses. The Board remarked that the Fund’s management fee of 1.85% was higher than the average of the peer group, but below the high of the peer group. The Board noted that the Adviser agreed to limit expenses and noted that the expense ratio was well below the average of the peer group. The Board determined that the advisory fees was not unreasonable.
Profitability. The Board considered the Adviser’s net profits from its relationship with the Fund. The Board discussed information provided by the Adviser indicating that the Adviser had not realized a profit from its relationship with the Fund over the past year. The Board concluded therefore that excessive profitability was not an issue for the Adviser at this time.
Economies of Scale. The Board considered whether economies of scale had been realized in connection with the Adviser’s advisory services provided to the Fund. The Board noted that based on the Fund’s current asset size and profit level, the absence of breakpoints was acceptable, and agreed to continue monitoring the Fund’s asset levels and to revisit the matter as the Fund continued to grow.
Conclusion. Having requested and received such information from the Adviser as the Board believed to be reasonably necessary to evaluate the terms of the Management Agreement, and as assisted by the advice of independent counsel, the Board concluded that the advisory fee structure was not unreasonable and that renewal of the Management Agreement was in the best interests of the Trust and the future shareholders of the Fund.
The Board noted in its consideration of the Management Agreement that the Trustees, including the Independent Trustees, did not identify any single factor as all-important or controlling, and the foregoing summary does not detail all the matters considered.
Consideration of Subadvisory Agreement between the Adviser and the Sub-Adviser
At a meeting held on August 22, 2023, the Board, including the Independent Trustees, considered the following material factors during their deliberations in considering whether to renew the Subadvisory Agreement between the Adviser and the Sub-Adviser: (i) the nature, extent and quality of services provided by the Sub-Adviser; (ii) the investment performance of the Fund and the Sub-Adviser; and (iii) the estimated cost of services to be provided.
Nature, Extent and Quality of Services. The Board considered the nature, extent, and quality of the services provided by the Sub-Adviser. The Board reviewed the responses provided in the Sub-Adviser 15(c) Questionnaire, which included a discussion of the services provided by the Sub-Adviser. It reviewed the services provided to the Fund by the Sub-Adviser, noting the Sub-Adviser used an analytical investment process, broad-based deal flow, extensive relationships in the financial community, financial and capital structuring skills, an investment surveillance database, and operational expertise in managing the Fund’s assets. The Board considered the Sub-Adviser’s robust investment selection process. The Board discussed the backgrounds of the personnel providing services to the Fund, and observed their considerable asset management, operational and compliance experience. The Board acknowledged that the Sub-Adviser invested substantial resources in developing its own proprietary computer systems and its front and back-office portfolio management system. The Board reviewed the key risks associated with the Fund’s strategy and discussed how the Sub-Adviser managed those risks. The Board considered how the Sub-Adviser monitored compliance with the Fund’s investment limitations. The Board discussed the Sub-Adviser’s robust counterparty selection process and how the Sub-Adviser allocated investment opportunities among clients to achieve a fair and equitable treatment of participating funds and accounts over time. The Board commented that the Sub-Adviser reported no material compliance issues since the Sub-Advisory Agreement was last renewed. The Board recognized that the Sub-Adviser had robust business continuity and disaster recovery procedures.
Ellington Income Opportunities Fund
BOARD APPROVAL OF MANAGEMENT AGREEMENT (Unaudited)(continued)
December 31, 2023
Performance. The Board considered the performance of the Fund, noting that the Fund had positive performance of the one-year period, but had underperformed its peer group and benchmark over the one-year and since inception periods. The Board noted that the Adviser expressed confidence in the Sub-Adviser’s ability to navigate credit cycles and its belief that Fund performance would be strong relative to the benchmark upon completion of the current credit cycle. After discussion and consideration of the Fund’s strategy, the Board concluded that Sub-Adviser should be given the opportunity to manage the Fund for a full market cycle.
Fees and Expenses. The Board recalled that the Sub-Adviser received a portion of the overall management fee from the Adviser rather than from the Fund. The Board reviewed that the sub-advisory fee was 60% of the net management fee. The Board discussed the Sub-Adviser’s representation that all sub-advisory fees had been waived for the past year. The Board concluded that the sub-advisory fee was not unreasonable.
Profitability. The Board considered the Sub -Adviser’s net profits from its relationship with the Fund. The Board discussed information provided by the Sub-Adviser indicating that the Sub-Adviser had not realized a profit from its relationship with the Fund over the past year. The Board concluded, therefore, that excessive profitability was not an issue for the Sub-Adviser at this time.
Economies of Scale. The Board considered whether economies of scale had been realized in connection with the services provided to the Fund. The Board determined that economies of scale was a Fund level issue and should be considered with respect to the Fund’s overall management fee.
Conclusion. Having requested and received such information from the Sub-Adviser as the Board believed to be reasonably necessary to evaluate the terms of the Sub-Advisory Agreement, and as assisted by the advice of independent counsel, the Board concluded that the sub-advisory fee structure was reasonable, and that renewal of the Sub-Advisory Agreement was in the best interests of the Trust and the Fund’s shareholders.
The Board noted in its consideration of the Subadvisory Agreement that the Trustees, including the Independent Trustees, did not identify any single factor as all-important or controlling, and the foregoing summary does not detail all the matters considered.
Ellington Income Opportunities Fund
TRUSTEES AND EXECUTIVE OFFICERS (Unaudited)
December 31, 2023
Set forth below is information with respect to each of the Trustees and executive officers of the Fund, including their principal occupations during the past five years. The business address of the Fund, its Trustees and executive officers is c/o Princeton Fund Advisors, LLC, 8500 Normandale Lake Blvd, Suite 1900, Minneapolis, MN, 55437. The Fund’s Statement of Additional Information contains additional information about the Fund’s Trustees and is available, without charge, upon request, by calling the Fund at 1-855- 862-6092.
Name and
Year of Birth | Position(s) Held with the Trust | Term of Office and Length of Time Served (1) | Principal Occupations During Past Five Years | Number of Portfolios in Fund Complex (2) Overseen by Trustee | Other Directorships Held by Trustee During the Past Five Years |
| Independent Trustees |
Jeffrey P. Greiner
(1958) | Trustee and Chairman of the Audit Committee | Since 2018 | Co-Founder and Managing Partner, Northern Pacific Group (2012-Present). | 2 | YMCA of the Greater Twin Cities (2000-Present); Boy Scouts of America (2013-Present); Princeton Everest Fund (2014-Present); Delaget (2014-Present); Outsell (2015-Present); Okabena Oakleaf Trust (2010 to Present); The Cathedral Church of St. Mark Foundation (2009-2019). |
Richard P. Imperiale
(1960) | Trustee | Since 2018 | Chairman & Chief Investment Officer, Uniplan Investment Counsel, Inc. (1984-Present). | 1 | Retail Properties of America (RPAI-NYSE) (2011-Present); Reven Housing (REVN-NYSE) (2011-Present). |
William J. Peichel
(1957) | Trustee | Since 2023 | Principal at Design Intelligence and Managing Partner of DI Capital Advisors (since 2021); Executive Officer of Mount Yale Capital Group, LLC (2018 to 2021) | 2 | Princeton Everest Fund (2023 -Present) |
| Interested Trustees |
John L. Sabre
(1957) | Trustee and President | Since 2018 | Chairman and CEO, Mount Yale Capital Group, LLC (2003-Present); Chairman and CEO Princeton Fund Advisors, LLC (2011-Present). | 2 | Princeton Everest Fund (2014-Present). |
Laurence E. Penn
(1962) | Trustee | Since 2018 | Vice Chairman, Ellington Management Group, LLC and its affiliates (1995-Present); Chairman, IMO 2021 Inc. | 1 | Ellington Financial Inc. (NYSE: EFC) (2007-Present); Ellington Residential Mortgage REIT Inc. (NYSE: EARN) (2012-Present). |
| (1) | The term of office for each Trustee listed above will continue indefinitely. |
| (2) | The “Fund Complex” consists of the Fund and Princeton Everest Fund (PEF). |
The following provides information regarding the executive officers of the Fund who are not Trustees. Officers serve at the pleasure o the Trustees and until his successor is appointed and qualified or until his earlier resignation or removal.
Ellington Income Opportunities Fund
TRUSTEES AND EXECUTIVE OFFICERS (Unaudited)(continued)
December 31, 2023
Name and
Year of Birth | Position(s) Held
with the Trust | Length of Time
Served | Principal Occupations During Past Five Years |
Christopher E. Moran (1979) | Treasurer | Since 2018 | Chief Financial Officer, Mount Yale Capital Group, LLC (2007-Present). |
Christopher Nelson (1968) | Secretary | Since 2021 | Senior Compliance Officer (March 2021-Present); Compliance Officer, (November 2010-February 2021). |
Emile R. Molineaux (1962) | Chief Compliance Officer | Since 2018 | Senior Compliance Officer of Northern Lights Compliance Services, LLC (“NLCS”) (2011-Present) and named CCO for seven different NLCS clients. |
32
Item 2. Code of Ethics.
The registrant has adopted a code of ethics that applies to the registrant’s principal executive officer and principal financial officer. The registrant has not made any substantive amendments to its code of ethics during the period covered by this report. The registrant has not granted any waivers from any provisions of the code of ethics during the period covered by this report.
A copy of the registrant’s Code of Ethics is filed herewith.
Item 3. Audit Committee Financial Expert.
The registrant’s board of directors has determined that there is at least one audit committee financial expert serving on its audit committee. William Peichel qualified as an “audit committee financial expert” and is considered to be “independent” as each term is defined in Item 3 of Form N-CSR.
Item 4. Principal Accountant Fees and Services.
The registrant has engaged its principal accountant to perform audit services, audit-related services, tax services and other services during the past two fiscal years. “Audit services” refer to performing an audit of the registrant's annual financial statements or services that are normally provided by the accountant in connection with statutory and regulatory filings or engagements for the past fiscal year. “Audit-related services” refer to the assurance and related services by the principal accountant that are reasonably related to the performance of the audit. “Tax services” refer to professional services rendered by the principal accountant for tax compliance, tax advice, and tax planning. There were no “Other services” provided by the principal accountant. The following table details the aggregate fees billed or expected to be billed for each of the last two fiscal years for audit fees, audit-related fees, tax fees and other fees by the principal accountant.
| | FYE 12/31/23 | FYE 12/31/22 |
| Audit Fees | $42,000 | $49,375 |
| Audit-Related Fees | - | - |
| Tax Fees | $6,500 | $6,000 |
| All Other Fees | - | - |
The audit committee has adopted pre-approval policies and procedures that require the audit committee to pre-approve all audit and non-audit services of the registrant, including services provided to any entity affiliated with the registrant.
The percentage of fees billed by RSM US, LLP applicable to non-audit services pursuant to waiver of pre-approval requirement were as follows:
| | FYE 12/31/2023 | FYE 12/31/2022 |
| Audit-Related Fees | 0% | 0% |
| Tax Fees | 100% | 100% |
| All Other Fees | 0% | 0% |
All of the principal accountant’s hours spent on auditing the registrant’s financial statements were attributed to work performed by full-time permanent employees of the principal accountant.
The following table indicates the non-audit fees billed or expected to be billed by the registrant’s accountant for services to the registrant and to the registrant’s investment adviser (and any other controlling entity, etc.—not sub-adviser) for the last two years. The audit committee of the board of trustees/directors has considered whether the provision of non-audit services that were rendered to the registrant's investment adviser is compatible with maintaining the principal accountant's independence and has concluded that the provision of such non-audit services by the accountant has not compromised the accountant’s independence.
| Non-Audit Related Fees | FYE 12/31/2023 | FYE 12/31/2022 |
| Registrant | $6,500 | $6,000 |
| Registrant’s Investment Adviser | $0 | $0 |
Item 5. Audit Committee of Listed Registrants.
Not applicable to registrants who are not listed issuers (as defined in Rule 10A-3 under the Securities Exchange Act of 1934).
Item 6. Investments.
| (a) | Schedule of Investments is included as part of the report to shareholders filed under Item 1 of this Form. |
Item 7. Disclosure of Proxy Voting Policies and Procedures for Closed-End Management Investment Companies.
E l l i n g t o n M a n a g e m e n t G r o u p
Compliance Manual
Proxy Voting and Corporate Actions
| 19. | Proxy voting AND CORPORATE ACTIONS |
The firm’s policy with respect to voting equity proxies or exercising discretion with respect to fixed income corporate actions is outlined below. In all cases, in circumstances in which we are exercising discretion on behalf of a Client, that discretion is to be exercised in accordance with our good faith assessment of the best interests of the Client in light of the proposed vote or action.
As a general rule, Ellington votes equity proxies for Clients with respect to which the Firm has determined that the benefit of voting such proxies exceeds the cost of voting them. Factors considered in making this determination can include: i) the strategy of the Client, ii) the amount of equities traded, iii) the holding periods for equities positions, iv) whether equities positions are typically long or short, and v) any other relevant factors.
Ellington’s policy is to generally presume that voting proxies is a net benefit to Clients who take long equity positions as a material part of their strategy.
| 19.1.1.1. | Use of third party proxy service |
With respect to equities accounts for which Ellington has determined that the benefit of voting proxies outweighs the cost of voting those proxies, the Firm expects to employ a third party proxy voting service. Proxies will be voted by the service in accordance with their then-current guidelines. Though, as discussed below, the Firm may elect not to vote proxies for quantitative equities clients in cases in which the cost of such voting outweighs its benefits, a proxy service may nevertheless be engaged for clients pursuing such strategies in cases in which the terms of the relevant governing documents or agreements require voting of proxies.
| 19.1.1.1.1. | Deviation from proxy service guidelines |
For Clients for whom proxies are voted, the recommendation of the proxy service may be overridden on a case-by-case basis, provided the portfolio manager for the relevant Client has made a determination that it is in the best interests of the Client to vote contrary to the recommendations of the service. All such votes must be pre-approved by the CCO or his designee.
E l l i n g t o n M a n a g e m e n t G r o u p
Compliance Manual
Proxy Voting and Corporate Actions
| 19.1.1.2. | Quantitative equities Clients |
Notwithstanding the presumption in favor of voting proxies for equities funds, the Firm may determine, on a case-by-case basis, that the benefit of voting proxies for a particular strategy or Client is outweighed by the costs. For example, quantitative equities strategies with relatively high turnover and which may take short positions in the same equities in which they have taken long positions within the previous 30 to 60 days, may derive little benefit from the voting of proxies. Determinations not to vote proxies for such accounts will be made by the Compliance Committee upon the recommendation of the relevant portfolio manager, and such determinations will be periodically re-assessed by the Committee. In determining whether to vote proxies for such Clients, the Committee will also consider the disclosure made or to be made to the Client or its investors.
| 19.1.2. | Non-equities Clients |
Ellington has made a determination that, with the present exception of equities Clients as discussed above, the holdings of equity securities in accounts managed by Ellington are either non-existent, incidental, or immaterial relative to the overall size and strategies of such Clients, and that the cost of voting proxies for such Clients currently exceeds the expected benefit to those Ellington Clients. Accordingly, Ellington will not under ordinary circumstances vote proxies relating to equity securities held in such Client accounts.
| 19.1.3. | Discretion to vote equity proxies in accounts not using a proxy service |
Notwithstanding a general determination not to vote equity proxies for a particular Client, where the relevant portfolio manager believes that voting a particular proxy is in the interests of a Client, the portfolio manager has the discretion to vote such proxy, provided that it is voted in the best interest of the relevant Client and the vote receives the prior approval of the CCO.
| 19.1.4. | Mitigation of Conflicts of Interest |
As discussed above, firm policy it either (i) to make use of a proxy service and require CCO approval of votes deviating from the recommendation of the proxy service, or (ii) to vote without use of proxy service, provided the vote receives prior approval of the CCO. In both cases, the CCO’s review and approval is intended to assist with identification of potential conflicts of interest that may arise in connection with the vote, and to permit the CCO, in consultation with others as appropriate, to recommend additional conflict mitigating measures where appropriate, including, for example, seeking review or approval by a client, fund board, or advisory committee.
E l l i n g t o n M a n a g e m e n t G r o u p
Compliance Manual
Proxy Voting and Corporate Actions
From time to time the firm receives requests from trustees or issuers for votes or other instructions or actions (together, “Corporate Actions”) with respect to fixed income securities held by our Clients.
Corporate Actions should be forwarded to Legal and Compliance on a timely basis for review.
| 19.2.1. | Review by Legal and Compliance |
An attorney in Legal and Compliance will review Corporate Actions, including review of any documents to be executed in connection with the Action and consultation with the relevant Portfolio Manager or trading personnel concerning their assessment of the proposed action and any recommendation they have with respect to it.
In addition, the CCO will conduct a “conflicts check” to assess whether multiple clients may have conflicting financial interests in a proposed Action through short positions or investment in multiple levels of an issuer’s capital structure.
| 19.2.2. | Review by Vice Chairman |
After review, Legal and Compliance will forward to Laurence Penn a recommendation with respect to a proposed Corporate Action. Approved recommendations should be forwarded to the appropriate operations personnel to ensure timely response.
Corporate Actions which are solely ministerial or administrative in nature and have no anticipated substantive economic effects on the issuer or its security-holders may be reviewed solely by Legal and Compliance and need not be submitted to the Vice Chairman for prior review.
| 19.2.3. | Corporate Actions and ERISA Clients |
Corporate Actions in which the interests of any Ellington Client deemed an ERISA benefit plan or “look-through” benefit plan conflict with those of another Ellington Client may, depending upon the facts and circumstances, be reviewed by an outside or “third-party fiduciary” who is engaged to act on behalf of one or more Ellington Clients. The CCO will refer potential conflicts involving ERISA Clients to the Compliance Committee for prior review. The Committee will make a recommendation to the Executive Committee with respect to whether a third-party fiduciary should be engaged in such circumstances.
E l l i n g t o n M a n a g e m e n t G r o u p
Compliance Manual
Proxy Voting and Corporate Actions
| Updated: | October 23, 2018; October 10, 2012; October 19, 2011; June 22, 2010; November 24, 2009; June 2, 2009 |
Item 8. Portfolio Managers of Closed-End Management Investment Companies.
The following table provides biographical information about the portfolio management of the Ellington Income Opportunities Fund as of December 31, 2023:
Michael Vranos
Mr. Vranos founded Ellington in December of 1994. Until December 1994, Mr. Vranos was the Senior Managing Director of Kidder Peabody in charge of RMBS trading. Mr. Vranos began his Wall Street career in 1983, after graduating magna cum laude, Phi Beta Kappa with a Bachelor of Arts in Mathematics from Harvard University.
Mark Tecotzky
Mr. Tecotzky is a Managing Director and head manager for all MBS/ABS credit. Prior to joining Ellington, Mr. Tecotzky was the senior trader in the mortgage department at Credit Suisse Prior to joining Credit Suisse, Mr. Tecotzky worked at Kidder Peabody as a Managing Director where he traded agency and credit sensitive pass-throughs and structured CMOs. Mr. Tecotzky holds a B.S. from Yale University, and received a National Science Foundation fellowship to study at MIT.
Portfolio Manager Compensation
The portfolio managers receive an annual base salary from Ellington and, as partners in Ellington, also receive a share of the firm’s profits.
The following table provides information about portfolios and accounts, other than the Ellington Income Opportunity Fund, for which the Portfolio Managers are primarily responsible for the day-to-day portfolio management as of December 31, 2023:
| Name of Investment Committee Member | Type of Accounts | Total Number of Accounts Managed | Total Assets ($MM) | Number of Accounts Managed for Which Advisory Fee is Based on Performance | Total Assets for Which Advisory Fee is Based on Performance ($MM) |
| Michael Vranos | Various | 47 | $9,163 | 22 | $5,454 |
| Mark Tecotzky | Various | 39 | $8,284 | 22 | $5,454 |
Conflicts of Interest
In addition to the sub-advisory services provided to the Fund, Ellington and its affiliates (together, the “Ellington Group”) provide investment management services to private, pooled investment vehicles, public companies, and institutional managed accounts (together “Clients” or “Client Accounts”). Ellington, other members of the Ellington Group, and Ellington’s employees and other related persons have interests in certain of these Client Accounts. In some cases, the Ellington Group may have invested in or hold shares of a Client Account, or may own most or all of an Account. In some cases, members of the Ellington Group may receive performance-based fees from a Client Account though Ellington does not receive such fees from the Fund. For all these reasons, Ellington has differing interests with respect to different Client Accounts, including the Fund, or with respect to individual transactions or investments made by or contemplated for those Accounts. Conflicts of interest among Client Accounts, for example when they compete for limited investment opportunities, may be more pronounced because of differing direct or indirect interests of Ellington or its affiliates with respect to those Accounts.
Set forth below is a summary of some of the circumstances in which such conflicts of interest may and do arise:
Allocation of Investment Opportunities and Order Aggregation
Ellington exercises reasonable, good faith judgment when determining which investment opportunities are appropriate for each Client Account. Investment opportunities are generally allocated on the basis of capital available for such opportunities and other relevant factors particular to an Account, including, but not limited to, the strategy pursued for the Account and applicable investment restrictions, tax considerations, Employee Retirement Income Security Act and other regulatory considerations, risk parameters, a Client’s pre-existing position, and the appropriate overall composition of each Client Account. Ellington may at times allocate opportunities on a preferential basis to Client Accounts that are in a “start-up” or “ramp-up” phase or to rebalance Accounts following the addition of capital to or withdrawal of capital from one or more Client Accounts.
Because Ellington allocates investment opportunities among multiple Client Accounts, conflicts arise when certain Client Accounts seek to sell investments when other Client Accounts hold similar or the same investments. For example, Client Accounts in liquidation or wind-down, or Client Accounts with differing liquidity or redemption terms, may seek to sell commonly held investments before other Client Accounts. Sale by such Client Accounts of the same or similar investments, depending upon the volume of sales and the nature of the market, may affect the market value of investments that continue to be held by other Client Accounts, including the Fund.
Transactions executed for Client Accounts may be effected independently or on an aggregated basis. Aggregation of Client orders can achieve better execution or result in more favorable commission rates. Such aggregation of orders, however, may not always be to the benefit of every Client Account with regard to the price or quantity executed for each individual transaction. Ellington’s policy is to allocate executions of aggregated Client orders on a fair and equitable basis among participating Clients.
Receipt of Material Non-public Information
The Ellington Group may come into possession of material non-public information or other confidential information as a result of its business activities. Ellington has adopted policies with respect to insider trading and receipt of confidential information which include restrictions on trading for personal and Client Accounts in circumstances in which the firm has received material, confidential information. As a consequence, the possession of such information may limit the ability of Ellington’s Client Accounts to buy or sell a security or otherwise to participate in an investment opportunity.
Differing Advice
Client Accounts may buy or sell securities of an issuer that are also bought or sold by the Ellington Group, other Client Accounts of the Ellington Group, or by Ellington employees for their own accounts. In this regard, Ellington may give and has given advice and recommend securities, derivatives, and other financial instruments to a Client Account which may be identical to or may differ from advice given to or instruments recommended or bought or sold for or by other Accounts, affiliates, or employees, even though their investment objectives may be the same or similar.
Cross or Principal Transactions
Ellington, an Ellington Client Account, or a member or principal account of the Ellington Group may buy securities from or sell securities to a Client Account where consistent with the best interests of participating Clients, applicable law (including the 1940 Act) and the governing, advisory, and other documents related to the participating Clients.
Differing Interests in an Issuer
Client Accounts may, from time to time, make an investment in an issuer in a different level of the issuer’s capital structure than the level in which the Ellington Group or one or more other Client Accounts has invested. Such circumstances may result in a conflict among or with such Client Accounts to the extent that a Client Account holds securities with rights, preferences, or privileges with respect to an issuer that are different than those held by other Client Accounts or the Ellington Group. In such instances, Ellington, in its sole discretion when acting in the best interests of each Client, may make recommendations and decisions regarding such rights or privileges for other entities that may be the same as or different from those made by or on behalf a Client Account and may take actions (or elect to take no action) in the context of these other economic interests or relationships the consequences of which may be adverse to the interests of a particular Client Account.
Other Activities and Affiliations
Ellington and the Ellington Group are not restricted from forming additional funds or vehicles, from entering into other investment advisory relationships, or from engaging in other business, academic, public policy, or charitable activities, even though such activities may be in competition with a Client Account or its interests or may involve substantial time and resources of Ellington’s principals or employees. Although Ellington and its principals and employees will devote as much of their time to the activities of Client Accounts as they deem necessary and appropriate, these other activities could be viewed as creating a conflict of interest in that the time and effort of Ellington and its related persons will be allocated among various Client Accounts and business activities.
Other Relationships with Brokers and Counterparties
The Ellington Group has other interests in or business arrangements with brokers and dealers used to execute transactions for Client Accounts, including the Fund.
Certain brokers or other counterparties for Ellington’s Client Accounts may offer capital introduction services. Capital introduction is a service designed to introduce fund managers to potential investors, typically through individual meetings or in a conference format. Although capital introduction is customarily offered as a free service, various conflicts of interest are presented by such arrangements. Ellington may, for example, have an incentive to use the services of a specific broker due to the broker’s ability to raise capital for management by Ellington or another member of the Ellington Group.
The Ellington Group may have other business arrangements with brokers and dealers used to execute transactions for Clients. For example, brokerage firms and their affiliates and representatives may also be Ellington Clients or invest in pooled investment vehicles managed by the Ellington Group. Brokerage firms may also provide financing, underwriting, placement or other services to the Ellington Group or other Client Accounts.
In addition, brokerage firms and their employees may offer gifts to Ellington’s employees, and may invite employees to entertainment and social events. Acceptance of such gifts and entertainment is subject to policies set forth in Ellington’s Code of Ethics. Ellington policy prohibits consideration of factors such as receipt of gifts and entertainment when selecting brokers and counterparties to execute transactions for Client Accounts.
The following table sets forth the dollar range of equity securities beneficially owned by each member of the Investment Committee in the Fund as of December 31, 2023:
| Investment Committee Member | Dollar Range of Fund Shares Beneficially Owned |
| Michael Vranos | None |
| Mark Tecotzky | None |
Item 9. Purchases of Equity Securities by Closed-End Management Investment Company and Affiliated Purchasers.
Not Applicable.
Item 10. Submission of Matters to a Vote of Security Holders.
Not Applicable.
Item 11. Controls and Procedures.
| (a) | The Registrant’s President and Treasurer have reviewed the Registrant's disclosure controls and procedures (as defined in Rule 30a-3(c) under the Investment Company Act of 1940 (the “Act”)) as of a date within 90 days of the filing of this report, as required by Rule 30a-3(b) under the Act and Rules 13a-15(b) or 15d-15(b) under the Securities Exchange Act of 1934. Based on their review, such officers have concluded that the disclosure controls and procedures are effective in ensuring that information required to be disclosed in this report is appropriately recorded, processed, summarized and reported and made known to them by others within the Registrant and by the Registrant’s service provider. |
| (b) | There were no changes in the Registrant's internal control over financial reporting (as defined in Rule 30a-3(d) under the Act) that occurred during the period covered by this report that have materially affected, or are reasonably likely to materially affect, the Registrant's internal control over financial reporting. |
Item 12. Disclosure of Securities Lending Activities for Closed-End Management Investment Companies
The registrant did not engage in securities lending activities during the fiscal year ended December 31, 2023 reported on this Form N-CSR.
Item 13. Exhibits.
(2) A separate certification for each principal executive officer and principal financial officer pursuant to Section 302 of the Sarbanes-Oxley Act of 2002. Filed herewith.
(3) Any written solicitation to purchase securities under Rule 23c-1 under the Act sent or given during the period covered by the report by or on behalf of the registrant to 10 or more persons. Not applicable.
(4) Change in the registrant’s independent public accountant. There was no change in the registrant’s independent public accountant for the period covered by this report.
SIGNATURES
Pursuant to the requirements of the Securities Exchange Act of 1934 and the Investment Company Act of 1940, the registrant has duly caused this report to be signed on its behalf by the undersigned, thereunto duly authorized.
| | (Registrant) | Ellington Income Opportunities Fund | |
| | | | |
| | By (Signature and Title) | /s/ John L. Sabre | |
| | | John L. Sabre, President (Principal Executive Officer) | |
| | | | |
| | Date | March 12, 2024 | |
Pursuant to the requirements of the Securities Exchange Act of 1934 and the Investment Company Act of 1940, this report has been signed below by the following persons on behalf of the registrant and in the capacities and on the dates indicated.
| | By (Signature and Title) | /s/ John L. Sabre | |
| | | John L. Sabre, President (Principal Executive Officer) | |
| | | | |
| | Date | March 12, 2024 | |
| | By (Signature and Title) | /s/ Christopher E. Moran | |
| | | Christopher E. Moran, Treasurer and Chief Financial Officer (Principal Financial Officer) | |
| | | | |
| | Date | March 12, 2024 | |