UNITED STATES
SECURITIES AND EXCHANGE COMMISSION
Washington, D.C. 20549
FORM N-CSR
CERTIFIED SHAREHOLDER REPORT OF REGISTERED
MANAGEMENT INVESTMENT COMPANIES
Investment Company Act File Number: 811-23383
LORD ABBETT CREDIT OPPORTUNITIES FUND
(Exact name of Registrant as specified in charter)
90 Hudson Street, Jersey City, NJ 07302
(Address of principal executive offices) (Zip code)
John T. Fitzgerald, Esq., Vice President & Assistant Secretary
90 Hudson Street, Jersey City, NJ 07302
(Name and address of agent for service)
Registrant’s telephone number, including area code: (888) 522-2388
Date of fiscal year end: 12/31
Date of reporting period: 12/31/2020
Form N-CSR is to be used by management investment companies to file reports with the Commission not later than 10 days after the transmission to stockholders of any report that is required to be transmitted to stockholders under Rule 30e-1 under the Investment Company Act of 1940 (17 CFR 270.30e-1). The Commission may use the information provided on Form N-CSR in its regulatory, disclosure review, inspection, and policymaking roles.
A registrant is required to disclose the information specified by Form N-CSR, and the Commission will make this information public. A registrant is not required to respond to the collection of information contained in Form N-CSR unless the Form displays a currently valid Office of Management and Budget (“OMB”) control number. Please direct comments concerning the accuracy of the information collection burden estimate and any suggestions for reducing the burden to Secretary, Securities and Exchange Commission, 450 Fifth Street, NW, Washington, DC 20549-0609. The OMB has reviewed this collection of information under the clearance requirements of 44 U.S.C. § 3507.
| Item 1: | Report(s) to Shareholders. |

LORD ABBETT
ANNUAL REPORT
Lord Abbett
Credit Opportunities Fund
For the fiscal year ended December 31, 2020
Table of Contents
Lord Abbett Credit Opportunities Fund
Annual Report
For the fiscal year ended December 31, 2020

From left to right: James L.L. Tullis, Independent Chairman of the Lord Abbett Funds and Douglas B. Sieg, Trustee, President, and Chief Executive Officer of the Lord Abbett Funds.
Dear Shareholders: We are pleased to provide you with this overview of the performance of Lord Abbett Credit Opportunities Fund for fiscal year ended December 31, 2020. On this page and the following pages, we discuss the major factors that influenced fiscal year performance. For additional information about the Fund, please visit our website at www.lordabbett.com, where you also can access quarterly commentaries that provide updates on the Fund’s performance and other portfolio related updates.
Thank you for investing in Lord Abbett mutual funds. We value the trust that you place in us and look forward to serving your investment needs in the years to come.
Best regards,

Douglas B. Sieg
Director, President, and Chief Executive Officer
For the fiscal year ended December 31, 2020, the Fund returned 12.84%, reflecting performance at the net asset value (NAV) of Institutional Class shares with all distributions reinvested. For context, investment grade bonds, as represented by the Bloomberg Barclays U.S. Aggregate Bond Index1, returned 7.51%, high yield bonds, as represented by the ICE BofA U.S. High Yield Constrained Index2, returned 6.07%, and bank loans, as represented by the Credit Suisse Leveraged Loan Index3, returned 2.78%.
The trailing twelve-month period was characterized by several market-moving events. After trade tensions continued to ebb and flow in the final months of 2019, U.S. President Donald Trump signed a “phase one” trade deal with China on the 15th of January 2020 and markets priced in a likelihood of two more interest rate cuts in 2020. The tide turned abruptly in February and March 2020, as the outbreak of the COVID-19 pandemic and the expected economic damage resulting from a sudden slowdown in corporate spending,
1
individual spending, consumer confidence, and thus recessionary and deflationary pressures, triggered a severe sell-off. As the COVID-19 pandemic fueled fears of slowing global growth, oil prices fell precipitously, with the primary U.S. oil contract closing in negative territory for the first time in history, although it has since rebounded. During the month of March, the S&P 500 Index4 experienced its fastest bear market since 1987 and the longest U.S. economic expansion in history ended at 128 months.
The U.S. Federal Reserve (Fed) responded to the COVID-19 outbreak with a breadth of policy measures which lifted investors’ confidence in the markets. The Fed launched a $700 billion quantitative easing program, decreased the reserve requirements to zero for thousands of banks, and cut the federal funds rate to the current target range of 0-0.25%. Next, the Fed announced additional stimulus programs, including open-ended asset purchases, purchases of corporate debt, and a commitment to a new small business lending program. Additionally, the central bank announced $2.3 trillion of credit support by expanding the Primary Market Corporate Credit Facility (PMCCF), the Secondary Market Corporate Credit Facility (SMCCF), and the Term Asset-Backed Securities Loan Facility (TALF). Most notably, the expanded measures included the purchase of select fallen angels.
Risk assets began to stage a recovery in April and May 2020 on the back of progress with respect to COVID-19 treatments and vaccines, commentary from several
corporations that indicated stabilization in April and May, and massive monetary and fiscal policy globally. Positive market sentiment continued into the third quarter of 2020 as well. In addition to the factors listed above, tailwinds for the continued rally in risk assets included a rebound in earnings revisions and further progress in COVID-19 treatments, as evidenced by multiple drugs reaching Phase III trials. In September, however, market sentiment soured amid political volatility related to the U.S. Supreme Court vacancy, increased COVID-19 concerns in Europe as global deaths topped one million, heightened uncertainty leading up to the U.S. Presidential election, and worries about stalled fiscal stimulus talks in Washington.
Despite the volatility in the fall, the markets rallied in the month of November with the Dow Jones Industrial Average having its best month since 1987. The rally was largely attributed to the conclusion of the U.S. Presidential election and positive vaccine news. Specifically, Former U.S. Vice President Biden defeated U.S. President Trump in the U.S. Presidential election, while the Republican Party narrowed the Democratic majority in the House. Soon after, Pfizer/BioNTech, Moderna, and AstraZeneca each announced a COVID-19 vaccine with greater than 90% efficacy rate. In December, as expected, the Food and Drug Administration (FDA) granted emergency use authorization for the Pfizer/BioNTech and Moderna vaccines. Monetary and fiscal policy remained largely supportive, as the Fed maintained interest
2
rates near zero in its December meeting and noted that it would continue its monthly pace of at least $120 billion of asset purchases until “substantial further progress has been made toward the Committee’s maximum employment and price stability goals”. Additionally, Congress passed a fifth COVID-19 relief package, worth roughly $900 billion, with approximately $325 billion in small business relief.
The Fund seeks to deliver total return by investing across a broad range of global fixed income sectors. The Fund aims to capture illiquidity and complexity premiums while capitalizing on idiosyncratic, catalyst-driven investment opportunities. This flexible strategy utilizes a bottom-up approach and seeks to maximize risk-adjusted returns, leveraging our capabilities across multiple fixed income segments to construct a portfolio of our highest conviction ideas.
The Fund’s exposure to select energy-related high yield issuers contributed to relative performance during the period. Specifically, the Fund’s holdings of Matador Resources, Co. and Centennial Resource Production LLC were some of the largest contributors to relative performance. The rationale for the Fund’s investment was that both of these oil and natural gas energy & production companies had what we believed to be strong reserve asset coverage, attractive assets in the Permian basin, and sufficient liquidity and operational flexibility. Companies in oil and oilfield services have been boosted by higher oil and gas prices and re-kindling of oilfield activity.
Crude prices have more than doubled from spring lows, spurring companies to bring back production that was shut down earlier in the year and complete wells that were not hooked up to pipelines. Similarly, the Fund’s investment in a convertible bond of Chart Industries, Inc., a leading manufacturer of equipment used in the liquid gas supply chain, also contributed to relative performance. The company has shown upside potential from large liquefied natural gas projects and has made new investments in the hydrogen fueling market which have boosted investor sentiment despite the year’s commodity down cycle.
The Fund’s allocation to bank loans of J. Crew Group, Inc. was one of the largest detractors from returns during the period. J. Crew Group is an American multi-brand, multi-channel, specialty retailer with both a brick and mortar and substantial online presence. The Fund originally invested in the loans of the company after our analysis showed that Madewell Inc., a fast-growing denim subsidiary of J. Crew, had significant value well above the trading value of the loan, with the potential for a par or better recovery. Earlier this year, J. Crew filed for an IPO for Madewell that would have valued the company well in excess of the J. Crew loan. Unfortunately, the COVID-19 pandemic prevented the offering, and J. Crew was forced to file for bankruptcy, although the retailer came to a consensual deal with most of its creditors to officially exit bankruptcy in late 2020. The Fund’s position in a high yield corporate bond in Revlon Consumer Products Corp., a
3
global cosmetics and personal care products supplier, also detracted from relative performance. The company was struggling with a heavy debt load, heightened competition, and changing consumer taste; struggles that were intensified with the onset of the COVID-19 pandemic, placing in doubt the company’s ability to avoid a near-term restructuring. Despite finally obtaining adequate support from bondholders, in November, to avoid bankruptcy, the bonds are still trading at heavily distressed levels.
The Fund’s portfolio is actively managed and, therefore, its holdings and the weightings of a particular issuer or particular sector as a percentage of portfolio assets are subject to change. Sectors may include many industries.
Unless otherwise specified, indexes reflect total return, with all dividends reinvested. Indexes are unmanaged, do not reflect the deduction of fees or expenses, and are not available for direct investment.
1 The Bloomberg Barclays U.S. Aggregate Bond Index is an index of U.S dollar-denominated, investment-grade U.S. government and corporate securities, and mortgage pass-through securities, and asset-backed securities. Indexes are unmanaged, do not reflect the deduction of fees or expenses, and an investor cannot invest directly in an index.
2 The ICE BofA U.S. High Yield Constrained Index is a capitalization weighted index of all U.S. dollar denominated below investment grade corporate debt publicly issued in the U.S. domestic market.
3 The Credit Suisse Leveraged Loan Index is designed to mirror the investable universe of the U.S. dollar-denominated leveraged loan market. The CS Leveraged Loan Index, which includes reinvested dividends, has been taken from published sources.
4 The S&P 500® Index is widely regarded as the standard for measuring large cap U.S. stock market performance and includes a representative sample of leading companies in leading industries.
Unless otherwise specified, indexes reflect total return, with all dividends reinvested. Indexes are unmanaged, do not reflect the deduction of fees or expenses, and are not available for direct investment.
Important Performance and Other Information
Performance data quoted in the following pages reflect past performance and are no guarantee of future results. Current performance may be higher or lower than the performance quoted. The investment return and principal value of an investment in the Fund will fluctuate so that shares, on any given day or when redeemed, may be worth more or less than their original cost. You can obtain performance data current to the most recent month end by calling Lord Abbett at 888-522-2388 or referring to www.lordabbett.com.
Except where noted, comparative Fund performance does not account for the deduction of sales charges and would be different if sales charges were included. The Fund offers classes of shares with distinct pricing options. For a full description of the differences in pricing alternatives, please see the Fund’s prospectus.
During certain periods shown, expense waivers and reimbursements were in place. Without such expense waivers and reimbursements, the Fund’s returns would have been lower.
The annual commentary above discusses the views of the Fund’s management and various portfolio holdings of the Fund as of December 31, 2020. These views and portfolio holdings may have changed after this date. Information provided in the commentary is not a recommendation to buy or sell securities. Because the Fund’s portfolio is actively managed and may change significantly, the Fund may no longer own the securities described above or may have otherwise changed its position in the securities. For more recent information about the Fund’s portfolio holdings, please visit www.lordabbett.com.
A Note about Risk: See Notes to Financial Statements for a discussion of investment risks. For a more detailed discussion of the risks associated with the Fund, please see the Fund’s prospectus.
Mutual funds are not insured by the FDIC, are not deposits or other obligations of, or guaranteed by, banks, and are subject to investment risks including possible loss of principal amount invested.
4
Credit Opportunities Fund
Investment Comparison
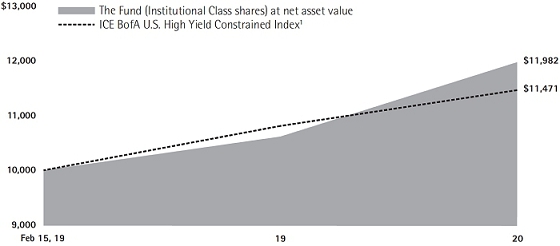
Below is a comparison of a $10,000 investment in Institutional Class shares with the same investment in the ICE BofA U.S. High Yield Constrained Index, assuming reinvestment of all dividends and distributions. The performance of the other classes will be greater than or less than the performance shown in the graph below due to different sales loads and expenses applicable to such class. The graph and performance table below do not reflect the deduction of taxes that a shareholder would pay on Fund distributions or the redemption of Fund shares. During certain periods, expenses of the Fund have been waived or reimbursed by Lord Abbett; without such waiver or reimbursement of expenses, the Fund’s returns would have been lower. Past performance is no guarantee of future results.
Average Annual Total Returns at Net Asset Value
for the Period Ended December 31, 2020
| | | 1 Year | | Life of Class | |
| Institutional Class2 | | 12.84% | | 10.22% | |
| Class A3 | | 9.50% | | 9.42% | |
| Class U4 | | – | | 18.33% | |
Standardized Yield for the Period Ended December 31, 2020
| Institutional Class | | Class A | | Class U | |
| 4.54% | | 3.70% | | 3.80% | |
1 Performance for the unmanaged index does not reflect any fees or expenses. The performance of the index is not necessarily representative of the Fund’s performance.
2 Institutional Class shares commenced operations and performance began on February 15, 2019. Performance is at net asset value.
3 Class A shares commenced operations and performance began on September 13, 2019. Total return, which is the
percentage change in net asset value, after deduction of the maximum initial sales charge of 2.50% applicable to Class A shares, with all dividends and distributions reinvested for the periods shown ended December 31, 2020, is calculated using the SEC-required uniform method to compute such return.
4 Class U shares commenced operations and performance began on June 18, 2020. Performance is at net asset value.
5
Expense Example
As a shareholder of the Fund, you incur two types of costs: (1) transaction costs, including sales charges (loads) on purchase payments (these charges vary among the share classes); and (2) ongoing costs, including management fees; distribution and service (12b-1) fees (these charges vary among the share classes); and other Fund expenses. You may also incur transaction costs in the form of a repurchase fee of up to 2% which the Fund may (but does not currently) impose on shares that have been accepted for repurchase that have been held for less than one year. This Example is intended to help you understand your ongoing costs (in dollars) of investing in the Fund and to compare these costs with the ongoing costs of investing in other mutual funds.
The Example is based on an investment of $1,000 invested at the beginning of the period and held for the entire period (July 1, 2020 through December 31, 2020).
Actual Expenses
For each class of the Fund, the first line of the table on the following page provides information about actual account values and actual expenses. You may use the information in this line, together with the amount you invested, to estimate the expenses that you paid over the period. Simply divide your account value by $1,000 (for example, an $8,600 account value divided by $1,000 = 8.6), then multiply the result by the number in the first line under the heading titled “Expenses Paid During Period 7/1/20 – 12/31/20” to estimate the expenses you paid on your account during this period.
Hypothetical Example for Comparison Purposes
For each class of the Fund, the second line of the table on the following page provides information about hypothetical account values and hypothetical expenses based on the Fund’s actual expense ratio and an assumed rate of return of 5% per year before expenses, which is not the Fund’s actual return. The hypothetical account values and expenses may not be used to estimate the actual ending account balance or expenses you paid for the period. You may use this information to compare the ongoing costs of investing in the Fund and other funds. To do so, compare this 5% hypothetical example with the 5% hypothetical examples that appear in the shareholder reports of the other funds.
6
Please note that the expenses shown in the table are meant to highlight your ongoing costs only and do not reflect any transactional costs, such as sales charges (loads). Therefore, the second line of the table is useful in comparing ongoing costs only, and will not help you determine the relative total costs of owning different funds. In addition, if these transactional costs were included, your costs would have been higher.
| | | Beginning
Account
Value | | Ending
Account
Value | | Expenses
Paid During
Period† | |
| | | 7/1/20 | | 12/31/20 | | 7/1/20 -
12/31/20 | |
| Institutional Class | | | | | | | | | |
| Actual | | $ | 1,000.00 | | | $ | 1,203.40 | | | $ | 8.31 | | |
| Hypothetical (5% Return Before Expenses) | | $ | 1,000.00 | | | $ | 1,017.60 | | | $ | 7.61 | | |
| Class A | | | | | | | | | | | | | |
| Actual | | $ | 1,000.00 | | | $ | 1,199.00 | | | $ | 12.44 | | |
| Hypothetical (5% Return Before Expenses) | | $ | 1,000.00 | | | $ | 1,013.83 | | | $ | 11.39 | | |
| Class U | | | | | | | | | | | | | |
| Actual | | $ | 1,000.00 | | | $ | 1,198.90 | | | $ | 12.44 | | |
| Hypothetical (5% Return Before Expenses) | | $ | 1,000.00 | | | $ | 1,013.83 | | | $ | 11.39 | | |
| † | For each class of the Fund, net expenses are equal to the annualized expense ratio for such class (1.50% for Institutional Class, 2.25% for Class A and Class U) multiplied by the average account value over the period, multiplied by 184/366 (to reflect one-half year period). |
Portfolio Holdings Presented by Sector
December 31, 2020
| Sector* | %** |
| Asset Backed | 17.27 | % |
| Automotive | 4.80 | % |
| Basic Industry | 2.09 | % |
| Capital Goods | 1.80 | % |
| Consumer Goods | 1.43 | % |
| Energy | 11.63 | % |
| Financial Services | 4.11 | % |
| Foreign Government | 2.50 | % |
| Healthcare | 4.30 | % |
| Leisure | 10.83 | % |
| Mortgage-Backed | 5.87 | % |
| Real Estate | 1.08 | % |
| Retail | 3.08 | % |
| Services | 4.89 | % |
| Technology | 7.10 | % |
| Transportation | 9.39 | % |
| Repurchase Agreement | 7.83 | % |
| Total | 100.00 | % |
| * | | A sector may comprise several industries. |
| ** | | Represents percent of total investments. |
7
Schedule of Investments
December 31, 2020
| Investments | | Interest
Rate | | | Maturity
Date | | Principal
Amount
(000) | | | Fair
Value | |
| LONG-TERM INVESTMENTS 91.02% | | | | | | | | | | | | | | |
| | | | | | | | | | | | | | | |
| ASSET-BACKED SECURITIES 15.63% | | | | | | | | | | | | | | |
| | | | | | | | | | | | | | | |
| Automobiles 1.53% | | | | | | | | | | | | | | |
| Flagship Credit Auto Trust 2019-1 R† | | | Zero Coupon | | | 6/15/2026 | | $ | 8 | | | $ | 1,287,909 | |
| Santander Consumer Auto Receivables Trust 2020-B† | | | 7.03% | | | 8/15/2028 | | | 4,000 | | | | 4,246,416 | |
| Total | | | | | | | | | | | | | 5,534,325 | |
| | | | | | | | | | | | | | | |
| Credit Cards 2.15% | | | | | | | | | | | | | | |
| Continental Finance Credit Card ABS Master Trust 2020-1A C† | | | 5.75% | | | 12/15/2028 | | | 6,500 | | | | 6,528,951 | |
| Perimeter Master Note Business Trust 2019-1A C† | | | 8.06% | | | 12/15/2022 | | | 1,250 | | | | 1,284,146 | |
| Total | | | | | | | | | | | | | 7,813,097 | |
| | | | | | | | | | | | | | | |
| Other 11.95% | | | | | | | | | | | | | | |
| Ares XLVI CLO Ltd. 2017-46A E† | | | 5.537%
(3 Mo. LIBOR + 5.30% | )# | | 1/15/2030 | | | 250 | | | | 223,766 | |
| Ares XXXVII CLO Ltd. 2015-4A DR† | | | 6.387%
(3 Mo. LIBOR + 6.15% | )# | | 10/15/2030 | | | 500 | | | | 464,408 | |
| Bain Capital Credit CLO 2018-1A E† | | | 5.559%
(3 Mo. LIBOR + 5.35% | )# | | 4/23/2031 | | | 1,000 | | | | 898,016 | |
| Burnham Park Clo Ltd. 2016-1A ER† | | | 5.618%
(3 Mo. LIBOR + 5.40% | )# | | 10/20/2029 | | | 2,000 | | | | 1,887,885 | |
| Cedar Funding IX CLO Ltd. 2018-9A E† | | | 5.568%
(3 Mo. LIBOR + 5.35% | )# | | 4/20/2031 | | | 275 | | | | 253,048 | |
| Cedar Funding VIII Clo Ltd. 2017-8A E† | | | 6.568%
(3 Mo. LIBOR + 6.35% | )# | | 10/17/2030 | | | 2,750 | | | | 2,642,093 | |
| Dryden 45 Senior Loan Fund 2016-45A ER† | | | 6.087%
(3 Mo. LIBOR + 5.85% | )# | | 10/15/2030 | | | 2,000 | | | | 1,918,962 | |
| Dryden 65 CLO Ltd. 2018-65A E† | | | 5.968%
(3 Mo. LIBOR + 5.75% | )# | | 7/18/2030 | | | 3,000 | | | | 2,854,153 | |
| Fairstone Financial Issuance Trust I 2019-1A D(a)† | | | 7.257% | | | 3/21/2033 | | CAD | 150 | | | | 118,396 | (b) |
| Fairstone Financial Issuance Trust I 2020-1A D(a)† | | | 6.873% | | | 10/20/2039 | | CAD | 6,570 | | | | 5,168,507 | (b) |
| Galaxy XVIII CLO Ltd. 2018-28A E† | | | 6.237%
(3 Mo. LIBOR + 6.00% | )# | | 7/15/2031 | | $ | 3,550 | | | | 3,354,083 | |
| Lending Funding Trust 2020-2 2020-2A D† | | | 6.77% | | | 4/21/2031 | | | 3,335 | | | | 3,418,069 | |
| Mariner CLO 5 Ltd. 2018-5A E† | | | 5.865%
(3 Mo. LIBOR + 5.65% | )# | | 4/25/2031 | | | 3,450 | | | | 3,247,673 | |
| ME Funding LLC 2019-1 A2† | | | 6.448% | | | 7/30/2049 | | | 5,590 | | | | 5,457,867 | |
| Newtek Small Business Loan Trust 2017-1 B† | | | 3.148%
(1 Mo. LIBOR + 3.00% | )# | | 2/25/2043 | | | 62 | | | | 56,501 | (b) |
| OCP CLO Ltd. 2014-6A DR† | | | 6.738%
(3 Mo. LIBOR + 6.52% | )# | | 10/17/2030 | | | 1,000 | | | | 983,352 | |
| 8 | See Notes to Financial Statements. |
Schedule of Investments (continued)
December 31, 2020
| Investments | | Interest
Rate | | | Maturity
Date | | Principal
Amount
(000) | | | Fair
Value | |
| Other (continued) | | | | | | | | | | | | | | |
| Octagon Investment Partners 40 Ltd. 2019 1A E† | | | 6.678%
(3 Mo. LIBOR + 6.46% | )# | | 4/20/2031 | | $ | 5,700 | | | $ | 5,606,418 | |
| Pagaya AI Debt Selection Trust 2020-1 CERT† | | | Zero Coupon | | | 7/15/2027 | | | 2,000 | | | | 2,295,990 | (b) |
| Riserva CLO Ltd. 2016-3A ER† | | | 6.568%
(3 Mo. LIBOR + 6.35% | )# | | 10/18/2028 | | | 2,500 | | | | 2,483,776 | |
| Total | | | | | | | | | | | | | 43,332,963 | |
| Total Asset-Backed Securities (cost $54,865,232) | | | | | | | | | | | | | 56,680,385 | |
| | | | | | | | | | | | | | | |
| | | | | | | | | Shares
(000) | | | | | |
| | | | | | | | | | | | | | |
| COMMON STOCKS 0.37% | | | | | | | | | | | | | | |
| | | | | | | | | | | | | | | |
| Specialty Retail 0.35% | | | | | | | | | | | | | | |
| Chinos Intermediate | | | | | | | | | 101 | | | | 1,222,256 | |
| Chinos Intermediate | | | | | | | | | 10 | | | | 34,898 | |
| Total | | | | | | | | | | | | | 1,257,154 | |
| | | | | | | | | | | | | | | |
| Transportation: Infrastructure/Services 0.02% | | | | | | | | | | | | | | |
| ACBL Holdings Corp. | | | | | | | | | 4 | | | | 87,100 | (b) |
| Total Common Stocks (cost $1,314,356) | | | | | | | | | | | | | 1,344,254 | |
| | | | | | | | | | | | | | | |
| | | | Interest
Rate | | | Maturity
Date | | Principal
Amount
(000) | | | | | |
| | | | | | | | | | | | | | |
| CONVERTIBLE BONDS 14.24% | | | | | | | | | | | | | | |
| | | | | | | | | | | | | | | |
| Air Transportation 1.30% | | | | | | | | | | | | | | |
| Southwest Airlines Co. | | | 1.25% | | | 5/1/2025 | | $ | 3,250 | | | | 4,736,875 | |
| | | | | | | | | | | | | | | |
| Hotels 1.20% | | | | | | | | | | | | | | |
| Huazhu Group Ltd. (China)(c) | | | 0.375% | | | 11/1/2022 | | | 3,810 | | | | 4,359,379 | |
| | | | | | | | | | | | | | | |
| Machinery 0.71% | | | | | | | | | | | | | | |
| Chart Industries, Inc.† | | | 1.00% | | | 11/15/2024 | | | 1,227 | | | | 2,576,475 | |
| | | | | | | | | | | | | | | |
| Medical Products 1.17% | | | | | | | | | | | | | | |
| Nevro Corp. | | | 1.75% | | | 6/1/2021 | | | 2,350 | | | | 4,235,389 | |
| | | | | | | | | | | | | | | |
| Pharmaceuticals 1.95% | | | | | | | | | | | | | | |
| Canopy Growth Corp.(a)† | | | 4.25% | | | 7/15/2023 | | CAD | 4,732 | | | | 3,880,136 | |
| Insmed, Inc. | | | 1.75% | | | 1/15/2025 | | $ | 2,835 | | | | 3,195,644 | |
| Total | | | | | | | | | | | | | 7,075,780 | |
| | See Notes to Financial Statements. | 9 |
Schedule of Investments (continued)
December 31, 2020
| Investments | | Interest
Rate | | | Maturity
Date | | Principal
Amount
(000) | | | Fair
Value | |
| Recreation & Travel 0.83% | | | | | | | | | | | | | | |
| Royal Caribbean Cruises Ltd.† | | | 4.25% | | | 6/15/2023 | | $ | 2,250 | | | $ | 3,002,048 | |
| | | | | | | | | | | | | | | |
| Software/Services 3.85% | | | | | | | | | | | | | | |
| Booking Holdings, Inc. | | | 0.90% | | | 9/15/2021 | | | 3,900 | | | | 4,529,959 | |
| Five9, Inc.† | | | 0.50% | | | 6/1/2025 | | | 3,198 | | | | 4,661,574 | |
| Square, Inc.† | | | Zero Coupon | | | 5/1/2026 | | | 4,250 | | | | 4,758,515 | |
| Total | | | | | | | | | | | | | 13,950,048 | |
| | | | | | | | | | | | | | | |
| Support: Services 1.30% | | | | | | | | | | | | | | |
| Uber Technologies, Inc.† | | | Zero Coupon | | | 12/15/2025 | | | 4,583 | | | | 4,711,502 | |
| | | | | | | | | | | | | | | |
| Technology Hardware & Equipment 0.89% | | | | | | | | | | | | | | |
| SunPower Corp. | | | 4.00% | | | 1/15/2023 | | | 2,475 | | | | 3,224,290 | |
| | | | | | | | | | | | | | | |
| Transportation: Infrastructure/Services 1.04% | | | | | | | | | | | | | | |
| Scorpio Tankers, Inc. (Monaco)(c) | | | 3.00% | | | 5/15/2022 | | | 3,921 | | | | 3,771,829 | |
| Total Convertible Bonds (cost $45,368,512) | | | | | | | | | | | | | 51,643,615 | |
| | | | | | | | | | | | | | | |
| | | | Dividend
Rate | | | | | Shares
(000) | | | | | |
| | | | | | | | | | | | | | |
| CONVERTIBLE PREFERRED STOCKS 0.96% | | | | | | | | | | | | | | |
| | | | | | | | | | | | | | | |
| Auto Parts & Equipment | | | | | | | | | | | | | | |
Aptiv plc (Ireland)(c)
(cost $2,971,720) | | | 5.50% | | | | | | 23 | | | | 3,487,180 | |
| | | | | | | | | | | | | | | |
| | | | Interest
Rate | | | | | Principal
Amount
(000) | | | | | |
| | | | | | | | | | | | | | |
| CORPORATE BONDS 39.48% | | | | | | | | | | | | | | |
| | | | | | | | | | | | | | | |
| Air Transportation 4.06% | | | | | | | | | | | | | | |
| British Airways 2020-1 Class B Pass Through Trust (United Kingdom)†(c) | 8.375% | | | 11/15/2028 | | $ | 5,000 | | | | 5,537,500 | |
| Delta Air Lines, Inc. | | | 3.75% | | | 10/28/2029 | | | 5,000 | | | | 4,849,261 | |
| VistaJet Malta Finance plc/XO Management Holding, Inc. (Malta)†(c) | 10.50% | | | 6/1/2024 | | | 4,233 | | | | 4,349,407 | |
| Total | | | | | | | | | | | | | 14,736,168 | |
| | | | | | | | | | | | | | | |
| Auto Loans 1.23% | | | | | | | | | | | | | | |
| Mclaren Finance plc(a) | | | 5.00% | | | 8/1/2022 | | GBP | 3,355 | | | | 4,467,531 | |
| 10 | See Notes to Financial Statements. |
Schedule of Investments (continued)
December 31, 2020
| Investments | | Interest
Rate | | | Maturity
Date | | Principal
Amount
(000) | | | Fair
Value | |
| Auto Parts & Equipment 1.14% | | | | | | | | | | | | | | |
| Garrett LX I Sarl/Garrett Borrowing LLC(a)(d) | | | 5.125% | | | 10/15/2026 | | EUR | 3,369 | | | $ | 4,136,565 | |
| | | | | | | | | | | | | | | |
| Auto Parts: Original Equipment 1.34% | | | | | | | | | | | | | | |
| Tenneco, Inc. | | | 5.00% | | | 7/15/2026 | | $ | 5,250 | | | | 4,839,844 | |
| | | | | | | | | | | | | | | |
| Automakers 0.07% | | | | | | | | | | | | | | |
| Mclaren Finance plc(a)† | | | 5.00% | | | 8/1/2022 | | GBP | 200 | | | | 266,321 | |
| | | | | | | | | | | | | | | |
| Automobiles 1.42% | | | | | | | | | | | | | | |
| AA Bond Co. Ltd.(a) | | | 5.50% | | | 7/31/2043 | | GBP | 3,850 | | | | 5,156,632 | |
| | | | | | | | | | | | | | | |
| Building & Construction 1.15% | | | | | | | | | | | | | | |
| STL Holding Co. LLC† | | | 7.50% | | | 2/15/2026 | | $ | 4,000 | | | | 4,150,000 | |
| | | | | | | | | | | | | | | |
| Diversified Capital Goods 0.94% | | | | | | | | | | | | | | |
| Granite US Holdings Corp.† | | | 11.00% | | | 10/1/2027 | | | 3,062 | | | | 3,414,130 | |
| | | | | | | | | | | | | | | |
| Energy: Exploration & Production 6.75% | | | | | | | | | | | | | | |
| Berry Petroleum Co. LLC† | | | 7.00% | | | 2/15/2026 | | | 4,936 | | | | 4,213,172 | |
| Centennial Resource Production LLC† | | | 8.00% | | | 6/1/2025 | | | 1,624 | | | | 1,461,600 | |
| Centennial Resource Production LLC† | | | 5.375% | | | 1/15/2026 | | | 272 | | | | 190,400 | |
| Centennial Resource Production LLC† | | | 6.875% | | | 4/1/2027 | | | 5,538 | | | | 3,989,603 | |
| Laredo Petroleum, Inc. | | | 10.125% | | | 1/15/2028 | | | 6,182 | | | | 5,267,064 | |
| Matador Resources Co. | | | 5.875% | | | 9/15/2026 | | | 5,375 | | | | 5,274,219 | |
| SM Energy Co. | | | 6.125% | | | 11/15/2022 | | | 4,200 | | | | 4,088,763 | |
| Total | | | | | | | | | | | | | 24,484,821 | |
| | | | | | | | | | | | | | | |
| Gaming 2.71% | | | | | | | | | | | | | | |
| Buena Vista Gaming Authority† | | | 13.00% | | | 4/1/2023 | | | 4,898 | | | | 5,317,391 | |
| Enterprise Development Authority (The)† | | | 12.00% | | | 7/15/2024 | | | 4,002 | | | | 4,517,258 | |
| Total | | | | | | | | | | | | | 9,834,649 | |
| | | | | | | | | | | | | | | |
| Gas Distribution 1.15% | | | | | | | | | | | | | | |
| Buckeye Partners LP | | 6.375% (3 Mo. LIBOR + 4.02% | )# | | 1/22/2078 | | | 5,532 | | | | 4,172,760 | |
| | | | | | | | | | | | | | | |
| Investments & Miscellaneous Financial Services 2.84% | | | | | | | | | | |
| Advisor Group Holdings, Inc.† | | | 10.75% | | | 8/1/2027 | | | 4,550 | | | | 5,041,104 | |
| Global Aircraft Leasing Co. Ltd.† | | | 6.50% | | | 9/15/2024 | | | 6,000 | | | | 5,255,167 | |
| Total | | | | | | | | | | | | | 10,296,271 | |
| | | | | | | | | | | | | | | |
| Metals/Mining (Excluding Steel) 0.72% | | | | | | | | | | | | | | |
| Warrior Met Coal, Inc.† | | | 8.00% | | | 11/1/2024 | | | 2,550 | | | | 2,609,364 | |
| | See Notes to Financial Statements. | 11 |
Schedule of Investments (continued)
December 31, 2020
| Investments | | Interest
Rate | | | Maturity
Date | | Principal
Amount
(000) | | | Fair
Value | |
| Oil Field Equipment & Services 1.38% | | | | | | | | | | | | | | |
| Oceaneering International, Inc. | | | 4.65% | | | 11/15/2024 | | $ | 5,472 | | | $ | 4,993,200 | |
| Oceaneering International, Inc. | | | 6.00% | | | 2/1/2028 | | | 28 | | | | 25,095 | |
| Total | | | | | | | | | | | | | 5,018,295 | |
| | | | | | | | | | | | | | | |
| Real Estate Development & Management 1.06% | | | | | | | | | | | | | | |
| Kaisa Group Holdings Ltd. (China)(c) | | | 9.375% | | | 6/30/2024 | | | 3,968 | | | | 3,856,400 | |
| | | | | | | | | | | | | | | |
| Recreation & Travel 2.97% | | | | | | | | | | | | | | |
| Carnival Corp.† | | | 7.625% | | | 3/1/2026 | | | 1,750 | | | | 1,909,889 | |
| Carnival Corp.† | | | 10.50% | | | 2/1/2026 | | | 3,600 | | | | 4,198,500 | |
| eDreams ODIGEO SA(a) | | | 5.50% | | | 9/1/2023 | | EUR | 4,000 | | | | 4,642,270 | |
| Total | | | | | | | | | | | | | 10,750,659 | |
| | | | | | | | | | | | | | | |
| Software/Services 1.13% | | | | | | | | | | | | | | |
| Veritas US, Inc./Veritas Bermuda Ltd.† | | | 10.50% | | | 2/1/2024 | | $ | 4,000 | | | | 4,082,660 | |
| | | | | | | | | | | | | | | |
| Specialty Retail 2.62% | | | | | | | | | | | | | | |
| Party City Holdings, Inc.† | | | 6.625% | | | 8/1/2026 | | | 6,000 | | | | 4,515,000 | |
| Signet UK Finance plc (United Kingdom)(c) | | | 4.70% | | | 6/15/2024 | | | 5,175 | | | | 4,988,933 | |
| Total | | | | | | | | | | | | | 9,503,933 | |
| | | | | | | | | | | | | | | |
| Support: Services 2.21% | | | | | | | | | | | | | | |
| Ahern Rentals, Inc.† | | | 7.375% | | | 5/15/2023 | | | 4,369 | | | | 3,203,023 | |
| Hertz Corp. (The)(d) | | | 6.25% | | | 10/15/2022 | | | 8,000 | | | | 4,340,000 | |
| Promontoria Holding 264 BV(a) | | | 6.75% | | | 8/15/2023 | | EUR | 400 | | | | 456,135 | |
| Total | | | | | | | | | | | | | 7,999,158 | |
| | | | | | | | | | | | | | | |
| Theaters & Entertainment 1.34% | | | | | | | | | | | | | | |
| Pinnacle Bidco PLC(a)† | | | 5.50% | | | 2/15/2025 | | EUR | 4,000 | | | | 4,842,743 | |
| | | | | | | | | | | | | | | |
| Transportation: Infrastructure/Services 1.25% | | | | | | | | | | | | | | |
| Promontoria Holding 264 BV(a)† | | | 6.75% | | | 8/15/2023 | | EUR | 3,960 | | | | 4,515,734 | |
| Total Corporate Bonds (cost $128,065,237) | | | | | | | | | | | | | 143,134,638 | |
| | | | | | | | | | | | | | | |
| FLOATING RATE LOANS(e) 11.80% | | | | | | | | | | | | | | |
| | | | | | | | | | | | | | | |
| Aerospace/Defense 0.13% | | | | | | | | | | | | | | |
| Alloy Finco Limited 2020 USD Term Loan B2 (Jersey)(c) | | 8.50% (1 Mo. LIBOR + 6.50%) | | | 3/6/2024 | | | 490 | | | | 462,069 | |
| | | | | | | | | | | | | | | |
| Air Transportation 1.32% | | | | | | | | | | | | | | |
| American Airlines, Inc. 2017 Incremental Term Loan | | 2.159% (1 Mo. LIBOR + 2.00%) | | | 12/15/2023 | | | 3,847 | | | | 3,477,988 | |
| 12 | See Notes to Financial Statements. |
Schedule of Investments (continued)
December 31, 2020
| Investments | | Interest
Rate | | | Maturity
Date | | Principal
Amount
(000) | | | Fair
Value | |
| Air Transportation (continued) | | | | | | | | | | | | | | |
| American Airlines, Inc. Repriced TL B due 2023 | | | 2.145%
(1 Mo. LIBOR + 2.00% | ) | | 4/28/2023 | | $ | 1,438 | | | $ | 1,303,110 | |
| Total | | | | | | | | | | | | | 4,781,098 | |
| | | | | | | | | | | | | | | |
| Business Services 1.33% | | | | | | | | | | | | | | |
| KUEHG Corp. 2017 2nd Lien Term Loan | | | 9.25%
(3 Mo. LIBOR + 8.25% | ) | | 8/22/2025 | | | 5,000 | | | | 4,800,000 | |
| | | | | | | | | | | | | | | |
| Gaming 1.41% | | | | | | | | | | | | | | |
| Spectacle Gary Holdings LLC Delayed Draw Term Loan | | | 11.25% (Prime Rate + 8.00%) | | | 12/23/2025 | | | 345 | | | | 346,003 | |
| Spectacle Gary Holdings LLC Term Loan B | | | 11.00%
(3 Mo. LIBOR + 9.00% | ) | | 12/23/2025 | | | 4,757 | | | | 4,774,834 | |
| Total | | | | | | | | | | | | | 5,120,837 | |
| | | | | | | | | | | | | | | |
| Health Services 1.13% | | | | | | | | | | | | | | |
| Wellpath Holdings, Inc. 2018 1st Lien Term Loan | | | 5.647%
(3 Mo. LIBOR + 5.50%) - 5.71% | | | 10/1/2025 | | | 4,210 | | | | 4,094,614 | (f) |
| | | | | | | | | | | | | | | |
| Oil Field Equipment & Services 1.15% | | | | | | | | | | | | | | |
| Ulterra Drilling Technologies, LP Term Loan B | | | 5.398%
(1 Mo. LIBOR + 5.25% | ) | | 11/26/2025 | | | 5,007 | | | | 4,180,831 | (f) |
| | | | | | | | | | | | | | | |
| Oil Refining & Marketing 1.05% | | | | | | | | | | | | | | |
| CITGO Holding Inc. 2019 Term Loan B | | | 8.00%
(3 Mo. LIBOR + 7.00% | ) | | 8/1/2023 | | | 4,079 | | | | 3,793,791 | |
| | | | | | | | | | | | | | | |
| Personal & Household Products 1.41% | | | | | | | | | | | | | | |
| Party City Holdings Inc. 2018 Term Loan B | | | –(g | ) | | 8/19/2022 | | | 5,507 | | | | 5,119,397 | |
| | | | | | | | | | | | | | | |
| Recreation & Travel 0.24% | | | | | | | | | | | | | | |
| United PF Holdings, LLC 2019 2nd Lien Term Loan | | | 8.754%
(3 Mo. LIBOR + 8.50% | ) | | 12/30/2027 | | | 1,000 | | | | 870,000 | (f) |
| | | | | | | | | | | | | | | |
| Software/Services 1.14% | | | | | | | | | | | | | | |
| Rocket Software, Inc. 2018 2nd Lien Term Loan | | | 8.464%
(3 Mo. LIBOR + 8.25% | ) | | 11/27/2026 | | | 4,366 | | | | 4,147,313 | |
| | | | | | | | | | | | | | | |
| Specialty Retail 0.07% | | | | | | | | | | | | | | |
| Chinos Intermediate Holdings A, Inc. Exit Term Loan | | | 11.00%
(1 Mo. LIBOR + 10.00% | ) | | 9/10/2027 | | | 231 | | | | 242,410 | |
| | | | | | | | | | | | | | | |
| Steel Producers/Products 0.20% | | | | | | | | | | | | | | |
| Jindal Steel and Power Limited Term Loan (india)(c) | | | 4.74%
(1 Mo. LIBOR + 3.50% | ) | | 3/31/2022 | | | 784 | | | | 729,115 | |
| | See Notes to Financial Statements. | 13 |
Schedule of Investments (continued)
December 31, 2020
| Investments | | Interest
Rate | | | Maturity
Date | | Principal
Amount
(000) | | | Fair
Value | |
| Support: Services 1.22% | | | | | | | | | | | | | | |
| Drive Chassis HoldCo, LLC 2019 2nd Lien Term Loan | | | 8.474%
(3 Mo. LIBOR + 8.25% | ) | | 4/10/2026 | | $ | 4,430 | | | $ | 4,420,795 | |
| Total Floating Rate Loans (cost $42,175,365) | | | | | | | | | | | | | 42,762,270 | |
| | | | | | | | | | | | | | | |
| FOREIGN GOVERNMENT OBLIGATIONS(c) 2.47% | | | | | | | | | | | | | | |
| | | | | | | | | | | | | | | |
| Egypt 0.86% | | | | | | | | | | | | | | |
| Egypt Government International Bond† | | | 7.053% | | | 1/15/2032 | | | 2,850 | | | | 3,111,844 | |
| | | | | | | | | | | | | | | |
| Kenya 0.25% | | | | | | | | | | | | | | |
| Republic of Kenya† | | | 7.25% | | | 2/28/2028 | | | 800 | | | | 899,530 | |
| | | | | | | | | | | | | | | |
| Nigeria 0.61% | | | | | | | | | | | | | | |
| Republic of Nigeria† | | | 7.143% | | | 2/23/2030 | | | 2,050 | | | | 2,216,710 | |
| | | | | | | | | | | | | | | |
| Sri Lanka 0.75% | | | | | | | | | | | | | | |
| Republic of Sri Lanka† | | | 5.875% | | | 7/25/2022 | | | 3,894 | | | | 2,713,417 | |
| Total Foreign Government Obligations (cost $8,439,319) | | | | | | | | | | | | | 8,941,501 | |
| | | | | | | | | | | | | | | |
| NON-AGENCY COMMERCIAL MORTGAGE-BACKED SECURITIES 5.80% | | | | | | | | | | |
| Bancorp Commercial Mortgage Trust 2019-CRE6 G† | | | 8.509% (1 Mo. LIBOR + 8.35% | )# | | 9/15/2036 | | | 1,000 | | | | 939,307 | |
| BX Trust 2018-GW MZ† | | | 5.647% (1 Mo. LIBOR + 5.49% | )# | | 5/15/2037 | | | 4,000 | | | | 3,657,071 | |
| CF Trust 2019-BOSS B1A† | 13.00% (1 Mo. LIBOR + 11.50% | )# | | 12/15/2021 | | | 1,100 | | | | 974,634 | (b) |
| Citigroup Commercial Mortgage Trust 2016-P3 D† | | | 2.804% | (h)# | | 4/15/2049 | | | 5,000 | | | | 3,398,121 | |
| Commercial Mortgage Pass-Through Certificates 2015-DC1 D† | | 4.308% | (h)# | | 2/10/2048 | | | 5,000 | | | | 3,463,981 | |
| GS Mortgage Securities Trust 2013-GC12 E† | | | 3.25% | | | 6/10/2046 | | | 5,400 | | | | 4,009,580 | |
| JPMorgan Chase Commercial Mortgage Securities Trust | | | 0.413% | | | 9/15/2029 | | | 97,614 | | | | 146 | (i) |
| JPMorgan Chase Commercial Mortgage Securities Trust | | | 11.00% | | | 9/15/2029 | | | 850 | | | | 719,419 | (b) |
| JPMorgan Chase Commercial Mortgage Securities Trust 2014-DSTY D† | 3.805% | (h)# | | 6/10/2027 | | | 615 | | | | 72,002 | |
| Laurel Road Prime Student Loan Trust 2019-A R† | | | Zero Coupon | | | 10/25/2048 | | | 8,940 | | | | 924,792 | |
| Natixis Commercial Mortgage Securities Trust 2019-1776 XBCP† | | | 0.119% | (h)# | | 10/15/2036 | | | 114,352 | | | | 61,750 | |
| Palisades Center Trust 2016-PLSD A† | | | 2.713% | | | 4/13/2033 | | | 3,200 | | | | 2,752,000 | |
| Palisades Center Trust 2016-PLSD D† | | | 4.737% | | | 4/13/2033 | | | 225 | | | | 52,729 | |
| Total Non-Agency Commercial Mortgage-Backed Securities (cost $19,555,636) | | | | | | | | | | 21,025,532 | |
| 14 | See Notes to Financial Statements. |
Schedule of Investments (continued)
December 31, 2020
| Investments | | Dividend
Rate | | | | | Shares
(000) | | | Fair
Value | |
| PREFERRED STOCKS 0.27% | | | | | | | | | | | | | | |
| | | | | | | | | | | | | | | |
| Transportation: Infrastructure/Services | | | | | | | | | | | | | | |
| ACBL Holdings Corp. Series A | | | Zero Coupon | | | | | | 16 | | | $ | 445,610 | (b) |
| ACBL Holdings Corp. Series B | | | Zero Coupon | | | | | | 16 | | | | 548,240 | (b) |
| Total Preferred Stocks (cost $802,375) | | | | | | | | | | | | | 993,850 | |
| Total Long-Term Investments (cost $303,557,752) | | | | | | | | | | | | | 330,013,225 | |
| | | | | | | | | | | | | | | |
| | | | | | | | | Principal
Amount
(000) | | | | | |
| SHORT-TERM INVESTMENT 7.74% | | | | | | | | | | | | | | |
| | | | | | | | | | | | | | | |
| Repurchase Agreement | | | | | | | | | | | | | | |
Repurchase Agreement dated 12/31/2020, 0.00% due 1/4/2021 with Fixed Income Clearing Corp. collateralized by $27,832,400 of U.S. Treasury Note at 1.50% due 9/15/2022; value: $28,608,136; proceeds: $28,047,174
(cost $28,047,174) | | | | | | | | $ | 28,047 | | | | 28,047,174 | |
| Total Investments in Securities 98.76% (cost $331,604,926) | | | | | | | | | | | | | 358,060,399 | |
| Cash and Other Assets in Excess of Liabilities(j) 1.24% | | | | | | | | | | | | | 4,500,055 | |
| Net Assets 100.00% | | | | | | | | | | | | $ | 362,560,454 | |
| CAD | | Canadian dollar. EUR Euro. |
| GBP | | British pound. |
| LIBOR | | London Interbank Offered Rate. |
| † | | Security was purchased pursuant to Rule 144A under the Securities Act of 1933 and, unless registered under such Act or exempted from registration, may only be resold to qualified institutional buyers. At December 31, 2020, the total value of Rule 144A securities was $187,098,069, which represents 51.60% of net assets. |
| # | | Variable rate security. The interest rate represents the rate in effect at December 31, 2020. |
| (a) | | Investment in non-U.S. dollar denominated securities. |
| (b) | | Level 3 Investment as described in Note 2(n) in the Notes to Financials. Security valued utilizing third party pricing information without adjustment. Such valuations are based on unobservable inputs. A significant change in third party information could result in a significantly lower or higher value of such Level 3 investments. |
| (c) | | Foreign security traded in U.S. dollars. |
| (d) | | Defaulted (non-income producing security). |
| (e) | | Floating Rate Loans in which the Fund invests generally pay interest at rates which are periodically re-determined at a margin above the London Interbank Offered Rate (“LIBOR”) or the prime rate offered by major U.S. banks. The rate(s) shown is the rate(s) in effect at December 31, 2020. |
| (f) | | Level 3 Investment as described in Note 2(n) in the Notes to Financials. Floating Rate Loans categorized as Level 3 are valued based on a single quotation obtained from a dealer. Accounting principles generally accepted in the United States of America do not require the Fund to create quantitative unobservable inputs that were not developed by the Fund. Therefore, the Fund does not have access to unobservable inputs and cannot disclose such inputs in the valuation. |
| (g) | | Interest rate to be determined. |
| (h) | | Interest rate is based on the weighted average interest rates of the underlying mortgages within the mortgage pool. |
| (i) | | Level 3 Investment as described in Note 2(n) in the Notes to Financials. Security fair valued by the Pricing Committee. |
| (j) | | Cash and Other Assets in Excess of Liabilities include net unrealized appreciation/depreciation on forward foreign currency exchange contracts and swap contracts as follows: |
| | See Notes to Financial Statements. | 15 |
Schedule of Investments (continued)
December 31, 2020
Credit Default Swaps on Indexes - Sell Protection at December 31, 2020(1):
Referenced
Index* | | Counterparty
Swap | | Fund
Receives
(Quarterly) | | Termination
Date | | Notional
Amount | | | Notional
Value | | | Payments
Upfront(2) | | | Unrealized
Appreciation(3) | | | Credit
Default
Swap
Agreements
Payable at
Fair Value(4) | |
| Markit CMBX.NA.BBB-.9 | | Citibank | | | 3.00% | | 9/17/2058 | | $ | 5,375,000 | | | $ | 4,735,723 | | | $ | (1,202,288 | ) | | $ | 563,011 | | | $ | (639,277 | ) |
| * | | The Referenced Index is for the Credit Default Swaps on Indexes, which is comprised of a basket of commercial mortgage-backed securities. |
| (1) | | If the Fund is a seller of protection and a credit event occurs, as defined under the terms of that particular swap agreement, the Fund will either (i) pay to the buyer of protection an amount equal to the notional amount of the swap and take delivery of the referenced obligation or underlying securities comprising the referenced index or (ii) pay a net settlement amount in the form of cash or securities equal to the notional amount of the swap less the recovery value of the referenced obligation or underlying securities. |
| (2) | | Upfront payments received are presented net of amortization. |
| (3) | | Total unrealized appreciation on Credit Default Swaps in Indexes amounted to $563,011. Total unrealized depreciation on Credit Default Swaps on Indexes amounted to $0. |
| (4) | | Includes upfront payments received. |
Forward
Foreign
Currency
Exchange
Contracts | | Transaction
Type | | Counterparty | | Expiration
Date | | Foreign
Currency | | U.S. $
Cost on
Origination
Date | | | U.S. $
Current
Value | | Unrealized
Appreciation | |
| Canadian dollar | | Buy | | State Street Bank and Trust | | 1/20/2021 | | 609,000 | | $ | 465,092 | | | $ | 478,472 | | | $ | 13,380 | |
| | | | | | | | | | | | | | | | | | | | | |
Forward
Foreign
Currency
Exchange
Contracts | | Transaction
Type | | Counterparty | | Expiration
Date | | Foreign
Currency | | U.S. $
Cost on
Origination
Date | | | U.S. $
Current
Value | | Unrealized
Depreciation | |
| British pound | | Sell | | Toronto Dominion Bank | | 3/8/2021 | | 7,326,000 | | $ | 9,850,503 | | | $ | 10,022,292 | | | $ | (171,789 | ) |
| Canadian dollar | | Sell | | Barclays Bank plc | | 1/20/2021 | | 6,873,000 | | | 5,237,388 | | | | 5,399,895 | | | | (162,507 | ) |
| Canadian dollar | | Sell | | Goldman Sachs | | 1/20/2021 | | 451,000 | | | 353,093 | | | | 354,336 | | | | (1,243 | ) |
| Canadian dollar | | Sell | | Morgan Stanley | | 1/20/2021 | | 72,000 | | | 54,071 | | | | 56,568 | | | | (2,497 | ) |
| Canadian dollar | | Sell | | Morgan Stanley | | 1/20/2021 | | 143,000 | | | 108,797 | | | | 112,351 | | | | (3,554 | ) |
| Canadian dollar | | Sell | | State Street Bank and Trust | | 1/20/2021 | | 5,050,000 | | | 3,839,112 | | | | 3,967,623 | | | | (128,511 | ) |
| Euro | | Sell | | Bank of America | | 3/4/2021 | | 389,000 | | | 473,543 | | | | 475,857 | | | | (2,314 | ) |
| Euro | | Sell | | Morgan Stanley | | 3/4/2021 | | 3,921,000 | | | 4,769,476 | | | | 4,796,494 | | | | (27,018 | ) |
| Euro | | Sell | | State Street Bank and Trust | | 3/4/2021 | | 11,076,000 | | | 13,425,480 | | | | 13,549,085 | | | | (123,605 | ) |
| Euro | | Sell | | State Street Bank and Trust | | 3/4/2021 | | 81,000 | | | 98,422 | | | | 99,086 | | | | (664 | ) |
| Unrealized Depreciation on Forward Foreign Currency Exchange Contracts | | | | | | | | | | $ | (623,702 | ) |
| 16 | See Notes to Financial Statements. |
Schedule of Investments (continued)
December 31, 2020
The following is a summary of the inputs used as of December 31, 2020 in valuing the Fund’s investments carried at fair value(1):
| Investment Type(2) | | Level 1 | | | Level 2 | | | Level 3 | | | Total | |
| Long-Term Investments | | | | | | | | | | | | | | | | |
| Asset-Backed Securities | | | | | | | | | | | | | | | | |
| Other | | $ | – | | | $ | 35,693,569 | | | $ | 7,639,394 | | | $ | 43,332,963 | |
| Remaining Industries | | | – | | | | 13,347,422 | | | | – | | | | 13,347,422 | |
| Common Stocks | | | | | | | | | | | | | | | | |
| Transportation: Infrastructure/Services | | | – | | | | – | | | | 87,100 | | | | 87,100 | |
| Remaining Industries | | | – | | | | 1,257,154 | | | | – | | | | 1,257,154 | |
| Convertible Bonds | | | – | | | | 51,643,615 | | | | – | | | | 51,643,615 | |
| Convertible Preferred Stock | | | 3,487,180 | | | | – | | | | – | | | | 3,487,180 | |
| Corporate Bonds | | | – | | | | 143,134,638 | | | | – | | | | 143,134,638 | |
| Floating Rate Loans | | | | | | | | | | | | | | | | |
| Health Services | | | – | | | | – | | | | 4,094,614 | | | | 4,094,614 | |
| Oil Field Equipment & Services | | | – | | | | – | | | | 4,180,831 | | | | 4,180,831 | |
| Recreation & Travel | | | – | | | | – | | | | 870,000 | | | | 870,000 | |
| Remaining Industries | | | – | | | | 33,616,825 | | | | – | | | | 33,616,825 | |
| Foreign Government Obligations | | | – | | | | 8,941,501 | | | | – | | | | 8,941,501 | |
| Non-Agency Commercial Mortgage-Backed Securities | | | – | | | | 19,331,333 | | | | 1,694,199 | | | | 21,025,532 | |
| Preferred Stocks | | | – | | | | – | | | | 993,850 | | | | 993,850 | |
| Short-Term Investment | | | | | | | | | | | | | | | | |
| Repurchase Agreement | | | – | | | | 28,047,174 | | | | – | | | | 28,047,174 | |
| Total | | $ | 3,487,180 | | | $ | 335,013,231 | | | $ | 19,559,988 | | | $ | 358,060,399 | |
| | | | | | | | | | | | | | | | | |
| Other Financial Instruments | | | | | | | | | | | | | | | | |
| Credit Default Swap Contracts | | | | | | | | | | | | | | | | |
| Assets | | $ | – | | | $ | – | | | $ | – | | | $ | – | |
| Liabilities | | | – | | | | (639,277 | ) | | | – | | | | (639,277 | ) |
| Forward Foreign Currency Exchange Contracts | | | | | | | | | | | | | | | | |
| Assets | | | – | | | | 13,380 | | | | – | | | | 13,380 | |
| Liabilities | | | – | | | | (623,702 | ) | | | – | | | | (623,702 | ) |
| Total | | $ | – | | | $ | (1,249,599 | ) | | $ | – | | | $ | (1,249,599 | ) |
| | | |
| (1) | | Refer to Note 2(n) for a description of fair value measurements and the three-tier hierarchy of inputs. |
| (2) | | See Schedule of Investments for fair values in each industry and identification of foreign issuers and/or geography. The table above is presented by Investment Type. Industries are presented within an Investment Type should such Investment Type include securities classified as two or more levels within the three-tier fair value hierarchy. Each Level 3 security is identified on the Schedule of Investments along with the valuation technique utilized. |
A reconciliation of Level 3 investments is presented when the Fund has a material amount of Level 3 investments at the beginning or end of the year in relation to the Fund’s net assets.
| | See Notes to Financial Statements. | 17 |
Schedule of Investments (concluded)
December 31, 2020
The following is a reconciliation of investments with unobservable inputs (Level 3) that were used in determining fair value:
| Investment Type | | Asset-Backed
Securities | | | Common
Stock | | | Floating
Rate Loans | | | Non-Agency
Commercial
Mortgage-
Backed
Securities | | | Preferred
Stock | |
| Balance as of January 1, 2020 | | $ | 2,500,835 | | | $ | – | | | $ | 2,981,260 | | | $ | 2,038,273 | | | $ | – | |
| Accrued Discounts (Premiums) | | | 118,774 | | | | – | | | | 49,902 | | | | 15,482 | | | | – | |
| Realized Gain (Loss) | | | (19,013 | ) | | | – | | | | (302,209 | ) | | | – | | | | – | |
| Change in Unrealized Appreciation (Depreciation) | | | 440,836 | | | | (45,292 | ) | | | (222,178 | ) | | | (359,556 | ) | | | 191,475 | |
| Purchases | | | 6,907,055 | | | | 132,392 | | | | 7,726,263 | | | | – | | | | 802,375 | |
| Sales | | | (413,769 | ) | | | – | | | | (1,327,909 | ) | | | – | | | | – | |
| Transfers into Level 3 | | | 76,583 | | | | – | | | | 751,381 | | | | – | | | | – | |
| Transfers out of Level 3 | | | (1,971,907 | ) | | | – | | | | (511,065 | ) | | | – | | | | – | |
| Balance as of December 31, 2020 | | $ | 7,639,394 | | | $ | 87,100 | | | $ | 9,145,445 | | | $ | 1,694,199 | | | $ | 993,850 | |
| Change in unrealized appreciation/depreciation for the year ended December 31, 2020, related to Level 3 investments held at December 31, 2020 | | $ | 433,532 | | | $ | (45,292 | ) | | $ | (233,418 | ) | | $ | (359,556 | ) | | $ | 191,475 | |
| 18 | See Notes to Financial Statements. |
Statement of Assets and Liabilities
December 31, 2020
| ASSETS: | | | |
| Investments in securities, at cost | | $ | 331,604,926 | |
| Investments in securities, at fair value | | $ | 358,060,399 | |
| Cash | | | 1,841,170 | |
| Deposits with brokers for swaps collateral | | | 603,534 | |
| Receivables: | | | | |
| Capital shares sold | | | 7,323,056 | |
| Interest and dividends | | | 4,678,994 | |
| Investment securities sold | | | 1,682,355 | |
| From advisor (See Note 3) | | | 69,590 | |
| Unrealized appreciation on forward foreign currency exchange contracts | | | 13,380 | |
| Prepaid expenses and other assets | | | 52,114 | |
| Total assets | | | 374,324,592 | |
| LIABILITIES: | | | | |
| Payables: | | | | |
| Investment securities purchased | | | 8,454,153 | |
| Management fee | | | 354,996 | |
| 12b-1 distribution plan | | | 105,848 | |
| Fund administration | | | 11,360 | |
| Trustees’ fees | | | 4,406 | |
| Unrealized depreciation on forward foreign currency exchange contracts | | | 623,702 | |
| Credit default swap agreements payable, at fair value (including upfront payments of $1,202,288) | | | 639,277 | |
| Distributions payable | | | 1,394,792 | |
| Accrued expenses | | | 175,604 | |
| Total liabilities | | | 11,764,138 | |
| Commitments and contingent liabilities | | | | |
| NET ASSETS | | $ | 362,560,454 | |
| COMPOSITION OF NET ASSETS: | | | | |
| Paid-in capital | | $ | 333,425,597 | |
| Total distributable earnings (loss) | | | 29,134,857 | |
| Net Assets | | $ | 362,560,454 | |
| Net assets by class: | | | | |
| Institutional Class Shares | | $ | 177,894,308 | |
| Class A Shares | | $ | 184,654,754 | |
| Class U Shares | | | $11,392 | |
| Outstanding shares by class (unlimited number of authorized shares of beneficial interest): | | | | |
| Institutional Class Shares | | | 17,155,565 | |
| Class A Shares | | | 17,811,148 | |
| Class U Shares | | | 1,099 | |
| Net asset value, offering and redemption price per share (Net assets divided by outstanding shares): | | | | |
| Institutional Class Shares-Net asset value | | | $10.37 | |
| Class A Shares-Net asset value | | | $10.37 | |
| Class A Shares-Maximum offering price (Net asset value plus sales charge of 2.50%) | | | $10.64 | |
| Class U Shares-Net asset value | | | $10.37 | |
| | | | | |
| | See Notes to Financial Statements. | 19 |
Statement of Operations
For the Year Ended December 31, 2020
| Investment income: | | | | |
| Dividends | | $ | 91,413 | |
| Interest and other | | | 17,400,100 | |
| Total investment income | | | 17,491,513 | |
| Expenses: | | | | |
| Management fee | | | 2,327,410 | |
| 12b-1 distribution plan-Class A | | | 608,636 | |
| 12b-1 distribution plan-Class U | | | 42 | |
| Professional | | | 201,334 | |
| Reports to shareholders | | | 129,344 | |
| Shareholder servicing | | | 83,453 | |
| Fund administration | | | 74,477 | |
| Offering costs | | | 59,766 | |
| Registration | | | 57,049 | |
| Custody | | | 12,974 | |
| Trustees’ fees | | | 5,384 | |
| Other | | | 35,202 | |
| Gross expenses | | | 3,595,071 | |
| Fees waived and expenses reimbursed (See Note 3) | | | (193,501 | ) |
| Net expenses | | | 3,401,570 | |
| Net investment income | | | 14,089,943 | |
| Net realized and unrealized gain (loss): | | | | |
| Net realized gain (loss) on investments | | | 6,243,288 | |
| Net realized gain (loss) on futures contracts | | | 3,064 | |
| Net realized gain (loss) on forward foreign currency exchange contracts | | | (838,481 | ) |
| Net realized gain (loss) on swap contracts | | | (2,415,463 | ) |
| Net realized gain (loss) on foreign currency related transactions | | | (102,121 | ) |
| Net change in unrealized appreciation/depreciation on investments | | | 26,561,430 | |
| Net change in unrealized appreciation/depreciation on futures contracts | | | (6,541 | ) |
| Net change in unrealized appreciation/depreciation on forward foreign currency exchange contracts | | | (581,532 | ) |
| Net change in unrealized appreciation/depreciation on swap contracts | | | 524,397 | |
| Net change in unrealized appreciation/depreciation on translation of assets and liabilities denominated in foreign currencies | | | 18,815 | |
| Net change in unrealized appreciation/depreciation on unfunded commitments | | | (2,152 | ) |
| Net realized and unrealized gain (loss) | | | 29,404,704 | |
| Net Increase in Net Assets Resulting From Operations | | $ | 43,494,647 | |
| | |
| 20 | See Notes to Financial Statements. |
Statements of Changes in Net Assets
| INCREASE IN NET ASSETS | | For the Year Ended
December 31, 2020 | | | For the Period Ended
December 31, 2019(a) | |
| Operations: | | | | | | | | | | |
| Net investment income | | | $ | 14,089,943 | | | | $ | 2,444,489 | |
| Net realized gain (loss) on investments, futures contracts, forward foreign currency exchange contracts, swaps and foreign currency related transactions | | | | 2,890,287 | | | | | 22,104 | |
| Net change in unrealized appreciation/depreciation on investments, futures contracts, forward foreign currency exchange contracts, swaps, unfunded commitments and translation of assets and liabilities denominated in foreign currencies | | | | 26,514,417 | | | | | (86,395 | ) |
| Net increase in net assets resulting from operations | | | | 43,494,647 | | | | | 2,380,198 | |
| Distributions to shareholders: | | | | | | | | | | |
| Institutional Class | | | | (8,521,213 | ) | | | | (2,629,544 | ) |
| Class A | | | | (5,855,737 | ) | | | | (204 | ) |
| Class U(b) | | | | (396 | ) | | | | – | |
| Total distributions to shareholders | | | | (14,377,346 | ) | | | | (2,629,748 | ) |
| Capital share transaction (See Note 16): | | | | | | | | | | |
| Net proceeds from sales of shares | | | | 294,308,700 | | | | | 59,550,773 | |
| Reinvestment of distributions | | | | 6,408,494 | | | | | 1,854,740 | |
| Cost of shares reacquired | | | | (28,499,592 | ) | | | | (30,412 | ) |
| Net increase in net assets resulting from capital share transactions | | | | 272,217,602 | | | | | 61,375,101 | |
| Net increase in net assets | | | | 301,334,903 | | | | | 61,125,551 | |
| NET ASSETS: | | | | | | | | | | |
| Beginning of year | | | $ | 61,225,551 | | | | $ | 100,000 | |
| End of year | | | $ | 362,560,454 | | | | $ | 61,225,551 | |
| | |
| (a) | For the period February 15, 2019 (commencement of operations) to December 31, 2019. |
| (b) | For the period June 18, 2020 (commencement of operations) to December 31, 2020. |
| | |
| | See Notes to Financial Statements. | 21 |
Financial Highlights
| | | | | | Per Share Operating Performance: | |
| | | | | | Investment operations: | | Distributions to
shareholders from: | |
| | | | | | | | | |
| | | Net asset
value,
beginning
of period | | Net
invest-
ment
income(a) | | Net
realized
and
unrealized
gain | | Total
from
invest-
ment
oper-
ations | | Net
invest-
ment
income | | Net
realized
gain | | Total
distri-
butions |
| Institutional Class | | | | | | | | | | | | | | | | | | | | | | | | | | | | |
| 12/31/2020 | | $ | 10.00 | | | $ | 0.74 | | | $ | 0.34 | | | $ | 1.08 | | | $ | (0.71 | ) | | $ | - | | | $ | (0.71 | ) |
| 2/15/2019 to 12/31/2019(c) | | | 10.00 | | | | 0.59 | | | | 0.03 | | | | 0.62 | | | | (0.61 | ) | | | (0.01 | ) | | | (0.62 | ) |
| Class A | | | | | | | | | | | | | | | | | | | | | | | | | | | | |
| 12/31/2020 | | | 10.00 | | | | 0.66 | | | | 0.48 | | | | 1.14 | | | | (0.77 | ) | | | - | | | | (0.77 | ) |
| 9/13/2019 to 12/31/2019(f) | | | 9.93 | | | | 0.19 | | | | 0.08 | | | | 0.27 | | | | (0.19 | ) | | | (0.01 | ) | | | (0.20 | ) |
| Class U | | | | | | | | | | | | | | | | | | | | | | | | | | | | |
| 6/18/2020 to 12/31/2020(g) | | | 9.10 | | | | 0.36 | | | | 1.27 | | | | 1.63 | | | | (0.36 | ) | | | - | | | | (0.36 | ) |
| | | | | | | | | | | | | | | | | | | | | | | | | | | | | |
| (a) | Calculated based on average shares outstanding during the period. |
| (b) | Total return for Class A does not consider the effects of sales loads and assumes the reinvestment of all distributions. Total return for Institutional Class and Class U assumes the reinvestment of all distributions. |
| (c) | Commenced on February 15, 2019. |
| (d) | Not annualized. |
| (e) | Annualized. |
| (f) | Commenced on September 13, 2019. |
| (g) | Commenced on June 18, 2020. |
| | |
| 22 | See Notes to Financial Statements. |
| | | | | | | Ratios to Average Net Assets: | | Supplemental
Data: |
| | | | | | | | | |
Net
asset
value,
end of
period | | Total
return
(%)(b) | | Total
expenses
after
waivers
and/or
reimburse-
ments
(%) | | Total
expenses
(%) | | Net
investment
income
(%) | | Net
assets,
end of
period
(000) | | Portfolio
turnover
rate
(%) |
| | | | | | | | | | | | | |
| $ | 10.37 | | | | 12.84 | | | | 1.50 | | | | 1.62 | | | | 7.92 | | | $ | 177,894 | | | | 119 | |
| | 10.00 | | | | 6.29 | (d) | | | 1.50 | (e) | | | 3.79 | (e) | | | 6.78 | (e) | | | 61,215 | | | | 50 | (d) |
| | | | | | | | | | | | | | | | | | | | | | | | | | | |
| | 10.37 | | | | 12.02 | | | | 2.25 | | | | 2.30 | | | | 7.01 | | | | 184,655 | | | | 119 | |
| | 10.00 | | | | 2.67 | (d) | | | 2.25 | (e) | | | 5.39 | (e) | | | 6.54 | (e) | | | 10 | | | | 50 | (d) |
| | | | | | | | | | | | | | | | | | | | | | | | | | | |
| | 10.37 | | | | 18.33 | (d) | | | 2.25 | (e) | | | 2.30 | (e) | | | 7.01 | (e) | | | 11 | | | | 119 | |
| | | | | | | | | | | | | | | | | | | | | | | | | | | |
| | See Notes to Financial Statements. | 23 |
Notes to Financial Statements
Lord Abbett Credit Opportunities Fund (the “Fund”) is registered under the Investment Company Act of 1940, as amended (the “Act”), as a non-diversified, closed-end management investment company that continuously offers its common shares (the “Shares”) and is operated as an interval fund. The Fund was organized as a Delaware statutory trust on September 18, 2018. The Fund had a sale to Lord, Abbett & Co. LLC (“Lord Abbett”) of 10,000 shares of common stock for $100,000 ($10.00 per share). The Fund commenced operations on February 15, 2019.
The Fund’s investment objective is total return. The Fund currently offers three classes of Shares: Institutional Class, Class A, and Class U. A front-end sales charge is normally added to the net asset value (“NAV”) for Class A shares. There is no front-end sales charge in the case of Institutional Class and Class U. Class U shares commenced operations on June 18, 2020.
The Fund will not list its Shares for trading on any securities exchange. There is currently no secondary market for its Shares and the Fund does not expect any secondary market to develop for its Shares. Shareholders of the Fund are not able have their Shares redeemed or otherwise sell their Shares on a daily basis because the Fund is an unlisted closed-end fund. In order to provide liquidity to shareholders, the Fund is structured as an interval fund and conducts quarterly repurchase offers for a portion of its outstanding Shares.
The preparation of the financial statements in conformity with accounting principles generally accepted in the United States of America (“U.S. GAAP”) requires management to make certain estimates and assumptions that affect the reported amounts of assets and liabilities and disclosure of contingent assets and liabilities at the date of the financial statements and the reported amounts of increases and decreases in net assets from operations during the reporting period. Actual results could differ from those estimates. The Fund is considered an investment company under U.S. GAAP and follows the accounting and reporting guidance applicable to investment companies.
| 2. | SIGNIFICANT ACCOUNTING POLICIES |
| (a) | Investment Valuation–Under procedures approved by the Fund’s Board of Trustees (the “Board”), Lord Abbett, the Fund’s investment manager, has formed a Pricing Committee to administer the pricing and valuation of portfolio investments and to ensure that prices utilized reasonably reflect fair value. Among other things, these procedures allow the Fund to utilize independent pricing services, quotations from securities and financial instrument dealers and other market sources to determine fair value. |
| | |
| | Securities actively traded on any recognized U.S. or non-U.S. exchange or on The NASDAQ Stock Market LLC are valued at the last sale price or official closing price on the exchange or system on which they are principally traded. Events occurring after the close of trading on non-U.S. exchanges may result in adjustments to the valuation of foreign securities to reflect their fair value as of the close of regular trading on the New York Stock Exchange. The Fund may utilize an independent fair valuation service in adjusting the valuations of foreign securities. Unlisted equity securities are valued at the last quoted sale price or, if no sale price is available, at the mean between the most recently quoted bid and asked prices. Exchange traded options and futures contracts are valued at the last quoted sale price in the market where they are principally traded. If no sale has occurred, the mean between the most recently quoted bid and asked prices is used. Fixed income securities are valued based on evaluated prices supplied by independent pricing services, which reflect broker/dealer supplied valuations and the independent pricing services’ own electronic data processing techniques. Floating rate |
24
Notes to Financial Statements (continued)
| | loans are valued at the average of bid and ask quotations obtained from dealers in loans on the basis of prices supplied by independent pricing services. Exchange traded options and futures contracts are valued at the last quoted sale price in the market where they are principally traded. If no sale has occurred, the mean between the most recently quoted bid and asked prices is used. Forward foreign currency exchange contracts are valued using daily forward exchange rates. Swaps are valued daily using independent pricing services or quotations from broker/dealers to the extent available. |
| | |
| | Securities for which prices are not readily available are valued at fair value as determined by the Pricing Committee. The Pricing Committee considers a number of factors, including observable and unobservable inputs, when arriving at fair value. The Pricing Committee may use related or comparable assets or liabilities, recent transactions, market multiples, book values, yield curves, broker quotes, observable trading activity, option adjusted spread models and other relevant information to determine the fair value of portfolio investments. The Board or a designated committee thereof regularly reviews fair value determinations made by the Pricing Committee and may employ techniques such as reviewing related market activity, reviewing inputs and assumptions, and retrospectively comparing prices of subsequent purchases and sales transactions to fair value determinations made by the Pricing Committee. |
| | |
| | Short-term securities with 60 days or less remaining to maturity are valued using the amortized cost method, which approximates fair value. |
| | |
| (b) | Security Transactions–Security transactions are recorded as of the date that the securities are purchased or sold (trade date). Realized gains and losses on sales of portfolio securities are calculated using the identified-cost method. Realized and unrealized gains (losses) are allocated to each class of shares based upon the relative proportion of net assets at the beginning of the day. |
| | |
| (c) | Investment Income–Dividend income is recorded on the ex-dividend date. Interest income is recorded on the accrual basis as earned. Discounts are accreted and premiums are amortized using the effective interest method and are included in Interest and other on the Statement of Operations. Investment income is allocated to each class of shares based upon the relative proportion of net assets at the beginning of the day. |
| | |
| (d) | Income Taxes–It is the policy of the Fund to meet the requirements of Subchapter M of the Internal Revenue Code applicable to regulated investment companies and to distribute substantially all taxable income and capital gains to its shareholders. Therefore, no income tax provision is required. |
| | |
| | The Fund files U.S. federal and various state and local tax returns. No income tax returns are currently under examination. The statute of limitations on the Fund’s filed U.S. federal tax return remains open for the fiscal years ended December 31, 2019 through December 31, 2020. The statutes of limitations on the Fund’s state and local tax returns may remain open for an additional year depending upon the jurisdiction. |
| | |
| (e) | Expenses–Expenses, excluding class-specific expenses, are allocated to each class of shares based upon the relative proportion of net assets at the beginning of the day. Class A and Class U shares bear their class-specific share of all expenses and fees relating to the Fund’s 12b-1 Distribution Plan. |
| | |
| (f) | Foreign Transactions–The books and records of the Fund are maintained in U.S. dollars and transactions denominated in foreign currencies are recorded in the Fund’s records at the rate prevailing when earned or recorded. Asset and liability accounts that are denominated in |
25
Notes to Financial Statements (continued)
| | foreign currencies are adjusted daily to reflect current exchange rates and any unrealized gain (loss), if applicable, is included in Net change in unrealized appreciation/depreciation on translation of assets and liabilities denominated in foreign currencies in the Fund’s Statement of Operations. The resultant exchange gains and losses upon settlement of such transactions are included in Net realized gain (loss), if applicable, on foreign currency related transactions in the Fund’s Statement of Operations. The Fund does not isolate that portion of the results of operations arising as a result of changes in the foreign exchange rates from the changes in market prices of the securities. The Fund uses foreign currency exchange contracts to facilitate transactions in foreign denominated securities. Losses from these transactions may arise from changes in the value of the foreign currency or if the counterparties do not perform under the contracts’ terms. |
| | |
| | The Fund uses foreign currency exchange contracts to facilitate transactions in foreign-denominated securities. Losses from these transactions may arise from changes in the value of the foreign currency or if the counterparties do not perform under the contracts’ terms. |
| | |
| (g) | Forward Foreign Currency Exchange Contracts–The Fund may enter into forward foreign currency exchange contracts in order to reduce exposure to changes in foreign currency exchange rates on foreign portfolio holdings, or gain or reduce exposure to foreign currency solely for investment purposes. A forward foreign currency exchange contract is a commitment to purchase or sell a foreign currency at a future date at a negotiated rate. The contracts are valued daily at forward exchange rates and any unrealized gain (loss) is included in Net change in unrealized appreciation/depreciation on forward foreign currency exchange contracts on the Fund’s Statement of Operations. The gain (loss) arising from the difference between the U.S. dollar cost of the original contract and the value of the foreign currency in U.S. dollars upon closing of such contracts is included in Net realized gain (loss) on forward foreign currency exchange contracts on the Fund’s Statement of Operations. |
| | |
| (h) | Futures Contracts–The Fund may purchase and sell futures contracts to enhance returns, to attempt to economically hedge some of its investment risk, or as a substitute position in lieu of holding the underlying asset on which the instrument is based. At the time of entering into a futures transaction, an investor is required to deposit and maintain a specified amount of cash or eligible securities called “initial margin.” Subsequent payments made or received by the Fund called “variation margin” are made on a daily basis as the market price of the futures contract fluctuates. The Fund will record an unrealized gain (loss) based on the amount of variation margin. When a contract is closed, a realized gain (loss) is recorded equal to the difference between the opening and closing value of the contract. |
| | |
| (i) | Credit Default Swaps–The Fund may enter into credit default swap contracts in order to hedge credit risk or for speculation purposes. As a seller of a credit default swap contract (“seller of protection”), the Fund is required to pay the notional amount or other agreed-upon value of a referenced debt obligation to the counterparty in the event of a default by or other credit event involving the referenced issuer, obligation or index. In return, the Fund receives from the counterparty a periodic stream of payments over the term of the contract. |
| | |
| | As a purchaser of a credit default swap contract (“buyer of protection”), the Fund would receive the notional amount or other agreed upon value of a referenced debt obligation from the counterparty in the event of default by or other credit event involving the referenced issuer, obligation or index. In return, the Fund would make periodic payments to the counterparty over the term of the contracts, provided no event of default has occurred. |
26
Notes to Financial Statements (continued)
| | These credit default swaps may have as a reference obligation corporate or sovereign issuers or credit indexes. These credit indexes are comprised of a basket of securities representing a particular sector of the market. |
| | |
| | Credit default swaps are fair valued based upon quotations from counterparties, brokers or market-makers and the change in value, if any, is recorded as an unrealized appreciation or depreciation. Daily changes in valuation of centrally cleared swaps, if any, are recorded as a receivable or payable for the change in value as appropriate (“variation margin”) on the Statement of Assets and Liabilities. For a credit default swap sold by the Fund, payment of the agreed-upon amount made by the Fund in the event of default of the referenced debt obligation is recorded as the cost of the referenced debt obligation purchased/received. For a credit default swap purchased by the Fund, the agreed-upon amount received by the Fund in the event of default of the referenced debt obligation is recorded as proceeds from sale/delivery of the referenced debt obligation and the resulting gain or loss realized on the referenced debt obligation is recorded as such by the Fund. |
| | |
| | Any upfront payments made or received upon entering a credit default swap contract would be amortized or accreted over the life of the swap and recorded as realized gains or losses. Collateral, in the form of cash or securities, may be required to be held in segregated accounts with the custodian bank or broker in accordance with the swap agreement. The value and credit rating of each credit default swap where the Fund is the seller of protection, are both measures of the current payment/performance risk of the swap. As the value of the swap changes as a positive or negative percentage of the total notional amount, the payment/performance risk may decrease or increase, respectively. The maximum potential amount of future payments (undiscounted) that the Fund as a seller of protection could be required to make under a credit default swap agreement would be an amount equal to the notional amount of the agreement. These potential amounts would be partially offset by any recovery values of the respective referenced obligations, upfront payments received upon entering into the agreement, or net amounts received from the settlement of buy protection credit default swap agreements entered into by the Fund for the same referenced entity or entities. |
| | |
| | Entering into credit default swaps involves credit and market risk. Such risks involve the possibility that there will be no liquid market for these agreements, that the counterparty to the agreements may default on its obligation to perform or disagree as to the meaning of the contractual terms in the agreements, and that there may be unfavorable changes in interest rates, and that Lord Abbett does not correctly predict the creditworthiness of the issuers of the reference obligation on which the credit default swap is based. For the centrally cleared credit default swaps, there was minimal counterparty risk to the Fund, since such credit default swaps entered into were traded through a central clearinghouse, which guarantees against default. |
| | |
| (j) | Total Return Swaps–The Fund may enter into total return swap agreements to obtain exposure to a security or market without owning such security or investing directly in that market. The Fund may agree to make payments that are the equivalent of interest in exchange for the right to receive payments equivalent to any appreciation in the value of an underlying security, index or other asset, as well as receive payments equivalent to any distributions made on that asset, over the term of the swap. If the value of the asset underlying a total return swap declines over the term of the swap, the Fund also may be required to pay an amount equal to that decline in value to their counterparty. |
| | |
| (k) | When-Issued, Forward Transactions or To-Be-Announced (“TBA”) Transactions–The Fund may purchase portfolio securities on a when-issued or forward basis. When-issued, forward transactions or TBA transactions involve a commitment by the Fund to purchase |
27
Notes to Financial Statements (continued)
| | securities, with payment and delivery (“settlement”) to take place in the future, in order to secure what is considered to be an advantageous price or yield at the time of entering into the transaction. During the period between purchase and settlement, the fair value of the securities will fluctuate and assets consisting of cash and/or marketable securities (normally short-term U.S. Government or U.S. Government sponsored enterprise securities) marked to market daily in an amount sufficient to make payment at settlement will be segregated at the Fund’s custodian in order to pay for the commitment. At the time the Fund makes the commitment to purchase a security on a when-issued basis, it will record the transaction and reflect the liability for the purchase and fair value of the security in determining its NAV. The Fund, generally, has the ability to close out a purchase obligation on or before the settlement date rather than take delivery of the security. Under no circumstances will settlement for such securities take place more than 120 days after the purchase date. |
| | |
| (l) | Repurchase Agreements–The Fund may enter into repurchase agreements with respect to securities. A repurchase agreement is a transaction in which a fund acquires a security and simultaneously commits to resell that security to the seller (a bank or securities dealer) at an agreed-upon price on an agreed-upon date. The Fund requires at all times that the repurchase agreement be collateralized by cash, or by securities of the U.S. Government, its agencies, its instrumentalities, or U.S. Government sponsored enterprises having a value equal to, or in excess of, the value of the repurchase agreement (including accrued interest). If the seller of the agreement defaults on its obligation to repurchase the underlying securities at a time when the fair value of these securities has declined, the Fund may incur a loss upon disposition of the securities. |
| | |
| (m) | Floating Rate Loans–The Fund may invest in floating rate loans, which usually take the form of loan participations and assignments. Loan participations and assignments are agreements to make money available to U.S. or foreign corporations, partnerships or other business entities (the “Borrower”) in a specified amount, at a specified rate and within a specified time. A loan is typically originated, negotiated and structured by a U.S. or foreign bank, insurance company or other financial institution (the “Agent”) for a group of loan investors (“Loan Investors”). The Agent typically administers and enforces the loan on behalf of the other Loan Investors in the syndicate and may hold any collateral on behalf of the Loan Investors. Such loan participations and assignments are typically senior, secured and collateralized in nature. The Fund records an investment when the Borrower withdraws money and records interest as earned. These loans pay interest at rates which are periodically reset by reference to a base lending rate plus a spread. These base lending rates are generally the prime rate offered by a designated U.S. bank or London InterBank Offered Rate (“LIBOR”). |
| | |
| | The loans in which the Fund invests may be subject to some restrictions on resale. For example, the Fund may be contractually obligated to receive approval from the Agent and/or Borrower prior to the sale of these investments. The Fund generally has no right to enforce compliance with the terms of the loan agreement with the Borrower. As a result, the Fund assumes the credit risk of the Borrower, the selling participant and any other persons interpositioned between the Fund and the Borrower (“Intermediate Participants”). In the event that the Borrower, selling participant or Intermediate Participants become insolvent or enter into bankruptcy, the Fund may incur certain costs and delays in realizing payment or may suffer a loss of principal and/or interest. |
28
Notes to Financial Statements (continued)
| | Unfunded commitments represent the remaining obligation of the Fund to the Borrower. At any point in time, up to the maturity date of the issue, the Borrower may demand the unfunded portion. As of December 31, 2020, the Fund did not have any unfunded loan commitments. |
| | |
| (n) | Fair Value Measurements–Fair value is defined as the price that the Fund would receive upon selling an investment or transferring a liability in an orderly transaction to an independent buyer in the principal or most advantageous market of the investment. A three-tier hierarchy is used to maximize the use of observable market data and minimize the use of unobservable inputs and to establish classification of fair value measurements for disclosure purposes. Inputs refer broadly to the assumptions that market participants would use in pricing the asset or liability, including assumptions about risk - for example, the risk inherent in a particular valuation technique used to measure fair value (such as a pricing model) and/or the risk inherent in the inputs to the valuation technique. Inputs may be observable or unobservable. Observable inputs reflect the assumptions market participants would use in pricing the asset or liability. Observable inputs are based on market data obtained from sources independent of the reporting entity. Unobservable inputs reflect the reporting entity’s own assumptions about the assumptions market participants would use in pricing the asset or liability. Unobservable inputs are based on the best information available in the circumstances. The three-tier hierarchy classification is determined based on the lowest level of inputs that is significant to the fair value measurement, and is summarized in the three broad Levels listed below: |
| | |
| | • | Level 1 – | unadjusted quoted prices in active markets for identical investments; |
| | | |
| | • | Level 2 – | other significant observable inputs (including quoted prices for similar investments, interest rates, prepayment speeds, credit risk, etc.); and |
| | | |
| | • | Level 3 – | significant unobservable inputs (including the Fund’s own assumptions in determining the fair value of investments). |
| | | |
| | A summary of inputs used in valuing the Fund’s investments and other financial instruments as of December 31, 2020 and, if applicable, Level 3 rollforwards for the fiscal year then ended is included in the Fund’s Schedule of Investments. |
| | |
| | Changes in valuation techniques may result in transfers into or out of an assigned level within the three-tier hierarchy. The inputs or methodology used for valuing securities are not necessarily an indication of the risk associated with investing in those securities. |
| 3. | MANAGEMENT FEE AND OTHER TRANSACTIONS WITH AFFILIATES |
Management Fee
The Fund has a management agreement with Lord Abbett, pursuant to which Lord Abbett provides the Fund with investment management services and executive and other personnel, provides office space and pays for ordinary and necessary office and clerical expenses relating to research and statistical work and supervision of the Fund’s investment portfolio.
The management fee is based on the Fund’s average daily net assets at the annual rate of 1.25%.
For the fiscal year ended December 31, 2020, the effective management fee, net of waivers, was at an annualized rate of 1.15% of the Fund’s average daily net assets.
In addition, Lord Abbett provides certain administrative services to the Fund pursuant to an Administrative Services Agreement in return for a fee at an annual rate of ..04% of the Fund’s
29
Notes to Financial Statements (continued)
average daily net assets. Lord Abbett voluntarily waived $12,974 of the fund administration fees during the fiscal year ended December 31, 2020.
For the fiscal year ended December 31, 2020 and continuing through June 30, 2021, Lord Abbett has contractually agreed to waive all or a portion of its management fee and, if necessary, waive all or a portion of its administrative fee and reimburse the Fund’s other expenses to the extent necessary so that the total net annual operating expenses for each class, excluding 12b-1 fees, do not exceed an annual rate of 1.50%. This agreement may be terminated only upon the approval of the Board.
12b-1 Distribution Plan
The Fund has adopted a Distribution and Servicing Plan for Class A and Class U Shares of the Fund pursuant to Rule 12b-1 under the Act, which provides for the payment of ongoing distribution and service fees to Lord Abbett Distributor LLC (the “Distributor”), an affiliate of Lord Abbett.
The following annual rates have been authorized by the Board pursuant to the plan:
| Fees* | Class A | Class U |
| Service | .25% | .25% |
| Distribution | .50% | .50% |
| | | |
| * | | The Fund may designate a portion of the aggregate fee as attributable to service activities for purposes of calculating Financial Industry Regulatory Authority, Inc. (“FINRA”) sales charge limitations. |
Institutional Class does not have a distribution plan.
Distributor
The Distributor is the principal underwriter and distributor of the Fund’s Shares pursuant to a distribution agreement (the “Distribution Agreement”) with the Fund. The Distributor is a wholly-owned subsidiary of Lord Abbett. The Distributor does not participate in the distribution of non-Lord Abbett managed products.
The Distributor acts as the distributor of Shares for the Fund on a best efforts basis, subject to various conditions, pursuant to the terms of the Distribution Agreement. The Distributor is not obligated to sell any specific amount of Shares of the Fund.
The Fund may impose repurchase fees of up to 2.00% on Shares accepted for repurchase that have been held for less than one year.
Commissions
Distributor received the following commissions on sales of shares of the Fund, after concessions were paid to authorized dealers, for the fiscal year ended December 31, 2020:
| Distributor | Dealers’ |
| Commissions | Concessions |
| $1,480 | $7,791 |
Distributor received CDSCs of $30,803 for Class A for the fiscal year ended December 31, 2020.
One Trustee and certain of the Fund’s officers have an interest in Lord Abbett.
| 4. | OFFERING AND ORGANIZATIONAL COSTS |
The Fund paid offering costs of $445,200 that were amortized from the Fund’s commencement of operations and continued for a twelve month period with amortization for the December 31, 2019 period end and for part of the 2020 fiscal year end.
30
Notes to Financial Statements (continued)
| 5. | DISTRIBUTIONS AND CAPITAL LOSS CARRYFORWARDS |
Dividends from net investment income, if any, are declared daily and paid monthly. Taxable net realized gains from investment transactions, reduced by allowable capital loss carryforwards, if any, are declared and distributed to shareholders at least annually. The capital loss carryforward amount, if any, is available to offset future net capital gains. Dividends and distributions to shareholders are recorded on the ex-dividend date. The amounts of dividends and distributions from net investment income and net realized capital gains are determined in accordance with federal income tax regulations, which may differ from U.S. GAAP. These book/tax differences are either considered temporary or permanent in nature. To the extent these differences are permanent in nature, such amounts are reclassified within the components of net assets based on their federal tax basis treatment; temporary differences do not require reclassification. Dividends and distributions that exceed earnings and profits for tax purposes are reported as a tax return of capital.
The tax character of distributions paid during the fiscal year ended December 31, 2020 and period ended December 31, 2019 was as follows:
| | | Year Ended | | | Period Ended | |
| | | 12/31/2020 | | | 12/31/2019 | |
| Distributions paid from: | | | | | | | | |
| Ordinary income | | $ | 14,377,346 | | | $ | 2,620,844 | |
| Net long-term capital gains | | | – | | | | 8,904 | |
| Total distributions paid | | $ | 14,377,346 | | | $ | 2,629,748 | |
As of December 31, 2020, the components of accumulated gains on a tax-basis were as follows:
| Undistributed ordinary income – net | | $ | 2,321,442 | |
| Total undistributed earnings | | | 2,321,442 | |
| Temporary differences | | | (4,406 | ) |
| Unrealized gains – net | | | 26,817,821 | |
| Total accumulated gains – net | | $ | 29,134,857 | |
As of December 31, 2020, the aggregate unrealized security gains and losses on investments and other financial instruments based on cost for U.S. federal income tax purposes were as follows:
| Tax cost | | $ | 331,215,127 | |
| Gross unrealized gain | | | 30,149,836 | |
| Gross unrealized loss | | | (3,351,875 | ) |
| Net unrealized security gain | | $ | 26,797,961 | |
The difference between book-basis and tax-basis unrealized gains (losses) is attributable to the tax treatment of certain securities, other financial instruments, amortization of premium and wash sales.
Permanent items identified during the fiscal year ended December 31, 2020 have been reclassified among the components of net assets based on their tax basis treatment as follows:
| Total Distributable | | Paid-in | |
| Earnings (loss) | | Capital | |
| $41,016 | | | $(41,016 | ) |
The permanent differences are attributable to the tax treatment of certain expenses.
31
Notes to Financial Statements (continued)
| 6. | PORTFOLIO SECURITIES TRANSACTIONS |
Purchases and sales of investment securities (excluding short-term investments) for the fiscal year ended December 31, 2020 were as follows:
| Purchases | Sales |
| $441,872,190 | $210,525,125 |
There were no purchases or sales of U.S. Government securities for the fiscal year ended December 31, 2020.
The Fund is permitted to purchase and sell securities (“cross-trade”) from and to other Lord Abbett funds or client accounts pursuant to procedures approved by the Board in compliance with Rule 17a-7 under the Act (the “Rule”). Each cross-trade is executed at a fair market price in compliance with provisions of the Rule. For the fiscal year ended December 31, 2020 the Fund did not engage in any cross-trade transactions.
| 7. | DISCLOSURES ABOUT DERIVATIVE INSTRUMENTS AND HEDGING ACTIVITIES |
The Fund entered into forward foreign currency exchange contracts during the fiscal year ended December 31, 2020 (as described in note 2(g)). A forward foreign currency exchange contract reduces the Fund’s exposure to changes in the value of the currency it will deliver (or settle in cash) and increases its exposure to changes in the value of the currency it will receive (or settle in cash) for the duration of the contract. The Fund’s use of forward foreign currency exchange contracts involves the risk that Lord Abbett will not accurately predict currency movements, and the Fund’s returns could be reduced as a result. Forward foreign currency exchange contracts are subject to the risk that those currencies will decline in value relative to the U.S. dollar, or, in the case of hedged positions, that the U.S. dollar will decline relative to the currency being hedged. Currency rates in foreign countries may fluctuate significantly over short periods of time. The Fund’s risk of loss from counterparty credit risk is the unrealized appreciation on forward foreign currency exchange contracts.
The Fund entered into U.S. Treasury futures contracts during the fiscal year ended December 31, 2020 (as described in note 2(h)) to economically hedge against changes in interest rates. The Fund bears the risk of interest rates moving unexpectedly, in which case the Fund may not achieve the anticipated benefits of the futures contracts and realize a loss. There is minimal counterparty credit risk to the Fund since futures are exchange traded and the exchange’s clearinghouse, as counterparty to all exchange traded futures, guarantees futures against default.
The Fund entered into credit default swaps during the fiscal year ended December 31, 2020 (as described in note 2(i)), to economically hedge credit risk. Credit default swaps involve the exchange of a fixed rate premium for protection against the loss in value of an underlying security in the event of a defined credit event, such as payment default or bankruptcy. Under a credit default swap one party acts as a guarantor by receiving the fixed periodic payment in exchange for the commitment to purchase the underlying security at par if the defined credit event occurs. The Fund’s maximum risk of loss from counterparty risk, either as the protection seller or as the protection buyer, is the fair value of the contract. There is minimal counterparty credit risk to the Fund since centrally cleared credit default swaps are traded through a central clearinghouse. As the counterparty to all centrally cleared credit default swaps, the clearinghouse guarantees credit default swaps against default.
32
Notes to Financial Statements (continued)
As of December 31, 2020, the Fund had the following derivatives at fair value, grouped into risk categories that illustrate the Fund’s use of derivative instruments:
| | | Interest | | | Foreign | | | | |
| | | Rate | | | Currency | | | Credit | |
| Asset Derivatives | | Contracts | | | Contracts | | | Contracts | |
| Forward Foreign Currency Exchange Contracts(2) | | | – | | | $ | 13,380 | | | | – | |
| Liability Derivatives | | | | | | | | | | | | |
| Credit Default Swap Contracts(1) | | | – | | | | – | | | $ | 639,277 | |
| Forward Foreign Currency Exchange Contracts(3) | | | – | | | $ | 632,702 | | | | – | |
| | | |
| (1) | | Statements of Assets and Liabilities location: Credit default swap agreements payable, at fair value. |
| (2) | | Statement of Assets and Liabilities location: Unrealized appreciation on forward foreign currency exchange contracts. |
| (3) | | Statement of Assets and Liabilities location: Unrealized depreciation on forward foreign currency exchange contracts. |
Transactions in derivative instruments for the year ended December 31, 2020, were as follows:
| | | | | | Foreign | | | | |
| | | Interest Rate | | | Currency | | | Credit | |
| | | Contracts | | | Contracts | | | Contracts | |
| Net Realized Gain (Loss) | | | | | | | | | | | | |
| Credit Default Swap Contracts(1) | | | – | | | | – | | | $ | (2,415,463 | ) |
| Forward Foreign Currency Exchange Contracts(2) | | | – | | | $ | (838,481 | ) | | | – | |
| Futures Contracts(3) | | $ | 3,064 | | | | – | | | | – | |
| Net Change in Unrealized Appreciation/Depreciation | | | | | | | | | | | | |
| Credit Default Swap Contracts(4) | | | – | | | | – | | | $ | 524,397 | |
| Forward Foreign Currency Exchange Contracts(5) | | | – | | | $ | (581,532 | ) | | | – | |
| Futures Contracts(6) | | $ | (6,541 | ) | | | – | | | | – | |
| Average Number of Contracts/Notional Amounts* | | | | | | | | | | | | |
| Credit Default Swaps(7) | | | – | | | | – | | | | 5,708,025 | |
| Forward Foreign Currency Exchange Contracts(8) | | | – | | | $ | 123,863,702 | | | | – | |
| Futures Contracts(7) | | | 1 | | | | – | | | | – | |
| | | |
| * | | Calculated based on the number of contracts or notional amounts for the fiscal year ended December 31, 2020. |
| (1) | | Statement of Operations location: Net realized gain (loss) on swap contracts. |
| (2) | | Statement of Operations location: Net realized gain (loss) on forward foreign currency exchange contracts. |
| (3) | | Statement of Operations location: Net realized gain (loss) on futures contracts. |
| (4) | | Statement of Operations location: Net change in unrealized appreciation/depreciation on swap contracts. |
| (5) | | Statement of Operations location: Net change in unrealized appreciation/depreciation on forward foreign currency contracts. |
| (6) | | Statement of Operations location: Net change in unrealized appreciation/depreciation on futures contracts. |
| (7) | | Amount represents number of contracts. |
| (8) | | Amount represents notional amounts in U.S. dollars. |
| 8. | DISCLOSURES ABOUT OFFSETTING ASSETS AND LIABILITIES |
The Financial Accounting Standards Board (“FASB”) requires disclosures intended to help better assess the effect or potential effect of offsetting arrangements on a fund’s financial position. The following tables illustrate gross and net information about recognized assets and liabilities eligible for offset in the Statement of Assets and Liabilities; and disclose such amounts subject to an enforceable master netting agreement or similar agreement, by counterparty. A master netting agreement is an agreement between a fund and a counterparty which provides for the net
33
Notes to Financial Statements (continued)
settlement of amounts owed under all contracts traded under that agreement, as well as cash collateral, through a single payment by one party to the other in the event of default on or termination of any one contract. The Fund’s accounting policy with respect to balance sheet offsetting is that, absent an event of default by the counterparty or a termination of the agreement, the master netting agreement does not result in an offset of reported amounts of financial assets and liabilities in the statement of assets and liabilities across transactions between the Fund and the applicable counterparty:
| Description | | Gross Amounts of
Recognized Assets | | | Gross Amounts
Offset in the
Statement of Assets
and Liabilities | | | Net Amounts of
Assets Presented
in the Statement of
Assets and Liabilities |
| Forward Foreign Currency Exchange Contracts | | $ | 13,380 | | | $ | – | | | $ | 13,380 |
| Repurchase Agreement | | | 28,047,174 | | | | – | | | | 28,047,174 |
| Total | | $ | 28,060,554 | | | $ | – | | | $ | 28,060,554 |
| | | Net Amounts | | | | | | | | | | | | |
| | | of Assets | | | Amounts Not Offset in the | | | |
| | | Presented in | | | Statement of Assets and Liabilities | | | |
| Counterparty | | the Statement
of Assets and
Liabilities | | | Financial
Instruments | | | Cash
Collateral
Received(a) | | | Securities
Collateral
Received(a) | | | Net
Amount(b) |
| Fixed Income Clearing Corp. | | $ | 28,047,174 | | | $ | – | | | $ | – | | | $ | (28,047,174 | ) | | $ | – |
| State Street Bank and Trust | | | 13,380 | | | | (13,380 | ) | | | – | | | | – | | | | – |
| Total | | $ | 28,060,554 | | | $ | (13,380 | ) | | $ | – | | | $ | (28,047,174 | ) | | $ | – |
| | | | | | Gross Amounts | | | Net Amounts of |
| | | | | | Offset in the | | | Liabilities Presented |
| | | Gross Amounts of | | | Statement of Assets | | | in the Statement of |
| Description | | Recognized Liabilities | | | and Liabilities | | | Assets and Liabilities |
| Credit Default Swap Contracts | | $ | 639,277 | | | $ | – | | | $ | 639,277 |
| Forward Foreign Currency Exchange Contracts | | | 623,702 | | | | – | | | | 623,702 |
| Total | | $ | 1,262,979 | | | $ | – | | | $ | 1,262,979 |
| | | Net Amounts | | | | | | | | | | | | |
| | | of Liabilities | | | Amounts Not Offset in the | | | |
| | | Presented in | | | Statement of Assets and Liabilities | | | |
| Counterparty | | the Statement
of Assets and
Liabilities | | | Financial
Instruments | | | Cash
Collateral
Pledged(a) | | | Securities
Collateral
Pledged(a) | | | Net
Amount(c) |
| Bank of America | | $ | 2,314 | | | $ | – | | | $ | – | | | $ | – | | | $ | 2,314 |
| Barclays Bank plc | | | 162,507 | | | | – | | | | – | | | | – | | | | 162,507 |
| Citibank | | | 639,277 | | | | – | | | | (603,533 | ) | | | – | | | | 35,744 |
| Goldman Sachs | | | 1,243 | | | | – | | | | – | | | | – | | | | 1,243 |
| Morgan Stanley | | | 33,069 | | | | – | | | | – | | | | – | | | | 33,069 |
| State Street Bank and Trust | | | 252,780 | | | | (13,380 | ) | | | – | | | | – | | | | 239,400 |
| Toronto Dominion Bank | | | 171,789 | | | | – | | | | – | | | | – | | | | 171,789 |
| Total | | $ | 1,262,979 | | | $ | (13,380 | ) | | $ | (603,533 | ) | | $ | – | | | $ | 646,066 |
| | | |
| (a) | | Collateral disclosed is limited to an amount not to exceed 100% of the net amount of assets (liabilities) presented in the Statement of Assets and Liabilities, for each respective counterparty. |
| (b) | | Net amount represents the amount owed to the Fund by the counterparty as of December 31, 2020. |
| (c) | | Net amount represents the amount owed by the Fund to the counterparty as of December 31, 2020. |
34
Notes to Financial Statements (continued)
The Trust’s officers and one Trustee, who are associated with Lord Abbett, do not receive any compensation from the Fund for serving in such capacities. Independent Trustees’ fees are allocated among all Lord Abbett-sponsored funds based on the net assets of the fund. There is an equity-based plan available to all Independent Trustees under which Independent Trustees must defer receipt of a portion of, and may elect to defer receipt of an additional portion of Trustees’ fees. The deferred amounts are treated as though equivalent dollar amounts had been invested in the fund. Such amounts and earnings accrued thereon are included in Trustees’ fees on the Statement of Operations and in Trustees’ fees payable on the Statement of Assets and Liabilities and are not deductible for U.S. federal income tax purposes until such amounts are paid.
The Fund has entered into an arrangement with its transfer agent and custodian, whereby credits realized as a result of uninvested cash balances are used to reduce a portion of the Fund’s expenses.
Effective August 6, 2020, the Participating Funds (together with the Fund) entered into a syndicated line of credit facility with various lenders for $1.17 billion (the “Syndicated Facility”) whereas SSB participated as a lender and as agent for the lenders. The Participating Funds are subject to graduated borrowing limits of one third of Fund net assets (if Fund net assets are less than $750 million), $250 million, $300 million, $600 million, or $900 million, based on past borrowings and likelihood of future borrowings, among other factors.
For the period ended December 31, 2020, the Participating Funds were party to an additional line of credit facility with SSB for $330 million (the “Bilateral Facility”), $250 million committed and $80 million uncommitted. Under the Bilateral Facility, the Participating Funds are subject to graduated borrowing limits of one-third of Fund net assets (if net assets are less than $750 million), $250 million, $300 million, or $330 million, based on past borrowings and likelihood of future borrowings, among other factors.
The Syndicated Facility and the Bilateral Facility are to be used for temporary or emergency purposes as an additional source of liquidity to satisfy redemptions.
For the fiscal year ended December 31, 2020, the Fund did not utilize the Facilities.
| 12. | CUSTODIAN AND ACCOUNTING AGENT |
SSB is the Fund’s custodian and accounting agent. SSB performs custodial, accounting and recordkeeping functions relating to portfolio transactions and calculating the Fund’s NAV.
| 13. | SECURITIES LENDING AGREEMENT |
The Fund has established a securities lending agreement with Citibank, N.A. for the lending of securities to qualified brokers in exchange for securities or cash collateral equal to at least the market value of securities loaned, plus interest, if applicable. Cash collateral is invested in an approved money market fund. In accordance with the Fund’s securities lending agreement, the market value of securities on loan is determined each day at the close of business and any additional collateral required to cover the value of securities on loan is delivered to the Fund on the next business day. As with other extensions of credit, the Fund may experience a delay in the recovery of their securities or incur a loss should the borrower of the securities breach its
35
Notes to Financial Statements (continued)
agreement with the Fund or become insolvent at a time when the collateral is insufficient to cover the cost of repurchasing securities on loan. Any income earned from securities lending is included in Securities lending net income on the Statement of Operations.
The initial collateral received by the Fund is required to have a value equal to at least 100% of the market value of the securities loaned. The collateral must be marked-to-market daily to cover increases in the market value of the securities loaned (or potentially a decline in the value of the collateral). In general, the risk of borrower default will be borne by the Fund’s agent; the Fund will bear the risk of loss with respect to the investment of the cash collateral. The advantage of such loans is that the Fund continues to receive income on loaned securities while receiving a portion of any securities lending fees and earning returns on the cash amounts which may be reinvested for the purchase of investments in securities.
As of December 31, 2020, the Fund did not loan any securities.
In order to provide liquidity to shareholders, the Fund has adopted a fundamental investment policy to make quarterly offers to repurchase its outstanding Shares at NAV per share, reduced by any applicable repurchase fee. Subject to applicable law and approval of the Board, for each quarterly repurchase offer, the Fund currently expects to offer to repurchase 5% of the Fund’s outstanding Shares at NAV, which is the minimum amount permitted. The result of the repurchase offers is as follows:
| Institutional Shares Repurchase offer | | | | | | | | | | |
| Commencement | | Deadline | | Pricing | | Shares | | | Amount | |
| Date | | Date | | Date | | Repurchased* | | | Repurchased* | |
| June 10, 2019 | | July 10, 2019 | | July 10, 2019 | | | 3,005 | | | $ | 30,412 | |
| September 9, 2019 | | October 9, 2019 | | October 9, 2019 | | | 0 | | | $ | 0 | |
| December 8, 2019 | | January 8, 2020 | | January 8, 2020 | | | 6,380 | | | $ | 64,060 | |
| March 9, 2020 | | April 8, 2020 | | April 8, 2020 | | | 622,729 | | | $ | 4,981,834 | |
| June 8, 2020 | | July 8, 2020 | | July 8, 2020 | | | 874,967 | | | $ | 7,883,455 | |
| September 4, 2020 | | October 7, 2020 | | October 7, 2020 | | | 1,095,580 | | | $ | 10,387,088 | |
| December 4, 2020 | | January 6, 2021 | | January 6, 2021 | | | 87,259 | | | $ | 907,497 | |
| Class A Shares Repurchase offer | | | | | | | | | | |
| Commencement | | Deadline | | Pricing | | Shares | | | Amount | |
| Date | | Date | | Date | | Repurchased* | | | Repurchased* | |
| March 9, 2020 | | April 8, 2020 | | April 8, 2020 | | | 21,728 | | | $ | 173,825 | |
| June 8, 2020 | | July 8, 2020 | | July 8, 2020 | | | 134,940 | | | $ | 1,215,811 | |
| September 4, 2020 | | October 7, 2020 | | October 7, 2020 | | | 208,634 | | | $ | 1,977,850 | |
| December 4, 2020 | | January 6, 2021 | | January 6, 2021 | | | 239,054 | | | $ | 2,486,162 | |
| | | |
| * | | Class U shares did not have any shares repurchased. |
Repurchase offers and the need to fund repurchase obligations may affect the ability of the Fund to be fully invested or force the Fund to maintain a higher percentage of its assets in liquid investments, which may harm the Fund’s investment performance. Moreover, diminution in the size of the Fund through repurchases may result in untimely sales of portfolio securities (with associated imputed transaction costs, which may be significant), may limit the ability of the Fund to participate in new investment opportunities or to achieve its investment objective and will tend to increase the Fund’s expense ratio per common share for remaining shareholders. The Fund may accumulate cash by holding back (i.e., not reinvesting) payments received in connection with the
36
Notes to Financial Statements (continued)
Fund’s investments. If at any time cash and other liquid assets held by the Fund are not sufficient to meet the Fund’s repurchase obligations, the Fund intends, if necessary, to sell investments. If the Fund employs investment leverage, repurchases of Shares would compound the adverse effects of leverage in a declining market. Also, if the Fund borrows to finance repurchases, interest on that borrowing will negatively affect shareholders who do not tender their Shares by increasing the Fund’s expenses and reducing any net investment income.
If a repurchase offer is oversubscribed, the Board may determine to increase the amount repurchased by up to 2% of the Fund’s outstanding shares as of the date of the Repurchase Request Deadline (as defined in the Fund’s Prospectus). In the event that the Board determines not to repurchase more than the repurchase offer amount, or if shareholders tender more than the repurchase offer amount plus 2% of the Fund’s outstanding shares as of the date of the Repurchase Request Deadline, the Fund will repurchase the Shares tendered on a pro rata basis, and shareholders will have to wait until the next repurchase offer to make another repurchase request. Consequently, shareholders may be unable to liquidate all or a given percentage of their investment in the Fund during a particular repurchase offer. Some shareholders, in anticipation of proration, may tender more Shares than they wish to have repurchased in a particular quarter, thereby increasing the likelihood that proration will occur. A shareholder may be subject to market and other risks, and the NAV of Shares tendered in a repurchase offer may decline between the Repurchase Request Deadline and the date on which the NAV for tendered Shares is determined. In addition, the repurchase of Shares by the Fund may be a taxable event to shareholders, potentially including even shareholders who do not tender any Shares in such repurchase.
The Fund is subject to the general risks and considerations associated with investing in debt securities and to the changing prospects of individual companies and/or sectors in which the Fund invests. The value of an investment will change as interest rates fluctuate and in response to market movements. When interest rates rise, the prices of debt securities are likely to decline; when rates fall, such prices tend to rise. Longer-term debt securities are usually more sensitive to interest rate changes. There is also the risk that an issuer of a debt security will fail to make timely payments of principal or interest to the Fund, a risk that is greater with high-yield securities (sometimes called “lower-rated bonds” or “junk bonds”), in which the Fund may substantially invest. Some issuers, particularly of high-yield securities, may default as to principal and/or interest payments after the Fund purchases its securities. A default, or concerns in the market about an increase in the risk of default, may result in losses to the Fund. High-yield securities are subject to greater price fluctuations, as well as additional risks. The market for below investment grade securities may be less liquid, which may make such securities more difficult to sell at an acceptable price, especially during periods of financial distress, increased market volatility, or significant market decline.
On July 27, 2017, the head of the United Kingdom’s Financial Conduct Authority announced a desire to phase out the use of LIBOR by the end of 2021. On November 30, 2020, the administrator of LIBOR announced a delay in the phase out of a majority of the U.S. dollar LIBOR publications until June 30, 2023, with the remainder of LIBOR publications to still end at the end of 2021. There remains uncertainty regarding the future utilization of LIBOR and the nature of any replacement rate. As such, the potential effect of a transition away from LIBOR on the Fund or the LIBOR-based instruments in which the Fund invest cannot yet be determined. The transition process might lead to increased volatility and illiquidity in markets that currently rely on LIBOR to determine interest rates. It could also lead to a reduction in the value of some LIBOR-based investments and reduce the effectiveness of new hedges placed against existing LIBOR-based instruments. Since the
37
Notes to Financial Statements (continued)
usefulness of LIBOR as a benchmark could deteriorate during the transition period, these effects could occur prior and/or subsequent to the end of 2021.
The Fund is subject to the risk of investing in securities issued or guaranteed by the U.S. Government or its agencies and instrumentalities (such as the Government National Mortgage Association (“Ginnie Mae”), the Federal National Mortgage Association (“Fannie Mae”), or the Federal Home Loan Mortgage Corporation (“Freddie Mac”)). Unlike Ginnie Mae securities, securities issued or guaranteed by U.S. Government-related organizations such as Fannie Mae and Freddie Mac are not backed by the full faith and credit of the U.S. Government and no assurance can be given that the U.S. Government would provide financial support to its agencies and instrumentalities if not required to do so by law. Consequently, the Fund may be required to look principally to the agency issuing or guaranteeing the obligation.
The mortgage-related and asset-backed securities in which the Fund may invest may be particularly sensitive to changes in prevailing interest rates, and economic conditions, including delinquencies and/or defaults. These changes can affect the value, income, and/or liquidity of such positions. When interest rates are declining, the value of these securities with prepayment features may not increase as much as other fixed income securities. Early principal repayment may deprive the Fund of income payments above current market rates. Alternatively, rising interest rates may cause prepayments to occur at a slower-than-expected rate, extending the duration of a security and typically reducing its value. The payment rate will thus affect the price and volatility of a mortgage-related security. In addition, the Fund may invest in non-agency asset backed and mortgage related securities, which are issued by private institutions, not by government-sponsored enterprises.
The Fund may invest up to 20% of its net assets in equity securities, the value of which fluctuates in response to movements in the equity securities markets in general, the changing prospects of individual companies in which the Fund invests, or an individual company’s financial condition.
The Fund may invest in convertible securities, which have both equity and fixed income risk characteristics, including market, credit, liquidity, and interest rate risks. Generally, convertible securities offer lower interest or dividend yields than non-convertible securities of similar quality and less potential for gains or capital appreciation in a rising equity securities market than equity securities. They tend to be more volatile than other fixed income securities and the market for convertible securities may be less liquid than the markets for stocks or bonds. A significant portion of convertible securities have below investment grade credit ratings and are subject to increased credit and liquidity risks.
Due to the Fund’s investment exposure to foreign companies and American Depositary Receipts, the Fund may experience increased market, industry and sector, liquidity, currency, political, information, and other risks. The securities of foreign companies also may be subject to inadequate exchange control regulations, the imposition of economic sanctions or other government restrictions, higher transaction and other costs, and delays in settlement to the extent they are traded on non-U.S. exchanges or markets.
The Fund is subject to the risks associated with derivatives, which may be different from and greater than the risks associated with directly investing in securities. Derivatives may be subject to risks such as liquidity risk, leveraging risk, interest rate risk, market risk, and credit risk. Illiquid securities may lower the Fund’s returns since the Fund may be unable to sell these securities at their desired time or price. Derivatives also may involve the risk of mispricing or improper valuation and the risk that changes in the value of the derivative may not correlate perfectly with the value of the
38
Notes to Financial Statements (continued)
underlying asset, rate or index. Whether the Fund’s use of derivatives is successful will depend on, among other things, the Fund’s ability to correctly forecast market movements and other factors. Losses may also arise from the failure of a derivative counterparty to meet its contractual obligations. If the Fund incorrectly forecasts these and other factors, the Fund’s performance could suffer. The Fund’s use of derivatives could result in a loss exceeding the amount of the Fund’s investment in these instruments.
The Fund may invest in loans, which include, among other things, loans to U.S. or foreign corporations, partnerships, other business entities, or to U.S. and non-U.S. governments. The Fund may invest in fixed rate and variable rate loans and floating or adjustable rate loans, including bridge loans, novations, assignments, and participations, which are subject to increased credit and liquidity risks. The loans in which the Fund invests will usually be rated below investment grade or may also be unrated. Below investment grade loans, as in the case of high-yield debt securities, or junk bonds, are usually more credit sensitive than interest rate sensitive, although the value of these instruments may be impacted by broader interest rate swings in the overall fixed income market. The Fund may invest in debtor-in-possession financings (commonly known as “DIP financings”). DIP financings are arranged when an entity seeks the protections of the bankruptcy court under Chapter 11 of the U.S. Bankruptcy Code. Such financings constitute senior liens on an unencumbered security (i.e., security not subject to other creditors’ claims).
Geopolitical and other events (e.g., wars, terrorism, natural disasters, epidemics or pandemics such as the COVID-19 outbreak which began in late 2019) may disrupt securities markets and adversely affect global economies and markets, thereby decreasing the value of the Fund’s investments. Market disruptions can also prevent the Fund from implementing its investment strategies and achieving its investment objective.
The transmission of COVID-19 and efforts to contain its spread have resulted in, among other things, border closings and other significant travel restrictions and disruptions, significant disruptions to business operations, supply chains and customer activity, lower consumer demand for goods and services, event cancellations and restrictions, service cancellations, reductions and other changes, significant challenges in healthcare service preparation and delivery, and prolonged quarantines, as well as general concern and uncertainty. The impact of the COVID-19 outbreak could negatively affect the global economy, the economies of individual countries, and the financial performance of individual issuers, sectors, industries, asset classes, and markets in significant and unforeseen ways.
The COVID-19 pandemic and its effects may last for an extended period of time, and in either case could result in significant market volatility, exchange trading suspensions and closures, declines in global financial markets, higher default rates, and a substantial economic downturn or recession. The foregoing could disrupt the operations of the Fund and its service providers, adversely affect the value and liquidity of the Fund’s investments, and negatively impact the Fund’s performance and your investment in the Fund.
These factors can affect the Fund’s performance.
39
Notes to Financial Statements (concluded)
| 16. | SUMMARY OF CAPITAL TRANSACTIONS |
Transactions in shares of capital stock were as follows:
| | | Year Ended | | | Period Ended | |
| | | December 31, 2020 | | | December 31, 2019 | |
| Institutional Shares(a) | | Shares | | | Amount | | | Shares | | | Amount | |
| Shares sold | | | 13,359,450 | | | $ | 122,679,387 | | | | 5,931,546 | | | $ | 59,540,773 | |
| Reinvestment of distributions | | | 270,959 | | | | 2,491,635 | | | | 186,034 | | | | 1,854,535 | |
| Shares reacquired | | | (2,599,419 | ) | | | (23,302,186 | ) | | | (3,005 | ) | | | (30,412 | ) |
| Increase | | | 11,030,990 | | | $ | 101,868,836 | | | | 6,114,575 | | | $ | 61,364,896 | |
| Class A Shares(b) | | | | | | | | | | | | | | | | |
| Shares sold | | | 17,946,422 | | | $ | 171,619,313 | | | | 1,006 | | | $ | 10,000 | |
| Reinvestment of distributions | | | 419,740 | | | | 3,916,859 | | | | 21 | | | | 205 | |
| Shares reacquired | | | (556,041 | ) | | | (5,197,406 | ) | | | – | | | | – | |
| Increase | | | 17,810,121 | | | $ | 170,338,766 | | | | 1,027 | | | $ | 10,205 | |
| Class U Shares(c) | | | | | | | | | | | | | | | | |
| Shares sold | | | 1,099 | | | $ | 10,000 | | | | – | | | $ | – | |
| Increase | | | 1,099 | | | $ | 10,000 | | | | – | | | $ | – | |
| | | |
| (a) | | Commenced on February 15, 2019 |
| (b) | | Commenced on September 13, 2019. |
| (c) | | Commenced on June 18, 2020. |
40
Report of Independent Registered Public Accounting Firm
To the shareholders and the Board of Trustees of Lord Abbett Credit Opportunities Fund
Opinion on the Financial Statements and Financial Highlights
We have audited the accompanying statement of assets and liabilities of Lord Abbett Credit Opportunities Fund (the “Fund”), including the schedule of investments, as of December 31, 2020, the related statement of operations for the year then ended, and the statements of changes in net assets and the financial highlights for the year ended December 31, 2020 and for the period from February 15, 2019 (commencement of operations) through December 31, 2019, and the related notes. In our opinion, the financial statements and financial highlights present fairly, in all material respects, the financial position of the Fund as of December 31, 2020, and the results of its operations for the year then ended, and the changes in its net assets and the financial highlights for the year ended December 31, 2020 and for the period from February 15, 2019 (commencement of operations) through December 31, 2019, in conformity with accounting principles generally accepted in the United States of America.
Basis for Opinion
These financial statements and financial highlights are the responsibility of the Fund’s management. Our responsibility is to express an opinion on the Fund’s financial statements and financial highlights based on our audits. We are a public accounting firm registered with the Public Company Accounting Oversight Board (United States) (PCAOB) and are required to be independent with respect to the Fund in accordance with the U.S. federal securities laws and the applicable rules and regulations of the Securities and Exchange Commission and the PCAOB.
We conducted our audits in accordance with the standards of the PCAOB. Those standards require that we plan and perform the audit to obtain reasonable assurance about whether the financial statements and financial highlights are free of material misstatement, whether due to error or fraud. The Fund is not required to have, nor were we engaged to perform, an audit of its internal control over financial reporting. As part of our audits we are required to obtain an understanding of internal control over financial reporting but not for the purpose of expressing an opinion on the effectiveness of the Fund’s internal control over financial reporting. Accordingly, we express no such opinion.
Our audits included performing procedures to assess the risks of material misstatement of the financial statements and financial highlights, whether due to error or fraud, and performing procedures that respond to those risks. Such procedures included examining, on a test basis, evidence regarding the amounts and disclosures in the financial statements and financial highlights. Our audits also included evaluating the accounting principles used and significant estimates made by management, as well as evaluating the overall presentation of the financial statements and financial highlights. Our procedures included confirmation of securities owned as of December 31, 2020, by correspondence with the custodian, brokers and selling or agent banks; when replies were not received from brokers and selling or agent banks, we performed other auditing procedures. We believe that our audits provide a reasonable basis for our opinion.
DELOITTE & TOUCHE LLP
New York, New York
February 26, 2021
We have served as the auditor of one or more Lord Abbett Family of Funds’ investment companies since 1932.
41
Basic Information About Management
The Board is responsible for the management of the business and affairs of the Fund in accordance with the laws of the state of organization. The Board elects officers who are responsible for the day-to-day operations of the Fund and who execute policies authorized by the Board. The Board also approves an investment adviser to the Fund and continues to monitor the cost and quality of the services the investment adviser provides, and annually considers whether to renew the contract with the investment adviser. Generally, each Board member holds office until his/her successor is elected and qualified or until his/her earlier resignation or removal, as provided in the Fund’s organizational documents.
Lord, Abbett & Co. LLC (“Lord Abbett”), a Delaware limited liability company, is the Fund’s investment adviser. Designated Lord Abbett personnel are responsible for the day-to-day management of the Fund.
Independent Board Members
The following Independent Board Members also are board members of each of the 13 investment companies in the Lord Abbett Family of Funds, which consist of 60 investment portfolios.
Name, Address and
Year of Birth | | Current Position and
Length of Service
with the Fund | | Principal Occupation and Other Directorships
During the Past Five Years |
Evelyn E. Guernsey
Lord, Abbett & Co. LLC
c/o Legal Dept.
90 Hudson Street
Jersey City, NJ 07302
(1955) | | Board member since 2011 | | Principal Occupation: None.
Other Directorships: None. |
Julie A. Hill
Lord, Abbett & Co. LLC
c/o Legal Dept.
90 Hudson Street
Jersey City, NJ 07302
(1946) | | Board member since 2004 | | Principal Occupation: Owner and CEO of The Hill Company, a business consulting firm (since 1998).
Other Directorships: Currently serves as director of Anthem, Inc., a health benefits company (since 1994). |
Kathleen M. Lutito
Lord, Abbett & Co. LLC
c/o Legal Dept.
90 Hudson Street
Jersey City, NJ 07302
(1963) | | Board member since 2017 | | Principal Occupation: President and Chief Investment Officer of CenturyLink Investment Management Company (since 2006).
Other Directorships: None. |
James M. McTaggart
Lord, Abbett & Co. LLC
c/o Legal Dept.
90 Hudson Street
Jersey City, NJ 07302
(1947) | | Board member since 2012 | | Principal Occupation: Independent management advisor and consultant (since 2012).
Other Directorships: Blyth, Inc., a home products company (2004–2015). |
Charles O. Prince
Lord, Abbett & Co. LLC
c/o Legal Dept.
90 Hudson Street
Jersey City, NJ 07302
(1950) | | Board member since 2019 | | Principal Occupation: None. Formerly Chairman and Chief Executive Officer, Citigroup, Inc. (Retired 2007).
Other Directorships: Currently serves as director of Johnson & Johnson (2006–Present). Previously served as director of Xerox Corporation (2008–2018). |
42
Basic Information About Management (continued)
Name, Address and
Year of Birth | | Current Position and
Length of Service
with the Fund | | Principal Occupation and Other Directorships
During the Past Five Years |
Karla M. Rabusch
Lord, Abbett & Co. LLC
c/o Legal Dept.
90 Hudson Street
Jersey City, NJ 07302
(1959) | | Board member since 2017 | | Principal Occupation: President and Director of Wells Fargo Funds Management, LLC (2003–2017); President of Wells Fargo Funds (2003–2016).
Other Directorships: None. |
Mark A. Schmid
Lord, Abbett & Co. LLC
c/o Legal Dept.
90 Hudson Street
Jersey City, NJ 07302
(1959) | | Board member since 2016 | | Principal Occupation: Vice President and Chief Investment Officer of the University of Chicago (since 2009).
Other Directorships: None. |
James L.L. Tullis
Lord, Abbett & Co. LLC
c/o Legal Dept.
90 Hudson Street
Jersey City, NJ 07302
(1947) | | Board member since 2006; Chairman since 2017 | | Principal Occupation: Chairman of Tullis Health Investors - FL LLC (since 2018); CEO of Tullis– Dickerson and Co. Inc., a venture capital management firm (1990–2016).
Other Directorships: Currently serves as director of Crane Co. (since 1998), Alphatec Spine (since 2018), electroCore, Inc. (since 2018), and Exagen Inc. (since 2019). |
Interested Board Members
Mr. Sieg is affiliated with Lord Abbett and is an “interested person” of the Fund as defined in the Act. Mr. Sieg is a board member of each of the 13 investment companies in the Lord Abbett Family of Funds, which consist of 60 investment portfolios. Mr. Sieg is an officer of the Lord Abbett Family of Funds.
Name, Address and
Year of Birth | | Current Position and
Length of Service
with the Fund | | Principal Occupation and Other Directorships
During the Past Five Years |
Douglas B. Sieg
Lord, Abbett & Co. LLC
90 Hudson Street
Jersey City, NJ 07302
(1969) | | Board member since 2016; President and Chief Executive Officer since 2018 | | Principal Occupation: Managing Partner (since 2018) and was formerly Head of Client Services, joined Lord Abbett in 1994.
Other Directorships: None. |
Officers
None of the officers listed below have received compensation from the Fund. All of the officers of the Fund also may be officers of the other Lord Abbett Funds and maintain offices at 90 Hudson Street, Jersey City, NJ 07302. Unless otherwise indicated, the position(s) and title(s) listed under the “Principal Occupation During the Past Five Years” column indicate each officer’s position(s) and title(s) with Lord Abbett. Each officer serves for an indefinite term (i.e., until his or her death, resignation, retirement, or removal).
Name and
Year of Birth | | Current Position
with the Fund | | Length of Service
of Current
Position | | Principal Occupation
During the Past Five Years |
Douglas B. Sieg
(1969) | | President and Chief Executive Officer | | Elected as President and Chief Executive Officer in 2018 | | Managing Partner of Lord Abbett (since 2018) and was formerly Head of Client Services, joined Lord Abbett in 1994. |
43
Basic Information About Management (concluded)
Name and
Year of Birth | | Current Position
with the Fund | | Length of Service
of Current
Position | | Principal Occupation
During the Past Five Years |
Jackson C. Chan
(1964) | | AML Compliance Officer | | Elected in 2018 | | Deputy Chief Compliance Officer and Director of Regulatory Affairs, joined Lord Abbett in 2014. |
Pamela P. Chen
(1978) | | Vice President, Assistant Secretary and Privacy Officer | | Elected as Vice President and Assistant Secretary in 2018 and Privacy Officer in 2019 | | Associate General Counsel, joined Lord Abbett in 2017 and was formerly Special Counsel at Schulte, Roth & Zabel LLP (2005–2017). |
John T. Fitzgerald
(1975) | | Vice President and Assistant Secretary | | Elected in 2018 | | Deputy General Counsel, joined Lord Abbett in 2018 and was formerly Deputy Head of U.S. Funds Legal, Executive Director and Assistant General Counsel at JPMorgan Chase (2005–2018). |
Vito A. Fronda
(1969) | | Chief Financial Officer and Treasurer | | Elected as Chief Financial Officer in 2020 and Treasurer in 2018 | | Partner and Director of U.S. Fund Treasury & Global Taxation, joined Lord Abbett in 2003. |
Linda Y. Kim
(1980) | | Vice President and Assistant Secretary | | Elected in 2016 | | Counsel, joined Lord Abbett in 2015. |
Joseph M. McGill
(1962) | | Chief Compliance Officer | | Elected in 2014 | | Partner and Chief Compliance Officer, joined Lord Abbett in 2014. |
Amanda S. Ryan
(1978) | | Vice President and Assistant Secretary | | Elected in 2018 | | Counsel, joined Lord Abbett in 2016 and was formerly a Director and Corporate Counsel at PGIM Investments (2012–2016). |
Lawrence B. Stoller
(1963) | | Vice President, Secretary and Chief Legal Officer | | Elected as Vice President and Secretary in 2007 and Chief Legal Officer in 2019 | | Partner and General Counsel, joined Lord Abbett in 2007. |
Please call 888-522-2388 for a copy of the statement of additional information, which contains further information about the Fund’s Board members. It is available free upon request.
44
Approval of Advisory Contract
The Board, including all of the Trustees who are not “interested persons” of the Fund or of Lord Abbett, as defined in the Investment Company Act of 1940, as amended (the “Independent Trustees”), annually considers whether to approve the continuation of the existing management agreement between the Fund and Lord Abbett (the “Agreement”). In connection with its most recent approval, the Board reviewed materials relating specifically to the Agreement, as well as numerous materials received throughout the course of the year, including information about the Fund’s investment performance compared to the performance of its benchmark. Before making its decision as to the Fund, the Board had the opportunity to ask questions and request further information, taking into account its knowledge of Lord Abbett gained through its meetings and discussions. These meetings and discussions included the deliberations of the Contract Committee and discussions between the Contract Committee and Lord Abbett’s management. The Independent Trustees also met with their independent legal counsel in various private sessions at which no representatives of management were present.
The materials received by the Board included, but were not limited to: (1) information provided by Broadridge Financial Solutions (“Broadridge”) regarding the investment performance of the Fund compared to the investment performance of certain funds with similar investment styles as determined by Broadridge, based, in part, on the Fund’s Morningstar category; (2) information provided by Broadridge regarding the expense ratios, contractual and actual management fee rates, and other expense components for the Fund and certain funds in the same Morningstar category, with generally the same or similar share classes and operational characteristics, including asset size (the “expense peer group”); (2) information provided by Lord Abbett on the expense ratios, management fee rates, and other expense components for the Fund; (3) sales and share repurchase information for the Fund; (4) information regarding Lord Abbett’s financial condition; (5) an analysis of the relative profitability of the Agreement to Lord Abbett; and (6) information regarding the personnel and other resources devoted by Lord Abbett to managing the Fund.
Investment Management and Related Services Generally. The Board considered the services provided by Lord Abbett to the Fund, including investment research, portfolio management, and trading, and Lord Abbett’s commitment to compliance with all applicable legal requirements. The Board also observed that Lord Abbett was solely engaged in the investment management business and accordingly did not experience the conflicts of interest that may result from being engaged in other lines of business. The Board considered the investment advisory services provided by Lord Abbett to other clients, the fees charged for the services, and the differences in the nature of the services provided to the Fund and other Lord Abbett Funds, on the one hand, and the services provided to other clients, on the other. After reviewing these and related factors, the Board concluded that the Fund was likely to continue to benefit from the nature, extent and quality of the investment services provided by Lord Abbett under the Agreement.
Investment Performance. The Board considered the Fund’s investment performance and noted that the Fund commenced operations on February 15, 2019 and therefore has a limited operating history. The Board further considered Lord Abbett’s performance and reputation generally, the performance of other Lord Abbett-managed funds overseen by the Board, and the willingness of Lord Abbett to take steps intended to improve performance when appropriate. After reviewing these and related factors, the Board concluded that the Fund’s Agreement should be continued.
Lord Abbett’s Personnel and Methods. The Board considered the qualifications of the personnel providing investment management services to the Fund, in light of its investment objective and discipline, and other services provided to the Fund by Lord Abbett. Among other things, the Board
45
Approval of Advisory Contract (continued)
considered the size, experience, and turnover of Lord Abbett’s staff, Lord Abbett’s investment methodology and philosophy, and Lord Abbett’s approach to recruiting, training, and retaining personnel.
Nature and Quality of Other Services. The Board considered the nature, quality, and extent of compliance, administrative, and other services performed by Lord Abbett and the nature and extent of Lord Abbett’s supervision of third party service providers, including the Fund’s transfer agent and custodian.
Expenses. The Board considered the expense level of the Fund, including the contractual and actual management fee rates, and the expense levels of the Fund’s expense peer group. It also considered how the expense level of the Fund related to those of the expense peer group and the amount and nature of the fees paid by shareholders. The Board observed that the net total expense ratio of the Fund was below the median of the expense peer group. After reviewing these and related factors, the Board concluded, within the context of its overall approval of the Agreement, that the management fees paid by, and expense level of, the Fund were reasonable in light of all of the factors it considered and supported the continuation of the Agreement.
Profitability. The Board considered the level of Lord Abbett’s operating margin in managing the Fund, including a review of Lord Abbett’s methodology for allocating its costs to its management of the Fund. It considered whether the Fund was profitable to Lord Abbett in connection with the Fund’s operation, including the fee that Lord Abbett receives from the Fund for providing administrative services to the Fund. The Board considered Lord Abbett’s profit margins excluding Lord Abbett’s marketing and distribution expenses. The Board also considered Lord Abbett’s profit margins, without those exclusions, in comparison with available industry data and how those profit margins could affect Lord Abbett’s ability to recruit and retain personnel. The Board recognized that Lord Abbett’s overall profitability was a factor in enabling it to attract and retain qualified personnel to provide services to the Fund. After reviewing these and related factors, the Board concluded, within the context of its overall approval of the Agreement, that Lord Abbett’s profitability with respect to the Fund was not excessive.
Economies of Scale. The Board considered the extent to which there had been economies of scale in managing the Fund, whether the Fund’s shareholders had appropriately benefited from such economies of scale, and whether there was potential for realization of any further economies of scale. The Board also considered information provided by Lord Abbett regarding how it shares any potential economies of scale through its investments in its businesses supporting the Funds. The Board also considered the Fund’s existing management fee schedule and the Fund’s expense limitation agreement. The Board concluded that no action was required with respect to economies of scale.
Other Benefits to Lord Abbett. The Board considered the amount and nature of the fees paid by the Fund and the Fund’s shareholders to Lord Abbett and the Distributor for services other than investment advisory services, such as the fee that Lord Abbett receives from the Fund for providing administrative services to the Fund. The Board also considered the revenues and profitability of Lord Abbett’s investment advisory business apart from its mutual fund business, and the intangible benefits enjoyed by Lord Abbett by virtue of its relationship with the Fund. The Board observed that the Distributor receives distribution and servicing fees from certain of the Lord Abbett Funds as to shares held in accounts for which there is no other broker of record, may retain a portion of such fees it receives, and receives a portion of the sales charges on sales and redemptions of some classes of shares of the Lord Abbett Funds. In addition, the Board observed that Lord Abbett accrues certain benefits for its business of providing investment advice to clients other than the Lord Abbett Funds, but that business also benefits the Funds. The Board also noted that Lord Abbett, as disclosed in the prospectus of the Fund, has entered into revenue sharing arrangements with certain entities that
46
Approval of Advisory Contract (concluded)
distribute shares of the Lord Abbett Funds. The Board also took into consideration the investment research that Lord Abbett receives as a result of client brokerage transactions.
Alternative Arrangements. The Board considered whether, instead of approving continuation of the Agreement, it might be in the best interests of the Fund to implement one or more alternative arrangements, such as continuing to employ Lord Abbett, but on different terms. After considering all of the relevant factors, the Board unanimously found that continuation of the Agreement was in the best interests of the Fund and its shareholders and voted unanimously to approve the continuation of the Agreement. In considering whether to approve the continuation of the Agreement, the Board did not identify any single factor as paramount or controlling. Individual Trustees may have evaluated the information presented differently from one another, giving different weights to various factors. This summary does not discuss in detail all matters considered.
47
Householding
The Fund has adopted a policy that allows it to send only one copy of the Fund’s prospectus, proxy material, annual report and semiannual report (or related notice of internet availability of annual report and semiannual report) to certain shareholders residing at the same “household.” This reduces Fund expenses, which benefits you and other shareholders. If you need additional copies or do not want your mailings to be “householded,” please call Lord Abbett at 888-522-2388 or send a written request with your name, the name of your fund or funds and your account number or numbers to Lord Abbett Family of Funds, P.O. Box 219336, Kansas City, MO 64121.
Proxy Voting Policies, Procedures and Records
A description of the policies and procedures that Lord Abbett uses to vote proxies related to the Fund’s portfolio securities, and information on how Lord Abbett voted the Fund’s proxies during the 12-month period ended June 30 are available without charge, upon request, (i) by calling 888-522-2388; (ii) on Lord Abbett’s Website at www.lordabbett.com; and (iii) on the Securities and Exchange Commission’s (“SEC”) Website at www.sec.gov.
Shareholder Reports and Quarterly Portfolio Disclosure
The Fund is required to file its complete schedule of portfolio holdings with the SEC for its first and third fiscal quarters as an attachment to Form N-PORT. Copies of the filings are available without charge, upon request on the SEC’s Website at www.sec.gov and may be available by calling Lord Abbett at 888-522-2388.
Tax Information (unaudited) For foreign shareholders, 91% of the net investment income distributions paid by the Fund during the period ended December 31, 2020 represents interest-related dividends. |
48


| This report, when not used for the general information of shareholders of the Fund, is to be distributed only if preceded or accompanied by a current fund prospectus. | | |
| | | |
Lord Abbett mutual fund shares are distributed by
LORD ABBETT DISTRIBUTOR LLC. | Lord Abbett Credit Opportunities Fund | LA-CROPP-2
(02/21) |
| (a) | In accordance with applicable requirements, the Registrant adopted a Sarbanes-Oxley Code of Ethics on June 19, 2003 that applies to the principal executive officer and senior financial officers of the Registrant (“Code of Ethics”). The Code of Ethics was in effect during the fiscal year ended December 30, 2020 (the “Period”). |
| (c) | The Registrant has not amended the Code of Ethics as described in Form N-CSR during the Period. |
| (d) | The Registrant has not granted any waiver, including an implicit waiver, from a provision of the Code of Ethics as described in Form N-CSR during the Period. |
| (f) | See Item 12(a)(1) concerning the filing of the Code of Ethics. |
| Item 3: | Audit Committee Financial Expert. |
The Registrant’s board of trustees has determined that each of the following independent trustees who are members of the audit committee is an audit committee financial expert: Evelyn E. Guernsey, Karla M. Rabusch and Mark A. Schmid. Each of these persons is independent within the meaning of the Form N-CSR.
| Item 4: | Principal Accountant Fees and Services. |
In response to sections (a), (b), (c) and (d) of Item 4, the aggregate fees billed to the Registrant for the fiscal years ended December 31, 2020 and 2019 by the Registrant’s principal accounting firm, Deloitte & Touche LLP, the member firms of Deloitte Touche Tohmatsu and their respective affiliates (collectively, “Deloitte”) were as follows:
| | | Fiscal year ended: |
| | | 2020 | 2019 |
| Audit Fees {a} | | $45,000 | $25,000 |
| Audit-Related Fees | | - 0 - | - 0 - |
| Total audit and audit-related fees | | 45,000 | 25,000 |
| | | | |
| Tax Fees {b} | | 7,597 | 7,240 |
| All Other Fees | | - 0 - | - 0 - |
| | | | |
| Total Fees | | $52,597 | $32,240 |
{a} Consists of fees for audits of the Registrant’s annual financial statements.
{b} Fees for the fiscal year ended December 31, 2020 and 2019 consist of fees for preparing the U.S. Income Tax Return for Regulated Investment Companies, New Jersey Corporation Business Tax Return, New Jersey Annual Report Form, U.S. Return of Excise Tax on Undistributed Income of Investment Companies, IRS Forms 1099-MISC and 1096 Annual Summary and Transmittal of U.S. Information Returns.
(e) (1) Pursuant to Rule 2-01(c) (7) of Regulation S-X, the Registrant’s Audit Committee has adopted pre-approval policies and procedures. Such policies and procedures generally provide that the Audit Committee must pre-approve:
| · | any audit, audit-related, tax, and other services to be provided to the Lord Abbett Funds, including the Registrant, and |
| · | any audit-related, tax, and other services to be provided to the Registrant’s investment adviser and any entity controlling, controlled by or under common control with the investment adviser that provides ongoing services to one or more Funds comprising the Registrant if the engagement relates directly to operations and financial reporting of a Fund, by the independent auditor to assure that the provision of such services does not impair the auditor’s independence. |
The Audit Committee has delegated pre-approval authority to its Chairman, subject to a fee limit of $10,000 per event, and not to exceed $25,000 annually. The Chairman will report any pre-approval decisions to the Audit Committee at its next scheduled meeting. Unless a type of service to be provided by the independent auditor has received general pre-approval, it must be pre-approved by the Audit Committee. Any proposed services exceeding pre-approved cost levels will require specific pre-approval by the Audit Committee.
(e) (2) The Registrant’s Audit Committee has approved 100% of the services described in this Item 4 (b) through (d).
(f) Not applicable.
(g) The aggregate non-audit fees billed by Deloitte for services rendered to the Registrant are shown above in the response to Item 4 (a), (b), (c) and (d) as “All Other Fees”.
The aggregate non-audit fees billed by Deloitte for services rendered to the Registrant’s investment adviser, Lord, Abbett & Co. LLC (“Lord Abbett”), for the fiscal years ended December 31, 2020 and 2019 were:
| | | Fiscal year ended: |
| | | 2020 | 2019 |
| All Other Fees {a} | | $214,142 | $215,383 |
{a} Consist of fees for Independent Services Auditors’ Report on Controls Placed in Operation and Tests of Operating Effectiveness related to Lord Abbett’s Asset Management Services (“SOC-1 Report”).
The aggregate non-audit fees billed by Deloitte for services rendered to entities under the common control of Lord Abbett for the fiscal years ended December 31, 2020 and 2019 were:
| | | Fiscal year ended: |
| | | 2020 | 2019 |
| All Other Fees | | $ - 0 - | $ - 0 - |
(h) The Registrant’s Audit Committee has considered the provision of non-audit services that were rendered to the Registrant’s investment adviser, and any entity controlling, controlled by or under common control with the investment adviser that provides ongoing services to the Registrant, that were not pre-approved pursuant to Rule 2-01 (c)(7)(ii) of Regulation S-X and has determined that the provision of such services is compatible with maintaining Deloitte’s independence.
| Item 5: | Audit Committee of Listed Registrants. |
| | |
| | Not applicable. |
| | |
| Item 6: | Investments. |
| | |
| | Not applicable. |
| | |
| Item 7: | Disclosure of Proxy Voting Policies and Procedures for Closed-End Management Investment Companies. |
| | |
| | Not applicable. |
| | |
| Item 8: | Portfolio Managers of Closed-End Management Investment Companies. |
| | |
| | Not applicable. |
| | |
| Item 9: | Purchases of Equity Securities by Closed-End Management Investment Company and Affiliated Purchasers. |
| | |
| | Not applicable. |
| | |
| Item 10: | Submission of Matters to a Vote of Security Holders. |
| | |
| | Not applicable. |
| Item 11: | Controls and Procedures. |
| (a) | Based on their evaluation of the Registrant’s disclosure controls and procedures (as defined in Rule 30a-3(c) under the Investment Company Act of 1940) as of a date within 90 days prior to the filing date of this report, the Chief Executive Officer and Chief Financial Officer of the Registrant have concluded that such disclosure controls and procedures are reasonably designed and effective to ensure that material information relating to the Registrant, including its consolidated subsidiaries, is made known to them by others within those entities. |
| (b) | There were no changes in the Registrant’s internal control over financial reporting (as defined in Rule 30a-3(d) under the Investment Company Act of 1940) that occurred during the period covered by this report that have materially affected, or are reasonably likely to materially affect, the Registrant’s internal control over financial reporting. |
SIGNATURES
Pursuant to the requirements of the Securities Exchange Act of 1934 and the Investment Company Act of 1940, the Registrant has duly caused this report to be signed on its behalf by the undersigned, thereunto duly authorized.
| | LORD ABBETT CREDIT OPPORTUNITIES FUND |
| | | | |
| | | By: | /s/ Douglas B. Sieg |
| | | | Douglas B. Sieg |
| | | | President and Chief Executive Officer |
Date: February 26, 2021
Pursuant to the requirements of the Securities Exchange Act of 1934 and the Investment Company Act of 1940, this report has been signed below by the following persons on behalf of the Registrant and in the capacities and on the dates indicated.
| | By: | /s/ Douglas B. Sieg |
| | | Douglas B. Sieg |
| | | President and Chief Executive Officer |
Date: February 26, 2021
| | By: | /s/ Vito A. Fronda |
| | | Vito A. Fronda |
| | | Chief Financial Officer and Treasurer |
Date: February 26, 2021