UNITED STATES
SECURITIES AND EXCHANGE COMMISSION
Washington, D.C. 20549
FORM N-CSR
CERTIFIED SHAREHOLDER REPORT OF REGISTERED
MANAGEMENT INVESTMENT COMPANIES
Investment Company Act File Number: 811-23383
LORD ABBETT CREDIT OPPORTUNITIES FUND
(Exact name of Registrant as specified in charter)
30 Hudson Street, Jersey City, New Jersey 07302-4804
(Address of principal executive offices) (Zip code)
Randolph A. Stuzin, Esq.
Vice President and Assistant Secretary
30 Hudson Street, Jersey City, New Jersey 07302-4804
(Name and address of agent for service)
Registrant’s telephone number, including area code: (888) 522-2388
Date of fiscal year end: 12/31
Date of reporting period: 12/31/2024
Form N-CSR is to be used by management investment companies to file reports with the Commission not later than 10 days after the transmission to stockholders of any report that is required to be transmitted to stockholders under Rule 30e-1 under the Investment Company Act of 1940 (17 CFR 270.30e-1). The Commission may use the information provided on Form N-CSR in its regulatory, disclosure review, inspection, and policymaking roles.
A registrant is required to disclose the information specified by Form N-CSR, and the Commission will make this information public. A registrant is not required to respond to the collection of information contained in Form N-CSR unless the Form displays a currently valid Office of Management and Budget (“OMB”) control number. Please direct comments concerning the accuracy of the information collection burden estimate and any suggestions for reducing the burden to Secretary, Securities and Exchange Commission, 450 Fifth Street, NW, Washington, DC 20549-0609. The OMB has reviewed this collection of information under the clearance requirements of 44 U.S.C. § 3507.
| Item 1: | Report to Shareholders. |
| | |

LORD ABBETT
ANNUAL REPORT
Lord Abbett
Credit Opportunities Fund
For the fiscal year ended December 31, 2024
Lord Abbett Credit Opportunities Fund
Annual Report
For the fiscal year ended December 31, 2024

From left to right: John Shaffer, Independent Trustee and Chair of the Lord Abbett Alternatives Funds Board of Trustees and Steven F. Rocco, Interested Trustee, President and Chief Executive Officer of the Lord Abbett Alternatives Funds. | | Dear Shareholders: We are pleased to provide you with this overview of the performance of Lord Abbett Credit Opportunities Fund for the fiscal year ended December 31, 2024. On this page and the following pages, we discuss the major factors that influenced fiscal year performance. For detailed and timely information about the Fund, please visit our website at www.lordabbett.com, where you can also access quarterly commentaries that provide updates on the Fund’s performance and other portfolio related updates and Fund literature. Thank you for investing in the Lord Abbett Family of Funds. We value the trust that you place in us and look forward to serving your investment needs in the years to come. Best regards, 
Steven F. Rocco Trustee, President and Chief Executive Officer |
For the fiscal year ended December 31, 2024, the Fund returned 10.90%, reflecting performance at the net asset value of Institutional Class shares with all distributions reinvested, compared to its benchmark, the ICE BofA U.S. High Yield Constrained Index*, which returned 8.27% over the same period.
Positive factors for the markets included momentum around the soft-landing narrative, which was supported by signs of a cooling labor market and a slowing economy. This led to the U.S. Federal Reserve lowering its policy rate by 50 basis points in
September, 25 basis points in November, and 25 basis points in December. Mixed economic data, including softer consumer price index reports and fluctuating job market indicators, contributed to rate cut expectations during the period, and also sparked recession fears. However, these factors were mostly balanced by strong consumer spending and retail sales.
The Fund’s allocation to U.S. high yield bonds was one of the main contributors to the Fund’s performance over the fiscal year. Specifically, within U.S. high yield bonds, the Fund’s allocations to the energy and building
1
products sectors were positive drivers of performance over the fiscal year. Within corporates the Fund’s allocation to energy remains the largest sector allocation but has come down from its highs earlier in the year.
Allocations to asset backed securities (ABS), and collateralized loan obligations (CLOs) also contributed to the Fund’s total return over the period. Within ABS, the Fund’s primary exposure continues to be in the auto loan segment with additional exposure in the auto lease, equipment lease, credit card, and consumer loan subsectors.
Although the Fund exhibited positive performance for the period, there were several allocations that detracted from performance. These allocations were primarily in commercial mortgage-backed securities (CMBS) and specific high yield bonds in the cable and satellite sector.
The Fund’s portfolio is actively managed and, therefore, its holdings and the weightings of a particular issuer or particular sector as a percentage of portfolio assets are subject to change. Sectors may include many industries.
* The ICE BofA U.S. High Yield Constrained Index is a capitalization-weighted index of all U.S. dollar denominated below investment grade corporate debt publicly issued in the U.S. domestic market.
Unless otherwise specified, indexes reflect total return, with all dividends reinvested. Indexes are unmanaged, do not reflect the deduction of fees or expenses, and are not available for direct investment.
Important Performance and Other Information Performance data quoted in the following pages reflect past performance and are no guarantee of future results. Current performance may be higher or lower than the performance quoted. The investment return and principal value of an investment in the Fund will fluctuate so that shares, on any given day or when redeemed, may be worth more or less than their original cost. You can obtain performance data current to the most recent month end by calling Lord Abbett at 888-522-2388 or referring to www.lordabbett.com.
Except where noted, comparative Fund performance does not account for the deduction of sales charges and would be different if sales charges were included. The Fund offers classes of shares with distinct pricing options. For a full description of the differences in pricing alternatives, please see the Fund’s prospectus.
During certain periods shown, expense waivers and reimbursements were in place. Without such expense waivers and reimbursements, the Fund’s returns would have been lower.
The annual commentary above discusses the views of the Fund’s management and various portfolio holdings of the Fund as of December 31, 2024. These views and portfolio holdings may have changed after this date. Information provided in the commentary is not a recommendation to buy or sell securities. Because the Fund’s portfolio is actively managed and may change significantly, the Fund may no longer own the securities described above or may have otherwise changed its position in the securities. For more recent information about the Fund’s portfolio holdings, please visit www.lordabbett.com.
A Note about Risk: See Notes to Financial Statements for a discussion of investment risks. For a more detailed discussion of the risks associated with the Fund, please see the Fund’s prospectus.
Mutual funds are not insured by the FDIC, are not deposits or other obligations of, or guaranteed by, banks, and are subject to investment risks including possible loss of principal amount invested.
2
Credit Opportunities Fund
Investment Comparison
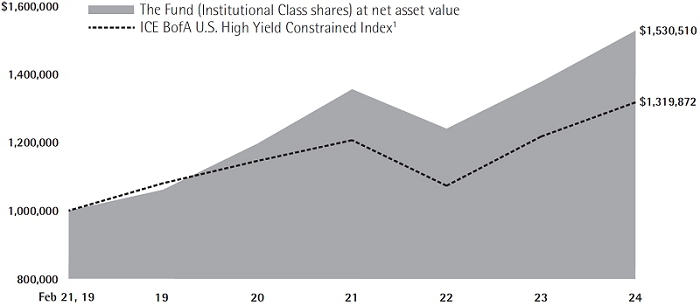
Below is a comparison of a $1 million investment in Institutional Class shares with the same investment in the ICE BofA U.S. High Yield Constrained Index, assuming reinvestment of all dividends and distributions. The performance of the other classes will be greater than or less than the performance shown in the graph below due to different sales loads and expenses applicable to such class. The graph and performance table below do not reflect the deduction of taxes that a shareholder would pay on Fund distributions or the redemption of Fund shares. During certain periods, expenses of the Fund have been waived or reimbursed by Lord Abbett; without such waiver or reimbursement of expenses, the Fund’s returns would have been lower. Past performance is no guarantee of future results.
Average Annual Total Returns at Net Asset Value
for the Periods Ended December 31, 2024
| | | 1 Year | | 5 Year | | Life of Class |
| Institutional Class2 | | 10.90% | | 7.59% | | 7.54% |
| Class A3 | | 7.66% | | 6.31% | | 6.47% |
| Class U4 | | 10.08% | | N/A | | 8.83% |
1 Performance for the unmanaged index does not reflect any fees or expenses. The performance of the index is not necessarily representative of the Fund’s performance.
2 Institutional Class shares commenced operations on February 15, 2019 and performance began on February 21, 2019. Performance is at net asset value.
3 Class A shares commenced operations and performance began on September 13, 2019. Total return, which is the
percentage change in net asset value, after deduction of the maximum initial sales charge of 2.50% applicable to Class A shares, with all dividends and distributions reinvested for the periods shown ended December 31, 2024, is calculated using the SEC-required uniform method to compute such return.
4 Class U shares commenced operations and performance began on June 18, 2020. Performance is at net asset value.
3
Portfolio Holdings Presented by Sector
December 31, 2024
| Holdings by | % of |
| Asset Allocation* | Investments** |
| Asset-Backed Securities | | 29.91% |
| Commercial Paper | | 3.45% |
| Common Stocks | | 0.02% |
| Convertible Bonds | | 0.82% |
| Corporate Bonds | | 49.98% |
| Floating Rate Loans | | 3.27% |
| Investments in Underlying Funds | | 2.23% |
| Non-Agency Commercial Mortgage-Backed Securities | | 0.13% |
| Preferred Stocks | | 0.04% |
| Warrants | | 0.00% |
| Repurchase Agreements | | 8.36% |
| Time Deposits(a) | | 0.18% |
| Money Market Funds(a) | | 1.61% |
| Total | | 100.00% |
| * | A sector may comprise several industries. |
| ** | Represents percent of total investments, which excludes derivatives. |
| (a) | Securities were purchased with the cash collateral from loaned securities. |
4
Schedule of Investments
December 31, 2024
| Investments | | Interest
Rate | | Maturity
Date | | Principal
Amount‡ | | | Fair
Value | |
| LONG-TERM INVESTMENTS 88.99% | | | | | | | | | | | | |
| | | | | | | | | | | | | |
| ASSET-BACKED SECURITIES 30.70% | | | | | | | | | | | | |
| | | | | | | | | | | | | |
| Automobiles 11.65% | | | | | | | | | | | | |
| Ally Auto Receivables Trust Series 2024-1 Class CERT† | | Zero Coupon | | 2/16/2032 | | $ | 30,890 | | | $ | 12,820,153 | |
| CAL Receivables LLC Series 2022-1 Class B† | | 8.948%
(30 day USD SOFR Average + 4.35% | )# | 10/15/2026 | | | 23,945,687 | | | | 23,929,567 | |
| Carvana Auto Receivables Trust Series 2021-N1 Class R† | | Zero Coupon | | 1/10/2028 | | | 10,000 | (a) | | | 1,035,764 | |
| Exeter Automobile Receivables Trust Series 2020-2A Class R† | | Zero Coupon | | 9/15/2032 | | | 35,000 | | | | 14,953,460 | (b) |
| Exeter Automobile Receivables Trust Series 2021-1A Class R | | Zero Coupon | | 2/15/2033 | | | 16,020 | | | | 9,411,362 | |
| Exeter Automobile Receivables Trust Series 2021-2A Class R | | Zero Coupon | | 7/15/2033 | | | 11,036 | | | | 6,393,552 | |
| Exeter Automobile Receivables Trust Series 2021-4A Class R† | | Zero Coupon | | 12/15/2033 | | | 28,050 | (a) | | | 3,139,788 | |
| Exeter Automobile Receivables Trust Series 2023-1A Class E† | | 12.07% | | 9/16/2030 | | | 14,258,000 | | | | 16,225,189 | |
| Exeter Automobile Receivables Trust Series 2023-2A Class E† | | 9.75% | | 11/15/2030 | | | 27,309,000 | | | | 29,436,068 | |
| Exeter Automobile Receivables Trust Series 2024-2A Class E† | | 7.98% | | 10/15/2031 | | | 15,000,000 | | | | 15,367,932 | |
| Exeter Automobile Receivables Trust Series 2024-3A Class E† | | 7.84% | | 10/15/2031 | | | 10,500,000 | | | | 10,699,205 | |
| Flagship Credit Auto Trust Series 2020-4 Class R† | | Zero Coupon | | 7/17/2028 | | | 17,826 | (a) | | | 1,184,800 | (b) |
| Flagship Credit Auto Trust Series 2023-2 Class E† | | 10.89% | | 7/15/2030 | | | 14,190,000 | | | | 13,808,340 | |
| GLS Auto Receivables Issuer Trust Series 2023-3A Class E† | | 9.27% | | 8/15/2030 | | | 9,950,000 | | | | 10,568,428 | |
| GLS Auto Receivables Issuer Trust Series 2023-4A Class E† | | 9.72% | | 8/15/2030 | | | 10,980,000 | | | | 11,776,496 | |
| GLS Auto Receivables Issuer Trust Series 2024-2A Class E† | | 7.98% | | 5/15/2031 | | | 8,250,000 | | | | 8,424,589 | |
| PenFed Auto Receivables Owner Trust Series 2022-A Class R1† | | 0.01% | | 6/17/2030 | | | 30,000 | | | | 2,903,994 | |
| Santander Bank Auto Credit-Linked Notes Series 2022-A Class E† | | 12.662% | | 5/15/2032 | | | 18,552,015 | | | | 19,696,676 | |
| Santander Bank Auto Credit-Linked Notes Series 2022-B Class G† | | 14.552% | | 8/16/2032 | | | 19,750,000 | | | | 21,335,896 | |
| Santander Bank Auto Credit-Linked Notes Series 2022-C Class E† | | 11.366% | | 12/15/2032 | | | 819,268 | | | | 834,840 | |
| | | |
| | See Notes to Financial Statements. | 5 |
Schedule of Investments (continued)
December 31, 2024
| Investments | | Interest
Rate | | Maturity
Date | | Principal
Amount‡ | | | Fair
Value | |
| Automobiles (continued) | | | | | | | | | | | | |
| Santander Bank Auto Credit-Linked Notes Series 2022-C Class F† | | 14.592% | | 12/15/2032 | | $ | 32,000,000 | | | $ | 34,973,344 | |
| SBNA Auto Receivables Trust Series 2024-A Class E† | | 8.00% | | 4/15/2032 | | | 5,860,000 | | | | 5,916,141 | |
| VStrong Auto Receivables Trust Series 2024-A Class E† | | 10.12% | | 7/15/2031 | | | 33,915,000 | | | | 35,819,656 | |
| Total | | | | | | | | | | | 310,655,240 | |
| | | | | | | | | | | | | |
| Credit Card 1.02% | | | | | | | | | | | | |
| Perimeter Master Note Business Trust | | 5.19% | | 5/15/2027 | | | 5,000,000 | | | | 4,575,961 | |
| Perimeter Master Note Business Trust | | 8.13% | | 5/15/2027 | | | 25,000,000 | | | | 22,560,125 | |
| Total | | | | | | | | | | | 27,136,086 | |
| | | | | | | | | | | | | |
| Other 18.00% | | | | | | | | | | | | |
| 720 East CLO Ltd. Series 2022-1A Class ER† | | 10.254%
(3 mo. USD Term SOFR + 5.90% | )# | 1/20/2038 | | | 7,950,000 | | | | 7,950,000 | |
| 720 East CLO Ltd. Series 2023-2A Class E† | | 13.226%
(3 mo. USD Term SOFR + 8.57% | )# | 10/15/2036 | | | 10,000,000 | | | | 10,366,762 | |
| 720 East CLO V Ltd. Series 2024-2A Class D† | | 8.833%
(3 mo. USD Term SOFR + 3.50% | )# | 7/20/2037 | | | 8,250,000 | | | | 8,416,633 | |
| Affirm Asset Securitization Trust Series 2024-X1 Class CERT† | | Zero Coupon | | 5/15/2029 | | | 149,208 | | | | 6,620,836 | |
| Affirm Asset Securitization Trust Series 2024-X2 Class CERT† | | Zero Coupon | | 12/17/2029 | | | 87,124 | | | | 9,201,532 | |
| AGL CLO 26 Ltd. Series 2023-26A Class E† | | 12.867%
(3 mo. USD Term SOFR + 8.25% | )# | 10/21/2036 | | | 4,160,000 | | | | 4,334,970 | |
| AGL CLO 30 Ltd. Series 2024-30RA Class E† | | 11.367%
(3 mo. USD Term SOFR + 6.75% | )# | 4/21/2037 | | | 13,610,000 | | | | 13,971,158 | |
| AMMC CLO 30 Ltd. Series 2024-30A Class E† | | 12.386%
(3 mo. USD Term SOFR + 7.73% | )# | 1/15/2037 | | | 8,250,000 | | | | 8,533,732 | |
| Apidos CLO XLVIII Ltd. Series 2024-48A Class E† | | 11.065%
(3 mo. USD Term SOFR + 5.75% | )# | 7/25/2037 | | | 4,550,000 | | | | 4,678,821 | |
| ARES LV CLO Ltd. Series 2020-55A Class ER2† | | 11.156%
(3 mo. USD Term SOFR + 6.50% | )# | 10/15/2037 | | | 7,750,000 | | | | 7,849,823 | |
| ARES LXXIV CLO Ltd. Series 2024-74A Class E† | | 10.809%
(3 mo. USD Term SOFR + 6.00% | )# | 10/15/2036 | | | 8,500,000 | | | | 8,668,007 | |
| Avant Loans Funding Trust Series 2021-REV1 Class E† | | 6.41% | | 7/15/2030 | | | 3,931,000 | | | | 3,827,143 | |
| Bain Capital Credit CLO Ltd. Series 2024-4A Class E† | | 10.87%
(3 mo. USD Term SOFR + 6.00% | )# | 10/23/2037 | | | 3,150,000 | | | | 3,232,953 | |
| Bain Capital Credit CLO Ltd. Series 2024-5A Class E† | | 10.76%
(3 mo. USD Term SOFR + 6.15% | )# | 10/21/2037 | | | 4,500,000 | | | | 4,638,784 | |
| | | | | | | | | | | | | |
| 6 | See Notes to Financial Statements. |
Schedule of Investments (continued)
December 31, 2024
| Investments | | Interest
Rate | | Maturity
Date | | Principal
Amount‡ | | | Fair
Value | |
| Other (continued) | | | | | | | | | | | | |
| Ballyrock CLO 20 Ltd. Series 2022-20A Class DR2† | | 10.856%
(3 mo. USD Term SOFR + 6.20% | )# | 10/15/2036 | | $ | 5,370,000 | | | $ | 5,474,121 | |
| Ballyrock CLO 23 Ltd. Series 2023-23A Class C† | | 9.826%
(3 mo. USD Term SOFR + 5.20% | )# | 4/25/2036 | | | 5,950,000 | | | | 6,037,036 | |
| Ballyrock CLO 24 Ltd. Series 2023-24A Class SUB† | | Zero Coupon | #(c) | 7/15/2036 | | | 11,250,000 | | | | 10,442,078 | |
| Ballyrock CLO 26 Ltd. Series 2024-26A Class SUB† | | Zero Coupon | #(c) | 7/25/2037 | | | 8,100,000 | | | | 7,141,439 | |
| Benefit Street Partners CLO XIV Ltd. Series 2018-14A Class D1R† | | 7.836%
(3 mo. USD Term SOFR + 3.25% | )# | 10/20/2037 | | | 11,870,000 | | | | 12,143,506 | |
| Cedar Funding XVIII CLO Ltd. Series 2024-18A Class D† | | 8.526%
(3 mo. USD Term SOFR + 3.90% | )# | 4/23/2037 | | | 13,500,000 | | | | 13,841,279 | |
| CIFC Funding Ltd. Series 2023-2A Class E† | | 12.587%
(3 mo. USD Term SOFR + 7.97% | )# | 1/21/2037 | | | 5,400,000 | | | | 5,610,492 | |
| CIFC Funding Ltd. Series 2024-1A Class D† | | 8.332%
(3 mo. USD Term SOFR + 3.70% | )# | 4/18/2037 | | | 6,750,000 | | | | 6,869,631 | |
| Dryden 115 CLO Ltd. Series 2024-115A Class E† | | 11.732%
(3 mo. USD Term SOFR + 7.10% | )# | 4/18/2037 | | | 9,570,000 | | | | 9,801,624 | |
| Dryden 94 CLO Ltd. Series 2022-94A Class ER† | | 12.756%
(3 mo. USD Term SOFR + 8.10% | )# | 10/15/2037 | | | 10,000,000 | | | | 10,380,311 | |
| Elmwood CLO 20 Ltd. Series 2022-7A Class SUB† | | Zero Coupon | #(c) | 1/17/2037 | | | 25,290,000 | | | | 16,215,734 | |
| Empower CLO Ltd. Series 2024-2A Class E† | | 11.376%
(3 mo. USD Term SOFR + 6.05% | )# | 7/15/2037 | | | 9,540,000 | | | | 9,724,575 | |
| Fairstone Financial Issuance Trust I Series 2020-1A Class D† | | 6.873% | | 10/20/2039 | | CAD | 11,070,000 | | | | 7,625,783 | |
| Generate CLO 13 Ltd. Series 2023-13A Class D1† | | 9.632%
(3 mo. USD Term SOFR + 5.00% | )# | 1/20/2037 | | $ | 7,000,000 | | | | 7,249,555 | |
| Generate CLO 13 Ltd. Series 2023-13A Class E† | | 12.672%
(3 mo. USD Term SOFR + 8.04% | )# | 1/20/2037 | | | 7,000,000 | | | | 7,269,543 | |
| Generate CLO 14 Ltd. Series 2024-14A Class D† | | 8.632%
(3 mo. USD Term SOFR + 4.00% | )# | 4/22/2037 | | | 13,450,000 | | | | 13,809,554 | |
| Generate CLO 15 Ltd. Series 2024-15A Class D† | | 8.367%
(3 mo. USD Term SOFR + 3.75% | )# | 7/20/2037 | | | 3,730,000 | | | | 3,826,638 | |
| Generate CLO 16 Ltd. Series 2024-16A Class E† | | 11.157%
(3 mo. USD Term SOFR + 6.15% | )# | 7/20/2037 | | | 7,375,000 | | | | 7,569,950 | |
| Generate CLO 20 Ltd. Series 2024-20A Class E†(d) | | – | (e) | 1/25/2038 | | | 9,980,000 | | | | 10,029,900 | (b) |
| Generate CLO 3 Ltd. Series 3A Class E2R† | | 12.447%
(3 mo. USD Term SOFR + 7.83% | )# | 10/20/2036 | | | 1,170,000 | | | | 1,213,370 | |
| | | |
| | See Notes to Financial Statements. | 7 |
Schedule of Investments (continued)
December 31, 2024
| Investments | | Interest
Rate | | Maturity
Date | | Principal
Amount‡ | | | Fair
Value | |
| Other (continued) | | | | | | | | | | | | |
| Harmony-Peace Park CLO Ltd. Series 2024-1A Class D1† | | 7.548%
(3 mo. USD Term SOFR + 3.00% | )# | 10/20/2037 | | $ | 9,000,000 | | | $ | 9,110,425 | |
| HINNT LLC Series 2024-A Class D† | | 7.00% | | 3/15/2043 | | | 2,860,701 | | | | 2,804,230 | |
| ICG U.S. CLO Ltd. Series 2024-R1A Class D1† | | 8.204%
(3 mo. USD Term SOFR + 3.65% | )# | 1/25/2038 | | | 10,440,000 | | | | 10,572,188 | |
| KKR CLO 47 Ltd. Series 2024-47A Class E† | | 10.827%
(3 mo. USD Term SOFR + 6.50% | )# | 1/15/2038 | | | 10,330,000 | | | | 10,465,767 | |
| KKR CLO 59 Ltd. Series 2024-56A Class E† | | 11.596%
(3 mo. USD Term SOFR + 6.50% | )# | 10/15/2037 | | | 14,750,000 | | | | 15,314,491 | |
| Lending Funding Trust Series 2020-2A Class D† | | 6.77% | | 4/21/2031 | | | 4,885,000 | | | | 4,720,319 | |
| Madison Park Funding XLVII Ltd. Series 2020-47A Class DR† | | 8.517%
(3 mo. USD Term SOFR + 3.90% | )# | 4/19/2037 | | | 12,500,000 | | | | 12,588,961 | |
| Neuberger Berman Loan Advisers CLO 56 Ltd. Series 2024-56A Class E† | | 11.069%
(3 mo. USD Term SOFR + 5.75% | )# | 7/24/2037 | | | 4,400,000 | | | | 4,462,742 | |
| New Mountain CLO 5 Ltd. Series CLO-5A Class SUB† | | Zero Coupon | #(c) | 4/20/2036 | | | 16,450,000 | (a) | | | 13,416,259 | |
| OCP CLO Ltd. Series 2023-26A Class E† | | 12.898%
(3 mo. USD Term SOFR + 8.25% | )# | 4/17/2036 | | | 3,750,000 | | | | 3,818,904 | |
| OCP CLO Ltd. Series 2023-26A Class SUB† | | Zero Coupon | #(c) | 4/17/2036 | | | 22,000,000 | | | | 21,060,225 | (b) |
| OHA Credit Funding 14 Ltd. Series 2023-14A Class E† | | 12.367%
(3 mo. USD Term SOFR + 7.75% | )# | 4/20/2036 | | | 4,715,000 | | | | 4,803,370 | |
| Pagaya AI Debt Selection Trust Series 2020-1 Class CERT†(f) | | Zero Coupon | | 7/15/2027 | | | 2,000,000 | (a) | | | 81,078 | (b) |
| Pagaya AI Debt Selection Trust Series 2021-1 Class CERT†(f) | | Zero Coupon | #(c) | 11/15/2027 | | | 2,153,846 | (a) | | | 3,029 | |
| Rad CLO 20 Ltd. Series 2023-20A Class D† | | 9.617%
(3 mo. USD Term SOFR + 5.00% | )# | 7/20/2036 | | | 6,500,000 | | | | 6,643,460 | |
| Rad CLO 20 Ltd. Series 2023-20A Class E† | | 12.697%
(3 mo. USD Term SOFR + 8.08% | )# | 7/20/2036 | | | 11,250,000 | | | | 11,598,242 | |
| Rad CLO 22 Ltd. Series 2023-22A Class SUB† | | Zero Coupon | #(c) | 1/20/2037 | | | 18,914,000 | | | | 13,997,376 | |
| Rad CLO 23 Ltd. Series 2024-23A Class E† | | 11.367%
(3 mo. USD Term SOFR + 6.75% | )# | 4/20/2037 | | | 4,900,000 | | | | 5,017,944 | |
| SCF Equipment Leasing LLC Series 2022-2A Class F1† | | 6.50% | | 6/20/2035 | | | 42,622,000 | | | | 40,914,115 | |
| Sierra Timeshare Receivables Funding LLC Series 2024-2A Class D† | | 7.48% | | 6/20/2041 | | | 1,268,359 | | | | 1,273,857 | |
| Silver Point CLO 1 Ltd. Series 2022-1A Class ER†(d) | | – | (e) | 1/20/2038 | | | 2,725,000 | | | | 2,724,915 | |
| | |
| 8 | See Notes to Financial Statements. |
Schedule of Investments (continued)
December 31, 2024
| Investments | | Interest
Rate | | Maturity
Date | | Principal
Amount‡ | | | Fair
Value | |
| Other (continued) | | | | | | | | | | | | |
| Sycamore Tree CLO Ltd. Series 2023-3A Class D1R† | | 8.867%
(3 mo. USD Term SOFR + 4.25% | )# | 4/20/2037 | | $ | 9,750,000 | | | $ | 10,032,341 | |
| Total | | | | | | | | | | | 479,991,511 | |
| | | | | | | | | | | | | |
| Student Loan 0.03% | | | | | | | | | | | | |
| Laurel Road Prime Student Loan Trust Series 2019-A Class R† | | Zero Coupon | | 10/25/2048 | | | 2,450,622 | | | | 700,633 | |
| Total Asset-Backed Securities (cost $846,247,273) | | | | | | | | | 818,483,470 | |
| | | | | | | | | | | | | |
| | | | | | | | Shares | | | | | |
| | | | | | | | | | | | | |
| COMMON STOCKS 0.02% | | | | | | | | | | | | |
| | | | | | | | | | | | | |
| Real Estate Management & Development 0.01% | | | | | | | | | | |
| Sunac China Holdings Ltd.*(g) | | | | | | | 1,117,897 | | | | 329,358 | |
| | | | | | | | | | | | | |
| Transportation Infrastructure 0.01% | | | | | | | | | | | | |
| ACBL Holdings Corp.* | | | | | | | 2,785 | | | | 139,250 | |
| Total Common Stocks (cost $437,350) | | | | | | | | | | | 468,608 | |
| | | | | | | | | | | | | |
| | | | | | | | Principal Amount‡ | | | | | |
| | | | | | | | | | | | | |
| CONVERTIBLE BONDS 0.85% | | | | | | | | | | | | |
| | | | | | | | | | | | | |
| Commercial Services 0.25% | | | | | | | | | | | | |
| Affirm Holdings, Inc.† | | 0.75% | | 12/15/2029 | | $ | 6,801,000 | | | | 6,554,238 | |
| | | | | | | | | | | | | |
| Equity Real Estate 0.22% | | | | | | | | | | | | |
| Sunac China Holdings Ltd. (China)†(h)(k) | | Zero Coupon | | 9/30/2028 | | | 18,058,440 | | | | 5,832,424 | |
| | | | | | | | | | | | | |
| Oil & Gas 0.38% | | | | | | | | | | | | |
| Nabors Industries, Inc. | | 1.75% | | 6/15/2029 | | | 14,000,000 | | | | 10,193,400 | |
| Total Convertible Bonds (cost $29,857,910) | | | | | | | | | | | 22,580,062 | |
| | | | | | | | | | | | | |
| CORPORATE BONDS 51.30% | | | | | | | | | | | | |
| | | | | | | | | | | | | |
| Aerospace/Defense 1.07% | | | | | | | | | | | | |
| Spirit AeroSystems, Inc.(i) | | 4.60% | | 6/15/2028 | | | 30,103,000 | | | | 28,569,422 | |
| | | | | | | | | | | | | |
| Airlines 1.22% | | | | | | | | | | | | |
| VistaJet Malta Finance PLC/Vista Management Holding, Inc. (Malta)†(h) | | 6.375% | | 2/1/2030 | | | 37,096,000 | | | | 32,453,025 | |
| | | |
| | See Notes to Financial Statements. | 9 |
Schedule of Investments (continued)
December 31, 2024
| Investments | | Interest
Rate | | Maturity
Date | | Principal
Amount‡ | | | Fair
Value | |
| Auto Parts & Equipment 0.61% | | | | | | | | | | | | |
| Mahle GmbH | | 6.50% | | 5/2/2031 | | EUR | 15,940,000 | | | $ | 16,264,805 | |
| | | | | | | | | | | | | |
| Building Materials 3.20% | | | | | | | | | | | | |
| ACProducts Holdings, Inc.† | | 6.375% | | 5/15/2029 | | $ | 61,992,000 | | | | 39,406,877 | |
| Cornerstone Building Brands, Inc.†(i) | | 6.125% | | 1/15/2029 | | | 57,439,000 | | | | 45,890,291 | |
| Total | | | | | | | | | | | 85,297,168 | |
| | | | | | | | | | | | | |
| Chemicals 2.20% | | | | | | | | | | | | |
| ASP Unifrax Holdings, Inc.† | | 7.10% | | 9/30/2029 | | | 1,947,122 | | | | 1,285,100 | |
| ASP Unifrax Holdings, Inc.† | | 10.425% | | 9/30/2029 | | | 36,879,473 | | | | 37,373,289 | |
| Herens Midco SARL | | 5.25% | | 5/15/2029 | | EUR | 23,205,000 | | | | 20,039,708 | |
| Total | | | | | | | | | | | 58,698,097 | |
| | | | | | | | | | | | | |
| Commercial Services 3.78% | | | | | | | | | | | | |
| BCP V Modular Services Finance PLC | | 6.75% | | 11/30/2029 | | EUR | 47,589,000 | | | | 44,796,879 | |
| EquipmentShare.com, Inc.† | | 8.625% | | 5/15/2032 | | $ | 12,617,000 | | | | 13,201,148 | |
| EquipmentShare.com, Inc.† | | 9.00% | | 5/15/2028 | | | 41,028,000 | | | | 42,611,189 | |
| Total | | | | | | | | | | | 100,609,216 | |
| | | | | | | | | | | | | |
| Diversified Financial Services 1.62% | | | | | | | | | | | | |
| Osaic Holdings, Inc.† | | 10.75% | | 8/1/2027 | | | 14,113,000 | | | | 14,645,427 | |
| SCF Preferred Equity LLC† | | 7.50%
(5 yr. CMT + 6.73% | )# | – | (j) | | 29,000,000 | | | | 28,492,500 | |
| Total | | | | | | | | | | | 43,137,927 | |
| | | | | | | | | | | | | |
| Holding Companies-Diversified 0.30% | | | | | | | | | | | | |
| Benteler International AG (Austria)†(h) | | 10.50% | | 5/15/2028 | | | 7,657,000 | | | | 8,057,154 | |
| | | | | | | | | | | | | |
| Media 4.10% | | | | | | | | | | | | |
| AMC Networks, Inc. | | 4.25% | | 2/15/2029 | | | 40,848,000 | | | | 32,109,755 | |
| CSC Holdings LLC† | | 4.625% | | 12/1/2030 | | | 44,140,000 | | | | 23,112,927 | |
| CSC Holdings LLC†(i) | | 5.75% | | 1/15/2030 | | | 4,800,000 | | | | 2,736,083 | |
| DISH DBS Corp. | | 5.125% | | 6/1/2029 | | | 34,160,000 | | | | 22,020,887 | |
| Gray Television, Inc.†(i) | | 5.375% | | 11/15/2031 | | | 54,649,000 | | | | 29,205,982 | |
| Total | | | | | | | | | | | 109,185,634 | |
| | | | | | | | | | | | | |
| Oil & Gas 23.48% | | | | | | | | | | | | |
| Baytex Energy Corp. (Canada)†(h) | | 7.375% | | 3/15/2032 | | | 9,229,000 | | | | 9,001,139 | |
| Comstock Resources, Inc.† | | 5.875% | | 1/15/2030 | | | 59,554,000 | | | | 55,597,216 | |
| Crescent Energy Finance LLC† | | 7.375% | | 1/15/2033 | | | 12,890,000 | | | | 12,530,417 | |
| Crescent Energy Finance LLC† | | 7.625% | | 4/1/2032 | | | 41,749,000 | | | | 41,572,788 | |
| Encino Acquisition Partners Holdings LLC† | | 8.75% | | 5/1/2031 | | | 39,021,000 | | | | 41,208,400 | |
| | |
| 10 | See Notes to Financial Statements. |
Schedule of Investments (continued)
December 31, 2024
| Investments | | Interest
Rate | | Maturity
Date | | Principal
Amount‡ | | | Fair
Value | |
| Oil & Gas (continued) | | | | | | | | | | | | |
| Hilcorp Energy I LP/Hilcorp Finance Co.† | | 7.25% | | 2/15/2035 | | $ | 27,968,000 | | | $ | 26,318,321 | |
| Kosmos Energy Ltd.† | | 7.50% | | 3/1/2028 | | | 9,136,000 | | | | 8,661,546 | |
| Kraken Oil & Gas Partners LLC† | | 7.625% | | 8/15/2029 | | | 44,760,000 | | | | 43,124,026 | |
| Moss Creek Resources Holdings, Inc.† | | 8.25% | | 9/1/2031 | | | 59,065,000 | | | | 58,022,928 | |
| Nabors Industries Ltd.†(i) | | 7.50% | | 1/15/2028 | | | 33,982,000 | | | | 31,499,177 | |
| Nabors Industries, Inc.†(i) | | 8.875% | | 8/15/2031 | | | 13,580,000 | | | | 12,623,783 | |
| Saturn Oil & Gas, Inc. (Canada)†(h)(i) | | 9.625% | | 6/15/2029 | | | 48,496,000 | | | | 47,191,932 | |
| Shelf Drilling Holdings Ltd. (United Arab Emirates)†(h)(i) | | 9.625% | | 4/15/2029 | | | 58,475,000 | | | | 49,391,446 | |
| SM Energy Co.† | | 7.00% | | 8/1/2032 | | | 7,771,000 | | | | 7,669,182 | |
| TGNR Intermediate Holdings LLC† | | 5.50% | | 10/15/2029 | | | 43,160,000 | | | | 40,342,632 | |
| Transocean, Inc. | | 7.50% | | 4/15/2031 | | | 69,235,000 | | | | 63,416,529 | |
| Valaris Ltd.† | | 8.375% | | 4/30/2030 | | | 17,487,000 | | | | 17,688,345 | |
| Vital Energy, Inc.† | | 7.875% | | 4/15/2032 | | | 62,375,000 | | | | 60,077,166 | |
| Total | | | | | | | | | | | 625,936,973 | |
| | | | | | | | | | | | | |
| Oil & Gas Services 0.85% | | | | | | | | | | | | |
| Nine Energy Service, Inc. | | 13.00% | | 2/1/2028 | | | 26,937,000 | | | | 17,554,978 | |
| Oceaneering International, Inc. | | 6.00% | | 2/1/2028 | | | 5,238,000 | | | | 5,171,387 | |
| Total | | | | | | | | | | | 22,726,365 | |
| | | | | | | | | | | | | |
| Real Estate 0.23% | | | | | | | | | | | | |
| CIFI Holdings Group Co. Ltd. (China)(h)(k) | | 4.375% | | 4/12/2027 | | | 2,000,000 | | | | 257,500 | |
| CIFI Holdings Group Co. Ltd. (China)(h)(k) | | 5.25% | | 5/13/2026 | | | 1,800,000 | | | | 236,250 | |
| CIFI Holdings Group Co. Ltd. (China)(h)(k) | | 6.00% | | 7/16/2025 | | | 7,000,000 | | | | 896,000 | |
| Logan Group Co. Ltd. (China)(h)(k) | | 4.50% | | 1/13/2028 | | | 4,000,000 | | | | 387,000 | |
| Logan Group Co. Ltd. (China)(h)(k) | | 5.25% | | 2/23/2023 | | | 8,000,000 | | | | 780,000 | |
| Shimao Group Holdings Ltd. (Hong Kong)(h)(k) | | 3.45% | | 1/11/2031 | | | 7,277,000 | | | | 481,737 | |
| Shimao Group Holdings Ltd. (Hong Kong)(h)(k) | | 5.20% | | 1/16/2027 | | | 26,223,000 | | | | 2,032,283 | |
| Sunac China Holdings Ltd. (China)†(h)(k) | | 6.00% | | 9/30/2026 | | | 756,460 | | | | 113,469 | |
| Sunac China Holdings Ltd. (China)†(h)(k) | | 6.25% | | 9/30/2027 | | | 758,297 | | | | 109,953 | |
| Sunac China Holdings Ltd. (China)†(h)(k) | | 6.50% | | 9/30/2027 | | | 1,520,277 | | | | 206,195 | |
| Sunac China Holdings Ltd. (China)†(h)(k) | | 6.75% | | 9/30/2028 | | | 2,285,942 | | | | 292,308 | |
| Sunac China Holdings Ltd. (China)†(h)(k) | | 7.00% | | 9/30/2029 | | | 2,291,474 | | | | 276,982 | |
| Sunac China Holdings Ltd. (China)†(h)(k) | | 7.25% | | 9/30/2030 | | | 1,079,008 | | | | 124,161 | |
| Total | | | | | | | | | | | 6,193,838 | |
| | | | | | | | | | | | | |
| Retail 7.29% | | | | | | | | | | | | |
| Foundation Building Materials, Inc.†(i) | | 6.00% | | 3/1/2029 | | | 53,662,000 | | | | 47,371,944 | |
| GPS Hospitality Holding Co. LLC/GPS Finco, Inc.† | | 7.00% | | 8/15/2028 | | | 50,275,000 | | | | 30,975,209 | |
| | | |
| | See Notes to Financial Statements. | 11 |
Schedule of Investments (continued)
December 31, 2024
| Investments | | Interest
Rate | | Maturity
Date | | Principal
Amount‡ | | | Fair
Value | |
| Retail (continued) | | | | | | | | | | | | |
| LBM Acquisition LLC†(i) | | 6.25% | | 1/15/2029 | | $ | 57,112,000 | | | $ | 52,591,666 | |
| Park River Holdings, Inc.† | | 5.625% | | 2/1/2029 | | | 49,109,000 | | | | 42,701,936 | |
| Park River Holdings, Inc.† | | 6.75% | | 8/1/2029 | | | 23,640,000 | | | | 20,784,099 | |
| Total | | | | | | | | | | | 194,424,854 | |
| | | | | | | | | | | | | |
| Telecommunications 1.35% | | | | | | | | | | | | |
| Hughes Satellite Systems Corp. | | 6.625% | | 8/1/2026 | | | 45,270,000 | | | | 36,047,790 | |
| Total Corporate Bonds (cost $1,422,848,160) | | | | | | | | | | | 1,367,602,268 | |
| | | | | | | | | | | | | |
| FLOATING RATE LOANS(l) 3.66% | | | | | | | | | | | | |
| | | | | | | | | | | | | |
| Aerospace/Defense 1.10% | | | | | | | | | | | | |
| Alloy Finco Ltd. USD Holdco PIK Term Loan 13.50% (Jersey)(h) | | – | (e) | 3/6/2025 | | | 24,372,000 | | | | 29,327,559 | |
| | | | | | | | | | | | | |
| Chemicals 0.30% | | | | | | | | | | | | |
| ASP Unifrax Holdings, Inc. 2024 Delayed Draw Term Loan(m) | | – | (e) | 9/28/2029 | | | 8,002,695 | | | | 7,895,979 | |
| | | | | | | | | | | | | |
| Cosmetics/Personal Care 0.70% | | | | | | | | | | | | |
| Conair Holdings LLC Term Loan B | | – | (e) | 5/17/2028 | | | 20,586,165 | | | | 18,590,130 | |
| | | | | | | | | | | | | |
| Gaming/Leisure 0.53% | | | | | | | | | | | | |
| 888 Acquisitions Ltd. USD Term Loan B (United Kingdom)(h) | | 9.495%
(6 mo. USD Term SOFR + 5.25% | ) | 7/1/2028 | | | 14,746,045 | | | | 14,271,443 | |
| | | | | | | | | | | | | |
| Retail 0.64% | | | | | | | | | | | | |
| Kodiak Building Partners, Inc. 2024 Term Loan B | | 8.132%
(1 mo. USD Term SOFR + 3.75% | ) | 11/26/2031 | | | 17,092,800 | | | | 17,126,387 | |
| | | | | | | | | | | | | |
| Telecommunications 0.16% | | | | | | | | | | | | |
| Connect Finco SARL 2024 Extended Term Loan B (Luxembourg)(h) | | 8.857%
(1 mo. USD Term SOFR + 4.50% | ) | 9/27/2029 | | | 4,832,857 | | | | 4,256,950 | |
| | | | | | | | | | | | | |
| Transportation 0.23% | | | | | | | | | | | | |
| PODS LLC 2021 Term Loan B | | 7.847%
(3 mo. USD Term SOFR + 4.00% | ) | 3/31/2028 | | | 6,466,750 | | | | 6,068,463 | |
| Total Floating Rate Loans (cost $97,609,429) | | | | | | | | | | | 97,536,911 | |
| | |
| 12 | See Notes to Financial Statements. |
Schedule of Investments (continued)
December 31, 2024
| Investments | | | | | | Shares | | | Fair
Value | |
| INVESTMENTS IN UNDERLYING FUNDS 2.29% | | | | | | | | | | | | |
Lord Abbett Private Credit Fund(n)(o)(s)
(cost $40,750,000) | | | | | | | 1,628,231 | | | $ | 41,161,682 | |
Lord Abbett Private Credit Fund A, LP(n)(o)
(cost $19,751,111) | | | | | | | 19,751,111 | (p) | | | 19,751,111 | |
| Total Investments in Underlying Funds (cost $60,501,111) | | | | | | | | | | 60,912,793 | |
| | | | | | | | | | | | | |
| | | Interest
Rate | | Maturity
Date | | | Principal
Amount‡ | | | | | |
| | | | | | | | | | | | | |
| NON-AGENCY COMMERCIAL MORTGAGE-BACKED SECURITIES 0.13% | | | | | | | | |
| JP Morgan Chase Commercial Mortgage Securities Trust Series 2014-DSTY Class D†(k) | | 3.805% | #(q) | 6/10/2027 | | $ | 614,619 | | | | 12,820 | |
| JP Morgan Chase Commercial Mortgage Securities Trust Series 2021-BOLT Class D†(k) | 11.212%
(1 mo. USD Term SOFR + 6.81% | )# | 8/15/2033 | | | 15,790,000 | (a) | | | 3,480,759 | |
| Palisades Center Trust Series 2016-PLSD Class D† | | 4.737% | | 4/13/2033 | | | 225,000 | | | | 3,527 | |
| Total Non-Agency Commercial Mortgage-Backed Securities (cost $16,524,204) | | | | | | | | | 3,497,106 | |
| | | | | | | | | | | | | |
| | | Dividend
Rate | | | | | Shares | | | | | |
| | | | | | | | | | | | | |
| PREFERRED STOCKS 0.04% | | | | | | | | | | | | |
| | | | | | | | | | | | | |
| Transportation Infrastructure 0.04% | | | | | | | | | | | | |
| ACBL Holdings Corp. (cost $397,275) | | Zero Coupon | | | | | 15,891 | | | | 1,024,970 | |
| | | | | | | | | | | | | |
| | | Exercise
Price | | Expiration
Date | | | | | | | | |
| | | | | | | | | | | | | |
| WARRANTS 0.00% | | | | | | | | | | | | |
| | | | | | | | | | | | | |
| Specialty Retail 0.00% | | | | | | | | | | | | |
Chinos Intermediate Holdings A, Inc.*
(cost $34,899) | | $3.20 | | 12/31/2099 | | | 9,971 | | | | 23,058 | |
| Total Long-Term Investments (cost $2,474,457,611) | | | | | | | | | | | 2,372,129,246 | |
| | | | | | | | | | | | | |
| Investments | | Interest
Rate | | Maturity
Date | | | Principal
Amount‡ | | | | | |
| | | | | | | | | | | | | |
| SHORT-TERM INVESTMENTS 13.96% | | | | | | | | | | | | |
| | | | | | | | | | | | | |
| COMMERCIAL PAPER 3.55% | | | | | | | | | | | | |
| | | | | | | | | | | | | |
| Chemicals 1.55% | | | | | | | | | | | | |
| FMC Corp.† | | 4.969% | | 1/2/2025 | | $ | 41,200,000 | | | | 41,200,000 | |
| | | |
| | See Notes to Financial Statements. | 13 |
Schedule of Investments (continued)
December 31, 2024
| Investments | | Interest
Rate | | Maturity
Date | | Principal
Amount‡ | | | Fair
Value | |
| Electronics 0.74% | | | | | | | | | | | | |
| Jabil, Inc.† | | 4.901% | | 1/6/2025 | | $ | 13,500,000 | | | $ | 13,492,755 | |
| Jabil, Inc.† | | 4.93% | | 1/7/2025 | | | 6,300,000 | | | | 6,295,739 | |
| Total | | | | | | | | | | | 19,788,494 | |
| | | | | | | | | | | | | |
| Home Furnishings 0.32% | | | | | | | | | | | | |
| Leggett & Platt, Inc.† | | 4.992% | | 1/6/2025 | | | 8,500,000 | | | | 8,495,372 | |
| | | | | | | | | | | | | |
| Pharmaceuticals 0.94% | | | | | | | | | | | | |
| CVS Health Corp.† | | 5.025% | | 1/2/2025 | | | 25,000,000 | | | | 25,000,000 | |
| Total Commercial Paper (cost $94,471,000) | | | | | | | | | | | 94,483,866 | |
| | | | | | | | | | | | | |
| REPURCHASE AGREEMENTS 8.58% | | | | | | | | | | | | |
Repurchase Agreement dated 12/31/2024, 2.050% due 1/2/2025 with Fixed Income Clearing Corp. collateralized by $19,215,200 of U.S. Treasury Note at 4.250% due 12/31/2026; value: $19,213,739; proceeds: $18,839,066
(cost $18,836,920) | | | | | | | 18,836,920 | | | | 18,836,920 | |
Repurchase Agreement dated 12/31/2024, 4.450% due 1/2/2025 with JPMorgan Securities LLC collateralized by $233,333,400 of U.S. Treasury Bond at 2.750% due 8/15/2032; value: $210,000,000; proceeds: $210,051,917
(cost $210,000,000) | | | | | | | 210,000,000 | | | | 210,000,000 | |
| Total Repurchase Agreements (cost $228,836,920) | | | | | | | | | | | 228,836,920 | |
| | | | | | | | | | | | | |
| TIME DEPOSITS 0.18% | | | | | | | | | | | | |
| CitiBank N.A.(r) (cost $4,894,996) | | | | | | | 4,894,996 | | | | 4,894,996 | |
| | | | | | | | | | | | | |
| | | | | | | | Shares | | | | | |
| | | | | | | | | | | | | |
| MONEY MARKET FUNDS 1.65% | | | | | | | | | | | | |
| Fidelity Government Portfolio(r) (cost $44,054,960) | | | | | | | 44,054,960 | | | | 44,054,960 | |
| Total Short-Term Investments (cost $372,257,876) | | | | | | | | | | | 372,270,742 | |
| Total Investments in Securities 102.95% (cost $2,846,715,487) | | | | | | | | | | | 2,744,399,988 | |
| Less Unfunded Loan Commitments (0.30%) (cost $8,002,695) | | | | | | | | | | | (7,895,979 | ) |
| Net Investments in Securities 102.65% (cost $2,838,712,792) | | | | | | | | | | | 2,736,504,009 | |
| Other Assets and Liabilities – Net(t) (2.65)% | | | | | | | | | | | (70,737,314 | ) |
| Net Assets 100.00% | | | | | | | | | | $ | 2,665,766,695 | |
| CAD | | Canadian Dollar. |
| EUR | | Euro. |
| CMT | | Constant Maturity Rate. |
| PIK | | Payment-in-kind. |
| SOFR | | Secured Overnight Financing Rate. |
| ‡ | | Principal Amount is denominated in U.S. dollars unless otherwise noted. |
| 14 | See Notes to Financial Statements. |
Schedule of Investments (continued)
December 31, 2024
| † | | Security was purchased pursuant to Rule 144A under the Securities Act of 1933 and, unless registered under such Act or exempted from registration, may only be resold to qualified institutional buyers. At December 31, 2024, the total value of Rule 144A securities was $1,962,449,462, which represents 73.62% of net assets. |
| # | | Variable rate security. The interest rate represents the rate in effect at December 31, 2024. |
| * | | Non-income producing security. |
| (a) | | Principal amount represents ownership shares of the Trust. |
| (b) | | Level 3 Investment as described in Note 2(o) in the Notes to Financial Statements. Security valued utilizing third party pricing information without adjustment. Such valuations are based on unobservable inputs. A significant change in third party information could result in a significantly lower or higher value of such Level 3 investments. |
| (c) | | Variable Rate is Fixed to Float: Rate remains fixed or at Zero Coupon until designated future date. |
| (d) | | Securities purchased on a when-issued basis (See Note 2(o)). |
| (e) | | Interest Rate to be determined. |
| (f) | | Interest-only security. The principal amount shown is a notional amount representing the outstanding principal of the underlying debt obligation(s). Holders of interest only securities do not receive principal payments on the underlying debt obligation(s). |
| (g) | | Investment in non-U.S. dollar denominated securities. |
| (h) | | Foreign security traded in U.S. dollars. |
| (i) | | All or a portion of this security is temporarily on loan to unaffiliated broker/dealers. |
| (j) | | Security is perpetual in nature and has no stated maturity. |
| (k) | | Defaulted (non-income producing security). |
| (l) | | Floating Rate Loans in which the Fund invests generally pay interest at rates which are periodically re-determined at a margin above the SOFR or the prime rate offered by major U.S. banks. The rate(s) shown is the rate(s) in effect at December 31, 2024. |
| (m) | | Security partially/fully unfunded. See Note 2(m). |
| (n) | | Affiliated funds (See Note 12). |
| (o) | | Restricted securities (including private placement) - investments in securities not registered under the Securities Act of 1933 (excluding 144A issues). At December 31, 2024, the value of restricted securities (excluding 144A issues) amounted to $60,912,793 or 2.29% of net assets. |
| (p) | | Shares represent partnership interest. |
| (q) | | Interest rate is based on the weighted average interest rates of the underlying mortgages within the mortgage pool. |
| (r) | | Security was purchased with the cash collateral from loaned securities. |
| (s) | | Fund is a business development company (“BDC”) under the Investment Company Act of 1940. |
| (t) | | Other Assets and Liabilities – Net include net unrealized appreciation/depreciation on forward foreign currency exchange contracts and swap contracts as follows: |
| | | |
Centrally Cleared Credit Default Swap Contracts on Indexes/Issuers - Buy Protection at December 31, 2024(1):
Referenced
Indexes/Issuers | | Central
Clearing
Party | | Fund Pays
(Quarterly) | | Termination
Date | | Notional
Amount | | Payments
Upfront(2) | | | Unrealized
Appreciation/
(Depreciation)(3) | | | Value | |
| CCO Holdings LLC/CCO Holdings Capital Corp.(4) | | Bank of America | | 5.00% | | 6/20/2029 | | $20,000,000 | | $ | (1,856,454 | ) | | | $ (653,584 | ) | | $ | (2,510,038 | ) |
| CCO Holdings LLC/CCO Holdings Capital Corp.(4) | | Bank of America | | 5.00% | | 12/20/2029 | | 9,700,000 | | | (940,725 | ) | | | (315,409 | ) | | | (1,256,134 | ) |
| Federal Republic of Germany(4) | | Bank of America | | 0.25% | | 12/20/2026 | | 35,000,000 | | | (66,355 | ) | | | (58,732 | ) | | | (125,087 | ) |
| Federal Republic of Germany(4) | | Bank of America | | 0.25% | | 12/20/2027 | | 10,000,000 | | | (9,359 | ) | | | (38,038 | ) | | | (47,397 | ) |
| General Motors Co.(4) | | Bank of America | | 5.00% | | 12/20/2028 | | 5,000,000 | | | (498,125 | ) | | | (267,291 | ) | | | (765,416 | ) |
| | | | | | | | | | | $ | (3,371,018 | ) | | | $(1,333,054 | ) | | $ | (4,704,072 | ) |
| | See Notes to Financial Statements. | 15 |
Schedule of Investments (continued)
December 31, 2024
Centrally Cleared Credit Default Swap Contracts on Indexes/Issuers - Sell Protection at December 31, 2024(1):
Referenced
Indexes/Issuers | | Central
Clearing
Party | | Fund
Receives
(Quarterly) | | Termination
Date | | Notional
Amount | | Payments
Upfront(2) | | | Unrealized
Appreciation/
(Depreciation)(3) | | | Value | |
| CDX.NA.HY.S43(4) | | Bank of America | | 5.00% | | 12/20/2029 | | $121,434,000 | | $ | 9,452,931 | | | | $(107,565 | ) | | $ | 9,345,366 | |
| (1) | | If the Fund is a buyer of protection and a credit event occurs, as defined under the terms of that particular swap contract agreement, the Fund will either (i) receive from the seller of protection an amount equal to the notional amount of the swap contracts and make delivery of the referenced obligation or underlying securities comprising the referenced index or (ii) receive a net settlement amount in the form of cash or securities equal to the notional amount of the swap contracts less the recovery value of the referenced obligation or underlying securities. If the Fund is a seller of protection and a credit event occurs, as defined under the terms of that particular swap contract agreement, the Fund will either (i) pay to the buyer of protection an amount equal to the notional amount of the swap contracts and take delivery of the referenced obligation or underlying securities comprising the referenced index or (ii) pay a net settlement amount in the form of cash or securities equal to the notional amount of the swap contracts less the recovery value of the referenced obligation or underlying securities. |
| (2) | | Upfront payments paid (received) by Central Clearing Party are presented net of amortization. |
| (3) | | Total unrealized appreciation on Credit Default Swap Contracts on Indexes/Issuers amounted to $0. Total unrealized depreciation on Credit Default Swap Contracts on Indexes/Issuers amounted to $1,440,619. |
| (4) | | Central Clearinghouse: Intercontinental Exchange (ICE). |
Forward Foreign Currency Exchange Contracts at December 31, 2024:
Forward
Foreign
Currency
Exchange
Contracts | | Transaction
Type | | Counterparty | | Expiration
Date | | Foreign
Currency | | U.S. $
Cost on
Origination
Date | | | U.S. $
Current
Value | | | Unrealized
Appreciation | |
| Canadian dollar | | Sell | | Morgan Stanley | | 3/7/2025 | | 10,950,000 | | $ | 7,861,913 | | | $ | 7,635,661 | | | | $ | 226,252 | |
| Euro | | Sell | | State Street Bank and Trust | | 2/20/2025 | | 76,817,000 | | | 81,752,877 | | | | 79,730,515 | | | | | 2,022,362 | |
| Euro | | Sell | | State Street Bank and Trust | | 2/20/2025 | | 8,093,000 | | | 8,565,199 | | | | 8,399,951 | | | | | 165,248 | |
| Euro | | Sell | | State Street Bank and Trust | | 2/20/2025 | | 3,141,000 | | | 3,297,030 | | | | 3,260,132 | | | | | 36,898 | |
| Euro | | Sell | | State Street Bank and Trust | | 2/20/2025 | | 8,128,000 | | | 8,445,886 | | | | 8,436,279 | | | | | 9,607 | |
| Total Unrealized Appreciation on Forward Foreign Currency Exchange Contracts | | | | | | | | | | $ | 2,460,367 | |
Forward
Foreign
Currency
Exchange
Contracts | | Transaction
Type | | Counterparty | | Expiration
Date | | Foreign
Currency | | U.S. $
Cost on
Origination
Date | | | U.S. $
Current
Value | | | Unrealized
Depreciation | |
| Euro | | Buy | | Bank of America | | 2/20/2025 | | 4,844,000 | | $ | 5,135,340 | | | $ | 5,027,723 | | | | $ | (107,617 | ) |
| Euro | | Buy | | Citibank | | 2/20/2025 | | 2,748,000 | | | 2,901,634 | | | | 2,852,226 | | | | | (49,408 | ) |
| Euro | | Buy | | Morgan Stanley | | 2/20/2025 | | 551,000 | | | 579,903 | | | | 571,898 | | | | | (8,005 | ) |
| Euro | | Buy | | State Street Bank and Trust | | 2/20/2025 | | 2,715,000 | | | 2,874,343 | | | | 2,817,975 | | | | | (56,368 | ) |
| Euro | | Buy | | Toronto Dominion Bank | | 2/20/2025 | | 9,673,000 | | | 10,275,418 | | | | 10,039,878 | | | | | (235,540 | ) |
| Total Unrealized Depreciation on Forward Foreign Currency Exchange Contracts | | | | | | | | | | | $ | (456,938 | ) |
| 16 | See Notes to Financial Statements. |
Schedule of Investments (continued)
December 31, 2024
The following is a summary of the inputs used as of December 31, 2024 in valuing the Fund’s investments carried at fair value(1):
| Investment Type(2) | | Level 1 | | | Level 2 | | | Level 3 | | | Total | |
| Long-Term Investments | | | | | | | | | | | | | | | | |
| Asset-Backed Securities | | | | | | | | | | | | | | | | |
| Automobiles | | $ | – | | | $ | 294,516,980 | | | $ | 16,138,260 | | | $ | 310,655,240 | |
| Other | | | – | | | | 448,820,308 | | | | 31,171,203 | | | | 479,991,511 | |
| Remaining Industries | | | – | | | | 27,836,719 | | | | – | | | | 27,836,719 | |
| Common Stocks | | | – | | | | 468,608 | | | | – | | | | 468,608 | |
| Convertible Bonds | | | – | | | | 22,580,062 | | | | – | | | | 22,580,062 | |
| Corporate Bonds | | | – | | | | 1,367,602,268 | | | | – | | | | 1,367,602,268 | |
| Floating Rate Loans | | | – | | | | 97,536,911 | | | | – | | | | 97,536,911 | |
| Less Unfunded Loan Commitments | | | – | | | | (7,895,979 | ) | | | – | | | | (7,895,979 | ) |
| Investments in Underlying Funds | | | – | | | | 60,912,793 | | | | – | | | | 60,912,793 | |
| Non-Agency Commercial Mortgage-Backed Securities | | | – | | | | 3,497,106 | | | | – | | | | 3,497,106 | |
| Preferred Stocks | | | – | | | | 1,024,970 | | | | – | | | | 1,024,970 | |
| Warrants | | | – | | | | 23,058 | | | | – | | | | 23,058 | |
| Short-Term Investments | | | | | | | | | | | | | | | | |
| Commercial Paper | | | – | | | | 94,483,866 | | | | – | | | | 94,483,866 | |
| Repurchase Agreements | | | – | | | | 228,836,920 | | | | – | | | | 228,836,920 | |
| Time Deposits | | | – | | | | 4,894,996 | | | | – | | | | 4,894,996 | |
| Money Market Funds | | | 44,054,960 | | | | – | | | | – | | | | 44,054,960 | |
| Total | | $ | 44,054,960 | | | $ | 2,645,139,586 | | | $ | 47,309,463 | | | $ | 2,736,504,009 | |
| | | | | | | | | | | | | | | | | |
| Other Financial Instruments | | | | | | | | | | | | | | | | |
| Centrally Cleared Credit Default Swap Contracts | | | | | | | | | | | | | |
| Assets | | $ | – | | | $ | 9,345,366 | | | $ | – | | | $ | 9,345,366 | |
| Liabilities | | | – | | | | (4,704,072 | ) | | | – | | | | (4,704,072 | ) |
| Forward Foreign Currency Exchange Contracts | | | | | | | | | | | | | |
| Assets | | | – | | | | 2,460,367 | | | | – | | | | 2,460,367 | |
| Liabilities | | | – | | | | (456,938 | ) | | | – | | | | (456,938 | ) |
| Total | | $ | – | | | $ | 6,644,723 | | | $ | – | | | $ | 6,644,723 | |
| (1) | | Refer to Note 2(o) for a description of fair value measurements and the three-tier hierarchy of inputs. |
| (2) | | See Schedule of Investments for fair values in each industry and identification of foreign issuers and/or geography. The table above is presented by Investment Type. Industries are presented within an Investment Type should such Investment Type include securities classified as two or more levels within the three-tier fair value hierarchy. When applicable, each Level 3 security is identified on the Schedule of Investments along with the valuation technique utilized. |
A reconciliation of Level 3 investments is presented when the Fund has a material amount of Level 3 investments at the beginning or end of the year in relation to the Fund’s net assets.
| | See Notes to Financial Statements. | 17 |
Schedule of Investments (concluded)
December 31, 2024
The following is a reconciliation of investments with unobservable inputs (Level 3) that were used in determining fair value:
| Investment Type | | Asset-Backed
Securities | | | Floating Rate
Loans | | | Non Agency Commercial
Mortgage-Backed Securities | |
| Balance as of January 1, 2024 | | $ | 23,133,411 | | | $ | 3,680,564 | | | | $ | 112,500 | |
| Accrued Discounts (Premiums) | | | 306,947 | | | | 35,871 | | | | | – | |
| Realized Gain (Loss) | | | – | | | | (88,576 | ) | | | | (11,239,380 | ) |
| Change in Unrealized Appreciation (Depreciation) | | | 5,124,988 | | | | (4,412 | ) | | | | 11,126,880 | |
| Purchases | | | 9,980,002 | | | | – | | | | | – | |
| Sales | | | (8,536,243 | ) | | | (3,623,447 | ) | | | | – | |
| Transfers into Level 3(a) | | | 38,232,636 | | | | – | | | | | – | |
| Transfers out of Level 3(a) | | | (20,932,278 | ) | | | – | | | | | – | |
| Balance as of December 31, 2024 | | $ | 47,309,463 | | | $ | – | | | | $ | – | |
| Change in unrealized appreciation/depreciation for the year ended December 31, 2024, related to Level 3 investments held at December 31, 2024 | | $ | 5,124,988 | | | $ | – | | | | $ | – | |
| (a) | | The Fund recognizes transfers within the fair value hierarchy as of the beginning of the period. Transfers into and out of Level 3 were primarily related to the availability of market quotations in accordance with valuation methodology. |
| 18 | See Notes to Financial Statements. |
Statement of Assets and Liabilities
December 31, 2024
| ASSETS: | | | |
| Investments in securities, at fair value including $46,840,366 of securities loaned (cost $2,778,211,681) | | $ | 2,675,591,216 | |
| Investments in Underlying Funds, at fair value (cost $60,501,111) | | | 60,912,793 | |
| Cash | | | 1,897,250 | |
| Deposits with brokers for forwards and swap contracts collateral | | | 12,519,661 | |
| Receivables: | | | | |
| Interest and dividends | | | 42,309,383 | |
| Capital shares sold | | | 11,745,558 | |
| Investment securities sold | | | 10,073,762 | |
| From broker | | | 1,923,037 | |
| Securities lending income | | | 29,972 | |
| Unrealized appreciation on forward foreign currency exchange contracts | | | 2,460,367 | |
| Prepaid expenses | | | 144,879 | |
| Total assets | | | 2,819,607,878 | |
| LIABILITIES: | | | | |
| Payables: | | | | |
| Investment securities purchased | | | 81,561,853 | |
| Collateral due to broker for securities lending | | | 48,949,956 | |
| Management fee | | | 2,760,910 | |
| Variation margin for centrally cleared swap contracts agreements | | | 1,787,269 | |
| Distribution and Servicing plan | | | 735,231 | |
| Trustees’ fees | | | 126,596 | |
| Unrealized depreciation on unfunded loan commitments | | | 106,716 | |
| Fund administration | | | 88,349 | |
| Capital shares reacquired | | | 10,203 | |
| Unrealized depreciation on forward foreign currency exchange contracts | | | 456,938 | |
| Distributions payable | | | 16,914,426 | |
| Accrued expenses and other liabilities | | | 342,736 | |
| Total liabilities | | | 153,841,183 | |
| Commitments and contingent liabilities (See Note 2(m)) | | | | |
| NET ASSETS | | $ | 2,665,766,695 | |
| COMPOSITION OF NET ASSETS: | | | | |
| Paid-in capital | | $ | 2,807,807,358 | |
| Total distributable earnings (loss) | | | (142,040,663 | ) |
| Net Assets | | $ | 2,665,766,695 | |
| Net assets by class: | | | | |
| Institutional Class Shares | | $ | 1,481,736,164 | |
| Class A Shares | | $ | 918,018,871 | |
| Class U Shares | | $ | 266,011,660 | |
| Outstanding shares by class: | | | | |
| Institutional Class Shares | | | 165,863,831 | |
| Class A Shares | | | 102,774,509 | |
| Class U Shares | | | 29,774,801 | |
| Net asset value, offering and redemption price per share (Net assets divided by outstanding shares): | | | | |
| Institutional Class Shares-Net asset value | | | $8.93 | |
| Class A Shares-Net asset value | | | $8.93 | |
| Class A Shares-Maximum offering price (Net asset value plus sales charge of 2.50%) | | | $9.16 | |
| Class U Shares-Net asset value | | | $8.93 | |
| | See Notes to Financial Statements. | 19 |
Statement of Operations
For the Year Ended December 31, 2024
| Investment income: | | | | |
| Dividends | | $ | 39,727 | |
| Dividends received from Underlying Funds (See Note 12) | | | 2,986,810 | |
| Securities lending net income | | | 301,466 | |
| Interest and other | | | 225,332,825 | |
| Total investment income | | | 228,660,828 | |
| Expenses: | | | | |
| Management fee | | | 26,834,480 | |
| Distribution and Servicing plan–Class A | | | 5,565,976 | |
| Distribution and Servicing plan–Class U | | | 1,498,683 | |
| Shareholder servicing | | | 952,978 | |
| Fund administration | | | 858,704 | |
| Professional | | | 492,012 | |
| Trustees’ fees | | | 364,289 | |
| Registration | | | 305,019 | |
| Reports to shareholders | | | 281,358 | |
| Custody | | | 34,458 | |
| Other | | | 225,985 | |
| Gross expenses | | | 37,413,942 | |
| Fees waived and expenses reimbursed (See Note 3) | | | (34,458 | ) |
| Net expenses | | | 37,379,484 | |
| Net investment income | | | 191,281,344 | |
| Net realized and unrealized gain (loss): | | | | |
| Net realized gain (loss) on investments | | | (10,542,370 | ) |
| Net realized gain (loss) on forward foreign currency exchange contracts | | | 3,321,817 | |
| Net realized gain (loss) on swap contracts | | | 8,205,243 | |
| Net realized gain (loss) on foreign currency related transactions | | | (604,345 | ) |
| Net change in unrealized appreciation/depreciation in Underlying Funds | | | 411,682 | |
| Net change in unrealized appreciation/depreciation on investments | | | 14,082,736 | |
| Net change in unrealized appreciation/depreciation on forward foreign currency exchange contracts | | | 3,422,448 | |
| Net change in unrealized appreciation/depreciation on swap contracts | | | (679,289 | ) |
| Net change in unrealized appreciation/depreciation on translation of assets and liabilities denominated in foreign currencies | | | (10,421 | ) |
| Net change in unrealized appreciation/depreciation on unfunded loan commitments | | | (106,716 | ) |
| Net realized and unrealized gain (loss) | | | 17,500,785 | |
| Net Increase in Net Assets Resulting From Operations | | $ | 208,782,129 | |
| 20 | See Notes to Financial Statements. |
Statements of Changes in Net Assets
| INCREASE IN NET ASSETS | | For the Year Ended
December 31, 2024 | | | For the Year Ended
December 31, 2023 | |
| Operations: | | | | | | | | | | |
| Net investment income | | | $ | 191,281,344 | | | | $ | 140,076,620 | |
| Net realized gain (loss) on investments, forward foreign currency exchange contracts, swap contracts and foreign currency related transactions | | | | 380,345 | | | | | (42,972,435 | ) |
| Net change in unrealized appreciation/depreciation on investments in Underlying Funds | | | | 411,682 | | | | | – | |
| Net change in unrealized appreciation/depreciation on investments, forward foreign currency exchange contracts, swap contracts, unfunded loan commitments and translation of assets and liabilities denominated in foreign currencies | | | | 16,708,758 | | | | | 47,462,104 | |
| Net increase in net assets resulting from operations | | | | 208,782,129 | | | | | 144,566,289 | |
| Distributions to Shareholders | | | | | | | | | | |
| Institutional Class | | | | (117,176,233 | ) | | | | (78,452,098 | ) |
| Class A | | | | (66,526,457 | ) | | | | (46,174,830 | ) |
| Class U | | | | (17,849,114 | ) | | | | (6,044,636 | ) |
| Total distribution to shareholders | | | | (201,551,804 | ) | | | | (130,671,564 | ) |
| Capital share transactions (See Note 15): | | | | | | | | | | |
| Net proceeds from sales of shares | | | | 1,129,254,731 | | | | | 645,407,379 | |
| Reinvestment of distributions | | | | 67,107,429 | | | | | 45,094,768 | |
| Cost of shares reacquired | | | | (209,426,510 | ) | | | | (208,802,272 | ) |
| Net increase in net assets resulting from capital share transactions | | | | 986,935,650 | | | | | 481,699,875 | |
| Net increase in net assets | | | | 994,165,975 | | | | | 495,594,600 | |
| NET ASSETS: | | | | | | | | | | |
| Beginning of year | | | $ | 1,671,600,720 | | | | $ | 1,176,006,120 | |
| End of year | | | $ | 2,665,766,695 | | | | $ | 1,671,600,720 | |
| | See Notes to Financial Statements. | 21 |
Financial Highlights
| | | | | Per Share Operating Performance: |
| | | | | Investment operations: | | Distributions to
shareholders from: |
| | | | | | | | | | | | | | | |
| | | Net asset
value,
beginning
of period | | Net
invest-
ment
income
(loss)(b) | | Net
realized
and
unrealized
gain (loss) | | Total
from
invest-
ment
oper-
ations | | Net
invest-
ment
income | | Net
realized
gain | | Total
distri-
butions |
| Institutional Class | | | | | | | | | | | | | | | | | | | | | | | | | | | | |
| 12/31/2024 | | $ | 8.88 | | | $ | 0.83 | | | $ | 0.10 | | | $ | 0.93 | | | $ | (0.88 | ) | | $ | – | | | $ | (0.88 | ) |
| 12/31/2023 | | | 8.79 | | | | 0.91 | | | | 0.03 | | | | 0.94 | | | | (0.85 | ) | | | – | | | | (0.85 | ) |
| 12/31/2022 | | | 10.58 | | | | 0.75 | | | | (1.64 | ) | | | (0.89 | ) | | | (0.76 | ) | | | (0.14 | ) | | | (0.90 | ) |
| 12/31/2021 | | | 10.37 | | | | 0.79 | | | | 0.56 | | | | 1.35 | | | | (0.75 | ) | | | (0.39 | ) | | | (1.14 | ) |
| 12/31/2020 | | | 10.00 | | | | 0.74 | | | | 0.34 | | | | 1.08 | | | | (0.71 | ) | | | – | | | | (0.71 | ) |
| | | | | | | | | | | | | | | | | | | | | | | | | | | | | |
| Class A | | | | | | | | | | | | | | | | | | | | | | | | | | | | |
| 12/31/2024 | | | 8.88 | | | | 0.76 | | | | 0.10 | | | | 0.86 | | | | (0.81 | ) | | | – | | | | (0.81 | ) |
| 12/31/2023 | | | 8.79 | | | | 0.84 | | | | 0.03 | | | | 0.87 | | | | (0.78 | ) | | | – | | | | (0.78 | ) |
| 12/31/2022 | | | 10.58 | | | | 0.68 | | | | (1.64 | ) | | | (0.96 | ) | | | (0.69 | ) | | | (0.14 | ) | | | (0.83 | ) |
| 12/31/2021 | | | 10.37 | | | | 0.71 | | | | 0.56 | | | | 1.27 | | | | (0.67 | ) | | | (0.39 | ) | | | (1.06 | ) |
| 12/31/2020 | | | 10.00 | | | | 0.66 | | | | 0.48 | | | | 1.14 | | | | (0.77 | ) | | | – | | | | (0.77 | ) |
| | | | | | | | | | | | | | | | | | | | | | | | | | | | | |
| Class U | | | | | | | | | | | | | | | | | | | | | | | | | | | | |
| 12/31/2024 | | | 8.88 | | | | 0.75 | | | | 0.11 | | | | 0.86 | | | | (0.81 | ) | | | – | | | | (0.81 | ) |
| 12/31/2023 | | | 8.80 | | | | 0.85 | | | | 0.01 | | | | 0.86 | | | | (0.78 | ) | | | – | | | | (0.78 | ) |
| 12/31/2022 | | | 10.58 | | | | 0.68 | | | | (1.62 | ) | | | (0.94 | ) | | | (0.70 | ) | | | (0.14 | ) | | | (0.84 | ) |
| 12/31/2021 | | | 10.37 | | | | 0.70 | | | | 0.57 | | | | 1.27 | | | | (0.67 | ) | | | (0.39 | ) | | | (1.06 | ) |
| 6/18/2020 to 12/31/2020(d) | | | 9.10 | | | | 0.36 | | | | 1.27 | | | | 1.63 | | | | (0.36 | ) | | | – | | | | (0.36 | ) |
| (a) | Does not include expenses of the Underlying Funds in which the Fund invests. |
| (b) | Calculated based on average shares outstanding during the period. |
| (c) | Total return for Class A does not consider the effects of sales loads and assumes the reinvestment of all distributions. Total return for Institutional Class and Class U assumes the reinvestment of all distributions. |
| (d) | Commenced on June 18, 2020. |
| (e) | Not annualized. |
| (f) | Annualized. |
| 22 | See Notes to Financial Statements. | |
| | | | | Ratios to Average Net Assets:(a) | | Supplemental
Data: |
| | | | | | | | | | | | | |
Net
asset
value,
end of
period | | Total
return
(%)(c) | | Total
expenses
after
waivers
and/or
reimburse-
ments
(%) | | Total
expenses
(%) | | Net
investment
income
(loss)
(%) | | Net
assets,
end of
period
(000) | | Portfolio
turnover
rate
(%) |
| | | | | | | | | | | | | | | | | | | | | | | | | | | |
| $ | 8.93 | | | | 10.90 | | | | 1.41 | | | | 1.41 | | | | 9.23 | | | $ | 1,481,736 | | | | 122 | |
| | 8.88 | | | | 11.15 | | | | 1.40 | | | | 1.41 | | | | 10.26 | | | | 963,355 | | | | 97 | |
| | 8.79 | | | | (8.58 | ) | | | 1.39 | | | | 1.39 | | | | 7.94 | | | | 684,810 | | | | 52 | |
| | 10.58 | | | | 13.35 | | | | 1.39 | | | | 1.40 | | | | 7.23 | | | | 408,536 | | | | 61 | |
| | 10.37 | | | | 12.84 | | | | 1.50 | | | | 1.62 | | | | 7.92 | | | | 177,894 | | | | 119 | |
| | | | | | | | | | | | | | | | | | | | | | | | | | | |
| | 8.93 | | | | 10.08 | | | | 2.16 | | | | 2.16 | | | | 8.48 | | | | 918,019 | | | | 122 | |
| | 8.88 | | | | 10.33 | | | | 2.15 | | | | 2.16 | | | | 9.50 | | | | 588,734 | | | | 97 | |
| | 8.79 | | | | (9.26 | ) | | | 2.14 | | | | 2.14 | | | | 7.16 | | | | 466,141 | | | | 52 | |
| | 10.58 | | | | 12.53 | | | | 2.13 | | | | 2.14 | | | | 6.53 | | | | 439,318 | | | | 61 | |
| | 10.37 | | | | 12.02 | | | | 2.25 | | | | 2.30 | | | | 7.01 | | | | 184,655 | | | | 119 | |
| | | | | | | | | | | | | | | | | | | | | | | | | | | |
| | 8.93 | | | | 10.08 | | | | 2.16 | | | | 2.16 | | | | 8.41 | | | | 266,012 | | | | 122 | |
| | 8.88 | | | | 10.33 | | | | 2.15 | | | | 2.16 | | | | 9.62 | | | | 119,511 | | | | 97 | |
| | 8.80 | | | | (9.24 | ) | | | 2.15 | | | | 2.15 | | | | 7.50 | | | | 25,055 | | | | 52 | |
| | 10.58 | | | | 12.54 | | | | 2.13 | | | | 2.13 | | | | 6.46 | | | | 12 | | | | 61 | |
| | 10.37 | | | | 18.33 | (e) | | | 2.25 | (f) | | | 2.30 | (f) | | | 7.01 | (f) | | | 11 | | | | 119 | (e) |
| | See Notes to Financial Statements. | 23 |
Notes to Financial Statements
Lord Abbett Credit Opportunities Fund (the “Fund”) is registered under the Investment Company Act of 1940, as amended (the “Act”), as a closed-end management investment company that continuously offers its common shares (the “Shares”) and is operated as an interval fund. The Fund is diversified for purposes of the 1940 Act. Pursuant to guidance from the Securities and Exchange Commission, the Fund’s classification changed from a non-diversified fund to a diversified fund. As a result of this classification change, the Fund is limited in the proportion of its assets that may be invested in the securities of a single issuer. The Fund was organized as a Delaware statutory trust on September 18, 2018. The Fund had a sale to Lord, Abbett & Co. LLC (“Lord Abbett”) of 10,000 shares of common stock for $100,000 ($10.00 per share). The Fund commenced operations on February 15, 2019.
The Fund’s investment objective is total return. The Fund currently offers three classes of Shares: Institutional Class, Class A and Class U. A front-end sales charge is normally added to the net asset value (“NAV”) for Class A shares. There is no front-end sales charge in the case of Institutional Class and Class U shares. Class U shares commenced operations on June 18, 2020.
The Fund will not list its Shares for trading on any securities exchange. There is currently no secondary market for its Shares and the Fund does not expect any secondary market to develop for its Shares. Shareholders of the Fund are not able to have their Shares redeemed or otherwise sell their Shares on a daily basis because the Fund is an unlisted closed-end fund. In order to provide liquidity to shareholders, the Fund is structured as an interval fund and conducts quarterly repurchase offers for a portion of its outstanding Shares. The Fund also invests in Lord Abbett Private Credit Fund (“PCF”), which is a non-diversified, closed-end management investment company which elected to be regulated as a business development company under the 1940 Act, and Lord Abbett Private Credit Fund A, LP (“PCF A”) which is a limited partnership. As of December 31, 2024, both the PCF and PCF A are available only to the Fund and certain other investment companies managed by Lord Abbett.
Basis of Preparation
The Fund is an investment company and applies the accounting and reporting guidance of the Financial Accounting Standards Board (“FASB”) Accounting Standards Codification Topic 946 Financial Services – Investment Companies. The preparation of the financial statements in conformity with accounting principles generally accepted in the United States of America (“U.S. GAAP”) requires management to make certain estimates and assumptions that affect the reported amounts of assets and liabilities and disclosure of contingent assets and liabilities at the date of the financial statements and the reported amounts of increases and decreases in net assets from operations during the reporting period. Actual results could differ from those estimates.
Segment Reporting
The Fund adopted FASB Accounting Standards Update (“ASU”) 2023-07, Segment Reporting (Topic 280) – Improvements to Reportable Segment Disclosures (“ASU 2023-07”). Adoption of the new standard resulted in new financial statement disclosures and did not affect the Fund’s financial position or its results of operations. An operating segment is defined in Topic 280 as a component of a public entity that engages in business activities from which it may recognize revenues and incur expenses, has operating results that are regularly reviewed by the public entity’s chief operating decision maker (“CODM”) to make decisions about resources to be allocated to the segment and assess its performance, and has discrete financial information available.
24
Notes to Financial Statements (continued)
The CODM for the Fund is Lord Abbett through its Management, Investment and Operating Committees, which are responsible for assessing performance and making decisions about resource allocation. The CODM has determined that the Fund has a single operating segment based on the fact that the CODM monitors the operating results of the Fund as a whole and that the Fund’s long-term strategic asset allocation is pre-determined in accordance with the terms of its prospectus, based on a defined investment strategy which is executed by the Fund’s portfolio managers as a team. The financial information provided to and reviewed by the CODM is consistent with that presented within the Fund’s Schedule of Investments, Statement of Assets and Liabilities, Statement of Operations, Statement of Changes in Net Assets and Financial Highlights.
| 2. | SIGNIFICANT ACCOUNTING POLICIES |
| (a) | Investment Valuation–Under procedures approved by the Fund’s Board of Trustees (the “Board”), the Board has designated the determination of fair value of the Fund’s portfolio investments to Lord Abbett as its valuation designee. Accordingly, Lord Abbett is responsible for, among other things, assessing and managing valuation risks, establishing, applying and testing fair value methodologies, and evaluating pricing services. Lord Abbett has formed a Pricing Committee that performs these responsibilities on behalf of Lord Abbett, administers the pricing and valuation of portfolio investments and ensures that prices utilized reasonably reflect fair value. Among other things, these procedures allow Lord Abbett, subject to Board oversight, to utilize independent pricing services, quotations from securities, and financial instrument dealers and other market sources to determine fair value. |
| | |
| | Securities actively traded on any recognized U.S. or non-U.S. exchange or on The NASDAQ Stock Market LLC are valued at the last sale price or official closing price on the exchange or system on which they are principally traded. Events occurring after the close of trading on non-U.S. exchanges may result in adjustments to the valuation of foreign securities to reflect their fair value as of the close of regular trading on the New York Stock Exchange. When valuing foreign equity securities that meet certain criteria, the Pricing Committee uses a third-party fair valuation service that values such securities to reflect market trading that occurs after the close of the applicable foreign markets of comparable securities or other instruments that correlate to the fair-valued securities. Unlisted equity securities are valued at the last quoted sale price or, if no sale price is available, at the mean between the most recently quoted bid and ask prices. Investments in the PCF and PCF A are valued at their NAV each month end. Fixed income securities are valued based on evaluated prices supplied by independent pricing services, which reflect broker/dealer supplied valuations and the independent pricing services’ own electronic data processing techniques. Floating rate loans are valued at the average of bid and ask quotations obtained from dealers in loans on the basis of prices supplied by independent pricing services. Forward foreign currency exchange contracts are valued using daily forward exchange rates. Swaps, options and options on swaps (“swaptions”) are valued daily using independent pricing services or quotations from broker/dealers to the extent available. |
| | |
| | Securities for which prices are not readily available are valued at fair value as determined by the Pricing Committee. The Pricing Committee considers a number of factors, including observable and unobservable inputs, when arriving at fair value. The Pricing Committee may use observable inputs such as yield curves, broker quotes, observable trading activity, option adjusted spread models and other relevant information to determine the fair value of portfolio investments. The Board or a designated committee thereof periodically reviews reports that may include fair value determinations made by the Pricing Committee, related market activity, |
25
Notes to Financial Statements (continued)
| | inputs and assumptions, and retrospective comparison of prices of subsequent purchases and sales transactions to fair value determinations made by the Pricing Committee. |
| | |
| | Short-term securities with 60 days or less remaining to maturity are valued using the amortized cost method, which approximates fair value. Investments in open-end money market mutual funds are valued at their NAV as of the close of each business day. |
| | |
| (b) | Security Transactions–Security transactions are recorded as of the date that the securities are purchased or sold (trade date). Realized gains and losses on sales of portfolio securities are calculated using the identified-cost method. Realized and unrealized gains (losses) are allocated to each class of shares based upon the relative proportion of net assets at the beginning of the day. |
| | |
| (c) | Investment Income–Dividend income is recorded on the ex-dividend date. Interest income is recorded on the accrual basis as earned. Discounts are accreted and premiums are amortized using the effective interest method and are included in Interest and other, if applicable, in the Statement of Operations. Investment income is allocated to each class of shares based upon the relative proportion of net assets at the beginning of the day. |
| | |
| (d) | Income Taxes–It is the policy of the Fund to meet the requirements of Subchapter M of the Internal Revenue Code applicable to regulated investment companies and to distribute substantially all taxable income and capital gains to its shareholders. Therefore, no income tax provision is required. |
| | |
| | The Fund files U.S. federal and various state and local tax returns. No income tax returns are currently under examination. The statute of limitations on the Fund’s filed U.S. federal tax returns remains open for the fiscal years ended December 31, 2021 through December 31, 2024. The statutes of limitations on the Fund’s state and local tax returns may remain open for an additional year depending upon the Fund’s jurisdiction. |
| | |
| (e) | Expenses–Expenses, excluding class-specific expenses, are allocated to each class of shares based upon the relative proportion of net assets at the beginning of the day. Class A and Class U shares bear their class-specific share of all expenses and fees relating to the Fund’s Distribution and Servicing Plan. |
| | |
| (f) | Foreign Transactions–The books and records of the Fund are maintained in U.S. dollars and transactions denominated in foreign currencies are recorded in the Fund’s records at the rate prevailing when earned or recorded. Asset and liability accounts that are denominated in foreign currencies are adjusted daily to reflect current exchange rates and any unrealized gain (loss), if applicable, is included in Net change in unrealized appreciation/depreciation on translation of assets and liabilities denominated in foreign currencies in the Fund’s Statement of Operations. The resultant exchange gains and losses upon settlement of such transactions, if applicable, are included in Net realized gain (loss) on foreign currency related transactions in the Fund’s Statement of Operations. The Fund does not isolate that portion of the results of operations arising as a result of changes in the foreign exchange rates from the changes in market prices of the securities. |
| | |
| | The Fund uses foreign currency exchange contracts to facilitate transactions in foreign-denominated securities. Losses from these transactions may arise from changes in the value of the foreign currency or if the counterparties do not perform under the contracts’ terms. |
26
Notes to Financial Statements (continued)
| (g) | Forward Foreign Currency Exchange Contracts–The Fund may enter into forward foreign currency exchange contracts in order to reduce exposure to changes in foreign currency exchange rates on foreign portfolio holdings, or gain or reduce exposure to foreign currency solely for investment purposes. A forward foreign currency exchange contract is a commitment to purchase or sell a foreign currency at a future date at a negotiated rate. The contracts are valued daily at forward exchange rates and any unrealized gain (loss), if applicable, is included in Net change in unrealized appreciation/depreciation on forward foreign currency exchange contracts in the Fund’s Statement of Operations. The gain (loss) arising from the difference between the U.S. dollar cost of the original contract and the value of the forward foreign currency in U.S. dollars upon closing of such contracts is included, if applicable, in Net realized gain (loss) on forward foreign currency exchange contracts in the Fund’s Statement of Operations. |
| | |
| (h) | Futures Contracts–The Fund may purchase and sell futures contracts to enhance returns, to attempt to economically hedge some of its investment risk, or as a substitute position in lieu of holding the underlying asset on which the instrument is based. At the time of entering into a futures transaction, an investor is required to deposit and maintain a specified amount of cash or eligible securities called “initial margin.” Subsequent payments made or received by the Fund called “variation margin” are made on a daily basis as the market price of the futures contract fluctuates. The Fund will record an unrealized gain (loss) based on the amount of variation margin. When a contract is closed, a realized gain (loss) is recorded equal to the difference between the opening and closing value of the contract. |
| | |
| (i) | Credit Default Swap Contracts–The Fund may enter into credit default swap contracts in order to hedge credit risk or for speculation purposes. As a seller of a credit default swap contract (“seller of protection”), the Fund is required to pay the notional amount or other agreed-upon value of a referenced debt obligation to the counterparty in the event of a default by or other credit event involving the referenced issuer, obligation or index. In return, the Fund receives from the counterparty a periodic stream of payments over the term of the contract. |
| | |
| | As a purchaser of a credit default swap contract (“buyer of protection”), the Fund would receive the notional amount or other agreed upon value of a referenced debt obligation from the counterparty in the event of default by or other credit event involving the referenced issuer, obligation or index. In return, the Fund makes periodic payments to the counterparty over the term of the contracts, provided no event of default has occurred. |
| | |
| | These credit default swap contracts may have as a reference obligation corporate or sovereign issuers or credit indexes. These credit indexes are comprised of a basket of securities representing a particular sector of the market. |
| | |
| | Credit default swap contracts are fair valued based upon quotations from counterparties, brokers or market-makers and the change in value, if any, is recorded as unrealized appreciation or depreciation. For a credit default swap contract sold by the Fund, payment of the agreed-upon amount made by the Fund in the event of default of the referenced debt obligation is recorded as the cost of the referenced debt obligation purchased/received. For a credit default swap contract purchased by the Fund, the agreed-upon amount received by the Fund in the event of default of the referenced debt obligation is recorded as proceeds from sale/delivery of the referenced debt obligation and the resulting gain or loss realized on the referenced debt obligation is recorded as such by the Fund. |
27
Notes to Financial Statements (continued)
| | Any upfront payments made or received upon entering a credit default swap contract would be amortized or accreted over the life of the swap contract and recorded as realized gains or losses. Collateral, in the form of cash or securities, may be required to be held in segregated accounts with the custodian bank or broker in accordance with the swap contract agreement. The value and credit rating of each credit default swap contract where the Fund is the seller of protection, are both measures of the current payment/performance risk of the swap contract. As the value of the swap contract changes as a positive or negative percentage of the total notional amount, the payment/performance risk may decrease or increase, respectively. The maximum potential amount of future payments (undiscounted) that the Fund as a seller of protection could be required to make under a credit default swap contract agreement would be an amount equal to the notional amount of the agreement. These potential amounts would be partially offset by any recovery values of the respective referenced obligations, upfront payments received upon entering into the agreement, or net amounts received from the settlement of buy protection credit default swap contract agreements entered into by the Fund for the same referenced entity or entities. |
| | |
| | Entering into credit default swap contracts involves credit and market risk. Such risks involve the possibility that there will be no liquid market for these agreements, that the counterparty to the agreements may default on its obligation to perform or disagree as to the meaning of the contractual terms in the agreements, and that there may be unfavorable changes in interest rates, and that Lord Abbett does not correctly predict the creditworthiness of the issuers of the reference obligation on which the credit default swap contract is based. For the centrally cleared credit default swap contracts, there was minimal counterparty risk to the Fund, since such credit default swap contracts entered into were traded through a central clearinghouse, which guarantees against default. |
| | |
| (j) | Repurchase Agreements–The Fund may enter into repurchase agreements with respect to securities. A repurchase agreement is a transaction in which a fund acquires a security and simultaneously commits to resell that security to the seller (a bank or securities dealer) at an agreed-upon price on an agreed-upon date. The Fund requires at all times that the repurchase agreement be collateralized by cash, or by securities of the U.S. Government, its agencies, its instrumentalities, or U.S. Government sponsored enterprises having a value equal to, or in excess of, the value of the repurchase agreement (including accrued interest). If the seller of the agreement defaults on its obligation to repurchase the underlying securities at a time when the fair value of these securities has declined, the Fund may incur a loss upon disposition of the securities. |
| | |
| (k) | When-Issued, Forward Transactions or To-Be-Announced (“TBA”) Transactions–The Fund may purchase portfolio securities on a when-issued or forward basis. When-issued, forward transactions or TBA transactions involve a commitment by the Fund to purchase securities, with payment and delivery (“settlement”) to take place in the future, in order to secure what is considered to be an advantageous price or yield at the time of entering into the transaction. During the period between purchase and settlement, the fair value of the securities will fluctuate and assets consisting of cash and/or marketable securities (normally short-term U.S. Government or U.S. Government sponsored enterprise securities) marked to market daily in an amount sufficient to make payment at settlement will be segregated at the Fund’s custodian in order to pay for the commitment. At the time the Fund makes the commitment to purchase a security on a when-issued basis, it will record the transaction and |
28
Notes to Financial Statements (continued)
| | reflect the liability for the purchase and fair value of the security in determining its NAV. The Fund, generally, has the ability to close out a purchase obligation on or before the settlement date rather than take delivery of the security. Under no circumstances will settlement for such securities take place more than 120 days after the purchase date. |
| | |
| (l) | Reverse Repurchase Agreements–The Fund may enter into reverse repurchase agreements. In a reverse repurchase agreement, the Fund sells a security to a securities dealer or bank for cash and also agrees to repurchase the same security later at a set price. Reverse repurchase agreements expose the Fund to credit risk (that is, the risk that the counterparty will fail to resell the security to the Fund). Engaging in reverse repurchase agreements also may involve the use of leverage, in that the Fund may reinvest the cash it receives in additional securities. Reverse repurchase agreements involve the risk that the market value of the securities to be repurchased by the Fund may decline below the repurchase price. |
| | |
| | For the fiscal year ended December 31, 2024, the Fund did not enter into reverse repurchase agreements. |
| | |
| (m) | Floating Rate Loans–The Fund may invest in floating rate loans, which usually take the form of loan participations and assignments. Loan participations and assignments are agreements to make money available to U.S. or foreign corporations, partnerships or other business entities (the “Borrower”) in a specified amount, at a specified rate and within a specified time. A loan is typically originated, negotiated and structured by a U.S. or foreign bank, insurance company or other financial institution (the “Agent”) for a group of loan investors (“Loan Investors”). The Agent typically administers and enforces the loan on behalf of the other Loan Investors in the syndicate and may hold any collateral on behalf of the Loan Investors. Such loan participations and assignments are typically senior, secured and collateralized in nature. The Fund records an investment when the Borrower withdraws money and records interest as earned. These loans pay interest at rates which are periodically reset by reference to a base lending rate plus a spread. These base lending rates are generally the prime rate offered by a designated U.S. bank or Secured Overnight Financing Rate (“SOFR”). |
| | |
| | The loans in which the Fund invests may be subject to some restrictions on resale. For example, the Fund may be contractually obligated to receive approval from the Agent and/or Borrower prior to the sale of these investments. The Fund generally has no right to enforce compliance with the terms of the loan agreement with the Borrower. As a result, the Fund assumes the credit risk of the Borrower, the selling participant and any other persons interpositioned between the Fund and the Borrower (“Intermediate Participants”). In the event that the Borrower, selling participant or Intermediate Participants become insolvent or enter into bankruptcy, the Fund may incur certain costs and delays in realizing payment or may suffer a loss of principal and/or interest. |
| | |
| | Unfunded commitments represent the remaining obligation of the Fund to the Borrower. At any point in time, up to the maturity date of the issue, the Borrower may demand the unfunded portion. Until demanded by the Borrower, unfunded commitments are not recognized as an asset on the Statement of Assets and Liabilities. Unrealized appreciation/depreciation on unfunded commitments is presented, if any, on the Statement of Assets and Liabilities and represents the mark to market of the unfunded portion of the Fund’s floating rate notes. |
29
Notes to Financial Statements (continued)
As of December 31, 2024 the Fund had the following unfunded loan commitments:
| | Borrower | | Principal
Amount | | Market
Value | | Cost | | Unrealized
Appreciation/
Depreciation | |
| | ASP Unifrax Holdings, Inc. Delayed Draw Term Loan | | $8,002,695 | | $7,895,979 | | $8,002,695 | | $(106,716 | ) |
| | |
| (n) | Total Return Swap Contracts–The Fund may enter into total return swap contract agreements to obtain exposure to a security or market without owning such security or investing directly in that market. The Fund may agree to make payments that are the equivalent of interest in exchange for the right to receive payments equivalent to any appreciation in the value of an underlying security, index or other asset, as well as receive payments equivalent to any distributions made on that asset, over the term of the swap contract. If the value of the asset underlying a total return swap contract declines over the term of the swap contract, the Fund also may be required to pay an amount equal to that decline in value to its counterparty. |
| | |
| (o) | Fair Value Measurements–Fair value is defined as the price that the Fund would receive upon selling an investment or transferring a liability in an orderly transaction to an independent buyer in the principal or most advantageous market of the investment. A three-tier hierarchy is used to maximize the use of observable market data and minimize the use of unobservable inputs and to establish classification of fair value measurements for disclosure purposes. Inputs refer broadly to the assumptions that market participants would use in pricing the asset or liability, including assumptions about risk – for example, the risk inherent in a particular valuation technique used to measure fair value (such as a pricing model) and/or the risk inherent in the inputs to the valuation technique. Inputs may be observable or unobservable. Observable inputs reflect the assumptions market participants would use in pricing the asset or liability. Observable inputs are based on market data obtained from sources independent of the reporting entity. Unobservable inputs reflect the reporting entity’s own assumptions about the assumptions market participants would use in pricing the asset or liability. Unobservable inputs are based on the best information available in the circumstances. The three-tier hierarchy classification is determined based on the lowest level of inputs that is significant to the fair value measurement, and is summarized in the three broad Levels listed below: |
| | • | Level 1 – | unadjusted quoted prices in active markets for identical investments; |
| | | | |
| | • | Level 2 – | other significant observable inputs (including quoted prices for similar investments, interest rates, prepayment speeds, credit risk, etc.); and |
| | | | |
| | • | Level 3 – | significant unobservable inputs (including the Fund’s own assumptions in determining the fair value of investments). |
A summary of inputs used in valuing the Fund’s investments and other financial instruments as of December 31, 2024 and, if applicable, Level 3 rollforwards for the fiscal year then ended is included in the Fund’s Schedule of Investments.
Changes in valuation techniques may result in transfers into or out of an assigned level within the three-tier hierarchy. The inputs or methodology used for valuing securities are not necessarily an indication of the risk associated with investing in those securities.
30
Notes to Financial Statements (continued)
| 3. | MANAGEMENT FEE AND OTHER TRANSACTIONS WITH AFFILIATES |
Management Fee
The Fund has a management agreement with Lord Abbett, pursuant to which Lord Abbett provides the Fund with investment management services and executive and other personnel, provides office space and pays for ordinary and necessary office and clerical expenses relating to research and statistical work and supervision of the Fund’s investment portfolio. The management fee is accrued daily and payable monthly.
The management fee is based on the Fund’s average daily net assets at the annual rate of 1.25%.
For the fiscal year ended December 31, 2024, the effective management fee, net of any applicable waiver, was at an annualized rate of 1.25% of the Fund’s average daily net assets.
In addition, Lord Abbett provides certain administrative services to the Fund pursuant to an Administrative Services Agreement in return for a fee at an annual rate of .04% of the Fund’s average daily net assets. The fund administration fee is accrued daily and payable monthly. Lord Abbett voluntarily waived $34,458 of fund administration fees for the fiscal year ended December 31, 2024.
For the fiscal year ended December 31, 2024 and continuing through April 30, 2025, Lord Abbett has contractually agreed to waive all or a portion of its management fee and, if necessary, waive all or a portion of its administrative fee and reimburse the Fund’s other expenses to the extent necessary so that the total net operating expenses for each class (excluding certain of the Fund’s expenses, such as acquired fund fees and expenses, if applicable) do not exceed an annual rate of 1.50%.
This agreement may be terminated only upon the approval of the Board.
Distribution and Servicing Plan
The Fund has adopted a Distribution and Servicing Plan for Class A and Class U shares of the Fund, which provides for the payment of ongoing distribution and service fees to Lord Abbett Distributor LLC (the “Distributor”), an affiliate of Lord Abbett. The distribution and service fees are accrued daily and payable monthly. The following annual rates have been authorized by the Board pursuant to the plan:
| Fees* | | Class A | | Class U |
| Service | | .25% | | .25% |
| Distribution | | .50% | | .50% |
| * | The Fund may designate a portion of the aggregate fees as attributable to service activities for purposes of calculating Financial Industry Regulatory Authority, Inc. sales charge limitations. |
Institutional Class does not have a distribution plan.
Distributor
The Distributor is the principal underwriter and distributor of the Fund’s Shares pursuant to a distribution agreement (the “Distribution Agreement”) with the Fund. The Distributor is a wholly-owned subsidiary of Lord Abbett. The Distributor does not participate in the distribution of non-Lord Abbett managed products. The Distributor acts as the distributor of Shares for the Fund on a best efforts basis, subject to various conditions, pursuant to the terms of the Distribution Agreement. The Distributor is not obligated to sell any specific amount of Shares of the Fund. The Fund may impose repurchase fees of up to 2.00% on Shares accepted for repurchase that have been held for less than one year.
31
Notes to Financial Statements (continued)
Commissions
The Distributor received the following commissions on sales of shares of the Fund, after concessions were paid to authorized dealers, during the fiscal year ended December 31, 2024:
| | Distributor | | | | Dealers’ | |
| | Commissions | | | | Concessions | |
| | $ – | | | | $5,031,865 | |
The Distributor received CDSCs of $30,239 for Class A for the fiscal year ended December 31, 2024.
One Trustee and certain of the Fund’s officers have an interest in Lord Abbett.
| 4. | DISTRIBUTIONS AND TAX INFORMATION |
Dividends are paid from net investment income, if any. Capital gain distributions are paid from taxable net realized gains from investments transactions, reduced by allowable capital loss carryforwards, if any. The capital loss carryforward amount, if any, is available to offset future net capital gains. Dividends and distributions to shareholders are recorded on the ex-dividend date. The amounts of dividends and distributions from net investment income and net realized capital gains are determined in accordance with federal income tax regulations, which may differ from U.S. GAAP. These book/tax differences are either considered temporary or permanent in nature. To the extent these differences are permanent in nature, such amounts are reclassified within the components of net assets based on their federal tax basis treatment; temporary differences do not require reclassification. Dividends and distributions, which exceed earnings and profits for tax purposes, are reported as a tax return of capital.
The tax character of distributions paid during the fiscal year ended December 31, 2024 was as follows:
| Fund | | Ordinary
Income | | Net
Long-Term
Capital Gains | | Return of
Capital | | Total
Distributions
Paid |
| Credit Opportunities Fund | | $201,551,804 | | $ – | | $ – | | $201,551,804 |
The tax character of distributions paid during the fiscal year ended December 31, 2023 was as follows:
| Fund | | Ordinary
Income | | Net
Long-Term
Capital Gains | | Return of
Capital | | Total
Distributions
Paid |
| Credit Opportunities Fund | | $130,671,564 | | $ – | | $ – | | $130,671,564 |
As of December 31, 2024, the components of distributable earnings (loss) on a tax basis were as follows:
| Fund | | Undistributed
Ordinary
Income | | Undistributed
Net
Long-Term
Capital Gains | | Accumulated
Capital and
Other Losses | | Unrealized
Appreciation/
(Depreciation) | | Temporary
Differences | | Total
Distributable
Earnings
(Loss) – Net | |
| Credit Opportunities Fund | | $ – | | $ – | | $(46,527,466) | | $(83,634,137 | ) | $(11,879,060 | ) | $(142,040,663 | ) |
32
Notes to Financial Statements (continued)
Net capital losses recognized by the Funds may be carried forward indefinitely and retain their character as short-term and/or long-term losses. Capital losses incurred that will be carried forward are as follows:
| Fund | | Short-Term
Losses | | | Long-Term
Losses | | | Net Capital
Losses | |
| Credit Opportunities Fund | | $ | – | | | $ | (46,527,466 | ) | | $ | (46,527,466 | ) |
As of December 31, 2024, the tax cost of investments and the breakdown of unrealized appreciation/(depreciation) for the Fund are shown below. The difference between book-basis and tax basis unrealized appreciation/(depreciation) is attributable to the tax treatment of certain securities, certain distributions, other financial instruments, amortization of premium, and wash sales.
| Fund | | Tax Cost of
Investments | | | Gross
Unrealized
Appreciation | | | Gross
Unrealized
Depreciation | | | Net
Unrealized
Appreciation/
(Depreciation) | |
| Credit Opportunities Fund | | $ | 2,820,586,260 | | | $ | 44,953,197 | | | $ | (128,472,638 | ) | | $ | (83,519,441 | ) |
Permanent items identified, as shown below, have been reclassified among the components of net assets based on their tax treatment. The permanent differences are primarily attributable to tax treatment of nondeductible expenses.
| Fund | | Total
Distributable
Earnings (Loss) | | |
Paid-in
Capital | |
| Credit Opportunities Fund | | | $16,730 | | | | $(16,730 | ) |
| 5. | PORTFOLIO SECURITIES TRANSACTIONS |
Purchases and sales of investment securities (excluding short-term investments) during the fiscal year ended December 31, 2024 were as follows:
| Purchases | Sales |
| $3,090,035,493 | $2,251,279,824 |
There were no purchases or sales of U.S. Government securities during the fiscal year ended December 31, 2024.
The Fund is permitted to purchase and sell securities (“cross-trade”) from and to other Lord Abbett funds or client accounts pursuant to procedures approved by the Board in compliance with Rule 17a-7 under the Act (the “Rule”). Each cross-trade is executed at a fair market price in compliance with provisions of the Rule. For the fiscal year ended December 31, 2024, the Fund did not engage in cross-trade purchases or sales.
| 6. | DISCLOSURES ABOUT DERIVATIVE INSTRUMENTS AND HEDGING ACTIVITIES |
The Fund entered into forward foreign currency exchange contracts during the fiscal year ended December 31, 2024 (as described in Note 2(h)). A forward foreign currency exchange contract reduces the Fund’s exposure to changes in the value of the currency it will deliver (or settle in cash) and increases its exposure to changes in the value of the currency it will receive (or settle in cash) for the duration of the contract. The Fund’s use of forward foreign currency exchange contracts involves the risk that Lord Abbett will not accurately predict currency movements, and the Fund’s returns could be reduced as a result. Forward foreign currency exchange contracts are subject to the risk that those currencies will decline in value relative to the U.S. dollar, or, in the case of
33
Notes to Financial Statements (continued)
hedged positions, that the U.S. dollar will decline relative to the currency being hedged. Currency rates in foreign countries may fluctuate significantly over short periods of time. The Fund’s risk of loss from counterparty credit risk is the unrealized appreciation on forward foreign currency exchange contracts.
The Fund entered into credit default swap contracts during the fiscal year ended December 31, 2024 (as described in Note 2(i)), for investment purposes, to economically hedge credit risk or for speculative purposes. Credit default swap contracts involve the exchange of a fixed rate premium for protection against the loss in value of an underlying security in the event of a defined credit event, such as payment default or bankruptcy. Under a credit default swap contract, one party acts as a guarantor by receiving the fixed periodic payment in exchange for the commitment to purchase the underlying security at par if the defined credit event occurs. Upon the occurrence of a defined credit event, the difference between the value of the reference obligation and the swap contract’s notional amount is recorded as realized gain or loss on swap contracts in the Statement of Operations. The Fund’s maximum risk of loss from counterparty risk, either as the protection seller or as the protection buyer, is the fair value of the contract. There is minimal counterparty credit risk to the Fund since centrally cleared credit default swap contracts are traded through a central clearinghouse. As the counterparty to all centrally cleared credit default swap contracts, the clearinghouse guarantees credit default swaps against default.
As of December 31, 2024, the Fund had the following derivatives at fair value, grouped into risk categories that illustrate the Fund’s use of derivative instruments:
| Asset Derivatives | | Foreign
Currency
Contracts | | | Credit
Contracts | |
| Centrally Cleared Credit Default Swap Contracts(1) | | $ | – | | | $ | 9,345,366 | |
| Forward Foreign Currency Exchange Contracts(2) | | | 2,460,367 | | | | – | |
| Liability Derivatives | | | | | | | | |
| Centrally Cleared Credit Default Swap Contracts(1) | | | – | | | | 4,704,072 | |
| Forward Foreign Currency Exchange Contracts(3) | | | 456,938 | | | | – | |
| (1) | Statement of Assets and Liabilities location: Includes cumulative unrealized appreciation/depreciation of centrally cleared swap contracts as reported in the schedule of Investments. Only current day’s variation margin is reported within the Statement of Assets and Liabilities. |
| (2) | Statement of Assets and Liabilities location: Unrealized appreciation on forward foreign currency exchange contracts. |
| (3) | Statement of Assets and Liabilities location: Unrealized depreciation on forward foreign currency exchange contracts. |
Transactions in derivative instruments for the fiscal year ended December 31, 2024, were as follows:
| | | Foreign
Currency
Contracts | | | Credit
Contracts | |
| Net Realized Gain (Loss) | | | | | | | | |
| Credit Default Swap Contracts(1) | | | – | | | $ | 8,205,243 | |
| Forward Foreign Currency Exchange Contracts(2) | | $ | 3,321,817 | | | | – | |
| Net Change in Unrealized Appreciation/ Depreciation | | | | | | | | |
| Credit Default Swap Contracts(3) | | | – | | | $ | (679,289 | ) |
| Forward Foreign Currency Exchange Contracts(4) | | $ | 3,422,448 | | | | – | |
| Average Number of Contracts/Notional Amounts* | | | | | | | | |
| Credit Default Swap Contracts(5) | | | – | | | $ | 167,141,079 | |
| Forward Foreign Currency Exchange Contracts(5) | | $ | 78,721,026 | | | | – | |
| * | Calculated based on the number of contracts or notional amounts during the fiscal year ended December 31, 2024. |
| (1) | Statement of Operations location: Net realized gain (loss) on swap contracts. |
34
Notes to Financial Statements (continued)
| (2) | Statement of Operations location: Net realized gain (loss) on forward foreign currency exchange contracts. |
| (3) | Statement of Operations location: Net change in unrealized appreciation/depreciation on swap contracts. |
| (4) | Statement of Operations location: Net change in unrealized appreciation/depreciation on forward foreign currency exchange contracts. |
| (5) | Amount represents notional amounts in U.S. dollars. |
| 7. | DISCLOSURES ABOUT OFFSETTING ASSETS AND LIABILITIES |
The FASB requires disclosures intended to help better assess the effect or potential effect of offsetting arrangements on a fund’s financial position. The following tables illustrate gross and net information about recognized assets and liabilities eligible for offset in the Statement of Assets and Liabilities; and disclose such amounts subject to an enforceable master netting agreement or similar agreement, by the counterparty. A master netting agreement is an agreement between a fund and a counterparty which provides for the net settlement of amounts owed under all contracts traded under that agreement, as well as cash collateral, through a single payment by one party to the other in the event of default on or termination of any one contract. The Fund’s accounting policy with respect to balance sheet offsetting is that, absent an event of default by the counterparty or a termination of the agreement, the master netting agreement does not result in an offset of reported amounts of financial assets and liabilities in the Statement of Assets and Liabilities across transactions between the Fund and the applicable counterparty:
| Description | | Gross Amounts of
Recognized Assets | | | Gross Amounts
Offset in the
Statement of Assets
and Liabilities | | | Net Amounts of
Assets Presented
in the Statement of
Assets and Liabilities | |
| Forward Foreign Currency Exchange Contracts | | | $ | 2,460,367 | | | | $ | – | | | | $ | 2,460,367 | |
| Repurchase Agreements | | | | 228,836,920 | | | | | – | | | | | 228,836,920 | |
| Total | | | $ | 231,297,287 | | | | $ | – | | | | $ | 231,297,287 | |
| | | Net Amounts
of Assets
Presented in
the Statement
of Assets and
Liabilities | | | Amounts Not Offset in the
Statement of Assets and Liabilities | | | | |
| Counterparty | | | | Financial
Instruments | | | Cash
Collateral
Received(a) | | | Securities
Collateral
Received(a) | | | Net
Amount(b) | |
| Morgan Stanley | | $ | 226,252 | | | $ | (8,005 | ) | | $ | – | | | $ | – | | | $ | 218,247 | |
| State Street Bank and Trust | | | 2,234,115 | | | | (56,368 | ) | | | – | | | | (1,780,617 | ) | | | 397,130 | |
| Fixed Income Clearing Corp. | | | 18,836,920 | | | | – | | | | – | | | | (18,836,920 | ) | | | – | |
| JPMorgan Securities LLC | | | 210,000,000 | | | | – | | | | – | | | | (210,000,000 | ) | | | – | |
| Total | | $ | 231,297,287 | | | $ | (64,373 | ) | | $ | – | | | $ | (230,617,537 | ) | | $ | 615,377 | |
| Description | | Gross Amounts of
Recognized Liabilities | | | Gross Amounts
Offset in the
Statement of Assets
and Liabilities | | | Net Amounts of
Liabilities Presented
in the Statement of
Assets and Liabilities | |
| Forward Foreign Currency Exchange Contracts | | | $ | 456,938 | | | | $ | – | | | | | $456,938 | |
| Total | | | $ | 456,938 | | | | $ | – | | | | | $456,938 | |
35
Notes to Financial Statements (continued)
| | | Net Amounts
of Liabilities
Presented in
the Statement
of Assets and
Liabilities | | | Amounts Not Offset in the
Statement of Assets and Liabilities | | | | |
| Counterparty | | | | Financial
Instruments | | | Cash
Collateral
Pledged(a) | | | Securities
Collateral
Pledged(a) | | | Net
Amount(c) | |
| Bank of America | | $ | 107,617 | | | $ | – | | | $ | (107,617 | ) | | $ | – | | | $ | – | |
| Citibank | | | 49,408 | | | | – | | | | – | | | | – | | | | 49,408 | |
| Morgan Stanley | | | 8,005 | | | | (8,005 | ) | | | – | | | | – | | | | – | |
| State Street Bank and Trust | | | 56,368 | | | | (56,368 | ) | | | – | | | | – | | | | – | |
| Toronto Dominion Bank | | | 235,540 | | | | – | | | | – | | | | – | | | | 235,540 | |
| Total | | $ | 456,938 | | | $ | (64,373 | ) | | $ | (107,617 | ) | | $ | – | | | $ | 284,948 | |
| (a) | Collateral disclosed is limited to an amount not to exceed 100% of the net amount of assets (liabilities) presented in the Statement of Assets and Liabilities, for each respective counterparty. |
| (b) | Net amount represents the amount owed to the Fund by the counterparty as of December 31, 2024. |
| (c) | Net amount represents the amount owed by the Fund to the counterparty as of December 31, 2024. |
The Fund’s officers and one Trustee, who are associated with Lord Abbett, do not receive any compensation from the Fund for serving in such capacities. From January 1, 2024 through December 31, 2024, Independent Trustees’ fees are allocated among all Lord Abbett-sponsored funds primarily based on the relative net assets of each fund. There was an equity-based plan available to all Independent Trustees under which Independent Trustees could elect to defer receipt of a portion of Trustees’ fees. The deferred amounts are treated as though equivalent dollar amounts had been invested in the Fund. Such amounts and earnings accrued thereon are included in Trustees’ fees in the Statement of Operations and in Trustees’ fees payable in the Statement of Assets and Liabilities and are not deductible for U.S. federal income tax purposes until such amounts are paid.
On June 28, 2024, shareholders of the Fund elected new independent Trustees for the Fund and certain other Lord Abbett-sponsored closed-end funds with an effective date of July 5, 2024 and the then-current Trustees resigned. Effective July 5, 2024, Independent Trustees’ fees are allocated among these certain Lord Abbett-sponsored closed-end funds based on the net assets of each fund.
For the period ended July 31, 2024, the Fund and certain other funds managed by Lord Abbett (collectively, the “Participating Funds”) were party to a syndicated line of credit facility with various lenders for $1.6 billion (the “Syndicated Facility”) under which State Street Bank and Trust Company (“SSB”) participated as a lender and as agent for the lenders. The Participating Funds were subject to graduated borrowing limits of one-third of fund net assets (if fund net assets are less than $750 million), $250 million, $300 million, $700 million, or $1 billion, based on past borrowings and likelihood of future borrowings, among other factors.
For the period ended July 31, 2024, the Participating Funds were also party to an additional uncommitted line of credit facility with SSB for $330 million (the “Bilateral Facility”). Under the Bilateral Facility, the Participating Funds were subject to graduated borrowing limits of one-third of fund net assets (if fund net assets are less than $750 million), or $250 million based on past borrowings and likelihood of future borrowings, among other factors.
These credit facilities are to be used for short-term working capital purposes as additional sources of liquidity to satisfy redemptions.
36
Notes to Financial Statements (continued)
For the period ended July 31, 2024, the Fund did not utilize the Syndicated Facility or Bilateral Facility. Effective August 1, 2024, the Fund ceased being a party to the Syndicated Facility and Bilateral Facility.
| 10. | CUSTODIAN AND ACCOUNTING AGENT |
SSB is the Fund’s custodian and accounting agent. SSB performs custodial, accounting and recordkeeping functions relating to portfolio transactions and calculating the Fund’s NAV.
| 11. | SECURITIES LENDING AGREEMENT |
The Fund has established a securities lending agreement with Citibank, N.A. for the lending of securities to qualified brokers in exchange for securities or cash collateral equal to at least the market value of securities loaned, plus interest, if applicable. Cash collateral is invested in an approved money market fund. In accordance with the Fund’s securities lending agreement, the market value of securities on loan is determined each day at the close of business and any additional collateral required to cover the value of securities on loan is delivered to the Fund on the next business day. As with other extensions of credit, the Fund may experience a delay in the recovery of its securities or incur a loss should the borrower of the securities breach its agreement with the Fund or the borrower becomes insolvent at a time when the collateral is insufficient to cover the cost of repurchasing securities on loan. Any income earned from securities lending is included in Securities lending net income in the Fund’s Statement of Operations.
The initial collateral received by the Fund is required to have a value equal to at least 100% of the market value of the securities loaned. The collateral must be marked-to-market daily to cover increases in the market value of the securities loaned (or potentially a decline in the value of the collateral). In general, the risk of borrower default will be borne by Citibank, N.A.; the Fund will bear the risk of loss with respect to the investment of the cash collateral. The advantage of such loans is that the Fund continues to receive income on loaned securities while receiving a portion of any securities lending fees and earning returns on the cash amounts which may be reinvested for the purchase of investments in securities.
As of December 31, 2024, the market value of securities loaned and collateral received were as follows:
| Market Value of | Collateral |
| Securities Loaned | Received(1) |
| $46,840,366 | $48,949,956 |
| (1) | Statement of Assets and Liabilities location: Collateral due to broker for securities lending. |
37
Notes to Financial Statements (continued)
| 12. | TRANSACTIONS WITH AFFILIATED FUNDS |
The Fund intends to obtain exposure to less liquid or illiquid private credit investments, generally involving corporate borrowers, through their investments in pooled investment vehicles, including PCF and PCF A which are both managed by Lord Abbett (the “Underlying Funds”). Typically, private credit investments are not traded in public markets and are illiquid, such that an underlying fund may not be able to dispose of its holdings for extended periods, which may be several years, or at the price at which the underlying fund is valuing its investments. An underlying fund will also be illiquid, and the Fund incurs two layers of fees, with Lord Abbett potentially receiving a management fee at both levels. An underlying fund may, from time to time or over time, focus its private credit investments in a particular industry or sector or select industries or sectors. Investment performance of such industries or sectors may thus at times have an out-sized impact on the performance of an underlying fund or the Fund indirectly. Additionally, private credit investments can range in credit quality depending on security-specific factors, including total leverage, amount of leverage senior to the security in question, variability in the issuer’s cash flows, the size of the issuer, the quality of assets securing debt and the degree to which such assets cover the subject company’s debt obligations. The issuers of the underlying fund’s private credit investment will often be leveraged, often as a result of leveraged buyouts or other recapitalization transactions, and often will not berated by national credit rating agencies.
The Fund’s investments in the PCF and PCF A are subject to restrictions on transfer and the Fund currently has no redemption rights with respect to its investment in PCF A. The PCF expects to repurchase shares pursuant to tender offers each quarter, up to 5% of the PCF’s Common Shares outstanding, using a purchase price equal to the NAV per share as of the last calendar day of the applicable quarter. There will be no trading market for the Fund’s investments in the PCF and PCF A. The Schedule of Investments lists the PCF and PCF A as investments as of year end, but does not include the underlying holdings of the PCF and PCF A. The Fund indirectly bears the proportionate share of the expenses of the PCF and PCF A. The Fund had the following transactions with the PCF and PCF A during the fiscal year ended December 31, 2024:
Credit Opportunities Fund(1)(2)
| | | Value at
12/31/2023 | | | Contributions | | | Withdrawals | | | Net Realized
Gain (Loss) | | | Net Change in
Appreciation
(Depreciation) | | | Value at
12/31/2024 | | | Dividend
Income | |
| Lord Abbett Private Credit Fund | | $ | – | | | $ | 41,246,744 | | | $ | (496,744 | ) | | $ | – | | | $ | 411,682 | | | $ | 41,161,682 | | | $ | 2,644,775 | |
| Lord Abbett Private Credit Fund A, LP | | $ | – | | | $ | 19,751,111 | | | $ | – | | | $ | – | | | $ | – | | | $ | 19,751,111 | | | $ | 342,035 | |
| (1) | The Fund acquired PCF shares from 2/23/2024 to 12/31/2024 at a cost of $40,750,000. |
| (2) | The Fund acquired PCF A shares from 12/4/2024 to 12/31/2024 at a cost of $19,751,111. |
The Fund has an unfunded commitment to make investments in the PCF and PCF A at a future date in the amount of $0 and $200,248,889, respectively, at year end. This unfunded commitment is not recognized on the Statement of Assets and Liabilities at year end.
38
Notes to Financial Statements (continued)
In order to provide liquidity to shareholders, the Fund has adopted a fundamental investment policy to make quarterly offers to repurchase its outstanding Shares at NAV per share, reduced by any applicable repurchase fee. Subject to applicable law and approval of the Board, for each quarterly repurchase offer, the Fund currently expects to offer to repurchase 5% of the Fund’s outstanding Shares at NAV, which is the minimum amount permitted. For the fiscal year ended December 31, 2024 the results of the repurchase offers were as follows:
Repurchase
Request Deadline | | Repurchase
Pricing
Date | | Amount
Repurchased | | | Number of
Shares
Repurchased
(all classes) | | | Percentage of
Outstanding
Shares
Repurchased | |
| January 24, 2024 | | January 24, 2024 | | $ | 37,944,418 | | | | 4,273,020 | | | | 2.28% | |
| April 24, 2024 | | April 24, 2024 | | $ | 46,347,043 | | | | 5,225,146 | | | | 2.55% | |
| July 24, 2024 | | July 24, 2024 | | $ | 55,499,311 | | | | 6,173,264 | | | | 2.90% | |
| October 23, 2024 | | October 23, 2024 | | $ | 67,852,939 | | | | 7,581,334 | | | | 2.81% | |
Repurchase offers and the need to fund repurchase obligations may affect the ability of the Fund to be fully invested or force the Fund to maintain a higher percentage of its assets in liquid investments, which may harm the Fund’s investment performance. Moreover, diminution in the size of the Fund through repurchases may result in untimely sales of portfolio securities (with associated imputed transaction costs, which may be significant), may limit the ability of the Fund to participate in new investment opportunities or to achieve its investment objective and will tend to increase the Fund’s expense ratio per common share for remaining shareholders. The Fund may accumulate cash by holding back (i.e., not reinvesting) payments received in connection with the Fund’s investments. If at any time cash and other liquid assets held by the Fund are not sufficient to meet the Fund’s repurchase obligations, the Fund intends, if necessary, to sell investments. If the Fund employs investment leverage, repurchases of Shares would compound the adverse effects of leverage in a declining market. Also, if the Fund borrows to finance repurchases, interest on that borrowing will negatively affect shareholders who do not tender their Shares by increasing the Fund’s expenses and reducing any net investment income.
If a repurchase offer is oversubscribed, the Board may determine to increase the amount repurchased by up to 2% of the Fund’s outstanding shares as of the date of the Repurchase Request Deadline (as defined in the Fund’s Prospectus). In the event that the Board determines not to repurchase more than the repurchase offer amount, or if shareholders tender more than the repurchase offer amount plus 2% of the Fund’s outstanding shares as of the date of the Repurchase Request Deadline, the Fund will repurchase the Shares tendered on a pro rata basis, and shareholders will have to wait until the next repurchase offer to make another repurchase request. Consequently, shareholders may be unable to liquidate all or a given percentage of their investment in the Fund during a particular repurchase offer. Some shareholders, in anticipation of proration, may tender more Shares than they wish to have repurchased in a particular quarter, thereby increasing the likelihood that proration will occur. A shareholder may be subject to market and other risks, and the NAV of Shares tendered in a repurchase offer may decline between the Repurchase Request Deadline and the date on which the NAV for tendered Shares is determined. In addition, the repurchase of Shares by the Fund may be a taxable event to shareholders, potentially including even shareholders who do not tender any Shares in such repurchase.
39
Notes to Financial Statements (continued)
The Fund is subject to the general risks and considerations associated with investing in debt securities and to the changing prospects of individual companies and/or sectors in which the Fund invests. The value of an investment will change as interest rates fluctuate and in response to market movements. For many fixed income securities, market risk is significantly, but not necessarily exclusively, influenced by changes in interest rates. A rise in interest rates typically causes a decrease in the value of investments in bonds and other debt securities, while a fall in rates typically causes an increase in value. Equity securities have experienced significantly more volatility in returns than fixed income securities over the long term, although under certain market conditions fixed income securities may have comparable or greater price volatility. There is also the risk that an issuer of a debt security will fail to make timely payments of principal or interest to the Fund, a risk that is greater with high-yield securities (sometimes called “lower-rated bonds” or “junk bonds”), in which the Fund may substantially invest. Some issuers, particularly of high-yield securities, may default as to principal and/or interest payments after the Fund purchases its securities. A default, or concerns in the market about an increase in the risk of default, may result in losses to the Fund. High-yield securities are subject to greater price fluctuations, as well as additional risks. The market for below investment grade securities may be less liquid, which may make such securities more difficult to sell at an acceptable price, especially during periods of financial distress, increased market volatility, or significant market decline.
The Fund is subject to the risk of investing in securities issued or guaranteed by the U.S. Government or its agencies and instrumentalities (such as the Government National Mortgage Association (“Ginnie Mae”), the Federal National Mortgage Association (“Fannie Mae”), or the Federal Home Loan Mortgage Corporation (“Freddie Mac”). Different types of U.S. government securities are subject to different levels of credit risk, including the risk of default, depending on the nature of the particular government support for that security. Unlike Ginnie Mae securities, securities issued or guaranteed by U.S. Government-related organizations such as Fannie Mae and Freddie Mac are not backed by the full faith and credit of the U.S. Government and no assurance can be given that the U.S. Government would provide financial support to its agencies and instrumentalities if not required to do so by law. Consequently, the Fund may be required to look principally to the agency issuing or guaranteeing the obligation.
The mortgage-related and asset-backed securities in which the Fund may invest may be particularly sensitive to changes in prevailing interest rates, and economic conditions, including delinquencies and/or defaults. These changes can affect the value, income, and/or liquidity of such positions. When interest rates are declining, the value of these securities with prepayment features may not increase as much as other fixed income securities. Early principal repayment may deprive the Fund of income payments above current market rates. Alternatively, rising interest rates may cause prepayments to occur at a slower-than-expected rate, extending the duration of a security and typically reducing its value. The payment rate will thus affect the price and volatility of a mortgage-related security. In addition, the Fund may invest in non-agency asset backed and mortgage related securities, which are issued by private institutions, not by government-sponsored enterprises.
The Fund may invest up to 20% of its net assets in equity securities, the value of which fluctuates in response to movements in the equity securities markets in general, the changing prospects of individual companies in which the Fund invests, or an individual company’s financial condition.
The Fund may invest in convertible securities, which have both equity and fixed income risk characteristics, including market, credit, liquidity, and interest rate risks. Generally, convertible securities offer lower interest or dividend yields than non-convertible securities of similar quality and less potential for gains or capital appreciation in a rising equity securities market than equity
40
Notes to Financial Statements (continued)
securities. They tend to be more volatile than other fixed income securities and the market for convertible securities may be less liquid than the markets for stocks or bonds. A significant portion of convertible securities have below investment grade credit ratings and are subject to increased credit and liquidity risks.
Due to the Fund’s investment exposure to foreign companies and American Depositary Receipts, the Fund may experience increased market, industry and sector, liquidity, currency, political, information, and other risks. The securities of foreign companies also may be subject to inadequate exchange control regulations, the imposition of economic sanctions or other government restrictions, higher transaction and other costs, and delays in settlement to the extent they are traded on non-U.S. exchanges or markets.
The Fund is subject to the risks associated with derivatives, which may be different from and greater than the risks associated with directly investing in securities. Derivatives may be subject to risks such as liquidity risk, leveraging risk, interest rate risk, market risk, and credit risk. Illiquid securities may lower the Fund’s returns since the Fund may be unable to sell these securities at their desired time or price. Derivatives also may involve the risk of mispricing or improper valuation and the risk that changes in the value of the derivative may not correlate perfectly with the value of the underlying asset, rate or index. Whether the Fund’s use of derivatives is successful will depend on, among other things, the Fund’s ability to correctly forecast market movements and other factors. Losses may also arise from the failure of a derivative counterparty to meet its contractual obligations. If the Fund incorrectly forecasts these and other factors, the Fund’s performance could suffer. The Fund’s use of derivatives could result in a loss exceeding the amount of the Fund’s investment in these instruments.
The Fund may invest in loans, which include, among other things, loans to U.S. or foreign corporations, partnerships, other business entities, or to U.S. and non-U.S. governments. The Fund may invest in fixed rate and variable rate loans and floating or adjustable rate loans, including bridge loans, novations, assignments, and participations, which are subject to increased credit and liquidity risks. The loans in which the Fund invests will usually be rated below investment grade or may also be unrated. Below investment grade loans, as in the case of high-yield debt securities, or junk bonds, are usually more credit sensitive than interest rate sensitive, although the value of these instruments may be impacted by broader interest rate swings in the overall fixed income market. The Fund may invest in debtor-in-possession financings (commonly known as “DIP financings”). DIP financings are arranged when an entity seeks the protections of the bankruptcy court under Chapter 11 of the U.S. Bankruptcy Code. Such financings constitute senior liens on an unencumbered security (i.e., security not subject to other creditors’ claims).
Geopolitical and other events, such as war, acts of terrorism, natural disasters, the spread of infectious illnesses, epidemics and pandemics, environmental and other public health issues, supply chain disruptions, inflation, recessions or other events, and governments’ reactions to such events, may lead to increased market volatility and instability in world economies and markets generally and may have adverse effects on the performance of the Fund and its investments.
A widespread health crisis, such as a global pandemic, could cause substantial market volatility, impact the ability to complete redemptions, and adversely impact Fund performance. For example, the effects to public health, business and market conditions resulting from the COVID-19 pandemic have had, and may in the future have, a significant negative impact on the performance of the Fund’s investments, including exacerbating other pre-existing political, social and economic risks. In addition, the increasing interconnectedness of markets around the world may result in many markets being affected by events or conditions in a single country or region or events affecting a single or small number of issuers.
41
Notes to Financial Statements (concluded)
It is difficult to accurately predict or foresee when events or conditions affecting the U.S. or global financial markets, economies, and issuers may occur, the effects of such events or conditions, potential escalations or expansions of these events, possible retaliations in response to sanctions or similar actions and the duration or ultimate impact of those events. The foregoing could disrupt the operations of the Fund and its service providers, adversely affect the value and liquidity of the Fund’s investments, and negatively impact the Fund’s performance and your investment in the Fund.
| 15. | SUMMARY OF CAPITAL TRANSACTIONS |
Transactions in shares of beneficial interest were as follows:
| | | Year Ended
December 31, 2024 | | | Year Ended
December 31, 2023 | |
| Institutional Class Shares | | Shares | | | Amount | | | Shares | | | Amount | |
| Shares sold | | | 71,171,241 | | | $ | 637,152,704 | | | | 43,043,583 | | | $ | 380,302,106 | |
| Reinvestment of distributions | | | 1,470,923 | | | | 13,162,852 | | | | 1,410,031 | | | | 12,456,912 | |
| Shares reacquired | | | (15,248,707 | ) | | | (136,106,401 | ) | | | (13,875,271 | ) | | | (122,117,742 | ) |
| Increase | | | 57,393,457 | | | $ | 514,209,155 | | | | 30,578,343 | | | $ | 270,641,276 | |
| Class A Shares | | | | | | | | | | | | | | | | |
| Shares sold | | | 39,922,664 | | | $ | 357,558,459 | | | | 19,860,989 | | | $ | 175,622,889 | |
| Reinvestment of distributions | | | 4,420,264 | | | | 39,555,670 | | | | 3,092,788 | | | | 27,301,385 | |
| Shares reacquired | | | (7,870,923 | ) | | | (70,340,466 | ) | | | (9,668,714 | ) | | | (85,407,637 | ) |
| Increase | | | 36,472,005 | | | $ | 326,773,663 | | | | 13,285,063 | | | $ | 117,516,637 | |
| Class U Shares | | | | | | | | | | | | | | | | |
| Shares sold | | | 15,046,167 | | | $ | 134,543,568 | | | | 10,143,687 | | | $ | 89,482,384 | |
| Reinvestment of distributions | | | 1,607,399 | | | | 14,388,907 | | | | 605,796 | | | | 5,336,471 | |
| Shares reacquired | | | (332,547 | ) | | | (2,979,643 | ) | | | (144,315 | ) | | | (1,276,893 | ) |
| Increase | | | 16,321,019 | | | $ | 145,952,832 | | | | 10,605,168 | | | $ | 93,541,962 | |
42
Report of Independent Registered Public Accounting Firm
To the shareholders and the Board of Trustees of Lord Abbett Credit Opportunities Fund
Opinion on the Financial Statements and Financial Highlights
We have audited the accompanying statement of assets and liabilities of Lord Abbett Credit Opportunities Fund (the “Fund”), including the schedule of investments, as of December 31, 2024, the related statement of operations for the year then ended, the statements of changes in net assets for each of the two years in the period then ended, the financial highlights for each of the five years in the period then ended, and the related notes. In our opinion, the financial statements and financial highlights present fairly, in all material respects, the financial position of the Fund as of December 31, 2024, and the results of its operations for the year then ended, the changes in its net assets for each of the two years in the period then ended, and the financial highlights for each of the five years in the period then ended in conformity with accounting principles generally accepted in the United States of America.
Basis for Opinion
These financial statements and financial highlights are the responsibility of the Fund’s management. Our responsibility is to express an opinion on the Fund’s financial statements and financial highlights based on our audits. We are a public accounting firm registered with the Public Company Accounting Oversight Board (United States) (PCAOB) and are required to be independent with respect to the Fund in accordance with the U.S. federal securities laws and the applicable rules and regulations of the Securities and Exchange Commission and the PCAOB.
We conducted our audits in accordance with the standards of the PCAOB. Those standards require that we plan and perform the audit to obtain reasonable assurance about whether the financial statements and financial highlights are free of material misstatement, whether due to error or fraud. The Fund is not required to have, nor were we engaged to perform, an audit of its internal control over financial reporting. As part of our audits, we are required to obtain an understanding of internal control over financial reporting but not for the purpose of expressing an opinion on the effectiveness of the Fund’s internal control over financial reporting. Accordingly, we express no such opinion.
Our audits included performing procedures to assess the risks of material misstatement of the financial statements and financial highlights, whether due to error or fraud, and performing procedures that respond to those risks. Such procedures included examining, on a test basis, evidence regarding the amounts and disclosures in the financial statements and financial highlights. Our audits also included evaluating the accounting principles used and significant estimates made by management, as well as evaluating the overall presentation of the financial statements and financial highlights. Our procedures included confirmation of securities owned as of December 31, 2024, by correspondence with the custodian or counterparties; when replies were not received from counterparties, we performed other auditing procedures. We believe that our audits provide a reasonable basis for our opinion.
/s/ Deloitte & Touche LLP
New York, New York
February 26, 2025
We have served as the auditor of one or more Lord Abbett Family of Funds’ investment companies since 1932.
43
Special Shareholder Meeting Results (Unaudited)
The Lord Abbett Credit Opportunities Fund held a special meeting of shareholders on June 28, 2024, for the purpose of considering and voting upon the following proposal:
Proposal: Election of a New Board of Trustees
A new Board of Trustees was elected by the shareholders of the Lord Abbett Credit Opportunities Fund. The results of the voting were as follows:
| | | Votes Received |
| Nominee Votes | | In Favor | | Against/
Withheld | | Abstain |
| Lorraine Hendrickson | | 152,613,805 | | 1,888,073 | | 0 |
| John Shaffer | | 152,886,070 | | 1,615,808 | | 0 |
| Lisa Shalett | | 152,554,827 | | 1,947,051 | | 0 |
| Steven Rocco | | 141,173,853 | | 13,297,630 | | 0 |
44
Basic Information About Management
The Board is responsible for the management of the business and affairs of the Fund in accordance with the laws of the state of organization. The Board elects officers who are responsible for the day-to-day operations of the Fund and who execute policies authorized by the Board. The Board also approves an investment adviser to the Fund and continues to monitor the cost and quality of the services the investment adviser provides, and annually considers whether to renew the contract with the investment adviser. Generally, each Board member holds office until his/her successor is elected and qualified or until his/her earlier resignation or removal, as provided in the Fund’s organizational documents.
Lord, Abbett & Co. LLC (“Lord Abbett”), a Delaware limited liability company, is the Fund’s investment adviser. Designated Lord Abbett personnel are responsible for the day-to-day management of the Fund.
Name
(Year of Birth) | | Position Held
(Length of Time
Served) | | Principal
Occupation(s)
During Past 5 Years | | Number of
Portfolios in
Fund Complex
Overseen by
Trustee | | Other Directorships
Held During Past
5 Years |
| Independent Trustees | | | | | | | | |
| | | | | | | | | |
John Shaffer
(1966) | | Chair and Trustee
(since 2024) | | Co-Head of the Americas’ Credit Sales at Goldman Sachs (2007–2014); Head of America’s Credit Sales at Merrill Lynch (2001–2006). | | 5 | | Advisory Council Member of Strategic Partners (2021–2023). |
| | | | | | | | | |
Lisa Shalett
(1966) | | Trustee (since 2024) | | Managing Partner, Head of Strategic Innovation at Brookfield Asset Management (2018–2019); Partner at Goldman Sachs (2002–2015) and formerly other roles (1995–2002); and Co-Founder of Extraordinary Women on Boards (since 2021). | | 5 | | Currently Board member of PennyMac Financial Services (since 2020), MPower Partners (since 2021), and FTAC Emerald Acquisition Corp. (since 2021); Board member of AccuWeather (2019–2023); Board member of Bully Pulpit Interactive (2017–2022); and Board member of PerformLine (2015–2019). |
| | | | | | | | | |
Lorraine Hendrickson
(1965) | | Trustee (since 2024) | | Director at Deloitte (2014–2015); Chief Administrative Officer at BNY Mellon Investment Management International (2012–2014); Head of Performance Analytics and Performance 2 Oversight Committee Chair at Merrill Lynch Investment Management (1988–2006). | | 5 | | Trustee and Audit Chair of Creatd, Inc. (2022). |
45
Basic Information About Management (continued)
Name
(Year of Birth) | | Position Held
(Length of Time
Served) | | Principal
Occupation(s)
During Past 5 Years | | Number of
Portfolios in
Fund Complex
Overseen by
Trustee | | Other Directorships
Held During Past
5 Years |
| Interested Trustee | | | | | | | | |
| | | | | | | | | |
Steven F. Rocco
(1979) | | Trustee; President; Chief Executive Officer (since 2024) | | Co-Head of Taxable Fixed Income and Partner of Lord Abbett (since 2011), and was formerly Associate Portfolio Manager, joined Lord Abbett in 2004. | | 7 | | None. |
Officers
No officer listed below has received compensation from the Fund. All officers of the Fund also may be officers of the other Lord Abbett Funds and maintain offices at 30 Hudson Street, Jersey City, NJ 07302. Unless otherwise indicated, the position(s) and title(s) listed under the “Principal Occupation(s) During Past 5 Years” column indicates each officer’s position(s) and title(s) with Lord Abbett. Each officer serves for an indefinite term (i.e., until his or her death, resignation, retirement, or removal).
Name
(Year of Birth) | | Position Held
with the Fund | | Year
Elected | | Principal Occupation(s)
During Past 5 Years |
Steven F. Rocco
(1979) | | President and Chief Executive Officer | | Since
inception | | Co-Head of Taxable Fixed Income and Partner of Lord Abbett (since 2011), and was formerly Associate Portfolio Managed, joined Lord Abbett in 2004. |
| | | | | | | |
Christopher J. Costello
(1973) | | Vice President and Assistant Secretary | | Since
inception | | Senior Counsel, joined Lord Abbett in 2024 and was formerly Counsel at Linklaters LLP (2023–2024) and Director & Associate General Counsel at Allianz Global Investors (2012–2021). |
| | | | | | | |
Nicholas D. Emguschowa
(1986) | | Data Protection Officer | | Since
inception | | Senior Counsel, joined Lord Abbett in 2018. |
| | | | | | | |
Brooke A. Fapohunda
(1975) | | Vice President, Secretary and Chief Legal Officer | | Since
inception | | Partner and Senior Deputy General Counsel, joined Lord Abbett in 2006. |
46
Basic Information About Management (concluded)
Name
(Year of Birth) | | Position Held
with the Fund | | Year
Elected | | Principal Occupation(s)
During Past 5 Years |
Michael J. Hebert
(1976) | | Chief Financial Officer and Treasurer | | Since
inception | | Head of Global Fund Finance, joined Lord Abbett in 2021 and was formerly Vice President at Eaton Vance Management (EVM) (2014–2021) and Calvert Research & Management (CRM) (2016–2021), and Assistant Treasurer of registered investment companies managed, advised or administered by EVM and CRM during such years. |
| | | | | | | |
Parker J. Milender
(1989) | | Vice President and Assistant Secretary | | Since
inception | | Counsel, joined Lord Abbett in 2021 and was formerly an Associate at Milbank LLP (2017–2021). |
| | | | | | | |
Mary Ann Picciotto
(1973) | | Chief Compliance Officer | | Since
inception | | Partner and Global Chief Compliance Officer, joined Lord Abbett in 2023 and was formerly Vice President and Head of Global Compliance at T. Rowe Price (2019–2023) and Senior Vice President, Head of Compliance at Oppenheimer Funds, Inc. (2014–2019). |
| | | | | | | |
Kunjan Sheth
(1982) | | AML Compliance Officer | | Since
inception | | Head of Distribution & Marketing Compliance, joined Lord Abbett in 2023 and was formerly a Compliance Manager at Invesco Distributors, Inc. (2018–2023). |
| | | | | | | |
Randolph A. Stuzin
(1966) | | Vice President and Assistant Secretary | | Since
inception | | Partner and Chief Legal Officer, joined Lord Abbett in 2023 and was formerly Partner and General Counsel at King Street Capital Management (2014–2023). |
| | | | | | | |
Christine Y. Sun
(1991) | | Vice President and Assistant Secretary | | Since
inception | | Counsel, joined Lord Abbett in 2024 and was formerly an Associate at Willkie Farr & Gallagher LLP (2017–2024). |
47
Householding
The Fund has adopted a policy that allows it to send only one copy of the Fund’s prospectus, proxy material, annual report and semiannual report (or related notice of internet availability of annual report and semiannual report) to certain shareholders residing at the same “household.” This reduces Fund expenses, which benefits you and other shareholders. If you need additional copies or do not want your mailings to be “householded,” please call Lord Abbett at 888-522-2388.
Proxy Voting Policies, Procedures and Records
A description of the policies and procedures that Lord Abbett uses to vote proxies related to the Fund’s portfolio securities, and information on how Lord Abbett voted the Fund’s proxies during the 12-month period ended June 30 are available without charge, upon request, (i) by calling 888-522-2388; (ii) on Lord Abbett’s website at www.lordabbett.com; and (iii) on the Securities and Exchange Commission’s (“SEC”) website at www.sec.gov.
Shareholder Reports and Quarterly Portfolio Disclosure
The Fund is required to file its complete schedule of portfolio holdings with the SEC for its first and third fiscal quarters as an attachment to Form N-PORT. Copies of the filings are available without charge, upon request on the SEC’s website at www.sec.gov and may be available by calling Lord Abbett at 888-522-2388.
Tax Information (unaudited)
For foreign shareholders, the percentages below reflect the portion of net investment income distributions that represent interest-related dividends:
| Fund Name | Interest-related
dividends |
| Credit Opportunities Fund | 74% |
48


This report, when not used for the general information of shareholders of the Fund, is to be distributed only if preceded or accompanied by a current fund prospectus. Lord Abbett mutual fund shares are distributed by
LORD ABBETT DISTRIBUTOR LLC. | | Lord Abbett Credit Opportunities Fund | | LA-CROPP-2
(02/25) |
| (a) | In accordance with applicable requirements, the Lord Abbett Family of Funds initially adopted a Sarbanes-Oxley Code of Ethics on June 19, 2003 that applies to the principal executive officer and senior financial officers of the Registrant (“Code of Ethics”). The Code of Ethics was in effect during the fiscal year ended December 31, 2024 (the “Period”). |
| (c) | The Registrant has not amended the Code of Ethics as described in Form N-CSR during the Period. |
| (d) | The Registrant has not granted any waiver, including an implicit waiver, from a provision of the Code of Ethics as described in Form N-CSR during the Period. |
| (f) | A copy of the Code of Ethics has been filed as an exhibit to this Form N-CSR. |
| Item 3: | Audit Committee Financial Expert. |
The Registrant’s board of trustees has determined that each of the following independent trustees who are members of the audit committee is an audit committee financial expert: Lorraine Hendrickson, John Shaffer, and Lisa Shalett. Each of these persons is independent within the meaning of the Form N-CSR.
| Item 4: | Principal Accountant Fees and Services. |
In response to sections (a), (b), (c) and (d) of Item 4, the aggregate fees billed to the Registrant for the fiscal years ended December 31, 2024 and 2023 by the Registrant’s principal accounting firm, Deloitte & Touche LLP, the member firms of Deloitte Touche Tohmatsu and their respective affiliates (collectively, “Deloitte”) were as follows:
| | Fiscal year ended: |
| | 2024 | 2023 |
| Audit Fees {a} | $75,000 | $75,000 |
| Audit-Related Fees | - 0 - | - 0 - |
| Total audit and audit-related fees | 75,000 | 75,000 |
| | | |
| Tax Fees | - 0 - | - 0 - |
| All Other Fees{b} | - 0 - | - 0 - |
| | | |
| Total Fees | $75,000 | $75,000 |
{a} Consists of fees for audits of the Registrant’s annual financial statements.
{b} Fees for the fiscal year ended December 31, 2024 and 2023 consist of fees for services related to the recovery of excess dividend withholding taxes in certain jurisdictions.
(e) (1) Pursuant to Rule 2-01(c) (7) of Regulation S-X, the Registrant’s Audit Committee has adopted pre-approval policies and procedures. Such policies and procedures generally provide that the Audit Committee must pre-approve:
| • | any audit, audit-related, tax, and other services to be provided to the Lord Abbett Funds, including the Registrant, and |
| • | any audit-related, tax, and other services to be provided to the Registrant’s investment adviser and any entity controlling, controlled by or under common control with the investment adviser that provides ongoing services to one or more Funds comprising the Registrant if the engagement relates directly to operations and financial reporting of a Fund, by the independent auditor to assure that the provision of such services does not impair the auditor’s independence. |
The Audit Committee has delegated pre-approval authority to its Chair, subject to a fee limit of $10,000 per event, and not to exceed $25,000 annually. The Chair will report any pre-approval decisions to the Audit Committee at its next scheduled meeting. Unless a type of service to be provided by the independent auditor has received general pre-approval, it must be pre-approved by the Audit Committee. Any proposed services exceeding pre-approved cost levels will require specific pre-approval by the Audit Committee.
(e) (2) The Registrant’s Audit Committee has approved 100% of the services described in paragraphs (b) through (d) of this Item 4, no amount was approved by the Audit Committee pursuant to paragraph (c)(7)(i)(C) of Rule 2-01 of Regulation S-X.
(f) Not applicable.
(g) The aggregate non-audit fees billed by Deloitte for services rendered to the Registrant are shown above in the response to Item 4 (a), (b), (c) and (d) as “All Other Fees”.
The aggregate non-audit fees billed by Deloitte for services rendered to the Registrant’s investment adviser, Lord, Abbett & Co. LLC (“Lord Abbett”), for the fiscal years ended December 31, 2024 and 2023 were:
| | Fiscal year ended: |
| | 2024 | 2023 |
| All Other Fees {a} | $250,000 | $230,000 |
{a} Consist of fees for Independent Services Auditors’ Report on Controls Placed in Operation and Tests of Operating Effectiveness related to Lord Abbett’s Asset Management Services (“SOC-1 Report”).
The aggregate non-audit fees billed by Deloitte for services rendered to entities under the common control of Lord Abbett for the fiscal years ended December 31, 2024 and 2023 were:
| | Fiscal year ended: |
| | 2024 | 2023 |
| All Other Fees | $ - 0 - | $ - 0- |
(h) The Registrant’s Audit Committee has considered the provision of non-audit services that were rendered to the Registrant’s investment adviser, and any entity controlling, controlled by or under common control with the investment adviser that provides ongoing services to the Registrant, that were not pre-approved pursuant to Rule 2-01 (c)(7)(ii) of Regulation S-X and has determined that the provision of such services is compatible with maintaining Deloitte’s independence.
(i) Not Applicable.
(j) Not Applicable.
| Item 5: | Audit Committee of Listed Registrants. |
Not applicable.
| (a) | The Registrant’s “Schedule I - Investments in securities of unaffiliated issuers” as of the close of the reporting period is included as part of the report to shareholders filed under Item 1(a) of this Form N-CSR. |
| Item 7: | Financial Statements and Financial Highlights for Open-End Management Investment Companies. |
Not applicable.
| Item 8: | Changes in and Disagreements with Accountants for Open-End Management Investment Companies. |
Not applicable.
| Item 9: | Proxy Disclosures for Open-End Management Investment Companies. |
Not applicable.
| Item 10: | Remuneration Paid to Directors, Officers, and Others for Open-End Management Investment Companies. |
Not applicable.
| Item 11: | Statement Regarding Basis for Approval of Investment Advisory Contract. |
Not applicable.
| Item 12: | Disclosure of Proxy Voting Policies and Procedures for Closed-End Management Investment Companies. |
The Fund has delegated proxy voting responsibilities to the Fund’s investment adviser, Lord Abbett, subject to the Board of Trustees’ general oversight. Lord Abbett has adopted its own proxy voting policies and procedures for this purpose. A copy of Lord Abbett’s proxy voting policies and procedures is attached hereto as Exhibit 19(c).
| Item 13: | Portfolio Managers of Closed-End Management Investment Companies. |
(a)(1) Investment Team
As of the date of filing this Report:
| Name and Title | | Since | | Recent Professional Experience |
| Eric P. Kang | | May 2021 | | Mr. Kang joined Lord Abbett in 2015, and is a Portfolio Manager, and was named Partner in 2023. Prior to his current role, he worked as a Research Analyst for the Credit Research team, which supports all the taxable fixed income capabilities. His previous experience includes serving as Principal, Senior Analyst at MidOcean Credit Partners; Senior Analyst at Bell Point Capital Management; Analyst, Fundamental Credit Group at Citadel Investment Group; Vice President and Associate, Principal Credit Group at Merrill Lynch; and Analyst, Investment Banking at Donaldson, Lufkin & Jenrette. He began his career in the financial services industry in 1999. He earned a BS in economics from the Wharton School of Business at the University of Pennsylvania and an MBA from the Darden School of Business at the University of Virginia. |
| | | | | |
| Adam C. Castle | | May 2021 | | Mr. Castle joined Lord Abbett in 2015, and is a Portfolio Manager, and was named Partner in 2022. His previous experience includes serving as Vice President, Securitized Products Group at Credit Suisse; Assistant Vice President and Research Analyst, Securitized Assets at AllianceBernstein; and Analyst, Fixed Income Rotational Program at AllianceBernstein. He began his career in the financial services industry in 2008. He earned a BS from Cornell University and is a holder of the Chartered Financial Analyst® (CFA) designation. |
| | | | | |
| Kewjin Yuoh | | Inception
(February 2019) | | Mr. Yuoh joined Lord Abbett in 2010, and is a Portfolio Manager, and was named Partner in 2012. He began his career in the financial services industry in 1994. Prior to joining Lord Abbett, he was a Portfolio Manager of |
| | | | | Structured Products at Sanford Bernstein; a Portfolio Manager of Agency Mortgage- Backed Securities at Credit Suisse Asset Management; and a Senior VP, Director of Fundamental Research for Liquid and Structured Products at AllianceBernstein. Mr. Yuoh earned a BS from Cornell University. |
| | | | | |
| Steven F. Rocco | | April 2023 | | Mr. Rocco, Co-Head of Taxable Fixed Income, joined Lord Abbett in 2004, and was named Partner in 2011. Prior to his current role, he served as Associate Portfolio Manager for the firm’s investment grade fixed income strategies. He has worked in the financial services industry since 2001. He earned a BA in economics from Cornell University and is a holder of the Chartered Financial Analyst® (CFA) designation. |
(a)(2) Other Accounts Managed by Portfolio Managers
The following table sets forth information about the other accounts managed by the Fund’s portfolio managers as of December 31, 2024.
Included in the Registered Investment Companies category are those U.S.-registered funds managed or sub-advised by Lord Abbett, including funds underlying variable annuity contracts and variable life insurance policies offered through insurance companies. The Other Pooled Investment Vehicles category includes collective investment funds, offshore funds and similar non-registered investment vehicles. The Other Accounts category encompasses retirement and benefit plans (including both defined contribution and defined benefit plans) sponsored by various corporations and other entities, individually managed institutional accounts of various corporations, other entities and individuals, and separately managed accounts in so-called wrap fee programs sponsored by financial intermediaries unaffiliated with Lord Abbett.
| | | Number of
Registered
Investment
Companies | | Total
Assets
($MM) | | Number of
Other
Pooled
Investment
Vehicles | | Total
Assets
($MM) | | Number
of Other
Accounts | | Total
Assets
($MM) |
| Eric P. Kang | | 4 | | 5,724.03 | | 1 | | 239.94 | | 1 | | 76.30 |
| Adam C. Castle | | 13 | | 66,915.83 | | 7 | | 9,434.35 | | 0 | | 0 |
| Kewjin Yuoh | | 16 | | 96,873.57 | | 9 | | 10,248.22 | | 671 | | 239.17 |
| Steven F. Rocco | | 20 | | 97,377.70 | | 14 | | 11,010.88 | | 14 | | 3,987.52 |
None of the registered investment companies, pooled investment vehicles or other accounts listed above are subject to an advisory fee that is based on the performance of the account.
Conflicts of interest may arise in connection with the portfolio managers’ management of the investments of the Fund and the investments of the other accounts included in the table above.
Such conflicts may arise with respect to the allocation of investment opportunities between the Fund and other accounts with similar investment objectives and policies. A portfolio manager potentially could use information concerning the Fund’s transactions to the advantage of other accounts and to the detriment of the Fund. To address these potential conflicts of interest, Lord Abbett has adopted and implemented a number of policies and procedures. Lord Abbett has adopted Policies and Procedures Relating to Client Brokerage and Soft Dollars, as well as Evaluation of Proprietary Research Policy and Procedures. The objective of these policies and procedures is to ensure the fair and equitable treatment of transactions and allocation of investment opportunities on behalf of all accounts managed by Lord Abbett. In addition, Lord Abbett’s Code of Ethics sets forth general principles for the conduct of employee personal securities transactions in a manner that avoids any actual or potential conflicts of interest with the interests of Lord Abbett’s clients, including the Funds. Moreover, Lord Abbett’s Insider Trading and Receipt of Material Non-Public Information Policy and Procedure sets forth procedures for personnel to follow when they have material non-public information. Lord Abbett is not affiliated with a full service broker-dealer and, therefore, does not execute any portfolio transactions through such an entity, a structure that could give rise to additional conflicts. Lord Abbett does not conduct any investment banking functions and does not manage any hedge funds. Lord Abbett does not believe that any material conflicts of interest exist in connection with the portfolio managers’ management of the investments of the Funds and the investments of the other accounts in the table referenced above.
(a)(3) Portfolio Manager Compensation
The discussion below describes the portfolio managers’ compensation as of December 31, 2024.
When used in this section, the term “fund” refers to the Fund, as well as any other registered investment companies, pooled investment vehicles, and accounts managed by a portfolio manager. Each portfolio manager receives compensation from Lord Abbett consisting of a salary, bonus, and profit-sharing plan contributions. The level of base compensation takes into account the portfolio manager’s experience, reputation, and competitive market rates, as well as the portfolio manager’s leadership and management of the investment team.
Fiscal year-end bonuses, which can be a substantial percentage of overall compensation, are determined after an evaluation of various factors. These factors include the portfolio manager’s investment results and style consistency, the dispersion among funds with similar objectives, the risk taken to achieve the returns, and similar factors. In considering the portfolio manager’s investment results, Lord Abbett’s senior leaders may evaluate the Fund’s performance against one or more benchmarks from among the Fund’s primary benchmark and any supplemental benchmarks as disclosed in the prospectus, indices disclosed as performance benchmarks by the portfolio manager’s other accounts, and other indices within one or more of the Fund’s peer groups (as defined from time to time by third party investment research companies), as well as the Fund’s peer group. In particular, investment results are evaluated based on an assessment of the portfolio manager’s one-, three-, and five-year investment returns on a pre-tax basis versus the benchmark. Finally, there is a component of
the bonus that rewards leadership and management of the investment team. The evaluation does not follow a formulaic approach, but rather is reached following a review of these factors. No part of the bonus payment is based on the portfolio manager’s assets under management, the revenues generated by those assets, or the profitability of the portfolio manager’s team. In addition, Lord Abbett may designate a bonus payment of a manager for participation in the firm’s deferred compensation plan. Depending on the employee’s level they will receive either an award under the Managing Director Award Plan or the Investment Capital Appreciation Plan. Both of these plans, following a three-year qualification period, provide for a deferred payout over a five-year period. The plan’s earnings are based on the overall average net asset growth of the firm as a whole or percentile performance of our funds against benchmarks as a whole. Lord Abbett believes these incentives focus portfolio managers on the impact their Fund’s performance has on the overall reputation of the firm as a whole and encourages exchanges of investment ideas among investment professionals managing different mandates.
Lord Abbett provides a 401(k) profit-sharing plan for all eligible employees. Contributions to a portfolio manager’s profit-sharing account are based on a percentage of the portfolio manager’s total base and bonus paid during the fiscal year, subject to a specified maximum amount.
(a)(4) Securities Ownership of Portfolio Managers
The following table indicates the dollar range of securities beneficially owned by each portfolio manager in the Fund he or she manages, as of December 31, 2024. This table includes the value of securities beneficially owned by such portfolio managers through 401(k) plans and certain other plans or accounts, if any.
Ownership of Securities | Aggregate Dollar Range of Securities* |
| Eric P. Kang | $50,001 - $100,000 |
| Adam C. Castle | $100,001 - $500,000 |
| Kewjin Yuoh | $10,001 - $50,000 |
| Steven F. Rocco | Over $1,000,000 |
*Dollar ranges are as follows: None, $1–$10,000, $10,001–$50,000, $50,001–$100,000, $100,001–$500,000, $500,001–$1,000,000 or Over $1,000,000.
| (b): | Portfolio Manager Changes Since Most Recent Annual Report |
None.
| Item 14: | Purchases of Equity Securities by Closed-End Management Investment Company and Affiliated Purchasers. |
No purchases were made during the reporting period by or on behalf of the registrant or any “affiliated purchaser,” as defined in Rule 10b-18(a)(3) under the Exchange Act (17 CFR 240.10b-18(a)(3)), of shares or other units of any class of the registrant’s equity securities that is registered by the registrant pursuant to Section 12 of the Exchange Act (15 U.S.C. 781).
| Item 15: | Submission of Matters to a Vote of Security Holders. |
During the period ended December 31, 2024, there were no material changes to the procedures by which shareholders may recommend nominees to the registrant’s board of trustees.
| Item 16: | Controls and Procedures. |
| (a) | The principal executive officer and principal financial & accounting officer have concluded as of a date within 90 days of the filing date of this report, based on their evaluation of the Registrant’s disclosure controls and procedures (as defined in Rule 30a-3(c) under the Investment Company Act of 1940), that the design of such procedures is effective to provide reasonable assurance that material information required to be disclosed by the Registrant on Form N-CSR is recorded, processed, summarized and reported within the time periods specified in the Commission’s rules and forms. |
| (b) | There were no changes in the Registrant’s internal control over financial reporting (as defined in Rule 30a-3(d) under the Investment Company Act of 1940) that occurred during the period covered by this report that have materially affected, or are reasonably likely to materially affect, the Registrant’s internal control over financial reporting. |
| Item 17: | Disclosure of Securities Lending Activities for Closed-End Management Investment Companies. |
(a) The following table shows the dollar amounts of income, and dollar amounts of fees and/or compensation paid, relating to the Fund’s securities lending activities during the fiscal year ended December 31, 2024.
| (1) | | Gross income from securities lending activities | | $ | 1,341,168 | |
| (2) | | Fees and/or compensation for securities lending activities and related services | | | | |
| | | (a) Securities lending income paid to Citi for services as securities lending agent | | $ | 33,495 | |
| | | (b) Collateral management expenses not included in (a) | | $ | 0 | |
| | | (c) Administrative fees not included in (a) | | $ | 0 | |
| | | (d) Indemnification fees not included in (a) | | $ | 0 | |
| | | (e) Rebate (paid to borrowers) | | $ | 1,006,206 | |
| | | (f) Other fees not included in (a) | | $ | 0 | |
| (3) | | Aggregate fees/compensation for securities lending activities | | $ | 1,039,701 | |
| (4) | | Net income from securities lending activities | | $ | 301,466 | |
(b) Citibank, N.A. (“Citi”) serves as securities lending agent for the Fund and in that role administers the Fund’s securities lending program pursuant to the terms of a securities lending agency agreement entered into between the Fund and Citi.
Item 18: Reward of Erroneously Awarded Compensation.
Item 19: Exhibits.
(a)(1) The Lord Abbett Family of Funds Sarbanes-Oxley Code of Ethics for the Principal Executive Officer and Senior Financial Officers is attached hereto as part of EX-99.CODEETH.
(a)(2) Not applicable.
(a)(3) Certification of each principal executive officer and principal financial officer of the registrant as required by Rule 30a-2(a) under the Investment Company Act of 1940 is attached hereto as a part of EX-99.CERT.
(a)(4) Not applicable.
(a)(5) There was no change in the registrant’s independent public accountant for the period covered by this report.
SIGNATURES
Pursuant to the requirements of the Securities Exchange Act of 1934 and the Investment Company Act of 1940, the Registrant has duly caused this report to be signed on its behalf by the undersigned, thereunto duly authorized.
LORD ABBETT CREDIT OPPORTUNITIES FUND
| | By: | /s/Steven F. Rocco |
| | | Steven F. Rocco |
| | | President and Chief Executive Officer |
| | | (Principal Executive Officer) |
Date: February 26, 2025
Pursuant to the requirements of the Securities Exchange Act of 1934 and the Investment Company Act of 1940, this report has been signed below by the following persons on behalf of the Registrant and in the capacities and on the dates indicated.
| | By: | /s/Steven F. Rocco |
| | | Steven F. Rocco |
| | | President and Chief Executive Officer |
| | | (Principal Executive Officer) |
Date: February 26, 2025
| | By: | /s/Michael J. Hebert |
| | | Michael J. Hebert |
| | | Chief Financial Officer and Treasurer |
Date: February 26, 2025