UNITED STATES SECURITIES AND EXCHANGE COMMISSION
Washington, D.C. 20549
__________________________________
Form 20-F
__________________________________
|
| |
| ¨ | REGISTRATION STATEMENT PURSUANT TO SECTION 12(b) OR (g) OF THE SECURITIES EXCHANGE ACT OF 1934 |
| OR |
| x | ANNUAL REPORT PURSUANT TO SECTION 13 OR 15(d) OF THE SECURITIES EXCHANGE ACT OF 1934 |
| For the fiscal year ended December 31, 2018 |
| OR |
| ¨ | TRANSITION REPORT PURSUANT TO SECTION 13 OR 15(d) OF THE SECURITIES EXCHANGE ACT OF 1934 |
| OR |
| ¨ | SHELL COMPANY REPORT PURSUANT TO SECTION 13 OR 15(d) OF THE SECURITIES EXCHANGE ACT OF 1934 |
For the transition period from to
Commission file number 333-228667
__________________________________
Sands China Ltd.
(Exact name of Registrant as specified in its charter)
__________________________________
Cayman Islands
(Jurisdiction of Incorporation or Organization)
__________________________________
The Venetian Macao Resort Hotel, L2 Executive Offices
Estrada da Baía de N. Senhora da Esperança, s/n
Macao SAR
(Address of principal executive offices)
__________________________________
Dylan Williams, Company Secretary
Sands China Ltd.
The Venetian Macao Resort Hotel, Legal Department, L2 Executive Offices
Estrada da Baía de N. Senhora da Esperança, s/n
Macao SAR
Telephone: +853 8118-2888 Facsimile: +853 2888-3382
(Name, Telephone, E-mail and/or Facsimile number and Address of Company Contact Person)
__________________________________
Securities registered or to be registered pursuant to Section 12(b) of the Act:
|
| | |
| Title of Each Class | | Name of Each Exchange on Which Registered |
| N/A | | N/A |
Securities registered or to be registered pursuant to Section 12(g) of the Act:
None
__________________________________
Securities for which there is a reporting obligation pursuant to Section 15(d) of the Act:
4.600% Notes Due August 8, 2023
5.125% Notes Due August 8, 2025
5.400% Notes Due August 8, 2028
__________________________________
Indicate the number of outstanding shares of each of the issuer’s classes of capital or common stock as of the close of the period covered by the annual report.
8,080,603,691 ordinary shares outstanding as of December 31, 2018
Indicate by check mark if the registrant is a well-known seasoned issuer, as defined in Rule 405 of the Securities Act. Yes ¨ No x
If this report is an annual or transition report, indicate by check mark if the registrant is not required to file reports pursuant to Section 13 or 15(d) of the Securities Exchange Act of 1934. Yes ¨ No x
Indicate by check mark whether the registrant (1) has filed all reports required to be filed by Section 13 or 15(d) of the Securities Exchange Act of 1934 during the preceding 12 months (or for such shorter period that the registrant was required to file such reports), and (2) has been subject to such filing requirements for the past 90 days. Yes x No ¨
Indicate by check mark whether the registrant has submitted electronically every Interactive Data File required to be submitted pursuant to Rule 405 of Regulation S-T (§232.405 of this chapter) during the preceding 12 months (or for such shorter period that the registrant was required to submit such files). Yes x No ¨
Indicate by check mark whether the registrant is a large accelerated filer, an accelerated filer, a non-accelerated filer, or an emerging growth company. See definition of “large accelerated filer,” “accelerated filer,” and “emerging growth company” in Rule 12b-2 of the Exchange Act. (Check one):
|
| | | | | | | | | | |
| Large accelerated filer | ¨ | | Accelerated filer | ¨ | | Non-Accelerated filer | x | | Emerging growth company | ¨ |
If an emerging growth company that prepares its financial statements in accordance with U.S. GAAP, indicate by check mark if the registrant has elected not to use the extended transition period for complying with any new or revised financial accounting standards provided pursuant to Section 13(a) of the Exchange Act. ☐
† The term “new or revised financial accounting standard” refers to any update issued by the Financial Accounting Standards Board to its Accounting Standards Codification after April 5, 2012.
Indicate by check mark which basis of accounting the registrant has used to prepare the financial statements included in this filing:
|
| | | | | | | |
| U.S. GAAP | ¨ | | International Financial Reporting Standards as issued by the International Accounting Standards Board | x | | Other | ¨ |
If “Other” has been checked in response to the previous question, indicate by check mark which financial statement item the registrant has elected to follow. Item 17 ¨ Item 18 ¨
If this is an annual report, indicate by check mark whether the registrant is a shell company (as defined in Rule 12b-2 of the Exchange Act). Yes ¨ No x
(APPLICABLE ONLY TO ISSUERS INVOLVED IN BANKRUPTCY PROCEEDINGS DURING THE PAST FIVE YEARS)
Indicate by check mark whether the registrant has filed all documents and reports required to be filed by Sections 12, 13 or 15(d) of the Securities Exchange Act of 1934 subsequent to the distribution of securities under a plan confirmed by a court. Yes ¨ No ¨
TABLE OF CONTENTS
PART I
ITEM 1. — IDENTITY OF DIRECTORS, SENIOR MANAGEMENT AND ADVISERS
Not applicable.
ITEM 2. — OFFER STATISTICS AND EXPECTED TIMETABLE
Not applicable.
ITEM 3. — KEY INFORMATION
A. SELECTED FINANCIAL INFORMATION
The following selected historical financial and other data as of and for the years ended December 31, 2018 and 2017, and for the year ended December 31, 2016, have been derived from our audited consolidated financial statements included elsewhere in this annual report. The following selected historical financial and other data as of December 31, 2016, and as of and for the years ended December 31, 2015 and 2014, have been derived from our audited consolidated financial statements not included in this annual report. Our audited consolidated financial statements are prepared in accordance with IFRS.
We adopted IFRS 15, Revenue from Contracts with Customers, effective January 1, 2018, by applying the full retrospective method. See Note 2 (b) “Summary of Significant Accounting Policies — Change in Accounting Policies and Disclosures” to our audited consolidated financial statements included in this annual report for further information regarding these changes. Revenues and operating expenses for the year ended December 31, 2014 were not revised and are presented in accordance with International Accounting Standard 18, Revenue, and related interpretations.
You should read this section in conjunction with “Item 4 — Information on the Company — B. Business Overview” and those financial statements and the notes to those statements included elsewhere in this annual report. The results for any historical period are not necessarily indicative of the results of operations to be expected in any future period.
|
| | | | | | | | | | | | | | | | | | | |
| | Year Ended December 31, |
| | 2018 | | 2017 | | 2016 | | 2015 | | 2014 |
| | (US$ in millions, except per share data) |
| Consolidated income statement data | | | | | | | | | |
| Net revenues | $ | 8,665 |
| | $ | 7,586 |
| | $ | 6,543 |
| | $ | 6,683 |
| | $ | 9,505 |
|
| Operating profit | $ | 2,154 |
| | $ | 1,773 |
| | $ | 1,352 |
| | $ | 1,519 |
| | $ | 2,624 |
|
| Profit attributable to equity holders of the Company | $ | 1,875 |
| | $ | 1,603 |
| | $ | 1,224 |
| | $ | 1,459 |
| | $ | 2,548 |
|
| Earnings per share for profit attributable to equity holders of the Company | | | | | | | | | |
| - Basic | US23.21 cents |
| | US19.86 cents |
| | US15.17 cents |
| | US18.09 cents |
| | US31.59 cents |
|
| - Diluted | US23.19 cents |
| | US19.85 cents |
| | US15.17 cents |
| | US18.08 cents |
| | US31.56 cents |
|
| Dividends declared per share (HK$) | HK$1.99 |
| | HK$1.99 |
| | HK$1.99 |
| | HK$1.99 |
| | HK$1.99 |
|
Dividends declared per share (US$)(i) | US25.40
cents |
| | US25.40
cents |
| | US25.70
cents |
| | US25.70 cents |
| | US25.70 cents |
|
| Consolidated balance sheet and other financial data (at year end) | | | | | | | | | |
| Total assets | $ | 12,058 |
| | $ | 10,647 |
| | $ | 11,183 |
| | $ | 10,772 |
| | $ | 11,348 |
|
| Share capital | $ | 81 |
| | $ | 81 |
| | $ | 81 |
| | $ | 81 |
| | $ | 81 |
|
| Total equity | $ | 4,409 |
| | $ | 4,538 |
| | $ | 5,007 |
| | $ | 5,839 |
| | $ | 6,429 |
|
| Weighted average number of shares | | | | | | | | | |
| - Basic (thousand shares) | 8,078,946 |
| | 8,072,709 |
| | 8,070,042 |
| | 8,068,742 |
| | 8,065,321 |
|
| - Diluted (thousand shares) | 8,086,274 |
| | 8,077,253 |
| | 8,071,651 |
| | 8,070,572 |
| | 8,072,743 |
|
| | | | | | | | | | |
____________________
| |
| (i) | The translation of dividends declared per share from HK$ amounts into US$ amounts has been made at the exchange rates in effect at the time of the transaction. |
B. CAPITALIZATION AND INDEBTEDNESS
Not applicable.
C. REASONS FOR THE OFFER AND USE OF PROCEEDS
Not applicable.
D. RISK FACTORS
You should carefully consider the risks described below and the other information contained in this annual report in connection with evaluating the Company. Additional risks and uncertainties not currently known to us or that we currently deem to be immaterial may also have a material adverse effect on the business, financial condition, results of operations and cash flows.
The Macao Government could grant additional rights to conduct gaming in the future.
We hold a subconcession under one of only six gaming concessions and subconcessions authorized by the Macao Government to operate casinos in Macao. No additional concessions or subconcessions have been granted since 2002; however, if the Macao Government were to allow additional gaming operators in Macao, we would face additional competition, which could have a material adverse effect on our financial condition, results of operations and cash flows.
Our business is particularly sensitive to reductions in discretionary consumer and corporate spending as a result of downturns in the economy.
Consumer demand for hotel/casino resorts, trade shows and conventions and for the type of luxury amenities we offer is particularly sensitive to downturns in the economy and the corresponding impact on discretionary spending. Changes in discretionary consumer spending or corporate spending on conventions and business travel could be driven by many factors, such as: perceived or actual general economic conditions; any weaknesses in the job or housing market, additional credit market disruptions; high energy, fuel and food costs; the increased cost of travel; the potential for bank failures; perceived or actual disposable consumer income and wealth; fears of recession and changes in consumer confidence in the economy; or fears of war and future acts of terrorism. These factors could reduce consumer and corporate demand for the luxury amenities and leisure and business activities we offer, thus imposing additional limits on pricing and harming our operations.
The number of visitors to Macao, particularly visitors from mainland China, may decline or travel to Macao may be disrupted.
Our VIP and mass market gaming customers typically come from nearby destinations in Asia, including mainland China, Hong Kong, South Korea and Japan. Increasingly, a significant number of gaming customers come to our casinos from mainland China. Any slowdown in economic growth or changes of China’s current restrictions on travel and currency movements could further disrupt the number of visitors from mainland China to our properties as well as the amounts they are willing and able to spend while at our properties.
Policies and measures adopted from time to time by the Chinese government include restrictions imposed on exit visas granted to residents of mainland China for travel to Macao and Hong Kong. These measures have, and any future policy developments implemented may have, the effect of reducing the number of visitors to Macao from mainland China, which could adversely impact tourism and the gaming industry in Macao.
Our operations face intense competition.
The hotel, resort and casino businesses are highly competitive. Our operations currently compete with numerous other casinos located in Macao. Additional Macao facilities announced by our competitors and the increasing capacity of hotel rooms in Macao could add to the competitive dynamic of the market.
Our operations will also compete to some extent with casinos located elsewhere in Asia, including Singapore, South Korea, Malaysia, Philippines, Australia, Cambodia and elsewhere in the world, including Las Vegas, as well as online gaming and cruise ships that offer gaming. Our operations also face increased competition from new developments in Malaysia, Australia and South Korea. In addition, certain countries have legalized, and others may in the future legalize, casino gaming, including Japan, Taiwan, Thailand and Vietnam.
The proliferation of gaming venues, especially in Southeast Asia, could have a significant and adverse effect on our financial condition, results of operations and cash flows.
Our business could be adversely affected by the limitations of the pataca exchange markets and restrictions on the export of the Renminbi.
Our revenues in Macao are denominated in patacas, the legal currency of Macao, and HK dollars. The Macao pataca is pegged to the HK dollar (which is pegged to the US$) and, in many cases, is used interchangeably with the HK dollar in Macao. Although currently
permitted, we cannot assure you patacas will continue to be freely exchangeable into U.S. dollars. Also, our ability to convert large amounts of patacas into U.S. dollars over a relatively short period may be limited.
We are currently prohibited from accepting wagers in Renminbi, the legal currency of China. There are also restrictions on the remittance of the Renminbi from mainland China and the amount of Renminbi that can be converted into foreign currencies, including the pataca and HK dollar. Restrictions on the remittance of the Renminbi from mainland China may impede the flow of gaming customers from mainland China to Macao, inhibit the growth of gaming in Macao and negatively impact our gaming operations. There is no assurance incremental mainland Chinese regulations will not be promulgated in the future that have the effect of restricting or eliminating the remittance of Renminbi from mainland China. Further, if any new mainland Chinese regulations are promulgated in the future that have the effect of permitting or restricting (as the case may be) the remittance of Renminbi from mainland China, then such remittances will need to be made subject to the specific requirements or restrictions set out in such rules.
Conducting business in Macao has certain political and economic risks.
Our operations in Macao include The Venetian Macao, Sands Cotai Central, The Parisian Macao, The Plaza Macao and Sands Macao. Accordingly, our business development plans, financial condition, results of operations and cash flows may be materially and adversely affected by significant political, social and economic developments in Macao, and by changes in policies of the government or changes in laws and regulations or their interpretations. Our operations in Macao are also exposed to the risk of changes in laws and policies that govern operations of companies based in Macao. Jurisdictional tax laws and regulations may also be subject to amendment or different interpretation and implementation, thereby having an adverse effect on our profitability after tax. These changes may have a material adverse effect on our financial condition, results of operations and cash flows.
Current Macao laws and regulations concerning gaming and gaming concessions and licenses are, for the most part, fairly recent and there is little precedent on the interpretation of these laws and regulations. We believe our organizational structure and operations are in compliance in all material respects with all applicable laws and regulations of Macao. These laws and regulations are complex and a court or an administrative or regulatory body may in the future render an interpretation of these laws and regulations, or issue regulations, which differs from our interpretation and could have a material adverse effect on our financial condition, results of operations and cash flows.
In addition, our activities in Macao are subject to administrative review and approval by various government agencies. We cannot assure you we will be able to obtain all necessary approvals, which may have a material adverse effect on our long-term business strategy and operations. Macao laws permit redress to the courts with respect to administrative actions; however, such redress is largely untested in relation to gaming issues.
On October 6, 2014, the Macao Government approved smoking control legislation, which prohibits smoking in casinos. This legislation, as amended on July 14, 2017 and effective as of January 1, 2018, permits casinos to maintain designated smoking rooms opened to the public, as long as such rooms comply with certain conditions, including no gaming equipment is installed within a three-meter radius from their entrance doors, they are physically separated from the remaining areas, and no activity other than smoking is conducted inside the rooms including gaming. Such legislation may deter potential gaming customers who are smokers from frequenting casinos in jurisdictions with smoking bans such as Macao. Such laws and regulations could change or could be interpreted differently in the future. We cannot predict the future likelihood or outcome of similar legislation or referendums or the magnitude of any decrease in revenues as a result of such regulations, though any smoking ban could have an adverse effect on our business, financial condition, results of operations and cash flows.
Our business is sensitive to the willingness of our customers to travel. Acts of terrorism, regional political events and developments in the conflicts in certain countries could cause severe disruptions in air travel that reduce the number of visitors to our facilities.
We are dependent on the willingness of our customers to travel. Only a small amount of our business is and will be generated by local residents. Most of our customers travel to reach our properties. Acts of terrorism may severely disrupt domestic and international travel, which would result in a decrease in customer visits to Macao, including our properties. Regional political events, including those resulting in travelers perceiving areas as unstable or an unwillingness of governments to grant visas, regional conflicts or an outbreak of hostilities or war could have a similar effect on domestic and international travel. Management cannot predict the extent to which disruptions in air or other forms of travel as a result of any further terrorist acts, regional political events, regional conflicts or outbreak of hostilities or war would have a material adverse effect on our business, financial condition, results of operations and cash flows.
Our failure to maintain the integrity of our information and information systems, which contain legally protected information about us and others, could happen in a variety of ways, including as a result of unauthorized access, breach of our cybersecurity systems and measures, or other disruption or corruption of our information systems, software or data, or access to information stored outside of our information systems, and could impair our ability to conduct our business operations, delay our ability to
recognize revenue, compromise the integrity of our business and services, result in significant data losses and the theft of our intellectual property, damage our reputation, expose us to liability to third parties, regulatory fines and penalties, and require us to incur significant costs to maintain the privacy and security of our information, network and data.
We face global cybersecurity and information security threats, which may range from uncoordinated individual attempts to sophisticated and targeted measures directed at us. Cyber-attacks and information security breaches may include, but are not limited to, attempts to access information, including legally protected information about people including customers and company information, computer malware such as viruses, denial of service, ransomware attacks that encrypt, exfiltrate, or otherwise render data unusable or unavailable in an effort to extort money or other consideration as a condition to purportedly returning the data to a usable form, operator errors or misuse, or inadvertent releases of data or documents, and other forms of electronic and non-electronic information security breaches.
Our business requires the collection and retention of large volumes of data and non-electronic information, including credit card numbers and other legally protected information about people in various information systems we maintain and in those maintained by third parties with whom we contract and may share data. We also maintain important internal company information such as legally protected information about our employees and information relating to our operations. The integrity and protection of that legally protected information about people and company information are important to us. Our collection of such legally protected information about people and company information is subject to extensive regulation by private groups such as the payment card industry as well as domestic and foreign governmental authorities, including gaming authorities. If a cybersecurity or privacy event occurs, we may be unable to satisfy applicable laws and regulations or the expectation of regulators, employees, customers or other impacted individuals.
Privacy and cybersecurity laws and regulations are developing and changing frequently, and vary significantly by jurisdiction. Many applicable laws and regulations protecting privacy and addressing cybersecurity have not yet been interpreted by regulators or courts, which causes uncertainty. We may incur significant costs in our efforts to comply with the various applicable privacy and cybersecurity laws and regulations as they emerge and change. Also, privacy and cybersecurity laws and regulations may limit our ability to protect individuals, including customers and employees. For example, these laws and regulations may restrict information sharing in ways that make it more difficult to obtain or share information concerning at-risk individuals. Compliance with applicable privacy laws and regulations also may adversely impact our ability to market our products, properties, and services to our guests and patrons. In addition, non-compliance by us, or potentially by third parties with which we share information, with any applicable privacy and cybersecurity law or regulation, including accidental loss, inadvertent disclosure, unauthorized access or dissemination, or breach of security may result in damage to our reputation and could subject us to fines, penalties, required corrective actions, lawsuits, payment of damages, or restrictions on our use or transfer of data. We are subject to different regulators' and others' interpretations of our compliance with these new and changing laws and regulations.
In addition, LVS, our parent, has experienced a sophisticated criminal cybersecurity attack in the past, including a breach of its information technology systems in which customer and company information was compromised and certain company data may have been destroyed, and LVS or we may experience additional cybersecurity attacks in the future, potentially with more frequency or sophistication. We rely on proprietary and commercially available systems, software, tools, and monitoring to provide security for processing, transmission, and storage of customer and employee information, such as payment card and other confidential or proprietary information. We also rely extensively on computer systems to process transactions, maintain information, and manage our businesses. Disruptions in the availability of our computer systems, through cyber-attacks or otherwise, could impact our ability to service our customers and adversely affect our revenues and results of operations. For instance, there has been an increase in criminal cybersecurity attacks against companies where customer and company information has been compromised and company data has been destroyed. Our information systems and records, including those we maintain with third-party service providers, as well as the systems of other third parties that share data with us under contractual agreements, may be subject to cyber-attacks and information security breaches. Our third-party information system service providers and other third parties that share data with us pursuant to contractual agreements face risks relating to cybersecurity and privacy similar to ours, and we do not directly control any of such parties' information security or privacy operations. For example, the systems currently used for the transmission and approval of payment card transactions, and the technology utilized in payment cards themselves, all of which can put payment card data at risk, are determined and controlled by the payment card industry, not us.
A significant theft, destruction, loss or fraudulent use of legally protected information about people or company information maintained by us or by a third-party service provider or other third party that shares data with us pursuant to contractual agreement could have an adverse effect on our reputation, cause a material disruption to our operations and management team and result in remediation expenses (including liability for stolen assets or information, repairing system damage and offering incentives to customers or business partners to maintain their relationships after an attack) and regulatory fines, penalties and corrective actions, or lawsuits by regulators, third-party service providers, third parties that share data with us pursuant to contractual agreements and/or people whose data is or may be impacted. Such theft, destruction, loss or fraudulent use could also result in litigation by shareholders alleging our privacy protections and protections against cyber-attacks were insufficient, our response to an attack was faulty or insufficient care was taken in ensuring we were able to comply with cybersecurity, privacy or data protection regulations, protect information, identify risks and attacks, or
respond to and recover from a cyber-attack, or by customers and other parties whose information was subject to such attacks. Advances in computer software capabilities and encryption technology, new tools, and other developments, including continuously evolving attack methods that may exploit vulnerabilities based on these advances, may increase the risk of a security breach or other intrusion. In addition, we may incur increased cybersecurity and privacy protection costs that may include organizational changes, deploying additional personnel and protection technologies, training employees and engaging third-party experts and consultants. There can be no assurance the insurance we have in place relating to cybersecurity and privacy risks will be sufficient in the event of a major cybersecurity or privacy event. Any of these events could have a material adverse effect on our business, financial condition, results of operations and cash flows.
We are subject to extensive regulation and the cost of compliance or failure to comply with such regulations.
We are required to obtain and maintain licenses from various jurisdictions in order to operate certain aspects of our business, and we are subject to extensive background investigations and suitability standards in our gaming business. We also will become subject to regulation in any other jurisdiction where we choose to operate in the future. There can be no assurance we will be able to obtain new licenses or renew any of our existing licenses, or if such licenses are obtained, such licenses will not be conditioned, suspended or revoked; and the loss, denial or non-renewal of any of our licenses could have a material adverse effect on our business, financial condition, results of operations and cash flows.
We are a subsidiary of LVS and are therefore subject to certain Nevada gaming laws, which apply to our gaming activities and associations in jurisdictions outside the State of Nevada. We are required to comply with certain reporting requirements concerning our current and proposed gaming activities and associations occurring outside the State of Nevada, including Macao. Also, as we are required to provide any other information the Nevada Commission may require concerning our gaming activities and associations in jurisdictions outside the State of Nevada, we could be subject to disciplinary action by the Nevada Commission if our current reporting is determined to be unsatisfactory due to Macao regulations regarding personal data protection prohibiting us from satisfying certain reporting requirements of the Nevada Commission.
We are also subject to regulations imposed by the FCPA, which generally prohibits U.S. companies and their intermediaries from making improper payments to foreign officials for the purpose of obtaining or retaining business. LVS entered into a comprehensive civil administrative settlement with the SEC on April 7, 2016, and a non-prosecution agreement with the DOJ on January 19, 2017, which resolved all inquiries related to these government investigations and include ongoing reporting obligations to the DOJ through January 2020. Any violation of the FCPA could have a material adverse effect on our business, financial condition, results of operations and cash flows.
We also deal with significant amounts of cash in our operations and are subject to various reporting and anti-money laundering regulations. Recently, various governmental authorities have evidenced an increased focus on the gaming industry and compliance with anti-money laundering laws and regulations. For instance, we are subject to regulation which, among other things, requires us to report to the various government authorities certain currency transactions in excess of applicable thresholds and certain suspicious activities where we know, suspect or have reason to suspect such transactions involve funds from illegal activity or are intended to violate certain laws or regulations or are designed to evade reporting requirements or have no business or lawful purpose. In addition, we are subject to various other rules and regulations involving reporting, recordkeeping and retention. Our compliance with these requirements is subject to periodic audits, and we may be subject to substantial civil and criminal penalties, including fines, if we fail to comply with applicable regulations. We are also subject to regulations set forth by the gaming authorities in the areas in which we operate. Any such laws and regulations could change or could be interpreted differently in the future, or new laws and regulations could be enacted. Any violation of anti-money laundering laws or regulations, or any accusations of money laundering or regulatory investigations into possible money laundering activities, by any of our properties, employees or customers could have a material adverse effect on our business, financial condition, results of operations and cash flows.
We are currently not required to pay corporate income taxes on our casino gaming operations in Macao. Additionally, we currently have an agreement with the Macao Government providing for a fixed annual payment as a substitution for a 12% tax otherwise due from VML’s shareholders on dividends distributed from our gaming operations. These tax arrangements expire on June 26, 2022, the date our subconcession agreement expires.
We have had the benefit of a corporate tax exemption in Macao, which exempts us from paying the 12% corporate income tax on profits generated by the operation of casino games. This exemption does not apply to our non-gaming activities. We will continue to benefit from this tax exemption through June 26, 2022, the date our subconcession agreement expires. Additionally, we entered into an agreement with the Macao Government in April 2019, effective through June 26, 2022, providing for an annual payment as a substitution for a 12% tax otherwise due from VML shareholders on dividend distributions paid from VML gaming profits. There is no certainty these agreements will be extended beyond their expiration dates, which could have a material adverse effect on our financial condition, results of operations and cash flows.
We will stop generating any gaming revenues from our operations if we cannot secure an extension of our subconcession in 2022 or if the Macao Government exercises its redemption right.
Our subconcession agreement expires on June 26, 2022. Unless our subconcession is extended, all of VML’s casino premises and gaming-related equipment will be transferred automatically to the Macao Government on that date without compensation to us and we will cease to generate gaming revenues from these operations. Beginning on December 26, 2017, the Macao Government may redeem the subconcession agreement by providing us at least one-year prior notice. In the event the Macao Government exercises this redemption right, we are entitled to fair compensation or indemnity. The amount of this compensation or indemnity will be determined based on the amount of gaming and non-gaming revenue generated by VML during the tax year prior to the redemption multiplied by the number of remaining years before expiration of the subconcession. We cannot assure you we will be able to renew or extend our subconcession agreement on terms favorable to us or at all. We also cannot assure you if our subconcession is redeemed, the compensation paid will be adequate to compensate us for the loss of future revenues.
Our subconcession can be terminated under certain circumstances without compensation to us.
The Macao Government has the right, after consultation with Galaxy Casino S.A. (one of the three Concessionaires), to unilaterally terminate our subconcession in the event of VML’s serious non-compliance with its basic obligations under the subconcession and applicable Macao laws. Upon termination of our subconcession, our casinos and gaming-related equipment would automatically be transferred to the Macao Government without compensation to us and we would cease to generate any revenues from these operations. The loss of our subconcession would prohibit us from conducting gaming operations in Macao, which would have a material adverse effect on our business, financial condition, results of operations and cash flows.
We are dependent upon gaming promoters for a portion of our gaming revenues in Macao.
Gaming promoters, which promote gaming and draw VIP patrons to casinos, are responsible for a portion of our gaming revenues in Macao. With the increased number of gaming facilities in Macao, the competition for relationships with gaming promoters has increased. There can be no assurance we will be able to maintain, or grow, our relationships with gaming promoters. If we are unable to maintain or grow our relationships with gaming promoters, or if the gaming promoters experience financial difficulties or are unable to develop or maintain relationships with our VIP patrons, our ability to grow our gaming revenues will be hampered.
If gaming promoters attempt to negotiate changes to our operational agreements, including higher commissions, it could result in higher costs for us, loss of business to a competitor or loss of relationships with gaming promoters. Given regulatory requirements and certain economic and other factors occurring in the region, gaming promoters may encounter difficulties in attracting patrons to come to Macao, resulting in decreased gaming volume at our properties. Credit already extended by gaming promoters to their patrons may become increasingly difficult for them to collect. This inability to attract sufficient patrons, grant credit and collect amounts due in a timely manner could negatively affect gaming promoters’ activities, cause gaming promoters to wind up or liquidate their operations or result in gaming promoters leaving Macao. The above factors affecting gaming promoters could have a material adverse effect on our business, financial condition, results of operations and cash flows.
In addition, the quality of gaming promoters with whom we have relationships is important to our reputation and our ability to continue to operate in compliance with our gaming license. While we strive for excellence in our associations with gaming promoters, we cannot assure you the gaming promoters with whom we are associated will meet the high standards we insist upon. If a gaming promoter falls below our standards, we may suffer reputational harm, as well as worsening relationships with, and possible sanctions from, gaming regulators with authority over our operations. In the event a gaming promoter does not meet its financial obligations, there can be no assurance we may not incur financial exposure.
We extend credit to a large portion of our customers and we may not be able to collect gaming receivables from our credit players.
We conduct our gaming activities on a credit and cash basis. Any such credit we extend is unsecured. Table games players typically are extended more credit than slot players, and high-stakes players typically are extended more credit than players who tend to wager lesser amounts. High-end gaming is more volatile than other forms of gaming, and variances in win-loss results attributable to high-end gaming may have a significant positive or negative impact on cash flow and earnings in a particular quarter.
During the year ended December 31, 2018, approximately 15.3% of our table games drop, was from credit-based wagering. We extend credit to those customers whose level of play and financial resources warrant, in the opinion of management, an extension of credit. These large receivables could have a significant impact on our results of operations if deemed uncollectible.
In particular, we expect our operations will be able to enforce gaming debts only in a limited number of jurisdictions, including Macao. To the extent our gaming customers and gaming promoters are from other jurisdictions, our operations may not have access to a forum in which it will be possible to collect all gaming receivables because, among other reasons, courts of many jurisdictions do not
enforce gaming debts and our operations may encounter forums that will refuse to enforce such debts. Moreover, under applicable law, our operations remain obligated to pay taxes on uncollectible winnings from customers.
Even where gaming debts are enforceable, they may not be collectible. Our inability to collect gaming debts could have a significant adverse effect on our results of operations and cash flows.
We face the risk of fraud and cheating.
Our gaming customers may attempt or commit fraud or cheat in order to increase winnings. Acts of fraud or cheating could involve the use of counterfeit chips or other tactics, possibly in collusion with our employees. Internal acts of cheating could also be conducted by employees through collusion with dealers, surveillance staff, floor managers or other casino or gaming area staff. Failure to discover such acts or schemes in a timely manner could result in losses in our gaming operations. In addition, negative publicity related to such schemes could have an adverse effect on our reputation, potentially causing a material adverse effect on our business, financial condition, results of operations and cash flows.
We depend on the continued services of key managers and employees. If we do not retain our key personnel or attract and retain other highly skilled employees, our business will suffer.
Our ability to maintain our competitive position is dependent to a large degree on the services of our senior management team, including Mr. Sheldon Gary Adelson, Dr. Wong Yin Wai (Wilfred), Mr. Chum Kwan Lock (Grant) and Mr. Sun MinQi (Dave). The loss of their services or the services of our other senior managers, or the inability to attract and retain additional senior management personnel could have a material adverse effect on our business.
We compete for limited management and labor resources in Macao, and policies of government may also affect our ability to employ imported managers or labor.
Our success depends in large part upon our ability to attract, retain, train, manage and motivate skilled managers and employees at our properties. The Macao Government requires we only hire Macao residents in our casinos for certain employee roles, such as dealers. In addition, we are required to obtain visas and work permits for managers and employees we seek to employ from other countries. There is significant competition for managers and employees with the skills required to perform the services we offer and competition for these individuals in Macao is likely to increase as other competitors expand their operations.
We may have to recruit managers and employees from other countries to adequately staff and manage our properties and certain Macao Government policies affect our ability to hire non-resident managers and employees in certain job classifications. Despite our coordination with the Macao labor and immigration authorities to ensure our management and labor needs are satisfied, we may not be able to recruit and retain a sufficient number of qualified managers or employees for our operations or the Macao labor and immigration authorities may not grant us the necessary visas or work permits.
If we are unable to obtain, attract, retain and train skilled managers and employees, and obtain any required visas or work permits for our skilled managers and employees, our ability to adequately manage and staff our existing properties and planned development projects could be impaired, which could have a material adverse effect on our business, financial condition, results of operations and cash flows.
The transportation infrastructure in Macao may not be adequate to accommodate increased future demand of visitors to Macao.
Macao is in the process of expanding its transportation infrastructure to service the increased number of visitors to Macao. If the planned expansions of transportation facilities to and from Macao are delayed or not completed, and Macao’s transportation infrastructure is insufficient to meet the demands of an increased volume of visitors to Macao, the desirability of Macao as a leisure and business tourism destination, as well as the results of operations of our properties, could be negatively impacted.
Our gaming operations rely heavily on technology services provided by third parties. In the event there is an interruption of these services to us, it may significantly impact us.
We engage a number of third parties to provide gaming operating systems for the facilities we operate. As a result, we rely on such third parties to provide uninterrupted services to us in order to run our business efficiently and effectively. In the event one of these third parties experiences a disruption in its ability to provide such services to us (whether due to technological difficulties or power problems), this may result in a material disruption at the gaming facilities in which we operate and have a material adverse effect on our business, financial condition, results of operations and cash flows.
Any unscheduled interruption in our technology services is likely to result in an immediate, and possibly substantial, loss of revenues due to a shutdown of our gaming operations, cloud computing and gaming systems. Such interruptions may occur as a result of, for example, catastrophic events or rolling blackouts. Our systems are also vulnerable to damage or interruption from earthquakes, floods, typhoons, fires, telecommunication failures, terrorist attacks, computer viruses, computer denial-of-service attacks and similar events.
Natural or man-made disasters, an outbreak of highly infectious disease, terrorist activity or war could adversely affect the number of visitors to our facilities and disrupt our operations.
So called “Acts of God,” such as typhoons and rainstorms, particularly in Macao, and other natural disasters, man-made disasters, outbreaks of highly infectious diseases, terrorist activity or war may result in decreases in travel to and from, and economic activity in, areas in which we operate, and may adversely affect the number of visitors to our properties. Any of these events also may disrupt our ability to staff our business adequately, could generally disrupt our operations and could have a material adverse effect on our business, financial condition, results of operations and cash flows. Although we have insurance coverage with respect to some of these events, we cannot assure you any such coverage will be sufficient to indemnify us fully against all direct and indirect costs, including any loss of business that could result from substantial damage to, or partial or complete destruction of, any of our properties.
VML may have financial and other obligations to foreign workers managed by its contractors under government labor quotas.
In January 2019, the Macao Government has granted VML a quota to permit it to hire foreign workers. VML has effectively assigned the management of this quota to its contractors for the construction of our Cotai Strip projects. VML, however, remains ultimately liable for all employer obligations relating to these employees, including for payment of wages and taxes and compliance with labor and workers’ compensation laws. VML requires each contractor to whom it has assigned the management of part of its labor quota to indemnify VML for any costs or liabilities VML incurs as a result of such contractor’s failure to fulfill employer obligations. VML’s agreements with its contractors also contain provisions that permit it to retain some payments for up to one year after the contractors’ complete work on the projects. We cannot assure you VML’s contractors will fulfill their obligations to employees hired under the labor quotas or to VML under the indemnification agreements, or the amount of any indemnification payments received will be sufficient to pay for any obligations VML may owe to employees managed by contractors under VML’s quotas. Until we make final payments to our contractors, we have offset rights to collect amounts they may owe us, including amounts owed under the indemnities relating to employer obligations. After we have made the final payments, it may be more difficult for us to enforce any unpaid indemnity obligations.
There are significant risks associated with our construction projects.
In 2018, we announced the renovation, expansion and rebranding of Sands Cotai Central into The Londoner Macao, the addition of approximately 370 luxury suites within the tower also occupied by the St. Regis hotel and the development of approximately 290 additional premium quality suites in the Four Seasons Tower Suites Macao. These development projects and any other construction projects we undertake will entail significant risks. Construction activity requires us to obtain qualified contractors and subcontractors, the availability of which may be uncertain. Construction projects are subject to cost overruns and delays caused by events outside of our control or, in certain cases, our contractors’ control, such as shortages of materials or skilled labor, unforeseen engineering, environmental and/or geological problems, work stoppages, weather interference, unanticipated cost increases and unavailability of construction materials or equipment. Construction, equipment or staffing problems or difficulties in obtaining any of the requisite materials, licenses, permits, allocations and authorizations from governmental or regulatory authorities could increase the total cost, delay, jeopardize, prevent the construction or opening of our projects, or otherwise affect the design and features. Construction contractors or counterparties for our current projects may be required to bear certain cost overruns for which they are contractually liable, and if such counterparties are unable to meet their obligations, we may incur increased costs for such developments. If our management is unable to manage successfully our construction projects, it could have a material adverse effect on our financial condition, results of operations and cash flows.
The anticipated costs and completion dates for our current projects are based on budgets, designs, development and construction documents. Schedule estimates are prepared with the assistance of architects and other construction development consultants and are subject to change as the design, development and construction documents are finalized and as actual construction work is performed. A failure to complete our projects on budget or on schedule may have a material adverse effect on our financial condition, results of operations and cash flows.
Our debt instruments, current debt service obligations and substantial indebtedness may restrict our current and future operations, particularly our ability to timely refinance existing indebtedness, finance additional growth, respond to changes or take some actions that may otherwise be in our best interests.
Our current debt service obligations contain, or any future debt service obligations and instruments may contain, a number of restrictive covenants that impose significant operating and financial restrictions on us, including restrictions on our ability to:
| |
| • | incur additional debt, including providing guarantees or credit support; |
| |
| • | incur liens securing indebtedness or other obligations; |
| |
| • | dispose of certain assets; |
| |
| • | make certain acquisitions; |
| |
| • | pay dividends or make distributions and make other restricted payments, such as purchasing equity interests, repurchasing junior indebtedness or making investments in third parties; |
| |
| • | enter into sale and leaseback transactions; |
| |
| • | engage in any new businesses; |
| |
| • | issue preferred stock; and |
| |
| • | enter into transactions with our stockholders and our affiliates. |
In addition, our credit agreements contain various financial covenants. See “Notes to the Consolidated Financial Statements — 24. Borrowings” further description of these covenants.
At December 31, 2018, we had US$5.56 billion of long-term debt outstanding, net of original issue discount, deferred offering costs and cumulative fair value adjustments. This indebtedness could have important consequences to us. For example, it could:
| |
| • | make it more difficult for us to satisfy our debt service obligations; |
| |
| • | increase our vulnerability to general adverse economic and industry conditions; |
| |
| • | impair our ability to obtain additional financing in the future for working capital needs, capital expenditures, development projects, acquisitions or general corporate purposes; |
| |
| • | require us to dedicate a significant portion of our cash flow from operations to the payment of principal and interest on our debt, which would reduce the funds available for our operations and development projects; |
| |
| • | limit our flexibility in planning for, or reacting to, changes in the business and the industry in which we operate; |
| |
| • | require us to repurchase our Senior Notes (as defined in Item 5 - “A. Operating Results”) upon certain events, such as any change in gaming law or any action by a gaming authority after which none of the Group members owns or manages casino or gaming areas or operates casino games of fortune and chance in Macao in substantially the same matter as the Group was at the issue date of the Senior Notes for a period of 30 consecutive days or more; |
| |
| • | place us at a competitive disadvantage compared to our competitors that have less debt; and |
| |
| • | subject us to higher interest expense in the event of increases in interest rates. |
Our ability to timely refinance and replace our indebtedness in the future will depend upon general economic and credit market conditions, approval required by local government regulators, adequate liquidity in the global credit markets, the particular circumstances of the gaming industry and prevalent regulations and our cash flow and operations, in each case as evaluated at the time of such potential refinancing or replacement. If we are unable to refinance or generate sufficient cash flow from operations to repay our indebtedness on a timely basis, we might be forced to seek alternate forms of financing, dispose of certain assets or minimize capital expenditures and other investments, or reduce dividend payments. There is no assurance any of these alternatives would be available to us, if at all, on satisfactory terms, on terms that would not be disadvantageous to us, or on terms that would not require us to breach the terms and conditions of our existing or future debt agreements.
We may attempt to arrange additional financing to fund the remainder of our planned, and any future, development projects. If such additional financing is necessary, we cannot assure you we will be able to obtain all the financing required for the construction and opening of these projects on suitable terms, if at all.
Our insurance coverage may not be adequate to cover all possible losses our properties could suffer. In addition, our insurance costs may increase and we may not be able to obtain the same insurance coverage, or the scope of insurance coverage we deem necessary, in the future.
We have comprehensive property and liability insurance policies for our properties in operation, as well as those in the course of construction, with coverage features and insured limits we believe are customary in their breadth and scope. Market forces beyond our control may nonetheless limit the scope of the insurance coverage we can obtain or our ability to obtain coverage at reasonable rates. Certain types of losses, generally of a catastrophic nature, such as earthquakes, typhoons and floods, or terrorist acts, or certain liabilities may be uninsurable or too expensive to justify obtaining insurance. As a result, we may not be successful in obtaining insurance without increases in cost or decreases in coverage levels. In addition, in the event of a substantial loss, the insurance coverage we carry may not be sufficient to pay the full market value or replacement cost of our lost investment or in some cases could result in certain losses being
totally uninsured. As a result, we could lose some or all of the capital we have invested in a property, as well as the anticipated future revenue from the property, and we could remain obligated for debt or other financial obligations related to the property.
Our debt instruments and other material agreements require us to maintain a certain level of insurance. Failure to satisfy these requirements could result in an event of default under these debt instruments or material agreements.
The Senior Notes could face risks which could have important consequences for the holders of the Senior Notes and significant effects on our business and future operations.
We may incur secured indebtedness or other secured obligations in the future. The claims of the holders of the Senior Notes will be effectively subordinated to any secured indebtedness and other secured obligations of the Company to the extent of the value of the assets securing such indebtedness or other obligations.
The Senior Notes are structurally subordinated to the liabilities of our subsidiaries and our subsidiaries do not have any obligations to pay amounts due under the Senior Notes or to make funds available for that purpose. In the event any of our subsidiaries becomes insolvent, is liquidated, reorganized or dissolved, or is otherwise wound up other than as a part of a solvent transaction, the holders of the Senior Notes will have no right to proceed against the assets of such subsidiary. Additionally, as a holding company, we depend on the receipt of dividends and the interest or principal payments on intercompany loans or advances from our subsidiaries to satisfy our obligations, including our obligations under the Senior Notes. The ability of our subsidiaries to pay dividends and make payments on intercompany loans or advances to their shareholders is subject to, among other things, distributable earnings, cash flow conditions, restrictions contained in the articles of association of our subsidiaries and applicable laws. Certain of our subsidiaries have incurred debt in their own name and may do so again in the future, and the instruments governing such debt may require the lenders’ consent prior to the subsidiaries declaring dividends or otherwise restrict dividends or other distributions on their equity interests to us. These restrictions could reduce the amounts we receive from our subsidiaries, which would restrict our ability to meet our payment obligations under the Senior Notes.
The Senior Notes have limited covenants that may not protect against developments that may impair their trading price or our ability to repay them.
Upon the occurrence of certain triggering events prescribed by the Senior Notes, we must offer to purchase the Senior Notes. The sources of funds for any such purchases is limited to our available cash or third-party financing. We may not have enough funds to make the required purchase, thus triggering an event of default under the Senior Notes. This event of default may, in turn, trigger an event of default on other indebtedness for which we may not have sufficient funds to purchase the Senior Notes and repay the other indebtedness.
ITEM 4. — INFORMATION ON THE COMPANY
A. HISTORY AND DEVELOPMENT OF THE COMPANY
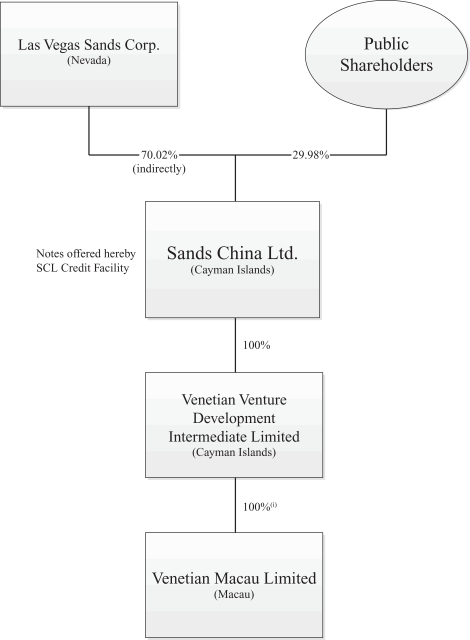
Sands China Ltd. was incorporated in the Cayman Islands on July 15, 2009 as an exempted company with limited liability under the Companies Law, Cap 22 (Law 3 of 1961, as consolidated and revised) of the Cayman Islands. Our principal executive offices are located at The Venetian Macao Resort Hotel, L2 Executive Offices, Estrada da Baía de N. Senhora da Esperança, s/n, Macao SAR. Our telephone number at this address is +853 8118-2888. Our registered office in the Cayman Islands is located at the offices of Intertrust Corporate Services (Cayman) Limited, 190 Elgin Avenue, George Town, Grand Cayman KY1-9005, Cayman Islands. Our principal place of business is Level 54, Hopewell Centre, 183 Queen’s Road East, Hong Kong. Our agent for service of process in the United States is Corporation Service Company located at 1180 Avenue of the Americas, Suite 210, New York, New York 10036. Our corporate website is www.sandschina.com. The information contained on our website is not a part of this annual report. The SEC maintains an Internet site that contains reports, proxy and information statements, and other information regarding issuers that file electronically with the SEC. The address of that site is www.sec.gov.
For a description of our principal capital expenditures for the years ended December 31, 2018, 2017 and 2016, see “Item 5 - Operating and Financial Review and Prospects — B. Liquidity and Capital Resources.”
B. BUSINESS OVERVIEW
Overview
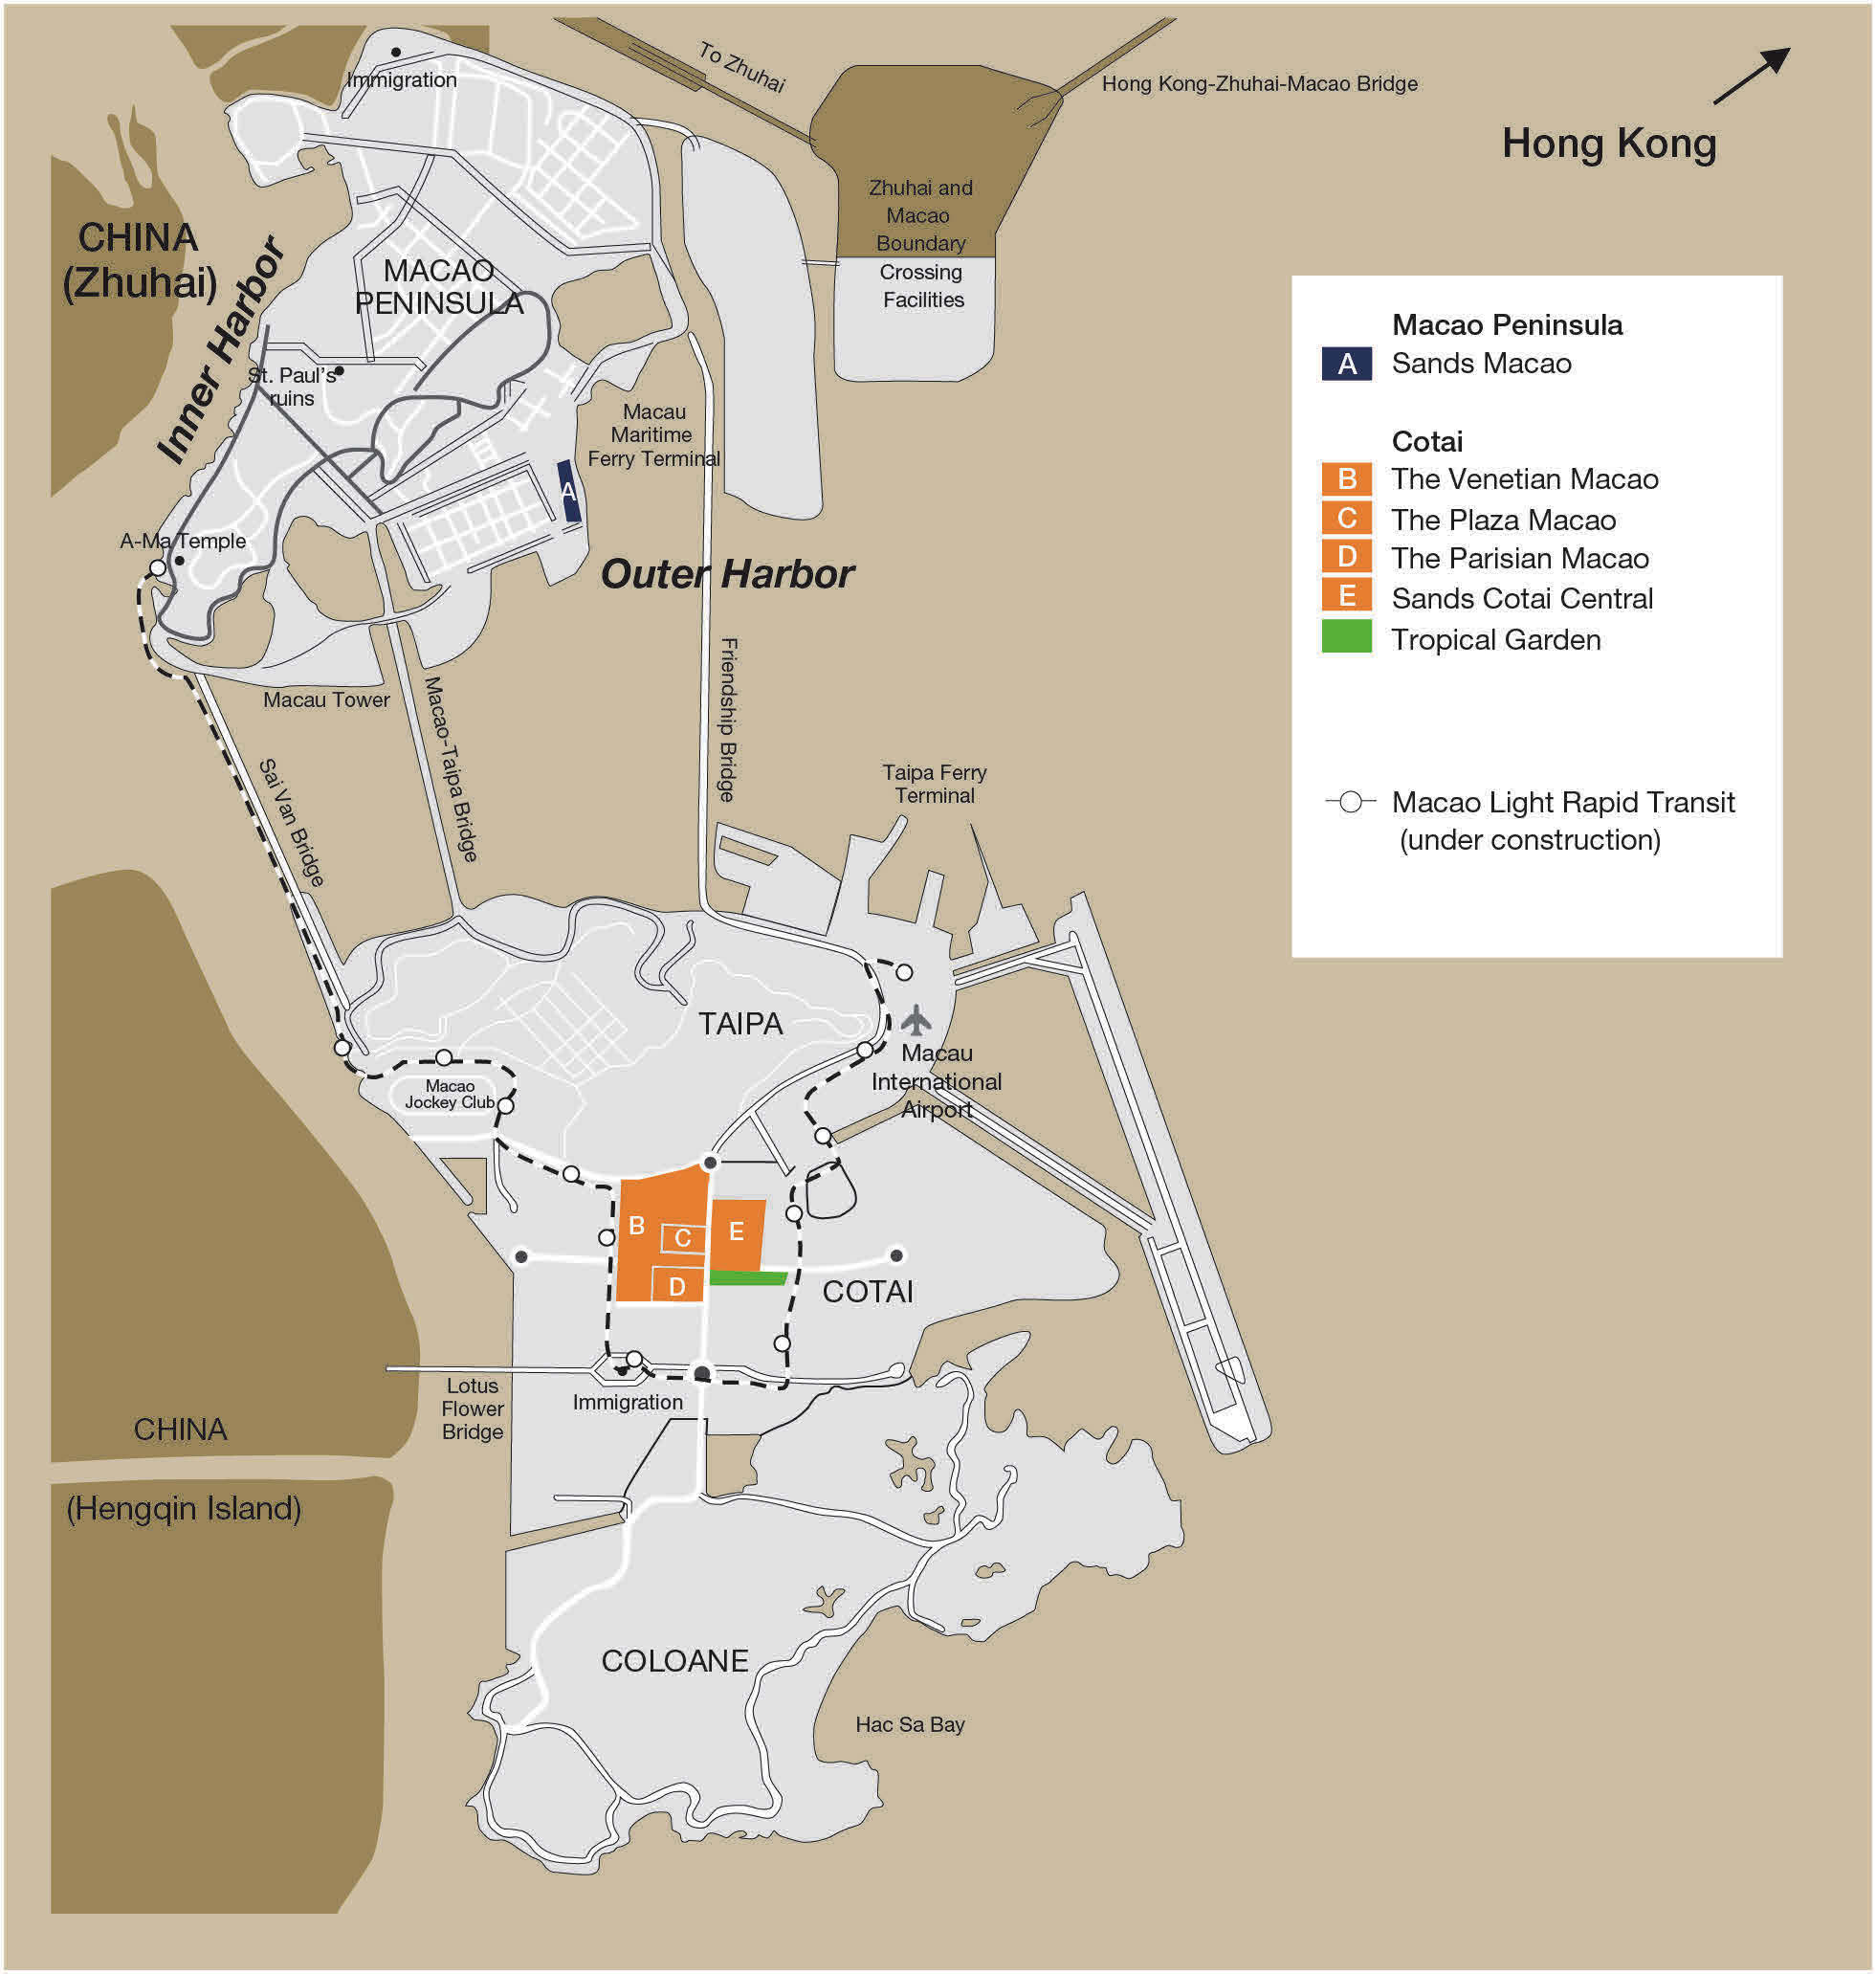
We are the leading developer, owner and operator of large-scale integrated resorts in Macao. In 2018, we welcomed approximately 99.3 million leisure and business visits at our properties on Cotai and on the Macao peninsula.
Our founder, chairman and chief executive officer, Sheldon G. Adelson, began investing in Macao in 2002 after being awarded a gaming subconcession to operate casino games and other games of chance in Macao. His vision and goal was to develop large-scale integrated resorts with a variety of world-class amenities and create an international tourism destination. This helped support Macao’s objective for long-term economic diversification and growth in tourism.
Today, with nearly 30 million square feet of interconnected facilities on Cotai, we operate the largest integrated resorts in Macao. These integrated resorts contain not only gaming areas, but also the largest number of four- and five-star rated hotel rooms of any other single developer in the market. Our integrated resorts also collectively feature the largest amount of meeting space, convention and exhibition halls, retail and dining areas and entertainment venues. We believe that our integrated resorts are unique to Macao and differentiate us from our competitors due to their size and scale, diversity of non-gaming amenities, and focus on leisure and business tourism.
According to research by the University of Nevada Las Vegas, Macao is the largest gaming market in the world as measured by casino gaming revenue and is the only location in China offering legalized casino gaming. VML, our subsidiary, holds one of six concessions or subconcessions permitted by the Macao Government to operate casinos or gaming areas in Macao.
We developed, own and operate The Venetian Macao, Sands Cotai Central, The Parisian Macao, The Plaza Macao and Sands Macao. We also own Cotai Expo, one of the largest convention and exhibition centers in Asia, as well as Macao’s largest entertainment venue, the Cotai Arena. Our properties collectively feature over 12,300 luxury suites and hotel rooms, more than 150 different restaurants and food outlets, spas, theaters for live performances, as well as other integrated resort amenities.
Our integrated resort brands, including The Venetian Macao and The Parisian Macao, are aspirational and have become recognized throughout China and Asia for quality and service and are designed to ensure a lasting connection with our customers. We believe The Venetian Macao is the most visited integrated resort in Asia, and since its opening in 2007, the property has received over 330 million visitations up to December 31, 2018. We estimate that since 2016, The Parisian Macao digital marketing and social media program has reached over nine billion online impressions up to December 31, 2018, including from platforms within China such as Sina Weibo.
We were the first developer in Macao to feature global hospitality brands for our hotel offerings on Cotai, including the Four Seasons, St. Regis, Conrad, Sheraton and Holiday Inn brands.
Within our integrated resorts, we also operate some of the largest and most profitable retail malls in Asia, showcasing over 820 shops occupying over 2 million square feet of retail space. Our retail malls showcase global luxury brands as well as leading Asian retail brands.
We own and operate CotaiJet, one of two major high speed ferry companies operating between Hong Kong and Macao, with 14 vessels helping leisure and business tourists reach Macao from points in Hong Kong, including the Hong Kong International Airport.
Our Developments in Macao
In May 2004, we opened the Sands Macao, the first Las Vegas style resort in Macao, which was designed for the mass market segment of leisure tourism. The Sands Macao currently contains a mix of gaming areas for mass market, VIP and premium players, entertainment and dining facilities, and hotel suites.
In August 2007, we opened The Venetian Macao, the flagship property of our Cotai Strip development. The Venetian Macao is a themed, large-scale integrated resort, with over 2,900 luxury hotel suites, more than 350 retail shops in one of the largest shopping malls in Asia with approximately 943,000 square feet of retail space, more than 50 restaurants and food outlets, and a state-of-the-art live performance theater with 1,800 seats. In addition, The Venetian Macao contains the Cotai Arena, a 15,000-seat venue directly adjacent to and which adjoins the Cotai Expo center and hosts numerous concerts, live performances, sporting events and corporate events each year. The Cotai Expo is a 1.2 million square foot first-class MICE facility, which includes exhibition and meeting space, including one of the largest column-free ballrooms in Asia.
In August 2008, we opened The Plaza Macao, a boutique luxury integrated resort featuring the Four Seasons Hotel Macao with 360 luxury suites, the Shoppes at Four Seasons with more than 140 shops from the world’s leading luxury retail brands, and the Plaza Casino. In July 2009, we completed and introduced our ultra-exclusive Paiza Mansions at The Plaza Macao.
In April 2012, we completed the first phase of Sands Cotai Central and opened the Conrad and Holiday Inn tower. This tower features approximately 650 five-star rooms and suites under the Conrad brand and approximately 1,200 four-star rooms and suites under the Holiday Inn brand. In September 2012, we opened the next phase of Sands Cotai Central with the completion of the first Sheraton tower, which features approximately 1,800 rooms and suites under the Sheraton brand.
In December 2012, we opened a fully enclosed climate-controlled footbridge between Sands Cotai Central and The Plaza Macao, with moving walkways to enhance the inter-connectivity and accessibility between our Cotai Strip properties.
In January 2013, we opened the second Sheraton tower at Sands Cotai Central, featuring approximately 2,100 additional rooms and suites under the Sheraton brand.
In December 2015, we opened the St. Regis tower at Sands Cotai Central, featuring 400 rooms and suites under the St. Regis brand.
Sands Cotai Central features approximately 367,000 square feet of gaming space, with over 390 table games and more than 1,100 slot machines or similar electronic gaming devices, and includes exclusive VIP rooms designed for VIP and premium players. Sands Cotai Central also has approximately 369,000 square feet of meeting space, a 1,701-seat theater and approximately 520,000 square feet of retail space with more than 150 stores and over 50 restaurants and food outlets.
In September 2016, we opened The Parisian Macao, a themed, iconic, “must-see” integrated resort connected to The Venetian Macao and The Plaza Macao, which includes a 253,000 square-foot casino, a hotel with approximately 2,500 rooms and suites, retail, entertainment, dining and meeting facilities. The Parisian Macao features a half size replica of the Eiffel Tower, providing a landmark attraction to visitors.
In 2018, we announced the renovation, expansion and rebranding of Sands Cotai Central into a new destination integrated resort, The Londoner Macao, by adding extensive thematic elements both externally and internally. The Londoner Macao will feature new attractions and features from London, including some of London’s most recognizable landmarks, and expanded retail and food and beverage venues. We will add approximately 370 luxury suites within the tower also occupied by the St. Regis hotel. Design work is nearing completion and construction is being initiated and will be phased to minimize disruption during the property’s peak periods. We expect the additional suites within the tower also occupied by the St. Regis hotel to be completed in the first quarter of 2020 and The Londoner Macao project to be completed in phases throughout 2020 and 2021.
In 2018, we also announced the Four Seasons Tower Suites Macao, which will feature approximately 290 additional premium quality suites. We have completed the structural work of the tower and have commenced preliminary build out of the suites. We expect the project to be completed in the first quarter of 2020.
We anticipate the total costs associated with these development projects to be approximately US$2.2 billion. The ultimate costs and completion dates for these projects are subject to change as we finalize our planning and design work and complete the projects. See “Item 3 - Key Information D. — Risk Factors — There are significant risks associated with our construction projects, which could have a material adverse effect on our financial condition, results of operations and cash flows.”
Our business strategy is to develop Cotai and to leverage our large-scale integrated resort business model to create Asia’s premier gaming, leisure, convention and meetings destination. Our interconnected integrated resorts, which have a wide range of branded hotel and resort offerings, are designed to attract different segments of the market all year round. We believe our business strategy and development plan will allow us to achieve more consistent demand, longer average length of stay in our hotels, more diversified sources of revenue and higher margins than more gaming-centric facilities.
Key Strengths
We believe we have a number of key strengths that differentiate our business from our competitors, including:
Diversified, high quality integrated resort offerings with substantial non-gaming amenities
Our integrated resorts feature non-gaming attractions and amenities including world-class entertainment, expansive retail offerings and market-leading MICE facilities. These attractions and amenities enhance the appeal of our integrated resorts, contributing to visitation, length of stay and customer expenditure at our resorts. As of December 31, 2018, our hotel inventory represented 47% of the total Macao competitor hotel inventory. The broad appeal of our market-leading integrated resort offerings in Macao enables us to serve the broadest array of customer segments in the Macao market.
Substantial and diversified cash flow from existing operations
We generated cash from operations of US$3.05 billion during the year ended December 31, 2018, from gaming and non-gaming sources, including retail, hotel, food and beverage, entertainment and MICE business.
Market leadership in the growing high-margin mass market gaming segment
We focus on the high-margin mass gaming segment, which has grown at a compound annual growth rate in excess of 11% since fiscal year 2015. During the twelve months ended December 31, 2018, we had the highest percentage of gaming win from mass tables and slots of the Macao operators, with approximately 30% market share. Our management estimates our mass market table revenues typically generate a gross margin that is approximately four times higher than the gross margin on our typical VIP table revenues.
Established brands with broad regional and international market awareness and appeal
Our brands, including The Venetian Macao, The Parisian Macao, Sands Macao, Cotai Expo, Cotai Arena, and CotaiJet enjoy broad regional and international market awareness and appeal. We welcomed approximately 99.3 million visits to our property portfolio in 2018, an increase of 7% compared to the prior year. The Venetian Macao is the most visited integrated resort in Macao, and enjoys broad brand awareness both regionally and globally. We estimate that since 2016, The Parisian Macao digital marketing and social media program has reached over nine billion online impressions up to December 31, 2018, including from platforms within China such as Sina Weibo.
Experienced management team with a proven track record
Mr. Sheldon G. Adelson is our founder, chairman and chief executive officer. Mr. Adelson’s business career spans more than seven decades and has included creating and developing to maturity numerous companies. Mr. Adelson created the MICE-based integrated resort and pioneered its development in the Las Vegas and Singapore markets, as well as in Macao, where he planned and developed the Cotai Strip. Dr. Wong Ying Wai, our President and Chief Operating Officer, Chum Kwan Lock, our Chief of Staff, and Sun Min Qi, our Chief Financial Officer, have substantial business experience and have successfully contributed to the execution of our operating strategies.
Unique MICE and entertainment facilities
Our market-leading MICE and entertainment facilities contribute to Macao’s diversification and appeal to business and leisure travelers while diversifying our cash flows and increasing revenues and profit. Our 1.7 million square feet of MICE space is specifically designed to meet the needs of meeting planners and corporate events and trade show organizers from around the world. Our experience and expertise in this industry continues to drive leisure and business tourism to Macao. Since opening in 2007, our 15,000-seat Cotai Arena has established itself as one of the top live entertainment venues in Southern China. The theaters at The Venetian Macao, Sands Cotai Central and The Parisian Macao offer a variety of ticketed events. The live entertainment program at our properties is a key traffic driver and has established us as the leader in the field of tourism and leisure activities.
Significant benefits from our on-going relationship with LVS
Sands China is approximately 70.0% owned by Las Vegas Sands, the world’s leading developer and operator of MICE-based integrated resorts. The operating experience of Las Vegas Sands in developing and operating MICE-based integrated resorts in the Las Vegas, Singapore and Macao markets is a significant benefit to us.
Business Strategies
Building on our key strengths, we seek to enhance our position as the leading developer and operator of integrated resorts and casinos in Macao by continuing to implement the following business strategies:
Developing and diversifying our integrated resort offerings on Cotai to include a full complement of products and services to cater to different market segments. Our development on Cotai includes four integrated resorts, MICE space, additional retail, dining and entertainment facilities and a range of hotel offerings to cater to different segments of the market. In addition to The Venetian Macao and The Parisian Macao hotel rooms, we have Four Seasons, Conrad, Holiday Inn, Sheraton and St. Regis branded suites and hotel rooms. We are able to leverage the recognition and the sales, marketing and reservation capabilities of these premier hotel brands to attract a wide range of customers in different market segments to our properties. We believe our partnerships with renowned hotel management partners, our diverse integrated resort offerings and the convenience and accessibility of our properties will continue to increase the appeal of our properties to both the business and leisure customer segments.
Leveraging our scale of operations to create and maintain an absolute cost advantage. Management expects to benefit from lower unit costs due to the economies of scale inherent in our operations. Opportunities for lower unit costs include, but are not limited to, lower utility costs; more efficient staffing of hotel and gaming operations; and centralized laundry, transportation, marketing and sales, and procurement. In addition, our scale allows us to consolidate certain back office functions.
Focusing on the high-margin mass market gaming segment, while continuing to provide luxury amenities and high service levels to our VIP and premium players. Our properties cater not only to VIP and premium players, but also to mass market customers, which comprise our most profitable gaming segment. We believe the mass market segment will continue to be a long-term growing segment as a result of the introduction of more high-quality gaming facilities and non-gaming amenities into the market. Our management estimates our mass market table revenues typically generate a gross margin that is approximately four times higher than the gross margin on our typical VIP table revenues.
Identifying targeted investment opportunities to drive growth across our portfolio. We will continue to invest in the expansion of our facilities and the enhancement of the leisure and business tourism appeal of our Cotai property portfolio.
Industry
According to Macao Government statistics issued publicly on a monthly basis by DICJ, annual gaming revenues were US$37.7 billion in 2018, a 13.4% increase compared to 2017. Macao gross gaming revenues had experienced year-over-year growth beginning in August 2016, and Macao continues to be the largest gaming market in the world and the only market in China to offer legalized casino gaming.
In 2018, Macao welcomed 36 million visitors, according to Macao Government Statistics Bureau disclosure. We expect Macao will continue to experience meaningful long-term growth and this growth will be driven by a variety of factors, including the movement of Chinese citizens to urban centers in China, continued growth of the Chinese outbound tourism market, the increased utilization of existing transportation infrastructure, the introduction of new transportation infrastructure and the continued increase in hotel room inventory in Macao and neighboring Hengqin Island. There has been significant investment announced and recently completed by concessionaires and subconcessionaires in new resort development projects on Cotai. These new resorts should help increase the critical mass on Cotai and further drive Macao’s transformation into a leading leisure and business tourism destination in Asia.
We believe the development of additional integrated resort products in Macao will also drive increased demand for gaming products. Table games are the dominant form of gaming in Asia with Baccarat being the most popular game. Historically, VIP baccarat has generated the majority of gaming revenue in Macao. In 2018, however, according to DICJ statistics, the mass gaming and slot segments represented 45% of the market revenue due to the increasing diversity of mass gaming and slot products on Cotai. We expect this trend to continue and thereby intend to introduce more modern and popular products catering to this growing customer segment. Furthermore, continued improvement of our high-quality gaming product offerings has enabled us to capture a meaningful share of the overall Macao gaming market across all player segments.
Proximity to Major Asian Cities
Visitors from Hong Kong, Southeast China, Taiwan and other locations in Asia can reach Macao in a relatively short time, using a variety of transportation methods, and visitors from more distant locations in Asia can take advantage of short travel times by air to Zhuhai, Shenzhen, Guangzhou or Hong Kong, followed by a road, ferry or helicopter trip to Macao. In addition, numerous air carriers fly directly into Macau International Airport from many major cities in Asia.
Macao draws a significant number of customers who are visitors or residents of Hong Kong. One of the major methods of transportation to Macao from Hong Kong is the jetfoil ferry service, including our ferry service, CotaiJet. Macao is also accessible from Hong Kong by helicopter. In addition, the bridge linking Hong Kong, Macao and Zhuhai, which was opened in 2018, has reduced the travel time between Hong Kong and Macao and from the Hong Kong International Airport to Macao.
Our Properties and Projects
Our operations consist of The Venetian Macao, Sands Cotai Central, The Parisian Macao and The Plaza Macao on Cotai and the Sands Macao on the Macao Peninsula, along with other operations that support these properties, including our high-speed CotaiJet ferry service operating between Hong Kong and Macao.
The following table sets forth data on our existing operations as of December 31, 2018:
|
| | | | | | | | | | | | | | | | | |
| | The Venetian Macao | | Sands Cotai Central | | The Parisian Macao | | The Plaza Macao | | Sands Macao | | Total |
| Opening date | August 2007 | | April 2012(i) | | September 2016 | | August 2008 | | May 2004 | | |
| Hotel rooms and suites | 2,841 |
| | 6,246 |
| | 2,333 |
| | 360 |
| | 238 |
| | 12,018 |
|
| Paiza suites | 64 |
| | — |
| | 208 |
| | — |
| | 51 |
| | 323 |
|
| Paiza mansions | — |
| | — |
| | — |
| | 19 |
| | — |
| | 19 |
|
| MICE (square feet) | 1,200,000 |
| | 369,000 |
| | 63,000 |
| | 28,000 |
| | — |
| | 1,660,000 |
|
| Theater (seats) | 1,800 |
| | 1,701 |
| | 1,200 |
| | — |
| | 650 |
| | 5,351 |
|
| Arena (seats) | 15,000 |
| | — |
| | — |
| | — |
| | — |
| | 15,000 |
|
| Total retail (square feet) | 943,000 |
| | 520,000 |
| | 296,000 |
| | 242,000 |
| | 50,000 |
| | 2,051,000 |
|
| Number of shops | 356 |
| | 158 |
| | 155 |
| | 141 |
| | 15 |
| | 825 |
|
| Number of restaurants and food outlets | 57 |
| | 53 |
| | 23 |
| | 8 |
| | 10 |
| | 151 |
|
| Total gaming facility (square feet) | 374,000 |
| | 367,000 |
| | 253,000 |
| | 105,000 |
| | 213,000 |
| | 1,312,000 |
|
| Gaming units: | | | | | | | | | | |
|
Tables(ii) | 644 |
| | 392 |
| | 327 |
| | 116 |
| | 206 |
| | 1,685 |
|
| Slots | 1,414 |
| | 1,118 |
| | 870 |
| | 157 |
| | 715 |
| | 4,274 |
|
____________________
| |
| (i) | Sands Cotai Central consists of the Conrad and Holiday Inn tower, the first Sheraton tower, the second Sheraton tower and the St. Regis tower, which opened in April 2012, September 2012, January 2013 and December 2015, respectively. |
| |
| (ii) | Permanent table count as of December 31, 2018. |
The Venetian Macao
In August 2007, we opened The Venetian Macao, the anchor property of our Cotai development, located approximately three kilometers from the Taipa Ferry Terminal on Macao’s Taipa Island and ten kilometers from the bridge linking Hong Kong, Macao and Zhuhai. As of December 31, 2018, The Venetian Macao included approximately 374,000 square feet of casino and gaming areas spread across exclusive VIP rooms and an expansive mass market gaming floor.
As of December 31, 2018, The Venetian Macao featured 644 table games and 1,414 slot machines or similar electronic gaming devices. The mass market gaming floor is divided into four uniquely designed areas: Red Dragon, Golden Fish, Phoenix and Imperial House. The Venetian Macao, with a theme similar to The Venetian Las Vegas, features replicas of many famous sites in Venice, Italy, including St. Mark’s Square, the Campanile Tower and Doge’s Palace. During the year ended December 31, 2018, The Venetian Macao had approximately 36.4 million visitors.
In addition to gaming facilities, The Venetian Macao features a 39-floor five-star hotel tower with 2,841 standard hotel suites and 64 Paiza suites. Standard suites consist of a raised sleeping area and bathroom as well as a sunken living/working area. We believe these designs are responsive to the needs of regional leisure and business travelers as well as patrons, and help attract more multi-night leisure or business visitors to Macao, as typically seen in Las Vegas. The 64 Paiza suites range from 2,300 to 8,000 square feet. Each Paiza suite in The Venetian Macao offers a living room, a dining room, at least two bedrooms and private concierge service. Some larger suites include a private massage room, gym, pool and media/karaoke room.
The Venetian Macao also provides a broad selection of entertainment options and amenities that cater to mass market customers, including families, and also targets VIP and premium players with special products and services, such as the Paiza Club. The Venetian Macao has approximately 943,000 square feet of retail and dining areas at the Shoppes at Venetian, consisting of more than 350 stores and over 50 world-class restaurants, including a food court. Visitors and guests can access the Shoppes at Venetian from several different locations, including the main road through Cotai, the Shoppes at Four Seasons, The Venetian Macao hotel and The Venetian Macao gaming floor. Offerings include a wide variety of shops, ranging from well-known international brands such as Furla, Stuart Weitzman, Hugo Boss, Coach, Ed Hardy, Armani Exchange and Jo Malone, to mid-level retail offerings such as Lululemon, MLB, M.A.C., Innisfree, Maje, Sandro, The North Face and ba&sh. The mall has an extensive selection of high-end jewelry and watch retailers such as Rolex, Omega, Bvlgari, Tiffany & Co., Cartier, Breguet, Piaget and Chaumet.
The restaurants and stores are set along streetscapes reminiscent of historical streetscapes in Venice. The common areas within the retail space include St. Mark’s Square and three indoor canals with gondola rides, similar to the Grand Canal Shoppes in Las Vegas.
In addition, The Venetian Macao features a convention center and meeting room complex of approximately 1.2 million square feet. These MICE facilities provide a flexible and expansive space that can be configured to provide small, mid-size or large meeting rooms and/or accommodate large-scale multi-media events or trade shows. MICE events typically take place on weekdays, thereby drawing traffic during the portion of the week when hotels and casinos in Macao normally experience lower demand relative to weekends and holidays, when occupancy and room rates are typically at their peak due to leisure travel. The Venetian Macao also has a 15,000-seat arena, the Cotai Arena, which has hosted a wide range of entertainment and sporting events, and a 1,800-seat theater.
The refurbishment of The Venetian Macao hotel tower including all 2,905 suites, was completed in late January 2018.
Sands Cotai Central
Sands Cotai Central is located across the street from The Venetian Macao, The Parisian Macao and The Plaza Macao and is our largest integrated resort on Cotai. Sands Cotai Central opened in phases, beginning in April 2012. The property features four hotel towers: the first hotel tower, which opened in April 2012, consisting of 654 five-star rooms and suites under the Conrad brand and 1,224 four-star rooms and suites under the Holiday Inn brand; the second hotel tower, which opened in September 2012, consisting of 1,842 rooms and suites under the Sheraton brand; the third hotel tower, which opened in January 2013, consisting of 2,126 rooms and suites under the Sheraton brand; and the fourth tower, which opened in December 2015, consisting of 400 rooms and suites under the St. Regis brand. Sands Cotai Central currently operates approximately 367,000 square feet of gaming space, with 392 table games and 1,118 slot machines or similar electronic gaming devices, and includes exclusive VIP rooms designed for VIP and premium players. Sands Cotai Central also has approximately 369,000 square feet of meeting space, a 1,701-seat theater and approximately 520,000 square feet of retail space with more than 150 stores and over 50 restaurants and food outlets. For the year ended December 31, 2018, Sands Cotai Central had a total of approximately 19.7 million visits.
In 2018, we announced the renovation, expansion and rebranding of Sands Cotai Central into a new destination integrated resort, The Londoner Macao, by adding extensive thematic elements both externally and internally. The Londoner Macao will feature new attractions and features from London, including some of London’s most recognizable landmarks, and expanded retail and food and beverage venues. We will add approximately 370 luxury suites within the tower also occupied by the St. Regis hotel. Design work is nearing completion and construction is being initiated and will be phased to minimize disruption during the property’s peak periods. We expect the additional suites within the tower also occupied by the St. Regis hotel to be completed in the first quarter of 2020 and The Londoner Macao project to be completed in phases throughout 2020 and 2021.
The Parisian Macao
On September 13, 2016, we opened The Parisian Macao, an integrated resort connected to The Venetian Macao and The Plaza Macao, which includes 253,000 square feet of gaming space with 327 table games and 870 slot machines or similar electronic gaming devices. The Parisian Macao also features approximately 2,500 elegantly appointed rooms and suites and the Shoppes at Parisian, approximately 296,000 square feet of unique retail shopping with more than 150 stores featuring many international brands and home to 23 restaurants and food outlets featuring an international assortment of cuisines. Other non-gaming amenities at The Parisian Macao include a meeting room complex of approximately 63,000 square feet and a 1,200-seat theater. Directly in front of The Parisian Macao, and connected via a covered walk-way to the main building, is a half-scale authentic re-creation of the Eiffel Tower containing a viewing platform and restaurant. The Parisian Macao welcomed approximately 14.1 million visits for the year ended December 31, 2018.
The Plaza Macao
In August 2008, we opened The Plaza Macao, which is located adjacent to The Venetian Macao. The Plaza Macao includes the Four Seasons Hotel Macao (360 rooms and suites managed by Four Seasons Hotels Inc.) and the Plaza Casino, which we own and operate and features approximately 105,000 square feet of gaming space with 116 table games and 157 slot machines or similar electronic gaming devices; 19 Paiza Mansions; several food and beverage offerings; conference and banquet facilities; and the Shoppes at Four Seasons, which comprise retail space of approximately 242,000 square feet and is connected to the Shoppes at Venetian and the Shoppes at Cotai Central. The ultra-exclusive Paiza Mansions at The Plaza Macao were completed and introduced to the VIP market in July 2009. For the year ended December 31, 2018, The Plaza Macao had a total of approximately 23.1 million visits.
The refurbishment of the 360 rooms and suites comprising the Four Seasons Hotel Macao, was completed in early August 2017.
In 2018, we announced the Four Seasons Tower Suites Macao, which will feature approximately 290 additional premium quality suites. We have completed the structural work of the tower and have commenced preliminary build out of the suites. We expect the project to be completed in the first quarter of 2020.
Sands Macao
We opened the Sands Macao in May 2004. The Sands Macao was the first Las Vegas-style casino in Macao and currently contains a mix of gaming areas for mass market, VIP and premium players, and entertainment and dining facilities and hotel suites. The Sands Macao is situated on the Macao Peninsula near the Macau Maritime Ferry Terminal, on a waterfront parcel centrally located between the Gongbei border gate and the central business district in Macao. This location provides the Sands Macao access to a large customer base, particularly the approximately 10.4 million visits in 2018 by visitors who arrived in Macao by sea at the Taipa Ferry Terminal or the Macau Maritime Ferry Terminal. For the year ended December 31, 2018, the Sands Macao had a total of approximately 5.9 million visits.
As of December 31, 2018, the Sands Macao features 289 suites, which are furnished with modern amenities. The Sands Macao also included approximately 213,000 square feet of gaming space and had 206 table games and 715 slot machines or similar electronic gaming devices.
In addition to gaming facilities and hotel accommodations, the Sands Macao also includes restaurants, spa facilities, entertainment areas and other amenities. The dining venues feature popular regional cuisine and include a Cantonese restaurant, and an upscale western-style steakhouse.
Other Operations
As part of our goal of driving visitation to Cotai and improving the customer experience in Macao, we have made targeted investments to help develop Macao’s transportation infrastructure. Our transportation operations consist of our high-speed CotaiJet ferry service between Hong Kong and Macao, CotaiLimo service, CotaiShuttle bus service, an airplane service for VIP and premium players, and travel agencies.
CotaiJet Ferry Service. In November 2007, we launched our high-speed CotaiJet ferry service between the Hong Kong Macau Ferry Terminal and the Taipa Ferry Terminal near our Cotai Strip development. With our 14 ferries, we have the ability to run ferries on 30-minute intervals as needed to meet demand. We transferred approximately 20,000 passengers per day for the year ended December 31, 2018. We provided an average of approximately 49 daily round trip sailings between Macao and Hong Kong. Our CotaiJet ferry service offered the following routes:
|
| | |
| To/From Hong Kong | | From/To Macao |
| Hong Kong Macau Ferry Terminal | | Taipa Ferry Terminal |
| Hong Kong China Ferry Terminal | | Taipa Ferry Terminal |
| Sky Pier at Hong Kong International Airport | | Taipa Ferry Terminal |
The CotaiJet service is fully managed and operated on our behalf by Chu Kong High-Speed Ferry Co., Ltd. of Hong Kong, using catamarans owned by our wholly owned indirect subsidiaries. Each custom-built catamaran has the capacity to carry more than 400 passengers and operate at top speeds of approximately 42 knots.
We operate our passenger ferry service pursuant to a 10-year license granted to us by the Macao Government on January 14, 2010.
CotaiLimo. Our CotaiLimo service fleet consists of over 90 limousines. It operates 24 hours per day and includes five signature vehicles (five Rolls-Royce Phantom EWB), which are provided on an exclusive basis to our VIP and premium players. Fleet deployment is managed through a centralized dispatch office for all pre-booked services, while additional vehicles are stationed at various locations to provide “on demand” services.
CotaiShuttle Bus Service. We operate a fleet of 150 (44 owned, 106 rented) complimentary shuttle buses that transport passengers between our properties and from the Macau Maritime Ferry Terminal, the Taipa Ferry Terminal and the Macau International Airport to our properties every five to ten minutes during peak periods. These shuttle buses are also supported by an additional 35 coaches available on request to serve increased demand. The CotaiShuttle also runs to and from two border checkpoints with mainland China, the Gongbei Border Gate and the Lotus Flower Bridge, transporting visitors directly to and between our properties every five to ten minutes during peak periods. The services between the Taipa Ferry Terminal and our properties provide a connecting service for all CotaiJet ferry arrivals and help direct visitors to our properties. In addition, a complimentary shuttle bus service operates between our Cotai properties, Wynn Palace, Studio City, City of Dreams, MGM Cotai, Galaxy Macau and Broadway Macau to enhance the overall Cotai experience. All of these routes maintain a regular schedule, although exact operating hours are dependent on the specific route. Most routes operate for a minimum of 15 hours every day.
Airplane. Through a Shared Services Agreement with LVS, we have access to a fleet of 19 corporate configured airplanes, three of which are currently stationed permanently in Asia. All airplanes are owned by LVS or by various entities controlled by our controlling
shareholder and are operated by Sands Aviation, LLC, an affiliate of our Company. We can deploy these airplanes to bring VIP and premium players from around the globe to our properties.
CotaiTicketing. CotaiTicketing was established in 2007 to provide ticketing services for events at all our properties. CotaiTicketing currently sells tickets for events at the Cotai Arena, The Venetian Theatre, The Parisian Theatre, Sands Theatre, The Venetian Macao and Sands Cotai Central ballrooms, and CotaiJet ferry tickets. CotaiTicketing operates seven permanent box office locations across all properties and a call center based in Macao with three language options and direct phone numbers for Asian and North American countries. We also sell tickets online 24 hours per day at our website www.CotaiTicketing.com. This site is available in two languages—English and Simplified Chinese.
Travel Agencies. We have our own travel agencies, CotaiTravel in Macao and Sands Resorts Travel Limited in Hong Kong. We have also developed partnerships with a large number of tour and travel companies throughout Asia. These agencies assist with reservations and booking for travel to Macao and for various shows and other activities and entertainment amenities at our properties.
Retail Mall Operations. We own and operate retail malls at our integrated resorts at The Venetian Macao, Sands Cotai Central, The Parisian Macao, The Plaza Macao, the Four Seasons Hotel Macao and Sands Macao. Upon completion of all phases of Sands Cotai Central’s renovation, rebranding and expansion to The Londoner Macao, we will own over 2.0 million square feet of gross retail space on Cotai.
Management believes being in the retail mall business and, specifically, owning some of the largest retail properties in Asia will provide meaningful value for us, particularly as the retail market in Asia continues to grow.
Our malls are designed to complement our other unique amenities and service offerings provided by our integrated resorts. Our strategy is to seek out desirable tenants that appeal to our customers and provide a wide variety of shopping options. We generate our mall revenue primarily from leases with tenants through base minimum rents, overage rents and reimbursements for common area maintenance (“CAM”) and other expenditures. For further information related to the financial performance of our malls, see “Item 5 - Operating and Financial Review and Prospects — A. Operating Results.”
The tables below set forth certain information regarding our mall operations on Cotai as of December 31, 2018.
|
| | | | |
| Mall Name | | Total GLA(i) | | Selected Significant Tenants |
| Shoppes at Venetian | | 813,376(ii) | | Zara, Uniqlo, H&M, Victoria’s Secret, Piaget, Rolex, Michael Kors, Bvlgari, Chanel Beauté, Lululemon |
| Shoppes at Cotai Central | | 519,681(iii) | | Marks & Spencer, Kid’s Cavern, Zara, Under Armour, Omega, Nike, Chow Tai Fook, Lady M, Apple |
| Shoppes at Parisian | | 295,915 | | Alexander McQueen, Isabel Marant, Lanvin, Maje, Sandro, Zadig & Voltaire, Paul Smith |
| Shoppes at Four Seasons | | 241,548 | | Cartier, Chanel, Louis Vuitton, Hermès, Gucci, Dior, Versace, Zegna, Berluti, Loro Piana, Saint Laurent Paris |
____________________
| |
| (i) | Represents GLA in square feet. |
| |
| (ii) | Excludes approximately 130,000 square feet of space on the fifth floor currently not on the market for lease. |
| |
| (iii) | The Shoppes at Cotai Central will feature up to an estimated 600,000 square feet of GLA upon completion of all phases of Sands Cotai Central’s renovation, rebranding and expansion to The Londoner Macao. |
The following table reflects our tenant representation by category for our mall operations as of December 31, 2018.
|
| | | | | | | | |
| Category | | Square Feet | | % of Square Feet | | Representative Tenants |
| Fashion (luxury, women’s, men’s, mixed) | | 585,693 |
| | 34 | % | | Louis Vuitton, Hermès, Dior, Gucci, Versace, Chanel, Zegna, Berluti, Loro Piana, Saint Laurent Paris |
| Restaurants and lounges | | 288,936 |
| | 17 | % | | Bambu, Lei Garden, Dragon King, Morton’s The Steakhouse, McDonald’s, Lady M |
| Multi-Brands | | 251,247 |
| | 15 | % | | Duty Free Americas, The Atrium, Temptation |
| Lifestyle, sports and entertainment | | 183,926 |
| | 11 | % | | Manchester United, Nike, Adidas, FILA |
| Fashion accessories and footwear | | 125,243 |
| | 7 | % | | Charles & Keith, Stuart Weitzman, Coach, Michael Kors |
| Jewelry | | 109,316 |
| | 6 | % | | Rolex, Omega, Bvlgari, Tiffany & Co., Luk Fook Jewellery, Cartier |
| Health and beauty | | 57,973 |
| | 3 | % | | Sa Sa, Jo Malone, M.A.C., Ingrid Millet Paris |
| Home furnishing and electronics | | 42,668 |
| | 2 | % | | Apple, Samsung, Zara Home |
| Banks and services | | 31,003 |
| | 2 | % | | Bank of China, ICBC, BNU |
| Specialty foods | | 25,977 |
| | 2 | % | | Godiva, Haagen Dazs, Noble Mart |
| Arts and gifts | | 12,828 |
| | 1 | % | | Gondola Shop, Eiffel Tower Souvenirs |
| Total | | 1,714,810 |
| | 100 | % | | |
| | | | | | | |
Advertising and Marketing
We advertise in many types of media, including television, Internet (including search engines, e-mail, online advertising and social media), radio, newspapers, magazines and other out-of-home advertising (including billboards), to promote general market awareness of our properties as unique leisure, business and convention destinations due to our first-class hotels, casinos, retail stores, restaurants and other amenities. We actively engage in direct marketing as allowed in various geographic regions.
We maintain websites to allow our customers to make room and/or restaurant reservations, purchase show tickets and provide feedback. We also continue to enhance and expand our use of digital marketing and social media to promote our integrated resorts, events and special offers, cultivate customer relationships and provide information and updates regarding our corporate citizenship efforts, including our sustainability and corporate giving programs.
Competition
Gaming in Macao is administered by the government through concessions awarded to three different concessionaires and three subconcessionaires, of which we are one. No additional concessions have been granted by the Macao Government since 2002; however, if the Macao Government were to allow additional gaming operators in Macao through the grant of additional concessions or subconcessions, we would face additional competition.
Sociedade de Jogos de Macau, S.A., a company incorporated under the laws of Macao (“SJM”), holds one of the three concessions (which expires in June 2022) and currently operates 20 facilities throughout Macao. Historically, SJM was the only gaming operator in Macao. Many of its gaming facilities are relatively small locations that are offered as amenities in hotels; however, some are large operations, including the Hotel Lisboa and The Grand Lisboa. SJM is currently developing the Grand Lisboa Palace, a 2,000-room resort on Cotai, which is scheduled to open in the second half of 2019.
MGM Grand Paradise, S.A. (also known as MGM Grand Paradise Limited), a company incorporated under the laws of Macao (“MGM Grand Paradise”), a joint venture between MGM Resorts International and Pansy Ho Chiu-King, obtained a subconcession from SJM in April 2005 (which subconcession expires in June 2022), allowing the joint venture to conduct gaming operations in Macao. The MGM Grand Macau opened in December 2007 and is located on the Macao Peninsula adjacent to the Wynn Macau. In February 2018, MGM Grand Paradise opened MGM Cotai, which includes approximately 1,400 hotel rooms and other non-gaming amenities and is located behind Sands Cotai Central.
Wynn Resorts (Macau) S.A., a company incorporated under the laws of Macao (“Wynn Resorts Macau”), a subsidiary of Wynn Resorts, Limited, holds a concession (which expires in June 2022) and owns and operates the Wynn Macau and Encore at Wynn Macau, which opened in September 2006 and April 2010, respectively. In August 2016, Wynn Resorts Macau opened a 1,700-room integrated resort, Wynn Palace, which is located behind the City of Dreams and MGM Cotai.
In 2006, Melco Resorts (Macau), S.A., a company incorporated under the laws of Macao (“Melco”), purchased Wynn Resorts Macau’s subconcession right under its gaming concession (which subconcession expires in June 2022), which permitted Melco to receive a gaming subconcession from the Macao Government. In May 2007, Melco opened the Crown Macao, later renamed Altira. In June 2009, Melco opened the City of Dreams, an integrated casino resort located adjacent to our Sands Cotai Central, which includes Nuwa, The Countdown Hotel, and Grand Hyatt hotels. In October 2015, Melco opened its second casino resort on Cotai, Studio City; which includes 1,600 hotel rooms, restaurants, retail, convention and exhibition facilities and other resort attractions. Melco opened the fifth tower at City of Dreams, the 772-room Morpheus Tower, in June 2018.
Galaxy Casino S.A. (also known as Galaxy Casino Company Limited), a company incorporated under the laws of Macao (“Galaxy”), holds the third concession (which expires in June 2022) and has the ability to operate casino properties independent of our subconcession agreement with Galaxy and the Macao Government. Galaxy currently operates six casinos in Macao, including StarWorld Hotel, which opened in October 2006; Galaxy Macau, which is located near The Venetian Macao and opened in May 2011; and Broadway Macau, which opened in May 2015. Additionally, in May 2015, Galaxy opened the second phase of its Galaxy Macau property on Cotai. The expansion includes JW Marriott and The Ritz Carlton, comprised of approximately 1,250 hotel rooms, as well as additional restaurants, retail and convention and exhibition facilities. Galaxy is currently developing the third phase of its Galaxy Macau property on Cotai.
Our operations also face competition from other gaming and resort destinations, both in Asia and globally.
Regulation
Macao Concession and Our Subconcession
In June 2002, the Macao Government granted one of three concessions to operate casinos in Macao to Galaxy. During December 2002, we entered into a subconcession agreement with Galaxy, which was approved by the Macao Government. The subconcession agreement allows us to develop and operate certain casino projects in Macao, including Sands Macao, The Venetian Macao, The Plaza Macao and Four Seasons Hotel Macao, Sands Cotai Central and The Parisian Macao, separately from Galaxy. Under the subconcession agreement, we are obligated to operate casino games of chance or games of other forms in Macao. We were also obligated to develop and open The Venetian Macao and a convention center by December 2007, and we were required to invest, or cause to be invested, at least 4.4 billion patacas (approximately US$548 million at exchange rates in effect at the time of the transaction) in various development projects in Macao by June 2009, which obligations we have fulfilled.
If the Galaxy concession is terminated for any reason, our subconcession will remain in effect. The subconcession may be terminated by agreement between Galaxy and us. Galaxy is not entitled to terminate the subconcession unilaterally; however, the Macao Government, after consultation with Galaxy, may terminate the subconcession under certain circumstances. Galaxy has developed, and may continue to develop, hotel and casino projects separately from us.
According to the Macao gaming regulatory framework, 10.0% of each subconcessionaire’s issued share capital must be held by its managing director, who must be appointed by the applicable subconcessionaire and must be a permanent Macao resident. Mr. Antonio Ferreira is the appointed managing director of VML and a permanent Macao resident. Mr. Ferreira holds 10.0% of VML’s issued share capital subject to a usufruct agreement entered into with Venetian Venture Development Intermediate Limited (“VVDIL”). The usufruct provides that VVDIL has the sole and exclusive benefit of the 10.0% of VML’s issued share capital held by Mr. Ferreira. Mr. Ferreira has no economic interest in VML and receives no distributions.
We are subject to licensing and control under applicable Macao law and are required to be licensed by the Macao gaming authorities to operate a casino. We must pay periodic and regular fees and taxes, and our gaming license is not transferable. We must periodically submit detailed financial and operating reports to the Macao gaming authorities and furnish any other information the Macao gaming authorities may require. No person may acquire any rights over the shares or assets of VML, SCL’s wholly owned subsidiary, without first obtaining the approval of the Macao gaming authorities. Similarly, no person may enter into possession of its premises or operate them through a management agreement or any other contract or through step in rights without first obtaining the approval of, and receiving a license from, the Macao gaming authorities. The transfer or creation of encumbrances over ownership of shares representing the share capital of VML or other rights relating to such shares, and any act involving the granting of voting rights or other stockholders’ rights to persons other than the original owners, would require the approval of the Macao Government and the subsequent report of such acts and transactions to the Macao gaming authorities.
Our subconcession agreement requires, among other things: (i) approval of the Macao Government for transfers of shares in VML, or of any rights over or inherent to such shares, including the grant of voting rights or other stockholder’s rights to persons other than the original owners, as well as for the creation of any charge, lien or encumbrance on such shares; (ii) approval of the Macao Government for transfers of shares, or of any rights over such shares, in any of our direct or indirect stockholders, provided that such shares or rights are directly or indirectly equivalent to an amount that is equal to or higher than 5% of VML’s share capital and (iii) that the Macao Government be given notice of the creation of any encumbrance or the grant of voting rights or other stockholder’s rights to persons other than the original owners on shares in any of the direct or indirect stockholders in VML, provided that such shares or rights are
equivalent to an amount that is equal to or higher than 5% of VML’s share capital. The requirements in provisions (ii) and (iii) above will not apply, however, to securities listed as tradable on a stock exchange.
The Macao gaming authorities may investigate any individual who has a material relationship to, or material involvement with, us to determine whether our suitability and/or financial capacity is affected by this individual. LVS and SCL shareholders with 5% or more of the share capital, directors and some of our key employees must apply for and undergo a finding of suitability process and maintain due qualification during the subconcession term, and accept the persistent and long-term inspection and supervision exercised by the Macao Government. VML is required to notify the Macao Government immediately should VML become aware of any fact that may be material to the appropriate qualification of any shareholder who owns 5% of the share capital, or any officer, director or key employee. Changes in licensed positions must be reported to the Macao gaming authorities, and in addition to their authority to deny an application for a finding of suitability or licensure, the Macao gaming authorities have jurisdiction to disapprove a change in corporate position. If the Macao gaming authorities were to find one of our officers, directors or key employees unsuitable for licensing, we would have to sever all relationships with that person. In addition, the Macao gaming authorities may require us to terminate the employment of any person who refuses to file appropriate applications.
Any person who fails or refuses to apply for a finding of suitability after being ordered to do so by the Macao gaming authorities may be found unsuitable. Any stockholder found unsuitable who holds, directly or indirectly, any beneficial ownership of the common stock of a company incorporated in Macao and registered with the Macao Companies and Moveable Assets Registrar (a “Macao registered corporation”) beyond the period of time prescribed by the Macao gaming authorities may lose their rights to the shares. We will be subject to disciplinary action if, after we receive notice that a person is unsuitable to be a stockholder or to have any other relationship with us, we:
| |
| • | pay that person any dividend or interest upon its shares; |
| |
| • | allow that person to exercise, directly or indirectly, any voting right conferred through shares held by that person; |
| |
| • | pay remuneration in any form to that person for services rendered or otherwise; or |
| |
| • | fail to pursue all lawful efforts to require that unsuitable person to relinquish its shares. |
The Macao gaming authorities also have the authority to approve all persons owning or controlling the stock of any corporation holding a gaming license.
In addition, the Macao gaming authorities require prior approval for the creation of liens and encumbrances over VML’s assets and restrictions on stock in connection with any financing.
The Macao gaming authorities must give their prior approval to changes in control of VML through a merger, consolidation, stock or asset acquisition, management or consulting agreement or any act or conduct by any person whereby he or she obtains control. Entities seeking to acquire control of a Macao registered corporation must satisfy the Macao gaming authorities concerning a variety of stringent standards prior to assuming control. The Macao gaming authorities may also require controlling stockholders, officers, directors and other persons having a material relationship or involvement with the entity proposing to acquire control, to be investigated and licensed as part of the approval process of the transaction.
The Macao gaming authorities may consider some management opposition to corporate acquisitions, repurchases of voting securities and corporate defense tactics affecting Macao gaming licensees, and the Macao registered corporations affiliated with such operations, to be injurious to stable and productive corporate gaming.
The Macao gaming authorities also have the power to supervise gaming licensees in order to:
| |
| • | assure the financial stability of corporate gaming operators and their affiliates; |
| |
| • | preserve the beneficial aspects of conducting business in the corporate form; and |
| |
| • | promote a neutral environment for the orderly governance of corporate affairs. |
The subconcession agreement requires the Macao gaming authorities’ prior approval of any recapitalization plan proposed by VML’s Board of Directors. The Chief Executive of Macao could also require VML to increase its share capital if he deemed it necessary.
The Macao Government also has the right, after consultation with Galaxy, to unilaterally terminate the subconcession agreement at any time upon the occurrence of specified events of default, including:
| |
| • | the operation of gaming without permission or operation of business which does not fall within the business scope of the subconcession; |
| |
| • | the suspension of operations of our gaming business in Macao without reasonable grounds for more than seven consecutive days or more than fourteen non-consecutive days within one calendar year; |
| |
| • | the unauthorized transfer of all or part of our gaming operations in Macao; |
| |
| • | the failure to pay taxes, premiums, levies or other amounts payable to the Macao Government; |
| |
| • | the failure to resume operations following the temporary assumption of operations by the Macao Government; |
| |
| • | the repeated opposition to supervision and inspection or the repeated failure to comply with decisions of the Macao Government, namely of the Macao gaming authorities; |
| |
| • | the failure to provide or supplement the guarantee deposit or the guarantees specified in the subconcession within the prescribed period; |
| |
| • | the bankruptcy or insolvency of VML; |
| |
| • | fraudulent activity by VML; |
| |
| • | serious and repeated violation by VML of the applicable rules for carrying out casino games of chance or games of other forms or the operation of casino games of chance or games of other forms; |
| |
| • | the grant to any other person of any managing power over VML; or |
| |
| • | the failure by a controlling shareholder in VML to dispose of its interest in VML following notice from the gaming authorities of another jurisdiction in which such controlling shareholder is licensed to operate casino games of chance to the effect that such controlling shareholder can no longer own shares in VML. |
In addition, we must comply with various covenants and other provisions under the subconcession, including obligations to:
| |
| • | ensure the proper operation and conduct of casino games; |
| |
| • | employ people with appropriate qualifications; |
| |
| • | operate and conduct casino games of chance in a fair and honest manner without the influence of criminal activities; |
| |
| • | safeguard and ensure Macao’s interests in tax revenue from the operation of casinos and other gaming areas; and |
| |
| • | maintain a specified level of insurance. |
The subconcession agreement also allows the Macao Government to request various changes in the plans and specifications of our Macao properties and to make various other decisions and determinations that may be binding on us. For example, the Macao Government has the right to require that we contribute additional capital to our Macao subsidiaries or that we provide certain deposits or other guarantees of performance in any amount determined by the Macao Government to be necessary. VML is limited in its ability to raise additional capital by the need to first obtain the approval of the Macao gaming and governmental authorities before raising certain debt or equity.
If our subconcession is terminated in the event of a default, the casinos and gaming-related equipment would be automatically transferred to the Macao Government without compensation to us and we would cease to generate any revenues from these operations. In many of these instances, the subconcession agreement does not provide a specific cure period within which any such events may be cured and, instead, we would rely on consultations and negotiations with the Macao Government to give us an opportunity to remedy any such default.
The Sands Macao, The Venetian Macao, The Plaza Macao and Four Seasons Hotel Macao, Sands Cotai Central and The Parisian Macao are being operated under our subconcession agreement. This subconcession excludes the following gaming activities: mutual bets, lotteries, raffles, interactive gaming and games of chance or other gaming, betting or gambling activities on ships or planes. Our subconcession is exclusively governed by Macao law. We are subject to the exclusive jurisdiction of the courts of Macao in case of any dispute or conflict relating to our subconcession.
Our subconcession agreement expires on June 26, 2022. Unless our subconcession is extended, on that date, the casinos and gaming-related equipment will automatically be transferred to the Macao Government without compensation to us and we will cease to generate any revenues from these operations. Beginning on December 26, 2017, the Macao Government may redeem our subconcession by giving us at least one-year prior notice and by paying us fair compensation or indemnity.
Under our subconcession, we are obligated to pay to the Macao Government an annual premium with a fixed portion and a variable portion based on the number and type of gaming tables employed and gaming machines operated by us. The fixed portion of the premium is equal to MOP30 million (approximately US$4 million at exchange rates in effect on December 31, 2018). The variable portion is equal to MOP300,000 per gaming table reserved exclusively for certain kinds of games or players, MOP150,000 per gaming table not so reserved and MOP1,000 per electrical or mechanical gaming machine, including slot machines (approximately US$37,195, US$18,598
and US$124, respectively, at exchange rates in effect on December 31, 2018), subject to a minimum of MOP45 million (approximately US$6 million at exchange rates in effect on December 31, 2018). We also have to pay a special gaming tax of 35% of gross gaming revenues and applicable withholding taxes. We must also contribute 4% of our gross gaming revenue to utilities designated by the Macao Government, a portion of which must be used for promotion of tourism in Macao. This percentage may be subject to change in the future.
Currently, the gaming tax in Macao is calculated as a percentage of gross gaming revenue; however, gross gaming revenue does not include deductions for credit losses. As a result, if we extend credit to our customers in Macao and are unable to collect on the related receivables from them, we have to pay taxes on our winnings from these customers even though we were unable to collect on the related receivables. If the laws are not changed, our business in Macao may not be able to realize the full benefits of extending credit to our customers.
In August 2018, we received an extension of our exemption from Macao’s corporate income tax on profits generated by the operation of casino games of chance through June 26, 2022, the date our subconcession agreement expires. In April 2019, we entered into an agreement with the Macao Government effective through June 26, 2022, that provides for an annual payment of MOP38 million (approximately US$5 million at exchange rates in effect on December 31, 2018) as a substitution for a 12% tax otherwise due from VML’s shareholders on dividend distributions paid from VML gaming profits.
C. ORGANIZATIONAL STRUCTURE
The following chart illustrates our simplified corporate structure as of December 31, 2018.
| |
| (i) | VVDIL has 100% economic interest in Venetian Macau Limited. 10% of Venetian Macau Limited’s share capital is held by Mr. Antonio Ferreira subject to a usufruct agreement. See “— B. Business Overview — Regulation.” |
See “Notes to the Consolidated Financial Statements — 33. Principal Subsidiaries” for listing of the Company’s significant subsidiaries.
D. PROPERTY, PLANTS AND EQUIPMENT
We have received land concessions from the Macao Government to build the Sands Macao and Parcels 1, 2, 3 and 5 and 6 on Cotai, the sites on which The Venetian Macao (Parcel 1), The Plaza Macao (Parcel 2), The Parisian Macao (Parcel 3) and Sands Cotai Central (Parcels 5 and 6) are located. We do not own these parcels; however, the land concessions, which have an initial term of 25 years and are renewable at our option in accordance with Macao laws, grant us exclusive use of the land.
As specified in each land concession, we are required to pay premiums, which are either payable in a single lump sum upon acceptance of the land concession or in seven semi-annual installments, as well as annual rent for the term of the land concession, which may be revised every five years by the Macao Government.
See “— B. Business Overview — Our Properties and Projects” for additional information regarding our material tangible fixed assets and “— B. Business Overview — Our Developments in Macao” for information regarding material plans to construct, expand or improve facilities.
ITEM 4A. — UNRESOLVED STAFF COMMENTS
None.
ITEM 5. — OPERATING AND FINANCIAL REVIEW AND PROSPECTS
A. OPERATING RESULTS
The following section should be read in connection with “Item 3 - Key Information — A. Selected Financial Information” and our consolidated financial statements, including the notes thereto, included elsewhere in this annual report. Certain statements in this section are forward-looking statements. See “Special Notice Regarding Forward-Looking Statements” regarding these statements. Our historical consolidated financial statements have been prepared in accordance with IFRS and have been adjusted retrospectively to reflect the impact of adopting the provisions of IFRS 15, Revenue from Contracts with Customers. For additional information, see Note 2 of our audited financial statements included elsewhere in this annual report.
Overview
We are the leading developer, owner and operator of large-scale integrated resorts in Macao. VML, our subsidiary, holds one of six concessions or subconcessions permitted by the Macao Government to operate casinos or gaming areas in Macao. Macao is the largest gaming market in the world as measured by casino gaming revenue and is the only location in China offering legalized casino gaming.
We developed, own and operate The Venetian Macao, Sands Cotai Central, The Parisian Macao, The Plaza Macao and Sands Macao. We also own Cotai Expo, one of the largest convention and exhibition centers in Asia, as well as Macao’s largest entertainment venue, the Cotai Arena. As at December 31, 2018, our properties collectively feature over 12,300 luxury suites and hotel rooms, more than 150 different restaurants and food outlets, spas, theaters for live performances, as well as other integrated resort amenities.
Our business strategy is to develop Cotai and to leverage our large-scale integrated resort business model to create Asia’s premier gaming, leisure, convention and meetings destination. Our interconnected integrated resorts, which have a wide range of branded hotel and resort offerings, are designed to attract different segments of the market all year round. We believe our business strategy and development plan will allow us to achieve more consistent demand, longer average length of stay in our hotels, more diversified sources of revenue and higher margins than more gaming-centric facilities.
In 2018, we announced the renovation, expansion and rebranding of Sands Cotai Central into a new destination integrated resort, The Londoner Macao, by adding extensive thematic elements both externally and internally. The Londoner Macao will feature new attractions and features from London, including some of London’s most recognizable landmarks, and expanded retail and food and beverage venues. We will add approximately 370 luxury suites within the tower also occupied by the St. Regis hotel. Design work is nearing completion and construction is being initiated and will be phased to minimize disruption during the property’s peak periods. We expect the additional suites within the tower also occupied by the St. Regis hotel to be completed in the first quarter of 2020 and The Londoner Macao project to be completed in phases throughout 2020 and 2021.
In 2018, we also announced the Four Seasons Tower Suites Macao, which will feature approximately 290 additional premium quality suites. We have completed the structural work of the tower and have commenced preliminary build out of the suites. We expect the project to be completed in the first quarter of 2020.
We anticipate the total costs associated with these development projects to be approximately US$2.2 billion. The ultimate costs and completion dates for these projects are subject to change as we finalize our planning and design work and complete the projects.
We will continue to invest in the expansion of our facilities and the enhancement of the leisure and business tourism appeal of our Cotai property portfolio.
For the years ended December 31, 2018, 2017 and 2016, our total net revenues were US$8.67 billion, US$7.59 billion and US$6.54 billion, respectively, and our profit was US$1.88 billion, US$1.60 billion and US$1.22 billion, respectively.
On August 9, 2018, we issued three series of senior unsecured unregistered notes in an aggregate principal amount of US$5.50 billion, consisting of US$1.80 billion of 4.600% senior notes due August 8, 2023 (the “2023 Notes”), US$1.80 billion of 5.125% senior notes due August 8, 2025 (the “2025 Notes”) and US$1.90 billion of 5.400% senior notes due August 8, 2028 (the “2028 Notes” and, together with the 2023 Notes and the 2025 Notes, the “Senior Notes”). A portion of the net proceeds from the issuance was used to repay in full the outstanding borrowings under the 2016 VML Credit Facility. In connection with the Senior Notes, we entered into fixed-to-variable interest rate swap contracts. We will use the remaining net proceeds from the Senior Notes for general corporate purposes, including capital expenditures. See “Note 24. Borrowings” and “Note 25. Derivative Financial Instruments” to our audited consolidated financial statements included in this annual report for further information on the Senior Notes and related interest rate swaps.
On December 21, 2018, we launched an exchange offer to exchange all the unregistered notes referred to above with notes, which have been registered under the United States Securities Act of 1933 (“U.S. Securities Act”). The terms of these new notes are identical in all material respects to the unregistered notes, except the new notes have been registered under the U.S. Securities Act and do not have
any of the transfer restrictions, any of the registration provisions and certain inapplicable interest provisions relating to the unregistered notes. The exchange offer expired on January 25, 2019.
Critical Accounting Policies and Estimates
The preparation of our consolidated financial statements in conformity with IFRS requires our management to make estimates and judgments that affect the reported amounts of assets and liabilities, revenues and expenses, and related disclosures of contingent assets and liabilities. These estimates and judgments are based on historical information, information currently available to us and on various other assumptions management believes to be reasonable under the circumstances. Actual results could vary from those estimates and we may change our estimates and assumptions in future evaluations. Changes in these estimates and assumptions may have a material effect on our financial condition and results of operations. Our critical accounting policies and estimates include the useful lives of investment properties and property, plant and equipment, impairment of assets, provision of expected credit loss for trade receivables and litigation provisions. We believe these critical accounting policies affect our more significant judgments and estimates used in the preparation of our consolidated financial statements. For a discussion of these critical accounting policies and estimates, see Note 3 to our audited consolidated financial statements included elsewhere in this annual report.
Key Operating Revenue Measurements
Operating revenues at The Venetian Macao, Sands Cotai Central, The Parisian Macao and The Plaza Macao are dependent upon the volume of customers who stay at the hotel, which affects the price that can be charged for hotel rooms and our gaming volume. Operating revenues at the Sands Macao are principally driven by casino customers who visit the properties on a daily basis. The following are the key measurements we use to evaluate operating revenues:
Casino revenue measurements
Table games are segregated into two groups, consistent with the Macao market’s convention: Rolling Chip play (all VIP players) and Non-Rolling Chip play (mostly non-VIP players). The volume measurement for Rolling Chip play is non-negotiable gaming chips wagered and lost. The volume measurement for Non-Rolling Chip play is table games drop (“drop”), which is the sum of markers issued (credit instruments), cash deposited in the table drop box and gaming chips purchased or exchanged at the cage. Rolling Chip and Non-Rolling Chip volume measurements are not comparable as the amounts wagered and lost are substantially higher than the amounts dropped. Slot handle, also a volume measurement, is the gross amount wagered for the period cited.
We view Rolling Chip win as a percentage of Rolling Chip volume, Non-Rolling Chip win as a percentage of drop and slot hold as a percentage of slot handle. Win or hold percentage represents the percentage of Rolling Chip volume, Non-Rolling Chip drop or slot handle won by the casino and recorded as casino revenue. Our win and hold percentages are calculated before discounts, commissions, deferring revenue associated with our loyalty programs and allocating casino revenues related to goods and services provided to patrons on a complimentary basis. Based upon our mix of table games, our Rolling Chip win percentage is expected to be 3.0% to 3.3%. Generally, slot machine play is conducted on a cash basis. Approximately 15.3% of our table games play was conducted on a credit basis for the year ended December 31, 2018.
Hotel revenue measurements
Performance indicators used are occupancy rate, which is the average percentage of available hotel rooms occupied during a period, and average daily rate, which is the average price of occupied rooms per day. Available rooms exclude those rooms unavailable for occupancy during the period due to renovation, development or other requirements. Revenue per available room represents a summary of hotel average daily rates and occupancy. Because not all available rooms are occupied, average daily rates are normally higher than revenue per available room. Reserved rooms where the guests do not show up for their stay and lose their deposit, or rooms where guests check out early, may be re-sold to walk-in guests.
Mall revenue measurements
Occupancy, base rent per square foot and tenant sales per square foot are used as performance indicators. Occupancy represents GLOA divided by GLA at the end of the reporting period. GLOA is the sum of: (1) tenant occupied space under lease and (2) tenants no longer occupying space, but paying rent. GLA does not include space currently under development or not on the market for lease. Base rent per square foot is the annualized base, or minimum, rent charge in effect at the end of the reporting period, which is calculated on a weighted average basis, for all tenants that would qualify to be included in occupancy. Tenant sales per square foot is the sum of reported comparable sales for the trailing 12 months divided by the comparable square footage for the same period. Only tenants that have been open for a minimum of 12 months are included in the tenant sales per square foot calculation.
Results of Operations
Year ended December 31, 2018 compared to year ended December 31, 2017
Summary Financial Results
Net revenues and operating profit for the year ended December 31, 2018, increased 14.2% to US$8.67 billion and 21.5% to US$2.15 billion compared to US$7.59 billion and US$1.77 billion, respectively, for the year ended December 31, 2017. Profit attributable to equity holders of the Company increased 17.0% to US$1.88 billion for the year ended December 31, 2018, compared to US$1.60 billion for the year ended December 31, 2017. Adjusted property EBITDA for the year ended December 31, 2018, increased 17.9% to US$3.08 billion, compared to US$2.61 billion for the year ended December 31, 2017. The increases were driven by revenue increases in all business categories due to an increase in visitation and growth in the overall Macao gaming market and continued focus on operational efficiencies and cost control measures throughout both the gaming and non-gaming areas of the business.
Net Revenues
Our net revenues consisted of the following for the periods indicated:
|
| | | | | | | | | | |
| | Year ended December 31, |
| | 2018 | | 2017 | | Percent Change |
| | (US$ in millions) |
| Casino | $ | 6,816 |
| | $ | 5,880 |
| | 15.9 | % |
| Rooms | 734 |
| | 651 |
| | 12.7 | % |
| Mall | 507 |
| | 479 |
| | 5.8 | % |
| Food and beverage | 304 |
| | 292 |
| | 4.1 | % |
| Convention, ferry, retail and other | 304 |
| | 284 |
| | 7.0 | % |
| Total net revenues | $ | 8,665 |
| | $ | 7,586 |
| | 14.2 | % |
| | | | | | |
____________________
Note: Prior year presentation has been adjusted for the adoption of IFRS 15, Revenue from Contracts with Customers, and conformed to the current year presentation.
Net revenues were US$8.67 billion for the year ended December 31, 2018, an increase of 14.2%, compared to US$7.59 billion for the year ended December 31, 2017. Net revenues increased in all business categories, mainly driven by an increase in visitation as well as growth in the overall Macao gaming market. We continued to enjoy Macao market-leading visitation and focused on driving the high-margin mass market gaming business, while providing luxury amenities and high service levels to our VIP and premium players.
Casino Revenues. Our net casino revenues for the year ended December 31, 2018 were US$6.82 billion, an increase of 15.9%, compared to US$5.88 billion for the year ended December 31, 2017. The increase was mainly attributable to revenue increases across all properties, especially at The Venetian Macao, as a result of strong growth in both the VIP and mass segments. Strong results in our properties on Cotai continue to demonstrate the competitive advantage of our integrated resort business model. The following table summarizes the results of our casino activity for the periods indicated:
|
| | | | | | | | | | |
| | Year ended December 31, |
| | 2018 | | 2017 | | Change |
| | (US$ in millions) |
| The Venetian Macao | | | | | |
| Total net casino revenues | $ | 2,829 |
| | $ | 2,362 |
| | 19.8 | % |
| Non-Rolling Chip drop | 9,068 |
| | 7,399 |
| | 22.6 | % |
| Non-Rolling Chip win percentage | 24.7 | % | | 25.2 | % | | (0.5 | )pts |
| Rolling Chip volume | 32,148 |
| | 26,239 |
| | 22.5 | % |
Rolling Chip win percentage(i) | 3.55 | % | | 3.34 | % | | 0.21 | pts |
| Slot handle | 3,303 |
| | 2,929 |
| | 12.8 | % |
| Slot hold percentage | 4.6 | % | | 5.3 | % | | (0.7 | )pts |
|
| | | | | | | | | | |
| | Year ended December 31, |
| | 2018 | | 2017 | | Change |
| | (US$ in millions) |
| Sands Cotai Central | | | | | |
| Total net casino revenues | $ | 1,622 |
| | $ | 1,433 |
| | 13.2 | % |
| Non-Rolling Chip drop | 6,722 |
| | 5,996 |
| | 12.1 | % |
| Non-Rolling Chip win percentage | 21.4 | % | | 20.7 | % | | 0.7 | pts |
| Rolling Chip volume | 10,439 |
| | 10,621 |
| | (1.7 | )% |
Rolling Chip win percentage(i) | 3.59 | % | | 3.09 | % | | 0.50 | pts |
| Slot handle | 4,811 |
| | 4,802 |
| | 0.2 | % |
| Slot hold percentage | 3.9 | % | | 4.1 | % | | (0.2 | )pts |
| The Parisian Macao | | | | | |
| Total net casino revenues | $ | 1,265 |
| | $ | 1,120 |
| | 12.9 | % |
| Non-Rolling Chip drop | 4,323 |
| | 3,973 |
| | 8.8 | % |
| Non-Rolling Chip win percentage | 21.1 | % | | 19.6 | % | | 1.5 | pts |
| Rolling Chip volume | 19,049 |
| | 18,275 |
| | 4.2 | % |
Rolling Chip win percentage(i) | 3.19 | % | | 3.14 | % | | 0.05 | pts |
| Slot handle | 4,837 |
| | 3,729 |
| | 29.7 | % |
| Slot hold percentage | 2.9 | % | | 3.3 | % | | (0.4 | )pts |
| The Plaza Macao | | | | | |
| Total net casino revenues | $ | 502 |
| | $ | 391 |
| | 28.4 | % |
| Non-Rolling Chip drop | 1,365 |
| | 1,284 |
| | 6.3 | % |
| Non-Rolling Chip win percentage | 24.9 | % | | 22.7 | % | | 2.2 | pts |
| Rolling Chip volume | 13,100 |
| | 10,040 |
| | 30.5 | % |
Rolling Chip win percentage(i) | 2.95 | % | | 2.59 | % | | 0.36 | pts |
| Slot handle | 565 |
| | 436 |
| | 29.6 | % |
| Slot hold percentage | 6.1 | % | | 7.4 | % | | (1.3 | )pts |
| Sands Macao | | | | | |
| Total net casino revenues | $ | 598 |
| | $ | 574 |
| | 4.2 | % |
| Non-Rolling Chip drop | 2,565 |
| | 2,457 |
| | 4.4 | % |
| Non-Rolling Chip win percentage | 18.4 | % | | 19.0 | % | | (0.6 | )pts |
| Rolling Chip volume | 5,705 |
| | 4,309 |
| | 32.4 | % |
Rolling Chip win percentage(i) | 3.12 | % | | 2.79 | % | | 0.33 | pts |
| Slot handle | 2,569 |
| | 2,420 |
| | 6.2 | % |
| Slot hold percentage | 3.1 | % | | 3.3 | % | | (0.2 | )pts |
____________________
Note: Prior year presentation has been adjusted for the adoption of IFRS 15, Revenue from Contracts with Customers, and conformed to the current year presentation.
(i) This compares to our expected Rolling Chip win percentage of 3.0% to 3.3% (calculated before discounts, commissions, deferring revenue associated with our loyalty program and allocating casino revenues related to goods and services provided to patrons on a complimentary basis).
Room Revenues. Room revenues for the year ended December 31, 2018 were US$734 million, an increase of 12.7%, compared to US$651 million for the year ended December 31, 2017. The increase was primarily driven by increased demand and higher average daily rate at The Venetian Macao and Sands Cotai Central. During the year ended December 31, 2018, there were approximately 18% fewer average rooms available at The Parisian Macao compared to the year ended December 31, 2017, due to the construction work that was underway to combine and convert standard rooms to suites.
The following table summarizes the results of our room activity for the periods indicated:
|
| | | | | | | | | | |
| | Year ended December 31, |
| | 2018 | | 2017 | | Change |
| | (Room revenues in US$ millions) |
| The Venetian Macao | | | | | |
| Total room revenues | $ | 223 |
| | $ | 179 |
| | 24.6 | % |
| Occupancy rate | 95.9 | % | | 91.4 | % | | 4.5 | pts |
| Average daily rate (in US$) | 225 |
| | 214 |
| | 5.1 | % |
| Revenue per available room (in US$) | 216 |
| | 196 |
| | 10.2 | % |
| Sands Cotai Central | | | | | |
| Total room revenues | $ | 331 |
| | $ | 291 |
| | 13.7 | % |
| Occupancy rate | 94.8 | % | | 86.6 | % | | 8.2 | pts |
| Average daily rate (in US$) | 157 |
| | 149 |
| | 5.4 | % |
| Revenue per available room (in US$) | 149 |
| | 129 |
| | 15.5 | % |
| The Parisian Macao | | | | | |
| Total room revenues | $ | 124 |
| | $ | 128 |
| | (3.1 | )% |
| Occupancy rate | 96.3 | % | | 90.4 | % | | 5.9 | pts |
| Average daily rate (in US$) | 155 |
| | 141 |
| | 9.9 | % |
| Revenue per available room (in US$) | 149 |
| | 128 |
| | 16.4 | % |
| The Plaza Macao | | | | | |
| Total room revenues | $ | 39 |
| | $ | 34 |
| | 14.7 | % |
| Occupancy rate | 88.7 | % | | 82.1 | % | | 6.6 | pts |
| Average daily rate (in US$) | 323 |
| | 343 |
| | (5.8 | )% |
| Revenue per available room (in US$) | 286 |
| | 281 |
| | 1.8 | % |
| Sands Macao | | | | | |
| Total room revenues | $ | 17 |
| | $ | 19 |
| | (10.5 | )% |
| Occupancy rate | 98.6 | % | | 97.7 | % | | 0.9 | pts |
| Average daily rate (in US$) | 164 |
| | 188 |
| | (12.8 | )% |
| Revenue per available room (in US$) | 162 |
| | 184 |
| | (12.0 | )% |
Mall Revenues. Mall revenues for the year ended December 31, 2018 increased 5.8%, to US$507 million, compared to US$479 million for the year ended December 31, 2017. The increase was primarily driven by increased turnover fees from Shoppes at Four Seasons, Shoppes at Venetian and Shoppes at Sands Cotai Central, as well as the additional retail space available at Shoppes at Sands Cotai Central. The following table summarizes the results of our mall activity on Cotai for the periods indicated:
|
| | | | | | | | | | |
| | Year ended December 31, |
| | 2018(i) | | 2017 | | Change |
| | (US$ in millions, except per square foot amount) |
| The Venetian Macao | | | | | |
| Total mall revenues | $ | 233 |
| | $ | 219 |
| | 6.4 | % |
| Mall gross leasable area (in square feet) | 813,376 |
| | 786,429 |
| | 3.4 | % |
| Occupancy | 90.3 | % | | 97.2 | % | | (6.9 | )pts |
| Base rent per square foot (in US$) | 263 |
| | 247 |
| | 6.5 | % |
Tenant sales per square foot (in US$)(ii) | 1,746 |
| | 1,389 |
| | 25.7 | % |
Sands Cotai Central (iii) | | | | | |
| Total mall revenues | $ | 69 |
| | $ | 63 |
| | 9.5 | % |
| Mall gross leasable area (in square feet) | 519,681 |
| | 424,309 |
| | 22.5 | % |
| Occupancy | 91.5 | % | | 93.5 | % | | (2.0 | )pts |
| Base rent per square foot (in US$) | 108 |
| | 113 |
| | (4.4 | )% |
Tenant sales per square foot (in US$)(ii) | 892 |
| | 744 |
| | 19.9 | % |
| The Parisian Macao | | | | | |
| Total mall revenues | $ | 57 |
| | $ | 66 |
| | (13.6 | )% |
| Mall gross leasable area (in square feet) | 295,915 |
| | 300,218 |
| | (1.4 | )% |
| Occupancy | 89.8 | % | | 93.4 | % | | (3.6 | )pts |
| Base rent per square foot (in US$) | 156 |
| | 218 |
| | (28.4 | )% |
Tenant sales per square foot (in US$)(ii) | 649 |
| | 574 |
| | 13.1 | % |
| The Plaza Macao | | | | | |
| Total mall revenues | $ | 145 |
| | $ | 131 |
| | 10.7 | % |
| Mall gross leasable area (in square feet) | 241,548 |
| | 257,859 |
| | (6.3 | )% |
| Occupancy | 99.0 | % | | 99.6 | % | | (0.6 | )pts |
| Base rent per square foot (in US$) | 460 |
| | 456 |
| | 0.9 | % |
Tenant sales per square foot (in US$)(ii) | 4,373 |
| | 3,500 |
| | 24.9 | % |
____________________
| |
| (i) | Excludes the results of our mall operations at Sands Macao. |
| |
| (ii) | Tenant sales per square foot reflect sales from tenants only after the tenant has been open for a period of 12 months. |
| |
| (iii) | The Shoppes at Sands Cotai Central will feature up to an estimated 600,000 square feet of gross leasable area upon completion of all phases of Sands Cotai Central’s renovation, rebranding and expansion to The Londoner Macao. |
Food and beverage revenues. Food and beverage revenues for the year ended December 31, 2018 increased 4.1%, to US$304 million, compared to US$292 million for the year ended December 31, 2017. The increase was primarily driven by an increase in property visitation.
Convention, ferry, retail and other revenues. Convention, ferry, retail and other revenues for the year ended December 31, 2018 were US$304 million, an increase of 7.0%, compared to US$284 million for the year ended December 31, 2017. The increase was primarily attributable to an insurance recovery for business interruption caused by Typhoons Hato and Mangkhut.
Operating Expenses
Our operating expenses consisted of the following:
|
| | | | | | | | | | |
| | Year ended December 31, |
| | 2018 | | 2017 | | Percent Change |
| | (US$ in millions) |
| Casino | $ | 4,216 |
| | $ | 3,646 |
| | 15.6 | % |
| Rooms | 185 |
| | 176 |
| | 5.1 | % |
| Mall | 53 |
| | 53 |
| | — | % |
| Food and beverage | 252 |
| | 241 |
| | 4.6 | % |
| Convention, ferry, retail and other | 212 |
| | 209 |
| | 1.4 | % |
| Provision for credit losses, net | 9 |
| | 4 |
| | 125.0 | % |
| General and administrative | 672 |
| | 657 |
| | 2.3 | % |
| Corporate | 125 |
| | 121 |
| | 3.3 | % |
| Pre-opening | 5 |
| | 7 |
| | (28.6 | )% |
| Depreciation and amortization | 655 |
| | 676 |
| | (3.1 | )% |
| Net foreign exchange (gains)/losses | (4 | ) | | 11 |
| | (136.4 | )% |
| Loss on disposal of property and equipment, investment properties and intangible assets | 131 |
| | 12 |
| | 991.7 | % |
| Total operating expenses | $ | 6,511 |
| | $ | 5,813 |
| | 12.0 | % |
| | | | | | |
____________________
Note: Prior year presentation has been adjusted for the adoption of IFRS 15, Revenue from Contracts with Customers, and conformed to the current year presentation.
Operating expenses were US$6.51 billion for the year ended December 31, 2018, an increase of 12.0%, compared to US$5.81 billion for the year ended December 31, 2017. The increase in operating expenses was primarily due to increases of business volumes across all business categories.
Casino expenses for the year ended December 31, 2018 were US$4.22 billion, an increase of 15.6% compared to US$3.65 billion for the year ended December 31, 2017. The increase was primarily due to an increase in gaming taxes as a result of increased casino revenues.
Room expenses for the year ended December 31, 2018 were US$185 million, an increase of 5.1% compared to US$176 million for the year ended December 31, 2017. The increase was mainly driven by increases in payroll and other operating expenses as a result of higher hotel occupancy.
Food and beverage expenses for the year ended December 31, 2018 were US$252 million, an increase of 4.6%, compared to US$241 million for the year ended December 31, 2017. The increase was primarily driven by increases in cost of sales and payroll consistent with higher business volumes.
Convention, ferry, retail and other expenses for the year ended December 31, 2018 were US$212 million, an increase of 1.4% compared to US$209 million for the year ended December 31, 2017. The increase was primarily driven by higher fuel costs for our ferry operations.
Provision for credit losses, net for the year ended December 31, 2018 were US$9 million, an increase of 125.0% compared to US$4 million for the year ended December 31, 2017. The increase was primarily driven by increased provision for premium direct players.
General and administrative expenses were US$672 million for the year ended December 31, 2018, an increase of 2.3% compared to US$657 million for the year ended December 31, 2017. The increase was primarily driven by an increase in team member costs and information technology-related expenses.
Corporate expenses were US$125 million for the year ended December 31, 2018, an increase of 3.3% compared to US$121 million for the year ended December 31, 2017. The increase was primarily driven by an increase in royalty fees due to increased revenues for the operation of The Venetian Macao, The Plaza Macao and Sands Macao.
Depreciation and amortization expense was US$655 million for the year ended December 31, 2018, a decrease of 3.1%, compared to US$676 million for the year ended December 31, 2017. During the year ended December 31, 2017, the Group completed an evaluation
of the estimated useful lives of its property and equipment and investment properties and determined changes to the useful lives of certain assets were appropriate. These changes in estimated useful lives of the assets were accounted for as changes in accounting estimates beginning on July 1, 2017. The impact of this change for the year ended December 31, 2018, was a decrease in depreciation expense of US$82 million. The aforementioned decrease was partially offset by a US$70 million increase due to the acceleration of depreciation on certain assets to be disposed of in conjunction with The Londoner Macao project.
Net foreign exchange gains for the year ended December 31, 2018 were US$4 million and were primarily associated with U.S. dollar denominated debt. This compared with net foreign exchange losses of US$11 million for the year ended December 31, 2017.
Loss on disposal of property and equipment, investment properties and intangible assets was US$131 million for the year ended December 31, 2018, compared with a loss of US$12 million for the year ended December 31, 2017. The increase was primarily due to US$128 million of assets disposed of related to the Four Seasons Tower Suites Macao project.
Adjusted Property EBITDA
The following table summarizes information related to our segments for the periods indicated:
|
| | | | | | | | | | |
| | Year ended December 31, |
| | 2018 | | 2017 | | Percent Change |
| | (US$ in millions) |
| The Venetian Macao | $ | 1,378 |
| | $ | 1,137 |
| | 21.2 | % |
| Sands Cotai Central | 759 |
| | 633 |
| | 19.9 | % |
| The Parisian Macao | 484 |
| | 412 |
| | 17.5 | % |
| The Plaza Macao | 262 |
| | 233 |
| | 12.4 | % |
| Sands Macao | 178 |
| | 174 |
| | 2.3 | % |
| Ferry and other operations | 18 |
| | 22 |
| | (18.2 | )% |
| Total Adjusted Property EBITDA | $ | 3,079 |
| | $ | 2,611 |
| | 17.9 | % |
| | | | | | |
Adjusted property EBITDA for the year ended December 31, 2018 increased 17.9% to US$3.08 billion, compared to US$2.61 billion for the year ended December 31, 2017. The increase was driven by the revenue increases in all business categories. The management team continues to focus on operational efficiencies and cost control measures throughout both the gaming and non-gaming areas of the business, maintaining a market-leading adjusted property EBITDA.
Interest Expense
The following table summarizes information related to interest expense for the periods indicated:
|
| | | | | | | | | | |
| | Year ended December 31, |
| | 2018 | | 2017 | | Percent Change |
| | (US$ in millions) |
| Interest and other finance costs | $ | 229 |
| | $ | 155 |
| | 47.7 | % |
| Less: interest capitalized | (4 | ) | | (2 | ) | | 100.0 | % |
| Interest expense, net | $ | 225 |
| | $ | 153 |
| | 47.1 | % |
| | | | | | |
Interest expense, net of amounts capitalized, was US$225 million for the year ended December 31, 2018, compared to US$153 million for the year ended December 31, 2017. The increase was primarily due to a US$74 million increase in interest and other finance costs, primarily driven by a US$112 million increase in interest expense on Senior Notes issued in August 2018, partially offset by US$9 million of net interest income related to interest rate swaps and a US$32 million decrease in interest expense on the 2016 VML Credit Facility repaid in August 2018. Our weighted average interest rate for the year ended December 31, 2018 was approximately 4.6%, compared to approximately 3.3% for the year ended December 31, 2017. The weighted average interest rates are calculated based on total interest expense (including amortization of deferred financing costs, standby fees and other financing costs and interest capitalized) and total weighted average borrowings.
Profit
Profit for the year ended December 31, 2018 was US$1.88 billion, an increase of 17.0% compared to US$1.60 billion for the year ended December 31, 2017.
Year ended December 31, 2017 compared to year ended December 31, 2016
Net Revenues
Our net revenues consisted of the following:
|
| | | | | | | | | | |
| | Year ended December 31, |
| | 2017 | | 2016 | | Percent Change |
| | (US$ in millions) |
| Casino | $ | 5,880 |
| | $ | 5,078 |
| | 15.8 | % |
| Rooms | 651 |
| | 536 |
| | 21.5 | % |
| Mall | 479 |
| | 420 |
| | 14.0 | % |
| Food and beverage | 292 |
| | 246 |
| | 18.7 | % |
| Convention, ferry, retail and other | 284 |
| | 263 |
| | 8.0 | % |
| Total net revenues | $ | 7,586 |
| | $ | 6,543 |
| | 15.9 | % |
| | | | | | |
Net revenues were US$7.59 billion for the year ended December 31, 2017, an increase of 15.9% compared to US$6.54 billion for the year ended December 31, 2016. Net revenues increased in all business categories, mainly driven by a full year of operations at The Parisian Macao. We continued to enjoy Macao market-leading visitation and focused on driving the high-margin mass market gaming business, while providing luxury amenities and high service levels to our VIP and premium players.
Casino Revenues. Our net casino revenues for the year ended December 31, 2017 were US$5.88 billion, an increase of 15.8% compared to US$5.08 billion for the year ended December 31, 2016. The increase was mainly driven by a full year of operations at The Parisian Macao. The following table summarizes the results of our casino activity for the periods indicated:
|
| | | | | | | | | | |
| | Year ended December 31, |
| | 2017 | | 2016 | | Change |
| | (US$ in millions) |
| The Venetian Macao | | | | | |
| Total net casino revenues | $ | 2,362 |
| | $ | 2,286 |
| | 3.3 | % |
| Non-Rolling Chip drop | 7,399 |
| | 6,856 |
| | 7.9 | % |
| Non-Rolling Chip win percentage | 25.2 | % | | 25.2 | % | | — |
|
| Rolling Chip volume | 26,239 |
| | 28,851 |
| | (9.1 | )% |
| Rolling Chip win percentage | 3.34 | % | | 3.23 | % | | 0.11 | pts |
| Slot handle | 2,929 |
| | 3,790 |
| | (22.7 | )% |
| Slot hold percentage | 5.3 | % | | 4.5 | % | | 0.8 | pts |
| Sands Cotai Central | | | | | |
| Total net casino revenues | $ | 1,433 |
| | $ | 1,471 |
| | (2.6 | )% |
| Non-Rolling Chip drop | 5,996 |
| | 5,992 |
| | 0.1 | % |
| Non-Rolling Chip win percentage | 20.7 | % | | 20.2 | % | | 0.5 | pts |
| Rolling Chip volume | 10,621 |
| | 12,329 |
| | (13.9 | )% |
| Rolling Chip win percentage | 3.09 | % | | 3.41 | % | | (0.32 | )pts |
| Slot handle | 4,802 |
| | 5,794 |
| | (17.1 | )% |
| Slot hold percentage | 4.1 | % | | 3.6 | % | | 0.5 | pts |
The Parisian Macao(i) | | | | | |
| Total net casino revenues | $ | 1,120 |
| | $ | 315 |
| | 255.6 | % |
| Non-Rolling Chip drop | 3,973 |
| | 1,085 |
| | 266.2 | % |
| Non-Rolling Chip win percentage | 19.6 | % | | 18.5 | % | | 1.1 | pts |
| Rolling Chip volume | 18,275 |
| | 4,061 |
| | 350.0 | % |
| Rolling Chip win percentage | 3.14 | % | | 4.24 | % | | (1.10 | )pts |
| Slot handle | 3,729 |
| | 974 |
| | 282.9 | % |
| Slot hold percentage | 3.3 | % | | 4.5 | % | | (1.2 | )pts |
| The Plaza Macao | | | | | |
| Total net casino revenues | $ | 391 |
| | $ | 392 |
| | (0.3 | )% |
| Non-Rolling Chip drop | 1,284 |
| | 1,114 |
| | 15.3 | % |
| Non-Rolling Chip win percentage | 22.7 | % | | 21.9 | % | | 0.8 | pts |
| Rolling Chip volume | 10,040 |
| | 9,004 |
| | 11.5 | % |
| Rolling Chip win percentage | 2.59 | % | | 3.09 | % | | (0.50 | )pts |
| Slot handle | 436 |
| | 414 |
| | 5.3 | % |
| Slot hold percentage | 7.4 | % | | 6.2 | % | | 1.2 | pts |
| Sands Macao | | | | | |
| Total net casino revenues | $ | 574 |
| | $ | 614 |
| | (6.5 | )% |
| Non-Rolling Chip drop | 2,457 |
| | 2,628 |
| | (6.5 | )% |
| Non-Rolling Chip win percentage | 19.0 | % | | 18.6 | % | | 0.4 | pts |
| Rolling Chip volume | 4,309 |
| | 7,014 |
| | (38.6 | )% |
| Rolling Chip win percentage | 2.79 | % | | 2.48 | % | | 0.31 | pts |
| Slot handle | 2,420 |
| | 2,583 |
| | (6.3 | )% |
| Slot hold percentage | 3.3 | % | | 3.4 | % | | (0.1 | )pts |
____________________
| |
| (i) | The Parisian Macao opened on September 13, 2016. |
Room Revenues. Room revenues for the year ended December 31, 2017 were US$651 million, an increase of 21.5% compared to US$536 million for the year ended December 31, 2016. The increase was primarily driven by a full year of operations at The Parisian Macao and increased demand at Sands Cotai Central. During the year ended December 31, 2017, there were approximately 9% and 8% fewer average rooms available at The Plaza Macao and The Venetian Macao, respectively, compared to the year ended December 31, 2016. The following table summarizes the results of our room activity for the periods indicated:
|
| | | | | | | | | | |
| | Year ended December 31, |
| | 2017 | | 2016 | | Change |
| | (Room revenues in US$ millions) |
| The Venetian Macao | | | | | |
| Total room revenues | $ | 179 |
| | $ | 177 |
| | 1.1 | % |
| Occupancy rate | 91.4 | % | | 86.0 | % | | 5.4 | pts |
| Average daily rate (in US$) | 214 |
| | 208 |
| | 2.9 | % |
| Revenue per available room (in US$) | 196 |
| | 179 |
| | 9.5 | % |
| Sands Cotai Central | | | | | |
| Total room revenues | $ | 291 |
| | $ | 267 |
| | 9.0 | % |
| Occupancy rate | 86.6 | % | | 82.2 | % | | 4.4 | pts |
| Average daily rate (in US$) | 149 |
| | 145 |
| | 2.8 | % |
| Revenue per available room (in US$) | 129 |
| | 119 |
| | 8.4 | % |
The Parisian Macao(i) | | | | | |
| Total room revenues | $ | 128 |
| | $ | 36 |
| | 255.6 | % |
| Occupancy rate | 90.4 | % | | 90.5 | % | | (0.1 | )pts |
| Average daily rate (in US$) | 141 |
| | 136 |
| | 3.7 | % |
| Revenue per available room (in US$) | 128 |
| | 123 |
| | 4.1 | % |
| The Plaza Macao | | | | | |
| Total room revenues | $ | 34 |
| | $ | 36 |
| | (5.6 | )% |
| Occupancy rate | 82.1 | % | | 75.3 | % | | 6.8 | pts |
| Average daily rate (in US$) | 343 |
| | 355 |
| | (3.4 | )% |
| Revenue per available room (in US$) | 281 |
| | 268 |
| | 4.9 | % |
| Sands Macao | | | | | |
| Total room revenues | $ | 19 |
| | $ | 20 |
| | (5.0 | )% |
| Occupancy rate | 97.7 | % | | 97.1 | % | | 0.6 | pts |
| Average daily rate (in US$) | 188 |
| | 199 |
| | (5.5 | )% |
| Revenue per available room (in US$) | 184 |
| | 193 |
| | (4.7 | )% |
____________________
| |
| (i) | The Parisian Macao opened on September 13, 2016. |
Mall Revenues. Mall revenues for the year ended December 31, 2017 increased 14.0%, to US$479 million, compared to US$420 million for the year ended December 31, 2016. The increase was primarily attributable to a US$43 million increase of mall revenues at the Shoppes at Parisian due to a full year of operations, as well as a US$11 million increase at the Shoppes at Venetian mainly driven by lease renewals and replacements that resulted in higher base rent. The following table summarizes the results of our mall activity for the periods indicated:
|
| | | | | | | | | | |
| | Year ended December 31, |
| | 2017 | | 2016 | | Change |
| | (US$ in millions, except per square foot amount) |
| The Venetian Macao | | | | | |
| Total mall revenues | $ | 219 |
| | $ | 208 |
| | 5.3 | % |
| Mall gross leasable area (in square feet) | 786,429 |
| | 777,413 |
| | 1.2 | % |
| Occupancy | 97.2 | % | | 97.6 | % | | (0.4 | )pts |
| Base rent per square foot (in US$) | 247 |
| | 241 |
| | 2.5 | % |
Tenant sales per square foot (in US$)(i) | 1,389 |
| | 1,326 |
| | 4.8 | % |
| Sands Cotai Central | | | | | |
| Total mall revenues | $ | 63 |
| | $ | 62 |
| | 1.6 | % |
| Mall gross leasable area (in square feet) | 424,309 |
| | 407,065 |
| | 4.2 | % |
| Occupancy | 93.5 | % | | 96.7 | % | | (3.2 | )pts |
| Base rent per square foot (in US$) | 113 |
| | 128 |
| | (11.7 | )% |
Tenant sales per square foot (in US$)(i) | 744 |
| | 882 |
| | (15.6 | )% |
The Parisian Macao(ii) | | | | | |
| Total mall revenues | $ | 66 |
| | $ | 23 |
| | 187.0 | % |
| Mall gross leasable area (in square feet) | 300,218 |
| | 299,778 |
| | 0.1 | % |
| Occupancy | 93.4 | % | | 92.6 | % | | 0.8 | pts |
| Base rent per square foot (in US$) | 218 |
| | 222 |
| | (1.8 | )% |
Tenant sales per square foot (in US$)(i) | 574 |
| | N/A |
| | N/A |
|
| The Plaza Macao | | | | | |
| Total mall revenues | $ | 131 |
| | $ | 127 |
| | 3.1 | % |
| Mall gross leasable area (in square feet) | 257,859 |
| | 259,410 |
| | (0.6 | )% |
| Occupancy | 99.6 | % | | 99.3 | % | | 0.3 | pts |
| Base rent per square foot (in US$) | 456 |
| | 452 |
| | 0.9 | % |
Tenant sales per square foot (in US$)(i) | 3,500 |
| | 3,004 |
| | 16.5 | % |
____________________
| |
| (i) | Tenant sales per square foot reflect sales from tenants only after the tenant has been open for a period of 12 months. |
| |
| (ii) | The Parisian Macao opened on September 13, 2016. |
Food and beverage revenues. Food and beverage revenues for the year ended December 31, 2017 increased 18.7%, to US$292 million, compared to US$246 million for the year ended December 31, 2016. The increase was primarily due to a full year of operations at The Parisian Macao.
Convention, ferry, retail and other revenues. Convention, ferry, retail and other revenues for the year ended December 31, 2017 were US$284 million, an increase of 8.0% compared to US$263 million for the year ended December 31, 2016. The increase was primarily attributable to a full year of operations at The Parisian Macao, and increases in other business categories, such as convention, entertainment and ferry operations.
Operating Expenses
Our operating expenses consisted of the following:
|
| | | | | | | | | | |
| | Year ended December 31, |
| | 2017 | | 2016 | | Percent Change |
| | (US$ in millions) |
| Casino | $ | 3,646 |
| | $ | 3,165 |
| | 15.2 | % |
| Rooms | 176 |
| | 143 |
| | 23.1 | % |
| Mall | 53 |
| | 41 |
| | 29.3 | % |
| Food and beverage | 241 |
| | 201 |
| | 19.9 | % |
| Convention, ferry, retail and other | 209 |
| | 188 |
| | 11.2 | % |
| Provision for doubtful accounts, net | 4 |
| | 18 |
| | (77.8 | )% |
| General and administrative | 657 |
| | 554 |
| | 18.6 | % |
| Corporate | 121 |
| | 131 |
| | (7.6 | )% |
| Pre-opening | 7 |
| | 128 |
| | (94.5 | )% |
| Depreciation and amortization | 676 |
| | 611 |
| | 10.6 | % |
| Net foreign exchange losses/(gains) | 11 |
| | (1 | ) | | (1,200.0 | )% |
| Loss on disposal of property and equipment, investment properties and intangible assets | 12 |
| | 12 |
| | 0.0 | % |
| Total operating expenses | $ | 5,813 |
| | $ | 5,191 |
| | 12.0 | % |
| | | | | | |
Operating expenses were US$5.81 billion for the year ended December 31, 2017, an increase of 12.0%, compared to US$5.19 billion for the year ended December 31, 2016. The increase in operating expenses was primarily due to increases of business volumes across all business categories, as well as a full year of operations at The Parisian Macao.
Casino expenses for the year ended December 31, 2017 were US$3.65 billion, an increase of 15.2% compared to US$3.16 billion for the year ended December 31, 2016. The increase was primarily driven by a full year of operations at The Parisian Macao.
Room expenses for the year ended December 31, 2017 were US$176 million, an increase of 23.1% compared to US$143 million for the year ended December 31, 2016. The increase was due to a full year of operations at The Parisian Macao.
Mall expenses for the year ended December 31, 2017 were US$53 million, an increase of 29.3% compared to US$41 million for the year ended December 31, 2016. The increase was primarily due to a full year of operations at The Parisian Macao and higher promotional expenses.
Food and beverage expenses for the year ended December 31, 2017 were US$241 million, an increase of 19.9%, compared to US$201 million for the year ended December 31, 2016. The increase was primarily driven by a full year of operations at The Parisian Macao, as well as additional volume-related expenses at other properties.
Convention, ferry, retail and other expenses for the year ended December 31, 2017 were US$209 million, an increase of 11.2% compared to US$188 million for the year ended December 31, 2016. The increase was primarily driven by higher repair and maintenance, and fuel costs for our ferry operations, increases in entertainment expenses at the Cotai Arena, as well as a full year of operations at The Parisian Macao.
Provision for doubtful accounts, net for the year ended December 31, 2017 were US$4 million, a decrease of 77.8% compared to US$18 million for the year ended December 31, 2016. The decrease was primarily driven by increased collection of previously reserved customer balances during the year ended December 31, 2017, as compared to the prior year period.
General and administrative expenses were US$657 million for the year ended December 31, 2017, an increase of 18.6% compared to US$554 million for the year ended December 31, 2016. The increase was primarily driven by a full year of operations at The Parisian Macao.
Corporate expenses were US$121 million for the year ended December 31, 2017, a decrease of 7.6% compared to US$131 million for the year ended December 31, 2016. The decrease was primarily due to non-recurring legal costs during the year ended December 31, 2016, partially offset by higher royalty fees for the full year of operations at The Parisian Macao.
Pre-opening expenses were US$7 million for the year ended December 31, 2017, a decrease of 94.5% compared to US$128 million for the year ended December 31, 2016. The decrease was primarily due to pre-opening activities at The Parisian Macao, which opened on September 13, 2016.
Depreciation and amortization expense was US$676 million for the year ended December 31, 2017, an increase of 10.6% compared to US$611 million for the year ended December 31, 2016. The increase was primarily driven by a full year of depreciation of assets at The Parisian Macao, partially offset by a change in the estimated useful lives of our leasehold interests in land, land improvements, buildings and building improvements from a range of 15 to 40 years to 10 to 50 years from the date placed in service, as well as changes to the estimated useful lives of certain other furniture, fittings and equipment, to better reflect the estimated periods during which these assets are expected to remain in service. These changes in estimated useful lives of the assets were accounted for as changes in accounting estimates beginning on July 1, 2017. The impact of these changes for the year ended December 31, 2017, was a decrease in depreciation expense and an increase in operating profit of US$89 million, and an increase of profit attributable to equity holders of the Company of US$88 million.
Net foreign exchange losses for the year ended December 31, 2017 were US$11 million and were primarily associated with U.S. dollar denominated debt. This compared with net foreign exchange gains of US$1 million for the year ended December 31, 2016.
Adjusted Property EBITDA
The following table summarizes information related to our segments for the periods indicated:
|
| | | | | | | | | | |
| | Year ended December 31, |
| | 2017 | | 2016 | | Percent Change |
| | (US$ in millions) |
| The Venetian Macao | $ | 1,137 |
| | $ | 1,092 |
| | 4.1 | % |
| Sands Cotai Central | 633 |
| | 615 |
| | 2.9 | % |
The Parisian Macao(i) | 412 |
| | 114 |
| | 261.4 | % |
| The Plaza Macao | 233 |
| | 221 |
| | 5.4 | % |
| Sands Macao | 174 |
| | 171 |
| | 1.8 | % |
| Ferry and other operations | 22 |
| | 31 |
| | (29.0 | )% |
| Total Adjusted Property EBITDA | $ | 2,611 |
| | $ | 2,244 |
| | 16.4 | % |
| | | | | | |
____________________
| |
| (i) | The Parisian Macao opened on September 13, 2016. |
Adjusted Property EBITDA for the year ended December 31, 2017 increased 16.4% to US$2.61 billion, compared to US$2.24 billion for the year ended December 31, 2016. The increases were primarily driven by a full year of operations at The Parisian Macao. The management team continues to focus on operational efficiencies and cost control measures throughout both the gaming and non-gaming areas of the business.
Interest Expense
The following table summarizes information related to interest expense for the periods indicated:
|
| | | | | | | | | | |
| | Year ended December 31, |
| | 2017 | | 2016 | | Percent Change |
| | (US$ in millions) |
| Interest and other finance costs | $ | 155 |
| | $ | 120 |
| | 29.2 | % |
| Less: interest capitalized | (2 | ) | | (34 | ) | | (94.1 | )% |
| Interest expense, net | $ | 153 |
| | $ | 86 |
| | 77.9 | % |
| | | | | | |
Interest expense, net of amounts capitalized, was US$153 million for the year ended December 31, 2017, compared to US$86 million for the year ended December 31, 2016. The increase was primarily due to a US$35 million increase in interest and other finance costs, primarily driven by a US$1.0 billion new term loan drawn in August 2016, an increase in weighted average interest rate and a US$32 million decrease in capitalized interest as we opened The Parisian Macao in September 2016. Our weighted average borrowing cost for the year ended December 31, 2017 was approximately 2.6%, compared to approximately 2.1% for the year ended December 31, 2016.
Profit
Profit for the year ended December 31, 2017 was US$1.60 billion, an increase of 31.0% compared to US$1.22 billion for the year ended December 31, 2016.
Reconciliation of Non-IFRS Financial Measures
The following table presents a reconciliation of Adjusted Property EBITDA to profit attributable to equity holders of the Company for the periods presented:
|
| | | | | | | | | | | |
| | Year Ended December 31, |
| | 2018 | | 2017 | | 2016 |
| | (US$ in millions) |
| Profit attributable to equity holders of the Company | $ | 1,875 |
| | $ | 1,603 |
| | $ | 1,224 |
|
| Income tax expense/(benefit) | (7 | ) | | 22 |
| | 44 |
|
| Loss on modification or early retirement of debt | 81 |
| | — |
| | 1 |
|
| Interest expense, net of amount capitalized | 225 |
| | 153 |
| | 86 |
|
| Interest income | (20 | ) | | (5 | ) | | (3 | ) |
| Loss on disposal of property and equipment, investment properties and intangible assets | 131 |
| | 12 |
| | 12 |
|
| Net foreign exchange (gains)/losses | (4 | ) | | 11 |
| | (1 | ) |
| Depreciation and amortization | 655 |
| | 676 |
| | 611 |
|
| Pre-opening expense | 5 |
| | 7 |
| | 127 |
|
| Corporate expense | 125 |
| | 120 |
| | 128 |
|
| Share-based compensation, net of amount capitalized | 13 |
| | 12 |
| | 15 |
|
| Adjusted Property EBITDA | $ | 3,079 |
| | $ | 2,611 |
| | $ | 2,244 |
|
| | | | | | |
Additional Information Regarding our Retail Mall Operations
The following tables summarize the results of our mall operations on Cotai for the years ended December 31, 2018, 2017 and 2016:
|
| | | | | | | | | | | | | | | | | | | |
| | Shoppes at Venetian | | Shoppes at Four Seasons | | Shoppes at Cotai Central | | Shoppes at Parisian(i) | | Total |
| | (US$ in millions) |
| For the year ended December 31, 2018 | | | | | | | | | |
| Mall revenues: | | | | | | | | | |
Minimum rents(ii) | $ | 180 |
| | $ | 110 |
| | $ | 38 |
| | $ | 42 |
| | $ | 370 |
|
| Overage rents | 21 |
| | 25 |
| | 14 |
| | 3 |
| | 63 |
|
| CAM, levies and direct recoveries | 32 |
| | 10 |
| | 17 |
| | 12 |
| | 71 |
|
| Total mall revenues | 233 |
| | 145 |
| | 69 |
| | 57 |
| | 504 |
|
| Mall operating expenses: | | | | | | | | | |
| Common area maintenance | 15 |
| | 6 |
| | 7 |
| | 6 |
| | 34 |
|
| Marketing and other direct operating expenses | 9 |
| | 3 |
| | 3 |
| | 4 |
| | 19 |
|
| Mall operating expenses | 24 |
| | 9 |
| | 10 |
| | 10 |
| | 53 |
|
| Provision for expected credit losses | — |
| | — |
| | 1 |
| | 1 |
| | 2 |
|
Mall-related expenses(iii), (iv) | $ | 24 |
| | $ | 9 |
| | $ | 11 |
| | $ | 11 |
| | $ | 55 |
|
| For the year ended December 31, 2017 | | | | | | | | | |
| Mall revenues: | | | | | | | | | |
Minimum rents(ii) | $ | 175 |
| | $ | 113 |
| | $ | 39 |
| | $ | 52 |
| | $ | 379 |
|
| Overage rents | 12 |
| | 8 |
| | 5 |
| | 2 |
| | 27 |
|
| CAM, levies and direct recoveries | 32 |
| | 10 |
| | 19 |
| | 12 |
| | 73 |
|
| Total mall revenues | 219 |
| | 131 |
| | 63 |
| | 66 |
| | 479 |
|
| Mall operating expenses: | | | | | | | | | |
| Common area maintenance | 15 |
| | 5 |
| | 7 |
| | 6 |
| | 33 |
|
| Marketing and other direct operating expenses | 8 |
| | 4 |
| | 3 |
| | 5 |
| | 20 |
|
| Mall operating expenses | 23 |
| | 9 |
| | 10 |
| | 11 |
| | 53 |
|
| Provision for doubtful accounts | — |
| | — |
| | 1 |
| | 2 |
| | 3 |
|
Mall-related expenses(iii), (iv) | $ | 23 |
| | $ | 9 |
| | $ | 11 |
| | $ | 13 |
| | $ | 56 |
|
| For the year ended December 31, 2016 | | | | | | | | | |
| Mall revenues: | | | | | | | | | |
Minimum rents(ii) | $ | 167 |
| | $ | 114 |
| | $ | 45 |
| | $ | 17 |
| | $ | 343 |
|
| Overage rents | 10 |
| | 3 |
| | 4 |
| | — |
| | 17 |
|
| CAM, levies and direct recoveries | 31 |
| | 10 |
| | 13 |
| | 6 |
| | 60 |
|
| Total mall revenues | 208 |
| | 127 |
| | 62 |
| | 23 |
| | 420 |
|
| Mall operating expenses: | | | | | | | | | |
| Common area maintenance | 15 |
| | 5 |
| | 7 |
| | 2 |
| | 29 |
|
| Marketing and other direct operating expenses | 5 |
| | 3 |
| | 2 |
| | 2 |
| | 12 |
|
| Mall operating expenses | 20 |
| | 8 |
| | 9 |
| | 4 |
| | 41 |
|
| Provision for doubtful accounts | 3 |
| | — |
| | — |
| | — |
| | 3 |
|
Mall-related expenses(iii), (iv) | $ | 23 |
| | $ | 8 |
| | $ | 9 |
| | $ | 4 |
| | $ | 44 |
|
____________________
| |
| (i) | The Shoppes at Parisian opened in September 2016. |
| |
| (ii) | Minimum rents include base rents and straight-line adjustments of base rents. |
| |
| (iii) | Mall-related expenses consist of CAM, marketing fees and other direct operating expenses, property taxes and provision for doubtful accounts, but exclude depreciation and amortization and general and administrative costs. |
| |
| (iv) | Commercial property that generates rental income is exempt from property tax for the first six years for newly constructed buildings in Cotai. Each property is also eligible to obtain an additional six-year exemption, provided certain qualifications are met. To date, The Venetian Macao, The Plaza Macao and Four Seasons Hotel Macao and The Parisian Macao have obtained a second exemption, |
extending the property tax exemption to July 2019, July 2020 and August 2028, respectively. Under the initial exemption, Sands Cotai Central has a distinct exemption for each hotel tower with expiration dates that range from March 2018 to November 2021. The Company is currently working on obtaining the second exemption for Sands Cotai Central.
It is common in the mall operating industry for companies to disclose mall net operating income (“NOI”) as a useful supplemental measure of a mall’s operating performance. Because NOI excludes general and administrative expenses, interest expense, impairment losses, depreciation and amortization, gains and losses from property dispositions, allocations to noncontrolling interests and provision for income taxes, it provides a performance measure that, when compared year over year, reflects the revenues and expenses directly associated with owning and operating commercial real estate properties and the impact on operations from trends in occupancy rates, rental rates and operating costs.
In the tables above, we believe taking total mall revenues less mall-related expenses provides an operating performance measure for our malls. Other mall operating companies may use different methodologies for deriving mall-related expenses. As such, this calculation may not be comparable to the NOI of other mall operating companies.
Taxation
According to the gaming subconcession granted by the Macao Government and the relevant legislation, we are required to pay a special gaming tax of 35% on gross gaming revenues. We are also required to contribute 4% of gross gaming revenues to utilities designated by the Macao Government, a portion of which must be used for promotion of tourism in Macao.
In addition, we are subject to a 12% complementary tax on profit before income tax. In August 2018, we received an extension of our exemption from this complementary tax on gaming profits through June 26, 2022.
We are also subject to a 12% complementary tax on dividend distributions to our shareholders from gaming profits. In April 2019, we entered into an agreement with the Macao Government that requires us to make fixed annual payments in lieu of this 12% tax through June 26, 2022.
For additional details, see Note 2(r) and Note 9 to our audited consolidated financial statements included elsewhere in this annual report.
Contingent Liabilities
We have contingent liabilities arising in the ordinary course of business. Management has made estimates for potential litigation costs based upon consultation with legal counsel. Actual results could differ from these estimates; however, in the opinion of management, such litigation and claims will not have a material adverse effect on our financial position, results of operations or cash flows.
B. LIQUIDITY AND CAPITAL RESOURCES
Liquidity and Capital Resources
Capital Resources
We fund our operations through cash generated from our operations and our debt financing. As of December 31, 2018, we held cash and cash equivalents of US$2.68 billion, which were primarily generated from our operations and the remaining net proceeds from the issuance of the Senior Notes (defined below). Such cash and cash equivalents were primarily held in HK$ and US$.
On August 9, 2018, we issued three series of senior unsecured unregistered notes in an aggregate principal amount of US$5.50 billion, consisting of US$1.80 billion of 4.600% senior notes due August 8, 2023 (the “2023 Notes”), US$1.80 billion of 5.125% senior notes due August 8, 2025 (the “2025 Notes”) and US$1.90 billion of 5.400% senior notes due August 8, 2028 (the “2028 Notes” and together with the 2023 Notes and 2025 Notes, the “Senior Notes”). A portion of the net proceeds from the issuance was used to repay in full the outstanding borrowings under the 2016 VML Credit Facility. The revolving portion of the 2016 VML Credit Facility remained in place following that issuance. On November 20, 2018, we entered into a facility agreement, dated November 20, 2018, (the “2018 SCL Credit Facility”), which provides for a US$2.0 billion revolving credit facility (the “2018 SCL Revolving Facility”), effective as of November 21, 2018, and we canceled the remaining commitments under the 2016 VML Credit Facility. We will use the remaining net proceeds from the issuance of the Senior Notes for general corporate purposes, including capital expenditures. In connection with the Senior Notes, we entered into fixed-to-variable interest rate swap contracts. See “Note 24. Borrowings” and “Note 25. Derivative Financial Instruments” to our audited consolidated financial statements included in this annual report for further information on the Senior Notes and related interest rate swaps.
On December 21, 2018, we launched an exchange offer to exchange all the unregistered notes referred to above with notes, which have been registered under the U.S. Securities Act. The terms of these new notes are identical in all material respects to the unregistered notes, except the new notes have been registered under the U.S. Securities Act and do not have any of the transfer restrictions, any of the registration provisions and certain inapplicable interest provisions relating to the unregistered notes. The exchange offer expired on January 25, 2019.
We believe the cash on hand and cash flow generated from operations, as well as the available borrowing capacity under the SCL Credit Facility, as of December 31, 2018, will be sufficient to maintain compliance with the financial covenants of the SCL Credit Facility and fund our working capital needs, committed and planned capital expenditures, development opportunities, debt obligations and dividend commitments. As at December 31, 2018, we had US$2.0 billion of available borrowing capacity under the SCL Revolving Facility.
For further information on our capital structure, the types of capital instruments we use and our currency and interest rate structure, see Note 20, Note 24, Note 26, Note 28, Note 31(a)(iii) and Note 31(b) to our audited consolidated financial statements included elsewhere in this annual report.
Cash Flows—Summary
Our cash flows consisted of the following for the periods indicated:
|
| | | | | | | | | | | |
| | Year Ended December 31, |
| | 2018 | | 2017 | | 2016 |
| | (US$ in millions) |
| Net cash generated from operating activities | $ | 3,049 |
| | $ | 2,626 |
| | $ | 2,346 |
|
| Net cash used in investing activities | (513 | ) | | (461 | ) | | (1,149 | ) |
| Net cash used in financing activities | (1,099 | ) | | (2,207 | ) | | (1,195 | ) |
| Net increase/(decrease) in cash and cash equivalents | 1,437 |
| | (42 | ) | | 2 |
|
| Cash and cash equivalents at beginning of period | 1,239 |
| | 1,284 |
| | 1,283 |
|
| Effect of exchange rate on cash and cash equivalents | — |
| | (3 | ) | | (1 | ) |
| Cash and cash equivalents at end of period | $ | 2,676 |
| | $ | 1,239 |
| | $ | 1,284 |
|
| | | | | | |
Cash Flows—Operating Activities
We derive most of our operating cash flows from our casino, mall and hotel operations. Table games play at our properties is conducted on a cash and credit basis, while slot machine play is primarily conducted on a cash basis. Our rooms, food and beverage and other non-gaming revenues are conducted primarily on a cash basis or as a trade receivable, resulting in operating cash flows being generally affected by changes in operating income and accounts receivable.
Net cash generated from operating activities for the year ended December 31, 2018 increased 16.1% to US$3.05 billion, compared to US$2.63 billion for the year ended December 31, 2017. The increase in net cash generated from operating activities was primarily attributable to the increase in operating income, partially offset by a lower benefit from our working capital accounts.
Net cash generated from operating activities for the year ended December 31, 2017 increased 11.9% to US$2.63 billion, compared to US$2.35 billion for the year ended December 31, 2016. The increase in net cash generated from operating activities was primarily attributable to the increase in operating income, partially offset by a lower benefit from our working capital accounts.
Cash Flows—Investing Activities
Net cash used in investing activities for the year ended December 31, 2018 was US$513 million and was primarily attributable to capital expenditures for development projects, as well as maintenance spending. Capital expenditures for the year ended December 31, 2018, totaled US$532 million, including US$179 million, US$130 million and US$130 million for construction and development activities at The Venetian Macao, Sands Cotai Central and The Parisian Macao, respectively, and US$93 million for projects mainly at The Plaza Macao and Sands Macao.
Net cash used in investing activities for the year ended December 31, 2017 was US$461 million and was primarily attributable to capital expenditures for development projects, as well as maintenance capital spending. Capital expenditures for the year ended December 31, 2017, totaled US$477 million, including US$204 million for construction activities at The Parisian Macao, and US$273 million for our operations, mainly at The Venetian Macao, Sands Cotai Central, The Plaza Macao and Sands Macao.
Net cash used in investing activities for the year ended December 31, 2016 was US$1.15 billion and was primarily attributable to capital expenditures, which included US$1.02 billion for construction activities at The Parisian Macao and Sands Cotai Central, and US$132 million for our operations, mainly at The Venetian Macao, The Plaza Macao and Sands Macao.
Cash Flows—Financing Activities
Net cash used in financing activities for the year ended December 31, 2018 was US$1.10 billion, which was primarily attributable to US$4.34 billion of net repayments on the 2016 VML Credit Facility, US$2.05 billion in dividend payments and US$128 million in interest and deferred financing costs payments, partially offset by US$5.5 billion proceeds from the issuance of the SCL Senior Notes.
Net cash used in financing activities for the year ended December 31, 2017 was US$2.21 billion, which was primarily attributable to US$2.07 billion in dividend payments, US$128 million in interest payments and US$20 million of repayments on the 2016 VML Credit Facility.
Net cash used in financing activities for the year ended December 31, 2016 was US$1.20 billion, which was primarily attributable to US$2.07 billion in dividend payments, partially offset by US$1.00 billion in proceeds from borrowings under the 2016 VML Credit Facility.
Capital Expenditures
The following table sets forth our capital expenditures, excluding capitalized interest and construction payables, for the periods indicated:
|
| | | | | | | | | | | |
| | Year Ended December 31, |
| | 2018 | | 2017 | | 2016 |
| | (US$ in millions) |
| The Venetian Macao | $ | 179 |
| | $ | 152 |
| | $ | 94 |
|
| Sands Cotai Central | 130 |
| | 84 |
| | 123 |
|
| The Parisian Macao | 130 |
| | 204 |
| | 896 |
|
| The Plaza Macao | 63 |
| | 22 |
| | 16 |
|
| Sands Macao | 29 |
| | 10 |
| | 18 |
|
| Ferry and other operations | 1 |
| | 5 |
| | 4 |
|
| Total capital expenditures | $ | 532 |
| | $ | 477 |
| | $ | 1,151 |
|
| | | | | | |
Capital expenditures are used primarily for new projects and to renovate, upgrade and maintain existing properties.
In 2018, we announced the renovation, expansion and rebranding of Sands Cotai Central into a new destination integrated resort, The Londoner Macao, by adding extensive thematic elements both externally and internally. The Londoner Macao will feature new attractions and features from London, including some of London’s most recognizable landmarks, and expanded retail and food and beverage venues. We will add approximately 370 luxury suites within the tower also occupied by the St. Regis hotel. Design work is nearing completion and construction is being initiated and will be phased to minimize disruption during the property’s peak periods. We expect the additional suites within the tower also occupied by the St. Regis hotel to be completed in 2020 and The Londoner Macao project to be completed in phases throughout 2020 and 2021.
In 2018, we also announced the Four Seasons Tower Suites Macao, which will feature approximately 290 additional premium quality suites. We expect the project to be completed in the first quarter of 2020.
We anticipate the total costs associated with these development projects to be approximately US$2.2 billion. The ultimate costs and completion dates for these projects are subject to change as we finalize our planning and design work and complete the projects. We expect to fund our developments through a combination of the remaining balance of the net proceeds from the Senior Notes, borrowings from our credit facility and operating cash flows.
C. RESEARCH AND DEVELOPMENT, PATENTS AND LICENSES
Intellectual Property
Our intellectual property portfolio currently consists of trademarks, copyrights, patents, domain names, trade secrets and other confidential and proprietary information. We believe that the name recognition, brand identification and image that we have developed
through our intellectual properties attract customers to our facilities, drive customer loyalty and contribute to our success. We register and protect our intellectual property in the jurisdictions in which we operate or significantly advertise, as well as in countries in which we may operate in the future or wish to ensure protection of our rights.
D. TREND INFORMATION
See “— A. Operating Results.”
E. OFF-BALANCE SHEET ARRANGEMENTS
We have not entered into any transactions with special purpose entities, nor have we engaged in any derivative transactions other than interest rate swaps.
F. TABULAR DISCLOSURE OF CONTRACTUAL OBLIGATIONS
Contractual Obligations and Commitments
The following table sets forth our contractual obligations and commitments as of December 31, 2018:
|
| | | | | | | | | | | | | | | | | | | |
| | Payment Due by Period |
| | 2019 | | 2020-21 | | 2022-23 | | Thereafter | | Total |
| | (US$ in millions) |
| Long-Term Debt Obligations | | | | | | | | | |
Senior Notes(i) | $ | — |
| | $ | — |
| | $ | 1,800 |
| | $ | 3,700 |
| | $ | 5,500 |
|
Land Lease Payments(ii) | 7 |
| | 11 |
| | 10 |
| | 49 |
| | 77 |
|
| Other Finance Leases | 2 |
| | 2 |
| | — |
| | — |
| | 4 |
|
| Fixed Interest Payments | 277 |
| | 555 |
| | 555 |
| | 698 |
| | 2,085 |
|
| Contractual Obligations | | | | | | | | | |
Macao Annual Premium(iii) | 42 |
| | 85 |
| | 21 |
| | — |
| | 148 |
|
Mall Deposits(iv) | 49 |
| | 58 |
| | 15 |
| | 5 |
| | 127 |
|
Operating Leases and Other(v) | 128 |
| | 172 |
| | 62 |
| | 214 |
| | 576 |
|
| Total | $ | 505 |
| | $ | 883 |
| | $ | 2,463 |
| | $ | 4,666 |
| | $ | 8,517 |
|
| | | | | | | | | | |
____________________
| |
| (i) | See “Notes to the Consolidated Financial Statements — 24. Borrowings” for further details on these financial transactions. |
| |
| (ii) | Land lease payments consist of long-term land leases with an initial term of 25 years. |
| |
| (iii) | In addition to the 39% gross gaming win tax in Macao (which is not included in this table as the amount we pay is variable in nature), we are required to pay an annual premium with a fixed portion and a variable portion, which is based on the number and type of gaming tables and gaming machines we operate. Based on the gaming tables and gaming machines in operation as of December 31, 2018 the annual premium payable to the Macao Government is approximately US$42 million through the termination of the gaming subconcession in June 2022. |
| |
| (iv) | Mall deposits consist of refundable security deposits received from mall tenants. |
| |
| (v) | Consists of contractual commitments under operating leases for real estate and various equipment, all other noncancellable contractual obligations and primarily relates to certain service and management agreements. The amounts exclude open purchase orders with our suppliers that have not yet been received as these agreements generally allow us the option to cancel, reschedule and adjust terms based on our business needs prior to the delivery of goods or performance of services. |
G. SAFE HARBOR
Special Note Regarding Forward-Looking Statements
This annual report contains forward-looking statements that are, by their nature, subject to significant risks and uncertainties. These forward-looking statements include the discussions of our business strategies and expectations concerning future operations, margins, profitability, liquidity and capital resources. Any statements contained in this annual report that are not statements of historical fact may be deemed to be forward-looking statements. Without limiting the generality of the foregoing, in certain portions included in this annual report, the words “anticipates,” “believes,” “estimates,” “seeks,” “expects,” “plans,” “intends” and similar expressions, as they relate to our company or management, are intended to identify forward-looking statements. Although we believe that these forward-looking
statements are reasonable, we cannot assure you any forward-looking statements will prove to be correct. These forward-looking statements involve known and unknown risks, uncertainties and other factors, which may cause our actual results, performance or achievements to be materially different from any future results, performance or achievements expressed or implied by these forward-looking statements. These factors include, among others, the risks associated with:
| |
| • | general economic and business conditions, which may impact levels of disposable income, consumer spending, group meeting business, pricing of hotel rooms and retail and mall sales; |
| |
| • | the uncertainty of consumer behavior related to discretionary spending and visiting our integrated resorts; |
| |
| • | increased competition, including recent and upcoming increases in hotel rooms, meeting and convention space, retail space, potential additional gaming licenses and online gaming; |
| |
| • | our ability to maintain our subconcession in Macao; |
| |
| • | new developments, construction projects and ventures, including our Cotai developments; |
| |
| • | fluctuations in currency exchange rates and interest rates; |
| |
| • | regulatory policies in mainland China or other countries in which our customers reside, or where we have operations, including visa restrictions limiting the number of visits or the length of stay for visitors from mainland China to Macao, restrictions on foreign currency exchange or importation of currency, and the judicial enforcement of gaming debts; |
| |
| • | the passage of new legislation and receipt of governmental approvals for our operations; |
| |
| • | government regulation of the casino industry (as well as new laws and regulations and changes to existing laws and regulations), including gaming license regulation, the requirement for certain beneficial owners of our securities to be found suitable by gaming authorities, the legalization of gaming in other jurisdictions and regulation of gaming on the Internet; |
| |
| • | the extensive regulations to which we are subject and the costs of compliance or failure to comply with such regulations; |
| |
| • | our failure to maintain the integrity of our customer or company data, including against past or future cybersecurity attacks, and any litigation or disruption to our operations resulting from such loss of data integrity; |
| |
| • | our ability to establish and protect our intellectual property rights; |
| |
| • | new taxes, changes to existing tax rates or proposed changes in tax legislation; |
| |
| • | the continued services of our key management and personnel; |
| |
| • | conflicts of interest that arise because certain of our directors and officers are also directors of LVS; |
| |
| • | our ability to obtain required visas and work permits for management and employees from outside countries to work in Macao, and our ability to compete for the managers and employees with the skills required to perform the services we offer at our properties; |
| |
| • | increased competition for labor and materials due to planned construction projects and quota limits on the hiring of foreign workers; |
| |
| • | labor actions and other labor problems; |
| |
| • | disruptions or reductions in travel, as well as disruptions in our operations, due to natural or man-made disasters, outbreaks of infectious diseases, terrorist activity or war; |
| |
| • | our leverage, debt service and debt covenant compliance, including the ability to refinance our debt obligations as they come due or to obtain sufficient funding for our planned, or any future, development projects; |
| |
| • | our ability to collect gaming receivables from our credit players; |
| |
| • | our relationship with gaming promoters; |
| |
| • | our dependence on chance and theoretical win rates; |
| |
| • | our insurance coverage, including the risk that we have not obtained sufficient coverage, may not be able to obtain sufficient coverage in the future, or will only be able to obtain additional coverage at significantly increased rates; |
| |
| • | the completion of infrastructure projects; |
| |
| • | our dependence upon properties in Macao for all of our cash flow; |
| |
| • | the ability of our subsidiaries to make distribution payments to us; |
| |
| • | the outcome of any ongoing and future litigation; and |
| |
| • | other factors described under “Item 3 - Key Information — D. Risk Factors.” |
Furthermore, these forward-looking statements merely reflect our current view with respect to future events and are not a guarantee of future performance. New risks and uncertainties arise from time to time, and it is impossible for us to predict these events or how they may affect us. Accordingly, you should not place undue reliance on any forward-looking statements. We do not have any obligation and do not intend to update or otherwise revise any forward-looking statements in this annual report, whether as a result of new information, future events or developments or otherwise, except as required by applicable laws, rules and regulations.
All forward-looking statements contained in this annual report are qualified by reference to this cautionary statement.
ITEM 6. — DIRECTORS, SENIOR MANAGEMENT AND EMPLOYEES
A. DIRECTORS AND SENIOR MANAGEMENT
Our Directors
The following table sets forth information regarding our Board of Directors as of the date of this report.
|
| | | | |
| Name | | Position | | Age |
| Mr. Sheldon Gary Adelson | | Chairman of the Board, Chief Executive Officer and Executive Director | | 85 |
| Dr. Wong Ying Wai (Wilfred) | | President and Chief Operating Officer and Executive Director | | 66 |
| Mr. Robert Glen Goldstein | | Non-executive Director | | 63 |
| Mr. Charles Daniel Forman | | Non-executive Director | | 72 |
| Ms. Chiang Yun (Rachel) | | Independent Non-executive Director | | 51 |
| Mr. Victor Patrick Hoog Antink | | Independent Non-executive Director | | 65 |
| Mr. Steven Zygmunt Strasser | | Independent Non-executive Director | | 70 |
| Mr. Kenneth Patrick Chung | | Independent Non-executive Director | | 61 |
The biography of each Director is set out below:
Executive Directors
Mr. Sheldon Gary Adelson is the Chairman of the Board, Chief Executive Officer, an Executive Director and the Chairman of the Nomination Committee. He is also the chief executive officer of one of our U.S. subsidiaries. Mr. Adelson served as a Non-Executive Director from August 2009 until March 2015. Mr. Adelson has been the chairman of the board, chief executive officer and a director of LVS since August 2004. Mr. Adelson has been the chairman of the board, chief executive officer and a director of LVS LLC (or its predecessor, Las Vegas Sands, Inc.) since April 1988, when it was formed to own and operate the former Sands Hotel and Casino. Mr. Adelson also created and developed the Sands Expo and Convention Center, the first privately owned convention center in the United States, which was transferred to LVS in July 2004. Mr. Adelson’s business career spans more than seven decades and has included creating and developing to maturity numerous companies. Mr. Adelson has extensive experience in the convention, trade show and tour and travel businesses. He created and developed the COMDEX Trade Shows, including the COMDEX/Fall Trade Show, which was the world’s largest computer show in the 1990s. He has been the president and chairman of Interface Group Holding Company, Inc. and its predecessors since the mid-1970s and a manager of LVS’ affiliate Interface Group-Massachusetts, LLC and was president of its predecessors since 1990. Mr. Adelson has earned multiple honorary degrees and has been a guest lecturer at various colleges and universities, including the University of New Haven, Harvard Business School, Columbia Business School, Tel Aviv University and Babson College. Among his numerous awards for his business and philanthropic work are the Armed Forces Foundation’s Patriot Award, the Hotel Investment Conference’s Innovation Award, the Woodrow Wilson Award for Corporate Citizenship and induction into the American Gaming Association’s Hall of Fame. Mr. Adelson was re-designated as an Executive Director with effect from March 6, 2015.
Dr. Wong Ying Wai (Wilfred) is the President and Chief Operating Officer, an Executive Director and a member of the Remuneration Committee and the Capex Committee. He is also a director of various subsidiaries of the Company. Dr. Wong joined the administrative officer grade of the Hong Kong Government in 1975 and served in a number of key positions including deputy secretary for the civil service and deputy director—general of industry. Dr. Wong joined the private sector in 1992 and has held top management positions in a number of Hong Kong listed companies in the property development and construction business sectors including Hsin Chong Group Holdings Limited (formerly known as “Hsin Chong Construction Group Limited”), K. Wah International Holdings Limited, Henderson China Holdings Limited and the Shui On Group.
Dr. Wong started his political career at the national level when he was appointed as a member of The Basic Law Consultative Committee (1985–1990) by the Central People’s Government of the People’s Republic of China. He was subsequently appointed by the National People’s Congress of the People’s Republic of China (the “NPC”) as a member of the Preliminary Working Committee for the HKSAR’s Preparatory Committee in 1993 and a member of the HKSAR’s Preparatory Committee in 1995, both bodies were responsible for the transitional policies and arrangements relating to the establishment of the HKSAR Government in 1997. Dr. Wong was a deputy to the NPC during the period from 1997 to 2013.
Dr. Wong’s public service continues through his participation in a number of councils and committees in Hong Kong and Macao. He is currently the chairman of the Hong Kong Arts Development Council, the vice chairman of the Hong Kong Film Development Council, the chairman emeritus of the Hong Kong Baptist University Foundation (since January 2018), the chairman and director of The
Hong Kong International Film Festival Society Limited, Asian Film Awards Academy Limited and Hong Kong Institute for Public Administration and a director and the chairman emeritus of Pacific Basin Economic Council Limited. He was appointed as a member of the Cultural Industries Committee and the Tourism Development Committee of the Government of the Macao Special Administrative Region in 2016 and 2018, respectively. He was the chairman of the Standing Commission on Civil Service Salaries and Conditions of Service until December 31, 2018 and the Court and Council of the Hong Kong Baptist University during the period from 2007 to 2012.
For his long and distinguished public and community service, Dr. Wong was awarded the silver bauhinia star and the gold bauhinia star by the Government of the HKSAR in 2007 and 2015, respectively. Dr. Wong was conferred the degree of Doctor of Humanities honoris causa from Hong Kong Baptist University in November 2013, recognizing his outstanding professional achievements as well as his remarkable contributions to society. He was educated at Harvard University (MPA), University of Oxford, The University of Hong Kong (BSocSc) and The Chinese University of Hong Kong.
Dr. Wong is currently an independent non-executive director of Xinyi Glass Holdings Limited, a company listed on the Hong Kong Stock Exchange. Dr. Wong was the executive director, executive chairman and chief executive officer of Hsin Chong Group Holdings Limited, a company listed on the Hong Kong Stock Exchange, until November 1, 2015, and served as the senior adviser to the board of Hsin Chong Group Holdings Limited subsequent to his resignation from other positions mentioned above, until May 23, 2017. He was also a non-executive director and chairman of Synergis Holdings Limited, a company listed on the Hong Kong Stock Exchange, until December 11, 2015. Dr. Wong was appointed as an Executive Director on January 22, 2016.
Non-Executive Directors
Mr. Robert Glen Goldstein is a Non-Executive Director and the Chairman of the Capex Committee. He is also a director of one of our Macao subsidiaries and the senior vice president of one of our U.S. subsidiaries. Mr. Goldstein has been the president, chief operating officer and a director of LVS and LVS LLC since January 2015 and Mr. Goldstein served as a Non-Executive Director since May 2014 until he was subsequently re-designated as an Executive Director in March 2015, and he was further re-designated as a Non-Executive Director in November 2015. Mr. Goldstein was our Interim President from March 2015 to November 2015 and has been a member of the Capex Committee since March 2015. He previously served as LVS’ President of Global Gaming Operations from January 2011 until December 2014, LVS’ Executive Vice President from July 2009 until December 2014, and the secretary of LVS from August 2016 to November 2016. He has held other senior executive positions at LVS and its subsidiaries since 1995. From 1992 until joining LVS in 1995, Mr. Goldstein was the executive vice president of marketing at the Sands Hotel in Atlantic City, as well as an executive vice president of the parent Pratt Hotel Corporation. Mr. Goldstein was a director of Remark Holdings, Inc. (formerly known as “Remark Media, Inc.”) from May 2013 to March 2017. Mr. Goldstein holds a Bachelor of Arts, History and Political Science, Magna Cum Laude, from the University of Pittsburgh and a Juris Doctorate from the Temple University School of Law. In 1980, he became a member of the Pennsylvania Bar Association. Mr. Goldstein was re-designated as a Non-Executive Director on November 1, 2015.
Mr. Charles Daniel Forman is a Non-Executive Director. Mr. Forman is currently a director of LVS and LVS LLC since August 2004 and March 2004 respectively. Mr. Forman served as the chairman and chief executive officer of Centric Events Group, LLC, a trade show and conference business from April 2002 until his retirement upon the sale of the business in 2007. From 2000 to 2002, he served as a director of a private company and participated in various private equity investments. During 2000, he was the executive vice president of international operations of Key3Media, Inc. From 1998 to 2000, he was the chief legal officer of ZD Events Inc., a tradeshow business that included COMDEX. From 1995 to 1998, Mr. Forman was the executive vice president, chief financial and legal officer of Softbank Comdex Inc. From 1989 to 1995, Mr. Forman was the vice president and general counsel of The Interface Group, a tradeshow and convention business that owned and operated COMDEX. Mr. Forman was in private law practice from 1972 to 1988. Mr. Forman is a member of the board of trustees of The Dana-Farber Cancer Institute, Inc. and a treasurer and director of Nantucket Jewish Cemetery, Inc. Mr. Forman holds a Bachelor of Arts from the University of Pennsylvania and Juris Doctorate from the Boston University School of Law. Mr. Forman was appointed as a Non-Executive Director on May 30, 2014.
Independent Non-Executive Directors
Ms. Chiang Yun (Rachel) is an Independent Non-Executive Director, a member of the Audit Committee and a member of the Nomination Committee. With over 24 years of private equity investment experience, Ms. Chiang is currently the founding and managing partner of Prospere Capital Limited (since April 2018). Ms. Chiang is currently an independent non-executive director of Goodbaby International Holdings Limited and Pacific Century Premium Developments Limited, both listed on the Hong Kong Stock Exchange and an independent non-executive director and a member of the audit committee and the health, safety and security committee of Merlin Entertainments Plc., listed on the Main Market of the London Stock Exchange. Ms. Chiang was one of the founding managing partners of Pacific Alliance Equity Partners, the private equity division of Pacific Alliance Group until March 2018. Ms. Chiang obtained her Executive Master of Business Administration from The Kellogg Graduate School of Management of Northwestern University and Hong Kong University of Science and Technology and Bachelor of Science degree, cum laude, from Virginia Polytechnic Institute and State University. Ms. Chiang was appointed as an Independent Non-Executive Director on October 14, 2009.
Mr. Victor Patrick Hoog Antink is an Independent Non-Executive Director, the Chairman of the Audit Committee, a member of the Remuneration Committee, the Capex Committee and the Nomination Committee. Mr. Hoog Antink is a member of the Bond University Council and the chairman of the Bond Business School Board of Advisors in Australia. He is also the former chairman of South Bank Corporation, and was a director of Property Industry Foundation until June 30, 2016. Mr. Hoog Antink retired as the chief executive officer of DEXUS Property Group in March 2012, a company listed on the Australian Stock Exchange (ASX:DXS). Prior to joining DEXUS Property Group in 2003, Mr. Hoog Antink was the director of funds management of Westfield Holdings Limited in Sydney. Mr. Hoog Antink has also held positions with Greenprint Foundation as a director, Property Council of Australia as national president, Shopping Centre Council of Australia as director, McIntosh Securities Limited, Sydney as a director in corporate and property, Allco Finance Group Limited, Sydney as a director in property finance, Chase Corporation Limited, Sydney as a property director, and Hill Samuel Limited (now Macquarie Bank), Sydney as an associate director. Mr. Hoog Antink holds a Bachelor of Commerce from the University of Queensland and a Master of Business Administration from Harvard Business School. He is a Fellow of the Australian Institute of Company Directors, a Fellow of the Institute of Chartered Accountants, Australia, a Fellow of the Australian Property Institute and a Fellow of the Royal Institute of Chartered Surveyors. In 2016, Mr. Hoog Antink was awarded National Life Membership of the Property Council of Australia. Mr. Hoog Antink possesses the accounting and related financial management expertise required under Rule 3.10(2) of the Listing Rules. Mr. Hoog Antink was appointed as an Independent Non-Executive Director on December 7, 2012.
Mr. Steven Zygmunt Strasser is an Independent Non-Executive Director, a member of the Audit Committee and the Chairman of the Remuneration Committee. Mr. Strasser has spent 28 years heading energy companies in the United States and in Asia. Mr. Strasser was, until June 2012, (i) the chairman, director and chief executive officer of Power Efficiency Corporation, a startup clean-tech company in the United States and (ii) the chairman, director and chief executive officer of Power Efficiency Asia Ltd. In 2001, Mr. Strasser also founded and became the chief executive officer of Summit Energy Ventures LLC, a clean-tech venture capital fund. Mr. Strasser holds a Bachelor of Arts in Political Science and Economics and a Bachelor of Civil Law from McGill University and a Juris Doctor degree from the University of Washington. He also pursued post-graduate studies in international law at the University of Aix-en-Provence. Mr. Strasser was appointed as an Independent Non-Executive Director on May 31, 2013.
Mr. Kenneth Patrick Chung is an Independent Non-Executive Director and a member of the Audit Committee. Mr. Chung joined Deloitte Haskins and Sells London Office in 1980. Mr. Chung became a partner of PricewaterhouseCoopers in 1992, and was a financial service specialist of PricewaterhouseCoopers (Hong Kong and China) since 1996. He was the human resources partner of PricewaterhouseCoopers (Hong Kong), the responsible partner of the audit department of PricewaterhouseCoopers (Hong Kong and China), and the global lead partner of the audit engagement team for Bank of China Limited. Mr. Chung retired from PricewaterhouseCoopers in 2009. Mr. Chung was the honorary treasurer of Community Chest of Hong Kong and the vice chairman of International Social Service Hong Kong Branch. Mr. Chung has also served as the audit partner for the restructurings and initial public offerings of Bank of China Limited, Bank of China (Hong Kong) Limited and Bank of Communications Co., Ltd. Mr. Chung was also an independent non-executive director of Industrial and Commercial Bank of China Limited, a company listed on the Hong Kong Stock Exchange until March 2017. Currently, Mr. Chung serves as an independent non-executive director of China Construction Bank Corporation, a company listed on the Hong Kong Stock Exchange (since November 2018), an independent non-executive director of Prudential Corporation Asia Ltd. (since April 2018) and a trustee of Fu Tak Iam Foundation Limited. Mr. Chung received his bachelor degree in economics from the University of Durham. He is a member of the Institute of Chartered Accountants in England and Wales, a member of the Hong Kong Institute of Certified Public Accountants and a member of the Macau Society of Certified Practicing Accountants. Mr. Chung possesses the accounting and related financial management expertise required under Rule 3.10(2) of the Listing Rules. Mr. Chung was appointed as an Independent Non-Executive Director on July 15, 2016.
The Board has established four committees, being the Audit Committee, the Remuneration Committee, the Nomination Committee and the Capex Committee. The table below details the membership and composition of each of the four committees as of the date of this annual report.
|
| | | | | | | | |
| Name of Director | | Audit Committee | | Remuneration Committee | | Nomination Committee | | Capex Committee |
| Mr. Sheldon Gary Adelson | | — | | — | | Chairman | | — |
| Dr. Wong Ying Wai | | — | | Member | | — | | Member |
| Mr. Robert Glen Goldstein | | — | | — | | — | | Chairman |
| Mr. Charles Daniel Forman | | — | | — | | — | | — |
| Ms. Chiang Yun | | Member | | — | | Member | | — |
| Mr. Victor Patrick Hoog Antink | | Chairman | | Member | | Member | | Member |
| Mr. Steven Zygmunt Strasser | | Member | | Chairman | | — | | — |
| Mr. Kenneth Patrick Chung | | Member | | — | | — | | — |
Our Senior Management
As of the date of this report, details of our senior management are as follows:
Mr. Sheldon Gary Adelson is the Chairman of our Board, Chief Executive Officer, Executive Director and the Chairman of the Nomination Committee.
Dr. Wong Ying Wai (Wilfred) is our President and Chief Operating Officer, Executive Director and a member of the Remuneration Committee and the Capex Committee.
Mr. Chum Kwan Lock, Grant, aged 43, is our Chief of Staff and is also a director of a number of our subsidiaries. Mr. Chum joined LVS and our Group as Senior Vice President, Global Gaming Strategy in July 2013. Prior to joining the Group, Mr. Chum spent 14 years at UBS Investment Bank (“UBS”) in a variety of roles, including serving as head of Hong Kong equity research from 2010 to 2013, and head of China equity research from 2007 to 2010. Mr. Chum was also responsible for Asia gaming equity research from 2006 to 2013 for UBS and was named Asia’s stock-picker of the year by the Financial Times in 2011. Mr. Chum graduated in Philosophy, Politics, and Economics with First Class Honors from Oxford University.
Mr. Sun MinQi (Dave), aged 45, is our Senior Vice President and Chief Financial Officer and is also a director of a number of our subsidiaries. Mr. Sun was appointed as a Director of Finance of the Company in August 2007, and in 2013, he was promoted to the position of Senior Vice President of Finance for the Company. During his tenure as Director of Finance for the Company, Mr. Sun was responsible for managing financial strategy and financial planning and analysis at the Company, and he also played a key role in managing the Company’s initial public offering in 2009. After his promotion to Senior Vice President of Finance, Mr. Sun’s role expanded to include the above as well as oversight of the Company’s accounting, treasury, tax, information technology and procurement functions. Mr. Sun was appointed as the Senior Vice President and Chief Financial Officer of the Company in April 2017.
Prior to joining the company, Mr. Sun held a variety of financial controller and financial management positions with various divisions of General Electric (“GE”) in Shanghai and Singapore since 1996, including GE Lighting Asia, GE Consumer and Industrial Asia and GE Energy Asia.
Mr. Sun graduated from Fudan University in Shanghai in 1996 with a Bachelor degree in Economics and Financial Management and a minor in Computer Science and Application. He subsequently obtained a Master of Business Administration from the Southern Illinois University Carbondale, United States. Mr. Sun is a fellow of CPA (FCPA) Australia.
B. COMPENSATION
See “Notes to the Consolidated Financial Statements — Note 6 — Employee Benefit Expenses (Including Directors’ Emoluments) — Directors’ Emoluments” for details about the compensation we paid to our directors on an aggregate and an individual basis. See “E. Share Ownership” for details of compensation in the form of stock options and see Exhibit 4.12 for the Equity Award Plan pursuant to which such options were granted.
C. BOARD PRACTICES
The Board
The Board is principally concerned with the overall leadership, strategy and development of the Group in order to promote its long-term success for the benefit of its Shareholders as a whole within a framework of effective controls that enable risk to be assessed and managed. The Board sets the Group’s strategic objectives, ensures necessary resources are in place to reach those objectives, reviews management performance and ensures high ethical standards of behavior are followed. In its decision-making process, the Board takes into account the likely consequences of any decision in the long-term, the interests of the Group’s team members, relationships with suppliers and customers, the impact of the Group’s operations on the community and the environment and maintaining Sands China’s reputation for high standards of business conduct. During 2018, the Board met six times and additionally passed written resolutions where required.
At the filing date, the Board comprises eight Directors. There are two Executive Directors and six Non-Executive Directors, of whom four are independent. See “— A. Directors and Senior Management” for biographies of each Director, setting out their specific skills and experience. Each Non-Executive Director, whether independent or not, is appointed for a term of three years and is subject to retirement by rotation at least once every three years. A Director appointed to fill a casual vacancy or as an addition to the Board will be subject to re-election by Shareholders at the first annual general meeting after their initial appointment.
The Committees
The Board has four Committees that undertake work on its behalf, and report back to the Board: the Audit Committee, the Remuneration Committee, the Nomination Committee and the Capex Committee. These Committees assist the Board by undertaking oversight responsibilities or dealing with certain matters in greater detail thereby allowing more effective use of Board time. The Chairman of each Committee reports back to the Board following each meeting, to ensure the Board is fully briefed on all activities and retains responsibility for approving any actions where a Committee role is advisory. The roles and functions of the Committees are set out in their respective terms of reference. The terms of reference of the Audit Committee, the Remuneration Committee and the Nomination Committee are available on the websites of the Company and the Stock Exchange. The terms of reference of the Capex Committee are available on the website of the Company. The following sections describe the corporate governance structure in more detail and set out how the Board, its Committees and the risk management system operated during 2018.
Audit Committee
The Audit Committee plays a key oversight role at Sands China by ensuring the Group has effective and appropriate risk management and internal control systems, backed up by comprehensive governance, internal and external audit and reporting functions. At the filing date, the Audit Committee comprises four Directors, all of whom are Independent Non-Executive Directors. The terms of reference specify a minimum membership of three Non-Executive Directors appointed by the Board, a majority of which should be independent. Mr. Victor Patrick Hoog Antink and Mr. Kenneth Patrick Chung have appropriate professional qualifications and experience in financial matters. In addition to the members of the Audit Committee, meetings are normally attended by the President and Chief Operating Officer, Chief of Staff, Senior Vice President and Chief Financial Officer, Vice President of Audit Services Group, Senior Vice President of Legal and Company Secretary, Senior Vice President and Chief Compliance Officer and the external auditor. During 2018, the Audit Committee met seven times and additionally passed written resolutions where required. Its terms of reference require it to meet at least four times in the year.
The Audit Committee’s responsibilities are set out in detail in its terms of reference. Its main responsibilities are to support the Board in fulfilling its oversight responsibilities in the following key areas:
| |
| • | overseeing the Company’s relationship with the external auditor, |
| |
| • | monitoring the integrity of financial information published by Sands China, |
| |
| • | performing an oversight role in respect of internal audit, risk management and internal control and |
| |
| • | evaluating its own performance and review the adequacy of its terms of reference annually. |
Remuneration Committee
The primary purpose of the Remuneration Committee is to make recommendations to the Board on the Company’s remuneration policy and structure. This includes base salary, benefits, long-term and short-term incentives, profit sharing plans and the terms of any agreements. At the filing date, the Remuneration Committee comprises three Directors – two Non-Executive Directors (both of whom are independent) and one Executive Director who is the President and Chief Operating Officer. The terms of reference require a majority of the members of the Remuneration Committee (including its Chairman) are Independent Non-Executive Directors. In addition to the members of the Remuneration Committee, the Senior Vice President of Human Resources attends the meetings by invitation. During 2018, the Remuneration Committee met once and additionally passed written resolutions where required. Its terms of reference suggest it should meet four times a year, but permit it to meet less frequently as circumstances require.
The Remuneration Committee’s responsibilities are set out in detail in its terms of reference. Its main responsibilities are as follows:
| |
| • | making recommendations on the Company’s remuneration policy and structure, |
| |
| • | making recommendations to the Board on the establishment of a formal and transparent procedure for developing remuneration policy, |
| |
| • | having delegated responsibility to determine the remuneration packages of individual Executive Directors and senior management (as defined in the terms of reference of the Remuneration Committee), |
| |
| • | making recommendations on the remuneration of Non-Executive Directors, |
| |
| • | evaluating and making recommendations to the Board with regard to incentive and share-based plans and |
| |
| • | evaluating its own performance and reviewing the adequacy of its terms of reference annually. |
Nomination Committee
The primary purpose of the Nomination Committee is to assist the Board by making recommendations on the appointment or re-appointment of Directors and succession planning for Directors. It thereby helps the Board to ensure the size, structure and composition of the Board remains appropriate to enable the Board to remain effective in fulfilling its responsibilities. The terms of reference require a majority of the members of the Nomination Committee are Independent Non-Executive Directors. They also provide the Committee Chairman should be Chairman of the Board or an Independent Non-Executive Director. At the filing date, the Nomination Committee comprises three Directors – the Chairman of the Board (who also is Chairman of the Nomination Committee) and two Independent Non-Executive Directors who accordingly form a majority on the Committee. During 2018, the Nomination Committee met once. Its terms of reference require it to meet at least once in the year.
The Nomination Committee’s responsibilities are set out in detail in its terms of reference. Its main responsibilities are to support the Board in ensuring appropriate balance and composition of its membership by:
| |
| • | reviewing the structure, size and composition (including but not limited to the perspective, skills, knowledge, experience and diversity) of the Board at least annually and making recommendations on any proposed changes to the Board to complement the Company’s corporate strategy, |
| |
| • | identifying individuals suitably qualified to become Board members and selecting or making recommendations to the Board on the selection of individuals nominated for directorships, |
| |
| • | making recommendations to the Board for appointments or reappointments of Directors and succession planning for Directors, |
| |
| • | assessing the independence of Independent Non-Executive Directors with reference to the factors set out in the Listing Rules and any other factors deemed appropriate by the Nomination Committee or the Board, |
| |
| • | reviewing the Nomination Policy (as defined in its terms of reference) and the board diversity policy and |
| |
| • | evaluating its own performance and reviewing the adequacy of its terms of reference annually. |
When identifying candidates for Board membership, the Nomination Committee takes into account the Company’s nomination policy and the board diversity policy. Appointments are based on merit and contribution the selected individuals will bring to the Board and factors considered include gender, age, cultural and educational background, professional and industry experience, skills, knowledge and time commitments of such individuals. The Nomination Committee also takes into account the Company’s business model and specific needs from time to time. External recruitment professionals might be engaged to assist with the selection process when necessary.
Capex Committee
The Capex Committee assists the Board by reviewing and, where appropriate, approving non-budgeted capital expenditures with a project value between US$1 million to US$10 million. This enables the Board, through the Committee, to exercise appropriate oversight and control over management for material projects while allowing more effective use of Board time in focusing on more significant matters. At the filing date, the Capex Committee comprises three Directors – two Non-Executive Directors (one of whom is independent) and one Executive Director who is the President and Chief Operating Officer. The terms of reference specify a minimum membership of three Directors appointed by the Board. The purpose of the Capex Committee is to assist effective decision-making by management with an appropriate level of control. As the Committee is not a governance committee, a majority of its members are not required to be Independent Non-Executive Directors. During 2018, the Capex Committee met five times and additionally passed written resolutions where required. Its terms of reference require it to meet as required.
The Capex Committee’s responsibilities are set out in detail in its terms of reference. Its principal purpose is to support the Board and management in making decisions on capital expenditure by:
| |
| • | reviewing and, if appropriate, approving the terms of any non-budgeted capital expenditure project with a project value between US$1 million and US$10 million, |
| |
| • | having full authority to enter into agreements on behalf of the Company within the above limits and |
| |
| • | evaluating its own performance and reviewing the adequacy of its terms of reference annually. |
Directors’ Service Contracts
Other than benefits upon termination of employment that Dr. Wong Ying Wai, our President and Chief Operating Officer, is entitled to receive as an employee of SCL and Mr. Sheldon Gary Adelson, our Chairman and Chief Executive Officer, and Mr. Robert Glen Goldstein are entitled to receive as employees of LVS, our directors are not entitled to any benefits upon termination of directorship.
D. EMPLOYEES
We directly employ approximately 28,300 employees as of December 31, 2018, and hire additional temporary employees on an as-needed basis. Our employees are not covered by collective bargaining agreements. We believe that we have good relations with our employees.
See “Notes to the Consolidated Financial Statements — Note 2 — Summary of Significant Accounting Policies — (s) Employee Benefits” and “Notes to the Consolidated Financial Statements — Note 30 — Share-Based Compensation” for details about share-based compensation available to our employees, directors and consultants.
E. SHARE OWNERSHIP
The interest of the following directors of the Company in the shares, underlying shares and debentures of the Company as of December 31, 2018, as recorded in the register required to be kept under Section 352 of Part XV of the SFO or as otherwise notified to the Company and the Hong Kong Stock Exchange pursuant to the Model Code for Securities Transactions by Directors of Listed Issuers as set out in Appendix 10 of the Listing Rules, was as follows:
|
| | | | | |
| Director | | Number of Shares Subject to Interest | | Percentage of Shares Outstanding |
| Mr. Sheldon Gary Adelson | | 5,657,814,885(i) | | 70.02 | % |
| Dr. Wong Ying Wai | | 4,000,000(ii) | | 0.05 | % |
____________________
| |
| (i) | This amount reflects LVS’ indirect ownership of our shares as of December 31, 2018. Mr. Adelson, his family members and trusts and other entities established for the benefit of Mr. Adelson and/or his family members beneficially owned approximately 56% of the outstanding common stock of LVS as of December 31, 2018. |
| |
| (ii) | This amount represents 4,000,000 options to purchase 4,000,000 of our shares at an exercise price of HK$28.59 per share, of which 1,600,000 are vested and exercisable. The expiration date of the options is November 1, 2025. |
Under our Articles of Association, our directors do not have different voting rights when compared to other holders of our shares.
See Exhibit 4.12 of this annual report for descriptions relating to arrangements for involving the employees in the capital of the Company, including any arrangement that involves the issue or grant of options or shares or securities of the Company.
ITEM 7. — MAJOR SHAREHOLDERS AND RELATED PARTY TRANSACTIONS
A. MAJOR SHAREHOLDERS
We have been notified of the following substantial shareholders’ interests in the shares of the Company as at December 31, 2018:
|
| | | | | | | | |
| Name of Substantial Shareholder | | Capacity/Nature of interest | | Number of Shares | | Approximate percentage of issued share capital |
| Sheldon Gary Adelson | | Interest in a controlled corporation | | 5,657,814,885 |
| | 70.02 | % |
| Las Vegas Sands Corp. | | Interest in a controlled corporation | | 5,657,814,885 |
| | 70.02 | % |
| Las Vegas Sands, LLC (“LVS LLC”) | | Interest in a controlled corporation | | 5,657,814,885 |
| | 70.02 | % |
| Venetian Casino Resort, LLC | | Interest in a controlled corporation | | 5,657,814,885 |
| | 70.02 | % |
| LVS (Nevada) International Holdings, Inc. | | Interest in a controlled corporation | | 5,657,814,885 |
| | 70.02 | % |
| LVS Dutch Finance C.V. | | Interest in a controlled corporation | | 5,657,814,885 |
| | 70.02 | % |
| LVS Dutch Holding B.V. | | Interest in a controlled corporation | | 5,657,814,885 |
| | 70.02 | % |
| Sands IP Asset Management B.V. | | Interest in a controlled corporation | | 5,657,814,885 |
| | 70.02 | % |
| Venetian Venture Development Intermediate II (“VVDI (II)”) | | Beneficial owner | | 5,657,814,885 |
| | 70.02 | % |
As at December 31, 2018, VVDI (II) was a substantial shareholder which was interested in 5,657,814,885 shares (representing approximately 70% of the total issued share capital of the Company). VVDI (II) was a wholly-owned subsidiary of Sands IP. Sands IP was a wholly-owned subsidiary of LVS Dutch Holding, which was in turn wholly-owned by LVS Dutch Finance. LVS Dutch Finance was a 99% subsidiary of LVS Nevada, which was in turn wholly-owned by Venetian Casino. Venetian Casino was a wholly-owned subsidiary of LVS LLC, which was in turn wholly-owned by LVS. Mr. Sheldon Gary Adelson, his family members and trusts and other entities established for the benefit of Mr. Adelson and/or his family members beneficially owned approximately 56% of the outstanding common stock of LVS as at December 31, 2018.
To our knowledge, there were no significant changes in the percentage ownership held by any other major beneficial shareholders during the past three fiscal years. Major shareholders do not have different voting rights from other shareholders.
B. RELATED PARTY TRANSACTIONS
The following is a summary of material transactions that we have engaged in with our direct and indirect shareholders, affiliates of our shareholders and other related parties, including those in which we or our management have a significant equity interest. We believe each of these arrangements, as described below, has been entered into on an arm’s-length basis or on terms that we believe have been at least as favorable to us as similar transactions with non-related parties. We believe that the related party transactions were conducted in the ordinary and usual course of the Company’s business. For a further discussion of related party transactions, see Note 29 to our audited consolidated financial statements for the year ended December 31, 2018 included elsewhere in this report.
No transactions were entered into with the Directors during the years ended December 31, 2018 and 2017, other than the emoluments paid to them as disclosed in Note 6 to our audited consolidated financial statements included elsewhere in this report.
Management fees
We provide management services to the LVS Group and the LVS Group companies also provide management services to us. During the year, we may incur certain expenses on behalf of the LVS Group, or vice versa.
Services we provide to the LVS Group include, but are not limited to, accounting services, information technology support, sourcing of goods and services and design, development and construction consultancy services.
Services provided to us by the LVS Group include, but are not limited to, human resources support, accounting services, sourcing of goods and services, sourcing of tenants for the malls, transportation services, other various types of marketing and promotion activities and design, development and construction consultancy services.
Royalty fees
In November 2009, we entered into an agreement with LVS LLC, an intermediate holding company incorporated in the United States of America, for the use of the trademarks and other intellectual property rights as defined in the agreement. For each of the full fiscal years through the full fiscal year ended December 31, 2012, we were required to pay LVS LLC an annual royalty in the amount of 1.5% of non-gaming revenue and Paiza-related gaming revenue of the Sands Macao, 1.5% of all revenue of The Venetian Macao, and 1.5% of all gaming revenue of the Plaza Casino at The Plaza Macao (the “Relevant Royalty”), provided that the total royalty payable in connection with these three properties in each fiscal year was capped at US$20 million per full fiscal year. For each of the subsequent full fiscal years through the full fiscal year ending December 31, 2022, we are required to pay an annual royalty being the lesser of the Relevant Royalty or the annual caps reflecting an increase of 20.0% for each subsequent year. Each subsequent casino gaming property that we operate which utilizes any of the licensed marks in connection with generating the relevant revenue will pay, for each of the first three fiscal calendar years after commencement of operations of each subsequent property, a royalty fee of 1.5% of the respective gross revenues of the operations in connection with which such licensed marks are used (each, the “Subsequent Casino Gaming Property Royalty”), subject to a US$20 million cap per fiscal year. For the fiscal calendar years thereafter until expiration of the initial term, we will pay LVS LLC an annual royalty being the lesser of the Subsequent Casino Gaming Property Royalty or the annual caps reflecting an increase of 20.0% for each subsequent year. After the commencement of the operation of Sands Cotai Central and The Parisian Macao in April 2012 and September 2016 respectively, we are required to pay royalty fees in connection with these properties.
C. INTERESTS OF EXPERTS AND COUNSEL
Not applicable.
ITEM 8. — FINANCIAL INFORMATION
A. CONSOLIDATED STATEMENTS AND OTHER FINANCIAL INFORMATION
Consolidated Statements
Refer to the consolidated financial statements and the notes of the consolidated financial statements included in “Item 18 - Financial Statements.”
Legal Proceedings
On January 19, 2012, Asian American Entertainment Corporation, Limited (“AAEC”) filed a claim with the Macao Judicial Court (Tribunal Judicial de Base) against VML, LVS Nevada, LVS LLC and Venetian Casino (collectively, the “Defendants”). The claim is for 3.0 billion patacas (approximately US$372 million) as compensation for damages resulting from the alleged breach of agreements entered into between AAEC and the Defendants for their joint presentation of a bid in response to the public tender held by the Macao Government for the award of gaming concessions at the end of 2001. On April 24, 2014, the Macao Judicial Court issued a decision holding that AAEC’s claim against VML is unfounded and that VML be removed as a party to the proceedings, and that the claim should proceed exclusively against the three U.S. Defendants. On May 8, 2014, AAEC lodged an appeal against that decision. The trial of this matter has been scheduled by the Macao Judicial Court for mid-September 2019. This action is in a preliminary stage and management has determined based on proceedings to date, it is currently unable to determine the probability of the outcome of this matter or the range of reasonably possible loss, if any. The Company intends to defend this matter vigorously.
The Company is involved in other litigation in addition to those described above, arising in the normal course of business. Management has made certain estimates for potential litigation costs based upon consultation with legal counsel. Actual results could differ from these estimates; however, in the opinion of management, such litigation and claims will not have a material effect on the Company’s financial condition, results of operations and cash flows.
Dividend Policy
It is the Company’s intention to provide shareholders with consistent regular dividends depending on the earnings, financial condition and capital requirements, as well as economic and other conditions our Board may deem relevant. Our ability to declare and pay dividends on our shares is also subject to the requirements of Cayman Islands law. Moreover, we are a holding company, which is dependent upon the operations of our subsidiaries for cash. The laws where our subsidiaries operate and the terms of our subsidiaries’ debt and other agreements may restrict the ability of our subsidiaries to make dividends or other distributions to us.
B. SIGNIFICANT CHANGES
Our directors confirm that, except as stated in this report, since December 31, 2018 (the date of the latest consolidated financial statements of the Company) and up to the date of this report, we have not experienced any significant changes.
ITEM 9. — THE OFFER AND THE LISTING
A. OFFER AND LISTING DETAILS
Not applicable.
B. PLAN OF DISTRIBUTION
Not applicable.
C. MARKETS
Our ordinary shares have been trading on the Hong Kong Stock Exchange under the stock code “1928.HK” since November 2009. Our US$ denominated senior unsecured notes have been trading on the Hong Kong Stock Exchange under the note stock codes “5140.HK”, “5141.HK” and “5142.HK” since August 2018 and note stock codes “5725.HK”, “5727.HK” and “5733.HK” since February 2019.
D. SELLING SHAREHOLDERS
Not applicable.
E. DILUTION
Not applicable.
F. EXPENSES OF THE ISSUE
Not applicable.
ITEM 10. — ADDITIONAL INFORMATION
A. SHARE CAPITAL
Not applicable.
B. MEMORANDUM AND ARTICLES OF ASSOCIATION
A copy of our Amended and Restated Memorandum and Articles of Association is attached as Exhibit 1.2 to this annual report.
Pursuant to the memorandum and articles of association of the Company (the "Articles"), directors who are in any way, whether directly or indirectly, interested in a contract or arrangement or proposed contract or arrangement with the Company must declare the nature of their interest at a meeting of the board of directors. Following such declaration, a director may not vote (nor be counted in the quorum) in respect of any contract or arrangement or any other proposal in which he or any of his associate(s) is materially interested, but this shall not apply in respect of matters involving the following:
| |
| (i) | the giving to such director or his associate(s) any security or indemnity in respect of money lent by him or any of his associate(s) or obligations incurred or undertaken by him or any of his associate(s) at the request of or for the benefit of the Company or any of its subsidiaries; |
| |
| (ii) | the giving of any security or indemnity to a third party in respect of a debt or obligation of the Company or any of its subsidiaries for which the director or his associate(s) has himself/themselves assumed responsibility, in whole or in part, whether alone or jointly under a guarantee or indemnity or by the giving of security; |
| |
| (iii) | an offer of shares or debentures or other securities of or by the Company or any other company which the Company may promote or be interested in for subscription or purchase, where the director or his associate(s) is/are or is/are to be interested as a participant in the underwriting or sub‑underwriting of the offer; |
| |
| (iv) | where the director or his associate(s) is/are interested in the same manner as other holders of shares or debentures or other securities of the Company by virtue only of his/their interest in shares or debentures or other securities of the Company; or |
| |
| (v) | the adoption, modification or operation of: (a) any employees' share scheme or any share incentive or a share option scheme under which a director or his associate(s) may benefit; or (b) a pension fund or retirement, death or disability benefits scheme or other arrangement which relates both to directors, his associate(s) and employees of the Company or of any of its subsidiaries and does not provide in respect of any director, or his associate(s), as such any privilege or advantage not accorded generally to the class of persons to which such scheme or fund relates. |
The Terms of Reference of the Remuneration Committee of the Company provide that, in fulfilling its responsibilities, the Remuneration Committee shall ensure that no director or any of his or her associates is involved in deciding his own remuneration. Any such director is also required to abstain from voting in accordance with the provisions of the Articles in respect of directors' interests, as set out above.
Pursuant to the Articles, the directors may exercise all the powers of the Company to borrow money and to mortgage or charge all or part of its undertaking, property and uncalled capital or any part thereof, and subject to the Companies Law (as amended) of the Cayman Islands, to issue debentures, debenture stock and other securities whenever money is borrowed or as security for any debt, liability or obligation of the Company or of any third party.
The Articles do not provide for any retirement requirements based on the age of a director.
A director is not required to hold any shares in the Company by way of qualification.
C. MATERIAL CONTRACTS
We have not entered into any material contracts other than in the ordinary course of business and other than those described in “Item 4 - Information on the Company” and “Item 7 - Major Shareholders and Related Party Transactions” or elsewhere in this annual report on Form 20-F.
D. EXCHANGE CONTROLS
Under existing Hong Kong law, (1) there are no foreign exchange controls or other laws which restrict the import or export of capital and which would affect the availability of cash and cash equivalents for use by the Company, (2) there are no foreign exchange controls or other laws, decrees or regulations that affect the remittance of interest, dividends or other payments on the Company’s
outstanding debt and equity securities to U.S. residents by reason of his/her/its U.S. residency and (3) there are no limitations on the rights of non-resident or foreign owners to hold the Company’s debt or equity securities.
E. TAXATION
This summary is based on the laws of the Cayman Islands, the United States and Hong Kong in effect on the date of this report, which are subject to changes (or changes in interpretation), possibly with retroactive effect.
Cayman Islands Taxation
The following is a discussion on certain Cayman Islands income tax consequences of an investment in the Notes. The discussion is a general summary of present law, which is subject to prospective and retroactive change. It is not intended as tax advice, does not consider any investor’s particular circumstances, and does not consider tax consequences other than those arising under Cayman Islands law.
Under the laws of the Cayman Islands, payments of interest, principal or premium on the Notes will not be subject to taxation and no withholding will be required on the payment of interest, principal or premium to any holder of the Notes, as the case may be, nor will gains derived from the disposal of the Notes be subject to Cayman Islands income or corporation tax. The Cayman Islands currently have no income, corporation or capital gains tax and no estate duty, inheritance tax or gift tax. The Cayman Islands are not party to any double taxation treaties.
No stamp duty is payable in respect of the issue of the Notes. The holder of any Notes (or a legal personal representative of such holder) whose Notes are brought into the Cayman Islands may in certain circumstances be liable to pay stamp duty imposed under the laws of the Cayman Islands in respect of such Notes. Certificates evidencing registered Notes, to which title is not transferable by delivery, will not attract Cayman Islands stamp duty. However, an instrument transferring title to a registered Note, if brought to or executed in the Cayman Islands, would be subject to nominal Cayman Islands stamp duty. Stamp duty will be payable on any documents executed by the Company if any such documents are executed in or brought into the Cayman Islands or produced before the Cayman Islands Courts.
The Company has been incorporated under the laws of the Cayman Islands as an exempted company with limited liability and, as such, has obtained an undertaking from the Governor in Cabinet of the Cayman Islands as to tax concessions under the Tax Concessions Law (2011 Revision). In accordance with the provision of section 6 of The Tax Concessions Law (2011 Revision), the Governor in Cabinet undertakes with the Company:
| |
| • | that no law which is hereafter enacted in the Cayman Islands imposing any tax to be levied on profits, income, gains or appreciations shall apply to the Company or its operations; and |
| |
| • | in addition, that no tax to be levied on profits, income, gains or appreciations or which is in the nature of estate duty or inheritance tax shall be payable, on or in respect of the shares, debentures or other obligations of the Company, or by way of the withholding, in whole or part, of any relevant payment as defined in Section 6(3) of the Tax Concessions Law (2011 Revision). |
These concessions shall be for a period of 20 years from 21 July 2009, being the date of the undertaking.
U.S. Federal Income Tax Considerations
The following discussion is a summary of U.S. federal income tax considerations under present law of the ownership and disposition of the Notes. This summary applies only to U.S. Holders (as defined below) that purchase the Notes in the initial offering at their issue price (i.e., the first price at which a substantial amount of the Notes of the relevant series is sold other than to bond houses, brokers or similar persons or organizations acting in the capacity of underwriters, placement agents or wholesalers) and hold the Notes as capital assets for U.S. federal income tax purposes. For purposes of this discussion, “U.S. Holder” means a beneficial owner of the Notes that is, for U.S. federal income tax purposes,
| |
| • | a citizen or individual resident of the United States; |
| |
| • | a corporation (or other entity subject to tax as a corporation for U.S. federal income tax purposes) that is created or organized in or under the laws of the United States, any state or political subdivision thereof or the District of Columbia; |
| |
| • | an estate whose income is subject to U.S. federal income taxation regardless of its source; or |
| |
| • | a trust that (i) is subject to the supervision of a court within the United States and the control of one or more United States persons or (ii) has a valid election in effect under applicable U.S. Treasury regulations to be treated as a United States person. |
This discussion is not a comprehensive summary of all of the tax considerations that may be relevant to any particular investor. In particular, the discussion does not address all of the tax consequences that may be applicable to investors that are subject to special rules,
such as banks, financial institutions, insurance companies, broker dealers, persons that mark their securities to market, tax-exempt entities, persons liable for the alternative minimum tax, regulated investment companies, certain expatriates or former long-term residents of the United States, governments or agencies or instrumentalities thereof, persons holding the Notes as part of a straddle, hedging, conversion or integrated transaction, persons whose functional currency is not the U.S. dollar and persons required to accelerate the recognition of any item of gross income with respect to the Notes as a result of such income being recognized on an applicable financial statement. Moreover, this discussion does not address any non-U.S., state or local tax considerations, any aspect of the Medicare tax on net investment income or any aspect of U.S. federal non-income tax laws, such as gift or estate tax laws.
Prospective investors are urged to consult their own tax advisors concerning the application of the U.S. federal income tax laws to their particular circumstances as well as any state, local or non-U.S. tax consequences to them of the ownership and disposition of the notes.
The discussion below regarding U.S. federal income tax consequences is based upon the Internal Revenue Code of 1986, as amended, U.S. Treasury regulations promulgated thereunder as well as administrative rulings or pronouncements or judicial decisions thereof, all as of the date hereof. All of the foregoing authorities are subject to change, which change could apply retroactively and could affect the tax considerations described below.
If a partnership or other entity treated as a partnership for U.S. federal income tax purposes holds the Notes, the tax treatment of a partner will generally depend upon the status of the partner and the activities of the partnership. If you are a partnership or other entity treated as a partnership for U.S. federal income tax purposes holding the Notes or a partner therein, you are urged to consult your tax advisor.
Interest Payments
Payments of stated interest on the Notes, without reduction for any foreign tax withheld from such payments and including any Additional Payments with respect thereto, will be includible in your gross income as ordinary interest income at the time you receive or accrue such amounts (in accordance with your regular method of tax accounting).
Interest on the Notes will constitute foreign-source income for U.S. federal income tax purposes. For foreign tax credit limitation purposes, interest on the Notes will generally constitute passive income. You may be entitled to deduct or credit foreign taxes withheld from interest payments in determining its U.S. federal income tax liability, subject to certain limitations (including that the election to deduct or credit foreign taxes applies to all of such U.S. Holder’s foreign taxes for a particular tax year). The rules governing the calculation and timing of foreign tax credits and the deduction of foreign taxes are complex and depend upon your particular circumstances. You are urged to consult your tax advisor regarding the application of these rules in your particular circumstances.
Any Additional Amounts paid pursuant to the obligations described under “Description of Notes - Payment of Additional Amounts” will be treated as foreign-source ordinary interest income.
Sale, Exchange, Redemption and Other Disposition of the Notes
Upon the sale, exchange, redemption or other disposition of a Note, you will recognize taxable gain or loss equal to the difference, if any, between the amount realized on the sale, exchange, redemption or other disposition (other than amounts attributable to accrued but unpaid interest, which will be treated as ordinary interest income if not already included in your income for U.S. federal income tax purposes) and your adjusted tax basis in such Note. Your adjusted tax basis in a Note will generally equal the cost of such Note. Any such gain or loss will generally be treated as U.S.-source capital gain or loss and will be long-term capital gain or loss if at the time of sale, exchange, redemption or other disposition you held the Notes for more than one year. The deductibility of capital losses is subject to certain limitations.
Hong Kong Taxation
No Hong Kong stamp duty is payable on any issue, sale or purchase or other disposal of debentures, loan stocks, funds, bonds or notes (i) which are denominated in a currency other than HK dollars (provided that such debentures, loan stocks, funds, bonds or notes are not redeemable in HK dollars and may not at the option of any person be redeemed in HK dollars) or (ii) the register of holders of which is maintained outside of Hong Kong. Therefore, the issue, sale or purchase or other disposal of the Notes will not be subject to Hong Kong stamp duty.
F. DIVIDENDS AND PAYING AGENTS
Not applicable.
G. STATEMENT BY EXPERTS
Not applicable.
H. DOCUMENTS ON DISPLAY
For further information about us, you may inspect a copy of the report, of the exhibits and schedules to the annual report or of any reports, statements or other information we file with the SEC without charge at the offices of the SEC at 100 F Street, N.E., Washington, D.C. 20549, United States. The SEC maintains a website at www.sec.gov that contains reports and information statements and other information regarding registrants like us that file electronically with the SEC. You can also inspect our registration statement on this website. Our filings with the SEC are available through the electronic data gathering, analysis and retrieval (EDGAR) system of the SEC. In addition, copies of all or any part of the registration statement are available without charge upon written or oral request directed to: Sands China Ltd., The Venetian Macao Resort Hotel, Legal Department, L2 Executive Offices, Estrada da Baía de N. Senhora da Esperança, s/n, Macao SAR; Attention: Company Secretary; Telephone: +853 8118-2888.
I. SUBSIDIARY INFORMATION
Not applicable.
ITEM 11. — QUANTITATIVE AND QUALITATIVE DISCLOSURES ABOUT MARKET RISK
Market risk is the risk of loss arising from adverse changes in market rates and prices, such as interest rates, foreign currency exchange rates and commodity prices. Our primary exposure to market risk are interest rate risk associated with our long-term debt and interest rate swap contracts and foreign currency exchange rate risk associated with our operations, which we may manage through the use of futures, options, caps, forward contracts and similar instruments. We do not hold or issue financial instruments for trading purposes and do not enter into derivative transactions that would be considered speculative positions. Our derivative financial instruments currently consist of interest rate swap contracts on certain fixed-rate long-term debt, which have been designated as hedging instruments for accounting purposes.
As of December 31, 2018, the estimated fair value of our long-term debt was approximately US$5.52 billion, compared to its carrying value of US$5.50 billion. The estimated fair value of our long-term debt is based on level 2 inputs (quoted prices in markets that are not active). A change in interest rates on fixed-rate debt impacts its fair value while a change in interest rates on variable-rate debt affects interest expense. A hypothetical 100 basis point change in market rates would cause the fair value of our long-term debt to change by US$308 million, inclusive of the impact from the interest rate swaps.
The total notional amount of our fixed-to-variable interest rate swaps was US$5.50 billion as of December 31, 2018. The fair value of the interest rate swaps, on a stand-alone basis, as of December 31, 2018, was an asset of US$56 million. A hypothetical 100 basis point change in LIBOR would cause the fair value of the interest rate swaps to change by approximately US$88 million. See also “Notes to the Consolidated Financial Statements — 24. Borrowings” and “Notes to the Consolidated Financial Statements — 25. Derivative Financial Instruments.”
Foreign currency transaction losses for the year ended December 31, 2018 were US$11 million, primarily due to U.S. dollar denominated debt held in Macao. We may be vulnerable to changes in the HK$/pataca and U.S. dollar/pataca exchange rates. Based on balances as of December 31, 2018, a hypothetical 1% weakening of the HK$/pataca exchange rate would cause a foreign currency transaction loss of approximately US$11 million and a hypothetical 1% weakening of the U.S. dollar/pataca exchange rate would cause a foreign currency transaction loss of approximately US$40 million. We maintain a significant amount of our operating funds in the same currencies in which we have obligations thereby reducing our exposure to currency fluctuations. See Note 31 to our audited consolidated financial statements included elsewhere in this report.
ITEM 12. — DESCRIPTION OF SECURITIES OTHER THAN EQUITY SECURITIES
A. DEBT SECURITIES
Not applicable.
B. WARRANTS AND RIGHTS
Not applicable.
C. OTHER SECURITIES
Not applicable.
D. AMERICAN DEPOSITARY SHARES
Not applicable.
PART II
ITEM 13. — DEFAULTS, DIVIDEND ARREARAGES AND DELINQUENCIES
None.
ITEM 14. — MATERIAL MODIFICATIONS TO THE RIGHTS OF SECURITY HOLDERS AND USE OF PROCEEDS
Not applicable.
ITEM 15. — CONTROLS AND PROCEDURES
Evaluation of Disclosure Controls and Procedures
Disclosure controls and procedures are designed to ensure information required to be disclosed in the reports the Company files or submits under the Securities Exchange Act of 1934 is recorded, processed, summarized and reported within the time periods specified in the SEC’s rules and forms and such information is accumulated and communicated to the Company’s management, including its principal executive officer and principal financial officer, as appropriate, to allow for timely decisions regarding required disclosure. The Company’s Chief Executive Officer and its Chief Financial Officer have evaluated the disclosure controls and procedures (as defined in the Securities Exchange Act of 1934 Rules 13a-15(e) and 15d-15(e)) of the Company as of December 31, 2018, and have concluded they are effective at the reasonable assurance level.
It should be noted any system of controls, however well designed and operated, can provide only reasonable, and not absolute, assurance the objectives of the system are met. In addition, the design of any control system is based in part upon certain assumptions about the likelihood of future events. Because of these and other inherent limitations of control systems, there can be no assurance any design will succeed in achieving its stated goals under all potential future conditions, regardless of how remote.
Management’s Annual Report on Internal Control Over Financial Reporting
This annual report does not include a report of management’s assessment regarding internal control over financial reporting or an attestation report of the company’s registered public accounting firm due to a transition period established by rules of the Securities and Exchange Commission for newly public companies.
Attestation Report of the Registered Public Accounting Firm
Not applicable.
Changes in Internal Control over Financial Reporting
There were no changes in the Company’s internal control over financial reporting that occurred during the year ended December 31, 2018 covered by this annual report on Form 20-F that had a material effect, or was reasonably likely to have a material effect, on the Company’s internal control over financial reporting.
ITEM 16A. — AUDIT COMMITTEE FINANCIAL EXPERT
Our Board of Directors has determined that Mr. Victor Patrick Hoog Antink qualifies as “audit committee financial expert” as defined in Item 16A of Form 20-F. Each of the members of our audit committee satisfies the “independence” requirements under the Securities Exchange Act of 1934. See “Item 6 - Directors, Senior Management and Employees.”
ITEM 16B. — CODE OF ETHICS
The Company has adopted a Code of Business Conduct and Ethics, as defined in Item 16B of Form 20-F under the Securities Exchange Act of 1934, as amended, that applies to our chief executive officer, principal financial officer, principal accounting officer and persons performing similar functions, as well as to directors and all other officers and employees. The code of ethics is available on our website at www.sandschina.com. Copies of the Code of Business Conduct and Ethics are available without charge by sending a written request to the following address: Sands China Ltd., The Venetian Macao Resort Hotel, Legal Department, L2 Executive Offices, Estrada da Baía de N. Senhora da Esperança, s/n, Macao SAR; Attention: Company Secretary; Telephone: +853 8118-2888.
ITEM 16C. — PRINCIPAL ACCOUNTANT FEES AND SERVICES
The following table sets forth fees paid or payable to Deloitte Touche Tohmatsu, our independent registered public accounting firm in 2018 and 2017, for audit and non-audit services as well as the percentage of these services approved by our Audit Committee:
|
| | | | | | | |
| | 2018 | | 2017 | | % of Services Approved by Audit Committee |
| Audit fees | 1,926,000 |
| | 1,941,000 |
| | 100% |
| Audit-related fees | 677,000 |
| | — |
| | 100% |
| Tax fees | 70,000 |
| | 64,000 |
| | 100% |
| All other fees | 34,000 |
| | 10,000 |
| | 100% |
The category of “Audit fees” includes fees for our annual audit and interim reviews and required statutory audits of certain of our subsidiaries.
The category of “Audit-related fees” includes fees for the audit and review of financial statements and financial information for the Senior Notes issuance and the related SEC filings. Auditor’s remuneration of US$600,000 was capitalized during the year ended December 31, 2018, related to the issuance of the Senior Notes.
The category of “Tax fees” includes tax consultation and planning fees and tax compliance services.
The category of “All other fees” principally includes fees for accounting training programs and consultations in 2018 related to SCL’s filings with the Stock Exchange of Hong Kong Limited.
Pre-Approval Policies and Procedures
Our Audit Committee terms of reference contains policies related to pre-approval of services provided by the independent registered public accounting firm. The Audit Committee, or one of its members if such authority is delegated by the Audit Committee, has the sole authority to review in advance, and grant any appropriate preapprovals, of (a) all auditing services provided by the independent registered public accounting firm and (b) all non-audit services to be provided by the independent registered public accounting firm as permitted by Section 10A of the Exchange Act and, in connection therewith, to approve all fees and other terms of engagement.
The Audit Committee has adopted the following process regarding the engagement of the Company’s independent registered public accounting firm to perform services for the Company. For audit services related to the audit of the consolidated financial statements of the Company, the independent registered public accounting firm will provide the Audit Committee with an engagement letter each year prior to or contemporaneously with commencement of the audit services outlining the scope of the audit services proposed to be performed during the fiscal year. If the services are agreed to by the Audit Committee, the engagement letter will be formally accepted. The Audit Committee also approves statutory audit services for our foreign subsidiaries. For tax services, management will provide the Audit Committee with a separate scope of the tax services proposed to be performed during the fiscal year. If the scope of the tax services is agreed to by the Audit Committee, engagement letters will be executed. All other non-audit services will require pre-approval from the Audit Committee on a case-by-case basis.
The pre-approval authority is delegated to the Chairman of the Audit Committee to approve services up to a maximum of US$50,000 per agreement.
ITEM 16D. — EXEMPTIONS FROM THE LISTING STANDARDS FOR AUDIT COMMITTEES
Not applicable.
ITEM 16E. — PURCHASES OF EQUITY SECURITIES BY THE ISSUER AND AFFILIATED PURCHASERS
Not applicable.
ITEM 16F. — CHANGE IN REGISTRANT’S CERTIFYING ACCOUNTANT
Not applicable.
ITEM 16G. — CORPORATE GOVERNANCE
Not applicable.
ITEM 16H. — MINE SAFETY DISCLOSURE
Not applicable.
PART III
ITEM 17. — FINANCIAL STATEMENTS
We have provided financial statements pursuant to Item 18.
ITEM 18. — FINANCIAL STATEMENTS
The consolidated financial statements of Sands China Ltd. and its subsidiaries are included at the end of this annual report.
ITEM 19. — EXHIBITS
|
| |
| Exhibit Number | Description of Document |
| 1.1 | |
| 1.2 | |
| 2.1 | |
| 2.2 | |
| 2.3 | |
| 2.4 | |
| 2.5 | |
| 4.1 | |
| 4.2 | |
| 4.3 | |
| 4.4 | |
| 4.5 | |
| 4.6 | |
| 4.7 | |
| 4.8 | |
|
| |
| Exhibit Number | Description of Document |
| 4.9 | |
| 4.10 | |
| 4.11 | |
| 4.12* | |
| 8.1* | |
| 12.1* | |
| 12.2* | |
| 13.1* | |
| 13.2* | |
| 101* | The following financial information from the Company’s Annual Report on Form 20-F for the year ended December 31, 2018, formatted in Extensible Business Reporting Language (“XBRL”): (i) Consolidated Income Statements for the years ended December 31, 2016, 2017 and 2018, (ii) Consolidated Statements of Comprehensive Income for the years ended December 31, 2016, 2017 and 2018, (iii) Consolidated Balance Sheets as at December 31, 2017 and 2018, (iv) Consolidated Statements of Changes in Equity for the years ended December 31, 2016, 2017 and 2018, (v) Consolidated Statements of Cash flows for the years ended December 31, 2016, 2017 and 2018, and (vi) Notes to the Consolidated Financial Statements. |
____________________
SIGNATURES
The registrant hereby certifies that it meets all of the requirements for filing on Form 20-F and that it has duly caused and authorized the undersigned to sign this annual report on its behalf.
|
| | | | |
| | | | Sands China Ltd. |
| | | | | |
| Date: | April 18, 2019 | | By: | /s/ Sun MinQi (Dave) |
| | | | Name: | Sun MinQi (Dave) |
| | | | Title: | Senior Vice President and Chief Financial Officer |
Index to Consolidated Financial Statements
|
| |
| Audited Financial Statements | |
| |
| |
| |
| |
| |
| |
| |
REPORT OF INDEPENDENT REGISTERED PUBLIC ACCOUNTING FIRM
To the Shareholders and the Board of Directors of Sands China Ltd.,
Opinion on the Financial Statements
We have audited the accompanying consolidated balance sheets of Sands China Ltd. and subsidiaries (the “Company”) as of December 31, 2018 and 2017, the related consolidated income statements, the consolidated statements of comprehensive income, the consolidated statements of changes in equity, and the consolidated statements of cash flows for each of the three years in the period ended December 31, 2018, and the related notes to the consolidated financial statements (collectively referred to as the “financial statements”). In our opinion, the financial statements present fairly, in all material respects, the financial position of the Company as of December 31, 2018 and 2017, and the results of its operations and its cash flows for each of the three years in the period ended December 31, 2018, in conformity with the International Financial Reporting Standards issued by the International Accounting Standards Board.
Basis for Opinion
These financial statements are the responsibility of the Company’s management. Our responsibility is to express an opinion on the Company’s financial statements based on our audits. We are a public accounting firm registered with the Public Company Accounting Oversight Board (United States) (“PCAOB”) and are required to be independent with respect to the Company in accordance with the U.S. federal securities laws and the applicable rules and regulations of the Securities and Exchange Commission and the PCAOB.
We conducted our audits in accordance with the standards of the PCAOB. Those standards require that we plan and perform the audit to obtain reasonable assurance about whether the financial statements are free of material misstatement, whether due to error or fraud. The Company is not required to have, nor were we engaged to perform, an audit of its internal control over financial reporting. As part of our audits, we are required to obtain an understanding of internal control over financial reporting but not for the purpose of expressing an opinion on the effectiveness of the Company’s internal control over financial reporting. Accordingly, we express no such opinion.
Our audits included performing procedures to assess the risks of material misstatement of the financial statements, whether due to error or fraud, and performing procedures that respond to those risks. Such procedures included examining, on a test basis, evidence regarding the amounts and disclosures in the financial statements. Our audits also included evaluating the accounting principles used and significant estimates made by management, as well as evaluating the overall presentation of the financial statements. We believe that our audits provide a reasonable basis for our opinion.
/s/ Deloitte Touche Tohmatsu
Certified Public Accountants
Hong Kong
April 18, 2019
We have served as the Company’s auditor since 2013.
CONSOLIDATED INCOME STATEMENTS
|
| | | | | | | | | | | | |
| | | Year ended December 31, |
| | | 2018 | | 2017 | | 2016 |
| | Note | US$ in millions, except per share data |
| Net revenues | 4 | $ | 8,665 |
| | $ | 7,586 |
| | $ | 6,543 |
|
| Gaming tax | | (3,430 | ) | | (2,925 | ) | | (2,527 | ) |
| Employee benefit expenses | 6 | (1,238 | ) | | (1,193 | ) | | (1,121 | ) |
| Depreciation and amortization | | (655 | ) | | (676 | ) | | (611 | ) |
| Inventories consumed | | (99 | ) | | (98 | ) | | (83 | ) |
| Other expenses and losses | 7 | (1,089 | ) | | (921 | ) | | (849 | ) |
| Operating profit | | 2,154 |
| | 1,773 |
| | 1,352 |
|
| Interest income | | 20 |
| | 5 |
| | 3 |
|
| Interest expense, net of amounts capitalized | 8 | (225 | ) | | (153 | ) | | (86 | ) |
| Loss on modification or early retirement of debt | 24 | (81 | ) | | — |
| | (1 | ) |
| Profit before income tax | | 1,868 |
| | 1,625 |
| | 1,268 |
|
| Income tax benefit/(expense) | 9 | 7 |
| | (22 | ) | | (44 | ) |
| Profit for the year attributable to equity holders of the Company | | $ | 1,875 |
| | $ | 1,603 |
| | $ | 1,224 |
|
| Earnings per share for profit attributable to equity holders of the Company | | | | | | |
| - Basic | 10 | US23.21 cents | | US19.86 cents | | US15.17 cents |
| - Diluted | 10 | US23.19 cents | | US19.85 cents | | US15.17 cents |
| | | | | | | |
____________________
Note: The prior year presentation has been adjusted for the adoption of IFRS 15, Revenue from Contracts with Customers, and conformed to the current year presentation.
CONSOLIDATED STATEMENTS OF COMPREHENSIVE INCOME
|
| | | | | | | | | | | |
| | Year ended December 31, |
| | 2018 | | 2017 | | 2016 |
| | US$ in millions |
| Profit for the year attributable to equity holders of the Company | $ | 1,875 |
| | $ | 1,603 |
| | $ | 1,224 |
|
| Other comprehensive expense | | | | | |
| Item that will not be reclassified subsequently to profit or loss: | | | | | |
| Currency translation differences | (12 | ) | | (22 | ) | | (3 | ) |
| Total comprehensive income for the year attributable to equity holders of the Company | $ | 1,863 |
| | $ | 1,581 |
| | $ | 1,221 |
|
| | | | | | |
CONSOLIDATED BALANCE SHEETS
|
| | | | | | | | | |
| | | | December 31, |
| | | | 2018 | | 2017 |
| | Note | | US$ in millions |
| ASSETS | | | | | |
| Non-current assets | | | | | |
| Investment properties, net | 12 | | $ | 629 |
| | $ | 1,311 |
|
| Property and equipment, net | 13 | | 8,134 |
| | 7,687 |
|
| Intangible assets, net | 15 | | 46 |
| | 34 |
|
| Other assets, net | | | 32 |
| | 34 |
|
| Trade and other receivables and prepayments, net | 17 | | 37 |
| | 23 |
|
| Total non-current assets | | | 8,878 |
| | 9,089 |
|
| Current assets | | | | | |
| Inventories | 19 | | 14 |
| | 15 |
|
| Trade and other receivables and prepayments, net | 17 | | 477 |
| | 293 |
|
| Restricted cash and cash equivalents | 18 | | 13 |
| | 11 |
|
| Cash and cash equivalents | 20 | | 2,676 |
| | 1,239 |
|
| Total current assets | | | 3,180 |
| | 1,558 |
|
| Total assets | | | $ | 12,058 |
| | $ | 10,647 |
|
| | | | | | |
CONSOLIDATED BALANCE SHEETS
|
| | | | | | | | | |
| | | | December 31, |
| | | | 2018 | | 2017 |
| | Note | | US$ in millions |
| EQUITY | | | | | |
| Capital and reserves attributable to equity holders of the Company | | | | | |
| Share capital | 21 | | $ | 81 |
| | $ | 81 |
|
| Reserves | 22 | | 4,328 |
| | 4,457 |
|
| Total equity | | | 4,409 |
| | 4,538 |
|
| LIABILITIES | | | | | |
| Non-current liabilities | | | | | |
| Trade and other payables | 23 | | 104 |
| | 92 |
|
| Borrowings | 24 | | 5,552 |
| | 4,358 |
|
| Deferred income tax liabilities | 16 | | 50 |
| | 62 |
|
| Total non-current liabilities | | | 5,706 |
| | 4,512 |
|
| Current liabilities | | | | | |
| Trade and other payables | 23 | | 1,928 |
| | 1,537 |
|
| Current income tax liabilities | | | 5 |
| | 6 |
|
| Borrowings | 24 | | 10 |
| | 54 |
|
| Total current liabilities | | | 1,943 |
| | 1,597 |
|
| Total liabilities | | | 7,649 |
| | 6,109 |
|
| Total equity and liabilities | | | $ | 12,058 |
| | $ | 10,647 |
|
| Net current assets/(liabilities) | | | $ | 1,237 |
| | $ | (39 | ) |
| Total assets less current liabilities | | | $ | 10,115 |
| | $ | 9,050 |
|
| | | | | | |
CONSOLIDATED STATEMENTS OF CHANGES IN EQUITY
|
| | | | | | | | | | | | | | | | | | | | | | | | | | | | | | | |
| | Share capital | | Capital reserve | | Share premium | | Statutory reserve | | Share-based compensation reserves | | Currency translation reserve | | Retained earnings | | Total |
| | | (Note 22(i)) | | | (Note 22(ii)) | | | | |
| | US$ in millions |
| Balance at January 1, 2016 | $ | 81 |
| | $ | 87 |
| | $ | 1,403 |
| | $ | 6 |
| | $ | 82 |
| | $ | 9 |
| | $ | 4,171 |
| | $ | 5,839 |
|
| Profit for the year | — |
| | — |
| | — |
| | — |
| | — |
| | — |
| | 1,224 |
| | 1,224 |
|
| Other comprehensive expense for the year | — |
| | — |
| | — |
| | — |
| | — |
| | (3 | ) | | — |
| | (3 | ) |
| Total comprehensive income | — |
| | — |
| | — |
| | — |
| | — |
| | (3 | ) | | 1,224 |
| | 1,221 |
|
| Exercise of share options | — |
| | — |
| | 5 |
| | — |
| | — |
| | — |
| | — |
| | 5 |
|
| Conversion of equity awards to liability awards | — |
| | — |
| | — |
| | — |
| | (2 | ) | | — |
| | — |
| | (2 | ) |
| Transfer to share premium upon exercise of share options | — |
| | — |
| | 3 |
| | — |
| | (3 | ) | | — |
| | — |
| | — |
|
| Forfeiture of share options | — |
| | — |
| | — |
| | — |
| | (3 | ) | | — |
| | 3 |
| | — |
|
| Share-based compensation of the Company | — |
| | — |
| | — |
| | — |
| | 14 |
| | — |
| | — |
| | 14 |
|
| Share-based compensation charged by LVS | — |
| | — |
| | — |
| | — |
| | 1 |
| | — |
| | — |
| | 1 |
|
| Dividends to equity holders of the Company | — |
| | — |
| | — |
| | — |
| | — |
| | — |
| | (2,071 | ) | | (2,071 | ) |
| Balance at December 31, 2016 | 81 |
| | 87 |
| | 1,411 |
| | 6 |
| | 89 |
| | 6 |
| | 3,327 |
| | 5,007 |
|
| Profit for the year | — |
| | — |
| | — |
| | — |
| | — |
| | — |
| | 1,603 |
| | 1,603 |
|
| Other comprehensive expense for the year | — |
| | — |
| | — |
| | — |
| | — |
| | (22 | ) | | — |
| | (22 | ) |
| Total comprehensive income | — |
| | — |
| | — |
| | — |
| | — |
| | (22 | ) | | 1,603 |
| | 1,581 |
|
| Exercise of share options | — |
| | — |
| | 12 |
| | — |
| | — |
| | — |
| | — |
| | 12 |
|
| Conversion of equity awards to liability awards | — |
| | — |
| | — |
| | — |
| | (5 | ) | | — |
| | — |
| | (5 | ) |
| Transfer to share premium upon exercise of share options | — |
| | — |
| | 5 |
| | — |
| | (5 | ) | | — |
| | — |
| | — |
|
| Forfeiture of share options | — |
| | — |
| | — |
| | — |
| | (3 | ) | | — |
| | 3 |
| | — |
|
| Share-based compensation of the Company | — |
| | — |
| | — |
| | — |
| | 12 |
| | — |
| | — |
| | 12 |
|
| Dividends to equity holders of the Company (Note 11) | — |
| | — |
| | — |
| | — |
| | — |
| | — |
| | (2,069 | ) | | (2,069 | ) |
| Balance at December 31, 2017 | 81 |
| | 87 |
| | 1,428 |
| | 6 |
| | 88 |
| | (16 | ) | | 2,864 |
| | 4,538 |
|
| Effect of adoption of IFRS 9 (Note 2) | — |
| | — |
| | — |
| | — |
| | — |
| | — |
| | 24 |
| | 24 |
|
| Balance at January 1, 2018 (Restated) | 81 |
| | 87 |
| | 1,428 |
| | 6 |
| | 88 |
| | (16 | ) | | 2,888 |
| | 4,562 |
|
| Profit for the year | — |
| | — |
| | — |
| | — |
| | — |
| | — |
| | 1,875 |
| | 1,875 |
|
| Other comprehensive expense for the year | — |
| | — |
| | — |
| | — |
| | — |
| | (12 | ) | | — |
| | (12 | ) |
| Total comprehensive income | — |
| | — |
| | — |
| | — |
| | — |
| | (12 | ) | | 1,875 |
| | 1,863 |
|
| Exercise of share options | — |
| | — |
| | 23 |
| | — |
| | — |
| | — |
| | — |
| | 23 |
|
| Transfer to share premium upon exercise of share options | — |
| | — |
| | 6 |
| | — |
| | (6 | ) | | — |
| | — |
| | — |
|
| Forfeiture of share options | — |
| | — |
| | — |
| | — |
| | (4 | ) | | — |
| | 4 |
| | — |
|
| Share-based compensation of the Company | — |
| | — |
| | — |
| | — |
| | 14 |
| | — |
| | — |
| | 14 |
|
| Dividends to equity holders of the Company (Note 11) | — |
| | — |
| | — |
| | — |
| | — |
| | — |
| | (2,053 | ) | | (2,053 | ) |
| Balance at December 31, 2018 | $ | 81 |
| | $ | 87 |
| | $ | 1,457 |
| | $ | 6 |
| | $ | 92 |
| | $ | (28 | ) | | $ | 2,714 |
| | $ | 4,409 |
|
| | | | | | | | | | | | | | | | |
CONSOLIDATED STATEMENTS OF CASH FLOWS
|
| | | | | | | | | | | | |
| | | Year ended December 31, |
| | | 2018 | | 2017 | | 2016 |
| | Note | US$ in millions |
| Cash flows from operating activities | | | | | | |
| Cash generated from operations | 27 | $ | 3,055 |
| | $ | 2,632 |
| | $ | 2,352 |
|
| Income tax paid | | (6 | ) | | (6 | ) | | (6 | ) |
| Net cash generated from operating activities | | 3,049 |
| | 2,626 |
| | 2,346 |
|
| Cash flows from investing activities | | | | | | |
| Increase in restricted cash and cash equivalents | | (2 | ) | | (1 | ) | | (2 | ) |
| Purchases of property and equipment | | (492 | ) | | (423 | ) | | (1,033 | ) |
| Additions to investment properties | | (16 | ) | | (45 | ) | | (100 | ) |
| Purchases of intangible assets | | (24 | ) | | (9 | ) | | (18 | ) |
| Proceeds from disposal of property and equipment, investment properties and intangible assets | | 5 |
| | 13 |
| | 1 |
|
| Interest received | | 16 |
| | 4 |
| | 3 |
|
| Net cash used in investing activities | | (513 | ) | | (461 | ) | | (1,149 | ) |
| Cash flows from financing activities | | | | | | |
| Proceeds from exercise of share options | | 23 |
| | 12 |
| | 5 |
|
| Proceeds from Senior Notes | 24 | 5,500 |
| | — |
| | — |
|
| Proceeds from bank loans | 24 | 746 |
| | 650 |
| | 2,000 |
|
| Repayments of bank loans | 24 | (5,083 | ) | | (669 | ) | | (1,000 | ) |
| Dividends paid | 24 | (2,052 | ) | | (2,067 | ) | | (2,070 | ) |
| Repayments of finance lease liabilities | 24 | (15 | ) | | (5 | ) | | (4 | ) |
| Payments for deferred financing costs | 24 | (90 | ) | | — |
| | (32 | ) |
| Interest paid | 24 | (128 | ) | | (128 | ) | | (94 | ) |
| Net cash used in financing activities | | (1,099 | ) | | (2,207 | ) | | (1,195 | ) |
| Net increase/(decrease) in cash and cash equivalents | | 1,437 |
| | (42 | ) | | 2 |
|
| Cash and cash equivalents at beginning of year | | 1,239 |
| | 1,284 |
| | 1,283 |
|
| Effect of exchange rate on cash and cash equivalents | | — |
| | (3 | ) | | (1 | ) |
| Cash and cash equivalents at end of year | 20 | $ | 2,676 |
| | $ | 1,239 |
| | $ | 1,284 |
|
| Non-cash investing and financing activities | | | | | | |
| Property and equipment acquired under finance lease | | $ | 1 |
| | $ | 15 |
| | $ | 6 |
|
| Conversion of equity awards to liability awards | | $ | — |
| | $ | 5 |
| | $ | 2 |
|
NOTES TO THE CONSOLIDATED FINANCIAL STATEMENTS
Principal activities
The Group is principally engaged in the operation of casino games of chance or games of other forms and the development and operation of integrated resorts and other ancillary services in Macao. The Group’s immediate holding company is Venetian Venture Development Intermediate II. Las Vegas Sands Corp., a company incorporated in Nevada, U.S.A., and indirectly holds 70.02% ownership interest in the Group as at December 31, 2018, is the Group’s ultimate holding company.
The Company was incorporated in the Cayman Islands on July 15, 2009 as an exempted company with limited liability under the Companies Law, Cap 22 (Law 3 of 1961, as consolidated and revised) of the Cayman Islands. The address of the Company’s registered office is Intertrust Corporate Services (Cayman) Limited, 190 Elgin Avenue, George Town, Grand Cayman KY1-9005, Cayman Islands. The Company’s principal place of business is Level 54, Hopewell Centre, 183 Queen’s Road East, Hong Kong.
The Group owns and operates The Venetian Macao-Resort-Hotel (“The Venetian Macao”), which anchors the Cotai Strip, the Group’s master-planned development of integrated resort properties in Macao. Sands Cotai Central opened in phases, beginning in April 2012. The property currently features four hotel towers, consisting of hotel rooms and suites under the Conrad, Holiday Inn, Sheraton and St. Regis brands. The Company previously announced the renovation, expansion and rebranding of Sands Cotai Central into a new destination integrated resort, The Londoner Macao, by adding extensive thematic elements both externally and internally. The Londoner Macao will feature new attractions and features from London, including some of London’s most recognizable landmarks and expanded retail and food and beverage venues. The Company will add approximately 370 luxury suites within the tower also occupied by the St. Regis hotel. In September 2016, the Group opened The Parisian Macao, an integrated resort connected to The Venetian Macao and The Plaza Macao. The Group owns The Plaza Macao, which is located adjacent and connected to The Venetian Macao. The Plaza Macao is an integrated resort that includes the Four Seasons Hotel Macao, the Plaza Casino, Shoppes at Four Seasons and Paiza Mansions. The Company also previously announced the Four Seasons Tower Suites Macao, which will feature approximately 290 additional premium quality suites. The Group also owns and operates the Sands Macao, the first Las Vegas-style casino in Macao. The Group’s other ancillary services include ferry operations and other related operations.
The Company’s shares were listed on the Main Board of the Stock Exchange on November 30, 2009.
The consolidated financial statements are presented in millions of units of United States dollars (“US$ in millions”), unless otherwise stated.
The consolidated financial statements were approved for issue by the Board of Directors on March 15, 2019.
| |
| 2. | SUMMARY OF SIGNIFICANT ACCOUNTING POLICIES |
The principal accounting policies applied in the preparation of the consolidated financial statements are set out below. These policies have been consistently applied to all the years presented, unless otherwise stated.
The consolidated financial statements of the Group have been prepared in accordance with the following accounting policies which conform with International Financial Reporting Standards (“IFRS”). The preparation of the consolidated financial statements in accordance with IFRS requires the use of certain critical accounting estimates. It also requires management to exercise its judgment in the process of applying the Group’s accounting policies. The areas involving a higher degree of judgment or complexity, or areas where assumptions and estimates are significant to the consolidated financial statements are disclosed in Note 3.
The consolidated financial statements have been prepared on the historical cost basis except for financial liabilities for cash-settled share-based payment transactions and derivative financial instruments that are measured at fair value.
| |
| (b) | Changes in accounting policies and disclosures |
During the year, there have been a number of new standards and new amendments to standards that have come into effect, which the Group has adopted at their respective dates. The adoption of these new standards and new amendments to standards had no material impact on the results of operations and financial position of the Group, except for the adoption of IFRS 15 Revenue from Contracts with Customers (“IFRS 15”) and IFRS 9 Financial Instruments (“IFRS 9”).
IFRS 15 Revenue from Contracts with Customers
The accounting standard establishes a single comprehensive model for entities to use in accounting for revenue arising from contracts with customers. The core principle of IFRS 15 is an entity should recognize revenue to depict the transfer of promised goods or services to customers in an amount that reflects the consideration to which the entity expects to be entitled in exchange for those goods or services. It also requires more detailed disclosures to enable users of financial statements to understand the nature, amount, timing and uncertainty of revenue and cash flows arising from contracts with customers. See Note 4 for these disclosures. The Group adopted the new standard on January 1, 2018, on a full retrospective basis.
The standard changes the accounting for complimentary services (including rooms, food and beverage, and other services) provided to casino guests as incentives related to gaming play. Complimentary revenues were previously excluded from revenues in the accompanying consolidated income statement prepared in accordance with IFRS. The adoption of the new standard resulted in a decrease in casino
revenue due to complimentary services provided and recognition of revenue in the resulting business category of the goods or services provided when the services are rendered. The cost of providing such complimentary services were regrouped in the respective business categories. Certain commission arrangements with third parties were reclassified out of operating expenses and netted with revenue. The effect of adoption of this standard is set out below.
Effect on the consolidated income statement for the year ended December 31, 2017:
|
| | | | | | | | | | | | | | | |
| | For the year ended | | | | | | For the year ended |
| | December 31, 2017 | | Effects of | | Reclassification | | December 31, 2017 |
| | as previously stated | | IFRS 15 | | (Note) | | as restated |
| | US$ in millions |
| Net revenues | $ | 7,715 |
| | $ | (129 | ) | | $ | — |
| | $ | 7,586 |
|
| Gaming promoter/agency commissions | (135 | ) | | 127 |
| | 8 |
| | — |
|
| Other expenses and losses | (915 | ) | | 2 |
| | (8 | ) | | (921 | ) |
Effect on the consolidated income statement for the year ended December 31, 2016:
|
| | | | | | | | | | | | | | | |
| | For the year ended | | | | | | For the year ended |
| | December 31, 2016 | | Effects of | | Reclassification | | December 31, 2016 |
| | as previously stated | | IFRS 15 | | (Note) | | as restated |
| | US$ in millions |
| Net revenues | $ | 6,653 |
| | $ | (110 | ) | | $ | — |
| | $ | 6,543 |
|
| Gaming promoter/agency commissions | (122 | ) | | 115 |
| | 7 |
| | — |
|
| Other expenses and losses | (837 | ) | | (5 | ) | | (7 | ) | | (849 | ) |
____________________
Note: Amount represented agency commissions. As the amount was immaterial, it was reclassified to “Other expenses and losses” for the purpose of presenting the consolidated income statement.
IFRS 9 Financial Instruments
The accounting standard replaces the provisions of International Accounting Standard (“IAS”) 39 “Financial Instruments: Recognition and Measurement” that relates to the recognition, classification and measurement of financial assets and financial liabilities, derecognition of financial instruments, impairment of financial assets and hedge accounting.
The adoption of IFRS 9 from January 1, 2018 resulted in changes in accounting policies and adjustments to the amounts recognized in the financial statements. In accordance with the transition provisions in IFRS 9 (7.2.15), comparative figures have not been restated.
Effect on the consolidated retained earnings as of January 1, 2018 is as follows:
|
| | | | | |
| | Note | | US$ in millions |
| Closing retained earnings as of December 31, 2017 - IAS 39 | | | $ | 2,864 |
|
| Decrease in carrying amount of bank loan measured at amortized cost | (i) | | 24 |
|
| Opening retained earnings as of January 1, 2018 - IFRS 9 | | | $ | 2,888 |
|
| | | | |
| |
| (i) | Classification and measurement - borrowings |
Following the adoption of IFRS 9, the Group is no longer able to defer the recognition of gain from the modification of debt, which did not result in a derecognition of the financial liability. Under the Group’s previous accounting policies, this gain would have been recognized over the remaining life of the borrowing by adjusting the effective interest rate, on the basis the terms and conditions of the credit facility remained largely unchanged. As a result, the carrying amount of the bank loan which is still recognized on the date of the adoption of IFRS 9 has been decreased by US$24 million and the opening retained earnings as of January 1, 2018 has been increased.
| |
| (ii) | Impairment of financial asset |
The Group’s financial assets consist of cash and cash equivalents, restricted cash and cash equivalents and trade and other receivables that are subsequently recognized at amortized cost. The Group applies the IFRS 9 simplified approach to measure expected credit losses (“ECL”), using a lifetime expected loss allowance for all trade and other receivables. Cash and cash equivalents and restricted cash and cash equivalents are also subject to the impairment requirements of IFRS 9 and, due to their nature, the expected loss allowance is immaterial.
To measure the expected credit losses, except for credit impaired balances and outstanding significant balances that have been assessed individually, the remaining trade receivables have been grouped based on shared credit risk characteristics and days past due. The loss allowance for trade receivables applying lifetime expected credit loss as compared to the incurred loss model of
IAS 39 did not result in a material difference and hence did not result in an adjustment of opening retained earnings as of January 1, 2018.
The Group has not early adopted the new or revised standards, amendments and interpretations that have been issued, but not yet effective for the year ended December 31, 2018.
The Group considers that the new or revised standards, amendments and interpretations effective for the annual period beginning on January 1, 2019 will not have a significant impact to the Group’s results of operations and financial position. Further information about IFRS 16 Leases (“IFRS 16”) is described as follows:
IFRS 16 introduces a comprehensive model for the identification of lease arrangements and accounting treatments for both lessors and lessees. IFRS 16 superseded IAS 17 Leases (“IAS 17”) and the related interpretations when it became effective.
IFRS 16 distinguishes lease and service contracts on the basis of whether an identified asset is controlled by a customer. Distinctions of operating leases and finance leases are removed for lessee accounting, and is replaced by a model where a right-of-use asset and a corresponding liability have to be recognized for all leases by lessees, except for short-term leases and leases of low value assets.
The right-of-use asset is initially measured at cost and subsequently measured at cost less accumulated depreciation and impairment losses. The lease liability is initially measured at the present value of the lease payments not paid at that date. Subsequently, the lease liability is adjusted for interest and lease payments, as well as the impact of lease modifications, amongst others.
Under IAS 17, the Group has already recognized an asset and a related finance lease liability for finance lease arrangement and prepaid lease payments for leasehold interest in lands where the Group is a lessee.
Lessor accounting remains largely unchanged under the new standard.
The Group intends to elect the practical expedient to apply IFRS 16 to contracts previously identified as leases applying IAS 17 and not apply this standard to contracts not previously identified as containing a lease applying IAS 17. Therefore, the Group will not reassess whether the contracts are, or contain a lease which already existed prior to the date of initial application. Further, the Group elected the modified retrospective approach for the application of IFRS 16 as lessee without restating comparative information. Management estimates adoption of the standard will result in the recognition of right-of-use assets and lease liabilities for operating leases of approximately US$6 million as at January 1, 2019. The adoption of this standard will not have a material impact on net income.
For the other new or revised standards, amendments and interpretations effective for annual periods after the year of 2019, the Group is still under assessment and is not yet in a position to state whether it would have a significant impact on the results of operations and financial position of the Group.
Consolidation
The consolidated financial statements incorporate the financial statements of the Company and entities controlled by the Company and its subsidiaries. Control is achieved when the Company:
| |
| • | has power over the investee; |
| |
| • | is exposed, or has rights, to variable returns from its involvement with the investee; and |
| |
| • | has the ability to use its power to affect its returns. |
The Group reassesses whether or not it controls an investee if facts and circumstances indicate there are changes to one or more of the three elements of control listed above.
Subsidiaries are fully consolidated from the date on which control is transferred to the Group and are deconsolidated from the date that control ceases.
Intra-group transactions, balances and unrealized gains and losses on transactions between group companies are eliminated. Profit and losses resulting from inter-company transactions are also eliminated.
The particulars of the Group’s principal subsidiaries as at December 31, 2018, 2017 and 2016 are set out in Note 33.
Operating segments are reported in a manner consistent with the internal reporting provided to the chief operating decision maker. The chief operating decision maker, who is responsible for allocating resources and assessing performance of the operating segments, has been identified as a group of senior management that makes strategic decisions.
| |
| (e) | Foreign currency translation |
| |
| (i) | Functional and presentation currency |
Items included in the financial statements of each of the Group’s companies are measured using the currency of the primary economic environment in which the entity operates (the “functional currency”). The Company’s functional currency is Macao patacas (“MOP”). The consolidated financial statements are presented in US$, which is the presentation currency of LVS.
| |
| (ii) | Transactions and balances |
Foreign currency transactions are translated into the functional currency using the exchange rates prevailing at the dates of the transactions or valuation where items are remeasured. Foreign exchange gains and losses resulting from the settlement of such transactions and from the translation at year-end exchange rates of monetary assets and liabilities denominated in foreign currencies are recognized in the consolidated income statement.
The results of operations and financial position of all the group companies (none of which has the currency of a hyperinflationary economy) that have a functional currency different from the presentation currency are translated into the presentation currency as follows:
| |
| • | Assets and liabilities for each balance sheet presented are translated at the closing rate at the date of that balance sheet; |
| |
| • | Income and expenses for each income statement are translated at average exchange rates (unless this average is not a reasonable approximation of the cumulative effect of the rates prevailing on the transaction dates, in which case income and expenses are translated at the rates on the dates of the transactions); and |
| |
| • | All resulting exchange differences are recognized in other comprehensive income/(loss) (currency translation differences) and will not be reclassified subsequently to profit or loss. |
On consolidation, exchange differences arising from the translation of the net investment in foreign entities, and of borrowings, are recognized in other comprehensive income/(loss). When a foreign operation is sold, such exchange differences are recognized in the consolidated income statement as part of the gain or loss on sale.
On the disposal of a foreign operation (that is, a disposal of the Group’s entire interest in a foreign operation, or a disposal involving loss of control over a subsidiary that includes a foreign operation), all of the exchange differences accumulated in equity in respect of that operation attributable to the equity holders of the Company are reclassified to profit or loss.
In the case of a partial disposal that does not result in the Group losing control over a subsidiary that includes a foreign operation, the proportionate share of accumulated exchange differences are reattributed to non-controlling interests and are not recognized in profit or loss.
Investment properties, principally comprising buildings and building improvements, are held for long-term rental yields or capital appreciation or both, and are not occupied by the Group. Investment properties currently being constructed or developed are classified as investment properties and stated at cost, less accumulated impairment losses, if any. Investment properties are initially measured at cost and subsequently carried at cost less accumulated depreciation and accumulated impairment losses, if any. Investment properties are depreciated on a straight-line basis, at rates sufficient to write off their costs over their estimated useful lives of 3 to 50 years. The residual values and useful lives of investment properties are reviewed, and adjusted as appropriate at each balance sheet date. The effects of any revision are included in the consolidated income statement when the changes arise. During the year ended December 31, 2017, the Group revised the estimated useful lives of certain investment properties. See Note 3(a) for details.
| |
| (g) | Property and equipment |
Leasehold interests in land classified as finance leases and all other property and equipment, except construction-in-progress, are stated at historical cost less accumulated depreciation and accumulated impairment losses. The cost of an asset comprises its purchase price and any directly attributable costs of bringing the asset to its working condition and location for its intended use. Leasehold interests in land classified as finance leases commence amortization from the time when the land interest becomes available for its intended use. Leasehold interests in land classified as finance leases are amortized and other property and equipment are depreciated on a straight-line basis, at rates sufficient to write off their costs over their estimated useful lives.
Property and equipment are depreciated as follows:
|
| |
| Leasehold interests in land classified as finance leases | 50 years |
| Leasehold improvements | Shorter of lease term or 3 years |
| Land improvements, buildings and building improvements | 10–50 years |
| Ferries | 20 years |
| Furniture, fittings and equipment | 3–20 years |
| Vehicles | 5–6 years |
During the year ended December 31, 2017, the Group revised the estimated useful lives of certain property and equipment. See Note3(a) for details.
Subsequent costs are included in the asset’s carrying amount or recognized as a separate asset, as appropriate, only when it is probable future economic benefits associated with the item will flow to the Group and the cost of the item can be measured reliably. The carrying amount of the replaced part is derecognized. All other repairs and maintenance are charged to the consolidated income statement during the financial period in which they are incurred.
Construction-in-progress represents property and equipment under construction and is stated at cost, less accumulated impairment losses, if any. This includes the direct costs of purchase, construction and capitalized borrowing costs. Construction-in-progress is not depreciated until such time as the relevant assets are completed and ready for their intended use, at which time they are transferred to the relevant asset category.
The assets’ residual values and useful lives are reviewed, and adjusted if applicable, at the end of each reporting period. An asset’s carrying amount is written down immediately to its recoverable amount if the asset’s carrying amount is greater than its estimated recoverable amount.
Gains and losses on disposals are determined by comparing the proceeds with the carrying amount and are recognized within “Other expenses and losses” in the consolidated income statement.
Assets acquired pursuant to finance leases that transfer to the Group substantially all the rewards and risks of ownership are accounted for as if purchased.
Computer software
Acquired computer software licenses are capitalized on the basis of the costs incurred to acquire and bring to use the specific software. These costs are amortized over their estimated useful lives of 4 years.
| |
| (j) | Impairment of non-financial assets |
Assets that have an indefinite useful life are not subject to amortization and are tested at least annually for impairment. Assets that are subject to amortization are reviewed for impairment whenever events or changes in circumstances indicate the carrying amount may not be recoverable. An impairment loss is recognized for the amount by which the asset’s carrying amount exceeds its recoverable amount. The recoverable amount is the higher of an asset’s fair value less costs to sell and value in use. For the purposes of assessing impairment, assets are grouped at the lowest levels for which there are separately identifiable cash inflows (i.e. cash generating units or “CGU”). Non-financial assets other than goodwill that suffered impairment are reviewed for possible reversal of the impairment at each reporting date.
Classification and subsequent measurement of financial assets (upon application of IFRS 9 in accordance with transitions in note 2(b))
Financial assets that meet the following conditions are subsequently measured at amortized cost:
| |
| • | the financial asset is held within a business model whose objective is to collect contractual cash flows; and |
| |
| • | the contractual terms give rise on specified dates to cash flows that are solely payments of principal and interest on the principal amount outstanding. |
Financial assets that meet the following conditions are subsequently measured at fair value through other comprehensive income (“FVTOCI”):
| |
| • | the financial asset is held within a business model whose objective is achieved by both collecting contractual cash flows and selling; and |
| |
| • | the contractual terms give rise on specified dates to cash flows that are solely payments of principal and interest on the principal amount outstanding. |
All other financial assets are subsequently measured at fair value through profit or loss (“FVTPL”).
The Group’s financial assets consist of cash and cash equivalents, restricted cash and cash equivalents and trade and other receivables.
Financial assets and liabilities are offset and the net amount is reported in the balance sheet when there is a legally enforceable right to offset the recognized amounts and there is an intention to settle on a net basis or realize the asset and settle the liability simultaneously.
Interest income is recognized by applying the effective interest rate, except for short-term receivables where the recognition of interest would be immaterial.
Impairment of financial assets (upon application IFRS 9 with transitions in accordance with note 2(b))
The Group recognizes a loss allowance for ECL on trade and other receivables which are subject to impairment under IFRS 9. The amount of ECL is updated at each reporting date to reflect changes in credit risk since initial recognition.
Lifetime ECL represents the ECL that will result from all possible default events over the expected life of the relevant instrument. Assessments are done based on the Group’s historical credit loss experience, adjusted for factors specific to the debtors, general economic conditions and an assessment of both the current conditions at the reporting date as well as the forecast of future conditions.
(i) Definition of default
For internal credit risk management, the Group considers an event of default occurs when information developed internally or obtained from external sources indicates the debtor is unlikely to pay its creditors, including the Group, in full (without taking into account any collaterals held by the Group).
(ii) Credit-impaired financial assets
A financial asset is credit-impaired when one or more events of default that have a detrimental impact on the estimated future cash flows of that financial asset have occurred. Evidence a financial asset is credit-impaired includes observable data about the following events:
| |
| • | Significant financial difficulty of the issuer or the borrower; |
| |
| • | A breach of contract, such as a default or past due event; |
| |
| • | The Group, for economic or legal reasons relating to the borrower’s financial difficulty, granting to the borrower a concession the lender would not otherwise consider; |
| |
| • | It becomes probable the borrower will enter bankruptcy or other financial reorganization; |
| |
| • | The disappearance of an active market for that financial asset because of financial reorganization; or |
| |
| • | Observable data indicating there is a measurable decrease in the estimated future cash flows from a portfolio of financial assets since the initial recognition of those assets, although the decrease cannot yet be identified with the individual financial assets in the portfolio, including: |
(i) adverse changes in the payment status of borrowers in the portfolio; or
(ii) national or local economic conditions that correlate with defaults on the assets in the portfolio.
(iii) Write-off policy
The Group writes off a financial asset when there is information indicating that the counterparty is in severe financial difficulty and there is no realistic prospect of recovery, for example, when the counterparty has been placed under liquidation or has entered into bankruptcy proceedings. Financial assets written off may still be subject to enforcement activities under the Group’s recovery procedures, taking into account legal advice where appropriate. A write-off constitutes a derecognition event. Any subsequent recoveries are recognized in profit or loss.
(iv) Measurement and recognition of ECL
The measurement of ECL is a function of the probability of default, loss given default (i.e. the magnitude of the loss if there is a default) and the exposure at default. The assessment of the probability of default and loss given default is based on historical data adjusted by forward-looking information.
Generally, the ECL is the difference between all contractual cash flows due to the Group in accordance with the contract and the cash flows the Group expects to receive.
Where ECL is measured on a collective basis or cater for cases where evidence at the individual instrument level may not yet be available, the financial instruments are grouped based on shared credit risk characteristics and days past due.
The grouping is regularly reviewed by management to ensure the constituents of each group continue to share similar credit risk characteristics.
The Group recognizes an impairment gain or loss in profit or loss for trade and other receivables by adjusting their carrying amount through a loss allowance account.
Classification and subsequent measurement of financial assets (before application of IFRS 9 on January 1, 2018)
The Group’s financial assets consist of receivables, which are classified as loans and receivables under IAS 39 and are non-derivative financial assets with fixed or determinable payments that are not quoted in an active market and for which management has no intention of trading. They are included in current assets, except for the amounts settled or expected to be settled more than twelve months after the end of the reporting period, which are classified as non-current.
Receivables are subsequently carried at amortized cost. Financial assets and liabilities are offset and the net amount is reported in the balance sheet when there is a legally enforceable right to offset the recognized amounts and there is an intention to settle on a net basis or realize the asset and settle the liability simultaneously.
Impairment of financial assets (before application of IFRS 9 on January 1, 2018)
The Group assesses at the end of each reporting period whether there is objective evidence that a financial asset or group of financial assets is impaired. A financial asset or a group of financial assets is impaired and impairment losses are incurred only if there is objective evidence of impairment as a result of one or more events that occurred after the initial recognition of the asset (a “loss event”) and that loss event (or events) has an impact on the estimated future cash flows of the financial asset or group of financial assets that can be reliably estimated.
The criteria the Group uses to determine there is objective evidence of an impairment loss include:
| |
| • | Significant financial difficulty of the issuer or obligor; |
| |
| • | A breach of contract, such as a default or delinquency in interest or principal payments; |
| |
| • | The Group, for economic or legal reasons relating to the borrower’s financial difficulty, granting to the borrower a concession the lender would not otherwise consider; |
| |
| • | It becomes probable the borrower will enter bankruptcy or other financial reorganization; |
| |
| • | Observable data indicating there is a measurable decrease in the estimated future cash flows from a portfolio of financial assets since the initial recognition of those assets, although the decrease cannot yet be identified with the individual financial assets in the portfolio, including: |
(i) adverse changes in the payment status of borrowers in the portfolio; or
(ii) national or local economic conditions that correlate with defaults on the assets in the portfolio.
The Group first assesses whether objective evidence of an impairment exists.
For the receivables, the amount of the loss is measured as the difference between the asset’s carrying amount and the estimated future cash flows (excluding future credit losses that have not been incurred). The carrying amount of the asset is reduced and the amount of the loss is recognized in the consolidated income statement.
If, in a subsequent period, the amount of the impairment loss decreases and the decrease can be related objectively to an event occurring after the impairment was recognized (such as an improvement in the debtor’s credit rating), the reversal of the previously recognized impairment loss is recognized in the consolidated income statement.
Derecognition of financial assets
The Group derecognizes a financial asset when the consideration was received. On derecognition of a financial asset measured at amortized cost, the difference between the asset’s carrying amount and the sum of the consideration received and receivable is recognized in profit or loss.
| |
| (l) | Cash and cash equivalents |
Cash and cash equivalents include cash and short-term deposits with original maturities of three months or less. Restricted cash and cash equivalents are excluded from cash and cash equivalents in the consolidated statement of cash flows.
Inventories consist primarily of food, beverage, retail products, ferry parts and general operating supplies, and are stated at the lower of cost and net realizable value. Cost is determined using the weighted average method. Net realizable value is the estimated selling price in the ordinary course of business, less applicable selling expenses.
Ordinary shares are classified as equity.
Incremental costs directly attributable to the issuance of equity instruments are shown in equity as a deduction, net of tax, from the proceeds.
The Group’s financial liabilities, including borrowings and trade and other payables, are initially measured at fair value and subsequently measured at amortized cost, using the effective interest method.
Derecognition/substantial modification of financial liabilities
The Group derecognizes financial liabilities when, and only when, the Group's obligations are discharged, cancelled or have expired. The difference between the carrying amount of the financial liability derecognized and the consideration paid and payable is recognized in profit or loss.
When the contractual terms of financial liability are modified such that the revised terms would result in a substantial modification from the original terms, after taking into account all relevant facts and circumstances including qualitative factors, such modification is accounted for as derecognition of the original financial liability and the recognition of new financial liability. The difference between the carrying amount of the financial liability derecognized and the fair value of consideration paid or payable, including any liabilities assumed and derivative components, is recognized in profit or loss.
Non-substantial modifications of financial liabilities (under IFRS 9 since January 1, 2018)
For non-substantial modifications of financial liabilities that do not result in derecognition, the carrying amount of the relevant financial liabilities will be calculated at the present value of the modified contractual cash flows discounted at the financial liabilities' original effective interest rate. Transaction costs or fees incurred are adjusted to the carrying amount of the modified financial liabilities and are
amortized over the remaining term. Any adjustment to the carrying amount of the financial liability is recognized in profit or loss at the date of modification.
Non-substantial modifications of financial liabilities (before application of IFRS 9 on January 1, 2018)
For non-substantial modifications of financial liabilities that do not result in derecognition, at the point of modification, the carrying amount of the relevant financial liabilities is revised for directly attributable transaction costs and any consideration paid to or received from the counterparty. The effective interest rate is then adjusted to amortize the difference between the revised carrying amount and the expected cash flows over the life of the modified instrument.
Trade payables are obligations to pay for goods or services acquired in the ordinary course of business from suppliers. Accounts payable are classified as current liabilities if payment is due within one year or less (or in the normal operating cycle of the business if longer). If not, they are presented as non-current liabilities.
Trade payables are recognized initially at fair value and subsequently measured at amortized cost using the effective interest method.
| |
| (q) | Borrowings and financing costs |
Borrowings are recognized initially at fair value, net of transaction costs incurred. Borrowings are subsequently stated at amortized cost; any difference between the proceeds (net of transaction costs) and the redemption value is recognized in the consolidated income statement over the period of the borrowings using the effective interest method.
Fees paid on the establishment of loan facilities are recognized as transaction costs of the loan to the extent it is probable some or all of the facilities will be drawn down. In this case, the fee is deferred until the draw-down occurs. To the extent there is no evidence it is probable some or all of the facilities will be drawn down, the fee is capitalized as a pre-payment for liquidity services and amortized over the period of the facility to which it relates.
Borrowings are classified as current liabilities unless the Group has an unconditional right to defer settlement of the liability for at least twelve months after the balance sheet date.
A qualifying asset is an asset that takes a substantial period of time to get ready for its intended use (Note 2(g)). Financing costs incurred for the construction of any qualifying asset, less any investment income on the temporary investment of related borrowings, are capitalized during the period that is required to complete and prepare the asset for its intended use. Other financing costs, net of interest income, are expensed.
| |
| (r) | Current and deferred income tax and gaming tax |
Income tax
Income tax expense is comprised of current and deferred tax.
Current income tax is calculated on the basis of the tax laws enacted or substantively enacted at the balance sheet date in the countries where the Company and its subsidiaries operate and generate taxable income. Management periodically evaluates positions taken in tax returns with respect to situations in which the applicable tax regulation is subject to interpretation and establishes provisions where appropriate on the basis of amounts expected to be paid to the tax authorities.
Deferred income tax is recognized, using the liability method, for temporary differences arising between the tax bases of assets and liabilities and their carrying values in the consolidated financial statements. Deferred income tax is not accounted for if it arises from initial recognition of an asset or a liability in a transaction other than a business combination that, at the time of the transaction, affects neither accounting nor taxable profit or loss. Deferred income tax is determined using tax rates (and laws) enacted or substantively enacted at the balance sheet date and are expected to apply when the related deferred income tax asset is realized or the deferred income tax liability is settled.
Deferred income tax assets are recognized only to the extent it is probable future taxable profit will be available against which the temporary differences can be utilized.
Deferred income tax is provided for temporary differences arising from investments in subsidiaries, except when the timing of the reversal of the temporary difference can be controlled by the Group and it is probable the temporary difference will not reverse in the foreseeable future.
Deferred income tax assets and liabilities are offset when there is a legally enforceable right to offset current tax assets against current tax liabilities and when the deferred income tax assets and liabilities relate to income taxes levied by the same taxation authority on either the taxable entity or different taxable entities where there is an intention to settle the balances on a net basis.
Gaming tax
According to the gaming subconcession granted by the Macao Government and the relevant legislation, the Group is required to pay 35% gaming tax on gross gaming revenues, which represents net wins from casino operations. The Group is also required to pay an additional 4% of gross gaming revenues as public development and social related contributions. On a monthly basis, the Group also makes certain variable and fixed payments to the Macao Government based on the number of slot machines and table games in its possession. These expenses are reported as “Gaming tax” in the consolidated income statement.
The Group operates a provident fund scheme, which is funded through payments to an insurance company. The provident fund scheme is a defined contribution plan available to all permanent employees after a three-month probation period. The Group contributes 5% of each employee’s basic salary to the fund and the employee is eligible to receive, upon resignation, 30% of these contributions after working for three consecutive years, gradually increasing to 100% after working for ten years. The Group has no further payment obligations once the contributions have been paid. The contributions are recognized as employee benefit expenses when they are due and are reduced by contributions forfeited by those employees who leave the scheme prior to vesting fully in the contributions. Prepaid contributions are recognized as an asset to the extent a cash refund or a reduction in the future payments is available.
| |
| (ii) | Share-based compensation |
Equity-settled share-based payment transactions
| |
| (1) | Share options of the Company |
The Company adopted an equity award plan (the “Equity Award Plan”) for grants of options to purchase ordinary shares of the Company. The cash subscribed for the shares issued when the options are exercised is credited to share capital (nominal value) and share premium, net of any directly attributable transaction costs. At the time when the options are exercised, the amount previously recognized in share-based compensation reserve will be transferred to share premium. When the options are forfeited after the vesting date or are still not exercised at the expiry date, the amount previously recognized in share-based compensation reserve will be transferred to retained earnings.
The Group participates in the equity-settled share-based compensation plan of LVS and is a party to its non-qualified share option plan, Las Vegas Sands Corp. 2004 Equity Award Plan (the “2004 Plan”). The plan provides for the granting of share options pursuant to the applicable provisions of the Internal Revenue Code and regulations in the United States of America.
Share-based compensation expense arising from the granting of share options by LVS to the employees of the Group, to the extent of services rendered to the Group, is deemed to have been allocated to the Group as an expense with the corresponding increase in the share-based compensation reserves under equity.
The fair value of the employee services received in exchange for the grant of the options under the Equity Award Plan and the 2004 Plan is recognized as an expense. The total amount to be expensed is determined by reference to the fair value of the options granted, excluding the impact of any service and non-market performance vesting conditions (for example, profitability, sales growth targets and remaining an employee of the entity over a specified time period). Non-market vesting conditions are included in assumptions about the number of options that are expected to vest. The total amount expensed is recognized over the vesting period, which is the period over which all of the specified vesting conditions are to be satisfied. At the end of each reporting period, the Group revises its estimates of the number of options expected to vest based on the non-market vesting conditions and service conditions.
The Group recognizes the impact of revisions to the original estimates, if any, in the consolidated income statement, with a corresponding adjustment to equity. When the options of the Equity Award Plan are exercised, the Company issues new shares. The proceeds received net of any directly attributable transaction costs are credited to share capital and share premium.
Cash-settled share-based payment transactions of the Company
For cash-settled share-based payments, a financial liability is recognized for the employee services acquired, measured initially at the fair value of the liability. At the end of each reporting period until the liability is settled, and at the date of settlement, the fair value of the liability is remeasured, with any changes in fair value recognized in profit or loss for the year.
| |
| (iii) | Social security fund |
Full-time employees of the Group are covered by a government-mandated defined contribution plan pursuant to which a fixed amount of retirement benefit would be determined and paid by the Macao Government. Contributions are generally made by both employees and employers by paying a fixed amount on a monthly basis to the Social Security Fund Contribution managed by the Macao Government. The Group funds the entire contribution and has no further commitments beyond its monthly contributions.
| |
| (iv) | Annual leave and other paid leave |
Employee entitlement to annual leave is recognized when it accrues to employees. A provision is made for the estimated liability for annual leave as a result of services rendered by employees during the year. Employee entitlements to maternity leave and sick leave are not recognized until the time of leave.
Termination benefits are payable when employment is terminated by the Group before the normal retirement date, or whenever an employee accepts voluntary redundancy in exchange for these benefits. The Group recognizes termination benefits at the earlier of when the Group can no longer withdraw the offer of the termination benefits and when it recognizes any related restructuring costs. In the case of an offer made to encourage voluntary redundancy, the termination benefits are measured based on the number of employees expected to accept the offer. Benefits falling due more than twelve months after the balance sheet date are discounted to their present value.
The Group recognizes a liability and an expense for bonuses where contractually obliged or where there is a past practice that has created a constructive obligation.
Provisions are recognized when: the Group has a present legal or constructive obligation as a result of past events; it is probable an outflow of resources will be required to settle the obligation; and the amount has been reliably estimated. Provisions are not recognized for future operating losses.
Provisions are measured at the present value of management’s best estimate of the expenditure to be required to settle the present obligation at the reporting date. The pre-tax discount rate used to determine the present value reflects current market assessments of the time value of money and the risks specific to the liability. The increase in the provision due to the passage of time is recognized as interest expense.
| |
| (u) | Contingent liabilities |
A contingent liability is a possible obligation that arises from past events and whose existence will only be confirmed by the occurrence or non-occurrence of one or more uncertain future events not wholly within the control of the Group. It can also be a present obligation arising from past events that is not recognized because it is not probable an outflow of economic resources will be required or the amount of the obligation cannot be measured reliably.
A contingent liability is not recognized but is disclosed in the notes to the consolidated financial statements unless the probability of outflow of resources embodying economic benefits is remote. When a change in the probability of an outflow occurs so the outflow is probable, it will then be recognized as a provision.
Revenue from contracts with customers primarily consists of casino wagers, room sales, food and beverage transactions, convention sales and entertainment and ferry ticket sales. These contracts can be written, oral or implied by customary business practices.
Gross casino revenue is the aggregate of gaming wins and losses. The commissions rebated to junket operators and premium players for rolling play, cash discounts and other cash incentives to patrons related to gaming play are recorded as a reduction to gross casino revenue. Gaming contracts include a performance obligation to honor the patron’s wager and typically include a performance obligation to provide a product or service to the patron on a complimentary basis to incentivize gaming or in exchange for points earned under the Group’s loyalty programs.
For wagering contracts that include complimentary products and services provided by the Group to incentivize gaming, the Group allocates the relative stand-alone selling price of each product and service to the respective revenue type. Complimentary products or services provided under the Group’s control and discretion, which are supplied by third parties, are recorded as an operating expense.
For wagering contracts that include products and services provided to a patron in exchange for points earned under the Group’s loyalty programs, the Group allocates the estimated fair value of the points earned to the loyalty program liability. The loyalty program liability is a deferral of revenue until redemption occurs. Upon redemption of loyalty program points for Group-owned products and services, the stand-alone selling price of each product or service is allocated to the respective revenue type. For redemptions of points with third parties, the redemption amount is deducted from the loyalty program liability and paid directly to the third party. Any discounts received by the Group from the third party in connection with this transaction are recorded to other revenue.
After allocation to the other revenue types for products and services provided to patrons as part of a wagering contract, the residual amount is recorded to casino revenue as soon as the wager is settled. As all wagers have similar characteristics, the Group accounts for its gaming contracts collectively on a portfolio basis versus an individual basis.
Hotel revenue recognition criteria are met at the time of occupancy. Food and beverage revenue recognition criteria are met at the time of service. Convention revenues are recognized when the related service is rendered or the event is held. Deposits for future hotel occupancy, convention space or food and beverage services contracts are recorded as deferred revenue until the revenue recognition criteria are met. Cancellation fees for convention contracts are recognized upon cancellation by the customer and are included in other
revenues. Ferry and entertainment revenue recognition criteria are met at the completion of the ferry trip or event, respectively. Revenue from contracts with a combination of these services is allocated pro rata based on each service’s relative stand-alone selling price.
The Group’s accounting policy for recognition of revenue from operating leases is described in the accounting policy for leases/right of use below.
Pre-opening expenses represent personnel and other costs incurred prior to the opening of new properties and are expensed as incurred.
| |
| (i) | As the lessor/grantor for operating leases/right of use |
When assets are leased/granted out under an agreement for the right of use, the asset is included in the consolidated balance sheet based on the nature of the asset. Lease rental/income from right of use (net of any incentives given to tenants or to retailers) is recognized over the terms of the lease/right of use on a straight-line basis. Turnover fees arising under operating leases/right of use are recognized as income in the period in which they are earned.
| |
| (ii) | As the lessee for operating leases |
Leases in which a significant portion of the risks and rewards of ownership are retained by the lessor are classified as operating leases. Payments made under operating leases (net of any incentives received from the lessor) are charged to the consolidated income statement on a straight-line basis over the period of the lease.
| |
| (iii) | As the lessee for finance leases |
The Group leases land and certain equipment. Leases of land and equipment where the Group has substantially all the risks and rewards of ownership are classified as finance leases. Finance leases are recognized at the leases’ commencement at the lower of the fair value of the leased assets and the present value of the minimum lease payments.
Each lease payment is allocated between the liability and finance charges. The corresponding rental obligations, net of finance charges, are included in borrowings. The interest element of the finance cost is charged to the consolidated income statement over the lease period so as to produce a constant periodic rate of interest on the remaining balance of the liability for each period. The land and equipment acquired under a finance lease are depreciated over the shorter of the useful life of the asset and the lease term.
| |
| (y) | Dividend distributions |
Dividend distributions to the Company’s Shareholders are recognized as a liability in the Group’s and the Company’s financial statements in the period in which the dividends are approved by the Company’s Shareholders or directors, where appropriate.
| |
| 3. | CRITICAL ACCOUNTING ESTIMATES AND JUDGMENTS |
Estimates and judgments are continually evaluated and are based on historical experience and other factors, including expectations of future events that are believed to be reasonable under the circumstances.
The Group makes estimates and assumptions concerning the future. The resulting accounting estimates will, by definition, seldom equal the related actual results. The estimates and assumptions that have a significant risk of potentially causing a material adjustment to the carrying amounts of assets and liabilities within the next financial year are addressed below.
| |
| (a) | Useful lives of investment properties and property and equipment |
The Group depreciates investment properties and property and equipment on a straight-line basis over their estimated useful lives with no residual value assumed. The estimated useful lives are based on the nature of the assets, as well as current operating strategy and legal considerations, such as contractual life. Future events, such as property expansions, property developments, new competition or new regulations, could result in a change in the manner in which the Group uses certain assets and could have an impact on the estimated useful lives of such assets.
During the year ended December 31, 2017, the Group changed the estimated useful lives of certain of its property and equipment and investment properties based on a combination of factors accumulating over time that provided the Group with updated information to make a better estimate on the economic lives of these assets. These factors included (1) the accumulation of historical asset replacement data at the Group’s operating properties, which reflects the actual length of time the Group uses certain assets, (2) the stabilization of the operating, regulatory and competitive environment in Macao, which includes meeting the final land concession government-imposed deadlines for the Group’s properties on Cotai, (3) transitioning to more predictable renovation cycles at the Group’s operating properties and (4) consideration of the estimated useful lives assigned to buildings of the Group’s peers in the gaming and hospitality industry. Based on these factors, as well as the anticipated use and condition of the assets evaluated, the Group determined changes to the useful lives of certain property and equipment and investment properties were appropriate. As a result, the Group revised the estimated useful lives of its leasehold interests in land, land improvements, buildings and building improvements from a range of 15 to 40 years to 10 to 50 years
and certain other furniture, fittings and equipment from 3 to 6 years to 5 to 10 years to better reflect the estimated periods during which these assets are expected to remain in service.
These changes in estimated useful lives of the assets were accounted for as changes in accounting estimates effective July 1, 2017. The impact of these changes for the year ended December 31, 2017, was a decrease in depreciation expense and an increase in operating profit of US$89 million, and an increase in net profit attributable to equity holders of the Company of US$88 million, or earnings per share of US1.10 cents on a basic and diluted basis.
| |
| (b) | Impairment of non-financial assets |
The Group follows the guidance of International Accounting Standard (“IAS”) 36 “Impairment of Assets” to determine when assets are impaired, which requires significant judgment. In making this judgment, the Group evaluates, among other factors, the duration and extent to which the recoverable amount of assets is less than their carrying balance, including factors such as the industry performance and changes in operational and financing cash flows. When required, the recoverable amount of the CGU would be determined based on value-in-use calculations. These calculations require the use of estimates, including operating results, income and expenses of the business, future economic conditions on growth rates, future returns and discount rate.
Changes in the key assumptions on which the recoverable amount of the assets is based could significantly affect the Group’s financial position and results of operations.
| |
| (c) | Provision of expected credit loss for trade receivables |
The Group applies the IFRS 9 simplified approach to measure expected credit losses, using a lifetime expected loss allowance for all trade and other receivables. The Group determines the allowance based on specific customer information, historical write-off experience, current industry and economic data and an assessment of both the current conditions at the reporting date as well as the forecast of future conditions. A provision of expected credit loss for trade receivables is recorded when the Group believes it is probable the recoverable amount of the receivables will be less than their carrying amounts. Account balances are written off against the allowance when the Group considers the receivables to be uncollectible. Management believes there are no concentrations of credit risk for which an allowance has not been established. Although management believes the allowance is adequate, it is possible the estimated amount of cash collections with respect to trade receivables could change.
The Group is subject to various claims and legal actions. The accruals for these claims and legal actions are estimated in accordance with IAS 37 “Provisions, Contingent Liabilities and Contingent Assets”. Based on consultations with legal counsel, management estimated no significant loss would be incurred beyond the amounts provided. Actual results could differ from these estimates.
The Group generates revenues at its properties by providing the following types of products and services: casino, rooms, mall, food and beverage and convention, ferry, retail and other. Revenue disaggregated by type of revenue and property is as follows:
|
| | | | | | | | | | | | | | | | | | | | | | | |
| | Casino | | Rooms | | Mall(ii) | | Food and beverage | | Convention, ferry, retail and other | | Net revenues |
| | US$ in millions |
| Year ended December 31, 2018 | | | | | | | | | | | |
| The Venetian Macao | $ | 2,829 |
| | $ | 223 |
| | $ | 234 |
| | $ | 81 |
| | $ | 107 |
| | $ | 3,474 |
|
| Sands Cotai Central | 1,622 |
| | 331 |
| | 69 |
| | 102 |
| | 29 |
| | 2,153 |
|
| The Parisian Macao | 1,265 |
| | 124 |
| | 57 |
| | 65 |
| | 22 |
| | 1,533 |
|
| The Plaza Macao | 502 |
| | 39 |
| | 145 |
| | 29 |
| | 4 |
| | 719 |
|
| Sands Macao | 598 |
| | 17 |
| | 3 |
| | 27 |
| | 5 |
| | 650 |
|
| Ferry and other operations | — |
| | — |
| | — |
| | — |
| | 151 |
| | 151 |
|
Inter-segment revenues(i) | — |
| | — |
| | (1 | ) | | — |
| | (14 | ) | | (15 | ) |
| | $ | 6,816 |
| | $ | 734 |
| | $ | 507 |
| | $ | 304 |
| | $ | 304 |
| | $ | 8,665 |
|
| Year ended December 31, 2017 | | | | | | | | | | | |
| The Venetian Macao | $ | 2,362 |
| | $ | 179 |
| | $ | 220 |
| | $ | 74 |
| | $ | 89 |
| | $ | 2,924 |
|
| Sands Cotai Central | 1,433 |
| | 291 |
| | 63 |
| | 102 |
| | 27 |
| | 1,916 |
|
| The Parisian Macao | 1,120 |
| | 128 |
| | 66 |
| | 61 |
| | 20 |
| | 1,395 |
|
| The Plaza Macao | 391 |
| | 34 |
| | 131 |
| | 28 |
| | 3 |
| | 587 |
|
| Sands Macao | 574 |
| | 19 |
| | — |
| | 27 |
| | 6 |
| | 626 |
|
| Ferry and other operations | — |
| | — |
| | — |
| | — |
| | 153 |
| | 153 |
|
Inter-segment revenues(i) | — |
| | — |
| | (1 | ) | | — |
| | (14 | ) | | (15 | ) |
| | $ | 5,880 |
| | $ | 651 |
| | $ | 479 |
| | $ | 292 |
| | $ | 284 |
| | $ | 7,586 |
|
| Year ended December 31, 2016 | | | | | | | | | | | |
| The Venetian Macao | $ | 2,286 |
| | $ | 177 |
| | $ | 209 |
| | $ | 75 |
| | $ | 84 |
| | $ | 2,831 |
|
| Sands Cotai Central | 1,471 |
| | 267 |
| | 62 |
| | 99 |
| | 25 |
| | 1,924 |
|
| The Parisian Macao | 315 |
| | 36 |
| | 23 |
| | 20 |
| | 7 |
| | 401 |
|
| The Plaza Macao | 392 |
| | 36 |
| | 127 |
| | 26 |
| | 3 |
| | 584 |
|
| Sands Macao | 614 |
| | 20 |
| | — |
| | 26 |
| | 8 |
| | 668 |
|
| Ferry and other operations | — |
| | — |
| | — |
| | — |
| | 145 |
| | 145 |
|
Inter-segment revenues(i) | — |
| | — |
| | (1 | ) | | — |
| | (9 | ) | | (10 | ) |
| | $ | 5,078 |
| | $ | 536 |
| | $ | 420 |
| | $ | 246 |
| | $ | 263 |
| | $ | 6,543 |
|
| | | | | | | | | | | | |
____________________
Note: The prior year presentation has been adjusted for the adoption of IFRS 15, Revenue from Contracts with Customers, and conformed to the current year presentation.
| |
| (i) | Inter-segment revenues are charged at prevailing market rates. |
| |
| (ii) | Of this amount, US$436 million and US$71 million for the year ended December 31, 2018, US$406 million and US$73 million for the year ended December 31, 2017, US$360 million and US$60 million for the year ended December 31, 2016 are related to income from right of use and management fee and other, respectively. Income from right of use is recognized in accordance with IAS 17 Leases. |
Contract and Contract Related Liabilities
The Group provides numerous products and services to its customers. There is often a timing difference between the cash payment by the customers and recognition of revenue for each of the associated performance obligations. The Group has the following main types of liabilities associated with contracts with customers: (1) outstanding chip liability, (2) loyalty program liability, and (3) customer deposits and other deferred revenue for gaming and non-gaming products and services yet to be provided.
The outstanding chip liability represents the collective amounts owed to junket operators and patrons in exchange for gaming chips in their possession. Outstanding chips are expected to be recognized as revenue or redeemed for cash within one year of being purchased. The loyalty program liability represents a deferral of revenue until patron redemption of points earned. The loyalty program points are expected to be redeemed and recognized as revenue within one year of being earned. Customer deposits and other deferred revenue represent cash deposits made by customers for future services provided by the Group. With the exception of mall deposits, which typically extend beyond a year based on the terms of the lease, the majority of these customer deposits and other deferred revenue are expected to be recognized as revenue or refunded to the customer within one year of the date the deposit was recorded.
The following table summarizes the liability activity related to contracts with customers:
|
| | | | | | | | | | | | | | | | | | | | | | | |
| | Outstanding Chip Liability | | Loyalty Program Liability | | Customer Deposits and Other Deferred Revenue(i) |
| | 2018 | | 2017 | | 2018 | | 2017 | | 2018 | | 2017 |
| | US$ in millions |
| Balance at January 1 | $ | 418 |
| | $ | 483 |
| | $ | 30 |
| | $ | 45 |
| | $ | 424 |
| | $ | 343 |
|
| Balance at December 31 | 514 |
| | 418 |
| | 33 |
| | 30 |
| | 497 |
| | 424 |
|
| Increase/(decrease) | $ | 96 |
| | $ | (65 | ) | | $ | 3 |
| | $ | (15 | ) | | $ | 73 |
| | $ | 81 |
|
| | | | | | | | | | | | |
____________________
| |
| (i) | Of this amount, US$127 million, US$121 million and US$109 million as of December 31, 2018, December 31, 2017, and January 1, 2017, respectively, relates to mall deposits that are accounted for based on lease terms usually greater than one year. |
Management has determined the operating segments based on the reports reviewed by a group of senior management which is the chief operating decision maker of the Group that makes strategic decisions. The Group considers the business from a property and service perspective.
The Group’s principal operating and developmental activities occur in Macao, which is the sole geographic area in which the Group is domiciled. The Group reviews the results of operations for each of its key operating segments, which are also the reportable segments: The Venetian Macao, Sands Cotai Central, The Parisian Macao (which opened in September 2016), The Plaza Macao, Sands Macao and ferry and other operations. The Group’s primary projects under development include the renovation, expansion and rebranding of Sands Cotai Central to The Londoner Macao, the apart-hotel tower at The Londoner Macao and the Four Seasons Tower Suites Macao.
Revenue is comprised of revenue from the sale of goods and services in the ordinary course of the Group’s activities. The Venetian Macao, Sands Cotai Central, The Parisian Macao, The Plaza Macao and Sands Macao derive their revenues primarily from casino, hotel, mall, food and beverage, convention, retail and other sources. Ferry and other operations mainly derive their revenues from the sale of ferry tickets for transportation between Hong Kong and Macao.
The Group’s segment information is as follows:
|
| | | | | | | | | | | |
| | Year ended December 31, |
| | 2018 | | 2017 | | 2016 |
| | US$ in millions |
| Net revenues | | | | | |
| The Venetian Macao | $ | 3,474 |
| | $ | 2,924 |
| | $ | 2,831 |
|
| Sands Cotai Central | 2,153 |
| | 1,916 |
| | 1,924 |
|
| The Parisian Macao | 1,533 |
| | 1,395 |
| | 401 |
|
| The Plaza Macao | 719 |
| | 587 |
| | 584 |
|
| Sands Macao | 650 |
| | 626 |
| | 668 |
|
| Ferry and other operations | 151 |
| | 153 |
| | 145 |
|
Inter-segment revenues(i) | (15 | ) | | (15 | ) | | (10 | ) |
| | $ | 8,665 |
| | $ | 7,586 |
| | $ | 6,543 |
|
| | | | | | |
____________________
Note: The prior year presentation has been adjusted for the adoption of IFRS 15, Revenue from Contracts with Customers, and conformed to the current year presentation.
| |
| (i) | Inter-segment revenues are charged at prevailing market rates. |
The following is a reconciliation of adjusted property EBITDA to profit for the year attributable to equity holders of the Company:
|
| | | | | | | | | | | | |
| | | Year ended December 31, |
| | | 2018 | | 2017 | | 2016 |
| | Note | US$ in millions |
Adjusted property EBITDA (Unaudited)(i) | | | | | | |
| The Venetian Macao | | $ | 1,378 |
| | $ | 1,137 |
| | $ | 1,092 |
|
| Sands Cotai Central | | 759 |
| | 633 |
| | 615 |
|
| The Parisian Macao | | 484 |
| | 412 |
| | 114 |
|
| The Plaza Macao | | 262 |
| | 233 |
| | 221 |
|
| Sands Macao | | 178 |
| | 174 |
| | 171 |
|
| Ferry and other operations | | 18 |
| | 22 |
| | 31 |
|
| Total adjusted property EBITDA | | 3,079 |
| | 2,611 |
| | 2,244 |
|
Share-based compensation, net of amount capitalized(ii) | | (13 | ) | | (12 | ) | | (15 | ) |
| Corporate expense | (a) | (125 | ) | | (120 | ) | | (128 | ) |
| Pre-opening expense | (b) | (5 | ) | | (7 | ) | | (127 | ) |
| Depreciation and amortization | | (655 | ) | | (676 | ) | | (611 | ) |
| Net foreign exchange gains/(losses) | | 4 |
| | (11 | ) | | 1 |
|
| Loss on disposal of property and equipment, investment properties and intangible assets | | (131 | ) | | (12 | ) | | (12 | ) |
| Operating profit | | 2,154 |
| | 1,773 |
| | 1,352 |
|
| Interest income | | 20 |
| | 5 |
| | 3 |
|
| Interest expense, net of amounts capitalized | | (225 | ) | | (153 | ) | | (86 | ) |
| Loss on modification or early retirement of debt | | (81 | ) | | — |
| | (1 | ) |
| Profit before income tax | | 1,868 |
| | 1,625 |
| | 1,268 |
|
| Income tax benefit/(expense) | | 7 |
| | (22 | ) | | (44 | ) |
Profit for the year attributable to equity holders
of the Company | | $ | 1,875 |
| | $ | 1,603 |
| | $ | 1,224 |
|
| | | | | | | |
____________________
| |
| (i) | Adjusted property EBITDA, which is a non-IFRS financial measure, is profit attributable to equity holders of the Company before share-based compensation, corporate expense, pre-opening expense, depreciation and amortization, net foreign exchange gains/(losses), impairment loss, gain/(loss) on disposal of property and equipment, investment properties and intangible assets, interest, gain/(loss) on modification or early retirement of debt and income tax benefit/(expense). Management utilizes adjusted property EBITDA to compare the operating profitability of its operations with those of its competitors, as well as a basis for determining certain incentive compensation. Gaming companies have historically reported adjusted property EBITDA as a supplemental performance measure to IFRS financial measures. In order to view the operations of their casinos on a more stand-alone basis, gaming companies, including the Group, have historically excluded certain expenses that do not relate to the management of specific casino properties, such as pre-opening expense and corporate expense, from their adjusted property EBITDA calculations. Adjusted property EBITDA should not be interpreted as an alternative to profit or operating profit (as an indicator of operating performance) or to cash flows from operations (as a measure of liquidity), in each case, as determined in accordance with IFRS. The Group has significant uses of cash flow, including capital expenditures, dividend payments, interest payments and debt principal repayments, which are not reflected in adjusted property EBITDA. Not all companies calculate adjusted property EBITDA in the same manner. As a result, adjusted property EBITDA as presented by the Group may not be directly comparable to other similarly titled measures presented by other companies. |
| |
| (ii) | Amount includes share-based compensation of US$1 million and nil, US$1 million and nil, and US$3 million and US$1 million for the years ended December 31, 2018, 2017, and 2016, respectively, related to corporate expense and pre-opening expense, respectively. |
|
| | | | | | | | | | | | |
| | | Year ended December 31, |
| | | 2018 | | 2017 | | 2016 |
| | Note | | | US$ in millions | | |
| Royalty fees | 29(a)(v) | $ | 106 |
| | $ | 98 |
| | $ | 73 |
|
| Management fees | 29(a)(ii) | 6 |
| | 6 |
| | 6 |
|
| Employee benefit expenses | | 7 |
| | 6 |
| | 6 |
|
| Other support services | | 3 |
| | 4 |
| | 7 |
|
| Other expenses | | 3 |
| | 6 |
| | 36 |
|
| | | $ | 125 |
| | $ | 120 |
| | $ | 128 |
|
| | | | | | | |
|
| | | | | | | | | | | | |
| | | Year ended December 31, |
| | | 2018 | | 2017 | | 2016 |
| | Note | | | US$ in millions | | |
| Utilities and operating supplies | | $ | 2 |
| | $ | 2 |
| | $ | 4 |
|
| Employee benefit expenses | | 1 |
| | — |
| | 80 |
|
| Contract labor and services | | 1 |
| | — |
| | 14 |
|
| Management fees | 29(a)(ii) | — |
| | 1 |
| | 4 |
|
| Advertising and promotions | | — |
| | — |
| | 15 |
|
| Other support services | | 1 |
| | 3 |
| | 3 |
|
| Other expenses | | — |
| | 1 |
| | 7 |
|
| | | $ | 5 |
| | $ | 7 |
| | $ | 127 |
|
| | | | | | | |
|
| | | | | | | | | | | |
| | Year ended December 31, |
| | 2018 | | 2017 | | 2016 |
| | | | US$ in millions | | |
| Depreciation and amortization | | | | | |
| The Venetian Macao | $ | 146 |
| | $ | 151 |
| | $ | 165 |
|
| Sands Cotai Central | 274 |
| | 239 |
| | 294 |
|
| The Parisian Macao | 163 |
| | 204 |
| | 58 |
|
| The Plaza Macao | 33 |
| | 36 |
| | 40 |
|
| Sands Macao | 24 |
| | 31 |
| | 39 |
|
| Ferry and other operations | 15 |
| | 15 |
| | 15 |
|
| | $ | 655 |
| | $ | 676 |
| | $ | 611 |
|
| | | | | | |
|
| | | | | | | | | | | |
| | Year ended December 31, |
| | 2018 | | 2017 | | 2016 |
| | | | US$ in millions | | |
| Capital expenditures | | | | | |
| The Venetian Macao | $ | 179 |
| | $ | 152 |
| | $ | 94 |
|
| Sands Cotai Central | 130 |
| | 84 |
| | 123 |
|
| The Parisian Macao | 130 |
| | 204 |
| | 896 |
|
| The Plaza Macao | 63 |
| | 22 |
| | 16 |
|
| Sands Macao | 29 |
| | 10 |
| | 18 |
|
| Ferry and other operations | 1 |
| | 5 |
| | 4 |
|
| | $ | 532 |
| | $ | 477 |
| | $ | 1,151 |
|
| | | | | | |
|
| | | | | | | |
| | December 31, |
| | 2018 | | 2017 |
| | US$ in millions |
| Total assets | | | |
| The Venetian Macao | $ | 3,447 |
| | $ | 2,669 |
|
| Sands Cotai Central | 4,378 |
| | 3,972 |
|
| The Parisian Macao | 2,489 |
| | 2,531 |
|
| The Plaza Macao | 913 |
| | 959 |
|
| Sands Macao | 328 |
| | 288 |
|
| Ferry and other operations | 503 |
| | 228 |
|
| | $ | 12,058 |
| | $ | 10,647 |
|
| | | | |
Almost all of the non-current assets of the Group are located in Macao.
| |
| 6. | EMPLOYEE BENEFIT EXPENSES (INCLUDING DIRECTORS’ EMOLUMENTS) |
|
| | | | | | | | | | | |
| | Year ended December 31, |
| | 2018 | | 2017 | | 2016 |
| | | | US$ in millions | | |
| Wages, salaries, bonus and termination costs | $ | 1,096 |
| | $ | 1,048 |
| | $ | 984 |
|
| Staff meals | 55 |
| | 57 |
| | 54 |
|
| Pension costs - defined contribution plan | 38 |
| | 37 |
| | 35 |
|
Share-based compensation, net of amount capitalized(i) | 13 |
| | 12 |
| | 15 |
|
| Other employee benefit expenses | 36 |
| | 39 |
| | 33 |
|
| | $ | 1,238 |
| | $ | 1,193 |
| | $ | 1,121 |
|
| | | | | | |
____________________
| |
| (i) | Share-based compensation of US$1 million, nil and US$1 million was capitalized during the years ended December 31, 2018, 2017 and 2016, respectively. For further information related to the Company’s Equity Award Plan and LVS’ 2004 Plan, see Note 30 to the consolidated financial statements. |
| |
| (a) | Pension costs — defined contribution plan |
Contributions totaling US$7 million remained payable to the provident fund as at December 31, 2018 and 2017. Forfeited contributions totaling US$4 million were utilized during the years ended December 31, 2018 and 2017, leaving US$1 million available at year end December 31, 2018 and 2017, to reduce future contributions.
The remuneration of the Company’s Directors is as follows:
|
| | | | | | | | | | | | | | | | | | | | | | | |
| | Fees | | Salaries | | Discretionary bonuses(1) | | Pension costs | | Estimated money value of other benefits(2) | | Total |
| | US$ in thousands |
| Year ended December 31, 2018 | | | | | | | | | | | |
| Executive Directors | | | | | | | | | | | |
| Sheldon Gary Adelson | $ | — |
| | $ | — |
| | $ | — |
| | $ | — |
| | $ | — |
| | $ | — |
|
Wong Ying Wai(3) | — |
| | 2,337 |
| | 1,494 |
| | 117 |
| | 667 |
| | 4,615 |
|
| Non-Executive Directors | | | | | | | | | | | |
| Robert Glen Goldstein | — |
| | — |
| | — |
| | — |
| | — |
| | — |
|
| Charles Daniel Forman | 150 |
| | — |
| | — |
| | — |
| | — |
| | 150 |
|
| Independent Non-Executive Directors | | | | | | | | | | | |
| Chiang Yun | 150 |
| | — |
| | — |
| | — |
| | — |
| | 150 |
|
| Victor Patrick Hoog Antink | 180 |
| | — |
| | — |
| | — |
| | — |
| | 180 |
|
| Steven Zygmunt Strasser | 180 |
| | — |
| | — |
| | — |
| | — |
| | 180 |
|
Kenneth Patrick Chung(6) | 150 |
| | — |
| | — |
| | — |
| | — |
| | 150 |
|
Wang Sing(9) | 117 |
| | — |
| | — |
| | — |
| | — |
| | 117 |
|
| | $ | 927 |
| | $ | 2,337 |
| | $ | 1,494 |
| | $ | 117 |
| | $ | 667 |
| | $ | 5,542 |
|
| | | | | | | | | | | | |
|
| | | | | | | | | | | | | | | | | | | | | | | |
| | Fees | | Salaries | | Discretionary bonuses(1) | | Pension costs | | Estimated money value of other benefits(2) | | Total |
| | US$ in thousands |
| Year ended December 31, 2017 | | | | | | | | | | | |
| Executive Directors | | | | | | | | | | | |
| Sheldon Gary Adelson | $ | — |
| | $ | — |
| | $ | — |
| | $ | — |
| | $ | — |
| | $ | — |
|
Wong Ying Wai(3) | — |
| | 2,334 |
| | 1,497 |
| | 116 |
| | 637 |
| | 4,584 |
|
| Non-Executive Directors | | | | | | | | | | | |
| Robert Glen Goldstein | — |
| | — |
| | — |
| | — |
| | — |
| | — |
|
| Charles Daniel Forman | 150 |
| | — |
| | — |
| | — |
| | — |
| | 150 |
|
| Independent Non-Executive Directors | | | | | | | | | | | |
| Chiang Yun | 150 |
| | — |
| | — |
| | — |
| | — |
| | 150 |
|
| Victor Patrick Hoog Antink | 180 |
| | — |
| | — |
| | — |
| | — |
| | 180 |
|
| Steven Zygmunt Strasser | 180 |
| | — |
| | — |
| | — |
| | — |
| | 180 |
|
Kenneth Patrick Chung(6) | 150 |
| | — |
| | — |
| | — |
| | — |
| | 150 |
|
Wang Sing(9) | 70 |
| | — |
| | — |
| | — |
| | — |
| | 70 |
|
| | $ | 880 |
| | $ | 2,334 |
| | $ | 1,497 |
| | $ | 116 |
| | $ | 637 |
| | $ | 5,464 |
|
| | | | | | | | | | | | |
|
| | | | | | | | | | | | | | | | | | | | | | | |
| | Fees | | Salaries | | Discretionary bonuses(1) | | Pension costs | | Estimated money value of other benefits(2) | | Total |
| | US$ in thousands |
| Year ended December 31, 2016 | | | | | | | | | | | |
| Executive Directors | | | | | | | | | | | |
| Sheldon Gary Adelson | $ | — |
| | $ | — |
| | $ | — |
| | $ | — |
| | $ | — |
| | $ | — |
|
Wong Ying Wai(3) | — |
| | 2,313 |
| | 1,508 |
| | 106 |
| | 639 |
| | 4,566 |
|
Toh Hup Hock(4) | — |
| | 356 |
| | — |
| | 13 |
| | 657 |
| | 1,026 |
|
| Non-Executive Directors | | | | | | | | | | | |
| Robert Glen Goldstein | — |
| | — |
| | — |
| | — |
| | — |
| | — |
|
| Charles Daniel Forman | 112 |
| | — |
| | — |
| | — |
| | — |
| | 112 |
|
Michael Alan Leven(5) | 34 |
| | — |
| | — |
| | — |
| | — |
| | 34 |
|
| Independent Non-Executive Directors | | | | | | | | | | | |
| Chiang Yun | 112 |
| | — |
| | — |
| | — |
| | — |
| | 112 |
|
| Victor Patrick Hoog Antink | 143 |
| | — |
| | — |
| | — |
| | — |
| | 143 |
|
| Steven Zygmunt Strasser | 134 |
| | — |
| | — |
| | — |
| | — |
| | 134 |
|
Kenneth Patrick Chung(6) | 59 |
| | — |
| | — |
| | — |
| | — |
| | 59 |
|
Iain Ferguson Bruce(7) | 19 |
| | — |
| | — |
| | — |
| | — |
| | 19 |
|
David Muir Turnbull(8) | 24 |
| | — |
| | — |
| | — |
| | — |
| | 24 |
|
| | $ | 637 |
| | $ | 2,669 |
| | $ | 1,508 |
| | $ | 119 |
| | $ | 1,296 |
| | $ | 6,229 |
|
| | | | | | | | | | | | |
____________________
| |
| (1) | The discretionary bonuses are determined by reference to the individual performance of the Directors and the Chief Executive and the Group’s performance, and approved by the Remuneration Committee. |
| |
| (2) | Other benefits mainly include share-based compensation, accommodation, meals, home leave tickets and medical insurance. |
| |
| (3) | Wong Ying Wai, the President and Chief Operating Officer, was appointed as an Executive Director with effect from January 22, 2016. |
| |
| (4) | Toh Hup Hock resigned as the Chief Financial Officer and Executive Vice President and an Executive Director with effect from April 15, 2016. |
| |
| (5) | Michael Alan Leven retired as a Non-Executive Director with effect from April 12, 2016. |
| |
| (6) | Kenneth Patrick Chung was appointed as an Independent Non-Executive Director with effect from July 15, 2016. |
| |
| (7) | Iain Ferguson Bruce resigned as an Independent Non-Executive Director with effect from March 11, 2016. |
| |
| (8) | David Muir Turnbull resigned as an Independent Non-Executive Director with effect from March 7, 2016. |
| |
| (9) | Wang Sing was appointed as an Independent Non-Executive Director with effect from July 14, 2017 and resigned as an Independent Non-Executive Director with effect from October 11, 2018. |
The Executive Directors’ emoluments were for their services in connection with the management of the affairs of the Group. The Non-Executive Directors’ and Independent Non-Executive Directors’ emoluments were for their services as directors of the Company.
In addition to the Directors’ emoluments disclosed above, Sheldon Gary Adelson and Robert Glen Goldstein received compensation (inclusive of share-based compensation) from LVS in respect of their services to LVS and its subsidiaries (including the Group). An amount of US$3 million was charged by LVS to the Group in respect of such management and administrative services of Robert Glen Goldstein provided to the Group for the years ended December 31, 2018, 2017 and 2016.
No emoluments were paid to any Directors as an inducement to join or upon joining the Group or as compensation for loss of office for the three years ended December 31, 2018.
With the exception of the continuing connected transactions disclosed in the 2018 Annual Report, 2017 Annual Report and 2016 Annual Report of the Company, none of the Directors has any material interests in transactions, arrangements or contracts entered into by the Company or the LVS Group.
None of the Directors waived or has agreed to waive any emoluments for the three years ended December 31, 2018.
| |
| (c) | Five highest paid individuals |
For each of the years ended December 31, 2018, 2017 and 2016, the five individuals whose emoluments were the highest in the Group include one Director whose emoluments are reflected in the analysis presented above. The emoluments payable to the remaining four individuals for the three years ended December 31, 2018, are as follows:
|
| | | | | | | | | | | |
| | Year ended December 31, |
| | 2018 | | 2017 | | 2016 |
| | US$ in thousands |
| Basic salaries, allowances and benefits in kind | $ | 5,496 |
| | $ | 5,462 |
| | $ | 6,206 |
|
| Bonus | 2,551 |
| | 2,980 |
| | 2,743 |
|
| Pension costs | 191 |
| | 191 |
| | 179 |
|
| | $ | 8,238 |
| | $ | 8,633 |
| | $ | 9,128 |
|
| | | | | | |
The emoluments of the above mentioned individuals fall within the following bands:
|
| | | | | | | | |
| | Year ended December 31, |
| | 2018 | | 2017 | | 2016 |
| | Number of individuals |
HK$13,000,001 (approximately US$1,677,000) – HK$13,500,000 (approximately US$1,742,000) | 1 |
| | 1 |
| | — |
|
| HK$15,500,001 (approximately US$2,000,000) – HK$16,000,000 (approximately US$2,065,000) | 1 |
| | — |
| | — |
|
| HK$16,000,001 (approximately US$2,065,000) – HK$16,500,000 (approximately US$2,129,000) | 1 |
| | — |
| | — |
|
| HK$16,500,001 (approximately US$2,129,000) – HK$17,000,000 (approximately US$2,194,000) | — |
| | 1 |
| | — |
|
| HK$17,000,001 (approximately US$2,194,000) – HK$17,500,000 (approximately US$2,258,000) | — |
| | — |
| | 2 |
|
| HK$18,000,001 (approximately US$2,323,000)– HK$18,500,000 (approximately US$2,387,000) | — |
| | 1 |
| | 2 |
|
| HK$18,500,001 (approximately US$2,387,000) – HK$19,000,000 (approximately US$2,452,000) | — |
| | 1 |
| | — |
|
| HK$19,000,001 (approximately US$2,452,000) – HK$19,500,000 (approximately US$2,516,000) | 1 |
| | — |
| | — |
|
| | 4 |
| | 4 |
| | 4 |
|
| | | | | | |
No emoluments were paid to any of the five highest paid individuals as an inducement to join or upon joining the Group or as compensation for loss of office for the three years ended December 31, 2018.
| |
| 7. | OTHER EXPENSES AND LOSSES |
| |
| (a) | An analysis of the operating expenses is as follows: |
|
| | | | | | | | | | | | |
| | | Year ended December 31, |
| | | 2018 | | 2017 | | 2016 |
| | Note | | | US$ in millions | | |
| Gaming tax | | $ | 3,430 |
| | $ | 2,925 |
| | $ | 2,527 |
|
| Employee benefit expenses | | 1,238 |
| | 1,193 |
| | 1,121 |
|
| Depreciation and amortization | | 655 |
| | 676 |
| | 611 |
|
| Inventories consumed | | 99 |
| | 98 |
| | 83 |
|
| Other expenses and losses | (i) | 1,089 |
| | 921 |
| | 849 |
|
| Operating expenses | | $ | 6,511 |
| | $ | 5,813 |
| | $ | 5,191 |
|
| | | | | | | |
____________________
Note: The prior year presentation has been adjusted for the adoption of IFRS 15, Revenue from Contracts with Customers, and conformed to the current year presentation.
| |
| (i) | Analysis of other expenses and losses is as follows: |
|
| | | | | | | | | | | | |
| | | Year ended December 31, |
| | | 2018 | | 2017 | | 2016 |
| | Note | | | US$ in millions | | |
| Utilities and operating supplies | | $ | 207 |
| | $ | 200 |
| | $ | 175 |
|
| Contract labor and services | | 151 |
| | 141 |
| | 127 |
|
Loss on disposal of property and equipment, investment properties and intangible assets(i) | | 131 |
| | 12 |
| | 12 |
|
| Advertising and promotions | | 124 |
| | 116 |
| | 104 |
|
| Royalty fees | | 112 |
| | 103 |
| | 78 |
|
| Repairs and maintenance | | 93 |
| | 83 |
| | 64 |
|
| Management fees | 29(a)(ii) | 50 |
| | 42 |
| | 46 |
|
| Operating lease expense | | 15 |
| | 30 |
| | 28 |
|
| Provision for expected credit losses, net | | 9 |
| | — |
| | — |
|
| Provision for doubtful accounts, net | | — |
| | 4 |
| | 18 |
|
| Auditor’s remuneration | | 2 |
| | 2 |
| | 2 |
|
| Net foreign exchange (gains)/losses | | (4 | ) | | 11 |
| | (1 | ) |
| Other support services | | 100 |
| | 111 |
| | 101 |
|
| Other operating expenses | | 99 |
| | 66 |
| | 95 |
|
| | | $ | 1,089 |
| | $ | 921 |
| | $ | 849 |
|
| | | | | | | |
____________________
| |
| (i) | The loss for the year ended December 31, 2018 consisted primarily of US$128 million of assets disposed of related to the Four Seasons Tower Suites Macao project. |
| |
| (b) | The operating expenses can also be analyzed as follows: |
|
| | | | | | | | | | | |
| | Year ended December 31, |
| | 2018 | | 2017 | | 2016 |
| | | | US$ in millions | | |
| Casino | $ | 4,216 |
| | $ | 3,646 |
| | $ | 3,165 |
|
| Rooms | 185 |
| | 176 |
| | 143 |
|
| Mall | 53 |
| | 53 |
| | 41 |
|
| Food and beverage | 252 |
| | 241 |
| | 201 |
|
| Convention, ferry, retail and other | 212 |
| | 209 |
| | 188 |
|
| Provision for expected credit losses, net | 9 |
| | — |
| | — |
|
| Provision for doubtful accounts, net | — |
| | 4 |
| | 18 |
|
| General and administrative expense | 672 |
| | 657 |
| | 554 |
|
| Corporate expense | 125 |
| | 121 |
| | 131 |
|
| Pre-opening expense | 5 |
| | 7 |
| | 128 |
|
| Depreciation and amortization | 655 |
| | 676 |
| | 611 |
|
| Net foreign exchange (gains)/losses | (4 | ) | | 11 |
| | (1 | ) |
| Loss on disposal of property and equipment, investment properties and intangible assets | 131 |
| | 12 |
| | 12 |
|
| Operating expenses | $ | 6,511 |
| | $ | 5,813 |
| | $ | 5,191 |
|
| | | | | | |
____________________
Note: The prior year presentation has been adjusted for the adoption of IFRS 15, Revenue from Contracts with Customers, and conformed to the current year presentation.
| |
| 8. | INTEREST EXPENSE, NET OF AMOUNTS CAPITALIZED |
|
| | | | | | | | | | | |
| | Year ended December 31, |
| | 2018 | | 2017 | | 2016 |
| | | | US$ in millions | | |
| Senior Notes | $ | 103 |
| | $ | — |
| | $ | — |
|
| Bank borrowings | 85 |
| | 117 |
| | 84 |
|
| Amortization of deferred financing costs | 22 |
| | 21 |
| | 21 |
|
| Finance lease liabilities | 8 |
| | 7 |
| | 6 |
|
| Standby fee and other financing costs | 11 |
| | 10 |
| | 9 |
|
| | 229 |
| | 155 |
| | 120 |
|
| Less: interest capitalized | (4 | ) | | (2 | ) | | (34 | ) |
| Interest expense, net of amounts capitalized | $ | 225 |
| | $ | 153 |
| | $ | 86 |
|
| | | | | | |
A capitalization rate of 3.2% to 5.4%, 2.7% to 3.3% and 2.3% to 2.8% for the years ended December 31, 2018, 2017 and 2016, respectively, was used, representing the effective finance costs of the loans to finance the assets under construction.
| |
| 9. | INCOME TAX EXPENSE/(BENEFIT) |
|
| | | | | | | | | | | |
| | Year ended December 31, |
| | 2018 | | 2017 | | 2016 |
| | | | US$ in millions | | |
| Current income tax | | | | | |
| Lump sum in lieu of Macao complementary tax on dividends | $ | 5 |
| | $ | 5 |
| | $ | 5 |
|
| Other overseas taxes | — |
| | 1 |
| | — |
|
| Deferred income tax expense/(benefit) | (12 | ) | | 16 |
| | 39 |
|
| Income tax expense/(benefit) | $ | (7 | ) | | $ | 22 |
| | $ | 44 |
|
| | | | | | |
Deferred income tax benefit was US$12 million for the year ended December 31, 2018, compared to deferred income tax expense of US$16 million for the year ended December 31, 2017. The deferred income tax benefit in 2018 was primarily due to the reversal of deferred tax liabilities related to accelerated tax depreciation allowance. The 2017 deferred income tax expense was primarily driven by the increase in valuation allowance related to net operating tax losses which either expired or are expected to expire without being utilized.
Deferred income tax expense was US$16 million for the year ended December 31, 2017, compared to US$39 million for the year ended December 31, 2016. The decrease was primarily due to decrease in write-off of deferred income tax assets on net operating tax losses that had expired unused and expected to be expiring unused due to unpredictable future utilization.
| |
| (a) | Macao complementary tax |
Macao complementary tax is levied at progressive rates ranging from 3% to 9% on the taxable income above MOP32,000 (equivalent to US$4,000) but below MOP300,000 (equivalent to US$37,500), and thereafter at a fixed rate of 12%. For the three years ended December 31, 2018, a special complementary tax incentive was provided to the effect that the tax free income threshold was increased from MOP32,000 to MOP600,000 (equivalent to US$4,000 to US$75,000) with the profit above MOP600,000 (equivalent to US$75,000) being taxed at a fixed rate of 12%.
Pursuant to the Dispatch No. 320/2013 issued by the Chief Executive of Macao on October 3, 2013, VML was granted an extension of the tax exemption regarding Macao complementary tax on its gaming activities for an additional five years, effective from the tax year 2014 to the tax year 2018. Pursuant to the Dispatch No. 194/2018 issued by the Chief Executive of Macao on August 20, 2018, VML was granted an extension of the tax exemption through June 26, 2022, the date VML’s subconcession agreement expires. Regarding the other subsidiaries, during the three years ended December 31, 2018, Macao complementary tax is calculated progressively at a maximum of 12% of the estimated assessable profit.
| |
| (b) | Lump sum in lieu of Macao complementary tax on dividends |
VML entered into a Shareholder Dividend Tax Agreement with the Macao Government. The agreement provided for an annual payment in lieu of Macao complementary tax otherwise due by VML’s shareholders on dividend distributions to them from gaming profits, effective through the end of 2018. In April 2019, VML entered into another Shareholder Dividend Tax Agreement with the Macao Government for an extension of the agreement through June 26, 2022, to correspond to the expiration of the Macao complementary tax exemption on its gaming activities (see also Note 9(a)).
The Company’s subsidiaries that carry on business in Hong Kong are subject to the Hong Kong profits tax at the maximum rate of 16.5% for the year ended December 31, 2018, and at 16.5% for the two years ended December 31, 2017.
| |
| (d) | Reconciliation between income tax (benefit)/expense and accounting profit at applicable tax rates |
The tax on the Group’s profit before income tax differs from the theoretical amount that would arise using the domestic tax rates applicable to profits of the consolidated entities in the respective jurisdictions as follows:
|
| | | | | | | | | | | |
| | Year ended December 31, |
| | 2018 | | 2017 | | 2016 |
| | US$ in millions |
| Profit before income tax | $ | 1,868 |
| | $ | 1,625 |
| | $ | 1,268 |
|
| Tax calculated at domestic rates applicable to profits in the respective jurisdictions | 238 |
| | 208 |
| | 161 |
|
| Tax effects of : | | | | | |
Income not subject to tax(i) | (905 | ) | | (837 | ) | | (720 | ) |
Expenses not deductible for tax purposes(i), (ii) | 574 |
| | 549 |
| | 483 |
|
| Amortization of pre-opening expenses previously not recognized | (3 | ) | | (9 | ) | | (8 | ) |
| Pre-opening expenses for which no deferred income tax assets were recognized | — |
| | — |
| | 9 |
|
| Origination and reversal of temporary difference, net | 4 |
| | 20 |
| | 32 |
|
| Tax losses for which no deferred income tax assets were recognized | 80 |
| | 87 |
| | 83 |
|
| Lump sum in lieu of Macao complementary tax of dividends | 5 |
| | 5 |
| | 5 |
|
| Other | — |
| | (1 | ) | | (1 | ) |
| Income tax (benefit)/expense | $ | (7 | ) | | $ | 22 |
| | $ | 44 |
|
| | | | | | |
____________________
| |
| (i) | For the three years ended December 31, 2018, VML was exempt from Macao complementary tax on its gaming activities (see also Note 9(a)). In addition, lease/right of use income recorded in VML, Venetian Cotai Limited (“VCL”) and Venetian Orient Limited (“VOL”) were subject to property tax (Note (ii)), and should, therefore, also be excluded from Macao complementary tax calculations. Accordingly, casino revenues and lease/right of use income and their corresponding expenses incurred were presented as “Income not subject to tax” and “Expenses not deductible for tax purposes”, respectively, in the calculations above. |
Additionally, for the three years ended December 31, 2018, the Company received dividend income from a subsidiary. The dividend income is not subject to Hong Kong profits tax.
| |
| (ii) | Lease/right of use income recorded in VML, VCL and VOL are exempt from property tax for the first four and six years for the newly constructed buildings in Macao and on Cotai, respectively, pursuant to Article 9(1)(a) of Lei no. 19/78/M. If the buildings in Macao and on Cotai also qualify for Tourism Utility Status, the property tax exemption can be extended by another four and six years, respectively, pursuant to Article 15(a) of Lei no. 81/89/M. The exemption for the Sands Macao expired in August 2012 and that for The Venetian Macao, The Plaza Macao and The Parisian Macao will be expiring in August 2019, August 2020 and September 2028, respectively. Regarding Sands Cotai Central, the procedures for registration at the tax department are in progress and the exact date of expiration of the exemption cannot be determined at this stage. |
Basic earnings per share is calculated by dividing the profit for the year attributable to equity holders of the Company by the weighted average number of ordinary shares outstanding during the year.
Diluted earnings per share is calculated by adjusting the weighted average number of ordinary shares outstanding to assume conversion of all dilutive potential ordinary shares. For the years ended December 31, 2018 and 2017, the Company had outstanding share options that would potentially dilute the ordinary shares. For the year ended December 31, 2016, the Company had outstanding share options and restricted share units that would potentially dilute the ordinary shares.
The calculation of basic and diluted earnings per share is based on the following:
|
| | | | | | | | | | | |
| | Year ended December 31, |
| | 2018 | | 2017 | | 2016 |
Profit attributable to equity holders of the Company
(US$ in millions) | $ | 1,875 |
| | $ | 1,603 |
| | $ | 1,224 |
|
| Weighted average number of shares for basic earnings per share (thousand shares) | 8,078,946 |
| | 8,072,709 |
| | 8,070,042 |
|
Adjustments for share options and restricted share units
(thousand shares) | 7,328 |
| | 4,544 |
| | 1,609 |
|
| Weighted average number of shares for diluted earnings per share (thousand shares) | 8,086,274 |
| | 8,077,253 |
| | 8,071,651 |
|
| Earnings per share, basic | US23.21 cents | | US19.86 cents | | US15.17 cents |
Earnings per share, basic(i) | HK181.75 cents | | HK155.22 cents | | HK117.65 cents |
| Earnings per share, diluted | US23.19 cents | | US19.85 cents | | US15.17 cents |
Earnings per share, diluted(i) | HK181.59 cents | | HK155.14 cents | | HK117.65 cents |
| | | | | | |
____________________
| |
| (i) | The translation of US$ amounts into HK$ amounts has been made at the exchange rate on December 31, 2018, 2017 and 2016 of US$1.00 to HK$7.8306, US$1.00 to HK$7.8157 and US$1.00 to HK$7.7555, respectively. |
|
| | | | | | | | | | | |
| | Year ended December 31, |
| | 2018 | | 2017 | | 2016 |
| | US$ in millions |
| 2018 interim dividend of HK$0.99 (equivalent to US$0.127) per ordinary share declared on January 18, 2019 and paid | $ | 1,023 |
| | $ | — |
| | $ | — |
|
| 2018 final dividend of HK$1.00 (equivalent to US$0.127) per ordinary share declared on March 15, 2019 | 1,033 |
| | — |
| | — |
|
| 2017 interim dividend of HK$0.99 (equivalent to US$0.127) per ordinary share declared on January 19, 2018 and paid | — |
| | 1,023 |
| | — |
|
| 2017 final dividend of HK$1.00 (equivalent to US$0.127) per ordinary share declared on May 25, 2018 and paid | — |
| | 1,030 |
| | — |
|
| 2016 interim dividend of HK$0.99 (equivalent to US$0.128) per ordinary share declared on January 20, 2017 and paid | — |
| | — |
| | 1,030 |
|
| 2016 final dividend of HK$1.00 (equivalent to US$0.129) per ordinary share declared on May 26, 2017 and paid | — |
| | — |
| | 1,039 |
|
| | $ | 2,056 |
| | $ | 2,053 |
| | $ | 2,069 |
|
| | | | | | |
On January 18, 2019, the Board declared an interim dividend of HK$0.99 (equivalent to US$0.127) per share, payable to Shareholders of the Company whose names appeared on the register of members of the Company on February 4, 2019. The interim dividend, amounting in aggregate to HK$8.0 billion (equivalent to US$1.02 billion), was paid on February 22, 2019.
On March 15, 2019, the Board proposed the payment of a final dividend of HK$1.00 (equivalent to US$0.127) per share, which is subject to the approval of the Shareholders at the forthcoming annual general meeting. Based on the ordinary shares in issue as at February 28, 2019, the total amount of the final dividend to be distributed is estimated to be approximately HK$8.08 billion (equivalent to US$1.03 billion).
Both the interim and final dividends referred to above have not been recognized as a liability as at the years ended December 31, 2018, 2017 and 2016. They will be reflected as appropriations of reserves during 2019, 2018 and 2017, respectively.
| |
| 12. | INVESTMENT PROPERTIES, NET |
|
| | | | | | | | | | | |
| | Completed | | Under development | | Total |
| | US$ in millions |
| At January 1, 2017 | | | | | |
| Cost | $ | 1,353 |
| | $ | 243 |
| | $ | 1,596 |
|
| Accumulated depreciation | (274 | ) | | — |
| | (274 | ) |
| At January 1, 2017 | $ | 1,079 |
| | $ | 243 |
| | $ | 1,322 |
|
| | | | | | |
| Year ended December 31, 2017 | | | | | |
| Opening net book amount | $ | 1,079 |
| | $ | 243 |
| | $ | 1,322 |
|
| Additions | 48 |
| | — |
| | 48 |
|
| Adjustments arising from change in lease term of leasehold interests in land | 2 |
| | — |
| | 2 |
|
| Adjustments to project costs | (8 | ) | | — |
| | (8 | ) |
| Transfers | 241 |
| | (241 | ) | | — |
|
| Depreciation | (44 | ) | | — |
| | (44 | ) |
| Exchange difference | (7 | ) | | (2 | ) | | (9 | ) |
| Closing net book amount | $ | 1,311 |
| | $ | — |
| | $ | 1,311 |
|
| | | | | | |
| At December 31, 2017 | | | | | |
| Cost | $ | 1,626 |
| | $ | — |
| | $ | 1,626 |
|
| Accumulated depreciation | (315 | ) | | — |
| | (315 | ) |
| At December 31, 2017 | $ | 1,311 |
| | $ | — |
| | $ | 1,311 |
|
| | | | | | |
| Year ended December 31, 2018 | | | | | |
| Opening net book amount | $ | 1,311 |
| | $ | — |
| | $ | 1,311 |
|
| Additions | 62 |
| | — |
| | 62 |
|
| Adjustments to project costs | 5 |
| | — |
| | 5 |
|
| Disposals | (92 | ) | | — |
| | (92 | ) |
| Transfers | (609 | ) | | — |
| | (609 | ) |
| Depreciation | (45 | ) | | — |
| | (45 | ) |
| Exchange difference | (3 | ) | | — |
| | (3 | ) |
| Closing net book amount | $ | 629 |
| | $ | — |
| | $ | 629 |
|
| | | | | | |
| At December 31, 2018 | | | | | |
| Cost | $ | 988 |
| | $ | — |
| | $ | 988 |
|
| Accumulated depreciation | (359 | ) | | — |
| | (359 | ) |
| At December 31, 2018 | $ | 629 |
| | $ | — |
| | $ | 629 |
|
| | | | | | |
Pursuant to IAS 40 “Investment Property”, an entity shall transfer a property to/or from investment property when and only when there is a change in use. Subsequent to the Board’s approval in October 2017 to introduce approximately 370 new suites in the apart-hotel tower at The Londoner Macao and approximately 290 new suites in the Four Seasons Tower Suites Macao, observable actions have taken place to support management’s intention to convert the apart-hotel tower at The Londoner Macao and the Four Seasons Tower Suites Macao to owner-occupied assets. As a result, during the year ended December 31, 2018, the assets pertaining to the apart-hotel tower at The Londoner Macao and the Four Seasons Tower Suites Macao with an aggregate carrying amount of US$609 million were transferred from investment properties to property and equipment.
The Group engaged an independent professional valuer, Knight Frank Petty Limited, to perform the valuation of the Group’s investment properties, which are located in Macao, on an annual basis. Knight Frank Petty Limited is a professionally qualified independent external valuer, and had appropriate recent experience in the relevant location and category of the properties being valued. In determining the fair value of the investment properties, the valuer uses assumptions and estimates that reflect, amongst other factors, comparable market transactions in an active market, lease/right of use income from current leases/rights of use and assumptions about lease/right of use income from future leases/rights of use in light of current market conditions, capitalization rates, terminal yield and reversionary income potential. Valuations were based on income and an open market value approach for all completed properties (except for the apart-hotel tower at The Londoner Macao as at December 31, 2017) as follows:
|
| | | | | | | |
| | December 31, |
| | 2018 | | 2017(i) |
| | US$ in millions |
| Fair value of the investment properties | $ | 8,243 |
| | $ | 9,248 |
|
| | | | |
____________________
| |
| (i) | Amount includes US$1,488 million related to the Four Seasons Tower Suites Macao. |
For the apart-hotel tower at The Londoner Macao, the valuation was determined by taking into account the market value of the proposed development assuming completion as at the date of valuation and then deducting from that amount the estimated costs to complete the development. The fair value of this property as at December 31, 2017 was US$801 million.
In estimating the fair value of the properties, the highest and best use of the properties is their current use. The fair value estimate of the Group’s investment properties is a Level 3 fair value measurement.
The following amounts have been recognized in the consolidated income statement:
|
| | | | | | | | | | | |
| | Year ended December 31, |
| | 2018 | | 2017 | | 2016 |
| | US$ in millions |
| Mall income | $ | 507 |
| | $ | 479 |
| | $ | 420 |
|
| Direct operating expenses arising from investment properties that generate right of use income | $ | 51 |
| | $ | 55 |
| | $ | 43 |
|
| Direct operating expenses that did not generate right of use income | $ | 5 |
| | $ | 2 |
| | $ | 1 |
|
| | | | | | |
| |
| 13. | PROPERTY AND EQUIPMENT, NET |
The movements of property and equipment for the year are as follows:
|
| | | | | | | | | | | | | | | | | | | | | | | | | | | | | | | | | | | |
| | Leasehold interests in land | | Land improvements | | Buildings and building improvements | | Leasehold improvements | | Vehicles | | Ferries | | Furniture, fittings & equipment | | Construction- in-progress | | Total |
| | US$ in millions |
| At January 1, 2017 | | | | | | | | | | | | | | | | | |
| Cost | $ | 584 |
| | $ | 338 |
| | $ | 8,485 |
| | $ | 8 |
| | $ | 40 |
| | $ | 251 |
| | $ | 1,644 |
| | $ | 132 |
| | $ | 11,482 |
|
| Accumulated depreciation | (97 | ) | | (123 | ) | | (1,924 | ) | | (7 | ) | | (28 | ) | | (104 | ) | | (1,088 | ) | | — |
| | (3,371 | ) |
| At January 1, 2017 | $ | 487 |
| | $ | 215 |
| | $ | 6,561 |
| | $ | 1 |
| | $ | 12 |
| | $ | 147 |
| | $ | 556 |
| | $ | 132 |
| | $ | 8,111 |
|
| Year ended December 31, 2017 | | | | | | | | | | | | | | | | | |
| Opening net book amount | $ | 487 |
| | $ | 215 |
| | $ | 6,561 |
| | $ | 1 |
| | $ | 12 |
| | $ | 147 |
| | $ | 556 |
| | $ | 132 |
| | $ | 8,111 |
|
| Additions | — |
| | 1 |
| | — |
| | 1 |
| | — |
| | — |
| | 52 |
| | 214 |
| | 268 |
|
| Adjustments arising from change in lease term of leasehold interests in land | 13 |
| | — |
| | — |
| | — |
| | — |
| | — |
| | — |
| | — |
| | 13 |
|
| Adjustments to project costs | (1 | ) | | 39 |
| | (40 | ) | | — |
| | — |
| | — |
| | (5 | ) | | 4 |
| | (3 | ) |
| Disposals | — |
| | (7 | ) | | (4 | ) | | — |
| | — |
| | — |
| | (4 | ) | | (10 | ) | | (25 | ) |
| Transfers | — |
| | 16 |
| | 147 |
| | — |
| | — |
| | — |
| | 82 |
| | (245 | ) | | — |
|
| Depreciation | (14 | ) | | (16 | ) | | (407 | ) | | (1 | ) | | (4 | ) | | (13 | ) | | (167 | ) | | — |
| | (622 | ) |
| Exchange difference | — |
| | (1 | ) | | (48 | ) | | — |
| | — |
| | — |
| | (4 | ) | | (2 | ) | | (55 | ) |
| Closing net book amount | $ | 485 |
| | $ | 247 |
| | $ | 6,209 |
| | $ | 1 |
| | $ | 8 |
| | $ | 134 |
| | $ | 510 |
| | $ | 93 |
| | $ | 7,687 |
|
| At December 31, 2017 | | | | | | | | | | | | | | | | | |
| Cost | $ | 596 |
| | $ | 381 |
| | $ | 8,510 |
| | $ | 7 |
| | $ | 40 |
| | $ | 251 |
| | $ | 1,724 |
| | $ | 93 |
| | $ | 11,602 |
|
| Accumulated depreciation | (111 | ) | | (134 | ) | | (2,301 | ) | | (6 | ) | | (32 | ) | | (117 | ) | | (1,214 | ) | | — |
| | (3,915 | ) |
| At December 31, 2017 | $ | 485 |
| | $ | 247 |
| | $ | 6,209 |
| | $ | 1 |
| | $ | 8 |
| | $ | 134 |
| | $ | 510 |
| | $ | 93 |
| | $ | 7,687 |
|
| Year ended December 31, 2018 | | | | | | | | | | | | | | | | | |
| Opening net book amount | $ | 485 |
| | $ | 247 |
| | $ | 6,209 |
| | $ | 1 |
| | $ | 8 |
| | $ | 134 |
| | $ | 510 |
| | $ | 93 |
| | $ | 7,687 |
|
| Additions | 10 |
| | 1 |
| | 2 |
| | — |
| | 3 |
| | — |
| | 98 |
| | 385 |
| | 499 |
|
| Adjustments to project costs | — |
| | — |
| | (5 | ) | | — |
| | — |
| | — |
| | 3 |
| | (6 | ) | | (8 | ) |
| Disposals | — |
| | (4 | ) | | (34 | ) | | — |
| | — |
| | — |
| | (4 | ) | | (1 | ) | | (43 | ) |
| Transfers | 69 |
| | 13 |
| | 725 |
| | — |
| | — |
| | — |
| | 114 |
| | (312 | ) | | 609 |
|
| Depreciation | (12 | ) | | (14 | ) | | (421 | ) | | — |
| | (4 | ) | | (12 | ) | | (135 | ) | | — |
| | (598 | ) |
| Exchange difference | — |
| | — |
| | (11 | ) | | — |
| | — |
| | — |
| | (1 | ) | | — |
| | (12 | ) |
| Closing net book amount | $ | 552 |
| | $ | 243 |
| | $ | 6,465 |
| | $ | 1 |
| | $ | 7 |
| | $ | 122 |
| | $ | 585 |
| | $ | 159 |
| | $ | 8,134 |
|
| At December 31, 2018 | | | | | | | | | | | | | | | | | |
| Cost | $ | 675 |
| | $ | 389 |
| | $ | 9,161 |
| | $ | 7 |
| | $ | 43 |
| | $ | 251 |
| | $ | 1,904 |
| | $ | 159 |
| | $ | 12,589 |
|
| Accumulated depreciation | (123 | ) | | (146 | ) | | (2,696 | ) | | (6 | ) | | (36 | ) | | (129 | ) | | (1,319 | ) | | — |
| | (4,455 | ) |
| At December 31, 2018 | $ | 552 |
| | $ | 243 |
| | $ | 6,465 |
| | $ | 1 |
| | $ | 7 |
| | $ | 122 |
| | $ | 585 |
| | $ | 159 |
| | $ | 8,134 |
|
| | | | | | | | | | | | | | | | | | |
Interest expense of US$4 million and US$2 million (Note 8) and other direct costs of US$23 million and US$13 million have been capitalized for the years ended December 31, 2018 and 2017, respectively.
The Group received land concessions from the Macao Government to build on the sites on which Sands Macao, The Venetian Macao, The Plaza Macao, Sands Cotai Central and The Parisian Macao are located. The Group does not own these land sites; however, the land concessions, which have an initial term of 25 years and are renewable at the Group’s option, in accordance with Macao laws, grant the Group exclusive use of the land. As specified in the land concessions, the Group is required to pay premiums for each parcel as well as annual rent for the term of the land concessions, which may be revised every five years by the Macao Government. The initial land lease premiums for all parcels have been fully paid. The finance lease obligations for land are disclosed in Note 26(a). We anticipate a useful life of 50 years related to these land concessions.
As at December 31, 2017, other than the land concession for Parcel 3, the Group’s rights arising from its land concessions were collateralized by a first-priority security for the Group’s indebtedness under the 2016 VML Credit Facility (see Note 24). In addition, the Group’s rights over the parcels of land were charged as security to a financial institution for issuing a bank guarantee to the Macao Government to guarantee the annual rent payments. As at December 31, 2018, there were no charges on the Group’s property and equipment.
Equipment includes the following amounts where the Group is the lessee under finance leases:
|
| | | | | | | |
| | December 31, |
| | 2018 | | 2017 |
| | US$ in millions |
| Cost | $ | 14 |
| | $ | 16 |
|
| Accumulated depreciation | (10 | ) | | (10 | ) |
| Net book amount | $ | 4 |
| | $ | 6 |
|
| | | | |
The Group leases various equipment under non-cancelable finance lease agreements. The lease terms are between three and five years and ownership of the assets resides with the Group.
| |
| 14. | FINANCIAL INSTRUMENTS BY CATEGORY |
|
| | | | | | | | |
| | | December 31, |
| | | 2018 | | 2017 |
| | Note | US$ in millions |
| Financial assets | | | | |
| Amortized cost: | | | | |
| Trade and other receivables, net | 17 | $ | 427 |
| | $ | 249 |
|
| Restricted cash and cash equivalents | 18 | 13 |
| | 11 |
|
| Cash and cash equivalents | 20 | 2,676 |
| | 1,239 |
|
| Deposits | | 3 |
| | 3 |
|
| FVTPL: | | | | |
| Interest rate swaps | 25 | 15 |
| | — |
|
| Total | | $ | 3,134 |
| | $ | 1,502 |
|
| | | | | |
|
| | | | | | | | |
| | | December 31, |
| | | 2018 | | 2017 |
| Financial liabilities | Note | US$ in millions |
| Amortized cost: | | | | |
| Trade and other payables | 23 | $ | 1,635 |
| | $ | 1,272 |
|
| Borrowings | 24 | 5,562 |
| | 4,412 |
|
| Total | | $ | 7,197 |
| | $ | 5,684 |
|
| | | | | |
| |
| 15. | INTANGIBLE ASSETS, NET |
|
| | | |
| | Computer software |
| | US$ in millions |
| At January 1, 2017 | |
| Cost | $ | 79 |
|
| Accumulated amortization | (44 | ) |
| At January 1, 2017 | $ | 35 |
|
| Year ended December 31, 2017 | |
| Opening net book amount | $ | 35 |
|
| Additions | 9 |
|
| Amortization | (10 | ) |
| Closing net book amount | $ | 34 |
|
| At December 31, 2017 | |
| Cost | $ | 88 |
|
| Accumulated amortization | (54 | ) |
| At December 31, 2017 | $ | 34 |
|
| Year ended December 31, 2018 | |
| Opening net book amount | $ | 34 |
|
| Additions | 24 |
|
| Amortization | (12 | ) |
| Closing net book amount | $ | 46 |
|
| At December 31, 2018 | |
| Cost | $ | 112 |
|
| Accumulated amortization | (66 | ) |
| At December 31, 2018 | $ | 46 |
|
| | |
| |
| 16. | DEFERRED INCOME TAX LIABILITIES |
Deferred tax assets and liabilities are offset when there is a legally enforceable right to set off and when the deferred income taxes relate to income taxes levied by the same taxation authority on either the taxable entity or different taxable entities where there is an intention to settle the balances on a net basis.
The movements of the deferred tax liabilities are as follows:
|
| | | | | | | | | | | |
| | Accelerated depreciation allowance | | Tax losses | | Total |
| | US$ in millions |
| At January 1, 2017 | $ | (68 | ) | | $ | 21 |
| | $ | (47 | ) |
| Credit/(charge) for the year | 5 |
| | (21 | ) | | (16 | ) |
| Currency translation differences | 1 |
| | — |
| | 1 |
|
| At December 31, 2017 | (62 | ) | | — |
| | (62 | ) |
| Credit for the year | 12 |
| | — |
| | 12 |
|
| At December 31, 2018 | $ | (50 | ) | | $ | — |
| | $ | (50 | ) |
| | | | | | |
Deferred tax assets are recognized for tax loss carryforwards to the extent realization of the related tax benefit through future taxable profits is probable. The unrecognized deferred income tax assets in respect of losses that can be carried forward against future taxable income and pre-opening expenses are as follows:
|
| | | | | | | |
| | December 31, |
| | 2018 | | 2017 |
| | US$ in millions |
| Arising from unused tax losses | $ | 270 |
| | $ | 263 |
|
| Arising from pre-opening expenses | 6 |
| | 9 |
|
| | $ | 276 |
| | $ | 272 |
|
| | | | |
As at December 31, 2018 and 2017, subject to the agreement by tax authorities, out of the total unrecognized tax losses of approximately US$2,210 million and US$2,140 million, respectively, an amount of approximately US$122 million and US$124 million, respectively, can be carried forward indefinitely. The remaining amount of approximately US$2,088 million and US$2,016 million for the years ended December 31, 2018 and 2017, respectively, will expire in one to three years.
| |
| 17. | TRADE AND OTHER RECEIVABLES AND PREPAYMENTS, NET |
|
| | | | | | | | |
| | | December 31, |
| | | 2018 | | 2017 |
| | Note | US$ in millions |
| Trade receivables | | $ | 461 |
| | $ | 348 |
|
| Less: provision for credit losses | | (94 | ) | | (111 | ) |
| Trade receivables, net | (a) | 367 |
| | 237 |
|
| Other receivables | | 60 |
| | 12 |
|
| Prepayments | | 56 |
| | 36 |
|
| Deferred rent | | 81 |
| | 77 |
|
| Less: amortization of deferred rent | | (46 | ) | | (43 | ) |
| provision for doubtful deferred rent | | (4 | ) | | (3 | ) |
| Prepayments, net | | 87 |
| | 67 |
|
| Trade and other receivables and prepayments, net | | 514 |
| | 316 |
|
| Less: non-current portion: | | | | |
| prepayments | | (18 | ) | | (4 | ) |
| deferred rent | | (19 | ) | | (19 | ) |
| | | (37 | ) | | (23 | ) |
| Current portion | | $ | 477 |
| | $ | 293 |
|
| | | | | |
As at January 1, 2017, trade receivables, net from contracts with customers amounted to US$297 million.
The trade and other receivables, net of provision for credit losses, are denominated in the following currencies:
|
| | | | | | | |
| | December 31, |
| | 2018 | | 2017 |
| | US$ in millions |
| HK$ | $ | 341 |
| | $ | 210 |
|
| MOP | 29 |
| | 37 |
|
| US$ | 57 |
| | 2 |
|
| | $ | 427 |
| | $ | 249 |
|
| | | | |
| |
| (a) | Trade receivables, net |
The aging analysis of trade receivables, net of provision for credit losses, is as follows:
|
| | | | | | | |
| | December 31, |
| | 2018 | | 2017 |
| | US$ in millions |
| 0 - 30 days | $ | 236 |
| | $ | 171 |
|
| 31 - 60 days | 39 |
| | 32 |
|
| 61 - 90 days | 28 |
| | 21 |
|
| Over 90 days | 64 |
| | 13 |
|
| | $ | 367 |
| | $ | 237 |
|
| | | | |
The carrying values of trade receivables approximate their fair values at each balance sheet date. The maximum exposure to credit risk is the fair values of trade receivables at each balance sheet date.
Trade receivables are comprised of casino, mall and hotel receivables. The Group extends credit to approved customers, tenants and gaming promoters following background checks and investigations of creditworthiness. Business or economic conditions, the legal enforceability of gaming debts, or other significant events in foreign countries could affect the collectability of receivables from customers and gaming promoters residing in these countries.
Trade receivables mainly consist of casino receivables. Credit is granted to certain gaming promoters on a revolving basis. All gaming promoter credit lines are generally subject to monthly review and regular settlement procedures to evaluate the current status of liquidity and financial health of these gaming promoters. Credit is granted based on the performance and financial background of the gaming promoter and, if applicable, the gaming promoter’s guarantor. Absent special approval, the credit period granted to selected premium and mass market players is typically 7–15 days, while for gaming promoters, the receivable is typically repayable within one month following the granting of the credit, subject to terms of the relevant credit agreement. The Group generally does not charge interest for credit granted, but requires a personal check or other acceptable forms of security.
The Group maintains an allowance for doubtful casino, mall and hotel receivables and regularly evaluates the balances. The Group specifically analyzes the collectability of each account with significant balance, based upon the age of the account, the customer’s financial
condition, collection history and any other known information, and the Group makes an allowance for trade receivables. The Group also monitors regional and global economic conditions and forecasts in its evaluation of the adequacy of the recorded allowances. Table games play is primarily cash play, as credit play represented approximately15.3%, 15.4% and 16.4% of total table games play for the years ended December 31, 2018, 2017 and 2016. The credit extended to gaming promoters can be offset by the commissions payable to and front money made by these gaming promoters, which is considered in the establishment of the allowance for doubtful accounts.
The Group currently has a legally enforceable right to offset the commissions payable and front money deposits against the casino receivables and intends to settle on a net basis. As at December 31, 2018 and 2017, a gross amount of casino receivables after provision for credit losses of US$442 million and US$298 million, respectively, was offset by commissions payable and front money deposits in an aggregate amount of US$191 million and US$148 million, respectively, resulting in net amounts of casino receivables after provision for credit losses of US$251 million and US$150 million, respectively.
There is a concentration of credit risk related to net casino receivables as 33.3% and 45.2% of the casino receivables as at December 31, 2018 and 2017, respectively, were from the top five customers. Other than casino receivables, there is no other concentration of credit risk with respect to trade receivables as the Group has a large number of customers. The Group believes the concentration of its credit risk in casino receivables is mitigated substantially by its credit evaluation process, credit policies, credit control and collection procedures, and also believes no significant credit risk is inherent in the Group’s trade receivables not provided for as at December 31, 2018, 2017 and 2016.
As at December 31, 2018, included in the Group’s trade receivables balance are debtors with aggregate carrying amount of US$247 million, which are past due as at the reporting date. The Directors of the Company are in the view there have been no significant increases in credit risk nor defaults because these relate to a number of independent customers that are either active and or have a good track record and established creditworthiness with the Group.
As at December 31, 2018, except for credit impaired balances and outstanding significant balances with gross amount of US$167 million that have been assessed individually, as part of the Group’s credit risk management, the Group uses debtors’ aging to assess the impairment for its customers because these remaining customers consist of a large number of small customers with common risk characteristics representative of the customers’ abilities to pay all amounts due in accordance with the contractual terms. The following table provides information about the exposure to credit risk for trade receivables which are assessed based on the provision matrix as at December 31, 2018, within lifetime ECL.
|
| | | | | | |
| | | | Trade receivables |
| | | | US$ in millions |
| Provision matrix - debtors’ aging | Average loss rate | | |
| Current (not past due) | — |
| | $ | 86 |
|
| Past due 1-90 days | 2% - 10% |
| | 102 |
|
| Past due 91-360 days | 15% - 25% |
| | 56 |
|
| Past due over 360 days | 50% - 100% |
| | 50 |
|
| | | | $ | 294 |
|
| | | | |
The estimated loss rates are estimated based on historical observed default rates over the expected life of the debtors and are adjusted for forward-looking information available without undue cost or effort. The grouping is regularly reviewed by management to ensure relevant information about specific debtors is updated.
The following table shows the movement in lifetime ECL that has been recognized for trade receivables under the simplified approach.
|
| | | |
| | Year ended |
| | December 31, 2018 |
| | US$ in millions |
| At beginning of year | $ | 111 |
|
| Provision for expected credit losses, net | 7 |
|
| Amounts written-off | (24 | ) |
| At end of year | $ | 94 |
|
| | |
Comparative information under IAS 39
As at December 31, 2017, net trade receivables of approximately US$74 million were past due but not impaired. These relate to a number of independent customers that have a good track record with the Group. Extension of the credit period, with terms and conditions subject to special approvals, has been granted to these customers. The aging analysis of these trade receivables that were past due but not impaired based on the original terms is as follows:
|
| | | |
| | Year ended |
| | December 31, 2017 |
| | US$ in millions |
| Past due 1 - 30 days | $ | 34 |
|
| Past due 31 - 60 days | 21 |
|
| Past due 61 - 90 days | 4 |
|
| Past due over 90 days | 15 |
|
| | $ | 74 |
|
| | |
As at December 31, 2017, trade receivables of US$136 million were past due and impaired and provided for. The amount of the provision was US$111 million as of December 31, 2017. The receivables mainly relate to casino customers, which are in unexpected difficult economic situations. It was assessed that a portion of the receivables is expected to be recovered and thus not impaired. The aging of these past due receivables is as follows:
|
| | | |
| | December 31, 2017 |
| | US$ in millions |
| Past due 1 - 30 days | $ | 1 |
|
| Past due 31 - 60 days | 14 |
|
| Past due 61 - 90 days | 6 |
|
| Past due over 90 days | 115 |
|
| | $ | 136 |
|
| | |
The Group maintains an allowance for doubtful accounts and regularly evaluates the balances.
Movements of provision of doubtful trade receivables for the year ended December 31, 2017 are as follows:
|
| | | |
| | December 31, 2017 |
| | US$ in millions |
| At beginning of year | $ | 169 |
|
| Provision for doubtful account, net | 1 |
|
| Amounts written-off | (58 | ) |
| Exchange difference | (1 | ) |
| At end of year | $ | 111 |
|
| | |
| |
| (b) | Other receivables and deferred rent |
The carrying values of other receivables approximate their fair values at each balance sheet date, which also represent the Group’s maximum exposure to credit risk as at December 31, 2018 and 2017. The Group holds security deposits, bank guarantees and letters of credit for certain other receivables and deferred rent. Impairment charges of US$2 million and US$3 million related to deferred rent were recorded for the years ended December 31, 2018 and 2017, respectively, and included in “Other expenses and losses” in the consolidated income statement. Amounts are charged to the provision account and generally written off when the recoverability is remote.
| |
| 18. | RESTRICTED CASH AND CASH EQUIVALENTS |
|
| | | | | | | |
| | December 31, |
| | 2018 | | 2017 |
| | US$ in millions |
| Cash at bank | $ | 2 |
| | $ | 2 |
|
| Short-term bank deposit | 11 |
| | 9 |
|
| | $ | 13 |
| | $ | 11 |
|
| | | | |
Restricted cash and cash equivalents represent sinking funds set aside to cover the cost of capital expenses, including repairs, renovations, replacements and maintenance of a substantial but infrequent or irregular nature of the Group’s shopping malls. The restricted cash and cash equivalents are denominated in MOP as at December 31, 2018 and 2017.
As at December 31, 2018 and 2017, the effective interest rate on the short-term bank deposit is 1.9% and 0.8%, respectively. The deposit has a maturity of 88 days and 89 days, respectively.
The maximum exposure to credit risk is the carrying amount of restricted cash and cash equivalents at each balance sheet date.
|
| | | | | | | |
| | December 31, |
| | 2018 | | 2017 |
| | US$ in millions |
| Food and beverage | $ | 9 |
| | $ | 8 |
|
| Retail products | 2 |
| | 3 |
|
| Ferry parts | 1 |
| | 2 |
|
| General operating supplies and other | 2 |
| | 2 |
|
| | $ | 14 |
| | $ | 15 |
|
| | | | |
As at December 31, 2018 and 2017, all inventories were carried at cost.
| |
| 20. | CASH AND CASH EQUIVALENTS |
|
| | | | | | | |
| | December 31, |
| | 2018 | | 2017 |
| | US$ in millions |
| Cash at bank and on hand | $ | 503 |
| | $ | 512 |
|
| Short-term bank deposits | 2,173 |
| | 727 |
|
| | $ | 2,676 |
| | $ | 1,239 |
|
| | | | |
The cash and cash equivalents are denominated in the following currencies:
|
| | | | | | | |
| | December 31, |
| | 2018 | | 2017 |
| | US$ in millions |
| HK$ | $ | 1,497 |
| | $ | 1,134 |
|
| US$ | 1,066 |
| | 18 |
|
| MOP | 82 |
| | 69 |
|
| Japanese Yen | 13 |
| | 6 |
|
| Singapore dollar | 10 |
| | 6 |
|
| RMB | 8 |
| | 6 |
|
| | $ | 2,676 |
| | $ | 1,239 |
|
| | | | |
As at December 31, 2018 and 2017, the effective interest rates on short-term bank deposits ranged from 1.4% to 3.1% and 0.5% to 1.5%, respectively, per annum. These deposits have maturities ranging from 8 to 88 days and 11 to 62 days, respectively.
The carrying values of cash equivalents are their fair values as at December 31, 2018 and 2017.
The maximum credit exposure of cash and cash equivalents of the Group as at December 31, 2018 and 2017 amounted to US$2,494 million and US$1,011 million, respectively.
|
| | | | | | |
| | Ordinary shares of US$0.01 each | | US$ in millions |
| Authorized | | | |
At January 1, 2016, December 31, 2016,
December 31, 2017 and December 31, 2018 | 16,000,000,000 |
| | $ | 160 |
|
| Issued and fully paid: | | | |
| At January 1, 2016 | 8,069,300,845 |
| | $ | 81 |
|
| Shares issued upon exercise of share options | 1,829,400 |
| | — |
|
| At December 31, 2016 | 8,071,130,245 |
| | 81 |
|
| Shares issued upon exercise of share options | 3,287,521 |
| | — |
|
| At December 31, 2017 | 8,074,417,766 |
| | 81 |
|
| Shares issued upon exercise of share options | 6,185,925 |
| | — |
|
| At December 31, 2018 | 8,080,603,691 |
| | $ | 81 |
|
| | | | |
The amount of the Group’s reserves and the movements therein for the current and prior years are set out in the consolidated statement of changes in equity.
The capital reserve represents the combined share premium of Venetian Venture Development Intermediate Limited (“VVDIL”) and Cotai Services (HK) Limited.
The statutory reserve represents amounts set aside from the income statement that are not distributable to Shareholders/quotaholders of the group companies incorporated.
The Macao Commercial Code #432 requires that companies incorporated in Macao that are limited by shares should set aside a minimum of 10% of the company’s profit after taxation to the statutory reserve until the balance of the reserve reaches a level equivalent to 25% of the company’s capital.
For companies incorporated in Macao that are limited by quotas, the Macao Commercial Code #377 requires that a company should set aside a minimum of 25% of the company’s profit after taxation to the statutory reserve until the balance of the reserve reaches a level equivalent to 50% of the company’s capital.
| |
| 23. | TRADE AND OTHER PAYABLES |
|
| | | | | | | | |
| | | December 31, |
| | | 2018 | | 2017 |
| | Note | US$ in millions |
| Trade payables | | $ | 33 |
| | $ | 40 |
|
| Outstanding chip liability | 4 | 514 |
| | 418 |
|
| Customer deposits and other deferred revenue | 4 | 497 |
| | 424 |
|
| Other tax payables | | 325 |
| | 286 |
|
| Accrued employee benefit expenses | | 155 |
| | 137 |
|
| Construction payables and accruals | | 147 |
| | 111 |
|
| Interest payables | | 125 |
| | 5 |
|
| Casino liabilities | | 67 |
| | 50 |
|
| Loyalty program liability | 4 | 33 |
| | 30 |
|
| Payables to related companies - non-trade | 29(b) | 9 |
| | 5 |
|
| Other payables and accruals | | 127 |
| | 123 |
|
| | | 2,032 |
| | 1,629 |
|
| Less: non-current portion | | (104 | ) | | (92 | ) |
| Current portion | | $ | 1,928 |
| | $ | 1,537 |
|
| | | | | |
____________________
Note: The prior year presentation has been adjusted for the adoption of IFRS 15, Revenue from Contracts with Customers, and conformed to the current year presentation.
The monetary trade and other payables are denominated in the following currencies:
|
| | | | | | | |
| | December 31, |
| | 2018 | | 2017 |
| | US$ in millions |
| HK$ | $ | 997 |
| | $ | 805 |
|
| MOP | 483 |
| | 435 |
|
| US$ | 145 |
| | 30 |
|
| Other currencies | 10 |
| | 2 |
|
| | $ | 1,635 |
| | $ | 1,272 |
|
| | | | |
The aging analysis of trade payables based on invoice date is as follows:
|
| | | | | | | |
| | December 31, |
| | 2018 | | 2017 |
| | US$ in millions |
| 0-30 days | $ | 27 |
| | $ | 29 |
|
| 31-60 days | 3 |
| | 5 |
|
| 61-90 days | 2 |
| | 3 |
|
| Over 90 days | 1 |
| | 3 |
|
| | $ | 33 |
| | $ | 40 |
|
| | | | |
|
| | | | | | | | |
| | | December 31, |
| | | 2018 | | 2017 |
| | Note | US$ in millions |
| Non-current portion | | | | |
| Senior Notes, unsecured | | $ | 5,515 |
| | $ | — |
|
| Bank loans, secured | | — |
| | 4,301 |
|
| Finance lease liabilities on leasehold interests in land, secured | 26 | 122 |
| | 127 |
|
| Other finance lease liabilities, secured | 26 | 3 |
| | 3 |
|
| | | 5,640 |
| | 4,431 |
|
| Less: deferred financing costs | | (88 | ) | | (73 | ) |
| | | 5,552 |
| | 4,358 |
|
| Current portion | | | | |
| Bank loans, secured | | — |
| | 47 |
|
| Finance lease liabilities on leasehold interests in land, secured | 26 | 8 |
| | 5 |
|
| Other finance lease liabilities, secured | 26 | 2 |
| | 2 |
|
| | | 10 |
| | 54 |
|
| Total borrowings | | $ | 5,562 |
| | $ | 4,412 |
|
| | | | | |
The Group’s borrowings are denominated in the following currencies:
|
| | | | | | | |
| | December 31, |
| | 2018 | | 2017 |
| | US$ in millions |
| HK$ | $ | — |
| | $ | 1,944 |
|
| US$ | 5,427 |
| | 1,696 |
|
| MOP | 135 |
| | 772 |
|
| | $ | 5,562 |
| | $ | 4,412 |
|
| | | | |
The contractual maturities of bank loans are as follows:
|
| | | | | | | |
| | December 31, |
| | 2018 | | 2017 |
| | US$ in millions |
| Repayable within 1 year | $ | — |
| | $ | 47 |
|
| Repayable over 1 year but not exceeding 2 years | — |
| | 110 |
|
| Repayable over 2 years but not exceeding 5 years | — |
| | 4,191 |
|
| | $ | — |
| | $ | 4,348 |
|
| | | | |
The estimated fair value of the Group’s bank loans as at December 31, 2017 was approximately US$4.30 billion.
The contractual maturities of Senior Notes are as follows:
|
| | | | | | | |
| | December 31, |
| | 2018 | | 2017 |
| | US$ in millions |
| Repayable over 2 years but not exceeding 5 years | $ | 1,800 |
| | $ | — |
|
| Repayable over 5 years | 3,700 |
| | — |
|
| | 5,500 |
| | — |
|
| Fair value adjustment of the interest rate swaps | 15 |
| | — |
|
| | $ | 5,515 |
| | $ | — |
|
| | | | |
The estimated fair value of the Group’s Senior Notes as at December 31, 2018 was approximately US$5.52 billion.
Senior Notes
On August 9, 2018, the Company issued three series of senior unsecured notes in an aggregate principal amount of US$5.50 billion, consisting of US$1.80 billion of 4.600% senior notes due August 8, 2023 (the “2023 Notes”), US$1.80 billion of 5.125% senior notes due August 8, 2025 (the “2025 Notes”) and US$1.90 billion of 5.400% senior notes due August 8, 2028 (the “2028 Notes” and, together with the 2023 Notes and the 2025 Notes, the “Senior Notes”). A portion of the net proceeds from the issuance was used to repay in full the outstanding borrowings under the 2016 VML Credit Facility (defined below). There are no interim principal payments on the Senior Notes and interest is payable semi-annually in arrears on each February 8 and August 8, commencing on February 8, 2019. In connection with the Senior Notes, the Company entered into fixed-to-variable interest rate swap contracts (see Note 25).
The Senior Notes are general senior obligations. Each series of Senior Notes rank equally in right of payment with all of the Company’s existing and future senior unsecured debt and rank senior in right of payment to all of the Company’s future subordinated debt, if any. The Senior Notes are effectively subordinated in right of payment to all of the Company’s future secured debt (to the extent of the value of the collateral securing such debt) and are structurally subordinated to all of the liabilities of the Company’s subsidiaries. None of the Company’s subsidiaries guarantee the Senior Notes.
The Senior Notes were issued pursuant to an indenture, dated August 9, 2018 (the “Indenture”), between the Company and U.S. Bank National Association, as trustee. Upon the occurrence of certain events described in the Indenture, the interest rate on the Senior Notes may be adjusted. The Indenture contains covenants, subject to customary exceptions and qualifications, that limit the ability of the Company and its subsidiaries to, among other things, incur liens, enter into sale and leaseback transactions and consolidate, merge, sell or otherwise dispose of all or substantially all of the Company’s assets on a consolidated basis. The Indenture also provides for customary events of default.
2018 SCL Credit Facility
On November 20, 2018, the Company as borrower, entered into a facility agreement with the arrangers and lenders named therein and Bank of China Limited, Macau Branch, as agent for the lenders, pursuant to which the lenders made available a US$2.0 billion revolving unsecured credit facility to the Company (the “2018 SCL Revolving Facility”). The facility is available until July 31, 2023, and the Company may draw loans under the facility, which may consist of general revolving loans (consisting of a United States dollar component and a Hong Kong dollar component) or loans drawn under a swing-line loan sub-facility (denominated in either United States dollars or Hong Kong dollars). The Company may utilize the loans for general corporate purposes and working capital requirements of the Company and its subsidiaries.
Loans under the 2018 SCL Revolving Facility bear interest calculated by reference to (1) in the case of general revolving loans denominated in United States dollars, the London Interbank Offered Rate (“LIBOR”), (2) in the case of loans denominated in United States dollars drawn under the swing-line loan sub-facility, a United States dollar alternate base rate (determined by reference to, among other things, the United States dollar prime lending rate and the Federal Funds Effective Rate), (3) in the case of general revolving loans denominated in Hong Kong dollars, the Hong Kong Interbank Offered Rate (“HIBOR”) or (4) in the case of loans denominated in Hong Kong dollars drawn under the swing-line loan sub-facility, a Hong Kong dollar alternate base rate (determined by reference to, among other things, the Hong Kong dollar prime lending rate), in each case, plus a margin determined by reference to the consolidated leverage ratio. The initial margin for general revolving loans is 2.0% per annum and the initial margin for loans drawn under the swing-line loan sub-facility is 1.0% per annum. The Company is also required to pay a commitment fee of 0.60% per annum on the undrawn amounts under the 2018 SCL Revolving Facility. As at December 31, 2018, the Company had US$2.0 billion of available borrowing capacity under the 2018 SCL Revolving Facility.
The 2018 SCL Credit Facility contains affirmative and negative covenants customary for similar unsecured financings, including, but not limited to, limitations on indebtedness secured by liens on principal properties and sale and leaseback transactions. The 2018 SCL Credit Facility also requires the Company to maintain a maximum ratio of total indebtedness to trailing twelve-month adjusted earnings before interest, income taxes, depreciation and amortization, as defined in the 2018 SCL Credit Facility (the “SCL Credit Facility Adjusted EBITDA”) of 4.00 to 1.00 throughout the life of the facility, and a minimum ratio of the SCL Credit Facility Adjusted EBITDA to net interest expense (including capitalized interest) of 2.50 to 1.00 throughout the life of the facility.
The 2018 SCL Credit Facility also contains certain events of default (some of which are subject to grace and remedy periods and materiality qualifiers), including, but not limited to, events relating to the Company’s gaming operations and the loss or termination of certain land concession contracts.
2016 VML Credit Facility
Two subsidiaries of the Group, VML US Finance LLC (the “Borrower”), and Venetian Macau Limited (“VML”), as guarantor, entered into a credit agreement (the “2016 VML Credit Facility”), which pursuant to various amendments, provided for a US$4.12 billion term loan (the “2016 VML Term Loans”), a US$269 million non-extended term loan (the “2016 Non-Extended VML Term Loans”), and a US$2.0 billion revolving facility (the “2016 VML Revolving Facility,” and together with the 2016 VML Term Loans and the 2016 Non-Extended VML Term Loans, the “2016 VML Credit Facility”). Borrowings under the 2016 VML Term Loans were used for working capital requirements and general corporate purposes, including to make any investment or payment not specifically prohibited by the terms of the loan documents.
The Company paid standby fees of 0.5% per annum on the undrawn amounts under the 2016 VML Revolving Facility. The weighted average interest rate on the 2016 VML Credit Facility was 3.1%, 2.6% and 2.1% for the years ended December 31, 2018, 2017 and 2016, respectively.
As previously described, a portion of the proceeds from the Senior Notes was used to repay the outstanding borrowings under the 2016 VML Credit Facility. As a result, the Company recorded a US$72 million loss on early retirement of debt during the year ended December 31, 2018.
On November 20, 2018, the 2016 VML Credit Facility was terminated with effect as of November 21, 2018. As a result, the Company recorded a US$9 million loss on early retirement of debt during the year ended December 31, 2018.
Reconciliation of liabilities arising from financing activities
The table below details changes in the Group’s liabilities arising from financing activities, including both cash and non- cash changes. Liabilities arising from financing activities are those for which cash flows were, or future cash flows will be, classified in the Group’s consolidated statement of cash flows as cash flows from financing activities.
|
| | | | | | | | | | | | | | | | | | | | | | | | | | | | | | | | | | | |
| | | | | | Non-cash changes | | |
| | Balance at January 1, 2018 | | Financing cash flows(i) | | Accruals | | Amortization | | Foreign exchange movement | | Adjustment arising from adoption of IFRS 9 | | Loss on modification or early retirement of debt | | Fair value adjustment of the interest rate swaps | | Balance at December 31, 2018 |
| | US$ in millions |
| Senior notes | $ | — |
| | $ | 5,500 |
| | $ | — |
| | $ | — |
| | $ | — |
| | $ | — |
| | $ | — |
| | $ | 15 |
| | $ | 5,515 |
|
| Bank loans | 4,348 |
| | (4,337 | ) | | — |
| | — |
| | (11 | ) | | — |
| | — |
| | — |
| | — |
|
| Finance lease liabilities on leasehold interests in land | 132 |
| | (13 | ) | | 11 |
| | — |
| | — |
| | — |
| | — |
| | — |
| | 130 |
|
| Other finance lease liabilities | 5 |
| | (2 | ) | | 2 |
| | — |
| | — |
| | — |
| | — |
| | — |
| | 5 |
|
| Deferred financing costs | (73 | ) | | (90 | ) | | (2 | ) | | 22 |
| | — |
| | (24 | ) | | 79 |
| | — |
| | (88 | ) |
| Interest payables | 5 |
| | (128 | ) | | 248 |
| | — |
| | — |
| | — |
| | — |
| | — |
| | 125 |
|
| Dividend payables | — |
| | (2,052 | ) | | 2,053 |
| | — |
| | (1 | ) | | — |
| | — |
| | — |
| | — |
|
| | $ | 4,417 |
| | $ | (1,122 | ) | | $ | 2,312 |
| | $ | 22 |
| | $ | (12 | ) | | $ | (24 | ) | | $ | 79 |
| | $ | 15 |
| | $ | 5,687 |
|
| | | | | | | | | | | | | | | | | | |
|
| | | | | | | | | | | | | | | | | | | | | | | | | | | | | | | |
| | | | | | Non-cash changes | | |
| | Balance at January 1, 2017 | | Financing cash flows(i) | | Accruals | | Amortization | | Foreign exchange movement | | True-up adjustment | | Adjustment arising from change in lease term of leasehold interests in land | | Balance at December 31, 2017 |
| | US$ in millions |
| Bank loans | $ | 4,388 |
| | $ | (19 | ) | | $ | — |
| | $ | — |
| | $ | (21 | ) | | $ | — |
| | $ | — |
| | $ | 4,348 |
|
| Finance lease liabilities on leasehold interests in land | 72 |
| | (2 | ) | | — |
| | — |
| | — |
| | (1 | ) | | 63 |
| | 132 |
|
| Other finance lease liabilities | 8 |
| | (3 | ) | | — |
| | — |
| | — |
| | — |
| | — |
| | 5 |
|
| Deferred financing costs | (94 | ) | | — |
| | — |
| | 21 |
| | — |
| | — |
| | — |
| | (73 | ) |
| Interest payables | 47 |
| | (128 | ) | | 134 |
| | — |
| | — |
| | — |
| | (48 | ) | | 5 |
|
| Dividend payables | — |
| | (2,067 | ) | | 2,069 |
| | — |
| | (2 | ) | | — |
| | — |
| | — |
|
| | $ | 4,421 |
| | $ | (2,219 | ) | | $ | 2,203 |
| | $ | 21 |
| | $ | (23 | ) | | $ | (1 | ) | | $ | 15 |
| | $ | 4,417 |
|
| | | | | | | | | | | | | | | | |
____________________
| |
| (i) | The cash flows from bank loans make up the net amount of proceeds from bank loans and repayments of bank loans in the statement of cash flows. |
| |
| 25. | DERIVATIVE FINANCIAL INSTRUMENTS |
Accounting standards require an entity to recognize all derivatives as either assets or liabilities in the balance sheet and measure those instruments at fair value. If specific conditions are met, a derivative may be designated as a hedge of specific financial exposures. The accounting for changes in fair value of a derivative depends on the intended use of the derivative and, if used in hedging activities, on its effectiveness as a hedge. In order to qualify for hedge accounting, the underlying hedged item must expose the Company to risks associated with market fluctuations and the financial instrument used must be designated as a hedge and must reduce the Company's exposure to market fluctuation throughout the hedge period.
Changes in market rates and prices, such as interest rates, foreign currency exchange rates and commodity prices, can impact the Company’s results of operations. The Company’s primary exposures to market risk are interest rate risk associated with long-term debt and foreign currency exchange rate risk associated with the Company’s operations. The Company has a policy aimed at managing interest rate risk associated with its current and anticipated future borrowings and foreign currency exchange rate risk associated with operations of its foreign subsidiaries. This policy enables the Company to use any combination of interest rate swaps, futures, options, caps, forward contracts and similar instruments. The Company does not hold or issue financial instruments for trading purposes and does not enter into derivative transactions that would be considered speculative positions.
In August 2018, the Company entered into interest rate swap agreements (the “IR Swaps”), which qualified and were designated as fair value hedges, swapping fixed-rate for variable-rate interest to hedge changes in the fair value of interest payments. These IR Swaps have a total notional value of US$5.50 billion and expire in August 2020.
The total fair value of the IR Swaps as of December 31, 2018, was US$56 million. In the accompanying consolidated balance sheets, US$15 million was recorded as an asset in “Trade and other receivables and prepayments, net” with an equal corresponding adjustment recorded against the carrying value of the Senior Notes. The realized portion of IR Swaps of US$41 million was recorded as interest receivables in “Trade and other receivables and prepayments, net”. The fair value of the IR Swaps was estimated using level 2 inputs from recently reported market forecasts of interest rates. Gains and losses due to changes in fair value of the IR Swaps completely offset changes in the fair value of the hedged portion of the underlying debt; therefore, no gain or loss has been recognized due to hedge ineffectiveness. Additionally, for the year ended December 31, 2018, the Company recorded US$9 million as a reduction to interest expense related to the realized amount associated with the IR Swaps.
| |
| 26. | FINANCE LEASE LIABILITIES |
The Group is a lessee under finance leases for land and equipment.
Lease liabilities are effectively secured as the rights of the leased assets will revert to the lessor in the event of default.
| |
| (a) | The future minimum lease payments (including interest) and the present value of the minimum lease payments under finance lease obligations for land are as follows: |
|
| | | | | | | |
| | December 31, |
| | 2018 | | 2017 |
| | US$ in millions |
| Minimum finance lease payments: | | | |
| No later than 1 year | $ | 8 |
| | $ | 5 |
|
| Later than 1 year and no later than 2 years | 5 |
| | 5 |
|
| Later than 2 years and no later than 5 years | 16 |
| | 16 |
|
| Later than 5 years | 312 |
| | 318 |
|
| | 341 |
| | 344 |
|
| Future finance charges on finance lease obligations | (211 | ) | | (212 | ) |
| Present value of finance lease liabilities | $ | 130 |
| | $ | 132 |
|
| Present value of minimum finance lease payments: | | | |
| No later than 1 year | $ | 8 |
| | $ | 5 |
|
| Later than 1 year and no later than 2 years | 5 |
| | 5 |
|
| Later than 2 years and no later than 5 years | 12 |
| | 13 |
|
| Later than 5 years | 105 |
| | 109 |
|
| | $ | 130 |
| | $ | 132 |
|
| | | | |
| |
| (b) | The future minimum lease payments (including interest) and the present value of the minimum lease payments under finance lease obligations for equipment are as follows: |
|
| | | | | | | |
| | December 31, |
| | 2018 | | 2017 |
| | US$ in millions |
| Minimum finance lease payments: | | | |
| No later than 1 year | $ | 2 |
| | $ | 2 |
|
| Later than 1 year and no later than 2 years | 2 |
| | 1 |
|
| Later than 2 years and no later than 5 years | 1 |
| | 2 |
|
| | $ | 5 |
| | $ | 5 |
|
| Present value of minimum finance lease payments: | | | |
| No later than 1 year | $ | 2 |
| | $ | 2 |
|
| Later than 1 year and no later than 2 years | 2 |
| | 1 |
|
| Later than 2 years and no later than 5 years | 1 |
| | 2 |
|
| | $ | 5 |
| | $ | 5 |
|
| | | | |
| |
| 27. | NOTE TO CONSOLIDATED STATEMENT OF CASH FLOWS |
Cash generated from operations is as follows:
|
| | | | | | | | | | | |
| | Year ended December 31, |
| | 2018 | | 2017 | | 2016 |
| | US$ in millions |
| Profit before income tax | $ | 1,868 |
| | $ | 1,625 |
| | $ | 1,268 |
|
| Adjustments for: | | | | | |
| Interest income | (20 | ) | | (5 | ) | | (3 | ) |
| Interest and other finance costs | 203 |
| | 132 |
| | 65 |
|
| Depreciation and amortization | 655 |
| | 676 |
| | 611 |
|
| Amortization of deferred financing costs | 22 |
| | 21 |
| | 21 |
|
| Amortization of deferred rent | 15 |
| | 15 |
| | 10 |
|
| Amortization of other assets | 3 |
| | 3 |
| | 3 |
|
| Loss on disposal of property and equipment, investment properties and intangible assets | 131 |
| | 12 |
| | 12 |
|
| Loss on modification or early retirement of debt | 81 |
| | — |
| | 1 |
|
| Provision for expected credit losses, net | 9 |
| | — |
| | — |
|
| Provision for doubtful accounts, net | — |
| | 4 |
| | 18 |
|
| Share-based compensation, net of amount capitalized | 13 |
| | 12 |
| | 14 |
|
| Net foreign exchange (gains)/losses | (5 | ) | | 11 |
| | 1 |
|
| Changes in working capital: | | | | | |
| Other assets | (1 | ) | | (1 | ) | | (8 | ) |
| Inventories | 1 |
| | (1 | ) | | (2 | ) |
| Trade and other receivables and prepayments | (180 | ) | | 37 |
| | 120 |
|
| Trade and other payables | 260 |
| | 91 |
| | 221 |
|
| Cash generated from operations | $ | 3,055 |
| | $ | 2,632 |
| | $ | 2,352 |
|
| |
| 28. | OPERATING LEASE ARRANGEMENTS, COMMITMENTS AND CONTINGENCIES |
| |
| (a) | Operating lease arrangements |
| |
| (i) | The Group as the lessee |
The Group had future aggregate minimum lease payments under non-cancelable operating leases for property and equipment as follows:
|
| | | | | | | |
| | December 31, |
| | 2018 | | 2017 |
| | US$ in millions |
| No later than 1 year | $ | 5 |
| | $ | 4 |
|
| Later than 1 year and no later than 5 years | 2 |
| | 2 |
|
| | $ | 7 |
| | $ | 6 |
|
| | | | |
| |
| (ii) | The Group as the lessor/grantor of the right of use |
The future aggregate minimum lease/base fee receivables under non-cancelable agreements are as follows:
|
| | | | | | | |
| | December 31, |
| | 2018 | | 2017 |
| | US$ in millions |
| No later than 1 year | $ | 331 |
| | $ | 344 |
|
| Later than 1 year and no later than 5 years | 602 |
| | 727 |
|
| Later than 5 years | 59 |
| | 52 |
|
| | $ | 992 |
| | $ | 1,123 |
|
| | | | |
Turnover fees earned during the years ended December 31, 2018, 2017 and 2016 were US$64 million, US$28 million and US$18 million, respectively.
Property and equipment commitments not provided for are as follows:
|
| | | | | | | |
| | December 31, |
| | 2018 | | 2017 |
| | US$ in millions |
| Contracted but not provided for | $ | 507 |
| | $ | 201 |
|
| | | | |
The Group has contingent liabilities arising in the ordinary course of business. Management has made estimates for potential litigation costs based upon consultation with legal counsel. Actual results could differ from these estimates; however, in the opinion of management, such litigation and claims will not have a material adverse effect on the Group’s financial condition, results of operations or cash flows.
| |
| (d) | Concession and Subconcession |
On June 26, 2002, the Macao Government granted a concession to operate casinos in Macao through June 26, 2022, subject to certain qualifications, to Galaxy, a consortium of Macao and Hong Kong-based investors. During December 2002, VML and Galaxy entered into a subconcession agreement that was recognized and approved by the Macao Government and allows VML to develop and operate casino projects, including The Venetian Macao, Sands Cotai Central, The Parisian Macao, The Plaza Macao and Sands Macao, separately from Galaxy. Beginning on December 26, 2017, the Macao Government may redeem the subconcession agreement by providing the Group at least one year’s prior notice. The subconcession of VML will expire on June 26, 2022.
Under the subconcession, the Group is obligated to pay to the Macao Government an annual premium with a fixed portion and a variable portion based on the number and type of gaming tables it employs and gaming machines it operates. The fixed portion of the premium is equal to MOP30 million (approximately US$4 million at the exchange rate in effect on December 31, 2018). The variable portion is equal to MOP300,000 per gaming table reserved exclusively for certain kinds of games or players, MOP150,000 per gaming table not so reserved and MOP1,000 per electrical or mechanical gaming machine, including slot machines (approximately US$37,195, US$18,598 and US$124, respectively, at the exchange rate in effect on December 31, 2018), subject to a minimum of MOP45 million (approximately US$6 million at the exchange rate in effect on December 31, 2018). The Group is also obligated to pay a special gaming tax of 35% of gross gaming revenues and applicable withholding taxes. The Group must also contribute 4% of its gross gaming revenue to utilities designated by the Macao Government, a portion of which must be used for promotion of tourism in Macao. Based on the number and types of gaming tables employed and gaming machines in operation as at December 31, 2018, the Group was obligated under its subconcession to make minimum future payments of approximately US$42 million in each of the next three years in the period ending December 31, 2021, and approximately US$21 million during the year ending December 31, 2022. Based on the number and types of gaming tables employed and gaming machines in operation as at December 31, 2017, the Group was obligated under its subconcession to make minimum future payments of approximately US$41 million in each of the four years in the period ending December 31, 2021, and approximately US$21 million during the year ending December 31, 2022.
The Group, in the past, has utilized an imported construction labor quota granted to it and its appointed construction manager, Hsin Chong Engineering (Macau) Limited, by the Human Resources Office of the Macao Government for purposes of completing outstanding areas within Sands Cotai Central and The Parisian Macao project and for additions and alterations work in The Venetian Macao, The Plaza Macao and Sands Cotai Central (the “Old Group Quota”). Following the completion of The Parisian Macao project, the Old Group Quota was held exclusively by the Group. The Old Group Quota was set to expire on December 31, 2018. In December 2018, the Group applied to the Labor Affairs Office of the Macao Government for the renewal of the Old Group Quota as well as for the granting of an additional imported construction labor quota (the “New Group Quota,” and together with the “Old Group Quota,” the “Group Quota”), which were approved and granted in January 2019. The Group retained a new construction management company, BCA (Macau) Limited, to manage the Group Quota in future development works on behalf of, and as directed by the Group with the Group’s contractors and consultants.
The Group Quota covers the importation of overseas staff and workers that represents only part of the imported staff and labor required to complete the construction work. The remainder of the imported staff and labor are covered by separate quotas awarded by the Labor Affairs Office of the Macao Government directly to the various construction companies contracted by the Group for the construction work, including BCA (Macau) Limited (the “Contractor Quota”).
The Group is primarily liable for all employer costs associated with persons employed under the Group Quota. In the past, such employees were managed and supervised by the Group’s contractors. The contractors utilizing the Group Quota are contractually obligated to pay all employer costs and to indemnify the Group for any costs they may incur as a result of the persons employed. In addition, the Group has the right of recovering the costs they may incur against any amounts due to the contractors. The Group, however, may still have a contingency for the payments to the construction labor if the contractors fail to pay the salaries and the Group is unable to fully recover the amounts due to the construction labor from the contractors. Up to December 31, 2018, the Group continued to employ imported staff and labor under the Old Group Quota. Upon the approval and grant of the Group Quota in January 2019, the Group employs imported staff and labor under the Group Quota.
The Group is not directly liable for employer costs associated with staff and labor imported by contractors under the Contractor Quota.
| |
| 29. | RELATED PARTY TRANSACTIONS |
For the purposes of these consolidated financial statements, parties are considered to be related to the Group if the party has the ability, directly or indirectly, to exercise significant influence over the Group in making financial and operating decisions, or vice versa. Related parties may be individuals (being members of key management personnel, significant Shareholders and/or their close family members) or other entities, and include entities which are under the significant influence of related parties of the Group where those parties are individuals. The Group’s immediate holding company is VVDI (II). LVS is the Group’s ultimate holding company. Related companies represent the group companies of the LVS Group.
Save as disclosed elsewhere in the consolidated financial statements, the Group had the following transactions with related parties during the year:
| |
| (a) | Transactions during the year |
|
| | | | | | | | | | | |
| | Year ended December 31, |
| | 2018 | | 2017 | | 2016 |
| | US$ in millions |
| LVS | $ | 1 |
| | $ | 1 |
| | $ | 1 |
|
| Intermediate holding companies | — |
| | 1 |
| | 2 |
|
| Fellow subsidiaries | 4 |
| | 3 |
| | 3 |
|
| | $ | 5 |
| | $ | 5 |
| | $ | 6 |
|
| | | | | | |
Management services are provided by the Group to LVS Group companies. These services include, but are not limited to, accounting services, information technology support, sourcing of goods and services, and design, development and construction consultancy services. Management fees are charged at actual costs incurred or on a cost-plus basis.
| |
| (ii) | Management fee expense |
|
| | | | | | | | | | | |
| | Year ended December 31, |
| | 2018 | | 2017 | | 2016 |
| | US$ in millions |
| LVS | $ | 20 |
| | $ | 14 |
| | $ | 16 |
|
| Fellow subsidiaries | 7 |
| | 6 |
| | 10 |
|
| | $ | 27 |
| | $ | 20 |
| | $ | 26 |
|
| | | | | | |
Management services are provided by LVS Group companies. These services include, but are not limited to, human resources support, accounting services, sourcing of goods and services, sourcing of tenants for the malls, transportation services, other various types of marketing and promotion activities for the Group, and design, development and construction consultancy services. Management fees are charged at actual costs incurred or on a cost-plus basis.
Management fee expense disclosed below can be reconciled to the management fees as disclosed in Note 5(a), Note 5(b) and Note 7(a)(i) as follows:
|
| | | | | | | | | | | | |
| | | Year ended December 31, |
| | | 2018 | | 2017 | | 2016 |
| | Note | US$ in millions |
| Total management fees disclosed in “Related party transactions” | | $ | 27 |
| | $ | 20 |
| | $ | 26 |
|
| Less: amounts capitalized as “Construction-in-progress” | | — |
| | — |
| | (1 | ) |
| Net amounts expensed in the consolidated income statement | | $ | 27 |
| | $ | 20 |
| | $ | 25 |
|
| Represented by management fees presented within: | | | | | | |
| Segment information - Corporate expense | 5(a) | $ | 6 |
| | $ | 6 |
| | $ | 6 |
|
| Segment information - Pre-opening expense | 5(b) | — |
| | 1 |
| | 4 |
|
| Other operating and administrative departments | | 21 |
| | 13 |
| | 15 |
|
| | | $ | 27 |
| | $ | 20 |
| | $ | 25 |
|
| Reconciled to management fees presented with “Other expenses and losses” as below: | | | | | | |
| Net management fees charged by related parties and expensed through the consolidated income statement | | $ | 27 |
| | $ | 20 |
| | $ | 25 |
|
| Management fees charged by third parties | | 23 |
| | 22 |
| | 21 |
|
| Total management fees expensed | 7(a)(i) | $ | 50 |
| | $ | 42 |
| | $ | 46 |
|
| | | | | | | |
| |
| (iii) | Expenses billed to/paid by other LVS group companies |
During the year, the Group incurred certain expenses on behalf of other LVS group companies, or vice versa. The Group charged/reimbursed other LVS group companies for these expenses at cost.
| |
| (iv) | Key management personnel remuneration |
No transactions have been entered into with the Directors of the Company (being the key management personnel) during the years ended December 31, 2018, 2017 and 2016 other than the emoluments paid to them (being the key management personnel remuneration) as disclosed in Note 6.
In November 2009, the Group entered into an agreement with Las Vegas Sands, LLC (“LVS LLC”), an intermediate holding company incorporated in the United States of America, for the use of the trademarks and other intellectual property rights as defined in the agreement. For each of the full fiscal years through the full fiscal year ended December 31, 2012, the Group was required to pay LVS LLC an annual royalty in the amount of 1.5% of non-gaming revenue and Paiza-related gaming revenue of the Sands Macao, 1.5% of all revenue of The Venetian Macao, and 1.5% of all gaming revenue of the Plaza Casino at The Plaza Macao (the “Relevant Royalty”), provided that the total royalty payable in connection with these three properties in each fiscal year was capped at US$20 million per full fiscal year. For each of the subsequent full fiscal years through the full fiscal year ending December 31, 2022, the Group is required to pay an annual royalty being the lesser of the Relevant Royalty or the annual caps reflecting an increase of 20.0% for each subsequent year. Each subsequent Casino Gaming property the Group operates which utilizes any of the licensed marks in connection with generating the relevant revenue will pay for each of the first three fiscal calendar years after commencement of operations of each subsequent property, a royalty fee of 1.5% of the respective gross revenues of the operations in connection with which such licensed marks are used (each, the “Subsequent Casino Gaming Property Royalty”), subject to a US$20 million cap per fiscal year. For the fiscal calendar years thereafter until expiration of the initial term, the Group will pay LVS LLC an annual royalty being the lesser of the Subsequent Casino Gaming Property Royalty or the annual caps reflecting an increase of 20.0% for each subsequent year. After the commencement of the operation of Sands Cotai Central and The Parisian Macao in April 2012 and September 2016 respectively, the Group is required to pay royalty fees in connection with these properties. During the years ended December 31, 2018, 2017, and 2016, the Group incurred US$106 million, US$98 million and US$73 million of royalty fees, respectively.
| |
| (vi) | Share-based compensation |
The Group participates in the share-based compensation plan of LVS (Notes 6 and 30).
| |
| (b) | Year-end balances between the Group and related companies |
|
| | | | | | | | |
| | | December 31, |
| | | 2018 | | 2017 |
| | Note | US$ in millions |
| Payables to related companies: | | | | |
| LVS | | $ | 4 |
| | $ | 2 |
|
| Intermediate holding company | | 4 |
| | 3 |
|
| Fellow subsidiaries | | 1 |
| | — |
|
| | 23 | $ | 9 |
| | $ | 5 |
|
| | | | | |
The credit period on the payables to related companies is 45 days. The payables are unsecured and interest-free.
| |
| 30. | SHARE-BASED COMPENSATION |
| |
| (a) | Share options of the Company |
The Company adopted the Equity Award Plan in November 2009 for grants of options to purchase ordinary shares of the Company. The purpose of the Equity Award Plan is to give the Company a competitive edge in attracting, retaining and motivating employees, directors and consultants and to provide the Company with a share plan providing incentives directly related to increases in its Shareholder value. Subject to certain criteria as defined in the Equity Award Plan, the Company’s subsidiaries’ or affiliates’ employees, directors or officers and many of its consultants are eligible for awards under the Equity Award Plan. The Equity Award Plan provides for an aggregate of 804,786,508 shares of the Company’s ordinary shares to be available for awards, representing 10% of the outstanding shares upon completion of the Global Offering. The Equity Award Plan has a term of ten years and no further awards may be granted after the expiration of the term. The Company’s Remuneration Committee may grant awards of share options, share appreciation rights, restricted share awards, restricted share units, share bonus awards, performance compensation awards or any combination of the foregoing. As at December 31, 2018, there were 714,665,526 shares available for grant under the Equity Award Plan.
Share option awards are granted with an exercise price not less than (i) the closing price of the Company’s ordinary shares on the date of grant or (ii) the average closing price of the Company’s ordinary shares for the five business days immediately preceding the date of grant. The outstanding share options generally vest over four years and have ten-year contractual terms. Compensation cost for all share option grants, which all have graded vesting, is net of estimated forfeitures and is recognized on an accelerated granted attribution approach over the awards’ respective requisite service periods. The Company estimates the fair value of share options using the Black-Scholes option-pricing model. Expected volatilities are based on the Company’s historical volatility for a period equal to the expected life of the share options. The expected option life is based on the contractual term of the option as well as historical exercise and forfeiture behavior. The risk-free interest rate for periods equal to the expected term of the share option is based on the Hong Kong Government Bond rate in effect at the time of the grant for share options granted subsequent to March 31, 2015 and based on the Hong Kong Exchange Fund Note rate in effect at the time of the grant for share options granted on or before March 31, 2015. The expected dividend yield is based on the estimate of annual dividends expected to be paid at the time of the grant. The Group has no legal or constructive obligation to repurchase or settle the options in cash.
A summary of the share option activity for the Company’s Equity Award Plan is presented below:
|
| | | | | | | | | | | | | | | | | | | | |
| | Year ended December 31, |
| | 2018 | | 2017 | | 2016 |
| | Number of options ’000 | | Weighted average exercise price US$ | | Number of options ’000 | | Weighted average exercise price US$ | | Number of options ’000 | | Weighted average exercise price US$ |
| Outstanding at January 1 | 48,252 |
| | $ | 4.39 |
| | 38,185 |
| | $ | 4.48 |
| | 25,474 |
| | $ | 5.17 |
|
| Granted | 18,873 |
| | 5.62 |
| | 17,364 |
| | 4.23 |
| | 18,407 |
| | 3.56 |
|
| Exercised | (6,186 | ) | | 3.74 |
| | (3,287 | ) | | 3.61 |
| | (1,829 | ) | | 3.06 |
|
| Forfeited | (3,557 | ) | | 5.24 |
| | (4,010 | ) | | 5.20 |
| | (3,867 | ) | | 5.38 |
|
| Outstanding at December 31 | 57,382 |
| | $ | 4.81 |
| | 48,252 |
| | $ | 4.39 |
| | 38,185 |
| | $ | 4.48 |
|
| Exercisable at December 31 | 18,152 |
| | $ | 5.00 |
| | 14,608 |
| | $ | 5.02 |
| | 11,285 |
| | $ | 5.07 |
|
| | | | | | | | | | | | |
The weighted average share price at the date of exercise for share options exercised during the years ended December 31, 2018, 2017, and 2016 was US$5.72, US$4.74 and US$4.18, respectively.
The range of exercise prices and the weighted average remaining contractual life of the above share options outstanding as at the dates indicated are as follows:
|
| | | | | | | | | | | | | | | |
| | | December 31, |
| | | 2018 | | 2017 | | 2016 |
| Range of exercise prices | | Number of options outstanding |
| | Weighted average remaining contractual life | | Number of options outstanding |
| | Weighted average remaining contractual life | | Number of options outstanding |
| | Weighted average remaining contractual life |
| US$ | | ‘000 |
| | (years) | | ‘000 |
| | (years) | | ‘000 |
| | (years) |
| 1.01 - 2.00 | | 811 |
| | 1.29 | | 893 |
| | 2.30 | | 893 |
| | 3.30 |
| 2.01 - 3.00 | | 283 |
| | 2.80 | | 470 |
| | 3.74 | | 1,085 |
| | 4.67 |
| 3.01 - 4.00 | | 14,805 |
| | 6.94 | | 19,311 |
| | 7.79 | | 22,624 |
| | 8.75 |
| 4.01 - 5.00 | | 18,673 |
| | 8.00 | | 20,108 |
| | 8.76 | | 4,715 |
| | 7.62 |
| 5.01 - 6.00 | | 15,991 |
| | 9.01 | | 592 |
| | 5.82 | | 592 |
| | 6.82 |
| 6.01 - 7.00 | | 2,227 |
| | 7.26 | | 1,868 |
| | 6.56 | | 2,006 |
| | 7.55 |
| 7.01 - 8.00 | | 2,554 |
| | 5.29 | | 2,972 |
| | 6.28 | | 3,637 |
| | 7.27 |
| 8.01 - 9.00 | | 2,038 |
| | 5.21 | | 2,038 |
| | 6.21 | | 2,633 |
| | 7.21 |
| | | 57,382 |
| | 7.64 | | 48,252 |
| | 7.82 | | 38,185 |
| | 8.03 |
| | | | | | | | | | | | | |
The fair value of each option grant was estimated on the grant date using the Black-Scholes option-pricing model with the following weighted average assumptions:
|
| | | | | | | | | | | |
| | Year ended December 31, |
| | 2018 | | 2017 | | 2016 |
| Expected volatility | 36.0 | % | | 36.9 | % | | 40.8 | % |
| Expected life (years) | 4.7 |
| | 4.4 |
| | 4.4 |
|
| Risk-free annual interest rate | 1.7 | % | | 1.3 | % | | 1.2 | % |
| Expected dividends | 5.8 | % | | 6.6 | % | | 5.5 | % |
| Weighted average share price at the date of grant (US$) | $ | 5.58 |
| | $ | 4.23 |
| | $ | 3.50 |
|
| Weighted average exercise price (US$) | $ | 5.62 |
| | $ | 4.23 |
| | $ | 3.56 |
|
Weighted average fair value of each share option granted by the
Company (US$) | $ | 1.01 |
| | $ | 0.71 |
| | $ | 0.73 |
|
| |
| (b) | Restricted share units of the Company |
The grant date fair value of restricted share units is the share price of the ordinary shares of the Company at the respective grant date. The number of unvested equity-settled restricted share units represents the number of ordinary shares of the Company to be given to the employees upon vesting.
Summaries of the unvested restricted share units under the Company’s Equity Award Plan are presented below:
|
| | | | | | | | | | | | | | | | | | | | |
| | Year ended December 31, |
| | 2018 | | 2017 | | 2016 |
| | Number of restricted share units
’000 | | Weighted average grant date fair value US$ | | Number of restricted share units
’000 | | Weighted average grant date fair value US$ | | Number of restricted share units
’000 | | Weighted average grant date fair value US$ |
| Equity-settled | | | | | | | | | | | |
| Unvested at January 1 | — |
| | $ | — |
| | 852 |
| | $ | 7.51 |
| | 1,402 |
| | $ | 7.29 |
|
| Granted | — |
| | — |
| | — |
| | — |
| | — |
| | — |
|
| Modified to cash-settled | — |
| | — |
| | (852 | ) | | 7.51 |
| | (284 | ) | | 7.13 |
|
| Forfeited | — |
| | — |
| | — |
| | — |
| | (266 | ) | | 6.76 |
|
| Unvested at December 31 | — |
| | $ | — |
| | — |
| | $ | — |
| | 852 |
| | $ | 7.51 |
|
| | | | | | | | | | | | |
|
| | | | | | | | | | | | | | | | | | | | |
| | Year ended December 31, |
| | 2018 | | 2017 | | 2016 |
| | Number of restricted share units
’000 | | Weighted average grant date fair value US$ | | Number of restricted share units
’000 | | Weighted average grant date fair value US$ | | Number of restricted share units
’000 | | Weighted average grant date fair value US$ |
| Cash-settled | | | | | | | | | | | |
| Unvested at January 1 | 852 |
| | $ | 7.51 |
| | 236 |
| | $ | 7.13 |
| | 798 |
| | $ | 5.89 |
|
| Modified from equity-settled | — |
| | — |
| | 852 |
| | 7.51 |
| | 284 |
| | 7.13 |
|
| Vested | (852 | ) | | 7.51 |
| | (236 | ) | | 7.13 |
| | (846 | ) | | 5.96 |
|
| Unvested at December 31 | — |
| | $ | — |
| | 852 |
| | $ | 7.51 |
| | 236 |
| | $ | 7.13 |
|
| | | | | | | | | | | | |
As a result of the Company cash-settling and planning to cash-settle certain future unvested restricted share units on their vesting dates, nil, 852,000 and 284,103 outstanding restricted share units under the Equity Award Plan were modified from equity awards to cash-settled liability awards during the years ended December 31, 2018, 2017 and 2016, respectively. The modification affected zero, four and one employees during the years ended December 31, 2018, 2017 and 2016, respectively, and resulted in no additional compensation expense. The fair value of these awards is remeasured each reporting period until the vesting dates. Upon settlement, the Group will pay the grantees an amount in cash calculated based on the higher of (i) the closing price of the Company’s shares on the vesting date, and (ii) the average closing price of the Company’s shares for the five trading days immediately preceding the vesting date. If the vesting date is not a trading day, the trading day immediately preceding the vesting date shall be considered as the vesting date. During the years ended December 31, 2018, 2017 and 2016, the Company paid US$5 million, US$3 million and US$1 million to settle vested restricted share units that were previously classified as equity awards. The accrued liability associated with these cash-settled restricted share units was nil, US$4 million and US$3 million as at December 31, 2018, 2017 and 2016, respectively. For the years ended December 31, 2018 and 2017, no fair value gain or loss on remeasurement of the liability was recognized in the consolidated financial statements. For the year ended December 31, 2016, fair value loss of US$1 million on remeasurement of the liability was recognized in the consolidated financial statements.
The Group participates in the equity-settled share-based compensation plan of LVS and is a party to a non-qualified share option plan, the 2004 Plan, which is described below. The plan provides for the granting of share options pursuant to the applicable provisions of the Internal Revenue Code and regulations in the United States of America.
LVS adopted the 2004 Plan, to which the Group is a party, for grants of options to purchase its common shares. The purpose of the 2004 Plan is to give LVS and its subsidiaries (collectively the “LVS Group”) a competitive edge in attracting, retaining, and motivating employees, directors and consultants and to provide the LVS Group with a share plan providing incentives directly related to increases in its shareholder value. Any of the LVS Group’s employees, directors or officers and many of its consultants are eligible for awards under the 2004 Plan. The 2004 Plan provides for an aggregate of 26,344,000 shares of LVS’ common shares to be available for awards. The 2004 Plan originally had a term of ten years, but in June 2014, the LVS’ board of directors approved an amendment to the 2004 Plan, extending the term to December 2019. LVS’ compensation committee may grant awards of non-qualified share options, incentive (qualified) share options, share appreciation rights, restricted share awards, restricted share units, share bonus awards, performance compensation awards or any combination of the foregoing. As at December 31, 2018, there were 917,674 shares available for grant under the 2004 Plan.
Share option awards are granted with an exercise price equal to the fair market value (as defined in the 2004 Plan) of LVS’ share on the date of grant. The outstanding share options generally vest over three to four years and have ten-year contractual terms. Compensation cost for all share option grants, which all have graded vesting, is net of estimated forfeitures and is recognized on an accelerated granted attribution approach over the awards’ respective requisite service periods. LVS estimates the fair value of share options using the Black-Scholes option-pricing model. Expected volatilities are based on LVS’ historical volatility for a period equal to the expected life of the share options. The expected option life is based on the contractual term of the option as well as historical exercise and forfeiture behavior. The risk-free interest rate for periods equal to the expected term of the share options is based on the U.S. Treasury yield curve in effect at the time of grant. The expected dividend yield is based on the estimate of annual dividends expected to be paid at the time of the grant. LVS has no legal or constructive obligation to repurchase or settle the options in cash.
For the purpose of financial reporting of the Group, share-based compensation expense arising from the granting of share options by LVS to the Directors and employees of the Group, to the extent of services rendered to the Group, is deemed to have been allocated to the Group as its expense with the corresponding increase in the share option reserve under equity in the relevant companies comprising the Group.
A summary of the share option activity for the 2004 Plan operated by LVS is presented below:
|
| | | | | | | | | | | | | | | | | | | | |
| | Year ended December 31, |
| | 2018 | | 2017 | | 2016 |
| | Number of options ’000 | | Weighted average exercise price US$ | | Number of options ’000 | | Weighted average exercise price US$ | | Number of options ’000 | | Weighted average exercise price US$ |
| Outstanding at January 1 | 198 |
| | $ | 72.83 |
| | 357 |
| | $ | 71.20 |
| | 547 |
| | $ | 70.33 |
|
| Granted | 23 |
| | 77.44 |
| | 34 |
| | 63.13 |
| | — |
| | — |
|
| Exercised | (62 | ) | | 66.18 |
| | (34 | ) | | 51.09 |
| | (3 | ) | | 36.55 |
|
Transfer-out(i) | — |
| | — |
| | (12 | ) | | 22.90 |
| | (47 | ) | | 59.51 |
|
| Expired | (102 | ) | | 80.08 |
| | (147 | ) | | 75.93 |
| | (140 | ) | | 72.51 |
|
| Outstanding at December 31 | 57 |
| | $ | 69.00 |
| | 198 |
| | $ | 72.83 |
| | 357 |
| | $ | 71.20 |
|
| Exercisable at December 31 | 11 |
| | $ | 63.13 |
| | 164 |
| | $ | 74.83 |
| | 335 |
| | $ | 71.63 |
|
| | | | | | | | | | | | |
____________________
| |
| (i) | Transfer-in and transfer-out represent movement of options owned by grantees who transferred from other subsidiaries of LVS to the Group, or vice versa. |
The fair value of each option grant under the 2004 Plan was estimated on the grant date using the Black-Scholes option-pricing model with the following weighted average assumptions:
|
| | | | | | | | | | | |
| | Year ended December 31, |
| | 2018 | | 2017 | | 2016 |
| Expected volatility | 25.0 | % | | 25.4 | % | | — | % |
| Expected life (years) | 5.5 |
| | 5.0 |
| | 0.0 |
|
| Risk-free annual interest rate | 2.5 | % | | 2.0 | % | | — | % |
| Dividend yield | 3.9 | % | | 4.6 | % | | — | % |
| Weighted average share price (US$) | $ | 77.44 |
| | $ | 63.13 |
| | $ | — |
|
| Weighted average exercise price (US$) | $ | 77.44 |
| | $ | 63.13 |
| | $ | — |
|
| Weighted average fair value of each share option granted by LVS (US$) | $ | 12.67 |
| | $ | 8.82 |
| | $ | — |
|
The range of exercise prices and the weighted average remaining contractual life of the above share options outstanding as at the dates indicated are as follows:
|
| | | | | | | | | | | | | | | |
| | | December 31, |
| | | 2018 | | 2017 | | 2016 |
| Range of exercise prices | | Number of options outstanding |
| | Weighted average remaining contractual life | | Number of options outstanding |
| | Weighted average remaining contractual life | | Number of options outstanding |
| | Weighted average remaining contractual life |
| US$ | | ‘000 |
| | (years) | | ‘000 |
| | (years) | | ‘000 |
| | (years) |
| 20.01 - 30.00 | | — |
| | 0.00 | | — |
| | 0.00 | | 24 |
| | 3.38 |
| 60.01 - 70.00 | | 34 |
| | 8.81 | | 96 |
| | 3.62 | | 102 |
| | 2.90 |
| 70.01 - 80.00 | | 23 |
| | 9.07 | | — |
| | 0.00 | | 103 |
| | 0.37 |
| 80.01 - 90.00 | | — |
| | 0.00 | | 102 |
| | 0.22 | | 118 |
| | 1.22 |
| 90.01 - 100.00 | | — |
| | 0.00 | | — |
| | 0.00 | | 5 |
| | 0.65 |
| 110.01 - 120.00 | | — |
| | 0.00 | | — |
| | 0.00 | | 5 |
| | 0.86 |
| | | 57 |
| | 8.92 | | 198 |
| | 1.87 | | 357 |
| | 1.59 |
| | | | | | | | | | | | | |
Options exercised during the years ended December 31, 2018, 2017 and 2016 resulted in 61,875 shares, 34,475 shares and 3,300 shares of LVS, respectively, being issued at a weighted average price of US$66.18, US$51.09 and US$36.55, respectively. The related weighted average share price at the time of exercise was US$77.66, US$69.08 and US$49.96 during the year, respectively.
| |
| (d) | Restricted shares and Units of LVS |
Grant date fair value of the restricted shares and units is the share price of the ordinary shares of LVS at the respective grant date. The number of unvested restricted shares and units represents the number of ordinary shares of LVS to be given to the employees upon vesting.
A summary of the unvested restricted shares and units under the 2004 Plan operated by LVS is presented below:
|
| | | | | | | | | | | | | | | | | | | | |
| | Year ended December 31, |
| | 2018 | | 2017 | | 2016 |
| | Number of restricted shares and units
’000 | | Weighted average grant date fair value US$ | | Number of restricted shares and units
’000 | | Weighted average grant date fair value US$ | | Number of restricted shares and units
’000 | | Weighted average grant date fair value US$ |
| Unvested at January 1 | — |
| | $ | — |
| | 35 |
| | $ | 64.78 |
| | 46 |
| | $ | 62.73 |
|
| Granted | — |
| | — |
| | — |
| | — |
| | — |
| | — |
|
| Vested | — |
| | — |
| | (35 | ) | | 64.78 |
| | (11 | ) | | 56.07 |
|
| Unvested at December 31 | — |
| | $ | — |
| | — |
| | $ | — |
| | 35 |
| | $ | 64.78 |
|
| | | | | | | | | | | | |
| |
| 31. | FINANCIAL RISK MANAGEMENT |
| |
| (a) | Financial risk factors |
The Group’s activities expose it to a variety of financial risks: market risk, credit risk and liquidity risk. The Group’s overall financial risk management program, mainly carried out by a central treasury department and approved by the Board of Directors, focuses on the unpredictability of financial markets and seeks to minimize potential adverse effects on the Group’s financial performance.
Market risk is the risk of loss arising from adverse changes in market rates and prices, such as interest rates and foreign currency exchange rates.
Interest rate risk
The Group’s primary exposure to market risk is interest rate risk associated with its fixed rate long-term borrowings and interest rate swap contracts for the year ended December 31, 2018, and variable rate long-term borrowings for the years ended December 31, 2017 and 2016. However, management monitors interest rate exposures and will consider hedging significant interest rate risk should the need arise. The Group does not hold or issue financial instruments for trading purposes and does not enter into derivative transactions that would be considered speculative positions. For the year ended December 31, 2018, the Group holds derivative financial instruments which consist of interest rate swap contracts on the fixed rate Senior Notes, which have been designated as hedging instruments for accounting purposes. The Group’s borrowings at fixed rates were denominated in US$ during the year ended December 31, 2018, and the Group’s borrowings at variable rates were denominated in US$, HK$ and MOP during the years ended December 31, 2017 and 2016.
As at December 31, 2018, the estimated fair value of fixed rate long-term borrowings was approximately US$5.52 billion, compared to its carrying value of US$5.50 billion. The estimated fair value of fixed rate long-term borrowings is based on level 2 inputs (quoted prices in markets that are not active). A change in interest rates on fixed rate long-term borrowings impacts its fair value. A hypothetical 100 basis point change in market rates would cause the fair value of the fixed rate long-term borrowings to change by US$308 million, inclusive of the impact from the interest rate swaps.
The total notional amount of our fixed-to-variable interest rate swaps was US$5.50 billion as at December 31, 2018. The fair value of the interest rate swaps, on a stand-alone basis, as at December 31, 2018, was an asset of US$56 million. A hypothetical 100 basis point change in LIBOR would cause the fair value of the interest rate swaps to change by approximately US$88 million.
As at December 31, 2017 and 2016, if interest rates on US$-denominated borrowings had been 50 basis-points higher/lower with all other variables held constant, pre-tax profit for the year would have been lower/higher by US$9 million and US$9 million, respectively. As at December 31, 2017 and 2016, if interest rates on HK$-denominated borrowings had been 50 basis-points higher/lower with all other variables held constant, pre-tax profit for the year would have been lower/higher by US$10 million and US$10 million, respectively. As at December 31, 2017 and 2016, if interest rates on MOP-denominated borrowings had been 50 basis-points higher/lower with all other variables held constant, pre-tax profit would have been lower/higher by US$3 million and US$3 million, respectively. This analysis does not include the effect of interest capitalized.
Foreign exchange risk
The Group’s foreign currency transactions are mainly denominated in US$. The majority of assets and liabilities are denominated in US$, HK$ and MOP, and there are no significant assets and liabilities denominated in other currencies. The Group is subject to foreign exchange rate risk arising from future commercial transactions and recognized assets and liabilities denominated in a currency other than MOP, which is the functional currency of the major operating companies within the Group.
For companies with MOP as their functional currency, as at December 31, 2018, 2017 and 2016, if the US$ had weakened by 1% against the MOP with all other variables held constant, it would cause a foreign currency transaction loss of approximately US$40 million, US$15 million and US$17 million, respectively, mainly as a result of the translation of US$-denominated debt held by SCL (as at December 31, 2017 and 2016: US$-denominated intercompany debt held). If the HK$ had weakened by 1% against
the MOP with all other variables held constant, pre-tax profit for the years ended December 31, 2018, 2017 and 2016 would have been lower by approximately US$11 million, US$5 million and US$9 million, respectively, mainly as a result of the translation of HK$-denominated cash and cash equivalents, deposits, trade receivables and borrowings.
Financial instruments, which potentially subject the Group to concentrations of credit risk, consist principally of cash and cash equivalents, restricted cash and cash equivalents and trade and other receivables.
The Group maintains cash and cash equivalents, restricted cash and cash equivalents and receivables associated with the derivative contracts with various creditworthy financial institutions. Management monitors this credit risk on an on-going basis and does not believe that the Group has any other significant exposure to any individual or institution as at December 31, 2018, 2017 and 2016.
Liquidity risk is the financial risk arising from the difficulty in meeting obligations associated with financial liabilities that are settled by cash or other financial assets.
The 2018 SCL Credit Facility requires the Group to comply with financial covenants, which include maintaining a maximum leverage ratio of debt to SCL Credit Facility Adjusted EBITDA. The maximum leverage ratio is 4.0:1.0 for all quarterly periods through maturity. As at December 31, 2018, the leverage ratio, as defined per the credit facility agreement, was 1.9:1.0, compared to the maximum leverage ratio allowed of 4.0:1.0. If the Group is unable to maintain compliance with the financial covenants under the credit facility, the Group would be in default with regard to any borrowings under the credit facility.
The Group’s financial liabilities, based on the contractual undiscounted cash flows are as follows:
|
| | | | | | | | | | | | | | | | | | | |
| | Within the first year | | In the second year | | In the third to fifth year | | Over the fifth year | | Total |
| | US$ in millions |
| At December 31, 2018 | | | | | | | | | |
| Senior Notes principal | $ | — |
| | $ | — |
| | $ | 1,800 |
| | $ | 3,700 |
| | $ | 5,500 |
|
| Senior Notes interest | 277 |
| | 277 |
| | 833 |
| | 698 |
| | 2,085 |
|
| Finance lease liabilities on leasehold interests in land | 8 |
| | 5 |
| | 16 |
| | 312 |
| | 341 |
|
| Other finance lease liabilities | 2 |
| | 2 |
| | 1 |
| | — |
| | 5 |
|
| Trade and other payables | 1,546 |
| | 22 |
| | 55 |
| | 12 |
| | 1,635 |
|
| At December 31, 2017 | | | | | | | | | |
| Bank borrowings | $ | 182 |
| | $ | 243 |
| | $ | 4,440 |
| | $ | — |
| | $ | 4,865 |
|
| Finance lease liabilities on leasehold interests in land | 5 |
| | 5 |
| | 16 |
| | 318 |
| | 344 |
|
| Other finance lease liabilities | 2 |
| | 1 |
| | 2 |
| | — |
| | 5 |
|
| Trade and other payables | 1,196 |
| | 26 |
| | 47 |
| | 3 |
| | 1,272 |
|
| |
| (b) | Capital risk management |
The Group’s primary objective when managing capital is to safeguard the Group’s ability to continue as a going concern in order to provide returns for Shareholders and benefits for other stakeholders, by pricing products and services commensurately with the level of risk.
The capital structure of the Group consists of debt, which includes borrowings (including current and non-current borrowings as shown in the consolidated balance sheet), net of cash and cash equivalents, and equity attributable to Shareholders, comprising issued share capital and reserves as disclosed in Notes 21 and 22, respectively.
The Group actively and regularly reviews and manages its capital structure to maintain the net debt-to-capital ratio (gearing ratio) at an appropriate level based on its assessment of the current risk and circumstances. This ratio is calculated as net debt divided by total capital. Net debt is calculated as interest bearing borrowings, net of deferred financing costs, less cash and cash equivalents and restricted cash and cash equivalents. Total capital is calculated as equity, as shown in the consolidated balance sheet, plus net debt.
|
| | | | | | | |
| | December 31, |
| | 2018 | | 2017 |
| | US$ in millions |
| Interest bearing borrowings, net of deferred financing costs | $ | 5,427 |
| | $ | 4,275 |
|
| Less: cash and cash equivalents | (2,676 | ) | | (1,239 | ) |
| restricted cash and cash equivalents | (13 | ) | | (11 | ) |
| Net debt | 2,738 |
| | 3,025 |
|
| Total equity | 4,409 |
| | 4,538 |
|
| Total capital | $ | 7,147 |
| | $ | 7,563 |
|
| Gearing ratio | 38.3 | % | | 40.0 | % |
| | | | |
|
| | | | | | | | |
| | | December 31, |
| | | 2018 | | 2017 |
| | Note | US$ in millions |
| ASSETS | | | | |
| Non-current assets | | | | |
| Interests in subsidiaries | | $ | 1,951 |
| | $ | 1,811 |
|
| Note receivable from a subsidiary | | 5,239 |
| | — |
|
| Other receivables and prepayments | | 54 |
| | — |
|
| Total non-current assets | | 7,244 |
| | 1,811 |
|
| Current assets | | | | |
| Other receivables and prepayments | | 64 |
| | 14 |
|
| Cash and cash equivalents | | 279 |
| | 47 |
|
| Total current assets | | 343 |
| | 61 |
|
| Total assets | | $ | 7,587 |
| | $ | 1,872 |
|
| EQUITY | | | | |
Capital and reserves attributable to equity holders of the Company | | | | |
| Share capital | | $ | 81 |
| | $ | 81 |
|
| Reserves | (a) | 1,954 |
| | 1,782 |
|
| Total equity | | 2,035 |
| | 1,863 |
|
| LIABILITIES | | | | |
| Non-current liability | | | | |
| Borrowings | | 5,427 |
| | — |
|
| Total non-current liability | | 5,427 |
| | — |
|
| Current liability | | | | |
| Other payables | | 125 |
| | 9 |
|
| Total current liability | | 125 |
| | 9 |
|
| Total liabilities | | 5,552 |
| | 9 |
|
| Total equity and liabilities | | $ | 7,587 |
| | $ | 1,872 |
|
| Net current assets | | $ | 218 |
| | $ | 52 |
|
| Total assets less current liability | | $ | 7,462 |
| | $ | 1,863 |
|
| | | | | |
| |
| (a) | The movements of reserves during the year are as follows |
|
| | | | | | | | | | | | | | | | | | | | | | | |
| | Capital reserve | | Share premium | | Share-based compensation reserves | | Currency translation reserve | | Retained earnings | | Total |
| | US$ in millions |
| Balance at January 1, 2016 | $ | 106 |
| | $ | 1,403 |
| | $ | 44 |
| | $ | (1 | ) | | $ | 135 |
| | $ | 1,687 |
|
| Profit for the year | — |
| | — |
| | — |
| | — |
| | 2,567 |
| | 2,567 |
|
| Other comprehensive expense for the year | — |
| | — |
| | — |
| | (2 | ) | | — |
| | (2 | ) |
| Total comprehensive income | — |
| | — |
| | — |
| | (2 | ) | | 2,567 |
| | 2,565 |
|
| Exercise of share options | — |
| | 5 |
| | — |
| | — |
| | — |
| | 5 |
|
| Conversion of equity awards to liability awards | — |
| | — |
| | (2 | ) | | — |
| | — |
| | (2 | ) |
| Transfer to share premium upon exercise of share options | — |
| | 3 |
| | (3 | ) | | — |
| | — |
| | — |
|
| Forfeiture of share options | — |
| | — |
| | (3 | ) | | — |
| | 3 |
| | — |
|
| Share-based compensation of the Company | — |
| | — |
| | 14 |
| | — |
| | — |
| | 14 |
|
| Dividends to equity holders of the Company | — |
| | — |
| | — |
| | — |
| | (2,071 | ) | | (2,071 | ) |
| Balance at December 31, 2016 | 106 |
| | 1,411 |
| | 50 |
| | (3 | ) | | 634 |
| | 2,198 |
|
| Profit for the year | — |
| | — |
| | — |
| | — |
| | 1,645 |
| | 1,645 |
|
| Other comprehensive expense for the year | — |
| | — |
| | — |
| | (11 | ) | | — |
| | (11 | ) |
| Total comprehensive income | — |
| | — |
| | — |
| | (11 | ) | | 1,645 |
| | 1,634 |
|
| Exercise of share options | — |
| | 12 |
| | — |
| | — |
| | — |
| | 12 |
|
| Conversion of equity awards to liability awards | — |
| | — |
| | (5 | ) | | — |
| | — |
| | (5 | ) |
| Transfer to share premium upon exercise of share options | — |
| | 5 |
| | (5 | ) | | — |
| | — |
| | — |
|
| Forfeiture of share options | — |
| | — |
| | (3 | ) | | — |
| | 3 |
| | — |
|
| Share-based compensation of the Company | — |
| | — |
| | 12 |
| | — |
| | — |
| | 12 |
|
| Dividends to equity holders of the Company (Note 11) | — |
| | — |
| | — |
| | — |
| | (2,069 | ) | | (2,069 | ) |
| Balance at December 31, 2017 | 106 |
| | 1,428 |
| | 49 |
| | (14 | ) | | 213 |
| | 1,782 |
|
| Profit for the year | — |
| | — |
| | — |
| | — |
| | 2,192 |
| | 2,192 |
|
| Other comprehensive expense for the year | — |
| | — |
| | — |
| | (4 | ) | | — |
| | (4 | ) |
| Total comprehensive income | — |
| | — |
| | — |
| | (4 | ) | | 2,192 |
| | 2,188 |
|
| Exercise of share options | — |
| | 23 |
| | — |
| | — |
| | — |
| | 23 |
|
| Transfer to share premium upon exercise of share options | — |
| | 6 |
| | (6 | ) | | — |
| | — |
| | — |
|
| Forfeiture of share options | — |
| | — |
| | (4 | ) | | — |
| | 4 |
| | — |
|
| Share-based compensation of the Company | — |
| | — |
| | 14 |
| | — |
| | — |
| | 14 |
|
| Dividends to equity holders of the Company (Note 11) | — |
| | — |
| | — |
| | — |
| | (2,053 | ) | | (2,053 | ) |
| Balance at December 31, 2018 | $ | 106 |
| | $ | 1,457 |
| | $ | 53 |
| | $ | (18 | ) | | $ | 356 |
| | $ | 1,954 |
|
| | | | | | | | | | | | |
| |
| 33. | PRINCIPAL SUBSIDIARIES |
Details of the Group’s principal subsidiaries as at December 31, 2018, 2017 and 2016 are as follows:
|
| | | | | | | | | |
| Name | | Place of incorporation or establishment/ operations and date of incorporation or establishment | | Principal activities | | Particulars of issued share/ registered capital | | Effective interests held |
| Directly held: | | | | | | | | |
| Venetian Venture Development Intermediate Limited | | Cayman Islands, June 21, 2002 | | Investment holding | | US$1 | | 100 | % |
| SCL IP Holdings, LLC | | United States, September 29, 2009 | | Holder of trademark licenses | | US$100 | | 100 | % |
| Indirectly held: | | | | | | | | |
| Cotai Ferry Company Limited | | Macao/Macao and
Hong Kong, July 19, 2007 | | High speed ferry transportation services | | MOP10,000,000 | | 100 | % |
| Cotai Strip Lot 2 Apart Hotel (Macau) Limited | | Macao, October 27, 2008 | | Hotel apartments | | As at December 31, 2016: MOP4,100,000 MOP3,121,000 (preference shares) | | 100 | % |
| | | | | | | As at December 31, 2017, 2018: MOP6,498,900 MOP722,100 (preference shares) | | 100 | % |
| Cotai Services (HK) Limited | | Hong Kong, July 11, 2007 | | Investment holding | | HK$1 | | 100 | % |
| CotaiJet 311 Ltd. | | Cayman Islands/Macao and Hong Kong, August 14, 2007 | | Ferry leasing | | US$1 | | 100 | % |
| CotaiJet 312 Ltd. | | Cayman Islands/Macao and Hong Kong, August 14, 2007 | | Ferry leasing | | US$1 | | 100 | % |
| CotaiJet 313 Ltd. | | Cayman Islands/Macao and Hong Kong, August 14, 2007 | | Ferry leasing | | US$1 | | 100 | % |
| CotaiJet 314 Ltd. | | Cayman Islands/Macao and Hong Kong, September 12, 2007 | | Ferry leasing | | US$1 | | 100 | % |
| CotaiJet 315 Ltd. | | Cayman Islands/Macao
and Hong Kong,
September 12, 2007 | | Ferry leasing | | US$1 | | 100 | % |
| CotaiJet 316 Ltd. | | Cayman Islands/Macao
and Hong Kong,
October 8, 2007 | | Ferry leasing | | US$1 | | 100 | % |
| CotaiJet 317 Ltd. | | Cayman Islands/Macao
and Hong Kong,
October 8, 2007 | | Ferry leasing | | US$1 | | 100 | % |
| CotaiJet 318 Ltd. | | Cayman Islands/Macao
and Hong Kong,
October 8, 2007 | | Ferry leasing | | US$1 | | 100 | % |
| CotaiJet 319 Ltd. | | Cayman Islands/Macao
and Hong Kong,
October 8, 2007 | | Ferry leasing | | US$1 | | 100 | % |
| CotaiJet 320 Ltd. | | Cayman Islands/Macao
and Hong Kong,
October 8, 2007 | | Ferry leasing | | US$1 | | 100 | % |
| CotaiJet 350 Ltd. | | Cayman Islands/Macao
and Hong Kong,
January 21, 2008 | | Ferry leasing | | US$1 | | 100 | % |
| CotaiJet 351 Ltd. | | Cayman Islands/Macao
and Hong Kong,
January 21, 2008 | | Ferry leasing | | US$1 | | 100 | % |
| CotaiJet 352 Ltd. | | Cayman Islands/Macao
and Hong Kong,
January 21, 2008 | | Ferry leasing | | US$1 | | 100 | % |
| CotaiJet 353 Ltd. | | Cayman Islands/Macao
and Hong Kong,
January 21, 2008 | | Ferry leasing | | US$1 | | 100 | % |
Cotaiwaterjet Sea
Bridge 1 Ltd. | | Cayman Islands/Macao
and Hong Kong,
October 27, 2015 | | Pontoon leasing | | US$1 | | 100 | % |
|
| | | | | | | | | |
| Name | | Place of incorporation or establishment/ operations and date of incorporation or establishment | | Principal activities | | Particulars of issued share/ registered capital | | Effective interests held |
Cotaiwaterjet Sea
Bridge 2 Ltd. | | Cayman Islands/Macao
and Hong Kong,
October 27, 2015 | | Pontoon leasing | | US$1 | | 100 | % |
| Sands Cotai East Holdings Limited | | Cayman Islands/Macao, May 25, 2011 | | Holder of hotel
franchise agreement | | US$1 | | 100 | % |
| Sands Cotai West Holdings Limited | | Cayman Islands/Macao, May 25, 2011 | | Holder of hotel
franchise agreement | | US$1 | | 100 | % |
Sands Resorts
Travel Limited | | Hong Kong,
February 29, 2016 | | Travel and tourism
agency services | | HK$500,000 | | 100 | % |
Sands Venetian
Security Limited | | Macao,
June 22, 2011 | | Security services | | MOP1,000,000 | | 100 | % |
| Venetian Cotai Hotel Management Limited | | Macao,
March 12, 2008 | | Human resources
administration | | MOP500,000 | | 100 | % |
| Venetian Cotai Limited | | Macao,
November 11, 2004 | | Hotels, restaurants,
shopping mall,
and conference
and convention | | MOP200,000,000 | | 100 | % |
| Venetian Macau Limited (Note (i)) | | Macao,
June 21, 2002 | | Gaming and other
related activities | | MOP200,000,000 | | 100 | % |
| Venetian Orient Limited | | Macao, February 2, 2006 | | Hotels, restaurants, shopping mall, and conference and convention | | MOP100,000 | | 100 | % |
| Venetian Retail Limited | | Macao, June 15, 2007 | | Mall management | | MOP1,500,000 | | 100 | % |
| Venetian Travel Limited | | Macao, October 16, 2006 | | Travel and tourism agency services | | MOP2,400,000 | | 100 | % |
| V-HK Services Limited | | Hong Kong, September 6, 2004 | | Marketing and customer development services for VML | | HK$1 | | 100 | % |
| VML US Finance LLC | | United States, January 3, 2006 | | Financing | | Nil | | 100 | % |
| Zhuhai Cotai Information Services Outsourcing Co., Ltd. (Note (ii)) | | PRC, September 30, 2010 | | Outsourcing services, including information technology, accounting, hotel reservation and marketing | | US$800,000 | | 100 | % |
| Zhuhai Cotai Logistics Hotel Services Co., Ltd. (Note (ii)) | | PRC, September 27, 2007 | | Procurement, marketing and administrative services | | US$4,500,000 | | 100 | % |
____________________
Notes:
| |
| (i) | 10% of the company’s issued share capital is held through a usufruct agreement whereby VVDIL has the sole and exclusive benefit. Accordingly, the profits and losses and assets and liabilities of the company have been consolidated as to 100% thereof into the consolidated financial statements. |
| |
| (ii) | These entities are wholly foreign owned enterprises established in the PRC. |
GLOSSARY
This glossary contains definitions of certain terms used in this annual report as they relate to us. Some of these definitions may not correspond to standard industry definitions.
|
| |
| “Adjusted Property EBITDA” | Adjusted Property EBITDA, which is a non-IFRS financial measure, is profit attributable to equity holders of the Company before share- based compensation, corporate expense, pre-opening expense, depreciation and amortization, net foreign exchange gains/(losses), impairment loss, gain/(loss) on disposal of property and equipment, investment properties and intangible assets, interest, gain/(loss) on modification or early retirement of debt and income tax benefit/(expense). Management utilizes Adjusted Property EBITDA to compare the operating profitability of its operations with those of its competitors, as well as a basis for determining certain incentive compensation. Integrated resort companies have historically reported Adjusted Property EBITDA as a supplemental performance measure to IFRS financial measures. In order to view the operations of their properties on a more stand-alone basis, integrated resort companies, including the Company, have historically excluded certain expenses that do not relate to the management of specific properties, such as pre-opening expense, development expense and corporate expense, from their Adjusted Property EBITDA calculations. Adjusted Property EBITDA should not be interpreted as an alternative to operating profit (as an indicator of operating performance) or to cash flows from operations (as a measure of liquidity), in each case, as determined in accordance with IFRS. The Company has significant uses of cash flow, including capital expenditures, dividend payments, interest payments, debt principal repayments and income taxes, which are not reflected in Adjusted Property EBITDA. Not all companies calculate Adjusted Property EBITDA in the same manner. As a result, Adjusted Property EBITDA as presented by the Company may not be directly comparable to similarly titled measures presented by other companies. In addition, our Adjusted Property EBITDA presented in the report may differ from Adjusted Property EBITDA presented by LVS for its Macao segment in its filings with the SEC. For a quantitative reconciliation of Adjusted Property EBITDA to its most directly comparable IFRS measurement, see “Note 5 - Segment Information” |
|
| |
| “average daily rate” | the average daily rate per occupied room in a given time period, calculated as room revenue divided by the number of rooms sold |
|
| |
| “Board” | the board of directors of the Company |
|
| |
| “cage” | a secure room within a casino with a facility that allows patrons to exchange cash for chips required to participate in gaming activities, or to exchange chips for cash |
|
| |
| “Capex Committee” | Sands China Capital Expenditure Committee of the Company |
|
| |
| “casino(s)” | a gaming facility that provides casino games consisting of table games operated in mass market areas or VIP areas, electronic games, slot machines and other casino games |
|
| |
| “Chief Executive” | a person who either alone or together with one or more other persons is or will be responsible under the immediate authority of the Board of Directors for the conduct of the business of the Company |
|
| |
| “China” or the “PRC” | the People’s Republic of China excluding, for the purpose of this annual report only, Hong Kong, Macao and Taiwan, unless the context otherwise requires |
|
| |
| “chip(s)” | tokens issued by a casino to players in exchange for cash or credit, which are used to place bets on gaming tables, in lieu of cash |
|
| |
| “Company,” “our,” “we,” “us,” or “Sands China” | Sands China Ltd., a company incorporated in the Cayman Islands on July 15, 2009 as an exempted company with limited liability and, except where the context otherwise requires, all of its subsidiaries, or where the context refers to the time before it became the holding company of its present subsidiaries, its present subsidiaries. When used in the context of gaming operations or the Subconcession, “we,” “us,” or “our” refers exclusively to VML |
|
| |
| “Concessionaire(s)” | the holder(s) of a concession for the operation of casino games in the MSAR |
|
| |
| “Cotai” | the name given to the land reclamation area in the MSAR between the islands of Coloane and Taipa |
|
| |
| “Cotai Strip” | large-scale integrated resort projects on Cotai being developed by us and inspired by the Las Vegas Strip in Las Vegas, Nevada, U.S.A. |
|
| |
| “DICJ” | Gaming Inspection and Coordination Bureau (“Direcção de Inspecção e Coordenação de Jogos”) under the Secretary for Economy and Finance of the MSAR |
|
| |
| “Director(s)” | member(s) of the board of directors of the Company |
|
| |
| “DOJ” | the United States Department of Justice |
|
| |
| “EBITDA” | earnings before interest, taxes, depreciation and amortization |
|
| |
| “Exchange Rate” | except as otherwise stated, amounts denominated in U.S. dollars, MOP and Hong Kong dollars have been converted at the exchange rate on December 31, 2018, for the purposes of illustration only, in this annual report at: • US$1.00: HK$7.8306 • US$1.00: MOP 8.0655 • HK$1.00: MOP 1.03 |
|
| |
| “FCPA” | the United States Foreign Corrupt Practices Act of 1977, as amended |
|
| |
| “Four Seasons Hotel Macao” | refers to the Four Seasons Hotel Macao, Cotai Strip®, which is managed and operated by FS Macau Lda., an affiliate of Four Seasons Hotels Limited |
|
| |
| “gaming area(s)” | a gaming facility that provides casino games consisting of table games operated in VIP areas or mass market areas, electronic games, slot machines and other casino games but has not been designated as a casino by the Macao Government |
|
| |
| “gaming promoter(s)” | individuals or corporations licensed by and registered with the Macao Government to promote games of fortune and chance to patrons, through the arrangement of certain services, including extension of credit (regulated by Law No. 5/2004), transportation, accommodation, dining and entertainment, whose activity is regulated by Administrative Regulation No. 6/2002 |
|
| |
| “GLOA” | gross leasable occupied area |
|
| |
| “Group” | our Company and its subsidiaries from time to time |
|
| |
| “HK$” or “HK dollars” | the Hong Kong dollars, the lawful currency of Hong Kong |
|
| |
| “Hong Kong” or “HKSAR” | the Hong Kong Special Administrative Region of the PRC |
|
| |
| “Hong Kong Stock Exchange” | The Stock Exchange of Hong Kong Limited |
|
| |
| “IFRS” | International Financial Reporting Standards as issued by the International Accounting Standards Board |
|
| |
| “integrated resort(s)” | a resort which provides customers with a combination of hotel accommodations, casinos or gaming areas, retail and dining facilities, MICE space, entertainment venues and spas |
|
| |
| “Listing Rules” | the Rules Governing the Listing of Securities on The Stock Exchange of Hong Kong Limited (as amended from time to time) |
|
| |
| “LVS” | Las Vegas Sands Corp., a company incorporated in Nevada, U.S.A. in August 2004 and the common stock of which is listed on the New York Stock Exchange |
|
| |
| “LVS Group” | LVS and its subsidiaries (excluding our Group) |
|
| |
| “LVS LLC” | Las Vegas Sands, LLC, a company incorporated in Nevada, U.S.A. |
|
| |
| “LVS Nevada” | LVS (Nevada) International Holdings, Inc., a company incorporated in Nevada, U.S.A. |
|
| |
| “Macao” or “Macau” or “MSAR” | the Macao Special Administrative Region of the PRC |
|
| |
| “Macao Government” | the local government of the MSAR, established on December 20, 1999 and the local administration before this date |
|
| |
| “mass market players” | Non-Rolling Chip and slot players |
|
| |
| “MICE” | Meetings, Incentives, Conventions and Exhibitions, an acronym commonly used to refer to tourism involving large groups brought together for an event or corporate meeting |
|
| |
| “MOP” or “pataca(s)” | Macao pataca, the lawful currency of Macao |
|
| |
| “Parcel 1” | a land parcel on Cotai totaling 290,562 square meters described under Registration No. 23225 by the Macao Property Registry, on which The Venetian Macao has been constructed |
|
| |
| “Parcel 2” | a land parcel on Cotai totaling 53,303 square meters described under Registration No. 23223 by the Macao Property Registry, on which The Plaza Macao has been constructed |
|
| |
| “Parcel 3” | a land parcel on Cotai totaling 61,681 square meters described under Registration No. 23224 by the Macao Property Registry, on which The Parisian Macao has been constructed |
|
| |
| “Parcels 5 and 6” | land parcels on Cotai totaling 150,134 square meters, including 44,576 square meters designated as a tropical garden, described under Registration No 23288 by the Macao Property Registry, on which Sands Cotai Central has been constructed |
|
| |
| “premium player(s)” | Rolling Chip players who have a direct relationship with gaming operators and typically participate in gaming activities in casinos or gaming areas without the use of gaming promoters |
|
| |
| “RMB” or “Renminbi” | Renminbi, the lawful currency of China |
|
| |
| “Rolling Chip win” | a percentage of Rolling Chip volume |
|
| |
| “Rolling Chip play” | play by VIP and premium players (excludes Paiza cash players) using non-negotiable chips |
|
| |
| “Rolling Chip volume” | casino revenue measurement, measured as the sum of all non-negotiable chips wagered and lost by VIP and premium players (excludes Paiza cash players) |
|
| |
| “Sands” | a land parcel in Macao totaling 26,082 square meters described under Registration No. 23114 by the Macao Property Registry, on which Sands Macao has been constructed |
|
| |
| “Sands Cotai Central” | an integrated resort which currently features four hotel towers, consisting of hotel rooms and suites under the Conrad, Holiday Inn, Sheraton and St. Regis brands. Sands Cotai Central also includes gaming area, retail, entertainment, dining and MICE facilities operated by us which are expected to be rebranded as The Londoner Macao |
|
| |
| “Sands Macao” | the Sands Macao, which includes gaming areas, a hotel tower, restaurants and a theater |
|
| |
| “SCL Credit Facility” | the revolving credit facility available pursuant to the facility agreement, dated November 20, 2018, among the Company, Bank of China Limited, Macau Branch, as agent, and certain other entities listed therein, as original lenders |
|
| |
| “SEC” | the Securities and Exchange Commission |
|
| |
| “SFO” | the Securities and Futures Ordinance of Hong Kong (Cap. 571 of the Laws of Hong Kong) as amended, supplemented or otherwise modified from time to time |
|
| |
| “Subconcession” or “Subconcession Contract” | the tripartite Subconcession Contract for the operation of casino games, dated December 26, 2002, among Galaxy Casino S.A., the Macao Government and VML |
|
| |
| “Subconcessionaire(s)” | the holder(s) of a subconcession for the operation of casino games in the MSAR |
|
| |
| “table games” | typical casino games, including card games such as baccarat, blackjack and hi-lo (also known as “sic bo”) as well as craps and roulette, among others |
|
| |
| “The Parisian Macao” | an integrated resort that includes a gaming area, hotel, a shopping mall and other integrated resort amenities |
|
| |
| “The Plaza Macao” | an integrated resort which includes (i) the Four Seasons Hotel Macao; (ii) the Plaza Casino gaming area operated by VML; (iii) the Paiza Mansions, the Shoppes at Four Seasons, restaurants and a spa, each of which are operated by us; and (iv) the Four Seasons Tower Suites Macao, which is expected to feature approximately 290 premium quality suites, except where the context indicates otherwise |
|
| |
| “The Venetian Macao” | The Venetian® Macao-Resort-Hotel, an integrated resort that includes casino and gaming areas, a hotel, MICE space, the Shoppes at Venetian, over 50 different restaurants and food outlets, a 15,000-seat arena and other entertainment venues |
|
| |
| “United States,” “U.S.” or “U.S.A.” | The United States of America, including its territories and possessions and all areas subject to its jurisdiction |
|
| |
| “US$” or “U.S. dollars” | United States dollars, the lawful currency of the United States |
|
| |
| “Venetian Casino” | Venetian Casino Resort, LLC, a company incorporated in Nevada, U.S.A. |
|
| |
| “VIP player(s)” | Rolling Chip players who play almost exclusively in dedicated VIP rooms or designated casino or gaming areas and are sourced from gaming promoters |
|
| |
| “VIP room(s)” | rooms or designated areas within a casino or gaming area where VIP players and premium players gamble |
|
| |
| “visit(s)” or “visitation(s)” | with respect to visitation of our properties, the number of times a property is entered during a fixed time period. Estimates of the number of visits to our properties is based on information collected from digital cameras placed above every entrance in our properties, which use video signal image processor detection and include repeat visitors to our properties on a given day |
|
| |
| “VML” | our subsidiary, Venetian Macau, S.A. (also known as Venetian Macau Limited), a public company limited by shares (“sociedade anónima”) incorporated on June 21, 2002 under the laws of Macao, one of the three Subconcessionaires and the holder of the Subconcession |
|
| |
| “VMLF” | our subsidiary, VML US Finance LLC, a limited liability company incorporated in Delaware, U.S.A. |
|
| |
| “VML Credit Facility” | the term loans, term loan commitments and revolving credit facility available pursuant to the credit agreement, dated September 21, 2011, among VML and certain of VML’s subsidiaries, terminated on November 20, 2018, effective as of November 21, 2018 |