UNITED STATES
SECURITIES AND EXCHANGE COMMISSION
Washington, D.C. 20549
FORM N-CSR
CERTIFIED SHAREHOLDER REPORT OF REGISTERED MANAGEMENT INVESTMENT COMPANIES
Investment Company Act file number 811-23402
Name of Fund: BlackRock ETF Trust
BlackRock U.S. Equity Factor Rotation ETF
Fund Address: 100 Bellevue Parkway, Wilmington, DE 19809
Name and address of agent for service: John M. Perlowski, Chief Executive Officer, BlackRock ETF Trust, 55 East
52nd Street, New York, NY 10055
Registrant’s telephone number, including area code: (800) 441-7762
Date of fiscal year end: 07/31/2020
Date of reporting period: 07/31/2020
Item 1 – Report to Stockholders
| | |
 | | JULY 31, 2020 |
BlackRock ETF Trust
| · | | BlackRock U.S. Equity Factor Rotation ETF | DYNF | NYSE ARCA |
Beginning on January 1, 2021, as permitted by regulations adopted by the Securities and Exchange Commission, paper copies of the Fund’s shareholder reports will no longer be sent by mail, unless you specifically request paper copies of the reports from your financial intermediary, such as a broker-dealer or bank. Instead, the reports will be made available on a website, and you will be notified by mail each time a report is posted and provided with a website link to access the report.
You may elect to receive all future reports in paper free of charge. If you hold accounts through a financial intermediary, you can follow the instructions included with this disclosure, if applicable, or contact your financial intermediary to request that you continue to receive paper copies of your shareholder reports. Please note that not all financial intermediaries may offer this service. Your election to receive reports in paper will apply to all funds held with your financial intermediary.
If you already elected to receive shareholder reports electronically, you will not be affected by this change and you need not take any action. You may elect to receive electronic delivery of shareholder reports and other communications by contacting your financial intermediary. Please note that not all financial intermediaries may offer this service.
|
| Not FDIC Insured • May Lose Value • No Bank Guarantee |
The Markets in Review
Dear Shareholder,
The last 12 months have been a time of sudden change in global financial markets, as a long period of growth and positive returns was interrupted in early 2020 by the emergence and spread of the coronavirus. For the first half of the reporting period, U.S. equities and bonds both delivered impressive returns, despite fears and doubts about the economy that were ultimately laid to rest with unprecedented monetary stimulus and a sluggish yet resolute performance from the U.S. economy. But as the threat from the coronavirus (or “COVID-19”) became more apparent throughout February and March 2020, countries around the world took economically disruptive countermeasures, causing a global recession and a sharp fall in equity prices. While markets have since recovered most of these losses as countries around the world adapt to life with the virus, lingering uncertainty about the depth and duration of the pandemic and an uptick in global infection rates tempered optimism late in the reporting period.
Returns for most securities were robust for the first half of the reporting period, as investors began to realize that the U.S. economy was maintaining the modest yet steady growth that had characterized this economic cycle. However, once stay-at-home orders and closures of non-essential businesses became widespread, many workers were laid off and unemployment claims spiked. The subsequent rapid decline in equity prices was followed by a slow recovery, and some economic indicators began to improve. U.S. large-capitalization stocks, which are often considered more resilient than smaller companies during market turbulence, advanced significantly. International equities from developed economies ended the 12-month reporting period with negative performance, while emerging market stocks posted a positive return.
The performance of different types of fixed-income securities diverged substantially due to a reduced investor appetite for risk. Treasuries benefited from the risk-off environment, and posted healthy returns, as the 10-year U.S. Treasury yield (which is inversely related to bond prices) fell to an all-time low. Investment-grade corporate bonds also delivered solid returns, while high-yield corporate returns were more modest due to credit concerns.
The U.S. Federal Reserve (the “Fed”) reduced interest rates three times in 2019, to support slowing economic growth. After the coronavirus outbreak, the Fed instituted two emergency rate cuts, pushing short-term interest rates close to zero. To stabilize credit markets, the Fed also implemented a new bond-buying program, as did several other central banks around the world, including the European Central Bank and the Bank of Japan.
Looking ahead, while coronavirus-related disruptions have clearly hindered worldwide economic growth, we believe that the global expansion is likely to continue once the outbreak subsides. Several risks remain, however, including a potential resurgence of the coronavirus amid loosened restrictions, policy fatigue among governments already deep into deficit spending, and structural damage to the financial system from lengthy economic interruptions.
Overall, we favor a moderately positive stance toward risk, and in particular toward credit given the extraordinary central bank measures taken in recent months. This support extends beyond investment-grade corporates and into high-yield, leading to attractive opportunities throughout the credit market. We believe that both U.S. Treasuries and sustainable investments can help provide portfolio resilience, and the disruption created by the coronavirus appears to be accelerating the shift toward sustainable investments. We remain neutral on equities overall while favoring European stocks, which are poised for cyclical upside as re-openings continue.
In this environment, our view is that investors need to think globally, extend their scope across a broad array of asset classes, and be nimble as market conditions change. We encourage you to talk with your financial advisor and visit blackrock.com for further insight about investing in today’s markets.
Sincerely,

Rob Kapito
President, BlackRock Advisors, LLC

Rob Kapito
President, BlackRock Advisors, LLC
| | | | |
| Total Returns as of July 31, 2020 |
| | | 6-Month | | 12-Month |
U.S. large cap equities
(S&P 500® Index) | | 2.42% | | 11.96% |
U.S. small cap equities
(Russell 2000® Index) | | (7.61) | | (4.59) |
International equities
(MSCI Europe, Australasia, Far East Index) | | (7.34) | | (1.67) |
Emerging market equities
(MSCI Emerging Markets Index) | | 3.08 | | 6.55 |
3-month Treasury bills
(ICE BofA 3-Month U.S. Treasury Bill Index) | | 0.48 | | 1.46 |
U.S. Treasury securities
(ICE BofA 10-Year U.S. Treasury Index) | | 9.92 | | 15.55 |
U.S. investment grade bonds
(Bloomberg Barclays U.S. Aggregate Bond Index) | | 5.69 | | 10.12 |
Tax-exempt municipal bonds
(S&P Municipal Bond Index) | | 1.75 | | 4.89 |
U.S. high yield bonds
(Bloomberg Barclays U.S. Corporate High Yield 2% Issuer Capped Index) | | 0.62 | | 4.07 |
Past performance is no guarantee of future results. Index performance is shown for illustrative purposes only. You cannot invest directly in an index. |
| | |
| 2 | | THIS PAGEISNOT PARTOF YOUR FUND REPORT |
Table of Contents
| | |
| Fund Summary as of July 31, 2020 | | BlackRock U.S. Equity Factor Rotation ETF |
Investment Objective
The BlackRock U.S. Equity Factor Rotation ETF (the “Fund”) seeks to outperform the investment results of the large- and mid-capitalization U.S. equity markets by providing diversified and tactical exposure to style factors via a factor rotation model. The Fund is an actively managed exchange-traded fund and does not seek to replicate the performance of a specified index.
Performance
| | | | | | | | | | | | | | | | | | | | |
| | | Average Annual Total Returns | | | | | | Cumulative Total Returns | |
| | | 1 Year | | | Since Inception | | | | | | 1 Year | | | Since Inception | |
Fund NAV | | | 4.61 | % | | | 8.27 | % | | | | | | | 4.61 | % | | | 11.50 | % |
Fund Market | | | 4.45 | | | | 8.18 | | | | | | | | 4.45 | | | | 11.37 | |
MSCI USA Index(a) | | | 13.11 | | | | 14.22 | | | | | | | | 13.11 | | | | 19.89 | |
80% MSCI USA Index / 20% MSCI USA Minimum Volatility (USD) Index(b) | | | 10.47 | | | | 12.60 | | | | | | | | 10.47 | | | | 17.56 | |
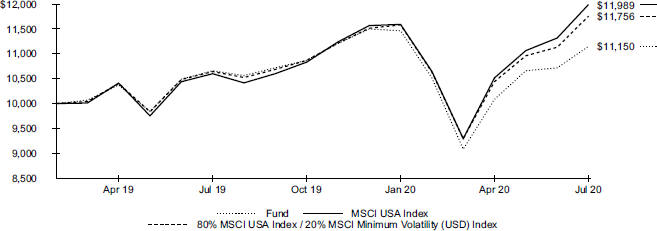
The inception date of the Fund was 3/19/19. The first day of secondary market trading was 3/21/19.
| | (a) | The MSCI USA Index is designed to measure the performance of the large and mid cap segments of the US market. The index covers approximately 85% of the free float-adjusted market capitalization in the US. Effective September 23, 2019, the Fund changed its benchmark against which it measures its performance from a custom weighted index composed of the 80% MSCI USA Index / 20% MSCI USA Minimum Volatility (USD) Index to the MSCI USA Index. |
| | (b) | The MSCI USA Minimum Volatility (USD) Index aims to reflect the performance characteristics of a minimum variance strategy applied to the large and mid cap USA equity universe. The index is calculated by optimizing the MSCI USA Index, its parent index, in USD for the lowest absolute risk. |
Past performance is no guarantee of future results. Performance results do not reflect the deduction of taxes that a shareholder would pay on fund distributions or on the redemption or sale of fund shares. See “About Fund Performance” on page 6 for more information.
Expense Example
| | | | | | | | | | | | | | | | | | | | | | | | | | | | | | |
| Actual | | | | | | Hypothetical 5% Return | | | | |
Beginning
Account Value
(02/01/20) | | | Ending
Account Value
(07/31/20) | | | Expenses
Paid During
the Period (a) | | | | | | Beginning
Account Value
(02/01/20) | | | Ending
Account Value
(07/31/20) | | | Expenses
Paid During
the Period (a) | | | Annualized
Expense
Ratio | |
| $ | 1,000.00 | | | $ | 972.80 | | | $ | 0.98 | | | | | | | $ | 1,000.00 | | | $ | 1,023.90 | | | $ | 1.01 | | | | 0.20 | % |
| | (a) | Expenses are calculated using the Fund’s annualized expense ratio (as disclosed in the table), multiplied by the average account value for the period, multiplied by the number of days in the period (182 days) and divided by the number of days in the year (366 days). See “Shareholder Expenses” on page 6 for more information. |
| | |
| 4 | | 2020 BLACKROCK ANNUAL REPORTTO SHAREHOLDERS |
| | |
| Fund Summary as of July 31, 2020 (continued) | | BlackRock U.S. Equity Factor Rotation ETF |
Portfolio Management Commentary
The Fund advanced modestly for the reporting period, driven largely by the information technology sector, which posted strong gains amid social distancing requirements that drove sharply higher use of technology products and services. Software companies were notable contributors, benefiting from increased demand for cloud-based subscriptions of business productivity, design, and marketing software. Software products that facilitate remote working, such as digital document signatures and virtual private networks, also advanced. Semiconductor and semiconductor equipment companies strengthened amid high demand for chips to support the expansion of data centers along with video gaming and streaming, all areas that grew after government-mandated coronavirus restrictions.
The healthcare sector also enhanced performance, driven by strength in the biotechnology, health care technology, and pharmaceuticals industries. Development of new cancer therapies and progress on identifying potential coronavirus treatments and vaccines supported the sector. Higher demand for diagnostic equipment used in research and development buoyed healthcare equipment makers.
On the downside, financials stocks detracted from the Fund’s performance, led by consumer finance, banks, and large insurance companies, which posted significant losses from coronavirus-related claims for workers’ compensation, travel, and mortgage insurance. Declining bond yields also pressured insurers, who generate income from investing premium payments. Bank stocks declined as rising bankruptcies and bad loan provisions, together with historically low interest rates, weighed on banks’ profits. Energy companies, which struggled amid declining commodity prices, also detracted from performance but comprised a relatively small proportion of the Fund.
In terms of relative performance, the Fund significantly underperformed the broader market, as represented by the MSCI USA Index. The Fund’s actively managed factor rotation strategy seeks diversified exposure to five style factors: value, low size, momentum, quality, and minimum volatility. The Fund seeks to outperform the broader market through diversified exposure to factors, as well as through active tilts to the factors that BlackRock Fund Advisors believes will perform best based on forward-looking insights.
With the exception of momentum, all other style factors underperformed the MSCI USA Index, which detracted from the Fund’s relative performance. Underperformance of individual factors was significant during the post-March market rally, except for momentum which outperformed. The Fund’s factor tilting also detracted from relative performance, driven primarily by varying exposure to the momentum factor, including underweight exposure to momentum toward the end of the measurement period.
Portfolio Information
ALLOCATION BY SECTOR
| | |
|
Sector | | Percent of Total Investments(a) |
|
Information Technology | | 24.3% |
Health Care | | 16.1 |
Financials | | 10.7 |
Consumer Discretionary | | 9.9 |
Communication Services | | 8.9 |
Industrials | | 8.8 |
Consumer Staples | | 7.5 |
Utilities | | 4.6 |
Real Estate | | 4.2 |
Materials | | 3.0 |
Energy | �� | 2.0 |
TEN LARGEST HOLDINGS
| | | | |
| |
Security | |
| Percent of
Total Investments |
(a) |
| |
Intel Corp. | | | 2.2 | % |
Apple Inc. | | | 1.9 | |
AT&T Inc. | | | 1.9 | |
Microsoft Corp. | | | 1.9 | |
Johnson & Johnson | | | 1.7 | |
Coca-Cola Co. (The) | | | 1.4 | |
Pfizer Inc. | | | 1.3 | |
Visa Inc., Class A | | | 1.2 | |
UnitedHealth Group Inc. | | | 1.2 | |
Facebook Inc., Class A | | | 1.2 | |
| | (a) | Excludes money market funds. | |
About Fund Performance
Past performance is no guarantee of future results. Financial markets have experienced extreme volatility and trading in many instruments has been disrupted. These circumstances may continue for an extended period of time and may continue to affect adversely the value and liquidity of the fund’s investments. As a result, current performance may be lower or higher than the performance data quoted. Performance data current to the most recent month-end is available at blackrock.com. Performance results assume reinvestment of all dividends and capital gain distributions and do not reflect the deduction of taxes that a shareholder would pay on fund distributions or on the redemption or sale of fund shares. The investment return and principal value of shares will vary with changes in market conditions. Shares may be worth more or less than their original cost when they are redeemed or sold in the market. Performance for certain funds may reflect a waiver of a portion of investment advisory fees. Without such a waiver, performance would have been lower.
Net asset value or “NAV” is the value of one share of a fund as calculated in accordance with the standard formula for valuing mutual fund shares. The price used to calculate market return (“Market Price”) is determined by using the midpoint between the highest bid and the lowest ask on the primary stock exchange on which shares of a fund are listed for trading, as of the time that such fund’s NAV is calculated. Since shares of a fund may not trade in the secondary market until after the fund’s inception, for the period from inception to the first day of secondary market trading in shares of the fund, the NAV of the fund is used as a proxy for the Market Price to calculate market returns. Market and NAV returns assume that dividends and capital gain distributions have been reinvested at Market Price and NAV, respectively.
An index is a statistical composite that tracks a specified financial market or sector. Unlike a fund, an index does not actually hold a portfolio of securities and therefore does not incur the expenses incurred by a fund. These expenses negatively impact fund performance. Also, market returns do not include brokerage commissions that may be payable on secondary market transactions. If brokerage commissions were included, market returns would be lower.
Shareholder Expenses
As a shareholder of your Fund, you incur two types of costs: (1) transaction costs, including brokerage commissions on purchases and sales of fund shares and (2) ongoing costs, including management fees and other fund expenses. The expense example, which is based on an investment of $1,000 invested at the beginning of the period and held through the end of the period, is intended to help you understand your ongoing costs (in dollars and cents) of investing in your Fund and to compare these costs with the ongoing costs of investing in other funds.
Actual Expenses — The table provides information about actual account values and actual expenses. Annualized expense ratios reflect contractual and voluntary fee waivers, if any. To estimate the expenses that you paid on your account over the period, simply divide your account value by $1,000 (for example, an $8,600 account value divided by $1,000 = 8.6), then multiply the result by the number under the heading entitled “Expenses Paid During the Period.”
Hypothetical Example for Comparison Purposes — The table also provides information about hypothetical account values and hypothetical expenses based on your Fund’s actual expense ratio and an assumed rate of return of 5% per year before expenses. You may use this information to compare the ongoing costs of investing in your Fund and other funds. To do so, compare this 5% hypothetical example with the 5% hypothetical examples that appear in the shareholder reports of the other funds.
Please note that the expenses shown in the table are meant to highlight your ongoing costs only and do not reflect any transactional costs, such as brokerage commissions paid on purchases and sales of fund shares. Therefore, the hypothetical examples are useful in comparing ongoing costs only and will not help you determine the relative total costs of owning different funds. In addition, if these transactional costs were included, your costs would have been higher.
| | |
| 6 | | 2020 BLACKROCK ANNUAL REPORTTO SHAREHOLDERS |
| | |
Schedule of Investments July 31, 2020 | | BlackRock U.S. Equity Factor Rotation ETF (Percentages shown are based on Net Assets) |
| | | | | | | | |
| Security | | Shares | | | Value | |
|
Common Stocks | |
|
| Communication Services — 8.9% | |
Activision Blizzard Inc. | | | 2,858 | | | $ | 236,156 | |
Alphabet Inc., Class A(a) | | | 447 | | | | 665,114 | |
Alphabet Inc., Class C, NVS(a) | | | 501 | | | | 742,963 | |
Altice USA Inc., Class A(a) | | | 774 | | | | 20,890 | |
AT&T Inc. | | | 57,047 | | | | 1,687,450 | |
Cable One Inc. | | | 22 | | | | 40,096 | |
CenturyLink Inc. | | | 10,801 | | | | 104,230 | |
Charter Communications Inc., Class A(a) | | | 319 | | | | 185,020 | |
Comcast Corp., Class A | | | 3,292 | | | | 140,898 | |
Discovery Inc., Class A(a)(b) | | | 929 | | | | 19,602 | |
Discovery Inc., Class C, NVS(a) | | | 4,266 | | | | 80,841 | |
DISH Network Corp., Class A(a) | | | 2,144 | | | | 68,844 | |
Electronic Arts Inc.(a) | | | 1,209 | | | | 171,219 | |
Facebook Inc., Class A(a) | | | 4,054 | | | | 1,028,378 | |
Fox Corp., Class A, NVS | | | 2,392 | | | | 61,642 | |
Fox Corp., Class B(a) | | | 1,215 | | | | 31,311 | |
IAC/InterActiveCorp.(a) | | | 97 | | | | 12,845 | |
Interpublic Group of Companies Inc. (The) | | | 3,330 | | | | 60,106 | |
Liberty Broadband Corp., Class A(a) | | | 118 | | | | 15,931 | |
Liberty Broadband Corp., Class C, NVS(a) | | | 213 | | | | 29,238 | |
Liberty Global PLC, Class A(a) | | | 189 | | | | 4,424 | |
Liberty Global PLC, Class C, NVS(a) | | | 998 | | | | 22,714 | |
Liberty Media Corp.-Liberty Formula One, Class C, NVS(a)(b) | | | 820 | | | | 29,061 | |
Liberty Media Corp.-Liberty SiriusXM, Class A(a) | | | 1,007 | | | | 35,033 | |
Liberty Media Corp.-Liberty SiriusXM, Class C,
NVS(a) | | | 1,297 | | | | 45,382 | |
Live Nation Entertainment Inc.(a) | | | 544 | | | | 25,465 | |
Match Group Inc.(a) | | | 514 | | | | 52,788 | |
Netflix Inc.(a) | | | 540 | | | | 263,995 | |
News Corp., Class A, NVS | | | 5,288 | | | | 67,263 | |
Omnicom Group Inc. | | | 1,616 | | | | 86,828 | |
Pinterest Inc., Class A(a) | | | 1,383 | | | | 47,423 | |
Roku Inc.(a) | | | 331 | | | | 51,269 | |
Sirius XM Holdings Inc. | | | 8,683 | | | | 51,056 | |
Snap Inc., Class A, NVS(a)(b) | | | 1,429 | | | | 32,038 | |
T-Mobile U.S. Inc.(a) | | | 3,575 | | | | 383,883 | |
Take-Two Interactive Software Inc.(a) | | | 1,133 | | | | 185,835 | |
Twitter Inc.(a) | | | 806 | | | | 29,338 | |
Verizon Communications Inc. | | | 5,813 | | | | 334,131 | |
ViacomCBS Inc., Class B, NVS | | | 6,710 | | | | 174,930 | |
Walt Disney Co. (The) | | | 5,401 | | | | 631,593 | |
Zillow Group Inc., Class C, NVS(a) | | | 635 | | | | 43,428 | |
| | | | | | | | |
| | | | | | | 8,000,651 | |
|
| Consumer Discretionary — 9.9% | |
Advance Auto Parts Inc.(b) | | | 270 | | | | 40,538 | |
Amazon.com Inc.(a) | | | 170 | | | | 537,995 | |
Aptiv PLC | | | 376 | | | | 29,234 | |
Aramark | | | 939 | | | | 19,832 | |
Autoliv Inc. | | | 454 | | | | 29,524 | |
AutoZone Inc.(a) | | | 110 | | | | 132,816 | |
Best Buy Co. Inc. | | | 2,818 | | | | 280,645 | |
Booking Holdings Inc.(a) | | | 330 | | | | 548,503 | |
BorgWarner Inc. | | | 2,711 | | | | 99,222 | |
Burlington Stores Inc.(a) | | | 231 | | | | 43,428 | |
CarMax Inc.(a) | | | 306 | | | | 29,673 | |
Carnival Corp.(b) | | | 6,448 | | | | 89,498 | |
Chipotle Mexican Grill Inc.(a) | | | 29 | | | | 33,500 | |
Darden Restaurants Inc. | | | 944 | | | | 71,650 | |
Dollar General Corp. | | | 1,132 | | | | 215,533 | |
| | | | | | | | |
| Security | | Shares | | | Value | |
|
| Consumer Discretionary (continued) | |
Dollar Tree Inc.(a) | | | 965 | | | $ | 90,083 | |
Domino’s Pizza Inc. | | | 116 | | | | 44,847 | |
DR Horton Inc. | | | 2,267 | | | | 149,985 | |
eBay Inc. | | | 906 | | | | 50,084 | |
Expedia Group Inc. | | | 735 | | | | 59,542 | |
Ford Motor Co. | | | 46,647 | | | | 308,337 | |
Garmin Ltd. | | | 1,569 | | | | 154,688 | |
General Motors Co. | | | 18,369 | | | | 457,204 | |
Genuine Parts Co. | | | 705 | | | | 63,556 | |
Hasbro Inc. | | | 367 | | | | 26,703 | |
Hilton Worldwide Holdings Inc. | | | 299 | | | | 22,440 | |
Home Depot Inc. (The) | | | 771 | | | | 204,693 | |
Las Vegas Sands Corp. | | | 511 | | | | 22,300 | |
Lear Corp. | | | 923 | | | | 101,881 | |
Lennar Corp., Class A | | | 2,685 | | | | 194,260 | |
LKQ Corp.(a) | | | 1,812 | | | | 51,080 | |
Lowe’s Companies Inc. | | | 204 | | | | 30,378 | |
Lululemon Athletica Inc.(a) | | | 921 | | | | 299,868 | |
Marriott International Inc./MD, Class A | | | 221 | | | | 18,525 | |
McDonald’s Corp. | | | 1,732 | | | | 336,493 | |
MercadoLibre Inc.(a) | | | 31 | | | | 34,863 | |
MGM Resorts International | | | 1,698 | | | | 27,321 | |
Mohawk Industries Inc.(a) | | | 808 | | | | 64,519 | |
Newell Brands Inc. | | | 5,289 | | | | 86,739 | |
Nike Inc., Class B | | | 10,185 | | | | 994,158 | |
NVR Inc.(a) | | | 30 | | | | 117,904 | |
O’Reilly Automotive Inc.(a) | | | 213 | | | | 101,682 | |
PulteGroup Inc. | | | 3,043 | | | | 132,675 | |
Ralph Lauren Corp. | | | 661 | | | | 47,129 | |
Ross Stores Inc. | | | 3,089 | | | | 276,991 | |
Royal Caribbean Cruises Ltd. | | | 1,859 | | | | 90,552 | |
Starbucks Corp. | | | 1,874 | | | | 143,417 | |
Target Corp. | | | 3,842 | | | | 483,631 | |
Tesla Inc.(a) | | | 314 | | | | 449,259 | |
Tiffany & Co. | | | 362 | | | | 45,380 | |
TJX Companies Inc. (The) | | | 9,163 | | | | 476,384 | |
Tractor Supply Co. | | | 244 | | | | 34,828 | |
Ulta Beauty Inc.(a) | | | 390 | | | | 75,266 | |
Vail Resorts Inc. | | | 137 | | | | 26,308 | |
VF Corp. | | | 2,130 | | | | 128,567 | |
Wayfair Inc., Class A(a)(b) | | | 157 | | | | 41,776 | |
Whirlpool Corp. | | | 686 | | | | 111,900 | |
Wynn Resorts Ltd. | | | 279 | | | | 20,208 | |
Yum! Brands Inc. | | | 224 | | | | 20,395 | |
| | | | | | | | |
| | | | | | | 8,920,390 | |
|
| Consumer Staples — 7.5% | |
Altria Group Inc. | | | 8,107 | | | | 333,603 | |
Archer-Daniels-Midland Co. | | | 797 | | | | 34,135 | |
Brown-Forman Corp., Class B, NVS | | | 649 | | | | 45,002 | |
Bunge Ltd. | | | 763 | | | | 33,145 | |
Campbell Soup Co. | | | 1,484 | | | | 73,562 | |
Church & Dwight Co. Inc. | | | 1,350 | | | | 130,045 | |
Clorox Co. (The) | | | 855 | | | | 202,216 | |
Coca-Cola Co. (The) | | | 27,110 | | | | 1,280,676 | |
Colgate-Palmolive Co. | | | 1,249 | | | | 96,423 | |
Conagra Brands Inc. | | | 2,126 | | | | 79,619 | |
Constellation Brands Inc., Class A | | | 148 | | | | 26,374 | |
Costco Wholesale Corp. | | | 548 | | | | 178,390 | |
Estee Lauder Companies Inc. (The), Class A | | | 1,924 | | | | 380,067 | |
General Mills Inc. | | | 1,784 | | | | 112,874 | |
| | |
SCHEDULE OF INVESTMENTS | | 7 |
| | |
Schedule of Investments (continued) July 31, 2020 | | BlackRock U.S. Equity Factor Rotation ETF (Percentages shown are based on Net Assets) |
| | | | | | | | |
| Security | | Shares | | | Value | |
| | |
| Consumer Staples (continued) | | | | | | |
Hershey Co. (The) | | | 2,748 | | | $ | 399,587 | |
Hormel Foods Corp. | | | 4,893 | | | | 248,858 | |
Ingredion Inc. | | | 743 | | | | 64,269 | |
JM Smucker Co. (The) | | | 1,387 | | | | 151,668 | |
Kellogg Co. | | | 1,961 | | | | 135,289 | |
Keurig Dr Pepper Inc. | | | 941 | | | | 28,785 | |
Kimberly-Clark Corp. | | | 655 | | | | 99,586 | |
Kraft Heinz Co. (The) | | | 6,174 | | | | 212,262 | |
Kroger Co. (The) | | | 8,653 | | | | 301,038 | |
Lamb Weston Holdings Inc. | | | 2,094 | | | | 125,808 | |
McCormick & Co. Inc./MD, NVS | | | 738 | | | | 143,836 | |
Molson Coors Beverage Co., Class B | | | 2,551 | | | | 95,714 | |
Mondelez International Inc., Class A | | | 2,510 | | | | 139,280 | |
Monster Beverage Corp.(a) | | | 2,877 | | | | 225,787 | |
PepsiCo Inc. | | | 2,406 | | | | 331,210 | |
Philip Morris International Inc. | | | 743 | | | | 57,070 | |
Procter & Gamble Co. (The) | | | 2,443 | | | | 320,326 | |
Sysco Corp. | | | 456 | | | | 24,100 | |
Tyson Foods Inc., Class A | | | 2,651 | | | | 162,904 | |
Walmart Inc. | | | 1,427 | | | | 184,654 | |
Walgreens Boots Alliance Inc. | | | 7,172 | | | | 291,972 | |
| | | | | | | | |
| | | | | | | 6,750,134 | |
| | |
| Energy — 2.0% | | | | | | |
Baker Hughes Co. | | | 10,893 | | | | 168,733 | |
Cabot Oil & Gas Corp. | | | 2,254 | | | | 42,150 | |
Cheniere Energy Inc.(a) | | | 1,086 | | | | 53,735 | |
Chevron Corp. | | | 398 | | | | 33,408 | |
Concho Resources Inc. | | | 1,697 | | | | 89,160 | |
ConocoPhillips | | | 617 | | | | 23,070 | |
Diamondback Energy Inc. | | | 1,180 | | | | 47,035 | |
EOG Resources Inc. | | | 468 | | | | 21,926 | |
Exxon Mobil Corp. | | | 12,311 | | | | 518,047 | |
Halliburton Co. | | | 2,247 | | | | 32,199 | |
Hess Corp. | | | 544 | | | | 26,770 | |
HollyFrontier Corp. | | | 2,289 | | | | 62,947 | |
Kinder Morgan Inc./DE | | | 8,874 | | | | 125,123 | |
Marathon Petroleum Corp. | | | 6,163 | | | | 235,427 | |
National Oilwell Varco Inc. | | | 2,229 | | | | 25,656 | |
Occidental Petroleum Corp.(b) | | | 1,739 | | | | 27,372 | |
ONEOK Inc. | | | 1,405 | | | | 39,213 | |
Phillips 66 | | | 1,196 | | | | 74,176 | |
Pioneer Natural Resources Co. | | | 280 | | | | 27,138 | |
Schlumberger Ltd. | | | 1,569 | | | | 28,462 | |
Valero Energy Corp. | | | 1,331 | | | | 74,842 | |
Williams Companies Inc. (The) | | | 1,143 | | | | 21,866 | |
| | | | | | | | |
| | | | | | | 1,798,455 | |
| | |
| Financials — 10.7% | | | | | | |
Aflac Inc. | | | 5,134 | | | | 182,616 | |
AGNC Investment Corp. | | | 4,522 | | | | 61,499 | |
Alleghany Corp. | | | 146 | | | | 76,259 | |
Allstate Corp. (The) | | | 1,711 | | | | 161,501 | |
Ally Financial Inc. | | | 4,106 | | | | 82,531 | |
American Express Co. | | | 470 | | | | 43,860 | |
American Financial Group Inc./OH | | | 548 | | | | 33,302 | |
American International Group Inc. | | | 5,607 | | | | 180,209 | |
Ameriprise Financial Inc. | | | 986 | | | | 151,479 | |
Annaly Capital Management Inc. | | | 10,927 | | | | 80,969 | |
Aon PLC, Class A | | | 2,344 | | | | 481,036 | |
Apollo Global Management Inc. | | | 685 | | | | 33,634 | |
| | | | | | | | |
| Security | | Shares | | | Value | |
| | |
| Financials (continued) | | | | | | |
Arch Capital Group Ltd.(a) | | | 3,255 | | | $ | 100,091 | |
Arthur J Gallagher & Co. | | | 1,632 | | | | 175,424 | |
Assurant Inc. | | | 294 | | | | 31,596 | |
Athene Holding Ltd., Class A(a)(b) | | | 1,890 | | | | 60,953 | |
Bank of America Corp. | | | 1,369 | | | | 34,061 | |
Bank of New York Mellon Corp. (The) | | | 1,155 | | | | 41,407 | |
Berkshire Hathaway Inc., Class B(a) | | | 765 | | | | 149,772 | |
Blackstone Group Inc. (The), Class A | | | 808 | | | | 43,050 | |
Brown & Brown Inc. | | | 3,353 | | | | 152,461 | |
Capital One Financial Corp. | | | 2,619 | | | | 167,092 | |
Carlyle Group Inc. (The) | | | 1,353 | | | | 38,520 | |
Cboe Global Markets Inc. | | | 991 | | | | 86,911 | |
Charles Schwab Corp. (The) | | | 7,728 | | | | 256,183 | |
Cincinnati Financial Corp. | | | 962 | | | | 74,969 | |
Citigroup Inc. | | | 9,326 | | | | 466,393 | |
Citizens Financial Group Inc. | | | 3,293 | | | | 81,699 | |
CME Group Inc. | | | 942 | | | | 156,542 | |
Comerica Inc. | | | 1,090 | | | | 41,987 | |
Discover Financial Services | | | 704 | | | | 34,799 | |
E*TRADE Financial Corp. | | | 797 | | | | 40,464 | |
East West Bancorp. Inc. | | | 1,671 | | | | 57,917 | |
Equitable Holdings Inc. | | | 4,505 | | | | 92,172 | |
Erie Indemnity Co., Class A, NVS | | | 448 | | | | 94,134 | |
Everest Re Group Ltd. | | | 870 | | | | 190,347 | |
FactSet Research Systems Inc. | | | 468 | | | | 162,068 | |
Fidelity National Financial Inc. | | | 4,179 | | | | 135,232 | |
Fifth Third Bancorp. | | | 2,872 | | | | 57,038 | |
First Republic Bank/CA | | | 269 | | | | 30,257 | |
Franklin Resources Inc. | | | 3,607 | | | | 75,927 | |
Globe Life Inc. | | | 416 | | | | 33,114 | |
Goldman Sachs Group Inc. (The) | | | 1,314 | | | | 260,119 | |
Hartford Financial Services Group Inc. (The) | | | 2,359 | | | | 99,833 | |
Huntington Bancshares Inc./OH | | | 3,306 | | | | 30,647 | |
Intercontinental Exchange Inc. | | | 1,766 | | | | 170,913 | |
Invesco Ltd. | | | 6,312 | | | | 63,372 | |
JPMorgan Chase & Co. | | | 508 | | | | 49,093 | |
KeyCorp | | | 2,526 | | | | 30,337 | |
KKR & Co. Inc. | | | 1,026 | | | | 36,290 | |
Lincoln National Corp. | | | 1,948 | | | | 72,602 | |
Loews Corp. | | | 2,406 | | | | 87,602 | |
M&T Bank Corp. | | | 449 | | | | 47,572 | |
Markel Corp.(a) | | | 125 | | | | 130,568 | |
MarketAxess Holdings Inc. | | | 449 | | | | 231,998 | |
Marsh & McLennan Companies Inc. | | | 1,737 | | | | 202,534 | |
MetLife Inc. | | | 4,446 | | | | 168,281 | |
Moody’s Corp. | | | 339 | | | | 95,361 | |
Morgan Stanley | | | 4,745 | | | | 231,936 | |
MSCI Inc. | | | 238 | | | | 89,483 | |
Nasdaq Inc. | | | 412 | | | | 54,100 | |
Northern Trust Corp. | | | 447 | | | | 35,022 | |
People’s United Financial Inc. | | | 2,475 | | | | 26,705 | |
PNC Financial Services Group Inc. (The) | | | 259 | | | | 27,628 | |
Principal Financial Group Inc. | | | 1,412 | | | | 59,911 | |
Progressive Corp. (The) | | | 5,653 | | | | 510,692 | |
Prudential Financial Inc. | | | 2,446 | | | | 155,003 | |
Raymond James Financial Inc. | | | 532 | | | | 36,963 | |
Regions Financial Corp. | | | 6,117 | | | | 66,431 | |
Reinsurance Group of America Inc. | | | 445 | | | | 37,936 | |
RenaissanceRe Holdings Ltd. | | | 832 | | | | 150,076 | |
S&P Global Inc. | | | 465 | | | | 162,866 | |
| | |
| 8 | | 2020 BLACKROCK ANNUAL REPORTTO SHAREHOLDERS |
| | |
Schedule of Investments (continued) July 31, 2020 | | BlackRock U.S. Equity Factor Rotation ETF (Percentages shown are based on Net Assets) |
| | | | | | | | |
| Security | | Shares | | | Value | |
| | |
| Financials (continued) | | | | | | |
SEI Investments Co. | | | 1,818 | | | $ | 95,136 | |
Signature Bank/New York NY | | | 284 | | | | 29,119 | |
State Street Corp. | | | 619 | | | | 39,486 | |
SVB Financial Group(a) | | | 457 | | | | 102,491 | |
Synchrony Financial | | | 1,626 | | | | 35,983 | |
T Rowe Price Group Inc. | | | 2,349 | | | | 324,397 | |
TD Ameritrade Holding Corp. | | | 2,488 | | | | 89,294 | |
Tradeweb Markets Inc., Class A | | | 593 | | | | 32,064 | |
Travelers Companies Inc. (The) | | | 1,273 | | | | 145,657 | |
Truist Financial Corp. | | | 1,027 | | | | 38,471 | |
U.S. Bancorp. | | | 2,946 | | | | 108,531 | |
Voya Financial Inc. | | | 1,799 | | | | 88,871 | |
Wells Fargo & Co. | | | 1,369 | | | | 33,212 | |
Willis Towers Watson PLC | | | 437 | | | | 91,774 | |
WR Berkley Corp. | | | 2,959 | | | | 182,718 | |
Zions Bancorp. N.A. | | | 953 | | | | 30,944 | |
| | | | | | | | |
| | | | | | | 9,621,497 | |
| | |
| Health Care — 16.1% | | | | | | |
Abbott Laboratories | | | 946 | | | | 95,205 | |
AbbVie Inc. | | | 4,107 | | | | 389,795 | |
ABIOMED Inc.(a) | | | 136 | | | | 40,792 | |
Agilent Technologies Inc. | | | 324 | | | | 31,211 | |
Alexion Pharmaceuticals Inc.(a) | | | 666 | | | | 68,258 | |
Align Technology Inc.(a) | | | 321 | | | | 94,316 | |
Alnylam Pharmaceuticals Inc.(a) | | | 323 | | | | 47,080 | |
AmerisourceBergen Corp. | | | 853 | | | | 85,462 | |
Amgen Inc. | | | 2,413 | | | | 590,389 | |
Anthem Inc. | | | 1,060 | | | | 290,228 | |
Avantor Inc.(a) | | | 1,955 | | | | 43,166 | |
Baxter International Inc. | | | 2,417 | | | | 208,780 | |
Becton Dickinson and Co. | | | 299 | | | | 84,121 | |
Biogen Inc.(a) | | | 1,303 | | | | 357,921 | |
BioMarin Pharmaceutical Inc.(a) | | | 764 | | | | 91,535 | |
Bio-Rad Laboratories Inc., Class A(a) | | | 83 | | | | 43,566 | |
Boston Scientific Corp.(a) | | | 592 | | | | 22,833 | |
Bristol-Myers Squibb Co. | | | 7,257 | | | | 425,696 | |
Cardinal Health Inc. | | | 2,574 | | | | 140,592 | |
Catalent Inc.(a) | | | 526 | | | | 45,941 | |
Centene Corp.(a) | | | 2,286 | | | | 149,161 | |
Cerner Corp. | | | 562 | | | | 39,031 | |
Cigna Corp.(a) | | | 1,690 | | | | 291,846 | |
Cooper Companies Inc. (The) | | | 269 | | | | 76,108 | |
CVS Health Corp. | | | 5,375 | | | | 338,302 | |
Danaher Corp. | | | 1,950 | | | | 397,410 | |
DaVita Inc.(a) | | | 714 | | | | 62,396 | |
Dentsply Sirona Inc. | | | 995 | | | | 44,377 | |
DexCom Inc.(a) | | | 236 | | | | 102,787 | |
Edwards Lifesciences Corp.(a) | | | 1,814 | | | | 142,236 | |
Elanco Animal Health Inc.(a) | | | 1,328 | | | | 31,381 | |
Eli Lilly & Co. | | | 3,073 | | | | 461,841 | |
Exact Sciences Corp.(a) | | | 300 | | | | 28,425 | |
Gilead Sciences Inc. | | | 9,485 | | | | 659,492 | |
HCA Healthcare Inc. | | | 225 | | | | 28,494 | |
Henry Schein Inc.(a) | | | 914 | | | | 62,819 | |
Hologic Inc.(a) | | | 493 | | | | 34,402 | |
Humana Inc. | | | 439 | | | | 172,286 | |
IDEXX Laboratories Inc.(a) | | | 68 | | | | 27,047 | |
Illumina Inc.(a) | | | 388 | | | | 148,278 | |
Incyte Corp.(a) | | | 831 | | | | 82,070 | |
Insulet Corp.(a) | | | 237 | | | | 48,196 | |
| | | | | | | | |
| Security | | Shares | | | Value | |
| | |
| Health Care (continued) | | | | | | |
Intuitive Surgical Inc.(a) | | | 282 | | | $ | 193,294 | |
Ionis Pharmaceuticals Inc.(a) | | | 480 | | | | 27,629 | |
IQVIA Holdings Inc.(a) | | | 172 | | | | 27,243 | |
Jazz Pharmaceuticals PLC(a) | | | 407 | | | | 44,058 | |
Johnson & Johnson | | | 10,264 | | | | 1,496,081 | |
Laboratory Corp. of America Holdings(a) | | | 150 | | | | 28,938 | |
Masimo Corp.(a) | | | 193 | | | | 42,483 | |
McKesson Corp. | | | 961 | | | | 144,304 | |
Medtronic PLC | | | 2,550 | | | | 246,024 | |
Merck & Co. Inc. | | | 10,126 | | | | 812,510 | |
Mettler-Toledo International Inc.(a) | | | 86 | | | | 80,410 | |
Moderna Inc.(a)(b) | | | 978 | | | | 72,470 | |
Molina Healthcare Inc.(a) | | | 180 | | | | 33,246 | |
Mylan NV(a) | | | 4,564 | | | | 73,526 | |
Neurocrine Biosciences Inc.(a) | | | 281 | | | | 33,821 | |
PerkinElmer Inc. | | | 282 | | | | 33,533 | |
Perrigo Co. PLC | | | 883 | | | | 46,817 | |
Pfizer Inc. | | | 30,068 | | | | 1,157,017 | |
Quest Diagnostics Inc. | | | 351 | | | | 44,602 | |
Regeneron Pharmaceuticals Inc.(a) | | | 847 | | | | 535,363 | |
ResMed Inc. | | | 322 | | | | 65,208 | |
Sarepta Therapeutics Inc.(a) | | | 242 | | | | 37,152 | |
Seattle Genetics Inc.(a) | | | 357 | | | | 59,358 | |
Steris PLC | | | 162 | | | | 25,860 | |
Stryker Corp. | | | 722 | | | | 139,563 | |
Teladoc Health Inc.(a)(b) | | | 282 | | | | 67,012 | |
Teleflex Inc. | | | 73 | | | | 27,236 | |
Thermo Fisher Scientific Inc. | | | 490 | | | | 202,835 | |
UnitedHealth Group Inc. | | | 3,487 | | | | 1,055,794 | |
Universal Health Services Inc., Class B | | | 765 | | | | 84,073 | |
Varian Medical Systems Inc.(a) | | | 423 | | | | 60,371 | |
Veeva Systems Inc., Class A(a) | | | 566 | | | | 149,747 | |
Vertex Pharmaceuticals Inc.(a) | | | 1,460 | | | | 397,120 | |
Waters Corp.(a) | | | 133 | | | | 28,349 | |
West Pharmaceutical Services Inc. | | | 248 | | | | 66,680 | |
Zimmer Biomet Holdings Inc. | | | 281 | | | | 37,896 | |
Zoetis Inc. | | | 1,148 | | | | 174,129 | |
| | | | | | | | |
| | | | | | | 14,477,024 | |
| | |
| Industrials — 8.8% | | | | | | |
3M Co. | | | 163 | | | | 24,527 | |
Allegion PLC | | | 961 | | | | 95,581 | |
AMERCO | | | 244 | | | | 77,526 | |
AMETEK Inc. | | | 242 | | | | 22,567 | |
AO Smith Corp. | | | 1,664 | | | | 80,105 | |
Boeing Co. (The) | | | 188 | | | | 29,704 | |
Carrier Global Corp. | | | 18,983 | | | | 517,097 | |
Caterpillar Inc. | | | 223 | | | | 29,632 | |
CH Robinson Worldwide Inc. | | | 3,251 | | | | 304,684 | |
Cintas Corp. | | | 106 | | | | 31,998 | |
Copart Inc.(a) | | | 2,215 | | | | 206,549 | |
CoStar Group Inc.(a) | | | 77 | | | | 65,432 | |
CSX Corp. | | | 383 | | | | 27,323 | |
Cummins Inc. | | | 2,460 | | | | 475,420 | |
Deere & Co. | | | 186 | | | | 32,794 | |
Delta Air Lines Inc. | | | 1,189 | | | | 29,689 | |
Dover Corp. | | | 307 | | | | 31,600 | |
Eaton Corp. PLC | | | 2,606 | | | | 242,697 | |
Emerson Electric Co. | | | 490 | | | | 30,385 | |
Equifax Inc. | | | 227 | | | | 36,901 | |
Expeditors International of Washington Inc. | | | 1,806 | | | | 152,625 | |
| | |
SCHEDULE OF INVESTMENTS | | 9 |
| | |
Schedule of Investments (continued) July 31, 2020 | | BlackRock U.S. Equity Factor Rotation ETF (Percentages shown are based on Net Assets) |
| | | | | | | | |
| Security | | Shares | | | Value | |
| | |
| Industrials (continued) | | | | | | |
Fastenal Co. | | | 5,670 | | | $ | 266,717 | |
FedEx Corp. | | | 1,926 | | | | 324,338 | |
Fortive Corp. | | | 445 | | | | 31,235 | |
Fortune Brands Home & Security Inc. | | | 438 | | | | 33,507 | |
General Dynamics Corp. | | | 207 | | | | 30,375 | |
General Electric Co. | | | 4,009 | | | | 24,335 | |
HD Supply Holdings Inc.(a) | | | 1,313 | | | | 46,086 | |
HEICO Corp. | | | 115 | | | | 11,054 | |
HEICO Corp., Class A | | | 208 | | | | 15,922 | |
Honeywell International Inc. | | | 650 | | | | 97,091 | |
Howmet Aerospace Inc. | | | 3,856 | | | | 56,992 | |
Huntington Ingalls Industries Inc. | | | 531 | | | | 92,240 | |
IDEX Corp. | | | 169 | | | | 27,855 | |
IHS Markit Ltd. | | | 666 | | | | 53,766 | |
Illinois Tool Works Inc. | | | 3,122 | | | | 577,539 | |
Ingersoll Rand Inc.(a) | | | 838 | | | | 26,472 | |
Jacobs Engineering Group Inc. | | | 349 | | | | 29,787 | |
JB Hunt Transport Services Inc. | | | 261 | | | | 33,773 | |
Johnson Controls International PLC | | | 5,182 | | | | 199,403 | |
Kansas City Southern | | | 178 | | | | 30,589 | |
Knight-Swift Transportation Holdings Inc. | | | 2,024 | | | | 88,024 | |
L3Harris Technologies Inc. | | | 703 | | | | 118,336 | |
Lennox International Inc. | | | 134 | | | | 35,931 | |
Lockheed Martin Corp. | | | 460 | | | | 174,326 | |
Masco Corp. | | | 564 | | | | 32,238 | |
Nielsen Holdings PLC | | | 3,539 | | | | 51,068 | |
Nordson Corp. | | | 155 | | | | 30,013 | |
Norfolk Southern Corp. | | | 154 | | | | 29,600 | |
Northrop Grumman Corp. | | | 134 | | | | 43,551 | |
Old Dominion Freight Line Inc. | | | 301 | | | | 55,029 | |
Otis Worldwide Corp. | | | 680 | | | | 42,663 | |
Owens Corning | | | 1,728 | | | | 104,492 | |
PACCAR Inc. | | | 2,624 | | | | 223,250 | |
Parker-Hannifin Corp. | | | 146 | | | | 26,122 | |
Pentair PLC | | | 791 | | | | 33,894 | |
Raytheon Technologies Corp. | | | 431 | | | | 24,429 | |
Republic Services Inc. | | | 3,690 | | | | 321,953 | |
Robert Half International Inc. | | | 1,677 | | | | 85,309 | |
Rockwell Automation Inc. | | | 193 | | | | 42,101 | |
Rollins Inc. | | | 792 | | | | 41,501 | |
Roper Technologies Inc. | | | 72 | | | | 31,136 | |
Sensata Technologies Holding PLC(a) | | | 644 | | | | 24,459 | |
Snap-on Inc. | | | 326 | | | | 47,554 | |
Southwest Airlines Co. | | | 2,244 | | | | 69,317 | |
Stanley Black & Decker Inc. | | | 215 | | | | 32,964 | |
Teledyne Technologies Inc.(a) | | | 109 | | | | 33,430 | |
Textron Inc. | | | 2,381 | | | | 83,192 | |
Trane Technologies PLC | | | 328 | | | | 36,693 | |
TransDigm Group Inc. | | | 68 | | | | 29,347 | |
TransUnion | | | 316 | | | | 28,304 | |
Uber Technologies Inc.(a) | | | 685 | | | | 20,728 | |
Union Pacific Corp. | | | 176 | | | | 30,510 | |
United Parcel Service Inc., Class B | | | 247 | | | | 35,262 | |
United Rentals Inc.(a) | | | 1,093 | | | | 169,819 | |
Verisk Analytics Inc. | | | 589 | | | | 111,150 | |
Waste Connections Inc. | | | 2,779 | | | | 284,486 | |
Waste Management Inc. | | | 2,991 | | | | 327,814 | |
Westinghouse Air Brake Technologies Corp. | | | 1,385 | | | | 86,133 | |
WW Grainger Inc. | | | 487 | | | | 166,325 | |
XPO Logistics Inc.(a) | | | 370 | | | | 27,757 | |
| | | | | | | | |
| Security | | Shares | | | Value | |
| | |
| Industrials (continued) | | | | | | |
Xylem Inc./NY | | | 423 | | | $ | 30,871 | |
| | | | | | | | |
| | | | | | | 7,864,993 | |
| | |
| Information Technology — 24.2% | | | | | | |
Accenture PLC, Class A | | | 2,870 | | | | 645,119 | |
Adobe Inc.(a) | | | 2,130 | | | | 946,402 | |
Advanced Micro Devices Inc.(a) | | | 2,093 | | | | 162,061 | |
Akamai Technologies Inc.(a) | | | 1,393 | | | | 156,629 | |
Amphenol Corp., Class A | | | 1,436 | | | | 151,871 | |
Analog Devices Inc. | | | 256 | | | | 29,402 | |
ANSYS Inc.(a) | | | 199 | | | | 61,809 | |
Apple Inc. | | | 4,001 | | | | 1,700,585 | |
Applied Materials Inc. | | | 5,650 | | | | 363,464 | |
Arista Networks Inc.(a)(b) | | | 223 | | | | 57,929 | |
Arrow Electronics Inc.(a) | | | 994 | | | | 71,190 | |
Autodesk Inc.(a) | | | 329 | | | | 77,785 | |
Automatic Data Processing Inc. | | | 2,097 | | | | 278,712 | |
Avalara Inc.(a) | | | 355 | | | | 47,730 | |
Black Knight Inc.(a) | | | 2,722 | | | | 203,932 | |
Booz Allen Hamilton Holding Corp. | | | 1,016 | | | | 83,068 | |
Broadcom Inc. | | | 232 | | | | 73,486 | |
Broadridge Financial Solutions Inc. | | | 1,038 | | | | 139,445 | |
Cadence Design Systems Inc.(a) | | | 1,079 | | | | 117,881 | |
CDK Global Inc. | | | 1,032 | | | | 46,915 | |
CDW Corp./DE | | | 218 | | | | 25,343 | |
Cisco Systems Inc. | | | 12,328 | | �� | | 580,649 | |
Citrix Systems Inc. | | | 2,389 | | | | 341,054 | |
Cognex Corp. | | | 424 | | | | 28,353 | |
Cognizant Technology Solutions Corp., Class A | | | 3,041 | | | | 207,761 | |
Corning Inc. | | | 5,786 | | | | 179,366 | |
Coupa Software Inc.(a) | | | 201 | | | | 61,596 | |
Crowdstrike Holdings Inc., Class A(a) | | | 473 | | | | 53,544 | |
Datadog Inc., Class A(a) | | | 511 | | | | 47,962 | |
Dell Technologies Inc., Class C(a) | | | 1,699 | | | | 101,651 | |
DocuSign Inc.(a) | | | 529 | | | | 114,703 | |
Dropbox Inc., Class A(a) | | | 1,176 | | | | 26,754 | |
Dynatrace Inc.(a) | | | 946 | | | | 39,571 | |
EPAM Systems Inc.(a)(b) | | | 196 | | | | 56,856 | |
F5 Networks Inc.(a) | | | 435 | | | | 59,117 | |
Fair Isaac Corp.(a) | | | 154 | | | | 67,635 | |
Fidelity National Information Services Inc. | | | 1,763 | | | | 257,945 | |
Fiserv Inc.(a) | | | 1,779 | | | | 177,526 | |
FleetCor Technologies Inc.(a) | | | 299 | | | | 77,312 | |
FLIR Systems Inc. | | | 1,137 | | | | 47,367 | |
Fortinet Inc.(a) | | | 334 | | | | 46,192 | |
Gartner Inc.(a) | | | 202 | | | | 25,177 | |
Global Payments Inc. | | | 329 | | | | 58,569 | |
GoDaddy Inc., Class A(a) | | | 315 | | | | 22,138 | |
Guidewire Software Inc.(a) | | | 272 | | | | 32,004 | |
Hewlett Packard Enterprise Co. | | | 16,903 | | | | 166,833 | |
HP Inc. | | | 12,689 | | | | 223,073 | |
Intel Corp. | | | 41,309 | | | | 1,971,679 | |
International Business Machines Corp. | | | 6,002 | | | | 737,886 | |
Intuit Inc. | | | 909 | | | | 278,490 | |
IPG Photonics Corp.(a)(b) | | | 170 | | | | 30,432 | |
Jack Henry & Associates Inc. | | | 1,508 | | | | 268,876 | |
Juniper Networks Inc. | | | 4,350 | | | | 110,403 | |
Keysight Technologies Inc.(a) | | | 1,624 | | | | 162,221 | |
KLA Corp. | | | 457 | | | | 91,322 | |
Lam Research Corp. | | | 1,302 | | | | 491,062 | |
Leidos Holdings Inc. | | | 384 | | | | 36,541 | |
| | |
| 10 | | 2020 BLACKROCK ANNUAL REPORTTO SHAREHOLDERS |
| | |
Schedule of Investments (continued) July 31, 2020 | | BlackRock U.S. Equity Factor Rotation ETF (Percentages shown are based on Net Assets) |
| | | | | | | | |
| Security | | Shares | | | Value | |
|
| Information Technology (continued) | |
Marvell Technology Group Ltd. | | | 957 | | | $ | 34,902 | |
Mastercard Inc., Class A | | | 3,175 | | | | 979,583 | |
Maxim Integrated Products Inc. | | | 1,135 | | | | 77,282 | |
Microchip Technology Inc. | | | 252 | | | | 25,636 | |
Micron Technology Inc.(a) | | | 14,124 | | | | 706,977 | |
Microsoft Corp. | | | 8,183 | | | | 1,677,597 | |
MongoDB Inc.(a)(b) | | | 162 | | | | 37,111 | |
Motorola Solutions Inc. | | | 1,315 | | | | 183,837 | |
NetApp Inc. | | | 1,601 | | | | 70,924 | |
NortonLifeLock Inc. | | | 4,917 | | | | 105,470 | |
NVIDIA Corp. | | | 912 | | | | 387,226 | |
NXP Semiconductors NV | | | 859 | | | | 100,958 | |
Okta Inc.(a) | | | 290 | | | | 64,084 | |
ON Semiconductor Corp.(a) | | | 4,158 | | | | 85,655 | |
Oracle Corp. | | | 8,087 | | | | 448,424 | |
Palo Alto Networks Inc.(a) | | | 256 | | | | 65,516 | |
Paychex Inc. | | | 3,985 | | | | 286,601 | |
Paycom Software Inc.(a) | | | 247 | | | | 70,239 | |
PayPal Holdings Inc.(a) | | | 186 | | | | 36,469 | |
PTC Inc.(a) | | | 354 | | | | 30,288 | |
Qorvo Inc.(a) | | | 1,083 | | | | 138,786 | |
Qualcomm Inc. | | | 308 | | | | 32,528 | |
RingCentral Inc., Class A(a) | | | 206 | | | | 59,796 | |
salesforce.com Inc.(a) | | | 140 | | | | 27,279 | |
Seagate Technology PLC | | | 2,577 | | | | 116,532 | |
ServiceNow Inc.(a) | | | 314 | | | | 137,909 | |
Skyworks Solutions Inc. | | | 1,101 | | | | 160,284 | |
Slack Technologies Inc., Class A(a)(b) | | | 1,174 | | | | 34,692 | |
Splunk Inc.(a) | | | 272 | | | | 57,071 | |
Square Inc., Class A(a) | | | 313 | | | | 40,643 | |
SS&C Technologies Holdings Inc. | | | 388 | | | | 22,310 | |
Synopsys Inc.(a) | | | 334 | | | | 66,539 | |
TE Connectivity Ltd. | | | 1,222 | | | | 108,844 | |
Teradyne Inc. | | | 913 | | | | 81,220 | |
Texas Instruments Inc. | | | 3,084 | | | | 393,364 | |
Trade Desk Inc. (The), Class A(a) | | | 86 | | | | 38,814 | |
Trimble Inc.(a) | | | 670 | | | | 29,822 | |
Twilio Inc., Class A(a) | | | 136 | | | | 37,729 | |
Tyler Technologies Inc.(a) | | | 657 | | | | 234,713 | |
VeriSign Inc.(a) | | | 482 | | | | 102,030 | |
Visa Inc., Class A | | | 5,720 | | | | 1,089,088 | |
VMware Inc., Class A(a) | | | 170 | | | | 23,836 | |
Western Digital Corp. | | | 3,255 | | | | 140,290 | |
Western Union Co. (The) | | | 7,647 | | | | 185,669 | |
Workday Inc., Class A(a) | | | 160 | | | | 28,947 | |
Xilinx Inc. | | | 814 | | | | 87,383 | |
Zebra Technologies Corp., Class A(a) | | | 103 | | | | 28,917 | |
Zoom Video Communications Inc., Class A(a) | | | 349 | | | | 88,615 | |
| | | | | | | | |
| | | | | | | 21,788,807 | |
| | |
| Materials — 3.0% | | | | | | |
Air Products & Chemicals Inc. | | | 1,164 | | | | 333,637 | |
Albemarle Corp. | | | 636 | | | | 52,445 | |
Amcor PLC(a) | | | 6,899 | | | | 71,060 | |
Avery Dennison Corp. | | | 622 | | | | 70,497 | |
Axalta Coating Systems Ltd.(a) | | | 1,090 | | | | 24,198 | |
Ball Corp. | | | 651 | | | | 47,933 | |
Celanese Corp. | | | 627 | | | | 60,944 | |
CF Industries Holdings Inc. | | | 922 | | | | 28,886 | |
Corteva Inc.(a) | | | 3,102 | | | | 88,593 | |
Crown Holdings Inc.(a) | | | 342 | | | | 24,480 | |
| | | | | | | | |
| Security | | Shares | | | Value | |
| | |
| Materials (continued) | | | | | | |
Dow Inc.(a) | | | 2,394 | | | $ | 98,298 | |
DuPont de Nemours Inc. | | | 587 | | | | 31,393 | |
Eastman Chemical Co. | | | 957 | | | | 71,421 | |
Ecolab Inc. | | | 1,659 | | | | 310,366 | |
FMC Corp. | | | 280 | | | | 29,694 | |
Freeport-McMoRan Inc. | | | 2,898 | | | | 37,442 | |
International Flavors & Fragrances Inc. | | | 183 | | | | 23,049 | |
International Paper Co. | | | 2,201 | | | | 76,573 | |
Linde PLC | | | 218 | | | | 53,434 | |
LyondellBasell Industries NV, Class A | | | 2,562 | | | | 160,176 | |
Martin Marietta Materials Inc. | | | 155 | | | | 32,113 | |
Mosaic Co. (The) | | | 4,416 | | | | 59,483 | |
Newmont Corp. | | | 6,151 | | | | 425,649 | |
Nucor Corp. | | | 1,869 | | | | 78,404 | |
Packaging Corp. of America | | | 613 | | | | 58,922 | |
PPG Industries Inc. | | | 975 | | | | 104,959 | |
RPM International Inc. | | | 407 | | | | 33,207 | |
Sealed Air Corp. | | | 946 | | | | 33,753 | |
Sherwin-Williams Co. (The) | | | 39 | | | | 25,269 | |
Steel Dynamics Inc. | | | 2,183 | | | | 59,836 | |
Vulcan Materials Co. | | | 271 | | | | 31,821 | |
Westrock Co. | | | 2,746 | | | | 73,758 | |
| | | | | | | | |
| | | | | | | 2,711,693 | |
| | |
| Real Estate — 4.2% | | | | | | |
Alexandria Real Estate Equities Inc.(b) | | | 173 | | | | 30,716 | |
American Tower Corp.(b) | | | 1,254 | | | | 327,783 | |
AvalonBay Communities Inc. | | | 964 | | | | 147,608 | |
Boston Properties Inc. | | | 296 | | | | 26,371 | |
Camden Property Trust | | | 1,145 | | | | 103,977 | |
CBRE Group Inc., Class A(a) | | | 4,966 | | | | 217,560 | |
Crown Castle International Corp. | | | 1,439 | | | | 239,881 | |
Digital Realty Trust Inc. | | | 486 | | | | 78,022 | |
Duke Realty Corp. | | | 2,144 | | | | 86,167 | |
Equinix Inc. | | | 180 | | | | 141,386 | |
Equity LifeStyle Properties Inc. | | | 386 | | | | 26,372 | |
Equity Residential | | | 2,507 | | | | 134,450 | |
Essex Property Trust Inc. | | | 362 | | | | 79,908 | |
Extra Space Storage Inc. | | | 924 | | | | 95,486 | |
Federal Realty Investment Trust | | | 320 | | | | 24,416 | |
Healthpeak Properties Inc. | | | 1,232 | | | | 33,621 | |
Host Hotels & Resorts Inc. | | | 19,128 | | | | 206,200 | |
Invitation Homes Inc. | | | 984 | | | | 29,343 | |
Iron Mountain Inc. | | | 1,751 | | | | 49,361 | |
Jones Lang LaSalle Inc. | | | 1,087 | | | | 107,515 | |
Medical Properties Trust Inc. | | | 2,497 | | | | 50,265 | |
Mid-America Apartment Communities Inc. | | | 644 | | | | 76,758 | |
National Retail Properties Inc. | | | 1,404 | | | | 49,772 | |
Omega Healthcare Investors Inc. | | | 848 | | | | 27,458 | |
Prologis Inc. | | | 2,798 | | | | 294,965 | |
Public Storage | | | 2,218 | | | | 443,334 | |
Realty Income Corp. | | | 499 | | | | 29,965 | |
Regency Centers Corp. | | | 601 | | | | 24,659 | |
SBA Communications Corp. | | | 331 | | | | 103,120 | |
Simon Property Group Inc. | | | 2,420 | | | | 150,887 | |
Sun Communities Inc. | | | 185 | | | | 27,737 | |
UDR Inc. | | | 2,358 | | | | 85,360 | |
Ventas Inc. | | | 783 | | | | 30,036 | |
VEREIT Inc. | | | 5,602 | | | | 36,469 | |
VICI Properties Inc. | | | 1,431 | | | | 31,067 | |
Vornado Realty Trust | | | 692 | | | | 23,888 | |
| | | | |
| SCHEDULE OF INVESTMENTS | | | 11 | |
| | |
Schedule of Investments (continued) July 31, 2020 | | BlackRock U.S. Equity Factor Rotation ETF (Percentages shown are based on Net Assets) |
| | | | | | | | |
| Security | | Shares | | | Value | |
| | |
| Real Estate (continued) | | | | | | |
Welltower Inc. | | | 556 | | | $ | 29,779 | |
Weyerhaeuser Co. | | | 1,497 | | | | 41,632 | |
WP Carey Inc. | | | 442 | | | | 31,546 | |
| | | | | | | | |
| | | | | | | 3,774,840 | |
| | |
| Utilities — 4.5% | | | | | | |
AES Corp. (The) | | | 4,029 | | | | 61,362 | |
Alliant Energy Corp. | | | 984 | | | | 52,988 | |
Ameren Corp. | | | 526 | | | | 42,206 | |
American Electric Power Co. Inc. | | | 1,506 | | | | 130,841 | |
American Water Works Co. Inc. | | | 330 | | | | 48,599 | |
Atmos Energy Corp. | | | 5,223 | | | | 553,586 | |
CenterPoint Energy Inc. | | | 2,803 | | | | 53,285 | |
CMS Energy Corp. | | | 1,224 | | | | 78,556 | |
Consolidated Edison Inc. | | | 3,019 | | | | 231,950 | |
Dominion Energy Inc. | | | 1,468 | | | | 118,952 | |
DTE Energy Co. | | | 223 | | | | 25,786 | |
Duke Energy Corp. | | | 4,339 | | | | 367,687 | |
Edison International | | | 424 | | | | 23,604 | |
Entergy Corp. | | | 262 | | | | 27,544 | |
Essential Utilities Inc. | | | 644 | | | | 29,205 | |
Evergy Inc. | | | 1,603 | | | | 103,923 | |
Eversource Energy | | | 1,239 | | | | 111,597 | |
Exelon Corp. | | | 5,391 | | | | 208,147 | |
FirstEnergy Corp. | | | 559 | | | | 16,211 | |
NextEra Energy Inc. | | | 1,744 | | | | 489,541 | |
NiSource Inc. | | | 978 | | | | 23,912 | |
NRG Energy Inc. | | | 1,177 | | | | 39,794 | |
OGE Energy Corp. | | | 8,801 | | | | 289,553 | |
Pinnacle West Capital Corp. | | | 354 | | | | 29,410 | |
PPL Corp. | | | 3,162 | | | | 84,172 | |
Public Service Enterprise Group Inc. | | | 535 | | | | 29,928 | |
Sempra Energy | | | 188 | | | | 23,398 | |
Southern Co. (The) | | | 4,150 | | | | 226,632 | |
UGI Corp. | | | 1,321 | | | | 44,042 | |
Vistra Corp. | | | 3,445 | | | | 64,284 | |
WEC Energy Group Inc. | | | 1,890 | | | | 180,041 | |
Xcel Energy Inc. | | | 3,851 | | | | 265,873 | |
| | | | | | | | |
| | | | | | | 4,076,609 | |
| | | | | | | | |
| | |
Total Common Stocks — 99.8%
(Cost: $80,768,115) | | | | | | | 89,785,093 | |
| | | | | | | | |
| | | | | | | | |
| Security | | Shares | | | Value | |
Warrants | | | | | | | | |
| | |
Energy — 0.0% | | | | | | | | |
Occidental Petroleum Corp. (Expires 08/03/27)(a) | | | 242 | | | $ | 1,355 | |
| | | | | | | | |
| | |
Total Warrants — 0.0%
(Cost: $0) | | | | | | | 1,355 | |
| | | | | | | | |
| | |
Total Long Investment
(Cost: $80,768,115) | | | | | | | 89,786,448 | |
| | | | | | | | |
| | |
Short-Term Investments | | | | | | | | |
| | |
| Money Market Funds — 0.9% | | | | | | |
BlackRock Cash Funds:Institutional,
SL Agency Shares, | | | | | | | | |
0.40%(c)(d)(e) | | | 676,996 | | | | 677,741 | |
BlackRock Cash Funds:Treasury,
SL Agency Shares, | | | | | | | | |
0.12%(c)(d) | | | 132,000 | | | | 132,000 | |
| | | | | | | | |
| | | | | | | 809,741 | |
| | | | | | | | |
| | |
Total Short-Term Investments — 0.9%
(Cost: $809,307) | | | | | | | 809,741 | |
| | | | | | | | |
| | |
Total Investments In Securities — 100.7%
(Cost: $81,577,422) | | | | | | | 90,596,189 | |
| | |
Other Assets, Less Liabilities — (0.7)% | | | | | | | (604,364 | ) |
| | | | | | | | |
| | |
Net Assets — 100.0% | | | | | | $ | 89,991,825 | |
| | | | | | | | |
| (a) | Non-income producing security. |
| (b) | All or a portion of this security is on loan. |
| (c) | Affiliate of the Fund. |
| (d) | Annualized 7-day yield as of period-end. |
| (e) | All or a portion of this security was purchased with cash collateral received from loaned securities. |
| | |
| 12 | | 2020 BLACKROCK ANNUAL REPORTTO SHAREHOLDERS |
| | |
Schedule of Investments (continued) July 31, 2020 | | BlackRock U.S. Equity Factor Rotation ETF |
Affiliates
Investments in issuers considered to be affiliate(s) of the Fund during the year ended July 31, 2020, for purposes of Section 2(a)(3) of the Investment Company Act of 1940, as amended, were as follows:
| | | | | | | | | | | | | | | | | | | | | | | | | | | | | | | | | | | | |
| |
Affiliated Issuer | |
| Value at
07/31/19 |
| |
| Purchases
at Cost |
| |
| Proceeds
from Sales |
| |
| Net Realized
Gain (Loss) |
| |
| Change in
Unrealized Appreciation (Depreciation) |
| |
| Value at
07/31/20 |
| |
| Shares
Held at 07/31/20 |
| | | Income | | |
| Capital Gain
Distributions from
Underlying Funds |
|
| |
BlackRock Cash Funds: Institutional,
SL Agency Shares | | $ | 17,127 | | | $ | 660,609 | (a) | | $ | — | | | $ | (427 | ) | | $ | 432 | | | $ | 677,741 | | | | 676,996 | | | $ | 5,975 | (b) | | $ | — | |
BlackRock Cash Funds: Treasury,
SL Agency Shares | | | 50,000 | | | | 82,000 | (a) | | | — | | | | — | | | | — | | | | 132,000 | | | | 132,000 | | | | 1,164 | | | | — | |
| | | | | | | | | | | | | | | | | | | | | | | | | | | | | | | | | | | | |
| | | | | | | | | | | | | | $ | (427 | ) | | $ | 432 | | | $ | 809,741 | | | | | | | $ | 7,139 | | | $ | — | |
| | | | | | | | | | | | | | | | | | | | | | | | | | | | | | | | | | | | |
| | (a) | Represents net amount purchased (sold). | |
| | (b) | All or a portion represents securities lending income earned from the reinvestment of cash collateral from loaned securities, net of fees and collateral investment expenses, and other payments to and from borrowers of securities. | |
Fair Value Measurements
Various inputs are used in determining the fair value of financial instruments. For description of the input levels and information about the Fund’s policy regarding valuation of financial instruments, refer to the Notes to Financial Statements.
The following table summarizes the value of the Fund’s investments according to the fair value hierarchy as of July 31, 2020. The breakdown of the Fund’s investments into major categories is disclosed in the Schedule of Investments above.
| | | | | | | | | | | | | | | | |
| |
| | | Level 1 | | | | Level 2 | | | | Level 3 | | | | Total | |
| |
Investments | | | | | | | | | | | | | | | | |
Assets | | | | | | | | | | | | | | | | |
Common Stocks | | $ | 89,785,093 | | | $ | — | | | $ | — | | | $ | 89,785,093 | |
Warrants | | | 1,355 | | | | — | | | | — | | | | 1,355 | |
Money Market Funds | | | 809,741 | | | | — | | | | — | | | | 809,741 | |
| | | | | | | | | | | | | | | | |
| | $ | 90,596,189 | | | $ | — | | | $ | — | | | $ | 90,596,189 | |
| | | | | | | | | | | | | | | | |
See notes to financial statements.
| | | | |
| SCHEDULE OF INVESTMENTS | | | 13 | |
Statement of Assets and Liabilities
July 31, 2020
| | | | |
| | | BlackRock U.S. Equity
Factor Rotation ETF | |
| |
| |
ASSETS | | | | |
Investments in securities, at value (including securities on loan)(a): | | | | |
Unaffiliated(b) | | $ | 89,786,448 | |
Affiliated(c) | | | 809,741 | |
Cash | | | 5,044 | |
Receivables: | | | | |
Securities lending income — Affiliated | | | 894 | |
Dividends | | | 99,044 | |
| | | | |
Total assets | | | 90,701,171 | |
| | | | |
| |
LIABILITIES | | | | |
Collateral on securities loaned, at value | | | 677,735 | |
Payables: | | | | |
Investment advisory fees | | | 31,611 | |
| | | | |
Total liabilities | | | 709,346 | |
| | | | |
| |
NET ASSETS | | $ | 89,991,825 | |
| | | | |
| |
NET ASSETS CONSIST OF: | | | | |
Paid-in capital | | $ | 86,391,705 | |
Accumulated earnings | | | 3,600,120 | |
| | | | |
NET ASSETS | | $ | 89,991,825 | |
| | | | |
| |
Shares outstanding | | | 3,300,000 | |
| | | | |
Net asset value | | $ | 27.27 | |
| | | | |
Shares authorized | | | Unlimited | |
| | | | |
Par value | | | None | |
| | | | |
| |
(a) Securities loaned, at value | | $ | 657,397 | |
(b) Investments, at cost — Unaffiliated | | $ | 80,768,115 | |
(c) Investments, at cost — Affiliated | | $ | 809,307 | |
See notes to financial statements.
| | |
| 14 | | 2020 BLACKROCK ANNUAL REPORTTO SHAREHOLDERS |
Statement of Operations
Year Ended July 31, 2020
| | | | |
| |
| BlackRock
U.S. Equity
Factor Rotation
ETF |
|
| |
| |
INVESTMENT INCOME | | | | |
Dividends — Unaffiliated | | $ | 1,488,840 | |
Dividends — Affiliated | | | 1,164 | |
Securities lending income — Affiliated — net | | | 5,975 | |
Foreign taxes withheld | | | (198 | ) |
| | | | |
Total investment income | | | 1,495,781 | |
| | | | |
| |
EXPENSES | | | | |
Investment advisory fees | | | 206,409 | |
| | | | |
Total expenses | | | 206,409 | |
| |
Less: | | | | |
Investment advisory fees waived | | | (68,804 | ) |
| | | | |
Total expenses after fees waived | | | 137,605 | |
| | | | |
Net investment income | | | 1,358,176 | |
| | | | |
| |
REALIZED AND UNREALIZED GAIN (LOSS) | | | | |
Net realized gain (loss) from: | | | | |
Investments — Unaffiliated | | | (5,990,030 | ) |
Investments — Affiliated | | | (427 | ) |
In-kind redemptions — Unaffiliated | | | 4,016,905 | |
| | | | |
Net realized loss | | | (1,973,552 | ) |
| | | | |
Net change in unrealized appreciation (depreciation) on: | | | | |
Investments — Unaffiliated | | | 7,774,311 | |
Investments — Affiliated | | | 432 | |
| | | | |
Net change in unrealized appreciation (depreciation) | | | 7,774,743 | |
| | | | |
Net realized and unrealized gain | | | 5,801,191 | |
| | | | |
NET INCREASE IN NET ASSETS RESULTING FROM OPERATIONS | | $ | 7,159,367 | |
| | | | |
See notes to financial statements.
Statement of Changes in Net Assets
| | | | | | | | |
| |
| BlackRock
U.S. Equity Factor Rotation ETF |
|
| |
| Year Ended
07/31/20 |
| |
| Period From
03/19/19to 07/31/19 |
(a) |
| |
| | |
INCREASE (DECREASE) IN NET ASSETS | | | | | | | | |
| | |
OPERATIONS | | | | | | | | |
Net investment income | | $ | 1,358,176 | | | $ | 131,577 | |
Net realized loss | | | (1,973,552 | ) | | | (63,285 | ) |
Net change in unrealized appreciation (depreciation) | | | 7,774,743 | | | | 1,244,024 | |
| | | | | | | | |
Net increase in net assets resulting from operations | | | 7,159,367 | | | | 1,312,316 | |
| | | | | | | | |
| | |
DISTRIBUTIONS TO SHAREHOLDERS(b) | | | | | | | | |
Decrease in net assets resulting from distributions to shareholders | | | (1,213,492 | ) | | | (98,114 | ) |
| | | | | | | | |
| | |
CAPITAL SHARE TRANSACTIONS | | | | | | | | |
Net increase in net assets derived from capital share transactions | | | 62,831,748 | | | | 20,000,000 | |
| | | | | | | | |
| | |
NET ASSETS | | | | | | | | |
Total increase in net assets | | | 68,777,623 | | | | 21,214,202 | |
Beginning of period | | | 21,214,202 | | | | — | |
| | | | | | | | |
End of period | | $ | 89,991,825 | | | $ | 21,214,202 | |
| | | | | | | | |
| (a) | Commencement of operations. |
| (b) | Distributions for annual periods determined in accordance with U.S. federal income tax regulations. |
See notes to financial statements.
| | |
| 16 | | 2020 BLACKROCK ANNUAL REPORTTO SHAREHOLDERS |
Financial Highlights
(For a share outstanding throughout each period)
| | | | | | | | |
| | | BlackRock U.S. Equity Factor
Rotation ETF | |
| |
| Year Ended
07/31/20 |
| |
| Period From
03/19/19to 07/31/19 |
(a) |
| |
| | |
Net asset value, beginning of period | | $ | 26.52 | | | $ | 25.00 | |
| | | | | | | | |
Net investment income(b) | | | 0.52 | | | | 0.16 | |
Net realized and unrealized gain(c) | | | 0.67 | | | | 1.48 | |
| | | | | | | | |
Net increase from investment operations | | | 1.19 | | | | 1.64 | |
| | | | | | | | |
| | |
Distributions(d) | | | | | | | | |
From net investment income | | | (0.44 | ) | | | (0.12 | ) |
| | | | | | | | |
Total distributions | | | (0.44 | ) | | | (0.12 | ) |
| | | | | | | | |
| | |
Net asset value, end of period | | $ | 27.27 | | | $ | 26.52 | |
| | | | | | | | |
| | |
Total Return | | | | | | | | |
Based on net asset value | | | 4.61 | % | | | 6.59 | %(e) |
| | | | | | | | |
| | |
Ratios to Average Net Assets | | | | | | | | |
Total expenses | | | 0.30 | % | | | 0.30 | %(f) |
| | | | | | | | |
Total expenses after fees waived | | | 0.20 | % | | | 0.20 | %(f) |
| | | | | | | | |
Net investment income | | | 1.97 | % | | | 1.74 | %(f) |
| | | | | | | | |
| | |
Supplemental Data | | | | | | | | |
Net assets, end of period (000) | | $ | 89,992 | | | $ | 21,214 | |
| | | | | | | | |
Portfolio turnover rate(g) | | | 175 | % | | | 42 | %(e) |
| | | | | | | | |
| (a) | Commencement of operations. |
| (b) | Based on average shares outstanding. |
| (c) | The amounts reported for a share outstanding may not accord with the change in aggregate gains and losses in securities for the fiscal period due to the timing of capital share transactions in relation to the fluctuating market values of the Fund’s underlying securities. |
| (d) | Distributions for annual periods determined in accordance with U.S. federal income tax regulations. |
| (g) | Portfolio turnover rate excludes in-kind transactions. |
See notes to financial statements.
Notes to Financial Statements
BlackRock ETF Trust (the “Trust”) is registered under the Investment Company Act of 1940, as amended (the “1940 Act”), as an open-end management investment company. The Trust is organized as a Delaware statutory trust and is authorized to have multiple series or portfolios. The BlackRock U.S. Equity Factor Rotation ETF (the “Fund”), which is a series of the Trust, is classified as non-diversified. These financial statements relate only to the Fund.
The Fund, together with certain other registered investment companies advised by BlackRock Fund Advisors (“BFA” or the “Manager”) or its affiliates, is included in a complex of equity, multi-asset, index and money market funds referred to as the BlackRock Multi-Asset Complex.
| 2. | SIGNIFICANT ACCOUNTING POLICIES |
The following significant accounting policies are consistently followed by the Fund in the preparation of its financial statements in conformity with accounting principles generally accepted in the United States of America (“U.S. GAAP”). The preparation of financial statements in conformity with U.S. GAAP requires management to make certain estimates and assumptions that affect the reported amounts of assets and liabilities and disclosures of contingent assets and liabilities at the date of the financial statements and the reported amounts of increases and decreases in net assets from operations during the reporting period. Actual results could differ from those estimates. The Fund is considered an investment company under U.S. GAAP and follows the accounting and reporting guidance applicable to investment companies.
Investment Transactions and Income Recognition: Investment transactions are accounted for on trade date. Realized gains and losses on investment transactions are determined using the specific identification method. Dividend income and capital gain distributions, if any, are recognized on the ex-dividend date, net of any foreign taxes withheld at source. Any taxes withheld that are reclaimable from foreign tax authorities are reflected in tax reclaims receivable. Distributions received by the Fund may include a return of capital that is estimated by management. Such amounts are recorded as a reduction of the cost of investments or reclassified to capital gains. Upon notification from issuers, some of the dividend income received from a real estate investment trust may be re-designated as a return of capital or capital gain. Non-cash dividends, if any, are recognized on the ex-dividend date and recorded as non-cash dividend income at fair value. Interest income is accrued daily.
Foreign Taxes: The Fund may be subject to foreign taxes (a portion of which may be reclaimable) on income, stock dividends, capital gains on investments, or certain foreign currency transactions. All foreign taxes are recorded in accordance with the applicable foreign tax regulations and rates that exist in the foreign jurisdictions in which the Fund invests. These foreign taxes, if any, are paid by the Fund and are reflected in its statement of operations as follows: foreign taxes withheld at source are presented as a reduction of income, foreign taxes on securities lending income are presented as a reduction of securities lending income, foreign taxes on stock dividends are presented as “other foreign taxes”, and foreign taxes on capital gains from sales of investments and foreign taxes on foreign currency transactions are included in their respective net realized gain (loss) categories. Foreign taxes payable or deferred as of July 31, 2020, if any, are disclosed in the statement of assets and liabilities.
In-kind Redemptions: For financial reporting purposes, in-kind redemptions are treated as sales of securities resulting in realized capital gains or losses to the Fund. Because such gains or losses are not taxable to the Fund and are not distributed to existing Fund shareholders, the gains or losses are reclassified from accumulated net realized gain (loss) to paid-in capital at the end of the Fund’s tax year. These reclassifications have no effect on net assets or net asset value (“NAV”) per share.
Distributions: Dividends and distributions paid by the Fund are recorded on the ex-dividend dates. Distributions are determined on a tax basis and may differ from net investment income and net realized capital gains for financial reporting purposes. Dividends and distributions are paid in U.S. dollars and cannot be automatically reinvested in additional shares of the Fund.
Indemnifications: In the normal course of business, the Fund enters into contracts that contain a variety of representations that provide general indemnification. The Fund’s maximum exposure under these arrangements is unknown because it involves future potential claims against the Fund, which cannot be predicted with any certainty.
| 3. | INVESTMENT VALUATION AND FAIR VALUE MEASUREMENTS |
Investment Valuation Policies: The Fund’s investments are valued at fair value (also referred to as “market value” within the financial statements) each day that the Fund’s listing exchange is open and, for financial reporting purposes, as of the report date should the reporting period end on a day that the Fund’s listing exchange is not open. U.S. GAAP defines fair value as the price a fund would receive to sell an asset or pay to transfer a liability in an orderly transaction between market participants at the measurement date. A fund determines the fair value of its financial instruments using various independent dealers or pricing services under policies approved by the Board of Trustees of the Trust (the “Board”). If a security’s market price is not readily available or does not otherwise accurately represent the fair value of the security, the security will be valued in accordance with a policy approved by the Board as reflecting fair value. The BlackRock Global Valuation Methodologies Committee (the “Global Valuation Committee”) is the committee formed by management to develop global pricing policies and procedures and to oversee the pricing function for all financial instruments.
Fair Value Inputs and Methodologies: The following methods and inputs are used to establish the fair value of the Fund’s assets and liabilities:
| | • | | Equity investments traded on a recognized securities exchange are valued at that day’s last traded price or official closing price, as applicable, on the exchange where the stock is primarily traded. Equity investments traded on a recognized exchange for which there were no sales on that day are valued at the last traded price. |
| | • | | Investments in open-end U.S. mutual funds (including money market funds) are valued at that day’s published NAV. |
If events (e.g., a company announcement, market volatility or a natural disaster) occur that are expected to materially affect the value of an investment, or in the event that application of these methods of valuation results in a price for an investment that is deemed not to be representative of the market value of such investment, or if a price is not available, the investment will be valued by the Global Valuation Committee, in accordance with policies approved by the Board as reflecting fair value (“Fair Valued Investments”). The fair valuation approaches that may be used by the Global Valuation Committee include market approach, income approach and the cost approach. Valuation techniques used under these approaches take into consideration inputs that include but are not limited to (i) attributes specific to the investment; (ii) the principal
| | |
| 18 | | 2020 BLACKROCK ANNUAL REPORTTO SHAREHOLDERS |
Notes to Financial Statements (continued)
market for the investment; (iii) the customary participants in the principal market for the investment; (iv) data assumptions by market participants for the investment, if reasonably available; (v) quoted prices for similar investments in active markets; and (vi) other inputs, such as future cash flows, interest rates, yield curves, volatilities, prepayment speeds, loss severities, credit risks and/or default rates.
When determining the price for Fair Valued Investments, the Global Valuation Committee, or its delegate, seeks to determine the price that the Fund might reasonably expect to receive or pay from the current sale or purchase of that asset or liability in an arm’s-length transaction. Fair value determinations shall be based upon all available factors that the Global Valuation Committee, or its delegate, deems relevant and consistent with the principles of fair value measurement.
Fair Value Hierarchy: Various inputs are used in determining the fair value of financial instruments. These inputs to valuation techniques are categorized into a fair value hierarchy consisting of three broad levels for financial reporting purposes as follows:
| | • | | Level 1 – Unadjusted price quotations in active markets for identical assets or liabilities; |
| | • | | Level 2 – Inputs other than quoted prices included within Level 1 that are observable for the asset or liability either directly or indirectly, including, but not limited to, quoted prices for similar assets or liabilities in markets that are active, quoted prices for identical or similar assets or liabilities in markets that are not considered to be active, inputs other than quoted prices that are observable for the asset or liability (such as interest rates, yield curves, volatilities, prepayment speeds, loss severities, credit risks and default rates) or other market-corroborated inputs; and |
| | • | | Level 3 – Unobservable inputs based on the best information available in the circumstances, to the extent observable inputs are not available, (including the Global Valuation Committee’s assumptions used in determining the fair value of financial instruments). |
The hierarchy gives the highest priority to unadjusted quoted prices in active markets for identical assets or liabilities (Level 1 measurements) and the lowest priority to unobservable inputs (Level 3 measurements). Accordingly, the degree of judgement exercised in determining fair value is greatest for instruments categorized in Level 3. The inputs used to measure fair value may fall into different levels of the fair value hierarchy. In such cases, for disclosure purposes, the fair value hierarchy classification is determined based on the lowest level input that is significant to the fair value measurement in its entirety. The fair value hierarchy for the Fund’s investments is included in its schedule of investments. The categorization of a value determined for financial instruments is based on the pricing transparency of the financial instruments and is not necessarily an indication of the risks associated with investing in those securities.
| 4. | SECURITIES AND OTHER INVESTMENTS |
Securities Lending: The Fund may lend its securities to approved borrowers, such as brokers, dealers and other financial institutions. The borrower pledges and maintains with the Fund collateral consisting of cash, an irrevocable letter of credit issued by an approved bank, or securities issued or guaranteed by the U.S. government. The initial collateral received by the Fund is required to have a value of at least 102% of the current market value of the loaned securities for securities traded on U.S. exchanges and a value of at least 105% for all other securities. The collateral is maintained thereafter at a value equal to at least 100% of the current value of the securities on loan. The market value of the loaned securities is determined at the close of each business day of the Fund and any additional required collateral is delivered to the Fund or excess collateral is returned by the Fund, on the next business day. During the term of the loan, the Fund is entitled to all distributions made on or in respect of the loaned securities but does not receive interest income on securities received as collateral. Loans of securities are terminable at any time and the borrower, after notice, is required to return borrowed securities within the standard time period for settlement of securities transactions.
As of July 31, 2020, any securities on loan were collateralized by cash and/or U.S. government obligations. Cash collateral received was invested in money market funds managed by BFA, the Fund’s investment adviser, or its affiliates and is disclosed in the schedule of investments. Any non-cash collateral received cannot be sold, re-invested or pledged by the Fund, except in the event of borrower default. The securities on loan for the Fund, if any, are also disclosed in its schedule of investments. The market value of any securities on loan as of July 31, 2020 and the value of the related cash collateral are disclosed in the statement of assets and liabilities.
Securities lending transactions are entered into by a fund under Master Securities Lending Agreements (each, an “MSLA”) which provide the right, in the event of default (including bankruptcy or insolvency) for the non-defaulting party to liquidate the collateral and calculate a net exposure to the defaulting party or request additional collateral. In the event that a borrower defaults, the fund, as lender, would offset the market value of the collateral received against the market value of the securities loaned. The value of the collateral is typically greater than the market value of the securities loaned, leaving the lender with a net amount payable to the defaulting party. However, bankruptcy or insolvency laws of a particular jurisdiction may impose restrictions on or prohibitions against such a right of offset in the event of an MSLA counterparty’s bankruptcy or insolvency. Under the MSLA, absent an event of default, the borrower can resell or re-pledge the loaned securities, and the fund can reinvest cash collateral received in connection with loaned securities.
| | | | |
| NOTESTO FINANCIAL STATEMENTS | | | 19 | |
Notes to Financial Statements (continued)
The following table is a summary of the securities lending agreements by counterparty which are subject to offset under an MSLA as of July 31, 2020:
| | | | | | | | | | | | | | | | |
BlackRock ETF and Counterparty | |
| Market Value of
Securities on Loan |
| |
| Cash Collateral
Received |
(a) | |
| Non-Cash Collateral
Received |
| | | Net Amount | |
U.S. Equity Factor Rotation | | | | | | | | | | | | | | | | |
Citigroup Global Markets Inc. | | $ | 10,361 | | | $ | 10,353 | | | $ | — | | | $ | (8 | )(b) |
Goldman Sachs & Co. | | | 131,089 | | | | 131,089 | | | | — | | | | — | |
JPMorgan Securities LLC | | | 96,820 | | | | 96,820 | | | | — | | | | — | |
Morgan Stanley & Co. LLC | | | 72,668 | | | | 72,668 | | | | — | | | | — | |
National Financial Services LLC | | | 24,923 | | | | 24,923 | | | | — | | | | — | |
RBC Capital Markets LLC | | | 27,848 | | | | 27,848 | | | | — | | | | — | |
State Street Bank & Trust Company | | | 1,914 | | | | 1,762 | | | | — | | | | (152 | )(b) |
UBS AG | | | 291,774 | | | | 291,774 | | | | — | | | | — | |
| | | | | | | | | | | | | | | | |
| | $ | 657,397 | | | $ | 657,237 | | | $ | — | | | $ | (160 | ) |
| | | | | | | | | | | | | | | | |
| | (a) | Collateral received in excess of the market value of securities on loan is not presented in this table. The total cash collateral received by the Fund is disclosed in the Fund’s statement of assets and liabilities. | |
| | (b) | Additional collateral is delivered to the Fund on the next business day in accordance with the MSLA. The net amount would be subject to the borrower default indemnity in the event of default by a counterparty. | |
The risks of securities lending include the risk that the borrower may not provide additional collateral when required or may not return the securities when due. To mitigate these risks, the Fund benefits from a borrower default indemnity provided by BlackRock, Inc. (“BlackRock”). BlackRock’s indemnity allows for full replacement of the securities loaned to the extent the collateral received does not cover the value of the securities loaned in the event of borrower default. The Fund could incur a loss if the value of an investment purchased with cash collateral falls below the market value of the loaned securities or if the value of an investment purchased with cash collateral falls below the value of the original cash collateral received. Such losses are borne entirely by the Fund.
| 5. | | INVESTMENT ADVISORY AGREEMENT AND OTHER TRANSACTIONS WITH AFFILIATES |
Investment Advisory Fees: Pursuant to an Investment Advisory Agreement with the Trust, BFA manages the investment of the Fund’s assets. BFA is a California corporation indirectly owned by BlackRock. Under the Investment Advisory Agreement, BFA is responsible for substantially all expenses of the Fund, except (i) interest and taxes; (ii) brokerage commissions and other expenses connected with the execution of portfolio transactions; (iii) distribution fees; (iv) the advisory fee payable to BFA; and (v) litigation expenses and any extraordinary expenses (in each case as determined by a majority of the trustees who are not “interested persons” of the Trust).
For its investment advisory services to the Fund, BFA is paid a management fee from the Fund, based on a percentage of the Fund’s average daily net assets, at an annual rate as follows:
| | | | |
| Average Daily Net Assets | | Investment Advisory Fee | |
First $1 billion | | | 0.30 | % |
Over $1 billion, up to and including $3 billion | | | 0.28 | |
Over $3 billion, up to and including $5 billion | | | 0.27 | |
Over $5 billion, up to and including $10 billion | | | 0.26 | |
Over $10 billion | | | 0.25 | |
Expense Waivers: BFA has contractually agreed to waive its management fees by the amount of investment advisory fees the Fund pays to BFA indirectly through its investment in money market funds managed by BFA or its affiliates, through November 30, 2020.
BFA has voluntarily agreed to waive its management fee payable by the Fund to limit the annual management fee paid by the Fund to 0.20%. BFA may also from time to time voluntarily waive and/or reimburse fees or expenses in order to limit total annual fund operating expenses (excluding acquired fund fees and expenses, if any). Any such voluntary waiver or reimbursement may be eliminated by BFA at any time.
For the year ended July 31, 2020, BFA voluntarily waived its investment advisory fee for the Fund in the amount of $68,727.
Distributor: BlackRock Investments, LLC, an affiliate of BFA, is the distributor for the Fund. Pursuant to the distribution agreement, BFA is responsible for any fees or expenses for distribution services provided to the Fund.
Securities Lending: The U.S. Securities and Exchange Commission (the “SEC”) has issued an exemptive order which permits BlackRock Institutional Trust Company, N.A. (“BTC”), an affiliate of BFA, to serve as securities lending agent for the Fund, subject to applicable conditions. As securities lending agent, BTC bears all operational costs directly related to securities lending. The Fund is responsible for fees in connection with the investment of cash collateral received for securities on loan (the “collateral investment fees”). The cash collateral is invested in a money market fund managed by BFA or its affiliates. However, BTC has agreed to reduce the amount of securities lending income it receives in order to effectively limit the collateral investment fees the Fund bears to an annual rate of 0.04%. The shares of such money market fund will not be subject to a sales load, distribution fee or service fee. The money market fund in which the cash collateral has been invested may, under certain circumstances,
| | |
| 20 | | 2020 BLACKROCK ANNUAL REPORTTO SHAREHOLDERS |
Notes to Financial Statements (continued)
impose a liquidity fee of up to 2% of the value redeemed or temporarily restrict redemptions for up to 10 business days during a 90 day period, in the event that the money market fund’s weekly liquid assets fall below certain thresholds.
Securities lending income is equal to the total of income earned from the reinvestment of cash collateral, net of fees and other payments to and from borrowers of securities, and less the collateral investment fees. The Fund retains a portion of securities lending income and remits a remaining portion to BTC as compensation for its services as securities lending agent.
Pursuant to the current securities lending agreement, the Fund retains 75% of securities lending income (which excludes collateral investment fees), and this amount retained can never be less than 70% of the total of securities lending income plus the collateral investment fees.
In addition, commencing the business day following the date that the aggregate securities lending income plus the collateral investment fees earned across the BlackRock Multi-Asset Complex in a calendar year exceeds a specified threshold, the Fund, pursuant to the securities lending agreement, will retain for the remainder of that calendar year securities lending income in an amount equal to 80% of securities lending income (which excludes collateral investment fees), and this amount retained can never be less than 70% of the total of securities lending income plus the collateral investment fees.
Prior to January 1, 2020, the Fund retained 73.5% of securities lending income (which excludes collateral investment fees) and the amount retained was not less than 70% of the total of securities lending income plus the collateral investment fees. In addition, commencing the business day following the date that the aggregate securities lending income plus the collateral investment fees generated across the BlackRock Multi-Asset Complex in a calendar year exceeded a specified threshold, the Fund, pursuant to the securities lending agreement, retained for the remainder of that calendar year 80% of securities lending income (which excludes collateral investment fees), and the amount retained could never be less than 70% of the total of securities lending income plus the collateral investment fees.
The share of securities lending income earned by the Fund is shown as securities lending income — affiliated — net in its statement of operations. For the year ended July 31, 2020, the Fund paid BTC $1,795 for securities lending agent services.
Officers and Trustees: Certain officers and/or trustees of the Trust are officers and/or trustees of BlackRock or its affiliates.
Other Transactions: Cross trading is the buying or selling of portfolio securities between funds to which BFA (or an affiliate) serves as investment adviser. At its regularly scheduled quarterly meetings, the Board reviews such transactions as of the most recent calendar quarter for compliance with the requirements and restrictions set forth by Rule 17a-7.
For the year ended July 31, 2020, transactions executed by the Fund pursuant to Rule 17a-7 under the 1940 Act were as follows:
| | | | | | | | | | | | |
| BlackRock ETF | | Purchases | | | Sales | | | Net Realized
Gain (Loss) | |
U.S. Equity Factor Rotation | | | $7,496,492 | | | | $5,454,525 | | | | $ (77,683) | |
The Fund may invest its positive cash balances in certain money market funds managed by BFA or an affiliate. The income earned on these temporary cash investments is shown as dividends – affiliated in the statement of operations.
For the year ended July 31, 2020, purchases and sales of investments, excluding in-kind transactions and short-term investments, were as follows:
| | | | | | | | |
| BlackRock ETF | | Purchases | | | Sales | |
U.S. Equity Factor Rotation | | | $120,841,363 | | | $ | 120,441,514 | |
For the year ended July 31, 2020, in-kind transactions were as follows:
| | | | | | | | |
| BlackRock ETF | | In-kind
Purchases | | | In-kind
Sales | |
U.S. Equity Factor Rotation | | $ | 82,874,973 | | | $ | 20,441,894 | |
| 7. | | INCOME TAX INFORMATION |
The Fund is treated as an entity separate from the Trust’s other funds for federal income tax purposes. It is the policy of the Fund to qualify as a regulated investment company by complying with the provisions applicable to regulated investment companies, as defined under Subchapter M of the Internal Revenue Code of 1986, as amended, and to annually distribute substantially all of its ordinary income and any net capital gains (taking into account any capital loss carryforwards) sufficient to relieve it from all, or substantially all, federal income and excise taxes. Accordingly, no provision for federal income taxes is required.
Management has analyzed tax laws and regulations and their application to the Fund as of July 31, 2020, inclusive of the open tax return years, and does not believe that there are any uncertain tax positions that require recognition of a tax liability in the Fund’s financial statements.
| | | | |
| NOTESTO FINANCIAL STATEMENTS | | | 21 | |
Notes to Financial Statements (continued)
U.S. GAAP requires that certain components of net assets be adjusted to reflect permanent differences between financial and tax reporting. These reclassifications have no effect on net assets or NAV per share. As of July 31, 2020, the following permanent differences attributable to realized gains (losses) from in-kind redemptions, were reclassified to the following accounts:
| | | | | | | | |
| BlackRock ETF | | Paid-in Capital | | | Accumulated
Earnings | |
U.S. Equity Factor Rotation | | | $3,559,957 | | | $ | (3,559,957) | |
The tax character of distributions paid was as follows:
| | | | | | | | |
| BlackRock ETF | | Year Ended
07/31/20 | | | Period Ended
07/31/19 | |
U.S. Equity Factor Rotation Ordinary income | | $ | 1,213,492 | | | $ | 98,114 | |
| | | | | | | | |
As of July 31, 2020, the tax components of accumulated net earnings (losses) were as follows:
| | | | | | | | | | | | | | | | |
| BlackRock ETF | |
| Undistributed
Ordinary Income |
| |
| Non-expiring
Capital Loss
Carryforwards |
(a) | |
| Net Unrealized
Gains (Losses) |
(b) | | | Total | |
U.S. Equity Factor Rotation | | $ | 186,503 | | | $ | (2,957,755 | ) | | $ | 6,371,372 | | | $ | 3,600,120 | |
| | (a) | Amounts available to offset future realized capital gains. | |
| | (b) | The difference between book-basis and tax-basis unrealized gains (losses) was attributable primarily to the tax deferral of losses on wash sales. | |
As of July 31, 2020, gross unrealized appreciation and depreciation based on cost of investments (including short positions and derivatives, if any) for U.S. federal income tax purposes were as follows:
| | | | | | | | | | | | | | | | |
| BlackRock ETF | | Tax Cost | | | Gross Unrealized
Appreciation | | | Gross Unrealized
Depreciation | | | Net Unrealized
Appreciation
(Depreciation) | |
U.S. Equity Factor Rotation | | $ | 84,224,817 | | | $ | 7,534,272 | | | $ | (1,162,900 | ) | | $ | 6,371,372 | |
In the normal course of business, the Fund invests in securities or other instruments and may enter into certain transactions, and such activities subject the Fund to various risks, including, among others, fluctuations in the market (market risk) or failure of an issuer to meet all of its obligations. The value of securities or other instruments may also be affected by various factors, including, without limitation: (i) the general economy; (ii) the overall market as well as local, regional or global political and/or social instability; (iii) regulation, taxation or international tax treaties between various countries; or (iv) currency, interest rate or price fluctuations. The Fund’s prospectus provides details of the risks to which the Fund is subject.
The Fund may be exposed to additional risks when reinvesting cash collateral in money market funds that do not seek to maintain a stable NAV per share of $1.00, which may be subject to redemption gates or liquidity fees under certain circumstances.
Market Risk: Market risk arises mainly from uncertainty about future values of financial instruments influenced by price, currency and interest rate movements. It represents the potential loss a fund may suffer through holding market positions in the face of market movements. A fund is exposed to market risk by its investment in equity, fixed income and/or financial derivative instruments or by its investment in underlying funds. The fair value of securities held by a fund may decline due to general market conditions, economic trends or events that are not specifically related to the issuers of the securities including local, regional or global political, social or economic instability or to factors that affect a particular industry or group of industries. Local, regional or global events such as war, acts of terrorism, the spread of infectious illness or other public health issues, recessions, or other events could have a significant impact on the Fund and its investments. The extent of a fund’s exposure to market risk is the market value of the investments held as shown in the fund’s schedule of investments.
An outbreak of respiratory disease caused by a novel coronavirus has developed into a global pandemic and has resulted in closing borders, quarantines, disruptions to supply chains and customer activity, as well as general concern and uncertainty. The impact of this pandemic, and other global health crises that may arise in the future, could affect the economies of many nations, individual companies and the market in general in ways that cannot necessarily be foreseen at the present time. This pandemic may result in substantial market volatility and may adversely impact the prices and liquidity of a fund’s investments. The duration of this pandemic and its effects cannot be determined with certainty.
Credit Risk: Credit risk is the risk that an issuer or guarantor of debt instruments or the counterparty to a financial transaction, including derivatives contracts, repurchase agreements or loans of portfolio securities, is unable or unwilling to make timely interest and/or principal payments or to otherwise honor its obligations. BFA and its affiliates manage counterparty credit risk by entering into transactions only with counterparties that they believe have the financial resources to honor their obligations and by monitoring the financial stability of those counterparties. Financial assets, which potentially expose a fund to issuer and counterparty credit risks, consist principally of
| | |
| 22 | | 2020 BLACKROCK ANNUAL REPORTTO SHAREHOLDERS |
Notes to Financial Statements (continued)
financial instruments and receivables due from counterparties. The extent of a fund’s exposure to credit and counterparty risks with respect to those financial assets is approximated by their value recorded in its statement of assets and liabilities.
Concentration Risk: A diversified portfolio, where this is appropriate and consistent with a fund’s objectives, minimizes the risk that a price change of a particular investment will have a material impact on the NAV of a fund. The investment concentrations within the Fund’s portfolio are disclosed in its schedule of investments.
When a fund concentrates its investments in securities within a single or limited number of market sectors, it assumes the risk that economic, regulatory, political and social conditions affecting such sectors may have a significant impact on the fund and could affect the income from, or the value or liquidity of, the fund’s portfolio.
LIBOR Transition Risk: The United Kingdom’s Financial Conduct Authority announced a phase out of the London Interbank Offered Rate (“LIBOR”) by the end of 2021, and it is expected that LIBOR will cease to be published after that time. The Fund may be exposed to financial instruments tied to LIBOR to determine payment obligations, financing terms, hedging strategies or investment value. The transition process away from LIBOR might lead to increased volatility and illiquidity in markets for, and reduce the effectiveness of new hedges placed against, instruments whose terms currently include LIBOR. The ultimate effect of the LIBOR transition process on the Fund is uncertain.
| 9. | | CAPITAL SHARE TRANSACTIONS |
Capital shares are issued and redeemed by the Fund only in aggregations of a specified number of shares or multiples thereof (“Creation Units”) at NAV. Except when aggregated in Creation Units, shares of the Fund are not redeemable.
Transactions in capital shares were as follows:
| | | | | | | | | | | | | | | | |
| | | Year Ended
07/31/20 | | | Period Ended
07/31/19 | |
| BlackRock ETF | | Shares | | | Amount | | | Shares | | | Amount | |
U.S. Equity Factor Rotation | | | | | | | | | | | | | | | | |
Shares sold | | | 3,300,000 | | | $ | 84,056,705 | | | | 800,000 | | | $ | 20,000,000 | |
Shares redeemed | | | (800,000 | ) | | | (21,224,957 | ) | | | — | | | | — | |
| | | | | | | | | | | | | | | | |
Net increase | | | 2,500,000 | | | $ | 62,831,748 | | | | 800,000 | | | $ | 20,000,000 | |
| | | | | | | | | | | | | | | | |
The consideration for the purchase of Creation Units of the Fund generally consists of the in-kind deposit of a designated portfolio of securities and a specified amount of cash. The Fund may be offered in Creation Units solely or partially for cash in U.S. dollars. Investors purchasing and redeeming Creation Units may pay a purchase transaction fee and a redemption transaction fee directly to State Street Bank and Trust Company, the Trust’s administrator, to offset transfer and other transaction costs associated with the issuance and redemption of Creation Units, including Creation Units for cash. Investors transacting in Creation Units for cash may also pay an additional variable charge to compensate the Fund for certain transaction costs (i.e., stamp taxes, taxes on currency or other financial transactions, and brokerage costs) and market impact expenses relating to investing in portfolio securities. Such variable charges, if any, are included in shares sold in the table above.
From time to time, settlement of securities related to in-kind contributions or in-kind redemptions may be delayed. In such cases, securities related to in-kind transactions are reflected as a receivable or a payable in the statement of assets and liabilities.
Management has evaluated the impact of all subsequent events on the Fund through the date the financial statements were available to be issued and has determined that there were no subsequent events requiring adjustment or additional disclosure in the financial statements.
| | | | |
| NOTESTO FINANCIAL STATEMENTS | | | 23 | |
Report of Independent Registered Public Accounting Firm
To the Board of Trustees of BlackRock ETF Trust and Shareholders of BlackRock U.S. Equity Factor Rotation ETF
Opinion on the Financial Statements
We have audited the accompanying statement of assets and liabilities, including the schedule of investments, of BlackRock U.S. Equity Factor Rotation ETF (the “Fund”) as of July 31, 2020, the related statement of operations for the year ended July 31, 2020 and the statement of changes in net assets and the financial highlights for the year ended July 31, 2020 and for the period March 19, 2019 (commencement of operations) through July 31, 2019, including the related notes (collectively referred to as the “financial statements”). In our opinion, the financial statements present fairly, in all material respects, the financial position of the Fund as of July 31, 2020, the results of its operations for the year ended July 31, 2020, and the changes in net assets and the financial highlights for the year ended July 31, 2020 and for the period March 19, 2019 (commencement of operations) through July 31, 2019 in conformity with accounting principles generally accepted in the United States of America.
Basis for Opinion
These financial statements are the responsibility of the Fund’s management. Our responsibility is to express an opinion on the Fund’s financial statements based on our audits. We are a public accounting firm registered with the Public Company Accounting Oversight Board (United States) (PCAOB) and are required to be independent with respect to the Fund in accordance with the U.S. federal securities laws and the applicable rules and regulations of the Securities and Exchange Commission and the PCAOB.
We conducted our audits of these financial statements in accordance with the standards of the PCAOB. Those standards require that we plan and perform the audit to obtain reasonable assurance about whether the financial statements are free of material misstatement, whether due to error or fraud.
Our audits included performing procedures to assess the risks of material misstatement of the financial statements, whether due to error or fraud, and performing procedures that respond to those risks. Such procedures included examining, on a test basis, evidence regarding the amounts and disclosures in the financial statements. Our audits also included evaluating the accounting principles used and significant estimates made by management, as well as evaluating the overall presentation of the financial statements. Our procedures included confirmation of securities owned as of July 31, 2020 by correspondence with the custodian and transfer agent. We believe that our audits provide a reasonable basis for our opinion.
/s/ PricewaterhouseCoopers LLP
Philadelphia, Pennsylvania
September 22, 2020
We have served as the auditor of one or more BlackRock investment companies since 2000.
| | |
| 24 | | 2020 BLACKROCK ANNUAL REPORTTO SHAREHOLDERS |
Important Tax Information (unaudited)
For corporate shareholders, the percentage of ordinary income distributions paid during the fiscal year ended July 31, 2020 that qualified for the dividends-received deduction were as follows:
| | | | |
| BlackRock ETF | | Dividends-Received
Deduction | |
U.S. Equity Factor Rotation | | | 90.82 | % |
The following maximum amounts are hereby designated as qualified dividend income for individuals for the fiscal year ended July 31, 2020:
| | | | |
| BlackRock ETF | | Qualified Dividend Income | |
U.S. Equity Factor Rotation | | $ | 1,266,146 | |
The following maximum amounts are hereby designated as qualified business income for individuals for the fiscal year ended July 31, 2020:
| | | | |
| BlackRock ETF | | Qualified Business Income | |
U.S. Equity Factor Rotation | | $ | 34,306 | |
| | | | |
| IMPORTANT TAX INFORMATION | | | 25 | |
Board Review and Approval of Investment Advisory Contract
The Board of Trustees (the “Board,” the members of which are referred to as “Board Members”) of BlackRock ETF Trust (the “Trust”) met on April 7, 2020 (the “April Meeting”) and May 11-13, 2020 (the “May Meeting”) to consider the approval of the investment advisory agreement (the “Agreement”) between the Trust, on behalf of BlackRock U.S. Equity Factor Rotation ETF (the “Fund”), a series of the Trust, and BlackRock Fund Advisors (the “Manager” or “BlackRock”), the Trust’s investment advisor.
Activities and Composition of the Board
On the date of the May Meeting, the Board consisted of fourteen individuals, twelve of whom were not “interested persons” of the Trust as defined in the Investment Company Act of 1940, as amended (the “1940 Act”) (the “Independent Board Members”). The Board Members are responsible for the oversight of the operations of the Trust and perform the various duties imposed on the directors of investment companies by the 1940 Act. The Independent Board Members have retained independent legal counsel to assist them in connection with their duties. The Chair of the Board is an Independent Board Member. The Board has established five standing committees: an Audit Committee, a Governance and Nominating Committee, a Compliance Committee, a Performance Oversight Committee and an Ad Hoc Topics Committee, each of which is chaired by an Independent Board Member and composed of Independent Board Members (except for the Ad Hoc Topics Committee, which also has one interested Board Member).
The Agreement
Consistent with the requirements of the 1940 Act, the Board considers the continuation of the Agreement on an annual basis. The Board has four quarterly meetings per year, each typically extending for two days, and additional in-person and telephonic meetings throughout the year, as needed. While the Board also has a fifth one-day meeting to consider specific information surrounding the renewal of the Agreement, the Board’s consideration entails a year-long deliberative process whereby the Board and its committees assess BlackRock’s services to the Fund. In particular, the Board assessed, among other things, the nature, extent and quality of the services provided to the Fund by BlackRock, BlackRock’s personnel and affiliates, including (as applicable): investment management services; accounting oversight; administrative and shareholder services; oversight of the Fund’s service providers; risk management and oversight; and legal, regulatory and compliance services. Throughout the year, including during the contract renewal process, the Independent Board Members were advised by independent legal counsel, and met with independent legal counsel in various executive sessions outside of the presence of BlackRock’s management.
During the year, the Board, acting directly and through its committees, considers information that is relevant to its annual consideration of the renewal of the Agreement, including the services and support provided by BlackRock to the Fund and its shareholders. BlackRock also furnished additional information to the Board in response to specific questions from the Board. This additional information is discussed further in the section titled “Board Considerations in Approving the Agreement.” Among the matters the Board considered were: (a) investment performance for one-year, three-year, five-year, and/or since inception periods, as applicable, against peer funds, an applicable benchmark, and other performance metrics, as applicable, as well as BlackRock senior management’s and portfolio managers’ analyses of the reasons for any outperformance or underperformance relative to its peers, benchmarks, and other performance metrics, as applicable; (b) fees, including advisory, administration, if applicable, and other amounts paid to BlackRock and its affiliates by the Fund for services; (c) Fund operating expenses and how BlackRock allocates expenses to the Fund; (d) the resources devoted to risk oversight of, and compliance reports relating to, implementation of the Fund’s investment objective, policies and restrictions, and meeting regulatory requirements; (e) BlackRock’s and the Fund’s adherence to applicable compliance policies and procedures; (f) the nature, character and scope of non-investment management services provided by BlackRock and its affiliates and the estimated cost of such services; (g) BlackRock’s and other service providers’ internal controls and risk and compliance oversight mechanisms; (h) BlackRock’s implementation of the proxy voting policies approved by the Board; (i) the use of brokerage commissions and execution quality of portfolio transactions; (j) BlackRock’s implementation of the Trust’s valuation and liquidity procedures; (k) an analysis of management fees for products with similar investment mandates across the open-end fund, exchange-traded fund (“ETF”), closed-end fund, sub-advised mutual fund, separately managed account, collective investment trust, and institutional separate account product channels, as applicable, and the similarities and differences between these products and the services provided as compared to the Fund; (l) BlackRock’s compensation methodology for its investment professionals and the incentives and accountability it creates, along with investment professionals’ investments in the fund(s) they manage; and (m) periodic updates on BlackRock’s business.
Board Considerations in Approving the Agreement
The Approval Process: Prior to the April Meeting, the Board requested and received materials specifically relating to the Agreement. The Independent Board Members are continuously engaged in a process with their independent legal counsel and BlackRock to review the nature and scope of the information provided to the Board to better assist its deliberations. The materials provided in connection with the April Meeting included, among other things: (a) information independently compiled and prepared by Broadridge Financial Solutions, Inc. (“Broadridge”), based on either a Lipper classification or Morningstar category, regarding the Fund’s fees and expenses as compared with a peer group of funds as determined by Broadridge (“Expense Peers”) and the investment performance of the Fund as compared with a peer group of funds (“Performance Peers”); (b) information on the composition of the Expense Peers and Performance Peers and a description of Broadridge’s methodology; (c) information on the estimated profits realized by BlackRock and its affiliates pursuant to the Agreement and a discussion of fall-out benefits to BlackRock and its affiliates; (d) a general analysis provided by BlackRock concerning investment management fees received in connection with other types of investment products, such as institutional accounts, sub-advised mutual funds, ETFs, closed-end funds, open-end funds, and separately managed accounts under similar investment mandates, as well as the performance of such other products, as applicable; (e) a review of non-management fees; (f) the existence, impact and sharing of potential economies of scale, if any, with the Fund; (g) a summary of aggregate amounts paid by the Fund to BlackRock; (h) sales and redemption data regarding the Fund’s shares; and (i) various additional information requested by the Board as appropriate regarding BlackRock’s and the Fund’s operations.
At the April Meeting, the Board reviewed materials relating to its consideration of the Agreement. As a result of the discussions that occurred during the April Meeting, and as a culmination of the Board’s year-long deliberative process, the Board presented BlackRock with questions and requests for additional information. BlackRock responded to these questions and requests with additional written information in advance of the May Meeting.
| | |
| 26 | | 2020 BLACKROCK ANNUAL REPORTTO SHAREHOLDERS |
| | |
| Board Review and Approval of Investment Advisory Contract (continued) | | |
At the May Meeting, the Board concluded its assessment of, among other things: (a) the nature, extent and quality of the services provided by BlackRock; (b) the investment performance of the Fund as compared to its Performance Peers and to other metrics, as applicable; (c) the advisory fee and the estimated cost of the services and estimated profits realized by BlackRock and its affiliates from their relationship with the Fund; (d) the Fund’s fees and expenses compared to its Expense Peers; (e) the existence and sharing of potential economies of scale; (f) any fall-out benefits to BlackRock and its affiliates as a result of BlackRock’s relationship with the Fund; and (g) other factors deemed relevant by the Board Members.
The Board also considered other matters it deemed important to the approval process, such as other payments made to BlackRock or its affiliates relating to securities lending and cash management, and BlackRock’s services related to the valuation and pricing of Fund portfolio holdings. The Board noted the willingness of BlackRock’s personnel to engage in open, candid discussions with the Board. The Board did not identify any particular information as determinative, and each Board Member may have attributed different weights to the various items considered.
A. Nature, Extent and Quality of the Services Provided by BlackRock
The Board, including the Independent Board Members, reviewed the nature, extent and quality of services provided by BlackRock, including the investment advisory services, and the resulting performance of the Fund. Throughout the year, the Board compared Fund performance to the performance of a comparable group of mutual funds, relevant benchmark, and performance metrics, as applicable. The Board met with BlackRock’s senior management personnel responsible for investment activities, including the senior investment officers. The Board also reviewed the materials provided by the Fund’s portfolio management team discussing the Fund’s performance, investment strategies and outlook.
The Board considered, among other factors, with respect to BlackRock: the number, education and experience of investment personnel generally and the Fund’s portfolio management team; research capabilities; investments by portfolio managers in the funds they manage; portfolio trading capabilities; use of technology; commitment to compliance; credit analysis capabilities; risk analysis and oversight capabilities; and the approach to training and retaining portfolio managers and other research, advisory and management personnel. The Board also considered BlackRock’s overall risk management program, including the continued efforts of BlackRock and its affiliates to address cybersecurity risks and the role of BlackRock’s Risk & Quantitative Analysis Group. The Board engaged in a review of BlackRock’s compensation structure with respect to the Fund’s portfolio management team and BlackRock’s ability to attract and retain high-quality talent and create performance incentives.
In addition to investment advisory services, the Board considered the nature and quality of the administrative and other non-investment advisory services provided to the Fund. BlackRock and its affiliates provide the Fund with certain administrative, shareholder and other services (in addition to any such services provided to the Fund by third parties) and officers and other personnel as are necessary for the operations of the Fund. In particular, BlackRock and its affiliates provide the Fund with administrative services including, among others: (i) responsibility for disclosure documents, such as the prospectus, the summary prospectus (as applicable), the statement of additional information and periodic shareholder reports; (ii) oversight of daily accounting and pricing; (iii) responsibility for periodic filings with regulators; (iv) overseeing and coordinating the activities of third-party service providers including, among others, the Fund’s custodian, fund accountant, transfer agent, and auditor; (v) organizing Board meetings and preparing the materials for such Board meetings; (vi) providing legal and compliance support; (vii) furnishing analytical and other support to assist the Board in its consideration of strategic issues such as the merger, consolidation or repurposing of certain open-end funds; and (viii) performing or managing administrative functions necessary for the operation of the Fund, such as tax reporting, expense management, fulfilling regulatory filing requirements, overseeing the Fund’s distribution partners, and shareholder call center and other services. The Board reviewed the structure and duties of BlackRock’s fund administration, shareholder services, and legal & compliance departments and considered BlackRock’s policies and procedures for assuring compliance with applicable laws and regulations.
B. The Investment Performance of the Fund and BlackRock
The Board, including the Independent Board Members, also reviewed and considered the performance history of the Fund. In preparation for the April Meeting, the Board was provided with reports independently prepared by Broadridge, which included an analysis of the Fund’s performance as of December 31, 2019, as compared to its Performance Peers. Broadridge ranks funds in quartiles, ranging from first to fourth, where first is the most desirable quartile position and fourth is the least desirable. In connection with its review, the Board received and reviewed information regarding the investment performance of the Fund as compared to its Performance Peers. The Board and its Performance Oversight Committee regularly review, and meet with Fund management to discuss, the performance of the Fund throughout the year.
In evaluating performance, the Board focused particular attention on funds with less favorable performance records. The Board also noted that while it found the data provided by Broadridge generally useful, it recognized the limitations of such data, including in particular, that notable differences may exist between a fund and its Performance Peers (for example, the investment objectives and strategies). Further, the Board recognized that the performance data reflects a snapshot of a period as of a particular date and that selecting a different performance period could produce significantly different results. The Board also acknowledged that long-term performance could be impacted by even one period of significant outperformance or underperformance, and that a single investment theme could have the ability to disproportionately affect long-term performance.
The Board noted that for the since-inception period reported, the Fund ranked in the third quartile against its Performance Peers.
C. Consideration of the Advisory/Management Fees and the Estimated Cost of the Services and Estimated Profits Realized by BlackRock and its Affiliates from their Relationship with the Fund
The Board, including the Independent Board Members, reviewed the Fund’s contractual management fee rate compared with those of its Expense Peers. The contractual management fee rate represents a combination of the advisory fee and any administrative fees, before taking into account any reimbursements or fee waivers. The Board also compared the Fund’s total expense ratio, as well as its actual management fee rate, to those of its Expense Peers. The total expense ratio represents a fund’s total net operating expenses, including any 12b-1 or non-12b-1 service fees. The total expense ratio gives effect to any expense reimbursements or fee waivers, and the actual management fee rate gives effect to any management fee reimbursements or waivers. The Board considered the services provided and the fees charged by BlackRock and
| | | | |
| BOARD REVIEWAND APPROVALOF INVESTMENT ADVISORY CONTRACT | | | 27 | |
Board Review and Approval of Investment Advisory Contract (continued)
its affiliates to other types of clients with similar investment mandates, as applicable, including institutional accounts and sub-advised mutual funds (including mutual funds sponsored by third parties).
The Board received and reviewed statements relating to BlackRock’s financial condition. The Board reviewed BlackRock’s profitability methodology and was also provided with an estimated profitability analysis that detailed the revenues earned and the expenses incurred by BlackRock for services provided to the Fund. The Board reviewed BlackRock’s estimated profitability with respect to the Fund and other funds the Board currently oversees for the year ended December 31, 2019 compared to available aggregate estimated profitability data provided for the prior two years. The Board reviewed BlackRock’s estimated profitability with respect to certain other U.S. fund complexes managed by BlackRock and/or its affiliates. The Board reviewed BlackRock’s assumptions and methodology of allocating expenses in the estimated profitability analysis, noting the inherent limitations in allocating costs among various advisory products. The Board recognized that profitability may be affected by numerous factors including, among other things, fee waivers and expense reimbursements by BlackRock, the types of funds managed, precision of expense allocations and business mix. The Board thus recognized that calculating and comparing profitability at the individual fund level is difficult.
The Board noted that, in general, individual fund or product line profitability of other advisors is not publicly available. The Board reviewed BlackRock’s overall operating margin, in general, compared to that of certain other publicly traded asset management firms. The Board considered the differences between BlackRock and these other firms, including the contribution of technology at BlackRock, BlackRock’s expense management, and the relative product mix.
The Board considered whether BlackRock has the financial resources necessary to attract and retain high quality investment management personnel to perform its obligations under the Agreement and to continue to provide the high quality of services that is expected by the Board. The Board further considered factors including but not limited to BlackRock’s commitment of time, assumption of risk, and liability profile in servicing the Fund, including in contrast to what is required of BlackRock with respect to other products with similar investment mandates across the open-end fund, ETF, closed-end fund, sub-advised mutual fund, separately managed account, collective investment trust, and institutional separate account product channels, as applicable.
The Board noted that the Fund’s contractual management fee rate ranked in the first quartile, and that the actual management fee rate and total expense ratio each ranked in the first quartile relative to the Fund’s Expense Peers. The Board also noted that the Fund has an advisory fee arrangement that includes breakpoints that adjust the fee rate downward as the size of the Fund increases above certain contractually specified levels. The Board noted that if the size of the Fund were to decrease, the Fund could lose the benefit of one or more breakpoints. The Board also noted that BlackRock had voluntarily agreed to waive a portion of the advisory fee payable by the Fund.
D. Economies of Scale
The Board, including the Independent Board Members, considered the extent to which economies of scale might be realized as the assets of the Fund increase, including the existence of fee waivers and/or expense caps, as applicable, noting that any contractual fee waivers and contractual expense caps had been approved by the Board. In its consideration, the Board further considered the continuation and/or implementation of fee waivers and/or expense caps, as applicable. The Board also considered the extent to which the Fund benefits from such economies of scale in a variety of ways and whether there should be changes in the advisory fee rate or breakpoint structure in order to enable the Fund to more fully participate in these economies of scale. The Board considered the Fund’s asset levels and whether the current fee schedule was appropriate.
E. Other Factors Deemed Relevant by the Board Members
The Board, including the Independent Board Members, also took into account other ancillary or “fall-out” benefits that BlackRock or its affiliates may derive from BlackRock’s respective relationships with the Fund, both tangible and intangible, such as BlackRock’s ability to leverage its investment professionals who manage other portfolios and its risk management personnel, an increase in BlackRock’s profile in the investment advisory community, and the engagement of BlackRock’s affiliates as service providers to the Fund, including for administrative, distribution, securities lending and cash management services. The Board also considered BlackRock’s overall operations and its efforts to expand the scale of, and improve the quality of, its operations. The Board also noted that, subject to applicable law, BlackRock may use and benefit from third-party research obtained by soft dollars generated by certain registered fund transactions to assist in managing all or a number of its other client accounts.
In connection with its consideration of the Agreement, the Board also received information regarding BlackRock’s brokerage and soft dollar practices. The Board received reports from BlackRock which included information on brokerage commissions and trade execution practices throughout the year.
The Board noted the competitive nature of the ETF marketplace, and that shareholders are able to redeem their Fund shares if they believe that the Fund’s fees and expenses are too high or if they are dissatisfied with the performance of the Fund.
Conclusion
The Board, including the Independent Board Members, unanimously approved the continuation of the Agreement between the Manager and the Trust, on behalf of the Fund, for a one-year term ending June 30, 2021. Based upon its evaluation of all of the aforementioned factors in their totality, as well as other information, the Board, including the Independent Board Members, was satisfied that the terms of the Agreement were fair and reasonable and in the best interest of the Fund and its shareholders. In arriving at its decision to approve the Agreement, the Board did not identify any single factor or group of factors as all-important or controlling, but considered all factors together, and different Board Members may have attributed different weights to the various factors considered. The Independent Board Members were also assisted by the advice of independent legal counsel in making this determination.
| | |
| 28 | | 2020 BLACKROCK ANNUAL REPORTTO SHAREHOLDERS |
Supplemental Information (unaudited)
Section 19(a) Notices
The amounts and sources of distributions reported are estimates and are being provided pursuant to regulatory requirements and are not being provided for tax reporting purposes. The actual amounts and sources for tax reporting purposes will depend upon the Fund’s investment experience during the year and may be subject to changes based on tax regulations. Shareholders will receive a Form 1099-DIV each calendar year that will inform them how to report these distributions for federal income tax purposes.
| | | | | | | | | | | | | | | | | | | | | | | | | | | | | | | | |
| | | Total Cumulative Distributions
for the Fiscal Year | | | % Breakdown of the Total Cumulative
Distributions for the Fiscal Year | |
| BlackRock ETF | | Net Investment Income | | | Net Realized Capital Gains | | | Return of Capital | | | Total Per Share | | | Net Investment Income | | | Net Realized
Capital Gains | | | Return of
Capital | | | Total Per
Share | |
U.S. Equity Factor Rotation(a) | | $ | 0.434276 | | | $ | — | | | $ | 0.001580 | | | $ | 0.435856 | | | | 100 | % | | | — | % | | | 0 | %(b) | | | 100 | % |
| | (a) | The Fund estimates that it has distributed more than its net investment income and net realized capital gains; therefore, a portion of the distribution may be a return of capital. A return of capital may occur, for example, when some or all of the shareholder’s investment in the Fund is returned to the shareholder. A return of capital does not necessarily reflect the Fund’s investment performance and should not be confused with “yield” or “income”. When distributions exceed total return performance, the difference will incrementally reduce the Fund’s net asset value per share. | |
| | (b) | Rounds to less than 1%. | |
Premium/Discount Information
The Premium/Discount Information section is intended to present information about the differences between the daily market price on secondary markets for shares of a fund and that fund’s NAV. NAV is the price at which a fund issues and redeems shares. It is calculated in accordance with the standard formula for valuing mutual fund shares. The “Market Price” of a fund generally is determined using the midpoint between the highest bid and the lowest ask on the primary securities exchange on which shares of such fund are listed for trading, as of the time that the fund’s NAV is calculated. A fund’s Market Price may be at, above or below its NAV. The NAV of a fund will fluctuate with changes in the value of its portfolio holdings. The Market Price of a fund will fluctuate in accordance with changes in its NAV, as well as market supply and demand.
Premiums or discounts are the differences (expressed as a percentage) between the NAV and Market Price of a fund on a given day, generally at the time the NAV is calculated. A premium is the amount that a fund is trading above the reported NAV, expressed as a percentage of the NAV. A discount is the amount that a fund is trading below the reported NAV, expressed as a percentage of the NAV.
Premium/discount information for the Fund covering the most recently completed calendar year and the most recently completed calendar quarters since that year (or since the Fund began trading, if shorter) is publicly accessible, free of charge, at blackrock.com.
The following information shows the frequency of distributions of premiums and discounts for the Fund for the immediately preceding five calendar years (or from the date the Fund began trading on the secondary market, if less than five years) through the date of the most recent calendar quarter-end. Each line in the table shows the number of trading days in which the Fund traded within the premium/discount range indicated. Premium/discount ranges with no trading days are omitted. The number of trading days in each premium/discount range is also shown as a percentage of the total number of trading days in the period covered by each table. All data presented here represents past performance, which cannot be used to predict future results.
BlackRock U.S. Equity Factor Rotation ETF
Period Covered: March 21, 2019 through June 30, 2020
| | | | | | | | | | | | | | | | |
| Premium/Discount Range | | Number of Days | | | Percentage of
Total Days | |
Greater than 1.0% and Less than 1.5% | | | | | | | 1 | | | | | | | | 0.31 | % |
Greater than 0.0% and Less than 0.5% | | | | | | | 177 | | | | | | | | 54.80 | |
At NAV | | | | | | | 25 | | | | | | | | 7.74 | |
Less than 0.0% and Greater than –0.5% | | | | | | | 120 | | | | | | | | 37.15 | |
| | | | | | | | | | | | | | | | |
| | | | | | | 323 | | | | | | | | 100.00 | % |
| | | | | | | | | | | | | | | | |
| | | | |
| SUPPLEMENTAL INFORMATION | | | 29 | |
Trustee and Officer Information
| | | | | | | | |
| Independent Trustees (a) |
| | | | | |
Name Year of Birth(b) | | Position(s) Held (Length of Service) | | Principal Occupation(s) During Past Five Years | | Number of BlackRock-Advised Registered Investment Companies (“RICs”) Consisting of Investment Portfolios (“Portfolios”) Overseen | | Public Company and Other Investment Company Directorships Held During Past Five Years |
Mark Stalnecker 1951 | | Chair of the Board and Trustee
(Since 2019) | | Chief Investment Officer, University of Delaware from 1999 to 2013; Trustee and Chair of the Finance and Investment Committees, Winterthur Museum and Country Estate from 2005 to 2016; Member of the Investment Committee, Delaware Public Employees’ Retirement System since 2002; Member of the Investment Committee, Christiana Care Health System from 2009 to 2017; Member of the Investment Committee, Delaware Community Foundation from 2013 to 2014; Director and Chair of the Audit Committee, SEI Private Trust Co. from 2001 to 2014. | | 36 RICs consisting of 155 Portfolios | | None |
Bruce R. Bond 1946 | | Trustee
(Since 2019) | | Board Member, Amsphere Limited (software) since 2018; Trustee and Member of the Governance Committee, State Street Research Mutual Funds from 1997 to 2005; Board Member of Governance, Audit and Finance Committee, Avaya Inc. (computer equipment) from 2003 to 2007. | | 36 RICs consisting of 155 Portfolios | | None |
Susan J. Carter 1956 | | Trustee
(Since 2019) | | Director, Pacific Pension Institute from 2014 to 2018; Advisory Board Member, Center for Private Equity and Entrepreneurship at Tuck School of Business since 1997; Senior Advisor, Commonfund Capital, Inc. (“CCI”) (investment adviser) in 2015; Chief Executive Officer, CCI from 2013 to 2014; President & Chief Executive Officer, CCI from 1997 to 2013; Advisory Board Member, Girls Who Invest from 2015 to 2018 and Board Member thereof since 2018; Advisory Board Member, Bridges Fund Management since 2016; Trustee, Financial Accounting Foundation since 2017; Practitioner Advisory Board Member, Private Capital Research Institute (“PCRI”) since 2017; Lecturer in the Practice of Management, Yale School of Management since 2019. | | 36 RICs consisting of 155 Portfolios | | None |
Collette Chilton 1958 | | Trustee
(Since 2019) | | Chief Investment Officer, Williams College since 2006; Chief Investment Officer, Lucent Asset Management Corporation from 1998 to 2006. | | 36 RICs consisting of 155 Portfolios | | None |
Neil A. Cotty 1954 | | Trustee
(Since 2019) | | Bank of America Corporation from 1996 to 2015, serving in various senior finance leadership roles, including Chief Accounting Officer, from 2009 to 2015, Chief Financial Officer of Global Banking, Markets and Wealth Management from 2008 to 2009, Chief Accounting Officer from 2004 to 2008, Chief Financial Officer of Consumer Bank from 2003 to 2004, Chief Financial Officer of Global Corporate Investment Bank from 1999 to 2002. | | 36 RICs consisting of 155 Portfolios | | None |
Lena G. Goldberg
1949 | | Trustee
(Since 2019) | | Senior Lecturer, Harvard Business School, since 2008; Director, Charles Stark Draper Laboratory, Inc. since 2013; FMR LLC/Fidelity Investments (financial services) from 1996 to 2008, serving in various senior roles including Executive Vice President – Strategic Corporate Initiatives and Executive Vice President and General Counsel; Partner, Sullivan & Worcester LLP from 1985 to 1996 and Associate thereof from 1979 to 1985. | | 36 RICs consisting of 155 Portfolios | | None |
| | |
| 30 | | 2020 BLACKROCK ANNUAL REPORTTO SHAREHOLDERS |
Trustee and Officer Information (continued)
| | | | | | | | |
| Independent Trustees (a) (continued) |
| | | | | |
Name Year of Birth(b) | | Position(s) Held (Length of Service) | | Principal Occupation(s) During Past Five Years | | Number of BlackRock-Advised Registered Investment Companies (“RICs”) Consisting of Investment Portfolios (“Portfolios”) Overseen | | Public Company and Other Investment Company Directorships Held During Past Five Years |
Henry R. Keizer 1956 | | Trustee (Since 2019) | | Director, Park Indemnity Ltd. (captive insurer) since 2010; Director, MUFG Americas Holdings Corporation and MUFG Union Bank, N.A. (financial and bank holding company) from 2014 to 2016; Director, American Institute of Certified Public Accountants from 2009 to 2011; Director, KPMG LLP (audit, tax and advisory services) from 2004 to 2005 and 2010 to 2012; Director, KPMG International in 2012, Deputy Chairman and Chief Operating Officer thereof from 2010 to 2012 and U.S. Vice Chairman of Audit thereof from 2005 to 2010; Global Head of Audit, KPMGI (consortium of KPMG firms) from 2006 to 2010; Director, YMCA of Greater New York from 2006 to 2010. | | 36 RICs consisting of 155 Portfolios | | Hertz Global Holdings (car rental); Montpelier Re Holdings, Ltd. (publicly held property and casualty reinsurance) from 2013 until 2015; WABCO (commercial vehicle safety systems); Sealed Air Corp. (packaging). |
Cynthia A. Montgomery 1952 | | Trustee (Since 2019) | | Professor, Harvard Business School since 1989. | | 36 RICs consisting of 155 Portfolios | | Newell Rubbermaid, Inc. (manufacturing) |
Donald C. Opatrny 1952 | | Trustee (Since 2019) | | Trustee, Vice Chair, Member of the Executive Committee and Chair of the Investment Committee, Cornell University since 2004; President, Trustee and Member of the Investment Committee, The Aldrich Contemporary Art Museum from 2007 to 2014; Member of the Board and Investment Committee, University School from 2007 to 2018; Member of the Investment Committee, Mellon Foundation from 2009 to 2015; Trustee, Artstor (a Mellon Foundation affiliate) from 2010 to 2015; President and Trustee, the Center for the Arts, Jackson Hole from 2011 to 2018; Director, Athena Capital Advisors LLC (investment management firm) since 2013; Trustee and Chair of the Investment Committee, Community Foundation of Jackson Hole since 2014; Member of Affordable Housing Supply Board of Jackson, Wyoming since 2018; Member, Investment Funds Committee, State of Wyoming since 2017; Trustee, Phoenix Art Museum since 2018; Trustee, Arizona Community Foundation and Member of Investment Committee since 2020. | | 36 RICs consisting of 155 Portfolios | | None |
Joseph P. Platt 1947 | | Trustee (Since 2019) | | General Partner, Thorn Partners, LP (private investments) since 1998; Director, WQED Multi-Media (public broadcasting not-for-profit) since 2001; Chair, Basic Health International (non-profit) since 2015. | | 36 RICs consisting of 155 Portfolios | | Greenlight Capital Re, Ltd. (reinsurance company); Consol Energy Inc. |
Kenneth L. Urish 1951 | | Trustee (Since 2019) | | Managing Partner, Urish Popeck & Co., LLC (certified public accountants and consultants) since 1976; Past-Chairman of the Professional Ethics Committee of the Pennsylvania Institute of Certified Public Accountants and Committee Member thereof since 2007; Member of External Advisory Board, The Pennsylvania State University Accounting Department since founding in 2001; Principal, UP Strategic Wealth Investment Advisors, LLC since 2013; Trustee, The Holy Family Institute from 2001 to 2010; President and Trustee, Pittsburgh Catholic Publishing Associates from 2003 to 2008; Director, Inter-Tel from 2006 to 2007. | | 36 RICs consisting of 155 Portfolios | | None |
| | | | |
| TRUSTEEAND OFFICER INFORMATION | | | 31 | |
Trustee and Officer Information (continued)
| | | | | | | | |
| Independent Trustees (a) (continued) |
| | | | | |
Name Year of Birth(b) | | Position(s) Held (Length of Service) | | Principal Occupation(s) During Past Five Years | | Number of BlackRock-Advised Registered Investment Companies (“RICs”) Consisting of Investment Portfolios (“Portfolios”) Overseen | | Public Company and Other Investment Company Directorships Held During Past Five Years |
Claire A. Walton 1957 | | Trustee (Since 2019) | | Chief Operating Officer and Chief Financial Officer of Liberty Square Asset Management, LP from 1998 to 2015; General Partner of Neon Liberty Capital Management, LLC since 2003; Director, Boston Hedge Fund Group from 2009 to 2018; Director, Woodstock Ski Runners since 2013; Director, Massachusetts Council on Economic Education from 2013 to 2015. | | 36 RICs consisting of 155 Portfolios | | None |
| (a) | The address of each Trustee is c/o BlackRock, Inc., 55 East 52nd Street, New York, New York 10055. |
| (b) | Independent Trustees serve until their resignation, retirement, removal or death, or until December 31 of the year in which they turn 75. The Board may determine to extend the terms of Independent Trustees on a case-by-case basis, as appropriate. |
| | | | | | | | |
|
| Interested Trustees (a) |
| | | | | |
Name Year of Birth(b) | | Position(s) Held (Length of Service) | | Principal Occupation(s) During Past Five Years | | Number of BlackRock-Advised Registered Investment Companies (“RICs”) Consisting of Investment Portfolios (“Portfolios”) Overseen | | Public Company and Other Investment Company Directorships Held During Past Five Years |
Robert Fairbairn 1965 | | Trustee
(since 2019) | | Vice Chairman of BlackRock, Inc. since 2019; Member of BlackRock’s Global Executive and Global Operating Committees; Co-Chair of BlackRock’s Human Capital Committee; Senior Managing Director of BlackRock, Inc. from 2010 to 2019; oversaw BlackRock’s Strategic Partner Program and Strategic Product Management Group from 2012 to 2019; Member of the Board of Managers of BlackRock Investments, LLC from 2011 to 2018; Global Head of BlackRock’s Retail and iShares® businesses from 2012 to 2016. | | 122 RICs consisting of 265 Portfolios | | None |
John M. Perlowski(c) 1964 | | Trustee and President and Chief Executive Officer (since 2019) | | Managing Director of BlackRock, Inc. since 2009; Head of BlackRock Global Accounting and Product Services since 2009; Advisory Director of Family Resource Network (charitable foundation) since 2009. | | 123 RICs consisting of 266 Portfolios | | None |
| (a) | The address of each Trustee is c/o BlackRock, Inc., 55 East 52nd Street, New York, New York 10055. |
| (b) | Mr. Fairbairn and Mr. Perlowski are both “interested persons,” as defined in the 1940 Act, of the Trust based on their positions with BlackRock, Inc. and its affiliates. Mr. Fairbairn and Mr. Perlowski are also board members of the BlackRock Fixed-Income Complex. |
| (c) | Mr. Perlowski is also a trustee of the BlackRock Credit Strategies Fund. |
| | | | |
|
| Officers Who Are Not Trustees (a) |
| | | |
Name Year of Birth(b) | | Position(s) Held (Length of Service) | | Principal Occupation(s) During Past Five Years |
Jennifer McGovern 1977 | | Vice President
(since 2019) | | Managing Director of BlackRock, Inc. since 2016; Director of BlackRock, Inc. from 2011 to 2015; Head of Americas Product Development and Governance for BlackRock’s Global Product Group since 2019; Head of Product Structure and Oversight for BlackRock’s U.S. Wealth Advisory Group from 2013 to 2019. |
Neal J. Andrews 1966 | | Chief Financial Officer
(since 2019) | | Chief Financial Officer of the iShares® exchange traded funds from 2019 to 2020; Managing Director of BlackRock, Inc. since 2006. |
| | |
| 32 | | 2020 BLACKROCK ANNUAL REPORTTO SHAREHOLDERS |
Trustee and Officer Information (continued)
| | | | |
| Officers Who Are Not Trustees (a) (continued) |
| | | |
Name Year of Birth(b) | | Position(s) Held (Length of Service) | | Principal Occupation(s) During Past Five Years |
Jay M. Fife 1970 | | Treasurer (since 2019) | | Managing Director of BlackRock, Inc. since 2007. |
Charles Park 1967 | | Chief Compliance Officer (since 2019) | | Anti-Money Laundering Compliance Officer for certain BlackRock-advised Funds from 2014 to 2015; Chief Compliance Officer of BlackRock Advisors, LLC and the BlackRock-advised Funds in the BlackRock Multi-Asset Complex and the BlackRock Fixed-Income Complex since 2014; Principal of and Chief Compliance Officer for iShares® Delaware Trust Sponsor LLC since 2012 and BlackRock Fund Advisors (“BFA”) since 2006; Chief Compliance Officer for the BFA-advised iShares® exchange traded funds since 2006; Chief Compliance Officer for BlackRock Asset Management International Inc. since 2012. |
Lisa Belle 1968 | | Anti-Money Laundering Compliance Officer (since 2019) | | Managing Director of BlackRock, Inc. since 2019; Global Financial Crime Head for Asset and Wealth Management of JP Morgan from 2013 to 2019; Managing Director of RBS Securities from 2012 to 2013; Head of Financial Crimes for Barclays Wealth Americas from 2010 to 2012. |
Janey Ahn 1975 | | Secretary (since 2019) | | Managing Director of BlackRock, Inc. since 2018; Director of BlackRock, Inc. from 2009 to 2017. |
| (a) | The address of each Officer is c/o BlackRock, Inc., 55 East 52nd Street, New York, New York 10055. |
| (b) | Officers of the Trust serve at the pleasure of the Board. |
Further information about the Trust’s Officers and Trustees is available in the Trust’s Statement of Additional Information, which can be obtained without charge by calling (800) 441-7762.
| | |
| Investment Adviser | | Independent Registered Public Accounting Firm |
| BlackRock Fund Advisors | | PricewaterhouseCoopers LLP |
| San Francisco, CA 94105 | | Philadelphia, Pennsylvania 19103 |
| |
| Administrator, Custodian and Transfer Agent | | Legal Counsel |
| State Street Bank and Trust Company | | Sidley Austin LLP |
| Boston, MA, 02111 | | New York, NY 10019 |
| |
| Distributor | | Address of the Trust |
| BlackRock Investments, LLC | | 100 Bellevue Parkway |
| New York, NY 10022 | | Wilmington, DE 19809 |
| | | | |
| TRUSTEEAND OFFICER INFORMATION | | | 33 | |
Additional Information
General Information
Householding
The Fund will mail only one copy of shareholder documents, including prospectuses, annual and semi-annual reports and proxy statements, to shareholders with multiple accounts at the same address. This practice is commonly called “householding” and is intended to reduce expenses and eliminate duplicate mailings of shareholder documents. Mailings of your shareholder documents may be householded indefinitely unless you instruct us otherwise. If you do not want the mailing of these documents to be combined with those for other members of your household, please call the Fund at (800) 441-7762.
Availability of Quarterly Schedule of Investments
The Fund files its complete schedule of portfolio holdings with the SEC for the first and third quarters of each fiscal year as an exhibit to its reports on Form N-PORT. The Fund’s Forms N-PORT are available on the SEC’s website at sec.gov. The Fund’s Forms N-PORT may also be obtained upon request and without charge by calling (800) 441-7762.
Availability of Proxy Voting Policies and Procedures
A description of the policies and procedures that the Fund uses to determine how to vote proxies relating to portfolio securities is available upon request and without charge (1) by calling (800) 441-7762; (2) at blackrock.com; and (3) on the SEC’s website at sec.gov.
Availability of Proxy Voting Record
Information about how the Fund voted proxies relating to securities held in the Fund’s portfolio during the most recent 12-month period ended June 30 is available upon request and without charge (1) at blackrock.com; or by calling (800) 441-7762 and (2) on the SEC’s website at sec.gov.
BlackRock’s Mutual Fund Family
BlackRock offers a diverse lineup of open-end mutual funds crossing all investment styles and managed by experts in equity, fixed-income and tax-exempt investing. Visit blackrock.com for more information.
BlackRock Privacy Principles
BlackRock is committed to maintaining the privacy of its current and former fund investors and individual clients (collectively, “Clients”) and to safeguarding their non-public personal information. The following information is provided to help you understand what personal information BlackRock collects, how we protect that information and why in certain cases we share such information with select parties.
If you are located in a jurisdiction where specific laws, rules or regulations require BlackRock to provide you with additional or different privacy-related rights beyond what is set forth below, then BlackRock will comply with those specific laws, rules or regulations.
BlackRock obtains or verifies personal non-public information from and about you from different sources, including the following: (i) information we receive from you or, if applicable, your financial intermediary, on applications, forms or other documents; (ii) information about your transactions with us, our affiliates, or others; (iii) information we receive from a consumer reporting agency; and (iv) from visits to our websites.
BlackRock does not sell or disclose to non-affiliated third parties any non-public personal information about its Clients, except as permitted by law or as is necessary to respond to regulatory requests or to service Client accounts. These non-affiliated third parties are required to protect the confidentiality and security of this information and to use it only for its intended purpose.
We may share information with our affiliates to service your account or to provide you with information about other BlackRock products or services that may be of interest to you. In addition, BlackRock restricts access to non-public personal information about its Clients to those BlackRock employees with a legitimate business need for the information. BlackRock maintains physical, electronic and procedural safeguards that are designed to protect the non-public personal information of its Clients, including procedures relating to the proper storage and disposal of such information.
| | |
| 34 | | 2020 BLACKROCK ANNUAL REPORTTO SHAREHOLDERS |
Glossary of Terms Used in this Report
Portfolio Abbreviations — Equity
| | | | |
| GLOSSARYOF TERMS USEDINTHIS REPORT | | | 35 | |
Want to know more?
blackrock.com | (800) 441-7762
This report is intended for current holders. It is not authorized for use as an offer of sale or a solicitation of an offer to buy shares of the Fund unless preceded or accompanied by the Fund’s current prospectus. Past performance results shown in this report should not be considered a representation of future performance. Investment returns and principal value of shares will fluctuate so that shares, when redeemed, may be worth more or less than their original cost. Statements and other information herein are as dated and are subject to change.
USEFR-7/20-AR
| | |
| |  |
| Item 2 – | Code of Ethics – The registrant (or the “Fund”) has adopted a code of ethics, as of the end of the period covered by this report, applicable to the registrant’s principal executive officer, principal financial officer, principal accounting officer or controller, or persons performing similar functions. During the period covered by this report, the code of ethics was amended to update certain information and to make other non-material changes. During the period covered by this report, there have been no waivers granted under the code of ethics. The registrant undertakes to provide a copy of the code of ethics to any person upon request, without charge, who calls 1-800-441-7762. |
| Item 3 – | Audit Committee Financial Expert – The registrant’s board of directors (the “board of directors”), has determined that (i) the registrant has the following audit committee financial experts serving on its audit committee and (ii) each audit committee financial expert is independent: |
| | Under applicable securities laws, a person determined to be an audit committee financial expert will not be deemed an “expert” for any purpose, including without limitation for the purposes of Section 11 of the Securities Act of 1933, as a result of being designated or identified as an audit committee financial expert. The designation or identification of a person as an audit committee financial expert does not impose on such person any duties, obligations, or liabilities greater than the duties, obligations, and liabilities imposed on such person as a member of the audit committee and board of directors in the absence of such designation or identification. The designation or identification of a person as an audit committee financial expert does not affect the duties, obligations, or liability of any other member of the audit committee or board of directors. |
| Item 4 – | Principal Accountant Fees and Services |
| | The following table presents fees billed by Pricewaterhouse Coopers (“PwC”) in each of the last two fiscal years for the services rendered to the Fund: |
| | | | | | | | | | | | | | | | |
| | | (a) Audit Fees | | (b) Audit-Related Fees1 | | (c) Tax Fees2 | | (d) All Other Fees |
| Entity Name | | Current
Fiscal Year
End | | Previous
Fiscal Year
End | | Current
Fiscal Year
End | | Previous
Fiscal Year
End | | Current
Fiscal Year
End | | Previous
Fiscal Year
End | | Current
Fiscal Year
End | | Previous
Fiscal Year
End |
BlackRock U.S.
Equity Factor
Rotation ETF | | $12,000 | | $12,000 | | $0 | | $5,000 | | $6,028 | | $3,800 | | $0 | | $0 |
The following table presents fees billed by PwC that were required to be approved by the registrant’s audit committee (the “Committee”) for services that relate directly to the operations or financial reporting of the Fund and that are rendered on behalf of BlackRock Advisors, LLC (the “Investment Adviser” or “BlackRock”) and entities controlling, controlled by, or under common control with BlackRock (not including any sub-adviser whose role is primarily portfolio management and is subcontracted with or overseen by another investment adviser) that provide ongoing services to the Fund (“Affiliated Service Providers”):
| | | | |
| | | Current Fiscal Year End | | Previous Fiscal Year End |
(b) Audit-Related Fees1 | | $0 | | $0 |
(c) Tax Fees2 | | $0 | | $0 |
2
| | | | |
(d) All Other Fees3 | | $0 | | $0 |
1 The nature of the services includes assurance and related services reasonably related to the performance of the audit or review of financial statements not included in Audit Fees, including accounting consultations, agreed-upon procedure reports, attestation reports, comfort letters, out-of-pocket expenses and internal control reviews not required by regulators.
2 The nature of the services includes tax compliance and/or tax preparation, including services relating to the filing or amendment of federal, state or local income tax returns, regulated investment company qualification reviews, taxable income and tax distribution calculations.
3 Aggregate fees borne by BlackRock in connection with the review of compliance procedures and attestation thereto performed by PwC with respect to all of the registered closed-end funds and some of the registered open-end funds advised by BlackRock.
(e)(1) Audit Committee Pre-Approval Policies and Procedures:
The Committee has adopted policies and procedures with regard to the pre-approval of services. Audit, audit-related and tax compliance services provided to the registrant on an annual basis require specific pre-approval by the Committee. The Committee also must approve other non-audit services provided to the registrant and those non-audit services provided to the Investment Adviser and Affiliated Service Providers that relate directly to the operations and the financial reporting of the registrant. Certain of these non-audit services that the Committee believes are (a) consistent with the SEC’s auditor independence rules and (b) routine and recurring services that will not impair the independence of the independent accountants may be approved by the Committee without consideration on a specific case-by-case basis (“general pre-approval”). The term of any general pre-approval is 12 months from the date of the pre-approval, unless the Committee provides for a different period. Tax or other non-audit services provided to the registrant which have a direct impact on the operations or financial reporting of the registrant will only be deemed pre-approved provided that any individual project does not exceed $10,000 attributable to the registrant or $50,000 per project. For this purpose, multiple projects will be aggregated to determine if they exceed the previously mentioned cost levels.
Any proposed services exceeding the pre-approved cost levels will require specific pre-approval by the Committee, as will any other services not subject to general pre-approval (e.g., unanticipated but permissible services). The Committee is informed of each service approved subject to general pre-approval at the next regularly scheduled in-person board meeting. At this meeting, an analysis of such services is presented to the Committee for ratification. The Committee may delegate to the Committee Chairman the authority to approve the provision of and fees for any specific engagement of permitted non-audit services, including services exceeding pre-approved cost levels.
(e)(2) None of the services described in each of Items 4(b) through (d) were approved by the Committee pursuant to the de minimis exception in paragraph (c)(7)(i)(C) of Rule 2-01 of Regulation S-X.
(f) Not Applicable
(g) The aggregate non-audit fees, defined as the sum of the fees shown under “Audit-Related Fees,” “Tax Fees” and “All Other Fees,” paid to the accountant for services rendered by the accountant to the registrant, the Investment Adviser and the Affiliated Service Providers were:
| | | | |
| Entity Name | | Current Fiscal Year End | | Previous Fiscal Year End |
| BlackRock U.S. Equity Factor Rotation ETF | | $6,028 | | $8,800 |
3
| | (h) The Committee has considered and determined that the provision of non-audit services that were rendered to the Investment Adviser and the Affiliated Service Providers that were not pre-approved pursuant to paragraph (c)(7)(ii) of Rule 2-01 of Regulation S-X is compatible with maintaining the principal accountant’s independence. |
| Item 5 – | Audit Committee of Listed Registrants – Not Applicable |
| | (a) The registrant’s Schedule of Investments is included as part of the Report to Stockholders filed under Item 1 of this Form. |
| | (b) Not Applicable due to no such divestments during the semi-annual period covered since the previous Form N-CSR filing. |
| Item 7 – | Disclosure of Proxy Voting Policies and Procedures for Closed-End Management Investment Companies – Not Applicable |
| Item 8 – | Portfolio Managers of Closed-End Management Investment Companies – Not Applicable |
| Item 9 – | Purchases of Equity Securities by Closed-End Management Investment Company and Affiliated Purchasers – Not Applicable |
| Item 10 – | Submission of Matters to a Vote of Security Holders – There have been no material changes to these procedures. |
| Item 11 – | Controls and Procedures |
| | (a) The registrant’s principal executive and principal financial officers, or persons performing similar functions, have concluded that the registrant’s disclosure controls and procedures (as defined in Rule 30a-3(c) under the Investment Company Act of 1940, as amended (the “1940 Act”)) are effective as of a date within 90 days of the filing of this report based on the evaluation of these controls and procedures required by Rule 30a-3(b) under the 1940 Act and Rule 15d-15(b) under the Securities Exchange Act of 1934, as amended. |
| | (b) There were no changes in the registrant’s internal control over financial reporting (as defined in Rule 30a-3(d) under the 1940 Act) that occurred during the period covered by this report that have materially affected, or are reasonably likely to materially affect, the registrant’s internal control over financial reporting. |
| Item 12 – | Disclosure of Securities Lending Activities for Closed-End Management Investment Companies –Not Applicable |
| Item 13 – | Exhibits attached hereto |
4
Pursuant to the requirements of the Securities Exchange Act of 1934 and the Investment Company Act of 1940, the registrant has duly caused this report to be signed on its behalf by the undersigned, thereunto duly authorized.
| | |
| BlackRock ETF Trust |
| |
| By: | | /s/ John M. Perlowski |
| | John M. Perlowski |
| | Chief Executive Officer (principal executive officer) of |
| | BlackRock ETF Trust |
|
| Date: October 2, 2020 |
Pursuant to the requirements of the Securities Exchange Act of 1934 and the Investment Company Act of 1940, this report has been signed below by the following persons on behalf of the registrant and in the capacities and on the dates indicated.
| | |
| By: | | /s/ John M. Perlowski |
| | John M. Perlowski |
| | Chief Executive Officer (principal executive officer) of |
| | BlackRock ETF Trust |
|
| Date: October 2, 2020 |
| |
| By: | | /s/ Neal J. Andrews |
| | Neal J. Andrews |
| | Chief Financial Officer (principal financial officer) of |
| | BlackRock ETF Trust |
|
| Date: October 2, 2020 |
6