UNITED STATES
SECURITIES AND EXCHANGE COMMISSION
Washington, D.C. 20549
FORM N-CSR
CERTIFIED SHAREHOLDER REPORT OF REGISTERED
MANAGEMENT INVESTMENT COMPANIES
Investment Company Act file number: 811-23425
CIM Real Assets & Credit Fund
(Exact Name of Registrant as Specified in Charter)
4700 Wilshire Boulevard
Los Angeles, California 90010
(Address of Principal Executive Offices)
David Thompson
Chief Executive Officer
CIM Real Assets & Credit Fund
4700 Wilshire Boulevard
Los Angeles, California 90010
(Name and Address of Agent for Service)
Registrant’s Telephone Number, Including Area Code: (323) 860-7421
Date of fiscal year end: September 30
Date of reporting period: October 1, 2021 – March 31, 2022
Item 1. Reports to Stockholders.
Table of Contents
Important Notice Regarding Electronic Delivery
If you already elected to receive shareholder reports electronically, you will not be affected by this change and you do not need to take any action. For shareholder reports and other communications from the Fund issued prior to 2022, you may elect to receive such reports and other communications electronically. If you own shares of the Fund through a financial intermediary, you may contact your financial intermediary to elect to receive materials electronically. This information is available free of charge by contacting us by mail at 4700 Wilshire Boulevard, Los Angeles, CA, 90010, by telephone at (866) 907-2653 or on our website at https://www.cimgroup.com/ public-investment-programs/current-public-programs/racr.
You may elect to receive all future reports in paper, free of charge. If you own shares of the Fund through a financial intermediary, you may contact your financial intermediary to elect to continue to receive paper copies of your shareholder reports in 2022. This information is available free of charge by contacting us by mail at 4700 Wilshire Boulevard, Los Angeles, CA, 90010, by telephone at (866) 907-2653 or on our website at https://www.cimgroup.com/public-investment-programs/current-public-programs/racr. If you make such an election through your financial intermediary, your election to receive reports in paper may apply to all funds held through your financial intermediary.
| CIM Real Assets & Credit Fund | Shareholder Letter |
March 31, 2022 (Unaudited)
Dear Shareholders,
We are pleased to provide you with the 2022 semi-annual report for CIM Real Assets & Credit Fund (“we,” “us,” “our,” “CIM RACR,” or the “Fund”). CIM RACR is a continuously-offered, closed-end interval fund registered under the Investment Company Act of 1940, as amended, that launched its offering on May 4, 2020. The Fund invests in real assets (both debt and equity) and corporate credit.
We believe the portfolio is well positioned for the current rising interest rate and inflationary environment. As of March 31, 2022, 100% of CIM RACR’s corporate credit investments were floating rate; if short-term interest rates continue to rise, we anticipate that these investments will generate higher interest income for our shareholders. In addition, we believe our real estate investments may provide shareholders with a degree of protection against inflation. We are specifically focused on investing in real estate where we can leverage CIM’s vertically integrated platform to execute on an identified business plan in order to create value for shareholders.
The Fund’s investment objective is to generate current income through cash distributions and preserve shareholders’ capital across various market cycles, with a secondary objective of capital appreciation. However, there can be no assurance that the Fund will achieve its investment objective.
The Fund seeks to provide shareholders with income with a low correlation to the broader equity markets, by investing in a mix of institutional-quality real assets and credit instruments.
Since inception (May 2020), CIM RACR has generated an annualized return of 9.46%, 9.20%, 8.90% and 8.39% for the Class I Common Shares, Class A Common Shares, Class L Common Shares, and Class C Common Shares, respectively, and has outperformed the Bloomberg US Aggregate Bond Index. RACR’s returns since inception have primarily been driven by interest income from our real estate debt and corporate credit investments as well as appreciation on our real estate debt and equity investments.
The performance data quoted above represents past performance. Past performance does not guarantee future results. The investment return and principle value of an investment will fluctuate so that an investor’s shares, when sold or repurchased, may be worth more or less than the original cost. The current performance may be lower or higher than performance data quoted.
Distributions*
Since the Fund’s inception, we have increased the distribution four times for the Class C and Class A Common Shares, five times for the Class L Common Shares, and six times for the Class I Common Shares.
On December 15, 2021, CIM RACR announced that its Board of Trustees declared monthly cash dividends for each of January, February and March 2022 of $0.129 per share of Class C Common Shares, $0.130 per share of Class A and CIass L Common Shares and $0.131 per share of Class I Common Shares. These dividends in the aggregate represent an annual dividend rate of 6.0% of the Fund’s per share NAV as of December 14, 2021.
Fund Overview
We believe CIM RACR is a highly differentiated interval fund that offers several compelling features to its shareholders:
Innovative Structure. The Fund’s innovative structure allows it to directly invest in real estate rather than private funds of other managers, and thus avoiding multiple layers of fees. The Fund also intends to continue to allocate capital to liquid asset classes, allowing the Fund to provide shareholders with partial liquidity on a quarterly basis.
Alignment. To promote further alignment with other funds managed by affiliates of CIM Group, LLC ("CIM") and OFS Capital Management, LLC (the "OFS Sub-Adviser" or "OFS"), the Fund has obtained exemptive relief from the U.S. Securities and Exchange Commission ("SEC") that allows it to co-invest alongside funds managed by affiliates of CIM and OFS, in accordance with the conditions specified in the exemptive relief. The Fund seeks to provide investors with exposure to proprietary transactions, alongside large, sophisticated institutions, that otherwise may not be available to retail investors and that may have high investment minimums.
To further promote alignment, CIM and its affiliates will invest an aggregate of $20 million in the Fund. As of the date of this letter, CIM and its affiliates have invested $9.6 million in the Fund.
Balanced Portfolio. The Fund seeks to provide investors with exposure to complementary asset classes – real assets and corporate debt. The Fund’s target asset mix seeks to leverage CIM’s and OFS’ insight across asset classes and strategies to identify the best opportunities for its portfolio. CIM has a research-focused approach, and leverages its vertically integrated team to conduct a detailed underwriting analysis on each potential investment, in order to understand the investment’s return profile under different scenarios and the risks of the investment.
| Semi-Annual Report | March 31, 2022 | 1 |
| CIM Real Assets & Credit Fund | Shareholder Letter |
March 31, 2022 (Unaudited)
About the Advisor
CIM Capital IC Management, LLC (the “Adviser”), registered as an investment adviser with the SEC under the Investment Advisers Act of 1940, as amended (the” Advisers Act”), acts as the Fund’s investment adviser and is primarily responsible for determining the amount of the Fund’s total assets that are allocated to each of the Fund’s sub-advisers. The Adviser has engaged each of CIM Capital SA Management, LLC (the “CIM Sub-Adviser”) and the OFS Sub-Adviser, each a SEC-registered investment adviser, to act as an investment sub-adviser to the Fund. The CIM Sub-Adviser is responsible for identifying and sourcing investment opportunities with respect to investments in real assets held by the Fund. The OFS Sub-Adviser is responsible for identifying and sourcing credit and credit-related investment opportunities.
CIM is a vertically-integrated owner and operator of real assets for its own account and on behalf of its partners and co-investors, seeking exposure to real assets and associated credit strategies, with a principal focus on metropolitan areas across the Americas. Since inception, CIM, on behalf of itself and over 175 institutional partners and co-investors, has operated over 270 discretionary real estate and real estate-related equity, debt and infrastructure holdings. As of December 31, 2021, CIM owns and operates approximately $31.2 billion of assets** across its products and has deployed assets for its Principals, partners and co-investors, which include U.S. and Non-U.S. public and corporate pension funds, endowments and foundations, sovereign wealth funds and other institutional and private partners and co-investors since 2000. CIM has over 1,000 employees and more than 570 professionals and 9 corporate offices worldwide.
OFS is a full-service provider of capital and levered financial solutions with $3.0 billion in assets under management as of December 31, 2021, with a focus on middle market lending, broadly syndicated loans, and structured credit. OFS serves as the investment adviser to business development companies, registered closed-end funds, and separately managed, proprietary and sub-advised accounts, as well as the collateral manager to various collateralized loan obligations.
Thank you for your investment in CIM RACR. If you have any questions, please contact the CIM Shareholder Relations team at 866.907.2653. We look forward to continuing our relationship in the years to come.
Sincerely,
David Thompson
Chief Executive Officer
| * | Our distributions may exceed our earnings, and therefore, portions of the distributions that we make may be a return of the money that you originally invested and represent a return of capital to you for tax purposes. Such a return of capital is not immediately taxable, but reduces your tax basis in our shares, which may result in higher taxes for you even if your shares are sold at a price below your original investment. |
| ** | “Assets Owned and Operated” represents the aggregate assets owned and operated by CIM Group on behalf of partners (including where CIM Group contributes alongside for its own account) and co-investors, whether or not CIM Group has discretion, in each case without duplication. |
Forward-Looking Statements
Statements in this letter regarding management's future expectations, beliefs, intentions, goals, strategies, plans or prospects, including statements relating management’s belief that CIM RACR will benefit from CIM Group’s combined real assets, credit and transaction experience and deal-sourcing capabilities; the composition of CIM RACR’s portfolio of real assets and corporate credit assets and the potential benefits to investors, which may not be realized; opportunities for individuals to invest alongside institutional partners, and whether those opportunities will align the interests among sponsors, partners and shareholders; and other factors may constitute forward-looking statements for purposes of the safe harbor protection under applicable securities laws. Forward-looking statements can be identified by terminology such as “anticipate,” “believe,” “could,” “could increase the likelihood,” “estimate,” “expect,” “intend,” “is planned,” “may,” “should,” “will,” “will enable,” “would be expected,” “look forward,” “may provide,” “would” or similar terms, variations of such terms or the negative of those terms. Such forward-looking statements involve known and unknown risks, uncertainties and other factors, including the impact of COVID-19 rising inflation, and the ongoing conflict between Russia and Ukraine, and related changes in base interest rates, supply chain disruptions, and significant market volatility on our business, our industry, and the global economy, as well as those risks, uncertainties and factors referred to in CIM RACR’s Prospectus filed with the SEC on January 29, 2021 under the section “Risks” as well as other documents that may be filed by CIM RACR from time to time with the SEC. As a result of such risks, uncertainties and factors, actual results may differ materially from any future results, performance or achievements discussed in or implied by the forward-looking statements contained herein. CIM RACR is providing the information in this letter as of this date and assumes no obligations to update the information included in this letter or revise any forward-looking statements, whether as a result of new information, future events or otherwise.
| 2 | https://www.cimgroup.com/public-investment-programs/current-public-programs/racr |
| CIM Real Assets & Credit Fund | Portfolio Update |
March 31, 2022 (Unaudited)
Performance as of March 31, 2022
| CIM Real Assets & Credit Fund | 1 Month | Quarter | 6 Month | YTD | 1 Year(a) | Since Inception |
| CIM Real Assets & Credit Fund - A - NAV | 0.07% | 2.60% | 4.78% | 2.60% | 10.10% | 9.20% |
| CIM Real Assets & Credit Fund - A - LOAD | -5.67% | -3.30% | -1.25% | -3.30% | 3.77% | 5.85% |
| CIM Real Assets & Credit Fund - C - NAV | 0.00% | 2.46% | 4.40% | 2.46% | 9.30% | 8.39% |
| CIM Real Assets & Credit Fund - I - NAV | 0.08% | 2.67% | 4.89% | 2.67% | 10.34% | 9.46% |
| CIM Real Assets & Credit Fund - L - NAV | 0.04% | 2.53% | 4.63% | 2.53% | 9.78% | 8.90% |
| CIM Real Assets & Credit Fund - L - LOAD | -4.23% | -1.83% | 0.19% | -1.83% | 5.12% | 6.45% |
| Bloomberg US Aggregate Bond Index | -2.78% | -5.93% | -5.92% | -5.93% | -4.15% | -2.66% |
| (a) | Excludes adjustments in accordance with accounting principles generally accepted in the United States of America and as such, the net asset value and total return for shareholder transactions reported to the market may differ from the net asset value for financial reporting purposes. |
Comparison of the Change in Value of a $10,000 Investment
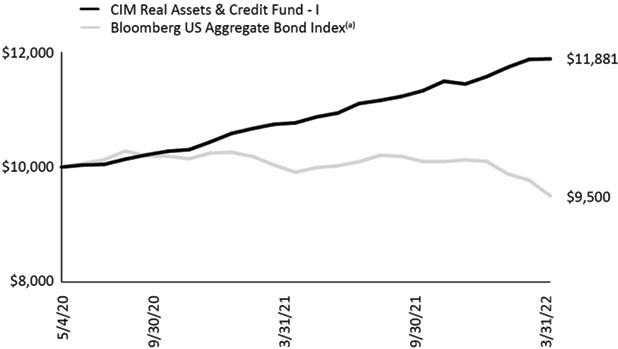
| (a) | The Bloomberg US Aggregate Bond Index is a broad based, market capitalization-weighted bond market index representing intermediate term investment grade bonds traded in the United States. Indexes are unmanaged and not available for direct investment; therefore, their performance does not reflect the expenses associated with active management of an actual portfolio. |
The performance data quoted above represents past performance. Past performance does not guarantee future results. The investment return and principle value of an investment will fluctuate so that an investor’s shares, when sold or repurchased, may be worth more or less than the original cost. The current performance may be lower or higher than performance data quoted. Please visit the Fund’s website at https://www.cimgroup.com/public-investment-programs/current-public-programs/racr for performance data current to the most recent month-end.
| Semi-Annual Report | March 31, 2022 | 3 |
| CIM Real Assets & Credit Fund | Portfolio Update |
March 31, 2022 (Unaudited)
Top Ten Long Holdings as of March 31, 2022
| | Percent of
Net Assets |
| EPIC Dallas | 8.80% |
| Del Mar Terrace - Phoenix, AZ | 7.43% |
| Sora Multifamily Residential Property | 6.41% |
| Society Las Olas - PMG-Greybook Riverfront I LLC | 5.01% |
| Vale at the Parks - DC | 3.06% |
| Society Las Olas - 301 SW 1st Avenue Holdings LLC | 2.52% |
| LAQ 2022-LAQ Mortgage Trust | 2.45% |
| Dryden 98 CLO, Ltd. | 2.41% |
| Boca Home Care Holdings, Inc DDTL | 2.14% |
| Brightwood Capital MM CLO 2022-11, LTD Class B LND | 1.94% |
| | 42.17% |
Portfolio Composition as of March 31, 2022
| Asset Type Allocation | Percent of
Net Assets |
| Real Estate-Related Securities | 8.20% |
| Direct Real Estate | 25.71% |
| Collateralized Loan Obligations | 21.00% |
| Bank Loan | 19.30% |
| Commercial Mortgage-Backed Securities | 5.53% |
| Common Stock | 3.56% |
| Cash, Cash Equivalents, & Other Net Assets | 16.70% |
| | 100.00% |
| 4 | https://www.cimgroup.com/public-investment-programs/current-public-programs/racr |
| CIM Real Assets & Credit Fund | Consolidated Schedule of Investments |
March 31, 2022 (Unaudited)
| | | Maturity Date | | Rate | | Principal | | | Value | |
| Bank Loans (19.30%)(a) | | | | | | | | | | | | |
| Chemicals (0.95%) | | | | | | | | | | | | |
| Molded Devices, Inc., Delayed Draw Term Loan(b) | | 11/01/2026 | | 1M US L + 6.00% | | $ | 277,778 | | | $ | 272,811 | |
| Molded Devices, Inc., Revolver(b) | | 11/01/2026 | | 1M US L + 6.00% | | | 185,185 | | | | 181,874 | |
| Molded Devices, Inc., Term Loan(b) | | 11/01/2026 | | 1M US L + 6.00% | | | 1,533,194 | | | | 1,505,782 | |
| Total Chemicals | | | | | | | | | | | 1,960,467 | |
| | | | | | | | | | | | | |
| Consumer, Non-cyclical (0.93%) | | | | | | | | | | | | |
| Bengal Debt Merger SUB, LLC TL 1L(b) | | 01/24/2030 | | L + 6.00% | | | 500,000 | | | | 500,000 | |
| RC Buyer, Inc., Second Lien Initial Term Loan(b) | | 07/30/2029 | | 3M US L + 6.50% | | | 1,016,949 | | | | 1,014,407 | |
| Spring Education Group, Inc., Second Lien Initial Term Loan(b) | | 07/30/2026 | | 3M US L + 8.25% | | | 430,240 | | | | 418,408 | |
| Total Consumer, Non-cyclical | | | | | | | | | | | 1,932,815 | |
| | | | | | | | | | | | | |
| Electronics (0.96%) | | | | | | | | | | | | |
| Idera, Inc.(b) | | 03/02/2029 | | 3M US L + 6.75% | | | 2,000,000 | | | | 1,975,000 | |
| | | | | | | | | | | | | |
| Food Products (0.40%) | | | | | | | | | | | | |
| BCPE North Star US Holdco 2, Inc. 2L TL(b) | | 06/08/2029 | | 3M US L + 7.25% | | | 833,333 | | | | 820,833 | |
| | | | | | | | | | | | | |
| Healthcare Equipment and Supplies (1.33%) | | | | | | | | | | | | |
| Kreg LLC, Revolver(b) | | 12/20/2026 | | 3M US L + 6.25% | | | 271,739 | | | | 268,816 | |
| Kreg LLC, Term Loan(b) | | 12/20/2026 | | 3M US L + 6.25% | | | 2,500,000 | | | | 2,473,102 | |
| Total Healthcare Equipment and Supplies | | | | | | | | | | | 2,741,918 | |
| | | | | | | | | | | | | |
| Healthcare Providers and Services (6.01%) | | | | | | | | | | | | |
| Baart Programs, Inc., Second Lien Term Loan(b) | | 06/11/2028 | | 3M US L + 8.50% | | | 2,189,394 | | | | 2,156,553 | |
| Boca Home Care Holdings Revolver(b) | | 02/25/2027 | | 1M SOFR + 6.50% | | | 580,645 | | | | 569,032 | |
| Boca Home Care Holdings, Inc DDTL(b) | | 02/25/2027 | | 1M SOFR + 6.50% | | | 4,500,000 | | | | 4,410,000 | |
| Honor HN Buyer, Inc., Delayed Draw Term Loan(b) | | 10/15/2027 | | 1M US L + 6.00% | | | 720,475 | | | | 705,009 | |
| Honor HN Buyer, Inc., Revolver(b) | | 10/15/2027 | | 1M US L + 6.00% | | | 132,013 | | | | 129,179 | |
| Honor HN Buyer, Inc., Term Loan(b) | | 10/15/2027 | | 1M US L + 6.00% | | | 1,147,512 | | | | 1,122,879 | |
| MedMark Services, Inc., Second Lien Term Loan(b) | | 06/11/2028 | | 3M US L + 8.50% | | | 378,788 | | | | 373,106 | |
| One GI Intermediate LLC, Revolver Upsize(b) | | 12/22/2025 | | 3M US L + 6.75% | | | 333,333 | | | | 326,018 | |
| One GI Intermediate LLC, Tranche B Delayed Draw Term Loan(b) | | 12/22/2025 | | 3M US L + 6.75% | | | 1,750,000 | | | | 1,711,593 | |
| One GI Intermediate LLC, Tranche C Delayed Draw Term Loan(b) | | 12/22/2025 | | 3M US L + 6.75% | | | 916,667 | | | | 896,549 | |
| Total Healthcare Providers and Services | | | | | | | | | | | 12,399,918 | |
| | | | | | | | | | | | | |
| Hotels, Restaurants & Leisure (2.29%) | | | | | | | | | | | | |
| SS Acquisition LLC, Delayed Draw Term Loan(b) | | 12/30/2026 | | L + 6.50% | | | 1,800,000 | | | | 1,775,983 | |
| SS Acquisition LLC, Term Loan(b) | | 12/30/2026 | | L + 6.50% | | | 3,000,000 | | | | 2,959,973 | |
| Total Hotels, Restaurants & Leisure | | | | | | | | | | | 4,735,956 | |
| | | | | | | | | | | | | |
| Household Durables (0.44%) | | | | | | | | | | | | |
| Astro One Acquisition Corporation(b) | | 09/14/2029 | | 3M US L + 8.50% | | | 1,000,000 | | | | 913,205 | |
See Notes to Consolidated Financial Statements.
| Semi-Annual Report | March 31, 2022 | 5 |
| CIM Real Assets & Credit Fund | Consolidated Schedule of Investments |
March 31, 2022 (Unaudited)
| | | Maturity Date | | Rate | | Principal | | | Value | |
| Industrial (0.47%) | | | | | | | | | | | | |
| Energy Acquisition LP, Second Lien Initial Term Loan(b) | | 06/26/2026 | | 2M US L + 8.50% | | $ | 1,097,499 | | | $ | 963,056 | |
| | | | | | | | | | | | | |
| Retail (1.61%) | | | | | | | | | | | | |
| LSF9 ATLANTIS HOLDINGS, LLC(b) | | 03/29/2029 | | L + 7.25% | | | 3,368,421 | | | | 3,320,000 | |
| | | | | | | | | | | | | |
| Services, Business (2.40%) | | | | | | | | | | | | |
| 24 Seven, Inc., DDTL(b) | | 11/16/2027 | | 3M US L + 6.00% | | | 2,084,500 | | | | 2,059,385 | |
| 24 Seven, Inc., Term Loan(b) | | 11/16/2027 | | 3M US L + 6.00% | | | 1,915,500 | | | | 1,892,421 | |
| Convergint Technologies LLC, Second Lien Term Loan(b) | | 03/30/2029 | | L + 6.75% | | | 999,970 | | | | 1,002,471 | |
| Total Services, Business | | | | | | | | | | | 4,954,277 | |
| | | | | | | | | | | | | |
| Technology (1.51%) | | | | | | | | | | | | |
| Redstone HoldCo 2 LP, Second Lien Initial Term Loan(b) | | 04/27/2029 | | 3M US L + 7.75% | | | 800,000 | | | | 736,500 | |
| RumbleOn, Inc., Delayed Draw Term Loan(b) | | 08/31/2026 | | 1M US L + 8.25% | | | 750,000 | | | | 713,285 | |
| RumbleON, Inc., First Lien Term Loan(b) | | 08/31/2026 | | 1M US L + 8.25% | | | 1,745,625 | | | | 1,660,170 | |
| Total Technology | | | | | | | | | | | 3,109,955 | |
| | | | | | | | | | | | | |
| TOTAL BANK LOANS (Cost $40,222,604) | | | | | | | | | | | 39,827,400 | |
| | | | | | | | | | | | | |
| Collateralized Loan Obligations - Debt (9.34%)(a) | | | | | | | | | | | | |
| Allegro CLO XII, Ltd., Class E(c) | | 01/21/2032 | | 3M US L + 7.10% | | | 1,000,000 | | | | 972,193 | |
| Barings Middle Market CLO, Ltd. 2021-I, Class D(c) | | 07/20/2033 | | 3M US L + 8.65% | | | 1,000,000 | | | | 1,007,877 | |
| Flatiron CLO 20, Ltd., Class E(c) | | 11/20/2033 | | 3M US L + 7.85% | | | 500,000 | | | | 497,890 | |
| Ivy Hill Middle Market Credit Fund XVIII, Ltd., Class E(c) | | 04/22/2033 | | 3M US L + 7.75% | | | 2,000,000 | | | | 1,932,238 | |
| LCM 31, Ltd., Class E(c) | | 01/20/2032 | | 3M US L + 7.08% | | | 1,250,000 | | | | 1,228,414 | |
| Madison Park Funding XLVII, Ltd., Class E(c) | | 01/19/2034 | | 3M US L + 7.46% | | | 600,000 | | | | 601,882 | |
| MCF CLO VII LLC, Class ER(c) | | 07/20/2033 | | 3M US L + 9.15% | | | 2,500,000 | | | | 2,519,895 | |
| Monroe Capital Mml CLO X, Ltd., Class E(c) | | 08/20/2031 | | 3M US L + 8.85% | | | 2,050,000 | | | | 2,049,763 | |
| Northwoods Capital 25, Ltd., Class E(c) | | 07/20/2034 | | 3M US L + 7.14% | | | 2,250,000 | | | | 2,137,958 | |
| OCP CLO 2020-20, Ltd., Class E(c) | | 10/09/2033 | | 3M US L + 7.66% | | | 500,000 | | | | 499,989 | |
| PennantPark CLO III, Ltd., Class E(c) | | 10/22/2032 | | 3M US L + 8.14% | | | 3,000,000 | | | | 3,015,741 | |
| Regatta Funding LP 2013-2A, Class DR2(c) | | 01/15/2029 | | 3M US L + 6.95% | | | 400,000 | | | | 384,542 | |
| Saratoga Investment Corp., CLO 2013-1, Ltd., Class F1R3(c) | | 04/20/2033 | | 3M US L + 10.00% | | | 2,000,000 | | | | 1,920,255 | |
| VCP CLO II, Ltd., Class E(c) | | 04/15/2031 | | 3M US L + 8.40% | | | 500,000 | | | | 498,388 | |
| | | | | | | | | | | | | |
| TOTAL COLLATERALIZED LOAN OBLIGATIONS - DEBT (Cost $19,060,269) | | | | | | | 19,267,025 | |
See Notes to Consolidated Financial Statements.
| 6 | https://www.cimgroup.com/public-investment-programs/current-public-programs/racr |
| CIM Real Assets & Credit Fund | Consolidated Schedule of Investments |
March 31, 2022 (Unaudited)
| | | Maturity Date | Rate | | Principal | | | Value | |
| Collateralized Loan Obligations - Equity (9.73%)(a)(d) | | | | | | | | | | | | |
| | | | | Estimated yield of | | | | | | | | |
| Apex Credit CLO 2021, Ltd., Class SUB(b)(c) | | 07/18/2034 | | 13.28% | | $ | 2,980,000 | | | $ | 2,273,442 | |
| ArrowMark Colorado Holdings, Class SUB(b)(c) | | 01/05/2035 | | 16.90% | | | 3,750,000 | | | | 2,875,125 | |
| Atlas Senior Loan Fund XVII, Ltd., Class SUB(b)(c) | | 10/20/2034 | | 15.67% | | | 3,000,000 | | | | 2,591,850 | |
| Dryden 98 CLO, Ltd., Class SUB(b)(c) | | 04/20/2035 | | 13.61% | | | 5,500,000 | | | | 4,976,318 | |
| LCM 31, Ltd., Class INC(b)(c) | | 01/20/2032 | | 21.01% | | | 250,000 | | | | 203,150 | |
| Marble Point CLO XXI, Ltd., Class INC(b)(c) | | 10/17/2051 | | 14.47% | | | 2,750,000 | | | | 2,218,975 | |
| Steele Creek CLO 2022-1, Ltd., Class SUB(b)(c) | | 04/15/2035 | | 16.22% | | | 5,000,000 | | | | 3,635,000 | |
| Trinitas CLO VIII, Ltd., Class SUB(b)(c) | | 07/20/2117 | | 20.54% | | | 2,300,000 | | | | 1,300,880 | |
| | | | | | | | | |
| TOTAL COLLATERALIZED LOAN OBLIGATIONS - EQUITY (Cost $20,331,597) | | | | | | | 20,074,740 | |
| | | | | | | | | |
| Commercial Mortgage-Backed Securities (5.53%) | | | | | | | | | | | | |
| Campus Drive Secured Lease-Backed Pass-Through | | | | | | | | | | | | |
| Trust, Series C(b)(c) | | 06/15/2058 | | 6.91% | | | 3,745,537 | | | | 3,106,756 | |
| Capital Funding Mortgage Trust 2021-21, Class B(a)(b)(c) | | 11/15/2023 | | 1M US L + 12.25% | | | 500,000 | | | | 500,000 | |
| CSMC 2020-TMIC, Class C(a)(c) | | 11/15/2033 | | 1M US L + 6.75% | | | 400,000 | | | | 409,328 | |
| LAQ 2022-LAQ Mortgage Trust, Class E(a)(c) | | 03/15/2039 | | 1M US SOFR + 4.87% | | | 450,000 | | | | 454,260 | |
| LAQ 2022-LAQ Mortgage Trust, Class F(a)(c) | | 03/15/2039 | | 1M US SOFR + 5.97% | | | 5,000,000 | | | | 5,047,294 | |
| TWO VA Repack Trust Class B-2, Series B2(b)(c)(e) | | 11/15/2033 | | 0.00% | | | 1,811,000 | | | | 658,426 | |
| VA Gilbert AZ Subordinated Note Lease-Backed Pass-Through Trust(b)(c) | | 03/15/2034 | | 13.00% | | | 187,901 | | | | 241,467 | |
| Wells Fargo Commercial Mortgage Trust 2021-FCMT, Class F(a)(c) | | 05/15/2031 | | 1M US L + 5.90% | | | 1,000,000 | | | | 987,558 | |
| | | | | | | | | |
| TOTAL COMMERCIAL MORTGAGE-BACKED SECURITIES (Cost $11,333,686) | | | | | | | 11,405,089 | |
| | | | | | | | | |
| Direct Real Estate (25.71%) | | | | | | | | | | | | |
| Del Mar Terrace - Phoenix, AZ(b)(f)(g) | | | | N/A | | | 15,000,000 | | | | 15,330,492 | |
| EPIC Dallas(b)(f)(g) | | | | N/A | | | 13,630,333 | | | | 18,165,645 | |
| Sora Multifamily Residential Property(b)(g) | | | | N/A | | | 13,421,688 | | | | 13,233,570 | |
| Vale at the Parks - DC(b)(f)(g) | | | | N/A | | | 5,008,001 | | | | 6,317,544 | |
| TOTAL DIRECT REAL ESTATE (Cost $47,060,022) | | | | | | | | | | | 53,047,251 | |
| | | | | | | | | |
| Real Estate-Related Securities (8.20%)(a) | | | | | | | | | | | | |
| Debt Securities (5.68%) | | | | | | | | | | | | |
| IENTC 2, LLC(b)(f) | | 03/31/2031 | | Term US SOFR + 9.75% | | | 1,645,000 | | | | 1,391,200 | |
| Society Las Olas - PMG-Greybook Riverfront I LLC(b)(f) | | 10/07/2023 | | 1.47% | | | 10,376,845 | | | | 10,337,836 | |
| Total Debt Securities | | | | | | | | | | | 11,729,036 | |
See Notes to Consolidated Financial Statements.
| Semi-Annual Report | March 31, 2022 | 7 |
| CIM Real Assets & Credit Fund | Consolidated Schedule of Investments |
March 31, 2022 (Unaudited)
| | | Maturity Date | | Rate | | | Principal | | | Value | |
| Preferred Units (2.52%) | | | | | | | | | | | | | | |
| Society Las Olas - 301 SW 1st Avenue Holdings LLC(b)(f) | | 09/23/2023 | | | 8.80% | | | $ | 5,231,984 | | | $ | 5,208,993 | |
| Total Preferred Units | | | | | | | | | | | | | 5,208,993 | |
| | | | | | | | | | | | | | | |
| TOTAL REAL ESTATE-RELATED SECURITIES (Cost $16,874,039) | | | | | | | | | 16,938,029 | |
| | | | | | | | | | | | | | | |
| Loan Accumulation Facility (1.94%)(a)(d) | | | | | | | | | | | | | | |
| Brightwood Capital MM CLO 2022-11, LTD Class B LND(b)(c) | | 12/31/2032 | | | 13.50% | | | | 4,000,000 | | | | 4,000,000 | |
| | | | | | | | | | | | | | | |
| TOTAL LOAN ACCUMULATION FACILITY (Cost $4,000,000) | | | | | | | | | | | 4,000,000 | |
| | | | | | | | | | | | | | | |
| Common Stocks (3.56%) | | | | | | | | | | | | | | |
| Boca Homecare Holdings, Inc. (Equity)(b)(g) | | | | | | | | | 580,645 | | | | 580,802 | |
| IENTC 1, LLC(b)(f) | | | | | | | | | 3,760,000 | | | | 3,760,000 | |
| Creative Media & Community Trust Corp.(f) | | | | | | | | | 3,106,362 | | | | 3,005,782 | |
| | | | | | | | | | | | | | | |
| TOTAL COMMON STOCKS (Cost $7,447,007) | | | | | | | | | | | | | 7,346,584 | |
| | | | | | | | | | | | | | | |
| Warrants (0.03%) | | | | | | | | | | | | | | |
| RumbleON, Inc., Expires 02/28/2023, Strike Price $33.00(b) | | | | | | | | | 7,576 | | | | 72,118 | |
| | | | | | | | | | | | | | | |
| TOTAL WARRANTS (Cost $83,469) | | | | | | | | | | | | | 72,118 | |
| | | | | | | | | | | | | | | |
| Short Term Investments (15.73%) | | | | | | | | | | | | | | |
| First American Treasury Obligations Fund, 0.180%(h) (Cost $32,457,410) | | | | | | | | | 32,457,410 | | | | 32,457,410 | |
| | | | | | | | | | | | | | | |
| TOTAL SHORT TERM INVESTMENTS (Cost $32,457,410) | | | | | | | | | | | | | 32,457,410 | |
| | | | | | | | | | | | | | | |
| TOTAL INVESTMENTS 99.07% (Cost $198,870,103) | | | | | | | | | | | | $ | 204,435,646 | |
| | | | | | | | | | | | | | | |
| Other Assets In Excess Of Liabilities 0.93% | | | | | | | | | | | | | 1,922,858 | |
| | | | | | | | | | | | | | | |
| NET ASSETS (100.00%) | | | | | | | | | | | | $ | 206,358,504 | |
| (a) | Floating or variable rate security. The reference rate is described above. The rate in effect as of March 31, 2022 is based on the reference rate plus the displayed spread as of the security's last reset date. |
| (b) | Fair value of this security was determined using significant, unobservable inputs and was determined in good faith under the procedures approved by the Fund's Board of Trustees. |
| (c) | Security exempt from registration under Rule 144A of the Securities Act of 1933. Total market value of Rule 144A securities amounts to $54,746,854, which represented approximately 26.53% of net assets as of March 31, 2022. Such securities may normally be sold to qualified institutional buyers in transactions exempt from registration. |
See Notes to Consolidated Financial Statements.
| 8 | https://www.cimgroup.com/public-investment-programs/current-public-programs/racr |
| CIM Real Assets & Credit Fund | Consolidated Schedule of Investments |
March 31, 2022 (Unaudited)
| (d) | CLO subordinated notes are residual positions in the CLO vehicle. CLO subordinated notes are entitled to distributions that are generally equal to the residual cash flows of the underlying securities less contractual payments to debt holders and fund expenses. The effective yield is estimated based upon the amount and timing of these distributions in addition to the estimated amount of terminal distribution. Effective yields for the CLO equity positions are updated generally once a quarter in connection with a transaction, such as an add-on purchase, refinancing or reset. The estimated yield and investment cost may ultimately not be realized. Estimated yields are periodically adjusted based on information reported by the CLO as of the date of determination. |
| (f) | Affiliated investments pursuant to the 1940 Act. See Note 5 for more information. |
| (g) | Non-income producing investment. |
| (h) | Money market fund; interest rate reflects seven-day yield as of March 31, 2022. |
Other than as described above, we do not "control" and are not an "affiliate" of any of our portfolio investments, each as defined in the Investment Company Act of 1940, as amended (the "1940 Act"). In general, under the 1940 Act, we would be presumed to "control" a portfolio investment if we owned 25% or more of its voting securities and would be an "affiliate" of a portfolio investment if we owned 5% or more of its voting securities.
Investment Abbreviations:
LIBOR - London Interbank Offered Rate
SOFR - Secured Overnight Financing Rate
Reference Rates:
1M US L - 1 Month LIBOR as of March 31, 2022 was 0.46%
2M US L - 2 Month LIBOR as of March 31, 2022 was 0.11%
3M US L - 3 Month LIBOR as of March 31, 2022 was 0.97%
6M US L - 6 Month LIBOR as of March 31, 2022 was 1.47%
1M SOFR - 1 month SOFR as of March 31, 2022 was 0.30%
3M SOFR - 3 month SOFR as of March 31, 2022 was 0.68%
6M SOFR - 6 month SOFR as of March 31, 2022 was 1.08%
TOTAL RETURN SWAP CONTRACTS(a)
| Counterparty | | Reference Entity/Obligation | | | Notional
Amount | | | Fund Pays | | | Termination
Date | | | | Value | | | | Net Unrealized
Appreciation | |
| Citibank, N.A. | | Acrisure LLC, 1M US L + 3.75(b) | | $ | 551,177 | | | 3M US L + 1.35% | | | 02/15/2027 | | | $ | 553,615 | | | $ | 2,438 | |
| Citibank, N.A. | | Acrisure LLC, 1M US L + 4.25(b) | | | 148,875 | | | 3M US L + 1.35% | | | 02/15/2027 | | | | 149,626 | | | | 751 | |
| Citibank, N.A. | | Advantage Sales & Marketing, Inc., 3M US L + 4.50 | | | 758,077 | | | 3M US L + 1.35% | | | 10/28/2027 | | | | 759,933 | | | | 1,856 | |
| Citibank, N.A. | | Allen Media LLC, 3M US L + 5.50 | | | 1,520,871 | | | 3M US L + 1.35% | | | 02/10/2027 | | | | 1,526,248 | | | | 5,377 | |
| Citibank, N.A. | | AP Core Holdings II LLC, 1M US L + 5.50, 3M US L + 5.50 | | | 1,184,042 | | | 3M US L + 1.35% | | | 09/01/2027 | | | | 1,194,135 | | | | 10,093 | |
| Citibank, N.A. | | Athletico Physical Therapy TLB, 6M SOFR + 4.25(b) | | | 904,545 | | | 3M US L + 1.35% | | | 02/15/2029 | | | | 905,118 | | | | 573 | |
| Citibank, N.A. | | Bausch Health Companies Inc. 1L TLB, 1M US L + 5.25 | | | 950,400 | | | 3M US L + 1.35% | | | 01/27/2027 | | | | 952,277 | | | | 1,877 | |
| Citibank, N.A. | | Caesars Resort Collection LLC, 1M US L + 2.75 | | | 592,372 | | | 3M US L + 1.35% | | | 12/23/2024 | | | | 593,033 | | | | 661 | |
| Citibank, N.A. | | Clydesdale Acquisition Holdings, Inc.TL 1L, 1M SOFR + 4.25 | | | 557,143 | | | 3M US L + 1.35% | | | 04/13/2029 | | | | 562,857 | | | | 5,714 | |
| Citibank, N.A. | | Corel Corp., 3M US L + 5.00 | | | 528,116 | | | 3M US L + 1.35% | | | 07/02/2026 | | | | 528,283 | | | | 167 | |
| Citibank, N.A. | | Dermatology Intermediate Holdings III, Inc. 1L, 1M SOFR + 4.25(b) | | | 54,470 | | | 3M US L + 1.35% | | | 03/26/2029 | | | | 55,025 | | | | 555 | |
| Citibank, N.A. | | Dermatology Intermediate Holdings III, Inc. TLB 1L, 1M SOFR + 4.25(b) | | | 291,413 | | | 3M US L + 1.35% | | | 03/26/2029 | | | | 294,386 | | | | 2,973 | |
| Citibank, N.A. | | DIRECTV Financing LLC, 1M US L + 5.00 | | | 1,080,872 | | | 3M US L + 1.35% | | | 08/02/2027 | | | | 1,083,487 | | | | 2,615 | |
| Citibank, N.A. | | East West Manufacturing, LLC TLB 1L, 3M SOFR + 5.75(b) | | | 648,214 | | | 3M US L + 1.35% | | | 12/22/2028 | | | | 649,851 | | | | 1,637 | |
| Citibank, N.A. | | Garda World Security Corporation TLB 1L, 1M SOFR + 4.25(b) | | | 495,000 | | | 3M US L + 1.35% | | | 02/01/2029 | | | | 496,250 | | | | 1,250 | |
| Citibank, N.A. | | Great Outdoors Group, LLC TLB 1L, 1M L + 3.75% | | | 1,490,000 | | | 3M US L + 1.35% | | | 03/06/2028 | | | | 1,496,483 | | | | 6,483 | |
| Citibank, N.A. | | HUB International, Ltd., L + 3.25 | | | 198,750 | | | 3M US L + 1.35% | | | 04/25/2025 | | | | 199,000 | | | | 250 | |
See Notes to Consolidated Financial Statements.
| Semi-Annual Report | March 31, 2022 | 9 |
| CIM Real Assets & Credit Fund | Consolidated Schedule of Investments |
March 31, 2022 (Unaudited)
TOTAL RETURN SWAP CONTRACTS(a) (continued)
| Counterparty | | Reference Entity/Obligation | | Notional
Amount | | | Fund Pays | | Termination
Date | | | Value | | | Net Unrealized
Appreciation | |
| Citibank, N.A. | | LSF9 ATLANTIS HOLDINGS, LLC, L + 7.25(b) | | $ | 1,216,184 | | | 3M US L + 1.35% | | | 03/29/2029 | | | $ | 1,245,000 | | | $ | 28,816 | |
| Citibank, N.A. | | McGraw-Hill Education, Inc., 6M US L + 4.75 | | | 1,143,450 | | | 3M US L + 1.35% | | | 07/28/2028 | | | | 1,144,715 | | | | 1,265 | |
| Citibank, N.A. | | Olaplex, Inc TL 1L, 1M SOFR + 3.75(b) | | | 230,192 | | | 3M US L + 1.35% | | | 02/17/2029 | | | | 230,481 | | | | 289 | |
| Citibank, N.A. | | Owens & Minor, Inc. TLB 1L, 1M SOFR + 3.75(b) | | | 246,250 | | | 3M US L + 1.35% | | | 03/29/2029 | | | | 249,688 | | | | 3,438 | |
| Citibank, N.A. | | PetSmart LLC, 6M US L + 3.75 | | | 1,291,993 | | | 3M US L + 1.35% | | | 02/11/2028 | | | | 1,294,068 | | | | 2,075 | |
| Citibank, N.A. | | Prestige Brands, Inc., 1M US L + 2.00 | | | 253,725 | | | 3M US L + 1.35% | | | 07/03/2028 | | | | 254,586 | | | | 861 | |
| Citibank, N.A. | | Primary Products Finance LLC, 3M US L + 4.00 | | | 577,500 | | | 3M US L + 1.35% | | | 10/25/2028 | | | | 579,906 | | | | 2,406 | |
| Citibank, N.A. | | Seattle SpinCo, Inc., 1M SOFR + 4.00(b) | | | 247,500 | | | 3M US L + 1.35% | | | 02/28/2027 | | | | 247,500 | | | | – | |
| Citibank, N.A. | | Virtusa Corporation TL 1L, 1M SOFR + 3.75(b) | | | 297,000 | | | 3M US L + 1.35% | | | 02/15/2029 | | | | 297,938 | | | | 938 | |
| | | | | $ | 17,458,131 | | | | | | | | | $ | 17,543,489 | | | $ | 85,358 | |
| Counterparty | | Reference Entity/Obligation | | Notional
Amount | | | Fund Pays | | Termination
Date | | | Value | | | Net Unrealized
Depreciation | |
| Citibank, N.A. | | 1011778 B.C. Unlimited Liability Company, 1M US L + 1.75 | | $ | 156,236 | | | 3M US L + 1.35% | | | 11/19/2026 | | | $ | 149,553 | | | $ | (6,683 | ) |
| Citibank, N.A. | | Academy, Ltd., 1M US L + 3.75 | | | 872,858 | | | 3M US L + 1.35% | | | 11/05/2027 | | | | 864,100 | | | | (8,758 | ) |
| Citibank, N.A. | | Acrisure LLC, 1M US L + 3.50 | | | 593,222 | | | 3M US L + 1.35% | | | 02/15/2027 | | | | 588,261 | | | | (4,961 | ) |
| Citibank, N.A. | | ADMI Corp. TLB3 1L, 1M US L + 3.50 | | | 800,413 | | | 3M US L + 1.35% | | | 12/23/2027 | | | | 796,813 | | | | (3,600 | ) |
| Citibank, N.A. | | Aegion Corp., 3M US L + 4.75(b) | | | 436,400 | | | 3M US L + 1.35% | | | 05/17/2028 | | | | 436,296 | | | | (104 | ) |
| Citibank, N.A. | | AHP Health Partners, Inc., 1M US L + 3.50 | | | 288,546 | | | 3M US L + 1.35% | | | 08/24/2028 | | | | 287,432 | | | | (1,114 | ) |
| Citibank, N.A. | | Allied Universal Holdco LLC, 1M US L + 3.75 | | | 496,256 | | | 3M US L + 1.35% | | | 05/14/2028 | | | | 491,758 | | | | (4,498 | ) |
| Citibank, N.A. | | Amentum Government Services Holdings LLC TLB 1L, 6M SOFR + 4.00(b) | | | 351,176 | | | 3M US L + 1.35% | | | 02/15/2029 | | | | 350,735 | | | | (441 | ) |
| Citibank, N.A. | | Anesthesia Partners, Inc., 3M US L + 4.25 | | | 943,378 | | | 3M US L + 1.35% | | | 10/02/2028 | | | | 943,203 | | | | (175 | ) |
| Citibank, N.A. | | Applovin Corp., 1M US L + 3.25 | | | 196,563 | | | 3M US L + 1.35% | | | 08/15/2025 | | | | 195,735 | | | | (828 | ) |
| Citibank, N.A. | | Aramark Intermediate HoldCo Corp., 1M US L + 1.75 | | | 197,839 | | | 3M US L + 1.35% | | | 03/11/2025 | | | | 196,700 | | | | (1,139 | ) |
| Citibank, N.A. | | Arches Buyer, Inc., 1M US L + 3.25 | | | 601,022 | | | 3M US L + 1.35% | | | 12/06/2027 | | | | 594,928 | | | | (6,094 | ) |
| Citibank, N.A. | | Asurion LLC, 1M US L + 3.00 | | | 195,425 | | | 3M US L + 1.35% | | | 11/03/2024 | | | | 194,192 | | | | (1,233 | ) |
| Citibank, N.A. | | Athenahealth Group Inc. 1L, 1M SOFR + 3.50 | | | 101,087 | | | 3M US L + 1.35% | | | 2/15/2029 | | | | 100,562 | | | | (525 | ) |
| Citibank, N.A. | | Athenahealth Group Inc. TLB 1L, 1M SOFR + 3.50 | | | 595,558 | | | 3M US L + 1.35% | | | 2/15/2029 | | | | 593,313 | | | | (2,245 | ) |
| Citibank, N.A. | | Atlantic Aviation Corp., 1M US L + 3.00 | | | 959,551 | | | 3M US L + 1.35% | | | 09/22/2028 | | | | 951,846 | | | | (7,705 | ) |
| Citibank, N.A. | | Autokiniton US Holdings, Inc., 12M US L + 4.50 | | | 1,095,108 | | | 3M US L + 1.35% | | | 04/06/2028 | | | | 1,078,855 | | | | (16,253 | ) |
| Citibank, N.A. | | Bakemark Holdings, Inc., 1M US L + 4.00(b) | | | 497,500 | | | 3M US L + 1.35% | | | 09/05/2028 | | | | 492,503 | | | | (4,997 | ) |
| Citibank, N.A. | | Bausch Health Americas, Inc., 1M US L + 3.00 | | | 1,003,222 | | | 3M US L + 1.35% | | | 06/01/2025 | | | | 999,191 | | | | (4,031 | ) |
| Citibank, N.A. | | BCPE North Star US Holdco 2, Inc. TL 1L, 3M US L + 4.00(b) | | | 960,608 | | | 3M US L + 1.35% | | | 06/09/2028 | | | | 948,844 | | | | (11,764 | ) |
| Citibank, N.A. | | Burlington Coat Factory Warehouse Corp., 1M US L + 2.00 | | | 544,514 | | | 3M US L + 1.35% | | | 06/26/2028 | | | | 541,321 | | | | (3,193 | ) |
| Citibank, N.A. | | Caesars Resort Collection LLC, 1M US L + 3.50 | | | 497,481 | | | 3M US L + 1.35% | | | 07/20/2025 | | | | 496,486 | | | | (995 | ) |
| Citibank, N.A. | | CCRR Parent, 3M US L + 3.75(b) | | | 895,574 | | | 3M US L + 1.35% | | | 03/06/2028 | | | | 890,849 | | | | (4,725 | ) |
| Citibank, N.A. | | Charter Next Generation, Inc., 1ML + 3.75% | | | 496,958 | | | 3M US L + 1.35% | | | 12/01/2027 | | | | 492,911 | | | | (4,047 | ) |
| Citibank, N.A. | | CHG Healthcare Services, Inc., 6M US L + 3.50 | | | 350,299 | | | 3M US L + 1.35% | | | 09/29/2028 | | | | 349,418 | | | | (881 | ) |
| Citibank, N.A. | | City Brewing Co. LLC, 3M US L + 3.50(b) | | | 222,775 | | | 3M US L + 1.35% | | | 04/05/2028 | | | | 203,933 | | | | (18,842 | ) |
| Citibank, N.A. | | Conduent Business Services LLC, L + 4.25% | | | 495,000 | | | 3M US L + 1.35% | | | 09/28/2028 | | | | 494,480 | | | | (520 | ) |
| Citibank, N.A. | | Connect Finco Sarl, 1M US L + 3.50 | | | 744,295 | | | 3M US L + 1.35% | | | 12/12/2026 | | | | 737,451 | | | | (6,844 | ) |
| Citibank, N.A. | | Core & Main LP, 1M US L + 2.50 | | | 413,547 | | | 3M US L + 1.35% | | | 07/27/2028 | | | | 411,992 | | | | (1,555 | ) |
| Citibank, N.A. | | CoreLogic, Inc., 1M US L + 3.50 | | | 497,503 | | | 3M US L + 1.35% | | | 06/02/2028 | | | | 494,077 | | | | (3,426 | ) |
| Citibank, N.A. | | Cornerstone OnDemand, Inc, 1M US L + 3.75 | | | 692,876 | | | 3M US L + 1.35% | | | 10/16/2028 | | | | 689,739 | | | | (3,137 | ) |
| Citibank, N.A. | | CP Atlas Buyer, Inc., 1M US L + 3.75 | | | 398,538 | | | 3M US L + 1.35% | | | 11/23/2027 | | | | 388,076 | | | | (10,462 | ) |
| Citibank, N.A. | | DexKo Global Inc., Delayed TL, 3M US L + 3.75 | | | 131,185 | | | 3M US L + 1.35% | | | 10/04/2028 | | | | 128,930 | | | | (2,255 | ) |
| Citibank, N.A. | | DexKo Global Inc., TLB, 3M US L + 3.75 | | | 687,508 | | | 3M US L + 1.35% | | | 10/04/2028 | | | | 676,883 | | | | (10,625 | ) |
| Citibank, N.A. | | DG Investment Intermediate Holdings 2, Inc., 1M US L + 3.75 3.5% | | | 1,208,655 | | | 3M US L + 1.35% | | | 03/31/2028 | | | | 1,199,478 | | | | (9,177 | ) |
| Citibank, N.A. | | Diversitech Holdings, Inc., 3M US L + 3.75 | | | 51,171 | | | 3M US L + 1.35% | | | 12/22/2028 | | | | 50,826 | | | | (345 | ) |
See Notes to Consolidated Financial Statements.
| 10 | https://www.cimgroup.com/public-investment-programs/current-public-programs/racr |
| CIM Real Assets & Credit Fund | Consolidated Schedule of Investments |
March 31, 2022 (Unaudited)
TOTAL RETURN SWAP CONTRACTS(a) (continued)
| Counterparty | | Reference Entity/Obligation | | Notional
Amount | | | Fund Pays | | Termination
Date | | | Value | | | Net Unrealized
Appreciation | |
| Citibank, N.A. | | Diversitech Holdings, Inc., 3M US L + 3.75 | | $ | 247,329 | | | 3M US L + 1.35% | | | 12/22/2028 | | | $ | 245,658 | | | $ | (1,671 | ) |
| Citibank, N.A. | | East West Manufacturing, LLC Delayed TL 1L, 3M SOFR + 5.75(b) | | | 95,238 | | | 3M US L + 1.35% | | | 12/22/2026 | | | | 94,524 | | | | (714 | ) |
| Citibank, N.A. | | Fertitta Entertainment, LLC TLB 1L, 1M SOFR + 4.00 | | | 346,957 | | | 3M US L + 1.35% | | | 01/29/2029 | | | | 346,544 | | | | (413 | ) |
| Citibank, N.A. | | Gainwell Acquisition Corp., 3M US L + 4.00 | | | 297,668 | | | 3M US L + 1.35% | | | 10/01/2027 | | | | 297,000 | | | | (668 | ) |
| Citibank, N.A. | | Garda World Security Corp., 1M US L + 4.25 | | | 593,428 | | | 3M US L + 1.35% | | | 10/30/2026 | | | | 586,886 | | | | (6,542 | ) |
| Citibank, N.A. | | Help/Systems Holdings, Inc., 1M US L + 4.00 | | | 496,212 | | | 3M US L + 1.35% | | | 11/19/2026 | | | | 491,250 | | | | (4,962 | ) |
| Citibank, N.A. | | Hunter Douglas Inc.TLB 1L, 3M SOFR +3.50(b) | | | 497,500 | | | 3M US L + 1.35% | | | 02/25/2029 | | | | 490,783 | | | | (6,717 | ) |
| Citibank, N.A. | | Ivanti Software, Inc., 3M US L + 4.25 | | | 665,000 | | | 3M US L + 1.35% | | | 12/01/2027 | | | | 658,750 | | | | (6,250 | ) |
| Citibank, N.A. | | Jadex, Inc., 1M US L + 4.75(b) | | | 364,089 | | | 3M US L + 1.35% | | | 02/11/2028 | | | | 354,026 | | | | (10,063 | ) |
| Citibank, N.A. | | KNS Midco Corp., 3M US L + 6.25 | | | 596,250 | | | 3M US L + 1.35% | | | 04/16/2027 | | | | 584,176 | | | | (12,074 | ) |
| Citibank, N.A. | | LBM Acquisition LLC, 1M US L + 3.75 | | | 644,122 | | | 3M US L + 1.35% | | | 12/18/2027 | | | | 630,464 | | | | (13,658 | ) |
| Citibank, N.A. | | Liftoff Mobile, Inc., 3M US L + 3.75 | | | 496,958 | | | 3M US L + 1.35% | | | 10/02/2028 | | | | 493,244 | | | | (3,714 | ) |
| Citibank, N.A. | | LogMeIn, Inc., 1M US L + 4.75 | | | 694,969 | | | 3M US L + 1.35% | | | 08/31/2027 | | | | 683,285 | | | | (11,684 | ) |
| Citibank, N.A. | | LSCS Holdings, Inc., 1M US L + 4.50(b) | | | 348,250 | | | 3M US L + 1.35% | | | 12/16/2028 | | | | 346,939 | | | | (1,311 | ) |
| Citibank, N.A. | | MA FinanceCo LLC, 3M US L + 4.25(b) | | | 224,856 | | | 3M US L + 1.35% | | | 06/05/2025 | | | | 221,420 | | | | (3,436 | ) |
| Citibank, N.A. | | Madison IAQ LLC, 6M US L + 3.25 | | | 648,287 | | | 3M US L + 1.35% | | | 06/21/2028 | | | | 644,975 | | | | (3,312 | ) |
| Citibank, N.A. | | Magenta Buyer LLC, 3M US L + 5.00 | | | 806,661 | | | 3M US L + 1.35% | | | 07/27/2028 | | | | 804,933 | | | | (1,728 | ) |
| Citibank, N.A. | | McAfee Corp. TLB 1L, 1M SOFR + 4.00 | | | 918,462 | | | 3M US L + 1.35% | | | 03/01/2029 | | | | 917,885 | | | | (577 | ) |
| Citibank, N.A. | | Medline Industries, LP, Term Loan, 1M US L + 3.25 | | | 872,266 | | | 3M US L + 1.35% | | | 10/21/2028 | | | | 867,287 | | | | (4,979 | ) |
| Citibank, N.A. | | MH Sub I LLC, 1M US L + 3.75 | | | 247,382 | | | 3M US L + 1.35% | | | 09/15/2024 | | | | 244,575 | | | | (2,807 | ) |
| Citibank, N.A. | | Midwest Physician Administrative Services LLC, 3M US L + 3.25 | | | 731,911 | | | 3M US L + 1.35% | | | 03/13/2028 | | | | 723,678 | | | | (8,233 | ) |
| Citibank, N.A. | | Mitchell International, Inc., 3M US L + 3.75 | | | 661,667 | | | 3M US L + 1.35% | | | 10/15/2028 | | | | 656,933 | | | | (4,734 | ) |
| Citibank, N.A. | | MJH Healthcare Holdings, LLC, TLB, 1M SOFR + 3.50(b) | | | 165,833 | | | 3M US L + 1.35% | | | 01/28/2029 | | | | 165,417 | | | | (416 | ) |
| Citibank, N.A. | | Naked Juice LLC, 1M SOFR + 3.25% | | | 943,091 | | | 3M US L + 1.35% | | | 01/24/2029 | | | | 931,949 | | | | (11,142 | ) |
| Citibank, N.A. | | Naked Juice LLC, 1M SOFR + 3.25% | | | 54,409 | | | 3M US L + 1.35% | | | 01/24/2029 | | | | 53,766 | | | | (643 | ) |
| Citibank, N.A. | | Osmosis Buyer Limited Del T1 1L, L + 4%(b) | | | 137,847 | | | 3M US L + 1.35% | | | 07/31/2028 | | | | 137,631 | | | | (216 | ) |
| Citibank, N.A. | | Osmosis Buyer Limited TLB 1L, L + 3%(b) | | | 606,528 | | | 3M US L + 1.35% | | | 07/31/2028 | | | | 605,574 | | | | (954 | ) |
| Citibank, N.A. | | Pitney Bowes INC.TL, 1M US L + 4.00(b) | | | 694,989 | | | 3M US L + 1.35% | | | 03/17/2028 | | | | 684,889 | | | | (10,100 | ) |
| Citibank, N.A. | | Plaze, Inc., 1M US L + 3.75(b) | | | 792,498 | | | 3M US L + 1.35% | | | 08/03/2026 | | | | 766,742 | | | | (25,756 | ) |
| Citibank, N.A. | | Pretium PKG Holdings, Inc., 6M US L + 4.00 | | | 279,298 | | | 3M US L + 1.35% | | | 10/02/2028 | | | | 273,283 | | | | (6,015 | ) |
| Citibank, N.A. | | Proofpoint, Inc., 3M US L + 3.25 | | | 711,071 | | | 3M US L + 1.35% | | | 08/31/2028 | | | | 707,489 | | | | (3,582 | ) |
| Citibank, N.A. | | Quest Borrower Limited TL 1L, 3M SOFR + 4.25 | | | 990,000 | | | 3M US L + 1.35% | | | 02/01/2029 | | | | 986,485 | | | | (3,515 | ) |
| Citibank, N.A. | | Redstone Holdco 2 LP, 3M US L + 4.75 | | | 713,565 | | | 3M US L + 1.35% | | | 04/27/2028 | | | | 701,286 | | | | (12,279 | ) |
| Citibank, N.A. | | Ring Container Technologies Group LLC, 6M US L + 3.75 | | | 392,467 | | | 3M US L + 1.35% | | | 08/12/2028 | | | | 390,115 | | | | (2,352 | ) |
| Citibank, N.A. | | Rough Country, LLC 1L, 1M US L + 3.50(b) | | | 1,265,441 | | | 3M US L + 1.35% | | | 07/26/2028 | | | | 1,254,373 | | | | (11,068 | ) |
| Citibank, N.A. | | Ryan Specialty Group LLC, 1M US L + 3.00 | | | 197,830 | | | 3M US L + 1.35% | | | 09/01/2027 | | | | 196,514 | | | | (1,316 | ) |
| Citibank, N.A. | | Scientific Games Holdings LP TLB 1L, 3M SOFR + 3.5% | | | 454,545 | | | 3M US L + 1.35% | | | 02/04/2029 | | | | 451,055 | | | | (3,490 | ) |
| Citibank, N.A. | | Sitel Worldwide Corp., 1M US L + 3.75 | | | 680,580 | | | 3M US L + 1.35% | | | 08/27/2028 | | | | 679,441 | | | | (1,139 | ) |
| Citibank, N.A. | | Sovos Brands Intermediate, Inc., 3M US L + 3.75 | | | 351,098 | | | 3M US L + 1.35% | | | 06/08/2028 | | | | 350,238 | | | | (860 | ) |
| Citibank, N.A. | | Specialty Building Products Holdings LLC, 1M US L + 3.75 | | | 498,500 | | | 3M US L + 1.35% | | | 10/05/2028 | | | | 489,220 | | | | (9,280 | ) |
| Citibank, N.A. | | SRS Distribution Inc., 6M US L + 3.75 | | | 361,295 | | | 3M US L + 1.35% | | | 06/02/2028 | | | | 360,082 | | | | (1,213 | ) |
| Citibank, N.A. | | Sunshine Luxembourg VII S.a r.l., 3M US L + 3.75 | | | 968,594 | | | 3M US L + 1.35% | | | 10/02/2026 | | | | 961,500 | | | | (7,094 | ) |
| Citibank, N.A. | | Teneo Holdings LLC, 1M SOFR + 5.25 | | | 793,046 | | | 3M US L + 1.35% | | | 07/12/2025 | | | | 792,272 | | | | (774 | ) |
| Citibank, N.A. | | TGP Holdings III LLC, 1M US L + 3.25 | | | 318,971 | | | 3M US L + 1.35% | | | 06/29/2028 | | | | 307,650 | | | | (11,321 | ) |
| Citibank, N.A. | | TGP Holdings III LLC, 1M US L + 3.25 | | | 42,058 | | | 3M US L + 1.35% | | | 06/29/2028 | | | | 40,566 | | | | (1,492 | ) |
| Citibank, N.A. | | TricorBraun Holdings, Inc., 1M L + 3.25% | | | 614,790 | | | 3M US L + 1.35% | | | 03/03/2028 | | | | 607,198 | | | | (7,592 | ) |
| Citibank, N.A. | | TruGreen LP, 1M US L + 4.00 | | | 248,390 | | | 3M US L + 1.35% | | | 11/02/2027 | | | | 246,366 | | | | (2,024 | ) |
| Citibank, N.A. | | Unified Women’s Healthcare LP, 1M US L + 4.25 | | | 1,240,641 | | | 3M US L + 1.35% | | | 12/20/2027 | | | | 1,237,368 | | | | (3,273 | ) |
| Citibank, N.A. | | Watlow Electric Manufacturing Co., 3M US L + 3.75 | | | 1,054,969 | | | 3M US L + 1.35% | | | 03/02/2028 | | | | 1,044,155 | | | | (10,814 | ) |
See Notes to Consolidated Financial Statements.
| Semi-Annual Report | March 31, 2022 | 11 |
| CIM Real Assets & Credit Fund | Consolidated Schedule of Investments |
March 31, 2022 (Unaudited)
TOTAL RETURN SWAP CONTRACTS(a) (continued)
| Counterparty | | Reference Entity/Obligation | | Notional
Amount | | | Fund Pays | | Termination
Date | | | Value | | | Net Unrealized
Appreciation | |
| Citibank, N.A. | | WW International, Inc., 1M US L + 3.50 | | $ | 1,171,997 | | | 3M US L + 1.35% | | | 04/13/2028 | | | $ | 1,073,368 | | | $ | (98,630 | ) |
| Citibank, N.A. | | Xperi Holding Corp., 1M US L + 3.50 | | | 970,125 | | | 3M US L + 1.35% | | | 06/08/2028 | | | | 965,372 | | | | (4,753 | ) |
| Citibank, N.A. | | Zelis Payments Buyer, Inc., 1M US L + 3.50 | | | 992,487 | | | 3M US L + 1.35% | | | 09/30/2026 | | | | 986,667 | | | | (5,820 | ) |
| | | | | $ | 49,872,262 | | | | | | | | | $ | 49,334,916 | | | $ | (537,346 | ) |
| TOTAL | | | | $ | 67,330,393 | | | | | | | | | $ | 66,878,405 | | | $ | (451,988 | ) |
| (a) | The Fund's interest in the total return swap transactions are held through a wholly-owned subsidiary of the Fund, RACR-FS, LLC, a Delaware Limited Liability Company. |
| (b) | Security is classified as Level 3 in the Fund's fair value hierarchy (see Note 2). |
See Notes to Consolidated Financial Statements.
| 12 | https://www.cimgroup.com/public-investment-programs/current-public-programs/racr |
| CIM Real Assets & Credit Fund | Consolidated Statement of Assets and Liabilities |
March 31, 2022 (Unaudited)
ASSETS
| Investments, at fair value (Cost $141,491,369) | | $ | 140,918,154 | |
| Affiliated investments, at fair value (Cost $57,378,734) | | | 63,517,492 | |
| Cash | | | 202,649 | |
| Receivable for shares sold | | | 8,174,917 | |
| Cash collateral for total return swaps | | | 17,500,930 | |
| Interest receivable | | | 992,199 | |
| Due from Advisor | | | 144,311 | |
| Prepaid expenses and other assets | | | 794,865 | |
| Unrealized appreciation on total return swap contracts | | | 85,358 | |
| Total Assets | | | 232,330,875 | |
| LIABILITIES | | | | |
| Payable for investments purchased | | | 24,232,998 | |
| Unrealized depreciation on total return swap contracts | | | 537,346 | |
| Professional fees payable | | | 463,358 | |
| Administration fees payable (Note 7) | | | 167,904 | |
| Trustees' fees payable (Note 7) | | | 178,380 | |
| Line of credit interest payable (Note 6) | | | 66,774 | |
| Custody fees payable | | | 36,127 | |
| Transfer agency fees payable (Note 7) | | | 16,502 | |
| Distribution fees payable (Note 7) | | | 5,428 | |
| Shareholder servicing fees payable (Note 7) | | | 2,390 | |
| Accrued expenses and other liabilities | | | 265,164 | |
| Total Liabilities | | | 25,972,371 | |
| NET ASSETS | | $ | 206,358,504 | |
| NET ASSETS CONSIST OF | | | | |
| Paid-in capital | | $ | 202,199,938 | |
| Total distributable earnings | | | 4,158,566 | |
| NET ASSETS | | $ | 206,358,504 | |
See Notes to Consolidated Financial Statements.
| Semi-Annual Report | March 31, 2022 | 13 |
| CIM Real Assets & Credit Fund | Consolidated Statement of Assets and Liabilities |
March 31, 2022 (Unaudited)
| PRICING OF SHARES | | | |
| Class A | | | | |
| Net assets | | $ | 2,769,686 | |
| Shares of beneficial interest outstanding (unlimited number of authorized shares, no par value common stock authorized) | | | 104,461 | |
| Net asset value | | $ | 26.51 | |
| Maximum offering price per share (Maximum sales load of 5.75%) | | $ | 28.13 | |
| Class C | | | | |
| Net assets | | $ | 8,952,865 | |
| Shares of beneficial interest outstanding (unlimited number of authorized shares, no par value common stock authorized) | | | 342,627 | |
| Net asset value(a) | | $ | 26.13 | |
| Maximum offering price per share | | $ | 26.13 | |
| Class I | | | | |
| Net assets | | $ | 194,143,224 | |
| Shares of beneficial interest outstanding (unlimited number of authorized shares, no par value common stock authorized) | | | 7,289,345 | |
| Net asset value | | $ | 26.63 | |
| Maximum offering price per share | | $ | 26.63 | |
| Class L | | | | |
| Net assets | | $ | 492,729 | |
| Shares of beneficial interest outstanding (unlimited number of authorized shares, no par value common stock authorized) | | | 18,682 | |
| Net asset value | | $ | 26.37 | |
| Maximum offering price per share (Maximum sales load of 4.25%) | | $ | 27.54 | |
| (a) | Subject to early-withdrawal charge. Redemption price varies based on length of time held (Note 2). |
See Notes to Consolidated Financial Statements.
| 14 | https://www.cimgroup.com/public-investment-programs/current-public-programs/racr |
| CIM Real Assets & Credit Fund | Consolidated Statement of Operations |
For the Six Months Ended March 31, 2022 (Unaudited)
| | | | |
| INVESTMENT INCOME | | | |
| Interest income | | $ | 3,962,245 | |
| Dividend income from affiliated investments | | | 62,034 | |
| Total Investment Income | | | 4,024,279 | |
| | | | | |
| EXPENSES | | | | |
| Management fees (Note 7) | | | 972,804 | |
| Shareholder servicing fees (Note 7) | | | | |
| Class A | | | 2,071 | |
| Class C | | | 8,771 | |
| Class L | | | 316 | |
| Distribution fees (Note 7): | | | | |
| Class C | | | 26,314 | |
| Class L | | | 316 | |
| Networking fees | | | | |
| Class I | | | 128 | |
| Administration fees (Note 7) | | | 412,232 | |
| Professional fees | | | 586,414 | |
| Trustees' fees (Note 7) | | | 93,750 | |
| Custody fees | | | 50,124 | |
| Interest expense (Note 6) | | | 49,590 | |
| State registration fees | | | 46,236 | |
| Printing fees | | | 21,104 | |
| Transfer agency fees (Note 7) | | | 8,044 | |
| Insurance fees | | | 5,313 | |
| Other expenses | | | 45,863 | |
| Total Expenses | | | 2,329,390 | |
| Expenses reimbursed by Adviser (Note 6) | | | (774,445 | ) |
| Net Expenses | | | 1,554,945 | |
| Net Investment Income | | | 2,469,334 | |
| Net realized gain on investments | | | 84,322 | |
| Net realized gain on total return swap contracts | | | 6,550 | |
| Net change in unrealized depreciation on investments | | | (1,570,785 | ) |
| Net change in unrealized appreciation on affiliated investments | | | 4,345,970 | |
| Net change in unrealized depreciation on total return swap contracts | | | (582,155 | ) |
| NET REALIZED AND UNREALIZED GAIN ON INVESTMENTS | | | 2,283,902 | |
| NET INCREASE IN NET ASSETS RESULTING FROM OPERATIONS | | $ | 4,753,236 | |
See Notes to Consolidated Financial Statements.
| Semi-Annual Report | March 31, 2022 | 15 |
| CIM Real Assets & Credit Fund | Consolidated Statements of Changes in Net Assets |
| | | For the Six Months Ended March 31, 2022 (Unaudited) | | | For the Year Ended September 30, 2021 | |
| OPERATIONS | | | | | | |
| Net investment income | | $ | 2,469,334 | | | $ | 1,383,257 | |
| Net realized gain on investments and total return swap contracts | | | 90,872 | | | | 591,951 | |
| Net change in unrealized appreciation on investments, affiliated investments and total return swap contracts | | | 2,193,030 | | | | 2,815,961 | |
| Net Increase in Net Assets Resulting from Operations | | | 4,753,236 | | | | 4,791,169 | |
| DISTRIBUTIONS TO SHAREHOLDERS | | | | | | | | |
| Class A | | | | | | | | |
| From distributable earnings | | | (46,552 | ) | | | (19,335 | ) |
| From return of capital | | | – | | | | (2,567 | ) |
| Class C | | | | | | | | |
| From distributable earnings | | | (202,123 | ) | | | (114,325 | ) |
| From return of capital | | | – | | | | (15,123 | ) |
| Class I | | | | | | | | |
| From distributable earnings | | | (3,479,852 | ) | | | (1,632,251 | ) |
| From return of capital | | | – | | | | (215,419 | ) |
| Class L | | | | | | | | |
| From distributable earnings | | | (6,915 | ) | | | (5,398 | ) |
| From return of capital | | | – | | | | (690 | ) |
| Net Decrease in Net Assets from Distributions to Shareholders | | | (3,735,442 | ) | | | (2,005,108 | ) |
| BENEFICIAL INTEREST TRANSACTIONS | | | | | | | | |
| Class A | | | | | | | | |
| Shares sold | | | 1,613,210 | | | | 983,730 | |
| Distributions reinvested | | | 21,944 | | | | 8,506 | |
| Class C | | | | | | | | |
| Shares sold | | | 2,872,750 | | | | 5,163,048 | |
| Distributions reinvested | | | 125,609 | | | | 62,377 | |
| Shares redeemed, net of redemption fees (Note 2) | | | (21,133 | ) | | | – | |
| Class I | | | | | | | | |
| Shares sold | | | 113,097,618 | | | | 72,175,473 | |
| Distributions reinvested | | | 1,154,098 | | | | 690,753 | |
| Shares redeemed | | | (2,331,999 | ) | | | (475,852 | ) |
| Class L | | | | | | | | |
| Shares sold | | | 383,000 | | | | – | |
| Net Increase in Net Assets Derived from Beneficial Interest Transactions | | | 116,915,097 | | | | 78,608,035 | |
| Net increase in net assets | | | 117,932,891 | | | | 81,394,096 | |
| NET ASSETS | | | | | | | | |
| Beginning of period | | | 88,425,613 | | | | 7,031,517 | |
| End of period | | $ | 206,358,504 | | | $ | 88,425,613 | |
See Notes to Consolidated Financial Statements.
| 16 | https://www.cimgroup.com/public-investment-programs/current-public-programs/racr |
| CIM Real Assets & Credit Fund | Consolidated Statements of Changes in Net Assets |
| | | For the Six Months Ended March 31, 2022 (Unaudited) | | | For the Year Ended September 30, 2021 | |
| Other Information | | | | | | | | |
| BENEFICIAL INTEREST TRANSACTIONS, IN SHARES | | | | | | | | |
| Class A | | | | | | | | |
| Beginning shares | | | 42,619 | | | | 4,000 | |
| Shares sold | | | 61,009 | | | | 38,289 | |
| Distributions reinvested | | | 833 | | | | 330 | |
| Net increase in shares outstanding | | | 61,842 | | | | 38,619 | |
| Ending shares | | | 104,461 | | | | 42,619 | |
| Class C | | | | | | | | |
| Beginning shares | | | 228,241 | | | | 22,786 | |
| Shares sold | | | 110,357 | | | | 203,009 | |
| Distributions reinvested | | | 4,840 | | | | 2,446 | |
| Shares redeemed | | | (811 | ) | | | – | |
| Net increase in shares outstanding | | | 114,386 | | | | 205,455 | |
| Ending shares | | | 342,627 | | | | 228,241 | |
| Class I | | | | | | | | |
| Beginning shares | | | 3,060,662 | | | | 248,515 | |
| Shares sold | | | 4,274,003 | | | | 2,803,647 | |
| Distributions reinvested | | | 43,723 | | | | 26,871 | |
| Shares redeemed | | | (89,043 | ) | | | (18,371 | ) |
| Net increase in shares outstanding | | | 4,228,683 | | | | 2,812,147 | |
| Ending shares | | | 7,289,345 | | | | 3,060,662 | |
| Class L | | | | | | | | |
| Beginning shares | | | 4,000 | | | | 4,000 | |
| Shares sold | | | 14,682 | | | | – | |
| Net increase in shares outstanding | | | 14,682 | | | | – | |
| Ending shares | | | 18,682 | | | | 4,000 | |
See Notes to Consolidated Financial Statements.
| Semi-Annual Report | March 31, 2022 | 17 |
| CIM Real Assets & Credit Fund | Consolidated Statement of Cash Flows |
For the Six Months Ended March 31, 2022 (Unaudited)
| Cash Flows from Operating Activities: | | | |
| Net increase in net assets resulting from operations | | $ | 4,753,236 | |
| Adjustments to reconcile net increase in net assets resulting from operations to net cash used in operating activities: | | | | |
| Purchase of investments | | | (95,927,392 | ) |
| Purchase of affiliated investments | | | (18,834,951 | ) |
| Proceeds from sale of investments | | | 6,275,804 | |
| Amortization of premium and accretion of discount on investments | | | (240,922 | ) |
| Net realized gains on investments | | | (84,322 | ) |
| Net realized gain on total return swaps | | | (6,550 | ) |
| Net changed in unrealized depreciation on investments | | | 1,570,785 | |
| Net changed in unrealized appreciation on affiliated investments | | | (4,345,970 | ) |
| Total return swap contracts | | | 582,155 | |
| (Increase)/Decrease in assets: | | | | |
| Interest receivable | | | (535,252 | ) |
| Receivable due from Adviser | | | (140,150 | ) |
| Prepaid expenses and other assets | | | (756,212 | ) |
| Increase/(Decrease) in liabilities: | | | | |
| Professional fees payable | | | 206,523 | |
| Administration fees payable | | | 82,500 | |
| Transfer agency fees payable | | | (1,610 | ) |
| Custody fees payable | | | 29,156 | |
| Trustees' fees payable | | | 93,750 | |
| Distribution fees payable | | | (1,249 | ) |
| Shareholder servicing fees payable | | | (245 | ) |
| Accrued expenses and other liabilities | | | 123,003 | |
| Interest due on loan payable | | | 66,774 | |
| Net cash used in operating activities | | | (107,091,139 | ) |
| | | | | |
| Cash Flows from Financing Activities: | | | | |
| Proceeds from sale of shares | | | 110,301,922 | |
| Cost of shares redeemed | | | (2,353,132 | ) |
| Cash distributions paid | | | (2,433,791 | ) |
| Net cash provided by financing activities | | | 105,514,999 | |
| | | | | |
| Net change in cash & cash equivalents | | | (1,576,140 | ) |
| | | | | |
| Cash & cash equivalents, beginning of period | | | 19,279,719 | |
| Cash & cash equivalents, end of period | | | 17,703,579 | |
| | | | | |
| Non-cash financing activities not included herein consist of reinvestment of distributions of: | | | 1,301,651 | |
| | | | | |
| RECONCILIATION OF RESTRICTED AND UNRESTRICTED CASH AT THE BEGINNING OF YEAR TO THE STATEMENT OF ASSETS AND LIABILITIES | | | | |
| Cash | | $ | 6,732,517 | |
| Cash collateral for total return swaps | | $ | 12,547,202 | |
| RECONCILIATION OF RESTRICTED AND UNRESTRICTED CASH AT THE END OF YEAR TO THE STATEMENT OF ASSETS AND LIABILITIES | | | | |
| Cash | | $ | 202,649 | |
| Cash collateral for total return swaps | | $ | 17,500,930 | |
See Notes to Consolidated Financial Statements.
| 18 | https://www.cimgroup.com/public-investment-programs/current-public-programs/racr |
| CIM Real Assets & Credit Fund | Consolidated Financial Highlights |
For a Share Outstanding Throughout the Periods Presented
| Class A | | For the Six Months Ended March 31, 2022 (Unaudited) | | | For the Year Ended September 30, 2021 | | | For the Period May 5, 2020 (Commencement of Operations) to September 30, 2020 | |
| Net asset value, beginning of period | | $ | 26.45 | | | $ | 25.16 | | | $ | 25.00 | |
| | | | | | | | | | | | | |
| INCOME FROM INVESTMENT OPERATIONS | | | | | | | | | | | | |
| Net investment income(a) | | | 0.46 | | | | 0.91 | | | | 0.20 | |
| Net realized and unrealized gain | | | 0.38 | | | | 1.91 | | | | 0.46 | |
| Total from investment operations | | | 0.84 | | | | 2.82 | | | | 0.66 | |
| | | | | | | | | | | | | |
| DISTRIBUTIONS | | | | | | | | | | | | |
| From net investment income | | | (0.37 | ) | | | (0.99 | ) | | | (0.50 | ) |
| From net realized gain on investments | | | (0.03 | ) | | | (0.36 | ) | | | – | |
| Return of capital | | | (0.38 | ) | | | (0.18 | ) | | | – | |
| Total distributions | | | (0.78 | ) | | | (1.53 | ) | | | (0.50 | ) |
| | | | | | | | | | | | | |
| Net increase in net asset value | | | 0.06 | | | | 1.29 | | | | 0.16 | |
| Net asset value, end of period | | $ | 26.51 | | | $ | 26.45 | | | $ | 25.16 | |
| TOTAL RETURN(b) | | | 3.23 | % | | | 11.60 | % | | | 2.67 | % |
| | | | | | | | | | | | | |
| RATIOS/SUPPLEMENTAL DATA | | | | | | | | | | | | |
| Net assets, end of period (000s) | | $ | 2,770 | | | $ | 1,127 | | | $ | 101 | |
| | | | | | | | | | | | | |
| Ratios to Average Net Assets | | | | | | | | | | | | |
| Ratio of expenses to average net assets excluding fee waivers and reimbursements | | | 3.71 | %(c) | | | 9.94 | % | | | 45.26 | %(c) |
| Ratio of expenses to average net assets including fee waivers and reimbursements | | | 2.50 | %(d) | | | 1.74 | %(e) | | | 1.00 | %(d)(e) |
| Ratio of net investment income to average net assets including fee waivers and reimbursements | | | 3.51 | %(d) | | | 3.53 | % | | | 1.94 | %(d) |
| Portfolio turnover rate | | | 7 | %(f) | | | 122 | % | | | 1 | %(f) |
| (a) | Calculated using the average shares method. |
| (b) | Total returns have not been annualized and do not reflect the impact of sales load. Total returns would have been lower had certain expenses not been waived or reimbursed during the period. Returns shown do not reflect the deduction of taxes that a shareholder would pay on Fund distributions or redemption of Fund shares. |
| (c) | These ratios to average net assets have been annualized except for the non-recurring offering and organizational expenses which have not been annualized. |
| (e) | The Adviser waived the management fees from commencement of operations May 5, 2020 to June 30, 2021. Without this waiver the net expense ratio would have been 2.50% |
See Notes to Consolidated Financial Statements.
| Semi-Annual Report | March 31, 2022 | 19 |
| CIM Real Assets & Credit Fund | Consolidated Financial Highlights |
For a Share Outstanding Throughout the Periods Presented
| Class C | | For the Six Months Ended March 31, 2022 (Unaudited) | | | For the Year Ended September 30, 2021 | | | For the Period May 5, 2020 (Commencement of Operations) to September 30, 2020 | |
| Net asset value, beginning of period | | $ | 26.16 | | | $ | 25.08 | | | $ | 25.00 | |
| | | | | | | | | | | | | |
| INCOME FROM INVESTMENT OPERATIONS | | | | | | | | | | | | |
| Net investment income(a) | | | 0.37 | | | | 0.70 | | | | 0.22 | |
| Net realized and unrealized gain | | | 0.37 | | | | 1.90 | | | | 0.36 | |
| Total from investment operations | | | 0.74 | | | | 2.60 | | | | 0.58 | |
| | | | | | | | | | | | | |
| DISTRIBUTIONS | | | | | | | | | | | | |
| From net investment income | | | (0.36 | ) | | | (0.98 | ) | | | (0.50 | ) |
| From net realized gain on investments | | | (0.02 | ) | | | (0.36 | ) | | | – | |
| Return of capital | | | (0.39 | ) | | | (0.18 | ) | | | – | |
| Total distributions | | | (0.77 | ) | | | (1.52 | ) | | | (0.50 | ) |
| | | | | | | | | | | | | |
| Net increase/(decrease) in net asset value | | | (0.03 | ) | | | 1.08 | | | | 0.08 | |
| Net asset value, end of period | | $ | 26.13 | | | $ | 26.16 | | | $ | 25.08 | |
| TOTAL RETURN(b) | | | 2.88 | % | | | 10.73 | % | | | 2.35 | % |
| | | | | | | | | | | | | |
| RATIOS/SUPPLEMENTAL DATA | | | | | | | | | | | | |
| Net assets, end of period (000s) | | $ | 8,953 | | | $ | 5,972 | | | $ | 572 | |
| | | | | | | | | | | | | |
| Ratios to Average Net Assets | | | | | | | | | | | | |
| Ratio of expenses to average net assets excluding fee waivers and reimbursements | | | 4.36 | %(c) | | | 11.49 | % | | | 44.33 | %(c) |
| Ratio of expenses to average net assets including fee waivers and reimbursements | | | 3.25 | %(d) | | | 2.48 | %(e) | | | 1.75 | %(d)(e) |
| Ratio of net investment income to average net assets including fee waivers and reimbursements | | | 2.83 | %(d) | | | 2.73 | % | | | 2.20 | %(d) |
| Portfolio turnover rate | | | 7 | %(f) | | | 122 | % | | | 1 | %(f) |
| (a) | Calculated using the average shares method. |
| (b) | Total returns have not been annualized. Total returns would have been lower had certain expenses not been waived or reimbursed during the period. Returns shown do not reflect the deduction of taxes that a shareholder would pay on Fund distributions or redemption of Fund shares. |
| (c) | These ratios to average net assets have been annualized except for the non-recurring offering and organizational expenses which have not been annualized. |
| (e) | The Adviser waived the management fees from commencement of operations May 5, 2020 to June 30, 2021. Without this waiver the net expense ratio would have been 3.25%. |
See Notes to Consolidated Financial Statements.
| 20 | https://www.cimgroup.com/public-investment-programs/current-public-programs/racr |
| CIM Real Assets & Credit Fund | Consolidated Financial Highlights |
For a Share Outstanding Throughout the Periods Presented
| Class I | | For the Six Months Ended March 31, 2022 (Unaudited) | | | For the Year Ended September 30, 2021 | | | For the Period May 5, 2020 (Commencement of Operations) to September 30, 2020 | |
| Net asset value, beginning of period | | $ | 26.54 | | | $ | 25.18 | | | $ | 25.00 | |
| | | | | | | | | | | | | |
| INCOME FROM INVESTMENT OPERATIONS | | | | | | | | | | | | |
| Net investment income(a) | | | 0.49 | | | | 0.99 | | | | 0.23 | |
| Net realized and unrealized gain | | | 0.38 | | | | 1.90 | | | | 0.45 | |
| Total from investment operations | | | 0.87 | | | | 2.89 | | | | 0.68 | |
| | | | | | | | | | | | | |
| DISTRIBUTIONS | | | | | | | | | | | | |
| From net investment income | | | (0.37 | ) | | | (0.99 | ) | | | (0.50 | ) |
| From net realized gain on investments | | | (0.03 | ) | | | (0.36 | ) | | | – | |
| Return of capital | | | (0.38 | ) | | | (0.18 | ) | | | – | |
| Total distributions | | | (0.78 | ) | | | (1.53 | ) | | | (0.50 | ) |
| | | | | | | | | | | | | |
| Net increase in net asset value | | | 0.09 | | | | 1.36 | | | | 0.18 | |
| Net asset value, end of period | | $ | 26.63 | | | $ | 26.54 | | | $ | 25.18 | |
| TOTAL RETURN(b) | | | 3.35 | % | | | 11.88 | % | | | 2.75 | % |
| | | | | | | | | | | | | |
| RATIOS/SUPPLEMENTAL DATA | | | | | | | | | | | | |
| Net assets, end of period (000s) | | $ | 194,143 | | | $ | 81,221 | | | $ | 6,259 | |
| | | | | | | | | | | | | |
| Ratios to Average Net Assets | | | | | | | | | | | | |
| Ratio of expenses to average net assets excluding fee waivers and reimbursements | | | 3.44 | %(c) | | | 9.98 | % | | | 44.53 | %(c) |
| Ratio of expenses to average net assets including fee waivers and reimbursements | | | 2.25 | %(d) | | | 1.48 | %(e) | | | 0.75 | %(d)(e) |
| Ratio of net investment income to average net assets including fee waivers and reimbursements | | | 3.76 | %(d) | | | 3.86 | % | | | 2.29 | %(d) |
| Portfolio turnover rate | | | 7 | %(f) | | | 122 | % | | | 1 | %(f) |
| (a) | Calculated using the average shares method. |
| (b) | Total returns have not been annualized. Total returns would have been lower had certain expenses not been waived or reimbursed during the period. Returns shown do not reflect the deduction of taxes that a shareholder would pay on Fund distributions or redemption of Fund shares. |
| (c) | These ratios to average net assets have been annualized except for the non-recurring offering and organizational expenses which have not been annualized. |
| (e) | The Adviser waived the management fees from commencement of operations May 5, 2020 to June 30, 2021. Without this waiver the net expense ratio would have been 2.25%. |
See Notes to Consolidated Financial Statements.
| Semi-Annual Report | March 31, 2022 | 21 |
| CIM Real Assets & Credit Fund | Consolidated Financial Highlights |
For a Share Outstanding Throughout the Periods Presented
| Class L | | For the Six Months Ended March 31, 2022 (Unaudited) | | | For the Year Ended September 30, 2021 | | | For the Period May 5, 2020 (Commencement of Operations) to September 30, 2020 | |
| Net asset value, beginning of period | | $ | 26.35 | | | $ | 25.13 | | | $ | 25.00 | |
| | | | | | | | | | | | | |
| INCOME FROM INVESTMENT OPERATIONS | | | | | | | | | | | | |
| Net investment income(a) | | | 0.42 | | | | 0.95 | | | | 0.17 | |
| Net realized and unrealized gain | | | 0.38 | | | | 1.79 | | | | 0.46 | |
| Total from investment operations | | | 0.80 | | | | 2.74 | | | | 0.63 | |
| | | | | | | | | | | | | |
| DISTRIBUTIONS | | | | | | | | | | | | |
| From net investment income | | | (0.37 | ) | | | (0.98 | ) | | | (0.50 | ) |
| From net realized gain on investments | | | (0.03 | ) | | | (0.36 | ) | | | – | |
| Return of capital | | | (0.38 | ) | | | (0.18 | ) | | | – | |
| Total distributions | | | (0.78 | ) | | | (1.52 | ) | | | (0.50 | ) |
| | | | | | | | | | | | | |
| Net increase in net asset value | | | 0.02 | | | | 1.22 | | | | 0.13 | |
| Net asset value, end of period | | $ | 26.37 | | | $ | 26.35 | | | $ | 25.13 | |
| TOTAL RETURN(b) | | | 3.08 | % | | | 11.31 | % | | | 2.55 | % |
| | | | | | | | | | | | | |
| RATIOS/SUPPLEMENTAL DATA | | | | | | | | | | | | |
| Net assets, end of period (000s) | | $ | 493 | | | $ | 105 | | | $ | 101 | |
| | | | | | | | | | | | | |
| Ratios to Average Net Assets | | | | | | | | | | | | |
| Ratio of expenses to average net assets excluding fee waivers and reimbursements | | | 4.03 | %(c) | | | 17.63 | % | | | 45.51 | %(c) |
| Ratio of expenses to average net assets including fee waivers and reimbursements | | | 2.75 | %(d) | | | 1.59 | %(e) | | | 1.25 | %(d)(e) |
| Ratio of net investment income to average net assets including fee waivers and reimbursements | | | 3.23 | %(d) | | | 3.73 | % | | | 1.68 | %(d) |
| Portfolio turnover rate | | | 7 | %(f) | | | 122 | % | | | 1 | %(f) |
| (a) | Calculated using the average shares method. |
| (b) | Total returns have not been annualized. Total returns would have been lower had certain expenses not been waived or reimbursed during the period. Returns shown do not reflect the deduction of taxes that a shareholder would pay on Fund distributions or redemption of Fund shares. |
| (c) | These ratios to average net assets have been annualized except for the non-recurring offering and organizational expenses which have not been annualized. |
| (e) | The Adviser waived the management fees from commencement of operations May 5, 2020 to June 30, 2021. Without this waiver the net expense ratio would have been 2.75% |
See Notes to Consolidated Financial Statements.
| 22 | https://www.cimgroup.com/public-investment-programs/current-public-programs/racr |
| CIM Real Assets & Credit Fund | Consolidated Notes to Financial Statements |
March 31, 2022 (Unaudited)
NOTE 1 — Organization and Registration
CIM Real Assets & Credit Fund (the “Fund”), a Delaware statutory trust, is a non-diversified, closed-end management investment company, registered under the Investment Company Act of 1940, as amended (the “1940 Act”). The Fund engages in a continuous offering of shares and operates as an interval fund that offers to make quarterly repurchases of shares at net asset value (“NAV”). The Fund’s investment objective is to generate current income through cash distributions and preserve shareholders’ capital across various market cycles, with a secondary objective of capital appreciation.
The Fund’s investment adviser is CIM Capital IC Management, LLC, a Delaware limited liability company (the “Adviser”) that is registered as an investment adviser with the U.S. Securities and Exchange Commission (the “SEC”) under the Investment Advisers Act of 1940, as amended (the “Advisers Act”). The Adviser is primarily responsible for determining the amount of the Fund’s total assets that are allocated to each of the Fund’s sub-advisers, and will review such allocation percentage on an ongoing basis and adjust the allocation percentage as necessary to best achieve the Fund’s investment objective.
The Adviser has engaged CIM Capital SA Management, LLC, a Delaware limited liability company (the “CIM Sub-Adviser”) that is registered as an investment adviser with the SEC under the Advisers Act, to act as an investment sub-adviser to the Fund. The CIM Sub-Adviser is a wholly-owned subsidiary of CIM Group, LLC and is an affiliate of the Adviser. The CIM Sub-Adviser is responsible for identifying and sourcing investment opportunities with respect to real assets held by the Fund. The Fund defines “real assets” as assets issued by United States issuers where the underlying interests are investments in real estate or infrastructure in the United States (“Real Assets”).The Fund’s investments in Real Assets will consist of (1) direct real estate that will generally be held through one or more wholly-owned real estate investment trust (“REIT”) subsidiaries (each, a “REIT Subsidiary”), (2) publicly traded REITs and private REITs, (3) real estate mortgages, (4) commercial mortgage-backed securities (“CMBS”) and (5) infrastructure assets that may be held through a REIT Subsidiary. The Fund’s investments in Real Assets will generally consist of real assets in densely populated qualified communities throughout the United States.
The Adviser has also engaged OFS Capital Management, LLC, a Delaware limited liability company (the “OFS Sub-Adviser”, and, together with the CIM Sub-Adviser, the “Sub-Advisers”) that is registered as an investment adviser with the SEC under the Advisers Act, to act as an investment sub-adviser to the Fund. The OFS Sub-Adviser is a wholly-owned subsidiary of Orchard First Source Asset Management, LLC, and is an affiliate of the Adviser. The OFS Sub-Adviser is responsible for identifying and sourcing credit and credit-related investment opportunities (“Credit and Credit-Related Investments”) as well as investments in CMBS. The Fund intends for its Credit and Credit-Related Investments to consist of (1) investments in floating and fixed rate loans; (2) broadly syndicated senior secured corporate loans; (3) investments in the debt and equity tranches of collateralized loan obligations (“CLOs”); and (4) opportunistic credit investments, by which the Fund means stressed and distressed credit situations, restructurings and non-performing loans.
The Fund was organized as a statutory trust on February 4, 2019 under the laws of the State of Delaware. The Fund had no operations from that date through May 4, 2020 other than those relating to organizational matters and the registration of its shares under applicable securities laws. During this period, the Adviser purchased 4,000 of the Fund's Class I Common Shares of beneficial interest (the "Class I Shares"), at an aggregate purchase price of $100,000, at a price of $25.00 per share.
On May 5, 2020, the Fund commenced a continuous public offering of Class I Shares, Class A Shares, Class C Shares and Class L Shares. The Fund has received exemptive relief from the SEC to permit the Fund to issue multiple classes of shares and to impose asset-based distribution fees and early withdrawal charges.1 Additionally, on May 5, 2020, an affiliate of the Adviser purchased 188,000 Class I Shares at a price of $25.00 per share, 4,000 Class A Common Shares of beneficial interest (the “Class A Shares”) at a price of $25.00 per share, 4,000 Class C Common Shares of beneficial interest (the “Class C Shares”) at a price of $25.00 per share, and 4,000 Class L Common Shares of beneficial interest (the “Class L Shares”) at a price of $25.00 per share. On January 28, 2021, an affiliate of the Adviser purchased 156,067 Class I Shares. The Adviser and its affiliates own shares in the Fund representing 4.6% and 4.3% of the NAV as of March 31, 2022 and May 12, 2022, respectively.
Class C Shares and Class I Shares are offered on a continuous basis at NAV. Class C Shares are subject to a 1.00% early withdrawal charge. Class A Shares are offered at NAV plus a maximum sales load of 5.75% of the offering price. Class L Shares are offered at NAV plus a maximum sales load of 4.25% of the offering price. Each class represents an interest in the same assets of the Fund and classes are identical except for differences in their sales charge structures, ongoing service and distribution charges and early withdrawal charges. All classes of shares have equal voting privileges except that each class has exclusive voting rights with respect to its service and/or distribution plans, and other matters that exclusively affect such class, and separate voting rights on any matter submitted to shareholders in which the interests of one class differ from the interests of any other class. The Fund’s income, expenses (other than class-specific distribution fees) and realized and unrealized gains and losses are allocated proportionately each day based upon the relative net assets of each class. Class specific expenses, where applicable, include distribution fees, shareholder servicing fees, and networking fees.
| 1 | (CIM Real Assets & Credit Fund, et al. (File No. 812-15001, Release No. IC-33659 (Oct. 22, 2019) (order), Release No. IC-33630 (Sep. 23, 2019) (notice)) |
| Semi-Annual Report | March 31, 2022 | 23 |
| CIM Real Assets & Credit Fund | Consolidated Notes to Financial Statements |
March 31, 2022 (Unaudited)
NOTE 2 — Significant Accounting Policies
The following is a summary of significant accounting policies followed by the Fund in preparation of its financial statements. The policies are in conformity with accounting principles generally accepted in the United States of America (“U.S. GAAP”). The Fund is an investment company and, accordingly, follows the investment company accounting and reporting guidance of the Financial Accounting Standards Board Accounting Standards Codification (“ASC”) Topic 946 - Investment Companies.
Use of Estimates
The preparation of the financial statements in accordance with U.S. GAAP requires management to make estimates and assumptions that affect the reported amounts of assets and liabilities and disclosure of contingent assets and liabilities at the date of the financial statements. Actual results could differ from these estimates.
Portfolio Valuation
The Fund determines the NAV per each class of Common Shares on each day that the New York Stock Exchange (“NYSE”) is open for business as of the close of the regular trading session (normally, 4:00 pm eastern time). The Fund calculates NAV per Common Share on a class-specific basis, by dividing the total value of the Fund’s assets attributable to the applicable class by the total number of Common Shares of such class outstanding. The Fund’s assets are determined by subtracting any liabilities (including borrowings for investment purposes) from the total value of its portfolio investments and other assets.
In accordance with ASC Topic 820 – Fair Value Measurement and Disclosures, and consistent with the Fund’s valuation policy and procedures, portfolio securities and other assets for which market quotes are readily available are valued at market value. In circumstances where market quotes are not readily available, the Fund’s board of trustees (the “Board”) has adopted policies and procedures for determining the fair value of such securities and other assets, and has delegated the responsibility for applying the valuation methods to the Fund’s valuation committee. On a quarterly basis, or more frequently if necessary, the Board ratifies the valuation determinations made with respect to the Fund’s investments during the preceding period and evaluates whether such determinations were made in a manner consistent with the Fund’s valuation policies and procedures.
Rule 2a-5 under the 1940 Act was recently adopted by the SEC and establishes requirements for determining fair value in good faith for purposes of the 1940 Act. We are evaluating the impact of adopting Rule 2a-5 on the financial statements and intend to comply with the new rule’s requirements on or before the compliance date in September 2022.
Fair Value Measurements
In accordance with ASC Topic 820 – Fair Value Measurements and Disclosures, a three-tier fair value hierarchy has been established to classify fair value measurements for disclosure purposes. Inputs refer broadly to the assumptions that market participants would use in pricing the asset or liability, including assumptions about risk. Inputs may be observable or unobservable. Observable inputs reflect the assumptions market participants would use in pricing the asset or liability that are developed based on market data obtained from sources independent of the reporting entity. Unobservable inputs reflect the reporting entity’s own assumptions about the assumptions market participants would use in pricing the asset or liability that are developed based on the best information available.
Various inputs are used in determining the fair value of the Fund’s investments as of the end of the reporting period. When inputs used fall into different levels of the fair value hierarchy, the level in the hierarchy within which the fair value measurement falls is determined based on the lowest level input that is significant to the fair value measurement in its entirety.
These inputs are categorized in the following hierarchy under applicable financial accounting standards:
| Level 1 – | Inputs are quoted prices (unadjusted) in active markets for identical assets or liabilities that the Fund has the ability to access at the measurement date. An active market is defined as a market in which transactions for the assets or liabilities occur with sufficient frequency and volume to provide pricing information on an ongoing basis. |
| Level 2 – | Inputs include quoted prices for similar assets or liabilities in active markets, quoted prices for identical or similar assets or liabilities in markets that are not active (markets with few transactions), inputs other than quoted prices that are observable for the asset or liability (i.e., interest rates, yield curves etc.), and inputs that are derived principally from or corroborated by observable market data correlation or other means (market corroborated inputs). |
| Level 3 – | Unobservable inputs, which are only used to the extent that observable inputs are not available, reflect the Fund's assumptions about the pricing of an asset or liability. |
| 24 | https://www.cimgroup.com/public-investment-programs/current-public-programs/racr |
| CIM Real Assets & Credit Fund | Consolidated Notes to Financial Statements |
March 31, 2022 (Unaudited)
The following is a summary of the inputs used to value the Fund’s investments as of March 31, 2022:
| Investments in Securities at Value | | Level 1 - Unadjusted Quoted Prices | | | Level 2 - Other Significant Observable Inputs | | | Level 3 - Significant Unobservable Inputs | | | Total | |
| Bank Loans | | $ | – | | | $ | – | | | $ | 39,827,400 | | | $ | 39,827,400 | |
| Collateralized Loan Obligations - Debt | | | – | | | | 19,267,025 | | | | – | | | | 19,267,025 | |
| Collateralized Loan Obligations - Equity | | | – | | | | – | | | | 20,074,740 | | | | 20,074,740 | |
| Commercial Mortgage-Backed Securities | | | – | | | | 6,898,440 | | | | 4,506,649 | | | | 11,405,089 | |
| Direct Real Estate | | | – | | | | – | | | | 53,047,251 | | | | 53,047,251 | |
| Real Estate-Related Securities(1) | | | – | | | | – | | | | 16,938,029 | | | | 16,938,029 | |
| Common Stocks(2) | | | 3,005,782 | | | | – | | | | 4,340,802 | | | | 7,346,584 | |
| Warrants | | | – | | | | – | | | | 72,118 | | | | 72,118 | |
| Loan Accumulation Facility(3) | | | – | | | | – | | | | 4,000,000 | | | | 4,000,000 | |
| Short Term Investments | | | 32,457,410 | | | | – | | | | – | | | | 32,457,410 | |
| Total | | $ | 35,463,192 | | | $ | 26,165,465 | | | $ | 142,806,989 | | | $ | 204,435,646 | |
| Other Financial Instruments | | | | | | | | | | | | | | | | |
| Assets | | | | | | | | | | | | | | | | |
| Total Return Swap Contracts | | $ | – | | | $ | 41,700 | | | $ | 43,658 | | | $ | 85,358 | |
| Liabilities | | | | | | | | | | | | | | | | |
| Total Return Swap Contracts | | $ | – | | | $ | (425,722 | ) | | $ | (111,624 | ) | | $ | (537,346 | ) |
| Total | | $ | – | | | $ | (384,022 | ) | | $ | (67,966 | ) | | $ | (451,988 | ) |
| (1) | IENTC 2, LLC investment of $1,391,200 was held at cost as of March 31, 2022. |
| (2) | IENTC 1, LLC investment of $3,760,000 was held at cost as of March 31, 2022. |
| (3) | Asset was held at cost as of March 31, 2022. |
The changes of the fair value of investments for which the Fund has used Level 3 inputs to determine the fair value are as follows:
| Asset Type | | Balance as of September 30, 2021 | | | Accrued Discount/Premium | | | Return of Capital | | | Realized Gain/(Loss) | | | Change in Unrealized Appreciation/ (Depreciation) | | | Purchases | | | Sales Proceeds | | | Transfer into Level 3 | | | Transfer Out of Level 3 | | | Balance as of March 31, 2022 | | | Net change in unrealized appreciation/ (depreciation) included in the Statements of Operations attributable to Level 3 investments held at March 31, 2022 | |
| Bank Loans | | $ | 6,695,955 | | | $ | 23,537 | | | $ | – | | | $ | 11,110 | | | $ | (442,780 | ) | | $ | 33,597,264 | | | $ | (794,186 | ) | | $ | 736,500 | | | $ | – | | | $ | 39,827,400 | | | $ | (442,780 | ) |
| CLO Equity | | | – | | | | 126,087 | | | | – | | | | – | | | | 30,289 | | | | 11,330,067 | | | | – | | | | 8,588,297 | | | | – | | | | 20,074,740 | | | | 30,289 | |
| Commercial Mortgage– Backed Securities | | | 4,629,027 | | | | 28,247 | | | | – | | | | (745 | ) | | | (704,166 | ) | | | 557,450 | | | | (3,164 | ) | | | – | | | | – | | | | 4,506,649 | | | | (704,166 | ) |
| Common Stocks | | | – | | | | – | | | | – | | | | – | | | | 157 | | | | 4,340,645 | | | | – | | | | – | | | | – | | | | 4,340,802 | | | | 157 | |
| Direct Real Estate(1) | | | 16,495,100 | | | | – | | | | – | | | | – | | | | 4,714,602 | | | | 31,837,549 | | | | – | | | | – | | | | – | | | | 53,047,251 | | | | 4,714,602 | |
| Loan Accumulation Facility | | | 2,500,000 | | | | – | | | | – | | | | – | | | | – | | | | 4,000,000 | | | | (2,500,000 | ) | | | – | | | | – | | | | 4,000,000 | | | | – | |
| Real Estate–Related Securities(2) | | | 14,618,750 | | | | 33,802 | | | | – | | | | – | | | | 63,990 | | | | 2,221,487 | | | | – | | | | – | | | | – | | | | 16,938,029 | | | | 63,990 | |
| Warrants | | | 107,000 | | | | – | | | | – | | | | – | | | | (34,882 | ) | | | – | | | | – | | | | – | | | | – | | | | 72,118 | | | | (34,882 | ) |
| | | $ | 45,045,832 | | | $ | 211,673 | | | $ | – | | | $ | 10,365 | | | $ | 3,627,210 | | | $ | 87,884,462 | | | $ | (3,297,350 | ) | | $ | 9,324,797 | | | $ | – | | | $ | 142,806,989 | | | $ | 3,627,210 | |
| Semi-Annual Report | March 31, 2022 | 25 |
| CIM Real Assets & Credit Fund | Consolidated Notes to Financial Statements |
March 31, 2022 (Unaudited)
| (1) | Includes $3,676,897 for the minimum Structured Acquisition Payment related to the property held by the Dallas Joint Venture. See Note 4 - Direct Real Estate Investments for a further discussion regarding the Structured Acquisition Payment. |
| (2) | IENTC asset was held at cost as of March 31, 2022. |
The table below provides additional information about the Level 3 Fair Value Measurements as of March 31, 2022:
| | | | | | | | | Range | | | | |
| Asset Class | | Fair Value | | Valuation Technique | | Unobservable Inputs | Minimum | | | Maximum | | | Weighted Average | |
| Direct Real Estate | | $ | 53,047,251 | | Income Approach | | Discount Rate | | 5.75 | % | | 6.75 | % | | 6.24 | % |
| | | | | | | | Terminal Capitalization Rate | | 4.25 | % | | 5.50 | % | | 4.77 | % |
| Real Estate Related Securities(1) | | | 16,938,029 | | Discounted Cash Flows | | Discount Rate | | 2.40 | % | | 10.90 | % | | 7.89 | % |
| Commercial Mortgage Backed Securities(2) | | | 4,506,649 | | Discounted Cash Flows | | Discount Rate | | 7.40 | % | | 9.49 | % | | 8.42 | % |
| Collateralized Loan Obligations - Equity | | | 20,074,740 | | Discounted Cash Flows | | Discount Rate | | 13.00 | % | | 20.50 | % | | 15.93 | % |
| Bank Loans | | | 25,633,861 | | Discounted Cash Flows | | Discount Rate | | 8.77 | % | | 12.70 | % | | 10.04 | % |
| Bank Loans | | | 14,193,539 | | Third Party Pricing Service | | Broker Quote | | – | | | – | | | – | |
| Loan Accumulation Facility(3) | | | 4,000,000 | | Market Approach | | Transaction Price | | – | | | – | | | – | |
| Common Stock(4) | | | 4,340,802 | | Market Approach | | Transaction Price | | | | | | | | | |
| Warrants | | | 72,118 | | Black-Scholes | | Volatility | | 54.00 | % | | 82.00 | % | | 68.00 | % |
| Total | | $ | 142,806,989 | | | | | | | | | | | | | |
| (1) | IENTC 2, LLC investment of $1,391,200 was held at cost as of March 31, 2022. |
| (2) | Capital Funding Mortgage Trust investment of $500,000 was held at cost as of March 31, 2022. |
| (3) | Asset was held at cost as of March 31, 2022. |
| (4) | IENTC 1, LLC investment of $3,760,000 was held at cost as of March 31, 2022. |
The following is a reconciliation for the six months ended March 31, 2022 of the total return swap contracts for which significant unobservable inputs (Level 3) were used in determining fair value:
| | | Total Return Swap Contracts | | | Total | |
| Balance as of September 30, 2021 | | $ | 52,304 | | | $ | 52,304 | |
| Change in Unrealized Appreciation/Depreciation | | | (71,276 | ) | | | (71,276 | ) |
| Purchased Unrealized Appreciation/Depreciation | | | (1,476 | ) | | | (1,476 | ) |
| Sold Unrealized Appreciation/Depreciation | | | (3,110 | ) | | | (3,110 | ) |
| Transfers In of Unrealized Appreciation/Depreciation | | | (3,436 | ) | | | (3,436 | ) |
| Transfers Out of Unrealized Appreciation/Depreciation | | | (40,972 | ) | | | (40,972 | ) |
| Balance as of March 31, 2022 | | $ | (67,966 | ) | | $ | (67,966 | ) |
| Net change in unrealized appreciation/(depreciation) attributable to Level 3 investments held at March 31, 2022 | | $ | (67,966 | ) | | $ | (67,966 | ) |
Indemnifications
The Fund indemnifies its officers and trustees for certain liabilities that may arise from the performance of their duties to the Fund. In the normal course of business, the Fund enters into contracts that contain a variety of representations and warranties and indemnification provisions. The Fund’s maximum exposure under these arrangements is unknown as this would involve future claims that may be made against the Fund that have not yet occurred. However, the Fund expects the risk of loss due to these warranties and indemnities to be remote.
Cash
The Fund places its cash with three banking institutions, which are insured by the Federal Deposit Insurance Corporation (“FDIC”). The FDIC limit is $250,000. At various times throughout the six months ended March 31, 2022, the amount on deposit exceeded the FDIC limit and subjected the Fund to credit risk. The Fund does not believe that such deposits are subject to any unusual risk associated with investment activities.
Income Tax
For U.S. federal income tax purposes, the Fund has elected to qualify as a regulated investment company under the provisions of Subchapter M of the Internal Revenue Code of 1986, as amended (the “Code”), by distributing substantially all of its investment company taxable net income and realized gains, not offset by capital loss carryforwards, if any, to its shareholders. The Fund intends to file U.S. federal, state, and local tax returns as required.
| 26 | https://www.cimgroup.com/public-investment-programs/current-public-programs/racr |
| CIM Real Assets & Credit Fund | Consolidated Notes to Financial Statements |
March 31, 2022 (Unaudited)
As of March 31, 2022 and for the six months ended March 31, 2022, the Fund did not have a liability for any unrecognized tax benefits. The Fund’s tax returns are subject to examination by the relevant tax authorities until expiration of the applicable statute of limitations, which is generally three years after the filing of the tax return for federal purposes and four years for most state returns.
In 2021, the Fund changed its tax year end from April 30 to September 30 to better align with the Fund's fiscal year end. To effect this change, the Fund has filed Form 1128 with the Internal Revenue Service.
On March 30, 2022, the Fund formed a REIT subsidiary (the “REIT Subsidiary”) to hold two of the Fund’s existing real estate investments. The REIT Subsidiary intends to qualify and elect to be taxed as a real estate investment trust (“REIT”) for federal income tax purposes under Sections 856 through 860 of the Code, commencing with its taxable year ending December 31, 2022. If the REIT Subsidiary qualifies for taxation as a REIT, the REIT Subsidiary will generally not be subject to federal corporate income tax to the extent it distributes its taxable income to its stockholders, and so long as it, among other things, distributes at least 90% of its annual taxable income (computed without regard to the dividends paid deduction and excluding net capital gains). REITs are subject to a number of other organizational and operational requirements. Even if the REIT Subsidiary qualifies for taxation as a REIT, it may be subject to certain state and local taxes on its income and property, and federal income and excise taxes on its undistributed income. The financial statements contained herein include the accounts of the Fund and the REIT Subsidiary.
Commitments and Contingencies
In the normal course of business, the Fund's investment activities involve executions, settlement and financing of various transactions resulting in receivables from, and payables to, brokers, dealers and the Fund's custodian. These activities may expose the Fund to risk in the event that such parties are unable to fulfill contractual obligations. Management does not anticipate any material losses from counterparties with whom it conducts business. Consistent with standard business practice, the Fund enters into contracts that contain a variety of indemnifications, and may be engaged from time to time in various legal actions. The maximum exposure of the Fund under these arrangements and activities is unknown. However, the Fund expects the risk of material loss to be remote.
Investment Transactions and Investment Income
Investment security transactions are accounted for on a trade date basis. Interest income (including interest income from payment-in-kind securities), adjusted for amortization of premium and accretion of discount, is recorded on the accrual basis. Gains and losses on securities sold are determined by use of the specific identification method. To the extent any issuer defaults or a credit event occurs that impacts the issuer, the Fund may halt any additional interest income accruals and consider the realizability of interest accrued up to the date of default or credit event. Dividend income for public securities is recorded on the ex-dividend date. Dividend income for public securities is recorded on the ex-dividend date. Dividend income received from the Fund’s three non-controlling interests in direct real estate investments is recorded when distributions are declared by vehicles into which the Fund has invested. During the six months ended March 31, 2022, the Fund did not receive any dividend income related to its direct real estate investments.
Distributions to Shareholders
The Fund intends to distribute substantially all of its net investment income to shareholders in the form of dividends. The Fund has and expects to continue to declare dividends quarterly and pay them out to shareholders monthly. Distributions from net realized capital gains, if any, are expected to be declared and paid annually and are recorded on the applicable ex-dividend date. The character of income and gains to be distributed is determined in accordance with U.S. federal income tax regulations, which may differ from U.S. GAAP.
Early Withdrawal Charge
Selling brokers, or other financial intermediaries that have entered into selling agreements with the ALPS Distributors, Inc. (the “Distributor”), may receive a commission of up to 1.0% of the purchase price of Class C Shares. Class C Shares will be subject to an early withdrawal charge of 1.0% of the shareholder’s repurchase proceeds in the event that a shareholder tenders his or her Class C Shares for repurchase such that they will have been held less than 365 days after purchase, as of the time of repurchase. The Distributor may waive the imposition of the early withdrawal charge in the following situations: (1) shareholder death or (2) shareholder bankruptcy. The early withdrawal charge may also be waived in connection with a number of additional circumstances, including the following repurchases of shares held by employer sponsored benefit plans: repurchases representing returns of excess contributions to such plans. Any such waiver does not imply that the early withdrawal charge will be waived at any time in the future or that such early withdrawal charge will be waived for any other shareholder. For any waiver request, notification must be made in conjunction with the repurchase request. If no such notification is received, the Fund reserves the right to reject the request for a waiver.
Offering Costs
Offering costs incurred by the Fund of $1,370,241 were treated as deferred charges until operations commenced and were amortized over a 12-month period using the straight-line method. All offering costs incurred by the Fund and paid for or absorbed by the Adviser pursuant to the Expense Limitation Agreement (defined below) are subject to reimbursement to the Adviser, subject to the conditions set forth in the Expense Limitation Agreement, as described in Note 7 — Investment Advisory, Related Parties and Other Agreements.
| Semi-Annual Report | March 31, 2022 | 27 |
| CIM Real Assets & Credit Fund | Consolidated Notes to Financial Statements |
March 31, 2022 (Unaudited)
NOTE 3 — Derivative Transactions
The Fund’s investment objectives allow the Fund to enter into various types of derivative contracts such as total return swaps and forward foreign currency contracts. In doing so, the Fund and RACR-FS, LLC (its “Swap Subsidiary”) will employ strategies in differing combinations to permit it to increase, decrease, or change the level or types of exposure to market factors. Central to those strategies are features inherent to derivatives that make them more attractive for this purpose than equity or debt securities; they require little or no initial cash investment, they can focus exposure only on certain selected risk factors, and they may not require the ultimate receipt or delivery of the underlying security (or securities) to the contract. This may allow the Fund to pursue its objectives more quickly and efficiently than if it were to make direct purchases or sales of securities capable of effecting a similar response to market factors.
Risk of Investing in Derivatives – The Fund’s use of derivatives can result in losses due to unanticipated changes in the market risk factors and the overall market.
Derivatives may have little or no initial cash investment relative to their market value exposure and therefore can produce significant gains or losses in excess of their cost. This use of embedded leverage allows the Fund to increase its market value exposure relative to its net assets and can substantially increase the volatility of the Fund’s performance.
Additional associated risks from investing in derivatives also exist and potentially could have significant effects on the valuation of the derivative and the Fund. Typically, the associated risks are not the risks that the Fund is attempting to increase or decrease exposure to, per their investment objectives, but are the additional risks from investing in derivatives.
Examples of these associated risks are liquidity risk, which is the risk that the Fund will not be able to sell the derivative in the open market in a timely manner, and counterparty credit risk, which is the risk that the counterparty will not fulfill its obligation to the Fund.
Total Return Swap Contract – The Swap Subsidiary has entered into a total return swap referencing a portfolio of bank loans with Citibank, N.A. (“Citi”) as the counterparty. The total return swap allows the Fund to indirectly obtain exposure to a portfolio of bank loans (each a “reference asset”) without owning or taking physical custody of such bank loans. Under the total return swap, Citi has contractually committed to make payments based on the total return (income plus realized appreciation) of each reference asset in exchange for a periodic payment from the Swap Subsidiary based on a floating interest rate and any realized depreciation of each Reference Asset. Additionally, the Swap Subsidiary posts collateral to cover its potential contractual obligations to Citi under the total return swap. The total return swap is marked-to-market daily consistent with the Fund’s Valuation Policy and changes in value are recorded by the Fund as unrealized gain or loss in the consolidated financial statements. If a reference asset is removed from the total return swap, the Fund records a realized gain or loss in the Consolidated Statement of Operations equal to the difference between the price of such reference asset from the date it was added to the total return swap and the price of the reference asset at the time it was removed from the total return swap. As of March 31, 2022, the total return swap had unrealized depreciation of ($451,988).
The total return swap effectively adds leverage to the Fund’s portfolio because, in addition to the Fund’s total net assets, the Fund would be subject to investment exposure on the amount of bank loans subject to the total return swap. The total return swap is also subject to the risk that a counterparty will default on its payment obligations thereunder or that the Fund will not be able to meet its obligations to the counterparty. In addition, because the total return swap is a form of synthetic leverage, such arrangement is subject to risks similar to those associated with the use of leverage.
Fair values of total return swap contracts on the Consolidated Statement of Assets and Liabilities as of March 31, 2022, categorized by risk exposure:
| Risk Exposure | | Consolidated Statement of Assets and Liabilities Location | | Fair Value | | | Consolidated Statement of Assets and Liabilities Location | | Fair Value | |
| Market and Credit Risk (Total Return Swap Contracts) | | Unrealized appreciation on total return swap contracts | | $ | 85,358 | | | Unrealized depreciation on total return swap contracts | | $ | (537,346 | ) |
| Total | | | | $ | 85,358 | | | | | $ | (537,346 | ) |
For the six months ended March 31, 2022, the average monthly notional value of total return swap contracts was $54,997,344.
| 28 | https://www.cimgroup.com/public-investment-programs/current-public-programs/racr |
| CIM Real Assets & Credit Fund | Consolidated Notes to Financial Statements |
March 31, 2022 (Unaudited)
The effect of total return swap contracts on the Consolidated Statement of Operations for the six months ended March 31, 2022:
| Risk Exposure | | Consolidated Statement of Operations Location | | Realized Gain/(Loss) on Derivatives | | | Change in Unrealized Appreciation/(Depreciation) on Derivatives Recognized in Income | |
| Market and Credit Risk (Total Return Swap Contracts) | | Net realized gain/(loss) on total return swaps / Net change in appreciation/(depreciation) on total return swaps | | $ | 6,550 | | | $ | (582,155 | ) |
| Total | | | | $ | 6,550 | | | $ | (582,155 | ) |
NOTE 4 — Direct Real Estate Investments
During the six months ended March 31, 2022, the Fund held an 11.0% membership interest in a joint venture (the “Dallas Joint Venture”) with affiliates and an unrelated third party ("Unrelated Third Party Joint Venture Partner"). The Dallas Joint Venture acquired an interest in an office property currently under development in Dallas, Texas. As part of its obligation under the limited partnership agreement with the joint venture partners, the Fund is obligated to make a payment (“Structured Acquisition Payment”) to the developer of the underlying property upon the satisfactions of certain milestones. As of March 31, 2022, the Fund’s share of the Structured Acquisition Payment was $3,676,897 and was paid subsequent to March 31, 2022. The Fund recorded the Structured Acquisition Payment amount as a liability within payable for investments purchased in the consolidated statement of assets and liabilities and increased the amortized cost in the Dallas Joint Venture. The Fund’s payment of its share of the Structured Acquisition Payment increased the Fund’s membership interest in the Dallas Joint Venture. As of March 31, 2022, the Fund's amortized cost basis in the property was $13,630,333, net of the Fund's share of an affiliated mortgage note from the Unrelated Third Party Joint Venture Partner of $8,758,290 and the value of the Fund’s investment in the Dallas Joint Venture was $18,165,645, which resulted in an unrealized gain of $4,535,312 being recognized in the statement of operations during the six months ended March 31, 2022.
During the six months ended March 31, 2022, the Fund held an 8.0% membership interest in a joint venture (the “Washington Joint Venture”) with an affiliate. The Washington Joint Venture acquired a multi-family residential property in Washington D.C. As of March 31, 2022, the Fund's amortized cost basis in the property was $5,008,001, net of the Fund's share of an affiliated mortgage note of $5,680,000 and the value of the Fund’s investment in the Washington Joint Venture was $6,317,544, which resulted in an unrealized gain of $1,309,543 being recognized in the statement of operations during the six months ended March 31, 2022.
During the six months ended March 31, 2022, the Fund acquired a 100% interest in a multi-family residential property in Los Angeles, California (“Sora”). As of March 31, 2022, the value of the property was $13,233,570, net of the Fund's mortgage note of $39,750,000. The Fund recorded an unrealized loss of $188,118 which is recognized in the statement of operations during the six months ended March 31, 2022.
During the six months ended March 31, 2022, the Fund invested $15,000,000, inclusive of an unfunded commitment of $1,049,940 as of March 31, 2022, for an 18.85% membership interest in a joint venture (the “Del Mar Venture”) with affiliates. The Del Mar Joint Venture acquired a multi-family residential property in Phoenix, Arizona. As of March 31, 2022, the value of Fund’s investment in the Del Mar Joint Venture was $15,330,492, net of the Fund’s share of a mortgage note of $34,949,348, which resulted in an unrealized gain of $330,492 being recognized in the statement of operations during the six months ended March 31, 2022.
NOTE 5 — Investment Transactions
Investment transactions for the six months ended March 31, 2022 were as follows:
| | Purchases of Investments | | | Proceeds from Sales of Investments | |
| | $ | 102,898,640 | | | $ | 6,670,250 | |
During the six months ended March 31, 2022, the Fund and an affiliate provided financing to an entity ("IENTC 2") that owns 99.9% of a United States domiciled company that operates a fiber-optic internet network in northern Mexico (the “Mexico Joint Venture”). Specifically, the Fund and an affiliate provided a tranche of senior secured term loan (the “Senior Loan”) that has a total funding obligation of $3,080,000 (for which the Fund funded $1,391,200). The Senior Loan has a maturity date of March 31, 2031 and had an all-in interest rate of SOFR plus 9.75% as of March 31, 2022.
| Semi-Annual Report | March 31, 2022 | 29 |
| CIM Real Assets & Credit Fund | Consolidated Notes to Financial Statements |
March 31, 2022 (Unaudited)
Additionally, the Fund and the affiliate committed to provide a tranche of a delayed draw term loan (the "Delayed Draw Term Loan”) that has a total funding obligation of $12,760,000 (for which the Fund has a funding obligation of $5,997,200). As of March 31, 2022, no amounts were outstanding on the Delayed Draw Term Loan. In addition, the Fund purchased $3,760,000 of common units (the "Common Units") in an entity ("IENTC 1") that owns 100% of IENTC 2. The Fund owns approximately 21% of IENTC 1, while the affiliate and a third-party own the remaining portion of the entity.
During the six months ended March 31, 2022, the Fund invested in the Del Mar Venture and the Mexico Joint Venture, both of which are affiliated investments. The affiliated investment purchases during the six months ended March 31, 2022 and the related positions as of March 31, 2022 follow:
| Security Name | | Market Value as of September 30, 2021 | | | Purchases | | | Sales | | | Market Value as of March 31, 2022 | | | Share Balance as of March 31, 2022 | | | Dividends | | | Change in Unrealized Gain/(Loss) | | | Realized Gain/(Loss) | |
| Creative Media & Community Trust Corp. | | $ | 2,511,622 | | | $ | 988,910 | | | $ | – | | | $ | 3,005,782 | | | $ | 388,344 | | | $ | 62,034 | | | $ | (494,750 | ) | | $ | – | |
| EPIC Dallas | | | 11,371,495 | | | | 3,372,660 | | | | – | | | | 18,165,645 | | | | N/A | | | | – | | | | 3,421,490 | | | | – | |
| Vale at the Parks - DC | | | 5,123,605 | | | | 43,201 | | | | – | | | | 6,317,544 | | | | N/A | | | | – | | | | 1,150,738 | | | | – | |
| Delmar Terrace - Phoenix, AZ | | | – | | | | 15,000,000 | | | | – | | | | 15,330,492 | | | | N/A | | | | – | | | | 330,492 | | | | – | |
| IENTC 1, LLC | | | – | | | | 3,760,000 | | | | – | | | | 3,760,000 | | | | N/A | | | | – | | | | – | | | | – | |
| IENTC 2, LLC | | | – | | | | 1,391,200 | | | | – | | | | 1,391,200 | | | | N/A | | | | – | | | | – | | | | – | |
| Society Las Olas - PMG-Greybook Riverfront I LLC | | | 9,886,684 | | | | 490,161 | | | | – | | | | 10,337,836 | | | | N/A | | | | – | | | | (39,009 | ) | | | – | |
| Society Las Olas - 301 SW 1st Avenue Holdings LLC | | | 4,867,648 | | | | 364,336 | | | | – | | | | 5,208,993 | | | | N/A | | | | – | | | | (22,991 | ) | | | – | |
| | | $ | 33,625,472 | | | $ | 25,410,468 | | | $ | – | | | $ | 63,517,492 | | | $ | 388,344 | | | $ | 62,034 | | | $ | 4,345,970 | | | $ | – | |
NOTE 6 — Line of Credit
As of March 31, 20212 the Fund has an unsecured credit facility with a bank in place under which the Fund can borrow up to $40 million, subject to a borrowing base calculation. Subject to the satisfaction of certain conditions and the borrowing base calculation, the Fund can increase the amount that it may borrow under the unsecured credit facility to $100 million. Outstanding advances under the unsecured credit facility bear interest at the rate of Secured Overnight Financing Rate (SOFR) plus 4.00%. The Fund also pays a quarterly facility fee of 0.125% of the commitment under the unsecured credit facility. The unsecured credit facility contains certain customary covenants, including a maximum debt to asset value ratio covenant and a minimum liquidity requirement. The unsecured credit facility matures in December 2026, provided that the Fund may elect to extend the maturity date for two periods of 12 months each, in each instance upon satisfaction of certain conditions. As of March 31, 2022, no amount was outstanding under the unsecured credit facility.
In addition to any indebtedness incurred by the Fund, the Fund may also utilize leverage by mortgaging properties held by the Fund (or any subsidiary), or by acquiring property with existing debt. Any such leverage will be consolidated with any leverage incurred directly by the Fund and subject to the 1940 Act’s limitations on leverage. As of March 31, 2022, a subsidiary of the Fund has a mortgage with an outstanding balance of $39.8 million in connection with the acquisition of a real property. Subject to the satisfaction of certain conditions, additional advances can be made under the mortgage, up to an aggregate amount of $41.7 million. The mortgage has an interest rate of SOFR plus 2.95 % and matures in January 2024, provided that, subject to the satisfaction of certain conditions, there is an option to extend the term for three additional 12-month periods. In addition, as of March 31, 2022, the Fund had three co-investments in real properties that had mortgage notes outstanding. As of March 31, 2022, the Company’s share of the mortgage notes outstanding related to these three co-investments was $49.8 million.
NOTE 7 — Investment Advisory, Related Parties and Other Agreements
Investment Advisory and Sub-Advisory Agreements
The Adviser serves as the Fund’s investment adviser pursuant to an Investment Advisory Agreement with the Fund (the “Investment Advisory Agreement”).
Pursuant to the Investment Advisory Agreement that the Fund has entered into with the Adviser, and in consideration of the advisory services to be provided by the Adviser to the Fund, the Adviser is entitled to a fee consisting of two components - the Management Fee and the Incentive Fee (each as defined below). In addition, the Fund reimburses the Adviser (in its capacity as Co-Administrator) for certain administrative services that the Adviser provides pursuant to an Administration Agreement between the Fund and the Adviser (the "Administration Agreement"). Pursuant to the Investment Sub-Advisory Agreement that the Adviser has entered into with the CIM Sub-Adviser (the “CIM Investment Sub-Advisory Agreement”), the Adviser pays the CIM Sub-Adviser a portion of the quarterly management and incentive fees payable to the Adviser attributable to all investments in Real Assets identified and sourced by the CIM Sub-Adviser. Pursuant to the Investment Sub-Advisory Agreement that the Adviser has entered into with the OFS Sub-Adviser (the “OFS Investment Sub-Advisory Agreement”), the Adviser pays the OFS Sub-Adviser a portion of the quarterly management and incentive fees payable to the Adviser attributable to all Credit and Credit-Related Investments and CMBS identified and sourced by the Sub-Adviser. The Adviser pays the Sub-Advisers a quarterly fee equal to 50% of the management and incentive fees payable to the Adviser (the “Quarterly Sub-Adviser Fee”). The Quarterly Sub-Adviser Fee is allocated between CIM Sub-Adviser and OFS Sub-Adviser based on the proportionate share of shareholders’ equity that is invested in Real Assets and Credit and Credit-Related Investments, respectively. The Sub-Advisers’ fees are paid by the Adviser out of the fee the Adviser receives from the Fund, and do not otherwise impact the Fund’s expenses.
| 30 | https://www.cimgroup.com/public-investment-programs/current-public-programs/racr |
| CIM Real Assets & Credit Fund | Consolidated Notes to Financial Statements |
March 31, 2022 (Unaudited)
The Board has also approved an Investment Advisory Agreement with the Adviser (the “REIT Subsidiary Investment Advisory Agreement”) and an Investment Sub-Advisory Agreement with the CIM Sub-Adviser (the “REIT Subsidiary Investment Sub-Advisory Agreement”) with respect to the Fund’s wholly-owned REIT Subsidiary. The REIT Subsidiary was formed on March 30, 2022, and was, therefore, not operational during the period covered by this report.
Management Fee
The management fee is calculated at an annual rate of 1.50% of the daily value of the Fund’s net assets and is payable quarterly in arrears (the “Management Fee”). For the six months ended March 31, 2022, the Fund incurred a Management Fee of $972,804. Management Fees payable by the Fund will be offset by any advisory fees paid by the REIT Subsidiary.
Incentive Fee
The Fund has agreed to pay the Adviser as compensation under the Investment Advisory Agreement a quarterly incentive fee equal to 20% of its “Pre-Incentive Fee Net Investment Income” for the immediately preceding quarter, subject to a quarterly preferred return, or hurdle, of 1.50% of the NAV (the “Hurdle Rate”) and a catch-up feature. Incentive fees payable to our Adviser will be offset by any incentive fees payable by the REIT Subsidiary. Pre-Incentive Fee Net Investment Income includes accrued income that the Fund has not yet received in cash. No incentive fee is payable to the Adviser on realized capital gains. The incentive fee is paid to the Adviser as follows:
| ● | No Incentive Fee is payable in any calendar quarter in which the Fund’s Pre-Incentive Fee Net Investment Income does not exceed the Hurdle Rate of 1.50%; |
| ● | 100% of the Fund’s Pre-Incentive Fee Net Investment Income, if any, that exceeds the Hurdle Rate but is less than or equal to 1.875% in any calendar quarter is payable to the Adviser. This portion of the Fund’s Pre-Incentive Fee Net Investment Income which exceeds the Hurdle Rate but is less than or equal to 1.875% is referred to as the “catch-up.” The “catch-up” provision is intended to provide the Adviser with an incentive fee of 20% on all of the Fund’s Pre-Incentive Fee Net Investment Income when the Fund’s Pre-Incentive Fee Net Investment Income reaches 1.875% of our NAV in any calendar quarter; and |
| ● | 20% of the Fund’s Pre-Incentive Fee Net Investment Income, if any, that exceeds 1.875% in any calendar quarter is payable to the Adviser once the Hurdle Rate is reached and the catch-up is achieved (20% of all the Fund’s Pre-Incentive Fee Net Investment Income thereafter is allocated to the Adviser). |
For the six months ended March 31, 2022, there was no incentive fee incurred.
Expense Limitation Agreement
The Adviser and the Fund have entered into an expense limitation and reimbursement agreement (the “Expense Limitation Agreement”) under which the Adviser has agreed contractually to waive its fees and to pay or absorb the ordinary operating expenses of the Fund (including organizational and offering expenses, but excluding the incentive fee, the management fee, the service fee, fees and expenses associated with property management, development management and leasing brokerage services for real properties owned by the REIT Subsidiary, the distribution fee, dividend and interest payments (including any dividend payments, interest expenses, commitment fees, or other expenses related to any leverage incurred by the fund), brokerage commissions, acquired fund fees and expenses, taxes and extraordinary expenses), to the extent that they exceed 0.75% per annum of the Fund’s average daily net assets (the “Expense Limitation”). In consideration of the Adviser’s agreement to limit the Fund’s expenses, the Fund has agreed to repay the Adviser in the amount of any fees waived and Fund expenses paid or absorbed, subject to the limitations that: (1) the reimbursement for fees and expenses will be made only if payable not more than three years from the date which they were incurred; (2) the reimbursement may not be made if it would cause the expense limitation then in effect or in effect at the time the expenses were waived or absorbed to be exceeded; and (3) the reimbursement is approved by the Fund’s Board. The Expense Limitation Agreement may be terminated at any time, and without payment of any penalty, by the Board, upon 60 days' written notice to the Adviser. The Expense Limitation Agreement may not be terminated by the Adviser without the consent of the Board. The Expense Limitation Agreement shall continue in effect until April 28, 2023, and shall thereafter continue in effect for successive twelve-month periods with the approval of at least annually of a majority of the Trustees of the Company.
| Semi-Annual Report | March 31, 2022 | 31 |
| CIM Real Assets & Credit Fund | Consolidated Notes to Financial Statements |
March 31, 2022 (Unaudited)
For the six months ended March 31, 2022, the Adviser waived fees and reimbursed expenses of $774,445.
As of March 31, 2022, the following amounts were available for recoupment by the Adviser based upon their potential expiration dates:
| Expenses waived or reimbursed as of May 4, 2020(1) | | Expenses waived or reimbursed in period from May 5, 2020 through September 30, 2020 | | Expenses waived or reimbursed in the period from October 1, 2020 through September 30, 2021 | | Expenses waived or reimbursed in the period from October 1, 2021 through March 31, 2022 |
| Subject to repayment until maximum expiration date of May 4, 2023 | | Subject to repayment until maximum expiration date of September 30, 2023 | | Subject to repayment until maximum expiration date of September 30, 2024 | | Subject to repayment until maximum expiration date of March 31, 2025 |
| $ | 440,015 | | $ | 1,305,720 | | $ | 2,851,947 | | $ | 774,445 |
| (1) | The Fund commenced operations on May 5, 2020. Amount reflects remaining repayment related to reimbursement of organization and offering expenses incurred as of May 4, 2020. |
Fund Administration and Accounting Fees and Expenses
ALPS Fund Services, Inc. (“AFS”), serves as administrator to the Fund. Under an Administration, Bookkeeping and Pricing Services Agreement, AFS is responsible for calculating the Fund’s NAV per class of Common Shares, providing additional fund accounting and tax services, and providing fund administration and compliance-related services to the Fund.
Distribution and Shareholder Servicing Fees and Expenses
The Fund has entered into a distribution agreement with the Distributor, an affiliate of ALPS, to provide distribution services to the Fund. There are no fees paid to the Distributor pursuant to the distribution agreement. The Board has adopted, on behalf of the Fund, a distribution and shareholder servicing plan under which the Fund may compensate financial industry professionals for providing ongoing services in respect of clients with whom they have distributed shares of the Fund (the “Distribution and Shareholder Servicing Plan”). Under the Distribution and Shareholder Servicing Plan, the Fund pays the Distributor (i) a distribution fee that is calculated monthly and accrued daily at an annualized rate of 0.75% and 0.25% of the average daily net assets of the Fund attributable to Class C Shares and Class L Shares, respectively, and (ii) a Servicing Fee that is paid monthly and that will accrue at an annual rate of up to 0.25% of the Fund’s average daily net assets attributable to the Class C Shares, Class A Shares and Class L Shares, respectively. For the six months ended March 31, 2022, Class A Shares, Class C Shares and Class L Shares incurred shareholder servicing fees of $2,071, $8,771 and $316, respectively. For the six months ended March 31, 2022, Class C Shares and Class L Shares incurred distribution fees of $26,314 and $316, respectively.
The Distributor acts as the Fund’s principal underwriter in a continuous public offering of the Fund’s shares. For the six months ended March 31, 2022, no fees were retained by the Distributor.
Transfer Agency Fees and Expenses
DST Systems, Inc. (“DST”), an affiliate of AFS, serves as the transfer agent for the Fund. Under the Transfer Agency Agreement, DST is responsible for maintaining all shareholder records of the Fund, and receives customary fees from the Fund for such services.
Custody Fees and Expenses
U.S. Bank, National Association, serves as the primary custodian to the Fund and UMB Bank N.A., serves as custodian regarding certain of the Fund’s assets. The Fund pays customary fees for the services of these two custodians.
Officer and Trustee Compensation
From the launch of the Fund through September 2021, each independent trustee received an annual cash retainer of $50,000. The Fund’s net asset value exceeded $125 million in December 2021. As a result, each independent trustee currently receives an annual cash retainer of $75,000, as well as reimbursement for any reasonable expenses incurred attending meetings.
David Thompson has been a trustee of the Fund since January 2019 and Chief Executive Officer of the Fund since August 2019. Bilal Rashid has been a trustee of the Fund since August 2019. Mr. Thompson and Mr. Rashid both serve in officer roles at affiliates of the Fund, and are not paid by the Fund for serving as interested trustees.
| 32 | https://www.cimgroup.com/public-investment-programs/current-public-programs/racr |
| CIM Real Assets & Credit Fund | Consolidated Notes to Financial Statements |
March 31, 2022 (Unaudited)
NOTE 8 — Tax Basis Information
For the six months ended March 31, 2022, the following reclassifications, which had no impact on results of operations or net assets, were recorded to reflect tax character.
| | Paid-in Capital | | | Total Distributable Earnings | |
| | $ | – | | | $ | – | |
The following information is computed on a tax basis for each item as of September 30, 2021:
| | | Undistributed net investment income | | | Undistributed long-term capital gain | | | Other cumulative effect of timing differences | | | Net unrealized appreciation/(depreciation) on investments | | | Total | |
| | | $ | – | | | $ | 8,971 | | | $ | – | | | $ | 3,260,719 | | | $ | 3,269,690 | |
The difference between book basis and tax basis distributable earnings and unrealized appreciation/(depreciation) is primarily attributable to the tax deferral of losses on wash sales, investments in partnerships and certain other investments. As of March 31, 2022, the components of accumulated earnings on a tax basis were as follows:
| | | Gross Appreciation (excess of value over tax cost) | | | Gross Depreciation (excess of tax cost over value) | | | Net Unrealized Appreciation/(Depreciation) | | | Cost of Investments for Income Tax Purposes | |
| | | $ | 7,142,791 | | | $ | (2,030,869 | ) | | $ | 5,111,922 | | | $ | 198,871,756 | |
The tax characteristics of distributions paid were as follows:
| Year | | | Ordinary Income | | | Long-Term Capital Gain | | | Return of Capital | |
| 2022 | | | $ | 1,824,708 | | | $ | 1,901,845 | | | $ | 8,971 | |
| 2021 | | | | 1,247,040 | | | | – | | | | 169,895 | |
NOTE 9 — Repurchase offers
The Fund has adopted a fundamental investment policy to make quarterly offers to repurchase no less than 5% of its outstanding Common Shares at NAV. As a fundamental policy, it may not be changed without shareholder approval. If a repurchase offer is oversubscribed, the Fund may determine to increase the amount repurchased by up to 2% of the Fund’s outstanding Common Shares as of the date of the Repurchase Request Deadline. Any share repurchase offer in excess of 5% of the Fund’s outstanding Common Shares is entirely within the discretion of the Fund. Shareholders will receive written notice of each quarterly repurchase offer (the “Repurchase Offer Notice”) at least 21 calendar days and not more than 42 calendar days before the date the repurchase offer ends (the “Repurchase Request Deadline”). Common Shares will be repurchased at the NAV per Common Share determined as of the close of regular trading on the NYSE no later than the 14th day after the Repurchase Request Deadline, or the next business day if the 14th day is not a business day (each “Repurchase Pricing Date”). The Fund will distribute such payment no later than seven calendar days after the Repurchase Pricing Date.
During the six months ended March 31, 2022, the Fund completed two quarterly repurchase offers. In these offers, the Fund offered to repurchase up to 5% of the number of its outstanding shares as of the Repurchase Request Deadline. With regard to each of the offers, all repurchase requests received by the Fund were fully honored. The result of those repurchase offers were as follows:
| | Repurchase Offer #1 | Repurchase Offer #2 |
| Repurchase Offer Notice Date | September 14, 2021 | December 14, 2021 |
| Repurchase Request Deadline | October 14, 2021 | January 13, 2022 |
| Repurchase Payment Deadline | October 21, 2021 | January 21, 2022 |
| Amount Repurchased | $1,595,524 | $757,608 |
| Shares Repurchased | 61,272 | 28,581 |
| Semi-Annual Report | March 31, 2022 | 33 |
| CIM Real Assets & Credit Fund | Consolidated Notes to Financial Statements |
March 31, 2022 (Unaudited)
NOTE 10 — Risk Factors
In the normal course of business, the Fund invests in financial instruments and enters into financial transactions where risk of potential loss exists due to such things as changes in the market (market risk) or failure or inability of the other party to a transaction to perform (credit and counterparty risk). Please see below for a detailed description of select principal risks. The following list is not intended to be a comprehensive listing of all of the potential risks associated with the Fund. For a more comprehensive list of potential risks the Fund may be subject to, please refer to the Fund’s Prospectus and Statement of Additional Information (“SAI”).
COVID-19 Risk
Periods of market volatility may continue to occur in response to pandemics or other events outside of the Fund’s control. These types of events could adversely affect the Fund’s operating results. A novel strain of coronavirus (“COVID-19”) initially surfaced in China in 2019 and spread globally. General uncertainty surrounding the dangers and impact of COVID-19 (including the preventative measures taken in response thereto) and additional uncertainty regarding new variants of COVID-19, most notably the Delta and Omicron variants, have to date impacted and continue to impact supply chains, consumer demand and the operations of many businesses, as well as created labor shortages, increased inflationary pressure and overall economic and financial market instability both globally and in the United States. There is considerable uncertainty surrounding the full economic impact of the COVID-19 pandemic and the long-term effects on the U.S. and global financial markets.
The COVID-19 pandemic has had, and any future pandemic or outbreak could have, an adverse impact on the markets and the economy in general, which could have a material adverse impact on, among other things, the ability of lenders to originate loans, the volume and type of loans originated, and the volume and type of amendments and waivers granted to borrowers and remedial actions taken in the event of a borrower default, each of which could negatively impact the amount and quality of loans available for investment by the Fund and returns to the Fund, among other things. It is impossible to determine the scope of this outbreak, or any future outbreaks, how long any such outbreak, market disruption or uncertainties may last, the effect any governmental actions will have or the full potential impact on us and our investments. Any potential impact to the Fund’s results of operations will depend to a large extent on future developments and new information that could emerge regarding the duration and severity of COVID-19 and any variants thereof, the efficacy of vaccines, and the actions taken by authorities and other entities to contain COVID-19 or treat its impact, all of which are beyond the Fund’s control. These potential impacts, while uncertain, could adversely affect the Fund and its investments.
Geopolitical Risk
The current worldwide financial markets situation, as well as various social and political tensions in the United States and around the world (including wars and other forms of conflict, terrorist acts, security operations and catastrophic events such as fires, floods, earthquakes, tornadoes, hurricanes and global health epidemics), may contribute to increased market volatility, may have long term effects on the United States and worldwide financial markets, and may cause economic uncertainties or deterioration in the United States and worldwide. For example, the ongoing conflict between Russia and Ukraine, and resulting market volatility, could adversely affect our business, financial condition or results of operations. In response to the conflict between Russia and Ukraine, the U.S. and other countries have imposed sanctions or other restrictive actions against Russia. Any of the above factors, including sanctions, export controls, tariffs, trade wars and other governmental actions, could have a material adverse effect on our business, financial condition, cash flows and results of operations and could cause the market value of our common shares to decline. We monitor developments and seek to manage our investments in a manner consistent with achieving our investment objectives, but there can be no assurance that we will be successful in doing so.
Real Estate Industry Risk
The Fund will invest a substantial portion of its assets in Real Assets within the United States, which includes real estate-related securities. Therefore, the performance of its portfolio will be significantly impacted by the performance of the real estate market in general and the Fund may experience more volatility and be exposed to greater risk than it would be if it held a more diversified portfolio. The Fund will be impacted by factors particular to the real estate industry including, among others: (i) changes in general economic and market conditions; (ii) changes in the value of real estate properties; (iii) risks related to local economic conditions, overbuilding and increased competition; (iv) increases in operating expenses including property taxes and; (v) changes in zoning laws; (vi) casualty and condemnation losses; (vii) variations in rental income, neighborhood values or the appeal of property to tenants; (viii) the availability of financing (ix) changes in interest rates and (x) changes in availability of leverage on loans for or secured by real estate. Changes in federal tax laws which are being debated or pending as of the date of this prospectus may have a significant impact on the U.S. real estate industry in general, particularly in the geographic markets targeted by Fund investments. The value of securities in the real estate industry may go through cycles of relative under-performance and over-performance in comparison to equity securities markets in general.
Collateralized Mortgage-Backed Securities Risk
Mortgage-backed securities are bonds which evidence interests in, or are secured by, commercial mortgage loans. Accordingly, collateralized mortgage-backed securities (“CMBS”) are subject to all of the risks of the underlying mortgage loans. In a rising interest rate environment, the value of CMBS may be adversely affected when payments on underlying mortgages do not occur as anticipated. The value of CMBS may also change due to shifts in the market’s perception of issuers and regulatory or tax changes adversely affecting the mortgage securities markets as a whole. In addition, CMBS are subject to the credit risk associated with the performance of the underlying commercial mortgage properties. CMBS are also subject to several risks created through the securitization process.
| 34 | https://www.cimgroup.com/public-investment-programs/current-public-programs/racr |
| CIM Real Assets & Credit Fund | Consolidated Notes to Financial Statements |
March 31, 2022 (Unaudited)
The Fund may invest in the residual or equity tranches of CMBS, which are referred to as subordinate CMBS or interest-only CMBS. Subordinate CMBSs are paid interest only to the extent there are funds available to make payments. There are multiple tranches of CMBS, offering investors various maturity and credit risk characteristics. Tranches are categorized as senior, mezzanine, and subordinated/equity, according to their degree of risk. The most senior tranche of a CMBS has the greatest collateralization and pays the lowest interest rate. If there are defaults or the collateral otherwise underperforms, scheduled payments to senior tranches take precedence over those of mezzanine tranches, and scheduled payments to mezzanine tranches take precedence over those to subordinated/equity tranches. Lower tranches represent lower degrees of credit quality and pay higher interest rates intended to compensate for the attendant risks. The return on the lower tranches is especially sensitive to the rate of defaults in the collateral pool. The lowest tranche (i.e. the “equity” or “residual” tranche) specifically receives the residual interest payments (i.e., money that is left over after the higher tranches have been paid and expenses of the issuing entities have been paid) rather than a fixed interest rate. As a result, interest only CMBS possess the risk of total loss of investment in the event of prepayment of the underlying mortgages. There is no limit on the portion of the Fund’s total assets that may be invested in interest-only multifamily CMBS.
The Fund also may invest in interest-only multifamily CMBS issued by multifamily mortgage loan securitizations. However, these interest-only multifamily CMBS typically only receive payments of interest to the extent that there are funds available in the securitization to make the payment and may introduce increased risks since these securities have no underlying principal cash flows.
Broadly Syndicated Loans Risk
The broadly syndicated senior secured corporate loans (“Broadly Syndicated Loans”) in which the Fund will invest will primarily be rated below investment grade, but may also be unrated and of comparable credit quality. As a result, the risks associated with such Broadly Syndicated Loans are generally similar to the risks of other below investment grade fixed income instruments, although Broadly Syndicated Loans are senior and typically secured in contrast to other below investment grade fixed income instruments, which are often subordinated or unsecured. Investments in below investment grade Broadly Syndicated Loans are considered speculative because of the credit risk of the borrowers. Such borrowers are more likely than investment grade borrowers to default on their payments of interest and principal owed to the Fund, and such defaults could reduce the Fund’s NAV and income dividends. An economic downturn would generally lead to a higher non-payment rate, and a Broadly Syndicated Loan may lose significant market value before a default occurs. Moreover, any specific collateral used to secure a Broadly Syndicated Loan may decline in value or become illiquid, which would adversely affect the Broadly Syndicated Loan’s value. Broadly Syndicated Loans are subject to a number of risks described elsewhere in this prospectus, including liquidity risk and the risk of investing in below investment grade fixed income instruments.
Broadly Syndicated Loans are subject to the risk of non-payment of scheduled interest or principal. Such non-payment would result in a reduction of income to the Fund, a reduction in the value of the investment and a potential decrease in the NAV of the Fund. There can be no assurance that the liquidation of any collateral securing a Broadly Syndicated Loan would satisfy the borrower’s obligation in the event of non-payment of scheduled interest or principal payments, whether when due or upon acceleration, or that the collateral could be liquidated, readily or otherwise. In the event of bankruptcy or insolvency of a Borrower, the Fund could experience delays or limitations with respect to its ability to realize the benefits of the collateral, if any, securing a Broadly Syndicated Loan. The collateral securing a Broadly Syndicated Loan, if any, may lose all or substantially all of its value in the event of the bankruptcy or insolvency of a Borrower. Some Broadly Syndicated Loans are subject to the risk that a court, pursuant to fraudulent conveyance or other similar laws, could subordinate such Broadly Syndicated Loans to presently existing or future indebtedness of the Borrower or take other action detrimental to the holders of Broadly Syndicated Loans including, in certain circumstances, invalidating such Broadly Syndicated Loans or causing interest previously paid to be refunded to the Borrower. Additionally, a Broadly Syndicated Loan may be “primed” in bankruptcy, which reduces the ability of the holders of the Broadly Syndicated Loan to recover on the collateral. Priming takes place when a debtor in bankruptcy is allowed to incur additional indebtedness by the bankruptcy court and such indebtedness has a senior or pari passu lien with the debtor’s existing secured indebtedness, such as existing Broadly Syndicated Loans or secured corporate bonds.
There may be less readily available information about most Broadly Syndicated Loans and the borrowers thereunder than is the case for many other types of securities, including securities issued in transactions registered under the Securities Act of 1933, as amended, or registered under the Securities Exchange Act of 1934, as amended, and borrowers subject to the periodic reporting requirements of Section 13 of the Exchange Act. Broadly Syndicated Loans may be issued by companies that are not subject to SEC reporting requirements and these companies, therefore, do not file reports with the SEC that must comply with SEC form requirements and in addition are subject to a less stringent liability disclosure regime than companies subject to SEC reporting requirements. As a result, the OFS Sub-Adviser will rely most often on their own evaluation of a borrower’s credit quality rather than on any available independent sources. Therefore, the Fund will be particularly dependent on the analytical abilities of the OFS Sub-Adviser.
The secondary trading market for Broadly Syndicated Loans may be less liquid than the secondary trading market for registered investment grade debt securities. No active trading market may exist for certain Broadly Syndicated Loans, which may make it difficult to value them. Illiquidity and adverse market conditions may mean that the Fund may not be able to sell Broadly Syndicated Loans quickly or at a fair price. To the extent that a secondary market does exist for certain Broadly Syndicated Loans, the market for them may be subject to irregular trading activity, wide bid/ask spreads and extended trade settlement periods.
| Semi-Annual Report | March 31, 2022 | 35 |
| CIM Real Assets & Credit Fund | Consolidated Notes to Financial Statements |
March 31, 2022 (Unaudited)
Broadly Syndicated Loans and other variable rate debt instruments are subject to the risk of payment defaults of scheduled interest or principal. Such payment defaults would result in a reduction of income to the Fund, a reduction in the value of the investment and a potential decrease in the NAV of the Fund. Similarly, a sudden and significant increase in market interest rates may increase the risk of payment defaults and cause a decline in the value of these investments and in the Fund’s NAV. Other factors (including, but not limited to, rating downgrades, credit deterioration, a large downward movement in share prices, a disparity in supply and demand of certain securities or market conditions that reduce liquidity) can reduce the value of Broadly Syndicated Loans and other debt obligations, impairing the Fund’s NAV.
The Fund will acquire Broadly Syndicated Loans through assignments and through participations. The purchaser of an assignment typically succeeds to all the rights and obligations of the assigning institution and becomes a lender under the credit agreement with respect to the debt obligation; however, the purchaser’s rights can be more restricted than those of the assigning institution, and the Fund may not be able to unilaterally enforce all rights and remedies under the loan and with regard to any associated collateral. In general, a participation is a contractual relationship only with the institution participating out the interest, not with the Borrower. Sellers of participations typically include banks, broker-dealers, other financial institutions and lending institutions. In purchasing participations, the Fund generally will have no right to enforce compliance by the Borrower with the terms of the loan agreement against the Borrower, and the Fund may not directly benefit from the collateral supporting the debt obligation in which it has purchased the participation. As a result, (i) the Fund will be exposed to the credit risk of both the Borrower and the institution selling the participation; and (ii) both the Borrower and the institution selling the participation will be considered issuers for purposes of the Fund’s investment restriction concerning industry concentration. See “Investment Restrictions”. Further, in purchasing participations in lending syndicates, the Fund may be more limited than it otherwise would be in its ability to conduct due diligence on the Borrower. In addition, as a holder of the participations, the Fund may not have voting rights or inspection rights that the Fund would otherwise have if it were investing directly in the Broadly Syndicated Loan, which may result in the Fund being exposed to greater credit or fraud risk with respect to the Borrower or the Broadly Syndicated Loan.
Valuation Risk
Where possible, the Fund utilizes independent pricing services approved by the Board to value certain portfolio instruments at their market value. If the pricing services are unable to provide a market value or if a significant event occurs such that the valuation(s) provided are deemed unreliable, the Fund may value portfolio instrument(s) at their fair value, which is generally the amount an owner might reasonably expect to receive upon a current sale. Valuation risks associated with the Fund’s investments include, but are not limited to: a limited number of market participants compared to publicly traded investment grade securities, a lack of publicly available information about some borrowers, resale restrictions, settlement delays, corporate actions and adverse market conditions may make it difficult to value or sell such instruments.
A large percentage of the Fund’s portfolio investments will not be publicly traded. The fair value of investments that are not publicly traded may not be readily determinable. The Fund values these investments at fair value as determined in good faith pursuant to valuation policies and procedures adopted by the Board. The types of factors that may be considered in valuing the Fund’s investments include the enterprise value of the portfolio company (the entire value of the portfolio company to a market participant, including the sum of the values of debt and equity securities used to capitalize the enterprise at a point in time), the nature and realizable value of any collateral, the portfolio company’s ability to make payments and its earnings and discounted cash flows, the markets in which the portfolio company does business, a comparison of the portfolio company’s securities to similar publicly traded securities, changes in the interest rate environment and the credit markets generally that may affect the price at which similar investments would trade in their principal markets and other relevant factors. When an external event such as a purchase transaction, public offering or subsequent equity sale occurs, the Fund considers the pricing indicated by the external event to corroborate the Fund’s valuation. Because such valuations, and particularly valuations of private investments and private companies, are inherently uncertain, may fluctuate over short periods of time and may be based on estimates, the Fund’s determinations of fair value may differ materially from the values that would have been used if a ready market for these investments existed and may differ materially from the values that the Fund may ultimately realize. The Fund’s NAV per each class of Common Shares could be adversely affected if the Fund’s determinations regarding the fair value of these investments are higher than the values that the Fund realizes upon disposition of such investments.
Liquidity Risk
The Fund may invest without limitation in securities that, at the time of investment, are illiquid (determined using the SEC’s standard applicable to registered investment companies, i.e., securities that cannot be disposed of by the Fund within seven days in the ordinary course of business at approximately the amount at which the Fund has valued the securities). The Fund may also invest in securities subject to restrictions on resale. Investments in restricted securities could have the effect of increasing the amount of the Fund’s assets invested in illiquid securities if qualified institutional buyers are unwilling to purchase these securities. The illiquidity of these investments may make it difficult for the Fund to sell such investments if the need arises. In addition, if the Fund is required to liquidate all or a portion of its portfolio quickly, the Fund may realize significantly less than the value at which it has previously recorded these investments.
| 36 | https://www.cimgroup.com/public-investment-programs/current-public-programs/racr |
| CIM Real Assets & Credit Fund | Consolidated Notes to Financial Statements |
March 31, 2022 (Unaudited)
Illiquid and restricted securities may be difficult to dispose of at a fair price at the times when the Fund believes it is desirable to do so. The market price of illiquid and restricted securities generally is more volatile than that of more liquid securities, which may adversely affect the price that the Fund pays for or recovers upon the sale of such securities. Illiquid and restricted securities are also more difficult to value, especially in challenging markets. Each Sub-Adviser’s judgment may play a greater role in the valuation process. Investment of the Fund’s assets in illiquid and restricted securities may restrict the Fund’s ability to take advantage of market opportunities. In order to dispose of an unregistered security, the Fund, where it has contractual rights to do so, may have to cause such security to be registered. A considerable period may elapse between the time the decision is made to sell the security and the time the security is registered, thereby enabling the Fund to sell it. Contractual restrictions on the resale of securities vary in length and scope and are generally the result of a negotiation between the issuer and acquiror of the securities. In either case, the Fund would bear market risks during that period.
Some loans and other instruments are not readily marketable and may be subject to restrictions on resale. Loans and other instruments may not be listed on any national securities exchange and no active trading market may exist for certain of the loans and other instruments in which the Fund will invest. Where a secondary market exists, the market for some loans and other instruments may be subject to irregular trading activity, wide bid/ask spreads and extended trade settlement periods.
Credit Risk
Credit risk is the risk that one or more loans or other floating rate instruments in the Fund’s portfolio will decline in price or fail to pay interest or principal when due because the issuer of the instrument experiences a decline in its financial status. While a senior position in the capital structure of a borrower or issuer may provide some protection with respect to the Fund’s investments in certain loans, losses may still occur because the market value of loans is affected by the creditworthiness of borrowers or issuers and by general economic and specific industry conditions and the Fund’s other investments will often be subordinate to other debt in the issuer’s capital structure. To the extent the Fund invests in below investment grade instruments, it will be exposed to a greater amount of credit risk than a fund which invests in investment grade securities. The prices of lower grade instruments are more sensitive to negative developments, such as a decline in the issuer’s revenues or a general economic downturn, than are the prices of higher grade instruments. Instruments of below investment grade quality are predominantly speculative with respect to the issuer’s capacity to pay interest and repay principal when due and therefore involve a greater risk of default.
CLO Risk
In addition to the general risks associated with debt securities and structured products discussed herein, CLOs carry additional risks, including, but not limited to (i) the possibility that distributions from collateral securities will not be adequate to make interest or other payments; (ii) the quality of the collateral may decline in value or default; (iii) the possibility that the investments in CLOs are subordinate to other classes or tranches thereof, (iv) the potential of spread compression in the underlying loans of the CLO, which could reduce credit enhancement in the CLOs and (v) the complex structure of the security may not be fully understood at the time of investment and may produce disputes with the issuer or unexpected investment results.
CLO junior debt securities that the Fund may acquire are subordinated to more senior tranches of CLO debt. CLO junior debt securities are subject to increased risks of default relative to the holders of superior priority interests in the same securities. In addition, at the time of issuance, CLO equity securities are under-collateralized in that the liabilities of a CLO at inception exceed its total assets. Though not exclusively, the Fund will typically be in a first loss or subordinated position with respect to realized losses on the assets of the CLOs in which it is invested. The Fund may recognize phantom taxable income from its investments in the subordinated tranches of CLOs.
Between the closing date and the effective date of a CLO, the CLO collateral manager will generally expect to purchase additional collateral obligations for the CLO. During this period, the price and availability of these collateral obligations may be adversely affected by a number of market factors, including price volatility and availability of investments suitable for the CLO, which could hamper the ability of the collateral manager to acquire a portfolio of collateral obligations that will satisfy specified concentration limitations and allow the CLO to reach the initial par amount of collateral prior to the effective date. An inability or delay in reaching the target initial par amount of collateral may adversely affect the timing and amount of interest or principal payments received by the holders of the CLO debt securities and distributions of the CLO on equity securities and could result in early redemptions which may cause CLO debt and equity investors to receive less than the face value of their investment.
In addition, the portfolios of certain CLOs in which the Fund may invest may contain “covenant-lite” loans. The Fund uses the term “covenant-lite” loans to refer generally to loans that do not have a complete set of financial maintenance covenants. Generally, “covenant-lite” loans provide borrower companies more freedom to negatively impact lenders because their covenants are incurrence-based, which means they are only tested and can only be breached following an affirmative action of the borrower, rather than by a deterioration in the borrower’s financial condition. Accordingly, to the extent the Fund is exposed to “covenant-lite” loans, the Fund may have a greater risk of loss on such investments as compared to investments in or exposure to loans with financial maintenance covenants.
| Semi-Annual Report | March 31, 2022 | 37 |
| CIM Real Assets & Credit Fund | Consolidated Notes to Financial Statements |
March 31, 2022 (Unaudited)
The failure by a CLO in which the Fund invests to satisfy financial covenants, including with respect to adequate collateralization and/or interest coverage tests, could lead to a reduction in the CLO’s payments to the Fund. In the event that a CLO fails certain tests, holders of CLO senior debt may be entitled to additional payments that would, in turn, reduce the payments the Fund would otherwise be entitled to receive. Separately, the Fund may incur expenses to the extent necessary to seek recovery upon default or to negotiate new terms, which may include the waiver of certain financial covenants, with a defaulting CLO or any other investment the Fund may make. If any of these occur, it could adversely affect the Fund’s operating results and cash flows.
The Fund’s CLO investments are exposed to leveraged credit risk. If certain minimum collateral value ratios and/or interest coverage ratios are not met by a CLO, primarily due to senior secured loan defaults, then cash flow that otherwise would have been available to pay distributions to the Fund on its CLO investments may instead be used to redeem any senior notes or to purchase additional senior secured loans, until the ratios again exceed the minimum required levels or any senior notes are repaid in full.
Leverage Risk
The 1940 Act requires a registered investment company to satisfy an asset coverage requirement of 300% of its indebtedness, including amounts borrowed, measured at the time of incurrence of indebtedness. This means that the value of the Fund’s total indebtedness may not exceed one-third of the value of its total assets, including the value of the assets purchased with the proceeds of its indebtedness. Under current market conditions, the Fund intends to utilize leverage principally through (i) Borrowings in an aggregate amount of up to 33 1/3% of the Fund’s total assets (including the assets subject to, and obtained with the proceeds of, such Borrowings) immediately after such Borrowings or (ii) the issuance of preferred shares in an aggregate amount of up to 50% of the Fund’s total assets (including the assets subject to, and obtained with the proceeds of, such issuance) immediately after such issuance. Leverage may result in greater volatility of the NAV and distributions on the Common Shares because changes in the value of the Fund’s portfolio investments, including investments purchased with the proceeds from are borne entirely by shareholders. Common Share income may fluctuate if the interest rate on Borrowings changes. In addition, the Fund’s use of leverage will result in increased operating costs. Thus, to the extent that the then-current cost of any leverage, together with other related expenses, approaches the net return on the Fund’s investment portfolio, the benefit of leverage to shareholders will be reduced, and if the then-current cost of any leverage together with related expenses were to exceed the net return on the Fund’s portfolio, the Fund’s leveraged capital structure would result in a lower rate of return to shareholders than if the Fund were not so leveraged. In addition, the costs associated with the Fund’s incurrence and maintenance of leverage could increase over time. There can be no assurance that the Fund’s leveraging strategy will be successful.
Any decline in the NAV of the Fund will be borne entirely by shareholders. Therefore, if the market value of the Fund’s portfolio declines, the Fund’s use of leverage will result in a greater decrease in NAV to shareholders than if the Fund were not leveraged.
Certain types of borrowings may result in the Fund being subject to covenants in credit agreements relating to asset coverage or portfolio composition or otherwise. In addition, the terms of the credit agreements may also require that the Fund pledge some or all of its assets as collateral.
Non-Diversification Risk
The Fund is classified as “non-diversified” under the 1940 Act. As a result, it can invest a greater portion of its assets in obligations of a single issuer other than a “diversified” fund. The Fund may therefore be more susceptible than a diversified fund to being adversely affected by any single corporate, economic, political or regulatory occurrence. The Fund intends to qualify for the special tax treatment available to “regulated investment companies” under Subchapter M of the Code, and thus intends to satisfy the diversification requirements of Subchapter M, including its less stringent diversification requirements that apply to the percentage of the Fund’s total assets that are represented by cash and cash items (including receivables), U.S. government securities, the securities of other regulated investment companies and certain other securities.
Affiliates Risk
Our Adviser and Sub-Advisers will experience conflicts of interest in connection with the management of our business affairs relating to and arising from a number of matters, including: the allocation of investment opportunities by our Adviser and Sub-Advisers and their affiliates; compensation to our Adviser and Sub-Advisers; services that may be provided by our Adviser and Sub-Advisers and their affiliates to issuers in which we invest; investments by us and other clients of our Adviser and Sub-Advisers, subject to the limitations of the 1940 Act; the formation of additional investment funds managed by our Adviser or Sub-Advisers; differing recommendations given by our Adviser and Sub-Advisers to us versus other clients; our Adviser’s and Sub-Advisers’ use of information gained from issuers in our portfolio for investments by other clients, subject to applicable law; and restrictions on our Adviser’s and Sub-Advisers’ use of “inside information” with respect to potential investments by us.
We may be prohibited under the 1940 Act from participating in certain transactions with our affiliates without the prior approval of our directors who are not interested persons and, in some cases, the prior approval of the SEC. To promote further alignment with other funds managed by CIM and its affiliates, the Fund has obtained exemptive relief from the SEC that allows it to co-invest alongside funds managed by affiliates of our Adviser and the OFS Sub-Adviser, in accordance with the conditions specified in the exemptive relief. We may therefore compete for capital and investment opportunities with other entities managed by our Adviser or Sub-Advisers or their affiliates, subjecting our Adviser and Sub-Advisers and their affiliates to certain conflicts of interest in evaluating the suitability of investment opportunities and making or recommending investments on our behalf.
| 38 | https://www.cimgroup.com/public-investment-programs/current-public-programs/racr |
| CIM Real Assets & Credit Fund | Consolidated Notes to Financial Statements |
March 31, 2022 (Unaudited)
Pursuant to such exemptive relief, we generally are permitted to co-invest with certain of our affiliates if a “required majority” (as defined in Section 57 of the 1940 Act) of our independent directors make certain conclusions in connection with a co-investment transaction, including that (1) the terms of the transaction, including the consideration to be paid, are reasonable and fair to us and our shareholders and do not involve overreaching of us or our shareholders on the part of any person concerned, (2) the transaction is consistent with the interests of our shareholders and is consistent with our investment objective and strategies, and (3) the investment by our affiliates would not disadvantage us, and our participation would not be on a basis different from or less advantageous than that on which our affiliates are investing. As a result of the exemptive relief, there could be significant overlap in our investment portfolio and the investment portfolio of other funds established by the Adviser or Sub-Adviser or their affiliates that could avail themselves of the exemptive relief.
LIBOR Risk
Our debt investments may be based on floating rates, such as London Interbank Offer Rate, or “LIBOR.” After the global financial crisis, regulators globally determined that existing interest rate benchmarks should be reformed based on concerns that LIBOR was susceptible to manipulation. A number of LIBOR panel banks entered into settlements with their regulators and law enforcement agencies with respect to alleged manipulation of LIBOR, and investigations by regulators and governmental authorities in various jurisdictions are ongoing.
On March 5, 2021, the United Kingdom’s Financial Conduct Authority (the “FCA”), which regulates LIBOR, announced that the 1-week and 2-month U.S. dollar LIBOR settings will cease publication after December 31, 2021 and the overnight 1, 3, 6 and 12 months U.S. dollar LIBOR settings will cease publication after June 30, 2023. On July 29, 2021, the U.S. Federal Reserve, in connection with the Alternative Reference Rates Committee (“ARRC”), a steering committee comprised of large U.S. financial institutions, formally recommended the forward-looking Secured Overnight Financing Rate (“SOFR”) term rates proposed by CME Group, Inc. as the replacement for U.S. dollar LIBOR, marking the final step in the ARRC’s Paced Transition Plan implemented to encourage the adoption of SOFR. In addition, as of the date of this report, the current nominated replacement for GBP-LIBOR is the Sterling Overnight Interbank Average Rate (“SONIA”). In July 2020, Bloomberg began publishing fall-backs that the International Swaps and Derivatives Association (“ISDA”) intends to implement in lieu of LIBOR with respect to swaps and derivatives. Given the inherent differences between LIBOR and SOFR, or any other alternative Benchmark Rate that may be established, including SONIA, there remains uncertainty regarding the future utilization of LIBOR and the nature of any replacement rate. In many cases, the nominated replacements, as well as other potential replacements, are not complete or ready to implement and require margin adjustments. There is currently no final consensus as to which Benchmark Rate(s) (along with any adjustment and/or permutation thereof) will replace all or any LIBOR tenors after the discontinuation thereof and there can be no assurance that any such replacement Benchmark Rate(s) will attain market acceptance.
Any transition away from LIBOR to one or more alternative Benchmark Rates is complex and could have a material adverse effect of the Fund’s business, financial condition and results of operations, including, without limitation, as a result of any changes in the pricing and/or availability of the Fund’s investments, negotiations and/or changes to the documentation for certain of the Fund’s investments, the pace of such changes, disputes and other actions regarding the interpretation of current and prospective loan documentation, basis risks between investments and hedges, basis risks within investments (e.g., securitizations), costs of modifications to processes and systems, and/or costs of administrative services and operations, including monitoring of recommended conventions and Benchmark Rates, or any component of or adjustment to the foregoing.
It is not possible to predict whether there will be any further changes in the methods pursuant to which the LIBOR rates are determined and any other reforms to LIBOR that will be enacted in the United States, the U.K. or elsewhere, or the effects thereof. Any such changes or further reforms to LIBOR may result in a sudden or prolonged increase or decrease in reported LIBOR rates, which could have a material adverse impact on the value of the Fund’s investments and any payments linked to LIBOR thereunder.
ETF Risk
The Fund may invest in ETFs. ETFs are traded similarly to stocks of individual companies. The value of ETFs can be expected to increase and decrease in value in proportion to increases and decreases in the indices that they are designed to track. The volatility of different index tracking stocks can be expected to vary in proportion to the volatility of the particular index they track. However, an ETF’s share price may not track its specified market index (if any) and may trade below its NAV. Although an ETF is designed to provide investment performance corresponding to its index, it may not be able to exactly replicate the performance of its index because of its operating expenses and other factors. The underlying indices that an ETF is designed to track may also experience volatility due to the COVID-19 pandemic or other widespread health crises. Any such impact could adversely affect the ETF’s performance and may indirectly lead to losses on your investment in the Fund.
Because ETFs trade on a securities exchange, extreme market volatility or potential lack of an active trading market for an ETF’s shares may trade at a premium or discount to their net asset value. The Fund’s investment in shares of ETFs subject it to the risks of owning the securities underlying the ETF, as well as certain structural risks, including authorized participant concentration risk, market maker risk, premium/discount risk and trading issues risk. As a shareholder in an ETF, the Fund bears its proportionate share of the ETF’s expenses. Certain ETFs use a “passive” investment strategy and do not take defensive positions in volatile or declining markets. Other ETFs in which the Fund may invest are actively managed ETFs (i.e., they do not track a particular benchmark), which indirectly subjects the Fund to active management risk. An active secondary market in ETF shares may not develop or be maintained and may be halted or interrupted due to actions by its listing exchange, unusual market conditions or other reasons. There can be no assurance that an ETF’s shares will continue to be listed on an active exchange. There is a risk that ETFs in which the Fund invests may terminate due to extraordinary events. For example, any of the service providers to ETFs, such as the trustee or sponsor, may close or otherwise fail to perform their obligations to the ETF, and the ETF may not be able to find a substitute service provider. Also, certain ETFs may be dependent upon licenses to use various indexes as a basis for determining their compositions and/or otherwise to use certain trade names. If these licenses are terminated, the ETFs may also terminate. In addition, an ETF may terminate if its net assets fall below a certain amount.
| Semi-Annual Report | March 31, 2022 | 39 |
| CIM Real Assets & Credit Fund | Consolidated Notes to Financial Statements |
March 31, 2022 (Unaudited)
Total Return Swap Risk
The Fund has entered, and may enter into additional, total return swap (“TRS”) agreements that would expose the Fund to certain risks, including market risk, liquidity risk and other risks similar to those associated with the use of leverage. A TRS is a contract in which one party agrees to make periodic payments to another party based on the return of the assets underlying the TRS, which may include a specified security, basket of securities or securities indices during the specified period, in return for periodic payments based on a fixed or variable interest rate. A TRS is typically used to obtain exposure to a basket of securities or loans or market without owning or taking physical custody of such securities or loans or investing directly in such market. A TRS effectively adds leverage to our portfolio because, in addition to our total net assets, we would be subject to investment exposure on the amount of securities subject to the TRS. A TRS is also subject to the risk that a counterparty will default on its payment obligations thereunder or that we will not be able to meet our obligations to the counterparty. In addition, because a TRS is a form of synthetic leverage, such arrangements are subject to risks similar to those associated with the use of leverage.
Cyber-Security Risk and Identity Theft Risks
Cyber-security incidents and cyber-attacks have been occurring globally at a more frequent and severe level and will likely continue to increase in frequency in the future. The Advisers’ information and technology systems may be vulnerable to damage or interruption from computer viruses and other malicious code, network failures, computer and telecommunication failures, infiltration by unauthorized persons and security breaches, usage errors by their respective professionals or service providers, power, communications or other service outages and catastrophic events such as fires, tornadoes, floods, hurricanes and earthquakes. If unauthorized parties gain access to such information and technology systems, they may be able to steal, publish, delete or modify private and sensitive information. Although the Advisers have implemented various measures to manage risks relating to these types of events, such systems could be inadequate and, if compromised, could become inoperable for extended periods of time, cease to function properly or fail to adequately secure private information. Breaches such as those involving covertly introduced malware, impersonation of authorized users and industrial or other espionage may not be identified even with sophisticated prevention and detection systems, potentially resulting in further harm and preventing it from being addressed appropriately. The Advisers and/or the Fund may have to make a significant investment to fix or replace them. The failure of these systems and/or of disaster recovery plans for any reason could cause significant interruptions in the Advisers’, and/or the Fund’s operations and result in a failure to maintain the security, confidentiality or privacy of sensitive data, including personal information relating to shareholders and the intellectual property and trade secrets of the Advisers. Such a failure could harm the Advisers’ and/or the Fund’s reputation, subject any such entity and their respective affiliates to legal claims and adverse publicity and otherwise affect their business and financial performance.
A disaster or a disruption in the infrastructure that supports the Fund’s business, including a disruption involving electronic communications or other services used by the Fund or by third parties with whom the Fund conducts business, or directly affecting the Fund’s headquarters, could have a material adverse impact on the Fund’s ability to continue to operate its business without interruption. The Fund’s disaster recovery programs may not be sufficient to mitigate the harm that may result from such a disaster or disruption. In addition, insurance and other safeguards might only partially reimburse the Fund for its losses, if at all.
Third parties with which the Fund does business may also be sources of cybersecurity or other technological risk. The Fund outsources certain functions and these relationships allow for the storage and processing of its information, as well as client, counterparty, employee, and borrower information. While the Fund engages in actions to reduce its exposure resulting from outsourcing, ongoing threats may result in unauthorized access, loss, exposure, destruction, or other cybersecurity incident that affects its data, resulting in increased costs and other consequences as described above.
The Fund and its service providers are currently impacted by quarantines and similar measures being enacted by governments in response to the COVID-19 pandemic, which are obstructing the regular functioning of business workforces (including requiring some employees to work from external locations and their homes). Accordingly, the risks described above may be heightened under current conditions.
| 40 | https://www.cimgroup.com/public-investment-programs/current-public-programs/racr |
| CIM Real Assets & Credit Fund | Consolidated Notes to Financial Statements |
March 31, 2022 (Unaudited)
Foreign Investments
The Fund may invest in foreign assets or assets that have foreign exposure, including investments quoted or denominated in a currency other than U.S. dollars. Investing in foreign assets or in assets that have foreign exposure involves certain special risks, which are not typically associated with investing in the United States. Many of these risks are more pronounced for investments in emerging economies.
With respect to investments in certain foreign countries, there exist certain economic, political and social risks, including the risk of adverse political developments, nationalization, military unrest, social instability, war and terrorism, confiscation without fair compensation, expropriation or confiscatory taxation, limitations on the movement of funds and other assets between different countries, or diplomatic developments, any of which could adversely affect the Fund’s investments in those countries. Governments in certain foreign countries continue to participate to a significant degree, through ownership interest or regulation, in their respective economies. Action by these governments could have a significant effect on market prices of securities and dividend payments.
Investments in foreign assets or assets that have foreign exposure often involve currencies of foreign countries. Accordingly, the Fund may be affected favorably or unfavorably by changes in currency rates and in exchange control regulations and may incur costs in connection with conversions between various currencies. The Fund may be subject to currency exposure independent of its investments. Currency exchange rates may fluctuate significantly over short periods of time. Currency exchange rates also can be affected unpredictably by intervention (or the failure to intervene) by U.S. or foreign governments or central banks or by currency controls or political developments in the United States or abroad.
Because foreign issuers generally are not subject to uniform accounting, auditing and financial reporting standards, practices and requirements comparable to those applicable to U.S. companies, there may be less publicly available information about a foreign company than about a U.S. company. Volume and liquidity in most foreign securities and debt markets are less than in the United States and the securities and debts of many foreign companies are less liquid and more volatile than securities of comparable U.S. companies. The securities and debts of foreign issuers may be listed on foreign exchanges or traded in foreign OTC markets. There is generally less government supervision and regulation of foreign exchanges, brokers, dealers and listed and unlisted companies than in the United States, and the legal remedies for investors may be more limited than the remedies available in the United States.
The Fund may invest in countries with emerging economies or securities markets. Political and economic structures in many of such countries may be undergoing significant evolution and rapid development, and such countries may lack the social, political and economic stability characteristic of more developed countries. Certain of such countries have in the past failed to recognize private property rights and have at times nationalized or expropriated the assets of, or ignored internationally accepted standards of due process against, private companies.
NOTE 11 — Subsequent Events
Subsequent events after the date of the Financial Statements have been evaluated through the date the financial statements were available to be issued.
The Fund completed a quarterly repurchase offer which resulted in 191,904 and 87,773 Fund Class I and Class C Shares, respectively being purchased for $5,095,047 and $2,284,742.
The Fund made an additional $31,399,654 in investments. The Fund also invested in total return swap transactions with a notional amount of $1,482,588.
Management has determined that there were no other subsequent events to report through the issuance of these financial statements.
| Semi-Annual Report | March 31, 2022 | 41 |
| CIM Real Assets & Credit Fund | Additional Information |
March 31, 2022 (Unaudited)
PROXY VOTING POLICIES AND VOTING RECORD
A description of the policies and procedures that the Fund uses to vote proxies relating to portfolio securities is available without charge upon request by calling toll-free 855-747-9559, or on the Securities and Exchange Commission’s (“SEC”) website at http://www.sec.gov. Information regarding how the Fund voted proxies relating to portfolio securities during the most recent 12-month period ended June 30th is available without charge upon request by calling toll-free 855-747-9559, or on the SEC’s website at http://www.sec.gov.
QUARTERLY PORTFOLIO HOLDINGS
The Fund files a complete listing of its portfolio holdings with the SEC as of the first and third quarters of each fiscal year as an exhibit to Form N-PORT. The filings are available upon request by calling 855-747-9559. You may also obtain a copy of each of the filings on the SEC’s website at http://www.sec.gov. Portfolio holdings are available on the Fund’s website.
Quarterly Portfolio Information
The Fund files its complete schedule of portfolio holdings with the SEC for the first and third quarters of each fiscal year as an exhibit to its reports on Form N-PORT. The Fund’s Form N-PORT reports are available on the Commission’s website at http://www.sec.gov. This information is also available free of charge by contacting the Fund by mail at 4700 Wilshire Boulevard, Los Angeles, CA, 90010, by telephone at (323) 860-7421 or on our website at https://www.cimgroup.com/investment-platforms/credit/racr.
Proxy Voting Records
Information regarding how the Adviser, or the Sub-Advisers, when applicable, voted proxies relating to the Fund’s portfolio securities is available: (1) without charge, upon request, by calling (323) 860-7421; and (2) on the SEC’s website at http://www.sec.gov. Information about how the Adviser, or the Sub-Advisers, when applicable voted proxies with respect to the Companies portfolio securities during the most recent period ended June 30, 2021 can be obtained by making a written request for proxy voting information to: CIM Capital IC Management, LLC, 4700 Wilshire Boulevard, Los Angeles, CA, 90010
| 42 | https://www.cimgroup.com/public-investment-programs/current-public-programs/racr |
| CIM Real Assets & Credit Fund | Board Approval of the Advisory Agreements |
March 31, 2022 (Unaudited)
On February 16, 2022, the Board, including a majority of Trustees who are not “interested persons” within the meaning of Section 2(a)(19) of the Investment Company Act (the “Independent Trustees”), unanimously approved the renewal of the Investment Advisory Agreement, the Investment Sub-Advisory Agreement, the CIM Investment Sub-Advisory Agreement, the OFS Investment Sub-Advisory Agreement, the REIT Subsidiary Investment Advisory Agreement and the REIT Subsidiary Investment Sub-Advisory Agreement (collectively, the “Advisory Agreements”). In reliance on certain relief granted by the SEC in connection with the ongoing COVID-19 pandemic, the Board approved the renewals of these agreements at a meeting held by videoconference.
When considering whether to approve the renewal of these agreements, the Board considered the following factors with respect to each agreement:
| | a) | Nature, Extent and Quality of Services. The Board examined the nature, extent and quality of the services provided and to be provided by the Advisers to the Fund under the Advisory Agreements. The Board considered the Advisers’ business operations; the Advisers’ investment management processes; the Advisers’ experience advising affiliated funds and other accounts; the experience and capability of the Advisers’ senior management and other key personnel; and the quality of the Advisers’ compliance programs. The Board considered the Adviser’s and the CIM Sub-Adviser’s experience advising affiliated funds and other accounts; and the OFS Sub-Adviser’s experience in managing clients with credit strategies similar to those of the Fund. In addition to investment management services, the Board also considered the nature, extent, and quality of administrative, compliance, and legal services that would be, and had been, provided by, or arranged to be provided by, the Advisers. The Board also considered the procedures in place to track the Advisers’ allocation of time between the Fund and other clients. The Board concluded that the nature, extent and quality of the services provided by the Advisers under the Advisory Agreements would benefit the Fund. |
| | b) | Investment Performance. The Board reviewed investment performance by considering the Fund’s performance compared to the performance of other funds with similar investment objectives and policies. The Board concluded that the Fund was performing as expected. |
| | c) | Fees and Expenses. The Board compared the Advisers’ fees to the fees of other funds with similar investment strategies as the Fund. The Board noted other fees that may be received by affiliates of the Adviser in connection with property management services provided to real properties owned by the Fund. After discussion, the Board concluded that the Advisers’ fees were acceptable considering the quality of the services the Fund expects to receive from the Adviser and the level of fees paid by similar funds. |
| | d) | Profitability. The Board considered the anticipated profits realized, and that may be realized by the Advisers under the Advisory Agreements, and whether the amount of profit is a fair profit for the services to be provided under the Agreement. The Board remarked that at current asset levels, the advisory fees received by the Advisers for the management of the Fund did not provide the Advisers with any profit. |
| | e) | Economies of Scale. The Board considered whether the Advisers would realize economies of scale with respect to the services to be provided to the Fund. It was the consensus of the Board that based on the projected size of the Fund, economies of scale was not a relevant consideration at this time. |
| | f) | Collateral Benefits. The Board considered whether the Advisers or their affiliates may receive other benefits as a result of their relationship with the Fund and determined that any reputational benefits that the Advisers might experience were reasonable. |
| Semi-Annual Report | March 31, 2022 | 43 |
| CIM Real Assets & Credit Fund | Privacy Policy |
March 31, 2022 (Unaudited)
PRIVACY STATEMENT
CIM Group® (CIM®) and its affiliates are committed to maintaining the confidentiality of your personal and financial information. Your privacy is very important to us. The Data Privacy Notice below for Investors sets forth our policies with respect to personal information (“personal data”) about our investors and prospective and former investors. The Data Privacy Notice below for Investors applies to you if you are an investor in our funds, and it may be changed at any time, provided a notice of any material change is given to you. We will treat personal data you provide to us in accordance with the terms of the Data Privacy Notice that exists at the time you provide the personal information, or any other terms to which you consent with respect to that information.
We seek to safeguard your private information and, to that end, restrict access to the personal information we process about you to those employees and other persons who need to know the information to enable us to provide services to you. We also maintain physical, electronic and procedural safeguards to help protect your non-public personal information.
If you have any questions or complaints regarding our policies or practices regarding the treatment of your personal information, please contact us at 1-833-687-3621 or email us at privacy@ cimgroup.com. If you need access to this privacy policy in a different format for accessibility reasons, please contact us at privacy@cimgroup.com.
DATA PRIVACY NOTICE FOR INVESTORS
1. Why are you seeing this notice?
| ● | You have provided or may provide personal information – “personal data” – to us as part of your investment into a CIM investment opportunity (including alternative investments vehicles, parallel funds and/or feeder funds, the “Fund”). |
| ● | We want you to understand how and why we use, store, disclose and otherwise process your information when you deal with us or our relevant affiliates. |
| ● | This Data Privacy Notice also contains information about your rights in relation to your “personal data.” |
Please read the information below carefully. It explains how and why personal data is processed by us.
2. Who is providing this notice?
The Fund is committed to protecting and respecting your privacy.
The Fund-related entities on whose behalf this privacy statement is made are: (i) the Fund; (ii) the General Partner, (iii) the Managers, and (iv) CIM Group, LLC (“CIM” and together with the Fund, the General Partner and the Manager, the “Fund Parties”).
Where we use the terms “we”, “us” and “our” in this Data Privacy Notice, we are referring to the Fund and the Fund Parties.
When you provide (or have provided) us with your personal data, the Fund acts as a “data controller”. In simple terms, this means that:
| ● | we “control” the personal data that you have provided – including endeavoring to make sure that it is kept secure |
| ● | we make certain decisions on how to use, disclose and protect your personal data – but only to the extent that we have informed you about the use or disclosure, or are otherwise permitted by law |
3. What information do we collect about you?
The types of personal data we process, hold and share depends on the product or service you have with us and the nature of your investment. This information can include or be related to:
| ● | name and contact details (including telephone number, email address and residential address) |
| ● | passport details and/or driver’s license details and/or other identification details |
| ● | social security number, national insurance number or tax identification number |
| ● | assets and investment experience |
| ● | risk tolerance and transaction history |
| 44 | https://www.cimgroup.com/public-investment-programs/current-public-programs/racr |
| CIM Real Assets & Credit Fund | Privacy Policy |
March 31, 2022 (Unaudited)
| ● | details about your investment activity or retirement portfolio(s) |
| ● | bank accounts details including account balances, payments made with respect to the account, proceeds from the sale or redemption of property paid or credited to the account and details of bank accounts held at other institutions |
| ● | details of assets held and the income generated with respect to such assets |
| ● | other financial information include income, employment information details |
| ● | commercial information, including records of personal property |
| ● | education or other professional information |
| ● | any other information required by applicable laws |
The personal data collected about you help us to provide you with a better service and facilitate our business relations, and to carry out the purposes we identify in this Privacy Notice, or otherwise disclose to you.
| ● | We may combine personal data you provide, or have provided, to us with personal data that we have collected from (or about you) in some circumstances. |
| ● | This will include information collected in an online or offline context. |
4. Where do we obtain your personal data?
We collect, and have collected, information about you from a number of sources, including from you directly and from others. You consent to our collection of personal data from third parties as described in this section:
| 1. | Information that you give us |
| ● | from the subscription agreement and any associated documentation that you completed when you subscribed for an investment. |
| ● | when you provide, or provided, it to us in correspondence and conversations |
| ● | when you have made / make transactions with respect to the Fund |
| ● | when you purchase, or have purchased, securities from us and/ or tell us where to send money |
| 2. | Information we obtain from others |
| ● | publicly available and accessible directories and sources |
| ● | tax authorities, including those that are based outside the jurisdiction where you are located if you are subject to tax in another jurisdiction |
| ● | governmental and competent regulatory authorities to whom we have regulatory obligations |
| ● | fraud prevention and detection agencies and organizations |
| ● | third parties acting on your behalf, including business partners, advisers and attorneys |
5. Why do we process your personal data?
We process your personal data for the following reasons:
It is necessary to perform our contract with you to:
| ● | administer, manage and set up your investor account(s) to allow you to purchase your holding (of interests) in the Fund |
| ● | meet the resulting contractual obligations we have to you |
| ● | facilitate the continuation or termination of the contractual relationship between you and the Fund |
| ● | facilitate the transfer of funds, and administering and facilitating any other transaction, between you and the Fund |
| Semi-Annual Report | March 31, 2022 | 45 |
| CIM Real Assets & Credit Fund | Privacy Policy |
March 31, 2022 (Unaudited)
It is necessary for compliance with an applicable legal or regulatory obligation to which we are subject to:
| ● | undertake our client and investor due diligence, and on- boarding checks |
| ● | carry out verification, know your client (KYC), terrorist financing and anti-money laundering checks |
| ● | verify the identity and addresses of our investors (and, if applicable their beneficial owners) |
| ● | comply with requests from regulatory, governmental, tax and law enforcement authorities |
| ● | surveillance and investigation |
| ● | maintain statutory registers |
| ● | prevent and detect fraud |
| ● | comply with the U.S Office of Foreign Assets Control list and other governmental sanctions lists |
| 3. | Our legitimate interests |
For our legitimate interests or those of a third party. Where legitimate interests are not a basis on which personal data may be processed, you consent to our processing your personal data for these purposes.
We process your personal data on this basis to:
| ● | manage and administer your holding of interests in the Fund, and any related accounts on an ongoing basis |
| ● | assess and process any applications or requests made by you |
| ● | open, maintain or close accounts in connection with your investment in, or redemption from, the Fund scheme |
| ● | send updates, information and notices or otherwise correspond with you in connection with your investment in the Fund scheme |
| ● | address or investigate any complaints, claims, proceedings or disputes |
| ● | provide you with, and inform you about, our investment products and services |
| ● | monitor and improve our relationships with investors |
| ● | send direct marketing communications to you |
| ● | comply with applicable regulatory obligations |
| ● | manage our risk and operations |
| ● | comply with our accounting and tax reporting requirements; |
| ● | comply with our audit requirements |
| ● | assist with internal compliance with our policies and process |
| ● | ensure appropriate group management and governance |
| ● | keep our internal records |
| ● | prepare reports on incidents / accidents |
| ● | protect our business against fraud, breach of confidence, theft of proprietary materials, and other financial or business crimes (to the extent that this is not required of us by law) |
| ● | analyze and manage commercial risks |
| ● | seek professional advice, including legal advice |
| ● | enable any actual or proposed assignee or transferee, participant or sub-participant of the partnership’s or Fund vehicles’ rights or obligations to evaluate proposed transactions |
| ● | facilitate business asset transactions involving the Fund partnership or Fund-related vehicles |
| ● | monitor communications to/from us using our systems |
| ● | protect the security and integrity of our IT systems |
We only rely on these interests where we have considered that, on balance, our legitimate interests are not overridden by your interests, fundamental rights or freedoms.
| 46 | https://www.cimgroup.com/public-investment-programs/current-public-programs/racr |
| CIM Real Assets & Credit Fund | Privacy Policy |
March 31, 2022 (Unaudited)
Direct marketing as described at (3) above
We process your personal data for direct marketing purposes:
| ● | to provide you with information, products and services that may be of interest to you in the context of the investment-related activities |
| ● | when raising investments into our funds |
| ● | in connection with future fundraising activities |
You have a right at any time to stop us from contacting you for marketing purposes.
If you object to the processing of your personal data for direct marketing purposes, we will stop using your personal data for these purposes. If you no longer wish to be contacted for marketing purposes, please contact us – please see section 16 below for our contact information.
Monitoring as described at (3) above
We monitor communications where the law requires us to do so. We will also monitor where we are required to do so to comply with our regulatory rules and practices and, where we are permitted to do so, to protect our business and the security of our systems.
6. Who we share your personal data with?
Your personal data will be shared with:
Fund associates
We share your personal data with our associates, related parties and members of our group. This is for the purposes:
| ● | of managing our relationship with you |
| ● | set out in this Data Privacy Notice |
Fund Managers, Depositories, Administrators, Custodians, Investment Advisors
| ● | of delivering the services you |
| ● | require of managing your investment |
| ● | of supporting and administering investment-related activities |
| ● | of complying with applicable investment laws and regulations |
Tax Authorities
| ● | of complying with applicable laws and regulations |
| ● | of complying with any EEA or other applicable tax authorities instructions (who, in turn, may share your personal data with foreign tax authorities) |
| ● | of complying with any foreign tax authorities’ instructions, including tax authorities outside of the EEA |
Service Providers
| ● | of delivering and facilitating the services needed to support our business relationship with you |
| ● | of supporting and administering investment-related activities |
Our lawyers, auditors, other professional advisors, law enforcement, and other regulatory authorities
| ● | of providing you with investment-related services |
| ● | of complying with applicable legal and regulatory requirements |
In exceptional circumstances, we will share your personal data with:
| ● | competent regulatory, prosecuting and other governmental or non-governmental agencies and/or regulators or litigation counterparties including fraud prevention agencies, in any country or territory |
| Semi-Annual Report | March 31, 2022 | 47 |
| CIM Real Assets & Credit Fund | Privacy Policy |
March 31, 2022 (Unaudited)
| ● | any third party that acquires, or is interested in acquiring all or part of any of the Fund Parties’ assets or shares or that succeeds any of the Fund Parties in carrying on all or a party of its business, whether by merger, acquisition, reorganization or otherwise |
| ● | other organizations and agencies as required or permitted by law, including to comply with a subpoena or similar legal process or government request, or when the Fund Parties believe in good faith that disclosure is legally required or the Fund Parties have a legitimate interest in marking a disclosure, such as where necessary to protect the Fund Parties’ rights and property |
7. Do you have to provide us with this personal data?
Where we collect personal data from you, we will indicate if:
| ● | provision of the personal data is necessary for our compliance with a legal obligation or the provision of our services; or |
| ● | it is purely voluntary and there are no implications for you if you do not wish to provide us with it. |
Unless otherwise indicated, you should assume that we require the personal data we request for business and/or compliance purposes.
Some of the personal data we request, or have requested, is necessary for us to perform our contract with you or to comply with anti-money laundering or other legal requirements. If you do not wish for us to process this personal data, it will affect our ability to manage our business relationship with you and, ultimately, may result in the Fund Parties not being able to accept you as an investor or terminating its relationship with you.
8. Consent – and your right to withdraw it
Subject to legal and contractual restrictions, you have the right to withdraw consent at any time. Please contact us at 1-833-687-3621 or email us at privacy@cimgroup.com at any time if you wish to do so. Please note that if you wish to withdraw consent that is necessary for our ability to manage our business relationship with you and, ultimately, may result in the Fund Parties not being able to accept you as an investor or terminating its relationship with you.
9. Personal data from minors
We do not offer financial services and products to minors and do not intend to collect personal information from children under the age of 16. We follow all local legal requirements with respect to the collection and processing of a minor’s personal information.
10. Retention and deletion of your information
We keep your personal data for as long as it is required by us for our legitimate business purposes, to perform our contractual obligations, or where longer, such longer period as is required by law or regulatory obligations which apply to us.
| ● | We will generally retain information about you throughout the life cycle of any investment you are involved in |
| ● | Some personal information will be retained after your relationship with us ends |
11. Your GDPR rights
Individuals located in the EU may have certain data protection rights, including:
| ● | the right to access your personal data |
| ● | the right to restrict the use of your personal data |
| ● | the right to have incomplete or inaccurate data corrected |
| ● | the right to ask us to stop processing your personal data |
| ● | the right to require us to delete your personal data in some limited circumstances |
| ● | the right to request information, with respect to our practices within the 12 months prior to your request, regarding the specific personal data we have collected from you, the sources from which we obtained it, the purposes for which we collected, used and shared the personal data, and the categories of third parties with whom we have shared it. |
You also have a right to object to processing of your personal data where that processing is carried out for our legitimate interest or for direct marketing.
| 48 | https://www.cimgroup.com/public-investment-programs/current-public-programs/racr |
| CIM Real Assets & Credit Fund | Privacy Policy |
March 31, 2022 (Unaudited)
You also have the right in some circumstances to request for us to “port” your personal data in a portable, re-usable format to other organizations (where this is possible).
You also have the right to lodge a complaint about the processing of your personal data with your local data protection authority.
You may exercise your right to make these requests/objections by contacting us at 1-833-687-3621 or emailing us at privacy@cimgroup.com.
12. Your CCPA rights
Residents of California may have certain data protection rights relating to certain personal information, including:
| ● | the right to disclosure of personal data collected and processed |
| ● | the right to “opt-out” of personal data to be sold |
| ● | the right to require us to delete your personal data in some limited circumstances |
Nonpublic information of individual consumer investors is subject to the Gramm-Leach-Bliley Act and the disclosures in the main section of this notice.
Your Right to Request Disclosure of Information We Collect and Share about You
If you are a California resident, the CCPA grants you the right to request certain information about our practices with respect to personal information. In particular, you can request the following:
| 1. | The categories of your personal information that we’ve collected. |
| 2. | The specific pieces of your personal information that we’ve collected. |
| 3. | The categories of sources from which we collected personal information. |
| 4. | The business or commercial purposes for which we collected or sold personal information. |
| 5. | The categories of third parties with which we shared personal information. |
You can submit a request to us for the following additional information:
| 1. | The categories of third parties to whom we’ve sold personal information, and the category or categories of personal information sold to each. |
| 2. | The categories of personal information that we’ve shared with service providers who provide services for us, like processing your bill. |
To exercise your CCPA rights with request to this information, contact us at 1-833-687-3621 or email us at privacy@cimgroup.com at any time.
Your Right to Request the Deletion of Personal Information
Upon your request, we will delete the personal information we have collected about you, except for situations when that information is necessary for us to: provide you with a product or service that you requested; perform a contract we entered into with you; maintain the functionality or security of our systems; comply with or exercise rights provided by the law; or use the information internally in ways that are compatible with the context in which you provided the information to us, or that are reasonably aligned with your expectations based on your relationship with us.
To exercise your right to request the deletion of your personal information, Please contact us at 1-833-687-3621 or email us at privacy@cimgroup.com at any time if you wish to do so.
Your Right to Ask Us Not to Sell Your Personal Information
We do not, and will not, sell your personal information.
Our Support for the Exercise of Your Data Rights
We are committed to providing you control over your personal information. If you exercise any of these rights explained in this section of the Privacy Policy, we will not disadvantage you. You will not be denied or charged different prices or rates for goods or services or provided a different level or quality of goods or services.
| Semi-Annual Report | March 31, 2022 | 49 |
| CIM Real Assets & Credit Fund | Privacy Policy |
March 31, 2022 (Unaudited)
How We Will Handle a Request to Exercise Your Rights
For requests for access or deletion, we will first acknowledge receipt of your request. We will provide a substantive response to your request as soon as we can, generally within 45 days from when we receive your request, although we may be allowed to take longer to process your request under certain circumstances. If we expect your request is going to take us longer than normal to fulfil, we’ll let you know.
When you make a request to access or delete your personal information, we will take steps to verify your identity. These steps may include asking you for personal information, such as your name, address, or other information we maintain about you. If we are unable to verify your identity with the degree of certainty required, we will not be able to respond to the request. We will notify you to explain the basis of the denial.
You may also designate an authorized agent to submit requests on your behalf. If you do so, you will be required to verify your identity by providing us with certain personal information as described above. Additionally, we will also require that you provide the agent with written permission to act on your behalf, and we will deny the request if the agent is unable to submit proof to us that you have authorized them to act on your behalf.
You may exercise your right to make these requests/objections by contacting us at 1-833-687-3621 or emailing us at privacy@ cimgroup.com. These requests for disclosure are generally free.
13. Canadian Privacy Rights
If you are in Canada, you have a right to request access to your personal information and to request a correction to it if you believe it is inaccurate. If you would like to access the personal information we hold regarding you, or if you would like to have it corrected, please contact us using the contact information provided below. Please note; however, that in some cases we may not be able to allow you to access certain personal information in certain circumstances, for example if it contains personal information of other persons, or for legal reasons.
When you make a request to access or delete your personal information, we will take steps to verify your identity. These steps may include asking you for personal information, such as your name, address, or other information we maintain about you. If we are unable to verify your identity with the degree of certainty required, we will not be able to respond to the request. We will notify you to explain the basis of the denial.
You may exercise your right to make these requests by contacting us at 1-833-687-3621 or emailing us at privacy@cimgroup.com.
For information on withdrawing your consent to the processing of your personal information, please see sections 6 and 8 above.
Please note that some or all of the personal information we collect may be stored or processed on servers located outside Canada and your jurisdiction of residence, including in the United States, whose data protection laws may differ from the jurisdiction in which you live. As a result, this information may be subject to access requests from governments, courts, or law enforcement in those jurisdictions according to laws in those jurisdictions.
14. Concerns, complaints or queries
We take your concerns very seriously. We encourage you to bring to our attention any concerns or complaints you may have about our processing your personal data.
This Data Privacy Notice was drafted with simplicity and clarity in mind. We are, of course, happy to provide any further information or explanation needed. Our contact details are below.
15. Security
Fund Parties implement and maintain security intended to protect personal information that we collect, use, retain, transfer or otherwise process, and will take reasonable steps to help protect your personal data against loss or theft, as well as from unauthorized access, disclosure, copying, use or modification, regardless of the format in which it is held. Personal information may be accessed by persons within our organization, or our third party service providers, who require such access to carry out the purposes indicated in this privacy notice, or such other purposes as may be permitted or required by the applicable law. Personal information we collect is maintained by us in the United States at Los Angeles, CA, San Francisco, CA, Franklin Park, IL and Redmond, WA. The location of personal information collected and/or maintained by our third party service providers is available upon request.
| 50 | https://www.cimgroup.com/public-investment-programs/current-public-programs/racr |
| CIM Real Assets & Credit Fund | Privacy Policy |
March 31, 2022 (Unaudited)
While we are committed to developing, implementing, maintaining, monitoring and updating a reasonable information security program, unfortunately, no data transmission over the Internet or any wireless network can be guaranteed to be 100% secure. Data security incidents and breaches can occur due to vulnerabilities, criminal exploits or other factors that cannot reasonably be prevented. Accordingly, while our security program is designed to manage data security risks and thus help prevent data security incidents and breaches, it cannot be assumed that the occurrence of any given incident or breach results from our failure to implement and maintain reasonable security. As a result, while we strive to protect your personal information, you acknowledge that: (a) there are security and privacy limitations which are beyond our control; (b) the security, integrity, and privacy of any and all information and data exchanged between you and us, including without limitation through the website, cannot be guaranteed; and (c) any such information and data may be viewed or tampered with by a third party.
16. Transfer of PII from the EU (or EEA, Switzerland) to the US and/or Other Countries
Your personal information may be transferred, processed and/ or stored in a country other than the one in which your personal information is collected. When transferring your personal information to the US or other countries, we have implemented procedures to ensure that appropriate safeguards are in place to protect the personal information regardless of where it is being transferred to.
17. Contact us
Please contact us if you have any questions about this Data Privacy Notice or the personal data we hold about you by calling 1-833-687-3621 or emailing us at privacy@cimgroup.com. You may also contact our Deputy Chief Compliance Officer at CIM Group, 4700 Wilshire Boulevard, Los Angeles, California, 90010.
18. Changes to this Data Privacy Notice
We keep this Data Privacy Notice under regular review. We reserve the right to update or otherwise amend this Data Privacy Notice at any time, but we will treat personal data that you provide to us before we make any such updates or amendments in accordance with the terms of this Data Privacy Notice, unless and until you agree with the application of the revised Privacy Notice’s terms to your personal information collected by us prior to the updates or amendments.
This Data Privacy Notice was last updated in September 2021.
| Semi-Annual Report | March 31, 2022 | 51 |

Item 2. Code of Ethics.
Not applicable to semi-annual report on Form N-CSR.
Item 3. Audit Committee Financial Expert.
Not applicable to semi-annual report on Form N-CSR.
Item 4. Principal Accountant Fees and Services.
Not applicable to semi-annual report on Form N-CSR.
Item 5. Audit Committee of Listed Registrants.
Not applicable to semi-annual report on Form N-CSR.
Item 6. Investments.
| (a) | The Registrant’s full schedule of investments is included as part of the semi-annual report to stockholders included in Item 1 of this Form N-CSR. |
| Item 7. | Disclosure of Proxy Voting Policies and Procedures for Closed-End Management Investment Companies. |
Not applicable to semi-annual report on Form N-CSR.
| Item 8. | Portfolio Managers of Closed-End Management Investment Companies. |
| (a) | Not applicable to semi-annual report on Form N-CSR. |
| (b) | There has been no change, as of the date of the filing of this semi-annual report on Form N-CSR, to any of the portfolio managers identified in response to paragraph (a)(1) of this item in the Registrant's most recent annual report on Form N-CSR. |
Item 9. Purchases of Equity Securities by Closed-End Management Investment Company and Affiliated Purchasers.
No such purchases were made by or on behalf of the Registrant during the period covered by this semi-annual report on Form N-CSR.
Item 10. Submission of Matters to a Vote of Security Holders.
There were no material changes to the procedures by which the Registrant’s shareholders may recommend nominees to the Registrant’s board of trustees during the period covered by this semi-annual report on Form N-CSR.
Item 11. Controls and Procedures.
(a) The Registrant’s Principal Executive Officer and Principal Financial Officer have concluded that the Registrant's disclosure controls and procedures (as defined in Rule 30a-3(c) under the Investment Company Act of 1940, as amended (the “1940 Act”) (17 CFR 270.30a-3(c))) are effective, as of a date within 90 days of the filing date of the report that includes the disclosure required by this paragraph, based on their evaluation of these controls and procedures required by Rule 30a-3(b) under the 1940 Act (17 CFR 270.30a-3(b)) and Rules 13a-15(b) or 15d-15(b) under the Securities Exchange Act of 1934, as amended (17 CFR 240.13a-15(b) or 240.15d-15(b)).
(b) There were no changes in the Registrant’s internal control over financial reporting (as defined in Rule 30a-3(d) under the 1940 Act (17 CFR 270.30a-3(d)) that occurred during the period covered by this report that has materially affected, or is reasonably likely to materially affect, the Registrant’s internal control over financial reporting.
Item 12. Disclosure of Securities Lending Activities for Closed-End Management Investment Companies.
Item 13. Exhibits.
SIGNATURES
Pursuant to the requirements of the Securities Exchange Act of 1934 and the Investment Company Act of 1940, the Registrant has duly caused this report to be signed on its behalf by the undersigned, thereunto duly authorized.
CIM REAL ASSETS & CREDIT FUND
| By: | /s/ David Thompson | |
| | David Thompson | |
| | Chief Executive Officer and Trustee (Principal Executive Officer) |
Pursuant to the requirements of the Securities Exchange Act of 1934 and the Investment Company Act of 1940, this report has been signed below by the following persons on behalf of the Registrant and in the capacities and on the dates indicated.
| By: | /s/ David Thompson | |
| | David Thompson | |
| | Chief Executive Officer and Trustee (Principal Executive Officer) |
| By: | /s/ Nathan D. DeBacker | |
| | Nathan D. DeBacker | |
| | Chief Financial Officer (Principal Financial Officer) |