UNITED STATES
SECURITIES AND EXCHANGE COMMISSION
Washington, D.C. 20549
FORM N-CSR
CERTIFIED SHAREHOLDER REPORT OF REGISTERED
MANAGEMENT INVESTMENT COMPANIES
Investment Company Act File number: 811-23429
HOMESTEAD FUNDS TRUST
(Exact name of registrant as specified in charter)
4301 Wilson Boulevard
Arlington, VA 22203
(Address of principal executive office – Zip code)
Danielle Sieverling
Homestead Funds Trust
4301 Wilson Boulevard
Arlington, VA 22203
(Name and address of agent for service)
Copies to:
Bryan Chegwidden, Esq.
Ropes & Gray LLP
1211 Avenue of the Americas
New York, NY 10036-8704
(Name and addresses of agent for service)
Registrant’s telephone number, including area code: (703) 907-5993
Date of fiscal year end: December 31
Date of reporting period: June 30, 2019
Item 1. Reports to Stockholders.


| Performance Evaluation | ||
| 2 | ||
| 4 | ||
| 6 | ||
| 8 | ||
| 10 | ||
| 12 | ||
| 14 | ||
| 16 | ||
| 18 | ||
| 20 | ||
| 22 | ||
| Portfolio of Investments | ||
| 29 | ||
| 30 | ||
| 33 | ||
| 41 | ||
| 43 | ||
| 44 | ||
| 46 | ||
| 48 | ||
| 50 |
| 52 | ||
| 54 | ||
| 56 | ||
| Financial Highlights | ||
| 61 | ||
| 62 | ||
| 63 | ||
| 64 | ||
| 65 | ||
| 66 | ||
| 67 | ||
| 68 | ||
| 69 | ||
| 70 | ||
| 78 | ||
| 79 | ||
| 80 |


| Investment Advisor: RE Advisers Corporation | |
 | Marc Johnston, CFP, ChFC, CAIAMoney Market Portfolio ManagerBA, General Arts, Villanova University; MBA, Northeastern University |
| Average Annual Total Returns (periods ended 06/30/19) | ||||||
| 1 YR % | 5 YR % | 10 YR % | ||||
| Daily Income Fund | 1.50 | 0.42 | 0.22 | |||
| Yield | ||
| Annualized 7-day current yield quoted 6/30/19 | 1.62% | |
| Security Diversification | ||
| % of Total Investments | ||
| as of 12/31/18 | as of 6/30/19 | |
| U.S. government and agency obligations | 94.4 | 85.1 |
| Short-term and other assets* | 5.6 | 14.9 |
| Total | 100.0% | 100.0% |
| Maturity | ||||
| as of 12/31/18 | as of 06/30/19 | |||
| Average weighted maturity | 39 days | 32 days | ||
| Investment Advisor: RE Advisers Corporation | |
 | Mauricio Agudelo, CFASenior Fixed Income Portfolio ManagerBS, Finance, The University of Maryland, Robert H. Smith School of Business |
 | Ivan Naranjo, CFA, FRMFixed Income Portfolio ManagerBS, Finance, The University of Maryland, Robert H. Smith School of Business |
| Average Annual Total Returns (periods ended 06/30/19) | ||||||
| 1 YR % | 5 YR % | 10 YR % | ||||
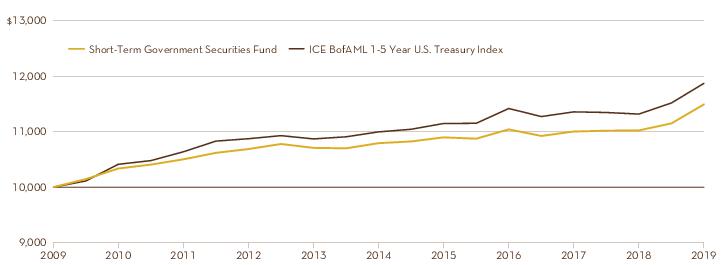
| Short-Term Government Securities Fund | 3.59 | 1.13 | 1.33 | |||
| ICE BofAML 1-5 Year U.S. Treasury Index | 4.89 | 1.54 | 1.73 | |||
| Security Diversification | ||
| % of Total Investments | ||
| as of 12/31/18 | as of 6/30/19 | |
| U.S. government and agency obligations | 58.1 | 66.3 |
| Corporate bonds–government guaranteed | 21.3 | 25.4 |
| Corporate bonds–other | 8.4 | 3.2 |
| Asset-backed securities | 3.4 | 2.0 |
| Certificates of deposit | 1.5 | 0.6 |
| Mortgage-backed securities | 2.2 | 0.1 |
| Municipal bonds | 0.3 | 0.0 |
| Short-term and other assets | 4.8 | 2.4 |
| Total | 100.0% | 100.0% |
| Maturity | ||||
| as of 12/31/18 | as of 06/30/19 | |||
| Average weighted maturity | 1.71 | 2.08 | ||
| Investment Advisor: RE Advisers Corporation | |
| Mauricio Agudelo, CFASenior Fixed Income Portfolio ManagerBS, Finance, The University of Maryland, Robert H. Smith School of Business |
| Ivan Naranjo, CFA, FRMFixed Income Portfolio ManagerBS, Finance, The University of Maryland, Robert H. Smith School of Business |
| Average Annual Total Returns (periods ended 06/30/19) | ||||||
| 1 YR % | 5 YR % | 10 YR % | ||||
| Short-Term Bond Fund | 3.97 | 1.73 | 3.01 | |||
| ICE BofAML 1-5 Year Corp./Gov. Index | 5.37 | 1.85 | 2.31 | |||
| Security Diversification | ||
| % of Total Investments | ||
| as of 12/31/18 | as of 6/30/19 | |
| U.S. government and agency obligations | 11.4 | 43.3 |
| Corporate bonds–other | 37.4 | 24.9 |
| Asset-backed securities | 21.7 | 14.7 |
| Yankee bonds | 10.3 | 7.6 |
| Municipal bonds | 14.5 | 5.7 |
| Mortgage-backed securities | 0.8 | 0.2 |
| Corporate bonds–government guaranteed* | 0.0 | 0.0 |
| Short-term and other assets | 3.9 | 3.6 |
| Total | 100.0% | 100.0% |
| Maturity | ||||
| as of 12/31/18 | as of 06/30/19 | |||
| Average weighted maturity | 1.52 | 2.19 | ||

| Investment Advisor: RE Advisers Corporation | |
| Mauricio Agudelo, CFASenior Fixed Income Portfolio ManagerBS, Finance, The University of Maryland, Robert H. Smith School of Business |
| Ivan Naranjo, CFA, FRMFixed Income Portfolio ManagerBS, Finance, The University of Maryland, Robert H. Smith School of Business |
| Aggregate Since Inception Return (for the period 05/01/19 to 06/30/19) | ||
| Since Inception 05/01/19 % | ||
| Intermediate Bond Fund | 2.54 | |
| Bloomberg Barclays U.S. Agg Index | 3.03 | |
| Security Diversification | |
| % of Total Investments | |
| as of 6/30/19 | |
| U.S. government and agency obligations | 28.4 |
| Corporate bonds–other | 20.7 |
| Mortgage-backed securities | 19.2 |
| Asset-backed securities | 4.4 |
| Yankee bonds | 1.6 |
| Short-term and other assets | 25.7 |
| Total | 100.0% |
| Maturity | ||
| as of 06/30/19 | ||
| Average weighted maturity | 7.09 | |

| Average Annual Total Returns (periods ended 06/30/19) | ||||||
| 1 YR % | 5 YR % | 10 YR % | ||||
| Stock Index Fund | 9.77 | 10.11 | 14.08 | |||
| Standard & Poor’s 500 Stock Index | 10.42 | 10.71 | 14.70 | |||
| Sector Diversification | ||
| % of Total Investments as of 6/30/19 | ||
| Information technology | 21.2 | |
| Health care | 13.9 | |
| Financials | 13.0 | |
| Consumer discretionary | 10.0 | |
| Communication services | 10.0 | |
| Industrials | 9.3 | |
| Consumer staples | 7.1 | |
| Energy | 4.9 | |
| Utilities | 3.3 | |
| Real estate | 3.0 | |
| Materials | 2.8 | |
| Short-term and other assets | 1.5 | |
| Total | 100.0% | |
| Top 10 Equity Holdings | ||
| % of Total Investments as of 6/30/19 | ||
| Microsoft Corp. | 4.1 | |
| Apple, Inc. | 3.5 | |
| Amazon.com, Inc. | 3.2 | |
| Alphabet, Inc. | 2.6 | |
| Facebook, Inc. | 1.9 | |
| Berkshire Hathaway, Inc. | 1.7 | |
| Johnson & Johnson | 1.5 | |
| JPMorgan Chase & Co. | 1.5 | |
| Exxon Mobil Corp. | 1.3 | |
| Visa Inc. | 1.2 | |
| Total | 22.5% | |

| Investment Advisor: RE Advisers Corporation | |
 | Prabha Carpenter, CFASenior Equity Portfolio ManagerBA, Economics, University of Madras; MBA with distinction in Finance and BS in Business Economics, The American University |
 | Jim Polk, CFASenior Equity Portfolio ManagerBA, English, Colby College; MBA, The Olin Graduate School of Business at Babson College |
| Average Annual Total Returns (periods ended 06/30/19) | ||||||
| 1 YR % | 5 YR % | 10 YR % | ||||
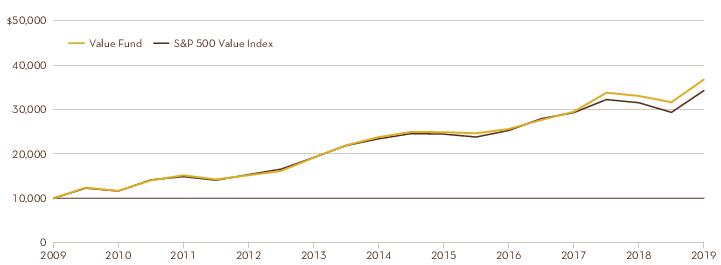
| Value Fund | 11.19 | 9.10 | 13.90 | |||
| Standard & Poor’s 500 Value Index | 8.67 | 7.92 | 13.10 | |||
| Sector Diversification | ||
| % of Total Investments as of 6/30/19 | ||
| Health care | 23.0 | |
| Information technology | 21.7 | |
| Financials | 15.8 | |
| Industrials | 12.1 | |
| Energy | 10.0 | |
| Materials | 8.8 | |
| Communication services | 5.3 | |
| Consumer discretionary | 2.6 | |
| Short-term and other assets | 0.7 | |
| Total | 100.0% | |
| Top 10 Equity Holdings | ||
| % of Total Investments as of 6/30/19 | ||
| Microsoft Corp. | 5.3 | |
| Visa Inc. | 5.1 | |
| Parker-Hannifin Corp. | 4.4 | |
| Avery Dennison Corp. | 4.3 | |
| Honeywell International, Inc. | 4.2 | |
| Cisco Systems, Inc. | 4.2 | |
| JPMorgan Chase & Co. | 4.0 | |
| Allstate Corp. | 3.9 | |
| Alphabet, Inc. | 3.9 | |
| Chevron Corp. | 3.9 | |
| Total | 43.2% | |
| Subadvisor: T. Rowe Price Associates | |
 | Taymour Tamaddon, CFAPortfolio ManagerBS, Applied Physics, Cornell University; MBA, Finance, Dartmouth |
| Average Annual Total Returns (periods ended 06/30/19) | ||||||
| 1 YR % | 5 YR % | 10 YR % | ||||
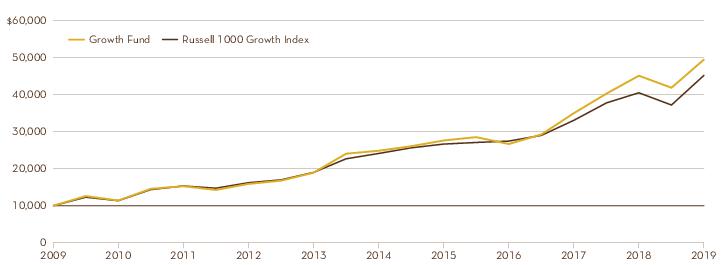
| Growth Fund | 9.63 | 14.76 | 17.33 | |||
| Russell 1000 Growth Index | 11.56 | 13.39 | 16.28 | |||
| Sector Diversification | ||
| % of Total Investments as of 6/30/19 | ||
| Information technology | 30.4 | |
| Consumer discretionary | 19.6 | |
| Communication services | 17.3 | |
| Health care | 15.4 | |
| Industrials | 9.3 | |
| Financials | 3.7 | |
| Utilities | 1.3 | |
| Consumer staples | 0.9 | |
| Energy | 0.5 | |
| Short-term and other assets | 1.6 | |
| Total | 100.0% | |
| Top 10 Equity Holdings | ||
| % of Total Investments as of 6/30/19 | ||
| Amazon.com, Inc. | 8.5 | |
| Microsoft Corp. | 7.1 | |
| Alphabet, Inc. | 6.3 | |
| Facebook, Inc. | 5.6 | |
| Visa Inc. | 5.2 | |
| Boeing Co. | 4.8 | |
| Stryker Corp. | 2.3 | |
| Tencent Holdings Ltd. ADR | 2.3 | |
| Intuit, Inc. | 2.3 | |
| Alibaba Group Holding Ltd. ADR | 2.2 | |
| Total | 46.6% | |
| Investment Advisor: RE Advisers Corporation | |
| Prabha Carpenter, CFASenior Equity Portfolio ManagerBA, Economics, University of Madras; MBA with distinction in Finance and BS in Business Economics, The American University |
| Jim Polk, CFASenior Equity Portfolio ManagerBA, English, Colby College; MBA, The Olin Graduate School of Business at Babson College |
| Average Annual Total Returns (periods ended 06/30/19) | ||||||
| 1 YR % | 5 YR % | 10 YR % | ||||
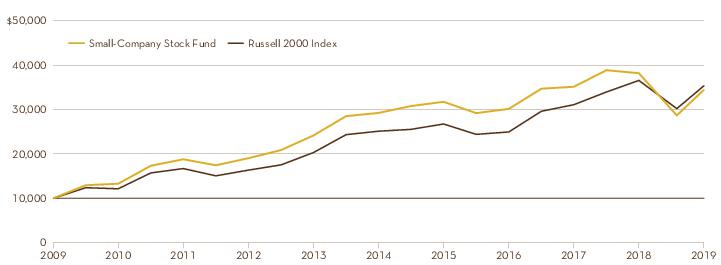
| Small-Company Stock Fund | -9.82 | 3.32 | 13.15 | |||
| Russell 2000 Index | -3.31 | 7.06 | 13.45 | |||
| Sector Diversification | ||
| % of Total Investments as of 6/30/19 | ||
| Financials | 19.8 | |
| Information technology | 19.6 | |
| Industrials | 18.0 | |
| Health care | 13.7 | |
| Consumer discretionary | 12.3 | |
| Materials | 6.1 | |
| Real estate | 1.2 | |
| Energy | 1.1 | |
| Communication services | 1.0 | |
| Consumer staples | 0.7 | |
| Short-term and other assets | 6.5 | |
| Total | 100.0% | |
| Top 10 Equity Holdings | ||
| % of Total Investments as of 6/30/19 | ||
| Core-Mark Holding Company, Inc. | 3.7 | |
| Cracker Barrel Old Country Store, Inc. | 3.6 | |
| Kinsale Capital Group, Inc. | 3.6 | |
| STERIS PLC | 3.5 | |
| j2 Global, Inc | 3.4 | |
| Descartes Systems Group Inc. (The) | 3.2 | |
| Glacier Bancorp, Inc. | 3.2 | |
| Summit Materials, Inc. | 3.0 | |
| Belden Inc. | 2.8 | |
| Welbilt, Inc. | 2.8 | |
| Total | 32.8% | |
| Subadvisor: Harding Loevner LP | |
 | Ferrill D. Roll, CFACo-Lead Portfolio ManagerBA, Economics, Stanford University |
 | Andrew West, CFACo-Lead Portfolio ManagerBS, Business Administration, University of Central Florida MBA, New York University |
| Average Annual Total Returns (periods ended 06/30/19) | ||||||
| 1 YR % | 5 YR % | 10 YR % | ||||
| International Equity Fund* | 1.65 | 3.12 | 6.55 | |||
| MSCI® EAFE® Index | 1.08 | 2.25 | 6.90 | |||
| Country Diversification | ||
| % of Total Investments as of 6/30/19 | ||
| Germany | 15.5 | |
| Japan | 13.9 | |
| Switzerland | 13.2 | |
| Britain | 9.2 | |
| France | 6.9 | |
| Sweden | 6.5 | |
| Spain | 5.3 | |
| United States of America | 4.1 | |
| Hong Kong | 3.7 | |
| Israel | 3.5 | |
| Canada | 3.2 | |
| Singapore | 3.2 | |
| China | 2.2 | |
| Taiwan | 1.0 | |
| India | 1.0 | |
| Denmark | 1.0 | |
| Republic of South Korea | 1.0 | |
| Russia | 0.9 | |
| Brazil, South Africa & Mexico | 1.7 | |
| Short-term and other assets | 3.0 | |
| Total | 100.0% | |
| Top 10 Equity Holdings | ||
| % of Total Investments as of 6/30/19 | ||
| Nestlé SA ADR | 4.6 | |
| SAP SE ADR | 4.2 | |
| Allianz SE REG | 3.9 | |
| AIA Group Ltd. | 3.8 | |
| L’Oréal SA | 3.7 | |
| Roche Holding AG REG | 3.6 | |
| Check Point Software Technologies Ltd. | 3.5 | |
| DBS Group Holdings Ltd. | 3.2 | |
| Atlas Copco AB | 3.0 | |
| Infineon Technologies AG | 2.9 | |
| Total | 36.4% | |

| Daily Income Fund | Beginning Account Value January 1, 2019 | Ending Account Value June 30, 2019 | Expenses Paid During the Perioda | Annualized Expense Ratio for the Period Ended June 30, 2019 |
| Actual Return | $1,000.00 | $1,008.20 | $3.79 | 0.76% |
| Hypothetical Return (5% return before expenses) | $1,000.00 | $1,021.22 | $3.82 | 0.76% |
| Short-Term Government Securities Fundb | ||||
| Actual Return | $1,000.00 | $1,024.10 | $3.77 | 0.75% |
| Hypothetical Return (5% return before expenses) | $1,000.00 | $1,021.28 | $3.76 | 0.75% |
| Short-Term Bond Fund | ||||
| Actual Return | $1,000.00 | $1,028.50 | $3.86 | 0.77% |
| Hypothetical Return (5% return before expenses) | $1,000.00 | $1,021.20 | $3.84 | 0.77% |
| Intermediate Bond Fundb,c | ||||
| Actual Return | $1,000.00d | $1,025.40 | $1.35 | 0.80% |
| Hypothetical Return (5% return before expenses) | $1,000.00 | $1,023.66 | $1.35 | 0.80% |
| Stock Index Funde | ||||
| Actual Return | $1,000.00 | $1,182.50 | $3.13 | 0.58% |
| Hypothetical Return (5% return before expenses) | $1,000.00 | $1,022.13 | $2.90 | 0.58% |
| Value Fund | ||||
| Actual Return | $1,000.00 | $1,161.70 | $3.34 | 0.62% |
| Hypothetical Return (5% return before expenses) | $1,000.00 | $1,021.91 | $3.12 | 0.62% |
| Growth Fund | ||||
| Actual Return | $1,000.00 | $1,181.30 | $4.75 | 0.88% |
| Hypothetical Return (5% return before expenses) | $1,000.00 | $1,020.65 | $4.40 | 0.88% |
| Small-Company Stock Fund | ||||
| Actual Return | $1,000.00 | $1,200.40 | $5.32 | 0.97% |
| Hypothetical Return (5% return before expenses) | $1,000.00 | $1,020.17 | $4.88 | 0.97% |
| International Equity Fundb | ||||
| Actual Return | $1,000.00 | $1,174.50 | $5.33 | 0.99% |
| Hypothetical Return (5% return before expenses) | $1,000.00 | $1,020.10 | $4.95 | 0.99% |
| a. | The dollar amounts shown as “Expenses Paid During the Period” are equal to each Fund’s annualized expense ratio multiplied by the average account value over the period, multiplied by the number of days in the period (61 for Intermediate Bond Fund, 181 for all other Funds), then divided by 365. |
| b. | Reflects fee waiver and expense limitation agreements in effect during the period. |
| c. | The Intermediate Bond Fund's inception date was May 1, 2019. |
| d. | The date of the beginning account value for the actual return is May 1, 2019 for the Intermediate Bond Fund. |
| e. | The Stock Index Fund is a feeder fund that invests substantially all of its assets in a Master Portfolio. The example reflects the expenses of both the feeder fund and the Master Portfolio. |
| U.S. Government & Agency Obligations | 85.1% of portfolio | ||||
| Interest Rate / Yield | Maturity Date | Face Amount | Value | |
| Federal Agricultural Mortgage Corp. | 2.40% | 07/16/19 | $4,000,000 | $3,996,017 |
| Federal Home Loan Bank | 2.40 | 07/03/19 | 4,000,000 | 3,999,469 |
| Federal Home Loan Bank | 2.41 | 07/09/19 | 5,250,000 | 5,247,212 |
| Federal Home Loan Bank | 2.40 | 07/10/19 | 4,000,000 | 3,997,615 |
| Federal Home Loan Bank | 2.23 | 07/19/19 | 2,310,000 | 2,307,436 |
| Federal Home Loan Bank | 2.42 | 07/22/19 | 3,750,000 | 3,744,728 |
| Federal Home Loan Bank | 2.42 | 07/24/19 | 1,750,000 | 1,747,309 |
| Federal Home Loan Bank | 2.41 | 07/26/19 | 3,750,000 | 3,743,750 |
| Federal Home Loan Bank | 2.42 | 07/30/19 | 2,000,000 | 1,996,125 |
| Federal Home Loan Bank | 2.24 | 07/31/19 | 3,500,000 | 3,493,496 |
| Federal Home Loan Bank | 2.42 | 08/02/19 | 3,000,000 | 2,993,600 |
| Federal Home Loan Bank | 2.24 | 08/07/19 | 1,500,000 | 1,496,382 |
| Federal Home Loan Bank | 2.41 | 08/07/19 | 3,500,000 | 3,491,557 |
| Federal Home Loan Bank | 2.38 | 08/09/19 | 4,000,000 | 3,989,730 |
| Federal Home Loan Bank | 2.39 | 08/16/19 | 5,000,000 | 4,984,846 |
| Federal Home Loan Bank | 2.38 | 08/20/19 | 3,750,000 | 3,737,682 |
| Federal Home Loan Bank | 2.37 | 08/23/19 | 3,500,000 | 3,487,839 |
| Federal Home Loan Bank | 2.36 | 08/28/19 | 3,500,000 | 3,486,777 |
| Federal Home Loan Bank | 2.29 | 09/06/19 | 3,750,000 | 3,734,122 |
| Federal Home Loan Bank | 2.23 | 09/11/19 | 3,000,000 | 2,986,680 |
| Federal Home Loan Bank | 2.22 | 09/13/19 | 2,000,000 | 1,990,923 |
| Federal Home Loan Bank | 2.34 | 09/18/19 | 3,000,000 | 2,984,694 |
| Federal National Mortgage Assoc. | 2.38 | 08/14/19 | 3,750,000 | 3,739,160 |
| Federal National Mortgage Assoc. | 2.34 | 08/21/19 | 3,500,000 | 3,488,447 |
| Federal National Mortgage Assoc. | 2.29 | 09/04/19 | 2,083,000 | 2,074,425 |
| U.S. Treasury Bill | 2.44 | 07/05/19 | 7,000,000 | 6,998,138 |
| U.S. Treasury Bill | 2.40 | 07/11/19 | 5,500,000 | 5,496,405 |
| U.S. Treasury Bill | 2.41 | 07/18/19 | 5,000,000 | 4,994,433 |
| U.S. Treasury Bill | 2.39 | 07/25/19 | 3,000,000 | 2,995,323 |
| U.S. Treasury Bill | 2.42 | 08/01/19 | 5,000,000 | 4,989,809 |
| U.S. Treasury Bill | 2.41 | 08/08/19 | 3,000,000 | 2,992,506 |
| U.S. Treasury Bill | 2.42 | 08/08/19 | 1,750,000 | 1,745,628 |
| U.S. Treasury Bill | 2.40 | 08/15/19 | 2,000,000 | 1,994,115 |
| U.S. Treasury Bill | 2.40 | 08/15/19 | 3,750,000 | 3,738,965 |
| U.S. Treasury Bill | 2.35 | 08/22/19 | 2,000,000 | 1,993,337 |
| U.S. Treasury Bill | 2.35 | 08/29/19 | 2,000,000 | 1,992,461 |
| U.S. Treasury Bill | 2.33 | 09/05/19 | 4,000,000 | 3,983,307 |
| U.S. Treasury Note | 1.00 | 08/31/19 | 5,000,000 | 4,988,598 |
| Total U.S. Government & Agency Obligations | ||||
| (Cost $131,843,046) | 131,843,046 | |||
| Money Market Fund | 14.9% of portfolio | ||||
| Shares | ||||
| State Street Institutional U.S. Government Money Market Fund | 2.31(a) | 23,101,764 | 23,101,764 | |
| Total Money Market Fund | ||||
| (Cost $23,101,764) | 23,101,764 | |||
| Total Investments in Securities | ||||
| (Cost $154,944,810) | 100.0% | $154,944,810 | |||
| (a) | 7-day yield at June 30, 2019. |
| The accompanying notes are an integral part of these financial statements. | Portfolio of Investments |
| U.S. Government & Agency Obligations | 66.3% of portfolio | ||||
| Interest Rate / Yield | Maturity Date | Face Amount | Value | |
| National Archives Facility Trust | 8.50% | 09/01/19 | $3,454 | $3,487 |
| Overseas Private Investment Corp. | 2.98(a) | 11/11/20 | 1,000,000 | 1,021,795 |
| Overseas Private Investment Corp. | 2.74(a) | 04/23/21 | 1,000,000 | 1,012,800 |
| Private Export Funding Corp. | 1.45 | 08/15/19 | 974,000 | 973,093 |
| U.S. Department of Housing & Urban Development | 5.45 | 08/01/19 | 409,000 | 410,245 |
| U.S. Department of Housing & Urban Development | 6.07 | 08/01/21 | 20,000 | 20,071 |
| U.S. Department of Housing & Urban Development | 6.12 | 08/01/22 | 10,000 | 10,036 |
| U.S. Department of Housing & Urban Development | 5.77 | 08/01/26 | 100,000 | 100,311 |
| U.S. Treasury Note | 1.00 | 08/31/19 | 1,000,000 | 997,874 |
| U.S. Treasury Note | 1.75 | 09/30/19 | 2,000,000 | 1,997,969 |
| U.S. Treasury Note | 1.00 | 09/30/19 | 1,000,000 | 997,148 |
| U.S. Treasury Note | 1.25 | 10/31/19 | 2,000,000 | 1,994,062 |
| U.S. Treasury Note | 1.00 | 11/30/19 | 2,000,000 | 1,990,703 |
| U.S. Treasury Note | 1.88 | 12/31/19 | 1,000,000 | 998,828 |
| U.S. Treasury Note | 1.25 | 01/31/20 | 3,440,000 | 3,423,069 |
| U.S. Treasury Note | 1.13 | 03/31/20 | 1,000,000 | 993,398 |
| U.S. Treasury Note | 1.13 | 04/30/20 | 1,000,000 | 992,695 |
| U.S. Treasury Note | 2.50 | 06/30/20 | 500,000 | 502,539 |
| U.S. Treasury Note | 2.63 | 08/31/20 | 500,000 | 504,043 |
| U.S. Treasury Note | 1.38 | 09/15/20 | 500,000 | 496,914 |
| U.S. Treasury Note | 1.63 | 10/15/20 | 500,000 | 498,340 |
| U.S. Treasury Note | 1.75 | 11/15/20 | 500,000 | 499,199 |
| U.S. Treasury Note | 1.88 | 12/15/20 | 500,000 | 500,156 |
| U.S. Treasury Note | 2.00 | 01/15/21 | 500,000 | 501,172 |
| U.S. Treasury Note | 2.50 | 01/31/21 | 600,000 | 606,188 |
| U.S. Treasury Note | 2.25 | 02/15/21 | 500,000 | 503,301 |
| U.S. Treasury Note | 2.25 | 03/31/21 | 1,500,000 | 1,511,367 |
| U.S. Treasury Note | 2.38 | 04/15/21 | 1,000,000 | 1,009,961 |
| U.S. Treasury Note | 2.63 | 12/15/21 | 11,500,000 | 11,748,418 |
| U.S. Treasury Note | 2.50 | 01/15/22 | 2,950,000 | 3,004,852 |
| U.S. Treasury Note | 2.13 | 05/15/22 | 3,000,000 | 3,032,695 |
| U.S. Treasury Note | 2.13 | 03/31/24 | 4,800,000 | 4,877,813 |
| U.S. Treasury Note | 2.00 | 05/31/24 | 1,290,000 | 1,304,512 |
| Total U.S. Government & Agency Obligations | ||||
| (Cost $48,522,025) | 49,039,054 | |||
| Corporate Bonds Guaranteed by Export-Import Bank of the United States | 25.4% of portfolio | ||||
| Consumer Discretionary | 0.1% | ||||
| Ethiopian Leasing (2012) LLC | 2.68 | 07/30/25 | 113,312 | 115,354 |
| Total Consumer Discretionary | 115,354 | |||
| Energy | 12.4% | ||||
| Petroleos Mexicanos | 2.00 | 12/20/22 | 350,000 | 349,285 |
| Petroleos Mexicanos | 1.95 | 12/20/22 | 877,100 | 873,030 |
| Petroleos Mexicanos | 2.38 | 04/15/25 | 732,600 | 738,471 |
| Petroleos Mexicanos | 2.46 | 12/15/25 | 650,000 | 656,859 |
| Reliance Industries Ltd. | 2.06 | 01/15/26 | 3,610,600 | 3,607,160 |
| Reliance Industries Ltd. | 1.87 | 01/15/26 | 1,473,684 | 1,458,055 |
| Reliance Industries Ltd. | 2.44 | 01/15/26 | 1,473,684 | 1,489,029 |
| Total Energy | 9,171,889 | |||
| Financials | 12.7% | ||||
| Altitude Investments 17 LLC | 2.68 | 11/08/25 | 573,596 | 592,541 |
| Portfolio of Investments | The accompanying notes are an integral part of these financial statements. |
| Corporate Bonds Guaranteed by Export-Import Bank of the United States | 25.4% of portfolio (Continued) | ||||
| Interest Rate /Yield | Maturity Date | Face Amount | Value | |
| Financials | 12.7% (Continued) | ||||
| Export Leasing 2009 LLC | 1.86% | 08/28/21 | $169,002 | $168,486 |
| Lulwa Ltd. | 1.83 | 03/26/25 | 506,968 | 502,869 |
| Mexican Aircraft Finance IV | 2.54 | 07/13/25 | 279,739 | 283,528 |
| Mexican Aircraft Finance V | 2.33 | 01/14/27 | 348,750 | 351,785 |
| MSN 41079 and 41084 Ltd. | 1.63 | 12/14/24 | 961,352 | 949,160 |
| Penta Aircraft Leasing 2013 LLC | 1.69 | 04/29/25 | 1,036,072 | 1,021,246 |
| Safina Ltd. | 1.55 | 01/15/22 | 589,677 | 584,677 |
| Safina Ltd. | 2.00 | 12/30/23 | 1,324,995 | 1,320,826 |
| Salmon River Export LLC | 2.19 | 09/15/26 | 156,540 | 156,945 |
| Sandalwood 2013 LLC | 2.82 | 02/12/26 | 390,965 | 400,105 |
| Santa Rosa Leasing LLC | 1.69 | 08/15/24 | 45,560 | 45,009 |
| Santa Rosa Leasing LLC | 1.47 | 11/03/24 | 482,351 | 474,285 |
| Tagua Leasing LLC | 1.90 | 07/12/24 | 1,082,499 | 1,075,526 |
| Tagua Leasing LLC | 1.73 | 09/18/24 | 464,852 | 460,077 |
| Union 11 Leasing LLC | 2.41 | 01/23/24 | 429,899 | 432,885 |
| Union 16 Leasing LLC | 1.86 | 01/22/25 | 505,328 | 501,914 |
| VCK Lease SA | 2.59 | 07/24/26 | 80,152 | 81,502 |
| Total Financials | 9,403,366 | |||
| Industrials | 0.2% | ||||
| Sayarra Ltd. | 2.77 | 10/29/21 | 137,219 | 138,238 |
| Total Industrials | 138,238 | |||
| Total Corporate Bonds Guaranteed by Export-Import Bank of the United States | ||||
| (Cost $18,815,515) | 18,828,847 | |||
| Corporate Bonds–Other | 3.2% of portfolio | ||||
| Communication Services | 0.2% | ||||
| Comcast Corp. | 3.30 | 10/01/20 | 150,000 | 151,982 |
| Total Communication Services | 151,982 | |||
| Financials | 2.2% | ||||
| Citibank, N.A. | 2.84(b) | 05/20/22 | 250,000 | 251,927 |
| Goldman Sachs Group, Inc. | 3.20 | 06/05/20 | 150,000 | 151,271 |
| Goldman Sachs Group, Inc. | 3.00 | 04/26/22 | 250,000 | 252,143 |
| JP Morgan Chase Bank NA | 3.09(b) | 04/26/21 | 250,000 | 251,307 |
| MetLife Global Funding I (c) | 1.75 | 09/19/19 | 500,000 | 499,214 |
| Wells Fargo Bank NA | 2.40 | 01/15/20 | 250,000 | 250,069 |
| Total Financials | 1,655,931 | |||
| Health Care | 0.3% | ||||
| Halfmoon Parent, Inc. (c) | 3.20 | 09/17/20 | 100,000 | 100,899 |
| Halfmoon Parent, Inc. (c) | 3.40 | 09/17/21 | 100,000 | 101,919 |
| Total Health Care | 202,818 | |||
| Utilities | 0.5% | ||||
| Duke Energy Florida Project Finance, LLC | 1.20 | 03/01/20 | 120,969 | 119,861 |
| Duke Energy Florida, LLC | 2.10 | 12/15/19 | 125,000 | 124,791 |
| The accompanying notes are an integral part of these financial statements. | Portfolio of Investments |
| Corporate Bonds–Other | 3.2% of portfolio (Continued) | ||||
| Interest Rate /Yield | Maturity Date | Face Amount | Value | |
| Utilities | 0.5% (Continued) | ||||
| Southwest Gas Corp. | 4.45% | 12/01/20 | $125,000 | $127,289 |
| Total Utilities | 371,941 | |||
| Total Corporate Bonds–Other | ||||
| (Cost $2,370,010) | 2,382,672 | |||
| Asset-Backed Securities | 2.0% of portfolio | ||||
| Ally Master Owner Trust 17-3 | 2.87(b) | 06/15/22 | 250,000 | 250,323 |
| Avant Loans Funding Trust 18-A (c) | 3.09 | 06/15/21 | 18,967 | 18,974 |
| Exeter Automobile Receivables Trust 18-3 (c) | 2.90 | 01/18/22 | 65,171 | 65,224 |
| Exeter Automobile Receivables Trust 18-4 (c) | 3.05 | 12/15/21 | 216,760 | 217,162 |
| Foursight Capital Automobile Receivables Trust 17-1 (c) | 2.37 | 04/15/22 | 29,963 | 29,928 |
| Foursight Capital Automobile Receivables Trust 18-2 (c) | 3.32 | 04/15/22 | 162,991 | 163,811 |
| Freedom Financial 18-2 (c) | 3.99 | 10/20/25 | 156,600 | 158,137 |
| GLS Auto Receivables Trust 17-1 (c) | 2.67 | 04/15/21 | 17,748 | 17,747 |
| GLS Auto Receivables Trust 18-3 (c) | 3.35 | 08/15/22 | 92,851 | 93,276 |
| Marlette Funding Trust 19-3 (c) | 2.69 | 09/17/29 | 250,000 | 249,980 |
| Prosper Marketplace Issuance Trust 18-2 (c) | 3.35 | 10/15/24 | 126,005 | 126,463 |
| Small Business Administration Pool # 503463 | 3.38(b) | 09/25/21 | 128 | 127 |
| United Auto Credit Securitization Trust 18-2 (c) | 2.89 | 03/10/21 | 57,243 | 57,262 |
| Total Asset-Backed Securities | ||||
| (Cost $1,444,389) | 1,448,414 | |||
| Mortgage-Backed Security | 0.1% of portfolio | ||||
| FDIC Structured Sale Guaranteed Notes 2010-S3 (c) | 2.74 | 12/03/20 | 78,282 | 78,077 |
| Total Mortgage-Backed Security | ||||
| (Cost $78,268) | 78,077 | |||
| Certificates of Deposit | 0.6% of portfolio | ||||
| HSBC Bank USA NA | 3.10(b) | 11/17/20 | 246,000 | 248,763 |
| JP Morgan Chase Bank, NA | 2.00(b) | 04/22/21 | 200,000 | 199,693 |
| Total Certificates of Deposit | ||||
| (Cost $445,999) | 448,456 | |||
| Commercial Paper | 2.4% of portfolio | ||||
| Duke Energy Corp. (c) | 2.47 | 07/01/19 | 1,800,000 | 1,799,624 |
| Total Commercial Paper | ||||
| (Cost $1,800,000) | 1,799,624 | |||
| Total Investments in Securities | ||||
| (Cost $73,476,206) | 100.0% | $74,025,144 | |||
| (a) | Interest is paid at maturity. |
| (b) | Variable coupon rate as of June 30, 2019. |
| (c) | Security was purchased pursuant to Rule 144A under the Securities Act of 1933 and may be resold in transactions exempt from registration, normally to qualified institutional buyers. The securities have been determined to be liquid under criteria established by the Fund's Board of Directors. The total of such securities at period-end amounts to $3,777,697 and represents 5.1% of total investments. |
| Portfolio of Investments | The accompanying notes are an integral part of these financial statements. |
| U.S. Government & Agency Obligations | 43.3% of portfolio | ||||
| Interest Rate / Yield | Maturity Date | Face Amount | Value | |
| Federal Home Loan Bank | 2.55% | 05/06/22 | $10,060,000 | $10,101,657 |
| Federal Home Loan Mortgage Corp. | 2.35 | 03/04/22 | 2,220,000 | 2,222,647 |
| Overseas Private Investment Corp. | 2.52 | 09/15/22 | 1,392,045 | 1,400,275 |
| Private Export Funding Corp. (a) | 2.10 | 12/19/19 | 875,000 | 874,458 |
| Tennessee Valley Authority | 0.00(b) | 06/15/21 | 595,000 | 570,914 |
| U.S. Department of Housing & Urban Development | 6.07 | 08/01/21 | 10,000 | 10,035 |
| U.S. Department of Housing & Urban Development | 6.12 | 08/01/22 | 10,000 | 10,036 |
| U.S. Treasury Note | 2.63 | 08/31/20 | 2,200,000 | 2,217,789 |
| U.S. Treasury Note | 1.63 | 10/15/20 | 12,225,000 | 12,184,409 |
| U.S. Treasury Note | 1.38 | 10/31/20 | 2,175,000 | 2,160,642 |
| U.S. Treasury Note | 2.75 | 11/30/20 | 2,080,000 | 2,105,675 |
| U.S. Treasury Note | 2.00 | 01/15/21 | 7,850,000 | 7,868,398 |
| U.S. Treasury Note | 2.50 | 01/31/21 | 1,450,000 | 1,464,953 |
| U.S. Treasury Note | 2.50 | 02/28/21 | 4,575,000 | 4,625,039 |
| U.S. Treasury Note | 2.25 | 03/31/21 | 17,000,000 | 17,128,828 |
| U.S. Treasury Note | 2.38 | 04/15/21 | 4,800,000 | 4,847,813 |
| U.S. Treasury Note | 2.25 | 04/30/21 | 8,793,000 | 8,865,130 |
| U.S. Treasury Note | 2.88 | 11/15/21 | 1,625,000 | 1,667,275 |
| U.S. Treasury Note | 2.63 | 12/15/21 | 29,900,000 | 30,545,887 |
| U.S. Treasury Note | 2.50 | 01/15/22 | 1,770,000 | 1,802,911 |
| U.S. Treasury Note | 2.25 | 04/15/22 | 53,770,000 | 54,509,338 |
| U.S. Treasury Note | 2.13 | 05/15/22 | 12,102,000 | 12,233,893 |
| U.S. Treasury Note | 1.75 | 06/15/22 | 468,000 | 468,494 |
| U.S. Treasury Note | 2.88 | 09/30/23 | 710,000 | 742,477 |
| U.S. Treasury Note | 2.13 | 03/31/24 | 52,663,000 | 53,516,717 |
| U.S. Treasury Note | 2.00 | 05/31/24 | 11,464,000 | 11,592,970 |
| Total U.S. Government & Agency Obligations | ||||
| (Cost $242,171,256) | 245,738,660 | |||
| Corporate Bonds–Other | 24.9% of portfolio | ||||
| Communication Services | 1.4% | ||||
| Comcast Corp. | 3.30 | 10/01/20 | 3,025,000 | 3,064,974 |
| Comcast Corp. | 3.45 | 10/01/21 | 1,010,000 | 1,038,998 |
| Comcast Corp. | 3.03(c) | 10/01/21 | 825,000 | 828,226 |
| Sprint Spectrum Co. LLC (a) | 3.36 | 03/20/23 | 1,504,688 | 1,504,687 |
| Sprint Spectrum Co. LLC (a) | 4.74 | 03/20/25 | 1,560,000 | 1,618,500 |
| Total Communication Services | 8,055,385 | |||
| Consumer Discretionary | 0.7% | ||||
| ABC Inc. | 8.75 | 08/15/21 | 810,000 | 914,565 |
| Volkswagen Group of America, Inc. (a) | 3.88 | 11/13/20 | 1,060,000 | 1,082,315 |
| Volkswagen Group of America, Inc. (a) | 3.31(c) | 11/13/20 | 2,200,000 | 2,208,978 |
| Total Consumer Discretionary | 4,205,858 | |||
| Consumer Staples | 1.2% | ||||
| Coca-Cola Co. (The) | 1.55 | 09/01/21 | 475,000 | 469,935 |
| Coca-Cola Co. (The) | 2.20 | 05/25/22 | 420,000 | 422,029 |
| Hershey Co. (The) | 2.90 | 05/15/20 | 875,000 | 879,434 |
| Mead Johnson Nutrition Co. | 3.00 | 11/15/20 | 4,125,000 | 4,161,460 |
| PepsiCo Inc. | 1.35 | 10/04/19 | 875,000 | 872,801 |
| Total Consumer Staples | 6,805,659 | |||
| The accompanying notes are an integral part of these financial statements. | Portfolio of Investments |
| Corporate Bonds–Other | 24.9% of portfolio (Continued) | ||||
| Interest Rate /Yield | Maturity Date | Face Amount | Value | |
| Energy | 0.8% | ||||
| Colonial Pipeline Co. (a) | 3.50% | 10/15/20 | $875,000 | $883,834 |
| Midwest Connector Capital Company LLC (a) | 3.63 | 04/01/22 | 620,000 | 635,069 |
| Midwest Connector Capital Company LLC (a) | 3.90 | 04/01/24 | 825,000 | 858,120 |
| Occidental Petroleum Corp. | 9.25 | 08/01/19 | 1,025,000 | 1,030,576 |
| Phillips 66 | 3.12(c) | 02/26/21 | 975,000 | 975,032 |
| Total Energy | 4,382,631 | |||
| Financials | 10.5% | ||||
| AIG Global Funding Inc. (a) | 2.30 | 07/01/22 | 865,000 | 864,835 |
| AMBAC Assurance Corp. (a) | 5.10 | 06/07/20 | 2,871 | 4,062 |
| AMBAC LSNI LLC (a) | 7.32(c) | 02/12/23 | 12,347 | 12,548 |
| Athene Global Funding (a) | 2.75 | 04/20/20 | 575,000 | 576,199 |
| Athene Global Funding (a) | 3.73(c) | 04/20/20 | 1,200,000 | 1,205,772 |
| Athene Global Funding (a) | 4.00 | 01/25/22 | 1,400,000 | 1,447,934 |
| Bank of America Corp. | 2.74(c) | 01/23/22 | 2,100,000 | 2,108,985 |
| Bank of America Corp. | 3.55(c) | 07/23/24 | 2,210,000 | 2,223,835 |
| Bank of America Corp. | 3.46(c) | 03/15/25 | 1,210,000 | 1,255,280 |
| Bank of America Corp. | 3.95 | 04/21/25 | 1,030,000 | 1,079,427 |
| Capital One Financial Corp. | 3.90 | 01/29/24 | 1,440,000 | 1,511,894 |
| Caterpillar Financial Services Corp. | 3.15 | 09/07/21 | 875,000 | 892,130 |
| Citibank, N.A. | 2.84(c) | 05/20/22 | 4,275,000 | 4,307,957 |
| Citibank, NA | 2.85 | 02/12/21 | 1,650,000 | 1,663,253 |
| Citibank, NA | 3.40 | 07/23/21 | 875,000 | 893,376 |
| Citibank, NA | 3.65 | 01/23/24 | 1,325,000 | 1,392,143 |
| Daimler Finance North America LLC (a) | 3.24(c) | 11/05/21 | 1,325,000 | 1,328,616 |
| Discover Bank | 4.68(c) | 08/09/28 | 3,081,000 | 3,192,717 |
| Fiserv Inc. | 2.75 | 07/01/24 | 435,000 | 437,878 |
| General Motors Financial Company, Inc. | 3.20 | 07/06/21 | 2,895,000 | 2,919,630 |
| Goldman Sachs Group, Inc. | 3.00 | 04/26/22 | 5,330,000 | 5,375,678 |
| Industrial And Commercial Bank of China Ltd. NY | 3.23 | 11/13/19 | 1,600,000 | 1,603,792 |
| J.P. Morgan Chase & Co. | 4.02(c) | 12/05/24 | 800,000 | 849,495 |
| John Deere Capital Corp. | 2.71(c) | 09/10/21 | 660,000 | 659,724 |
| John Deere Capital Corp. | 3.13 | 09/10/21 | 220,000 | 224,356 |
| Main Street Capital Corp. | 4.50 | 12/01/22 | 539,000 | 556,860 |
| Main Street Capital Corp. | 5.20 | 05/01/24 | 3,057,000 | 3,201,344 |
| Metropolitan Life Global Funding (a) | 3.38 | 01/11/22 | 450,000 | 462,421 |
| Metropolitan Life Global Funding (a) | 3.60 | 01/11/24 | 450,000 | 474,152 |
| Morgan Stanley | 3.77(c) | 01/20/22 | 1,277,000 | 1,290,481 |
| Reliance Standard Life Global Funding II (a) | 2.50 | 01/15/20 | 5,550,000 | 5,547,318 |
| Reliance Standard Life Global Funding II (a) | 2.38 | 05/04/20 | 5,650,000 | 5,642,710 |
| Synchrony Financial | 4.25 | 08/15/24 | 1,200,000 | 1,249,714 |
| Wells Fargo Bank NA | 3.33(c) | 07/23/21 | 1,025,000 | 1,034,640 |
| Wells Fargo Bank NA | 3.63 | 10/22/21 | 625,000 | 642,450 |
| Wells Fargo Bank NA | 3.10(c) | 10/22/21 | 1,325,000 | 1,327,475 |
| Total Financials | 59,461,081 | |||
| Health Care | 2.3% | ||||
| AbbVie Inc. | 3.38 | 11/14/21 | 2,140,000 | 2,175,663 |
| AbbVie Inc. | 3.75 | 11/14/23 | 440,000 | 458,748 |
| Allergan Funding SCS | 3.45 | 03/15/22 | 2,280,000 | 2,327,224 |
| Bayer US Finance II LLC (a) | 3.50 | 06/25/21 | 1,325,000 | 1,343,835 |
| Bayer US Finance II LLC (a) | 2.98(c) | 06/25/21 | 1,325,000 | 1,316,103 |
| Halfmoon Parent, Inc. (a) | 3.20 | 09/17/20 | 4,350,000 | 4,389,116 |
| Portfolio of Investments | The accompanying notes are an integral part of these financial statements. |
| Corporate Bonds–Other | 24.9% of portfolio (Continued) | ||||
| Interest Rate /Yield | Maturity Date | Face Amount | Value | |
| Health Care | 2.3% (Continued) | ||||
| Halfmoon Parent, Inc. (a) | 3.40% | 09/17/21 | $835,000 | $851,018 |
| Total Health Care | 12,861,707 | |||
| Industrials | 1.0% | ||||
| BNSF Railway Co. | 3.80 | 01/01/20 | 330,000 | 329,896 |
| Burlington Northern & Santa Fe Railway Co. | 4.58 | 01/15/21 | 82,662 | 84,326 |
| Burlington Northern & Santa Fe Railway Co. | 4.83 | 01/15/23 | 36,237 | 37,239 |
| General Dynamics Corp. | 2.88 | 05/11/20 | 3,075,000 | 3,090,419 |
| Johnson Controls Inc. (a) | 5.00 | 03/30/20 | 831,000 | 846,160 |
| Parker-Hannifin Corp. | 2.70 | 06/14/24 | 435,000 | 441,306 |
| Ryder System Inc. | 2.88 | 06/01/22 | 435,000 | 439,866 |
| Ryder System, Inc. | 3.50 | 06/01/21 | 220,000 | 224,392 |
| Total Industrials | 5,493,604 | |||
| Information Technology | 1.7% | ||||
| Apple Inc. | 2.50 | 02/09/22 | 975,000 | 985,933 |
| Dell International LLC (a) | 4.00 | 07/15/24 | 2,565,000 | 2,630,836 |
| International Business Machine Corp. | 3.00 | 05/15/24 | 2,200,000 | 2,259,490 |
| Microsoft Corp. | 2.00 | 11/03/20 | 950,000 | 949,480 |
| Microsoft Corp. | 2.40 | 02/06/22 | 1,675,000 | 1,693,374 |
| Qualcomm Inc. | 3.45 | 05/20/25 | 1,250,000 | 1,294,773 |
| Total Information Technology | 9,813,886 | |||
| Materials | 0.4% | ||||
| 3M Co. | 1.63 | 09/19/21 | 450,000 | 445,097 |
| PPG Industries, Inc. | 2.30 | 11/15/19 | 2,200,000 | 2,198,116 |
| Total Materials | 2,643,213 | |||
| Real Estate | 0.2% | ||||
| Ventas Realty LP | 2.65 | 01/15/25 | 975,000 | 970,110 |
| Total Real Estate | 970,110 | |||
| Utilities | 4.7% | ||||
| Atlantic City Electric Co. | 4.35 | 04/01/21 | 3,150,000 | 3,218,261 |
| Dominion Energy Inc. | 2.58 | 07/01/20 | 325,000 | 324,516 |
| Duke Energy Florida Project Finance, LLC | 1.20 | 03/01/20 | 2,002,456 | 1,984,108 |
| Duke Energy Florida, LLC | 2.10 | 12/15/19 | 1,612,500 | 1,609,809 |
| Duke Energy Kentucky, Inc. (a) | 4.65 | 10/01/19 | 1,325,000 | 1,331,456 |
| Empire District Electric Co. | 4.65 | 06/01/20 | 5,225,000 | 5,316,160 |
| Entergy Louisiana LLC | 4.80 | 05/01/21 | 1,175,000 | 1,214,707 |
| Entergy Texas, Inc. | 4.10 | 09/01/21 | 1,220,000 | 1,250,416 |
| Oncor Electric Delivery Co. LLC | 5.75 | 09/30/20 | 660,000 | 684,753 |
| SanDiego Gas & Electric Co. | 1.91 | 02/01/22 | 2,130,880 | 2,085,799 |
| Southern California Edison Co. | 3.88 | 06/01/21 | 1,050,000 | 1,069,706 |
| Southern California Edison Co. | 1.85 | 02/01/22 | 3,510,000 | 3,447,717 |
| Southwest Gas Corp. | 4.45 | 12/01/20 | 825,000 | 840,107 |
| Toledo Edison Co. | 7.25 | 05/01/20 | 250,000 | 257,831 |
| Westar Energy Inc. | 5.10 | 07/15/20 | 1,275,000 | 1,309,762 |
| The accompanying notes are an integral part of these financial statements. | Portfolio of Investments |
| Corporate Bonds–Other | 24.9% of portfolio (Continued) | ||||
| Interest Rate /Yield | Maturity Date | Face Amount | Value | |
| Utilities | 4.7% (Continued) | ||||
| Wisconsin Power and Light Co. | 5.00% | 07/15/19 | $560,000 | $560,515 |
| Total Utilities | 26,505,623 | |||
| Total Corporate Bonds–Other | ||||
| (Cost $139,548,410) | 141,198,757 | |||
| Asset-Backed Securities | 14.7% of portfolio | ||||
| ACC Trust 18-1 (a) | 3.70 | 12/21/20 | 294,191 | 294,629 |
| Ally Master Owner Trust 17-3 | 2.87(c) | 06/15/22 | 750,000 | 750,969 |
| Ally Master Owner Trust 17-3 | 2.04 | 06/15/22 | 900,000 | 897,262 |
| American Airlines 13-2 | 4.95 | 07/15/24 | 1,123,344 | 1,177,826 |
| American Credit Acceptance Receivables Trust 18-4 (a) | 3.38 | 12/13/21 | 1,927,146 | 1,933,449 |
| American Credit Acceptance Receivables Trust 19-2 (a) | 2.85 | 07/12/22 | 1,930,279 | 1,933,553 |
| Avant Loans Funding Trust 18-A (a) | 3.09 | 06/15/21 | 374,285 | 374,418 |
| Avant Loans Funding Trust 18-B (a) | 3.42 | 01/18/22 | 1,019,425 | 1,022,777 |
| Avant Loans Funding Trust 19-A (a) | 3.48 | 07/15/22 | 1,020,085 | 1,023,979 |
| Axis Equipment Finance Receivables LLC 16-A (a) | 2.21 | 11/20/21 | 126,257 | 126,147 |
| California Republic Auto Receivable Trust 15-3 | 2.13 | 05/17/21 | 546,260 | 545,578 |
| Carvana Auto Receivables Trust 19-2 (a) | 2.60 | 01/18/22 | 2,700,000 | 2,700,880 |
| CCR Inc. MT-100 Payment Rights Master Trust 12-C (a) | 4.75 | 07/10/22 | 770,833 | 776,875 |
| Consumer Loan Underlying Bond 17-P2 (a) | 2.61 | 01/15/24 | 322,571 | 321,913 |
| Consumer Loan Underlying Bond 18-P2 (a) | 3.47 | 10/15/25 | 781,653 | 786,230 |
| Consumer Loan Underlying Bond 18-P3 (a) | 3.82 | 01/15/26 | 988,836 | 997,990 |
| Consumer Loan Underlying Bond 19-P1 (a) | 2.94 | 07/15/26 | 980,000 | 980,476 |
| CPS Auto Trust 19-A (a) | 3.18 | 06/15/22 | 837,346 | 841,328 |
| Credit Acceptance Auto Loan Trust 17-1 (a) | 2.56 | 10/15/25 | 620,461 | 620,461 |
| Credit Acceptance Auto Loan Trust 17-2 (a) | 2.55 | 02/17/26 | 1,525,000 | 1,524,783 |
| Credit Acceptance Auto Loan Trust 17-3 (a) | 2.65 | 06/15/26 | 1,025,000 | 1,026,750 |
| Credit Acceptance Auto Loan Trust 18-1 (a) | 3.01 | 02/16/27 | 1,525,000 | 1,533,413 |
| Credit Acceptance Auto Loan Trust 18-2 (a) | 3.47 | 05/17/27 | 2,200,000 | 2,231,802 |
| Credit Acceptance Auto Loan Trust 18-3 (a) | 3.55 | 08/15/27 | 1,100,000 | 1,119,718 |
| Credit Acceptance Auto Loan Trust 19-1 (a) | 3.33 | 02/15/28 | 1,550,000 | 1,583,056 |
| Credit Suisse ABS Trust 18-LD1 (a) | 3.42 | 07/25/24 | 489,613 | 489,916 |
| Drive Auto Receivables Trust 19-3 | 2.63 | 09/15/22 | 1,270,000 | 1,272,005 |
| DT Auto Owner Trust 19-1 (a) | 3.08 | 09/15/22 | 1,409,199 | 1,414,291 |
| Element Rail Leasing I LLC 14-1 (a) | 2.30 | 04/19/44 | 898,955 | 900,500 |
| Element Rail Leasing I LLC 15-1 (a) | 2.71 | 02/19/45 | 426,671 | 426,267 |
| Element Rail Leasing I LLC 16-1 (a) | 3.97 | 03/19/46 | 278,112 | 283,708 |
| Entergy New Orleans Storm Recovery Fund 15-1 | 2.67 | 06/01/27 | 610,203 | 614,702 |
| Exeter Automobile Receivables Trust 17-3 (a) | 2.05 | 12/15/21 | 126,276 | 126,162 |
| Exeter Automobile Receivables Trust 18-3 (a) | 2.90 | 01/18/22 | 391,024 | 391,347 |
| Exeter Automobile Receivables Trust 18-4 (a) | 3.05 | 12/15/21 | 769,497 | 770,926 |
| Exeter Automobile Receivables Trust 19-1 (a) | 3.20 | 04/15/22 | 1,335,435 | 1,339,839 |
| Foursight Capital Automobile Receivables Trust 16-1 (a) | 2.87 | 10/15/21 | 137,317 | 137,422 |
| Foursight Capital Automobile Receivables Trust 17-1 (a) | 2.37 | 04/15/22 | 215,734 | 215,485 |
| Foursight Capital Automobile Receivables Trust 18-1 (a) | 2.85 | 08/16/21 | 386,884 | 386,958 |
| Foursight Capital Automobile Receivables Trust 18-2 (a) | 3.32 | 04/15/22 | 1,100,189 | 1,105,726 |
| Freedom Financial 18-1 (a) | 3.61 | 07/18/24 | 1,206,061 | 1,212,492 |
| Freedom Financial 18-2 (a) | 3.99 | 10/20/25 | 814,320 | 822,310 |
| Freedom Financial 19-1 (a) | 3.42 | 06/18/26 | 781,430 | 783,656 |
| GLS Auto Receivables Trust 17-1 (a) | 2.67 | 04/15/21 | 140,206 | 140,202 |
| GLS Auto Receivables Trust 18-1 (a) | 2.82 | 07/15/22 | 1,306,844 | 1,308,591 |
| GLS Auto Receivables Trust 18-3 (a) | 3.35 | 08/15/22 | 649,960 | 652,934 |
| GLS Auto Receivables Trust 19-1 (a) | 3.37 | 01/17/23 | 1,126,758 | 1,136,076 |
| GLS Auto Receivables Trust 19-2 (a) | 3.06 | 04/17/23 | 1,589,459 | 1,598,533 |
| Portfolio of Investments | The accompanying notes are an integral part of these financial statements. |
| Asset-Backed Securities | 14.7% of portfolio (Continued) | ||||
| Interest Rate /Yield | Maturity Date | Face Amount | Value | |
| Gracie Point International Premium Financing 18-A (a) | 3.93%(c) | 03/01/20 | $5,480,000 | $5,480,000 |
| Longtrain Leasing III LLC 2015-1 (a) | 2.98 | 01/15/45 | 437,723 | 441,344 |
| Marlette Funding Trust 18-2 (a) | 3.06 | 07/17/28 | 786,949 | 787,798 |
| Marlette Funding Trust 18-3 (a) | 3.20 | 09/15/28 | 1,448,708 | 1,452,839 |
| Marlette Funding Trust 18-4 (a) | 3.71 | 12/15/28 | 1,555,017 | 1,570,845 |
| Marlette Funding Trust 19-1 (a) | 3.44 | 04/16/29 | 1,316,189 | 1,327,330 |
| Marlette Funding Trust 19-3 (a) | 2.69 | 09/17/29 | 4,570,000 | 4,569,628 |
| NP SPE II LLC 17-1 (a) | 3.37 | 10/21/47 | 462,754 | 473,456 |
| Oscar US Funding Trust 17-2 (a) | 2.45 | 12/10/21 | 730,000 | 729,510 |
| Oscar US Funding Trust 18-1 (a) | 2.91 | 04/12/21 | 866,990 | 867,603 |
| Oscar US Funding Trust 18-2 (a) | 3.15 | 08/10/21 | 613,977 | 615,506 |
| Oscar US Funding Trust 19-1 (a) | 3.10 | 04/11/22 | 1,030,000 | 1,035,016 |
| Prosper Marketplace Issuance Trust 18-2 (a) | 3.35 | 10/15/24 | 2,368,899 | 2,377,506 |
| Prosper Marketplace Issuance Trust 19-2 (a) | 3.20 | 09/15/25 | 910,000 | 912,090 |
| Prosper Marketplace Issuance Trust 19-3 (a) | 3.19 | 07/15/25 | 1,375,000 | 1,379,862 |
| Santander Drive Auto Receivables Trust 18-2 | 2.75 | 09/15/21 | 434,379 | 434,456 |
| SoFi Consumer Loan Program Trust 17-1 (a) | 3.28 | 01/26/26 | 422,387 | 425,767 |
| SoFi Consumer Loan Program Trust 17-3 (a) | 2.77 | 05/25/26 | 569,434 | 570,472 |
| SoFi Consumer Loan Program Trust 17-4 (a) | 2.50 | 05/26/26 | 462,768 | 463,087 |
| SoFi Consumer Loan Program Trust 18-3 (a) | 3.20 | 08/25/27 | 276,258 | 277,152 |
| SoFi Consumer Loan Program Trust 18-4 (a) | 3.54 | 11/26/27 | 1,504,754 | 1,521,945 |
| SoFi Consumer Loan Program Trust 19-2 (a) | 3.01 | 04/25/28 | 1,010,178 | 1,016,606 |
| United Auto Credit Securitization Trust 18-2 (a) | 2.89 | 03/10/21 | 377,805 | 377,929 |
| United Auto Credit Securitization Trust 19-1 (a) | 2.82 | 07/12/21 | 2,417,162 | 2,420,051 |
| Upgrade Receivables Trust 18-1 (a) | 3.76 | 11/15/24 | 924,893 | 929,305 |
| Upgrade Receivables Trust 19-1 (a) | 3.48 | 03/15/25 | 1,430,601 | 1,436,459 |
| Veros Autos Receivable Trust 17-1 (a) | 2.84 | 04/17/23 | 81,038 | 80,988 |
| World Financial Network Credit Card Master Note Trust 17-B | 1.98 | 06/15/23 | 3,500,000 | 3,497,230 |
| World Financial Network Credit Card Master Note Trust 18-B | 3.46 | 07/15/25 | 1,200,000 | 1,233,433 |
| Total Asset-Backed Securities | ||||
| (Cost $82,980,541) | 83,361,523 | |||
| Yankee Bonds | 7.6% of portfolio | ||||
| African Development Bank | 8.80 | 09/01/19 | 1,960,000 | 1,980,737 |
| América Móvil SAB de CV | 5.00 | 03/30/20 | 646,000 | 658,080 |
| Avolon Holdings Funding Ltd. (a) | 3.63 | 05/01/22 | 1,325,000 | 1,343,020 |
| Banco Santander SA | 2.71 | 06/27/24 | 1,400,000 | 1,403,080 |
| Bank of Nova Scotia | 3.40 | 02/11/24 | 1,220,000 | 1,268,154 |
| BMO Financial Group | 2.90 | 03/26/22 | 900,000 | 914,177 |
| BMO Financial Group | 4.34(c) | 10/05/28 | 1,300,000 | 1,361,963 |
| CNOOC Nexen Finance (2015) Australia Pty Ltd. | 2.63 | 05/05/20 | 425,000 | 425,633 |
| Coca-Cola European Partners PLC | 3.50 | 09/15/20 | 825,000 | 834,432 |
| Daimler Finance North America LLC (a) | 3.10 | 05/04/20 | 650,000 | 653,430 |
| Daimler Finance North America LLC (a) | 2.96(c) | 05/04/20 | 450,000 | 450,414 |
| Daimler Finance North America LLC (a) | 2.30 | 02/12/21 | 1,650,000 | 1,643,310 |
| Daimler Finance North America LLC (a) | 2.97(c) | 02/12/21 | 1,650,000 | 1,648,157 |
| Daimler Finance North America LLC (a) | 3.35 | 05/04/21 | 875,000 | 887,103 |
| Daimler Finance North America LLC (a) | 3.12(c) | 05/04/21 | 425,000 | 425,070 |
| HSBC Holdings PLC | 3.80(c) | 03/11/25 | 2,635,000 | 2,744,167 |
| Hydro-Quebec | 6.27 | 01/03/26 | 80,000 | 98,149 |
| ING Groep N.V. | 3.55 | 04/09/24 | 720,000 | 744,447 |
| Reckitt Benckiser Treasury Services PLC (a) | 2.75 | 06/26/24 | 1,100,000 | 1,110,094 |
| Royal Bank of Scotland Group PLC | 4.52(c) | 06/25/24 | 1,325,000 | 1,379,495 |
| Royal Bank of Scotland Group PLC | 4.27(c) | 03/22/25 | 1,330,000 | 1,375,061 |
| Seagate HDD Cayman | 4.75 | 01/01/25 | 1,100,000 | 1,111,081 |
| Shell International Finance BV | 2.79(c) | 09/12/19 | 3,000,000 | 3,002,387 |
| Shell International Finance BV | 2.13 | 05/11/20 | 665,000 | 664,858 |
| The accompanying notes are an integral part of these financial statements. | Portfolio of Investments |
| Yankee Bonds | 7.6% of portfolio (Continued) | ||||
| Interest Rate /Yield | Maturity Date | Face Amount | Value | |
| Sinopec Group Overseas Development (2015) Ltd. (a) | 2.50% | 04/28/20 | $1,075,000 | $1,074,925 |
| Sinopec Group Overseas Development (2017) Ltd. (a) | 2.38 | 04/12/20 | 2,175,000 | 2,174,347 |
| Sinopec Group Overseas Development (2020) Ltd. (a) | 2.25 | 09/13/20 | 2,200,000 | 2,194,840 |
| Standard Chartered Bank PLC. (a) | 2.10 | 08/19/19 | 700,000 | 699,419 |
| Standard Chartered Bank PLC. (a) | 3.65(c) | 08/19/19 | 450,000 | 450,645 |
| Sumitomo Mitsui Banking Corp. | 2.09 | 10/18/19 | 1,300,000 | 1,298,653 |
| Sumitomo Mitsui Banking Corp. | 2.51 | 01/17/20 | 1,300,000 | 1,300,924 |
| Sumitomo Mitsui Banking Corp. | 2.94(c) | 01/17/20 | 875,000 | 876,160 |
| Syngenta Finance N.V. (a) | 3.70 | 04/24/20 | 1,300,000 | 1,309,046 |
| Syngenta Finance N.V. (a) | 3.93 | 04/23/21 | 425,000 | 432,603 |
| Tencent Holdings Ltd. (a) | 3.28 | 04/11/24 | 2,650,000 | 2,704,151 |
| Tyco Electronics Group SA | 2.93(c) | 06/05/20 | 220,000 | 220,239 |
| Total Yankee Bonds | ||||
| (Cost $42,330,368) | 42,862,451 | |||
| Municipal Bonds | 5.7% of portfolio | ||||
| California | 0.4% | ||||
| Adelanto California Public Utility Authority | 3.25 | 07/01/21 | 750,000 | 766,320 |
| Adelanto California Public Utility Authority | 3.63 | 07/01/23 | 795,000 | 837,016 |
| Fresno County CA Pension Obligation | 0.00(b) | 08/15/22 | 650,000 | 599,891 |
| Total California | 2,203,227 | |||
| Florida | 0.8% | ||||
| Florida State Board of Administration Finance Corp. | 2.16 | 07/01/19 | 4,375,000 | 4,375,000 |
| Total Florida | 4,375,000 | |||
| New Jersey | 1.5% | ||||
| New Jersey Economic Development Authority | 0.00(b) | 02/15/20 | 7,240,000 | 7,128,287 |
| New Jersey Economic Development Authority | 0.00(b) | 02/15/21 | 1,350,000 | 1,297,269 |
| Total New Jersey | 8,425,556 | |||
| North Carolina | 0.1% | ||||
| North Carolina Housing Finance Agency | 4.00 | 01/01/30 | 750,000 | 766,185 |
| Total North Carolina | 766,185 | |||
| Pennsylvania | 1.7% | ||||
| Philadelphia Pennsylvania Authority for Industrial Development | 0.00(b) | 04/15/20 | 5,285,000 | 5,171,796 |
| Philadelphia Pennsylvania Authority for Industrial Development | 0.00(b) | 04/15/20 | 3,380,000 | 3,309,155 |
| Philadelphia Pennsylvania Authority for Industrial Development | 0.00(b) | 04/15/22 | 1,400,000 | 1,299,536 |
| Total Pennsylvania | 9,780,487 | |||
| Puerto Rico | 0.8% | ||||
| Puerto Rico Highway & Transportation Authority | 5.50 | 07/01/19 | 1,800,000 | 1,800,000 |
| Puerto Rico Highway & Transportation Authority | 6.25 | 07/01/21 | 2,400,000 | 2,501,808 |
| Puerto Rico, Commonwealth of | 5.50 | 07/01/19 | 250,000 | 250,000 |
| Total Puerto Rico | 4,551,808 | |||
| Portfolio of Investments | The accompanying notes are an integral part of these financial statements. |
| Municipal Bonds | 5.7% of portfolio (Continued) | ||||
| Interest Rate /Yield | Maturity Date | Face Amount | Value | |
| Wisconsin | 0.4% | ||||
| Wisconsin, Public Finance Authority | 2.82% | 03/01/20 | $910,000 | $910,118 |
| Wisconsin, Public Finance Authority | 2.75 | 06/01/20 | 1,575,000 | 1,569,173 |
| Total Wisconsin | 2,479,291 | |||
| Total Municipal Bonds | ||||
| (Cost $32,157,941) | 32,581,554 | |||
| Mortgage-Backed Securities | 0.2% of portfolio | ||||
| ACE Securities Corp. 06-ASL1 | 2.71(c) | 02/25/36 | 208,513 | 99,387 |
| Amresco Residential Securities 98-1 | 7.12(c) | 10/25/27 | 26,726 | 28,814 |
| Bear Stearns ALT-A Trust 06-6 | 4.11(c) | 11/25/36 | 1,369 | 1,263 |
| Bear Stearns Asset Backed Securities Trust 03-3 | 3.61(c) | 06/25/43 | 29,069 | 29,241 |
| Bear Stearns Asset Backed Securities Trust 04-HE5 | 4.30(c) | 07/25/34 | 29,712 | 30,223 |
| Bear Stearns Structured Products Inc., 00-1 (a) | 7.33(c) | 08/28/33 | 54 | 54 |
| CDC Mortgage Capital Trust 02-HE1 | 3.05(c) | 01/25/33 | 180,028 | 179,065 |
| Chaseflex Trust 05-2 | 6.00 | 06/25/35 | 270 | 260 |
| CITICORP Mortgage Securities, Inc. 07-1 | 5.25(d) | 03/25/37 | 38,954 | 39,634 |
| Cityscape Home Equity Loan Trust 96-2 | 8.10 | 08/25/26 | 45,055 | 45,011 |
| Conseco Finance Securitizations Corp. 01-2 | 7.10 | 02/01/33 | 83,004 | 86,947 |
| Contimortgage Home Equity Loan Trust 95-2 | 8.10 | 08/15/25 | 20,205 | 11,926 |
| Countrywide Asset Backed Certificate 02-S2 (e) | 5.98 | 01/25/17 | 1,688 | 1,682 |
| Countrywide Asset Backed Certificate 02-S4 (e) | 4.70(c) | 10/25/17 | 7,474 | 7,713 |
| Countrywide Asset Backed Certificate 04-S1 | 5.12 | 02/25/35 | 9,594 | 9,677 |
| FHLMC 780754 | 4.43(c) | 08/01/33 | 1,160 | 1,223 |
| FNMA 813842 | 4.25(c) | 01/01/35 | 4,207 | 4,335 |
| GMAC Mortgage Corp. Loan Trust 06-HE3 | 5.75 | 10/25/36 | 14,792 | 15,588 |
| Green Tree Financial Corp. 98-5 | 6.22 | 03/01/30 | 29,824 | 31,031 |
| Master Asset Backed Securities Trust 07-NCW (a) | 2.73(c) | 05/25/37 | 254,773 | 242,248 |
| Option One Mortgage Loan Trust 07-FXD2 | 5.90 | 03/25/37 | 4,716 | 4,751 |
| Residential Asset Securitization Trust 04-A3 | 5.25 | 06/25/34 | 54 | 54 |
| Salomon Brothers Mortgage Securities 97-LB6 | 6.82 | 12/25/27 | 3 | 3 |
| Total Mortgage-Backed Securities | ||||
| (Cost $969,477) | 870,130 | |||
| Corporate Bond Guaranteed by Export-Import Bank of the United States | less than 0.1% of portfolio | ||||
| Energy | Less than 0.1% | ||||
| Petroleos Mexicanos | 2.46 | 12/15/25 | 285,350 | 288,361 |
| Total Energy | 288,361 | |||
| Total Corporate Bond Guaranteed by Export-Import Bank of the United States | ||||
| (Cost $282,323) | 288,361 | |||
| Commercial Paper | 3.6% of portfolio | ||||
| Duke Energy Corp. (a) | 2.47 | 07/01/19 | 20,400,000 | 20,395,743 |
| Total Commercial Paper | ||||
| (Cost $20,400,000) | 20,395,743 | |||
| Total Investments in Securities | ||||
| (Cost $560,840,316) | 100.0% | $567,297,179 | |||
| The accompanying notes are an integral part of these financial statements. | Portfolio of Investments |
| (a) | Security was purchased pursuant to Rule 144A under the Securities Act of 1933 and may be resold in transactions exempt from registration, normally to qualified institutional buyers. The securities have been determined to be liquid under criteria established by the Fund's Board of Directors. The total of such securities at period-end amounts to $152,717,733 and represents 26.9% of total investments. |
| (b) | Zero coupon rate, purchased at a discount. |
| (c) | Variable coupon rate as of June 30, 2019. |
| (d) | Step coupon security, the current rate may be adjusted upwards before maturity date. |
| (e) | Security did not mature on maturity date. While additional principal and interest have been received past the maturity date, the amount and timing of future payments is uncertain. |
| Portfolio of Investments | The accompanying notes are an integral part of these financial statements. |
| U.S. Government & Agency Obligations | 28.4% of portfolio | ||||
| Interest Rate / Yield | Maturity Date | Face Amount | Value | |
| Federal Home Loan Bank | 3.25% | 11/16/28 | $55,000 | $59,771 |
| U.S. Treasury Note | 2.25 | 04/30/21 | 525,000 | 529,307 |
| U.S. Treasury Note | 2.13 | 05/31/21 | 65,000 | 65,424 |
| U.S. Treasury Note | 2.13 | 05/15/22 | 430,000 | 434,686 |
| U.S. Treasury Note | 1.75 | 06/15/22 | 70,000 | 70,074 |
| U.S. Treasury Note | 2.00 | 05/31/24 | 503,000 | 508,659 |
| U.S. Treasury Note | 2.13 | 05/31/26 | 142,000 | 144,280 |
| U.S. Treasury Note | 2.38 | 05/15/29 | 91,000 | 93,986 |
| U.S. Treasury Note | 3.00 | 02/15/49 | 498,000 | 546,166 |
| Total U.S. Government & Agency Obligations | ||||
| (Cost $2,425,730) | 2,452,353 | |||
| Corporate Bonds–Other | 20.7% of portfolio | ||||
| Communication Services | 1.0% | ||||
| Charter Communications Operating LLC | 5.38 | 04/01/38 | 70,000 | 74,898 |
| Sprint Communications, Inc. | 6.00 | 11/15/22 | 15,000 | 15,637 |
| Total Communication Services | 90,535 | |||
| Consumer Discretionary | 1.3% | ||||
| General Motors Co. | 5.15 | 04/01/38 | 116,000 | 114,531 |
| Total Consumer Discretionary | 114,531 | |||
| Energy | 2.7% | ||||
| Energy Transfer Operating LP | 5.25 | 04/15/29 | 92,000 | 102,883 |
| Murphy Oil Corp. | 4.20(a) | 12/01/22 | 126,000 | 127,103 |
| Total Energy | 229,986 | |||
| Financials | 7.8% | ||||
| Bank of America Corp. | 3.95 | 04/21/25 | 235,000 | 246,277 |
| Citigroup Inc. | 4.04(b) | 06/01/24 | 239,000 | 252,546 |
| Goldman Sachs Group Inc. | 3.81(b) | 04/23/29 | 77,000 | 80,187 |
| JPMorgan Chase & Co. | 3.63 | 12/01/27 | 20,000 | 20,601 |
| Synchrony Financial | 4.38 | 03/19/24 | 68,000 | 71,173 |
| Total Financials | 670,784 | |||
| Health Care | 5.3% | ||||
| AbbVie Inc. | 4.88 | 11/14/48 | 71,000 | 74,693 |
| Allergan Funding SCS | 3.45 | 03/15/22 | 17,000 | 17,352 |
| Becton Dickinson and Co. | 3.50(b) | 06/06/22 | 211,000 | 212,412 |
| CVS Health Corp. | 4.10 | 03/25/25 | 68,000 | 71,681 |
| HCA Healthcare Inc. | 5.13 | 06/15/39 | 80,000 | 83,097 |
| Total Health Care | 459,235 | |||
| Industrials | 1.0% | ||||
| Parker-Hannifin Corp. | 3.25 | 06/14/29 | 80,000 | 82,939 |
| Total Industrials | 82,939 | |||
| Information Technology | 1.1% | ||||
| Microsoft Corp. | 3.70 | 08/08/46 | 89,000 | 95,729 |
| Total Information Technology | 95,729 | |||
| The accompanying notes are an integral part of these financial statements. | Portfolio of Investments |
| Corporate Bonds–Other | 20.7% of portfolio (Continued) | ||||
| Interest Rate /Yield | Maturity Date | Face Amount | Value | |
| Utilities | 0.5% | ||||
| Duke Energy Carolinas LLC | 4.00% | 09/30/42 | $36,000 | $38,611 |
| TerraForm Power Operating LLC (c) | 4.25 | 01/31/23 | 7,000 | 7,009 |
| Total Utilities | 45,620 | |||
| Total Corporate Bonds–Other | ||||
| (Cost $1,744,620) | 1,789,359 | |||
| Mortgage-Backed Securities | 19.2% of portfolio | ||||
| Federal National Mortgage Association (d) | 3.00 | 07/15/49 | 547,000 | 551,416 |
| Federal National Mortgage Association (d) | 3.50 | 07/15/49 | 539,000 | 550,875 |
| Federal National Mortgage Association (d) | 4.00 | 07/15/49 | 532,000 | 549,716 |
| Total Mortgage-Backed Securities | ||||
| (Cost $1,648,271) | 1,652,007 | |||
| Asset-Backed Securities | 4.4% of portfolio | ||||
| Drive Auto Receivables Trust 19-3 | 2.63 | 09/15/22 | 100,000 | 100,158 |
| GLS Auto Receivables Trust 19-2 (c) | 3.06 | 04/17/23 | 9,633 | 9,688 |
| Marlette Funding Trust 19-3 (c) | 2.69 | 09/17/29 | 100,000 | 99,992 |
| Prosper Marketplace Issuance Trust 19-3 (c) | 3.19 | 07/15/25 | 100,000 | 100,353 |
| United Auto Credit Securitization Trust 19-1 (c) | 2.82 | 07/12/21 | 69,726 | 69,809 |
| Total Asset-Backed Securities | ||||
| (Cost $379,342) | 380,000 | |||
| Yankee Bonds | 1.6% of portfolio | ||||
| NOVA Chemicals Corp. (c) | 4.88 | 06/01/24 | 110,000 | 113,850 |
| Seagate HDD Cayman | 4.75 | 01/01/25 | 23,000 | 23,232 |
| Total Yankee Bonds | ||||
| (Cost $128,950) | 137,082 | |||
| Money Market Fund | 25.7% of portfolio | ||||
| Shares | ||||
| State Street Institutional U.S. Government Money Market Fund | 2.31(e) | 2,220,187 | 2,220,187 | |
| Total Money Market Fund | ||||
| (Cost $2,220,187) | 2,220,187 | |||
| Total Investments in Securities | ||||
| (Cost $8,547,100) | 100.0% | $8,630,988 | |||
| (a) | Step coupon security, the current rate may be adjusted upwards before maturity date. |
| (b) | Variable coupon rate as of June 30, 2019. |
| (c) | Security was purchased pursuant to Rule 144A under the Securities Act of 1933 and may be resold in transactions exempt from registration, normally to qualified institutional buyers. The securities have been determined to be liquid under criteria established by the Fund's Board of Trustees. The total of such securities at period-end amounts to $400,701 and represents 4.6% of total investments. |
| (d) | Security purchased on a to-be-announced (TBA) basis. |
| (e) | 7-day yield at June 30, 2019. |
| Portfolio of Investments | The accompanying notes are an integral part of these financial statements. |
| Cost | Value | |
| Investment | $44,917,646 | $153,640,634 |
| The accompanying notes are an integral part of these financial statements. | Portfolio of Investments |
| Common Stocks | 99.3% of portfolio | ||
| Shares | Value | |
| Communication Services | 5.3% | ||
| Diversified Telecommunication Services | ||
| Verizon Communications, Inc. | 234,000 | $13,368,420 |
| Interactive Media & Services | ||
| Alphabet, Inc., Class C (a) | 34,000 | 36,750,940 |
| Total Communication Services | 50,119,360 | |
| Consumer Discretionary | 2.6% | ||
| Distributors | ||
| Genuine Parts Co. | 240,400 | 24,900,632 |
| Total Consumer Discretionary | 24,900,632 | |
| Energy | 10.0% | ||
| Energy Equipment & Services | ||
| Halliburton Co. | 110,444 | 2,511,497 |
| Helmerich & Payne, Inc. | 110,000 | 5,568,200 |
| Oil, Gas & Consumable Fuels | ||
| Chevron Corp. | 295,000 | 36,709,800 |
| ConocoPhillips | 452,400 | 27,596,400 |
| Royal Dutch Shell PLC ADR | 353,000 | 23,206,220 |
| Total Energy | 95,592,117 | |
| Financials | 15.8% | ||
| Banks | ||
| Bank of America Corp. | 750,200 | 21,755,800 |
| Citigroup, Inc. | 296,000 | 20,728,880 |
| JPMorgan Chase & Co. | 342,600 | 38,302,680 |
| Wells Fargo & Co. | 221,000 | 10,457,720 |
| Capital Markets | ||
| Goldman Sachs Group, Inc. | 47,565 | 9,731,799 |
| Insurance | ||
| Allstate Corp. | 369,000 | 37,523,610 |
| Chubb Ltd. | 85,469 | 12,588,729 |
| Total Financials | 151,089,218 | |
| Health Care | 23.0% | ||
| Health Care Equipment & Supplies | ||
| Abbott Laboratories | 399,000 | 33,555,900 |
| Boston Scientific Corp. (a) | 354,195 | 15,223,301 |
| Medtronic PLC | 146,465 | 14,264,227 |
| Health Care Providers & Services | ||
| Centene Corp. (a) | 232,244 | 12,178,875 |
| Cigna Corp. | 90,111 | 14,196,988 |
| Life Sciences Tools & Services | ||
| Mettler-Toledo International, Inc. (a) | 39,000 | 32,760,000 |
| Pharmaceuticals | ||
| Allergan PLC | 80,129 | 13,415,998 |
| Bristol-Myers Squibb Co. | 342,530 | 15,533,736 |
| Merck & Co., Inc. | 385,100 | 32,290,635 |
| Pfizer, Inc. | 824,000 | 35,695,680 |
| Total Health Care | 219,115,340 | |
| Common Stocks | 99.3% of portfolio (Continued) | ||
| Shares | Value | |
| Industrials | 12.1% | ||
| Airlines | ||
| Southwest Airlines Co. | 367,800 | $18,676,884 |
| Industrial Conglomerates | ||
| Honeywell International, Inc. | 231,100 | 40,347,749 |
| Machinery | ||
| Parker-Hannifin Corp. | 246,400 | 41,890,464 |
| Stanley Black & Decker, Inc. | 33,000 | 4,772,130 |
| Road & Rail | ||
| CSX Corp. | 119,100 | 9,214,767 |
| Total Industrials | 114,901,994 | |
| Information Technology | 21.7% | ||
| Communications Equipment | ||
| Cisco Systems, Inc. | 721,638 | 39,495,248 |
| Electronic Equipment, Instruments & Components | ||
| TE Connectivity Ltd. | 262,850 | 25,175,773 |
| IT Services | ||
| Leidos Holdings Inc. | 250,750 | 20,022,387 |
| Visa Inc., Class A | 282,000 | 48,941,100 |
| Semiconductors & Semiconductor Equipment | ||
| Intel Corp. | 49,041 | 2,347,593 |
| NVIDIA Corp. | 58,777 | 9,652,947 |
| NXP Semiconductors NV | 76,278 | 7,445,495 |
| Software | ||
| Microsoft Corp. | 377,000 | 50,502,920 |
| Tyler Technologies, Inc. (a) | 14,000 | 3,024,280 |
| Total Information Technology | 206,607,743 | |
| Materials | 8.8% | ||
| Chemicals | ||
| Corteva, Inc. | 237,300 | 7,016,961 |
| Dow Inc. | 237,300 | 11,701,263 |
| DuPont de Nemours, Inc. | 237,300 | 17,814,111 |
| Containers & Packaging | ||
| Amcor PLC (a) | 615,060 | 7,067,039 |
| Avery Dennison Corp. | 350,000 | 40,488,000 |
| Total Materials | 84,087,374 | |
| Total Common Stocks | ||
| (Cost $493,097,767) | 946,413,778 | |
| Commercial Paper | 0.7% of portfolio | ||
| Face Amount | ||
| Duke Energy Corp., 2.47%, 07/01/19 (b) | $7,000,000 | 6,998,539 |
| Total Commercial Paper | ||
| (Cost $7,000,000) | 6,998,539 | |
| Total Investments in Securities | ||
| (Cost $500,097,767) | 100.0% | $953,412,317 | |
| Portfolio of Investments | The accompanying notes are an integral part of these financial statements. |
| (a) | Non-income producing. |
| (b) | Security was purchased pursuant to Rule 144A under the Securities Act of 1933 and may be resold in transactions exempt from registration, normally to qualified institutional buyers. The securities have been determined to be liquid under criteria established by the Fund's Board of Directors. The total of such securities at period-end amounts to $6,998,539 and represents 0.7% of total investments. |
| The accompanying notes are an integral part of these financial statements. | Portfolio of Investments |
| Common Stocks | 98.4% of portfolio | ||
| Shares | Value | |
| Communication Services | 17.3% | ||
| Entertainment | ||
| Electronic Arts Inc. (a) | 10,278 | $1,040,750 |
| Netflix, Inc. (a) | 8,484 | 3,116,343 |
| Tencent Music Entertainment Group ADR (a) | 81,378 | 1,219,856 |
| Interactive Media & Services | ||
| Alphabet, Inc., Class C (a) | 4,400 | 4,756,004 |
| Alphabet, Inc., Class A (a) | 8,947 | 9,687,812 |
| Facebook, Inc., Class A (a) | 66,825 | 12,897,225 |
| IAC/InterActiveCorp (a) | 7,965 | 1,732,626 |
| Tencent Holdings Ltd. ADR | 117,464 | 5,316,421 |
| Total Communication Services | 39,767,037 | |
| Consumer Discretionary | 19.6% | ||
| Auto Components | ||
| Aptiv PLC | 41,306 | 3,338,764 |
| Hotels, Restaurants & Leisure | ||
| Hilton Worldwide Holdings, Inc. | 25,541 | 2,496,377 |
| Las Vegas Sands Corp. | 22,408 | 1,324,089 |
| McDonald's Corp. | 6,969 | 1,447,182 |
| Restaurant Brands International Inc. | 24,790 | 1,723,897 |
| Internet & Direct Marketing Retail | ||
| Alibaba Group Holding Ltd. ADR (a) | 29,421 | 4,985,389 |
| Amazon.com, Inc. (a) | 10,370 | 19,636,943 |
| Booking Holdings, Inc. (a) | 1,316 | 2,467,118 |
| Multiline Retail | ||
| Dollar General Corp. | 23,659 | 3,197,750 |
| Specialty Retail | ||
| Ross Stores, Inc. | 25,757 | 2,553,034 |
| Textiles, Apparel & Luxury Goods | ||
| NIKE, Inc., Class B | 24,601 | 2,065,254 |
| Total Consumer Discretionary | 45,235,797 | |
| Consumer Staples | 0.9% | ||
| Tobacco | ||
| Philip Morris International, Inc. | 25,805 | 2,026,466 |
| Total Consumer Staples | 2,026,466 | |
| Energy | 0.5% | ||
| Oil, Gas & Consumable Fuels | ||
| Concho Resources Inc. | 10,616 | 1,095,359 |
| Total Energy | 1,095,359 | |
| Financials | 3.7% | ||
| Capital Markets | ||
| Charles Schwab Corp. | 79,951 | 3,213,231 |
| Intercontinental Exchange, Inc. | 26,797 | 2,302,934 |
| Morgan Stanley | 33,554 | 1,470,001 |
| TD Ameritrade Holding Corp. | 29,410 | 1,468,147 |
| Total Financials | 8,454,313 | |
| Common Stocks | 98.4% of portfolio (Continued) | ||
| Shares | Value | |
| Health Care | 15.4% | ||
| Biotechnology | ||
| Alexion Pharmaceuticals, Inc. (a) | 9,093 | $1,191,001 |
| Vertex Pharmaceuticals, Inc. (a) | 18,162 | 3,330,548 |
| Health Care Equipment & Supplies | ||
| Becton, Dickinson & Co. | 17,518 | 4,414,711 |
| Intuitive Surgical, Inc. (a) | 8,775 | 4,602,926 |
| Stryker Corp. | 25,982 | 5,341,380 |
| Health Care Providers & Services | ||
| Anthem, Inc. | 7,190 | 2,029,090 |
| Centene Corp. (a) | 21,639 | 1,134,749 |
| Cigna Corp. | 24,641 | 3,882,190 |
| HCA Healthcare, Inc. | 28,358 | 3,833,151 |
| UnitedHealth Group, Inc. | 7,245 | 1,767,852 |
| WellCare Health Plans, Inc. (a) | 4,220 | 1,202,995 |
| Life Sciences Tools & Services | ||
| Avantor, Inc. (a) | 80,109 | 1,529,281 |
| Pharmaceuticals | ||
| Eli Lilly & Co. | 10,537 | 1,167,394 |
| Total Health Care | 35,427,268 | |
| Industrials | 9.3% | ||
| Aerospace & Defense | ||
| Boeing Co. | 30,424 | 11,074,640 |
| Northrop Grumman Corp. | 7,625 | 2,463,714 |
| Spirit AeroSystem Holdings, Inc., Class A | 12,335 | 1,003,699 |
| Commercial Services & Supplies | ||
| Waste Connections, Inc. | 20,752 | 1,983,476 |
| Industrial Conglomerates | ||
| Honeywell International, Inc. | 7,068 | 1,234,002 |
| Machinery | ||
| Fortive Corp. | 12,932 | 1,054,217 |
| PACCAR Inc. | 16,997 | 1,218,005 |
| Road & Rail | ||
| J.B. Hunt Transport Services, Inc. | 11,500 | 1,051,215 |
| Uber Technologies, Inc. (a) | 7,581 | 351,607 |
| Total Industrials | 21,434,575 | |
| Information Technology | 30.4% | ||
| IT Services | ||
| Fidelity National Information Services, Inc. | 11,031 | 1,353,283 |
| Global Payments, Inc. | 21,005 | 3,363,531 |
| PayPal Holdings, Inc. (a) | 31,706 | 3,629,069 |
| Total System Services, Inc. | 15,573 | 1,997,549 |
| Visa Inc., Class A | 68,561 | 11,898,761 |
| Semiconductors & Semiconductor Equipment | ||
| ASML Holding NV ADR | 8,701 | 1,809,199 |
| Marvell Technology Group Ltd. | 80,949 | 1,932,253 |
| Maxim Integrated Products, Inc. | 23,565 | 1,409,658 |
| Software | ||
| Atlassian Corp. PLC, Class A (a) | 1,646 | 215,363 |
| Intuit, Inc. | 20,039 | 5,236,792 |
| Portfolio of Investments | The accompanying notes are an integral part of these financial statements. |
| Common Stocks | 98.4% of portfolio (Continued) | ||
| Shares | Value | |
| Information Technology | 30.4% (Continued) | ||
| Microsoft Corp. | 121,169 | $16,231,799 |
| Red Hat, Inc. (a) | 13,908 | 2,611,366 |
| salesforce.com, Inc. (a) | 20,240 | 3,071,015 |
| ServiceNow, Inc. (a) | 7,687 | 2,110,619 |
| Splunk Inc. (a) | 18,200 | 2,288,650 |
| Temenos AG ADR | 4,495 | 803,158 |
| VMware, Inc., Class A | 23,394 | 3,911,711 |
| Workday, Inc., Class A (a) | 10,565 | 2,171,953 |
| Zoom Video Communications, Inc. (a) | 590 | 52,386 |
| Technology Hardware, Storage & Peripherals | ||
| Apple, Inc. | 19,593 | 3,877,846 |
| Total Information Technology | 69,975,961 | |
| Utilities | 1.3% | ||
| Multi-Utilities | ||
| Sempra Energy | 13,523 | 1,858,601 |
| Common Stocks | 98.4% of portfolio (Continued) | ||
| Shares | Value | |
| Utilities | 1.3% (Continued) | ||
| Water Utilities | ||
| American Water Works Co., Inc. | 9,551 | $1,107,916 |
| Total Utilities | 2,966,517 | |
| Total Common Stocks | ||
| (Cost $154,546,910) | 226,383,293 | |
| Money Market Fund | 1.6% of portfolio | ||
| State Street Institutional U.S. Government Money Market Fund, 2.31% (b) | 3,662,192 | 3,662,192 |
| Total Money Market Fund | ||
| (Cost $3,662,192) | 3,662,192 | |
| Total Investments in Securities | ||
| (Cost $158,209,102) | 100.0% | $230,045,485 | |
| (a) | Non-income producing. |
| (b) | 7-day yield at June 30, 2019. |
| The accompanying notes are an integral part of these financial statements. | Portfolio of Investments |
| Common Stocks | 93.5% of portfolio | ||
| Shares | Value | |
| Communication Services | 1.0% | ||
| Diversified Telecommunication Services | ||
| ORBCOMM Inc. (a) | 611,276 | $4,431,751 |
| Total Communication Services | 4,431,751 | |
| Consumer Discretionary | 12.3% | ||
| Distributors | ||
| Core-Mark Holding Company, Inc. | 416,467 | 16,542,069 |
| Hotels, Restaurants & Leisure | ||
| BJ’s Restaurants, Inc. | 193,801 | 8,515,616 |
| Cracker Barrel Old Country Store, Inc. | 92,882 | 15,857,744 |
| Textiles, Apparel & Luxury Goods | ||
| Carter's, Inc. | 20,717 | 2,020,736 |
| G-III Apparel Group, Ltd. (a) | 390,289 | 11,482,303 |
| Total Consumer Discretionary | 54,418,468 | |
| Consumer Staples | 0.7% | ||
| Food Products | ||
| TreeHouse Foods, Inc. (a) | 57,131 | 3,090,787 |
| Total Consumer Staples | 3,090,787 | |
| Energy | 1.1% | ||
| Energy Equipment & Services | ||
| RPC, Inc. | 285,544 | 2,058,772 |
| Oil, Gas & Consumable Fuels | ||
| Callon Petroleum Co. (a) | 439,842 | 2,898,559 |
| Total Energy | 4,957,331 | |
| Financials | 19.8% | ||
| Banks | ||
| Atlantic Union Bankshares Corp. | 145,743 | 5,149,100 |
| Cadence Bancorporation | 435,723 | 9,063,038 |
| CenterState Bank Corp. | 195,599 | 4,504,645 |
| FB Financial Corp. | 156,991 | 5,745,871 |
| Glacier Bancorp, Inc. | 343,954 | 13,947,335 |
| Metropolitan Bank Holding Corp. (a) | 150,175 | 6,607,700 |
| Texas Capital Bancshares, Inc. (a) | 123,316 | 7,567,903 |
| Consumer Finance | ||
| Encore Capital Group, Inc. (a) | 329,715 | 11,167,447 |
| Insurance | ||
| Kinsale Capital Group, Inc. | 171,830 | 15,719,008 |
| National General Holdings Corp. | 356,249 | 8,172,352 |
| Total Financials | 87,644,399 | |
| Health Care | 13.7% | ||
| Biotechnology | ||
| Emergent BioSolutions Inc. (a) | 58,190 | 2,811,159 |
| Health Care Equipment & Supplies | ||
| ICU Medical, Inc. (a) | 34,007 | 8,566,703 |
| Common Stocks | 93.5% of portfolio (Continued) | ||
| Shares | Value | |
| Health Care | 13.7% (Continued) | ||
| Merit Medical Systems, Inc. (a) | 90,009 | $5,360,936 |
| STAAR Surgical Co. (a) | 113,529 | 3,335,482 |
| STERIS PLC | 104,123 | 15,501,832 |
| Health Care Providers & Services | ||
| AMN Healthcare Services, Inc. (a) | 87,446 | 4,743,946 |
| LHC Group, Inc. (a) | 43,335 | 5,181,999 |
| Life Sciences Tools & Services | ||
| Medpace Holdings, Inc. (a) | 50,460 | 3,301,093 |
| NanoString Technologies, Inc. (a) | 384,197 | 11,660,379 |
| Total Health Care | 60,463,529 | |
| Industrials | 18.0% | ||
| Aerospace & Defense | ||
| BWX Technologies, Inc. | 38,864 | 2,024,814 |
| Commercial Services & Supplies | ||
| Interface, Inc. | 270,717 | 4,150,092 |
| Construction & Engineering | ||
| Dycom Industries, Inc. (a) | 190,884 | 11,237,341 |
| Primoris Services Corp. | 439,562 | 9,200,033 |
| Machinery | ||
| Colfax Corp. (a) | 161,267 | 4,520,314 |
| NN, Inc. | 784,014 | 7,651,977 |
| Welbilt, Inc. | 737,850 | 12,322,095 |
| Road & Rail | ||
| Covenant Transportation Group, Inc., Class A (a) | 115,159 | 1,693,989 |
| Knight-Swift Transportation Holdings Inc. | 200,865 | 6,596,406 |
| Werner Enterprises, Inc. | 277,088 | 8,611,895 |
| Trading Companies & Distributors | ||
| Applied Industrial Technologies, Inc. | 184,655 | 11,361,822 |
| Total Industrials | 79,370,778 | |
| Information Technology | 19.6% | ||
| Electronic Equipment, Instruments & Components | ||
| Belden Inc. | 207,152 | 12,340,044 |
| Itron, Inc. (a) | 43,426 | 2,717,165 |
| Knowles Corp. (a) | 281,141 | 5,147,692 |
| IT Services | ||
| CACI International Inc., Class A (a) | 25,051 | 5,125,184 |
| Cass Information Systems, Inc. | 99,818 | 4,839,177 |
| ManTech International Corp., Class A | 167,660 | 11,040,411 |
| Semiconductors & Semiconductor Equipment | ||
| Advanced Energy Industries, Inc. (a) | 48,581 | 2,733,653 |
| Software | ||
| Altair Engineering Inc. (a) | 91,927 | 3,712,932 |
| Portfolio of Investments | The accompanying notes are an integral part of these financial statements. |
| Common Stocks | 93.5% of portfolio (Continued) | ||
| Shares | Value | |
| Information Technology | 19.6% (Continued) | ||
| Descartes Systems Group Inc. (The) (a) | 380,840 | $14,072,038 |
| Five9, Inc. (a) | 84,712 | 4,344,878 |
| j2 Global, Inc | 171,144 | 15,212,990 |
| Tenable Holdings, Inc. (a) | 178,598 | 5,097,187 |
| Total Information Technology | 86,383,351 | |
| Materials | 6.1% | ||
| Chemicals | ||
| Ingevity Corp. (a) | 38,865 | 4,087,432 |
| PolyOne Corp. | 308,243 | 9,675,748 |
| Construction Materials | ||
| Summit Materials, Inc., Class A (a) | 677,007 | 13,032,385 |
| Total Materials | 26,795,565 | |
| Real Estate | 1.2% | ||
| Equity Real Estate Investment Trusts (REITs) | ||
| QTS Realty Trust, Inc. Class A | 110,777 | 5,115,682 |
| Total Real Estate | 5,115,682 | |
| Total Common Stocks | ||
| (Cost $330,145,279) | 412,671,641 | |
| Exchange Traded Fund | 2.0% of portfolio | ||
| Shares | Value | |
| iShares Core S&P Small-Cap ETF | 110,000 | $8,610,800 |
| Total Exchange Traded Fund | ||
| (Cost $8,415,220) | 8,610,800 | |
| Money Market Fund | 4.5% of portfolio | ||
| State Street Institutional U.S. Government Money Market Fund, 2.31% (b) | 20,081,141 | 20,081,141 |
| Total Money Market Fund | ||
| (Cost $20,081,141) | 20,081,141 | |
| Total Investments in Securities | ||
| (Cost $358,641,640) | 100.0% | $441,363,582 | |
| (a) | Non-income producing. |
| (b) | 7-day yield at June 30, 2019. |
| The accompanying notes are an integral part of these financial statements. | Portfolio of Investments |
| Common Stocks | 94.9% of portfolio | ||
| Shares | Value | |
| Brazil | 0.5% | ||
| Ambev SA ADR | 77,706 | $362,887 |
| Total Brazil | 362,887 | |
| Britain | 9.2% | ||
| Diageo PLC | 44,475 | 1,914,215 |
| HSBC Holdings PLC | 120,820 | 1,008,395 |
| Rio Tinto PLC | 15,408 | 953,648 |
| Royal Dutch Shell PLC, Class B | 43,234 | 1,416,634 |
| Unilever PLC | 27,075 | 1,680,687 |
| Total Britain | 6,973,579 | |
| Canada | 3.2% | ||
| Alimentation Couche-Tard Inc., Class B | 15,400 | 969,122 |
| Canadian National Railway Co. | 15,589 | 1,441,671 |
| Total Canada | 2,410,793 | |
| China | 2.2% | ||
| Baidu, Inc. ADR (a) | 3,060 | 359,121 |
| China Moble Ltd. ADR | 9,865 | 446,786 |
| Ping An Insurance Group Co. of China Ltd., Class H | 42,500 | 511,057 |
| Tencent Holdings Ltd. | 6,900 | 312,152 |
| Total China | 1,629,116 | |
| Denmark | 0.9% | ||
| Novozymes A/S, Class B | 15,400 | 718,053 |
| Total Denmark | 718,053 | |
| France | 6.9% | ||
| Air Liquide SA | 6,115 | 855,295 |
| Dassault Systèmes SE | 9,743 | 1,554,060 |
| L’Oréal SA | 9,837 | 2,796,935 |
| Total France | 5,206,290 | |
| Germany | 15.0% | ||
| adidas AG | 5,087 | 1,573,766 |
| Allianz SE REG | 12,140 | 2,927,878 |
| Bayerische Motoren Werke AG | 1,995 | 147,465 |
| Infineon Technologies AG | 124,414 | 2,210,797 |
| SAP SE ADR | 23,160 | 3,168,288 |
| Symrise AG | 13,132 | 1,264,482 |
| Total Germany | 11,292,676 | |
| Hong Kong | 3.8% | ||
| AIA Group Ltd. | 262,600 | 2,835,791 |
| Total Hong Kong | 2,835,791 | |
| Common Stocks | 94.9% of portfolio (Continued) | ||
| Shares | Value | |
| India | 1.0% | ||
| HDFC Bank Ltd. ADR | 2,972 | $386,479 |
| ICICI Bank Ltd. ADR | 28,169 | 354,648 |
| Total India | 741,127 | |
| Israel | 3.5% | ||
| Check Point Software Technologies Ltd. (a) | 22,865 | 2,643,423 |
| Total Israel | 2,643,423 | |
| Japan | 13.9% | ||
| Chugai Pharmaceutical Co., Ltd. | 19,500 | 1,277,110 |
| Dentsu Inc. | 29,000 | 1,014,230 |
| FANUC Corp. | 4,700 | 873,320 |
| Keyence Corp. | 2,600 | 1,603,478 |
| Komatsu Ltd. | 35,300 | 857,006 |
| Kubota Corp. | 90,700 | 1,515,280 |
| M3, Inc. | 78,900 | 1,447,882 |
| Sysmex Corp. | 16,500 | 1,079,432 |
| Unicharm Corp. | 27,400 | 826,070 |
| Total Japan | 10,493,808 | |
| Mexico | 0.3% | ||
| Fomento Economico Mexicano, SAB de CV ADR | 2,125 | 205,594 |
| Total Mexico | 205,594 | |
| Republic of South Korea | 0.3% | ||
| Samsung Electronics Co., Ltd. GDR | 228 | 231,940 |
| Total Republic of South Korea | 231,940 | |
| Russia | 0.9% | ||
| LUKOIL PJSC ADR | 4,424 | 371,704 |
| Yandex NV, Class A (a) | 8,295 | 315,210 |
| Total Russia | 686,914 | |
| Singapore | 3.2% | ||
| DBS Group Holdings Ltd. | 125,200 | 2,405,099 |
| Total Singapore | 2,405,099 | |
| South Africa | 0.5% | ||
| Naspers Ltd., Class N | 1,054 | 255,121 |
| Sasol Ltd. | 5,662 | 140,788 |
| Total South Africa | 395,909 | |
| Spain | 4.8% | ||
| Amadeus IT Group SA | 17,800 | 1,410,569 |
| Portfolio of Investments | The accompanying notes are an integral part of these financial statements. |
| Common Stocks | 94.9% of portfolio (Continued) | ||
| Shares | Value | |
| Spain | 4.8% (Continued) | ||
| Banco Bilboa Vizcaya Argentaria SA | 326,721 | $1,822,345 |
| Grifols, SA | 12,266 | 362,994 |
| Total Spain | 3,595,908 | |
| Sweden | 6.5% | ||
| Alfa Laval AB | 53,514 | 1,169,417 |
| Atlas Copco AB, Class A | 70,661 | 2,264,377 |
| Epiroc AB, Class A (a) | 80,958 | 843,527 |
| Skandinaviska Enskilda Banken AB, Class A | 68,054 | 630,106 |
| Total Sweden | 4,907,427 | |
| Switzerland | 13.2% | ||
| Lonza Group AG REG | 4,727 | 1,595,801 |
| Nestlé SA ADR | 33,204 | 3,437,352 |
| Roche Holding AG REG | 9,749 | 2,741,298 |
| SGS SA REG | 355 | 904,845 |
| Sonova Holding AG REG | 5,436 | 1,237,226 |
| Total Switzerland | 9,916,522 | |
| Taiwan | 1.0% | ||
| Taiwan Semiconductor Manufacturing Co. Ltd. ADR | 19,323 | 756,882 |
| Total Taiwan | 756,882 | |
| United States of America | 4.1% | ||
| Linde PLC | 8,932 | 1,794,047 |
| Schlumberger Ltd. | 32,495 | 1,291,351 |
| Total United States of America | 3,085,398 | |
| Total Common Stocks | ||
| (Cost $58,032,655) | 71,495,136 | |
| Preferred Stocks | 2.1% of portfolio | ||
| Shares | Value | |
| Brazil | 0.4% | ||
| Itaú Unibanco Holding SA ADR | 32,757 | $308,571 |
| Total Brazil | 308,571 | |
| Germany | 0.5% | ||
| FUCHS PETROLUB SE | 9,378 | 368,183 |
| Total Germany | 368,183 | |
| Republic of South Korea | 0.7% | ||
| Samsung Electronics Co., Ltd. REG GDR | 579 | 482,493 |
| Total Republic of South Korea | 482,493 | |
| Spain | 0.5% | ||
| Grifols, SA ADR | 19,289 | 406,998 |
| Total Spain | 406,998 | |
| Total Preferred Stocks | ||
| (Cost $1,117,793) | 1,566,245 | |
| Money Market Fund | 3.0% of portfolio | ||
| State Street Institutional U.S. Government Money Market Fund, 2.31% (b) | 2,301,839 | 2,301,839 |
| Total Money Market Fund | ||
| (Cost $2,301,839) | 2,301,839 | |
| Total Investments in Securities | ||
| (Cost $61,452,287) | 100.0% | $75,363,220 | |
| (a) | Non-income producing. |
| (b) | 7-day yield at June 30, 2019. |
| The accompanying notes are an integral part of these financial statements. | Portfolio of Investments |
| Assets | Daily Income Fund | Short-Term Government Securities Fund | Short-Term Bond Fund |
| Investments in securities, at value (cost: $154,944,810, $73,476,206, $560,840,316, $8,547,100, $44,917,646, $500,097,767, $158,209,102, $358,641,640 and $61,452,287, respectively) | $154,944,810 | $74,025,144 | $567,297,179 |
| Cash | 8,005,202 | — | — |
| Foreign currency (cost $22,412) | — | — | — |
| Investment securities sold | — | — | 1,195,334 |
| Dividends, interest, and tax reclaims | 83,869 | 315,236 | 2,887,864 |
| Capital shares sold | 1,588,261 | 35,451 | 213,655 |
| Prepaid expenses | 37,385 | 23,362 | 96,438 |
| Due from RE Advisers | — | — | — |
| Total Assets | 164,659,527 | 74,399,193 | 571,690,470 |
| Liabilities | |||
| Investment securities purchased | — | 645,340 | 13,394,341 |
| Accrued expenses | 57,737 | 47,876 | 170,919 |
| Independent Director/Trustee's deferred compensation | 64,358 | 25,681 | 136,027 |
| Due to RE Advisers | 87,114 | 33,434 | 334,845 |
| Due to custodian | — | 7,007 | 407,898 |
| Capital shares redeemed | 133,255 | 7,854 | 73,661 |
| Dividends | 851 | 1,270 | 18,037 |
| Total Liabilities | 343,315 | 768,462 | 14,535,728 |
| Net Assets | $164,316,212 | $73,630,731 | $557,154,742 |
| Net Assets Consist Of: | |||
| Distributable earnings (losses) | (64,357) | 511,761 | 5,878,018 |
| Paid-in-capital applicable to outstanding shares of 164,380,528, 14,104,643, 105,951,172, 1,352,091, 6,963,371, 17,869,506, 20,275,909, 15,457,398 and 8,820,934, respectively | 164,380,569 | 73,118,970 | 551,276,724 |
| Net Assets | $164,316,212 | $73,630,731 | $557,154,742 |
| Net Asset Value Per Share | $1.00 | $5.22 | $5.26 |
| Statements of Assets and Liabilities | The accompanying notes are an integral part of these financial statements. |
| Intermediate Bond Fund | Stock Index Fund | Value Fund | Growth Fund | Small-Company Stock Fund | International Equity Fund |
| $8,630,988 | $153,640,634 | $953,412,317 | $230,045,485 | $441,363,582 | $75,363,220 |
| — | — | — | — | 42,559 | — |
| — | — | — | — | — | 22,409 |
| 199,714 | 55,043 | 10,509,806 | 281,353 | — | 150,227 |
| 27,979 | — | 661,445 | 70,528 | 197,776 | 369,748 |
| 17,275 | 17,471 | 135,401 | 147,270 | 208,595 | 8,466 |
| 55,844 | 34,482 | 162,026 | 47,832 | 103,685 | 21,782 |
| 19,941 | — | — | — | — | — |
| 8,951,741 | 153,747,630 | 964,880,995 | 230,592,468 | 441,916,197 | 75,935,852 |
| 2,018,541 | — | 9,615,255 | 377,962 | 8,745,275 | 367,678 |
| 17,654 | 131,787 | 190,057 | 47,162 | 115,235 | 89,341 |
| 54 | 27,131 | 226,427 | 19,766 | 160,552 | 48,273 |
| — | 53,949 | 465,759 | 149,190 | 332,693 | 32,196 |
| — | — | 427,334 | — | — | — |
| — | 72,514 | 995,420 | 102,494 | 2,870,680 | 16,990 |
| 63 | 2,029 | 393,575 | 11,867 | 377,784 | — |
| 2,036,312 | 287,410 | 12,313,827 | 708,441 | 12,602,219 | 554,478 |
| $6,915,429 | $153,460,220 | $952,567,168 | $229,884,027 | $429,313,978 | $75,381,374 |
| 110,885 | 109,399,760 | 534,451,514 | 78,192,740 | 125,573,274 | 11,249,829 |
| 6,804,544 | 44,060,460 | 418,115,654 | 151,691,287 | 303,740,704 | 64,131,545 |
| $6,915,429 | $153,460,220 | $952,567,168 | $229,884,027 | $429,313,978 | $75,381,374 |
| $5.11 | $22.04 | $53.31 | $11.34 | $27.77 | $8.55 |
| The accompanying notes are an integral part of these financial statements. | Statements of Assets and Liabilities |
| Investment Income | Daily Income Fund | Short-Term Government Securities Fund | Short-Term Bond Fund |
| Interest | $2,013,462 | $911,084 | $8,152,273 |
| Dividends | — | — | — |
| Allocated from Master Portfolio | |||
| Dividends | — | — | — |
| Interest | — | — | — |
| Total Investment Income | 2,013,462 | 911,084 | 8,152,273 |
| Expenses | |||
| Management fees | 416,869 | 167,938 | 1,660,819 |
| Shareholder servicing fees | 78,827 | 44,603 | 92,060 |
| Custodian and accounting fees | 39,167 | 40,023 | 95,691 |
| Legal and audit fees | 32,962 | 16,099 | 100,311 |
| Director, Trustee, and Board meeting expenses | 32,292 | 15,706 | 97,595 |
| Registration fees | 13,690 | 13,390 | 17,423 |
| Printing and regulatory filings | 9,271 | 5,422 | 14,664 |
| Insurance | 3,923 | 1,968 | 12,055 |
| Communication | 3,610 | 2,126 | 5,600 |
| Other expenses | 4,863 | 8,169 | 26,802 |
| Administration fees | — | — | — |
| Allocated from Master Portfolio | — | — | — |
| Total Expenses | 635,474 | 315,444 | 2,123,020 |
| Less fees waived by RE Advisers | — | (35,460) | — |
| Net Expenses | 635,474 | 279,984 | 2,123,020 |
| Net Investment Income (Loss) | 1,377,988 | 631,100 | 6,029,253 |
| Realized and Unrealized Gain (Loss) on Investments | |||
| Net realized gain (loss) on investments | — | (5,765) | (409,279) |
| Net change in unrealized apprecation (depreciation) | — | 1,109,233 | 9,490,055 |
| Net Gain (Loss) On Investments | — | 1,103,468 | 9,080,776 |
| Net Increase In Net Assets From Operations | $1,377,988 | $1,734,568 | $15,110,029 |
| Statements of Operations | The accompanying notes are an integral part of these financial statements. |
| Intermediate Bond Fund | Stock Index Fund | Value Fund | Growth Fund | Small-Company Stock Fund | International Equity Fund |
| $20,001 | $— | $183,091 | $59,533 | $236,553 | $23,322 |
| — | — | 10,372,134 | 861,883 | 4,450,809 | 1,063,252 |
| — | 1,458,138 | — | — | — | — |
| — | 15,162 | — | — | — | — |
| 20,001 | 1,473,300 | 10,555,225 | 921,416 | 4,687,362 | 1,086,574 |
| 4,289 | — | 2,197,017 | 708,816 | 1,882,912 | 267,752 |
| 6,621 | 86,350 | 191,619 | 89,421 | 143,760 | 74,281 |
| 9,267 | 26,652 | 76,391 | 37,515 | 56,649 | 74,903 |
| 6,353 | 29,963 | 160,755 | 39,480 | 85,559 | 14,767 |
| 147 | 29,563 | 157,287 | 39,025 | 79,780 | 15,098 |
| 10,351 | 11,487 | 16,759 | 12,471 | 14,077 | 11,946 |
| 11 | 13,433 | 31,512 | 14,109 | 22,223 | 12,235 |
| — | 3,401 | 18,385 | 4,457 | 10,417 | 1,760 |
| 338 | 5,231 | 12,101 | 5,455 | 8,599 | 4,808 |
| 729 | 5,720 | 20,650 | 6,443 | 14,680 | 4,283 |
| — | 182,832 | — | — | — | — |
| — | 28,798 | — | — | — | — |
| 38,106 | 423,430 | 2,882,476 | 957,192 | 2,318,656 | 481,833 |
| (32,579) | — | — | — | — | (129,086) |
| 5,527 | 423,430 | 2,882,476 | 957,192 | 2,318,656 | 352,747 |
| 14,474 | 1,049,870 | 7,672,749 | (35,776) | 2,368,706 | 733,827 |
| 27,047 | (127,248) | 81,492,461 | 7,527,590 | 40,347,824 | 1,953,764 |
| 83,888 | 23,153,587 | 48,881,384 | 27,621,519 | 47,067,375 | 8,663,405 |
| 110,935 | 23,026,339 | 130,373,845 | 35,149,109 | 87,415,199 | 10,617,169 |
| $125,409 | $24,076,209 | $138,046,594 | $35,113,333 | $89,783,905 | $11,350,996 |
| The accompanying notes are an integral part of these financial statements. | Statements of Operations |
| Daily Income Fund | ||
| Six Months Ended June 30, 2019 (Unaudited) | Year Ended December 31, 2018 | |
| Increase (Decrease) In Net Assets | ||
| Operations | ||
| Net investment income | $1,377,988 | $1,781,962 |
| Net realized gain (loss) on investments | — | — |
| Net change in unrealized appreciation (depreciation) | — | — |
| Increase (decrease) in net assets from operations | 1,377,988 | 1,781,962 |
| Distributions to Shareholders | ||
| Distributions to shareholders | (1,378,720) | (1,781,962) |
| Total Distributions to shareholders | (1,378,720) | (1,781,962) |
| Capital Share Transactions | ||
| Net capital share transactions | 463,155 | (10,073,437) |
| Total increase (decrease) in net assets from capital transactions | 463,155 | (10,073,437) |
| Total Increase (Decrease) In Net Assets | 462,423 | (10,073,437) |
| Net Assets | ||
| Beginning of period | $163,853,789 | $173,927,226 |
| End of period | $164,316,212 | $163,853,789 |
| Statements of Changes in Net Assets | The accompanying notes are an integral part of these financial statements. |
| Short-Term Government Securities Fund | Short-Term Bond Fund | Intermediate Bond Fund | ||
| Six Months Ended June 30, 2019 (Unaudited) | Year Ended December 31, 2018 | Six Months Ended June 30, 2019 (Unaudited) | Year Ended December 31, 2018 | Since Inception May 1, 2019 to June 30, 2019 (Unaudited) |
| $631,100 | $1,043,181 | $6,029,253 | $11,135,781 | $14,474 |
| (5,765) | 1,404 | (409,279) | 203,351 | 27,047 |
| 1,109,233 | (143,002) | 9,490,055 | (1,270,313) | 83,888 |
| 1,734,568 | 901,583 | 15,110,029 | 10,068,819 | 125,409 |
| (631,426) | (1,059,685) | (6,047,153) | (11,376,055) | (14,524) |
| (631,426) | (1,059,685) | (6,047,153) | (11,376,055) | (14,524) |
| (4,390,598) | 1,651,517 | (13,940,673) | 13,097,696 | 6,804,544 |
| (4,390,598) | 1,651,517 | (13,940,673) | 13,097,696 | 6,804,544 |
| (3,287,456) | 1,493,415 | (4,877,797) | 11,790,460 | 6,915,429 |
| $76,918,187 | $75,424,772 | $562,032,539 | $550,242,079 | $— |
| $73,630,731 | $76,918,187 | $557,154,742 | $562,032,539 | $6,915,429 |
| The accompanying notes are an integral part of these financial statements. | Statements of Changes in Net Assets |
| Stock Index Fund | ||
| Six Months Ended June 30, 2019 (Unaudited) | Year Ended December 31, 2018 | |
| Increase (Decrease) In Net Assets | ||
| Operations | ||
| Net investment income | $1,049,870 | $2,065,092 |
| Net realized gain (loss) on investments | (127,248) | 1,283,303 |
| Net change in unrealized appreciation (depreciation) | 23,153,587 | (10,109,545) |
| Increase (decrease) in net assets from operations | 24,076,209 | (6,761,150) |
| Distributions to Shareholders | ||
| Distributions to shareholders | (255,922) | (2,625,112) |
| Total Distributions to shareholders | (255,922) | (2,625,112) |
| Capital Share Transactions | ||
| Net capital share transactions | (4,294,253) | (1,773,979) |
| Total increase (decrease) in net assets from capital transactions | (4,294,253) | (1,773,979) |
| Total Increase (Decrease) In Net Assets | 19,526,034 | (11,160,241) |
| Net Assets | ||
| Beginning of period | $133,934,186 | $145,094,427 |
| End of period | $153,460,220 | $133,934,186 |
| Statements of Changes in Net Assets | The accompanying notes are an integral part of these financial statements. |
| Value Fund | Growth Fund | Small-Company Stock Fund | |||
| Six Months Ended June 30, 2019 (Unaudited) | Year Ended December 31, 2018 | Six Months Ended June 30, 2019 (Unaudited) | Year Ended December 31, 2018 | Six Months Ended June 30, 2019 (Unaudited) | Year Ended December 31, 2018 |
| $7,672,749 | $16,329,001 | $(35,776) | $294,109 | $2,368,706 | $2,568,725 |
| 81,492,461 | 81,100,003 | 7,527,590 | 19,033,343 | 40,347,824 | 217,695,361 |
| 48,881,384 | (156,332,971) | 27,621,519 | (13,337,473) | 47,067,375 | (433,694,859) |
| 138,046,594 | (58,903,967) | 35,113,333 | 5,989,979 | 89,783,905 | (213,430,773) |
| (15,328,405) | (89,984,419) | (1,904,059) | (20,113,936) | (41,200,817) | (122,418,197) |
| (15,328,405) | (89,984,419) | (1,904,059) | (20,113,936) | (41,200,817) | (122,418,197) |
| (45,416,997) | (94,554,235) | 2,207,624 | 30,570,695 | (106,261,680) | (454,592,108) |
| (45,416,997) | (94,554,235) | 2,207,624 | 30,570,695 | (106,261,680) | (454,592,108) |
| 77,301,192 | (243,442,621) | 35,416,898 | 16,446,738 | (57,678,592) | (790,441,078) |
| $875,265,976 | $1,118,708,597 | $194,467,129 | $178,020,391 | $486,992,570 | $1,277,433,648 |
| $952,567,168 | $875,265,976 | $229,884,027 | $194,467,129 | $429,313,978 | $486,992,570 |
| The accompanying notes are an integral part of these financial statements. | Statements of Changes in Net Assets |
| International Equity Fund | ||
| Six Months Ended June 30, 2019 (Unaudited) | Year Ended December 31, 2018 | |
| Increase (Decrease) In Net Assets | ||
| Operations | ||
| Net investment income | $733,827 | $1,042,997 |
| Net realized gain (loss) on investments | 1,953,764 | 1,091,500 |
| Net change in unrealized appreciation (depreciation) | 8,663,405 | (11,742,258) |
| Increase (decrease) in net assets from operations | 11,350,996 | (9,607,761) |
| Distributions to Shareholders | ||
| Distributions to shareholders | — | (1,151,141) |
| Total Distributions to shareholders | — | (1,151,141) |
| Capital Share Transactions | ||
| Net capital share transactions | (2,051,498) | 2,702,686 |
| Total increase (decrease) in net assets from capital transactions | (2,051,498) | 2,702,686 |
| Total Increase (Decrease) In Net Assets | 9,299,498 | (8,056,216) |
| Net Assets | ||
| Beginning of period | $66,081,876 | $74,138,092 |
| End of period | $75,381,374 | $66,081,876 |
| Statements of Changes in Net Assets | The accompanying notes are an integral part of these financial statements. |
| Six Months Ended June 30, 2019 (Unaudited) | Year Ended December 31, | |||||
| 2018 | 2017 | 2016 | 2015 | 2014 | ||
| Net Asset Value, Beginning of Period | $1.00 | $1.00 | $1.00 | $1.00 | $1.00 | $1.00 |
| Income from investment operations | ||||||
| Net investment income | 0.01 | 0.01 | —(a,b) | —(a,b) | —(a,b) | —(a,b) |
| Net realized and unrealized gain (loss) on investments | — | — | — | — | — | — |
| Total from investment operations | 0.01 | 0.01 | — | — | — | — |
| Distributions | ||||||
| Net investment income | (0.01) | (0.01) | —(b) | —(b) | —(b) | —(b) |
| Net realized gain | — | — | — | — | — | — |
| Total distributions | (0.01) | (0.01) | — | — | — | — |
| Net Asset Value, End of Period | $1.00 | $1.00 | $1.00 | $1.00 | $1.00 | $1.00 |
| Total Return | 0.82%(c) | 1.08% | 0.18% | 0.01% | 0.01% | 0.01% |
| Ratios/Supplemental Data | ||||||
| Net assets, end of period (thousands) | $164,316 | $163,854 | $173,927 | $195,858 | $193,156 | $196,771 |
| Ratio of net investment income to average net assets | 1.65%(d) | 1.07% | 0.17%(a) | 0.00%(a,e) | 0.00%(a,e) | 0.00%(a,e) |
| Ratio of gross expenses before voluntary expense limitation to average net assets | 0.76%(d) | 0.74% | 0.71% | 0.71% | 0.68% | 0.66% |
| Ratio of expenses to average net assets | 0.76%(d) | 0.74% | 0.66%(a) | 0.37%(a) | 0.14%(a) | 0.09%(a) |
| (a) | Excludes excess investment management fees and other expenses voluntarily waived and/or reimbursed by RE Advisers. Effective August 14, 2009, RE Advisers agreed to waive fees and/or reimburse expenses to the extent necessary to assist the Fund in attempting to maintain a positive yield. The temporary waiver continued through May 11, 2017. |
| (b) | Less than $0.01 per share. |
| (c) | Aggregate total return for the period. |
| (d) | Annualized. |
| (e) | Less than 0.01%. |
| The accompanying notes are an integral part of these financial statements. | Financial Highlights |
| Six Months Ended June 30, 2019 (Unaudited) | Year Ended December 31, | |||||
| 2018 | 2017 | 2016 | 2015 | 2014 | ||
| Net Asset Value, Beginning of Period | $5.14 | $5.15 | $5.16 | $5.18 | $5.20 | $5.19 |
| Income from investment operations | ||||||
| Net investment income | 0.04 | 0.07 | 0.05 | 0.04 | 0.04 | 0.05 |
| Net realized and unrealized gain (loss) on investments | 0.08 | (0.01) | (0.01) | (0.02) | (0.02) | 0.01 |
| Total from investment operations | 0.12 | 0.06 | 0.04 | 0.02 | 0.02 | 0.06 |
| Distributions | ||||||
| Net investment income | (0.04) | (0.07) | (0.05) | (0.04) | (0.04) | (0.05) |
| Net realized gain | — | —(a) | —(a) | —(a) | —(a) | —(a) |
| Total distributions | (0.04) | (0.07) | (0.05) | (0.04) | (0.04) | (0.05) |
| Net Asset Value, End of Period | $5.22 | $5.14 | $5.15 | $5.16 | $5.18 | $5.20 |
| Total Return | 2.41%(b) | 1.20% | 0.87% | 0.45% | 0.46% | 1.16% |
| Ratios/Supplemental Data | ||||||
| Net assets, end of period (thousands) | $73,631 | $76,918 | $75,425 | $73,108 | $73,048 | $76,661 |
| Ratio of net investment income to average net assets | 1.69%(c,d) | 1.37%(d) | 1.02%(d) | 0.81%(d) | 0.84% | 0.95% |
| Ratio of gross expenses before expense limitation to average net assets | 0.85%(c) | 0.82% | 0.81% | 0.78% | 0.77% | 0.71% |
| Ratio of expenses to average net assets | 0.75%(c,d) | 0.75%(d) | 0.75%(d) | 0.75%(d) | 0.77% | 0.71% |
| Portfolio turnover rate | 106%(e) | 40% | 33% | 26% | 32% | 20% |
| (a) | Less than $0.01 per share. |
| (b) | Aggregate total return for the period. |
| (c) | Annualized. |
| (d) | Excludes expenses in excess of a 0.75% contractual expense limitation with RE Advisers, in effect through April 30, 2020. |
| (e) | The change in portfolio turnover in 2018 and 2019 is due to a repositioning of the Fund as a result of market activities. |
| Financial Highlights | The accompanying notes are an integral part of these financial statements. |
| Six Months Ended June 30, 2019 (Unaudited) | Year Ended December 31, | |||||
| 2018 | 2017 | 2016 | 2015 | 2014 | ||
| Net Asset Value, Beginning of Period | $5.17 | $5.19 | $5.19 | $5.18 | $5.23 | $5.22 |
| Income from investment operations | ||||||
| Net investment income | 0.06 | 0.10 | 0.08 | 0.08 | 0.07 | 0.07 |
| Net realized and unrealized gain (loss) on investments | 0.09 | (0.02) | —(a) | 0.01 | (0.05) | 0.01 |
| Total from investment operations | 0.15 | 0.08 | 0.08 | 0.09 | 0.02 | 0.08 |
| Distributions | ||||||
| Net investment income | (0.06) | (0.10) | (0.08) | (0.08) | (0.07) | (0.07) |
| Net realized gain | — | —(a) | —(a) | — | — | — |
| Total distributions | (0.06) | (0.10) | (0.08) | (0.08) | (0.07) | (0.07) |
| Net Asset Value, End of Period | $5.26 | $5.17 | $5.19 | $5.19 | $5.18 | $5.23 |
| Total Return | 2.85%(b) | 1.69% | 1.65% | 1.75% | 0.43% | 1.56% |
| Ratios/Supplemental Data | ||||||
| Net assets, end of period (thousands) | $557,155 | $562,033 | $550,242 | $541,014 | $542,251 | $571,695 |
| Ratio of net investment income to average net assets | 2.18%(c) | 2.02% | 1.59% | 1.49% | 1.38% | 1.35% |
| Ratio of expenses to average net assets | 0.77% | 0.77% | 0.76% | 0.76% | 0.74% | 0.73% |
| Portfolio turnover rate | 114%(d) | 39% | 32% | 31% | 20% | 26% |
| (a) | Less than $0.01 per share. |
| (b) | Aggregate total return for the period. |
| (c) | Annualized. |
| (d) | The change in portfolio turnover in 2018 and 2019 is due to a repositioning of the Fund as a result of market activities. |
| The accompanying notes are an integral part of these financial statements. | Financial Highlights |
| Since Inception May 1, 2019 to June 30, 2019 (Unaudited) | |
| Net Asset Value, Beginning of Period | $5.00 |
| Income from investment operations | |
| Net investment income | 0.02 |
| Net realized and unrealized gain (loss) on investments | 0.11 |
| Total from investment operations | 0.13 |
| Distributions | |
| Net investment income | (0.02) |
| Net realized gain | — |
| Total distributions | (0.02) |
| Net Asset Value, End of Period | $5.11 |
| Total Return | 2.54%(a) |
| Ratios/Supplemental Data | |
| Net assets, end of period (thousands) | $6,915 |
| Ratio of net investment income to average net assets | 2.10%(b,c) |
| Ratio of gross expenses before expense limitation to average net assets | 5.52% |
| Ratio of expenses to average net assets | 0.80%(b,c) |
| Portfolio turnover rate | 44% |
| (a) | Aggregate total return for the period. |
| (b) | Annualized. |
| (c) | Excludes expenses in excess of a 0.80% contractual expense limitation with RE Advisers, in effect through April 30, 2021. |
| Financial Highlights | The accompanying notes are an integral part of these financial statements. |
| Six Months Ended June 30, 2019 (Unaudited) | Year Ended December 31, | |||||
| 2018 | 2017 | 2016 | 2015 | 2014 | ||
| Net Asset Value, Beginning of Period | $18.67 | $20.02 | $16.67 | $15.20 | $15.33 | $13.74 |
| Income from investment operations | ||||||
| Net investment income | 0.16 | 0.32 | 0.27 | 0.25 | 0.25 | 0.22 |
| Net realized and unrealized gain (loss) on investments | 3.25 | (1.30) | 3.26 | 1.47 | (0.13) | 1.59 |
| Total from investment operations | 3.41 | (0.98) | 3.53 | 1.72 | 0.12 | 1.81 |
| Distributions | ||||||
| Net investment income | (0.04) | (0.37) | (0.18) | (0.25) | (0.25) | (0.22) |
| Net realized gain | — | — | — | — | — | — |
| Total distributions | (0.04) | (0.37) | (0.18) | (0.25) | (0.25) | (0.22) |
| Net Asset Value, End of Period | $22.04 | $18.67 | $20.02 | $16.67 | $15.20 | $15.33 |
| Total Return | 18.25%(a) | -4.95% | 21.16% | 11.33% | 0.79% | 13.15% |
| Ratios/Supplemental Data | ||||||
| Net assets, end of period (thousands) | $153,460 | $133,934 | $145,094 | $123,039 | $114,436 | $116,163 |
| Ratio of net investment income to average net assets | 1.44%(b) | 1.39% | 1.42% | 1.57% | 1.49% | 1.49% |
| Ratio of expenses to average net assets | 0.58%(b) | 0.56% | 0.55% | 0.58% | 0.54% | 0.54% |
| Portfolio turnover rate | N/A | N/A | N/A | N/A | N/A | N/A |
| (a) | Aggregate total return for the period. |
| (b) | Annualized. |
| The accompanying notes are an integral part of these financial statements. | Financial Highlights |
| Six Months Ended June 30, 2019 (Unaudited) | Year Ended December 31, | |||||
| 2018 | 2017 | 2016 | 2015 | 2014 | ||
| Net Asset Value, Beginning of Period | $46.64 | $55.26 | $47.70 | $46.77 | $50.79 | $45.46 |
| Income from investment operations | ||||||
| Net investment income | 0.43 | 0.91 | 1.00 | 1.10 | 0.94 | 0.78 |
| Net realized and unrealized gain (loss) on investments | 7.11 | (4.39) | 9.52 | 4.60 | (1.59) | 5.41 |
| Total from investment operations | 7.54 | (3.48) | 10.52 | 5.70 | (0.65) | 6.19 |
| Distributions | ||||||
| Net investment income | (0.44) | (0.91) | (1.00) | (1.10) | (0.94) | (0.78) |
| Net realized gain | (0.43) | (4.23) | (1.96) | (3.67) | (2.43) | (0.08) |
| Total distributions | (0.87) | (5.14) | (2.96) | (4.77) | (3.37) | (0.86) |
| Net Asset Value, End of Period | $53.31 | $46.64 | $55.26 | $47.70 | $46.77 | $50.79 |
| Total Return | 16.17%(a) | -6.36% | 22.17% | 12.26% | -1.28% | 13.66% |
| Ratios/Supplemental Data | ||||||
| Net assets, end of period (thousands) | $952,567 | $875,266 | $1,118,709 | $955,828 | $899,158 | $938,857 |
| Ratio of net investment income to average net assets | 1.66%(b) | 1.55% | 1.92% | 2.26% | 1.85% | 1.64% |
| Ratio of expenses to average net assets | 0.62%(b) | 0.60% | 0.60% | 0.62% | 0.59% | 0.61% |
| Portfolio turnover rate | 11% | 1% | 7% | 9% | 8% | 2% |
| (a) | Aggregate total return for the period. |
| (b) | Annualized. |
| Financial Highlights | The accompanying notes are an integral part of these financial statements. |
| Six Months Ended June 30, 2019 (Unaudited) | Year Ended December 31, | |||||
| 2018 | 2017 | 2016 | 2015 | 2014 | ||
| Net Asset Value, Beginning of Period | $9.68 | $10.36 | $8.07 | $8.00 | $7.79 | $7.92 |
| Income from investment operations | ||||||
| Net investment income | — | 0.02 | — | — | — | — |
| Net realized and unrealized gain (loss) on investments | 1.75 | 0.41 | 3.04 | 0.19 | 0.73 | 0.66 |
| Total from investment operations | 1.75 | 0.43 | 3.04 | 0.19 | 0.73 | 0.66 |
| Distributions | ||||||
| Net investment income | — | (0.02) | — | — | — | — |
| Net realized gain | (0.09) | (1.09) | (0.75) | (0.12) | (0.52) | (0.79) |
| Total distributions | (0.09) | (1.11) | (0.75) | (0.12) | (0.52) | (0.79) |
| Net Asset Value, End of Period | $11.34 | $9.68 | $10.36 | $8.07 | $8.00 | $7.79 |
| Total Return | 18.13%(a) | 3.96% | 37.68% | 2.54% | 9.43% | 8.38% |
| Ratios/Supplemental Data | ||||||
| Net assets, end of period (thousands) | $229,884 | $194,467 | $178,020 | $117,281 | $114,329 | $93,717 |
| Ratio of net investment income (loss) to average net assets | (0.03)%(b) | 0.14% | (0.12)% | (0.14)%(c) | (0.32)% | (0.32)%(c) |
| Ratio of gross expenses before expense limitation to average net assets | 0.88%(b) | 0.86% | 0.93% | 0.98% | 0.95% | 0.97% |
| Ratio of expenses to average net assets | 0.88%(b) | 0.86% | 0.93% | 0.95%(c) | 0.95% | 0.95%(c) |
| Portfolio turnover rate | 13% | 34% | 37% | 39% | 40% | 49% |
| (a) | Aggregate total return for the period. |
| (b) | Annualized. |
| (c) | Excludes expenses in excess of a 0.95% contractual expense limitation with RE Advisers, in effect through April 30, 2020. |
| The accompanying notes are an integral part of these financial statements. | Financial Highlights |
| Six Months Ended June 30, 2019 (Unaudited) | Year Ended December 31, | |||||
| 2018 | 2017 | 2016 | 2015 | 2014 | ||
| Net Asset Value, Beginning of Period | $25.57 | $44.11 | $41.13 | $35.45 | $39.28 | $36.86 |
| Income from investment operations | ||||||
| Net investment income | 0.15 | 0.15 | 0.08 | 0.14 | 0.15 | 0.14 |
| Net realized and unrealized gain (loss) on investments | 4.97 | (11.45) | 4.86 | 6.55 | (2.19) | 2.80 |
| Total from investment operations | 5.12 | (11.30) | 4.94 | 6.69 | (2.04) | 2.94 |
| Distributions | ||||||
| Net investment income | —(a) | (0.15) | (0.08) | (0.14) | (0.15) | (0.14) |
| Net realized gain | (2.92) | (7.09) | (1.88) | (0.87) | (1.64) | (0.38) |
| Total distributions | (2.92) | (7.24) | (1.96) | (1.01) | (1.79) | (0.52) |
| Net Asset Value, End of Period | $27.77 | $25.57 | $44.11 | $41.13 | $35.45 | $39.28 |
| Total Return | 20.04%(b) | -26.18% | 11.99% | 18.85% | -5.18% | 7.97% |
| Ratios/Supplemental Data | ||||||
| Net assets, end of period (thousands) | $429,314 | $486,993 | $1,277,434 | $1,322,218 | $1,211,351 | $1,059,800 |
| Ratio of net investment income to average net assets | 1.00%(c) | 0.26% | 0.14% | 0.34% | 0.43% | 0.38% |
| Ratio of expenses to average net assets | 0.97%(c) | 0.90% | 0.88% | 0.89% | 0.86% | 0.89% |
| Portfolio turnover rate | 23% | 5% | 7% | 14% | 16% | 3% |
| (a) | Less than 0.01%. |
| (b) | Aggregate total return for the period. |
| (c) | Annualized. |
| Financial Highlights | The accompanying notes are an integral part of these financial statements. |
| Six Months Ended June 30, 2019 (Unaudited) | Year Ended December 31, | |||||
| 2018 | 2017 | 2016 | 2015 | 2014 | ||
| Net Asset Value, Beginning of Period | $7.28 | $8.49 | $6.69 | $6.44 | $7.17 | $8.13 |
| Income from investment operations | ||||||
| Net investment income | 0.08 | 0.12 | 0.08 | 0.07 | 0.47 | 0.24 |
| Net realized and unrealized gain (loss) on investments | 1.19 | (1.20) | 1.80 | 0.24 | (0.72) | (0.96) |
| Total from investment operations | 1.27 | (1.08) | 1.88 | 0.31 | (0.25) | (0.72) |
| Distributions | ||||||
| Net investment income | — | (0.13) | (0.08) | (0.06) | (0.48) | (0.24) |
| Net realized gain | — | — | — | — | — | — |
| Total distributions | — | (0.13) | (0.08) | (0.06) | (0.48) | (0.24) |
| Net Asset Value, End of Period | $8.55 | $7.28 | $8.49 | $6.69 | $6.44 | $7.17 |
| Total Return | 17.45%(a) | -12.74% | 28.12% | 4.85% | -3.48% | -8.90% |
| Ratios/Supplemental Data | ||||||
| Net assets, end of period (thousands) | $75,381 | $66,082 | $74,138 | $53,974 | $53,144 | $207,774 |
| Ratio of net investment income to average net assets | 2.06%(b,c) | 1.39%(c) | 1.03%(c) | 1.22%(c,d) | 1.87%(c,d) | 3.04% |
| Ratio of gross expenses before voluntary expense limitation to average net assets | 1.35%(b) | 1.23% | 1.25% | 1.46% | 1.01% | 0.97% |
| Ratio of expenses to average net assets | 0.99%(b,c) | 0.99%(c) | 0.99%(c) | 0.97%(c,d) | 0.87%(c,d) | 0.97% |
| Portfolio turnover rate | 21% | 16% | 11% | 112%(e) | 62% | 24% |
| (a) | Aggregate total return for the period. |
| (b) | Annualized. |
| (c) | Excludes expenses in excess of a 0.99% contractual expense limitation with RE Advisers, in effect through April 30, 2020. |
| (d) | RE Advisers waived additional management fees equal to the difference between the fee that would have been paid to the previous subadviser, Mercator and the fee paid to SSgA Funds Management Inc., beginning September 7, 2015 through January 14, 2016, the period in which SSgA Funds Management Inc. was subadviser. |
| (e) | Unusually high due to change in strategy and subadviser on January 15, 2016. |
| The accompanying notes are an integral part of these financial statements. | Financial Highlights |
| Notes to Financial Statements |
| Daily Income Fund | Level 1 | Level 2 | Level 3 | Total |
| U.S. Government & Agency Obligations | $ — | $131,843,046 | $ — | $131,843,046 |
| Money Market Fund | 23,101,764 | — | — | 23,101,764 |
| Total | $23,101,764 | $131,843,046 | $ — | $154,944,810 |
| Notes to Financial Statements |
| Short-Term Government Securities Fund | Level 1 | Level 2 | Level 3 | Total |
| U.S. Government & Agency Obligations | $ — | $49,039,054 | $ — | $49,039,054 |
| Corporate Bonds Guaranteed by Export-Import Bank of the United States | — | 18,828,847 | — | 18,828,847 |
| Corporate Bonds–Other | — | 2,382,672 | — | 2,382,672 |
| Asset-Backed Securities | — | 1,448,414 | — | 1,448,414 |
| Mortgage-Backed Security | — | 78,077 | — | 78,077 |
| Commercial Paper | — | 1,799,624 | — | 1,799,624 |
| Certificates of Deposit | — | 448,456 | — | 448,456 |
| Total | $ — | $74,025,144 | $ — | $74,025,144 |
| Short-Term Bond Fund | ||||
| U.S. Government & Agency Obligations | $ — | $245,738,660 | $ — | $245,738,660 |
| Corporate Bonds–Other | — | 141,198,757 | — | 141,198,757 |
| Asset-Backed Securities | — | 83,361,523 | — | 83,361,523 |
| Yankee Bonds | — | 42,862,451 | — | 42,862,451 |
| Municipal Bonds | — | 32,581,554 | — | 32,581,554 |
| Mortgage-Backed Securities | — | 870,130 | — | 870,130 |
| Corporate Bond Guaranteed by Export-Import Bank of the United States | — | 288,361 | — | 288,361 |
| Commercial Paper | — | 20,395,743 | — | 20,395,743 |
| Total | $ — | $567,297,179 | $ — | $567,297,179 |
| Intermediate Bond Fund | ||||
| U.S. Government & Agency Obligations | $ — | $2,452,353 | $ — | $2,452,353 |
| Corporate Bonds–Other | — | 1,789,359 | — | 1,789,359 |
| Mortgage-Backed Securities | — | 1,652,007 | — | 1,652,007 |
| Asset-Backed Securities | — | 380,000 | — | 380,000 |
| Yankee Bonds | — | 137,082 | — | 137,082 |
| Money Market Fund | 2,220,187 | — | — | 2,220,187 |
| Total | $2,220,187 | $6,410,801 | $ — | $8,630,988 |
| Value Fund | ||||
| Common Stocks | $946,413,778 | $ — | $ — | $946,413,778 |
| Commercial Paper | — | 6,998,539 | — | 6,998,539 |
| Total | $946,413,778 | $6,998,539 | $ — | $953,412,317 |
| Growth Fund | ||||
| Common Stocks | $226,383,293 | $ — | $ — | $226,383,293 |
| Money Market Fund | 3,662,192 | — | — | 3,662,192 |
| Total | $230,045,485 | $ — | $ — | $230,045,485 |
| Small-Company Stock Fund | ||||
| Common Stocks | $412,671,641 | $ — | $ — | $412,671,641 |
| Exchange Traded Fund | 8,610,800 | — | — | 8,610,800 |
| Money Market Fund | 20,081,141 | — | — | 20,081,141 |
| Total | $441,363,582 | $ — | $ — | $441,363,582 |
| International Equity Fund | ||||
| Common Stocks | $13,305,106 | $58,190,030 | $ — | $71,495,136 |
| Preferred Stocks | 1,566,245 | — | — | 1,566,245 |
| Money Market Fund | 2,301,839 | — | — | 2,301,839 |
| Total | $17,173,190 | $58,190,030 | $ — | $75,363,220 |
| Notes to Financial Statements |
| Notes to Financial Statements |
| Tax Cost | Tax Appreciation | Tax Depreciation | Net Tax Appreciation (Depreciation) | |
| Daily Income Fund | $154,944,810 | $— | $— | $— |
| Short-Term Gov. Securities Fund | $73,476,206 | $625,231 | $(76,293) | $548,938 |
| Short-Term Bond Fund | $560,840,316 | $6,755,183 | $(298,320) | $6,456,863 |
| Intermediate Bond Fund | $8,547,100 | $84,122 | $(235) | $83,887 |
| Value Fund | $500,097,767 | $456,420,992 | $(3,106,442) | $453,314,550 |
| Growth Fund | $158,532,887 | $75,499,409 | $(3,339,241) | $72,160,168 |
| Small-Company Stock Fund | $358,641,661 | $95,059,893 | $(12,337,930) | $82,721,963 |
| International Equity Fund | $61,456,912 | $15,984,648 | $(2,069,090) | $13,915,558 |
| Purchases | Proceeds from Sale | |
| Short-Term Gov. Securities Fund | $4,252,977 | $10,157,476 |
| Short-Term Bond Fund | $105,766,244 | $240,448,177 |
| Intermediate Bond Fund | $3,465,317 | $1,588,421 |
| Value Fund | $98,081,732 | $145,823,859 |
| Growth Fund | $29,365,886 | $28,402,598 |
| Small-Company Stock Fund | $103,666,919 | $228,326,624 |
| International Equity Fund | $14,581,164 | $16,129,490 |
| Purchases | Proceeds from Sale | |
| Short-Term Gov. Securities Fund | $68,925,445 | $64,985,621 |
| Short-Term Bond Fund | $519,579,006 | $344,355,779 |
| Intermediate Bond Fund | $5,540,443 | $1,111,084 |
| Notes to Financial Statements |
| Notes to Financial Statements |
| Shares Sold | Shares Issued In Reinvestment of Dividends | Total Shares Issued | Total Shares Redeemed | Net Increase (Decrease) | |
| Period Ended June 30, 2019 | |||||
| In Dollars | |||||
| Daily Income Fund | $48,493,427 | $1,365,687 | $49,859,114 | $(49,395,959) | $463,155 |
| Short-Term Government Securities Fund | $2,296,827 | $622,696 | $2,919,523 | $(7,310,121) | $(4,390,598) |
| Short-Term Bond Fund | $35,036,140 | $5,936,342 | $40,972,482 | $(54,913,155) | $(13,940,673) |
| Intermediate Bond Fund | $6,796,623 | $14,457 | $6,811,080 | $(6,536) | $6,804,544 |
| Stock Index Fund | $7,414,963 | $253,893 | $7,668,856 | $(11,963,109) | $(4,294,253) |
| Value Fund | $24,724,983 | $14,934,830 | $39,659,813 | $(85,076,810) | $(45,416,997) |
| Growth Fund | $22,055,146 | $1,892,192 | $23,947,338 | $(21,739,714) | $2,207,624 |
| Small-Company Stock Fund | $25,444,448 | $40,823,032 | $66,267,480 | $(172,529,160) | $(106,261,680) |
| International Equity Fund | $3,123,829 | $— | $3,123,829 | $(5,175,327) | $(2,051,498) |
| In Shares | |||||
| Daily Income Fund | 48,493,427 | 1,365,687 | 49,859,114 | (49,395,959) | 463,155 |
| Short-Term Government Securities Fund | 445,627 | 120,372 | 565,999 | (1,415,476) | (849,477) |
| Short-Term Bond Fund | (10,562,471) | 1,138,911 | (9,423,560) | 6,745,480 | (2,678,080) |
| Intermediate Bond Fund | 1,350,539 | 2,841 | 1,353,380 | (1,289) | 1,352,091 |
| Stock Index Fund | 359,238 | 11,520 | 370,758 | (579,839) | (209,081) |
| Value Fund | 486,504 | 280,151 | 766,655 | (1,665,086) | (898,431) |
| Growth Fund | 2,026,589 | 166,860 | 2,193,449 | (2,016,236) | 177,213 |
| Small-Company Stock Fund | 884,189 | 1,470,041 | 2,354,230 | (5,945,105) | (3,590,875) |
| International Equity Fund | 390,526 | — | 390,526 | (646,492) | (255,966) |
| Notes to Financial Statements |
| Shares Sold | Shares Issued In Reinvestment of Dividends | Total Shares Issued | Total Shares Redeemed | Net Increase (Decrease) | |
| Year Ended December 31, 2018 | |||||
| In Dollars | |||||
| Daily Income Fund | $99,834,828 | $1,759,707 | $101,594,535 | $(111,667,972) | $(10,073,437) |
| Short-Term Government Securities Fund | $13,050,967 | $1,047,397 | $14,098,364 | $(12,446,847) | $1,651,517 |
| Short-Term Bond Fund | $92,746,007 | $11,174,708 | $103,920,715 | $(90,823,019) | $13,097,696 |
| Stock Index Fund | $19,057,748 | $2,608,256 | $21,666,004 | $(23,439,983) | $(1,773,979) |
| Value Fund | $92,336,077 | $87,189,015 | $179,525,092 | $(274,079,327) | $(94,554,235) |
| Growth Fund | $51,575,108 | $19,984,976 | $71,560,084 | $(40,989,389) | $30,570,695 |
| Small-Company Stock Fund | $96,766,231 | $120,348,694 | $217,114,925 | $(671,707,033) | $(454,592,108) |
| International Equity Fund | $10,465,592 | $1,138,797 | $11,604,389 | $(8,901,703) | $2,702,686 |
| In Shares | |||||
| Daily Income Fund | 99,834,828 | 1,759,707 | 101,594,535 | (111,667,972) | (10,073,437) |
| Short-Term Government Securities Fund | 2,546,237 | 204,330 | 2,750,567 | (2,428,212) | 322,355 |
| Short-Term Bond Fund | 17,930,290 | 2,160,822 | 20,091,112 | (17,558,653) | 2,532,459 |
| Stock Index Fund | 926,146 | 135,267 | 1,061,413 | (1,134,986) | (73,573) |
| Value Fund | 1,675,097 | 1,843,395 | 3,518,492 | (4,996,418) | (1,477,926) |
| Growth Fund | 4,553,819 | 2,027,070 | 6,580,889 | (3,662,673) | 2,918,216 |
| Small-Company Stock Fund | 2,368,470 | 4,481,052 | 6,849,522 | (16,759,137) | (9,909,615) |
| International Equity Fund | 1,233,468 | 156,000 | 1,389,468 | (1,049,807) | 339,661 |
| Notes to Financial Statements |
| Votes For | Votes Withheld | |
| Julie H. Dellinger | 303,181,061.582 | 8,953,085.411 |
| Judith H. McKinney | 303,441,664.942 | 8,692,482.051 |
| Mark D. Santero | 302,667,784.912 | 9,466,362.081 |
| Peter J. Tonetti | 303,456,363.323 | 8,677,783.670 |
| Votes For | Votes Against | Abstentions | Broker Non- Votes | |
| Daily Income Fund | 141,151,229.001 | 10,068,646.098 | 3,320,258.712 | 75,027.760 |
| Short-Term Bond Fund | 79,383,080.036 | 3,324,639.165 | 1,836,953.091 | 4,322,240.122 |
| Value Fund | 9,084,528.635 | 2,272,136.708 | 233,933.144 | 2,566,240.461 |
| Short-Term Government Securities Fund | 11,044,431.996 | 717,913.770 | 241,248.074 | 11,481.206 |
| Stock Index Fund | 5,157,867.472 | 192,415.900 | 24,331.274 | 153,614.778 |
| Growth Fund | 14,099,682.584 | 510,747.354 | 269,710.629 | 1,803,849.813 |
| International Equity Fund | 7,138,682.065 | 196,465.413 | 65,994.227 | 26,633.341 |
| Common Stocks | 98.8% of net assets | ||
| Shares | Value | |
| Aerospace & Defense | 2.6% | ||
| Arconic, Inc. | 327,315 | $8,451,273 |
| Boeing Co. | 428,938 | 156,137,721 |
| General Dynamics Corp. | 222,599 | 40,472,950 |
| Huntington Ingalls Industries, Inc. | 33,853 | 7,608,123 |
| L3 Technologies, Inc. | 65,131 | 15,968,167 |
| L3Harris Technologies, Inc. | 96,835 | 18,314,404 |
| Lockheed Martin Corp. | 201,505 | 73,255,128 |
| Northrop Grumman Corp. | 139,196 | 44,975,620 |
| Raytheon Co. | 229,127 | 39,840,603 |
| Textron, Inc. | 190,050 | 10,080,252 |
| TransDigm Group, Inc. (a) | 40,107 | 19,403,767 |
| United Technologies Corp. | 664,937 | 86,574,797 |
| Total Aerospace & Defense | 521,082,805 | |
| Air Freight & Logistics | 0.5% | ||
| C.H. Robinson Worldwide, Inc. | 111,949 | 9,442,898 |
| Expeditors International of Washington, Inc. | 141,594 | 10,741,321 |
| FedEx Corp. | 196,760 | 32,306,024 |
| United Parcel Service, Inc., Class B | 571,808 | 59,050,612 |
| Total Air Freight & Logistics | 111,540,855 | |
| Airlines | 0.4% | ||
| Alaska Air Group, Inc. | 101,244 | 6,470,504 |
| American Airlines Group, Inc. | 325,899 | 10,627,567 |
| Delta Air Lines, Inc. | 488,356 | 27,714,203 |
| Southwest Airlines Co. | 400,667 | 20,345,870 |
| United Continental Holdings, Inc. (a) | 181,453 | 15,886,210 |
| Total Airlines | 81,044,354 | |
| Auto Components | 0.1% | ||
| Aptiv PLC | 211,364 | 17,084,552 |
| BorgWarner, Inc. | 171,553 | 7,201,795 |
| Total Auto Components | 24,286,347 | |
| Automobiles | 0.4% | ||
| Ford Motor Co. | 3,212,405 | 32,862,903 |
| General Motors Co. | 1,081,356 | 41,664,647 |
| Harley-Davidson, Inc. | 128,117 | 4,590,432 |
| Total Automobiles | 79,117,982 | |
| Banks | 5.4% | ||
| Bank of America Corp. | 7,248,871 | 210,217,259 |
| BB&T Corp. | 627,874 | 30,847,450 |
| Citigroup, Inc. | 1,895,679 | 132,754,400 |
| Citizens Financial Group, Inc. | 379,761 | 13,428,349 |
| Comerica, Inc. | 129,051 | 9,374,265 |
| Fifth Third Bancorp | 596,094 | 16,631,023 |
| First Republic Bank (b) | 135,767 | 13,257,647 |
| Huntington Bancshares, Inc. | 848,449 | 11,725,565 |
| Common Stocks | 98.8% of net assets (Continued) | ||
| Shares | Value | |
| Banks | 5.4% (Continued) | ||
| JPMorgan Chase & Co. | 2,659,293 | $297,308,957 |
| KeyCorp | 828,871 | 14,712,460 |
| M&T Bank Corp. | 111,998 | 19,047,500 |
| People's United Financial, Inc. | 323,296 | 5,424,907 |
| PNC Financial Services Group, Inc. | 370,072 | 50,803,484 |
| Regions Financial Corp. | 833,745 | 12,456,150 |
| SunTrust Banks, Inc. | 363,538 | 22,848,363 |
| SVB Financial Group (a)(b) | 42,320 | 9,504,649 |
| U.S. Bancorp | 1,226,809 | 64,284,792 |
| Wells Fargo & Co. | 3,315,956 | 156,911,038 |
| Zions Bancorp. NA | 150,600 | 6,924,588 |
| Total Banks | 1,098,462,846 | |
| Beverages | 1.8% | ||
| Brown-Forman Corp., Class B | 136,364 | 7,558,657 |
| Coca-Cola Co. | 3,147,488 | 160,270,089 |
| Constellation Brands, Inc., Class A | 137,072 | 26,994,960 |
| Molson Coors Brewing Co., Class B | 153,940 | 8,620,640 |
| Monster Beverage Corp. (a)(b) | 320,917 | 20,484,132 |
| PepsiCo, Inc. | 1,149,164 | 150,689,875 |
| Total Beverages | 374,618,353 | |
| Biotechnology | 2.2% | ||
| AbbVie, Inc. | 1,211,884 | 88,128,204 |
| Alexion Pharmaceuticals, Inc. (a) | 183,821 | 24,076,875 |
| Amgen, Inc. | 500,004 | 92,140,737 |
| Biogen, Inc. (a) | 159,255 | 37,244,967 |
| Celgene Corp. (a) | 578,147 | 53,443,909 |
| Gilead Sciences, Inc. | 1,042,375 | 70,422,855 |
| Incyte Corp. (a) | 145,905 | 12,396,089 |
| Regeneron Pharmaceuticals, Inc. (a) | 64,467 | 20,178,171 |
| Vertex Pharmaceuticals, Inc. (a) | 209,959 | 38,502,281 |
| Total Biotechnology | 436,534,088 | |
| Building Products | 0.3% | ||
| Allegion PLC | 77,298 | 8,545,294 |
| AO Smith Corp. | 116,550 | 5,496,498 |
| Fortune Brands Home & Security, Inc. | 114,669 | 6,551,040 |
| Johnson Controls International PLC | 652,353 | 26,948,703 |
| Masco Corp. | 243,172 | 9,542,069 |
| Total Building Products | 57,083,604 | |
| Capital Markets | 2.7% | ||
| Affiliated Managers Group, Inc. | 41,062 | 3,783,453 |
| Ameriprise Financial, Inc. | 109,770 | 15,934,213 |
| Bank of New York Mellon Corp. | 722,143 | 31,882,613 |
| BlackRock, Inc. (c) | 97,514 | 45,763,320 |
| Appendix | The accompanying notes are an integral part of these financial statements. |
| Common Stocks | 98.8% of net assets (Continued) | ||
| Shares | Value | |
| Capital Markets | 2.7% (Continued) | ||
| Cboe Global Markets, Inc. | 91,576 | $9,490,021 |
| Charles Schwab Corp. | 974,010 | 39,145,462 |
| CME Group, Inc. | 293,453 | 56,962,162 |
| E*Trade Financial Corp. | 202,442 | 9,028,913 |
| Franklin Resources, Inc. | 241,326 | 8,398,145 |
| Goldman Sachs Group, Inc. | 278,911 | 57,065,191 |
| Intercontinental Exchange, Inc. | 462,236 | 39,724,562 |
| Invesco Ltd. | 327,515 | 6,700,957 |
| MarketAxess Holdings, Inc. | 30,887 | 9,927,699 |
| Moody's Corp. | 135,222 | 26,410,209 |
| Morgan Stanley | 1,048,068 | 45,915,859 |
| MSCI, Inc. | 69,417 | 16,576,085 |
| Nasdaq, Inc. | 95,087 | 9,144,517 |
| Northern Trust Corp. | 179,042 | 16,113,780 |
| Raymond James Financial, Inc. | 102,701 | 8,683,370 |
| S&P Global, Inc. | 201,433 | 45,884,423 |
| State Street Corp. | 304,540 | 17,072,512 |
| T. Rowe Price Group, Inc. | 193,854 | 21,267,722 |
| Total Capital Markets | 540,875,188 | |
| Chemicals | 2.0% | ||
| Air Products & Chemicals, Inc. | 180,457 | 40,850,051 |
| Albemarle Corp. | 87,068 | 6,130,458 |
| Celanese Corp. | 103,779 | 11,187,376 |
| CF Industries Holdings, Inc. | 183,499 | 8,571,238 |
| Corteva, Inc. | 615,743 | 18,207,520 |
| Dow Inc. | 613,859 | 30,269,387 |
| DuPont de Nemours, Inc. | 613,836 | 46,080,669 |
| Eastman Chemical Co. | 111,653 | 8,689,953 |
| Ecolab, Inc. | 207,936 | 41,054,884 |
| FMC Corp. | 106,998 | 8,875,484 |
| International Flavors & Fragrances, Inc. | 83,088 | 12,055,238 |
| Linde PLC | 444,940 | 89,343,952 |
| LyondellBasell Industries NV, Class A | 248,936 | 21,440,858 |
| Mosaic Co. | 290,955 | 7,282,604 |
| PPG Industries, Inc. | 193,548 | 22,588,987 |
| Sherwin-Williams Co. | 66,596 | 30,520,281 |
| Total Chemicals | 403,148,940 | |
| Commercial Services & Supplies | 0.4% | ||
| Cintas Corp. | 69,030 | 16,380,129 |
| Copart, Inc. (a) | 163,712 | 12,235,835 |
| Republic Services, Inc. | 176,629 | 15,303,137 |
| Rollins, Inc. | 120,824 | 4,333,957 |
| Waste Management, Inc. | 320,288 | 36,951,626 |
| Total Commercial Services & Supplies | 85,204,684 | |
| Communications Equipment | 1.2% | ||
| Arista Networks, Inc. (a)(b) | 43,341 | 11,252,191 |
| Cisco Systems, Inc. | 3,509,192 | 192,058,078 |
| Common Stocks | 98.8% of net assets (Continued) | ||
| Shares | Value | |
| Communications Equipment | 1.2% (Continued) | ||
| F5 Networks, Inc. (a) | 48,294 | $7,033,055 |
| Juniper Networks, Inc. | 282,265 | 7,516,717 |
| Motorola Solutions, Inc. | 135,278 | 22,554,901 |
| Total Communications Equipment | 240,414,942 | |
| Construction & Engineering | 0.1% | ||
| Jacobs Engineering Group, Inc. | 95,037 | 8,020,173 |
| Quanta Services, Inc. | 116,201 | 4,437,716 |
| Total Construction & Engineering | 12,457,889 | |
| Construction Materials | 0.1% | ||
| Martin Marietta Materials, Inc. | 51,218 | 11,785,774 |
| Vulcan Materials Co. | 108,284 | 14,868,476 |
| Total Construction Materials | 26,654,250 | |
| Consumer Finance | 0.7% | ||
| American Express Co. | 560,249 | 69,157,136 |
| Capital One Financial Corp. | 384,959 | 34,931,180 |
| Discover Financial Services | 265,381 | 20,590,912 |
| Synchrony Financial | 519,871 | 18,023,928 |
| Total Consumer Finance | 142,703,156 | |
| Containers & Packaging | 0.4% | ||
| Amcor PLC (a) | 1,330,675 | 15,289,456 |
| Avery Dennison Corp. | 67,946 | 7,859,993 |
| Ball Corp. | 272,557 | 19,076,264 |
| International Paper Co. | 326,605 | 14,148,529 |
| Packaging Corp. of America | 77,463 | 7,383,773 |
| Sealed Air Corp. | 128,174 | 5,483,284 |
| WestRock Co. | 210,715 | 7,684,776 |
| Total Containers & Packaging | 76,926,075 | |
| Distributors | 0.1% | ||
| Genuine Parts Co. | 119,738 | 12,402,462 |
| LKQ Corp. (a) | 257,401 | 6,849,441 |
| Total Distributors | 19,251,903 | |
| Diversified Consumer Services | 0.0% | ||
| H&R Block, Inc. | 162,767 | 4,769,073 |
| Total Diversified Consumer Services | 4,769,073 | |
| Diversified Financial Services | 1.7% | ||
| Berkshire Hathaway, Inc., Class B (a) | 1,588,542 | 338,629,498 |
| Jefferies Financial Group, Inc. | 207,709 | 3,994,244 |
| Total Diversified Financial Services | 342,623,742 | |
| The accompanying notes are an integral part of these financial statements. | Appendix |
| Common Stocks | 98.8% of net assets (Continued) | ||
| Shares | Value | |
| Diversified Telecommunication Services | 2.0% | ||
| AT&T, Inc. | 5,982,640 | $200,478,266 |
| CenturyLink, Inc. | 783,101 | 9,209,268 |
| Verizon Communications, Inc. | 3,390,305 | 193,688,125 |
| Total Diversified Telecommunication Services | 403,375,659 | |
| Electric Utilities | 2.0% | ||
| Alliant Energy Corp. | 193,709 | 9,507,238 |
| American Electric Power Co., Inc. | 404,501 | 35,600,133 |
| Duke Energy Corp. | 596,827 | 52,664,014 |
| Edison International | 265,461 | 17,894,726 |
| Entergy Corp. | 155,695 | 16,025,686 |
| Evergy, Inc. | 200,103 | 12,036,195 |
| Eversource Energy | 263,227 | 19,942,078 |
| Exelon Corp. | 795,954 | 38,158,035 |
| FirstEnergy Corp. | 413,874 | 17,717,946 |
| NextEra Energy, Inc. | 392,614 | 80,430,904 |
| Pinnacle West Capital Corp. | 92,041 | 8,660,138 |
| PPL Corp. | 590,949 | 18,325,328 |
| Southern Co. | 853,238 | 47,166,997 |
| Xcel Energy, Inc. | 421,911 | 25,099,485 |
| Total Electric Utilities | 399,228,903 | |
| Electrical Equipment | 0.5% | ||
| AMETEK, Inc. | 186,776 | 16,966,732 |
| Eaton Corp. PLC | 346,842 | 28,885,002 |
| Emerson Electric Co. | 502,231 | 33,508,852 |
| Rockwell Automation, Inc. | 96,409 | 15,794,686 |
| Total Electrical Equipment | 95,155,272 | |
| Electronic Equipment, Instruments & Components | 0.5% | ||
| Amphenol Corp., Class A | 244,890 | 23,494,747 |
| Corning, Inc. | 643,313 | 21,377,291 |
| FLIR Systems, Inc. | 109,710 | 5,935,311 |
| IPG Photonics Corp. (a)(b) | 28,468 | 4,391,189 |
| Keysight Technologies, Inc. (a) | 154,256 | 13,853,731 |
| TE Connectivity Ltd. | 276,526 | 26,485,660 |
| Total Electronic Equipment, Instruments & Components | 95,537,929 | |
| Energy Equipment & Services | 0.5% | ||
| Baker Hughes a GE Co. | 422,098 | 10,396,274 |
| Halliburton Co. | 716,456 | 16,292,209 |
| Helmerich & Payne, Inc. | 90,592 | 4,585,767 |
| National Oilwell Varco, Inc. | 316,363 | 7,032,750 |
| Schlumberger Ltd. | 1,135,474 | 45,123,737 |
| TechnipFMC PLC | 339,977 | 8,819,003 |
| Total Energy Equipment & Services | 92,249,740 | |
| Entertainment | 1.0% | ||
| Activision Blizzard, Inc. | 627,945 | 29,639,004 |
| Common Stocks | 98.8% of net assets (Continued) | ||
| Shares | Value | |
| Entertainment | 1.0% (Continued) | ||
| Electronic Arts Inc. (a) | 243,981 | $24,705,516 |
| Netflix, Inc. (a) | 358,417 | 131,653,733 |
| Take-Two Interactive Software, Inc. (a) | 92,258 | 10,474,051 |
| Viacom, Inc., Class B | 289,905 | 8,659,462 |
| Total Entertainment | 205,131,766 | |
| Equity Real Estate Investment Trusts (REITs) | 2.9% | ||
| Alexandria Real Estate Equities, Inc. | 92,658 | 13,073,117 |
| American Tower Corp. | 362,355 | 74,083,480 |
| Apartment Investment & Management Co., Class A | 124,251 | 6,227,460 |
| AvalonBay Communities, Inc. | 114,278 | 23,219,004 |
| Boston Properties, Inc. | 126,670 | 16,340,430 |
| Crown Castle International Corp. | 340,810 | 44,424,583 |
| Digital Realty Trust, Inc. | 171,140 | 20,158,581 |
| Duke Realty Corp. | 294,646 | 9,313,760 |
| Equinix, Inc. | 68,918 | 34,754,658 |
| Equity Residential | 303,691 | 23,056,221 |
| Essex Property Trust, Inc. | 53,872 | 15,726,853 |
| Extra Space Storage, Inc. | 104,482 | 11,085,540 |
| Federal Realty Investment Trust | 61,405 | 7,906,508 |
| HCP, Inc. | 394,067 | 12,602,263 |
| Host Hotels & Resorts, Inc. | 607,358 | 11,066,063 |
| Iron Mountain, Inc. | 235,175 | 7,360,977 |
| Kimco Realty Corp. | 345,973 | 6,393,581 |
| Macerich Co. | 84,574 | 2,832,383 |
| Mid-America Apartment Communities, Inc. | 93,450 | 11,004,672 |
| Prologis, Inc. | 517,102 | 41,419,870 |
| Public Storage | 123,122 | 29,323,967 |
| Realty Income Corp. | 258,076 | 17,799,502 |
| Regency Centers Corp. | 135,215 | 9,024,249 |
| SBA Communications Corp. (a) | 92,839 | 20,873,921 |
| Simon Property Group, Inc. | 253,296 | 40,466,569 |
| SL Green Realty Corp. | 67,577 | 5,431,163 |
| UDR, Inc. | 231,005 | 10,369,814 |
| Ventas, Inc. | 302,831 | 20,698,499 |
| Vornado Realty Trust | 142,305 | 9,121,750 |
| Welltower, Inc. | 331,956 | 27,064,373 |
| Weyerhaeuser Co. | 611,599 | 16,109,518 |
| Total Equity Real Estate Investment Trusts (REITs) | 598,333,329 | |
| Food & Staples Retailing | 1.5% | ||
| Costco Wholesale Corp. | 360,523 | 95,271,808 |
| Kroger Co. | 661,289 | 14,356,584 |
| Sysco Corp. | 387,631 | 27,413,264 |
| Walgreens Boots Alliance, Inc. | 637,083 | 34,829,328 |
| Walmart, Inc. | 1,146,698 | 126,698,662 |
| Total Food & Staples Retailing | 298,569,646 | |
| Appendix | The accompanying notes are an integral part of these financial statements. |
| Common Stocks | 98.8% of net assets (Continued) | ||
| Shares | Value | |
| Food Products | 1.1% | ||
| Archer-Daniels-Midland Co. | 458,597 | $18,710,757 |
| Campbell Soup Co. | 157,998 | 6,330,980 |
| Conagra Brands, Inc. | 398,336 | 10,563,871 |
| General Mills, Inc. | 490,867 | 25,780,335 |
| Hershey Co. | 114,189 | 15,304,752 |
| Hormel Foods Corp. | 223,190 | 9,048,123 |
| J.M. Smucker Co. | 93,246 | 10,741,007 |
| Kellogg Co. | 203,763 | 10,915,584 |
| Kraft Heinz Co. | 504,334 | 15,654,527 |
| Lamb Weston Holdings, Inc. | 121,446 | 7,694,818 |
| McCormick & Co., Inc. | 100,395 | 15,562,229 |
| Mondelez International, Inc., Class A | 1,180,818 | 63,646,090 |
| Tyson Foods, Inc., Class A | 241,670 | 19,512,436 |
| Total Food Products | 229,465,509 | |
| Gas Utilities | 0.0% | ||
| Atmos Energy Corp. | 95,910 | 10,124,260 |
| Total Gas Utilities | 10,124,260 | |
| Health Care Equipment & Supplies | 3.5% | ||
| Abbott Laboratories | 1,446,213 | 121,626,513 |
| ABIOMED, Inc. (a) | 36,992 | 9,636,046 |
| Align Technology, Inc. (a)(b) | 59,683 | 16,335,237 |
| Baxter International, Inc. | 388,942 | 31,854,350 |
| Becton, Dickinson & Co. | 221,117 | 55,723,695 |
| Boston Scientific Corp. (a) | 1,140,008 | 48,997,544 |
| Cooper Cos., Inc. | 40,568 | 13,666,954 |
| Danaher Corp. | 516,469 | 73,813,749 |
| DENTSPLY SIRONA, Inc. | 191,806 | 11,193,798 |
| Edwards Lifesciences Corp. (a) | 170,922 | 31,576,130 |
| Hologic, Inc. (a) | 219,738 | 10,551,819 |
| IDEXX Laboratories, Inc. (a)(b) | 70,505 | 19,412,142 |
| Intuitive Surgical, Inc. (a) | 94,641 | 49,643,937 |
| Medtronic PLC | 1,099,056 | 107,037,064 |
| ResMed, Inc. | 117,913 | 14,388,923 |
| Stryker Corp. | 253,862 | 52,188,950 |
| Teleflex, Inc. | 37,401 | 12,385,341 |
| Varian Medical Systems, Inc. (a) | 74,554 | 10,149,036 |
| Zimmer Biomet Holdings, Inc. | 167,668 | 19,741,230 |
| Total Health Care Equipment & Supplies | 709,922,458 | |
| Health Care Providers & Services | 2.6% | ||
| AmerisourceBergen Corp. | 127,499 | 10,870,565 |
| Anthem, Inc. | 210,840 | 59,501,156 |
| Cardinal Health, Inc. | 244,339 | 11,508,367 |
| Centene Corp. (a)(b) | 338,864 | 17,770,028 |
| Cigna Corp. | 311,066 | 49,008,448 |
| CVS Health Corp. | 1,064,949 | 58,029,071 |
| DaVita, Inc. (a) | 100,411 | 5,649,123 |
| HCA Healthcare, Inc. | 218,877 | 29,585,604 |
| Henry Schein, Inc. (a)(b) | 121,008 | 8,458,459 |
| Common Stocks | 98.8% of net assets (Continued) | ||
| Shares | Value | |
| Health Care Providers & Services | 2.6% (Continued) | ||
| Humana, Inc. | 110,948 | $29,434,504 |
| Laboratory Corp. of America Holdings (a)(b) | 80,802 | 13,970,666 |
| McKesson Corp. | 157,150 | 21,119,389 |
| Quest Diagnostics, Inc. | 110,442 | 11,244,100 |
| UnitedHealth Group, Inc. | 779,057 | 190,097,699 |
| Universal Health Services, Inc., Class B (b) | 67,589 | 8,812,930 |
| WellCare Health Plans, Inc. (a) | 41,244 | 11,757,427 |
| Total Health Care Providers & Services | 536,817,536 | |
| Health Care Technology | 0.1% | ||
| Cerner Corp. | 266,769 | 19,554,168 |
| Total Health Care Technology | 19,554,168 | |
| Hotels, Restaurants & Leisure | 1.9% | ||
| Carnival Corp. | 328,239 | 15,279,525 |
| Chipotle Mexican Grill, Inc. (a) | 19,993 | 14,652,470 |
| Darden Restaurants, Inc. | 100,811 | 12,271,723 |
| Hilton Worldwide Holdings, Inc. | 239,226 | 23,381,949 |
| Marriott International, Inc., Class A | 226,567 | 31,785,084 |
| McDonald's Corp. | 625,936 | 129,981,870 |
| MGM Resorts International | 417,840 | 11,937,689 |
| Norwegian Cruise Line Holdings Ltd. (a) | 177,936 | 9,542,708 |
| Royal Caribbean Cruises Ltd. | 140,499 | 17,029,884 |
| Starbucks Corp. | 992,899 | 83,234,723 |
| Wynn Resorts Ltd. | 80,004 | 9,919,696 |
| Yum! Brands, Inc. | 250,827 | 27,759,024 |
| Total Hotels, Restaurants & Leisure | 386,776,345 | |
| Household Durables | 0.3% | ||
| D.R. Horton, Inc. | 278,385 | 12,006,745 |
| Garmin Ltd. | 99,649 | 7,951,990 |
| Leggett & Platt, Inc. | 104,824 | 4,022,097 |
| Lennar Corp., Class A | 233,087 | 11,295,396 |
| Mohawk Industries, Inc. (a)(b) | 50,377 | 7,429,096 |
| Newell Brands, Inc. | 319,095 | 4,920,445 |
| PulteGroup, Inc. | 210,636 | 6,660,311 |
| Whirlpool Corp. | 51,923 | 7,391,758 |
| Total Household Durables | 61,677,838 | |
| Household Products | 1.7% | ||
| Church & Dwight Co., Inc. | 203,326 | 14,854,997 |
| Clorox Co. | 104,561 | 16,009,335 |
| Colgate-Palmolive Co. | 703,780 | 50,439,913 |
| Kimberly-Clark Corp. | 281,831 | 37,562,436 |
| Procter & Gamble Co. | 2,056,239 | 225,466,606 |
| Total Household Products | 344,333,287 | |
| The accompanying notes are an integral part of these financial statements. | Appendix |
| Common Stocks | 98.8% of net assets (Continued) | ||
| Shares | Value | |
| Independent Power and Renewable Electricity Producers | 0.1% | ||
| AES Corp. | 544,100 | $9,119,116 |
| NRG Energy, Inc. | 219,002 | 7,691,350 |
| Total Independent Power and Renewable Electricity Producers | 16,810,466 | |
| Industrial Conglomerates | 1.4% | ||
| 3M Co. | 472,534 | 81,909,044 |
| General Electric Co. | 7,149,007 | 75,064,573 |
| Honeywell International, Inc. | 596,577 | 104,156,378 |
| Roper Technologies, Inc. | 85,227 | 31,215,241 |
| Total Industrial Conglomerates | 292,345,236 | |
| Insurance | 2.5% | ||
| Aflac, Inc. | 611,109 | 33,494,884 |
| Allstate Corp. | 273,069 | 27,768,387 |
| American International Group, Inc. | 711,080 | 37,886,342 |
| Aon PLC | 197,171 | 38,050,060 |
| Arthur J Gallagher & Co. | 152,665 | 13,371,927 |
| Assurant, Inc. | 50,395 | 5,361,020 |
| Chubb Ltd. | 375,346 | 55,284,712 |
| Cincinnati Financial Corp. | 124,366 | 12,893,023 |
| Everest Re Group Ltd. | 33,888 | 8,376,436 |
| Hartford Financial Services Group, Inc. | 296,680 | 16,531,010 |
| Lincoln National Corp. | 165,874 | 10,690,579 |
| Loews Corp. | 219,232 | 11,985,414 |
| Marsh & McLennan Cos., Inc. | 419,182 | 41,813,405 |
| MetLife, Inc. | 779,079 | 38,696,854 |
| Principal Financial Group, Inc. | 213,283 | 12,353,351 |
| Progressive Corp. | 478,731 | 38,264,969 |
| Prudential Financial, Inc. | 332,962 | 33,629,162 |
| Torchmark Corp. | 82,916 | 7,417,665 |
| Travelers Cos., Inc. | 214,703 | 32,102,393 |
| Unum Group | 173,973 | 5,836,794 |
| Willis Towers Watson PLC | 105,943 | 20,292,322 |
| Total Insurance | 502,100,709 | |
| Interactive Media & Services | 4.6% | ||
| Alphabet, Inc., Class C (a) | 251,235 | 271,562,424 |
| Alphabet, Inc., Class A (a) | 245,467 | 265,791,667 |
| Facebook, Inc., Class A (a) | 1,969,519 | 380,117,167 |
| Twitter, Inc. (a) | 598,591 | 20,890,826 |
| Total Interactive Media & Services | 938,362,084 | |
| Internet & Direct Marketing Retail | 3.7% | ||
| Amazon.com, Inc. (a) | 339,021 | 641,980,336 |
| Booking Holdings, Inc. (a) | 35,488 | 66,529,709 |
| eBay, Inc. | 671,580 | 26,527,410 |
| Expedia Group, Inc. | 97,000 | 12,903,910 |
| Common Stocks | 98.8% of net assets (Continued) | ||
| Shares | Value | |
| Internet & Direct Marketing Retail | 3.7% (Continued) | ||
| TripAdvisor, Inc. (a) | 84,852 | $3,927,799 |
| Total Internet & Direct Marketing Retail | 751,869,164 | |
| IT Services | 5.2% | ||
| Accenture PLC, Class A | 522,873 | 96,611,244 |
| Akamai Technologies, Inc. (a) | 134,521 | 10,780,513 |
| Alliance Data Systems Corp. | 37,366 | 5,236,098 |
| Automatic Data Processing, Inc. | 356,784 | 58,987,099 |
| Broadridge Financial Solutions, Inc. | 95,207 | 12,156,030 |
| Cognizant Technology Solutions Corp., Class A | 466,019 | 29,540,944 |
| DXC Technology Co. | 220,706 | 12,171,936 |
| Fidelity National Information Services, Inc. | 265,471 | 32,567,982 |
| Fiserv, Inc. (a)(b) | 321,726 | 29,328,542 |
| FleetCor Technologies, Inc. (a)(b) | 70,658 | 19,844,299 |
| Gartner, Inc. (a)(b) | 73,853 | 11,885,902 |
| Global Payments, Inc. | 128,448 | 20,568,378 |
| International Business Machines Corp. | 726,838 | 100,230,960 |
| Jack Henry & Associates, Inc. | 63,289 | 8,475,663 |
| Mastercard, Inc., Class A | 736,785 | 194,901,736 |
| Paychex, Inc. | 262,944 | 21,637,662 |
| PayPal Holdings, Inc. (a) | 963,168 | 110,244,209 |
| Total System Services, Inc. | 133,466 | 17,119,684 |
| VeriSign, Inc. (a) | 85,978 | 17,983,159 |
| Visa Inc., Class A | 1,425,560 | 247,405,938 |
| Western Union Co. | 346,907 | 6,899,980 |
| Total IT Services | 1,064,577,958 | |
| Leisure Products | 0.0% | ||
| Hasbro, Inc. | 94,917 | 10,030,828 |
| Total Leisure Products | 10,030,828 | |
| Life Sciences Tools & Services | 1.1% | ||
| Agilent Technologies, Inc. | 260,809 | 19,474,608 |
| Illumina, Inc. (a) | 120,505 | 44,363,916 |
| IQVIA Holdings, Inc. (a) | 129,353 | 20,812,897 |
| Mettler-Toledo International, Inc. (a)(b) | 20,333 | 17,079,720 |
| PerkinElmer, Inc. | 90,927 | 8,759,907 |
| Thermo Fisher Scientific, Inc. | 327,890 | 96,294,735 |
| Waters Corp. (a)(b) | 56,953 | 12,258,564 |
| Total Life Sciences Tools & Services | 219,044,347 | |
| Machinery | 1.6% | ||
| Caterpillar, Inc. | 468,804 | 63,893,297 |
| Cummins, Inc. | 118,571 | 20,315,955 |
| Deere & Co. | 259,945 | 43,075,486 |
| Dover Corp. | 119,136 | 11,937,427 |
| Appendix | The accompanying notes are an integral part of these financial statements. |
| Common Stocks | 98.8% of net assets (Continued) | ||
| Shares | Value | |
| Machinery | 1.6% (Continued) | ||
| Flowserve Corp. | 107,502 | $5,664,280 |
| Fortive Corp. | 241,738 | 19,706,482 |
| Illinois Tool Works, Inc. | 246,589 | 37,188,087 |
| Ingersoll-Rand PLC | 197,798 | 25,055,073 |
| PACCAR Inc. | 284,002 | 20,351,583 |
| Parker-Hannifin Corp. | 106,186 | 18,052,682 |
| Pentair PLC | 129,638 | 4,822,534 |
| Snap-on, Inc. | 45,592 | 7,551,859 |
| Stanley Black & Decker, Inc. | 124,221 | 17,963,599 |
| Wabtec Corp. | 132,623 | 9,517,026 |
| Xylem, Inc. | 147,503 | 12,337,151 |
| Total Machinery | 317,432,521 | |
| Media | 2.4% | ||
| CBS Corp., Class B | 288,519 | 14,397,098 |
| Charter Communications, Inc., Class A (a)(b) | 141,019 | 55,727,888 |
| Comcast Corp., Class A | 3,712,997 | 156,985,513 |
| Discovery, Inc., Class A (a)(b) | 127,330 | 3,909,031 |
| Discovery, Inc., Class C (a)(b) | 295,569 | 8,408,938 |
| DISH Network Corp., Class A (a) | 189,146 | 7,265,098 |
| Fox Corp., Class A (a) | 290,484 | 10,643,334 |
| Fox Corp., Class B (a) | 133,124 | 4,863,020 |
| Interpublic Group of Cos., Inc. | 317,281 | 7,167,378 |
| News Corp., Class A | 316,045 | 4,263,447 |
| News Corp., Class B | 95,128 | 1,327,987 |
| Omnicom Group, Inc. | 180,486 | 14,790,828 |
| Walt Disney Co. | 1,431,069 | 199,834,475 |
| Total Media | 489,584,035 | |
| Metals & Mining | 0.3% | ||
| Freeport-McMoRan, Inc. | 1,197,969 | 13,908,420 |
| Newmont Mining Corp. | 671,906 | 25,848,224 |
| Nucor Corp. | 251,026 | 13,831,532 |
| Total Metals & Mining | 53,588,176 | |
| Multi-Utilities | 1.1% | ||
| Ameren Corp. | 201,176 | 15,110,329 |
| CenterPoint Energy, Inc. | 411,664 | 11,785,940 |
| CMS Energy Corp. | 234,825 | 13,598,716 |
| Consolidated Edison, Inc. | 268,147 | 23,511,129 |
| Dominion Energy, Inc. | 657,749 | 50,857,153 |
| DTE Energy Co. | 150,191 | 19,206,425 |
| NiSource, Inc. | 305,857 | 8,808,682 |
| Public Service Enterprise Group, Inc. | 411,377 | 24,197,195 |
| Sempra Energy | 224,933 | 30,914,791 |
| WEC Energy Group, Inc. | 258,937 | 21,587,578 |
| Total Multi-Utilities | 219,577,938 | |
| Multiline Retail | 0.5% | ||
| Dollar General Corp. | 211,870 | 28,636,349 |
| Common Stocks | 98.8% of net assets (Continued) | ||
| Shares | Value | |
| Multiline Retail | 0.5% (Continued) | ||
| Dollar Tree, Inc. (a)(b) | 195,034 | $20,944,701 |
| Kohl's Corp. | 132,816 | 6,315,401 |
| Macy's, Inc. | 253,674 | 5,443,844 |
| Nordstrom, Inc. | 88,174 | 2,809,224 |
| Target Corp. | 421,683 | 36,521,964 |
| Total Multiline Retail | 100,671,483 | |
| Oil, Gas & Consumable Fuels | 4.5% | ||
| Anadarko Petroleum Corp. | 411,619 | 29,043,837 |
| Apache Corp. | 308,588 | 8,939,794 |
| Cabot Oil & Gas Corp. | 349,750 | 8,030,260 |
| Chevron Corp. | 1,561,579 | 194,322,891 |
| Cimarex Energy Co. | 82,191 | 4,876,392 |
| Concho Resources Inc. (b) | 164,440 | 16,966,919 |
| ConocoPhillips | 926,478 | 56,515,158 |
| Devon Energy Corp. | 340,366 | 9,707,238 |
| Diamondback Energy, Inc. | 126,893 | 13,827,530 |
| EOG Resources, Inc. | 475,730 | 44,319,007 |
| Exxon Mobil Corp. | 3,468,500 | 265,791,155 |
| Hess Corp. | 209,360 | 13,309,015 |
| HollyFrontier Corp. | 129,331 | 5,985,439 |
| Kinder Morgan, Inc. | 1,595,933 | 33,323,081 |
| Marathon Oil Corp. | 662,202 | 9,409,890 |
| Marathon Petroleum Corp. | 545,527 | 30,484,049 |
| Noble Energy, Inc. | 392,315 | 8,787,856 |
| Occidental Petroleum Corp. | 613,200 | 30,831,696 |
| ONEOK, Inc. | 337,239 | 23,205,416 |
| Phillips 66 | 342,797 | 32,065,231 |
| Pioneer Natural Resources Co. | 138,068 | 21,243,142 |
| Valero Energy Corp. | 342,347 | 29,308,327 |
| Williams Cos., Inc. | 993,366 | 27,853,983 |
| Total Oil, Gas & Consumable Fuels | 918,147,306 | |
| Personal Products | 0.2% | ||
| Coty, Inc., Class A | 246,388 | 3,301,599 |
| Estee Lauder Cos., Inc., Class A | 179,751 | 32,914,206 |
| Total Personal Products | 36,215,805 | |
| Pharmaceuticals | 4.5% | ||
| Allergan PLC | 252,597 | 42,292,316 |
| Bristol-Myers Squibb Co. | 1,340,909 | 60,810,223 |
| Eli Lilly & Co. | 708,309 | 78,473,554 |
| Johnson & Johnson | 2,176,520 | 303,145,705 |
| Merck & Co., Inc. | 2,110,601 | 176,973,894 |
| Mylan NV (a)(b) | 428,272 | 8,154,299 |
| Nektar Therapeutics (a)(b) | 143,154 | 5,093,419 |
| Perrigo Co. PLC | 99,598 | 4,742,857 |
| Pfizer, Inc. | 4,551,171 | 197,156,728 |
| Zoetis, Inc. | 392,385 | 44,531,774 |
| Total Pharmaceuticals | 921,374,769 | |
| The accompanying notes are an integral part of these financial statements. | Appendix |
| Common Stocks | 98.8% of net assets (Continued) | ||
| Shares | Value | |
| Professional Services | 0.3% | ||
| Equifax, Inc. | 99,047 | $13,395,116 |
| IHS Markit Ltd. (a) | 296,698 | 18,905,597 |
| Nielsen Holdings PLC | 291,421 | 6,586,115 |
| Robert Half International, Inc. | 95,017 | 5,416,919 |
| Verisk Analytics, Inc. | 134,168 | 19,650,245 |
| Total Professional Services | 63,953,992 | |
| Real Estate Management & Development | 0.1% | ||
| CBRE Group, Inc., Class A (a) | 256,372 | 13,151,884 |
| Total Real Estate Management & Development | 13,151,884 | |
| Road & Rail | 1.0% | ||
| CSX Corp. | 630,158 | 48,755,324 |
| J.B. Hunt Transport Services, Inc. | 71,325 | 6,519,818 |
| Kansas City Southern | 82,458 | 10,045,034 |
| Norfolk Southern Corp. | 218,030 | 43,459,920 |
| Union Pacific Corp. | 580,260 | 98,127,769 |
| Total Road & Rail | 206,907,865 | |
| Semiconductors & Semiconductor Equipment | 3.7% | ||
| Advanced Micro Devices, Inc. (a)(b) | 727,059 | 22,080,782 |
| Analog Devices, Inc. | 303,117 | 34,212,816 |
| Applied Materials, Inc. | 768,929 | 34,532,601 |
| Broadcom, Inc. | 324,500 | 93,410,570 |
| Intel Corp. | 3,670,085 | 175,686,969 |
| KLA-Tencor Corp. | 133,643 | 15,796,603 |
| Lam Research Corp. | 122,905 | 23,086,475 |
| Maxim Integrated Products, Inc. | 221,402 | 13,244,268 |
| Microchip Technology, Inc. | 195,044 | 16,910,315 |
| Micron Technology, Inc. (a) | 907,222 | 35,009,697 |
| NVIDIA Corp. | 499,236 | 81,989,528 |
| Qorvo, Inc. (a)(b) | 99,482 | 6,626,496 |
| QUALCOMM, Inc. | 996,587 | 75,810,373 |
| Skyworks Solutions, Inc. | 141,213 | 10,911,528 |
| Texas Instruments, Inc. | 769,108 | 88,262,834 |
| Xilinx, Inc. | 208,155 | 24,545,638 |
| Total Semiconductors & Semiconductor Equipment | 752,117,493 | |
| Software | 6.7% | ||
| Adobe, Inc. (a) | 400,005 | 117,861,473 |
| ANSYS, Inc. (a) | 68,801 | 14,091,821 |
| Autodesk, Inc. (a) | 180,037 | 29,328,027 |
| Cadence Design Systems, Inc. (a) | 230,378 | 16,313,066 |
| Citrix Systems, Inc. | 102,013 | 10,011,556 |
| Fortinet, Inc. (a) | 118,986 | 9,141,694 |
| Intuit, Inc. | 212,518 | 55,537,329 |
| Microsoft Corp. | 6,281,705 | 841,497,202 |
| Oracle Corp. | 1,989,186 | 113,323,926 |
| Red Hat, Inc. (a) | 145,718 | 27,360,012 |
| Common Stocks | 98.8% of net assets (Continued) | ||
| Shares | Value | |
| Software | 6.7% (Continued) | ||
| salesforce.com, Inc. (a) | 636,583 | $96,588,739 |
| Symantec Corp. | 506,961 | 11,031,471 |
| Synopsys, Inc. (a) | 122,882 | 15,813,685 |
| Total Software | 1,357,900,001 | |
| Specialty Retail | 2.3% | ||
| Advance Auto Parts, Inc. | 59,306 | 9,141,427 |
| AutoZone, Inc. (a) | 20,211 | 22,221,388 |
| Best Buy Co., Inc. | 190,454 | 13,280,358 |
| CarMax, Inc. (a)(b) | 136,238 | 11,829,546 |
| Foot Locker, Inc. | 90,561 | 3,796,317 |
| Gap, Inc. | 168,153 | 3,021,709 |
| Home Depot, Inc. | 901,975 | 187,583,741 |
| L Brands, Inc. | 188,267 | 4,913,769 |
| Lowe's Cos., Inc. | 641,807 | 64,764,744 |
| O'Reilly Automotive, Inc. (a) | 64,169 | 23,698,895 |
| Ross Stores, Inc. | 300,143 | 29,750,174 |
| Tiffany & Co. | 88,586 | 8,295,193 |
| TJX Cos., Inc. | 994,102 | 52,568,114 |
| Tractor Supply Co. | 99,135 | 10,785,888 |
| Ulta Salon Cosmetics & Fragrance, Inc. (a) | 45,643 | 15,833,100 |
| Total Specialty Retail | 461,484,363 | |
| Technology Hardware, Storage & Peripherals | 3.9% | ||
| Apple, Inc. | 3,583,207 | 709,188,329 |
| Hewlett Packard Enterprise Co. | 1,097,787 | 16,411,916 |
| HP, Inc. | 1,240,636 | 25,792,822 |
| NetApp, Inc. | 200,968 | 12,399,726 |
| Seagate Technology PLC | 206,875 | 9,747,950 |
| Western Digital Corp. | 240,189 | 11,420,987 |
| Xerox Corp. | 160,203 | 5,672,788 |
| Total Technology Hardware, Storage & Peripherals | 790,634,518 | |
| Textiles, Apparel & Luxury Goods | 0.7% | ||
| Capri Holdings Ltd. (a) | 123,734 | 4,291,095 |
| Hanesbrands, Inc. | 298,071 | 5,132,783 |
| NIKE, Inc., Class B | 1,030,218 | 86,486,801 |
| PVH Corp. | 60,782 | 5,752,409 |
| Ralph Lauren Corp. | 42,619 | 4,841,092 |
| Tapestry, Inc. | 237,843 | 7,546,758 |
| Under Armour, Inc., Class A (a)(b) | 154,128 | 3,907,145 |
| Under Armour, Inc., Class C (a) | 157,544 | 3,497,477 |
| VF Corp. | 266,972 | 23,320,004 |
| Total Textiles, Apparel & Luxury Goods | 144,775,564 | |
| Tobacco | 0.9% | ||
| Altria Group, Inc. | 1,533,713 | 72,621,310 |
| Philip Morris International, Inc. | 1,275,392 | 100,156,534 |
| Total Tobacco | 172,777,844 | |
| Appendix | The accompanying notes are an integral part of these financial statements. |
| Common Stocks | 98.8% of net assets (Continued) | ||
| Shares | Value | |
| Trading Companies & Distributors | 0.2% | ||
| Fastenal Co. | 469,165 | $15,290,087 |
| United Rentals, Inc. (a) | 64,479 | 8,551,850 |
| W.W. Grainger, Inc. | 36,250 | 9,723,338 |
| Total Trading Companies & Distributors | 33,565,275 | |
| Water Utilities | 0.1% | ||
| American Water Works Co., Inc. | 148,954 | 17,278,665 |
| Total Water Utilities | 17,278,665 | |
| Total Common Stocks | ||
| (Cost $12,230,970,576) | 20,031,335,010 | |
| Short-Term Securities | 1.5% of net assets | ||
| BlackRock Cash Funds: Institutional, SL Agency Shares, 2.52% (c)(d)(e) | 98,087,066 | 98,136,109 |
| Short-Term Securities | 1.5% of net assets (Continued) | ||
| Shares | Value | |
| BlackRock Cash Funds: Treasury, SL Agency Shares, 2.34% (c)(d) | 205,449,696 | $205,449,696 |
| Total Short-Term Securities | ||
| (Cost $303,559,693) | 303,585,805 | |
| Total Investments | ||
| (Cost $12,534,530,269) | 100.3% | 20,334,920,815 | |
| Liabilities in Excess of Other Assets | (0.3)% | (64,906,758) | |
| Net Assets | 100.0% | $20,270,014,057 | |
| (a) | Non-income producing. |
| (b) | Security, or a portion of security, is on loan. |
| (c) | During the period ended June 30, 2019, investments in issuers considered to be affiliates of the Master Portfolio for purposes of Section 2(a)(3) of the Investment Company Act of 1940, as amended, and/or related parties of the Master Portfolio were as follows: |
| Affiliate Persons and/or Related Parties | Shares Held at December 31, 2018 | Shares Purchased | Shares Sold | Shares Held at June 30, 2019 | Value at June 30, 2019 | Income | Realized Gain (Loss)1 | Change in Unrealized Appreciation (Depreciation) |
| BlackRock Cash Funds: Institutional, SL Agency Shares | 118,748,723 | — | (20,661,657)2 | 98,087,066 | $98,136,109 | $345,7063 | $23,375 | $23,276 |
| BlackRock Cash Funds: Treasury, SL Agency Shares | 479,801,017 | — | (274,351,321)2 | 205,449,696 | 205,449,696 | 1,971,019 | — | — |
| BlackRock, Inc. | 98,827 | — | (1,313) | 97,514 | 45,763,320 | 643,592 | (203,113) | 7,674,125 |
| Total | $349,349,125 | $2,960,317 | $(179,738) | $7,697,401 |
| 1 | Includes net capital gain distributions, if applicable. |
| 2 | Represents net shares sold. |
| 3 | Represents all or portion of securities lending income earned from the reinvestment of cash collateral from loaned securities, net of fees, and collateral investment expenses, and other payments to and from borrowers of securities. |
| (d) | 7-day yield at June 30, 2019. |
| (e) | All or a portion of security was purchased with the cash collateral from loaned securities. |
| Derivative Financial Instruments Outstanding as of Period End - Futures Contracts | ||||
| Contracts Long | Issue | Expiration | Notional Amount (000) | Unrealized Appreciation (Depreciation) |
| 1,505 | S&P 500 E-Mini Index | September 2019 | $221,551 | $3,346,039 |
| The accompanying notes are an integral part of these financial statements. | Appendix |
| Assets-Derivative Financial Instruments | Commodity Contracts | Credit Contract | Equity Contracts | Foriegn Currency Exchange Contracts | Interest Rate Contracts | Other Contracts | Total |
| Futures contracts net unrealized appreciation1 | — | — | $3,346,039 | — | — | — | $3,346,039 |
| 1 | Net cumulative unrealized appreciation (depreciation) on futures contracts, if any, are reported in the Schedule of Investments. In the Statements of Assets and Liabilities, only current day’s variation margin is reported in receivables or payables and the net cumulative unrealized appreciation (depreciation) is included in Net unrealized appreciation (depreciation). |
| Commodity Contracts | Credit Contract | Equity Contracts | Foreign Currency Exchange Contracts | Interest Rate Contracts | Other Contracts | Total | |
| Realized Gain (Loss) From: | |||||||
| Futures contracts | — | — | $28,926,772 | — | — | — | $28,926,772 |
| Net Change in Unrealized Appreciation (Depreciation) on: | |||||||
| Futures contracts | — | — | $2,968,716 | — | — | — | $2,968,716 |
| Average Quarterly Balances on Outstanding Derivative Financial Instruments | |||||||
| Futures contracts: Average notional value of contracts—long | $171,717,280 | ||||||
| Level 1 | Level 2 | Level 3 | Total | |
| Assets: | ||||
| Investments: | ||||
Long-Term Investments: Common Stocks(a) | $20,031,335,010 | $— | $— | $20,031,335,010 |
Short-Term Securities: Money Market Funds | 303,585,805 | — | — | 303,585,805 |
| $20,334,920,815 | $— | $— | $20,334,920,815 | |
| Derivative Financial Instruments(b) | ||||
| Assets: | ||||
Equity contracts | $3,346,039 | $— | $— | $3,346,039 |
| (a) | See above Schedule of Investments for values in each industry. |
| (b) | Derivative financial instruments are futures contracts. Futures contracts are valued at the unrealized appreciation (depreciation) on the instrument. |
| Appendix | The accompanying notes are an integral part of these financial statements. |
| Assets | |
| Investments in securities, at value (including securities loaned of $95,091,731) (cost: $12,200,612,073) | $19,985,571,690 |
| Investments at value—affiliated (cost—$333,918,196) | 349,349,125 |
| Cash pledged for futures contracts | 9,576,800 |
| Dividends—unaffiliated | 16,319,883 |
| Dividends—affiliated | 510,019 |
| Securities lending income—affiliated | 18,531 |
| Variation margin on futures contracts | 1,000,800 |
| Contributions from investors | 16,521,544 |
| Prepaid expenses | 31,527 |
| Total Assets | 20,378,899,919 |
| Liabilities | |
| Collateral on securities loaned at value | 98,105,170 |
| Investment securities purchased | 10,032,889 |
| Accrued expenses | 29,075 |
| Investment advisory fees | 634,430 |
| Trustees' fees | 67,813 |
| Professional fees | 16,485 |
| Total Liabilities | 108,885,862 |
| Net Assets | $20,270,014,057 |
| Net Assets Consist Of: | |
| Unrealized appreciation (depreciation) of investments | 7,803,736,585 |
| Investors’ capital | 12,466,277,472 |
| Net Assets | $20,270,014,057 |
| The accompanying notes are an integral part of these financial statements. | Appendix |
| Investment Income | |
| Dividends—unaffiliated | 188,616,582 |
| Dividends—affiliated | 2,614,611 |
| Securities lending—affiliated—net | 345,706 |
| Foreign taxes withheld | (667,399) |
| Total Investment Income | 190,909,500 |
| Expenses | |
| Investment advisory | 3,794,286 |
| Director, Trustee, and Board meeting expenses | 137,397 |
| Professional | 21,942 |
| Total Expenses | 3,953,625 |
| Less fees waived and/or reimbursed by the Manager | (218,089) |
| Total Expenses After Fees Waived and/or Reimbursed | 3,735,536 |
| Net Investment Income | 187,173,964 |
| Realized And Unrealized Gain (Loss) | |
| Net realized gain (loss) from: | |
| Investments—unaffiliated | (48,197,142) |
| Investments—affiliated | (179,738) |
| Futures contracts | 28,926,772 |
| Net Realized Gain (Loss) | (19,450,108) |
| Net change in unrealized appreciation (depreciation) on: | |
| Investments—unaffiliated | 2,991,110,124 |
| Investments—affiliated | 7,697,401 |
| Futures contracts | 2,968,716 |
| Net Change In Unrealized Appreciation (Depreciation) | 3,001,776,241 |
| Net Realized And Unrealized Gain | $2,982,326,133 |
| Net Increase In Net Assets From Operations | $3,169,500,097 |
| Appendix | The accompanying notes are an integral part of these financial statements. |
| Six Months Ended June 30, 2019 (Unaudited) | Year Ended December 31, 2018 | |
| Increase (Decrease) In Net Assets | ||
| Operations | ||
| Net investment income | $187,173,964 | $308,119,158 |
| Net realized gain (loss) on investments | (19,450,108) | 68,976,788 |
| Net change in unrealized appreciation (depreciation) | 3,001,776,241 | (1,302,602,820) |
| Net Increase (decrease) in net assets from operations | 3,169,500,097 | (925,506,874) |
| Capital Transactions | ||
| Proceeds from contributions | 2,917,255,952 | 9,671,286,018 |
| Value of withdrawals | (3,073,670,801) | (5,263,924,715) |
| Total increase (decrease) in net assets from capital transactions | (156,414,849) | 4,407,361,303 |
| Total Increase In Net Assets | 3,013,085,248 | 3,481,854,429 |
| Net Assets | ||
| Beginning of period | $17,256,928,809 | $13,775,074,380 |
| End of period | $20,270,014,057 | $17,256,928,809 |
| The accompanying notes are an integral part of these financial statements. | Appendix |
| Six Months Ended June 30, 2019 (Unaudited) | Year Ended December 31, | |||||
| 2018 | 2017 | 2016 | 2015 | 2014 | ||
| Total Return | 18.52%(a) | -4.38% | 21.77% | 11.92% | 1.35% | 13.63% |
| Ratio to Average Net Assets | ||||||
| Total expenses | 0.04%(b) | 0.04% | 0.04% | 0.04% | 0.05% | 0.05% |
| Total expenses after fees waived and/or reimbursed | 0.04%(b) | 0.04% | 0.04% | 0.04% | 0.04% | 0.05% |
| Net investment income | 1.97%(b) | 1.92% | 1.93% | 2.11% | 2.00% | 1.98% |
| Supplemental Data | ||||||
| Net assets, end of period (000) | $20,270,014 | $17,256,929 | $13,775,074 | $9,791,759 | $7,209,857 | $5,748,578 |
| Portfolio turnover rate | 2% | 12% | 11% | 4% | 2% | 3% |
| (a) | Aggregate total return for the period. |
| (b) | Annualized. |
| Appendix | The accompanying notes are an integral part of these financial statements. |
| Target Fund | Fair Value of Invesments | Cost of Investments |
| State Farm S&P 500 Index Fund | $1,473,476,973 | $726,300,157 |
| Notes to Financial Statements | Appendix |
| Appendix | Notes to Financial Statements |
| Counterparty | Securities Loaned at Value | Cash Collateral Received1 | Net Amount |
| Barclays Bank Plc | $2,259,642 | $(2,259,642) | — |
| Barclays Capital, Inc. | 2,277,793 | (2,277,793) | — |
| BNP Paribas Securities Corp. | 814,465 | (814,465) | — |
| Merrill Lynch, Pierce, Fenner & Smith, Inc. | 25,703,587 | (25,703,587) | — |
| Citigroup Global Markets, Inc. | 9,809,071 | (9,809,071) | — |
| Credit Suisse Securities (USA) LLC | 356,116 | (356,116) | — |
| Goldman Sachs & Co. | 9,437,216 | (9,437,216) | — |
| JP Morgan Securities LLC | 43,725,776 | (43,725,776) | — |
| UBS Securities LLC | 708,065 | (708,065) | — |
| $95,091,731 | $(95,091,731) | $— | |
| 1Cash collateral with a value of $98,105,170 has been received in connection with securities lending agreements. Collateral received in excess of the value of securities loaned from the individual counterparty is not shown for financial reporting purposes in the table above. | |||
| Notes to Financial Statements | Appendix |
| Appendix | Notes to Financial Statements |
| Purchases | Sales | Net Realized Gain (Loss) |
| $192,583,940 | $39,440,422 | $(9,380,548) |
| Notes to Financial Statements | Appendix |
| Tax cost | $12,264,788,466 |
| Gross unrealized appreciation | $8,766,910,889 |
| Gross unrealized depreciation | $(693,432,501) |
| Net unrealized appreciation | $8,073,478,388 |
| Appendix | Notes to Financial Statements |
| Notes to Financial Statements | Appendix |
S&P 500 Index Master Portfolio


Item 2. Code of Ethics.
Not required in this filing.
Item 3. Audit Committee Financial Expert.
Not required in this filing.
Item 4. Principal Accountant Fees and Services.
Not required in this filing.
Item 5. Audit Committee of Listed Registrants.
Not applicable.
Item 6. Investments.
(a) | The Registrant’s schedule of investments in unaffiliated issuers is included in the report to shareholders under Item 1 of this Form N-CSR. |
(b) | Not applicable. |
Item 7. Disclosure of Proxy Voting Policies and Procedures for Closed-End Management Investment Companies.
Not applicable.
Item 8. Portfolio Managers of Closed-End Management Investment Companies.
Not applicable.
Item 9. Purchases of Equity Securities by Closed-End Management Investment Company and Affiliated Purchasers.
Not applicable.
Item 10. Submission of Matters to a Vote of Security Holders.
Not applicable.
Item 11. Controls and Procedures.
(a) | Disclosure Controls and Procedures. The registrant's principal executive officer and principal financial officer concluded, based on their evaluation of the disclosure controls and procedures as of a date within 90 days of the filing date of this report, that the registrant's disclosure controls and procedures are effectively designed to provide reasonable assurance that the information required to be disclosed by the registrant in this report is recorded, processed, summarized and reported by the filing date, including the registrant's principal executive officer and principal financial officer, as appropriate, to allow timely decisions regarding required disclosure. |
(b) | Internal Control. There were no changes in registrant's internal control over financial reporting that occurred during the period covered by this report that have materially affected, or are reasonably likely to materially affect, the registrant's internal control over financial reporting. |
Item 12. Disclosure of Securities Lending Activities For Closed-End Management Investment Companies.
Not applicable.
Item 13. Exhibits.
(a)(1) | Not required with this filing. |
(a)(2) | A separate certification for the principal executive officer and principal financial officer of the registrant, as required by Rule 30a-2(a) under the Investment Company Act of 1940, is filed herewith. |
(a)(3) | Not applicable. |
| (a)(4) | Not applicable. |
(b) | A certification by the registrant’s principal executive officer and principal financial officer, as required by Section 906 of the Sarbanes-Oxley Act of 2002 and Rule 30a-2(b) under the Investment Company Act of 1940, is filed herewith |
SIGNATURES
Pursuant to the requirements of the Securities Exchange Act of 1934 and the Investment Company Act of 1940, the registrant has duly caused this report to be signed on its behalf by the undersigned, thereunto duly authorized.
HOMESTEAD FUNDS TRUST
By: | /s/ Mark D. Santero |
| Mark D. Santero |
| President, Chief Executive Officer and Trustee |
Date: September 4, 2019
Pursuant to the requirements of the Securities Exchange Act of 1934 and the Investment Company Act of 1940, this report has been signed below by the following persons on behalf of the registrant and in the capacities and on the dates indicated.
By: | /s/ Mark D. Santero |
| Mark D. Santero |
| President, Chief Executive Officer and Trustee |
Date: September 4, 2019
By: | /s/ Amy M. DiMauro |
| Amy M. DiMauro |
| Treasurer |
Date: September 4, 2019