UNITED STATES
SECURITIES AND EXCHANGE COMMISSION
Washington, D.C. 20549
FORM N-CSR
CERTIFIED SHAREHOLDER REPORT OF REGISTERED
MANAGEMENT INVESTMENT COMPANIES
Investment Company Act File number: 811-23429
HOMESTEAD FUNDS TRUST
(Exact name of registrant as specified in charter)
4301 Wilson Boulevard
Arlington, VA 22203
(Address of principal executive office – Zip code)
Danielle Sieverling
Homestead Funds Trust
4301 Wilson Boulevard
Arlington, VA 22203
(Name and address of agent for service)
Copies to:
Bryan Chegwidden, Esq.
Ropes & Gray LLP
1211 Avenue of the Americas
New York, NY 10036-8704
(Name and addresses of agent for service)
Registrant's telephone number, including area code: (703) 907-5993
Date of fiscal year end: December 31
Date of reporting period: December 31, 2020
Item 1. Reports to Stockholders.


| Performance Evaluation | ||
| 2 | ||
| 4 | ||
| 6 | ||
| 8 | ||
| 10 | ||
| 12 | ||
| 14 | ||
| 16 | ||
| 18 | ||
| 20 | ||
| 22 | ||
| 33 | ||
| 34 | ||
| Portfolio of Investments | ||
| 35 | ||
| 37 | ||
| 40 | ||
| 48 | ||
| 57 | ||
| 58 | ||
| 60 | ||
| 62 | ||
| 64 |
| 66 | ||
| 68 | ||
| 70 | ||
| Financial Highlights | ||
| 75 | ||
| 76 | ||
| 77 | ||
| 78 | ||
| 79 | ||
| 80 | ||
| 81 | ||
| 82 | ||
| 83 | ||
| 84 | ||
| 93 | ||
| 96 | ||
| 97 |


| Investment Advisor: RE Advisers Corporation | |
 | Marc Johnston, CFP, ChFC, CAIAMoney Market Portfolio ManagerBA, General Arts, Villanova University; MBA, Northeastern University |
| Average Annual Total Returns (periods ended 12/31/20) | ||||||
| 1 YR % | 5 YR % | 10 YR % | ||||
| Daily Income Fund | 0.19 | 0.58 | 0.29 | |||
| Yield | ||
| Annualized 7-day current yield quoted 12/31/20 | 0.01% | |
| Security Diversification | ||
| % of Total Investments | ||
| as of 12/31/19 | as of 12/31/20 | |
| U.S. government and agency obligations | 89.7 | 82.1 |
| Short-term and other assets* | 10.3 | 17.9 |
| Total | 100.0% | 100.0% |
| Maturity | ||||
| as of 12/31/19 | as of 12/31/20 | |||
| Average weighted maturity | 46 days | 52 days | ||
| Investment Advisor: RE Advisers Corporation | |
 | Mauricio Agudelo, CFASenior Fixed Income Portfolio ManagerBS, Finance, The University of Maryland, Robert H. Smith School of Business |
 | Ivan Naranjo, CFA, FRMFixed Income Portfolio ManagerBS, Finance, The University of Maryland, Robert H. Smith School of Business |
| Average Annual Total Returns (periods ended 12/31/20) | ||||||
| 1 YR % | 5 YR % | 10 YR % | ||||
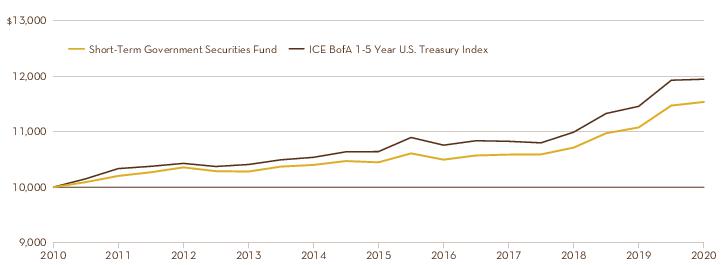
| Short-Term Government Securities Fund | 4.13 | 1.99 | 1.43 | |||
| ICE BofA 1-5 Year U.S. Treasury Index | 4.25 | 2.33 | 1.79 | |||
| Security Diversification | ||
| % of Total Investments | ||
| as of 12/31/19 | as of 12/31/20 | |
| Corporate bonds–government guaranteed | 27.5 | 52.7 |
| U.S. government and agency obligations | 62.6 | 37.0 |
| Corporate bonds–other | 2.7 | 2.4 |
| Asset-backed securities | 4.3 | 2.4 |
| Municipal bonds | 0.0 | 2.1 |
| Mortgage-backed securities | 0.1 | 0.0 |
| Certificates of deposit | 0.6 | 0.0 |
| Short-term and other assets | 2.2 | 3.4 |
| Total | 100.0% | 100.0% |
| Maturity | ||||
| as of 12/31/19 | as of 12/31/20 | |||
| Average weighted maturity | 2.70 | 2.83 | ||
| Investment Advisor: RE Advisers Corporation | |
| Mauricio Agudelo, CFASenior Fixed Income Portfolio ManagerBS, Finance, The University of Maryland, Robert H. Smith School of Business |
| Ivan Naranjo, CFA, FRMFixed Income Portfolio ManagerBS, Finance, The University of Maryland, Robert H. Smith School of Business |
| Average Annual Total Returns (periods ended 12/31/20) | ||||||
| 1 YR % | 5 YR % | 10 YR % | ||||
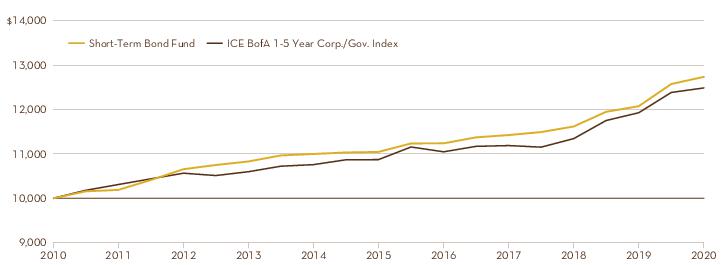
| Short-Term Bond Fund | 5.42 | 2.87 | 2.44 | |||
| ICE BofA 1-5 Year Corp./Gov. Index | 4.65 | 2.79 | 2.24 | |||
| Security Diversification | ||
| % of Total Investments | ||
| as of 12/31/19 | as of 12/31/20 | |
| U.S. government and agency obligations | 61.4 | 36.8 |
| Corporate bonds–other | 19.6 | 34.2 |
| Asset-backed securities | 12.2 | 10.6 |
| Yankee bonds | 5.6 | 10.0 |
| Municipal bonds | 0.2 | 3.4 |
| Corporate bonds–government guaranteed | 0.1 | 3.0 |
| Mortgage-backed securities | 0.1 | 0.0 |
| Short-term and other assets | 0.8 | 2.0 |
| Total | 100.0% | 100.0% |
| Maturity | ||||
| as of 12/31/19 | as of 12/31/20 | |||
| Average weighted maturity | 2.64 | 2.90 | ||
| Investment Advisor: RE Advisers Corporation | |
| Mauricio Agudelo, CFASenior Fixed Income Portfolio ManagerBS, Finance, The University of Maryland, Robert H. Smith School of Business |
| Ivan Naranjo, CFA, FRMFixed Income Portfolio ManagerBS, Finance, The University of Maryland, Robert H. Smith School of Business |
| Average Annual Total Returns (periods ended 12/31/20) | ||||
| 1 YR % | Since Inception % | |||
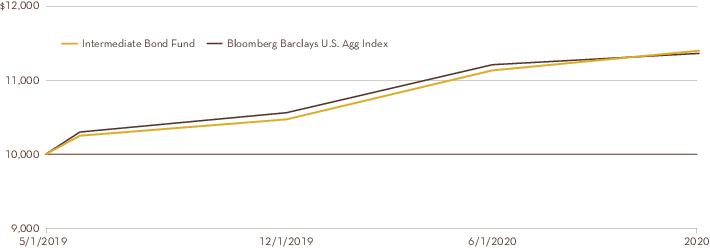
| Intermediate Bond Fund | 8.70 | 8.04 | ||
| Bloomberg Barclays U.S. Agg Index | 7.51 | 7.89 | ||
| Security Diversification | ||
| % of Total Investments | ||
| as of 12/31/19 | as of 12/31/20 | |
| Corporate bonds–other | 25.5 | 39.1 |
| Mortgage-backed securities | 23.4 | 17.4 |
| U.S. government and agency obligations | 39.8 | 13.9 |
| Asset-backed securities | 5.2 | 11.3 |
| Yankee bonds | 3.8 | 9.1 |
| Municipal bonds | 0.4 | 4.0 |
| Corporate bonds–government guaranteed | 0.0 | 0.4 |
| Short-term and other assets | 1.9 | 4.8 |
| Total | 100.0% | 100.0% |
| Maturity | ||||
| as of 12/31/19 | as of 12/31/20 | |||
| Average weighted maturity | 7.30 | 7.47 | ||
| Average Annual Total Returns (periods ended 12/31/20) | ||||||
| 1 YR % | 5 YR % | 10 YR % | ||||
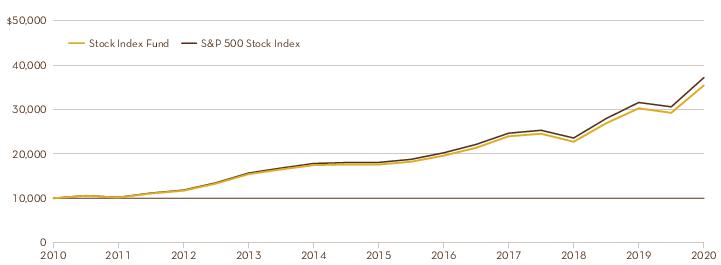
| Stock Index Fund | 17.80 | 14.58 | 13.27 | |||
| S&P 500 Stock Index | 18.40 | 15.22 | 13.88 | |||
| Sector Diversification | ||
| % of Total Investments as of 12/31/20 | ||
| Information technology | 27.4 | |
| Health care | 13.4 | |
| Consumer discretionary | 12.7 | |
| Communication services | 10.6 | |
| Financials | 10.2 | |
| Industrials | 8.4 | |
| Consumer staples | 6.4 | |
| Utilities | 2.7 | |
| Materials | 2.6 | |
| Real estate | 2.4 | |
| Energy | 2.3 | |
| Short-term and other assets | 0.9 |
| Total | 100.0% |
| Top 10 Equity Holdings | ||
| % of Total Investments as of 12/31/20 | ||
| Apple, Inc. | 6.6 | |
| Microsoft Corp. | 5.3 | |
| Amazon.com, Inc. | 4.3 | |
| Alphabet, Inc. | 3.2 | |
| Facebook, Inc. | 2.1 | |
| Tesla Inc. | 1.7 | |
| Berkshire Hathaway, Inc. | 1.4 | |
| Johnson & Johnson | 1.3 | |
| JPMorgan Chase & Co. | 1.2 | |
| Visa Inc. | 1.2 | |
| Total | 28.3% | |
| Investment Advisor: RE Advisers Corporation | |
 | Prabha Carpenter, CFASenior Equity Portfolio ManagerBA, Economics, University of Madras; MBA with distinction in Finance and BS in Business Economics, The American University |
 | Jim Polk, CFASenior Equity Portfolio ManagerBA, English, Colby College; MBA, The Olin Graduate School of Business at Babson College |
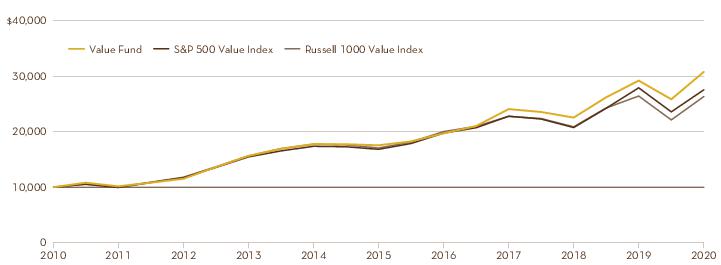
| Average Annual Total Returns (periods ended 12/31/20) | ||||||
| 1 YR % | 5 YR % | 10 YR % | ||||
| Value Fund | 7.61 | 12.03 | 11.97 | |||
| Standard & Poor’s 500 Value Index | 1.36 | 10.52 | 10.74 | |||
| Russell 1000 Value Index | 2.80 | 9.74 | 10.50 | |||
| Sector Diversification | ||
| % of Total Investments as of 12/31/20 | ||
| Health care | 22.3 | |
| Financials | 18.5 | |
| Information technology | 17.4 | |
| Industrials | 16.3 | |
| Materials | 8.4 | |
| Communication services | 8.0 | |
| Consumer discretionary | 5.6 | |
| Real estate | 2.0 | |
| Short-term and other assets | 1.5 | |
| Total | 100.0% | |
| Top 10 Equity Holdings | ||
| % of Total Investments as of 12/31/20 | ||
| Alphabet, Inc. | 5.0 | |
| Honeywell International, Inc. | 5.0 | |
| Avery Dennison Corp. | 4.4 | |
| Abbott Laboratories | 4.4 | |
| Microsoft Corp. | 4.4 | |
| JPMorgan Chase & Co. | 4.3 | |
| Allstate Corp. | 3.6 | |
| Visa Inc. | 3.4 | |
| Parker-Hannifin Corp. | 3.2 | |
| NVIDIA Corp. | 2.7 | |
| Total | 40.4% | |
| Subadvisor: T. Rowe Price Associates | |
 | Taymour Tamaddon, CFAPortfolio ManagerBS, Applied Physics, Cornell University; MBA, Finance, Dartmouth |
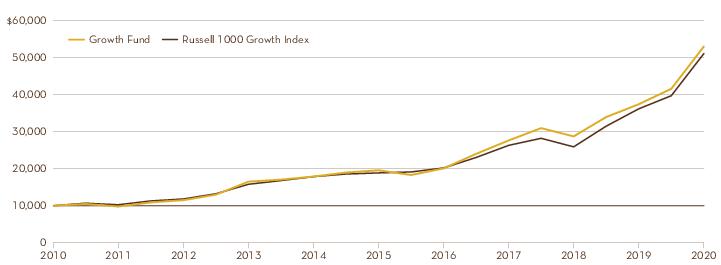
| Average Annual Total Returns (periods ended 12/31/20) | ||||||
| 1 YR % | 5 YR % | 10 YR % | ||||
| Growth Fund | 38.65 | 21.17 | 17.73 | |||
| Russell 1000 Growth Index | 38.49 | 21.00 | 17.21 | |||
| Sector Diversification | ||
| % of Total Investments as of 12/31/20 | ||
| Information technology | 35.5 | |
| Communication services | 23.1 | |
| Consumer discretionary | 21.2 | |
| Health care | 14.5 | |
| Industrials | 2.2 | |
| Financials | 2.0 | |
| Utilities | 0.9 | |
| Short-term and other assets | 0.6 | |
| Total | 100.0% | |
| Top 10 Equity Holdings | ||
| % of Total Investments as of 12/31/20 | ||
| Amazon.com, Inc. | 9.5 | |
| Microsoft Corp. | 7.8 | |
| Alphabet, Inc. | 7.3 | |
| Facebook, Inc. | 5.7 | |
| Apple, Inc. | 4.6 | |
| Visa Inc. | 4.0 | |
| Global Payments, Inc. | 3.7 | |
| Intuit, Inc. | 2.5 | |
| Snap Inc., Class A | 2.5 | |
| PayPal Holdings, Inc. | 2.2 | |
| Total | 49.8% | |
| Subadvisor: Harding Loevner LP | |
 | Ferrill D. Roll, CFACo-Lead Portfolio ManagerBA, Economics, Stanford University |
 | Andrew West, CFACo-Lead Portfolio ManagerBS, Business Administration, University of Central Florida; MBA, New York University |
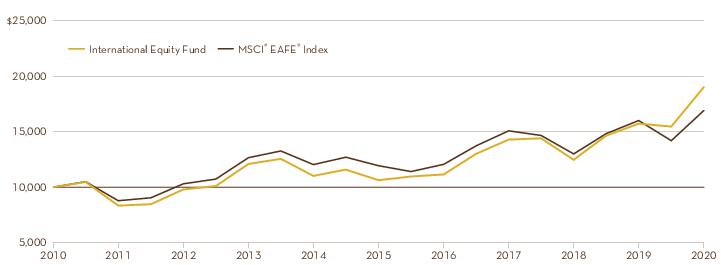
| Average Annual Total Returns (periods ended 12/31/20) | ||||||
| 1 YR % | 5 YR % | 10 YR % | ||||
| International Equity Fund* | 21.34 | 12.17 | 6.56 | |||
| MSCI® EAFE® Index | 7.82 | 7.45 | 5.51 | |||
| Country Diversification | ||
| % of Total Investments as of 12/31/20 | ||
| Japan | 18.1 | |
| Germany | 14.0 | |
| Switzerland | 12.8 | |
| France | 10.0 | |
| Britain | 8.2 | |
| Sweden | 7.4 | |
| Netherlands | 3.8 | |
| Hong Kong | 3.4 | |
| Singapore | 2.5 | |
| Canada | 2.1 | |
| China | 2.0 | |
| Israel | 1.8 | |
| Spain | 1.6 | |
| Taiwan | 1.4 | |
| Republic of South Korea | 1.4 | |
| Australia | 1.3 | |
| United States of America | 1.1 | |
| Denmark | 1.0 | |
| India | 0.9 | |
| Brazil, Russia & Mexico | 1.7 | |
| Short-term and other assets | 3.5 | |
| Total | 100.0% | |
| Top 10 Equity Holdings | ||
| % of Total Investments as of 12/31/20 | ||
| Infineon Technologies AG | 4.7 | |
| L’Oréal SA | 3.9 | |
| Adyen NV | 3.8 | |
| Atlas Copco AB | 3.7 | |
| AIA Group Ltd. | 3.4 | |
| SAP SE ADR | 3.1 | |
| Lonza Group AG REG | 3.1 | |
| Roche Holding AG REG | 3.1 | |
| Allianz SE REG | 3.1 | |
| Schneider Electric SE | 3.0 | |
| Total | 34.9% | |
| Investment Advisor: RE Advisers Corporation | |
| Prabha Carpenter, CFASenior Equity Portfolio ManagerBA, Economics, University of Madras; MBA with distinction in Finance and BS in Business Economics, The American University |
| Jim Polk, CFASenior Equity Portfolio ManagerBA, English, Colby College; MBA, The Olin Graduate School of Business at Babson College |
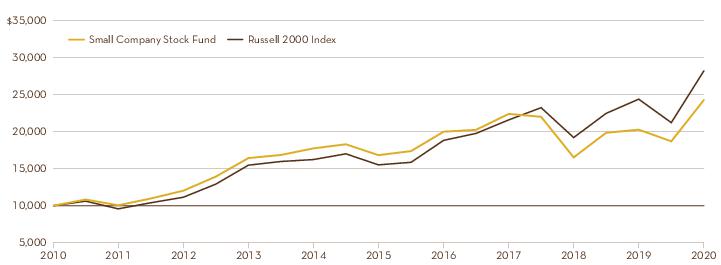
| Average Annual Total Returns (periods ended 12/31/20) | ||||||
| 1 YR % | 5 YR % | 10 YR % | ||||
| Small-Company Stock Fund | 22.08 | 7.94 | 9.44 | |||
| Russell 2000 Index | 19.96 | 13.26 | 11.20 | |||
| Sector Diversification | ||
| % of Total Investments as of 12/31/20 | ||
| Health care | 26.8 | |
| Information technology | 22.3 | |
| Industrials | 14.5 | |
| Financials | 13.9 | |
| Consumer discretionary | 7.4 | |
| Materials | 7.4 | |
| Real estate | 4.4 | |
| Communication services | 1.1 | |
| Consumer staples | 0.9 | |
| Short-term and other assets | 1.3 | |
| Total | 100.0% | |
| Top 10 Equity Holdings | ||
| % of Total Investments as of 12/31/20 | ||
| Avient Corp. | 3.7 | |
| Twist Bioscience Corp. | 3.6 | |
| Medpace Holdings, Inc. | 3.4 | |
| Applied Industrial Technologies, Inc. | 3.4 | |
| NanoString Technologies, Inc. | 3.3 | |
| LHC Group, Inc. | 3.3 | |
| STAAR Surgical Co. | 3.2 | |
| ManTech International Corp. | 3.2 | |
| Glacier Bancorp, Inc. | 2.8 | |
| Descartes Systems Group Inc. (The) | 2.6 | |
| Total | 32.5% | |
| Daily Income Fundb | Beginning Account Value July 1, 2020 | Ending Account Value December 31, 2020 | Expenses Paid During the Perioda | Annualized Expense Ratio for the Period Ended December 31, 2020 |
| Actual Return | $1,000.00 | $1,000.10 | $0.64 | 0.13% |
| Hypothetical Return (5% return before expenses) | $1,000.00 | $1,024.36 | $0.64 | 0.13% |
| Short-Term Government Securities Fundb | ||||
| Actual Return | $1,000.00 | $1,005.70 | $3.78 | 0.75% |
| Hypothetical Return (5% return before expenses) | $1,000.00 | $1,021.24 | $3.80 | 0.75% |
| Short-Term Bond Fund | ||||
| Actual Return | $1,000.00 | $1,012.80 | $3.91 | 0.77% |
| Hypothetical Return (5% return before expenses) | $1,000.00 | $1,021.11 | $3.93 | 0.77% |
| Intermediate Bond Fundb | ||||
| Actual Return | $1,000.00 | $1,022.70 | $4.05 | 0.80% |
| Hypothetical Return (5% return before expenses) | $1,000.00 | $1,020.99 | $4.05 | 0.80% |
| Stock Index Fundc | ||||
| Actual Return | $1,000.00 | $1,211.30 | $2.77 | 0.50% |
| Hypothetical Return (5% return before expenses) | $1,000.00 | $1,022.49 | $2.53 | 0.50% |
| Value Fund | ||||
| Actual Return | $1,000.00 | $1,191.30 | $3.53 | 0.64% |
| Hypothetical Return (5% return before expenses) | $1,000.00 | $1,021.78 | $3.26 | 0.64% |
| Growth Fund | ||||
| Actual Return | $1,000.00 | $1,275.10 | $4.91 | 0.86% |
| Hypothetical Return (5% return before expenses) | $1,000.00 | $1,020.68 | $4.36 | 0.86% |
| International Equity Fundb | ||||
| Actual Return | $1,000.00 | $1,230.00 | $5.54 | 0.99% |
| Hypothetical Return (5% return before expenses) | $1,000.00 | $1,020.03 | $5.02 | 0.99% |
| Small-Company Stock Fund | ||||
| Actual Return | $1,000.00 | $1,298.20 | $6.58 | 1.14% |
| Hypothetical Return (5% return before expenses) | $1,000.00 | $1,019.27 | $5.78 | 1.14% |
| a. | The dollar amounts shown as “Expenses Paid During the Period” are equal to each Fund’s annualized expense ratio multiplied by the average account value over the period, multiplied by the number of days in the period 184, then divided by 366. |
| b. | Reflects fee waiver and/or expense reimbursements in effect during the period. |
| c. | The Stock Index Fund is a feeder fund that invests substantially all of its assets in a Master Portfolio. The example reflects the expenses of both the feeder fund and the Master Portfolio. |
| Fund | Statement of change in net assets | Financial Highlights |
| Daily Income Fund | For the years ended December 31, 2020 and 2019 | For the years ended December 31, 2020, 2019, 2018, 2017, and 2016 |
| Short-Term Government Securities Fund | ||
| Short-Term Bond Fund | ||
| Stock Index Fund | ||
| Value Fund | ||
| Growth Fund | ||
| Small-Company Stock Fund | ||
| International Equity Fund | ||
| Intermediate Bond Fund | For the period May 1, 2019 (inception) through December 31, 2019 and the year ended December 31, 2020 | For the period May 1, 2019 (inception) through December 31, 2019 and the year ended December 31, 2020 |

| U.S. Government & Agency Obligations | 82.1% of portfolio | ||||
| Interest Rate / Yield | Maturity Date | Face Amount | Value | |
| Federal Farm Credit Bank | 0.13% | 01/06/21 | $2,000,000 | $1,999,964 |
| Federal Farm Credit Bank | 0.26(a) | 11/02/21 | 8,650,000 | 8,662,173 |
| Federal Home Loan Bank | 0.08 | 02/10/17 | 4,000,000 | 3,999,600 |
| Federal Home Loan Bank | 0.09 | 02/10/17 | 6,500,000 | 6,499,422 |
| Federal Home Loan Bank | 0.08 | 01/05/21 | 5,500,000 | 5,499,948 |
| Federal Home Loan Bank | 0.11 | 01/11/21 | 1,200,000 | 1,199,965 |
| Federal Home Loan Bank | 0.10 | 02/12/21 | 994,000 | 993,884 |
| Federal Home Loan Bank | 1.38 | 02/18/21 | 3,480,000 | 3,485,730 |
| Federal Home Loan Bank | 0.08 | 03/10/21 | 7,185,000 | 7,184,796 |
| Federal Home Loan Bank | 3.63 | 03/12/21 | 425,000 | 427,882 |
| Federal Home Loan Bank | 1.75 | 03/12/21 | 525,000 | 526,660 |
| Federal Home Loan Bank | 0.10 | 04/27/21 | 915,000 | 914,705 |
| Federal Home Loan Bank | 0.10 | 05/12/21 | 895,000 | 894,674 |
| Federal Home Loan Bank | 0.10 | 05/13/21 | 900,000 | 899,670 |
| Federal Home Loan Bank | 2.25 | 06/11/21 | 750,000 | 757,161 |
| Federal National Mortgage Assoc. | 1.38 | 02/26/21 | 2,079,000 | 2,082,974 |
| Federal National Mortgage Assoc. | 2.50 | 04/13/21 | 2,100,000 | 2,114,170 |
| Private Export Funding Corp. (b) | 2.65 | 02/16/21 | 8,000,000 | 8,020,329 |
| Resolution Funding Corp. Principal Strip | 0.11 | 01/15/21 | 6,000,000 | 5,999,760 |
| Tunisia Government AID Bonds | 1.42 | 08/05/21 | 4,000,000 | 4,029,652 |
| U.S. International Development Finance Corp. | 0.13(a) | 03/15/30 | 5,000,000 | 5,000,000 |
| U.S. International Development Finance Corp. | 0.13(a) | 07/05/38 | 2,500,000 | 2,500,000 |
| U.S. Treasury Bill | 0.11 | 01/07/21 | 3,000,000 | 2,999,944 |
| U.S. Treasury Bill | 0.11 | 01/14/21 | 2,000,000 | 1,999,917 |
| U.S. Treasury Bill | 0.11 | 02/04/21 | 4,500,000 | 4,499,545 |
| U.S. Treasury Bill | 0.11 | 02/11/21 | 3,500,000 | 3,499,574 |
| U.S. Treasury Bill | 0.11 | 02/18/21 | 4,000,000 | 3,999,446 |
| U.S. Treasury Bill | 0.08 | 02/25/21 | 3,500,000 | 3,499,561 |
| U.S. Treasury Bill | 0.10 | 02/25/21 | 4,500,000 | 4,499,367 |
| U.S. Treasury Bill | 0.10 | 03/04/21 | 3,000,000 | 2,999,498 |
| U.S. Treasury Bill | 0.09 | 03/11/21 | 2,000,000 | 1,999,645 |
| U.S. Treasury Bill | 0.10 | 03/25/21 | 4,000,000 | 3,999,068 |
| U.S. Treasury Bill | 0.11 | 03/25/21 | 2,000,000 | 1,999,506 |
| U.S. Treasury Bill | 0.10 | 04/01/21 | 3,000,000 | 2,999,243 |
| U.S. Treasury Bill | 0.08 | 04/08/21 | 4,000,000 | 3,999,115 |
| U.S. Treasury Bill | 0.09 | 04/15/21 | 4,000,000 | 3,999,018 |
| U.S. Treasury Bill | 0.09 | 04/22/21 | 4,000,000 | 3,998,741 |
| U.S. Treasury Bill | 0.10 | 04/22/21 | 4,000,000 | 3,998,890 |
| U.S. Treasury Bill | 0.95 | 04/29/21 | 6,000,000 | 5,998,149 |
| U.S. Treasury Note | 2.25 | 03/31/21 | 3,000,000 | 3,015,803 |
| U.S. Treasury Note | 1.38 | 05/31/21 | 4,000,000 | 4,021,121 |
| Total U.S. Government & Agency Obligations | ||||
| (Cost $141,718,270) | 141,718,270 | |||
| Money Market Fund | 17.9% of portfolio | ||||
| Shares | ||||
| State Street Institutional U.S. Government Money Market Fund Premier Class | 0.03(c) | 30,808,207 | 30,808,207 | |
| Total Money Market Fund | ||||
| (Cost $30,808,207) | 30,808,207 | |||
| Total Investments in Securities | ||||
| (Cost $172,526,477) | 100.0% | $172,526,477 | |||
| (a) | Variable coupon rate as of December 31, 2020. |
| The accompanying notes are an integral part of these financial statements. | Portfolio of Investments |
| (b) | Security was purchased pursuant to Rule 144A under the Securities Act of 1933 and may be resold in transactions exempt from registration, normally to qualified institutional buyers. The securities have been determined to be liquid under criteria established by the Fund's Board of Directors. The total of such securities at period-end amounts to $8,020,329 and represents 4.6% of total investments. |
| (c) | 7-day yield at December 31, 2020. |
| Portfolio of Investments | The accompanying notes are an integral part of these financial statements. |
| Corporate Bonds Guaranteed by Export-Import Bank of the United States | 52.7% of portfolio | ||||
| Interest Rate / Yield | Maturity Date | Face Amount | Value | |
| Consumer Discretionary | 0.1% | ||||
| Ethiopian Leasing (2012) LLC | 2.68% | 07/30/25 | $87,829 | $91,930 |
| Total Consumer Discretionary | 91,930 | |||
| Energy | 24.4% | ||||
| Petroleos Mexicanos | 2.00 | 12/20/22 | 1,680,600 | 1,712,324 |
| Petroleos Mexicanos | 1.95 | 12/20/22 | 836,200 | 851,475 |
| Petroleos Mexicanos | 1.70 | 12/20/22 | 114,000 | 115,379 |
| Petroleos Mexicanos | 2.38 | 04/15/25 | 729,450 | 759,853 |
| Petroleos Mexicanos | 0.59(a) | 04/15/25 | 9,675,000 | 9,690,790 |
| Petroleos Mexicanos | 2.46 | 12/15/25 | 867,500 | 908,226 |
| Reliance Industries Ltd. | 2.06 | 01/15/26 | 2,836,900 | 2,937,138 |
| Reliance Industries Ltd. | 1.87 | 01/15/26 | 3,832,632 | 3,951,605 |
| Reliance Industries Ltd. | 2.44 | 01/15/26 | 1,204,211 | 1,259,609 |
| Total Energy | 22,186,399 | |||
| Financials | 28.1% | ||||
| CES MU2 LLC | 1.99 | 05/13/27 | 1,916,903 | 2,003,560 |
| Durrah MSN 35603 | 1.68 | 01/22/25 | 562,321 | 573,812 |
| Export Leasing 2009 LLC | 1.86 | 08/28/21 | 50,588 | 50,847 |
| Helios Leasing II LLC | 2.67 | 03/18/25 | 1,950,831 | 2,045,044 |
| Lulwa Ltd. | 1.89 | 02/15/25 | 1,561,971 | 1,605,104 |
| Lulwa Ltd. | 1.83 | 03/26/25 | 379,885 | 391,044 |
| Mexican Aircraft Finance IV | 2.54 | 07/13/25 | 216,674 | 226,658 |
| Mexican Aircraft Finance V | 2.33 | 01/14/27 | 281,250 | 295,423 |
| MSN 41079 and 41084 Ltd. | 1.72 | 07/13/24 | 2,818,358 | 2,879,360 |
| MSN 41079 and 41084 Ltd. | 1.63 | 12/14/24 | 706,966 | 723,133 |
| Penta Aircraft Leasing 2013 LLC | 1.69 | 04/29/25 | 784,021 | 804,057 |
| Pluto Aircraft Leasing LLC | 0.42(a) | 02/07/23 | 2,181,814 | 2,180,069 |
| Rimon LLC | 2.45 | 11/01/25 | 118,750 | 123,885 |
| Safina Ltd. | 1.55 | 01/15/22 | 255,765 | 257,195 |
| Safina Ltd. | 2.00 | 12/30/23 | 1,222,378 | 1,250,746 |
| Salmon River Export LLC | 2.19 | 09/15/26 | 849,270 | 884,592 |
| Sandalwood 2013 LLC | 2.82 | 02/12/26 | 310,460 | 329,134 |
| Santa Rosa Leasing LLC | 1.69 | 08/15/24 | 32,540 | 33,256 |
| Santa Rosa Leasing LLC | 1.47 | 11/03/24 | 354,999 | 361,155 |
| Tagua Leasing LLC | 1.90 | 07/12/24 | 1,500,800 | 1,535,232 |
| Tagua Leasing LLC | 1.73 | 09/18/24 | 2,852,691 | 2,928,414 |
| Tagua Leasing LLC | 1.58 | 11/16/24 | 187,000 | 190,810 |
| VCK Lease SA | 2.59 | 07/24/26 | 64,792 | 68,600 |
| Washington Aircraft 2 Co. DAC | 0.68(a) | 06/26/24 | 3,797,181 | 3,803,132 |
| Total Financials | 25,544,262 | |||
| Industrials | 0.1% | ||||
| Sayarra Ltd. | 2.77 | 10/29/21 | 56,490 | 57,094 |
| Total Industrials | 57,094 | |||
| Total Corporate Bonds Guaranteed by Export-Import Bank of the United States | ||||
| (Cost $47,122,627) | 47,879,685 | |||
| U.S. Government & Agency Obligations | 37.0% of portfolio | ||||
| Private Export Funding Corp. | 1.75 | 11/15/24 | 1,000,000 | 1,046,646 |
| The accompanying notes are an integral part of these financial statements. | Portfolio of Investments |
| U.S. Government & Agency Obligations | 37.0% of portfolio (Continued) | ||||
| Interest Rate /Yield | Maturity Date | Face Amount | Value | |
| U.S. Department of Housing & Urban Development | 6.07% | 08/01/21 | $20,000 | $20,092 |
| U.S. Department of Housing & Urban Development | 6.12 | 08/01/22 | 10,000 | 10,046 |
| U.S. Department of Housing & Urban Development | 5.77 | 08/01/26 | 94,000 | 94,407 |
| U.S. International Development Finance Corp. | 2.22(b) | 01/24/25 | 2,000,000 | 2,183,883 |
| U.S. International Development Finance Corp. | 1.27(b) | 06/21/25 | 1,000,000 | 1,007,885 |
| U.S. International Development Finance Corp. | 0.00(c) | 07/17/25 | 1,000,000 | 1,013,178 |
| U.S. International Development Finance Corp. | 0.00(c) | 01/17/26 | 700,000 | 764,369 |
| U.S. International Development Finance Corp. | 0.95(b) | 04/23/29 | 5,000,000 | 5,111,514 |
| U.S. International Development Finance Corp. | 1.11 | 05/15/29 | 1,000,000 | 1,017,395 |
| U.S. International Development Finance Corp. | 2.36 | 10/15/29 | 1,960,460 | 2,107,640 |
| U.S. International Development Finance Corp. | 1.05 | 10/15/29 | 1,960,460 | 1,984,954 |
| U.S. Treasury Note | 0.13 | 12/15/23 | 8,900,000 | 8,888,875 |
| U.S. Treasury Note | 0.38 | 12/31/25 | 2,000,000 | 2,001,094 |
| U.S. Treasury Note | 1.88 | 07/31/26 | 5,900,000 | 6,368,082 |
| Total U.S. Government & Agency Obligations | ||||
| (Cost $33,132,148) | 33,620,060 | |||
| Corporate Bonds–Other | 2.4% of portfolio | ||||
| Communication Services | 0.4% | ||||
| AT&T Inc. | 1.40(a) | 06/12/24 | 250,000 | 256,120 |
| Verizon Communications Inc. | 1.32(a) | 05/15/25 | 100,000 | 102,685 |
| Total Communication Services | 358,805 | |||
| Financials | 1.7% | ||||
| Athene Global Funding (d) | 2.50 | 01/14/25 | 100,000 | 104,734 |
| Bank of America Corp. | 0.81(a) | 10/24/24 | 250,000 | 251,873 |
| Citigroup Inc. | 1.32(a) | 05/17/24 | 250,000 | 253,384 |
| Goldman Sachs Group, Inc. | 0.96(a) | 02/23/23 | 250,000 | 252,328 |
| Jackson National Life Global Funding (d) | 0.68(a) | 01/06/23 | 150,000 | 150,617 |
| Owl Rock Capital Corp. | 3.40 | 07/15/26 | 250,000 | 253,394 |
| Owl Rock Technology Finance Corp. | 4.75 | 12/15/25 | 250,000 | 261,007 |
| Total Financials | 1,527,337 | |||
| Real Estate | 0.3% | ||||
| SBA Tower Trust (d) | 3.45 | 03/15/23 | 290,000 | 307,537 |
| Total Real Estate | 307,537 | |||
| Total Corporate Bonds–Other | ||||
| (Cost $2,150,950) | 2,193,679 | |||
| Asset-Backed Securities | 2.4% of portfolio | ||||
| Avid Automobile Receivables Trust 19-1 (d) | 2.62 | 02/15/24 | 105,830 | 106,804 |
| Carvana Auto Receivables Trust 20-N1A (d) | 2.01 | 03/17/25 | 250,000 | 253,942 |
| Consumer Loan Underlying Bond 19-HP1 (d) | 2.59 | 12/15/26 | 100,563 | 101,684 |
| CPS Auto Trust 20-AA (d) | 2.09 | 05/15/23 | 63,397 | 63,696 |
| CPS Auto Trust 20-AB (d) | 2.36 | 02/15/24 | 150,000 | 152,346 |
| CPS Auto Trust 20-CA (d) | 0.63 | 03/15/24 | 203,050 | 203,241 |
| Credit Acceptance Auto Loan Trust 20-3A (d) | 1.24 | 10/15/29 | 250,000 | 252,775 |
| Exeter Automobile Receivables Trust 19-4 (d) | 2.18 | 01/17/23 | 34,593 | 34,664 |
| Foursight Capital Automobile Receivables Trust 19-1 (d) | 2.67 | 03/15/24 | 300,000 | 304,694 |
| Freedom Financial 18-2 (d) | 3.99 | 10/20/25 | 9,633 | 9,653 |
| Freedom Financial 20-3 (d) | 2.40 | 09/20/27 | 126,646 | 127,110 |
| GLS Auto Receivables Trust 19-4 (d) | 2.47 | 11/15/23 | 205,196 | 207,500 |
| Marlette Funding Trust 19-3 (d) | 2.69 | 09/17/29 | 68,543 | 69,005 |
| Portfolio of Investments | The accompanying notes are an integral part of these financial statements. |
| Asset-Backed Securities | 2.4% of portfolio (Continued) | ||||
| Interest Rate /Yield | Maturity Date | Face Amount | Value | |
| SoFi Consumer Loan Program Trust 19-4 (d) | 2.45% | 08/25/28 | $38,263 | $38,662 |
| Upstart Securitization Trust 19-3 (d) | 2.68 | 01/21/30 | 230,695 | 232,742 |
| Total Asset-Backed Securities | ||||
| (Cost $2,142,718) | 2,158,518 | |||
| Municipal Bonds | 2.1% of portfolio | ||||
| California | 0.7% | ||||
| Arcadia California Pension Obligation | 1.50 | 12/01/26 | 100,000 | 100,543 |
| California Infrastructure & Economic Development Bank | 1.04 | 10/01/26 | 100,000 | 101,107 |
| Gardena California Pension Obligation | 2.07 | 04/01/26 | 200,000 | 207,172 |
| Port of Oakland California | 1.52 | 05/01/26 | 200,000 | 202,678 |
| Total California | 611,500 | |||
| Hawaii | 0.2% | ||||
| Hawaii State | 0.57 | 10/01/23 | 150,000 | 151,009 |
| Total Hawaii | 151,009 | |||
| New York | 1.0% | ||||
| New York NY | 0.83 | 08/01/24 | 500,000 | 501,295 |
| New York NY | 1.22 | 08/01/26 | 200,000 | 202,416 |
| Suffolk County New York | 0.90 | 06/15/22 | 100,000 | 100,096 |
| Suffolk County New York | 1.05 | 06/15/23 | 100,000 | 100,348 |
| Total New York | 904,155 | |||
| Texas | 0.2% | ||||
| Harris County Texas Cultural Education Facilities Finance Corp. | 1.45 | 11/15/22 | 200,000 | 200,734 |
| Total Texas | 200,734 | |||
| Total Municipal Bonds | ||||
| (Cost $1,850,000) | 1,867,398 | |||
| Money Market Fund | 3.4% of portfolio | ||||
| Shares | ||||
| State Street Institutional U.S. Government Money Market Fund Premier Class | 0.03(e) | 3,056,818 | 3,056,818 | |
| Total Money Market Fund | ||||
| (Cost $3,056,818) | 3,056,818 | |||
| Total Investments in Securities | ||||
| (Cost $89,455,261) | 100.0% | $90,776,158 | |||
| (a) | Variable coupon rate as of December 31, 2020. |
| (b) | Interest is paid at maturity. |
| (c) | Zero coupon rate, purchased at a discount. |
| (d) | Security was purchased pursuant to Rule 144A under the Securities Act of 1933 and may be resold in transactions exempt from registration, normally to qualified institutional buyers. The securities have been determined to be liquid under criteria established by the Fund's Board of Directors. The total of such securities at period-end amounts to $2,721,406 and represents 3.0% of total investments. |
| (e) | 7-day yield at December 31, 2020. |
| The accompanying notes are an integral part of these financial statements. | Portfolio of Investments |
| U.S. Government & Agency Obligations | 36.8% of portfolio | ||||
| Interest Rate / Yield | Maturity Date | Face Amount | Value | |
| Tennessee Valley Authority | 0.00%(a) | 06/15/21 | $595,000 | $594,308 |
| U.S. Department of Housing & Urban Development | 6.07 | 08/01/21 | 10,000 | 10,046 |
| U.S. Department of Housing & Urban Development | 6.12 | 08/01/22 | 10,000 | 10,046 |
| U.S. International Development Finance Corp. | 0.67(b) | 04/23/29 | 1,230,000 | 1,245,496 |
| U.S. International Development Finance Corp. | 2.36 | 10/15/29 | 828,295 | 890,478 |
| U.S. International Development Finance Corp. | 1.05 | 10/15/29 | 1,190,980 | 1,205,860 |
| U.S. Treasury Note | 0.13 | 08/31/22 | 14,215,000 | 14,215,555 |
| U.S. Treasury Note | 0.13 | 09/30/22 | 10,221,000 | 10,221,000 |
| U.S. Treasury Note | 0.13 | 10/31/22 | 640,000 | 640,075 |
| U.S. Treasury Note | 0.15(c) | 10/31/22 | 16,000,000 | 15,997,012 |
| U.S. Treasury Note | 0.25 | 11/15/23 | 130,303,000 | 130,659,298 |
| U.S. Treasury Note | 0.38 | 11/30/25 | 0 | 0 |
| U.S. Treasury Note | 0.38 | 12/31/25 | 32,775,000 | 32,792,928 |
| Total U.S. Government & Agency Obligations | ||||
| (Cost $208,192,633) | 208,482,102 | |||
| Corporate Bonds–Other | 34.2% of portfolio | ||||
| Communication Services | 3.4% | ||||
| AT&T Inc. | 1.40(c) | 06/12/24 | 4,460,000 | 4,569,181 |
| Baidu Inc. | 3.88 | 09/29/23 | 1,165,000 | 1,254,929 |
| Comcast Corp. | 3.70 | 04/15/24 | 5,200,000 | 5,720,245 |
| Verizon Communications Inc. | 1.32(c) | 05/15/25 | 5,225,000 | 5,365,295 |
| Verizon Communications Inc. | 0.85 | 11/20/25 | 1,700,000 | 1,712,965 |
| Walt Disney Co. (The) | 1.75 | 01/13/26 | 420,000 | 440,176 |
| Total Communication Services | 19,062,791 | |||
| Consumer Discretionary | 3.0% | ||||
| American Honda Finance Corp. | 0.65 | 09/08/23 | 2,000,000 | 2,012,498 |
| Booking Holdings Inc. | 2.75 | 03/15/23 | 1,075,000 | 1,127,454 |
| Booking Holdings Inc. | 4.10 | 04/13/25 | 1,252,000 | 1,419,614 |
| Expedia Group, Inc. (d) | 3.60 | 12/15/23 | 250,000 | 266,407 |
| Ford Motor Co. | 8.50 | 04/21/23 | 1,000,000 | 1,127,580 |
| Harley-Davidson Financial Services, Inc. (d) | 3.35 | 02/15/23 | 1,205,000 | 1,257,014 |
| Harley-Davidson Financial Services, Inc. (d) | 3.35 | 06/08/25 | 900,000 | 974,681 |
| Ralph Lauren Corp. | 1.70 | 06/15/22 | 1,000,000 | 1,018,162 |
| Ralph Lauren Corp. | 3.75 | 09/15/25 | 850,000 | 955,196 |
| Volkswagen Group of America, Inc. (d) | 2.70 | 09/26/22 | 2,120,000 | 2,197,822 |
| Volkswagen Group of America, Inc. (d) | 0.75 | 11/23/22 | 1,935,000 | 1,940,720 |
| Volkswagen Group of America, Inc. (d) | 0.88 | 11/22/23 | 2,500,000 | 2,513,893 |
| Total Consumer Discretionary | 16,811,041 | |||
| Consumer Staples | 0.7% | ||||
| Altria Group, Inc. | 4.40 | 02/14/26 | 2,580,000 | 2,994,846 |
| Land O'Lakes, Inc. (d) | 6.00 | 11/15/22 | 840,000 | 901,579 |
| Total Consumer Staples | 3,896,425 | |||
| Energy | 2.4% | ||||
| BP Capital Markets America Inc. | 3.19 | 04/06/25 | 3,600,000 | 3,957,911 |
| Exxon Mobil Corp. | 3.18 | 03/15/24 | 2,065,000 | 2,226,962 |
| Midwest Connector Capital Co. LLC (d) | 3.63 | 04/01/22 | 2,676,000 | 2,722,815 |
| Midwest Connector Capital Co. LLC (d) | 3.90 | 04/01/24 | 1,665,000 | 1,706,382 |
| Phillips 66 Co. | 1.30 | 02/15/26 | 1,500,000 | 1,525,173 |
| Portfolio of Investments | The accompanying notes are an integral part of these financial statements. |
| Corporate Bonds–Other | 34.2% of portfolio (Continued) | ||||
| Interest Rate /Yield | Maturity Date | Face Amount | Value | |
| Energy | 2.4% (Continued) | ||||
| Rockies Express Pipeline LLC (d) | 3.60% | 05/15/25 | $1,300,000 | $1,339,000 |
| Total Energy | 13,478,243 | |||
| Financials | 16.8% | ||||
| AIG Global Funding Inc. (d) | 0.80 | 07/07/23 | 1,300,000 | 1,312,726 |
| Ambac LSNI LLC (d) | 6.00(c) | 02/12/23 | 10,516 | 10,463 |
| American Express Co. | 0.97(c) | 08/03/23 | 862,000 | 873,136 |
| Athene Global Funding (d) | 2.80 | 05/26/23 | 925,000 | 965,652 |
| Athene Global Funding (d) | 2.50 | 01/14/25 | 4,800,000 | 5,027,244 |
| Bank of America Corp. | 0.81(c) | 10/24/24 | 3,990,000 | 4,026,986 |
| Bank of America Corp. | 0.81(c) | 10/24/24 | 1,805,000 | 1,818,527 |
| Bank of America Corp. | 4.00 | 01/22/25 | 1,210,000 | 1,359,627 |
| Bank of America Corp. | 3.95 | 04/21/25 | 2,210,000 | 2,491,197 |
| Bank of America Corp. | 2.46(c) | 10/22/25 | 2,200,000 | 2,344,852 |
| Bank of America Corp. | 2.02(c) | 02/13/26 | 2,100,000 | 2,200,468 |
| Bank of America Corp. | 1.32(c) | 06/19/26 | 2,100,000 | 2,144,348 |
| Bank of America Corp. | 1.20(c) | 10/24/26 | 920,000 | 932,040 |
| Capital One Bank (USA), NA | 2.01(c) | 01/27/23 | 875,000 | 889,999 |
| Capital One Financial Corp. | 3.90 | 01/29/24 | 1,440,000 | 1,577,126 |
| Capital Southwest Corp. | 4.50 | 01/31/26 | 4,000,000 | 4,010,000 |
| CIT Group Inc. | 3.93(c) | 06/19/24 | 1,440,000 | 1,522,800 |
| Citigroup Inc. | 1.68(c) | 05/15/24 | 715,000 | 736,484 |
| Citigroup Inc. | 1.32(c) | 05/17/24 | 5,337,000 | 5,409,241 |
| Citigroup Inc. | 3.11(c) | 04/08/26 | 5,800,000 | 6,335,633 |
| Fidus Investment Corp. | 4.75 | 01/31/26 | 2,000,000 | 2,040,682 |
| Goldman Sachs BDC, Inc. | 2.88 | 01/15/26 | 600,000 | 612,702 |
| Goldman Sachs Group, Inc. | 0.96(c) | 02/23/23 | 3,685,000 | 3,719,319 |
| Goldman Sachs Group, Inc. | 0.63(c) | 11/17/23 | 1,935,000 | 1,942,756 |
| Goldman Sachs Group, Inc. | 3.63 | 02/20/24 | 2,065,000 | 2,247,057 |
| J.P. Morgan Chase & Co. | 0.65(c) | 09/16/24 | 900,000 | 904,702 |
| J.P. Morgan Chase & Co. | 4.02(c) | 12/05/24 | 1,225,000 | 1,349,395 |
| J.P. Morgan Chase & Co. | 2.30(c) | 10/15/25 | 2,130,000 | 2,260,654 |
| J.P. Morgan Chase & Co. | 2.08(c) | 04/22/26 | 2,055,000 | 2,169,909 |
| Jackson National Life Global Funding (d) | 0.68(c) | 01/06/23 | 3,400,000 | 3,413,981 |
| Main Street Capital Corp. | 5.20 | 05/01/24 | 3,635,000 | 3,941,809 |
| Metropolitan Life Global Funding (d) | 3.60 | 01/11/24 | 450,000 | 489,922 |
| Morgan Stanley | 0.79(c) | 01/20/23 | 372,000 | 373,194 |
| Morgan Stanley | 0.56(c) | 11/10/23 | 2,025,000 | 2,029,617 |
| Morgan Stanley | 3.74(c) | 04/24/24 | 1,020,000 | 1,097,443 |
| Morgan Stanley | 2.19(c) | 04/28/26 | 425,000 | 448,813 |
| Oaktree Specialty Lending Corp. | 3.50 | 02/25/25 | 1,277,000 | 1,322,078 |
| Owl Rock Technology Finance Corp. | 4.75 | 12/15/25 | 5,180,000 | 5,408,059 |
| PACCAR Financial Corp. | 0.80 | 06/08/23 | 1,000,000 | 1,010,646 |
| PNC Bank NA | 0.67(c) | 07/22/22 | 850,000 | 851,697 |
| Principal Life Global Funding II (d) | 0.50 | 01/08/24 | 1,000,000 | 1,002,023 |
| Protective Life Global Funding (d) | 2.62 | 08/22/22 | 1,695,000 | 1,756,235 |
| Protective Life Global Funding (d) | 1.08 | 06/09/23 | 845,000 | 859,575 |
| Protective Life Global Funding (d) | 1.17 | 07/15/25 | 850,000 | 864,062 |
| Wells Fargo & Co. | 1.65(c) | 06/02/24 | 4,250,000 | 4,365,972 |
| Wells Fargo & Co. | 2.16(c) | 02/11/26 | 840,000 | 883,127 |
| Wells Fargo & Co. | 2.19(c) | 04/30/26 | 2,120,000 | 2,231,677 |
| Total Financials | 95,585,655 | |||
| The accompanying notes are an integral part of these financial statements. | Portfolio of Investments |
| Corporate Bonds–Other | 34.2% of portfolio (Continued) | ||||
| Interest Rate /Yield | Maturity Date | Face Amount | Value | |
| Health Care | 2.3% | ||||
| Anthem, Inc. | 2.38% | 01/15/25 | $2,130,000 | $2,277,699 |
| Bristol-Myers Squibb Co. | 0.75 | 11/13/25 | 2,000,000 | 2,013,224 |
| Cigna Corp. | 1.13(c) | 07/15/23 | 1,830,000 | 1,850,706 |
| Gilead Sciences, Inc. | 0.75 | 09/29/23 | 1,235,000 | 1,238,651 |
| Health Care Service Corp. (d) | 1.50 | 06/01/25 | 1,800,000 | 1,847,160 |
| Merck & Co., Inc. | 0.75 | 02/24/26 | 1,165,000 | 1,177,858 |
| Stryker Corp. | 1.15 | 06/15/25 | 1,500,000 | 1,530,188 |
| Sutter Health | 1.32 | 08/15/25 | 915,000 | 930,225 |
| Total Health Care | 12,865,711 | |||
| Industrials | 1.5% | ||||
| American Airlines Group Inc. | 3.60 | 03/22/29 | 2,360,575 | 2,323,507 |
| Burlington Northern & Santa Fe Railway Co. | 4.58 | 01/15/21 | 28,173 | 28,209 |
| Burlington Northern & Santa Fe Railway Co. | 4.83 | 01/15/23 | 20,013 | 20,249 |
| Caterpillar Financial Services Corp. | 2.15 | 11/08/24 | 940,000 | 1,001,162 |
| Caterpillar Financial Services Corp. | 0.80 | 11/13/25 | 2,010,000 | 2,025,592 |
| Delta Air Lines, Inc. (d) | 7.00 | 05/01/25 | 965,000 | 1,113,939 |
| Delta Air Lines, Inc. | 7.38 | 01/15/26 | 730,000 | 833,712 |
| Waste Management, Inc | 0.75 | 11/15/25 | 1,200,000 | 1,204,937 |
| Total Industrials | 8,551,307 | |||
| Information Technology | 0.2% | ||||
| PayPal Holdings, Inc. | 1.65 | 06/01/25 | 1,265,000 | 1,321,382 |
| Total Information Technology | 1,321,382 | |||
| Materials | 0.5% | ||||
| E. I. Du Pont De Nemours and Co. | 1.70 | 07/15/25 | 500,000 | 520,946 |
| Georgia-Pacific LLC (d) | 0.95 | 05/15/26 | 1,450,000 | 1,456,784 |
| Nucor Corp. | 2.00 | 06/01/25 | 1,000,000 | 1,058,808 |
| Total Materials | 3,036,538 | |||
| Real Estate | 1.5% | ||||
| Federal Realty Investment Trust | 1.25 | 02/15/26 | 1,231,000 | 1,253,301 |
| SBA Tower Trust (d) | 3.45 | 03/15/23 | 2,420,000 | 2,566,337 |
| SBA Tower Trust (d) | 2.84 | 01/15/25 | 3,450,000 | 3,673,157 |
| Service Properties Trust | 7.50 | 09/15/25 | 930,000 | 1,071,459 |
| Total Real Estate | 8,564,254 | |||
| Utilities | 1.9% | ||||
| Entergy Louisiana, LLC | 0.62 | 11/17/23 | 2,350,000 | 2,357,754 |
| NextEra Energy Capital Holdings, Inc. | 2.75 | 05/01/25 | 500,000 | 540,809 |
| PPL Electric Utilities Corp. | 0.50(c) | 09/28/23 | 1,000,000 | 1,000,906 |
| San Diego Gas & Electric Co. | 1.91 | 02/01/22 | 1,065,460 | 1,071,099 |
| Southern California Edison Co. | 0.50(c) | 12/03/21 | 1,800,000 | 1,800,763 |
| Southern California Edison Co. | 1.85 | 02/01/22 | 1,755,000 | 1,758,763 |
| Southern California Edison Co. | 1.20 | 02/01/26 | 2,065,000 | 2,089,117 |
| Total Utilities | 10,619,211 | |||
| Total Corporate Bonds–Other | ||||
| (Cost $188,189,682) | 193,792,558 | |||
| Portfolio of Investments | The accompanying notes are an integral part of these financial statements. |
| Asset-Backed Securities | 10.6% of portfolio | ||||
| Interest Rate /Yield | Maturity Date | Face Amount | Value | |
| American Credit Acceptance Receivables Trust 19-1 (d) | 3.50% | 04/14/25 | $900,000 | $914,276 |
| American Credit Acceptance Receivables Trust 20-1 (d) | 1.89 | 04/13/23 | 482,833 | 484,620 |
| American Credit Acceptance Receivables Trust 20-3A (d) | 0.62 | 10/13/23 | 907,559 | 908,612 |
| American Credit Acceptance Receivables Trust 20-3B (d) | 1.15 | 08/13/24 | 850,000 | 854,344 |
| Avant Loans Funding Trust 19-B (d) | 2.72 | 10/15/26 | 354,685 | 355,973 |
| Avid Automobile Receivables Trust 19-1 (d) | 2.62 | 02/15/24 | 742,930 | 749,767 |
| Carvana Auto Receivables Trust 20-N1A (d) | 2.01 | 03/17/25 | 1,560,000 | 1,584,598 |
| Consumer Loan Underlying Bond 18-P2 (d) | 3.47 | 10/15/25 | 10,247 | 10,254 |
| Consumer Loan Underlying Bond 18-P3 (d) | 3.82 | 01/15/26 | 108,341 | 108,758 |
| Consumer Loan Underlying Bond 19-HP1 (d) | 2.59 | 12/15/26 | 1,493,353 | 1,510,003 |
| Consumer Loan Underlying Bond 19-P1 (d) | 2.94 | 07/15/26 | 224,712 | 226,084 |
| Consumer Loan Underlying Bond 20-P1 (d) | 2.26 | 03/15/28 | 611,801 | 616,261 |
| CoreVest American Finance 20-4 (d) | 1.17 | 12/15/52 | 920,000 | 923,224 |
| CPS Auto Trust 20-AA (d) | 2.09 | 05/15/23 | 507,174 | 509,567 |
| CPS Auto Trust 20-AB (d) | 2.36 | 02/15/24 | 1,200,000 | 1,218,768 |
| CPS Auto Trust 20-CA (d) | 0.63 | 03/15/24 | 843,065 | 843,858 |
| Credit Acceptance Auto Loan Trust 18-1A (d) | 3.01 | 02/16/27 | 91,708 | 91,785 |
| Credit Acceptance Auto Loan Trust 18-2A (d) | 3.47 | 05/17/27 | 1,408,864 | 1,417,072 |
| Credit Acceptance Auto Loan Trust 18-3A (d) | 3.55 | 08/15/27 | 622,620 | 629,267 |
| Credit Acceptance Auto Loan Trust 18-3B (d) | 3.89 | 10/15/27 | 1,045,000 | 1,067,979 |
| Credit Acceptance Auto Loan Trust 19-1A (d) | 3.33 | 02/15/28 | 2,880,000 | 2,933,407 |
| Credit Acceptance Auto Loan Trust 19-1B (d) | 3.75 | 04/17/28 | 4,475,000 | 4,656,220 |
| Credit Acceptance Auto Loan Trust 19-1C (d) | 3.94 | 06/15/28 | 785,000 | 820,560 |
| Credit Acceptance Auto Loan Trust 20-1A (d) | 2.01 | 02/15/29 | 1,725,000 | 1,763,594 |
| Credit Acceptance Auto Loan Trust 20-2A (d) | 1.37 | 07/16/29 | 870,000 | 881,719 |
| Credit Acceptance Auto Loan Trust 20-3A (d) | 1.24 | 10/15/29 | 2,500,000 | 2,527,753 |
| DT Auto Owner Trust 18-2D (d) | 4.15 | 03/15/24 | 345,000 | 353,961 |
| DT Auto Owner Trust 19-1C (d) | 3.61 | 11/15/24 | 364,000 | 370,846 |
| DT Auto Owner Trust 20-3A (d) | 0.54 | 04/15/24 | 1,310,248 | 1,312,611 |
| Entergy New Orleans Storm Recovery Fund 15-1 | 2.67 | 06/01/27 | 434,015 | 442,436 |
| Exeter Automobile Receivables Trust 18-3 (d) | 3.71 | 06/15/23 | 1,182,718 | 1,193,519 |
| Exeter Automobile Receivables Trust 19-4 (d) | 2.18 | 01/17/23 | 164,892 | 165,233 |
| Exeter Automobile Receivables Trust 20-3 | 0.46 | 10/17/22 | 1,235,000 | 1,235,361 |
| Foursight Capital Automobile Receivables Trust 19-1 (d) | 2.67 | 03/15/24 | 4,140,000 | 4,204,769 |
| Freedom Financial 18-2 (d) | 3.99 | 10/20/25 | 50,091 | 50,196 |
| Freedom Financial 20-1 (d) | 2.52 | 03/18/27 | 800,361 | 805,941 |
| Freedom Financial 20-3 (d) | 2.40 | 09/20/27 | 493,921 | 495,729 |
| GLS Auto Receivables Trust 18-1 (d) | 2.82 | 07/15/22 | 64,164 | 64,232 |
| GLS Auto Receivables Trust 19-1 (d) | 3.37 | 01/17/23 | 121,633 | 122,059 |
| GLS Auto Receivables Trust 19-2 (d) | 3.06 | 04/17/23 | 315,903 | 317,981 |
| GLS Auto Receivables Trust 19-4 (d) | 2.47 | 11/15/23 | 867,978 | 877,726 |
| GLS Auto Receivables Trust 20-2 (d) | 1.58 | 08/15/24 | 2,094,530 | 2,113,261 |
| GLS Auto Receivables Trust 20-3 (d) | 0.69 | 10/16/23 | 784,509 | 785,487 |
| GLS Auto Receivables Trust 20-4 (d) | 0.52 | 02/15/24 | 2,700,000 | 2,700,889 |
| Gracie Point International Fund 20-B (d) | 1.53(c) | 05/02/23 | 750,000 | 749,968 |
| Longtrain Leasing III LLC 2015-1 (d) | 2.98 | 01/15/45 | 329,834 | 337,504 |
| Marlette Funding Trust 18-4 (d) | 3.71 | 12/15/28 | 183,108 | 183,833 |
| Marlette Funding Trust 19-1 (d) | 3.44 | 04/16/29 | 293,779 | 296,119 |
| Marlette Funding Trust 19-3 (d) | 2.69 | 09/17/29 | 1,252,965 | 1,261,413 |
| Marlette Funding Trust 20-2 (d) | 1.02 | 09/16/30 | 453,373 | 454,134 |
| NP SPE II LLC 17-1 (d) | 3.37 | 10/21/47 | 383,909 | 397,034 |
| Oscar US Funding Trust 19-1 (d) | 3.10 | 04/11/22 | 134,570 | 134,917 |
| Prosper Marketplace Issuance Trust 19-3 (d) | 3.19 | 07/15/25 | 167,785 | 168,353 |
| SoFi Consumer Loan Program Trust 17-3 (d) | 2.77 | 05/25/26 | 56,055 | 56,219 |
| SoFi Consumer Loan Program Trust 17-4 (d) | 2.50 | 05/26/26 | 65,131 | 65,374 |
| SoFi Consumer Loan Program Trust 18-3 (d) | 4.02 | 08/25/27 | 1,000,000 | 1,027,437 |
| SoFi Consumer Loan Program Trust 18-4 (d) | 3.54 | 11/26/27 | 142,539 | 143,072 |
| The accompanying notes are an integral part of these financial statements. | Portfolio of Investments |
| Asset-Backed Securities | 10.6% of portfolio (Continued) | ||||
| Interest Rate /Yield | Maturity Date | Face Amount | Value | |
| SoFi Consumer Loan Program Trust 19-2 (d) | 3.01% | 04/25/28 | $256,772 | $259,357 |
| SoFi Consumer Loan Program Trust 19-4 (d) | 2.45 | 08/25/28 | 516,555 | 521,930 |
| United Auto Credit Securitization Trust 20-1 (d) | 1.47 | 11/10/22 | 1,120,000 | 1,125,995 |
| Upstart Securitization Trust 19-3 (d) | 2.68 | 01/21/30 | 1,817,879 | 1,834,005 |
| Westlake Automobile Receivable Trust 19-2A (d) | 2.84 | 07/15/24 | 1,025,000 | 1,045,948 |
| Westlake Automobile Receivable Trust 20-3A (d) | 0.56 | 05/15/24 | 2,715,000 | 2,720,937 |
| World Financial Network Credit Card Master Note Trust 18-B | 3.46 | 07/15/25 | 1,200,000 | 1,226,255 |
| Total Asset-Backed Securities | ||||
| (Cost $59,883,084) | 60,230,364 | |||
| Yankee Bonds | 10.0% of portfolio | ||||
| AerCap Ireland Capital DAC | 6.50 | 07/15/25 | 1,000,000 | 1,195,222 |
| Aircastle Ltd. (d) | 5.25 | 08/11/25 | 1,243,000 | 1,368,712 |
| América Móvil, SAB de CV | 3.13 | 07/16/22 | 1,085,000 | 1,125,384 |
| Avolon Holdings Funding Ltd. (d) | 3.63 | 05/01/22 | 950,000 | 970,541 |
| Avolon Holdings Funding Ltd. (d) | 3.95 | 07/01/24 | 530,000 | 559,687 |
| Avolon Holdings Funding Ltd. (d) | 5.50 | 01/15/26 | 1,850,000 | 2,095,444 |
| Baidu Inc. | 3.08 | 04/07/25 | 1,050,000 | 1,121,001 |
| Banco Bilbao Vizcaya Argentaria SA | 0.88 | 09/18/23 | 800,000 | 805,555 |
| Banco Bilbao Vizcaya Argentaria SA | 1.13 | 09/18/25 | 800,000 | 805,602 |
| Banco Santander SA | 2.75 | 05/28/25 | 1,200,000 | 1,280,773 |
| Bank of Montreal | 4.34(c) | 10/05/28 | 1,300,000 | 1,422,532 |
| Barclays PLC | 1.60(c) | 05/16/24 | 1,250,000 | 1,266,850 |
| Barclays PLC | 1.01(c) | 12/10/24 | 4,205,000 | 4,233,122 |
| Barclays PLC | 2.85(c) | 05/07/26 | 1,250,000 | 1,342,160 |
| BMW Finance NV (d) | 2.40 | 08/14/24 | 2,500,000 | 2,649,431 |
| Delta and SkyMiles IP Ltd. (d) | 4.50 | 10/20/25 | 780,000 | 833,582 |
| Enel Finance International NV (d) | 2.75 | 04/06/23 | 1,345,000 | 1,407,217 |
| Enel Finance International NV (d) | 2.65 | 09/10/24 | 1,275,000 | 1,357,914 |
| ING Groep NV | 3.55 | 04/09/24 | 720,000 | 786,532 |
| Lloyds Banking Group PLC | 2.86(c) | 03/17/23 | 1,400,000 | 1,438,718 |
| Lloyds Banking Group PLC | 2.91(c) | 11/07/23 | 1,400,000 | 1,462,721 |
| Mitsubishi UFJ Financial Group, Inc. | 1.07(c) | 07/26/23 | 1,765,000 | 1,784,151 |
| Mitsubishi UFJ Financial Group, Inc. | 1.41 | 07/17/25 | 710,000 | 729,253 |
| Nationwide Building Society (d) | 3.62(c) | 04/26/23 | 1,980,000 | 2,056,606 |
| NatWest Group PLC | 2.36(c) | 05/22/24 | 845,000 | 879,202 |
| NatWest Group PLC | 4.52(c) | 06/25/24 | 1,325,000 | 1,446,558 |
| NatWest Group PLC | 4.27(c) | 03/22/25 | 1,330,000 | 1,471,148 |
| Nissan Motor Co., Ltd. (d) | 3.52 | 09/17/25 | 1,460,000 | 1,565,199 |
| Reckitt Benckiser Treasury Services PLC (d) | 2.75 | 06/26/24 | 1,100,000 | 1,176,231 |
| Saudi Arabian Oil Co. (d) | 1.25 | 11/24/23 | 800,000 | 810,235 |
| Saudi Arabian Oil Co. (d) | 1.63 | 11/24/25 | 500,000 | 512,249 |
| Schlumberger Finance Canada Ltd. | 1.40 | 09/17/25 | 1,000,000 | 1,028,120 |
| Shell International Finance BV | 2.00 | 11/07/24 | 1,650,000 | 1,738,213 |
| Sinopec Group Overseas Development (2012) Ltd. (d) | 3.90 | 05/17/22 | 2,100,000 | 2,180,347 |
| Standard Chartered PLC (d) | 2.74(c) | 09/10/22 | 1,700,000 | 1,724,125 |
| Sumitomo Mitsui Trust Bank, Ltd. (d) | 0.80 | 09/12/23 | 1,900,000 | 1,917,022 |
| Syngenta Finance NV (d) | 4.44 | 04/24/23 | 400,000 | 419,749 |
| Tencent Holdings Ltd. (d) | 3.28 | 04/11/24 | 1,840,000 | 1,959,412 |
| Tencent Holdings Ltd. (d) | 1.81 | 01/26/26 | 1,000,000 | 1,022,018 |
| Tencent Music Entertainment Group | 1.38 | 09/03/25 | 3,035,000 | 3,038,912 |
| Total Yankee Bonds | ||||
| (Cost $54,566,595) | 56,987,450 | |||
| Portfolio of Investments | The accompanying notes are an integral part of these financial statements. |
| Municipal Bonds | 3.4% of portfolio | ||||
| Interest Rate /Yield | Maturity Date | Face Amount | Value | |
| Alabama | 0.1% | ||||
| Alabama Public School & College Authority | 0.92% | 06/01/25 | $710,000 | $718,378 |
| Total Alabama | 718,378 | |||
| Arizona | 0.2% | ||||
| Pinal County Arizona Revenue Obligation | 0.80 | 08/01/23 | 410,000 | 411,447 |
| Pinal County Arizona Revenue Obligation | 1.20 | 08/01/25 | 690,000 | 695,589 |
| Total Arizona | 1,107,036 | |||
| California | 0.4% | ||||
| Arcadia California Pension Obligation | 1.50 | 12/01/26 | 780,000 | 784,235 |
| California Infrastructure & Economic Development Bank | 1.04 | 10/01/26 | 460,000 | 465,092 |
| Gardena California Pension Obligation | 2.07 | 04/01/26 | 560,000 | 580,082 |
| Port of Oakland California | 1.52 | 05/01/26 | 325,000 | 329,352 |
| San Francisco California Community College District | 1.33 | 06/15/26 | 300,000 | 303,888 |
| Total California | 2,462,649 | |||
| Colorado | 0.1% | ||||
| Denver City & County Colorado Airport Revenue | 0.88 | 11/15/23 | 575,000 | 576,892 |
| Total Colorado | 576,892 | |||
| Florida | 0.1% | ||||
| Sarasota County Florida Utility System Revenue | 0.46 | 10/01/23 | 200,000 | 200,756 |
| Sarasota County Florida Utility System Revenue | 1.11 | 10/01/26 | 400,000 | 403,296 |
| Total Florida | 604,052 | |||
| Hawaii | 0.4% | ||||
| Hawaii State | 0.57 | 10/01/23 | 1,445,000 | 1,454,725 |
| Hawaii State | 0.80 | 10/01/24 | 1,015,000 | 1,028,520 |
| Total Hawaii | 2,483,245 | |||
| Maine | 0.1% | ||||
| Maine State Housing Authority | 1.70 | 11/15/26 | 245,000 | 250,826 |
| Total Maine | 250,826 | |||
| Massachusetts | 0.1% | ||||
| Massachusetts State | 0.99 | 11/01/26 | 405,000 | 416,761 |
| Total Massachusetts | 416,761 | |||
| New Jersey | 0.6% | ||||
| New Jersey Economic Development Authority | 7.63(b) | 02/15/22 | 950,000 | 944,262 |
| New Jersey Housing and Morgage Finance Agency | 1.34 | 04/01/24 | 750,000 | 755,415 |
| New Jersey Housing and Morgage Finance Agency | 1.49 | 04/01/25 | 640,000 | 644,992 |
| New Jersey Housing and Morgage Finance Agency | 1.54 | 10/01/25 | 1,110,000 | 1,114,962 |
| Total New Jersey | 3,459,631 | |||
| New York | 1.2% | ||||
| New York NY | 0.83 | 08/01/24 | 2,650,000 | 2,656,863 |
| The accompanying notes are an integral part of these financial statements. | Portfolio of Investments |
| Municipal Bonds | 3.4% of portfolio (Continued) | ||||
| Interest Rate /Yield | Maturity Date | Face Amount | Value | |
| New York | 1.2% (Continued) | ||||
| New York NY | 1.22% | 08/01/26 | $1,065,000 | $1,077,865 |
| Suffolk County New York | 0.90 | 06/15/22 | 370,000 | 370,355 |
| Suffolk County New York | 1.05 | 06/15/23 | 350,000 | 351,218 |
| Suffolk County New York | 1.41 | 06/15/24 | 810,000 | 815,954 |
| Suffolk County New York | 1.61 | 06/15/25 | 1,350,000 | 1,362,960 |
| Total New York | 6,635,215 | |||
| Texas | 0.1% | ||||
| Harris County Texas Cultural Education Facilities Finance Corp. | 1.45 | 11/15/22 | 400,000 | 401,468 |
| Harris County Texas Cultural Education Facilities Finance Corp. | 1.84 | 11/15/24 | 205,000 | 208,124 |
| Total Texas | 609,592 | |||
| Total Municipal Bonds | ||||
| (Cost $19,195,105) | 19,324,277 | |||
| Corporate Bonds Guaranteed by Export-Import Bank of the United States | 3.0% of portfolio | ||||
| Energy | 2.2% | ||||
| Petroleos Mexicanos | 0.59(c) | 04/15/25 | 10,552,500 | 10,569,722 |
| Petroleos Mexicanos | 2.46 | 12/15/25 | 219,500 | 229,804 |
| Reliance Industries Ltd. | 1.87 | 01/15/26 | 1,743,211 | 1,797,324 |
| Total Energy | 12,596,850 | |||
| Financials | 0.8% | ||||
| MSN 41079 and 41084 Ltd. | 1.72 | 07/13/24 | 796,734 | 813,979 |
| MSN 41079 and 41084 Ltd. | 1.63 | 12/14/24 | 934,256 | 955,620 |
| Pluto Aircraft Leasing LLC | 0.42(c) | 02/07/23 | 254,727 | 254,523 |
| Santa Rosa Leasing LLC | 1.69 | 08/15/24 | 866,541 | 885,600 |
| Washington Aircraft 2 Co. DAC | 0.68(c) | 06/26/24 | 1,235,559 | 1,237,496 |
| Total Financials | 4,147,218 | |||
| Total Corporate Bonds Guaranteed by Export-Import Bank of the United States | ||||
| (Cost $16,635,971) | 16,744,068 | |||
| Mortgage-Backed Securities | less than 0.1% of portfolio | ||||
| FHLMC 780754 | 2.63(c) | 08/01/33 | 957 | 979 |
| FNMA 813842 | 2.11(c) | 01/01/35 | 3,000 | 3,087 |
| Salomon Brothers Mortgage Securities 97-LB6 | 6.82 | 12/25/27 | 2 | 2 |
| Total Mortgage-Backed Securities | ||||
| (Cost $3,959) | 4,068 | |||
| Money Market Fund | 2.0% of portfolio | ||||
| Shares | ||||
| State Street Institutional U.S. Government Money Market Fund Premier Class | 0.03(e) | 11,322,370 | 11,322,370 | |
| Total Money Market Fund | ||||
| (Cost $11,322,370) | 11,322,370 | |||
| Total Investments in Securities | ||||
| (Cost $557,989,399) | 100.0% | $566,887,257 | |||
| Portfolio of Investments | The accompanying notes are an integral part of these financial statements. |
| (a) | Zero coupon rate, purchased at a discount. |
| (b) | Interest is paid at maturity. |
| (c) | Variable coupon rate as of December 31, 2020. |
| (d) | Security was purchased pursuant to Rule 144A under the Securities Act of 1933 and may be resold in transactions exempt from registration, normally to qualified institutional buyers. The securities have been determined to be liquid under criteria established by the Fund's Board of Directors. The total of such securities at period-end amounts to $126,091,606 and represents 22.2% of total investments. |
| (e) | 7-day yield at December 31, 2020. |
| The accompanying notes are an integral part of these financial statements. | Portfolio of Investments |
| Corporate Bonds–Other | 39.1% of portfolio | ||||
| Interest Rate / Yield | Maturity Date | Face Amount | Value | |
| Communication Services | 3.3% | ||||
| Alphabet Inc. | 1.10% | 08/15/30 | $40,000 | $39,407 |
| Alphabet Inc. | 1.90 | 08/15/40 | 50,000 | 48,995 |
| Alphabet Inc. | 2.05 | 08/15/50 | 82,000 | 78,097 |
| Alphabet Inc. | 2.25 | 08/15/60 | 120,000 | 115,744 |
| AT&T Inc. | 1.40(a) | 06/12/24 | 345,000 | 353,447 |
| AT&T Inc. | 2.25 | 02/01/32 | 145,000 | 147,007 |
| AT&T Inc. | 3.50 | 06/01/41 | 40,000 | 43,063 |
| AT&T Inc. | 3.65 | 06/01/51 | 255,000 | 266,530 |
| Charter Communications Operating LLC | 4.20 | 03/15/28 | 170,000 | 196,079 |
| Charter Communications Operating LLC | 3.70 | 04/01/51 | 50,000 | 51,831 |
| Comcast Corp. | 0.87(a) | 04/15/24 | 26,000 | 26,311 |
| Comcast Corp. | 3.95 | 10/15/25 | 85,000 | 97,635 |
| Comcast Corp. | 3.30 | 04/01/27 | 110,000 | 125,103 |
| Comcast Corp. | 1.95 | 01/15/31 | 65,000 | 66,840 |
| Comcast Corp. | 2.45 | 08/15/52 | 125,000 | 121,502 |
| Comcast Corp. | 2.65 | 08/15/62 | 125,000 | 124,834 |
| Sprint Communications, Inc. | 6.00 | 11/15/22 | 104,000 | 112,580 |
| Sprint Spectrum Co. LLC (b) | 4.74 | 03/20/25 | 450,000 | 487,390 |
| T-Mobile US, Inc. (b) | 3.00 | 02/15/41 | 200,000 | 207,344 |
| Verizon Communications Inc. | 0.85 | 11/20/25 | 150,000 | 151,144 |
| Verizon Communications Inc. | 2.65 | 11/20/40 | 100,000 | 100,986 |
| Walt Disney Co. (The) | 3.50 | 05/13/40 | 65,000 | 76,301 |
| Total Communication Services | 3,038,170 | |||
| Consumer Discretionary | 5.1% | ||||
| Amazon.com, Inc. | 2.70 | 06/03/60 | 160,000 | 170,686 |
| American Airlines Pass Through Trust 2017-1 | 3.65 | 02/15/29 | 136,744 | 137,819 |
| Block Financial Corp. | 3.88 | 08/15/30 | 95,000 | 102,573 |
| Booking Holdings Inc. | 4.10 | 04/13/25 | 150,000 | 170,082 |
| Booking Holdings Inc. | 4.50 | 04/13/27 | 55,000 | 65,560 |
| Expedia Group, Inc. (b) | 4.63 | 08/01/27 | 330,000 | 368,470 |
| Ford Motor Co. | 8.50 | 04/21/23 | 245,000 | 276,257 |
| Ford Motor Co. | 3.37 | 11/17/23 | 200,000 | 203,958 |
| Ford Motor Co. | 9.00 | 04/22/25 | 65,000 | 79,875 |
| Ford Motor Co. | 3.38 | 11/13/25 | 200,000 | 204,812 |
| General Motors Financial Co., Inc. | 1.55(a) | 06/30/22 | 60,000 | 60,401 |
| General Motors Financial Co., Inc. | 1.22(a) | 01/05/23 | 45,000 | 44,957 |
| General Motors Financial Co., Inc. | 5.20 | 03/20/23 | 325,000 | 356,339 |
| General Motors Financial Co., Inc. | 2.75 | 06/20/25 | 45,000 | 48,109 |
| Harley-Davidson Financial Services, Inc. (b) | 3.35 | 02/15/23 | 165,000 | 172,122 |
| Lowe's Companies, Inc. | 1.30 | 04/15/28 | 135,000 | 136,129 |
| Lowe's Companies, Inc. | 1.70 | 10/15/30 | 180,000 | 181,616 |
| Lowe's Companies, Inc. | 3.00 | 10/15/50 | 170,000 | 181,221 |
| Marriott International, Inc. | 4.63 | 06/15/30 | 190,000 | 222,848 |
| Masco Corp. | 2.00 | 10/01/30 | 85,000 | 86,491 |
| McDonald's Corp. | 3.50 | 07/01/27 | 60,000 | 68,801 |
| McDonald's Corp. | 4.20 | 04/01/50 | 35,000 | 44,916 |
| Pomona College | 2.89 | 01/01/51 | 100,000 | 107,314 |
| Ralph Lauren Corp. | 3.75 | 09/15/25 | 155,000 | 174,183 |
| Rockefeller Foundation (The) | 2.49 | 10/01/50 | 208,000 | 216,220 |
| Southwest Airlines Co. | 5.13 | 06/15/27 | 165,000 | 196,212 |
| Target Corp. | 2.65 | 09/15/30 | 60,000 | 67,368 |
| Tractor Supply Co. | 1.75 | 11/01/30 | 100,000 | 100,449 |
| Volkswagen Group of America (b) | 4.25 | 11/13/23 | 200,000 | 219,948 |
| Portfolio of Investments | The accompanying notes are an integral part of these financial statements. |
| Corporate Bonds–Other | 39.1% of portfolio (Continued) | ||||
| Interest Rate / Yield | Maturity Date | Face Amount | Value | |
| Consumer Discretionary | 5.1% (Continued) | ||||
| W.K. Kellogg Foundation Trust (b) | 2.44% | 10/01/50 | $250,000 | $254,794 |
| Total Consumer Discretionary | 4,720,530 | |||
| Consumer Staples | 1.0% | ||||
| General Mills, Inc. | 1.23(a) | 10/17/23 | 210,000 | 213,420 |
| Kellogg Co. | 2.10 | 06/01/30 | 100,000 | 104,984 |
| Keurig Dr Pepper Inc. | 3.43 | 06/15/27 | 399,000 | 455,497 |
| Molson Coors Brewing Co. | 3.00 | 07/15/26 | 92,000 | 100,272 |
| Molson Coors Brewing Co. | 5.00 | 05/01/42 | 50,000 | 62,489 |
| Total Consumer Staples | 936,662 | |||
| Energy | 3.8% | ||||
| BP Capital Markets America Inc. | 1.75 | 08/10/30 | 210,000 | 210,682 |
| BP Capital Markets America Inc. | 2.77 | 11/10/50 | 125,000 | 123,432 |
| BP Capital Markets America Inc. | 3.19 | 04/06/25 | 385,000 | 423,277 |
| Cheniere Corpus Christi Holdings LLC | 5.13 | 06/30/27 | 180,000 | 212,862 |
| Cheniere Corpus Christi Holdings LLC | 3.70 | 11/15/29 | 39,000 | 43,396 |
| Energy Transfer Operating LP | 3.75 | 05/15/30 | 318,000 | 342,835 |
| Energy Transfer Operating LP | 5.00 | 05/15/50 | 90,000 | 97,311 |
| EOG Resources, Inc. | 4.38 | 04/15/30 | 85,000 | 103,253 |
| EOG Resources, Inc. | 4.95 | 04/15/50 | 60,000 | 81,190 |
| EQM Midstream Partners, LP | 4.75 | 07/15/23 | 188,000 | 197,678 |
| EQM Midstream Partners, LP | 5.50 | 07/15/28 | 68,000 | 74,314 |
| Gray Oak Pipeline, LLC (b) | 2.00 | 09/15/23 | 70,000 | 71,084 |
| HollyFrontier Corp. | 2.63 | 10/01/23 | 60,000 | 61,316 |
| Midwest Connector Capital Co. LLC (b) | 3.90 | 04/01/24 | 85,000 | 87,113 |
| Midwest Connector Capital Co. LLC (b) | 4.63 | 04/01/29 | 205,000 | 214,797 |
| MPLX LP | 1.75 | 03/01/26 | 80,000 | 82,773 |
| MPLX LP | 2.65 | 08/15/30 | 245,000 | 256,621 |
| National Oilwell Varco, Inc. | 3.60 | 12/01/29 | 112,000 | 117,060 |
| Phillips 66 | 2.15 | 12/15/30 | 260,000 | 263,791 |
| Pioneer Natural Resources Co. | 1.90 | 08/15/30 | 430,000 | 425,705 |
| Valero Energy Corp. | 1.20 | 03/15/24 | 90,000 | 90,818 |
| Total Energy | 3,581,308 | |||
| Financials | 15.5% | ||||
| Air Lease Corp. | 3.38 | 07/01/25 | 95,000 | 102,143 |
| Air Lease Corp. | 2.88 | 01/15/26 | 100,000 | 105,790 |
| Athene Global Funding (b) | 2.80 | 05/26/23 | 95,000 | 99,175 |
| Athene Global Funding (b) | 2.50 | 01/14/25 | 609,000 | 637,832 |
| Athene Global Funding (b) | 2.95 | 11/12/26 | 120,000 | 128,673 |
| Bank of America Corp. | 0.81(a) | 10/24/24 | 300,000 | 302,248 |
| Bank of America Corp. | 3.95 | 04/21/25 | 844,000 | 951,389 |
| Bank of America Corp. | 0.98(a) | 09/25/25 | 220,000 | 222,354 |
| Bank of America Corp. | 1.20(a) | 10/24/26 | 200,000 | 202,617 |
| Bank of America Corp. | 2.50(a) | 02/13/31 | 263,000 | 279,172 |
| Bank of America Corp. | 1.92(a) | 10/24/31 | 300,000 | 303,786 |
| Bank of America Corp. | 2.68(a) | 06/19/41 | 275,000 | 286,084 |
| Bank of America Corp. | 2.83(a) | 10/24/51 | 300,000 | 312,305 |
| Capital One Bank (USA), NA | 2.01(a) | 01/27/23 | 275,000 | 279,714 |
| Capital Southwest Corp. | 4.50 | 01/31/26 | 600,000 | 601,500 |
| CIT Group Inc. | 3.93(a) | 06/19/24 | 402,000 | 425,115 |
| Citigroup Inc. | 1.68(a) | 05/15/24 | 75,000 | 77,254 |
| The accompanying notes are an integral part of these financial statements. | Portfolio of Investments |
| Corporate Bonds–Other | 39.1% of portfolio (Continued) | ||||
| Interest Rate / Yield | Maturity Date | Face Amount | Value | |
| Financials | 15.5% (Continued) | ||||
| Citigroup Inc. | 1.32%(a) | 05/17/24 | $150,000 | $152,030 |
| Citigroup Inc. | 4.45 | 09/29/27 | 653,000 | 769,889 |
| Citigroup Inc. | 2.98(a) | 11/05/30 | 65,000 | 71,548 |
| Citigroup Inc. | 2.57(a) | 06/03/31 | 470,000 | 500,675 |
| CoreStates Capital II (b) | 0.89(a) | 01/15/27 | 175,000 | 164,570 |
| Fidus Investment Corp. | 4.75 | 01/31/26 | 300,000 | 306,102 |
| Goldman Sachs BDC, Inc. | 2.88 | 01/15/26 | 500,000 | 510,585 |
| Goldman Sachs Group Inc. | 3.81(a) | 04/23/29 | 117,000 | 135,508 |
| Goldman Sachs Group, Inc. | 3.50 | 04/01/25 | 165,000 | 183,483 |
| Iron Mountain Inc. (b) | 4.50 | 02/15/31 | 80,000 | 83,800 |
| J.P. Morgan Chase & Co. | 0.65(a) | 09/16/24 | 120,000 | 120,627 |
| J.P. Morgan Chase & Co. | 2.08(a) | 04/22/26 | 205,000 | 216,463 |
| J.P. Morgan Chase & Co. | 3.63 | 12/01/27 | 422,000 | 479,767 |
| J.P. Morgan Chase & Co. | 2.52(a) | 04/22/31 | 105,000 | 112,798 |
| J.P. Morgan Chase & Co. | 2.96(a) | 05/13/31 | 120,000 | 131,548 |
| Jackson National Life Global Funding (b) | 0.68(a) | 01/06/23 | 350,000 | 351,439 |
| Main Street Capital Corp. | 5.20 | 05/01/24 | 884,000 | 958,613 |
| Morgan Stanley | 2.70(a) | 01/22/31 | 230,000 | 249,547 |
| Morgan Stanley | 1.79(a) | 02/13/32 | 175,000 | 175,976 |
| Oaktree Specialty Lending Corp. | 3.50 | 02/25/25 | 405,000 | 419,296 |
| Owl Rock Capital Corp. | 3.40 | 07/15/26 | 300,000 | 304,072 |
| Owl Rock Technology Finance Corp. | 4.75 | 12/15/25 | 1,095,000 | 1,143,209 |
| Owl Rock Technology Finance Corp. (b) | 3.75 | 06/17/26 | 150,000 | 150,779 |
| Prudential Financial, Inc. | 5.70(a) | 09/15/48 | 75,000 | 86,535 |
| Regions Financial Corp. | 2.25 | 05/18/25 | 70,000 | 74,219 |
| Visa Inc. | 2.00 | 08/15/50 | 120,000 | 114,361 |
| Wells Fargo & Co. | 1.65(a) | 06/02/24 | 510,000 | 523,917 |
| Wells Fargo & Co. | 2.19(a) | 04/30/26 | 60,000 | 63,161 |
| Wells Fargo & Co. | 2.39(a) | 06/02/28 | 175,000 | 186,232 |
| Wells Fargo & Co. | 2.57(a) | 02/11/31 | 50,000 | 52,888 |
| Wells Fargo & Co. | 3.07(a) | 04/30/41 | 340,000 | 369,863 |
| Total Financials | 14,480,651 | |||
| Health Care | 2.0% | ||||
| AbbVie Inc. | 2.95 | 11/21/26 | 160,000 | 176,988 |
| AbbVie Inc. | 4.05 | 11/21/39 | 172,000 | 207,518 |
| AbbVie Inc. | 4.25 | 11/21/49 | 90,000 | 112,803 |
| Anthem, Inc. | 2.38 | 01/15/25 | 50,000 | 53,467 |
| Anthem, Inc. | 3.13 | 05/15/50 | 60,000 | 65,741 |
| Bristol-Myers Squibb Co. | 2.35 | 11/13/40 | 170,000 | 174,692 |
| CVS Health Corp. | 1.75 | 08/21/30 | 245,000 | 246,306 |
| CVS Health Corp. | 2.70 | 08/21/40 | 170,000 | 171,732 |
| HCA Healthcare Inc. | 5.13 | 06/15/39 | 144,000 | 184,036 |
| Merck & Co., Inc. | 2.35 | 06/24/40 | 75,000 | 77,492 |
| Mylan Inc. | 4.55 | 04/15/28 | 140,000 | 166,364 |
| Mylan Inc. | 5.20 | 04/15/48 | 50,000 | 65,778 |
| Sutter Health | 1.32 | 08/15/25 | 135,000 | 137,246 |
| Thermo Fisher Scientific Inc. | 4.50 | 03/25/30 | 55,000 | 68,703 |
| Total Health Care | 1,908,866 | |||
| Industrials | 1.2% | ||||
| Ashtead Capital, Inc. (b) | 4.25 | 11/01/29 | 308,000 | 337,211 |
| Boeing Co. (The) | 1.88 | 06/15/23 | 80,000 | 81,404 |
| Portfolio of Investments | The accompanying notes are an integral part of these financial statements. |
| Corporate Bonds–Other | 39.1% of portfolio (Continued) | ||||
| Interest Rate / Yield | Maturity Date | Face Amount | Value | |
| Industrials | 1.2% (Continued) | ||||
| Boeing Co. (The) | 2.85% | 10/30/24 | $131,000 | $138,421 |
| Caterpillar Inc. | 3.25 | 04/09/50 | 55,000 | 64,835 |
| Delta Air Lines, Inc. (b) | 7.00 | 05/01/25 | 150,000 | 173,151 |
| Delta Air Lines, Inc. | 7.38 | 01/15/26 | 110,000 | 125,628 |
| Southwest Airlines Co. | 5.25 | 05/04/25 | 124,000 | 143,585 |
| Waste Management, Inc. | 1.15 | 03/15/28 | 96,000 | 96,232 |
| Total Industrials | 1,160,467 | |||
| Information Technology | 1.8% | ||||
| Dell International LLC / EMC Corp. (b) | 5.85 | 07/15/25 | 110,000 | 132,113 |
| Dell International LLC / EMC Corp. (b) | 4.90 | 10/01/26 | 182,000 | 214,861 |
| DXC Technology Co. | 4.00 | 04/15/23 | 145,000 | 154,246 |
| Infor, Inc. (b) | 1.75 | 07/15/25 | 70,000 | 72,697 |
| International Business Machines Corp. | 4.15 | 05/15/39 | 246,000 | 311,049 |
| Microsoft Corp. | 3.70 | 08/08/46 | 445,000 | 563,450 |
| NVIDIA Corp. | 3.50 | 04/01/40 | 90,000 | 107,933 |
| NVIDIA Corp. | 3.50 | 04/01/50 | 90,000 | 108,974 |
| Total Information Technology | 1,665,323 | |||
| Materials | 0.9% | ||||
| 3M Co. | 3.70 | 04/15/50 | 60,000 | 74,340 |
| DuPont de Nemours, Inc. | 2.17 | 05/01/23 | 145,000 | 146,912 |
| E.I. du Pont de Nemours & Co. | 2.30 | 07/15/30 | 40,000 | 42,525 |
| Georgia-Pacific LLC (b) | 0.95 | 05/15/26 | 200,000 | 200,936 |
| Mosaic Co. (The) | 4.25 | 11/15/23 | 305,000 | 333,124 |
| Total Materials | 797,837 | |||
| Real Estate | 1.5% | ||||
| American Tower Corp. | 1.88 | 10/15/30 | 130,000 | 131,058 |
| Life Storage, LP | 2.20 | 10/15/30 | 215,000 | 219,341 |
| SBA Tower Trust (b) | 2.84 | 01/15/25 | 115,000 | 122,439 |
| Service Properties Trust | 7.50 | 09/15/25 | 305,000 | 351,392 |
| STORE Capital Corp. | 2.75 | 11/18/30 | 200,000 | 203,282 |
| VEREIT Operating Partnership, LP | 2.20 | 06/15/28 | 295,000 | 301,506 |
| Welltower Inc. | 2.75 | 01/15/31 | 95,000 | 101,306 |
| Total Real Estate | 1,430,324 | |||
| Utilities | 3.0% | ||||
| Dominion Energy, Inc. | 0.75(a) | 09/15/23 | 90,000 | 90,166 |
| National Fuel Gas Co. | 5.50 | 01/15/26 | 307,000 | 354,031 |
| NRG Energy, Inc. (b) | 4.45 | 06/15/29 | 95,000 | 110,135 |
| Pacific Gas & Electric Co. | 4.25 | 08/01/23 | 394,000 | 423,007 |
| Pacific Gas & Electric Co. | 4.25 | 03/15/46 | 325,000 | 348,255 |
| San Diego Gas & Electric Co. | 1.91 | 02/01/22 | 182,362 | 183,328 |
| Southern California Edison Co. | 1.85 | 02/01/22 | 176,571 | 176,950 |
| Southern California Edison Co. | 2.25 | 06/01/30 | 55,000 | 57,230 |
| Southern California Edison Co. | 4.50 | 09/01/40 | 200,000 | 240,654 |
| Southern California Edison Co. | 4.00 | 04/01/47 | 164,000 | 192,318 |
| Southern California Edison Co. | 3.65 | 02/01/50 | 214,000 | 242,629 |
| TerraForm Power Operating LLC (b) | 4.25 | 01/31/23 | 215,000 | 222,256 |
| The accompanying notes are an integral part of these financial statements. | Portfolio of Investments |
| Corporate Bonds–Other | 39.1% of portfolio (Continued) | ||||
| Interest Rate / Yield | Maturity Date | Face Amount | Value | |
| Utilities | 3.0% (Continued) | ||||
| TerraForm Power Operating LLC (b) | 4.75% | 01/15/30 | $171,000 | $182,970 |
| Total Utilities | 2,823,929 | |||
| Total Corporate Bonds–Other | ||||
| (Cost $35,080,672) | 36,544,067 | |||
| Mortgage-Backed Securities | 17.4% of portfolio | ||||
| Federal Home Loan Mortgage Corp. | 3.00 | 06/01/50 | 507,454 | 531,475 |
| FNMA BN5402 | 3.50 | 04/01/49 | 77,519 | 81,888 |
| FNMA BN7662 | 3.50 | 07/01/49 | 249,890 | 263,802 |
| FNMA CA4016 | 3.00 | 08/01/49 | 1,059,252 | 1,125,027 |
| FNMA FM1000 | 3.00 | 04/01/47 | 1,827,274 | 1,916,494 |
| FNMA FM4231 | 2.50 | 09/01/50 | 353,690 | 373,110 |
| FNMA MA3691 | 3.00 | 07/01/49 | 413,749 | 433,710 |
| FNMA MA3692 | 3.50 | 07/01/49 | 977,366 | 1,032,404 |
| FNMA MA3745 | 3.50 | 08/01/49 | 1,119,995 | 1,183,038 |
| FNMA MA3834 | 3.00 | 11/01/49 | 823,159 | 863,064 |
| FNMA MA3960 | 3.00 | 03/01/50 | 380,315 | 398,634 |
| FNMA MA3992 | 3.50 | 04/01/50 | 452,555 | 478,313 |
| FNMA MA4048 | 3.00 | 06/01/50 | 1,488,498 | 1,558,961 |
| FNMA MA4179 | 2.00 | 11/01/35 | 5,771,594 | 6,033,753 |
| Total Mortgage-Backed Securities | ||||
| (Cost $16,114,470) | 16,273,673 | |||
| U.S. Government & Agency Obligations | 13.9% of portfolio | ||||
| U.S. International Development Finance Corp. | 1.05 | 10/15/29 | 147,035 | 148,872 |
| U.S. International Development Finance Corp. | 1.49 | 08/15/31 | 80,000 | 82,151 |
| U.S. International Development Finance Corp. | 3.00 | 10/05/34 | 190,246 | 217,299 |
| U.S. International Development Finance Corp. | 1.32 | 03/15/35 | 210,000 | 211,415 |
| U.S. Treasury Note | 0.25 | 11/15/23 | 145,000 | 145,396 |
| U.S. Treasury Note | 0.38 | 12/31/25 | 1,145,000 | 1,145,626 |
| U.S. Treasury Note | 0.63 | 11/30/27 | 1,919,000 | 1,917,801 |
| U.S. Treasury Note | 0.88 | 11/15/30 | 3,493,000 | 3,479,355 |
| U.S. Treasury Note | 1.38 | 08/15/50 | 6,053,000 | 5,655,772 |
| Total U.S. Government & Agency Obligations | ||||
| (Cost $12,978,698) | 13,003,687 | |||
| Asset-Backed Securities | 11.3% of portfolio | ||||
| American Credit Acceptance Receivables Trust 19-1 (b) | 3.50 | 04/14/25 | 120,000 | 121,904 |
| American Credit Acceptance Receivables Trust 2019-3 (b) | 2.59 | 08/14/23 | 800,000 | 803,486 |
| American Credit Acceptance Receivables Trust 20-3A (b) | 0.62 | 10/13/23 | 118,377 | 118,515 |
| American Credit Acceptance Receivables Trust 20-3B (b) | 1.15 | 08/13/24 | 115,000 | 115,588 |
| Avant Loans Funding Trust 19-B (b) | 2.72 | 10/15/26 | 34,773 | 34,899 |
| Avid Automobile Receivables Trust 19-1 (b) | 2.62 | 02/15/24 | 42,332 | 42,722 |
| Carvana Auto Receivables Trust 19-2A (b) | 2.74 | 12/15/23 | 310,000 | 314,855 |
| Carvana Auto Receivables Trust 20-N1A (b) | 2.01 | 03/17/25 | 350,000 | 355,519 |
| Consumer Loan Underlying Bond 18-P3 (b) | 3.82 | 01/15/26 | 78,794 | 79,097 |
| Consumer Loan Underlying Bond 19-HP1 (b) | 2.59 | 12/15/26 | 50,281 | 50,842 |
| Consumer Loan Underlying Bond 20-P1 (b) | 2.26 | 03/15/28 | 119,961 | 120,836 |
| CoreVest American Finance 20-4 (b) | 1.17 | 12/15/52 | 150,000 | 150,526 |
| CPS Auto Trust 20-C (b) | 1.01 | 01/15/25 | 100,000 | 100,267 |
| Credit Acceptance Auto Loan Trust 18-2A (b) | 3.47 | 05/17/27 | 75,991 | 76,433 |
| Credit Acceptance Auto Loan Trust 18-3B (b) | 3.89 | 10/15/27 | 250,000 | 255,497 |
| Portfolio of Investments | The accompanying notes are an integral part of these financial statements. |
| Asset-Backed Securities | 11.3% of portfolio (Continued) | ||||
| Interest Rate /Yield | Maturity Date | Face Amount | Value | |
| Credit Acceptance Auto Loan Trust 19-1A (b) | 3.33% | 02/15/28 | $250,000 | $254,636 |
| Credit Acceptance Auto Loan Trust 19-1B (b) | 3.75 | 04/17/28 | 500,000 | 520,248 |
| Credit Acceptance Auto Loan Trust 19-1C (b) | 3.94 | 06/15/28 | 250,000 | 261,325 |
| Credit Acceptance Auto Loan Trust 20-1A (b) | 2.01 | 02/15/29 | 500,000 | 511,187 |
| Credit Acceptance Auto Loan Trust 20-1A (b) | 2.39 | 04/16/29 | 250,000 | 255,911 |
| Credit Acceptance Auto Loan Trust 20-2A (b) | 1.37 | 07/16/29 | 250,000 | 253,368 |
| Credit Acceptance Auto Loan Trust 20-3A (b) | 1.24 | 10/15/29 | 350,000 | 353,886 |
| DT Auto Owner Trust 18-2D (b) | 4.15 | 03/15/24 | 100,000 | 102,597 |
| DT Auto Owner Trust 19-1C (b) | 3.61 | 11/15/24 | 300,000 | 305,642 |
| DT Auto Owner Trust 20-3A (b) | 0.91 | 12/16/24 | 200,000 | 201,044 |
| Exeter Automobile Receivables Trust 19-4 (b) | 2.18 | 01/17/23 | 18,449 | 18,488 |
| Exeter Automobile Receivables Trust 20-1A (b) | 2.05 | 06/15/23 | 29,813 | 29,931 |
| Exeter Automobile Receivables Trust 20-1A (b) | 2.26 | 04/15/24 | 100,000 | 101,377 |
| Exeter Automobile Receivables Trust 20-3A | 0.52 | 10/16/23 | 100,000 | 100,082 |
| Foursight Capital Automobile Receivables Trust 19-1 (b) | 2.67 | 03/15/24 | 100,000 | 101,564 |
| Freedom Financial 20-3 (b) | 2.40 | 09/20/27 | 189,970 | 190,665 |
| GLS Auto Receivables Trust 19-1 (b) | 3.65 | 12/16/24 | 800,000 | 815,584 |
| GLS Auto Receivables Trust 19-2 (b) | 3.06 | 04/17/23 | 1,054,925 | 1,061,862 |
| GLS Auto Receivables Trust 20-2 (b) | 1.58 | 08/15/24 | 294,095 | 296,725 |
| GLS Auto Receivables Trust 20-3 (b) | 1.38 | 08/15/24 | 150,000 | 151,429 |
| GLS Auto Receivables Trust 20-4 (b) | 0.87 | 12/16/24 | 300,000 | 300,423 |
| Gracie Point International Fund 20-B (b) | 1.53(a) | 05/02/23 | 291,000 | 290,987 |
| Marlette Funding Trust 19-3 (b) | 2.69 | 09/17/29 | 27,417 | 27,602 |
| Marlette Funding Trust 20-2 (b) | 1.02 | 09/16/30 | 70,641 | 70,760 |
| Prosper Marketplace Issuance Trust 19-3 (b) | 3.19 | 07/15/25 | 12,203 | 12,244 |
| SoFi Consumer Loan Program Trust 18-3 (b) | 4.02 | 08/25/27 | 150,000 | 154,116 |
| SoFi Consumer Loan Program Trust 19-1 (b) | 3.24 | 02/25/28 | 22,533 | 22,692 |
| SoFi Consumer Loan Program Trust 19-4 (b) | 2.45 | 08/25/28 | 38,263 | 38,661 |
| United Auto Credit Securitization Trust 20-1 (b) | 1.47 | 11/10/22 | 120,000 | 120,642 |
| Upstart Securitization Trust 19-3 (b) | 2.68 | 01/21/30 | 69,209 | 69,823 |
| Westlake Automobile Receivable Trust 19-2A (b) | 2.84 | 07/15/24 | 200,000 | 204,087 |
| Westlake Automobile Receivable Trust 20-3A (b) | 0.56 | 05/15/24 | 375,000 | 375,820 |
| Westlake Automobile Receivable Trust 20-3A (b) | 0.78 | 11/17/25 | 230,000 | 230,485 |
| Total Asset-Backed Securities | ||||
| (Cost $10,511,735) | 10,546,879 | |||
| Yankee Bonds | 9.1% of portfolio | ||||
| AerCap Ireland Capital DAC | 4.13 | 07/03/23 | 185,000 | 198,125 |
| AerCap Ireland Capital DAC | 6.50 | 07/15/25 | 165,000 | 197,212 |
| Aircastle Ltd. (b) | 5.25 | 08/11/25 | 160,000 | 176,182 |
| Avolon Holdings Funding Ltd. (b) | 3.63 | 05/01/22 | 207,000 | 211,476 |
| Avolon Holdings Funding Ltd. (b) | 5.13 | 10/01/23 | 500,000 | 534,855 |
| Avolon Holdings Funding Ltd. (b) | 3.95 | 07/01/24 | 150,000 | 158,402 |
| Avolon Holdings Funding Ltd. (b) | 5.50 | 01/15/26 | 300,000 | 339,802 |
| Avolon Holdings Funding Ltd. (b) | 4.25 | 04/15/26 | 100,000 | 107,713 |
| Banco Bilbao Vizcaya Argentaria SA | 0.88 | 09/18/23 | 200,000 | 201,389 |
| Banco Bilbao Vizcaya Argentaria SA | 1.13 | 09/18/25 | 200,000 | 201,400 |
| Banco Santander SA | 2.75 | 05/28/25 | 200,000 | 213,462 |
| Banco Santander SA | 3.49 | 05/28/30 | 200,000 | 224,293 |
| Barclays PLC | 1.60(a) | 05/16/24 | 400,000 | 405,392 |
| Barclays PLC | 2.85(a) | 05/07/26 | 325,000 | 348,962 |
| Barclays PLC | 2.65(a) | 06/24/31 | 200,000 | 208,153 |
| Cemex, SAB de CV (b) | 7.38 | 06/05/27 | 230,000 | 261,740 |
| Delta and SkyMiles IP Ltd. (b) | 4.50 | 10/20/25 | 100,000 | 106,869 |
| Delta and SkyMiles IP Ltd. (b) | 4.75 | 10/20/28 | 50,000 | 54,555 |
| DH Europe Finance II SARL | 2.60 | 11/15/29 | 153,000 | 167,243 |
| Enel Finance International NV (b) | 2.75 | 04/06/23 | 200,000 | 209,251 |
| The accompanying notes are an integral part of these financial statements. | Portfolio of Investments |
| Yankee Bonds | 9.1% of portfolio (Continued) | ||||
| Interest Rate /Yield | Maturity Date | Face Amount | Value | |
| Enel Finance International NV (b) | 2.65% | 09/10/24 | $345,000 | $367,436 |
| Mitsubishi UFJ Financial Group, Inc. | 1.07(a) | 07/26/23 | 230,000 | 232,495 |
| Mitsubishi UFJ Financial Group, Inc. | 1.41 | 07/17/25 | 220,000 | 225,966 |
| Nationwide Building Society (b) | 3.62(a) | 04/26/23 | 200,000 | 207,738 |
| NatWest Group PLC | 4.27(a) | 03/22/25 | 296,000 | 327,413 |
| Nissan Motor Co., Ltd. (b) | 3.52 | 09/17/25 | 230,000 | 246,572 |
| Nissan Motor Co., Ltd. (b) | 4.81 | 09/17/30 | 200,000 | 225,361 |
| Seagate HDD Cayman (b) | 4.13 | 01/15/31 | 75,000 | 80,169 |
| Spirit Loyalty Cayman Ltd. (b) | 8.00 | 09/20/25 | 100,000 | 112,000 |
| Sumitomo Mitsui Financial Group, Inc. (b) | 1.05 | 09/12/25 | 200,000 | 201,289 |
| Syngenta Finance NV (b) | 4.44 | 04/24/23 | 230,000 | 241,356 |
| Syngenta Finance NV (b) | 4.89 | 04/24/25 | 530,000 | 568,722 |
| Tencent Holdings Ltd. (b) | 1.81 | 01/26/26 | 220,000 | 224,844 |
| Tencent Music Entertainment Group | 2.00 | 09/03/30 | 200,000 | 198,701 |
| Teva Pharmaceutical Industries Ltd. | 2.80 | 07/21/23 | 248,000 | 245,520 |
| Westpac Banking Corp. | 2.96 | 11/16/40 | 300,000 | 318,992 |
| Total Yankee Bonds | ||||
| (Cost $8,147,821) | 8,551,050 | |||
| Municipal Bonds | 4.0% of portfolio | ||||
| Alabama | 0.1% | ||||
| Alabama Public School & College Authority | 1.16 | 06/01/26 | 85,000 | 86,510 |
| Total Alabama | 86,510 | |||
| Arizona | 0.2% | ||||
| Pinal County Arizona Revenue Obligation | 1.05 | 08/01/24 | 120,000 | 120,723 |
| Pinal County Arizona Revenue Obligation | 1.58 | 08/01/26 | 110,000 | 111,333 |
| Total Arizona | 232,056 | |||
| California | 0.4% | ||||
| California Infrastructure & Economic Development Bank | 1.24 | 10/01/27 | 50,000 | 50,463 |
| Gardena California Pension Obligation | 2.07 | 04/01/26 | 100,000 | 103,586 |
| Santa Clara Valley California Water District | 3.82 | 06/01/39 | 180,000 | 198,007 |
| Total California | 352,056 | |||
| Colorado | 0.1% | ||||
| Denver City & County Colorado Airport | 1.57 | 11/15/26 | 95,000 | 95,511 |
| Total Colorado | 95,511 | |||
| Georgia | 0.1% | ||||
| City of Atlanta Georgia Water & Wastewater | 2.26 | 11/01/35 | 130,000 | 136,512 |
| Total Georgia | 136,512 | |||
| Hawaii | 0.2% | ||||
| Hawaii State | 0.89 | 08/01/26 | 60,000 | 60,460 |
| Hawaii State | 1.11 | 10/01/26 | 90,000 | 91,688 |
| Total Hawaii | 152,148 | |||
| New Jersey | 1.1% | ||||
| New Jersey Economic Development Authority | 7.63(c) | 02/15/22 | 130,000 | 129,215 |
| Portfolio of Investments | The accompanying notes are an integral part of these financial statements. |
| Municipal Bonds | 4.0% of portfolio (Continued) | ||||
| Interest Rate /Yield | Maturity Date | Face Amount | Value | |
| New Jersey | 1.1% (Continued) | ||||
| New Jersey Housing and Morgage Finance Agency | 1.34% | 04/01/24 | $95,000 | $95,686 |
| New Jersey Housing and Morgage Finance Agency | 1.49 | 04/01/25 | 85,000 | 85,663 |
| New Jersey Housing and Morgage Finance Agency | 1.54 | 10/01/25 | 145,000 | 145,648 |
| New Jersey Transportation Trust Fund Authority | 4.08 | 06/15/39 | 575,000 | 604,474 |
| Total New Jersey | 1,060,686 | |||
| New York | 1.4% | ||||
| New York NY | 0.83 | 08/01/24 | 500,000 | 501,295 |
| New York NY | 1.22 | 08/01/26 | 200,000 | 202,416 |
| Suffolk County New York | 1.61 | 06/15/25 | 200,000 | 201,920 |
| Suffolk County New York | 1.99 | 06/15/26 | 365,000 | 372,869 |
| Total New York | 1,278,500 | |||
| Texas | 0.4% | ||||
| Harris County Texas Cultural Education Facilities Finance Corp. | 3.34 | 11/15/37 | 200,000 | 213,924 |
| San Antonio Texas Electric & Gas | 2.91 | 02/01/48 | 150,000 | 158,090 |
| Total Texas | 372,014 | |||
| Total Municipal Bonds | ||||
| (Cost $3,663,784) | 3,765,993 | |||
| Corporate Bond Guaranteed by Export-Import Bank of the United States | 0.4% of portfolio | ||||
| Energy | 0.4% | ||||
| Petroleos Mexicanos | 0.59(a) | 04/15/25 | 321,750 | 322,275 |
| Total Energy | 322,275 | |||
| Total Corporate Bond Guaranteed by Export-Import Bank of the United States | ||||
| (Cost $321,403) | 322,275 | |||
| Money Market Fund | 4.8% of portfolio | ||||
| Shares | ||||
| State Street Institutional U.S. Government Money Market Fund Premier Class | 0.03(d) | 4,504,029 | 4,504,029 | |
| Total Money Market Fund | ||||
| (Cost $4,504,029) | 4,504,029 | |||
| Total Investments in Securities | ||||
| (Cost $91,322,612) | 100.0% | $93,511,653 | |||
| (a) | Variable coupon rate as of December 31, 2020. |
| (b) | Security was purchased pursuant to Rule 144A under the Securities Act of 1933 and may be resold in transactions exempt from registration, normally to qualified institutional buyers. The securities have been determined to be liquid under criteria established by the Fund's Board of Trustees. The total of such securities at period-end amounts to $20,551,228 and represents 22.0% of total investments. |
| (c) | Interest is paid at maturity. |
| (d) | 7-day yield at December 31, 2020. |
| The accompanying notes are an integral part of these financial statements. | Portfolio of Investments |
| Portfolio of Investments | The accompanying notes are an integral part of these financial statements. |
| Cost | Value | |
| Investment | $39,884,120 | $188,972,500 |
| The accompanying notes are an integral part of these financial statements. | Portfolio of Investments |
| Common Stocks | 98.5% of portfolio | ||
| Shares | Value | |
| Communication Services | 8.0% | ||
| Diversified Telecommunication Services | ||
| Verizon Communications, Inc. | 219,431 | $12,891,571 |
| Interactive Media & Services | ||
| Alphabet, Inc., Class C (a) | 26,311 | 46,093,715 |
| Facebook, Inc., Class A (a) | 36,000 | 9,833,760 |
| Media | ||
| Comcast Corp., Class A | 100,800 | 5,281,920 |
| Total Communication Services | 74,100,966 | |
| Consumer Discretionary | 5.6% | ||
| Hotels, Restaurants & Leisure | ||
| Las Vegas Sands Corp. (a) | 137,048 | 8,168,061 |
| McDonald's Corp. | 57,797 | 12,402,080 |
| Specialty Retail | ||
| Home Depot, Inc. | 37,418 | 9,938,969 |
| TJX Companies, Inc. (The) | 145,100 | 9,908,879 |
| Ulta Beauty, Inc. (a) | 41,456 | 11,904,505 |
| Total Consumer Discretionary | 52,322,494 | |
| Financials | 18.5% | ||
| Banks | ||
| Bank of America Corp. | 738,202 | 22,374,903 |
| Citigroup, Inc. | 277,639 | 17,119,221 |
| JPMorgan Chase & Co. | 312,091 | 39,657,403 |
| Truist Financial Corp. | 257,400 | 12,337,182 |
| Capital Markets | ||
| Goldman Sachs Group, Inc. | 77,474 | 20,430,668 |
| Insurance | ||
| Allstate Corp. | 304,684 | 33,493,912 |
| American International Group, Inc. | 368,594 | 13,954,969 |
| Chubb Ltd. | 80,038 | 12,319,449 |
| Total Financials | 171,687,707 | |
| Health Care | 22.3% | ||
| Biotechnology | ||
| AbbVie Inc. | 183,263 | 19,636,630 |
| Amgen Inc. | 34,500 | 7,932,240 |
| Health Care Equipment & Supplies | ||
| Abbott Laboratories | 374,156 | 40,966,341 |
| Boston Scientific Corp. (a) | 332,296 | 11,946,041 |
| Medtronic PLC | 137,256 | 16,078,168 |
| Health Care Providers & Services | ||
| Centene Corp. (a) | 300,797 | 18,056,844 |
| Cigna Corp. | 84,514 | 17,594,124 |
| Life Sciences Tools & Services | ||
| Mettler-Toledo International, Inc. (a) | 9,004 | 10,261,679 |
| Pharmaceuticals | ||
| Bristol-Myers Squibb Co. | 256,001 | 15,879,742 |
| Merck & Co., Inc. | 300,982 | 24,620,328 |
| Common Stocks | 98.5% of portfolio (Continued) | ||
| Shares | Value | |
| Health Care | 22.3% (Continued) | ||
| Pfizer, Inc. | 652,799 | $24,029,531 |
| Total Health Care | 207,001,668 | |
| Industrials | 16.3% | ||
| Aerospace & Defense | ||
| Northrop Grumman Corp. | 34,831 | 10,613,702 |
| Airlines | ||
| Southwest Airlines Co. (a) | 252,732 | 11,779,839 |
| Electrical Equipment | ||
| Eaton Corp. PLC | 89,887 | 10,799,024 |
| Industrial Conglomerates | ||
| Honeywell International, Inc. | 216,673 | 46,086,347 |
| Machinery | ||
| Deere & Co. | 31,800 | 8,555,790 |
| Parker-Hannifin Corp. | 109,222 | 29,753,165 |
| Stanley Black & Decker, Inc. | 84,842 | 15,149,388 |
| Road & Rail | ||
| CSX Corp. | 208,594 | 18,929,905 |
| Total Industrials | 151,667,160 | |
| Information Technology | 17.4% | ||
| IT Services | ||
| Fiserv, Inc. (a) | 71,700 | 8,163,762 |
| Leidos Holdings Inc. | 162,817 | 17,115,323 |
| Visa Inc., Class A | 144,898 | 31,693,540 |
| Semiconductors & Semiconductor Equipment | ||
| NVIDIA Corp. | 47,355 | 24,728,781 |
| NXP Semiconductors NV | 139,463 | 22,176,012 |
| Software | ||
| Microsoft Corp. | 183,914 | 40,906,152 |
| VMware, Inc., Class A (a) | 117,083 | 16,422,061 |
| Total Information Technology | 161,205,631 | |
| Materials | 8.4% | ||
| Chemicals | ||
| Dow Inc. | 183,081 | 10,160,995 |
| DuPont de Nemours, Inc. | 296,978 | 21,118,106 |
| Containers & Packaging | ||
| Avery Dennison Corp. | 265,787 | 41,226,222 |
| Metals & Mining | ||
| Freeport-McMoRan Inc. (a) | 224,500 | 5,841,490 |
| Total Materials | 78,346,813 | |
| Real Estate | 2.0% | ||
| Equity Real Estate Investment Trusts (REITs) | ||
| Digital Realty Trust, Inc. | 52,901 | 7,380,219 |
| VICI Properties Inc. | 424,135 | 10,815,442 |
| Total Real Estate | 18,195,661 | |
| Total Common Stocks | ||
| (Cost $523,064,646) | 914,528,100 | |
| Portfolio of Investments | The accompanying notes are an integral part of these financial statements. |
| Money Market Fund | 1.5% of portfolio | ||
| Shares | Value | |
| State Street Institutional U.S. Government Money Market Fund Premier Class, 0.03% (b) | 13,690,331 | $13,690,331 |
| Total Money Market Fund | ||
| (Cost $13,690,331) | 13,690,331 | |
| Total Investments in Securities | ||
| (Cost $536,754,977) | 100.0% | $928,218,431 | |
| (a) | Non-income producing. |
| (b) | 7-day yield at December 31, 2020. |
| The accompanying notes are an integral part of these financial statements. | Portfolio of Investments |
| Common Stocks | 99.4% of portfolio | ||
| Shares | Value | |
| Communication Services | 23.1% | ||
| Entertainment | ||
| Netflix, Inc. (a) | 12,446 | $6,729,926 |
| Sea Ltd. ADR (a) | 4,771 | 949,667 |
| Spotify Technology SA (a) | 16,503 | 5,192,834 |
| Interactive Media & Services | ||
| Alphabet, Inc., Class C (a) | 4,400 | 7,708,272 |
| Alphabet, Inc., Class A (a) | 8,947 | 15,680,870 |
| Facebook, Inc., Class A (a) | 66,375 | 18,130,995 |
| IAC/InterActiveCorp (a) | 9,074 | 1,718,162 |
| Match Group, Inc. (a) | 23,435 | 3,543,138 |
| Snap Inc., Class A (a) | 160,777 | 8,050,104 |
| Tencent Holdings Ltd. ADR | 86,109 | 6,190,376 |
| Total Communication Services | 73,894,344 | |
| Consumer Discretionary | 21.2% | ||
| Auto Components | ||
| Aptiv PLC | 33,062 | 4,307,648 |
| Hotels, Restaurants & Leisure | ||
| Chipotle Mexican Grill, Inc. (a) | 1,425 | 1,976,062 |
| DraftKings Inc., Class A (a) | 36,908 | 1,718,436 |
| Internet & Direct Marketing Retail | ||
| Alibaba Group Holding Ltd. ADR (a) | 26,439 | 6,153,149 |
| Amazon.com, Inc. (a) | 9,289 | 30,253,623 |
| Booking Holdings, Inc. (a) | 1,601 | 3,565,859 |
| Farfetch Ltd., Class A (a) | 22,230 | 1,418,496 |
| Multiline Retail | ||
| Dollar General Corp. | 18,803 | 3,954,271 |
| Specialty Retail | ||
| CarMax, Inc. (a) | 14,906 | 1,408,021 |
| Carvana Co. (a) | 10,482 | 2,510,858 |
| Ross Stores, Inc. | 46,295 | 5,685,489 |
| Textiles, Apparel & Luxury Goods | ||
| lululemon athletica Inc. (a) | 7,258 | 2,526,002 |
| NIKE, Inc., Class B | 16,995 | 2,404,282 |
| Total Consumer Discretionary | 67,882,196 | |
| Financials | 2.0% | ||
| Capital Markets | ||
| Charles Schwab Corp. | 28,585 | 1,516,148 |
| Goldman Sachs Group, Inc. | 8,033 | 2,118,383 |
| S&P Global Inc. | 5,872 | 1,930,303 |
| XP Inc., Class A (a) | 22,554 | 894,717 |
| Total Financials | 6,459,551 | |
| Health Care | 14.5% | ||
| Biotechnology | ||
| Incyte Corp. (a) | 21,111 | 1,836,235 |
| Vertex Pharmaceuticals, Inc. (a) | 15,442 | 3,649,562 |
| Health Care Equipment & Supplies | ||
| Becton, Dickinson & Co. | 9,840 | 2,462,165 |
| Intuitive Surgical, Inc. (a) | 7,365 | 6,025,306 |
| Stryker Corp. | 26,846 | 6,578,344 |
| Common Stocks | 99.4% of portfolio (Continued) | ||
| Shares | Value | |
| Health Care | 14.5% (Continued) | ||
| Health Care Providers & Services | ||
| Anthem, Inc. | 4,641 | $1,490,179 |
| Centene Corp. (a) | 32,107 | 1,927,383 |
| Cigna Corp. | 33,618 | 6,998,595 |
| HCA Healthcare, Inc. | 21,603 | 3,552,830 |
| Humana Inc. | 6,901 | 2,831,273 |
| UnitedHealth Group, Inc. | 18,229 | 6,392,546 |
| Life Sciences Tools & Services | ||
| Avantor, Inc. (a) | 91,561 | 2,577,442 |
| Total Health Care | 46,321,860 | |
| Industrials | 2.2% | ||
| Machinery | ||
| Ingersoll Rand Inc. (a) | 64,595 | 2,942,948 |
| Professional Services | ||
| CoStar Group, Inc. (a) | 2,759 | 2,550,089 |
| Road & Rail | ||
| Norfolk Southern Corp. | 6,399 | 1,520,466 |
| Total Industrials | 7,013,503 | |
| Information Technology | 35.5% | ||
| IT Services | ||
| Fidelity National Information Services, Inc. | 14,206 | 2,009,581 |
| Global Payments, Inc. | 54,617 | 11,765,594 |
| MongoDB, Inc. (a) | 5,788 | 2,078,123 |
| PayPal Holdings, Inc. (a) | 30,199 | 7,072,606 |
| Shopify Inc., Class A (a) | 426 | 482,211 |
| Visa Inc., Class A | 58,667 | 12,832,233 |
| Wix.com Ltd. (a) | 3,747 | 936,600 |
| Semiconductors & Semiconductor Equipment | ||
| Advanced Micro Devices, Inc. (a) | 26,516 | 2,431,782 |
| ASML Holding NV ADR | 9,986 | 4,870,372 |
| Marvell Technology Group Ltd. | 38,343 | 1,822,826 |
| Software | ||
| Intuit, Inc. | 21,227 | 8,063,076 |
| Microsoft Corp. | 112,640 | 25,053,389 |
| RingCentral, Inc., Class A (a) | 3,300 | 1,250,601 |
| salesforce.com, Inc. (a) | 28,844 | 6,418,655 |
| ServiceNow, Inc. (a) | 8,025 | 4,417,201 |
| Slack Technologies, Inc., Class A (a) | 19,774 | 835,254 |
| Splunk Inc. (a) | 23,233 | 3,947,054 |
| Synopsys, Inc. (a) | 9,438 | 2,446,707 |
| Technology Hardware, Storage & Peripherals | ||
| Apple, Inc. | 111,639 | 14,813,379 |
| Total Information Technology | 113,547,244 | |
| Portfolio of Investments | The accompanying notes are an integral part of these financial statements. |
| Common Stocks | 99.4% of portfolio (Continued) | ||
| Shares | Value | |
| Utilities | 0.9% | ||
| Electric Utilities | ||
| NextEra Energy, Inc. | 38,890 | $3,000,364 |
| Total Utilities | 3,000,364 | |
| Total Common Stocks | ||
| (Cost $161,740,040) | 318,119,062 | |
| Money Market Fund | 0.6% of portfolio | ||
| State Street Institutional U.S. Government Money Market Fund Premier Class, 0.03% (b) | 2,006,631 | 2,006,631 |
| Total Money Market Fund | ||
| (Cost $2,006,631) | 2,006,631 | |
| Total Investments in Securities | ||
| (Cost $163,746,671) | 100.0% | $320,125,693 | |
| (a) | Non-income producing. |
| (b) | 7-day yield at December 31, 2020. |
| The accompanying notes are an integral part of these financial statements. | Portfolio of Investments |
| Common Stocks | 94.4% of portfolio | ||
| Shares | Value | |
| Australia | 1.3% | ||
| BHP Group Ltd. ADR | 17,774 | $1,161,353 |
| Total Australia | 1,161,353 | |
| Brazil | 0.3% | ||
| Ambev SA ADR | 103,138 | 315,602 |
| Total Brazil | 315,602 | |
| Britain | 8.2% | ||
| Diageo PLC | 41,384 | 1,637,514 |
| Rio Tinto PLC | 30,548 | 2,299,442 |
| Royal Dutch Shell PLC, Class B | 72,669 | 1,231,646 |
| Standard Chartered PLC | 124,013 | 787,475 |
| Unilever PLC | 25,114 | 1,506,179 |
| Total Britain | 7,462,256 | |
| Canada | 2.1% | ||
| Alimentation Couche-Tard Inc., Class B | 28,500 | 971,270 |
| Canadian National Railway Co. | 8,270 | 908,460 |
| Total Canada | 1,879,730 | |
| China | 2.0% | ||
| Alibaba Group Holding Ltd. ADR (a) | 1,408 | 327,684 |
| ENN Energy Holdings Ltd. | 8,250 | 121,107 |
| Ping An Insurance Group Co. of China Ltd., Class H | 39,000 | 474,615 |
| Tencent Holdings Ltd. | 12,700 | 913,813 |
| Total China | 1,837,219 | |
| Denmark | 1.0% | ||
| Novozymes A/S, Class B | 15,188 | 865,108 |
| Total Denmark | 865,108 | |
| France | 10.0% | ||
| Air Liquide SA | 6,141 | 1,006,797 |
| Dassault Systèmes SE | 9,053 | 1,836,125 |
| L’Oréal SA | 9,249 | 3,528,974 |
| Schneider Electric SE | 19,262 | 2,783,887 |
| Total France | 9,155,783 | |
| Germany | 13.3% | ||
| adidas AG (a) | 1,758 | 639,569 |
| Allianz SE REG | 11,432 | 2,808,532 |
| Infineon Technologies AG | 112,007 | 4,277,391 |
| SAP SE ADR | 21,879 | 2,852,803 |
| Symrise AG | 12,082 | 1,606,221 |
| Total Germany | 12,184,516 | |
| Common Stocks | 94.4% of portfolio (Continued) | ||
| Shares | Value | |
| Hong Kong | 3.4% | ||
| AIA Group Ltd. | 255,800 | $3,117,209 |
| Total Hong Kong | 3,117,209 | |
| India | 0.9% | ||
| HDFC Bank Ltd. ADR (a) | 5,614 | 405,668 |
| ICICI Bank Ltd. ADR (a) | 25,206 | 374,561 |
| Total India | 780,229 | |
| Israel | 1.8% | ||
| Check Point Software Technologies Ltd. (a) | 12,514 | 1,663,236 |
| Total Israel | 1,663,236 | |
| Japan | 18.1% | ||
| Chugai Pharmaceutical Co., Ltd. | 46,700 | 2,491,685 |
| FANUC Corp. | 4,400 | 1,086,136 |
| Keyence Corp. | 4,900 | 2,756,331 |
| Komatsu Ltd. | 58,600 | 1,617,258 |
| Kubota Corp. | 85,000 | 1,857,048 |
| Nitori Holdings Co., Ltd. | 6,100 | 1,275,519 |
| Shionogi & Co., Ltd. | 16,500 | 902,080 |
| Sysmex Corp. | 15,900 | 1,913,192 |
| Unicharm Corp. | 55,400 | 2,627,400 |
| Total Japan | 16,526,649 | |
| Mexico | 0.3% | ||
| Fomento Economico Mexicano, SAB de CV ADR | 3,960 | 300,049 |
| Total Mexico | 300,049 | |
| Netherlands | 3.8% | ||
| Adyen NV (a) | 1,503 | 3,492,282 |
| Total Netherlands | 3,492,282 | |
| Republic of South Korea | 0.5% | ||
| Samsung Electronics Co., Ltd. GDR | 228 | 414,684 |
| Total Republic of South Korea | 414,684 | |
| Russia | 0.6% | ||
| LUKOIL PJSC ADR | 4,255 | 290,872 |
| Yandex NV, Class A (a) | 4,239 | 294,949 |
| Total Russia | 585,821 | |
| Singapore | 2.5% | ||
| DBS Group Holdings Ltd. | 122,615 | 2,323,644 |
| Total Singapore | 2,323,644 | |
| Portfolio of Investments | The accompanying notes are an integral part of these financial statements. |
| Common Stocks | 94.4% of portfolio (Continued) | ||
| Shares | Value | |
| Spain | 1.6% | ||
| Banco Bilboa Vizcaya Argentaria SA | 300,380 | $1,488,864 |
| Total Spain | 1,488,864 | |
| Sweden | 7.4% | ||
| Alfa Laval AB (a) | 49,472 | 1,366,242 |
| Atlas Copco AB, Class A | 65,798 | 3,381,780 |
| Epiroc AB, Class A | 74,590 | 1,355,652 |
| Skandinaviska Enskilda Banken AB, Class A (a) | 63,357 | 652,418 |
| Total Sweden | 6,756,092 | |
| Switzerland | 12.8% | ||
| Alcon Inc. | 22,167 | 1,462,579 |
| Lonza Group AG REG | 4,427 | 2,851,725 |
| Nestlé SA ADR | 18,121 | 2,142,107 |
| Roche Holding AG REG | 8,135 | 2,833,408 |
| SGS SA REG | 338 | 1,018,857 |
| Sonova Holding AG REG (a) | 5,315 | 1,382,397 |
| Total Switzerland | 11,691,073 | |
| Taiwan | 1.4% | ||
| Taiwan Semiconductor Manufacturing Co. Ltd. ADR | 12,114 | 1,320,911 |
| Total Taiwan | 1,320,911 | |
| United States of America | 1.1% | ||
| Linde PLC | 3,970 | 1,046,795 |
| Total United States of America | 1,046,795 | |
| Total Common Stocks | ||
| (Cost $55,396,522) | 86,369,105 | |
| Preferred Stocks | 2.1% of portfolio | ||
| Shares | Value | |
| Brazil | 0.5% | ||
| Itaú Unibanco Holding SA ADR | 74,855 | $455,867 |
| Total Brazil | 455,867 | |
| Germany | 0.7% | ||
| FUCHS PETROLUB SE | 10,870 | 613,312 |
| Total Germany | 613,312 | |
| Republic of South Korea | 0.9% | ||
| Samsung Electronics Co., Ltd. REG GDR | 514 | 853,893 |
| Total Republic of South Korea | 853,893 | |
| Total Preferred Stocks | ||
| (Cost $1,013,543) | 1,923,072 | |
| Money Market Fund | 3.5% of portfolio | ||
| State Street Institutional U.S. Government Money Market Fund Premier Class, 0.03% (b) | 3,176,868 | 3,176,868 |
| Total Money Market Fund | ||
| (Cost $3,176,868) | 3,176,868 | |
| Total Investments in Securities | ||
| (Cost $59,586,933) | 100.0% | $91,469,045 | |
| (a) | Non-income producing. |
| (b) | 7-day yield at December 31, 2020. |
| The accompanying notes are an integral part of these financial statements. | Portfolio of Investments |
| Common Stocks | 98.7% of portfolio | ||
| Shares | Value | |
| Communication Services | 1.1% | ||
| Wireless Telecommunication Services | ||
| Shenandoah Telecommunications Co. | 76,263 | $3,298,375 |
| Total Communication Services | 3,298,375 | |
| Consumer Discretionary | 7.4% | ||
| Distributors | ||
| Core-Mark Holding Company, Inc. | 175,473 | 5,153,642 |
| Hotels, Restaurants & Leisure | ||
| Cracker Barrel Old Country Store, Inc. (a) | 20,119 | 2,654,099 |
| Extended Stay America, Inc. | 240,924 | 3,568,084 |
| Leisure Products | ||
| Callaway Golf Co. (a) | 167,351 | 4,018,097 |
| Specialty Retail | ||
| Floor & Decor Holdings, Inc. (a) | 29,379 | 2,727,840 |
| Textiles, Apparel & Luxury Goods | ||
| Carter's, Inc. | 34,051 | 3,203,178 |
| Total Consumer Discretionary | 21,324,940 | |
| Consumer Staples | 0.9% | ||
| Food Products | ||
| TreeHouse Foods, Inc. (a) | 62,227 | 2,644,025 |
| Total Consumer Staples | 2,644,025 | |
| Financials | 13.9% | ||
| Banks | ||
| Atlantic Union Bankshares Corp. | 138,192 | 4,552,044 |
| Cadence Bancorporation | 65,000 | 1,067,300 |
| Eastern Bankshares, Inc. (a) | 65,200 | 1,063,412 |
| FB Financial Corp. | 148,859 | 5,169,873 |
| Glacier Bancorp, Inc. | 178,216 | 8,199,718 |
| South State Corp. | 55,675 | 4,025,303 |
| Capital Markets | ||
| Virtu Financial, Inc., Class A | 101,443 | 2,553,320 |
| Consumer Finance | ||
| Encore Capital Group, Inc. (a) | 161,183 | 6,278,078 |
| Insurance | ||
| Kinsale Capital Group, Inc. | 34,426 | 6,889,676 |
| Total Financials | 39,798,724 | |
| Health Care | 26.8% | ||
| Biotechnology | ||
| Emergent BioSolutions Inc. (a) | 58,625 | 5,252,800 |
| Twist Bioscience Corp. (a) | 71,877 | 10,155,501 |
| Health Care Equipment & Supplies | ||
| Envista Holdings Corp. (a) | 98,000 | 3,305,540 |
| Integer Holdings Corp. (a) | 34,770 | 2,822,976 |
| NuVasive, Inc. (a) | 56,800 | 3,199,544 |
| STAAR Surgical Co. (a) | 117,036 | 9,271,592 |
| Health Care Providers & Services | ||
| AMN Healthcare Services, Inc. (a) | 86,687 | 5,916,388 |
| Common Stocks | 98.7% of portfolio (Continued) | ||
| Shares | Value | |
| Health Care | 26.8% (Continued) | ||
| LHC Group, Inc. (a) | 45,028 | $9,605,373 |
| Health Care Technology | ||
| Inovalon Holdings, Inc. (a) | 355,991 | 6,468,357 |
| Life Sciences Tools & Services | ||
| Medpace Holdings, Inc. (a) | 69,950 | 9,737,040 |
| NanoString Technologies, Inc. (a) | 144,153 | 9,640,953 |
| Pharmaceuticals | ||
| Aerie Pharmaceuticals, Inc. (a) | 119,638 | 1,616,309 |
| Total Health Care | 76,992,373 | |
| Industrials | 14.5% | ||
| Construction & Engineering | ||
| Comfort Systems USA, Inc. | 67,988 | 3,580,248 |
| Primoris Services Corp. | 194,098 | 5,359,046 |
| Electrical Equipment | ||
| EnerSys | 48,935 | 4,064,541 |
| Machinery | ||
| Barnes Group Inc. | 54,800 | 2,777,812 |
| Colfax Corp. (a) | 170,128 | 6,505,694 |
| Federal Signal Corp. | 125,594 | 4,165,953 |
| Road & Rail | ||
| Werner Enterprises, Inc. | 141,133 | 5,535,236 |
| Trading Companies & Distributors | ||
| Applied Industrial Technologies, Inc. | 124,326 | 9,696,185 |
| Total Industrials | 41,684,715 | |
| Information Technology | 22.3% | ||
| Electronic Equipment, Instruments & Components | ||
| Itron, Inc. (a) | 46,077 | 4,418,784 |
| Knowles Corp. (a) | 157,794 | 2,908,144 |
| IT Services | ||
| CACI International Inc., Class A (a) | 16,771 | 4,181,513 |
| CSG Systems International, Inc. | 30,170 | 1,359,762 |
| ManTech International Corp., Class A | 102,965 | 9,157,707 |
| Semiconductors & Semiconductor Equipment | ||
| Advanced Energy Industries, Inc. (a) | 61,562 | 5,969,667 |
| Diodes Inc. (a) | 61,486 | 4,334,763 |
| Software | ||
| Altair Engineering Inc. (a) | 98,477 | 5,729,392 |
| Descartes Systems Group Inc. (The) (a) | 129,170 | 7,553,861 |
| Five9, Inc. (a) | 39,188 | 6,834,387 |
| j2 Global, Inc. (a) | 65,126 | 6,362,159 |
| Verint Systems Inc. (a) | 77,226 | 5,188,043 |
| Total Information Technology | 63,998,182 | |
| Portfolio of Investments | The accompanying notes are an integral part of these financial statements. |
| Common Stocks | 98.7% of portfolio (Continued) | ||
| Shares | Value | |
| Materials | 7.4% | ||
| Chemicals | ||
| Avient Corp. | 263,527 | $10,614,868 |
| Ingevity Corp. (a) | 42,441 | 3,214,057 |
| Construction Materials | ||
| Summit Materials, Inc., Class A (a) | 362,768 | 7,284,381 |
| Total Materials | 21,113,306 | |
| Real Estate | 4.4% | ||
| Equity Real Estate Investment Trusts (REITs) | ||
| Community Healthcare Trust Inc. | 36,900 | 1,738,359 |
| Easterly Government Properties, Inc. | 195,411 | 4,426,059 |
| QTS Realty Trust, Inc. Class A | 105,078 | 6,502,227 |
| Total Real Estate | 12,666,645 | |
| Total Common Stocks | ||
| (Cost $193,556,197) | 283,521,285 | |
| Money Market Fund | 1.3% of portfolio | ||
| Shares | Value | |
| State Street Institutional U.S. Government Money Market Fund Premier Class, 0.03% (b) | 3,762,606 | $3,762,606 |
| Total Money Market Fund | ||
| (Cost $3,762,606) | 3,762,606 | |
| Total Investments in Securities | ||
| (Cost $197,318,803) | 100.0% | $287,283,891 | |
| (a) | Non-income producing. |
| (b) | 7-day yield at December 31, 2020. |
| The accompanying notes are an integral part of these financial statements. | Portfolio of Investments |
| Assets | Daily Income Fund | Short-Term Government Securities Fund | Short-Term Bond Fund |
| Investments in securities, at value (cost: $172,526,477, $89,455,261, $557,989,399, $91,322,612, $39,884,120, $536,754,977, $163,746,671, $59,586,933 and $197,318,803, respectively) | $172,526,477 | $90,776,158 | $566,887,257 |
| Foreign currency (cost $1) | — | — | — |
| Investment securities sold | — | 2,035,114 | 33,365,052 |
| Dividends, interest, and tax reclaims | 176,207 | 218,277 | 1,456,332 |
| Capital shares sold | 108,176 | 1,214 | 539,806 |
| Prepaid expenses | 23,135 | 13,428 | 53,074 |
| Due from RE Advisers | 3,754 | — | — |
| Total Assets | 172,837,749 | 93,044,191 | 602,301,521 |
| Liabilities | |||
| Investment securities purchased | — | 3,788,081 | 36,508,002 |
| Accrued expenses | 57,642 | 28,160 | 120,374 |
| Independent Director/Trustee's deferred compensation | 74,402 | 30,122 | 168,934 |
| Due to RE Advisers | — | 41,529 | 376,129 |
| Capital shares redeemed | 922,614 | 5,335 | 54,568 |
| Dividends | 22 | 1,014 | 12,492 |
| Total Liabilities | 1,054,680 | 3,894,241 | 37,240,499 |
| Net Assets | $171,783,069 | $89,149,950 | $565,061,022 |
| Net Assets Consist Of: | |||
| Distributable earnings (losses) | (74,403) | 1,190,086 | 11,037,445 |
| Paid-in-capital applicable to outstanding shares of 171,857,431, 16,859,082, 106,289,184, 17,114,062, 6,795,961, 19,644,418, 20,541,726, 8,446,026 and 10,101,893, respectively | 171,857,472 | 87,959,864 | 554,023,577 |
| Net Assets | $171,783,069 | $89,149,950 | $565,061,022 |
| Net Asset Value Per Share | $1.00 | $5.29 | $5.32 |
| Statements of Assets and Liabilities | The accompanying notes are an integral part of these financial statements. |
| Intermediate Bond Fund | Stock Index Fund | Value Fund | Growth Fund | International Equity Fund | Small-Company Stock Fund |
| $93,511,653 | $188,972,500 | $928,218,431 | $320,125,693 | $91,469,045 | $287,283,891 |
| — | — | — | — | 1 | — |
| 1,165,784 | 584,432 | — | 21,035 | — | — |
| 409,723 | — | 913,291 | 23,587 | 297,039 | 129,843 |
| 1,362 | 33,109 | 893,064 | 533,850 | 12,297 | 44,437 |
| 14,990 | 22,924 | 72,316 | 34,548 | 19,302 | 30,812 |
| — | — | — | — | — | — |
| 95,103,512 | 189,612,965 | 930,097,102 | 320,738,713 | 91,797,684 | 287,488,983 |
| 1,845,629 | — | — | 19,890 | 74,394 | — |
| 35,915 | 66,105 | 180,127 | 107,130 | 38,336 | 141,286 |
| 2,451 | 36,208 | 280,771 | 34,044 | 52,718 | 181,027 |
| 41,800 | 70,403 | 513,320 | 217,673 | 57,073 | 249,152 |
| 516,676 | 617,541 | 379,075 | 700,340 | 33,701 | 379,630 |
| 804 | — | — | — | — | — |
| 2,443,275 | 790,257 | 1,353,293 | 1,079,077 | 256,222 | 951,095 |
| $92,660,237 | $188,822,708 | $928,743,809 | $319,659,636 | $91,541,462 | $286,537,888 |
| 1,798,576 | 148,684,232 | 396,475,895 | 161,233,018 | 30,655,068 | 97,543,611 |
| 90,861,661 | 40,138,476 | 532,267,914 | 158,426,618 | 60,886,394 | 188,994,277 |
| $92,660,237 | $188,822,708 | $928,743,809 | $319,659,636 | $91,541,462 | $286,537,888 |
| $5.41 | $27.78 | $47.28 | $15.56 | $10.84 | $28.36 |
| The accompanying notes are an integral part of these financial statements. | Statements of Assets and Liabilities |
| Investment Income | Daily Income Fund | Short-Term Government Securities Fund | Short-Term Bond Fund |
| Interest | $964,900 | $1,021,526 | $9,273,069(a) |
| Dividends | — | — | — |
| Allocated from Master Portfolio | |||
| Dividends | — | — | — |
| Interest | — | — | — |
| Total Investment Income | 964,900 | 1,021,526 | 9,273,069 |
| Expenses | |||
| Management fees | 879,264 | 346,874 | 3,272,431 |
| Shareholder servicing fees | 155,548 | 77,482 | 173,665 |
| Custodian and accounting fees | 93,211 | 71,863 | 176,299 |
| Director, Trustee, and Board meeting expenses | 81,308 | 33,623 | 236,753 |
| Legal and audit fees | 75,766 | 33,074 | 203,382 |
| Registration fees | 31,719 | 23,771 | 41,208 |
| Printing and regulatory filings | 25,026 | 12,438 | 37,849 |
| Insurance | 8,958 | 3,748 | 27,241 |
| Communication | 8,131 | 3,876 | 12,604 |
| Other expenses | 10,996 | 18,895 | 66,548 |
| Administration fees | — | — | — |
| Allocated from Master Portfolio | — | — | — |
| Total Expenses | 1,369,927 | 625,644 | 4,247,980 |
| Less fees waived and/or expenses reimbursed by RE Advisers | (711,511) | (48,176) | — |
| Net Expenses | 658,416 | 577,468 | 4,247,980 |
| Net Investment Income (Loss) | 306,484 | 444,058 | 5,025,089 |
| Realized and Unrealized Gain (Loss) on Investments | |||
| Net realized gain on investments | — | 1,544,708 | 16,494,094 |
| Net change in unrealized apprecation (depreciation) | — | 1,019,892 | 6,236,279 |
| Net Gain (Loss) On Investments | — | 2,564,600 | 22,730,373 |
| Net Increase In Net Assets From Operations | $306,484 | $3,008,658 | $27,755,462 |
| (a) | Includes foreign tax withholding expense of $6,131 in Short-Term Bond, $31,964 in Value, $4,488 in Growth, and $139,478 in International Equity Funds. |
| (b) | Represents expenses allocated to the Fund by the S&P 500 Master Portfolio after expense reimbursements of $2,935. |
| (c) | Represents realized and unrealized gain on investments allocated from the Master Portfolio. |
| Statements of Operations | The accompanying notes are an integral part of these financial statements. |
| Intermediate Bond Fund | Stock Index Fund | Value Fund | Growth Fund | International Equity Fund | Small-Company Stock Fund |
| $1,146,873 | $— | $58,884 | $10,175 | $3,417 | $21,734 |
| 130 | — | 17,139,685(a) | 1,122,543(a) | 1,258,678(a) | 2,506,592 |
| — | 3,019,654 | — | — | — | — |
| — | 7,181 | — | — | — | — |
| 1,147,003 | 3,026,835 | 17,198,569 | 1,132,718 | 1,262,095 | 2,528,326 |
| 346,234 | — | 4,126,599 | 1,695,833 | 576,055 | 2,183,222 |
| 49,470 | 159,311 | 350,870 | 201,694 | 133,499 | 288,769 |
| 107,587 | 56,651 | 170,193 | 103,360 | 101,935 | 88,834 |
| 20,630 | 72,570 | 390,655 | 120,723 | 34,996 | 139,657 |
| 25,060 | 64,440 | 314,259 | 107,491 | 33,052 | 107,802 |
| 59,361 | 28,879 | 45,078 | 32,594 | 24,826 | 31,950 |
| 4,432 | 32,505 | 81,602 | 43,001 | 28,155 | 55,934 |
| 1,433 | 8,389 | 47,203 | 12,959 | 4,046 | 17,220 |
| 1,196 | 9,990 | 26,272 | 12,169 | 8,536 | 17,464 |
| 38,365 | 12,300 | 48,258 | 17,369 | 8,524 | 22,791 |
| — | 413,149 | — | — | — | — |
| — | 15,428(b) | — | — | — | — |
| 653,768 | 873,612 | 5,600,989 | 2,347,193 | 953,624 | 2,953,643 |
| (194,366) | — | — | — | (193,893) | — |
| 459,402 | 873,612 | 5,600,989 | 2,347,193 | 759,731 | 2,953,643 |
| 687,601 | 2,153,223 | 11,597,580 | (1,214,475) | 502,364 | (425,317) |
| 1,216,814 | 447,620(c) | 132,416,932 | 18,129,840 | 658,224 | 44,525,939 |
| 2,105,520 | 25,993,186(c) | (89,955,729) | 71,265,220 | 14,814,294 | 1,992,422 |
| 3,322,334 | 26,440,806 | 42,461,203 | 89,395,060 | 15,472,518 | 46,518,361 |
| $4,009,935 | $28,594,029 | $54,058,783 | $88,180,585 | $15,974,882 | $46,093,044 |
| The accompanying notes are an integral part of these financial statements. | Statements of Operations |
| Daily Income Fund | ||
| Year Ended December 31, 2020 | Year Ended December 31, 2019 | |
| Increase (Decrease) In Net Assets | ||
| Operations | ||
| Net investment income | $306,484 | $2,355,051 |
| Net realized gain on investments | — | — |
| Net change in unrealized appreciation (depreciation) | — | — |
| Increase in net assets from operations | 306,484 | 2,355,051 |
| Distributions to Shareholders | ||
| Distributions to shareholders | (311,702) | (2,360,611) |
| Total Distributions to shareholders | (311,702) | (2,360,611) |
| Capital Share Transactions | ||
| Net capital share transactions | 8,953,537 | (1,013,479) |
| Total increase (decrease) in net assets from capital transactions | 8,953,537 | (1,013,479) |
| Total Increase (Decrease) In Net Assets | 8,948,319 | (1,019,039) |
| Net Assets | ||
| Beginning of year | $162,834,750 | $163,853,789 |
| End of year | $171,783,069 | $162,834,750 |
| Statements of Changes in Net Assets | The accompanying notes are an integral part of these financial statements. |
| Short-Term Government Securities Fund | Short-Term Bond Fund | Intermediate Bond Fund | |||
| Year Ended December 31, 2020 | Year Ended December 31, 2019 | Year Ended December 31, 2020 | Year Ended December 31, 2019 | Year Ended December 31, 2020 | Since Inception December 31, 2019 |
| $444,058 | $1,130,343 | $5,025,089 | $10,411,224 | $687,601 | $138,679 |
| 1,544,708 | 359,731 | 16,494,094 | 5,060,226 | 1,216,814 | 108,114 |
| 1,019,892 | 861,300 | 6,236,279 | 5,694,771 | 2,105,520 | 83,521 |
| 3,008,658 | 2,351,374 | 27,755,462 | 21,166,221 | 4,009,935 | 330,314 |
| (2,136,655) | (1,441,910) | (19,849,328) | (14,850,051) | (2,215,449) | (327,462) |
| (2,136,655) | (1,441,910) | (19,849,328) | (14,850,051) | (2,215,449) | (327,462) |
| 16,762,309 | (6,312,013) | 8,843,177 | (20,036,998) | 67,021,192 | 23,841,707 |
| 16,762,309 | (6,312,013) | 8,843,177 | (20,036,998) | 67,021,192 | 23,841,707 |
| 17,634,312 | (5,402,549) | 16,749,311 | (13,720,828) | 68,815,678 | 23,844,559 |
| $71,515,638 | $76,918,187 | $548,311,711 | $562,032,539 | $23,844,559 | $— |
| $89,149,950 | $71,515,638 | $565,061,022 | $548,311,711 | $92,660,237 | $23,844,559 |
| The accompanying notes are an integral part of these financial statements. | Statements of Changes in Net Assets |
| Stock Index Fund | ||
| Year Ended December 31, 2020 | Year Ended December 31, 2019 | |
| Increase (Decrease) In Net Assets | ||
| Operations | ||
| Net investment income | $2,153,223 | $2,130,742 |
| Net realized gain on investments | 447,620 | 841,781 |
| Net change in unrealized appreciation (depreciation) | 25,993,186 | 37,525,793 |
| Increase in net assets from operations | 28,594,029 | 40,498,316 |
| Distributions to Shareholders | ||
| Distributions to shareholders | (2,658,345) | (3,333,711) |
| Total Distributions to shareholders | (2,658,345) | (3,333,711) |
| Capital Share Transactions | ||
| Net capital share transactions | (8,064,248) | (147,519) |
| Total increase (decrease) in net assets from capital transactions | (8,064,248) | (147,519) |
| Total Increase (Decrease) In Net Assets | 17,871,436 | 37,017,086 |
| Net Assets | ||
| Beginning of year | $170,951,272 | $133,934,186 |
| End of year | $188,822,708 | $170,951,272 |
| Statements of Changes in Net Assets | The accompanying notes are an integral part of these financial statements. |
| Value Fund | Growth Fund | International Equity Fund | |||
| Year Ended December 31, 2020 | Year Ended December 31, 2019 | Year Ended December 31, 2020 | Year Ended December 31, 2019 | Year Ended December 31, 2020 | Year Ended December 31, 2019 |
| $11,597,580 | $14,376,369 | $(1,214,475) | $(312,429) | $502,364 | $943,527 |
| 132,416,932 | 137,873,648 | 18,129,840 | 14,030,244 | 658,224 | 3,272,569 |
| (89,955,729) | 76,986,017 | 71,265,220 | 40,898,938 | 14,814,294 | 11,841,604 |
| 54,058,783 | 229,236,034 | 88,180,585 | 54,616,753 | 15,974,882 | 16,057,700 |
| (136,377,946) | (135,337,648) | (14,345,568) | (12,506,704) | (552,126) | (841,645) |
| (136,377,946) | (135,337,648) | (14,345,568) | (12,506,704) | (552,126) | (841,645) |
| 18,955,139 | 22,943,471 | 2,276,767 | 6,970,674 | (2,656,559) | (2,522,666) |
| 18,955,139 | 22,943,471 | 2,276,767 | 6,970,674 | (2,656,559) | (2,522,666) |
| (63,364,024) | 116,841,857 | 76,111,784 | 49,080,723 | 12,766,197 | 12,693,389 |
| $992,107,833 | $875,265,976 | $243,547,852 | $194,467,129 | $78,775,265 | $66,081,876 |
| $928,743,809 | $992,107,833 | $319,659,636 | $243,547,852 | $91,541,462 | $78,775,265 |
| The accompanying notes are an integral part of these financial statements. | Statements of Changes in Net Assets |
| Small-Company Stock Fund | ||
| Year Ended December 31, 2020 | Year Ended December 31, 2019 | |
| Increase (Decrease) In Net Assets | ||
| Operations | ||
| Net investment income | $(425,317) | $2,287,266 |
| Net realized gain on investments | 44,525,939 | 38,451,396 |
| Net change in unrealized appreciation (depreciation) | 1,992,422 | 52,318,099 |
| Increase in net assets from operations | 46,093,044 | 93,056,761 |
| Distributions to Shareholders | ||
| Distributions to shareholders | (33,366,323) | (65,351,838) |
| Total Distributions to shareholders | (33,366,323) | (65,351,838) |
| Capital Share Transactions | ||
| Net capital share transactions | (58,639,010) | (182,247,316) |
| Total increase (decrease) in net assets from capital transactions | (58,639,010) | (182,247,316) |
| Total Increase (Decrease) In Net Assets | (45,912,289) | (154,542,393) |
| Net Assets | ||
| Beginning of year | $332,450,177 | $486,992,570 |
| End of year | $286,537,888 | $332,450,177 |
| Statements of Changes in Net Assets | The accompanying notes are an integral part of these financial statements. |
| Year Ended December 31, | |||||
| For a Share Outstanding Throughout Each Year | 2020 | 2019 | 2018 | 2017 | 2016 |
| Net Asset Value, Beginning of Year | $1.00 | $1.00 | $1.00 | $1.00 | $1.00 |
| Income from investment operations | |||||
| Net investment income | -—(a,b,c) | 0.01 | 0.01 | -—(a,b,c) | —(a,b,c) |
| Net realized and unrealized gain (loss) on investments | — | — | — | — | — |
| Total from investment operations | —(a,c) | 0.01 | 0.01 | —(a,c) | —(a,c) |
| Distributions | |||||
| Net investment income | —(c) | (0.01) | (0.01) | —(c) | —(c) |
| Net realized gain | — | — | — | — | — |
| Total distributions | —(a,c) | (0.01) | (0.01) | —(a,c) | —(a,c) |
| Net Asset Value, End of Year | $1.00 | $1.00 | $1.00 | $1.00 | $1.00 |
| Total Return | 0.19% | 1.43% | 1.08% | 0.18% | 0.01% |
| Ratios/Supplemental Data | |||||
| Net assets, end of year (thousands) | $171,783 | $162,835 | $163,854 | $173,927 | $195,858 |
| Ratio of net investment income to average net assets | 0.17%(a,b) | 1.42% | 1.07% | 0.17%(a,b) | 0.00%(a,b,d) |
| Ratio of gross expenses before voluntary expense limitation to average net assets | 0.78% | 0.78% | 0.74% | 0.71% | 0.71% |
| Ratio of expenses to average net assets | 0.37%(a,b) | 0.78% | 0.74% | 0.66%(a,b) | 0.37%(a,b) |
| (a) | Effective August 14, 2009, RE Advisers agreed to waive fees and/or reimburse expenses to the extent necessary to assist the Fund in attempting to maintain a positive yield. The temporary waiver continued through May 11, 2017 and was reinstated on April 20, 2020. |
| (b) | Excludes excess investment management fees and other expenses voluntarily waived and reimbursed by RE Advisers. |
| (c) | Less than $0.01 per share. |
| (d) | Less than 0.01%. |
| The accompanying notes are an integral part of these financial statements. | Financial Highlights |
| Year Ended December 31, | |||||
| For a Share Outstanding Throughout Each Year | 2020 | 2019 | 2018 | 2017 | 2016 |
| Net Asset Value, Beginning of Year | $5.21 | $5.14 | $5.15 | $5.16 | $5.18 |
| Income from investment operations | |||||
| Net investment income | 0.03 | 0.08 | 0.07 | 0.05 | 0.04 |
| Net realized and unrealized gain (loss) on investments | 0.18 | 0.09 | (0.01) | (0.01) | (0.02) |
| Total from investment operations | 0.21 | 0.17 | 0.06 | 0.04 | 0.02 |
| Distributions | |||||
| Net investment income | (0.03) | (0.08) | (0.07) | (0.05) | (0.04) |
| Net realized gain | (0.10) | (0.02) | —(a) | —(a) | —(a) |
| Total distributions | (0.13) | (0.10) | (0.07) | (0.05) | (0.04) |
| Net Asset Value, End of Year | $5.29 | $5.21 | $5.14 | $5.15 | $5.16 |
| Total Return | 4.13% | 3.36% | 1.20% | 0.87% | 0.45% |
| Ratios/Supplemental Data | |||||
| Net assets, end of year (thousands) | $89,150 | $71,516 | $76,918 | $75,425 | $73,108 |
| Ratio of net investment income to average net assets | 0.58%(b) | 1.52%(b) | 1.37%(b) | 1.02%(b) | 0.81%(b) |
| Ratio of gross expenses before expense limitation to average net assets | 0.81% | 0.85% | 0.82% | 0.81% | 0.78% |
| Ratio of expenses to average net assets | 0.75%(b) | 0.75%(b) | 0.75%(b) | 0.75%(b) | 0.75%(b) |
| Portfolio turnover rate | 299%(c) | 237%(c,d) | 40% | 33% | 26% |
| (a) | Less than $0.01 per share. |
| (b) | Excludes expenses in excess of a 0.75% contractual expense limitation with RE Advisers, in effect through April 30, 2021. |
| (c) | Rate includes purchases and sales of long-term U.S. Treasury Bonds. |
| (d) | The change in portfolio turnover from 2018 to 2019 is due to a repositioning of the Fund as a result of market activities. |
| Financial Highlights | The accompanying notes are an integral part of these financial statements. |
| Year Ended December 31, | |||||
| For a Share Outstanding Throughout Each Year | 2020 | 2019 | 2018 | 2017 | 2016 |
| Net Asset Value, Beginning of Year | $5.23 | $5.17 | $5.19 | $5.19 | $5.18 |
| Income from investment operations | |||||
| Net investment income | 0.05 | 0.10 | 0.10 | 0.08 | 0.08 |
| Net realized and unrealized gain (loss) on investments | 0.23 | 0.10 | (0.02) | —(a) | 0.01 |
| Total from investment operations | 0.28 | 0.20 | 0.08 | 0.08 | 0.09 |
| Distributions | |||||
| Net investment income | (0.05) | (0.10) | (0.10) | (0.08) | (0.08) |
| Net realized gain | (0.14) | (0.04) | —(a) | —(a) | — |
| Total distributions | (0.19) | (0.14) | (0.10) | (0.08) | (0.08) |
| Net Asset Value, End of Year | $5.32 | $5.23 | $5.17 | $5.19 | $5.19 |
| Total Return | 5.42% | 3.90% | 1.69% | 1.65% | 1.75% |
| Ratios/Supplemental Data | |||||
| Net assets, end of year (thousands) | $565,061 | $548,312 | $562,033 | $550,242 | $541,014 |
| Ratio of net investment income to average net assets | 0.92% | 1.87% | 2.02% | 1.59% | 1.49% |
| Ratio of expenses to average net assets | 0.78% | 0.79% | 0.77% | 0.76% | 0.76% |
| Portfolio turnover rate | 328%(b) | 276%(b,c) | 39% | 32% | 31% |
| (a) | Less than $0.01 per share. |
| (b) | Rate includes purchases and sales of long-term U.S. Treasury Bonds. |
| (c) | The change in portfolio turnover from 2018 to 2019 is due to a repositioning of the Fund as a result of market activities. |
| The accompanying notes are an integral part of these financial statements. | Financial Highlights |
| Year Ended December 31, | Since Inception May 1, 2019 to December 31 , | |
| For a Share Outstanding Throughout the Period | 2020 | 2019 |
| Net Asset Value, Beginning of Period | $5.13 | $5.00 |
| Income from investment operations | ||
| Net investment income | 0.08 | 0.06 |
| Net realized and unrealized gain (loss) on investments | 0.36 | 0.17 |
| Total from investment operations | 0.44 | 0.23 |
| Distributions | ||
| Net investment income | (0.08) | (0.06) |
| Net realized gain | (0.08) | (0.04) |
| Total distributions | (0.16) | (0.10) |
| Net Asset Value, End of Period | $5.41 | $5.13 |
| Total Return | 8.70% | 4.69%(a) |
| Ratios/Supplemental Data | ||
| Net assets, end of year (thousands) | $92,660 | $23,845 |
| Ratio of net investment income to average net assets | 1.19%(b) | 1.69%(b,c) |
| Ratio of gross expenses before expense limitation to average net assets | 1.13% | 2.49%(c) |
| Ratio of expenses to average net assets | 0.80%(b) | 0.80%(b,c) |
| Portfolio turnover rate | 359%(d) | 395%(d) |
| (a) | Aggregate total return for the period. |
| (b) | Excludes expenses in excess of a 0.80% contractual expense limitation with RE Advisers, in effect through April 30, 2021. |
| (c) | Annualized. |
| (d) | Rate includes purchases and sales of long-term U.S. Treasury Bonds. |
| Financial Highlights | The accompanying notes are an integral part of these financial statements. |
| Year Ended December 31, | |||||
| For a Share Outstanding Throughout Each Year | 2020 | 2019 | 2018 | 2017 | 2016 |
| Net Asset Value, Beginning of Year | $23.93 | $18.67 | $20.02 | $16.67 | $15.20 |
| Income from investment operations | |||||
| Net investment income | 0.32 | 0.34 | 0.32 | 0.27 | 0.25 |
| Net realized and unrealized gain (loss) on investments | 3.92 | 5.39 | (1.30) | 3.26 | 1.47 |
| Total from investment operations | 4.24 | 5.73 | (0.98) | 3.53 | 1.72 |
| Distributions | |||||
| Net investment income | (0.31) | (0.38) | (0.37) | (0.18) | (0.25) |
| Net realized gain | (0.08) | (0.09) | — | — | — |
| Total distributions | (0.39) | (0.47) | (0.37) | (0.18) | (0.25) |
| Net Asset Value, End of Year | $27.78 | $23.93 | $18.67 | $20.02 | $16.67 |
| Total Return | 17.80% | 30.77% | -4.95% | 21.16% | 11.33% |
| Ratios/Supplemental Data | |||||
| Net assets, end of year (thousands) | $188,823 | $170,951 | $133,934 | $145,094 | $123,039 |
| Ratio of net investment income to average net assets | 1.30% | 1.39% | 1.39% | 1.42% | 1.57% |
| Ratio of expenses to average net assets | 0.53% | 0.59% | 0.56% | 0.55% | 0.58% |
| Portfolio turnover rate (a) | N/A | N/A | N/A | N/A | N/A |
| (a) | Substantially all of the assets of the Stock Index Fund are invested in the S&P 500 Index Master Portfolio managed by BlackRock Fund Advisors. Please refer to the financial highlights in the Appendix for the portfolio turnover rate of the S&P 500 Index Master Portfolio. |
| The accompanying notes are an integral part of these financial statements. | Financial Highlights |
| Year Ended December 31, | |||||
| For a Share Outstanding Throughout Each Year | 2020 | 2019 | 2018 | 2017 | 2016 |
| Net Asset Value, Beginning of Year | $51.51 | $46.64 | $55.26 | $47.70 | $46.77 |
| Income from investment operations | |||||
| Net investment income | 0.66 | 0.83 | 0.91 | 1.00 | 1.10 |
| Net realized and unrealized gain (loss) on investments | 2.94 | 11.93 | (4.39) | 9.52 | 4.60 |
| Total from investment operations | 3.60 | 12.76 | (3.48) | 10.52 | 5.70 |
| Distributions | |||||
| Net investment income | (0.66) | (0.83) | (0.91) | (1.00) | (1.10) |
| Net realized gain | (7.17) | (7.06) | (4.23) | (1.96) | (3.67) |
| Total distributions | (7.83) | (7.89) | (5.14) | (2.96) | (4.77) |
| Net Asset Value, End of Year | $47.28 | $51.51 | $46.64 | $55.26 | $47.70 |
| Total Return | 7.61% | 27.69% | -6.36% | 22.17% | 12.26% |
| Ratios/Supplemental Data | |||||
| Net assets, end of year (thousands) | $928,744 | $992,108 | $875,266 | $1,118,709 | $955,828 |
| Ratio of net investment income to average net assets | 1.35% | 1.53% | 1.55% | 1.92% | 2.26% |
| Ratio of expenses to average net assets | 0.65% | 0.66% | 0.60% | 0.60% | 0.62% |
| Portfolio turnover rate | 22% | 17%(a) | 1% | 7% | 9% |
| (a) | The change in portfolio turnover from 2018 to 2019 is due to a repositioning of the Fund as a result of market activities. |
| Financial Highlights | The accompanying notes are an integral part of these financial statements. |
| Year Ended December 31, | |||||
| For a Share Outstanding Throughout Each Year | 2020 | 2019 | 2018 | 2017 | 2016 |
| Net Asset Value, Beginning of Year | $11.78 | $9.68 | $10.36 | $8.07 | $8.00 |
| Income from investment operations | |||||
| Net investment income | -— | -— | 0.02 | -— | — |
| Net realized and unrealized gain (loss) on investments | 4.52 | 2.73 | 0.41 | 3.04 | 0.19 |
| Total from investment operations | 4.52 | 2.73 | 0.43 | 3.04 | 0.19 |
| Distributions | |||||
| Net investment income | — | — | (0.02) | — | — |
| Net realized gain | (0.74) | (0.63) | (1.09) | (0.75) | (0.12) |
| Total distributions | (0.74) | (0.63) | (1.11) | (0.75) | (0.12) |
| Net Asset Value, End of Year | $15.56 | $11.78 | $9.68 | $10.36 | $8.07 |
| Total Return | 38.65% | 28.36% | 3.96% | 37.68% | 2.54% |
| Ratios/Supplemental Data | |||||
| Net assets, end of year (thousands) | $319,660 | $243,548 | $194,467 | $178,020 | $117,281 |
| Ratio of net investment income (loss) to average net assets | (0.46)% | (0.14)% | 0.14% | (0.12)% | (0.14)%(a) |
| Ratio of gross expenses before expense limitation to average net assets | 0.89% | 0.93% | 0.86% | 0.93% | 0.98% |
| Ratio of expenses to average net assets | 0.89% | 0.93% | 0.86% | 0.93% | 0.95%(a) |
| Portfolio turnover rate | 23% | 29% | 34% | 37% | 39% |
| (a) | Excludes expenses in excess of a 0.95% contractual expense limitation with RE Advisers, in effect through April 30, 2021. |
| The accompanying notes are an integral part of these financial statements. | Financial Highlights |
| Year Ended December 31, | |||||
| For a Share Outstanding Throughout Each Year | 2020 | 2019 | 2018 | 2017 | 2016 |
| Net Asset Value, Beginning of Year | $8.99 | $7.28 | $8.49 | $6.69 | $6.44 |
| Income from investment operations | |||||
| Net investment income | 0.06 | 0.12 | 0.12 | 0.08 | 0.07 |
| Net realized and unrealized gain (loss) on investments | 1.86 | 1.69 | (1.20) | 1.80 | 0.24 |
| Total from investment operations | 1.92 | 1.81 | (1.08) | 1.88 | 0.31 |
| Distributions | |||||
| Net investment income | (0.07) | (0.10) | (0.13) | (0.08) | (0.06) |
| Net realized gain | — | — | — | — | — |
| Total distributions | (0.07) | (0.10) | (0.13) | (0.08) | (0.06) |
| Net Asset Value, End of Year | $10.84 | $8.99 | $7.28 | $8.49 | $6.69 |
| Total Return | 21.34% | 24.83% | -12.74% | 28.12% | 4.85% |
| Ratios/Supplemental Data | |||||
| Net assets, end of year (thousands) | $91,541 | $78,775 | $66,082 | $74,138 | $53,974 |
| Ratio of net investment income to average net assets | 0.65%(a) | 1.29%(a) | 1.39%(a) | 1.03%(a) | 1.22%(a,b) |
| Ratio of gross expenses before voluntary expense limitation to average net assets | 1.24% | 1.30% | 1.23% | 1.25% | 1.46% |
| Ratio of expenses to average net assets | 0.99%(a) | 0.99%(a) | 0.99%(a) | 0.99%(a) | 0.97%(a,b) |
| Portfolio turnover rate | 15% | 27% | 16% | 11% | 112%(c) |
| (a) | Excludes expenses in excess of a 0.99% contractual expense limitation with RE Advisers, in effect through April 30, 2021. |
| (b) | RE Advisers waived additional management fees equal to the difference between the fee that would have been paid to the previous subadviser, Mercator and the fee paid to SSgA Funds Management Inc., beginning September 7, 2015 through January 14, 2016, the period in which SSgA Funds Management Inc. was subadviser. |
| (c) | Unusually high due to change in strategy and subadviser on January 15, 2016. |
| Financial Highlights | The accompanying notes are an integral part of these financial statements. |
| Year Ended December 31, | |||||
| For a Share Outstanding Throughout Each Year | 2020 | 2019 | 2018 | 2017 | 2016 |
| Net Asset Value, Beginning of Year | $26.25 | $25.57 | $44.11 | $41.13 | $35.45 |
| Income from investment operations | |||||
| Net investment income | (—) | 0.18 | 0.15 | 0.08 | 0.14 |
| Net realized and unrealized gain (loss) on investments | 5.70 | 5.42 | (11.45) | 4.86 | 6.55 |
| Total from investment operations | 5.70 | 5.60 | (11.30) | 4.94 | 6.69 |
| Distributions | |||||
| Net investment income | —(a) | (0.18) | (0.15) | (0.08) | (0.14) |
| Net realized gain | (3.59) | (4.74) | (7.09) | (1.88) | (0.87) |
| Total distributions | (3.59) | (4.92) | (7.24) | (1.96) | (1.01) |
| Net Asset Value, End of Year | $28.36 | $26.25 | $25.57 | $44.11 | $41.13 |
| Total Return | 22.08% | 22.16% | -26.18% | 11.99% | 18.85% |
| Ratios/Supplemental Data | |||||
| Net assets, end of year (thousands) | $286,538 | $332,450 | $486,993 | $1,277,434 | $1,322,218 |
| Ratio of net investment income (loss) to average net assets | (0.16)% | 0.54% | 0.26% | 0.14% | 0.34% |
| Ratio of expenses to average net assets | 1.12% | 1.05% | 0.90% | 0.88% | 0.89% |
| Portfolio turnover rate | 18% | 38% | 5% | 7% | 14% |
| (a) | Less than $0.01 per share. |
| The accompanying notes are an integral part of these financial statements. | Financial Highlights |
| Notes to Financial Statements |
| Daily Income Fund | Level 1 | Level 2 | Level 3 | Total |
| U.S. Government & Agency Obligations | $ — | $141,718,270 | $ — | $141,718,270 |
| Money Market Fund | 30,808,207 | — | — | 30,808,207 |
| Total | $30,808,207 | $141,718,270 | $ — | $172,526,477 |
| Notes to Financial Statements |
| Short-Term Government Securities Fund | Level 1 | Level 2 | Level 3 | Total |
| Corporate Bonds Guaranteed by Export-Import Bank of the United States | $ — | $47,879,685 | $ — | $47,879,685 |
| U.S. Government & Agency Obligations | — | 33,620,060 | — | 33,620,060 |
| Corporate Bonds–Other | — | 2,193,679 | — | 2,193,679 |
| Asset-Backed Securities | — | 2,158,518 | — | 2,158,518 |
| Municipal Bonds | — | 1,867,398 | — | 1,867,398 |
| Money Market Fund | 3,056,818 | — | — | 3,056,818 |
| Total | $3,056,818 | $87,719,340 | $ — | $90,776,158 |
| Short-Term Bond Fund | ||||
| U.S. Government & Agency Obligations | $ — | $208,482,102 | $ — | $208,482,102 |
| Corporate Bonds–Other | — | 193,792,558 | — | 193,792,558 |
| Asset-Backed Securities | — | 60,230,364 | — | 60,230,364 |
| Yankee Bonds | — | 56,987,450 | — | 56,987,450 |
| Municipal Bonds | — | 19,324,277 | — | 19,324,277 |
| Corporate Bonds Guaranteed by Export-Import Bank of the United States | — | 16,744,068 | — | 16,744,068 |
| Mortgage-Backed Securities | — | 4,068 | — | 4,068 |
| Money Market Fund | 11,322,370 | — | — | 11,322,370 |
| Total | $11,322,370 | $555,564,887 | $ — | $566,887,257 |
| Intermediate Bond Fund | ||||
| Corporate Bonds–Other | $ — | $36,544,067 | $ — | $36,544,067 |
| Mortgage-Backed Securities | — | 16,273,673 | — | 16,273,673 |
| U.S. Government & Agency Obligations | — | 13,003,687 | — | 13,003,687 |
| Asset-Backed Securities | — | 10,546,879 | — | 10,546,879 |
| Yankee Bonds | — | 8,551,050 | — | 8,551,050 |
| Municipal Bonds | — | 3,765,993 | — | 3,765,993 |
| Corporate Bond Guaranteed by Export-Import Bank of the United States | — | 322,275 | — | 322,275 |
| Money Market Fund | 4,504,029 | — | — | 4,504,029 |
| Total | $4,504,029 | $89,007,624 | $ — | $93,511,653 |
| Value Fund | ||||
| Common Stocks | $914,528,100 | $ — | $ — | $914,528,100 |
| Money Market Fund | 13,690,331 | — | — | 13,690,331 |
| Total | $928,218,431 | $ — | $ — | $928,218,431 |
| Growth Fund | ||||
| Common Stocks | $318,119,062 | $ — | $ — | $318,119,062 |
| Money Market Fund | 2,006,631 | — | — | 2,006,631 |
| Total | $320,125,693 | $ — | $ — | $320,125,693 |
| International Equity Fund | ||||
| Common Stocks | $12,649,997 | $73,719,108 | $ — | $86,369,105 |
| Preferred Stocks | 455,867 | 1,467,205 | — | 1,923,072 |
| Money Market Fund | 3,176,868 | — | — | 3,176,868 |
| Total | $16,282,732 | $75,186,313 | $ — | $91,469,045 |
| Small-Company Stock Fund | ||||
| Common Stocks | $283,521,285 | $ — | $ — | $283,521,285 |
| Money Market Fund | 3,762,606 | — | — | 3,762,606 |
| Total | $287,283,891 | $ — | $ — | $287,283,891 |
| Notes to Financial Statements |
| Notes to Financial Statements |
| Distributable Earnings (Losses) | Paid in Capital | |
| Daily Income Fund | $— | $— |
| Short-Term Gov. Securities Fund | $— | $— |
| Short-Term Bond Fund | $— | $— |
| Intermediate Bond Fund | $1,238 | $(1,238) |
| Stock Index Fund | $4,225 | $(4,225) |
| Value Fund | $(17,252,352) | $17,252,352 |
| Growth Fund | $— | $— |
| International Equity Fund | $— | $— |
| Small-Company Stock Fund | $(6,339,497) | $6,339,497 |
| Ordinary Income | Long-Term Gain | Return of Capital | Total Distributions | |
| Daily Income Fund | $311,702 | $— | $— | $311,702 |
| Short-Term Gov. Securities Fund | $1,659,674 | $476,981 | $— | $2,136,655 |
| Short-Term Bond Fund | $17,675,090 | $2,174,238 | $— | $19,849,328 |
| Intermediate Bond Fund | $2,215,449 | $— | $— | $2,215,449 |
| Stock Index Fund | $2,146,140 | $512,205 | $— | $2,658,345 |
| Value Fund | $11,542,273 | $124,835,673 | $— | $136,377,946 |
| Growth Fund | $1,461,359 | $12,884,209 | $— | $14,345,568 |
| International Equity Fund | $552,126 | $— | $— | $552,126 |
| Small-Company Stock Fund | $3,064 | $33,363,259 | $— | $33,366,323 |
| Ordinary Income | Long-Term Gain | Return of Capital | Total Distributions | |
| Daily Income Fund | $2,360,611 | $— | $— | $2,360,611 |
| Short-Term Gov. Securities Fund | $1,441,910 | $— | $— | $1,441,910 |
| Short-Term Bond Fund | $14,850,051 | $— | $— | $14,850,051 |
| Intermediate Bond Fund | $327,462 | $— | $— | $327,462 |
| Stock Index Fund | $3,204,130 | $129,581 | $— | $3,333,711 |
| Value Fund | $14,340,909 | $120,996,739 | $— | $135,337,648 |
| Growth Fund | $— | $12,506,704 | $— | $12,506,704 |
| International Equity Fund | $841,645 | $— | $— | $841,645 |
| Small-Company Stock Fund | $2,225,699 | $63,126,139 | $— | $65,351,838 |
| Notes to Financial Statements |
| Undistributed Ordinary Income | Undistributed Long-Term Gain | Net Unrealized Appreciation/ Depreciation | Capital Loss Carryforward/ Late Year Loss Deferral | Other Book/Tax Differences | Total Distributable Earnings (Losses) | |
| Daily Income Fund | $— | $— | $— | $— | $(74,403) | $(74,403) |
| Short-Term Gov. Securities Fund | $2,416 | $— | $1,320,897 | $(103,107) | $(30,120) | $1,190,086 |
| Short-Term Bond Fund | $2,206,595 | $101,927 | $8,897,858 | $— | $(168,935) | $11,037,445 |
| Intermediate Bond Fund | $— | $— | $2,176,141 | $(374,311) | $(3,254) | $1,798,576 |
| Stock Index Fund | $556,163 | $— | $146,992,679 | $— | $1,135,390 | $148,684,232 |
| Value Fund | $98,140 | $5,534,310 | $391,124,217 | $— | $(280,772) | $396,475,895 |
| Growth Fund | $1,326,960 | $3,807,920 | $156,132,185 | $— | $(34,047) | $161,233,018 |
| International Equity Fund | $43,855 | $— | $31,844,658 | $(1,180,728) | $(52,717) | $30,655,068 |
| Small-Company Stock Fund | $1,315,846 | $6,512,217 | $89,896,575 | $— | $(181,027) | $97,543,611 |
| Tax Cost | Tax Appreciation | Tax Depreciation | Net Tax Appreciation (Depreciation) | |
| Daily Income Fund | $172,526,477 | $— | $— | $— |
| Short-Term Gov. Securities Fund | $89,455,261 | $1,329,268 | $(8,371) | $1,320,897 |
| Short-Term Bond Fund | $557,989,399 | $8,956,044 | $(58,186) | $8,897,858 |
| Intermediate Bond Fund | $91,335,512 | $2,220,968 | $(44,827) | $2,176,141 |
| Value Fund | $537,094,214 | $402,693,843 | $(11,569,626) | $391,124,217 |
| Growth Fund | $163,993,509 | $156,196,784 | $(64,600) | $156,132,184 |
| International Equity Fund | $59,645,701 | $33,107,545 | $(1,284,201) | $31,823,344 |
| Small-Company Stock Fund | $197,387,316 | $93,746,184 | $(3,849,609) | $89,896,575 |
| Purchases | Proceeds from Sale | |
| Short-Term Gov. Securities Fund | $41,885,423 | $13,704,720 |
| Short-Term Bond Fund | $434,375,605 | $303,493,515 |
| Intermediate Bond Fund | $114,752,310 | $55,091,767 |
| Value Fund | $187,707,555 | $299,912,929 |
| Growth Fund | $60,047,801 | $72,910,800 |
| International Equity Fund | $11,034,395 | $15,430,907 |
| Small-Company Stock Fund | $46,169,128 | $137,987,671 |
| Notes to Financial Statements |
| Purchases | Proceeds from Sale | |
| Short-Term Gov. Securities Fund | $198,498,172 | $211,573,472 |
| Short-Term Bond Fund | $1,302,240,983 | $1,443,488,102 |
| Intermediate Bond Fund | $144,860,837 | $141,959,829 |
| Notes to Financial Statements |
| Shares Sold | Shares Issued In Reinvestment of Dividends | Total Shares Issued | Total Shares Redeemed | Net Increase (Decrease) | |
| Year Ended December 31, 2020 | |||||
| In Dollars | |||||
| Daily Income Fund | $131,829,694 | $308,816 | $132,138,510 | $(123,184,973) | $8,953,537 |
| Short-Term Government Securities Fund | $32,509,433 | $2,053,370 | $34,562,803 | $(17,800,494) | $16,762,309 |
| Short-Term Bond Fund | $119,224,544 | $19,376,890 | $138,601,434 | $(129,758,257) | $8,843,177 |
| Intermediate Bond Fund | $74,315,951 | $2,205,802 | $76,521,753 | $(9,500,561) | $67,021,192 |
| Stock Index Fund | $23,233,086 | $2,633,355 | $25,866,441 | $(33,930,689) | $(8,064,248) |
| Value Fund | $67,011,750 | $134,232,075 | $201,243,825 | $(182,288,686) | $18,955,139 |
| Growth Fund | $55,331,449 | $14,235,123 | $69,566,572 | $(67,289,805) | $2,276,767 |
| International Equity Fund | $10,427,226 | $546,196 | $10,973,422 | $(13,629,981) | $(2,656,559) |
| Small-Company Stock Fund | $15,156,853 | $33,027,545 | $48,184,398 | $(106,823,408) | $(58,639,010) |
| In Shares | |||||
| Daily Income Fund | 131,829,694 | 308,816 | 132,138,510 | (123,184,973) | 8,953,537 |
| Short-Term Government Securities Fund | 6,070,408 | 387,426 | 6,457,834 | (3,336,901) | 3,120,933 |
| Short-Term Bond Fund | 22,168,547 | 3,637,973 | 25,806,520 | (24,310,767) | 1,495,753 |
| Intermediate Bond Fund | 13,844,395 | 408,603 | 14,252,998 | (1,788,809) | 12,464,189 |
| Stock Index Fund | 992,479 | 99,236 | 1,091,715 | (1,439,735) | (348,020) |
| Value Fund | 1,470,048 | 2,894,042 | 4,364,090 | (3,981,817) | 382,273 |
| Growth Fund | 4,228,327 | 952,121 | 5,180,448 | (5,315,850) | (135,402) |
| International Equity Fund | 1,185,487 | 52,889 | 1,238,376 | (1,555,093) | (316,717) |
| Small-Company Stock Fund | 615,266 | 1,182,565 | 1,797,831 | (4,361,324) | (2,563,493) |
| Notes to Financial Statements |
| Shares Sold | Shares Issued In Reinvestment of Dividends | Total Shares Issued | Total Shares Redeemed | Net Increase (Decrease) | |
| Year Ended December 31, 2019 | |||||
| In Dollars | |||||
| Daily Income Fund | $91,086,706 | $2,336,618 | $93,423,324 | $(94,436,803) | $(1,013,479) |
| Short-Term Government Securities Fund | $4,833,516 | $1,424,511 | $6,258,027 | $(12,570,040) | $(6,312,013) |
| Short-Term Bond Fund | $56,684,029 | $14,583,306 | $71,267,335 | $(91,304,333) | $(20,036,998) |
| Intermediate Bond Fund | $23,899,853 | $327,117 | $24,226,970 | $(385,263) | $23,841,707 |
| Stock Index Fund | $17,527,067 | $3,303,467 | $20,830,534 | $(20,978,053) | $(147,519) |
| Value Fund | $48,837,566 | $131,515,248 | $180,352,814 | $(157,409,343) | $22,943,471 |
| Growth Fund | $36,189,129 | $12,427,196 | $48,616,325 | $(41,645,651) | $6,970,674 |
| International Equity Fund | $5,229,301 | $831,804 | $6,061,105 | $(8,583,771) | $(2,522,666) |
| Small-Company Stock Fund | $35,434,305 | $64,691,901 | $100,126,206 | $(282,373,522) | $(182,247,316) |
| In Shares | |||||
| Daily Income Fund | 91,086,706 | 2,336,618 | 93,423,324 | (94,436,803) | (1,013,479) |
| Short-Term Government Securities Fund | 930,893 | 273,974 | 1,204,867 | (2,420,838) | (1,215,971) |
| Short-Term Bond Fund | 10,852,517 | 2,786,212 | 13,638,729 | (17,474,550) | (3,835,821) |
| Intermediate Bond Fund | 4,660,754 | 63,669 | 4,724,423 | (74,550) | 4,649,873 |
| Stock Index Fund | 807,251 | 140,575 | 947,826 | (976,297) | (28,471) |
| Value Fund | 936,620 | 2,568,734 | 3,505,354 | (3,011,146) | 494,208 |
| Growth Fund | 3,255,743 | 1,071,930 | 4,327,673 | (3,749,241) | 578,432 |
| International Equity Fund | 638,711 | 93,043 | 731,754 | (1,045,911) | (314,157) |
| Small-Company Stock Fund | 1,258,845 | 2,385,961 | 3,644,806 | (10,027,693) | (6,382,887) |
| Notes to Financial Statements |
Independent | (Unaudited)
| Name, Year of Birth and Address (1) | Position(s) Held With Homestead Funds | Term of Office and Length of Time Served | Principal Occupation(s) During Past Five Years | Number of Portfolios Overseen by Director | Other Directorships Held by Director |
| James F. Perna 1947 | Director/Trustee, Chairman of the Board, Member of Audit Committee, Member of Compensation Committee | 1990-present (Homestead Funds, Inc.); since inception (Homestead Funds Trust) | Solo Practitioner (attorney) (2008-present) | 9 | None |
| Douglas W. Johnson 1955 | Director/Trustee, Chairman of Audit Committee, Member of Compensation Committee | 2003-present (Homestead Funds, Inc.); since inception (Homestead Funds Trust) | CEO, Blue Ridge Electric Membership Corporation (1989-present) | 9 | None |
| Kenneth R. Meyer 1944 | Director/Trustee, Member of Audit Committee, Chairman of Compensation Committee | 2005-present (Homestead Funds, Inc.); since inception (Homestead Funds Trust) | Retired (2004-present) | 9 | None |
| Anthony M. Marinello 1946 | Director/Trustee, Member of Audit Committee, Member of Compensation Committee | 1990-present (Homestead Funds, Inc.); since inception (Homestead Funds Trust) | Retired (2004-present) | 9 | None |
| Sheldon C. Petersen 1953 | Director/Trustee, Member of Audit Committee, Member of Compensation Committee | 2005-present (Homestead Funds, Inc.); since inception (Homestead Funds Trust) | CEO, National Rural Utilities Cooperative Finance Corporation (1995-present) | 9 | None |
| Mark Rose 1953 | Director/Trustee, Member of Audit Committee, Member of Compensation Committee | 2005-present (Homestead Funds, Inc.); since inception (Homestead Funds Trust) | Consultant, public affairs (2017-present (self-employed)); CEO and General Manager, Bluebonnet Electric Cooperative (2002-2017) | 9 | None |
| Peter J. Tonetti 1953 | Director/Trustee, Member of Audit Committee, Member of Compensation Committee | 2010-present (Homestead Funds, Inc.); since inception (Homestead Funds Trust) | Retired (2015-present); Chief Investment Officer, Hamilton College (2008-2015) | 9 | None |
| Judy H. McKinney 1950 | Director/Trustee, Member of Audit Committee, Member of Compensation Committee | 2019-present (Homestead Funds, Inc.); 2019-present (Homestead Funds Trust) | Executive Vice President and Manager, Callan LLC (2007-2019) | 9 | None |
Independent | (Unaudited) (Continued)
| Julie H. Dellinger 1953 | Director/Trustee, Member of Audit Committee, Member of Compensation Committee | 2019-present (Homestead Funds, Inc.); 2019-present (Homestead Funds Trust) | Westminster Investment Consultants, CEO (2017- present); Managing Vice President of Investments, ICMARC and Manager, Vantagepoint Investment Advisers, LLC (1998-2017) | 9 | None |
Interested | (Unaudited)
| Name, Year of Birth and Address (1) | Position(s) Held With Homestead Funds | Term of Office and Length of Time Served | Principal Occupation(s) During Past Five Years | Number of Portfolios Overseen by Director | Other Directorships Held by Director |
| Mark D. Santero (2) 1961 | Director/Trustee, President and Chief Executive Officer | 2018-present (Homestead Funds, Inc.); since inception (Homestead Funds Trust) | RE Advisers Corporation, President, Chief Executive Officer and Director (2018- present); Chief Executive Officer, The Dreyfus Corporation (2016-2017); Chief Operating Officer, BNY Mellon Investment Management (2014- 2016) | 9 | Not Applicable |
| Danielle C. Sieverling 1971 | Chief Compliance Officer | 2005-present (Homestead Funds, Inc.); since inception (Homestead Funds Trust) | Chief Compliance Officer, RE Advisers (2005-present); Vice President, Chief Risk and Compliance Officer, NRECA (2015-present); Chief Compliance Officer, RE Investment Corporation (2017-Present); Secretary, RE Advisers (2017-2018, 2020-present); Chief Executive Officer and Director, RE Investment Corporation (2017- 2018); Director, RE Investment Corporation (2016) Vice President and Director, RE Investment Corporation (2015- 2016); Vice President and Chief Compliance Officer, Management Advisory Services, NRECA (2008-2015) | Not Applicable | Not Applicable |
| Secretary | 2005-2008, 2017, 2020 – present (Homestead Funds, Inc.); 2020-present (Homestead Funds Trust) | ||||
| Amy M. DiMauro 1971 | Treasurer | 2007-present (Homestead Funds, Inc,); since inception (Homestead Funds Trust) | Treasurer and Director, RE Investment Corporation (2006- present); Treasurer and Director, RE Advisers Corporation (2010- present); Senior Director, Finance & Accounting—Mutual Funds, NRECA (2014-present); Treasurer and Director, Electric Cooperative Life Insurance Co. (2013-present); Treasurer and Director, Cooperating Insurance Services Co. (2013- present) | Not Applicable | Not Applicable |
| Jennifer (Laurie) Webster 1963 | Chief Operations Officer | 2017-Present (Homestead Funds, Inc.); since inception (Homestead Funds Trust) | President and Director, RE Investment Corporation (2018- present); Chief Operations Officer, RE Investment Corporation (2017- present); Vice President of Operations and Client Services, RE Advisers (2017-present); Chief Operating Officer, Solomon Hess Capital Management (2017-2017); V.P. Investment Operations and Indexing, Calvert Investments (2014-2017) | Not Applicable | Not Applicable |
| (1) | The address of each Director and officer is 4301 Wilson Boulevard, Arlington, Virginia 22203. |
| Fund | Qualified Dividend Income for Individuals | Dividends Received Deduction for Corporations |
| Daily Income Fund | 0% | 0% |
| Short-Term Government Securities Fund | 0% | 0% |
| Short-Term Bond Fund | 0% | 0% |
| Stock Index Fund | 100% | 91% |
| Value Fund | 100% | 99% |
| Growth Fund | 0% | 0% |
| International Equity Fund | 100% | 100% |
| Small-Company Stock Fund | 80% | 80% |
| Fund | Record Date | Distributions of Short-Term Capital Gains | Distributions of Long-Term Capital Gains |
| Short-Term Government Securities Fund | 6/29/2020 | $0.0032 | $– |
| Short-Term Government Securities Fund | 12/16/2020 | $0.0712 | $0.0291 |
| Short-Term Bond Fund | 6/29/2020 | $0.0064 | $– |
| Short-Term Bond Fund | 12/16/2020 | $0.1151 | $0.0209 |
| Intermediate Bond Fund | 12/16/2020 | $0.0809 | $– |
| Stock Index Fund | 6/29/2020 | $– | $0.0743 |
| Stock Index Fund | 12/16/2020 | $0.0053 | $– |
| Value Fund | 6/29/2020 | $– | $0.8284 |
| Value Fund | 12/16/2020 | $– | $6.3412 |
| Growth Fund | 6/29/2020 | $– | $0.1320 |
| Growth Fund | 12/16/2020 | $0.0752 | $0.5295 |
| Small-Company Stock Fund | 6/29/2020 | $– | $0.3290 |
| Small-Company Stock Fund | 12/16/2020 | $– | $3.2631 |
| Common Stocks | 99.8% of net assets | ||
| Shares | Value | |
| Aerospace & Defense | 1.6% | ||
| Boeing Co. | 453,312 | $97,035,967 |
| General Dynamics Corp. | 200,676 | 29,864,602 |
| Howmet Aerospace, Inc. | 339,873 | 9,699,976 |
| Huntington Ingalls Industries, Inc. | 32,105 | 5,473,260 |
| L3Harris Technologies, Inc. | 177,886 | 33,624,012 |
| Lockheed Martin Corp. | 207,448 | 73,639,891 |
| Northrop Grumman Corp. | 130,782 | 39,851,891 |
| Raytheon Technologies Corp. | 1,297,789 | 92,804,891 |
| Teledyne Technologies, Inc. (a) | 31,829 | 12,476,332 |
| Textron, Inc. | 195,208 | 9,434,403 |
| TransDigm Group, Inc. (a) | 46,804 | 28,964,655 |
| Total Aerospace & Defense | 432,869,880 | |
| Air Freight & Logistics | 0.7% | ||
| C.H. Robinson Worldwide, Inc. | 115,921 | 10,881,504 |
| Expeditors International of Washington, Inc. | 135,422 | 12,879,987 |
| FedEx Corp. | 208,029 | 54,008,489 |
| United Parcel Service, Inc., Class B | 610,732 | 102,847,269 |
| Total Air Freight & Logistics | 180,617,249 | |
| Airlines | 0.3% | ||
| Alaska Air Group, Inc. | 104,278 | 5,422,456 |
| American Airlines Group, Inc. | 439,112 | 6,924,796 |
| Delta Air Lines, Inc. | 550,751 | 22,145,698 |
| Southwest Airlines Co. (a) | 509,319 | 23,739,358 |
| United Airlines Holdings, Inc. (a)(b) | 251,247 | 10,866,433 |
| Total Airlines | 69,098,741 | |
| Auto Components | 0.1% | ||
| Aptiv PLC | 233,150 | 30,377,113 |
| BorgWarner, Inc. | 176,581 | 6,823,090 |
| Total Auto Components | 37,200,203 | |
| Automobiles | 2.0% | ||
| Ford Motor Co. | 3,390,483 | 29,802,346 |
| General Motors Co. | 1,087,117 | 45,267,552 |
| Tesla Inc. (a) | 645,218 | 455,310,986 |
| Total Automobiles | 530,380,884 | |
| Banks | 3.8% | ||
| Bank of America Corp. | 6,456,539 | 195,697,697 |
| Citigroup, Inc. | 1,772,920 | 109,318,247 |
| Citizens Financial Group, Inc. | 365,770 | 13,079,935 |
| Comerica, Inc. | 123,273 | 6,886,030 |
| Fifth Third Bancorp | 611,953 | 16,871,544 |
| First Republic Bank | 141,799 | 20,834,527 |
| Huntington Bancshares, Inc. | 878,386 | 11,094,015 |
| JPMorgan Chase & Co. | 2,586,875 | 328,714,206 |
| KeyCorp | 839,510 | 13,776,359 |
| Common Stocks | 99.8% of net assets (Continued) | ||
| Shares | Value | |
| Banks | 3.8% (Continued) | ||
| M&T Bank Corp. | 102,840 | $13,091,532 |
| People's United Financial, Inc. | 329,495 | 4,260,370 |
| PNC Financial Services Group, Inc. | 359,850 | 53,617,650 |
| Regions Financial Corp. | 833,745 | 13,439,970 |
| SVB Financial Group (a) | 45,318 | 17,575,680 |
| Truist Financial Corp. | 1,147,453 | 54,997,422 |
| U.S. Bancorp | 1,145,350 | 53,361,857 |
| Wells Fargo & Co. | 3,513,456 | 106,036,102 |
| Zions Bancorp. NA | 129,876 | 5,641,814 |
| Total Banks | 1,038,294,957 | |
| Beverages | 1.6% | ||
| Brown-Forman Corp., Class B | 156,870 | 12,460,184 |
| Coca-Cola Co. | 3,294,568 | 180,674,109 |
| Constellation Brands, Inc., Class A | 145,838 | 31,945,814 |
| Molson Coors Brewing Co., Class B | 161,725 | 7,308,353 |
| Monster Beverage Corp. (a) | 318,762 | 29,479,110 |
| PepsiCo, Inc. | 1,176,601 | 174,489,928 |
| Total Beverages | 436,357,498 | |
| Biotechnology | 1.9% | ||
| AbbVie Inc. | 1,506,284 | 161,398,331 |
| Alexion Pharmaceuticals, Inc. (a) | 184,883 | 28,886,120 |
| Amgen Inc. | 493,971 | 113,573,812 |
| Biogen, Inc. (a) | 130,235 | 31,889,342 |
| Gilead Sciences, Inc. | 1,062,746 | 61,915,582 |
| Incyte Corp. (a) | 160,508 | 13,960,986 |
| Regeneron Pharmaceuticals, Inc. (a) | 88,812 | 42,905,965 |
| Vertex Pharmaceuticals, Inc. (a) | 220,483 | 52,108,952 |
| Total Biotechnology | 506,639,090 | |
| Building Products | 0.5% | ||
| Allegion PLC | 73,213 | 8,520,529 |
| AO Smith Corp. | 116,550 | 6,389,271 |
| Carrier Global Corp. | 706,396 | 26,645,257 |
| Fortune Brands Home & Security, Inc. | 119,282 | 10,224,853 |
| Johnson Controls International PLC | 617,041 | 28,747,940 |
| Masco Corp. | 213,495 | 11,727,281 |
| Trane Technologies PLC | 206,627 | 29,993,975 |
| Total Building Products | 122,249,106 | |
| Capital Markets | 2.8% | ||
| Ameriprise Financial, Inc. | 103,845 | 20,180,199 |
| Bank of New York Mellon Corp. | 686,544 | 29,136,928 |
| BlackRock, Inc. (c) | 121,477 | 87,650,514 |
| Cboe Global Markets, Inc. | 92,827 | 8,644,050 |
| Charles Schwab Corp. | 1,278,340 | 67,803,154 |
| The accompanying notes are an integral part of these financial statements. | Appendix |
| Common Stocks | 99.8% of net assets (Continued) | ||
| Shares | Value | |
| Capital Markets | 2.8% (Continued) | ||
| CME Group, Inc. | 305,631 | $55,640,123 |
| Franklin Resources, Inc. | 229,824 | 5,743,302 |
| Goldman Sachs Group, Inc. | 297,089 | 78,345,340 |
| Intercontinental Exchange, Inc. | 478,645 | 55,182,982 |
| Invesco Ltd. | 327,515 | 5,708,586 |
| MarketAxess Holdings, Inc. | 33,020 | 18,839,891 |
| Moody's Corp. | 136,555 | 39,633,723 |
| Morgan Stanley | 1,233,843 | 84,555,261 |
| MSCI, Inc. | 70,656 | 31,550,024 |
| Nasdaq, Inc. | 94,707 | 12,571,407 |
| Northern Trust Corp. | 179,676 | 16,735,023 |
| Raymond James Financial, Inc. | 108,288 | 10,359,913 |
| S&P Global Inc. | 202,937 | 66,711,480 |
| State Street Corp. | 303,979 | 22,123,592 |
| T. Rowe Price Group, Inc. | 191,576 | 29,002,691 |
| Total Capital Markets | 746,118,183 | |
| Chemicals | 1.8% | ||
| Air Products & Chemicals, Inc. | 187,676 | 51,276,837 |
| Albemarle Corp. | 90,674 | 13,376,228 |
| Celanese Corp. | 102,137 | 13,271,682 |
| CF Industries Holdings, Inc. | 183,713 | 7,111,530 |
| Corteva, Inc. | 643,334 | 24,909,893 |
| Dow Inc. | 639,913 | 35,515,172 |
| DuPont de Nemours, Inc. | 632,434 | 44,972,382 |
| Eastman Chemical Co. | 115,913 | 11,623,756 |
| Ecolab, Inc. | 211,465 | 45,752,567 |
| FMC Corp. | 112,854 | 12,970,310 |
| International Flavors & Fragrances, Inc. (b) | 87,373 | 9,509,677 |
| Linde PLC (a) | 449,167 | 118,359,996 |
| LyondellBasell Industries NV, Class A | 223,528 | 20,488,577 |
| Mosaic Co. | 301,320 | 6,933,373 |
| PPG Industries, Inc. | 203,752 | 29,385,113 |
| Sherwin-Williams Co. | 69,634 | 51,174,723 |
| Total Chemicals | 496,631,816 | |
| Commercial Services & Supplies | 0.4% | ||
| Cintas Corp. | 75,067 | 26,533,182 |
| Copart, Inc. (a) | 178,107 | 22,664,116 |
| Republic Services, Inc. | 169,096 | 16,283,945 |
| Rollins, Inc. | 191,024 | 7,463,307 |
| Waste Management, Inc. | 323,846 | 38,191,159 |
| Total Commercial Services & Supplies | 111,135,709 | |
| Communications Equipment | 0.8% | ||
| Arista Networks, Inc. (a) | 47,229 | 13,723,330 |
| Cisco Systems, Inc. | 3,583,855 | 160,377,511 |
| F5 Networks, Inc. (a) | 51,988 | 9,146,769 |
| Juniper Networks, Inc. | 249,143 | 5,608,209 |
| Common Stocks | 99.8% of net assets (Continued) | ||
| Shares | Value | |
| Communications Equipment | 0.8% (Continued) | ||
| Motorola Solutions, Inc. | 142,665 | $24,261,610 |
| Total Communications Equipment | 213,117,429 | |
| Construction & Engineering | 0.1% | ||
| Jacobs Engineering Group, Inc. | 111,963 | 12,199,489 |
| Quanta Services, Inc. | 121,753 | 8,768,651 |
| Total Construction & Engineering | 20,968,140 | |
| Construction Materials | 0.1% | ||
| Martin Marietta Materials, Inc. | 53,454 | 15,179,332 |
| Vulcan Materials Co. | 115,239 | 17,091,096 |
| Total Construction Materials | 32,270,428 | |
| Consumer Finance | 0.5% | ||
| American Express Co. | 557,565 | 67,415,184 |
| Capital One Financial Corp. | 394,278 | 38,974,381 |
| Discover Financial Services | 264,542 | 23,948,987 |
| Synchrony Financial | 473,928 | 16,450,041 |
| Total Consumer Finance | 146,788,593 | |
| Containers & Packaging | 0.4% | ||
| Amcor PLC | 1,345,193 | 15,832,921 |
| Avery Dennison Corp. | 68,324 | 10,597,736 |
| Ball Corp. | 281,971 | 26,274,058 |
| International Paper Co. | 341,409 | 16,974,855 |
| Packaging Corp. of America | 81,400 | 11,225,874 |
| Sealed Air Corp. | 133,968 | 6,134,395 |
| WestRock Co. | 221,545 | 9,643,854 |
| Total Containers & Packaging | 96,683,693 | |
| Distributors | 0.1% | ||
| Genuine Parts Co. | 124,563 | 12,509,862 |
| LKQ Corp. (a) | 241,720 | 8,518,213 |
| Pool Corp. (b) | 34,586 | 12,883,285 |
| Total Distributors | 33,911,360 | |
| Diversified Financial Services | 1.4% | ||
| Berkshire Hathaway, Inc., Class B (a) | 1,654,300 | 383,582,541 |
| Total Diversified Financial Services | 383,582,541 | |
| Diversified Telecommunication Services | 1.4% | ||
| AT&T, Inc. | 6,041,997 | 173,767,834 |
| CenturyLink, Inc. | 857,752 | 8,363,082 |
| Verizon Communications, Inc. | 3,499,054 | 205,569,422 |
| Total Diversified Telecommunication Services | 387,700,338 | |
| Appendix | The accompanying notes are an integral part of these financial statements. |
| Common Stocks | 99.8% of net assets (Continued) | ||
| Shares | Value | |
| Electric Utilities | 1.8% | ||
| Alliant Energy Corp. | 200,121 | $10,312,235 |
| American Electric Power Co., Inc. | 417,498 | 34,765,058 |
| Duke Energy Corp. | 626,271 | 57,341,373 |
| Edison International | 326,571 | 20,515,190 |
| Entergy Corp. | 166,908 | 16,664,095 |
| Evergy, Inc. | 186,331 | 10,343,234 |
| Eversource Energy | 296,144 | 25,619,417 |
| Exelon Corp. | 824,237 | 34,799,286 |
| FirstEnergy Corp. | 470,441 | 14,400,199 |
| NextEra Energy, Inc. | 1,676,981 | 129,379,084 |
| NRG Energy, Inc. | 191,096 | 7,175,655 |
| Pinnacle West Capital Corp. | 96,814 | 7,740,279 |
| PPL Corp. | 668,523 | 18,852,349 |
| Southern Co. | 899,607 | 55,262,858 |
| Xcel Energy, Inc. | 439,461 | 29,298,865 |
| Total Electric Utilities | 472,469,177 | |
| Electrical Equipment | 0.5% | ||
| AMETEK, Inc. | 199,032 | 24,070,930 |
| Eaton Corp. PLC | 345,947 | 41,562,073 |
| Emerson Electric Co. | 515,985 | 41,469,714 |
| Rockwell Automation, Inc. | 97,930 | 24,561,823 |
| Total Electrical Equipment | 131,664,540 | |
| Electronic Equipment, Instruments & Components | 0.6% | ||
| Amphenol Corp., Class A | 258,151 | 33,758,406 |
| CDW Corp. | 117,995 | 15,550,561 |
| Corning, Inc. | 657,033 | 23,653,188 |
| FLIR Systems, Inc. | 113,633 | 4,980,534 |
| IPG Photonics Corp. (a) | 29,995 | 6,712,581 |
| Keysight Technologies, Inc. (a) | 160,848 | 21,246,412 |
| TE Connectivity Ltd. | 283,029 | 34,266,321 |
| Vontier Corp. (a) | 116,416 | 3,888,295 |
| Zebra Technologies Corp., Class A (a) | 46,056 | 17,700,703 |
| Total Electronic Equipment, Instruments & Components | 161,757,001 | |
| Energy Equipment & Services | 0.2% | ||
| Baker Hughes Co. | 572,371 | 11,933,936 |
| Halliburton Co. | 750,650 | 14,187,285 |
| Schlumberger NV | 1,205,365 | 26,313,118 |
| TechnipFMC PLC | 362,703 | 3,409,408 |
| Total Energy Equipment & Services | 55,843,747 | |
| Entertainment | 2.3% | ||
| Activision Blizzard, Inc. | 660,176 | 61,297,342 |
| Electronic Arts Inc. (a) | 244,459 | 35,104,312 |
| Live Nation Entertainment, Inc. (a)(b) | 121,362 | 8,917,680 |
| Netflix, Inc. (a) | 377,497 | 204,123,953 |
| Common Stocks | 99.8% of net assets (Continued) | ||
| Shares | Value | |
| Entertainment | 2.3% (Continued) | ||
| Take-Two Interactive Software, Inc. (a) | 98,542 | $20,476,042 |
| Walt Disney Co. (a) | 1,547,292 | 280,338,364 |
| Total Entertainment | 610,257,693 | |
| Equity Real Estate Investment Trusts (REITs) | 2.3% | ||
| Alexandria Real Estate Equities, Inc. | 101,270 | 18,048,339 |
| American Tower Corp. | 378,283 | 84,909,402 |
| AvalonBay Communities, Inc. | 121,601 | 19,508,448 |
| Boston Properties, Inc. | 122,286 | 11,559,696 |
| Crown Castle International Corp. | 361,609 | 57,564,537 |
| Digital Realty Trust, Inc. | 232,261 | 32,402,732 |
| Duke Realty Corp. | 320,492 | 12,810,065 |
| Equinix, Inc. | 75,708 | 54,069,139 |
| Equity Residential | 295,670 | 17,527,318 |
| Essex Property Trust, Inc. | 56,305 | 13,367,933 |
| Extra Space Storage, Inc. | 110,681 | 12,823,501 |
| Federal Realty Investment Trust | 61,405 | 5,226,794 |
| Healthpeak Properties, Inc. | 464,806 | 14,051,085 |
| Host Hotels & Resorts, Inc. | 604,349 | 8,841,626 |
| Iron Mountain, Inc. | 252,876 | 7,454,784 |
| Kimco Realty Corp. | 361,070 | 5,419,661 |
| Mid-America Apartment Communities, Inc. | 99,445 | 12,598,687 |
| Prologis, Inc. | 631,238 | 62,909,179 |
| Public Storage | 127,861 | 29,526,941 |
| Realty Income Corp. | 297,920 | 18,521,686 |
| Regency Centers Corp. | 136,212 | 6,209,905 |
| SBA Communications Corp. | 94,259 | 26,593,292 |
| Simon Property Group, Inc. | 263,910 | 22,506,245 |
| SL Green Realty Corp. | 63,248 | 3,768,316 |
| UDR, Inc. | 255,798 | 9,830,317 |
| Ventas, Inc. | 321,095 | 15,746,499 |
| Vornado Realty Trust | 135,460 | 5,058,076 |
| Welltower, Inc. | 360,314 | 23,283,491 |
| Weyerhaeuser Co. | 648,783 | 21,753,694 |
| Total Equity Real Estate Investment Trusts (REITs) | 633,891,388 | |
| Food & Staples Retailing | 1.4% | ||
| Costco Wholesale Corp. | 373,936 | 140,891,606 |
| Kroger Co. | 649,781 | 20,637,045 |
| Sysco Corp. | 439,090 | 32,606,823 |
| Walgreens Boots Alliance, Inc. | 605,004 | 24,127,560 |
| Walmart, Inc. | 1,175,103 | 169,391,097 |
| Total Food & Staples Retailing | 387,654,131 | |
| Food Products | 1.0% | ||
| Archer-Daniels-Midland Co. | 479,615 | 24,177,392 |
| Campbell Soup Co. | 160,677 | 7,768,733 |
| Conagra Brands, Inc. | 423,722 | 15,364,160 |
| General Mills, Inc. | 515,032 | 30,283,882 |
| The accompanying notes are an integral part of these financial statements. | Appendix |
| Common Stocks | 99.8% of net assets (Continued) | ||
| Shares | Value | |
| Food Products | 1.0% (Continued) | ||
| Hershey Co. | 122,877 | $18,717,853 |
| Hormel Foods Corp. | 227,068 | 10,583,639 |
| J.M. Smucker Co. | 93,502 | 10,808,831 |
| Kellogg Co. | 205,999 | 12,819,318 |
| Kraft Heinz Co. | 559,480 | 19,391,577 |
| Lamb Weston Holdings, Inc. | 124,846 | 9,830,374 |
| McCormick & Co., Inc. | 207,973 | 19,882,219 |
| Mondelez International, Inc., Class A | 1,208,001 | 70,631,818 |
| Tyson Foods, Inc., Class A | 253,297 | 16,322,459 |
| Total Food Products | 266,582,255 | |
| Gas Utilities | 0.0% | ||
| Atmos Energy Corp. | 100,005 | 9,543,477 |
| Total Gas Utilities | 9,543,477 | |
| Health Care Equipment & Supplies | 3.8% | ||
| Abbott Laboratories | 1,508,419 | 165,156,796 |
| ABIOMED, Inc. (a) | 39,437 | 12,785,475 |
| Align Technology, Inc. (a) | 61,710 | 32,976,590 |
| Baxter International, Inc. | 428,071 | 34,348,417 |
| Becton, Dickinson & Co. | 245,757 | 61,493,317 |
| Boston Scientific Corp. (a) | 1,197,101 | 43,035,781 |
| Cooper Cos., Inc. | 40,492 | 14,711,553 |
| Danaher Corp. | 540,447 | 120,054,897 |
| DENTSPLY SIRONA, Inc. | 191,806 | 10,042,962 |
| DexCom, Inc. (a) | 82,667 | 30,563,643 |
| Edwards Lifesciences Corp. (a) | 527,109 | 48,088,154 |
| Hologic, Inc. (a) | 223,962 | 16,311,153 |
| IDEXX Laboratories, Inc. (a) | 73,440 | 36,710,453 |
| Intuitive Surgical, Inc. (a) | 99,919 | 81,743,734 |
| Medtronic PLC | 1,143,719 | 133,975,244 |
| ResMed, Inc. | 122,022 | 25,936,996 |
| STERIS PLC | 73,941 | 14,014,777 |
| Stryker Corp. | 278,803 | 68,317,887 |
| Teleflex, Inc. | 40,309 | 16,589,975 |
| Varian Medical Systems, Inc. (a) | 78,200 | 13,685,782 |
| West Pharmaceutical Services, Inc. | 63,513 | 17,993,868 |
| Zimmer Biomet Holdings, Inc. | 179,086 | 27,595,362 |
| Total Health Care Equipment & Supplies | 1,026,132,816 | |
| Health Care Providers & Services | 2.6% | ||
| AmerisourceBergen Corp. | 126,910 | 12,406,722 |
| Anthem, Inc. | 212,211 | 68,138,830 |
| Cardinal Health, Inc. | 254,665 | 13,639,857 |
| Centene Corp. (a) | 486,846 | 29,225,365 |
| Cigna Corp. | 308,286 | 64,178,979 |
| CVS Health Corp. | 1,113,623 | 76,060,451 |
| DaVita, Inc. (a) | 63,568 | 7,462,883 |
| HCA Healthcare, Inc. | 227,659 | 37,440,799 |
| Henry Schein, Inc. (a)(b) | 123,272 | 8,241,966 |
| Humana Inc. | 112,412 | 46,119,271 |
| Common Stocks | 99.8% of net assets (Continued) | ||
| Shares | Value | |
| Health Care Providers & Services | 2.6% (Continued) | ||
| Laboratory Corp. of America Holdings (a) | 81,724 | $16,634,920 |
| McKesson Corp. | 135,991 | 23,651,555 |
| Quest Diagnostics, Inc. | 115,282 | 13,738,156 |
| UnitedHealth Group, Inc. | 810,014 | 284,055,710 |
| Universal Health Services, Inc., Class B | 67,089 | 9,224,738 |
| Total Health Care Providers & Services | 710,220,202 | |
| Health Care Technology | 0.1% | ||
| Cerner Corp. | 249,120 | 19,550,938 |
| Total Health Care Technology | 19,550,938 | |
| Hotels, Restaurants & Leisure | 1.7% | ||
| Carnival Corp. | 633,064 | 13,712,166 |
| Chipotle Mexican Grill, Inc. (a) | 24,149 | 33,487,660 |
| Darden Restaurants, Inc. | 112,179 | 13,362,762 |
| Domino's Pizza, Inc. | 33,697 | 12,921,452 |
| Hilton Worldwide Holdings, Inc. | 239,440 | 26,640,094 |
| Las Vegas Sands Corp. (a) | 283,584 | 16,901,606 |
| Marriott International, Inc., Class A | 229,622 | 30,291,734 |
| McDonald's Corp. | 638,475 | 137,003,966 |
| MGM Resorts International (b) | 353,512 | 11,139,163 |
| Norwegian Cruise Line Holdings Ltd. (a)(b) | 225,621 | 5,737,542 |
| Royal Caribbean Cruises Ltd. | 153,843 | 11,490,534 |
| Starbucks Corp. | 1,009,361 | 107,981,440 |
| Wynn Resorts, Ltd. | 85,011 | 9,591,791 |
| Yum! Brands, Inc. | 260,241 | 28,251,763 |
| Total Hotels, Restaurants & Leisure | 458,513,673 | |
| Household Durables | 0.4% | ||
| D.R. Horton, Inc. | 285,772 | 19,695,406 |
| Garmin Ltd. | 128,795 | 15,411,610 |
| Leggett & Platt, Inc. | 117,117 | 5,188,283 |
| Lennar Corp., Class A | 237,116 | 18,075,353 |
| Mohawk Industries, Inc. (a) | 50,377 | 7,100,638 |
| Newell Brands, Inc. | 333,665 | 7,083,708 |
| NVR, Inc. (a) | 3,042 | 12,410,934 |
| PulteGroup, Inc. | 231,556 | 9,984,695 |
| Whirlpool Corp. | 53,787 | 9,708,015 |
| Total Household Durables | 104,658,642 | |
| Household Products | 1.6% | ||
| Church & Dwight Co., Inc. | 213,668 | 18,638,260 |
| Clorox Co. | 106,016 | 21,406,751 |
| Colgate-Palmolive Co. | 723,514 | 61,867,682 |
| Kimberly-Clark Corp. | 283,820 | 38,267,450 |
| Procter & Gamble Co. | 2,101,471 | 292,398,675 |
| Total Household Products | 432,578,818 | |
| Appendix | The accompanying notes are an integral part of these financial statements. |
| Common Stocks | 99.8% of net assets (Continued) | ||
| Shares | Value | |
| Independent Power and Renewable Electricity Producers | 0.1% | ||
| AES Corp. | 582,112 | $13,679,632 |
| Total Independent Power and Renewable Electricity Producers | 13,679,632 | |
| Industrial Conglomerates | 1.2% | ||
| 3M Co. | 488,728 | 85,424,767 |
| General Electric Co. | 7,481,950 | 80,805,060 |
| Honeywell International, Inc. | 597,613 | 127,112,285 |
| Roper Technologies, Inc. | 89,049 | 38,388,134 |
| Total Industrial Conglomerates | 331,730,246 | |
| Insurance | 1.9% | ||
| Aflac, Inc. | 557,728 | 24,802,164 |
| Allstate Corp. | 257,959 | 28,357,433 |
| American International Group, Inc. | 743,797 | 28,160,154 |
| Aon PLC, Class A | 194,306 | 41,051,029 |
| Arthur J Gallagher & Co. | 165,349 | 20,455,325 |
| Assurant, Inc. | 52,112 | 7,098,697 |
| Chubb Ltd. | 384,837 | 59,234,111 |
| Cincinnati Financial Corp. | 129,152 | 11,284,010 |
| Everest Re Group Ltd. | 34,513 | 8,079,148 |
| Globe Life, Inc. | 77,552 | 7,364,338 |
| Hartford Financial Services Group, Inc. | 307,460 | 15,059,391 |
| Lincoln National Corp. | 156,847 | 7,890,973 |
| Loews Corp. | 190,151 | 8,560,598 |
| Marsh & McLennan Cos., Inc. | 430,199 | 50,333,283 |
| MetLife, Inc. | 662,307 | 31,095,314 |
| Principal Financial Group, Inc. | 220,438 | 10,935,929 |
| Progressive Corp. | 497,912 | 49,233,538 |
| Prudential Financial, Inc. | 339,044 | 26,469,165 |
| Travelers Cos., Inc. | 214,736 | 30,142,492 |
| Unum Group | 173,973 | 3,990,941 |
| W.R. Berkley Corp. | 110,610 | 7,346,716 |
| Willis Towers Watson PLC | 108,797 | 22,921,352 |
| Total Insurance | 499,866,101 | |
| Interactive Media & Services | 5.5% | ||
| Alphabet, Inc., Class A (a) | 255,603 | 447,980,042 |
| Alphabet, Inc., Class C (a) | 247,736 | 434,003,744 |
| Facebook, Inc., Class A (a) | 2,048,181 | 559,481,122 |
| Twitter, Inc. (a) | 682,937 | 36,981,038 |
| Total Interactive Media & Services | 1,478,445,946 | |
| Internet & Direct Marketing Retail | 4.9% | ||
| Amazon.com, Inc. (a) | 363,296 | 1,183,229,641 |
| Booking Holdings, Inc. (a) | 34,950 | 77,843,087 |
| eBay, Inc. | 559,957 | 28,137,839 |
| Etsy, Inc. (a) | 103,033 | 18,330,601 |
| Common Stocks | 99.8% of net assets (Continued) | ||
| Shares | Value | |
| Internet & Direct Marketing Retail | 4.9% (Continued) | ||
| Expedia Group, Inc. | 116,285 | $15,396,134 |
| Total Internet & Direct Marketing Retail | 1,322,937,302 | |
| IT Services | 5.5% | ||
| Accenture PLC, Class A | 536,464 | 140,129,761 |
| Akamai Technologies, Inc. (a)(b) | 140,703 | 14,772,408 |
| Automatic Data Processing, Inc. | 363,450 | 64,039,890 |
| Broadridge Financial Solutions, Inc. | 95,386 | 14,613,135 |
| Cognizant Technology Solutions Corp., Class A | 454,785 | 37,269,631 |
| DXC Technology Co. | 220,706 | 5,683,180 |
| Fidelity National Information Services, Inc. | 527,105 | 74,564,273 |
| Fiserv, Inc. (a) | 473,199 | 53,878,438 |
| FleetCor Technologies, Inc. (a) | 69,975 | 19,091,279 |
| Gartner, Inc. (a) | 76,998 | 12,334,310 |
| Global Payments, Inc. | 254,323 | 54,786,261 |
| International Business Machines Corp. | 758,728 | 95,508,681 |
| Jack Henry & Associates, Inc. | 61,355 | 9,938,897 |
| Leidos Holdings Inc. | 116,021 | 12,196,128 |
| Mastercard, Inc., Class A | 745,793 | 266,203,353 |
| Paychex, Inc. | 267,919 | 24,964,692 |
| PayPal Holdings, Inc. (a) | 1,000,316 | 234,274,007 |
| VeriSign, Inc. (a) | 79,563 | 17,217,433 |
| Visa Inc., Class A (b) | 1,437,647 | 314,456,528 |
| Western Union Co. | 324,812 | 7,126,375 |
| Total IT Services | 1,473,048,660 | |
| Leisure Products | 0.0% | ||
| Hasbro, Inc. | 109,344 | 10,228,038 |
| Total Leisure Products | 10,228,038 | |
| Life Sciences Tools & Services | 1.2% | ||
| Agilent Technologies, Inc. | 260,573 | 30,875,295 |
| Bio-Rad Laboratories, Inc., Class A (a) | 18,020 | 10,504,579 |
| Illumina, Inc. (a)(b) | 124,186 | 45,948,820 |
| IQVIA Holdings, Inc. (a) | 165,151 | 29,590,105 |
| Mettler-Toledo International, Inc. (a)(b) | 20,122 | 22,932,641 |
| PerkinElmer, Inc. | 95,779 | 13,744,286 |
| Thermo Fisher Scientific, Inc. | 338,184 | 157,519,343 |
| Waters Corp. (a) | 50,761 | 12,559,287 |
| Total Life Sciences Tools & Services | 323,674,356 | |
| Machinery | 1.7% | ||
| Caterpillar, Inc. | 463,847 | 84,429,431 |
| Cummins, Inc. | 124,557 | 28,286,895 |
| Deere & Co. | 270,580 | 72,799,549 |
| The accompanying notes are an integral part of these financial statements. | Appendix |
| Common Stocks | 99.8% of net assets (Continued) | ||
| Shares | Value | |
| Machinery | 1.7% (Continued) | ||
| Dover Corp. | 118,881 | $15,008,726 |
| Flowserve Corp. | 112,148 | 4,132,654 |
| Fortive Corp. | 281,511 | 19,936,609 |
| IDEX Corp. | 61,803 | 12,311,157 |
| Illinois Tool Works, Inc. | 239,874 | 48,905,511 |
| Ingersoll Rand Inc. (a) | 320,494 | 14,601,707 |
| Otis Worldwide Corp. | 342,980 | 23,168,299 |
| PACCAR Inc. | 290,767 | 25,087,377 |
| Parker-Hannifin Corp. | 110,721 | 30,161,507 |
| Pentair PLC | 142,497 | 7,565,166 |
| Snap-on, Inc. | 43,128 | 7,380,926 |
| Stanley Black & Decker, Inc. | 137,876 | 24,619,138 |
| Westinghouse Air Brake Technologies Corp. | 154,454 | 11,306,033 |
| Xylem, Inc. | 156,792 | 15,959,858 |
| Total Machinery | 445,660,543 | |
| Media | 1.3% | ||
| Charter Communications, Inc., Class A (a)(b) | 124,393 | 82,292,189 |
| Comcast Corp., Class A | 3,905,303 | 204,637,877 |
| Discovery, Inc., Class A (a)(b) | 134,754 | 4,054,748 |
| Discovery, Inc., Class C (a) | 267,283 | 7,000,142 |
| DISH Network Corp., Class A (a)(b) | 213,018 | 6,889,002 |
| Fox Corp., Class A | 280,017 | 8,154,095 |
| Fox Corp., Class B (a) | 133,124 | 3,844,621 |
| Interpublic Group of Cos., Inc. | 340,340 | 8,004,797 |
| News Corp., Class A | 332,273 | 5,970,946 |
| News Corp., Class B | 114,231 | 2,029,885 |
| Omnicom Group, Inc. | 185,083 | 11,543,627 |
| ViacomCBS, Inc., Class B | 486,782 | 18,137,497 |
| Total Media | 362,559,426 | |
| Metals & Mining | 0.3% | ||
| Freeport-McMoRan Inc. (a) | 1,253,904 | 32,626,582 |
| Newmont Corp. | 682,201 | 40,857,018 |
| Nucor Corp. | 239,549 | 12,741,611 |
| Total Metals & Mining | 86,225,211 | |
| Multi-Utilities | 0.8% | ||
| Ameren Corp. | 201,001 | 15,690,138 |
| CenterPoint Energy, Inc. | 470,418 | 10,179,846 |
| CMS Energy Corp. | 231,392 | 14,117,226 |
| Consolidated Edison, Inc. | 289,441 | 20,917,901 |
| Dominion Energy, Inc. | 691,657 | 52,012,606 |
| DTE Energy Co. | 167,263 | 20,307,401 |
| NiSource, Inc. | 292,980 | 6,720,961 |
| Public Service Enterprise Group, Inc. | 424,316 | 24,737,623 |
| Sempra Energy | 244,708 | 31,178,246 |
| WEC Energy Group, Inc. | 265,074 | 24,394,760 |
| Total Multi-Utilities | 220,256,708 | |
| Common Stocks | 99.8% of net assets (Continued) | ||
| Shares | Value | |
| Multiline Retail | 0.5% | ||
| Dollar General Corp. | 208,901 | $43,931,880 |
| Dollar Tree, Inc. (a) | 200,048 | 21,613,186 |
| Target Corp. | 427,037 | 75,384,842 |
| Total Multiline Retail | 140,929,908 | |
| Oil, Gas & Consumable Fuels | 2.1% | ||
| Apache Corp. | 317,469 | 4,504,885 |
| Cabot Oil & Gas Corp. | 344,150 | 5,602,762 |
| Chevron Corp. | 1,639,297 | 138,438,632 |
| Concho Resources Inc. | 159,227 | 9,290,895 |
| ConocoPhillips | 901,181 | 36,038,228 |
| Devon Energy Corp. | 330,941 | 5,232,177 |
| Diamondback Energy, Inc. | 136,845 | 6,623,298 |
| EOG Resources, Inc. | 492,292 | 24,550,602 |
| Exxon Mobil Corp. | 3,594,094 | 148,148,555 |
| Hess Corp. | 236,028 | 12,459,918 |
| HollyFrontier Corp. | 104,307 | 2,696,336 |
| Kinder Morgan, Inc. | 1,633,055 | 22,323,862 |
| Marathon Oil Corp. | 684,055 | 4,562,647 |
| Marathon Petroleum Corp. | 565,354 | 23,383,041 |
| NOV, Inc. | 342,352 | 4,700,493 |
| Occidental Petroleum Corp. | 722,809 | 12,511,824 |
| ONEOK, Inc. | 383,542 | 14,720,342 |
| Phillips 66 | 367,911 | 25,731,695 |
| Pioneer Natural Resources Co. | 141,842 | 16,154,385 |
| Valero Energy Corp. | 340,568 | 19,265,932 |
| Williams Cos., Inc. | 1,055,312 | 21,159,006 |
| Total Oil, Gas & Consumable Fuels | 558,099,515 | |
| Personal Products | 0.2% | ||
| Estee Lauder Cos., Inc., Class A | 193,936 | 51,623,824 |
| Total Personal Products | 51,623,824 | |
| Pharmaceuticals | 3.8% | ||
| Bristol-Myers Squibb Co. | 1,922,531 | 119,254,598 |
| Catalent, Inc. (a) | 141,724 | 14,749,216 |
| Eli Lilly & Co. | 675,443 | 114,041,796 |
| Johnson & Johnson | 2,231,116 | 351,133,036 |
| Merck & Co., Inc. | 2,136,245 | 174,744,841 |
| Perrigo Co. PLC | 116,394 | 5,205,140 |
| Pfizer, Inc. | 4,732,238 | 174,193,681 |
| Viatris, Inc. (a) | 1,010,311 | 18,933,228 |
| Zoetis, Inc. | 403,438 | 66,768,989 |
| Total Pharmaceuticals | 1,039,024,525 | |
| Professional Services | 0.3% | ||
| Equifax, Inc. | 105,425 | 20,330,157 |
| IHS Markit Ltd. | 314,633 | 28,263,482 |
| Nielsen Holdings PLC | 313,402 | 6,540,700 |
| Robert Half International, Inc. | 98,980 | 6,184,270 |
| Verisk Analytics, Inc. | 136,594 | 28,355,549 |
| Total Professional Services | 89,674,158 | |
| Appendix | The accompanying notes are an integral part of these financial statements. |
| Common Stocks | 99.8% of net assets (Continued) | ||
| Shares | Value | |
| Real Estate Management & Development | 0.1% | ||
| CBRE Group, Inc., Class A (a)(b) | 291,463 | $18,280,559 |
| Total Real Estate Management & Development | 18,280,559 | |
| Road & Rail | 1.0% | ||
| CSX Corp. | 651,345 | 59,109,559 |
| J.B. Hunt Transport Services, Inc. | 71,440 | 9,762,276 |
| Kansas City Southern | 81,200 | 16,575,356 |
| Norfolk Southern Corp. | 216,791 | 51,511,709 |
| Old Dominion Freight Line, Inc. | 80,360 | 15,684,665 |
| Union Pacific Corp. | 573,424 | 119,398,345 |
| Total Road & Rail | 272,041,910 | |
| Semiconductors & Semiconductor Equipment | 5.1% | ||
| Advanced Micro Devices, Inc. (a) | 1,012,926 | 92,895,443 |
| Analog Devices, Inc. | 313,987 | 46,385,299 |
| Applied Materials, Inc. | 781,089 | 67,407,981 |
| Broadcom, Inc. | 345,975 | 151,485,154 |
| Intel Corp. | 3,485,417 | 173,643,475 |
| KLA-Tencor Corp. | 133,954 | 34,682,030 |
| Lam Research Corp. | 123,378 | 58,267,728 |
| Maxim Integrated Products, Inc. | 222,854 | 19,756,007 |
| Microchip Technology, Inc. | 217,977 | 30,104,803 |
| Micron Technology, Inc. (a) | 952,133 | 71,581,359 |
| NVIDIA Corp. | 528,504 | 275,984,789 |
| Qorvo, Inc. (a) | 99,482 | 16,540,872 |
| QUALCOMM, Inc. | 966,228 | 147,195,174 |
| Skyworks Solutions, Inc. | 143,117 | 21,879,727 |
| Teradyne, Inc. | 143,359 | 17,187,311 |
| Texas Instruments, Inc. | 777,254 | 127,570,699 |
| Xilinx, Inc. | 210,533 | 29,847,263 |
| Total Semiconductors & Semiconductor Equipment | 1,382,415,114 | |
| Software | 8.6% | ||
| Adobe, Inc. (a)(b) | 409,547 | 204,822,646 |
| ANSYS, Inc. (a) | 72,586 | 26,406,787 |
| Autodesk, Inc. (a) | 189,334 | 57,811,244 |
| Cadence Design Systems, Inc. (a)(b) | 235,337 | 32,107,027 |
| Citrix Systems, Inc. | 106,662 | 13,876,726 |
| Fortinet, Inc. (a) | 115,935 | 17,219,825 |
| Intuit, Inc. | 223,118 | 84,751,372 |
| Microsoft Corp. | 6,432,915 | 1,430,808,954 |
| NortonLifeLock, Inc. | 510,295 | 10,603,930 |
| Oracle Corp. | 1,612,765 | 104,329,768 |
| Paycom Software, Inc. (a) | 42,795 | 19,354,039 |
| salesforce.com, Inc. (a) | 778,781 | 173,302,136 |
| ServiceNow, Inc. (a) | 165,633 | 91,169,372 |
| Synopsys, Inc. (a) | 130,891 | 33,932,183 |
| Tyler Technologies, Inc. (a)(b) | 34,089 | 14,880,530 |
| Total Software | 2,315,376,539 | |
| Common Stocks | 99.8% of net assets (Continued) | ||
| Shares | Value | |
| Specialty Retail | 2.2% | ||
| Advance Auto Parts, Inc. | 59,306 | $9,341,288 |
| AutoZone, Inc. (a) | 19,391 | 22,986,867 |
| Best Buy Co., Inc. | 198,275 | 19,785,862 |
| CarMax, Inc. (a) | 140,808 | 13,300,724 |
| Gap, Inc. | 180,058 | 3,635,371 |
| Home Depot, Inc. | 916,414 | 243,417,887 |
| L Brands, Inc. | 200,125 | 7,442,649 |
| Lowe's Cos., Inc. | 628,041 | 100,806,861 |
| O'Reilly Automotive, Inc. (a) | 60,849 | 27,538,432 |
| Ross Stores, Inc. | 307,115 | 37,716,793 |
| Tiffany & Co. | 89,063 | 11,707,331 |
| TJX Companies, Inc. (The) | 1,023,472 | 69,892,903 |
| Tractor Supply Co. | 98,685 | 13,873,137 |
| Ulta Beauty, Inc. (a) | 49,300 | 14,156,988 |
| Total Specialty Retail | 595,603,093 | |
| Technology Hardware, Storage & Peripherals | 7.0% | ||
| Apple, Inc. | 13,604,154 | 1,805,135,194 |
| Hewlett Packard Enterprise Co. | 1,101,086 | 13,047,869 |
| HP, Inc. | 1,158,037 | 28,476,130 |
| NetApp, Inc. | 191,688 | 12,697,413 |
| Seagate Technology PLC | 192,709 | 11,978,792 |
| Western Digital Corp. | 259,683 | 14,383,841 |
| Xerox Holdings Corp. | 132,367 | 3,069,591 |
| Total Technology Hardware, Storage & Peripherals | 1,888,788,830 | |
| Textiles, Apparel & Luxury Goods | 0.8% | ||
| Hanesbrands, Inc. | 298,358 | 4,350,060 |
| NIKE, Inc., Class B | 1,074,871 | 152,062,000 |
| PVH Corp. | 63,061 | 5,920,797 |
| Ralph Lauren Corp. | 42,619 | 4,421,295 |
| Tapestry, Inc. | 237,843 | 7,392,160 |
| Under Armour, Inc., Class A (a)(b) | 164,871 | 2,830,835 |
| Under Armour, Inc., Class C (a) | 169,421 | 2,520,985 |
| VF Corp. | 274,173 | 23,417,116 |
| Total Textiles, Apparel & Luxury Goods | 202,915,248 | |
| Tobacco | 0.6% | ||
| Altria Group, Inc. | 1,588,044 | 65,109,804 |
| Philip Morris International, Inc. | 1,329,864 | 110,099,441 |
| Total Tobacco | 175,209,245 | |
| Trading Companies & Distributors | 0.2% | ||
| Fastenal Co. | 493,888 | 24,116,551 |
| United Rentals, Inc. (a) | 62,237 | 14,433,383 |
| W.W. Grainger, Inc. | 37,224 | 15,200,048 |
| Total Trading Companies & Distributors | 53,749,982 | |
| The accompanying notes are an integral part of these financial statements. | Appendix |
| Common Stocks | 99.8% of net assets (Continued) | ||
| Shares | Value | |
| Water Utilities | 0.1% | ||
| American Water Works Co., Inc. | 153,076 | $23,492,574 |
| Total Water Utilities | 23,492,574 | |
| Wireless Telecommunication Services | 0.2% | ||
| T-Mobile U.S., Inc. (a) | 497,236 | 67,052,275 |
| Total Wireless Telecommunication Services | 67,052,275 | |
| Total Common Stocks | ||
| (Cost $13,257,423,611) | 26,946,523,804 | |
| Investment Companies | 0.0% of net assets | ||
| iShares Core S&P 500 ETF (c) | 11,420 | $4,286,954 |
| Total Investment Companies | ||
| (Cost $2,830,069) | 4,286,954 | |
| Total Long-Term Investments | ||
| (Cost $13,260,253,680) | 26,950,810,758 | |
| Short-Term Securities | 0.9% of net assets | ||
| Shares | Value | |
| BlackRock Cash Funds: Institutional, SL Agency Shares, 0.21% (c)(d)(e) | 161,721,157 | $161,818,190 |
| BlackRock Cash Funds: Treasury, SL Agency Shares, 0.05% (c)(d) | 82,440,013 | 82,440,013 |
| Total Short-Term Securities | ||
| (Cost $244,110,392) | 244,258,203 | |
| Total Investments | ||
| (Cost $13,504,364,072) | 100.7% | 27,195,068,961 | |
| Liabilities in Excess of Other Assets | (0.7)% | (202,096,307) | |
| Net Assets | 100.0% | $26,992,972,654 | |
| (a) | Non-income producing. |
| (b) | Security, or a portion of security, is on loan. |
| (c) | During the period ended December 31, 2020, investments in issuers considered to be affiliates of the Master Portfolio for purposes of Section 2(a)(3) of the Investment Company Act of 1940, as amended, and/or related parties of the Master Portfolio were as follows: |
| Affiliate Persons and/or Related Parties | Shares Held at December 31, 2019 | Shares Purchased | Shares Sold | Shares Held at December 31, 2020 | Value at December 31, 2020 | Income | Realized Gain (Loss) | Change in Unrealized Appreciation (Depreciation) |
| BlackRock Cash Funds: Institutional, SL Agency Shares | 139,403,854 | 22,269,6461 | — | 161,721,157 | 161,818,190 | $1,676,2282 | $13,367 | $131,323 |
| BlackRock Cash Funds: Treasury, SL Agency Shares | 215,380,072 | — | (132,940,059)1 | 82,440,013 | 82,440,013 | 1,003,418 | — | — |
| BlackRock, Inc. | 50,696,290 | 16,775,336 | (7,590,452) | 121,477 | 87,650,514 | 1,777,168 | 397,600 | 27,371,740 |
| iShares Core S&P 500 ETF | 94,603,944 | 41,630,812 | (129,939,288) | 11,420 | 4,286,954 | 932,703 | 2,981,453 | (4,989,967) |
| Total | $336,195,671 | $5,389,517 | $3,392,420 | $22,513,096 |
| 1 | Represents net shares purchased (sold). |
| 2 | Represents all or portion of securities lending income earned from the reinvestment of cash collateral from loaned securities, net of fees, and collateral investment expenses, and other payments to and from borrowers of securities. |
| (d) | 7-day yield at December 31, 2020. |
| (e) | All or a portion of security was purchased with the cash collateral from loaned securities. |
| Derivative Financial Instruments Outstanding as of Period End - Futures Contracts | ||||
| Contracts Long | Issue | Expiration | Notional Amount (000) | Unrealized Appreciation (Depreciation) |
| 530 | S&P 500 E-Mini Index | February 2021 | $99,343 | $1,620,498 |
| Appendix | The accompanying notes are an integral part of these financial statements. |
| Assets-Derivative Financial Instruments | Commodity Contracts | Credit Contract | Equity Contracts | Foriegn Currency Exchange Contracts | Interest Rate Contracts | Other Contracts | Total |
| Futures contracts net unrealized appreciation1 | — | — | $1,620,498 | — | — | — | $1,620,498 |
| 1 | Net cumulative unrealized appreciation (depreciation) on futures contracts, if any, are reported in the Schedule of Investments. In the Statement of Assets and Liabilities, only current day’s variation margin is reported in receivables or payables and the net cumulative unrealized appreciation (depreciation) is included in net unrealized appreciation (depreciation). |
| Commodity Contracts | Credit Contract | Equity Contracts | Foreign Currency Exchange Contracts | Interest Rate Contracts | Other Contracts | Total | |
| Net Realized Gain (Loss) From: | |||||||
| Futures contracts | — | — | $13,682,613 | — | — | — | $13,682,613 |
| Net Change in Unrealized Appreciation (Depreciation) on: | |||||||
| Futures contracts | — | — | $(724,988) | — | — | — | $(724,988) |
| Average Quarterly Balances on Outstanding Derivative Financial Instruments | |||||||
| Futures contracts: Average notional value of contracts—long | $190,400,191 | ||||||
| Level 1 | Level 2 | Level 3 | Total | |
| Assets: | ||||
| Investments: | ||||
Long-Term Investments | $26,950,810,758 | $— | $— | $26,950,810,758 |
Short-Term Securities: Money Market Funds | 244,258,203 | — | — | 244,258,203 |
| $27,195,068,961 | $— | $— | $27,195,068,961 | |
| Derivative Financial Instruments(a) | ||||
| Assets: | ||||
Equity contracts | $1,620,498 | $— | $— | $1,620,498 |
| (a) | Derivative financial instruments are futures contracts. Futures contracts are valued at the unrealized appreciation (depreciation) on the instrument. |
| The accompanying notes are an integral part of these financial statements. | Appendix |
| Assets | |
| Investments in securities, at value (including securities loaned of $159,293,085) (cost: $13,216,001,480) | $26,858,873,290 |
| Investments at value—affiliated (cost—$288,362,592) | 336,195,671 |
| Cash pledged for futures contracts | 7,766,800 |
| Dividends—unaffiliated | 19,661,598 |
| Dividends—affiliated | 3,820 |
| Securities lending income—affiliated | 66,869 |
| Variation margin on futures contracts | 643,559 |
| Prepaid expenses | 86,039 |
| Total Assets | 27,223,297,646 |
| Liabilities | |
| Collateral on securities loaned at value | 161,661,741 |
| Withdrawals to investors | 68,089,075 |
| Investment advisory fees | 419,107 |
| Trustees' fees | 88,789 |
| Professional fees | 66,280 |
| Total Liabilities | 230,324,992 |
| Net Assets | $26,992,972,654 |
| Net Assets Consist Of: | |
| Unrealized appreciation (depreciation) of investments | 13,692,325,387 |
| Investors’ capital | 13,300,647,267 |
| Net Assets | $26,992,972,654 |
| Appendix | The accompanying notes are an integral part of these financial statements. |
| Investment Income | |
| Dividends—unaffiliated | 424,626,813 |
| Dividends—affiliated | 3,713,289 |
| Securities lending—affiliated—net | 1,676,228 |
| Foreign taxes withheld | (2,168,396) |
| Total Investment Income | 427,847,934 |
| Expenses | |
| Investment advisory | 2,337,070 |
| Director, Trustee, and Board meeting expenses | 313,882 |
| Professional | 101,203 |
| Total Expenses | 2,752,155 |
| Less fees waived and/or reimbursed by the Manager | (577,819) |
| Total Expenses After Fees Waived and/or Reimbursed | 2,174,336 |
| Net Investment Income | 425,673,598 |
| Realized And Unrealized Gain (Loss) | |
| Net realized gain (loss) from: | |
| Investments—unaffiliated | (31,540,705) |
| Investments—affiliated | 3,392,420 |
| Futures contracts | 13,682,613 |
| Net Realized Gain (Loss) | (14,465,672) |
| Net change in unrealized appreciation (depreciation) on: | |
| Investments—unaffiliated | 3,888,625,045 |
| Investments—affiliated | 22,513,096 |
| Futures contracts | (724,988) |
| Net Change In Unrealized Appreciation (Depreciation) | 3,910,413,153 |
| Net Realized And Unrealized Gain | $3,895,947,481 |
| Net Increase In Net Assets From Operations | $4,321,621,079 |
| The accompanying notes are an integral part of these financial statements. | Appendix |
| Year Ended December 31, 2020 | Year Ended December 31, 2019 | |
| Increase (Decrease) In Net Assets | ||
| Operations | ||
| Net investment income | $425,673,598 | $393,599,409 |
| Net realized gain (loss) on investments | (14,465,672) | 53,806,401 |
| Net change in unrealized appreciation (depreciation) | 3,910,413,153 | 4,979,951,890 |
| Net Increase in net assets from operations | 4,321,621,079 | 5,427,357,700 |
| Capital Transactions | ||
| Proceeds from contributions | 7,849,994,984 | 11,063,823,888 |
| Value of withdrawals | (8,386,601,754) | (10,540,152,052) |
| Total increase (decrease) in net assets from capital transactions | (536,606,770) | 523,671,836 |
| Total Increase In Net Assets | 3,785,014,309 | 5,951,029,536 |
| Net Assets | ||
| Beginning of year | $23,207,958,345 | $17,256,928,809 |
| End of year | $26,992,972,654 | $23,207,958,345 |
| Appendix | The accompanying notes are an integral part of these financial statements. |
| Year Ended December 31, | |||||
| 2020 | 2019 | 2018 | 2017 | 2016 | |
| Total Return | 18.42% | 31.44% | -4.38% | 21.77% | 11.92% |
| Ratio to Average Net Assets | |||||
| Total expenses | 0.01% | 0.03% | 0.04% | 0.04% | 0.04% |
| Total expenses after fees waived and/or reimbursed | 0.01% | 0.02% | 0.04% | 0.04% | 0.04% |
| Net investment income | 1.82% | 1.95% | 1.92% | 1.93% | 2.11% |
| Supplemental Data | |||||
| Net assets, end of year (000) | $26,992,973 | $23,207,958 | $17,256,929 | $13,775,074 | $9,791,759 |
| Portfolio turnover rate | 5% | 3% | 12% | 11% | 4% |
| The accompanying notes are an integral part of these financial statements. | Appendix |
| Appendix | Notes to Financial Statements |
| Notes to Financial Statements | Appendix |
| Counterparty | Securities Loaned at Value | Cash Collateral Received1 | Net Amount |
| Barclays Bank PLC | 9,509,677 | (9,509,677) | — |
| Barclays Capital, Inc. | 3,621,116 | (3,621,116) | — |
| BofA Securities, Inc. | $4,809,927 | $(4,809,927) | — |
| Citigroup Global Markets, Inc. | 82,521,804 | (82,521,804) | — |
| Goldman Sachs & Co. | 549,985 | (549,985) | — |
| HSBC Bank PLC | 2,503,442 | (2,503,442) | — |
| Counterparty | Securities Loaned at Value | Cash Collateral Received1 | Net Amount |
| ING Financial Markets LLC | 18,046 | (18,046) | — |
| JP Morgan Securities LLC | 22,126,519 | (22,126,519) | — |
| National Financial Services LLC | 106,976 | (106,976) | — |
| SG Americas Securities LLC | 28,931,954 | (28,931,954) | — |
| UBS Securities LLC | 1,926,928 | (1,926,928) | — |
| Virtu Americas, LLC | 2,400,576 | (2,400,576) | — |
| Wells Fargo Securities LLC | 266,135 | (266,135) | — |
| $159,293,085 | $(159,293,085) | $— | |
| 1Collateral received in excess of the market value of securities on loan is not presented in this table. The total cash collateral received by the Master Portfolio is disclosed in the Master Portfolio’s Statement of Assets and Liabilities. | |||
| Appendix | Notes to Financial Statements |
| Notes to Financial Statements | Appendix |
| Purchases | Sales | Net Realized Gain (Loss) |
| $419,937,106 | 210,187,409 | $(42,188,498) |
| Appendix | Notes to Financial Statements |
| Tax cost | $13,299,017,725 |
| Gross unrealized appreciation | $14,560,736,626 |
| Gross unrealized depreciation | $(664,685,390) |
| Net unrealized appreciation | $13,896,051,236 |
| Notes to Financial Statements | Appendix |
| Appendix | Notes to Financial Statements |
S&P 500 Index Master Portfolio | Independent Trustees1
| Name and Year of Birth2 | Position(s) Held | Length of Time Served3 | Principal Occupation(s) During Past Five Years | Number of BlackRock- Advised Registered Investment Companies (“RICs”) Consisting of Investment Portfolios (“Portfolios”) Overseen | Public Company and Investment Company Directorships During Past Five Years |
| Mark Stalnecker 1951 | Chair of the Board and Trustee | Since 2019 & 2015 | Chief Investment Officer, University of Delaware from 1999 to 2013; Trustee and Chair of the Finance and Investment Committees, Winterthur Museum and Country Estate from 2005 to 2016; Member of the Investment Committee, Delaware Public Employees’ Retirement System since 2002; Member of the Investment Committee, Christiana Care Health System from 2009 to 2017; Member of the Investment Committee, Delaware Community Foundation from 2013 to 2014; Director and Chair of the Audit Committee, SEI Private Trust Co. from 2001 to 2014. | 33 RICs consisting of 159 Portfolios | None |
| Bruce R. Bond 1946 | Trustee | Since 2019 | Board Member, Amsphere Limited (software) since 2018; Trustee and Member of the Governance Committee, State Street Research Mutual Funds from 1997 to 2005; Board Member of Governance, Audit and Finance Committee, Avaya Inc. (computer equipment) from 2003 to 2007. | 33 RICs consisting of 159 Portfolios | None |
S&P 500 Index Master Portfolio | Independent Trustees1 (Continued)
| Name and Year of Birth2 | Position(s) Held | Length of Time Served3 | Principal Occupation(s) During Past Five Years | Number of BlackRock- Advised Registered Investment Companies (“RICs”) Consisting of Investment Portfolios (“Portfolios”) Overseen | Public Company and Investment Company Directorships During Past Five Years |
| Susan J.Carter 1956 | Trustee | Since 2016 | Director, Pacific Pension Institute from 2014 to 2018; Advisory Board Member, Center for Private Equity and Entrepreneurship at Tuck School of Business since 1997; Senior Advisor, Commonfund Capital, Inc. (“CCI”) (investment adviser) in 2015; Chief Executive Officer, CCI from 2013 to 2014; President & Chief Executive Officer, CCI from 1997 to 2013; Advisory Board Member, Girls Who Invest from 2015 to 2018 and Board Member thereof since 2018; Advisory Board Member, Bridges Fund Management since 2016; Trustee, Financial Accounting Foundation since 2017; Practitioner Advisory Board Member, Private Capital Research Institute ("PCRI") since 2017; Lecturer in the Practice of Management, Yale School of Management since 2019. | 33 RICs consisting of 159 Portfolios | None |
| Collette Chilton 1958 | Trustee | Since 2015 | Chief Investment Officer, Williams College since 2006; Chief Investment Officer, Lucent Asset Management Corporation from 1998 to 2006. | 33 RICs consisting of 159 Portfolios | None |
| Neil A. Cotty 1954 | Trustee | Since 2016 | Bank of America Corporation from 1996 to 2015, serving in various senior finance leadership roles, including Chief Accounting Officer from 2009 to 2015, Chief Financial Officer of Global Banking, Markets and Wealth Management from 2008 to 2009, Chief Accounting Officer from 2004 to 2008, Chief Financial Officer of Consumer Bank from 2003 to 2004, Chief Financial Officer of Global Corporate Investment Bank from 1999 to 2002. | 33 RICs consisting of 159 Portfolios | None |
S&P 500 Index Master Portfolio | Independent Trustees1 (Continued)
| Name and Year of Birth2 | Position(s) Held | Length of Time Served3 | Principal Occupation(s) During Past Five Years | Number of BlackRock- Advised Registered Investment Companies (“RICs”) Consisting of Investment Portfolios (“Portfolios”) Overseen | Public Company and Investment Company Directorships During Past Five Years |
| Lena G. Goldberg 1949 | Trustee | Since 2019 | Senior Lecturer, Harvard Business School, since 2008; Director, Charles Stark Draper Laboratory, Inc. since 2013; FMR LLC/Fidelity Investments (financial services) from 1996 to 2008, serving in various senior roles including Executive Vice President - Strategic Corporate Initiatives and Executive Vice President and General Counsel; Partner, Sullivan & Worcester LLP from 1985 to 1996 and Associate thereof from 1979 to 1985. | 33 RICs consisting of 159 Portfolios | None |
| Henry R. Keizer 1956 | Trustee | Since 2019 | Director, Park Indemnity Ltd. (captive insurer) since 2010; Director, MUFG Americas Holdings Corporation and MUFG Union Bank, N.A. (financial and bank holding company) from 2014 to 2016; Director, American Institute of Certified Public Accountants from 2009 to 2011; Director, KPMG LLP (audit, tax and advisory services) from 2004 to 2005 and 2010 to 2012; Director, KPMG International in 2012, Deputy Chairman and Chief Operating Officer thereof from 2010 to 2012 and U.S. Vice Chairman of Audit thereof from 2005 to 2010; Global Head of Audit, KPMGI (consortium of KPMG firms) from 2006 to 2010; Director, YMCA of Greater New York from 2006 to 2010. | 33 RICs consisting of 159 Portfolios | Hertz Global Holdings (car rental); Montpelier Re Holdings, Ltd. (publicly held property and casualty reinsurance) from 2013 until 2015; WABCO (commercial vehicle safety systems); Sealed Air Corp. (packaging) |
| Cynthia A. Montgomery 1952 | Trustee | Since 2009 | Professor, Harvard Business School since 1989. | 33 RICs consisting of 159 Portfolios | Newell Rubbermaid, Inc. (manufacturing) |
S&P 500 Index Master Portfolio | Independent Trustees1 (Continued)
| Name and Year of Birth2 | Position(s) Held | Length of Time Served3 | Principal Occupation(s) During Past Five Years | Number of BlackRock- Advised Registered Investment Companies (“RICs”) Consisting of Investment Portfolios (“Portfolios”) Overseen | Public Company and Investment Company Directorships During Past Five Years |
| Donald C. Opatrny 1952 | Trustee | Since 2019 | Trustee, Vice Chair, Member of the Executive Committee and Chair of the Investment Committee, Cornell University since 2004; President, Trustee and Member of the Investment Committee, The Aldrich Contemporary Art Museum from 2007 to 2014; Member of the Board and Investment Committee, University School from 2007 to 2018; Member of the Investment Committee, Mellon Foundation from 2009 to 2015; Trustee, Artstor (a Mellon Foundation affiliate) from 2010 to 2015; President and Trustee, the Center for the Arts, Jackson Hole from 2011 to 2018; Director, Athena Capital Advisors LLC (investment management firm) since 2013; Trustee and Chair of the Investment Committee, Community Foundation of Jackson Hole since 2014; Member of Affordable Housing Supply Board of Jackson, Wyoming since 2018; Member, Investment Funds Committee, State of Wyoming since 2017; Trustee, Phoenix Art Museum since 2018; Trustee, Arizona Community Foundation and Member of Investment Committee since 2020. | 33 RICs consisting of 159 Portfolios | None |
| Joseph P. Platt 1947 | Trustee | Since 2009 | General Partner, Thorn Partners, LP (private investments) since 1998; Director, WQED Multi-Media (public broadcasting not-for-profit) since 2001; Chair, Basic Health International (non-profit) since 2015. | 33 RICs consisting of 159 Portfolios | Greenlight Capital Re, Ltd. (reinsurance company); Consol Energy Inc. |
S&P 500 Index Master Portfolio | Independent Trustees1 (Continued)
| Name and Year of Birth2 | Position(s) Held | Length of Time Served3 | Principal Occupation(s) During Past Five Years | Number of BlackRock- Advised Registered Investment Companies (“RICs”) Consisting of Investment Portfolios (“Portfolios”) Overseen | Public Company and Investment Company Directorships During Past Five Years |
| Kenneth L. Urish 1951 | Trustee | Since 2009 | Managing Partner, Urish Popeck & Co., LLC (certified public accountants and consultants) since 1976; Past-Chairman of the Professional Ethics Committee of the Pennsylvania Institute of Certified Public Accountants and Committee Member thereof since 2007; Member of External Advisory Board, The Pennsylvania State University Accounting Department since founding in 2001; Principal, UP Strategic Wealth Investment Advisors, LLC since 2013; Trustee, The Holy Family Institute from 2001 to 2010; President and Trustee, Pittsburgh Catholic Publishing Associates from 2003 to 2008; Director, Inter-Tel from 2006 to 2007. | 33 RICs consisting of 159 Portfolios | None |
| Claire A. Walton 1957 | Trustee | Since 2016 | Chief Operating Officer and Chief Financial Officer of Liberty Square Asset Management, LP from 1998 to 2015; General Partner of Neon Liberty Capital Management, LLC since 2003; Director, Boston Hedge Fund Group from 2009 to 2018; Director, Woodstock Ski Runners since 2013; Director, Massachusetts Council on Economic Education from 2013 to 2015. | 33 RICs consisting of 159 Portfolios | None |
| 1The address of each Trustee is c/o BlackRock, Inc., 55 East 52nd Street, New York, New York 10055. | |||||
| 2Independent Trustees serve until their resignation, retirement, removal or death, or until December 31 of the year in which they turn 75. The Board may determine to extend the terms of Independent Trustees on a case-by-case basis, as appropriate. | |||||
| 3In connection with the acquisition of Barclays Global Investors by BlackRock, Inc. in December 2009, certain Independent Trustees were elected to the Board. Furthermore, effective January 1, 2019, three BlackRock Fund Complexes were realigned and consolidated into two BlackRock Fund Complexes. As a result, although the chart shows the year that each Independent Trusteejoined the Board, certain Independent Trustees first became members of the boards of other BlackRock-advised Funds or legacy BlackRock funds as follows: Bruce R. Bond, 2005; Cynthia A. Montgomery, 1994; Joseph P. Platt, 1999; Kenneth L. Urish, 1999; Lena G. Goldberg, 2016; Henry R. Keizer, 2016; Donald C. Opatrny, 2015. | |||||
S&P 500 Index Master Portfolio | Interested Trustees1,4
| Name and Year of Birth2 | Position(s) Held | Length of Time Served3 | Principal Occupation(s) During Past Five Years | Number of BlackRock- Advised Registered Investment Companies (“RICs”) Consisting of Investment Portfolios (“Portfolios”) Overseen | Public Company and Investment Company Directorships During Past Five Years |
| Robert Fairbairn 1965 | Trustee | Since 2018 | Vice Chairman of BlackRock, Inc. since 2019; Member of BlackRock’s Global Executive and Global Operating Committees; Co-Chair of BlackRock’s Human Capital Committee; Senior Managing Director of BlackRock, Inc. from 2010 to 2019; oversaw BlackRock’s Strategic Partner Program and Strategic Product Management Group from 2012 to 2019; Member of the Board of Managers of BlackRock Investments, LLC from 2011 to 2018; Global Head of BlackRock’s Retail and iShares businesses from 2012 to 2016. | 117 RICs consisting of 267 Portfolios | None |
| John M. Perlowski5 1964 | Trustee, President and Chief Executive Officer | Since 2015 (Trustee); Since 2010 (President and Chief Executive Officer) | Managing Director of BlackRock, Inc. since 2009; Head of BlackRock Global Accounting and Product Services since 2009; Advisory Director of Family Resource Network (charitable foundation) since 2009. | 118 RICs consisting of 268 Portfolios | None |
| 1 The address of each Trustee is c/o BlackRock, Inc., 55 East 52nd Street, New York, NY 10055. | |||||
| 2Independent Trustees serve until their resignation, retirement, removal or death, or until December 31 of the year in which they turn 75. The Board may determine to extend the terms of Independent Trustees on a case-by-case basis, as appropriate. | |||||
| 3In connection with the acquisition of Barclays Global Investors by BlackRock, Inc. in December 2009, certain Independent Trustees were elected to the Board. Furthermore, effective January 1, 2019, three BlackRock Fund Complexes were realigned and consolidated into two BlackRock Fund Complexes. As a result, although the chart shows the year that each Independent Trusteejoined the Board, certain Independent Trustees first became members of the boards of other BlackRock-advised Funds or legacy BlackRock funds as follows: Bruce R. Bond, 2005; Cynthia A. Montgomery, 1994; Joseph P. Platt, 1999; Kenneth L. Urish, 1999; Lena G. Goldberg, 2016; Henry R. Keizer, 2016; Donald C. Opatrny, 2015. | |||||
| 4Mr. Fairbairn and Mr. Perlowski are both “interested persons,” as defined in the 1940 Act, of the Trust/MIP based on their positions with BlackRock, Inc. and its affiliates. Mr. Fairbairn and Mr. Perlowski are also board members of the BlackRock Fixed-Income Complex. | |||||
| 5Mr. Perlowski is also a trustee of the BlackRock Credit Strategies Fund. | |||||
S&P 500 Index Master Portfolio | Officers Who Are Not Trustees1
| Name and Year of Birth2 | Position(s) Held | Length of Time Served3 | Principal Occupation(s) During Past Five Years | ||
| Thomas Callahan 1968 | Vice President | Since 2016 | Managing Director of BlackRock, Inc. since 2013; Member of the Board of Managers of BlackRock Investments, LLC (principal underwriter) since 2019 and Managing Director thereof since 2017; Head of BlackRock’s Global Cash Management Business since 2016; Co-Head of the Global Cash Management Business from 2014 to 2016; Deputy Head of the Global Cash Management Business from 2013 to 2014; Member of the Cash Management Group Executive Committee since 2013; Chief Executive Officer of NYSE Liffe U.S. from 2008 to 2013. | ||
| Jennifer McGovern 1977 | Vice President | Since 2014 | Managing Director of BlackRock, Inc. since 2016; Director of BlackRock, Inc. from 2011 to 2015; Head of Americas Product Development and Governance for BlackRock’s Global Product Group since 2019; Head of Product Structure and Oversight for BlackRock’s U.S. Wealth Advisory Group from 2013 to 2019. | ||
| Neal J. Andrews 1966 | Chief Financial Officer | Since 2009 | Chief Financial Officer of the iShares® exchange traded funds from 2019 to 2020; Managing Director of BlackRock, Inc. since 2006. | ||
| Jay M. Fife 1970 | Treasurer | Since 2009 | Managing Director of BlackRock, Inc. since 2007. | ||
| Charles Park 1967 | Chief Compliance Officer | Since 2014 | Anti-Money Laundering Compliance Officer for certain BlackRock-advised Funds from 2014 to 2015; Chief Compliance Officer of BlackRock Advisors, LLC and the BlackRock-advised Funds in the BlackRock Multi-Asset Complex and the BlackRock Fixed-Income Complex since 2014; Principal of and Chief Compliance Officer for iShares® Delaware Trust Sponsor LLC since 2012 and BlackRock Fund Advisors (“BFA”) since 2006; Chief Compliance Officer for the BFA-advised iShares® exchange traded funds since 2006; Chief Compliance Officer for BlackRock Asset Management International Inc. since 2012. | ||
| Lisa Belle 1968 | Anti-Money Laundering Compliance Officer | Since 2019 | Director of BlackRock, Inc. since 2017; Global Head of Anti-Money Laundering at BlackRock , Inc. since 2017; Director of AML Monitoring and Investigations Group of Citibank from 2015 to 2017; Global Anti-Money Laundering and Economic Sanctions Officer for MasterCard from 2011 to 2015. | ||
| Janey Ahn 1975 | Secretary | Since 2019 | Managing Director of BlackRock, Inc. since 2018; Director of BlackRock, Inc. from 2009 to 2017. | ||
| 1The address of each Officer is c/o BlackRock, Inc., 55 East 52nd Street, New York, New York 10055. | |||||
| 2 Officers of the Trust/MIP serve at the pleasure of the Board. | |||||


2. | Code of Ethics. |
Homestead Funds Trust has adopted a Senior Officer Code of Ethics, as defined in Item 2 of Form N-CSR, which applies to its principal executive officer, principal financial officer, principal accounting or controller, or persons performing similar functions. The Senior Officer Code of Ethics is available on Homestead Funds Trust’s website at www.homesteadfunds.com or without charge, upon request, by calling the Chief Compliance Officer at 1-800-258-3030. During the period covered by this report, no substantive amendments were approved or waivers were granted to the Senior Officer Code of Ethics.
3. | Audit Committee Financial Expert. |
The Registrant’s board of directors has determined that Julie H. Dellinger, member of the Registrant’s audit committee, qualifies as an audit committee financial expert, as such term is defined in Instruction 2(b) to Item 3 of Form N-CSR. Ms. Dellinger is “independent” as such term is defined in paragraph (a)(2) of Item 3 of Form N-CSR.
Under applicable securities laws, a person who is determined to be an audit committee financial expert will not be deemed an “expert” for any purpose, including, without limitation, for the purposes of Section 11 of the Securities Act of 1933, as a result of being designated or identified as an audit committee financial expert. The designation or identification of a person as an audit committee financial expert does not impose on such person any duties, obligations, or liabilities that are greater than the duties, obligations, and liabilities imposed on such person as a member of the audit committee and board of directors in the absence of such designation or identification. The designation or identification of a person as an audit committee financial expert does not affect the duties, obligations or liability of any other member of the audit committee or Board of Trustees.
4. | Principal Accountant Fees and Services. |
(a) | Audit Fees1 |
Fiscal Year 2019 | $8,354 |
Fiscal Year 2020 | $6,585 |
(b) | Audit-Related Fees |
Fiscal Year 2019 | $0 |
Fiscal Year 2020 | $0 |
1
(c) | These fees were for professional services rendered for the audit of the financial statements of the Intermediate Bond Fund, including services that are normally provided in connection with the Fund’s statutory and regulatory filings.
Tax Fees |
Fiscal Year 2019 | $0 |
Fiscal Year 2020 | $ 0 |
(d) | All Other Fees |
Fiscal Year 2019 | $0 |
Fiscal Year 2020 | $ 0 |
(e)(1) | The Registrant’s audit committee is directly responsible for approving the services to be provided by the principal accountant. |
(2) | None of the services provided to the Registrant described in paragraphs (b)-(d) of Item 4 were approved by the Audit Committee pursuant to paragraph (c)(7)(i)(C) of Rule 2-01 of Regulation S-X. |
(f)Not applicable
(g) | The National Rural Electric Cooperative Association paid the Funds’ principal accountant $3,970 and $114,007 in 2020 and 2019 respectively, for consulting and tax services. The National Rural Electric Cooperative Association is the parent company, hence a controlling entity of RE Advisers Corporation, the investment adviser that provided ongoing services to Homestead Funds Trust for each of its last two fiscal years. |
(h) | Homestead Funds Trust’s Audit Committee considered the provision of non-audit services, which were not approved by the Audit Committee pursuant to paragraph (c)(7)(ii) of Rule 2-01 of Regulation S-X, that the principal accountant rendered to the National Rural Electric Cooperative Association, a controlling entity of RE Advisers Corporation, the investment adviser that provided ongoing services to Homestead Funds Trust for each of its last two fiscal years. The Audit Committee determined that these services were compatible with maintaining the principal accountant’s independence. |
5. | Audit Committee of Listed Registrants. |
Not applicable.
6. | Investments. |
(a) | The Registrant’s schedule of investments in unaffiliated issuers is included in the report to shareholders under Item 1 of this Form N-CSR. |
(b) | Not applicable. |
7. | Disclosure of Proxy Voting Policies and Procedures for Closed-End Management Investment Companies. |
Not applicable.
8. | Portfolio Managers of Closed-End Management Investment Companies. |
Not applicable.
9. | Purchases of Equity Securities by Closed-End Management Investment Company and Affiliated Purchasers. |
Not applicable.
10. | Submission of Matters to a Vote of Security Holders. |
Not applicable.
11. | Controls and Procedures. |
(a) | Disclosure Controls and Procedures. The Registrant’s principal executive officer and principal financial officer concluded, based on their evaluation of the disclosure controls and procedures as of a date within 90 days of the filing date of this report, that the Registrant’s disclosure controls and procedures are effectively designed to provide reasonable assurance that the information required to be disclosed by the Registrant in this report is recorded, processed, summarized and reported by the filing date, including the Registrant’s principal executive officer and principal financial officer, as appropriate, to allow timely decisions regarding required disclosure. |
(b) | Internal Control. There were no changes in the Registrant’s internal control over financial reporting that occurred during the period covered by this report that have materially affected, or are reasonably likely to materially affect, the Registrant’s internal control over financial reporting. |
12. | Disclosure of Securities Lending Activities For Closed-End Management Investment Companies. |
Not applicable.
13. | Exhibits. |
(a)(1) | Not required with this filing. |
(a)(3) | Not applicable. |
(a)(4) | Not applicable. |
SIGNATURES
Pursuant to the requirements of the Securities Exchange Act of 1934 and the Investment Company Act of 1940, the registrant has duly caused this report to be signed on its behalf by the undersigned, thereunto duly authorized.
HOMESTEAD FUNDS TRUST
By: | /s/ Mark D. Santero |
| Mark D. Santero President, Chief Executive Officer and Trustee (Principal Executive Officer)
|
Date: March 5, 2021
Pursuant to the requirements of the Securities Exchange Act of 1934 and the Investment Company Act of 1940, this report has been signed below by the following persons on behalf of the registrant and in the capacities and on the dates indicated.
By: | /s/ Mark D. Santero |
| Mark D. Santero President, Chief Executive Officer and Trustee (Principal Executive Officer)
|
Date: March 5, 2021
By: | /s/ Amy M. DiMauro |
| Amy M. DiMauro Treasurer (Principal Financial & Accounting Officer)
|
Date: March 5, 2021
|