UNITED STATES SECURITIES AND EXCHANGE COMMISSION Washington, D.C. 20549 |
FORM N-CSR |
CERTIFIED SHAREHOLDER REPORT OF REGISTERED MANAGEMENT INVESTMENT COMPANIES Investment Company Act File number: 811-23429 |
HOMESTEAD FUNDS TRUST (Exact name of registrant as specified in charter) 4301 Wilson Boulevard Arlington, VA 22203 (Address of principal executive office – Zip code) |
Danielle Sieverling Homestead Funds Trust 4301 Wilson Boulevard Arlington, VA 22203 (Name and address of agent for service) |
Copies to: Amy Ward Pershkow, Esq. Vedder Price P.C. 1401 New York Avenue Washington, D.C. 20005 (Name and addresses of agent for service)
|
Registrant’s telephone number, including area code: 800-258-3030 Date of fiscal year end: December 31 Date of reporting period: December 31, 2022
|
Item 1. Reports to Stockholders.
(a)The following is a copy of the report transmitted to stockholders pursuant to Rule 30e-1 under the Act (17 CFR 270.30e-1).
(b) Not applicable.

| 1 | ||
| Performance Evaluation | ||
| 2 | ||
| 4 | ||
| 6 | ||
| 8 | ||
| 10 | ||
| 12 | ||
| 14 | ||
| 16 | ||
| 18 | ||
| 20 | ||
| 22 | ||
| 24 | ||
| 37 | ||
| Portfolio of Investments | ||
| 38 | ||
| 40 | ||
| 43 | ||
| 49 | ||
| 56 | ||
| 61 | ||
| 62 | ||
| 64 | ||
| 66 | ||
| 68 |
| 70 | ||
| 72 | ||
| 74 | ||
| Financial Highlights | ||
| 80 | ||
| 81 | ||
| 82 | ||
| 83 | ||
| 84 | ||
| 85 | ||
| 86 | ||
| 87 | ||
| 88 | ||
| 89 | ||
| 90 | ||
| 100 | ||
| 103 | ||
| 104 |


| Average Annual Total Returns (periods ended 12/31/22) | |||||||
| 1 YR % | 5 YR % | 10 YR % | |||||
| Daily Income Fund | 1.20 | 0.78 | 0.41 | ||||
| Yield | |||
| Annualized 7-day current yield quoted 12/31/22 | 3.53% | ||
| Security Diversification | ||
| % of Total Investments | ||
| as of 12/31/21 | as of 12/31/22 | |
| U.S. government and agency obligations | 100.0 | 81.2 |
| Short-term and other assets* | 0.0** | 18.8 |
| Total | 100.0% | 100.0% |
| Maturity | |||||
| as of 12/31/21 | as of 12/31/22 | ||||
| Average weighted maturity | 42 days | 34 days | |||
| Investment Advisor: Homestead Advisers | |
 | Mauricio Agudelo, CFA Head of Fixed-Income Investments BS, Finance, The University of Maryland, Robert H. Smith School of Business |
 | Ivan Naranjo, CFA, FRM Fixed-Income Portfolio Manager BS, Finance, The University of Maryland, Robert H. Smith School of Business |
| Average Annual Total Returns (periods ended 12/31/22) | |||||||
| 1 YR % | 5 YR % | 10 YR % | |||||
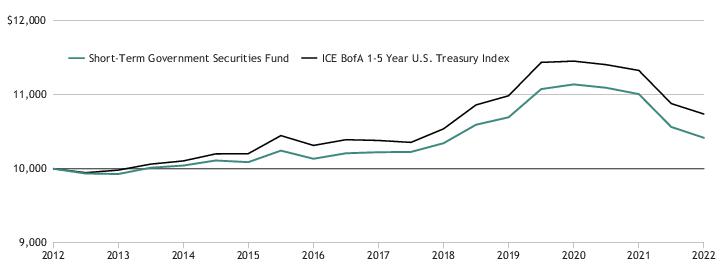
| Short-Term Government Securities Fund | -5.41 | 0.36 | 0.40 | ||||
| ICE BofA 1-5 Year U.S. Treasury Index | -5.25 | 0.66 | 0.71 | ||||
| Security Diversification | ||
| % of Total Investments | ||
| as of 12/31/21 | as of 12/31/22 | |
| U.S. government and agency obligations | 39.7 | 66.6 |
| Corporate bonds—government guaranteed | 50.2 | 25.8 |
| Asset-backed securities | 3.6 | 3.1 |
| Corporate bonds—other | 3.0 | 1.6 |
| Mortgage-backed securities | 0.9 | 1.1 |
| Municipal bonds | 0.9 | 0.1 |
| Short-term and other assets* | 1.7 | 1.7 |
| Total | 100.0% | 100.0% |
| Maturity | |||||
| as of 12/31/21 | as of 12/31/22 | ||||
| Average weighted maturity | 2.45 | 2.48 | |||
| Investment Advisor: Homestead Advisers | |
| Mauricio Agudelo, CFA Head of Fixed-Income Investments BS, Finance, The University of Maryland, Robert H. Smith School of Business |
| Ivan Naranjo, CFA, FRM Fixed-Income Portfolio Manager BS, Finance, The University of Maryland, Robert H. Smith School of Business |
| Average Annual Total Returns (periods ended 12/31/22) | |||||||
| 1 YR % | 5 YR % | 10 YR % | |||||
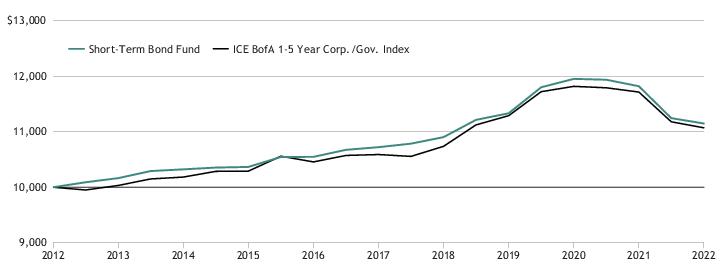
| Short-Term Bond Fund | -5.72 | 0.76 | 1.08 | ||||
| ICE BofA 1-5 Year Corp./Gov. Index | -5.54 | 0.87 | 1.01 | ||||
| Security Diversification | ||
| % of Total Investments | ||
| as of 12/31/21 | as of 12/31/22 | |
| U.S. government and agency obligations | 30.9 | 51.4 |
| Corporate bonds—other | 35.4 | 26.1 |
| Asset-backed securities | 12.8 | 10.4 |
| Yankee bonds | 14.2 | 7.3 |
| Corporate bonds—government guaranteed | 2.6 | 2.1 |
| Mortgage-backed securities | 0.6 | 0.9 |
| Municipal bonds | 1.7 | 0.6 |
| Short-term and other assets | 1.8 | 1.2 |
| Total | 100.0% | 100.0% |
| Maturity | |||||
| as of 12/31/21 | as of 12/31/22 | ||||
| Average weighted maturity | 2.68 | 2.70 | |||
| Investment Advisor: Homestead Advisers | |
| Mauricio Agudelo, CFA Head of Fixed-Income Investments BS, Finance, The University of Maryland, Robert H. Smith School of Business |
| Ivan Naranjo, CFA, FRM Fixed-Income Portfolio Manager BS, Finance, The University of Maryland, Robert H. Smith School of Business |
| Average Annual Total Returns (periods ended 12/31/22) | |||||
| 1 YR % | Since Inception % | ||||
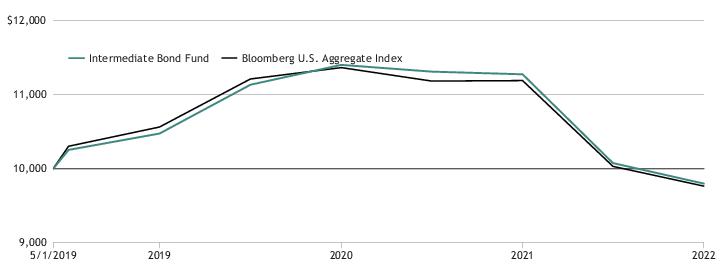
| Intermediate Bond Fund | -13.38 | -0.70 | |||
| Bloomberg U.S. Aggregate Index | -13.01 | -0.77 | |||
| Security Diversification | ||
| % of Total Investments | ||
| as of 12/31/21 | as of 12/31/22 | |
| U.S. government and agency obligations | 14.9 | 34.5 |
| Corporate bonds—other | 35.5 | 23.0 |
| Mortgage-backed securities | 14.9 | 22.3 |
| Asset-backed securities | 12.7 | 9.2 |
| Yankee bonds | 12.1 | 4.9 |
| Municipal bonds | 3.6 | 2.5 |
| Corporate bonds—government guaranteed | 0.5 | 0.4 |
| Short-term and other assets | 5.8 | 3.2 |
| Total | 100.0% | 100.0% |
| Maturity | |||||
| as of 12/31/21 | as of 12/31/22 | ||||
| Average weighted maturity | 7.90 | 8.34 | |||
| Investment Advisor: Homestead Advisers* | |
 | Mark Iong, CFA Equity Portfolio Manager BS, Operations Research and Information Engineering, Cornell |
| Ivan Naranjo, CFA, FRM Fixed-Income Portfolio Manager BS, Finance, The University of Maryland, Robert H. Smith School of Business |
| Homestead Advisers' Jim Polk, head of equity investments, and Mauricio Agudelo, head of fixed-income investments, co-manage this fund with the individuals named above. Their bios appear in adjacent fund manager letters. | |
| * | On February 10, 2023, Prabha Carpenter retired from Homestead Advisers and no longer serves as portfolio manager of the Rural America Growth & Income Fund. |
| Average Annual Total Returns (periods ended 12/31/22) | |||||
| 1 YR % | Since Inception % | ||||
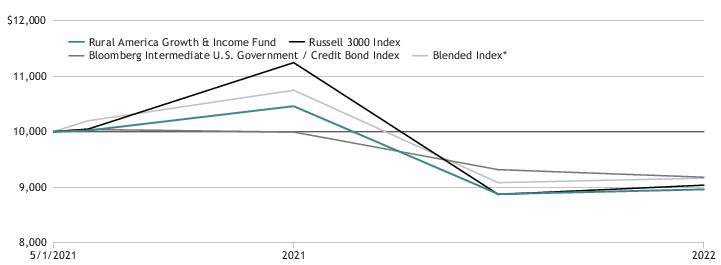
| Rural America Growth & Income Fund | -14.18 | -6.26 | |||
| Blended Index* | -14.59 | -5.07 | |||
| Russell 3000 Index** | -19.22 | -5.63 | |||
| Bloomberg Intermediate U.S. Government/Credit Bond Index** | -8.24 | -5.06 | |||
| Security Diversification | |
| % of Total Investments as of 12/31/22 | |
| Common stocks | 55.5 |
| Information technology | 11.6 |
| Industrials | 9.7 |
| Health care | 8.1 |
| Financials | 7.8 |
| Consumer discretionary | 7.2 |
| Real estate | 4.5 |
| Energy | 2.4 |
| Consumer staples | 2.1 |
| Materials | 1.7 |
| Communication services | 0.4 |
| U.S. government and agency obligations | 18.4 |
| Corporate bonds—other | 13.0 |
| Asset-backed securities | 3.0 |
| Municipal bonds | 1.5 |
| Mortgage-backed securities | 1.2 |
| Short-term and other assets | 7.4 |
| 100.0% | |
| Top 10 Holdings | |||
| % of Total Investments as of 12/31/22 | |||
| Deere & Co. | 2.7 | ||
| Federal Farm Credit Bank, 09/27/29, 4.00% | 2.7 | ||
| Federal Farm Credit Bank, 02/25/26, 3.32% | 2.7 | ||
| Federal Farm Credit Bank, 10/21/25, 0.52% | 2.4 | ||
| Federal Farm Credit Bank, 04/28/27, 1.20% | 2.3 | ||
| Hershey Co. (The) | 2.1 | ||
| Jack Henry & Associates, Inc. | 2.1 | ||
| Zoetis Inc. | 2.0 | ||
| American Tower Corp. | 2.0 | ||
| Paycom Software, Inc. | 1.9 | ||
| Total | 22.9% | ||
| Maturity | |||||
| as of 12/31/21 | as of 12/31/22 | ||||
| Average weighted maturity | 4.26 | 4.17 | |||
| Average Annual Total Returns (periods ended 12/31/22) | |||||||
| 1 YR % | 5 YR % | 10 YR % | |||||
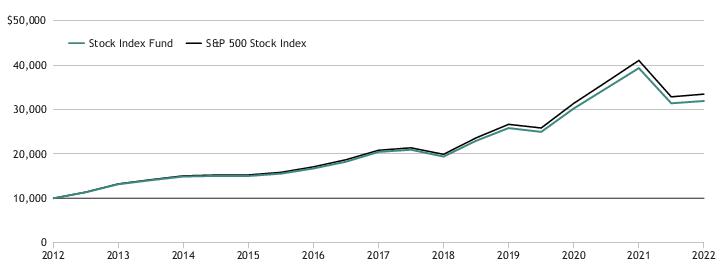
| Stock Index Fund | -18.50 | 8.86 | 11.97 | ||||
| S&P 500 Stock Index | -18.11 | 9.42 | 12.56 | ||||
| Sector Diversification | |||
| % of Total Investments as of 12/31/22 | |||
| Information technology | 25.5 | ||
| Health care | 15.7 | ||
| Financials | 12.3 | ||
| Consumer discretionary | 9.7 | ||
| Industrials | 8.6 | ||
| Communication | 7.2 | ||
| Consumer staples | 7.2 | ||
| Energy | 5.2 | ||
| Utilities | 3.2 | ||
| Materials | 2.7 | ||
| Real Estate | 2.7 | ||
| Total | 100.0% | ||
| Top 10 Equity Holdings | |||
| % of Total Investments as of 12/31/22 | |||
| Apple, Inc. | 6.0 | ||
| Microsoft Corp. | 5.5 | ||
| Alphabet, Inc. | 3.1 | ||
| Amazon.com, Inc. | 2.3 | ||
| Berkshire Hathaway Inc. | 1.7 | ||
| UnitedHealth Group Inc. | 1.5 | ||
| Johnson & Johnson | 1.4 | ||
| Exxon Mobil Corp. | 1.4 | ||
| JPMorgan Chase & Co. | 1.2 | ||
| NVIDIA Corp. | 1.1 | ||
| Total | 25.2% | ||
| Investment Advisor: Homestead Advisers* | |
| Mark Iong, CFA Equity Portfolio Manager BS, Operations Research and Information Engineering, Cornell |
 | Jim Polk, CFA Head of Equity Investments BA, English, Colby College; MBA, The Olin Graduate School of Business at Babson College |
| * | On February 10, 2023, Prabha Carpenter retired from Homestead Advisers and no longer serves as portfolio manager of the Value Fund. In addition, effective February 10, 2023, Mark Iong began serving as portfolio manager of the Value Fund. |
| Average Annual Total Returns (periods ended 12/31/22) | |||||||
| 1 YR % | 5 YR % | 10 YR % | |||||
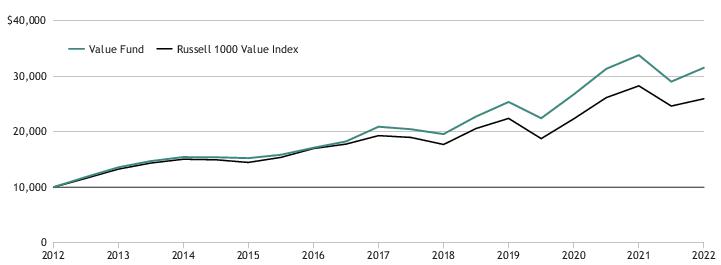
| Value Fund | -5.50 | 8.74 | 12.25 | ||||
| Russell 1000 Value Index | -7.54 | 6.67 | 10.29 | ||||
| Sector Diversification | |||
| % of Total Investments as of 12/31/22 | |||
| Health care | 22.7 | ||
| Financials | 17.4 | ||
| Industrials | 17.2 | ||
| Information technology | 10.3 | ||
| Materials | 7.8 | ||
| Energy | 7.7 | ||
| Consumer discretionary | 6.7 | ||
| Communication services | 4.3 | ||
| Real estate | 2.7 | ||
| Consumer staples | 1.0 | ||
| Short-term and other assets | 2.2 | ||
| Total | 100.0% | ||
| Top 10 Equity Holdings | |||
| % of Total Investments as of 12/31/22 | |||
| Honeywell International, Inc. | 3.9 | ||
| JPMorgan Chase & Co. | 3.8 | ||
| AbbVie Inc. | 3.6 | ||
| Abbott Laboratories | 3.5 | ||
| Microsoft Corp. | 3.5 | ||
| Chevron Corp. | 3.2 | ||
| Alphabet, Inc. | 3.1 | ||
| ConocoPhillips | 3.0 | ||
| Parker-Hannifin Corp. | 3.0 | ||
| Cigna Corp. | 3.0 | ||
| Total | 33.6 % | ||
| Subadvisor: T. Rowe Price Associates | |
 | Taymour Tamaddon, CFA Portfolio Manager BS, Applied Physics, Cornell University; MBA, Finance, Dartmouth |
| Average Annual Total Returns (periods ended 12/31/22) | |||||||
| 1 YR % | 5 YR % | 10 YR % | |||||
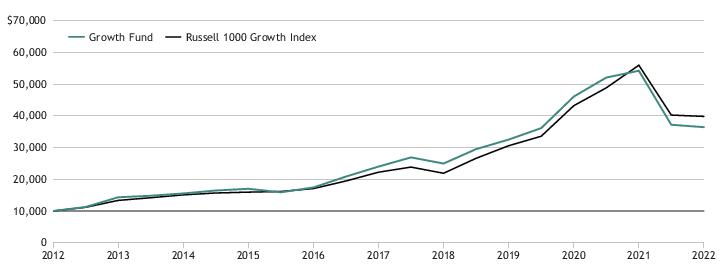
| Growth Fund | -33.45 | 7.60 | 13.22 | ||||
| Russell 1000 Growth Index | -29.14 | 10.96 | 14.10 | ||||
| Sector Diversification | |||
| % of Total Investments as of 12/31/22 | |||
| Information technology | 46.2 | ||
| Health care | 21.9 | ||
| Consumer discretionary | 16.0 | ||
| Communication services | 11.7 | ||
| Industrials | 1.7 | ||
| Consumer staples | 1.1 | ||
| Short-term and other assets | 1.4 | ||
| Total | 100.0% | ||
| Top 10 Equity Holdings | |||
| % of Total Investments as of 12/31/22 | |||
| Microsoft Corp. | 11.5 | ||
| Alphabet, Inc. | 7.2 | ||
| Apple, Inc. | 6.5 | ||
| Amazon.com, Inc. | 6.5 | ||
| UnitedHealth Group, Inc. | 5.0 | ||
| Cigna Corp. | 4.0 | ||
| Intuit, Inc. | 3.6 | ||
| Fiserv, Inc. | 3.3 | ||
| Mastercard Inc. | 2.8 | ||
| Visa Inc. | 2.6 | ||
| Total | 53.0% | ||
| Subadvisor: Harding Loevner LP | |
| Ferrill Roll, CFA Co-Lead Portfolio Manager | Babatunde Ojo, CFA Portfolio Manager |
| Andrew West, CFA Co-Lead Portfolio Manager | Patrick Todd, CFA Portfolio Manager |
| Bryan Lloyd, CFA Portfolio Manager | |
| Average Annual Total Returns (periods ended 12/31/22) | |||||||
| 1 YR % | 5 YR % | 10 YR % | |||||
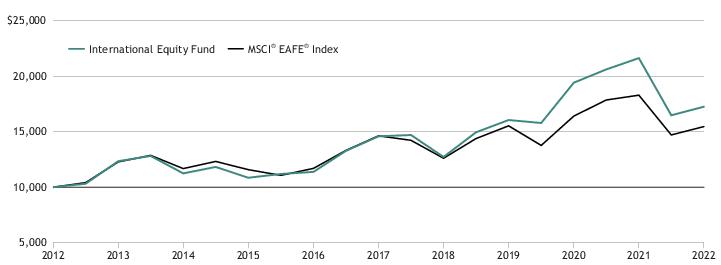
| International Equity Fund* | -19.13 | 3.50 | 5.64 | ||||
| MSCI® EAFE® Index | -14.45 | 1.54 | 4.67 | ||||
| Country Diversification | |||
| % of Total Investments as of 12/31/22 | |||
| Japan | 17.7 | ||
| France | 11.7 | ||
| Switzerland | 10.7 | ||
| Germany | 10.0 | ||
| Sweden | 9.4 | ||
| Britain | 7.6 | ||
| Canada | 4.4 | ||
| Australia | 4.1 | ||
| Hong Kong | 3.9 | ||
| Singapore | 3.8 | ||
| China | 2.9 | ||
| Spain | 2.2 | ||
| Netherlands | 2.2 | ||
| United States of America | 1.8 | ||
| Republic of South Korea | 1.2 | ||
| India | 1.0 | ||
| Denmark | 0.9 | ||
| Taiwan | 0.7 | ||
| Russia | 0.0 | ||
| Brazil, Mexico & Indonesia | 1.5 | ||
| Short-term and other assets | 2.3 | ||
| Total | 100.0% | ||
| Top 10 Equity Holdings | |||
| % of Total Investments as of 12/31/22 | |||
| L’Oréal SA | 4.0 | ||
| AIA Group Ltd. | 3.9 | ||
| DBS Group Holdings Ltd. | 3.8 | ||
| BHP Group Ltd. ADR | 3.6 | ||
| Infineon Technologies AG | 3.5 | ||
| Roche Holding AG REG | 3.5 | ||
| Atlas Copco AB | 3.4 | ||
| Schneider Electric SE | 3.3 | ||
| Allianz SE REG | 3.2 | ||
| Rio Tinto PLC | 2.8 | ||
| Total | 35.0% | ||
| Investment Advisor: Homestead Advisers* | |
| Mark Iong, CFA Equity Portfolio Manager BS, Operations Research and Information Engineering, Cornell |
| Jim Polk, CFA Head of Equity Investments BA, English, Colby College; MBA, The Olin Graduate School of Business at Babson College |
| * | On February 10, 2023, Prabha Carpenter retired from Homestead Advisers and no longer serves as portfolio manager of the Small-Company Stock Fund. In addition, effective February 10, 2023, Mark Iong began serving as portfolio manager of the Small-Company Stock Fund. |
| Average Annual Total Returns (periods ended 12/31/22) | |||||||
| 1 YR % | 5 YR % | 10 YR % | |||||
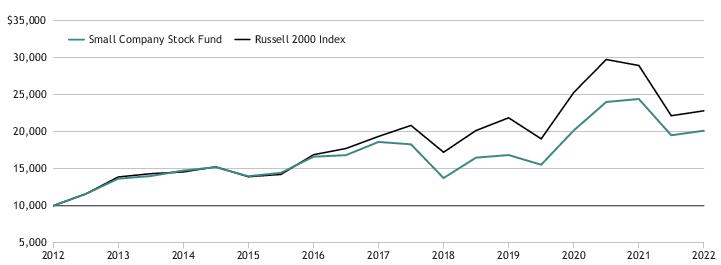
| Small-Company Stock Fund | -16.91 | 2.00 | 7.47 | ||||
| Russell 2000 Index | -20.44 | 4.13 | 9.01 | ||||
| Sector Diversification | |||
| % of Total Investments as of 12/31/22 | |||
| Industrials | 24.3 | ||
| Financials | 17.8 | ||
| Information technology | 16.9 | ||
| Health care | 14.1 | ||
| Consumer discretionary | 8.8 | ||
| Materials | 7.1 | ||
| Energy | 3.5 | ||
| Real estate | 3.4 | ||
| Communication services | 2.1 | ||
| Short-term and other assets | 2.0 | ||
| Total | 100.0% | ||
| Top 10 Equity Holdings | |||
| % of Total Investments as of 12/31/22 | |||
| Applied Industrial Technologies, Inc. | 4.1 | ||
| Atkore Inc. | 4.0 | ||
| Federal Signal Corp. | 3.6 | ||
| Summit Materials, Inc. | 3.4 | ||
| Medpace Holdings, Inc. | 3.3 | ||
| Comfort Systems USA, Inc. | 2.9 | ||
| Descartes Systems Group Inc. (The) | 2.9 | ||
| Glacier Bancorp, Inc. | 2.8 | ||
| Encore Capital Group, Inc. | 2.6 | ||
| Eastern Bankshares, Inc. | 2.4 | ||
| Total | 32.0% | ||
| Daily Income Fundb | Beginning Account Value July 1, 2022 | Ending Account Value December 31, 2022 | Expenses Paid During the Perioda | Annualized Expense Ratio for the Period Ended December 31, 2022 |
| Actual Return | $1,000.00 | $1,011.50 | $3.04 | 0.60% |
| Hypothetical Return (5% return before expenses) | $1,000.00 | $1,021.98 | $3.06 | 0.60% |
| Short-Term Government Securities Fundb | ||||
| Actual Return | $1,000.00 | $985.80 | $3.76 | 0.75% |
| Hypothetical Return (5% return before expenses) | $1,000.00 | $1,021.22 | $3.82 | 0.75% |
| Short-Term Bond Fund | ||||
| Actual Return | $1,000.00 | $991.40 | $3.65 | 0.73% |
| Hypothetical Return (5% return before expenses) | $1,000.00 | $1,021.34 | $3.70 | 0.73% |
| Intermediate Bond Fundb | ||||
| Actual Return | $1,000.00 | $972.50 | $3.98 | 0.80% |
| Hypothetical Return (5% return before expenses) | $1,000.00 | $1,020.97 | $4.08 | 0.80% |
| Rural America Growth & Income Fundb | ||||
| Actual Return | $1,000.00 | $1,017.40 | $5.08 | 1.00% |
| Hypothetical Return (5% return before expenses) | $1,000.00 | $1,019.96 | $5.09 | 1.00% |
| Stock Index Fundc | ||||
| Actual Return | $1,000.00 | $1,016.50 | $2.44 | 0.48% |
| Hypothetical Return (5% return before expenses) | $1,000.00 | $1,022.58 | $2.44 | 0.48% |
| Value Fund | ||||
| Actual Return | $1,000.00 | $1,086.10 | $3.25 | 0.62% |
| Hypothetical Return (5% return before expenses) | $1,000.00 | $1,021.89 | $3.15 | 0.62% |
| Growth Fund | ||||
| Actual Return | $1,000.00 | $987.10 | $4.25 | 0.85% |
| Hypothetical Return (5% return before expenses) | $1,000.00 | $1,020.73 | $4.32 | 0.85% |
| International Equity Fundb | ||||
| Actual Return | $1,000.00 | $1,046.70 | $5.15 | 1.00% |
| Hypothetical Return (5% return before expenses) | $1,000.00 | $1,019.96 | $5.09 | 1.00% |
| Small-Company Stock Fund | ||||
| Actual Return | $1,000.00 | $1,031.50 | $5.50 | 1.07% |
| Hypothetical Return (5% return before expenses) | $1,000.00 | $1,019.58 | $5.47 | 1.07% |
| a. | The dollar amounts shown as “Expenses Paid During the Period” are equal to each Fund’s annualized expense ratio multiplied by the average account value over the period, multiplied by the number of days in the period 184, then divided by 365. |
| b. | Reflects fee waiver and/or expense reimbursements in effect during the period. |
| c. | The Stock Index Fund is a feeder fund that invests substantially all of its assets in a Master Portfolio. The example reflects the expenses of both the feeder fund and the Master Portfolio. |
| 1 | Homestead Advisers serves as an administrator to the Stock Index Fund pursuant to an administrative services agreement with that Fund and does not currently serve as the Fund’s investment adviser. |
| Fund | Statement of Operations | Statement of change in net assets | Financial Highlights |
| Daily Income Fund | For the year ended December 31, 2022 | For the years ended December 31, 2022 and 2021 | For the years ended December 31, 2022, 2021, 2020, 2019, and 2018 |
| Short-Term Government Securities Fund | |||
| Short-Term Bond Fund | |||
| Stock Index Fund | |||
| Value Fund | |||
| Growth Fund | |||
| International Equity Fund | |||
| Small-Company Stock Fund | |||
| Intermediate Bond Fund | For the year ended December 31, 2022 | For the years ended December 31, 2022 and December 31, 2021 | For the years ended December 31, 2022, 2021, and 2020, and the period May 1, 2019 (inception) to December 31, 2019 |
| Rural America Growth & Income Fund | For the year ended December 31, 2022 | For the year ended December 31, 2022 and the period ended from May 1, 2021 (inception) to December 31, 2021 | For the year ended December 31, 2022, and the period ended from May 1, 2021 (inception) to December 31, 2021 |

| U.S. Government & Agency Obligations | 81.2% of portfolio | ||||
| Interest Rate / Yield | Maturity Date | Face Amount | Value | |
| Federal Farm Credit Bank | 4.34%(a) | 05/19/23 | $1,000,000 | $1,000,000 |
| Federal Farm Credit Bank | 4.33(a) | 06/14/23 | 500,000 | 500,000 |
| Federal Farm Credit Bank | 4.32(a) | 06/23/23 | 500,000 | 499,990 |
| Federal Farm Credit Bank | 4.33(a) | 09/18/23 | 500,000 | 500,000 |
| Federal Farm Credit Bank | 4.34(a) | 09/20/23 | 1,000,000 | 1,000,000 |
| Federal Farm Credit Bank | 4.35(a) | 09/29/23 | 1,000,000 | 1,000,000 |
| Federal Farm Credit Bank | 4.36(a) | 11/07/23 | 500,000 | 500,000 |
| Federal Farm Credit Bank | 4.34(a) | 12/15/23 | 500,000 | 499,976 |
| Federal Farm Credit Bank | 4.34(a) | 01/04/24 | 500,000 | 500,000 |
| Federal Farm Credit Bank | 4.36(a) | 01/10/24 | 500,000 | 500,000 |
| Federal Farm Credit Bank | 4.34(a) | 01/25/24 | 500,000 | 500,000 |
| Federal Farm Credit Bank | 4.34(a) | 02/05/24 | 1,000,000 | 1,000,000 |
| Federal Farm Credit Bank | 4.35(a) | 02/20/24 | 500,000 | 500,000 |
| Federal Farm Credit Bank | 4.35(a) | 03/15/24 | 500,000 | 500,000 |
| Federal Farm Credit Bank | 4.34(a) | 03/18/24 | 1,500,000 | 1,500,000 |
| Federal Farm Credit Bank | 4.35(a) | 04/25/24 | 500,000 | 500,000 |
| Federal Farm Credit Bank | 4.35(a) | 05/24/24 | 1,000,000 | 1,000,000 |
| Federal Farm Credit Bank | 4.40(a) | 08/08/24 | 500,000 | 500,000 |
| U.S. Treasury Bill | 4.07 | 01/03/23 | 14,000,000 | 13,996,891 |
| U.S. Treasury Bill | 4.10 | 01/17/23 | 6,000,000 | 5,989,280 |
| U.S. Treasury Bill | 4.20 | 01/24/23 | 2,000,000 | 1,994,741 |
| U.S. Treasury Bill | 4.10 | 01/26/23 | 6,000,000 | 5,983,333 |
| U.S. Treasury Bill | 4.18 | 01/31/23 | 6,000,000 | 5,979,515 |
| U.S. Treasury Bill | 4.15 | 02/02/23 | 12,000,000 | 11,956,782 |
| U.S. Treasury Bill | 4.08 | 02/07/23 | 10,000,000 | 9,958,940 |
| U.S. Treasury Bill | 4.22 | 02/09/23 | 8,000,000 | 7,964,293 |
| U.S. Treasury Bill | 4.16 | 02/14/23 | 10,000,000 | 9,950,219 |
| U.S. Treasury Bill | 4.26 | 02/16/23 | 4,000,000 | 3,978,763 |
| U.S. Treasury Bill | 4.32 | 02/23/23 | 5,000,000 | 4,968,936 |
| U.S. Treasury Bill | 4.30 | 02/28/23 | 4,000,000 | 3,973,062 |
| U.S. Treasury Bill | 4.39 | 03/02/23 | 4,000,000 | 3,971,433 |
| U.S. Treasury Bill | 4.40 | 03/07/23 | 4,000,000 | 3,969,089 |
| U.S. Treasury Bill | 4.38 | 03/09/23 | 5,000,000 | 4,960,265 |
| U.S. Treasury Bill | 4.38 | 03/16/23 | 2,000,000 | 1,982,446 |
| U.S. Treasury Bill | 4.53 | 03/28/23 | 500,000 | 494,744 |
| U.S. Treasury Bill | 4.46 | 03/30/23 | 4,000,000 | 3,957,467 |
| U.S. Treasury Bill | 4.56 | 04/04/23 | 3,000,000 | 2,965,668 |
| U.S. Treasury Bill | 4.53 | 04/11/23 | 2,000,000 | 1,975,556 |
| U.S. Treasury Bill | 4.57 | 04/18/23 | 3,000,000 | 2,960,410 |
| U.S. Treasury Bill | 4.55 | 04/25/23 | 5,000,000 | 4,929,938 |
| U.S. Treasury Bill | 4.68 | 05/02/23 | 4,000,000 | 3,939,839 |
| U.S. Treasury Bill | 3.03 | 07/13/23 | 1,000,000 | 984,340 |
| U.S. Treasury Bill | 4.13 | 10/05/23 | 1,000,000 | 968,066 |
| U.S. Treasury Bill | 4.78 | 11/30/23 | 500,000 | 478,933 |
| U.S. Treasury Note | 4.51(a) | 01/31/23 | 6,000,000 | 6,000,120 |
| U.S. Treasury Note | 4.49(a) | 04/30/23 | 4,100,000 | 4,100,059 |
| U.S. Treasury Note | 4.49(a) | 07/31/23 | 3,500,000 | 3,500,018 |
| U.S. Treasury Note | 4.49(a) | 10/31/23 | 5,500,000 | 5,500,080 |
| U.S. Treasury Note | 4.44(a) | 01/31/24 | 500,000 | 499,907 |
| U.S. Treasury Note | 4.38(a) | 04/30/24 | 3,000,000 | 2,997,278 |
| U.S. Treasury Note | 4.50(a) | 07/31/24 | 4,500,000 | 4,496,333 |
| U.S. Treasury Note | 4.60(a) | 10/31/24 | 2,500,000 | 2,497,497 |
| Total U.S. Government & Agency Obligations | ||||
| (Cost $167,324,207) | 167,324,207 | |||
| Portfolio of Investments | The accompanying notes are an integral part of these financial statements. |
| Money Market Fund | 18.8% of portfolio | ||||
| Interest Rate /Yield | Shares | Value | ||
| State Street Institutional U.S. Government Money Market Fund Premier Class | 4.12%(b) | 38,676,504 | $38,676,504 | |
| Total Money Market Fund | ||||
| (Cost $38,676,504) | 38,676,504 | |||
| Total Investments in Securities | ||||
| (Cost $206,000,711) | 100.0% | $206,000,711 | |||
| (a) | Variable coupon rate as of December 31, 2022. |
| (b) | 7-day yield at December 31, 2022. |
| The accompanying notes are an integral part of these financial statements. | Portfolio of Investments |
| U.S. Government & Agency Obligations | 66.6% of portfolio | ||||
| Interest Rate / Yield | Maturity Date | Face Amount | Value | |
| Export-Import Bank of the U.S. | 1.90% | 07/12/24 | $553,286 | $539,958 |
| Export-Import Bank of the U.S. | 1.73 | 09/18/24 | 1,355,844 | 1,314,169 |
| Export-Import Bank of the U.S. | 1.58 | 11/16/24 | 95,085 | 91,860 |
| Export-Import Bank of the U.S. | 2.54 | 07/13/25 | 128,682 | 124,517 |
| Export-Import Bank of the U.S. | 2.33 | 01/14/27 | 191,249 | 175,144 |
| Private Export Funding Corp. | 1.75 | 11/15/24 | 1,000,000 | 941,120 |
| U.S. Department of Housing & Urban Development | 5.77 | 08/01/26 | 46,000 | 46,049 |
| U.S. International Development Finance Corp. | 2.22(a) | 01/24/25 | 2,000,000 | 2,023,021 |
| U.S. International Development Finance Corp. | 1.27(a) | 06/21/25 | 1,000,000 | 941,345 |
| U.S. International Development Finance Corp. | 0.00(b) | 07/17/25 | 1,000,000 | 909,456 |
| U.S. International Development Finance Corp. | 0.00(b) | 01/17/26 | 700,000 | 691,167 |
| U.S. International Development Finance Corp. | 1.11 | 05/15/29 | 928,571 | 826,340 |
| U.S. International Development Finance Corp. | 2.36 | 10/15/29 | 1,608,382 | 1,472,913 |
| U.S. International Development Finance Corp. | 1.05 | 10/15/29 | 1,608,382 | 1,403,082 |
| U.S. International Development Finance Corp. | 1.24 | 08/15/31 | 1,418,919 | 1,233,346 |
| U.S. Treasury Note | 4.25 | 09/30/24 | 9,400,000 | 9,351,898 |
| U.S. Treasury Note | 0.25 | 07/31/25 | 15,880,000 | 14,329,839 |
| U.S. Treasury Note | 4.25 | 10/15/25 | 1,891,000 | 1,889,523 |
| U.S. Treasury Note | 4.50 | 11/15/25 | 805,000 | 809,843 |
| U.S. Treasury Note | 0.38 | 11/30/25 | 1,000,000 | 894,453 |
| U.S. Treasury Note | 3.88 | 11/30/27 | 785,000 | 780,707 |
| U.S. Treasury Note | 0.75 | 01/31/28 | 5,533,000 | 4,704,779 |
| Total U.S. Government & Agency Obligations | ||||
| (Cost $47,643,580) | 45,494,529 | |||
| Corporate Bonds Guaranteed by Export-Import Bank of the United States | 25.8% of portfolio | ||||
| Consumer Discretionary | 0.1% | ||||
| Ethiopian Leasing (2012) LLC | 2.68 | 07/30/25 | 52,212 | 50,551 |
| Total Consumer Discretionary | 50,551 | |||
| Energy | 8.4% | ||||
| Petroleos Mexicanos | 2.38 | 04/15/25 | 405,250 | 391,619 |
| Petroleos Mexicanos | 2.46 | 12/15/25 | 520,500 | 497,058 |
| Reliance Industries Ltd. | 2.06 | 01/15/26 | 1,892,800 | 1,806,284 |
| Reliance Industries Ltd. | 1.87 | 01/15/26 | 2,438,947 | 2,320,425 |
| Reliance Industries Ltd. | 2.44 | 01/15/26 | 766,316 | 735,897 |
| Total Energy | 5,751,283 | |||
| Financials | 17.3% | ||||
| CES MU2 LLC | 1.99 | 05/13/27 | 1,481,066 | 1,382,394 |
| Durrah MSN 35603 | 1.68 | 01/22/25 | 423,015 | 408,120 |
| DY8 Leasing LLC | 2.63 | 04/29/26 | 145,833 | 139,730 |
| DY9 Leasing LLC | 2.37 | 03/19/27 | 525,411 | 494,198 |
| Export Lease Eleven Co. LLC | 4.69(c) | 07/30/25 | 51,695 | 51,505 |
| Helios Leasing II LLC | 2.67 | 03/18/25 | 1,312,279 | 1,273,175 |
| HNA 2015 LLC | 2.29 | 06/30/27 | 217,658 | 203,738 |
| HNA 2015 LLC | 2.37 | 09/18/27 | 128,749 | 120,485 |
| KE Export Leasing 2013-A LLC | 5.01(c) | 02/25/25 | 1,395,932 | 1,391,260 |
| Lulwa Ltd. | 1.89 | 02/15/25 | 842,896 | 813,369 |
| Lulwa Ltd. | 1.83 | 03/26/25 | 266,298 | 255,632 |
| MSN 41079 and 41084 Ltd. | 1.72 | 07/13/24 | 1,339,525 | 1,297,852 |
| MSN 41079 and 41084 Ltd. | 1.63 | 12/14/24 | 358,775 | 346,054 |
| Osprey Aircraft Leasing LLC | 2.21 | 06/21/25 | 93,376 | 89,851 |
| Penta Aircraft Leasing 2013 LLC | 1.69 | 04/29/25 | 440,801 | 423,352 |
| Pluto Aircraft Leasing LLC | 4.74(c) | 02/07/23 | 242,419 | 242,348 |
| Portfolio of Investments | The accompanying notes are an integral part of these financial statements. |
| Corporate Bonds Guaranteed by Export-Import Bank of the United States | 25.8% of portfolio (Continued) | ||||
| Interest Rate /Yield | Maturity Date | Face Amount | Value | |
| Financials | 17.3% (Continued) | ||||
| Rimon LLC | 2.45% | 11/01/25 | $135,000 | $129,894 |
| Salmon River Export LLC | 2.19 | 09/15/26 | 643,129 | 611,335 |
| Sandalwood 2013 LLC | 2.84 | 07/10/25 | 205,022 | 199,279 |
| Sandalwood 2013 LLC | 2.82 | 02/12/26 | 273,638 | 263,453 |
| Santa Rosa Leasing LLC | 1.69 | 08/15/24 | 102,374 | 99,727 |
| Santa Rosa Leasing LLC | 1.47 | 11/03/24 | 180,351 | 174,219 |
| Thirax 1 LLC | 0.97 | 01/14/33 | 1,725,806 | 1,419,412 |
| Total Financials | 11,830,382 | |||
| Total Corporate Bonds Guaranteed by Export-Import Bank of the United States | ||||
| (Cost $18,725,600) | 17,632,216 | |||
| Asset-Backed Securities | 3.1% of portfolio | ||||
| American Credit Acceptance Receivables Trust 22-1A (d) | 0.99 | 12/15/25 | 61,335 | 60,901 |
| Avant Loans Funding Trust 22-REV1 (d) | 6.54 | 09/15/31 | 150,000 | 146,452 |
| Credit Acceptance Auto Loan Trust 20-3A (d) | 1.24 | 10/15/29 | 203,750 | 199,543 |
| First Investors Auto Owner Trust 21-2A (d) | 0.48 | 03/15/27 | 75,409 | 72,920 |
| GLS Auto Receivables Trust 21-3A (d) | 0.42 | 01/15/25 | 19,994 | 19,890 |
| GLS Auto Receivables Trust 21-4 (d) | 0.84 | 07/15/25 | 66,560 | 65,654 |
| Gracie Point International Fund 21-1 (d) | 4.87(c) | 11/01/23 | 205,921 | 205,456 |
| LAD Auto Receivables Trust 21-1 (d) | 1.30 | 08/17/26 | 121,970 | 118,531 |
| Oasis Securitisation 21-1A (d) | 2.58 | 02/15/33 | 38,335 | 37,775 |
| Oasis Securitisation 21-2A (d) | 2.14 | 10/15/33 | 133,950 | 130,628 |
| Oasis Securitisation 22-2A (d) | 6.85 | 10/15/34 | 310,141 | 308,494 |
| PenFed Auto Receivables Owner Trust 22-A (d) | 3.83 | 12/16/24 | 250,000 | 248,175 |
| SBA Tower Trust (d) | 2.84 | 01/15/25 | 250,000 | 235,629 |
| United Auto Credit Securitization Trust 22-1A (d) | 1.11 | 07/10/24 | 34,436 | 34,294 |
| Upstart Securitization Trust 21-3 (d) | 0.83 | 07/20/31 | 43,201 | 42,308 |
| Westgate Resorts 22-1A (d) | 2.29 | 08/20/36 | 225,137 | 211,750 |
| Total Asset-Backed Securities | ||||
| (Cost $2,193,322) | 2,138,400 | |||
| Corporate Bonds–Other | 1.6% of portfolio | ||||
| Financials | 1.6% | ||||
| Bank of America Corp. | 4.83(c) | 07/22/26 | 200,000 | 197,663 |
| J.P. Morgan Chase & Co. | 1.04(c) | 02/04/27 | 100,000 | 86,987 |
| Main Street Capital Corp. | 3.00 | 07/14/26 | 415,000 | 357,649 |
| Owl Rock Capital Corp. III (d) | 3.13 | 04/13/27 | 250,000 | 205,798 |
| Owl Rock Core Income Corp. (d) | 3.13 | 09/23/26 | 250,000 | 212,741 |
| Total Financials | 1,060,838 | |||
| Total Corporate Bonds–Other | ||||
| (Cost $1,214,639) | 1,060,838 | |||
| Mortgage-Backed Securities | 1.1% of portfolio | ||||
| GNMA 21-8 | 1.00 | 01/20/50 | 543,709 | 424,749 |
| GNMA CK0445 | 4.00 | 02/15/52 | 365,604 | 347,810 |
| Total Mortgage-Backed Securities | ||||
| (Cost $883,302) | 772,559 | |||
| The accompanying notes are an integral part of these financial statements. | Portfolio of Investments |
| Municipal Bond | 0.1% of portfolio | ||||
| Interest Rate /Yield | Maturity Date | Face Amount | Value | |
| New York | 0.1% | ||||
| Suffolk County New York | 1.05% | 06/15/23 | $100,000 | $98,405 |
| Total New York | 98,405 | |||
| Total Municipal Bond | ||||
| (Cost $100,000) | 98,405 | |||
| Money Market Fund | 1.7% of portfolio | ||||
| Shares | ||||
| State Street Institutional U.S. Government Money Market Fund Premier Class | 4.12(e) | 1,161,168 | 1,161,168 | |
| Total Money Market Fund | ||||
| (Cost $1,161,168) | 1,161,168 | |||
| Total Investments in Securities | ||||
| (Cost $71,921,611) | 100.0% | $68,358,115 | |||
| (a) | Interest is paid at maturity. |
| (b) | Zero coupon rate, purchased at a discount. |
| (c) | Variable coupon rate as of December 31, 2022. |
| (d) | Security was purchased pursuant to Rule 144A under the Securities Act of 1933 and may be resold in transactions exempt from registration, normally to qualified institutional buyers. The securities have been determined to be liquid under criteria established by the Fund's Board of Directors. The total of such securities at period-end amounts to $2,556,939 and represents 3.7% of total investments. |
| (e) | 7-day yield at December 31, 2022. |
| Portfolio of Investments | The accompanying notes are an integral part of these financial statements. |
| U.S. Government & Agency Obligations | 51.4% of portfolio | ||||
| Interest Rate / Yield | Maturity Date | Face Amount | Value | |
| U.S. International Development Finance Corp. | 0.67%(a) | 04/23/29 | $1,230,000 | $1,130,782 |
| U.S. International Development Finance Corp. | 2.36 | 10/15/29 | 679,541 | 622,306 |
| U.S. International Development Finance Corp. | 1.05 | 10/15/29 | 977,092 | 852,372 |
| U.S. Treasury Note | 4.25 | 09/30/24 | 64,290,000 | 63,961,016 |
| U.S. Treasury Note | 4.50 | 11/30/24 | 1,030,000 | 1,030,040 |
| U.S. Treasury Note | 0.25 | 07/31/25 | 86,090,000 | 77,686,136 |
| U.S. Treasury Note | 4.25 | 10/15/25 | 52,892,000 | 52,850,678 |
| U.S. Treasury Note | 4.50 | 11/15/25 | 779,000 | 783,686 |
| U.S. Treasury Note | 3.88 | 11/30/27 | 46,832,000 | 46,575,888 |
| Total U.S. Government & Agency Obligations | ||||
| (Cost $249,701,596) | 245,492,904 | |||
| Corporate Bonds–Other | 26.1% of portfolio | ||||
| Communication Services | 0.5% | ||||
| Magallanes, Inc. (b) | 3.76 | 03/15/27 | 1,355,000 | 1,220,217 |
| Sprint Spectrum Co. LLC (b) | 4.74 | 03/20/25 | 1,125,000 | 1,111,737 |
| Total Communication Services | 2,331,954 | |||
| Consumer Discretionary | 1.0% | ||||
| Daimler Trucks Financial N.A. LLC (b) | 1.63 | 12/13/24 | 1,500,000 | 1,392,058 |
| Daimler Trucks Financial N.A. LLC (b) | 3.50 | 04/07/25 | 1,255,000 | 1,203,890 |
| US Airways 2013 1A PTT | 3.95 | 05/15/27 | 2,662,986 | 2,418,809 |
| Total Consumer Discretionary | 5,014,757 | |||
| Consumer Staples | 1.1% | ||||
| 7-Eleven, Inc. (b) | 0.63 | 02/10/23 | 1,000,000 | 994,874 |
| 7-Eleven, Inc. (b) | 0.80 | 02/10/24 | 1,090,000 | 1,037,266 |
| 7-Eleven, Inc. (b) | 0.95 | 02/10/26 | 800,000 | 700,636 |
| Philip Morris International Inc. | 5.13 | 11/15/24 | 1,150,000 | 1,151,520 |
| Philip Morris International Inc. | 5.00 | 11/17/25 | 460,000 | 462,067 |
| Philip Morris International Inc. | 5.13 | 11/17/27 | 805,000 | 810,879 |
| Total Consumer Staples | 5,157,242 | |||
| Energy | 2.3% | ||||
| Cheniere Corpus Christi Holdings LLC | 5.13 | 06/30/27 | 2,000,000 | 1,975,856 |
| Energy Transfer Operating LP | 2.90 | 05/15/25 | 2,900,000 | 2,731,060 |
| Midwest Connector Capital Co. LLC (b) | 3.90 | 04/01/24 | 3,270,000 | 3,166,138 |
| Phillips 66 Co. | 1.30 | 02/15/26 | 1,500,000 | 1,343,790 |
| Pioneer Natural Resources Co. | 1.13 | 01/15/26 | 1,023,000 | 911,807 |
| Targa Resources Corp. | 5.20 | 07/01/27 | 985,000 | 965,430 |
| Total Energy | 11,094,081 | |||
| Financials | 14.0% | ||||
| Antares Holdings LP | 3.95 | 07/15/26 | 335,000 | 289,723 |
| Antares Holdings LP | 2.75 | 01/15/27 | 1,000,000 | 801,075 |
| Bank of America Corp. | 2.46(c) | 10/22/25 | 2,200,000 | 2,078,686 |
| Bank of America Corp. | 2.02(c) | 02/13/26 | 2,100,000 | 1,949,262 |
| Bank of America Corp. | 1.32(c) | 06/19/26 | 2,100,000 | 1,891,040 |
| Bank of America Corp. | 4.83(c) | 07/22/26 | 2,770,000 | 2,737,632 |
| Bank of America Corp. | 1.20(c) | 10/24/26 | 920,000 | 817,908 |
| Bank of America Corp. | 4.95(c) | 07/22/28 | 1,955,000 | 1,909,372 |
| Bank of America Corp. | 6.20(c) | 11/10/28 | 565,000 | 583,346 |
| Capital Southwest Corp. | 3.38 | 10/01/26 | 1,355,000 | 1,131,560 |
| The accompanying notes are an integral part of these financial statements. | Portfolio of Investments |
| Corporate Bonds–Other | 26.1% of portfolio (Continued) | ||||
| Interest Rate /Yield | Maturity Date | Face Amount | Value | |
| Financials | 14.0% (Continued) | ||||
| Citigroup Inc. | 7.00% | 12/01/25 | $2,000,000 | $2,086,530 |
| CNO Global Funding (b) | 1.65 | 01/06/25 | 1,125,000 | 1,042,189 |
| F&G Global Funding (b) | 1.75 | 06/30/26 | 2,500,000 | 2,225,914 |
| Fidus Investment Corp. | 4.75 | 01/31/26 | 304,000 | 276,264 |
| Fidus Investment Corp. | 3.50 | 11/15/26 | 693,000 | 567,735 |
| GA Global Funding Trust (b) | 0.80 | 09/13/24 | 920,000 | 840,654 |
| GA Global Funding Trust (b) | 3.85 | 04/11/25 | 1,715,000 | 1,641,388 |
| GA Global Funding Trust (b) | 2.25 | 01/06/27 | 2,370,000 | 2,086,138 |
| Goldman Sachs Group, Inc. | 5.70 | 11/01/24 | 1,070,000 | 1,082,735 |
| Goldman Sachs Group, Inc. | 2.64(c) | 02/24/28 | 930,000 | 828,058 |
| Goldman Sachs Group, Inc. | 3.62(c) | 03/15/28 | 572,000 | 532,796 |
| J.P. Morgan Chase & Co. | 4.02(c) | 12/05/24 | 1,225,000 | 1,206,727 |
| J.P. Morgan Chase & Co. | 2.30(c) | 10/15/25 | 2,130,000 | 2,007,211 |
| J.P. Morgan Chase & Co. | 2.08(c) | 04/22/26 | 2,055,000 | 1,907,649 |
| J.P. Morgan Chase & Co. | 4.08(c) | 04/26/26 | 700,000 | 679,645 |
| J.P. Morgan Chase & Co. | 1.04(c) | 02/04/27 | 910,000 | 791,580 |
| J.P. Morgan Chase & Co. | 4.85(c) | 07/25/28 | 890,000 | 867,557 |
| Main Street Capital Corp. | 3.00 | 07/14/26 | 3,300,000 | 2,843,954 |
| Morgan Stanley | 3.74(c) | 04/24/24 | 1,020,000 | 1,014,486 |
| Morgan Stanley | 2.19(c) | 04/28/26 | 425,000 | 394,938 |
| Morgan Stanley | 4.68(c) | 07/17/26 | 1,190,000 | 1,169,598 |
| Morgan Stanley | 1.51(c) | 07/20/27 | 865,000 | 750,637 |
| Owl Rock Capital Corp. III (b) | 3.13 | 04/13/27 | 2,320,000 | 1,909,806 |
| Owl Rock Core Income Corp. (b) | 3.13 | 09/23/26 | 4,955,000 | 4,216,521 |
| Owl Rock Technology Finance Corp. | 2.50 | 01/15/27 | 1,415,000 | 1,153,493 |
| Santander Holdings USA, Inc. | 2.49(c) | 01/06/28 | 1,000,000 | 857,983 |
| SCE Recovery Funding LLC | 0.86 | 11/15/31 | 1,633,023 | 1,356,722 |
| Security Benefit Global Funding (b) | 1.25 | 05/17/24 | 4,000,000 | 3,752,694 |
| Volkswagen Group of America Finance LLC (b) | 1.25 | 11/24/25 | 3,025,000 | 2,696,643 |
| Wells Fargo & Co. | 2.16(c) | 02/11/26 | 3,270,000 | 3,048,402 |
| Wells Fargo & Co. | 3.91(c) | 04/25/26 | 1,900,000 | 1,846,624 |
| Wells Fargo & Co. | 2.19(c) | 04/30/26 | 2,120,000 | 1,972,995 |
| Wells Fargo & Co. | 3.53(c) | 03/24/28 | 915,000 | 847,291 |
| Wells Fargo & Co. | 4.81(c) | 07/25/28 | 2,140,000 | 2,090,130 |
| Total Financials | 66,783,291 | |||
| Health Care | 1.0% | ||||
| AmerisourceBergen Corp. | 0.74 | 03/15/23 | 2,213,000 | 2,194,355 |
| Baylor Scott & White Holdings | 0.83 | 11/15/25 | 1,000,000 | 883,471 |
| GE Healthcare Technologies Inc. (b) | 5.55 | 11/15/24 | 915,000 | 918,294 |
| GE Healthcare Technologies Inc. (b) | 5.65 | 11/15/27 | 975,000 | 986,408 |
| Total Health Care | 4,982,528 | |||
| Industrials | 1.3% | ||||
| American Airlines Group Inc. | 3.60 | 03/22/29 | 2,076,283 | 1,862,366 |
| American Airlines Group Inc. | 3.95 | 01/11/32 | 1,000,000 | 793,438 |
| BNSF Railway Co. (b) | 3.44 | 06/16/28 | 788,973 | 739,686 |
| Boeing Co. (The) | 2.20 | 02/04/26 | 1,900,000 | 1,726,269 |
| Burlington Northern & Santa Fe Railway Co. | 4.83 | 01/15/23 | 1,642 | 1,641 |
| Delta Air Lines, Inc. (b) | 7.00 | 05/01/25 | 965,000 | 986,173 |
| Total Industrials | 6,109,573 | |||
| Materials | 1.8% | ||||
| Celanese US Holdings LLC | 6.05 | 03/15/25 | 5,321,000 | 5,300,298 |
| Portfolio of Investments | The accompanying notes are an integral part of these financial statements. |
| Corporate Bonds–Other | 26.1% of portfolio (Continued) | ||||
| Interest Rate /Yield | Maturity Date | Face Amount | Value | |
| Materials | 1.8% (Continued) | ||||
| Celanese US Holdings LLC | 6.17% | 07/15/27 | $1,330,000 | $1,311,814 |
| Sealed Air Corp. (b) | 1.57 | 10/15/26 | 2,200,000 | 1,899,701 |
| Total Materials | 8,511,813 | |||
| Real Estate | 0.3% | ||||
| VICI Properties LP (b) | 3.50 | 02/15/25 | 1,600,000 | 1,508,528 |
| Total Real Estate | 1,508,528 | |||
| Utilities | 2.8% | ||||
| Entergy Louisiana, LLC | 3.78 | 04/01/25 | 1,445,000 | 1,387,790 |
| Metropolitan Edison Co. (b) | 4.00 | 04/15/25 | 4,250,000 | 4,066,621 |
| Pacific Gas and Electric Co. | 3.75 | 02/15/24 | 3,500,000 | 3,427,634 |
| PPL Electric Utilities Corp. | 4.97(c) | 09/28/23 | 1,000,000 | 995,603 |
| Southern California Edison Co. | 1.10 | 04/01/24 | 1,850,000 | 1,757,062 |
| Southern California Edison Co. | 1.20 | 02/01/26 | 2,065,000 | 1,831,175 |
| Total Utilities | 13,465,885 | |||
| Total Corporate Bonds–Other | ||||
| (Cost $134,757,511) | 124,959,652 | |||
| Asset-Backed Securities | 10.4% of portfolio | ||||
| American Credit Acceptance Receivables Trust 21-4B (b) | 0.86 | 02/13/26 | 1,081,000 | 1,068,992 |
| American Credit Acceptance Receivables Trust 22-1A (b) | 0.99 | 12/15/25 | 469,827 | 466,500 |
| Avant Credit Card Master Trust 21-1A (b) | 1.37 | 04/15/27 | 2,500,000 | 2,287,186 |
| Avant Loans Funding Trust 22-REV1 (b) | 6.54 | 09/15/31 | 3,300,000 | 3,221,948 |
| Avid Automobile Receivables Trust 21-1A (b) | 0.61 | 01/15/25 | 66,901 | 66,695 |
| CNH Equipment Trust 22-A | 2.39 | 08/15/25 | 371,434 | 366,041 |
| Colony American Finance Ltd. 21-2 (b) | 1.41 | 07/15/54 | 761,596 | 648,249 |
| CoreVest American Finance 20-4 (b) | 1.17 | 12/15/52 | 779,927 | 688,454 |
| CoreVest American Finance 21-1 (b) | 1.57 | 04/15/53 | 1,181,976 | 1,026,937 |
| CoreVest American Finance 21-3 (b) | 2.49 | 10/15/54 | 2,480,000 | 2,127,049 |
| CPS Auto Trust 21-B (b) | 0.81 | 12/15/25 | 516,598 | 513,079 |
| Credit Acceptance Auto Loan Trust 20-2A (b) | 1.37 | 07/16/29 | 404,691 | 400,649 |
| Credit Acceptance Auto Loan Trust 20-3A (b) | 1.24 | 10/15/29 | 2,037,497 | 1,995,433 |
| Credit Acceptance Auto Loan Trust 21-2A (b) | 0.96 | 02/15/30 | 1,755,000 | 1,687,775 |
| Credito Real USA Auto Receivables Trust 21-1 (b) | 1.35 | 02/16/27 | 650,978 | 636,259 |
| Entergy New Orleans Storm Recovery Fund 15-1 | 2.67 | 06/01/27 | 190,115 | 183,776 |
| FIC Funding 21-1 (b) | 1.13 | 04/15/33 | 443,660 | 433,290 |
| First Investors Auto Owner Trust 21-2A (b) | 0.48 | 03/15/27 | 923,755 | 893,269 |
| Firstkey Homes Trust 22-SFR2 (b) | 4.25 | 07/17/39 | 969,517 | 915,435 |
| Flagship Credit Auto Trust 21-3 (b) | 0.36 | 07/15/27 | 1,668,882 | 1,616,107 |
| Foursight Capital Automobile Receivables Trust 22-1A (b) | 1.15 | 09/15/25 | 345,943 | 339,776 |
| FRTKL 21-SFR1 (b) | 1.57 | 09/17/38 | 970,000 | 828,768 |
| GLS Auto Receivables Trust 21-3A (b) | 0.42 | 01/15/25 | 269,251 | 267,855 |
| GLS Auto Receivables Trust 21-4 (b) | 0.84 | 07/15/25 | 926,851 | 914,235 |
| Gracie Point International Fund 21-1 (b) | 4.87(c) | 11/01/23 | 1,489,427 | 1,486,063 |
| Gracie Point International Fund 22-1 (b) | 5.28(c) | 04/01/24 | 1,495,986 | 1,485,435 |
| LAD Auto Receivables Trust 21-1 (b) | 1.30 | 08/17/26 | 739,953 | 719,089 |
| Longtrain Leasing III LLC 2015-1 (b) | 2.98 | 01/15/45 | 265,577 | 255,952 |
| Marlette Funding Trust 22-2 (b) | 4.25 | 08/15/32 | 815,606 | 804,737 |
| NP SPE II LLC 17-1 (b) | 3.37 | 10/21/47 | 286,872 | 269,887 |
| Oasis Securitisation 21-1A (b) | 2.58 | 02/15/33 | 212,684 | 209,576 |
| Oasis Securitisation 21-2A (b) | 2.14 | 10/15/33 | 1,131,877 | 1,103,803 |
| Oasis Securitisation 22-1A (b) | 4.75 | 05/15/34 | 587,416 | 576,260 |
| Oasis Securitisation 22-2A (b) | 6.85 | 10/15/34 | 2,216,595 | 2,204,822 |
| The accompanying notes are an integral part of these financial statements. | Portfolio of Investments |
| Asset-Backed Securities | 10.4% of portfolio (Continued) | ||||
| Interest Rate /Yield | Maturity Date | Face Amount | Value | |
| Oportun Funding 21-A (b) | 1.21% | 03/08/28 | $1,070,000 | $996,361 |
| Oportun Funding 21-B (b) | 1.47 | 05/08/31 | 2,225,000 | 1,943,372 |
| Oscar US Funding Trust 21-1A (b) | 0.40 | 03/11/24 | 65,700 | 65,550 |
| PenFed Auto Receivables Owner Trust 22-A (b) | 3.83 | 12/16/24 | 2,780,000 | 2,759,710 |
| Progress Residential Trust 21-SFR8 (b) | 1.51 | 10/17/38 | 1,318,851 | 1,123,600 |
| Progress Residential Trust 22-SFR3 (b) | 3.20 | 04/17/39 | 925,000 | 838,463 |
| SBA Tower Trust (b) | 2.84 | 01/15/25 | 4,765,000 | 4,491,094 |
| SBA Tower Trust (b) | 1.88 | 01/15/26 | 1,450,000 | 1,275,244 |
| SBA Tower Trust (b) | 1.63 | 11/15/26 | 195,000 | 165,609 |
| SBA Tower Trust (b) | 6.60 | 01/15/28 | 775,000 | 773,106 |
| United Auto Credit Securitization Trust 22-1A (b) | 1.11 | 07/10/24 | 203,170 | 202,337 |
| Upstart Securitization Trust 21-1 (b) | 0.87 | 03/20/31 | 32,900 | 32,798 |
| Upstart Securitization Trust 21-3 (b) | 0.83 | 07/20/31 | 285,462 | 279,563 |
| Upstart Securitization Trust 21-4 (b) | 0.84 | 09/20/31 | 589,049 | 570,212 |
| Westgate Resorts 20-1A (b) | 3.96 | 03/20/34 | 589,677 | 575,701 |
| Westgate Resorts 22-1A (b) | 2.29 | 08/20/36 | 1,050,639 | 988,165 |
| Total Asset-Backed Securities | ||||
| (Cost $52,585,773) | 49,790,266 | |||
| Yankee Bonds | 7.3% of portfolio | ||||
| Aircastle Ltd. (b) | 5.25 | 08/11/25 | 850,000 | 817,477 |
| Avolon Holdings Funding Ltd. (b) | 5.50 | 01/15/26 | 1,850,000 | 1,758,800 |
| Avolon Holdings Funding Ltd. (b) | 2.75 | 02/21/28 | 1,930,000 | 1,549,276 |
| Bank of Montreal | 4.34(c) | 10/05/28 | 1,300,000 | 1,273,840 |
| Barclays PLC | 7.33(c) | 11/02/26 | 1,410,000 | 1,460,471 |
| Delta and SkyMiles IP Ltd. (b) | 4.50 | 10/20/25 | 780,000 | 760,954 |
| Delta and SkyMiles IP Ltd. (b) | 4.75 | 10/20/28 | 2,000,000 | 1,879,946 |
| JBS Finance Luxembourg SARL (b) | 2.50 | 01/15/27 | 3,364,000 | 2,942,558 |
| Lenovo Group Ltd. (b) | 5.83 | 01/27/28 | 2,770,000 | 2,674,032 |
| Macquarie Group Ltd. (b) | 1.34(c) | 01/12/27 | 2,500,000 | 2,178,885 |
| Nationwide Building Society (b) | 2.97(c) | 02/16/28 | 1,500,000 | 1,318,494 |
| Nissan Motor Co., Ltd. (b) | 3.52 | 09/17/25 | 2,500,000 | 2,322,248 |
| Nissan Motor Co., Ltd. (b) | 1.85 | 09/16/26 | 2,000,000 | 1,669,677 |
| Nutrien Ltd. | 5.90 | 11/07/24 | 455,000 | 460,718 |
| Nutrien Ltd. | 5.95 | 11/07/25 | 685,000 | 698,928 |
| Santander UK Group Holdings PLC | 6.83(c) | 11/21/26 | 460,000 | 465,944 |
| Saudi Arabian Oil Co. (b) | 1.63 | 11/24/25 | 500,000 | 455,407 |
| Syngenta Finance NV (b) | 4.44 | 04/24/23 | 400,000 | 398,208 |
| Tencent Music Entertainment Group | 1.38 | 09/03/25 | 1,260,000 | 1,120,276 |
| TransCanada Pipelines Ltd. | 7.06 | 10/14/25 | 6,043,000 | 6,182,099 |
| Triton Container International Ltd. (b) | 1.15 | 06/07/24 | 2,110,000 | 1,951,365 |
| Var Energi ASA (b) | 7.50 | 01/15/28 | 595,000 | 606,068 |
| Total Yankee Bonds | ||||
| (Cost $37,928,323) | 34,945,671 | |||
| Corporate Bonds Guaranteed by Export-Import Bank of the United States | 2.1% of portfolio | ||||
| Energy | 1.5% | ||||
| Petroleos Mexicanos | 4.43(c) | 04/15/25 | 5,862,500 | 5,844,229 |
| Petroleos Mexicanos | 2.46 | 12/15/25 | 131,700 | 125,769 |
| Reliance Industries Ltd. | 1.87 | 01/15/26 | 1,109,316 | 1,055,408 |
| Total Energy | 7,025,406 | |||
| Financials | 0.6% | ||||
| MSN 41079 and 41084 Ltd. | 1.72 | 07/13/24 | 378,676 | 366,895 |
| MSN 41079 and 41084 Ltd. | 1.63 | 12/14/24 | 474,121 | 457,311 |
| Portfolio of Investments | The accompanying notes are an integral part of these financial statements. |
| Corporate Bonds Guaranteed by Export-Import Bank of the United States | 2.1% of portfolio (Continued) | ||||
| Interest Rate /Yield | Maturity Date | Face Amount | Value | |
| Financials | 0.6% (Continued) | ||||
| Pluto Aircraft Leasing LLC | 4.74%(c) | 02/07/23 | $28,302 | $28,294 |
| Santa Rosa Leasing LLC | 1.69 | 08/15/24 | 389,458 | 379,391 |
| Thirax 1 LLC | 0.97 | 01/14/33 | 2,070,967 | 1,703,295 |
| Total Financials | 2,935,186 | |||
| Total Corporate Bonds Guaranteed by Export-Import Bank of the United States | ||||
| (Cost $10,451,248) | 9,960,592 | |||
| Mortgage-Backed Securities | 0.9% of portfolio | ||||
| FHLMC 780754 | 4.08(c) | 08/01/33 | 626 | 622 |
| FNMA 813842 | 3.45(c) | 01/01/35 | 1,751 | 1,765 |
| GNMA 21-8 | 1.00 | 01/20/50 | 2,052,683 | 1,603,568 |
| GNMA CK0445 | 4.00 | 02/15/52 | 2,563,798 | 2,439,015 |
| Salomon Brothers Mortgage Securities 97-LB6 | 6.82 | 12/25/27 | 1 | 1 |
| Total Mortgage-Backed Securities | ||||
| (Cost $4,435,134) | 4,044,971 | |||
| Municipal Bonds | 0.6% of portfolio | ||||
| Arizona | 0.4% | ||||
| Glendale Arizona | 1.45 | 07/01/26 | 1,000,000 | 882,277 |
| Glendale Arizona | 1.72 | 07/01/27 | 1,235,000 | 1,061,336 |
| Total Arizona | 1,943,613 | |||
| New York | 0.1% | ||||
| Suffolk County New York | 1.05 | 06/15/23 | 350,000 | 344,417 |
| Total New York | 344,417 | |||
| Texas | 0.1% | ||||
| Grey Forest Texas Gas System Revenue | 1.05 | 02/01/25 | 800,000 | 738,664 |
| Total Texas | 738,664 | |||
| Total Municipal Bonds | ||||
| (Cost $3,385,000) | 3,026,694 | |||
| Money Market Fund | 1.2% of portfolio | ||||
| Shares | ||||
| State Street Institutional U.S. Government Money Market Fund Premier Class | 4.12(d) | 5,860,480 | 5,860,480 | |
| Total Money Market Fund | ||||
| (Cost $5,860,480) | 5,860,480 | |||
| Total Investments in Securities | ||||
| (Cost $499,105,065) | 100.0% | $478,081,230 | |||
| (a) | Interest is paid at maturity. |
| (b) | Security was purchased pursuant to Rule 144A under the Securities Act of 1933 and may be resold in transactions exempt from registration, normally to qualified institutional buyers. The securities have been determined to be liquid under criteria established by the Fund's Board of Directors. The total of such securities at period-end amounts to $114,868,018 and represents 24.0% of total investments. |
| (c) | Variable coupon rate as of December 31, 2022. |
| (d) | 7-day yield at December 31, 2022. |
| The accompanying notes are an integral part of these financial statements. | Portfolio of Investments |
| Portfolio of Investments | The accompanying notes are an integral part of these financial statements. |
| U.S. Government & Agency Obligations | 34.5% of portfolio | ||||
| Interest Rate / Yield | Maturity Date | Face Amount | Value | |
| Federal Farm Credit Bank | 0.52% | 10/21/25 | $300,000 | $268,644 |
| U.S. International Development Finance Corp. | 1.05 | 10/15/29 | 120,629 | 105,231 |
| U.S. Treasury Note | 4.25 | 09/30/24 | 4,713,000 | 4,688,883 |
| U.S. Treasury Note | 4.25 | 10/15/25 | 6,707,000 | 6,701,760 |
| U.S. Treasury Note | 4.50 | 11/15/25 | 935,000 | 940,625 |
| U.S. Treasury Note | 3.88 | 11/30/27 | 7,502,000 | 7,460,973 |
| U.S. Treasury Note | 3.88 | 11/30/29 | 5,260,000 | 5,224,659 |
| U.S. Treasury Note | 4.13 | 11/15/32 | 4,854,000 | 4,953,355 |
| U.S. Treasury Note | 2.38 | 02/15/42 | 4,918,000 | 3,754,970 |
| U.S. Treasury Note | 3.25 | 05/15/42 | 1,804,000 | 1,581,601 |
| U.S. Treasury Note | 3.38 | 08/15/42 | 4,374,000 | 3,909,263 |
| U.S. Treasury Note | 4.00 | 11/15/42 | 605,000 | 592,333 |
| U.S. Treasury Note | 3.00 | 08/15/52 | 6,122,000 | 5,043,954 |
| Total U.S. Government & Agency Obligations | ||||
| (Cost $46,977,967) | 45,226,251 | |||
| Corporate Bonds–Other | 23.0% of portfolio | ||||
| Communication Services | 0.9% | ||||
| Magallanes, Inc. (a) | 4.05 | 03/15/29 | 190,000 | 164,373 |
| Magallanes, Inc. (a) | 4.28 | 03/15/32 | 190,000 | 156,515 |
| Magallanes, Inc. (a) | 5.05 | 03/15/42 | 285,000 | 218,048 |
| Magallanes, Inc. (a) | 5.14 | 03/15/52 | 180,000 | 130,854 |
| Magallanes, Inc. (a) | 5.39 | 03/15/62 | 190,000 | 138,703 |
| Sprint Spectrum Co. LLC (a) | 4.74 | 03/20/25 | 253,125 | 250,141 |
| T-Mobile US, Inc. | 3.00 | 02/15/41 | 200,000 | 141,125 |
| Total Communication Services | 1,199,759 | |||
| Consumer Discretionary | 1.2% | ||||
| Block Financial Corp. | 2.50 | 07/15/28 | 145,000 | 123,251 |
| Daimler Trucks Financial N.A. LLC (a) | 3.50 | 04/07/25 | 340,000 | 326,154 |
| Expedia Group, Inc. | 4.63 | 08/01/27 | 330,000 | 316,587 |
| General Motors Financial Co., Inc. | 4.35 | 01/17/27 | 150,000 | 142,528 |
| Kohl's Corp. | 5.55 | 07/17/45 | 530,000 | 333,900 |
| Tractor Supply Co. | 1.75 | 11/01/30 | 100,000 | 76,784 |
| US Airways 2013 1A PTT | 3.95 | 05/15/27 | 290,709 | 264,053 |
| Total Consumer Discretionary | 1,583,257 | |||
| Consumer Staples | 1.2% | ||||
| 7-Eleven Inc. (a) | 1.30 | 02/10/28 | 60,000 | 49,729 |
| 7-Eleven Inc. (a) | 1.80 | 02/10/31 | 60,000 | 45,821 |
| 7-Eleven Inc. (a) | 2.80 | 02/10/51 | 135,000 | 82,655 |
| Campbell Soup Co. | 2.38 | 04/24/30 | 250,000 | 208,043 |
| JBS USA Finance, Inc. (a) | 3.00 | 02/02/29 | 335,000 | 277,261 |
| JBS USA Finance, Inc. (a) | 4.38 | 02/02/52 | 530,000 | 374,670 |
| Philip Morris International Inc. | 5.75 | 11/17/32 | 310,000 | 316,022 |
| Smithfield Foods, Inc. (a) | 2.63 | 09/13/31 | 340,000 | 243,170 |
| Total Consumer Staples | 1,597,371 | |||
| Energy | 2.2% | ||||
| BP Capital Markets America Inc. | 2.77 | 11/10/50 | 210,000 | 134,068 |
| Cheniere Corpus Christi Holdings LLC | 5.13 | 06/30/27 | 180,000 | 177,827 |
| Cheniere Corpus Christi Holdings LLC | 3.70 | 11/15/29 | 39,000 | 35,253 |
| Cheniere Corpus Christi Holdings LLC | 2.74 | 12/31/39 | 170,000 | 131,455 |
| Energy Transfer Operating LP | 3.75 | 05/15/30 | 318,000 | 280,376 |
| The accompanying notes are an integral part of these financial statements. | Portfolio of Investments |
| Corporate Bonds–Other | 23.0% of portfolio (Continued) | ||||
| Interest Rate /Yield | Maturity Date | Face Amount | Value | |
| Energy | 2.2% (Continued) | ||||
| Energy Transfer Operating LP | 6.00% | 06/15/48 | $420,000 | $378,608 |
| HF Sinclair Corp. | 2.63 | 10/01/23 | 60,000 | 58,751 |
| Marathon Oil Corp. | 4.40 | 07/15/27 | 360,000 | 343,790 |
| Midwest Connector Capital Co. LLC (a) | 3.90 | 04/01/24 | 85,000 | 82,300 |
| Midwest Connector Capital Co. LLC (a) | 4.63 | 04/01/29 | 205,000 | 185,196 |
| MPLX LP | 1.75 | 03/01/26 | 80,000 | 71,310 |
| MPLX LP | 2.65 | 08/15/30 | 245,000 | 198,547 |
| National Oilwell Varco, Inc. | 3.60 | 12/01/29 | 112,000 | 98,441 |
| Phillips 66 | 2.15 | 12/15/30 | 260,000 | 208,176 |
| Pioneer Natural Resources Co. | 1.90 | 08/15/30 | 255,000 | 199,696 |
| Targa Resources Corp. | 5.20 | 07/01/27 | 260,000 | 254,834 |
| Total Energy | 2,838,628 | |||
| Financials | 10.0% | ||||
| Antares Holdings LP | 3.95 | 07/15/26 | 375,000 | 324,317 |
| Athene Global Funding (a) | 2.95 | 11/12/26 | 120,000 | 108,264 |
| Athene Holding Ltd. | 3.95 | 05/25/51 | 300,000 | 202,427 |
| Bank of America Corp. | 4.83(b) | 07/22/26 | 740,000 | 731,353 |
| Bank of America Corp. | 1.20(b) | 10/24/26 | 200,000 | 177,806 |
| Bank of America Corp. | 4.95(b) | 07/22/28 | 525,000 | 512,747 |
| Bank of America Corp. | 6.20(b) | 11/10/28 | 150,000 | 154,871 |
| Bank of America Corp. | 2.50(b) | 02/13/31 | 263,000 | 213,764 |
| Bank of America Corp. | 5.02(b) | 07/22/33 | 445,000 | 422,479 |
| CIT Group Inc. | 3.93(b) | 06/19/24 | 402,000 | 398,507 |
| Citigroup Inc. | 2.57(b) | 06/03/31 | 870,000 | 703,647 |
| Citigroup Inc. | 6.27(b) | 11/17/33 | 445,000 | 459,081 |
| CoreStates Capital II (a) | 4.73(b) | 01/15/27 | 725,000 | 677,819 |
| Fidus Investment Corp. | 3.50 | 11/15/26 | 166,000 | 135,994 |
| GA Global Funding Trust (a) | 0.80 | 09/13/24 | 240,000 | 219,301 |
| GA Global Funding Trust (a) | 3.85 | 04/11/25 | 460,000 | 440,256 |
| Goldman Sachs Group, Inc. | 2.64(b) | 02/24/28 | 245,000 | 218,144 |
| Goldman Sachs Group, Inc. | 3.62(b) | 03/15/28 | 153,000 | 142,514 |
| Goldman Sachs Group, Inc. | 2.38(b) | 07/21/32 | 365,000 | 283,207 |
| Goldman Sachs Group, Inc. | 2.91(b) | 07/21/42 | 230,000 | 156,405 |
| Goldman Sachs Group, Inc. | 3.44(b) | 02/24/43 | 255,000 | 187,368 |
| J.P. Morgan Chase & Co. | 2.08(b) | 04/22/26 | 340,000 | 315,621 |
| J.P. Morgan Chase & Co. | 1.04(b) | 02/04/27 | 150,000 | 130,480 |
| J.P. Morgan Chase & Co. | 4.91(b) | 07/25/33 | 185,000 | 176,143 |
| Main Street Capital Corp. | 3.00 | 07/14/26 | 743,000 | 640,321 |
| Morgan Stanley | 1.51(b) | 07/20/27 | 200,000 | 173,558 |
| Morgan Stanley | 1.79(b) | 02/13/32 | 510,000 | 383,296 |
| Morgan Stanley | 4.89(b) | 07/20/33 | 170,000 | 159,719 |
| Northern Trust Corp. | 6.13 | 11/02/32 | 265,000 | 279,427 |
| Owl Rock Capital Corp. III (a) | 3.13 | 04/13/27 | 681,000 | 560,594 |
| Owl Rock Core Income Corp. (a) | 3.13 | 09/23/26 | 1,311,000 | 1,115,612 |
| Owl Rock Technology Finance Corp. | 3.75 | 06/17/26 | 150,000 | 131,183 |
| Owl Rock Technology Finance Corp. | 2.50 | 01/15/27 | 366,000 | 298,359 |
| Prudential Financial, Inc. | 5.70(b) | 09/15/48 | 75,000 | 71,625 |
| Santander Holdings USA, Inc. | 2.49(b) | 01/06/28 | 298,000 | 255,679 |
| Security Benefit Global Funding (a) | 1.25 | 05/17/24 | 300,000 | 281,452 |
| Wells Fargo & Co. | 2.19(b) | 04/30/26 | 210,000 | 195,438 |
| Wells Fargo & Co. | 3.53(b) | 03/24/28 | 240,000 | 222,240 |
| Wells Fargo & Co. | 2.39(b) | 06/02/28 | 445,000 | 392,752 |
| Wells Fargo & Co. | 2.57(b) | 02/11/31 | 200,000 | 165,613 |
| Portfolio of Investments | The accompanying notes are an integral part of these financial statements. |
| Corporate Bonds–Other | 23.0% of portfolio (Continued) | ||||
| Interest Rate /Yield | Maturity Date | Face Amount | Value | |
| Financials | 10.0% (Continued) | ||||
| Wells Fargo & Co. | 3.07%(b) | 04/30/41 | $440,000 | $313,848 |
| Total Financials | 13,133,231 | |||
| Health Care | 0.7% | ||||
| GE Healthcare Technologies Inc. (a) | 5.60 | 11/15/25 | 225,000 | 226,386 |
| GE Healthcare Technologies Inc. (a) | 5.65 | 11/15/27 | 255,000 | 257,984 |
| GE Healthcare Technologies Inc. (a) | 5.91 | 11/22/32 | 270,000 | 279,774 |
| HCA Healthcare, Inc. | 3.50 | 07/15/51 | 228,000 | 146,277 |
| Mylan Inc. | 5.20 | 04/15/48 | 50,000 | 37,234 |
| Total Health Care | 947,655 | |||
| Industrials | 1.4% | ||||
| Ashtead Capital, Inc. (a) | 1.50 | 08/12/26 | 240,000 | 204,814 |
| Ashtead Capital, Inc. (a) | 4.25 | 11/01/29 | 308,000 | 276,071 |
| Ashtead Capital, Inc. (a) | 2.45 | 08/12/31 | 200,000 | 154,388 |
| BNSF Railway Co. (a) | 3.44 | 06/16/28 | 358,951 | 336,527 |
| Boeing Co. (The) | 2.20 | 02/04/26 | 350,000 | 317,997 |
| Delta Air Lines, Inc. (a) | 7.00 | 05/01/25 | 250,000 | 255,485 |
| Quanta Services, Inc. | 2.35 | 01/15/32 | 260,000 | 197,426 |
| Triton International Ltd. | 3.25 | 03/15/32 | 175,000 | 135,109 |
| Total Industrials | 1,877,817 | |||
| Information Technology | 1.1% | ||||
| Broadcom Cayman Finance Ltd. | 3.88 | 01/15/27 | 255,000 | 241,202 |
| Oracle Corp. | 6.25 | 11/09/32 | 275,000 | 287,821 |
| Oracle Corp. | 6.90 | 11/09/52 | 190,000 | 203,266 |
| Qualcomm Inc. | 6.00 | 05/20/53 | 170,000 | 180,552 |
| VMware, Inc. | 1.40 | 08/15/26 | 155,000 | 135,124 |
| VMware, Inc. | 4.70 | 05/15/30 | 200,000 | 186,043 |
| VMware, Inc. | 2.20 | 08/15/31 | 155,000 | 117,624 |
| Western Digital Corp. | 2.85 | 02/01/29 | 175,000 | 135,392 |
| Total Information Technology | 1,487,024 | |||
| Materials | 1.3% | ||||
| Celanese US Holdings LLC | 6.05 | 03/15/25 | 515,000 | 512,996 |
| Celanese US Holdings LLC | 6.17 | 07/15/27 | 360,000 | 355,077 |
| Celanese US Holdings LLC | 6.33 | 07/15/29 | 260,000 | 252,627 |
| Celanese US Holdings LLC | 6.38 | 07/15/32 | 175,000 | 166,416 |
| Glencore Funding LLC (a) | 2.63 | 09/23/31 | 260,000 | 207,118 |
| Glencore Funding LLC (a) | 3.38 | 09/23/51 | 170,000 | 110,268 |
| Silgan Holdings Inc. (a) | 1.40 | 04/01/26 | 125,000 | 110,282 |
| Total Materials | 1,714,784 | |||
| Real Estate | 0.3% | ||||
| Host Hotels & Resorts, LP | 4.50 | 02/01/26 | 150,000 | 143,730 |
| VICI Properties LP | 4.75 | 02/15/28 | 180,000 | 170,760 |
| Total Real Estate | 314,490 | |||
| Utilities | 2.7% | ||||
| Ameren Illinois Co. | 5.90 | 12/01/52 | 175,000 | 190,025 |
| Entergy Louisiana, LLC | 3.78 | 04/01/25 | 325,000 | 312,133 |
| Indianapolis Power & Light Co. (a) | 5.65 | 12/01/32 | 260,000 | 266,652 |
| National Fuel Gas Co. | 5.50 | 01/15/26 | 80,000 | 79,588 |
| The accompanying notes are an integral part of these financial statements. | Portfolio of Investments |
| Corporate Bonds–Other | 23.0% of portfolio (Continued) | ||||
| Interest Rate /Yield | Maturity Date | Face Amount | Value | |
| Utilities | 2.7% (Continued) | ||||
| Pacific Gas & Electric Co. | 4.25% | 08/01/23 | $644,000 | $640,717 |
| Pacific Gas & Electric Co. | 3.00 | 06/15/28 | 225,000 | 194,513 |
| Pacific Gas & Electric Co. | 4.55 | 07/01/30 | 130,000 | 117,832 |
| Pacific Gas & Electric Co. | 4.25 | 03/15/46 | 770,000 | 535,532 |
| SCE Recovery Funding LLC | 2.51 | 11/15/43 | 190,000 | 119,227 |
| Southern California Edison Co. | 1.10 | 04/01/24 | 370,000 | 351,412 |
| Southern California Edison Co. | 2.25 | 06/01/30 | 55,000 | 45,296 |
| Southern California Edison Co. | 4.50 | 09/01/40 | 200,000 | 170,781 |
| Southern California Edison Co. | 4.00 | 04/01/47 | 164,000 | 128,162 |
| Southern California Edison Co. | 3.65 | 02/01/50 | 214,000 | 156,289 |
| TerraForm Power Operating LLC (a) | 4.75 | 01/15/30 | 171,000 | 148,770 |
| Total Utilities | 3,456,929 | |||
| Total Corporate Bonds–Other | ||||
| (Cost $34,928,189) | 30,150,945 | |||
| Mortgage-Backed Securities | 22.3% of portfolio | ||||
| Farm 2021-1 Mortgage Trust 21-1 (a) | 2.18(b) | 01/25/51 | 227,752 | 184,949 |
| FHLMC QA7479 | 3.00 | 03/01/50 | 222,363 | 197,374 |
| FHLMC QE2363 | 3.50 | 05/01/52 | 1,379,945 | 1,255,080 |
| FHLMC SD1188 | 3.50 | 06/01/52 | 709,531 | 644,814 |
| FHLMC SD1495 | 5.00 | 08/01/52 | 934,362 | 932,614 |
| FHLMC SD7555 | 3.00 | 08/01/52 | 924,749 | 822,091 |
| FHLMC SD8068 | 3.00 | 06/01/50 | 212,951 | 188,156 |
| FHLMC SD8193 | 2.00 | 02/01/52 | 6,277,955 | 5,115,391 |
| FHLMC SD8237 | 4.00 | 08/01/52 | 1,370,499 | 1,285,580 |
| FNMA BN7662 | 3.50 | 07/01/49 | 88,571 | 81,451 |
| FNMA CA4016 | 3.00 | 08/01/49 | 512,580 | 454,499 |
| FNMA FM1000 | 3.00 | 04/01/47 | 923,884 | 824,117 |
| FNMA FM4231 | 2.50 | 09/01/50 | 239,270 | 204,196 |
| FNMA MA3691 | 3.00 | 07/01/49 | 146,039 | 129,172 |
| FNMA MA3834 | 3.00 | 11/01/49 | 304,100 | 268,775 |
| FNMA MA3960 | 3.00 | 03/01/50 | 140,253 | 123,822 |
| FNMA MA3992 | 3.50 | 04/01/50 | 140,537 | 128,804 |
| FNMA MA4048 | 3.00 | 06/01/50 | 637,280 | 562,791 |
| FNMA MA4124 | 2.50 | 09/01/35 | 1,194,889 | 1,096,397 |
| FNMA MA4179 | 2.00 | 11/01/35 | 3,878,556 | 3,459,487 |
| FNMA MA4229 | 2.00 | 01/01/36 | 1,823,112 | 1,630,608 |
| FNMA MA4254 | 1.50 | 02/01/51 | 2,707,254 | 2,090,779 |
| FNMA MA4303 | 2.00 | 04/01/36 | 1,551,199 | 1,383,563 |
| FNMA MA4418 | 2.00 | 09/01/36 | 2,594,322 | 2,313,882 |
| FNMA MA4579 | 3.00 | 04/01/52 | 734,031 | 644,550 |
| Freddie Mac STACR 21-HQA3 (a) | 7.28(b) | 09/25/41 | 1,000,000 | 854,118 |
| GNMA 21-8 | 1.00 | 01/20/50 | 526,943 | 411,651 |
| GNMA CK0445 | 4.00 | 02/15/52 | 1,334,455 | 1,269,505 |
| GNMA G2786247 | 4.00 | 07/20/52 | 677,007 | 640,332 |
| Total Mortgage-Backed Securities | ||||
| (Cost $31,672,752) | 29,198,548 | |||
| Asset-Backed Securities | 9.2% of portfolio | ||||
| American Credit Acceptance Receivables Trust 22-1B (a) | 1.68 | 09/14/26 | 375,000 | 365,427 |
| Avant Credit Card Master Trust 21-1A (a) | 1.37 | 04/15/27 | 500,000 | 457,437 |
| Avant Loans Funding Trust 21-REV1 (a) | 1.21 | 07/15/30 | 500,000 | 476,220 |
| Avant Loans Funding Trust 22-REV1 (a) | 6.54 | 09/15/31 | 595,000 | 580,927 |
| Colony American Finance Ltd. 21-2 (a) | 1.41 | 07/15/54 | 175,753 | 149,596 |
| Portfolio of Investments | The accompanying notes are an integral part of these financial statements. |
| Asset-Backed Securities | 9.2% of portfolio (Continued) | ||||
| Interest Rate /Yield | Maturity Date | Face Amount | Value | |
| CoreVest American Finance 20-4 (a) | 1.17% | 12/15/52 | $127,162 | $112,248 |
| CoreVest American Finance 21-1 (a) | 1.57 | 04/15/53 | 826,557 | 718,138 |
| CoreVest American Finance 21-3 (a) | 2.49 | 10/15/54 | 660,000 | 566,070 |
| CPS Auto Trust 21-B (a) | 0.81 | 12/15/25 | 112,304 | 111,539 |
| Credit Acceptance Auto Loan Trust 20-1A (a) | 2.39 | 04/16/29 | 159,857 | 159,227 |
| Credit Acceptance Auto Loan Trust 20-2A (a) | 1.37 | 07/16/29 | 116,290 | 115,129 |
| Credit Acceptance Auto Loan Trust 20-3A (a) | 1.24 | 10/15/29 | 285,250 | 279,360 |
| Credit Acceptance Auto Loan Trust 21-2A (a) | 0.96 | 02/15/30 | 320,000 | 307,742 |
| Credito Real USA Auto Receivables Trust 21-1 (a) | 1.35 | 02/16/27 | 263,021 | 257,074 |
| DT Auto Owner Trust 20-3A (a) | 0.91 | 12/16/24 | 42,195 | 42,070 |
| FIC Funding 21-1 (a) | 1.13 | 04/15/33 | 98,591 | 96,287 |
| First Investors Auto Owner Trust 21-2A (a) | 0.48 | 03/15/27 | 237,537 | 229,698 |
| Firstkey Homes Trust 22-SFR2 (a) | 4.25 | 07/17/39 | 323,172 | 305,145 |
| Flagship Credit Auto Trust 21-3 (a) | 0.36 | 07/15/27 | 197,937 | 191,678 |
| FRTKL 21-SFR1 (a) | 1.57 | 09/17/38 | 250,000 | 213,600 |
| GLS Auto Receivables Trust 21-3A (a) | 0.42 | 01/15/25 | 65,313 | 64,975 |
| GLS Auto Receivables Trust 21-4 (a) | 0.84 | 07/15/25 | 242,945 | 239,638 |
| Gracie Point International Fund 21-1 (a) | 4.87(b) | 11/01/23 | 319,877 | 319,154 |
| LAD Auto Receivables Trust 21-1 (a) | 1.30 | 08/17/26 | 197,185 | 191,625 |
| Oasis Securitisation 21-1A (a) | 2.58 | 02/15/33 | 76,671 | 75,550 |
| Oasis Securitisation 21-2A (a) | 2.14 | 10/15/33 | 296,922 | 289,558 |
| Oasis Securitisation 22-1A (a) | 4.75 | 05/15/34 | 167,833 | 164,646 |
| Oasis Securitisation 22-2A (a) | 6.85 | 10/15/34 | 583,795 | 580,694 |
| Oportun Funding 21-A (a) | 1.21 | 03/08/28 | 300,000 | 279,353 |
| Oportun Funding 21-B (a) | 1.47 | 05/08/31 | 1,000,000 | 873,426 |
| Oscar US Funding Trust 21-1A (a) | 0.40 | 03/11/24 | 12,549 | 12,521 |
| PenFed Auto Receivable Owner 22-A (a) | 3.96 | 04/15/26 | 330,000 | 325,043 |
| Progress Residential Trust 21-SFR8 (a) | 1.51 | 10/17/38 | 338,192 | 288,124 |
| Progress Residential Trust 22-SFR3 (a) | 3.20 | 04/17/39 | 250,000 | 226,612 |
| Progress Residential Trust 22-SFR3 (a) | 3.60 | 04/17/39 | 165,000 | 147,315 |
| SBA Tower Trust (a) | 2.84 | 01/15/25 | 230,000 | 216,779 |
| SBA Tower Trust (a) | 1.88 | 01/15/26 | 330,000 | 290,228 |
| SBA Tower Trust (a) | 1.63 | 11/15/26 | 580,000 | 492,581 |
| SBA Tower Trust (a) | 6.60 | 01/15/28 | 210,000 | 209,487 |
| SBA Tower Trust (a) | 2.59 | 10/15/31 | 430,000 | 330,061 |
| Upstart Securitization Trust 21-3 (a) | 0.83 | 07/20/31 | 66,354 | 64,982 |
| Upstart Securitization Trust 21-4 (a) | 0.84 | 09/20/31 | 152,505 | 147,628 |
| Westgate Resorts 22-1A (a) | 2.29 | 08/20/36 | 300,183 | 282,333 |
| Westlake Automobile Receivable Trust 20-3A (a) | 0.78 | 11/17/25 | 124,539 | 123,892 |
| Total Asset-Backed Securities | ||||
| (Cost $12,916,028) | 11,970,817 | |||
| Yankee Bonds | 4.9% of portfolio | ||||
| Aircastle Ltd. (a) | 5.25 | 08/11/25 | 206,000 | 198,117 |
| Aptiv PLC | 3.10 | 12/01/51 | 280,000 | 165,476 |
| Avolon Holdings Funding Ltd. (a) | 5.13 | 10/01/23 | 500,000 | 494,380 |
| Avolon Holdings Funding Ltd. (a) | 5.50 | 01/15/26 | 800,000 | 760,562 |
| Avolon Holdings Funding Ltd. (a) | 2.75 | 02/21/28 | 500,000 | 401,367 |
| Barclays PLC | 7.33(b) | 11/02/26 | 370,000 | 383,244 |
| Cenovus Energy Inc. | 5.25 | 06/15/37 | 395,000 | 359,831 |
| Delta and SkyMiles IP Ltd. (a) | 4.75 | 10/20/28 | 550,000 | 516,985 |
| Lenovo Group Ltd. (a) | 5.83 | 01/27/28 | 370,000 | 357,181 |
| Lenovo Group Ltd. (a) | 3.42 | 11/02/30 | 805,000 | 638,367 |
| Nissan Motor Co., Ltd. (a) | 3.52 | 09/17/25 | 230,000 | 213,647 |
| Nissan Motor Co., Ltd. (a) | 1.85 | 09/16/26 | 260,000 | 217,058 |
| Nissan Motor Co., Ltd. (a) | 2.45 | 09/15/28 | 435,000 | 338,022 |
| Nissan Motor Co., Ltd. (a) | 4.81 | 09/17/30 | 200,000 | 169,734 |
| The accompanying notes are an integral part of these financial statements. | Portfolio of Investments |
| Yankee Bonds | 4.9% of portfolio (Continued) | ||||
| Interest Rate /Yield | Maturity Date | Face Amount | Value | |
| Petronas Capital Ltd. (a) | 3.40% | 04/28/61 | $360,000 | $247,766 |
| Syngenta Finance NV (a) | 4.44 | 04/24/23 | 230,000 | 228,970 |
| Syngenta Finance NV (a) | 4.89 | 04/24/25 | 530,000 | 513,323 |
| Var Energi ASA (a) | 7.50 | 01/15/28 | 200,000 | 203,721 |
| Total Yankee Bonds | ||||
| (Cost $7,284,845) | 6,407,751 | |||
| Municipal Bonds | 2.5% of portfolio | ||||
| Arizona | 0.2% | ||||
| Pinal County Arizona Revenue Obligation | 1.05 | 08/01/24 | 120,000 | 113,375 |
| Pinal County Arizona Revenue Obligation | 1.58 | 08/01/26 | 110,000 | 98,254 |
| Yuma Arizona Pledged Revenue | 2.63 | 07/15/38 | 135,000 | 93,079 |
| Total Arizona | 304,708 | |||
| California | 1.3% | ||||
| City of Chula Vista California Pension Obligation | 1.16 | 06/01/27 | 130,000 | 109,725 |
| City of Chula Vista California Pension Obligation | 1.41 | 06/01/28 | 130,000 | 107,002 |
| City of Chula Vista California Pension Obligation | 1.63 | 06/01/29 | 160,000 | 128,805 |
| City of Chula Vista California Pension Obligation | 2.91 | 06/01/45 | 255,000 | 163,149 |
| City of Los Angeles California Department of Airports | 1.25 | 05/15/28 | 200,000 | 164,941 |
| City of Monterey Park California Pension Obligation | 1.89 | 06/01/30 | 1,000,000 | 800,378 |
| Huntington Beach California Pension Obligation | 1.68 | 06/15/27 | 155,000 | 134,054 |
| San Francisco California City & County Airports | 3.35 | 05/01/51 | 100,000 | 67,795 |
| Total California | 1,675,849 | |||
| Colorado | 0.2% | ||||
| Regional Transportation District Colorado | 1.18 | 11/01/27 | 175,000 | 148,309 |
| Regional Transportation District Colorado | 1.33 | 11/01/28 | 150,000 | 123,563 |
| Total Colorado | 271,872 | |||
| New Jersey | 0.4% | ||||
| New Jersey Transportation Trust Fund Authority | 4.08 | 06/15/39 | 575,000 | 475,554 |
| Total New Jersey | 475,554 | |||
| Texas | 0.3% | ||||
| Harris County Texas Cultural Education Facilities Finance Corp. | 3.34 | 11/15/37 | 275,000 | 222,128 |
| North Texas Tollway Authority Revenue | 3.01 | 01/01/43 | 150,000 | 112,220 |
| San Antonio Texas Electric & Gas | 2.91 | 02/01/48 | 150,000 | 105,575 |
| Total Texas | 439,923 | |||
| West Virginia | 0.1% | ||||
| West Virginia State University Revenues | 3.01 | 10/01/41 | 150,000 | 110,974 |
| Total West Virginia | 110,974 | |||
| Total Municipal Bonds | ||||
| (Cost $4,104,066) | 3,278,880 | |||
| Corporate Bonds Guaranteed by Export-Import Bank of the United States | 0.4% of portfolio | ||||
| Energy | 0.1% | ||||
| Petroleos Mexicanos | 4.43(b) | 04/15/25 | 178,750 | 178,193 |
| Total Energy | 178,193 | |||
| Portfolio of Investments | The accompanying notes are an integral part of these financial statements. |
| Corporate Bonds Guaranteed by Export-Import Bank of the United States | 0.4% of portfolio (Continued) | ||||
| Interest Rate /Yield | Maturity Date | Face Amount | Value | |
| Financials | 0.3% | ||||
| Thirax 1 LLC | 0.97% | 01/14/33 | $431,451 | $354,853 |
| Total Financials | 354,853 | |||
| Total Corporate Bonds Guaranteed by Export-Import Bank of the United States | ||||
| (Cost $610,098) | 533,046 | |||
| Money Market Fund | 3.2% of portfolio | ||||
| Shares | ||||
| State Street Institutional U.S. Government Money Market Fund Premier Class | 4.12(c) | 4,226,719 | 4,226,719 | |
| Total Money Market Fund | ||||
| (Cost $4,226,719) | 4,226,719 | |||
| Total Investments in Securities | ||||
| (Cost $142,720,664) | 100.0% | $130,992,957 | |||
| (a) | Security was purchased pursuant to Rule 144A under the Securities Act of 1933 and may be resold in transactions exempt from registration, normally to qualified institutional buyers. The securities have been determined to be liquid under criteria established by the Fund's Board of Trustees. The total of such securities at period-end amounts to $27,472,491 and represents 21.0% of total investments. |
| (b) | Variable coupon rate as of December 31, 2022. |
| (c) | 7-day yield at December 31, 2022. |
| The accompanying notes are an integral part of these financial statements. | Portfolio of Investments |
| Common Stocks | 55.5% of portfolio | ||||
| Shares | Value | |||
| Communication Services | 0.4% | ||||
| Media | ||||
| Cable One, Inc. | 39 | $27,763 | ||
| Total Communication Services | 27,763 | |||
| Consumer Discretionary | 7.2% | ||||
| Hotels, Restaurants & Leisure | ||||
| Choice Hotels International, Inc. | 925 | 104,192 | ||
| Leisure Products | ||||
| Malibu Boats, Inc. Class A (a) | 942 | 50,209 | ||
| Multiline Retail | ||||
| Dollar General Corp. | 301 | 74,121 | ||
| Ollie's Bargain Outlet Holdings, Inc. (a) | 512 | 23,982 | ||
| Specialty Retail | ||||
| ARKO Corp. | 4,249 | 36,796 | ||
| Lowe's Companies, Inc. | 276 | 54,990 | ||
| O'Reilly Automotive, Inc. (a) | 133 | 112,256 | ||
| Tractor Supply Co. | 318 | 71,541 | ||
| Total Consumer Discretionary | 528,087 | |||
| Consumer Staples | 2.1% | ||||
| Food Products | ||||
| Hershey Co. (The) | 687 | 159,089 | ||
| Total Consumer Staples | 159,089 | |||
| Energy | 2.4% | ||||
| Oil, Gas & Consumable Fuels | ||||
| Chevron Corp. | 330 | 59,232 | ||
| ConocoPhillips | 477 | 56,286 | ||
| Marathon Petroleum Corp. | 545 | 63,432 | ||
| Total Energy | 178,950 | |||
| Financials | 7.8% | ||||
| Banks | ||||
| FB Financial Corp. | 835 | 30,177 | ||
| Glacier Bancorp, Inc. | 1,412 | 69,781 | ||
| SouthState Corp. | 597 | 45,587 | ||
| Truist Financial Corp. | 2,605 | 112,093 | ||
| Capital Markets | ||||
| CME Group, Inc. | 670 | 112,667 | ||
| Intercontinental Exchange, Inc. | 827 | 84,842 | ||
| Insurance | ||||
| Allstate Corp. | 156 | 21,154 | ||
| American International Group, Inc. | 715 | 45,216 | ||
| Chubb Ltd. | 232 | 51,179 | ||
| Total Financials | 572,696 | |||
| Health Care | 8.1% | ||||
| Health Care Equipment & Supplies | ||||
| Integer Holdings Corp. (a) | 1,222 | 83,658 | ||
| Stryker Corp. | 547 | 133,736 | ||
| Health Care Providers & Services | ||||
| AMN Healthcare Services, Inc. (a) | 597 | 61,384 | ||
| Centene Corp. (a) | 1,104 | 90,539 | ||
| Portfolio of Investments | The accompanying notes are an integral part of these financial statements. |
| Common Stocks | 55.5% of portfolio (Continued) | ||||
| Shares | Value | |||
| Health Care | 8.1% (Continued) | ||||
| Life Sciences Tools & Services | ||||
| IQVIA Holdings Inc. (a) | 377 | $77,244 | ||
| Pharmaceuticals | ||||
| Zoetis Inc. | 1,026 | 150,360 | ||
| Total Health Care | 596,921 | |||
| Industrials | 9.7% | ||||
| Air Freight & Logistics | ||||
| Air Transport Services Group, Inc. (a) | 2,117 | 55,000 | ||
| Commercial Services & Supplies | ||||
| Casella Waste Systems, Inc. Class A (a) | 691 | 54,803 | ||
| Machinery | ||||
| Cummins Inc. | 212 | 51,365 | ||
| Deere & Co. | 457 | 195,943 | ||
| Xylem, Inc. | 233 | 25,763 | ||
| Road & Rail | ||||
| CSX Corp. | 2,972 | 92,072 | ||
| J.B. Hunt Transport Services, Inc. | 299 | 52,134 | ||
| Trading Companies & Distributors | ||||
| Applied Industrial Technologies, Inc. | 518 | 65,284 | ||
| Fastenal Co. | 2,544 | 120,382 | ||
| Total Industrials | 712,746 | |||
| Information Technology | 11.6% | ||||
| Electronic Equipment, Instruments & Components | ||||
| Advanced Energy Industries, Inc. | 827 | 70,940 | ||
| Corning Inc. | 3,319 | 106,009 | ||
| Trimble Inc. (a) | 1,329 | 67,194 | ||
| IT Services | ||||
| Block, Inc. (a) | 601 | 37,767 | ||
| Jack Henry & Associates, Inc. | 866 | 152,035 | ||
| Semiconductors & Semiconductor Equipment | ||||
| Diodes Inc. (a) | 1,051 | 80,023 | ||
| Software | ||||
| ANSYS, Inc. (a) | 423 | 102,193 | ||
| Paycom Software, Inc. (a) | 454 | 140,881 | ||
| Tyler Technologies, Inc. (a) | 311 | 100,269 | ||
| Total Information Technology | 857,311 | |||
| Materials | 1.7% | ||||
| Chemicals | ||||
| Sherwin-Williams Co. (The) | 271 | 64,316 | ||
| Construction Materials | ||||
| Vulcan Materials Co. | 360 | 63,040 | ||
| Total Materials | 127,356 | |||
| Real Estate | 4.5% | ||||
| Equity Real Estate Investment Trusts (REITs) | ||||
| American Tower Corp. | 701 | 148,514 | ||
| Community Healthcare Trust Inc. | 696 | 24,917 | ||
| Crown Castle International Corp. | 1,037 | 140,658 | ||
| The accompanying notes are an integral part of these financial statements. | Portfolio of Investments |
| Common Stocks | 55.5% of portfolio (Continued) | ||||
| Shares | Value | |||
| Real Estate | 4.5% (Continued) | ||||
| Uniti Group Inc. | 2,828 | $15,639 | ||
| Total Real Estate | 329,728 | |||
| Total Common Stocks | ||||
| (Cost $ 4,414,713) | 4,090,647 | |||
| U.S. Government & Agency Obligations | 18.4% of portfolio | ||||
| Interest Rate / Yield | Maturity Date | Face Amount | ||
| Federal Farm Credit Bank | 0.52% | 10/21/25 | $200,000 | 179,096 |
| Federal Farm Credit Bank | 3.32 | 02/25/26 | 200,000 | 194,665 |
| Federal Farm Credit Bank | 1.20 | 04/28/27 | 195,000 | 171,254 |
| Federal Farm Credit Bank | 3.37 | 09/15/27 | 120,000 | 116,587 |
| Federal Farm Credit Bank | 3.43 | 12/06/28 | 62,000 | 59,411 |
| Federal Farm Credit Bank | 4.00 | 09/27/29 | 200,000 | 195,932 |
| Federal Farm Credit Bank | 3.50 | 09/01/32 | 50,000 | 46,370 |
| Tennessee Valley Authority | 2.88 | 09/15/24 | 99,000 | 95,950 |
| Tennessee Valley Authority | 0.75 | 05/15/25 | 88,000 | 80,418 |
| Tennessee Valley Authority | 7.12 | 05/01/30 | 95,000 | 110,070 |
| Tennessee Valley Authority | 1.50 | 09/15/31 | 135,000 | 105,930 |
| Total U.S. Government & Agency Obligations | ||||
| (Cost $ 1,438,817) | 1,355,683 | |||
| Corporate Bonds–Other | 13.0% of portfolio | ||||
| Communication Services | 1.2% | ||||
| DISH DBS Corp. (b) | 5.25 | 12/01/26 | 57,000 | 48,013 |
| T-Mobile USA, Inc. | 3.75 | 04/15/27 | 44,000 | 41,443 |
| Total Communication Services | 89,456 | |||
| Consumer Discretionary | 1.2% | ||||
| Choice Hotels International, Inc. | 3.70 | 01/15/31 | 25,000 | 21,192 |
| Kohl's Corp. | 3.25 | 02/01/23 | 8,000 | 7,940 |
| Kohl's Corp. | 4.25 | 07/17/25 | 22,000 | 20,625 |
| Tractor Supply Co. | 1.75 | 11/01/30 | 44,000 | 33,785 |
| Total Consumer Discretionary | 83,542 | |||
| Consumer Staples | 0.4% | ||||
| Bunge Limited Finance Corp. | 3.75 | 09/25/27 | 10,000 | 9,337 |
| Dollar General Corp. | 4.15 | 11/01/25 | 22,000 | 21,513 |
| Total Consumer Staples | 30,850 | |||
| Energy | 0.1% | ||||
| Murphy Oil Corp. | 6.38 | 07/15/28 | 3,000 | �� 2,888 |
| Total Energy | 2,888 | |||
| Financials | 5.6% | ||||
| American Tower Corp. | 3.95 | 03/15/29 | 60,000 | 55,311 |
| Chubb INA Holdings Inc. | 3.15 | 03/15/25 | 36,000 | 34,762 |
| Cincinnati Financial Corp. | 6.92 | 05/15/28 | 25,000 | 26,680 |
| Globe Life Inc. | 4.55 | 09/15/28 | 33,000 | 31,981 |
| Intercontinental Exchange, Inc. | 3.75 | 12/01/25 | 78,000 | 75,791 |
| M&T Bank Corp. | 3.55 | 07/26/23 | 58,000 | 57,572 |
| Portfolio of Investments | The accompanying notes are an integral part of these financial statements. |
| Corporate Bonds–Other | 13.0% of portfolio (Continued) | ||||
| Interest Rate /Yield | Maturity Date | Face Amount | Value | |
| Financials | 5.6% (Continued) | ||||
| Metlife, Inc. | 3.00% | 03/01/25 | $42,000 | $40,326 |
| Truist Bank | 3.69 (c) | 08/02/24 | 60,000 | 59,453 |
| Truist Financial Corp. | 3.87 | 03/19/29 | 35,000 | 32,274 |
| Total Financials | 414,150 | |||
| Health Care | 1.6% | ||||
| CVS Health Corp. | 1.30 | 08/21/27 | 26,000 | 22,012 |
| Laboratory Corporation of America Holdings | 2.30 | 12/01/24 | 20,000 | 18,914 |
| Laboratory Corporation of America Holdings | 1.55 | 06/01/26 | 43,000 | 38,084 |
| Zoetis Inc. | 5.40 | 11/14/25 | 40,000 | 40,799 |
| Total Health Care | 119,809 | |||
| Industrials | 0.7% | ||||
| CNH Industrial Capital LLC | 1.45 | 07/15/26 | 17,000 | 14,982 |
| J.B. Hunt Transport Services, Inc. | 3.88 | 03/01/26 | 23,000 | 22,271 |
| John Deere Capital Corp. | 2.65 | 06/24/24 | 15,000 | 14,546 |
| Total Industrials | 51,799 | |||
| Information Technology | 0.3% | ||||
| Micron Technology, Inc. | 4.66 | 02/15/30 | 26,000 | 23,581 |
| Total Information Technology | 23,581 | |||
| Materials | 1.1% | ||||
| Martin Marietta Materials, Inc. | 3.50 | 12/15/27 | 9,000 | 8,328 |
| Mosaic Co. | 4.05 | 11/15/27 | 22,000 | 20,715 |
| Steel Dynamics, Inc. | 2.40 | 06/15/25 | 27,000 | 25,317 |
| Vulcan Materials Co. | 3.50 | 06/01/30 | 32,000 | 28,187 |
| Total Materials | 82,547 | |||
| Real Estate | 0.2% | ||||
| Crown Castle International Corp. | 3.80 | 02/15/28 | 18,000 | 16,729 |
| Total Real Estate | 16,729 | |||
| Utilities | 0.6% | ||||
| Black Hills Corp. | 4.25 | 11/30/23 | 45,000 | 44,747 |
| Total Utilities | 44,747 | |||
| Total Corporate Bonds–Other | ||||
| (Cost $ 1,060,629) | 960,098 | |||
| Asset-Backed Securities | 3.0% of portfolio | ||||
| CNH Equipment Trust 22-A | 2.39 | 08/15/25 | 96,476 | 95,075 |
| SBA Tower Trust (b) | 1.63 | 11/15/26 | 60,000 | 50,957 |
| SBA Tower Trust (b) | 2.59 | 10/15/31 | 52,000 | 39,914 |
| SBA Tower Trust (b) | 2.84 | 01/15/25 | 35,000 | 32,988 |
| Total Asset-Backed Securities | ||||
| (Cost $ 244,616) | 218,934 | |||
| Municipal Bonds | 1.5% of portfolio | ||||
| Kansas | 0.1% | ||||
| City of Wichita, Kansas Water & Sewer Utility Revenue | 3.00 | 10/01/24 | 10,000 | 9,733 |
| The accompanying notes are an integral part of these financial statements. | Portfolio of Investments |
| Municipal Bonds | 1.5% of portfolio (Continued) | ||||
| Interest Rate /Yield | Maturity Date | Face Amount | Value | |
| Montana | 0.2% | ||||
| Yellowstone County School District No. 2 Billings | 2.22% | 06/15/32 | $15,000 | $11,880 |
| Pennsylvania | 0.5% | ||||
| Geisinger Health System Revenue | 2.25 | 04/01/27 | 20,000 | 17,918 |
| New Castle Sanitation Authority | 1.16 | 06/01/25 | 25,000 | 22,911 |
| Total Pennsylvania | 40,829 | |||
| Texas | 0.4% | ||||
| Grey Forest Texas Gas System Revenue | 1.05 | 02/01/25 | 30,000 | 27,700 |
| Washington | 0.3% | ||||
| Northwest Open Access Network Revenue | 1.68 | 12/01/27 | 30,000 | 24,485 |
| Total Municipal Bonds | ||||
| (Cost $ 131,547) | 114,627 | |||
| Mortgage-Backed Securities | 1.2% of portfolio | ||||
| Farm 2021-1 Mortgage Trust 21-1 (b) | 2.18(c) | 01/25/51 | 26,794 | 21,759 |
| Freddie Mac Multiclass Certificates 21-P009 | 1.13 | 01/25/31 | 45,526 | 38,900 |
| GNMA II POOL 785401 | 2.50 | 10/20/50 | 29,559 | 24,872 |
| Total Mortgage-Backed Securities | ||||
| (Cost $ 103,164) | 85,531 | |||
| Money Market Fund | 7.4% of portfolio | ||||
| Shares | ||||
| State Street Institutional U.S. Government Money Market Fund | 4.12%(d) | 542,698 | 542,698 | |
| Total Money Market Fund | ||||
| (Cost $ 542,698) | 542,698 | |||
| Total Investments in Securities | ||||
| (Cost $7,936,184) | 100.0% | $7,368,218 | |||
| (a) | Non-income producing. |
| (b) | Security was purchased pursuant to Rule 144A under the Securities Act of 1933 and may be resold in transactions exempt from registration, normally to qualified institutional buyers. The securities have been determined to be liquid under criteria established by the Fund's Board of Directors. The total of such securities at period-end amounts to $193,631 and represents 2.6% of total investments. |
| (c) | Variable coupon rate as of December 31, 2022. |
| (d) | 7-day yield at December 31, 2022. |
| Portfolio of Investments | The accompanying notes are an integral part of these financial statements. |
| Cost | Value | |
| Investment | $39,747,203 | $191,800,417 |
| The accompanying notes are an integral part of these financial statements. | Portfolio of Investments |
| Common Stocks | 97.8% of portfolio | ||
| Shares | Value | |
| Communication Services | 4.3% | ||
| Interactive Media & Services | ||
| Alphabet, Inc., Class C (a) | 324,320 | $28,776,913 |
| Meta Platforms, Inc., Class A (a) | 87,700 | 10,553,818 |
| Total Communication Services | 39,330,731 | |
| Consumer Discretionary | 6.7% | ||
| Hotels, Restaurants & Leisure | ||
| McDonald's Corp. | 57,197 | 15,073,126 |
| Multiline Retail | ||
| Target Corp. | 39,800 | 5,931,792 |
| Specialty Retail | ||
| Home Depot, Inc. | 37,018 | 11,692,505 |
| TJX Companies, Inc. (The) | 143,600 | 11,430,560 |
| Ulta Beauty, Inc. (a) | 37,256 | 17,475,672 |
| Total Consumer Discretionary | 61,603,655 | |
| Consumer Staples | 1.0% | ||
| Food Products | ||
| Kraft Heinz Co. (The) | 228,300 | 9,294,093 |
| Total Consumer Staples | 9,294,093 | |
| Energy | 7.7% | ||
| Oil, Gas & Consumable Fuels | ||
| Chevron Corp. | 166,300 | 29,849,187 |
| ConocoPhillips | 238,100 | 28,095,800 |
| Hess Corp. | 94,800 | 13,444,536 |
| Total Energy | 71,389,523 | |
| Financials | 17.4% | ||
| Banks | ||
| Bank of America Corp. | 618,502 | 20,484,786 |
| Citigroup, Inc. | 274,739 | 12,426,445 |
| JPMorgan Chase & Co. | 258,991 | 34,730,693 |
| Truist Financial Corp. | 355,600 | 15,301,468 |
| Capital Markets | ||
| Goldman Sachs Group, Inc. | 76,774 | 26,362,656 |
| Insurance | ||
| Allstate Corp. | 95,784 | 12,988,310 |
| American International Group, Inc. | 339,594 | 21,475,925 |
| Chubb Ltd. | 79,138 | 17,457,843 |
| Total Financials | 161,228,126 | |
| Health Care | 22.7% | ||
| Biotechnology | ||
| AbbVie Inc. | 208,363 | 33,673,545 |
| Health Care Equipment & Supplies | ||
| Abbott Laboratories | 296,856 | 32,591,820 |
| Boston Scientific Corp. (a) | 452,396 | 20,932,363 |
| Health Care Providers & Services | ||
| Centene Corp. (a) | 329,397 | 27,013,848 |
| Cigna Corp. | 81,814 | 27,108,251 |
| Common Stocks | 97.8% of portfolio (Continued) | ||
| Shares | Value | |
| Health Care | 22.7% (Continued) | ||
| Pharmaceuticals | ||
| Bristol-Myers Squibb Co. | 217,701 | $15,663,587 |
| Merck & Co., Inc. | 187,682 | 20,823,318 |
| Pfizer, Inc. | 361,099 | 18,502,713 |
| Royalty Pharma PLC, Class A | 346,484 | 13,693,047 |
| Total Health Care | 210,002,492 | |
| Industrials | 17.2% | ||
| Aerospace & Defense | ||
| Northrop Grumman Corp. | 47,131 | 25,715,145 |
| Electrical Equipment | ||
| Eaton Corp. PLC | 88,887 | 13,950,815 |
| Industrial Conglomerates | ||
| Honeywell International, Inc. | 165,573 | 35,482,294 |
| Machinery | ||
| Deere & Co. | 46,800 | 20,065,968 |
| Parker-Hannifin Corp. | 94,222 | 27,418,602 |
| Professional Services | ||
| Leidos Holdings Inc. | 161,117 | 16,947,897 |
| Road & Rail | ||
| CSX Corp. | 619,182 | 19,182,258 |
| Total Industrials | 158,762,979 | |
| Information Technology | 10.3% | ||
| Electronic Equipment, Instruments & Components | ||
| Corning Inc. | 255,600 | 8,163,864 |
| IT Services | ||
| Fiserv, Inc. (a) | 177,700 | 17,960,139 |
| Visa Inc., Class A | 101,298 | 21,045,673 |
| Semiconductors & Semiconductor Equipment | ||
| Lam Research Corp. | 11,300 | 4,749,390 |
| NXP Semiconductors NV | 71,863 | 11,356,510 |
| Software | ||
| Microsoft Corp. | 135,314 | 32,451,003 |
| Total Information Technology | 95,726,579 | |
| Materials | 7.8% | ||
| Chemicals | ||
| Dow Inc. | 193,281 | 9,739,430 |
| DuPont de Nemours, Inc. | 259,878 | 17,835,427 |
| Containers & Packaging | ||
| Avery Dennison Corp. | 147,987 | 26,785,647 |
| Metals & Mining | ||
| Freeport-McMoRan Inc. | 473,700 | 18,000,600 |
| Total Materials | 72,361,104 | |
| Real Estate | 2.7% | ||
| Equity Real Estate Investment Trusts (REITs) | ||
| Digital Realty Trust, Inc. | 52,301 | 5,244,221 |
| Portfolio of Investments | The accompanying notes are an integral part of these financial statements. |
| Common Stocks | 97.8% of portfolio (Continued) | ||
| Shares | Value | |
| Real Estate | 2.7% (Continued) | ||
| VICI Properties Inc. | 611,935 | $19,826,694 |
| Total Real Estate | 25,070,915 | |
| Total Common Stocks | ||
| (Cost $534,090,677) | 904,770,197 | |
| Money Market Fund | 2.2% of portfolio | ||
| State Street Institutional U.S. Government Money Market Fund Premier Class, 4.12% (b) | 20,549,021 | 20,549,021 |
| Total Money Market Fund | ||
| (Cost $20,549,021) | 20,549,021 | |
| Total Investments in Securities | ||
| (Cost $554,639,698) | 100.0% | $925,319,218 | |
| (a) | Non-income producing. |
| (b) | 7-day yield at December 31, 2022. |
| The accompanying notes are an integral part of these financial statements. | Portfolio of Investments |
| Common Stocks | 98.6% of portfolio | ||
| Shares | Value | |
| Communication Services | 11.7% | ||
| Entertainment | ||
| Live Nation Entertainment, Inc. (a) | 18,434 | $1,285,587 |
| Netflix, Inc. (a) | 10,131 | 2,987,429 |
| Spotify Technology SA (a) | 15,973 | 1,261,069 |
| Interactive Media & Services | ||
| Alphabet, Inc., Class C (a) | 13,366 | 1,185,965 |
| Alphabet, Inc., Class A (a) | 178,940 | 15,787,876 |
| Meta Platforms, Inc., Class A (a) | 24,489 | 2,947,006 |
| IAC/InterActiveCorp (a) | 13,554 | 601,798 |
| Match Group, Inc. (a) | 16,364 | 678,943 |
| Media | ||
| Trade Desk, Inc. (The), Class A (a) | 16,586 | 743,550 |
| Total Communication Services | 27,479,223 | |
| Consumer Discretionary | 16.0% | ||
| Automobiles | ||
| Rivian Automotive, Inc. (a) | 176,674 | 3,256,102 |
| Hotels, Restaurants & Leisure | ||
| Booking Holdings, Inc. (a) | 1,486 | 2,994,706 |
| Chipotle Mexican Grill, Inc. (a) | 1,262 | 1,751,012 |
| Internet & Direct Marketing Retail | ||
| Amazon.com, Inc. (a) | 181,780 | 15,269,520 |
| Coupang, Inc. (a) | 77,837 | 1,144,982 |
| Leisure Products | ||
| Peloton Interactive, Inc. (a) | 115,683 | 918,523 |
| Multiline Retail | ||
| Dollar General Corp. | 14,914 | 3,672,573 |
| Specialty Retail | ||
| Ross Stores, Inc. | 48,609 | 5,642,047 |
| Textiles, Apparel & Luxury Goods | ||
| lululemon athletica Inc. (a) | 3,275 | 1,049,244 |
| NIKE, Inc., Class B | 14,857 | 1,738,418 |
| Total Consumer Discretionary | 37,437,127 | |
| Consumer Staples | 1.1% | ||
| Beverages | ||
| Monster Beverage Corp. (a) | 26,700 | 2,710,851 |
| Total Consumer Staples | 2,710,851 | |
| Health Care | 21.9% | ||
| Biotechnology | ||
| Vertex Pharmaceuticals, Inc. (a) | 8,025 | 2,317,459 |
| Health Care Equipment & Supplies | ||
| Becton, Dickinson & Co. | 14,217 | 3,615,383 |
| Insulet Corp. (a) | 6,085 | 1,791,363 |
| Intuitive Surgical, Inc. (a) | 20,866 | 5,536,793 |
| Stryker Corp. | 23,818 | 5,823,263 |
| Health Care Providers & Services | ||
| Cigna Corp. | 28,271 | 9,367,313 |
| Humana, Inc. | 6,217 | 3,184,286 |
| UnitedHealth Group, Inc. | 22,351 | 11,850,053 |
| Common Stocks | 98.6% of portfolio (Continued) | ||
| Shares | Value | |
| Health Care | 21.9% (Continued) | ||
| Life Sciences Tools & Services | ||
| Avantor, Inc. (a) | 75,830 | $1,599,255 |
| Illumina, Inc. (a) | 2,251 | 455,152 |
| Pharmaceuticals | ||
| Daiichi Sankyo Co., Ltd. ADR | 39,816 | 1,281,677 |
| Eli Lilly & Co. | 12,300 | 4,499,832 |
| Total Health Care | 51,321,829 | |
| Industrials | 1.7% | ||
| Machinery | ||
| Ingersoll Rand Inc. | 59,612 | 3,114,727 |
| Road & Rail | ||
| Old Dominion Freight Line, Inc. | 2,897 | 822,110 |
| Total Industrials | 3,936,837 | |
| Information Technology | 46.2% | ||
| Communications Equipment | ||
| Arista Networks, Inc. (a) | 24,500 | 2,973,075 |
| Electronic Equipment, Instruments & Components | ||
| Amphenol Corp., Class A | 49,443 | 3,764,590 |
| IT Services | ||
| Accenture PLC, Class A | 4,861 | 1,297,109 |
| Affirm Holdings, Inc. (a) | 26,879 | 259,920 |
| Fiserv, Inc. (a) | 77,161 | 7,798,662 |
| Global Payments, Inc. | 27,323 | 2,713,720 |
| Mastercard Inc., Class A | 19,217 | 6,682,328 |
| MongoDB, Inc. (a) | 5,861 | 1,153,679 |
| Visa Inc., Class A | 28,864 | 5,996,785 |
| Semiconductors & Semiconductor Equipment | ||
| Advanced Micro Devices, Inc. (a) | 22,160 | 1,435,303 |
| ASML Holding NV ADR | 9,406 | 5,139,439 |
| NVIDIA Corp. | 31,110 | 4,546,415 |
| Software | ||
| Atlassian Corp., Class A (a) | 13,323 | 1,714,404 |
| Cadence Design Systems, Inc. (a) | 16,200 | 2,602,368 |
| Fortinet, Inc. (a) | 20,063 | 980,880 |
| HashiCorp, Inc., Class A (a) | 8,886 | 242,943 |
| Intuit, Inc. | 21,711 | 8,450,355 |
| Microsoft Corp. | 112,140 | 26,893,415 |
| salesforce.com, Inc. (a) | 36,775 | 4,875,997 |
| ServiceNow, Inc. (a) | 9,433 | 3,662,551 |
| Technology Hardware, Storage & Peripherals | ||
| Apple, Inc. | 117,522 | 15,269,634 |
| Total Information Technology | 108,453,572 | |
| Total Common Stocks | ||
| (Cost $183,894,192) | 231,339,439 | |
| Portfolio of Investments | The accompanying notes are an integral part of these financial statements. |
| Money Market Fund | 1.4% of portfolio | ||
| Shares | Value | |
| State Street Institutional U.S. Government Money Market Fund Premier Class, 4.12% (b) | 3,293,574 | $3,293,574 |
| Total Money Market Fund | ||
| (Cost $3,293,574) | 3,293,574 | |
| Total Investments in Securities | ||
| (Cost $187,187,766) | 100.0% | $234,633,013 | |
| (a) | Non-income producing. |
| (b) | 7-day yield at December 31, 2022. |
| The accompanying notes are an integral part of these financial statements. | Portfolio of Investments |
| Common Stocks | 97.7% of portfolio | ||
| Shares | Value | |
| Australia | 4.1% | ||
| BHP Group Ltd. ADR | 47,204 | $2,929,008 |
| Woodside Energy Group Ltd. | 17,059 | 412,999 |
| Total Australia | 3,342,007 | |
| Brazil | 0.5% | ||
| Ambev SA ADR | 103,138 | 280,535 |
| XP Inc., Class A (a) | 10,753 | 164,951 |
| Total Brazil | 445,486 | |
| Britain | 7.6% | ||
| Rio Tinto PLC | 32,008 | 2,252,851 |
| Shell PLC | 79,456 | 2,239,930 |
| Standard Chartered PLC | 231,807 | 1,728,936 |
| Total Britain | 6,221,717 | |
| Canada | 4.4% | ||
| Alimentation Couche-Tard Inc. | 28,800 | 1,265,583 |
| Canadian National Railway Co. | 8,152 | 969,110 |
| Manulife Financial Corp. | 78,000 | 1,391,211 |
| Total Canada | 3,625,904 | |
| China | 2.9% | ||
| CSPC Pharmaceutical Group Ltd. | 174,000 | 181,147 |
| ENN Energy Holdings Ltd. | 26,217 | 366,200 |
| Haier Smart Home Co., Ltd. | 118,148 | 401,004 |
| Tencent Holdings Ltd. | 21,400 | 907,368 |
| Zhejiang Sanhua Intelligent Controls Co., Ltd. | 174,900 | 533,880 |
| Total China | 2,389,599 | |
| Denmark | 0.9% | ||
| Novozymes A/S, Class B | 14,743 | 747,967 |
| Total Denmark | 747,967 | |
| France | 11.7% | ||
| Air Liquide SA | 8,016 | 1,137,753 |
| Dassault Systèmes SE | 34,284 | 1,232,841 |
| Kering SA | 2,378 | 1,210,230 |
| L’Oréal SA | 9,197 | 3,293,423 |
| Schneider Electric SE | 19,067 | 2,677,666 |
| Total France | 9,551,913 | |
| Germany | 10.0% | ||
| Allianz SE REG | 12,135 | 2,591,522 |
| Infineon Technologies AG | 95,148 | 2,891,727 |
| SAP SE ADR | 13,327 | 1,375,213 |
| Symrise AG | 12,037 | 1,307,278 |
| Total Germany | 8,165,740 | |
| Common Stocks | 97.7% of portfolio (Continued) | ||
| Shares | Value | |
| Hong Kong | 3.9% | ||
| AIA Group Ltd. | 288,200 | $3,182,703 |
| Total Hong Kong | 3,182,703 | |
| India | 1.0% | ||
| HDFC Bank Ltd. ADR | 12,169 | 832,481 |
| Total India | 832,481 | |
| Indonesia | 0.4% | ||
| PT Telkom Indonesia (Persero) Tbk. ADR | 13,191 | 314,605 |
| Total Indonesia | 314,605 | |
| Japan | 17.7% | ||
| Chugai Pharmaceutical Co., Ltd. | 67,600 | 1,724,256 |
| Daifuku Co., Ltd. | 18,900 | 881,007 |
| FANUC Corp. | 4,400 | 658,445 |
| Keyence Corp. | 3,200 | 1,242,382 |
| Komatsu Ltd. | 57,900 | 1,251,457 |
| Kubota Corp. | 84,800 | 1,158,490 |
| Nitori Holdings Co., Ltd. | 9,500 | 1,241,293 |
| Shimano, Inc. | 6,400 | 1,011,321 |
| Shionogi & Co., Ltd. | 28,000 | 1,397,007 |
| Shiseido Co., Ltd. | 26,700 | 1,308,665 |
| Sysmex Corp. | 15,800 | 953,855 |
| Unicharm Corp. | 43,200 | 1,653,965 |
| Total Japan | 14,482,143 | |
| Mexico | 0.6% | ||
| Fomento Economico Mexicano, SAB de CV ADR | 6,050 | 472,626 |
| Total Mexico | 472,626 | |
| Netherlands | 2.2% | ||
| Adyen NV (a) | 1,291 | 1,792,229 |
| Total Netherlands | 1,792,229 | |
| Republic of South Korea | 1.2% | ||
| Samsung Electronics Co., Ltd. GDR | 866 | 959,275 |
| Total Republic of South Korea | 959,275 | |
| Russia | 0.0% | ||
| LUKOIL PJSC | 6,253 | 0 |
| Yandex NV, Class A (a) | 4,239 | 0 |
| Total Russia | 0 | |
| Singapore | 3.8% | ||
| DBS Group Holdings Ltd. | 121,915 | 3,085,864 |
| Total Singapore | 3,085,864 | |
| Portfolio of Investments | The accompanying notes are an integral part of these financial statements. |
| Common Stocks | 97.7% of portfolio (Continued) | ||
| Shares | Value | |
| Spain | 2.2% | ||
| Banco Bilboa Vizcaya Argentaria SA | 299,490 | $1,803,908 |
| Total Spain | 1,803,908 | |
| Sweden | 9.4% | ||
| Alfa Laval AB | 49,106 | 1,420,506 |
| Atlas Copco AB, Class A | 238,753 | 2,828,840 |
| Epiroc AB, Class A | 74,699 | 1,360,202 |
| Skandinaviska Enskilda Banken AB, Class A | 182,243 | 2,098,140 |
| Total Sweden | 7,707,688 | |
| Switzerland | 10.7% | ||
| Alcon Inc. | 22,943 | 1,572,743 |
| Lonza Group AG REG | 3,813 | 1,871,708 |
| Nestlé SA ADR | 12,490 | 1,442,712 |
| Roche Holding AG REG | 9,120 | 2,865,844 |
| Sonova Holding AG REG | 4,214 | 1,000,819 |
| Total Switzerland | 8,753,826 | |
| Taiwan | 0.7% | ||
| Taiwan Semiconductor Manufacturing Co. Ltd. ADR | 7,996 | 595,622 |
| Total Taiwan | 595,622 | |
| Common Stocks | 97.7% of portfolio (Continued) | ||
| Shares | Value | |
| United States of America | 1.8% | ||
| Linde PLC | 4,455 | $1,452,157 |
| Total United States of America | 1,452,157 | |
| Total Common Stocks | ||
| (Cost $67,654,172) | 79,925,460 | |
| Money Market Fund | 2.3% of portfolio | ||
| State Street Institutional U.S. Government Money Market Fund Premier Class, 4.12% (b) | 1,915,024 | 1,915,024 |
| Total Money Market Fund | ||
| (Cost $1,915,024) | 1,915,024 | |
| Total Investments in Securities | ||
| (Cost $69,569,196) | 100.0% | $81,840,484 | |
| (a) | Non-income producing. |
| (b) | 7-day yield at December 31, 2022. |
| The accompanying notes are an integral part of these financial statements. | Portfolio of Investments |
| Common Stocks | 98.0% of portfolio | ||
| Shares | Value | |
| Communication Services | 2.1% | ||
| Interactive Media & Services | ||
| Ziff Davis, Inc. (a) | 62,726 | $4,961,627 |
| Total Communication Services | 4,961,627 | |
| Consumer Discretionary | 8.8% | ||
| Hotels, Restaurants & Leisure | ||
| Hilton Grand Vacations Inc. (a) | 110,400 | 4,254,816 |
| Household Durables | ||
| MDC Holdings, Inc. | 134,288 | 4,243,501 |
| Leisure Products | ||
| Malibu Boats, Inc., Class A (a) | 88,100 | 4,695,730 |
| Topgolf Callaway Brands Corp. (a) | 204,351 | 4,035,932 |
| Specialty Retail | ||
| ARKO Corp. | 455,000 | 3,940,300 |
| Total Consumer Discretionary | 21,170,279 | |
| Energy | 3.5% | ||
| Oil, Gas & Consumable Fuels | ||
| Northern Oil and Gas, Inc. | 145,600 | 4,487,392 |
| SM Energy Co. | 113,100 | 3,939,273 |
| Total Energy | 8,426,665 | |
| Financials | 17.8% | ||
| Banks | ||
| Atlantic Union Bankshares Corp. | 141,992 | 4,989,599 |
| Cadence Bank | 145,250 | 3,581,865 |
| Eastern Bankshares, Inc. | 335,300 | 5,783,925 |
| FB Financial Corp. | 152,959 | 5,527,938 |
| Glacier Bancorp, Inc. | 138,216 | 6,830,635 |
| Live Oak Bancshares, Inc. | 59,900 | 1,808,980 |
| Umpqua Holdings Corp. | 163,000 | 2,909,550 |
| Consumer Finance | ||
| Encore Capital Group, Inc. (a) | 130,383 | 6,250,561 |
| Insurance | ||
| Kinsale Capital Group, Inc. | 19,426 | 5,080,287 |
| Total Financials | 42,763,340 | |
| Health Care | 14.1% | ||
| Biotechnology | ||
| Twist Bioscience Corp. (a) | 61,977 | 1,475,672 |
| Health Care Equipment & Supplies | ||
| Enovis Corp. (a) | 61,576 | 3,295,548 |
| Envista Holdings Corp. (a) | 139,400 | 4,693,598 |
| Integer Holdings Corp. (a) | 76,970 | 5,269,366 |
| NuVasive, Inc. (a) | 103,200 | 4,255,968 |
| STAAR Surgical Co. (a) | 35,236 | 1,710,355 |
| Health Care Providers & Services | ||
| AMN Healthcare Services, Inc. (a) | 53,087 | 5,458,405 |
| Life Sciences Tools & Services | ||
| Medpace Holdings, Inc. (a) | 37,150 | 7,891,032 |
| Total Health Care | 34,049,944 | |
| Common Stocks | 98.0% of portfolio (Continued) | ||
| Shares | Value | |
| Industrials | 24.3% | ||
| Aerospace & Defense | ||
| Triumph Group, Inc. (a) | 361,100 | $3,798,772 |
| Building Products | ||
| Hayward Holdings, Inc. (a) | 317,200 | 2,981,680 |
| Construction & Engineering | ||
| Comfort Systems USA, Inc. | 61,888 | 7,122,071 |
| Dycom Industries, Inc. (a) | 17,400 | 1,628,640 |
| Electrical Equipment | ||
| Atkore Inc. (a) | 84,200 | 9,549,964 |
| EnerSys | 36,035 | 2,660,824 |
| Machinery | ||
| ESAB Corp. | 57,176 | 2,682,698 |
| Federal Signal Corp. | 186,594 | 8,671,023 |
| John Bean Technologies Corp. | 16,400 | 1,497,812 |
| Professional Services | ||
| CACI International Inc., Class A (a) | 8,371 | 2,516,239 |
| Road & Rail | ||
| Werner Enterprises, Inc. | 141,733 | 5,706,171 |
| Trading Companies & Distributors | ||
| Applied Industrial Technologies, Inc. | 77,326 | 9,745,396 |
| Total Industrials | 58,561,290 | |
| Information Technology | 16.9% | ||
| Electronic Equipment, Instruments & Components | ||
| Advanced Energy Industries, Inc. | 63,162 | 5,418,037 |
| Itron, Inc. (a) | 51,377 | 2,602,245 |
| IT Services | ||
| CSG Systems International, Inc. | 61,670 | 3,527,524 |
| TaskUs, Inc., Class A (a) | 205,100 | 3,466,190 |
| Semiconductors & Semiconductor Equipment | ||
| Diodes Inc. (a) | 67,486 | 5,138,384 |
| Software | ||
| Altair Engineering Inc., Class A (a) | 101,177 | 4,600,518 |
| Descartes Systems Group Inc. (The) (a) | 101,770 | 7,088,281 |
| Model N, Inc. (a) | 134,900 | 5,471,544 |
| Verint Systems Inc. (a) | 93,726 | 3,400,379 |
| Total Information Technology | 40,713,102 | |
| Materials | 7.1% | ||
| Chemicals | ||
| Avient Corp. | 170,627 | 5,760,368 |
| Ingevity Corp. (a) | 43,641 | 3,074,072 |
| Construction Materials | ||
| Summit Materials, Inc., Class A (a) | 289,609 | 8,222,001 |
| Total Materials | 17,056,441 | |
| Portfolio of Investments | The accompanying notes are an integral part of these financial statements. |
| Common Stocks | 98.0% of portfolio (Continued) | ||
| Shares | Value | |
| Real Estate | 3.4% | ||
| Equity Real Estate Investment Trusts (REITs) | ||
| Community Healthcare Trust Inc. | 78,900 | $2,824,620 |
| Easterly Government Properties, Inc. | 229,311 | 3,272,268 |
| Uniti Group Inc. | 390,700 | 2,160,571 |
| Total Real Estate | 8,257,459 | |
| Total Common Stocks | ||
| (Cost $200,764,396) | 235,960,147 | |
| Stock Warrants | less than 0.1% of portfolio | ||
| Industrials | 0.0% | ||
| Aerospace & Defense | ||
| Triumph Group, Inc. | 108,330 | 72,581 |
| Total Stock Warrants | ||
| (Cost $0) | 72,581 | |
| Money Market Fund | 2.0% of portfolio | ||
| Shares | Value | |
| State Street Institutional U.S. Government Money Market Fund Premier Class, 4.12% (b) | 4,825,344 | $4,825,344 |
| Total Money Market Fund | ||
| (Cost $4,825,344) | 4,825,344 | |
| Total Investments in Securities | ||
| (Cost $205,589,740) | 100.0% | $240,858,072 | |
| (a) | Non-income producing. |
| (b) | 7-day yield at December 31, 2022. |
| The accompanying notes are an integral part of these financial statements. | Portfolio of Investments |
| Assets | Daily Income Fund | Short-Term Government Securities Fund | Short-Term Bond Fund |
| Investments in securities, at value (cost: $206,000,711, $71,921,611, $499,105,065, $142,720,664, $7,936,184, $40,012,896, $554,639,698, $187,187,766, $69,569,196 and $205,589,740, respectively) | $206,000,711 | $68,358,115 | $478,081,230 |
| Investment securities sold receivable | — | — | — |
| Dividends, interest, and tax reclaims receivable | 329,945 | 291,486 | 3,268,263 |
| Capital shares sold receivable | 2,517,367 | 12,041 | 316,076 |
| Prepaid expenses | 17,681 | 9,909 | 25,082 |
| Due from Homestead Advisers | — | — | — |
| Total Assets | 208,865,704 | 68,671,551 | 481,690,651 |
| Liabilities | |||
| Investment securities purchased payable | 3,939,839 | 895,311 | — |
| Accrued expenses payable | 39,699 | 11,815 | 159,970 |
| Independent Director/Trustee's deferred compensation payable | 81,698 | 34,047 | 194,818 |
| Capital shares redeemed payable | 173,178 | 21,259 | 194,569 |
| Dividends payable | 3,568 | — | 27,373 |
| Due to Homestead Advisers | 67,370 | 38,368 | 305,314 |
| Total Liabilities | 4,305,352 | 1,000,800 | 882,044 |
| Net Assets | $204,560,352 | $67,670,751 | $480,808,607 |
| Net Assets Consist Of: | |||
| Distributable earnings (losses) | (79,009) | (5,056,755) | (42,325,395) |
| Paid-in-capital applicable to outstanding shares of 204,639,712, 13,894,608, 99,871,754, 29,176,880, 809,426, 6,881,477, 19,987,500, 22,573,350, 9,262,231 and 10,592,228, respectively | 204,639,361 | 72,727,506 | 523,134,002 |
| Net Assets | $204,560,352 | $67,670,751 | $480,808,607 |
| Net Asset Value Per Share | $1.00 | $4.87 | $4.81 |
| Statements of Assets and Liabilities | The accompanying notes are an integral part of these financial statements. |
| Intermediate Bond Fund | Rural America Growth & Income Fund | Stock Index Fund | Value Fund | Growth Fund | International Equity Fund | Small-Company Stock Fund |
| $130,992,957 | $7,368,218 | $191,800,417 | $925,319,218 | $234,633,013 | $81,840,484 | $240,858,072 |
| — | — | — | — | 142,235 | — | — |
| 941,576 | 24,533 | — | 989,476 | 53,392 | 352,678 | 159,099 |
| 80,059 | 10,635 | 47,278 | 91,236 | 177,884 | 26,418 | 33,761 |
| 9,987 | 2,504 | 16,505 | 45,675 | 20,931 | 14,744 | 19,230 |
| — | 12,084 | — | — | — | — | — |
| 132,024,579 | 7,417,974 | 191,864,200 | 926,445,605 | 235,027,455 | 82,234,324 | 241,070,162 |
| 1,088,938 | 196,081 | 11,773 | — | — | — | — |
| 42,120 | 14,465 | 67,205 | 170,974 | 58,689 | 9,000 | 101,780 |
| 7,329 | 54 | 45,381 | 324,972 | 50,337 | 57,155 | 195,304 |
| 53,434 | 8,816 | 35,505 | 330,933 | 27,604 | 10,188 | 217,104 |
| — | — | — | — | — | — | — |
| 74,832 | — | 64,236 | 485,887 | 212,503 | 66,830 | 210,637 |
| 1,266,653 | 219,416 | 224,100 | 1,312,766 | 349,133 | 143,173 | 724,825 |
| $130,757,926 | $7,198,558 | $191,640,100 | $925,132,839 | $234,678,322 | $82,091,151 | $240,345,337 |
| (23,924,750) | (700,481) | 149,613,335 | 373,966,633 | 44,851,638 | 12,856,576 | 37,132,035 |
| 154,682,676 | 7,899,039 | 42,026,765 | 551,166,206 | 189,826,684 | 69,234,575 | 203,213,302 |
| $130,757,926 | $7,198,558 | $191,640,100 | $925,132,839 | $234,678,322 | $82,091,151 | $240,345,337 |
| $4.48 | $8.89 | $27.85 | $46.29 | $10.40 | $8.86 | $22.69 |
| The accompanying notes are an integral part of these financial statements. | Statements of Assets and Liabilities |
| Investment Income | Daily Income Fund | Short-Term Government Securities Fund | Short-Term Bond Fund |
| Interest | $3,355,943 | $1,380,571 | $12,351,723 |
| Dividends | — | — | — |
| Allocated from Master Portfolio | |||
| Dividends | — | — | — |
| Interest | — | — | — |
| Total Investment Income | 3,355,943 | 1,380,571 | 12,351,723 |
| Expenses | |||
| Management fees | 782,525 | 324,367 | 3,066,934 |
| Shareholder servicing fees | 92,996 | 68,953 | 135,052 |
| Custodian and accounting fees | 92,989 | 70,875 | 162,749 |
| Director, Trustee, and Board meeting expenses | 68,882 | 27,096 | 195,457 |
| Legal and audit fees | 59,319 | 24,065 | 148,207 |
| Registration fees | 31,038 | 25,205 | 39,213 |
| Printing and regulatory filings | 17,628 | 9,838 | 30,094 |
| Insurance | 8,756 | 3,816 | 27,408 |
| Sub-transfer agency fees | — | 17 | 8,433 |
| Other expenses | 2,179 | 21,015 | 70,111 |
| Administration fees | — | — | — |
| Allocated from Master Portfolio | — | — | — |
| Total Expenses | 1,156,312 | 575,247 | 3,883,658 |
| Less fees waived and/or expenses reimbursed by Homestead Advisers | (224,316) | (34,324) | — |
| Net Expenses | 931,996 | 540,923 | 3,883,658 |
| Net Investment Income (Loss) | 2,423,947 | 839,648 | 8,468,065 |
| Realized and Unrealized Gain (Loss) on Investments | |||
| Net realized gain (loss) on investments | (33,501) | (1,032,782) | (19,926,895) |
| Net change in unrealized apprecation (depreciation) | — | (3,870,513) | (20,007,017) |
| Net Gain (Loss) On Investments | (33,501) | (4,903,295) | (39,933,912) |
| Net Increase (Decrease) In Net Assets From Operations | $2,390,446 | $(4,063,647) | $(31,465,847) |
| (a) | Includes foreign tax withholding expense of $16,220 in Stock Index, $36,434 in Value, $8,721 in Growth, and $166,020 in International Equity Funds. |
| (b) | Represents expenses allocated to the Fund by the S&P 500 Master Portfolio after expense reimbursements of $1,879. |
| (c) | Represents realized and unrealized losses on investments allocated from the Master Portfolio. |
| Statements of Operations | The accompanying notes are an integral part of these financial statements. |
| Intermediate Bond Fund | Rural America Growth & Income Fund | Stock Index Fund | Value Fund | Growth Fund | International Equity Fund | Small-Company Stock Fund |
| $3,727,158 | $58,592 | $— | $232,315 | $65,041 | $38,961 | $76,549 |
| — | 53,726 | — | 18,847,815(a) | 1,277,395(a) | 2,463,680(a) | 2,692,762 |
| — | — | 3,253,032(a) | — | — | — | — |
| — | — | 13,004 | — | — | — | — |
| 3,727,158 | 112,318 | 3,266,036 | 19,080,130 | 1,342,436 | 2,502,641 | 2,769,311 |
| 817,604 | 42,905 | — | 4,443,671 | 1,803,512 | 632,198 | 2,156,217 |
| 62,599 | 36,037 | 149,395 | 282,725 | 151,063 | 117,336 | 190,128 |
| 121,657 | 59,474 | 68,755 | 191,490 | 94,892 | 107,723 | 88,668 |
| 51,413 | 2,639 | 84,422 | 358,935 | 110,098 | 32,868 | 105,029 |
| 42,249 | 5,514 | 66,749 | 276,158 | 81,582 | 27,489 | 83,623 |
| 49,720 | 38,593 | 28,338 | 38,345 | 29,562 | 28,910 | 31,167 |
| 8,400 | 2,812 | 32,080 | 64,518 | 33,666 | 23,178 | 44,652 |
| 7,336 | 261 | 12,452 | 50,621 | 17,687 | 4,904 | 15,446 |
| 3 | — | 539 | 20,211 | 2,116 | 116 | 10,500 |
| 30,367 | 144 | 6,710 | 29,247 | 11,600 | 2,765 | 9,360 |
| — | — | 510,174 | — | — | — | — |
| — | — | 19,810(b) | — | — | — | — |
| 1,191,348 | 188,379 | 979,424 | 5,755,921 | 2,335,778 | 977,487 | 2,734,790 |
| (100,416) | (122,493) | — | — | — | (134,027) | — |
| 1,090,932 | 65,886 | 979,424 | 5,755,921 | 2,335,778 | 843,460 | 2,734,790 |
| 2,636,226 | 46,432 | 2,286,612 | 13,324,209 | (993,342) | 1,659,181 | 34,521 |
| (11,358,826) | (138,527) | (154,799)(c) | 63,175,711 | 7,059,306 | 2,298,816 | 10,610,119 |
| (11,565,088) | (740,459) | (46,167,668)(c) | (136,261,835) | (130,619,695) | (23,735,880) | (62,638,176) |
| (22,923,914) | (878,986) | (46,322,467) | (73,086,124) | (123,560,389) | (21,437,064) | (52,028,057) |
| $(20,287,688) | $(832,554) | $(44,035,855) | $(59,761,915) | $(124,553,731) | $(19,777,883) | $(51,993,536) |
| The accompanying notes are an integral part of these financial statements. | Statements of Operations |
| Daily Income Fund | ||
| Year Ended December 31, 2022 | Year Ended December 31, 2021 | |
| Increase (Decrease) In Net Assets | ||
| Operations | ||
| Net investment income | $2,423,947 | $17,623 |
| Net realized gain (loss) on investments | (33,501) | (1,481) |
| Net change in unrealized appreciation (depreciation) | — | — |
| Increase (decrease) in net assets from operations | 2,390,446 | 16,142 |
| Distributions to Shareholders | ||
| Distributions to shareholders | (2,393,963) | (17,623) |
| Total Distributions to shareholders | (2,393,963) | (17,623) |
| Capital Share Transactions | ||
| Net capital share transactions | 24,974,628 | 7,807,653 |
| Total increase (decrease) in net assets from capital transactions | 24,974,628 | 7,807,653 |
| Total Increase (Decrease) In Net Assets | 24,971,111 | 7,806,172 |
| Net Assets | ||
| Beginning of year | $179,589,241 | $171,783,069 |
| End of year | $204,560,352 | $179,589,241 |
| Statements of Changes in Net Assets | The accompanying notes are an integral part of these financial statements. |
| Short-Term Government Securities Fund | Short-Term Bond Fund | Intermediate Bond Fund | |||
| Year Ended December 31, 2022 | Year Ended December 31, 2021 | Year Ended December 31, 2022 | Year Ended December 31, 2021 | Year Ended December 31, 2022 | Year Ended December 31, 2021 |
| $839,648 | $270,512 | $8,468,065 | $2,285,214 | $2,636,226 | $1,358,053 |
| (1,032,782) | (318,484) | (19,926,895) | 2,056,538 | (11,358,826) | 32,497 |
| (3,870,513) | (1,013,880) | (20,007,017) | (9,914,676) | (11,565,088) | (2,351,660) |
| (4,063,647) | (1,061,852) | (31,465,847) | (5,572,924) | (20,287,688) | (961,110) |
| (842,483) | (282,892) | (8,609,201) | (7,728,293) | (2,782,153) | (1,695,715) |
| (842,483) | (282,892) | (8,609,201) | (7,728,293) | (2,782,153) | (1,695,715) |
| (4,935,132) | (10,293,193) | (44,422,657) | 13,546,507 | 2,491,679 | 61,332,676 |
| (4,935,132) | (10,293,193) | (44,422,657) | 13,546,507 | 2,491,679 | 61,332,676 |
| (9,841,262) | (11,637,937) | (84,497,705) | 245,290 | (20,578,162) | 58,675,851 |
| $77,512,013 | $89,149,950 | $565,306,312 | $565,061,022 | $151,336,088 | $92,660,237 |
| $67,670,751 | $77,512,013 | $480,808,607 | $565,306,312 | $130,757,926 | $151,336,088 |
| The accompanying notes are an integral part of these financial statements. | Statements of Changes in Net Assets |
| Rural America Growth & Income Fund | ||
| Year Ended December 31, 2022 | Period ended May 1, 2021 (inception) to December 31, 2021 | |
| Increase (Decrease) In Net Assets | ||
| Operations | ||
| Net investment income | $46,432 | $10,539 |
| Net realized gain (loss) on investments | (138,527) | 9,896 |
| Net change in unrealized appreciation (depreciation) | (740,459) | 172,493 |
| Increase (decrease) in net assets from operations | (832,554) | 192,928 |
| Distributions to Shareholders | ||
| Distributions to shareholders | (42,312) | (18,556) |
| Total Distributions to shareholders | (42,312) | (18,556) |
| Capital Share Transactions | ||
| Net capital share transactions | 2,711,190 | 5,187,862 |
| Total increase (decrease) in net assets from capital transactions | 2,711,190 | 5,187,862 |
| Total Increase (Decrease) In Net Assets | 1,836,324 | 5,362,234 |
| Net Assets | ||
| Beginning of year | $5,362,234 | $— |
| End of year | $7,198,558 | $5,362,234 |
| Statements of Changes in Net Assets | The accompanying notes are an integral part of these financial statements. |
| Stock Index Fund | Value Fund | Growth Fund | |||
| Year Ended December 31, 2022 | Year Ended December 31, 2021 | Year Ended December 31, 2022 | Year Ended December 31, 2021 | Year Ended December 31, 2022 | Year Ended December 31, 2021 |
| $2,286,612 | $1,965,230 | $13,324,209 | $11,588,275 | $(993,342) | $(1,794,125) |
| (154,799) | 2,230,795 | 63,175,711 | 96,849,735 | 7,059,306 | 34,831,159 |
| (46,167,668) | 48,866,809 | (136,261,835) | 115,477,901 | (130,619,695) | 21,685,920 |
| (44,035,855) | 53,062,834 | (59,761,915) | 223,915,911 | (124,553,731) | 54,722,954 |
| (3,574,110) | (5,077,762) | (91,061,366) | (85,105,090) | (15,514,807) | (32,076,755) |
| (3,574,110) | (5,077,762) | (91,061,366) | (85,105,090) | (15,514,807) | (32,076,755) |
| (2,505,647) | 4,947,932 | 27,692,364 | (19,290,874) | (4,517,269) | 36,958,294 |
| (2,505,647) | 4,947,932 | 27,692,364 | (19,290,874) | (4,517,269) | 36,958,294 |
| (50,115,612) | 52,933,004 | (123,130,917) | 119,519,947 | (144,585,807) | 59,604,493 |
| $241,755,712 | $188,822,708 | $1,048,263,756 | $928,743,809 | $379,264,129 | $319,659,636 |
| $191,640,100 | $241,755,712 | $925,132,839 | $1,048,263,756 | $234,678,322 | $379,264,129 |
| The accompanying notes are an integral part of these financial statements. | Statements of Changes in Net Assets |
| International Equity Fund | ||
| Year Ended December 31, 2022 | Year Ended December 31, 2021 | |
| Increase (Decrease) In Net Assets | ||
| Operations | ||
| Net investment income | $1,659,181 | $1,068,618 |
| Net realized gain (loss) on investments | 2,298,816 | 5,271,736 |
| Net change in unrealized appreciation (depreciation) | (23,735,880) | 4,104,984 |
| Increase (decrease) in net assets from operations | (19,777,883) | 10,445,338 |
| Distributions to Shareholders | ||
| Distributions to shareholders | (4,045,559) | (4,420,388) |
| Total Distributions to shareholders | (4,045,559) | (4,420,388) |
| Capital Share Transactions | ||
| Net capital share transactions | 2,629,704 | 5,718,477 |
| Total increase (decrease) in net assets from capital transactions | 2,629,704 | 5,718,477 |
| Total Increase (Decrease) In Net Assets | (21,193,738) | 11,743,427 |
| Net Assets | ||
| Beginning of year | $103,284,889 | $91,541,462 |
| End of year | $82,091,151 | $103,284,889 |
| Statements of Changes in Net Assets | The accompanying notes are an integral part of these financial statements. |
| Small-Company Stock Fund | |
| Year Ended December 31, 2022 | Year Ended December 31, 2021 |
| $34,521 | $1,136,724 |
| 10,610,119 | 48,395,731 |
| (62,638,176) | 7,941,420 |
| (51,993,536) | 57,473,875 |
| (12,017,540) | (50,233,661) |
| (12,017,540) | (50,233,661) |
| (9,662,489) | 20,240,800 |
| (9,662,489) | 20,240,800 |
| (73,673,565) | 27,481,014 |
| $314,018,902 | $286,537,888 |
| $240,345,337 | $314,018,902 |
| The accompanying notes are an integral part of these financial statements. | Statements of Changes in Net Assets |
| Year Ended December 31, | |||||
| For a Share Outstanding Throughout Each Year | 2022 | 2021 | 2020 | 2019 | 2018 |
| Net Asset Value, Beginning of Year | $1.00 | $1.00 | $1.00 | $1.00 | $1.00 |
| Income from investment operations | |||||
| Net investment income | 0.01(a,b) | —(a,b,c) | (—)(a,b,c) | 0.01 | 0.01 |
| Net realized and unrealized gain (loss) on investments | —(c) | —(c) | — | — | — |
| Total from investment operations | 0.01(a) | —(a,c) | —(a,c) | 0.01 | 0.01 |
| Distributions | |||||
| Net investment income | (0.01) | —(c) | —(c) | (0.01) | (0.01) |
| Net realized gain | — | — | — | — | — |
| Total distributions | (0.01) | —(a,c) | —(a,c) | (0.01) | (0.01) |
| Net Asset Value, End of Year | $1.00 | $1.00 | $1.00 | $1.00 | $1.00 |
| Total Return | 1.20% | 0.01% | 0.19% | 1.43% | 1.08% |
| Ratios/Supplemental Data | |||||
| Net assets, end of year (thousands) | $204,560 | $179,589 | $171,783 | $162,835 | $163,854 |
| Ratio of net investment income to average net assets | 1.24%(a,b) | 0.01%(a,b) | 0.17%(a,b) | 1.42% | 1.07% |
| Ratio of gross expenses before voluntary expense limitation to average net assets | 0.59% | 0.70% | 0.78% | 0.78% | 0.74% |
| Ratio of expenses to average net assets | 0.48%(a,b) | 0.04%(a,b) | 0.37%(a,b) | 0.78% | 0.74% |
| (a) | Effective August 14, 2009, Homestead Advisers agreed to waive fees and/or reimburse expenses to the extent necessary to assist the Fund in attempting to maintain a positive yield. The temporary waiver continued through May 11, 2017 and April 20, 2020 through May 6, 2022. |
| (b) | Excludes excess investment management fees and other expenses voluntarily waived and reimbursed by Homestead Advisers. |
| (c) | Less than $0.01 per share. |
| Financial Highlights | The accompanying notes are an integral part of these financial statements. |
| Year Ended December 31, | |||||
| For a Share Outstanding Throughout Each Year | 2022 | 2021 | 2020 | 2019 | 2018 |
| Net Asset Value, Beginning of Year | $5.21 | $5.29 | $5.21 | $5.14 | $5.15 |
| Income from investment operations | |||||
| Net investment income | 0.06 | 0.02 | 0.03 | 0.08 | 0.07 |
| Net realized and unrealized gain (loss) on investments | (0.34) | (0.08) | 0.18 | 0.09 | (0.01) |
| Total from investment operations | (0.28) | (0.06) | 0.21 | 0.17 | 0.06 |
| Distributions | |||||
| Net investment income | (0.06) | (0.02) | (0.03) | (0.08) | (0.07) |
| Net realized gain | — | — | (0.10) | (0.02) | —(a) |
| Total distributions | (0.06) | (0.02) | (0.13) | (0.10) | (0.07) |
| Net Asset Value, End of Year | $4.87 | $5.21 | $5.29 | $5.21 | $5.14 |
| Total Return | -5.41% | -1.18% | 4.13% | 3.36% | 1.20% |
| Ratios/Supplemental Data | |||||
| Net assets, end of year (thousands) | $67,671 | $77,512 | $89,150 | $71,516 | $76,918 |
| Ratio of net investment income to average net assets | 1.16%(b) | 0.32%(b) | 0.58%(b) | 1.52%(b) | 1.37%(b) |
| Ratio of gross expenses before expense limitation to average net assets | 0.80% | 0.79% | 0.81% | 0.85% | 0.82% |
| Ratio of expenses to average net assets | 0.75%(b) | 0.75%(b) | 0.75%(b) | 0.75%(b) | 0.75%(b) |
| Portfolio turnover rate | 202%(c) | 155%(c) | 299%(c) | 237%(c,d) | 40% |
| (a) | Less than $0.01 per share. |
| (b) | Excludes expenses in excess of a 0.75% contractual expense limitation with Homestead Advisers, in effect through April 30, 2023. |
| (c) | Rate includes purchases and sales of long-term U.S. Treasury Bonds. |
| (d) | The change in portfolio turnover from 2018 to 2019 is due to a repositioning of the Fund as a result of market activities. |
| The accompanying notes are an integral part of these financial statements. | Financial Highlights |
| Year Ended December 31, | |||||
| For a Share Outstanding Throughout Each Year | 2022 | 2021 | 2020 | 2019 | 2018 |
| Net Asset Value, Beginning of Year | $5.19 | $5.32 | $5.23 | $5.17 | $5.19 |
| Income from investment operations | |||||
| Net investment income | 0.08 | 0.02 | 0.05 | 0.10 | 0.10 |
| Net realized and unrealized gain (loss) on investments | (0.38) | (0.08) | 0.23 | 0.10 | (0.02) |
| Total from investment operations | (0.30) | (0.06) | 0.28 | 0.20 | 0.08 |
| Distributions | |||||
| Net investment income | (0.08) | (0.02) | (0.05) | (0.10) | (0.10) |
| Net realized gain | — | (0.05) | (0.14) | (0.04) | —(a) |
| Total distributions | (0.08) | (0.07) | (0.19) | (0.14) | (0.10) |
| Net Asset Value, End of Year | $4.81 | $5.19 | $5.32 | $5.23 | $5.17 |
| Total Return | -5.72% | -1.11% | 5.42% | 3.90% | 1.69% |
| Ratios/Supplemental Data | |||||
| Net assets, end of year (thousands) | $480,809 | $565,306 | $565,061 | $548,312 | $562,033 |
| Ratio of net investment income to average net assets | 1.66% | 0.40% | 0.92% | 1.87% | 2.02% |
| Ratio of expenses to average net assets | 0.76% | 0.79% | 0.78% | 0.79% | 0.77% |
| Portfolio turnover rate | 328%(b) | 355%(b) | 328%(b) | 276%(b,c) | 39% |
| (a) | Less than $0.01 per share. |
| (b) | Rate includes purchases and sales of long-term U.S. Treasury Bonds. |
| (c) | The change in portfolio turnover from 2018 to 2019 is due to a repositioning of the Fund as a result of market activities. |
| Financial Highlights | The accompanying notes are an integral part of these financial statements. |
| Year Ended December 31, | Period ended May 1, 2019 (inception) to December 31 , | |||
| For a Share Outstanding Throughout Each Period | 2022 | 2021 | 2020 | 2019 |
| Net Asset Value, Beginning of Period | $5.28 | $5.41 | $5.13 | $5.00 |
| Income from investment operations | ||||
| Net investment income | 0.10 | 0.07 | 0.08 | 0.06 |
| Net realized and unrealized gain (loss) on investments | (0.80) | (0.13) | 0.36 | 0.17 |
| Total from investment operations | (0.70) | (0.06) | 0.44 | 0.23 |
| Distributions | ||||
| Net investment income | (0.10) | (0.07) | (0.08) | (0.06) |
| Net realized gain | — | — | (0.08) | (0.04) |
| Total distributions | (0.10) | (0.07) | (0.16) | (0.10) |
| Net Asset Value, End of Period | $4.48 | $5.28 | $5.41 | $5.13 |
| Total Return | -13.38% | -1.12% | 8.70% | 4.69%(a) |
| Ratios/Supplemental Data | ||||
| Net assets, end of year (thousands) | $130,758 | $151,336 | $92,660 | $23,845 |
| Ratio of net investment income to average net assets | 1.93%(b) | 1.03%(b) | 1.19%(b) | 1.69%(b,c) |
| Ratio of gross expenses before expense limitation to average net assets | 0.87% | 0.91% | 1.13% | 2.49%(c) |
| Ratio of expenses to average net assets | 0.80%(b) | 0.80%(b) | 0.80%(b) | 0.80%(b,c) |
| Portfolio turnover rate | 258%(d) | 249%(d) | 359%(d) | 395%(d) |
| (a) | Aggregate total return for the period. |
| (b) | Excludes expenses in excess of a 0.80% contractual expense limitation with Homestead Advisers, in effect through April 30, 2023. |
| (c) | Annualized. |
| (d) | Rate includes purchases and sales of long-term U.S. Treasury Bonds. |
| The accompanying notes are an integral part of these financial statements. | Financial Highlights |
| Year Ended December 31, | Period ended May 1, 2021 (inception) to December 31 , | |
| For a Share Outstanding Throughout Each Period | 2022 | 2021 |
| Net Asset Value, Beginning of Period | $10.42 | $10.00 |
| Income from investment operations | ||
| Net investment income | 0.05 | 0.02 |
| Net realized and unrealized gain (loss) on investments | (1.53) | 0.44 |
| Total from investment operations | (1.48) | 0.46 |
| Distributions | ||
| Net investment income | (0.05) | (0.02) |
| Net realized gain | — | (0.02) |
| Total distributions | (0.05) | (0.04) |
| Net Asset Value, End of Period | $8.89 | $10.42 |
| Total Return | -14.18% | 4.58%(a) |
| Ratios/Supplemental Data | ||
| Net assets, end of year (thousands) | $7,199 | $5,362 |
| Ratio of net investment income to average net assets | 0.70%(b) | 0.44%(b,c) |
| Ratio of gross expenses before expense limitation to average net assets | 2.85% | 5.12%(c) |
| Ratio of expenses to average net assets | 1.00%(b) | 1.00%(b,c) |
| Portfolio turnover rate | 44%(d) | 9% |
| (a) | Aggregate total return for the period. |
| (b) | Excludes expenses in excess of a 1.00% contractual expense limitation with Homestead Advisers, in effect through April 30, 2023. |
| (c) | Annualized. |
| (d) | The change in the portfolio turnover rate from 2021 to 2022, is due to an increase in shareholder redemptions, resulting in more security sales. |
| Financial Highlights | The accompanying notes are an integral part of these financial statements. |
| Year Ended December 31, | |||||
| For a Share Outstanding Throughout Each Year | 2022 | 2021 | 2020 | 2019 | 2018 |
| Net Asset Value, Beginning of Year | $34.82 | $27.78 | $23.93 | $18.67 | $20.02 |
| Income from investment operations | |||||
| Net investment income | 0.34 | 0.29 | 0.32 | 0.34 | 0.32 |
| Net realized and unrealized gain (loss) on investments | (6.78) | 7.50 | 3.92 | 5.39 | (1.30) |
| Total from investment operations | (6.44) | 7.79 | 4.24 | 5.73 | (0.98) |
| Distributions | |||||
| Net investment income | (0.34) | (0.30) | (0.31) | (0.38) | (0.37) |
| Net realized gain | (0.19) | (0.45) | (0.08) | (0.09) | — |
| Total distributions | (0.53) | (0.75) | (0.39) | (0.47) | (0.37) |
| Net Asset Value, End of Year | $27.85 | $34.82 | $27.78 | $23.93 | $18.67 |
| Total Return | -18.50% | 28.09% | 17.80% | 30.77% | -4.95% |
| Ratios/Supplemental Data | |||||
| Net assets, end of year (thousands) | $191,640 | $241,756 | $188,823 | $170,951 | $133,934 |
| Ratio of net investment income to average net assets | 1.12% | 0.91% | 1.30% | 1.39% | 1.39% |
| Ratio of expenses to average net assets | 0.48% | 0.50% | 0.53% | 0.59% | 0.56% |
| Portfolio turnover rate (a) | N/A | N/A | N/A | N/A | N/A |
| (a) | Substantially all of the assets of the Stock Index Fund are invested in the S&P 500 Index Master Portfolio managed by BlackRock Fund Advisors. Please refer to the financial highlights in the Appendix for the portfolio turnover rate of the S&P 500 Index Master Portfolio. |
| The accompanying notes are an integral part of these financial statements. | Financial Highlights |
| Year Ended December 31, | |||||
| For a Share Outstanding Throughout Each Year | 2022 | 2021 | 2020 | 2019 | 2018 |
| Net Asset Value, Beginning of Year | $54.33 | $47.28 | $51.51 | $46.64 | $55.26 |
| Income from investment operations | |||||
| Net investment income | 0.68 | 0.63 | 0.66 | 0.83 | 0.91 |
| Net realized and unrealized gain (loss) on investments | (3.84) | 11.12 | 2.94 | 11.93 | (4.39) |
| Total from investment operations | (3.16) | 11.75 | 3.60 | 12.76 | (3.48) |
| Distributions | |||||
| Net investment income | (0.68) | (0.64) | (0.66) | (0.83) | (0.91) |
| Net realized gain | (4.20) | (4.06) | (7.17) | (7.06) | (4.23) |
| Total distributions | (4.88) | (4.70) | (7.83) | (7.89) | (5.14) |
| Net Asset Value, End of Year | $46.29 | $54.33 | $47.28 | $51.51 | $46.64 |
| Total Return | -5.50% | 25.07% | 7.61% | 27.69% | -6.36% |
| Ratios/Supplemental Data | |||||
| Net assets, end of year (thousands) | $925,133 | $1,048,264 | $928,744 | $992,108 | $875,266 |
| Ratio of net investment income to average net assets | 1.42% | 1.14% | 1.35% | 1.53% | 1.55% |
| Ratio of expenses to average net assets | 0.62% | 0.63% | 0.65% | 0.66% | 0.60% |
| Portfolio turnover rate | 10% | 9% | 22% | 17%(a) | 1% |
| (a) | The change in portfolio turnover from 2018 to 2019 is due to a repositioning of the Fund as a result of market activities. |
| Financial Highlights | The accompanying notes are an integral part of these financial statements. |
| Year Ended December 31, | |||||
| For a Share Outstanding Throughout Each Year | 2022 | 2021 | 2020 | 2019 | 2018 |
| Net Asset Value, Beginning of Year | $16.66 | $15.56 | $11.78 | $9.68 | $10.36 |
| Income from investment operations | |||||
| Net investment income (loss) | — | (0.08) | (—) | (—) | 0.02 |
| Net realized and unrealized gain (loss) on investments | (5.55) | 2.70 | 4.52 | 2.73 | 0.41 |
| Total from investment operations | (5.55) | 2.62 | 4.52 | 2.73 | 0.43 |
| Distributions | |||||
| Net investment income | — | — | — | — | (0.02) |
| Net realized gain | (0.71) | (1.52) | (0.74) | (0.63) | (1.09) |
| Total distributions | (0.71) | (1.52) | (0.74) | (0.63) | (1.11) |
| Net Asset Value, End of Year | $10.40 | $16.66 | $15.56 | $11.78 | $9.68 |
| Total Return | -33.45% | 17.13% | 38.65% | 28.36% | 3.96% |
| Ratios/Supplemental Data | |||||
| Net assets, end of year (thousands) | $234,678 | $379,264 | $319,660 | $243,548 | $194,467 |
| Ratio of net investment income (loss) to average net assets | (0.35)% | (0.50)% | (0.46)% | (0.14)% | 0.14% |
| Ratio of expenses to average net assets | 0.83% | 0.84% | 0.89% | 0.93% | 0.86% |
| Portfolio turnover rate | 23% | 26% | 23% | 29% | 34% |
| The accompanying notes are an integral part of these financial statements. | Financial Highlights |
| Year Ended December 31, | |||||
| For a Share Outstanding Throughout Each Year | 2022 | 2021 | 2020 | 2019 | 2018 |
| Net Asset Value, Beginning of Year | $11.52 | $10.84 | $8.99 | $7.28 | $8.49 |
| Income from investment operations | |||||
| Net investment income | 0.19 | 0.13 | 0.06 | 0.12 | 0.12 |
| Net realized and unrealized gain (loss) on investments | (2.40) | 1.07 | 1.86 | 1.69 | (1.20) |
| Total from investment operations | (2.21) | 1.20 | 1.92 | 1.81 | (1.08) |
| Distributions | |||||
| Net investment income | (0.18) | (0.12) | (0.07) | (0.10) | (0.13) |
| Net realized gain | (0.27) | (0.40) | — | — | — |
| Total distributions | (0.45) | (0.52) | (0.07) | (0.10) | (0.13) |
| Net Asset Value, End of Year | $8.86 | $11.52 | $10.84 | $8.99 | $7.28 |
| Total Return | -19.13% | 11.09% | 21.34% | 24.83% | -12.74% |
| Ratios/Supplemental Data | |||||
| Net assets, end of year (thousands) | $82,091 | $103,285 | $91,541 | $78,775 | $66,082 |
| Ratio of net investment income to average net assets | 1.97%(a) | 1.07%(a) | 0.65%(a) | 1.29%(a) | 1.39%(a) |
| Ratio of gross expenses before voluntary expense limitation to average net assets | 1.16% | 1.19% | 1.24% | 1.30% | 1.23% |
| Ratio of expenses to average net assets | 1.00%(a) | 1.00%(a) | 0.99%(a) | 0.99%(a) | 0.99%(a) |
| Portfolio turnover rate | 13% | 13% | 15% | 27% | 16% |
| (a) | Excludes expenses in excess of a 1.00% contractual expense limitation with Homestead Advisers, in effect through April 30, 2023. Prior to May 1, 2021, the actual contractual expense limitation was 0.99%. |
| Financial Highlights | The accompanying notes are an integral part of these financial statements. |
| Year Ended December 31, | |||||
| For a Share Outstanding Throughout Each Year | 2022 | 2021 | 2020 | 2019 | 2018 |
| Net Asset Value, Beginning of Year | $28.72 | $28.36 | $26.25 | $25.57 | $44.11 |
| Income from investment operations | |||||
| Net investment income | (—) | 0.12 | (—) | 0.18 | 0.15 |
| Net realized and unrealized gain (loss) on investments | (4.87) | 5.53 | 5.70 | 5.42 | (11.45) |
| Total from investment operations | (4.87) | 5.65 | 5.70 | 5.60 | (11.30) |
| Distributions | |||||
| Net investment income | —(a) | (0.12) | —(a) | (0.18) | (0.15) |
| Net realized gain | (1.16) | (5.17) | (3.59) | (4.74) | (7.09) |
| Total distributions | (1.16) | (5.29) | (3.59) | (4.92) | (7.24) |
| Net Asset Value, End of Year | $22.69 | $28.72 | $28.36 | $26.25 | $25.57 |
| Total Return | -16.91% | 20.68% | 22.08% | 22.16% | -26.18% |
| Ratios/Supplemental Data | |||||
| Net assets, end of year (thousands) | $240,345 | $314,019 | $286,538 | $332,450 | $486,993 |
| Ratio of net investment income (loss) to average net assets | 0.01% | 0.36% | (0.16)% | 0.54% | 0.26% |
| Ratio of expenses to average net assets | 1.05% | 1.06% | 1.12% | 1.05% | 0.90% |
| Portfolio turnover rate | 16% | 24% | 18% | 38%(b) | 5% |
| (a) | Less than $0.01 per share. |
| (b) | The change in portfolio turnover from 2018 to 2019 is due to a repositioning of the Fund as a result of market activities. |
| The accompanying notes are an integral part of these financial statements. | Financial Highlights |
| Notes to Financial Statements |
| Notes to Financial Statements |
| Daily Income Fund | Level 1 | Level 2 | Level 3 | Total |
| U.S. Government & Agency Obligations | $ — | $167,324,207 | $ — | $167,324,207 |
| Money Market Fund | 38,676,504 | — | — | 38,676,504 |
| Total | $38,676,504 | $167,324,207 | $ — | $206,000,711 |
| Short-Term Government Securities Fund | ||||
| U.S. Government & Agency Obligations | $ — | $45,494,529 | $ — | $45,494,529 |
| Corporate Bonds Guaranteed by Export-Import Bank of the United States | — | 17,632,216 | — | 17,632,216 |
| Asset-Backed Securities | — | 2,138,400 | — | 2,138,400 |
| Corporate Bonds–Other | — | 1,060,838 | — | 1,060,838 |
| Mortgage-Backed Securities | — | 772,559 | — | 772,559 |
| Municipal Bond | — | 98,405 | — | 98,405 |
| Money Market Fund | 1,161,168 | — | — | 1,161,168 |
| Total | $1,161,168 | $67,196,947 | $ — | $68,358,115 |
| Short-Term Bond Fund | ||||
| U.S. Government & Agency Obligations | $ — | $245,492,904 | $ — | $245,492,904 |
| Corporate Bonds–Other | — | 124,959,652 | — | 124,959,652 |
| Asset-Backed Securities | — | 49,790,266 | — | 49,790,266 |
| Yankee Bonds | — | 34,945,671 | — | 34,945,671 |
| Corporate Bonds Guaranteed by Export-Import Bank of the United States | — | 9,960,592 | — | 9,960,592 |
| Mortgage-Backed Securities | — | 4,044,971 | — | 4,044,971 |
| Municipal Bonds | — | 3,026,694 | — | 3,026,694 |
| Money Market Fund | 5,860,480 | — | — | 5,860,480 |
| Total | $5,860,480 | $472,220,750 | $ — | $478,081,230 |
| Intermediate Bond Fund | ||||
| U.S. Government & Agency Obligations | $ — | $45,226,251 | $ — | $45,226,251 |
| Corporate Bonds–Other | — | 30,150,945 | — | 30,150,945 |
| Mortgage-Backed Securities | — | 29,198,548 | — | 29,198,548 |
| Asset-Backed Securities | — | 11,970,817 | — | 11,970,817 |
| Yankee Bonds | — | 6,407,751 | — | 6,407,751 |
| Municipal Bonds | — | 3,278,880 | — | 3,278,880 |
| Corporate Bonds Guaranteed by Export-Import Bank of the United States | — | 533,046 | — | 533,046 |
| Money Market Fund | 4,226,719 | — | — | 4,226,719 |
| Total | $4,226,719 | $126,766,238 | $ — | $130,992,957 |
| Rural America Growth & Income Fund | ||||
| Common Stocks | $4,090,647 | $ — | $ — | $4,090,647 |
| U.S. Government & Agency Obligations | — | 1,355,683 | — | 1,355,683 |
| Corporate Bonds–Other | — | 960,098 | — | 960,098 |
| Asset-Backed Securities | — | 218,934 | — | 218,934 |
| Municipal Bonds | — | 114,627 | — | 114,627 |
| Mortgage-Backed Securities | — | 85,531 | — | 85,531 |
| Money Market Fund | 542,698 | — | — | 542,698 |
| Total | $4,633,345 | $2,734,873 | $ — | $7,368,218 |
| Notes to Financial Statements |
| Value Fund | Level 1 | Level 2 | Level 3 | Total |
| Common Stocks | $904,770,197 | $ — | $ — | $904,770,197 |
| Money Market Fund | 20,549,021 | — | — | 20,549,021 |
| Total | $925,319,218 | $ — | $ — | $925,319,218 |
| Growth Fund | ||||
| Common Stocks | $231,339,439 | $ — | $ — | $231,339,439 |
| Money Market Fund | 3,293,574 | — | — | 3,293,574 |
| Total | $234,633,013 | $ — | $ — | $234,633,013 |
| International Equity Fund | ||||
| Common Stocks | $12,576,687 | $67,348,773 | $ — | $79,925,460 |
| Money Market Fund | 1,915,024 | — | — | 1,915,024 |
| Total | $14,491,711 | $67,348,773 | $ — | $81,840,484 |
| Small-Company Stock Fund | ||||
| Common Stocks | $235,960,147 | $ — | $ — | $235,960,147 |
| Stock Warrants | 72,581 | — | — | 72,581 |
| Money Market Fund | 4,825,344 | — | — | 4,825,344 |
| Total | $240,858,072 | $ — | $ — | $240,858,072 |
| Notes to Financial Statements |
| Distributable Earnings (Losses) | Paid in Capital | |
| Daily Income Fund | $392 | $(392) |
| Short-Term Gov. Securities Fund | $1,369 | $(1,369) |
| Short-Term Bond Fund | $— | $— |
| Intermediate Bond Fund | $2,081 | $(2,081) |
| Rural America Growth & Income Fund | $13 | $(13) |
| Stock Index Fund | $(672) | $672 |
| Value Fund | $(4,296,273) | $4,296,273 |
| Growth Fund | $1,040,959 | $(1,040,959) |
| International Equity Fund | $— | $— |
| Small-Company Stock Fund | $(172,043) | $172,043 |
| Ordinary Income | Long-Term Gain | Return of Capital | Total Distributions | |
| Daily Income Fund | $2,393,963 | $— | $— | $2,393,963 |
| Short-Term Gov. Securities Fund | $842,483 | $— | $— | $842,483 |
| Short-Term Bond Fund | $8,609,201 | $— | $— | $8,609,201 |
| Intermediate Bond Fund | $2,782,153 | $— | $— | $2,782,153 |
| Rural America Growth & Income Fund | $42,312 | $— | $— | $42,312 |
| Stock Index Fund | $2,649,522 | $924,588 | $— | $3,574,110 |
| Value Fund | $12,769,165 | $78,292,201 | $— | $91,061,366 |
| Growth Fund | $— | $15,514,807 | $— | $15,514,807 |
| International Equity Fund | $1,618,091 | $2,427,468 | $— | $4,045,559 |
| Small-Company Stock Fund | $— | $12,017,540 | $— | $12,017,540 |
| Notes to Financial Statements |
| Ordinary Income | Long-Term Gain | Return of Capital | Total Distributions | |
| Daily Income Fund | $17,623 | $— | $— | $17,623 |
| Short-Term Gov. Securities Fund | $282,892 | $— | $— | $282,892 |
| Short-Term Bond Fund | $6,392,688 | $1,335,605 | $— | $7,728,293 |
| Intermediate Bond Fund | $1,695,715 | $— | $— | $1,695,715 |
| Rural America Growth & Income Fund | $18,495 | $61 | $— | $18,556 |
| Stock Index Fund | $3,103,532 | $1,974,230 | $— | $5,077,762 |
| Value Fund | $13,493,152 | $71,611,938 | $— | $85,105,090 |
| Growth Fund | $3,714,317 | $28,362,438 | $— | $32,076,755 |
| International Equity Fund | $1,003,936 | $3,416,452 | $— | $4,420,388 |
| Small-Company Stock Fund | $8,497,274 | $41,736,387 | $— | $50,233,661 |
| Undistributed Ordinary Income | Undistributed Long-Term Gain | Net Unrealized Appreciation/ Depreciation | Capital Loss Carryforward/ Late Year Loss Deferral | Other Book/Tax Differences | Total Distributable Earnings (Losses) | |
| Daily Income Fund | $37,672 | $— | $— | $(34,982) | $(81,699) | $(79,009) |
| Short-Term Gov. Securities Fund | $— | $— | $(3,563,810) | $(1,458,898) | $(34,047) | $(5,056,755) |
| Short-Term Bond Fund | $— | $— | $(21,080,729) | $(21,047,724) | $(196,942) | $(42,325,395) |
| Intermediate Bond Fund | $— | $— | $(11,894,151) | $(12,023,271) | $(7,328) | $(23,924,750) |
| Rural America Growth & Income Fund | $3,721 | $— | $(587,262) | $(116,887) | $(53) | $(700,481) |
| Stock Index Fund | $46,115 | $9,013 | $152,053,213 | $— | $(2,495,006) | $149,613,335 |
| Value Fund | $— | $3,251,463 | $371,040,142 | $— | $(324,972) | $373,966,633 |
| Growth Fund | $— | $— | $46,356,564 | $(1,454,589) | $(50,337) | $44,851,638 |
| International Equity Fund | $175,857 | $511,716 | $12,226,158 | $— | $(57,155) | $12,856,576 |
| Small-Company Stock Fund | $— | $1,861,419 | $35,465,920 | $— | $(195,304) | $37,132,035 |
| Tax Cost | Tax Appreciation | Tax Depreciation | Net Tax Appreciation (Depreciation) | |
| Daily Income Fund | $206,000,711 | $— | $— | $— |
| Short-Term Gov. Securities Fund | $71,921,927 | $26,867 | $(3,590,679) | $(3,563,812) |
| Short-Term Bond Fund | $499,161,958 | $395,955 | $(21,476,683) | $(21,080,728) |
| Intermediate Bond Fund | $142,887,109 | $261,259 | $(12,155,411) | $(11,894,152) |
| Rural America Growth & Income Fund | $7,955,480 | $164,383 | $(751,645) | $(587,262) |
| Value Fund | $554,279,075 | $390,793,138 | $(19,752,995) | $371,040,143 |
| Growth Fund | $188,276,447 | $71,815,713 | $(25,459,147) | $46,356,566 |
| International Equity Fund | $69,615,569 | $16,418,916 | $(4,194,001) | $12,224,915 |
| Small-Company Stock Fund | $205,392,152 | $54,916,182 | $(19,450,262) | $35,465,920 |
| Notes to Financial Statements |
| Purchases | Proceeds from Sale | |
| Short-Term Gov. Securities Fund | $3,231,707 | $25,186,201 |
| Short-Term Bond Fund | $174,190,500 | $302,191,506 |
| Intermediate Bond Fund | $62,212,403 | $85,271,054 |
| Rural America Growth & Income Fund | $3,963,028 | $2,555,888 |
| Value Fund | $92,904,277 | $145,428,079 |
| Growth Fund | $64,771,467 | $86,936,737 |
| International Equity Fund | $12,438,719 | $10,464,054 |
| Small-Company Stock Fund | $40,926,929 | $63,508,948 |
| Purchases | Proceeds from Sale | |
| Short-Term Gov. Securities Fund | $140,627,380 | $122,755,003 |
| Short-Term Bond Fund | $1,452,791,115 | $1,366,881,206 |
| Intermediate Bond Fund | $289,401,143 | $258,215,412 |
| Rural America Growth & Income Fund | $1,388,541 | $213,987 |
| Notes to Financial Statements |
| Notes to Financial Statements |
| Shares Sold | Shares Issued In Reinvestment of Dividends | Total Shares Issued | Total Shares Redeemed | Net Increase (Decrease) | |
| Year Ended December 31, 2022 | |||||
| In Dollars | |||||
| Daily Income Fund | $105,940,219 | $2,368,554 | $108,308,773 | $(83,334,145) | $24,974,628 |
| Short-Term Government Securities Fund | $6,903,885 | $834,420 | $7,738,305 | $(12,673,437) | $(4,935,132) |
| Short-Term Bond Fund | $35,346,633 | $8,425,693 | $43,772,326 | $(88,194,983) | $(44,422,657) |
| Intermediate Bond Fund | $12,142,488 | $2,779,340 | $14,921,828 | $(12,430,149) | $2,491,679 |
| Rural America Growth & Income Fund | $6,042,214 | $42,281 | $6,084,495 | $(3,373,305) | $2,711,190 |
| Stock Index Fund | $19,111,037 | $3,464,922 | $22,575,959 | $(25,081,606) | $(2,505,647) |
| Value Fund | $54,797,327 | $88,584,574 | $143,381,901 | $(115,689,537) | $27,692,364 |
| Growth Fund | $24,726,104 | $15,377,070 | $40,103,174 | $(44,620,443) | $(4,517,269) |
| International Equity Fund | $5,995,506 | $3,834,128 | $9,829,634 | $(7,199,930) | $2,629,704 |
| Small-Company Stock Fund | $10,346,352 | $11,615,697 | $21,962,049 | $(31,624,538) | $(9,662,489) |
| In Shares | |||||
| Daily Income Fund | 105,940,219 | 2,368,554 | 108,308,773 | (83,334,145) | 24,974,628 |
| Short-Term Government Securities Fund | 1,378,052 | 168,753 | 1,546,805 | (2,543,811) | (997,006) |
| Short-Term Bond Fund | 7,093,356 | 1,724,987 | 8,818,343 | (17,777,882) | (8,959,539) |
| Intermediate Bond Fund | 2,516,831 | 595,521 | 3,112,352 | (2,571,384) | 540,968 |
| Rural America Growth & Income Fund | 638,440 | 4,719 | 643,159 | (348,494) | 294,665 |
| Stock Index Fund | 632,939 | 123,157 | 756,096 | (818,468) | (62,372) |
| Value Fund | 1,115,417 | 1,935,365 | 3,050,782 | (2,358,768) | 692,014 |
| Growth Fund | 1,918,181 | 1,414,054 | 3,332,235 | (3,530,173) | (197,938) |
| International Equity Fund | 621,580 | 432,023 | 1,053,603 | (755,175) | 298,428 |
| Small-Company Stock Fund | 415,423 | 512,197 | 927,620 | (1,268,636) | (341,016) |
| Notes to Financial Statements |
| Shares Sold | Shares Issued In Reinvestment of Dividends | Total Shares Issued | Total Shares Redeemed | Net Increase (Decrease) | |
| Year Ended December 31, 2021 | |||||
| In Dollars | |||||
| Daily Income Fund | $117,288,844 | $16,979 | $117,305,823 | $(109,498,170) | $7,807,653 |
| Short-Term Government Securities Fund | $11,853,556 | $272,740 | $12,126,296 | $(22,419,489) | $(10,293,193) |
| Short-Term Bond Fund | $106,966,199 | $7,643,200 | $114,609,399 | $(101,062,892) | $13,546,507 |
| Intermediate Bond Fund | $74,980,483 | $1,690,202 | $76,670,685 | $(15,338,009) | $61,332,676 |
| Rural America Growth & Income Fund | $5,753,354 | $18,551 | $5,771,905 | $(584,043) | $5,187,862 |
| Stock Index Fund | $31,088,322 | $5,006,751 | $36,095,073 | $(31,147,141) | $4,947,932 |
| Value Fund | $71,920,677 | $83,431,312 | $155,351,989 | $(174,642,863) | $(19,290,874) |
| Growth Fund | $71,087,698 | $31,887,045 | $102,974,743 | $(66,016,449) | $36,958,294 |
| International Equity Fund | $13,647,206 | $4,408,623 | $18,055,829 | $(12,337,352) | $5,718,477 |
| Small-Company Stock Fund | $26,754,838 | $49,753,560 | $76,508,398 | $(56,267,598) | $20,240,800 |
| In Shares | |||||
| Daily Income Fund | 117,288,844 | 16,979 | 117,305,823 | (109,498,170) | 7,807,653 |
| Short-Term Government Securities Fund | 2,253,734 | 51,942 | 2,305,676 | (4,273,144) | (1,967,468) |
| Short-Term Bond Fund | 20,228,826 | 1,456,777 | 21,685,603 | (19,143,494) | 2,542,109 |
| Intermediate Bond Fund | 14,097,662 | 318,492 | 14,416,154 | (2,894,304) | 11,521,850 |
| Rural America Growth & Income Fund | 569,936 | 1,812 | 571,748 | (56,987) | 514,761 |
| Stock Index Fund | 987,453 | 147,889 | 1,135,342 | (987,454) | 147,888 |
| Value Fund | 1,351,918 | 1,554,431 | 2,906,349 | (3,255,281) | (348,932) |
| Growth Fund | 4,185,515 | 1,947,685 | 6,133,200 | (3,903,638) | 2,229,562 |
| International Equity Fund | 1,207,830 | 388,675 | 1,596,505 | (1,078,728) | 517,777 |
| Small-Company Stock Fund | 835,192 | 1,765,342 | 2,600,534 | (1,769,183) | 831,351 |
| Notes to Financial Statements |
Independent | (Unaudited)
| Name, Year of Birth and Address (1) | Position(s) Held With Homestead Funds | Term of Office and Length of Time Served | Principal Occupation(s) During Past Five Years | Number of Portfolios Overseen by Director in the Fund Complex (2) | Other Directorships Held by Director |
| James F. Perna 1947 | Director/Trustee, Chairman of the Board, Member of Audit Committee, Member of Compensation Committee | 1990-present (Homestead Funds, Inc.); since inception (Homestead Funds Trust) | Solo Practitioner (attorney) (2008-present) | 10 | None |
| Douglas W. Johnson 1955 | Director/Trustee, Chairman of Audit Committee, Member of Compensation Committee | 2003-present (Homestead Funds, Inc.); since inception (Homestead Funds Trust) | CEO, Blue Ridge Electric Membership Corporation (1989-present) | 10 | None |
| Kenneth R. Meyer 1944 | Director/Trustee, Member of Audit Committee, Chairman of Compensation Committee | 2005-present (Homestead Funds, Inc.); since inception (Homestead Funds Trust) | Retired (2004-present) | 10 | None |
| Anthony M. Marinello 1946 | Director/Trustee, Member of Audit Committee, Member of Compensation Committee | 1990-present (Homestead Funds, Inc.); since inception (Homestead Funds Trust) | Retired (2004-present) | 10 | None |
| Sheldon C. Petersen 1953 | Director/Trustee, Member of Audit Committee, Member of Compensation Committee | 2005-present (Homestead Funds, Inc.); since inception (Homestead Funds Trust) | Retired (2021-present); CEO, National Rural Utilities Cooperative Finance Corporation (1995-2021) | 10 | None |
| Mark Rose 1953 | Director/Trustee, Member of Audit Committee, Member of Compensation Committee | 2005-present (Homestead Funds, Inc.); since inception (Homestead Funds Trust) | Consultant, public affairs (2017-present)(self-employed); CEO and General Manager, Bluebonnet Electric Cooperative (2002-2017) | 10 | None |
| Peter J. Tonetti 1953 | Director/Trustee, Member of Audit Committee, Member of Compensation Committee | 2010-present (Homestead Funds, Inc.); since inception (Homestead Funds Trust) | Retired (2015-present) | 10 | None |
Independent | (Unaudited) (Continued)
| Judith H. McKinney 1950 | Director/Trustee, Member of Audit Committee, Member of Compensation Committee | 2019-present | Retired (2019-present); Executive Vice President and Manager, Callan LLC (2007-2019) | 10 | None |
| Julie H. Dellinger 1953 | Director/Trustee, Vice Chair of Audit Committee, Member of Compensation Committee | 2019-present; Vice Chair of Audit Committee 2021-present | Westminster Investment Consultants, CEO (2017- present); Managing Vice President of Investments, ICMARC and Manager, Vantagepoint Investment Advisers, LLC (1998-2017) | 10 | None |
Interested | (Unaudited)
| Name, Year of Birth and Address (1) | Position(s) Held With Homestead Funds | Term of Office and Length of Time Served | Principal Occupation(s) During Past Five Years | Number of Portfolios Overseen by Director | Other Directorships Held by Director |
| Mark D. Santero (3) 1961 | Director/Trustee, President and Chief Executive Officer | 2018-present (Homestead Funds, Inc.); since inception (Homestead Funds Trust) | Homestead Advisers Corp., President, Chief Executive Officer and Director (2018- present); Chief Executive Officer, The Dreyfus Corporation (2016-2017); Chief Operating Officer, BNY Mellon Investment Management (2014- 2016) | 10 | Not Applicable |
| Danielle C. Sieverling 1971 | Chief Compliance Officer | 2005-present (Homestead Funds, Inc.); since inception (Homestead Funds Trust) | Chief Compliance Officer, Homestead Advisers Corp. (2005-present); Vice President, Chief Risk and Compliance Officer, NRECA (2015-present); Chief Compliance Officer, Homestead Financial Services Corp. (2017-Present); Secretary, Homestead Advisers Corp. (2017-2018, 2020-2021); Chief Executive Officer and Director, Homestead Financial Services Corp. (2017-2018); Director, Homestead Financial Services Corp. (2016) Vice President and Director, Homestead Financial Services Corp. (2015-2016); Vice President and Chief Compliance Officer, Management Advisory Services, NRECA (2008-2015) | Not Applicable | Not Applicable |
| Amy M. DiMauro 1971 | Treasurer | 2007-present (Homestead Funds, Inc,); since inception (Homestead Funds Trust) | Treasurer and Director, Homestead Financial Services Corp. (2006- present); Treasurer and Director, Homestead Advisers Corp. (2010- present); Senior Director, Finance & Accounting—Mutual Funds, NRECA (2014-present); Treasurer and Director, Electric Cooperative Life Insurance Co. (2013-2021); Treasurer and Director, Cooperating Insurance Services Co. (2013- present) | Not Applicable | Not Applicable |
| Jennifer (Laurie) Webster 1963 | Chief Operations Officer | 2017-present (Homestead Funds, Inc.); since inception (Homestead Funds Trust) | President and Director, Homestead Financial Services Corp. (2018- present); Chief Operations Officer, Homestead Financial Services Corp. (2017- present); Vice President of Operations and Client Services, Homestead Advisers Corp. (2017-2020); Chief Operations Officer, Homestead Advisers Corp. (2020-present); Chief Operating Officer, Solomon Hess Capital Management (2017-2017); V.P. Investment Operations and Indexing, Calvert Investments (2014-2017) | Not Applicable | Not Applicable |
| Jeremy Sperlazza 1990 | Secretary | 2021-present | Secretary and Counsel, Homestead Advisers Corp. (2021-present); Counsel, Homestead Financial Services Corp. (2021-present); Associate, Dechert LLP (2015-2021) | Not Applicable | Not Applicable |
| Fund | Qualified Dividend Income for Individuals | Dividends Received Deduction for Corporations |
| Daily Income Fund | 0% | 0% |
| Short-Term Government Securities Fund | 0% | 0% |
| Short-Term Bond Fund | 0% | 0% |
| Rural America Growth & Income Fund | 50% | 50% |
| Stock Index Fund | 94% | 94% |
| Value Fund | 100% | 99% |
| Growth Fund | 0% | 0% |
| International Equity Fund | 100% | 97% |
| Small-Company Stock Fund | 0% | 0% |
| Fund | Record Date | Distributions of Short-Term Capital Gains | Distributions of Long-Term Capital Gains |
| Rural America Growth & Income Fund | 6/29/2022 | $0.0019 | $– |
| Stock Index Fund | 6/29/2022 | $0.0086 | $0.0913 |
| Stock Index Fund | 12/14/2022 | $0.0467 | $0.0456 |
| Value Fund | 6/29/2022 | $– | $1.2099 |
| Value Fund | 12/14/2022 | $0.0018 | $2.9848 |
| Growth Fund | 6/29/2022 | $– | $0.3686 |
| Growth Fund | 12/14/2022 | $– | $0.3382 |
| International Equity Fund | 06/29/2022 | $– | $0.0749 |
| International Equity Fund | 12/14/2022 | $– | $0.1970 |
| Small-Company Stock Fund | 6/29/2022 | $– | $0.3701 |
| Small-Company Stock Fund | 12/14/2022 | $– | $0.7911 |

| Master Portfolio Information as of December 31, 2022 | S&P 500 Index Master Portfolio |
TEN LARGEST HOLDINGS
Security
| Percent of
| |||
Apple, Inc. | 6.0% | |||
Microsoft Corp. | 5.5 | |||
Amazon.com, Inc. | 2.3 | |||
Berkshire Hathaway, Inc., Class B | 1.7 | |||
Alphabet, Inc., Class A | 1.6 | |||
UnitedHealth Group, Inc. | 1.5 | |||
Alphabet, Inc., Class C | 1.5 | |||
Johnson & Johnson | 1.4 | |||
Exxon Mobil Corp. | 1.4 | |||
JPMorgan Chase & Co.
| 1.2 | |||
SECTOR ALLOCATION
Sector(a)
| Percent of
| |||
Information Technology | 25.5% | |||
Health Care | 15.7 | |||
Financials | 11.5 | |||
Consumer Discretionary | 9.7 | |||
Industrials | 8.6 | |||
Communication Services | 7.2 | |||
Consumer Staples | 7.1 | |||
Energy | 5.2 | |||
Utilities | 3.1 | |||
Materials | 2.7 | |||
Real Estate | 2.7 | |||
Investment Companies | 0.7 | |||
Short-Term Securities | 1.4 | |||
Liabilities in Excess of Other Assets
| (1.1) | |||
| (a) | For S&P 500 Index Master Portfolio (the “Master Portfolio”) compliance purposes, the Master Portfolio’s sector classifications refer to one or more of the sector subclassifications used by one or more widely recognized market indexes or ratings group indexes, and/or as defined by the investment adviser. These definitions may not apply for purposes of this report, which may combine such sector sub-classifications for reporting ease. |
MASTER PORTFOLIO INFORMATION | 1 |
Schedule of Investments December 31, 2022 | S&P 500 Index Master Portfolio (Percentages shown are based on Net Assets) |
| Security | Shares | Value | ||||||
| ||||||||
Common Stocks | ||||||||
Aerospace & Defense — 1.9% | ||||||||
Boeing Co.(a) | 508,028 | $ | 96,774,254 | |||||
General Dynamics Corp. | 204,768 | 50,804,988 | ||||||
Howmet Aerospace, Inc. | 336,170 | 13,248,460 | ||||||
Huntington Ingalls Industries, Inc. | 36,612 | 8,445,656 | ||||||
L3Harris Technologies, Inc. | 174,560 | 36,345,138 | ||||||
Lockheed Martin Corp. | 212,352 | 103,307,125 | ||||||
Northrop Grumman Corp. | 132,361 | 72,217,485 | ||||||
Raytheon Technologies Corp. | 1,343,846 | 135,620,938 | ||||||
Textron, Inc. | 190,018 | 13,453,274 | ||||||
TransDigm Group, Inc. | 46,632 | 29,361,839 | ||||||
|
| |||||||
| 559,579,157 | ||||||||
| Air Freight & Logistics — 0.6% | ||||||||
CH Robinson Worldwide, Inc.(b) | 107,165 | 9,812,027 | ||||||
Expeditors International of Washington, Inc. | 144,881 | 15,056,034 | ||||||
FedEx Corp. | 218,135 | 37,780,982 | ||||||
United Parcel Service, Inc., Class B | 666,095 | 115,793,955 | ||||||
|
| |||||||
| 178,442,998 | ||||||||
| Airlines(a) — 0.2% | ||||||||
Alaska Air Group, Inc.(b) | 117,159 | 5,030,807 | ||||||
American Airlines Group, Inc.(b) | 585,790 | 7,451,249 | ||||||
Delta Air Lines, Inc. | 580,557 | 19,077,103 | ||||||
Southwest Airlines Co. | 537,016 | 18,081,329 | ||||||
United Airlines Holdings, Inc. | 296,024 | 11,160,105 | ||||||
|
| |||||||
| 60,800,593 | ||||||||
| Auto Components — 0.1% | ||||||||
Aptiv PLC(a)(b) | 245,210 | 22,836,407 | ||||||
BorgWarner, Inc. | 218,526 | 8,795,672 | ||||||
|
| |||||||
| 31,632,079 | ||||||||
| Automobiles — 1.3% | ||||||||
Ford Motor Co. | 3,596,203 | 41,823,841 | ||||||
General Motors Co. | 1,293,432 | 43,511,053 | ||||||
Tesla, Inc.(a) | 2,443,651 | 301,008,930 | ||||||
|
| |||||||
| 386,343,824 | ||||||||
| Banks — 3.8% | ||||||||
Bank of America Corp. | 6,362,530 | 210,726,994 | ||||||
Citigroup, Inc. | 1,762,692 | 79,726,559 | ||||||
Citizens Financial Group, Inc. | 453,139 | 17,840,082 | ||||||
Comerica, Inc. | 117,856 | 7,878,674 | ||||||
Fifth Third Bancorp | 622,692 | 20,430,525 | ||||||
First Republic Bank | 165,544 | 20,178,158 | ||||||
Huntington Bancshares, Inc. | 1,305,269 | 18,404,293 | ||||||
JPMorgan Chase & Co. | 2,669,073 | 357,922,689 | ||||||
KeyCorp | 846,467 | 14,745,455 | ||||||
M&T Bank Corp. | 159,106 | 23,079,916 | ||||||
PNC Financial Services Group, Inc. | 367,190 | 57,993,989 | ||||||
Regions Financial Corp. | 845,683 | 18,232,926 | ||||||
Signature Bank | 58,578 | 6,749,357 | ||||||
SVB Financial Group(a) | 54,022 | 12,432,623 | ||||||
Truist Financial Corp. | 1,207,213 | 51,946,375 | ||||||
U.S. Bancorp | 1,230,748 | 53,672,920 | ||||||
Wells Fargo & Co. | 3,452,235 | 142,542,783 | ||||||
Zions Bancorp NA | 137,643 | 6,766,530 | ||||||
|
| |||||||
| 1,121,270,848 | ||||||||
| Beverages — 1.9% | ||||||||
Brown-Forman Corp., Class B | 165,482 | 10,868,858 | ||||||
Coca-Cola Co. | 3,542,445 | 225,334,926 | ||||||
Constellation Brands, Inc., Class A | 146,199 | 33,881,618 | ||||||
| Security | Shares | Value | ||||||
| ||||||||
| Beverages (continued) | ||||||||
Keurig Dr. Pepper, Inc. | 768,975 | $ | 27,421,649 | |||||
Molson Coors Beverage Co., Class B | 172,881 | 8,906,829 | ||||||
Monster Beverage Corp.(a) | 351,162 | 35,653,478 | ||||||
PepsiCo, Inc. | 1,256,081 | 226,923,593 | ||||||
|
| |||||||
| 568,990,951 | ||||||||
| Biotechnology — 2.5% | ||||||||
AbbVie, Inc. | 1,609,228 | 260,067,337 | ||||||
Amgen, Inc. | 486,866 | 127,870,486 | ||||||
Biogen, Inc.(a) | 132,346 | 36,649,254 | ||||||
Gilead Sciences, Inc. | 1,140,749 | 97,933,302 | ||||||
Incyte Corp.(a) | 169,464 | 13,611,348 | ||||||
Moderna, Inc.(a) | 300,798 | 54,029,337 | ||||||
Regeneron Pharmaceuticals, Inc.(a) | 97,559 | 70,387,843 | ||||||
Vertex Pharmaceuticals, Inc.(a) | 233,416 | 67,405,873 | ||||||
|
| |||||||
| 727,954,780 | ||||||||
| Building Products — 0.4% | ||||||||
A O Smith Corp.(b) | 117,189 | 6,707,898 | ||||||
Allegion PLC | 79,067 | 8,322,593 | ||||||
Carrier Global Corp. | 768,584 | 31,704,090 | ||||||
Johnson Controls International PLC | 628,013 | 40,192,832 | ||||||
Masco Corp. | 206,583 | 9,641,229 | ||||||
Trane Technologies PLC | 211,437 | 35,540,445 | ||||||
|
| |||||||
| 132,109,087 | ||||||||
| Capital Markets — 3.1% | ||||||||
Ameriprise Financial, Inc.(b) | 96,884 | 30,166,771 | ||||||
Bank of New York Mellon Corp. | 672,768 | 30,624,399 | ||||||
BlackRock, Inc.(c) | 137,222 | 97,239,626 | ||||||
Cboe Global Markets, Inc. | 97,578 | 12,243,112 | ||||||
Charles Schwab Corp. | 1,389,747 | 115,710,335 | ||||||
CME Group, Inc., Class A | 327,137 | 55,011,358 | ||||||
FactSet Research Systems, Inc. | 34,598 | 13,881,063 | ||||||
Franklin Resources, Inc. | 254,123 | 6,703,765 | ||||||
Goldman Sachs Group, Inc. | 308,300 | 105,864,054 | ||||||
Intercontinental Exchange, Inc. | 508,348 | 52,151,421 | ||||||
Invesco Ltd. | 403,742 | 7,263,319 | ||||||
MarketAxess Holdings, Inc. | 34,777 | 9,698,957 | ||||||
Moody’s Corp. | 143,848 | 40,078,930 | ||||||
Morgan Stanley | 1,200,194 | 102,040,494 | ||||||
MSCI, Inc. | 73,457 | 34,169,993 | ||||||
Nasdaq, Inc.(b) | 309,612 | 18,994,696 | ||||||
Northern Trust Corp.(b) | 189,313 | 16,752,307 | ||||||
Raymond James Financial, Inc. | 175,801 | 18,784,337 | ||||||
S&P Global, Inc.(b) | 303,170 | 101,543,760 | ||||||
State Street Corp. | 332,717 | 25,808,858 | ||||||
T Rowe Price Group, Inc. | 204,367 | 22,288,265 | ||||||
| �� |
|
| ||||||
| 917,019,820 | ||||||||
| Chemicals — 1.9% | ||||||||
Air Products & Chemicals, Inc. | 201,870 | 62,228,446 | ||||||
Albemarle Corp.(b) | 107,065 | 23,218,116 | ||||||
Celanese Corp. | 91,453 | 9,350,155 | ||||||
CF Industries Holdings, Inc. | 180,343 | 15,365,223 | ||||||
Corteva, Inc. | 655,008 | 38,501,370 | ||||||
Dow, Inc. | 640,717 | 32,285,730 | ||||||
DuPont de Nemours, Inc. | 455,895 | 31,288,074 | ||||||
Eastman Chemical Co. | 109,209 | 8,893,981 | ||||||
Ecolab, Inc. | 226,421 | 32,957,841 | ||||||
FMC Corp. | 115,005 | 14,352,624 | ||||||
International Flavors & Fragrances, Inc. | 230,742 | 24,190,991 | ||||||
Linde PLC(a) | 450,094 | 146,811,661 | ||||||
LyondellBasell Industries NV, Class A | 230,284 | 19,120,480 | ||||||
| 2 | 2 0 2 2 BLACK ROCK ANNUAL REPORT TO SHAREHOLDERS |
Schedule of Investments (continued) December 31, 2022 | S&P 500 Index Master Portfolio (Percentages shown are based on Net Assets) |
| Security | Shares | Value | ||||||
| ||||||||
Chemicals (continued) | ||||||||
Mosaic Co. | 312,487 | $ | 13,708,805 | |||||
PPG Industries, Inc. | 212,686 | 26,743,138 | ||||||
Sherwin-Williams Co. | 214,725 | 50,960,684 | ||||||
|
| |||||||
| 549,977,319 | ||||||||
| Commercial Services & Supplies — 0.5% | ||||||||
Cintas Corp. | 78,524 | 35,463,009 | ||||||
Copart, Inc.(a) | 387,194 | 23,576,243 | ||||||
Republic Services, Inc. | 186,337 | 24,035,609 | ||||||
Rollins, Inc. | 207,904 | 7,596,812 | ||||||
Waste Management, Inc.(b) | 342,341 | 53,706,456 | ||||||
|
| |||||||
| 144,378,129 | ||||||||
| Communications Equipment — 0.9% | ||||||||
Arista Networks, Inc.(a) | 223,067 | 27,069,180 | ||||||
Cisco Systems, Inc. | 3,738,161 | 178,085,990 | ||||||
F5, Inc.(a) | 53,572 | 7,688,118 | ||||||
Juniper Networks, Inc. | 298,689 | 9,546,100 | ||||||
Motorola Solutions, Inc. | 152,225 | 39,229,905 | ||||||
|
| |||||||
| 261,619,293 | ||||||||
| Construction & Engineering — 0.1% | ||||||||
Quanta Services, Inc. | 130,356 | 18,575,730 | ||||||
|
| |||||||
| Construction Materials — 0.1% | ||||||||
Martin Marietta Materials, Inc. | 56,452 | 19,079,083 | ||||||
Vulcan Materials Co. | 120,321 | 21,069,410 | ||||||
|
| |||||||
| 40,148,493 | ||||||||
| Consumer Finance — 0.5% | ||||||||
American Express Co. | 545,905 | 80,657,464 | ||||||
Capital One Financial Corp. | 350,354 | 32,568,908 | ||||||
Discover Financial Services | 247,236 | 24,187,098 | ||||||
Synchrony Financial | 410,182 | 13,478,580 | ||||||
|
| |||||||
| 150,892,050 | ||||||||
| Containers & Packaging — 0.3% | ||||||||
Amcor PLC | 1,352,352 | 16,106,512 | ||||||
Avery Dennison Corp. | 73,900 | 13,375,900 | ||||||
Ball Corp. | 283,963 | 14,521,868 | ||||||
International Paper Co. | 330,052 | 11,429,701 | ||||||
Packaging Corp. of America | 85,537 | 10,941,038 | ||||||
Sealed Air Corp.(b) | 133,957 | 6,681,775 | ||||||
Westrock Co. | 227,684 | 8,005,369 | ||||||
|
| |||||||
| 81,062,163 | ||||||||
| Distributors — 0.2% | ||||||||
Genuine Parts Co. | 128,003 | 22,209,801 | ||||||
LKQ Corp. | 231,034 | 12,339,526 | ||||||
Pool Corp.(b) | 36,153 | 10,930,136 | ||||||
|
| |||||||
| 45,479,463 | ||||||||
| Diversified Financial Services — 1.7% | ||||||||
Berkshire Hathaway, Inc., Class B(a) | 1,640,324 | 506,696,084 | ||||||
|
| |||||||
| Diversified Telecommunication Services — 0.9% | ||||||||
AT&T, Inc. | 6,485,711 | 119,401,939 | ||||||
Lumen Technologies, Inc. | 868,348 | 4,532,777 | ||||||
Verizon Communications, Inc. | 3,822,360 | 150,600,984 | ||||||
|
| |||||||
| 274,535,700 | ||||||||
| Electric Utilities — 2.1% | ||||||||
Alliant Energy Corp. | 227,585 | 12,564,968 | ||||||
American Electric Power Co., Inc. | 468,333 | 44,468,218 | ||||||
Constellation Energy Corp. | 296,360 | 25,549,196 | ||||||
Duke Energy Corp. | 700,785 | 72,173,847 | ||||||
Edison International | 345,218 | 21,962,769 | ||||||
| Security | Shares | Value | ||||||
| ||||||||
Electric Utilities (continued) | ||||||||
Entergy Corp. | 184,105 | $ | 20,711,812 | |||||
Evergy, Inc. | 208,077 | 13,094,286 | ||||||
Eversource Energy | 313,551 | 26,288,116 | ||||||
Exelon Corp. | 905,553 | 39,147,056 | ||||||
FirstEnergy Corp. | 491,288 | 20,604,619 | ||||||
NextEra Energy, Inc.(b) | 1,809,156 | 151,245,441 | ||||||
NRG Energy, Inc. | 216,695 | 6,895,235 | ||||||
PG&E Corp.(a)(b) | 1,457,153 | 23,693,308 | ||||||
Pinnacle West Capital Corp. | 101,647 | 7,729,238 | ||||||
PPL Corp. | 674,518 | 19,709,416 | ||||||
Southern Co. | 991,151 | 70,778,093 | ||||||
Xcel Energy, Inc. | 499,491 | 35,019,314 | ||||||
|
| |||||||
| 611,634,932 | ||||||||
| Electrical Equipment — 0.6% | ||||||||
AMETEK, Inc. | 207,781 | 29,031,161 | ||||||
Eaton Corp. PLC | 362,512 | 56,896,258 | ||||||
Emerson Electric Co. | 538,341 | 51,713,037 | ||||||
Generac Holdings, Inc.(a)(b) | 58,692 | 5,907,937 | ||||||
Rockwell Automation, Inc. | 104,493 | 26,914,262 | ||||||
|
| |||||||
| 170,462,655 | ||||||||
| Electronic Equipment, Instruments & Components — 0.6% | ||||||||
Amphenol Corp., Class A | 542,182 | 41,281,737 | ||||||
CDW Corp. | 122,403 | 21,858,728 | ||||||
Corning, Inc. | 688,556 | 21,992,479 | ||||||
Keysight Technologies, Inc.(a) | 163,103 | 27,902,030 | ||||||
TE Connectivity Ltd. | 291,892 | 33,509,202 | ||||||
Teledyne Technologies, Inc.(a)(b) | 42,839 | 17,131,744 | ||||||
Trimble, Inc.(a) | 223,646 | 11,307,542 | ||||||
Zebra Technologies Corp., Class A(a) | 47,349 | 12,140,757 | ||||||
|
| |||||||
| 187,124,219 | ||||||||
| Energy Equipment & Services — 0.4% | ||||||||
Baker Hughes Co. | 915,696 | 27,040,503 | ||||||
Halliburton Co. | 828,836 | 32,614,696 | ||||||
Schlumberger Ltd. | 1,287,302 | 68,819,165 | ||||||
|
| |||||||
| 128,474,364 | ||||||||
| Entertainment — 1.3% | ||||||||
Activision Blizzard, Inc. | 648,382 | 49,633,642 | ||||||
Electronic Arts, Inc. | 241,406 | 29,494,985 | ||||||
Live Nation Entertainment, Inc.(a) | 130,925 | 9,130,709 | ||||||
Netflix, Inc.(a) | 404,748 | 119,352,090 | ||||||
Take-Two Interactive Software, Inc.(a) | 141,989 | 14,785,315 | ||||||
Walt Disney Co.(a)(b) | 1,659,252 | 144,155,814 | ||||||
Warner Bros Discovery, Inc., Class A(a) | 1,999,372 | 18,954,047 | ||||||
|
| |||||||
| 385,506,602 | ||||||||
| Equity Real Estate Investment Trusts (REITs) — 2.6% | ||||||||
Alexandria Real Estate Equities, Inc. | 135,351 | 19,716,580 | ||||||
American Tower Corp. | 423,753 | 89,776,311 | ||||||
AvalonBay Communities, Inc. | 126,555 | 20,441,164 | ||||||
Boston Properties, Inc. | 129,325 | 8,739,783 | ||||||
Camden Property Trust | 97,493 | 10,907,517 | ||||||
Crown Castle, Inc. | 394,158 | 53,463,591 | ||||||
Digital Realty Trust, Inc. | 262,877 | 26,358,677 | ||||||
Equinix, Inc. | 82,896 | 54,299,367 | ||||||
Equity Residential | 309,475 | 18,259,025 | ||||||
Essex Property Trust, Inc. | 59,575 | 12,625,134 | ||||||
Extra Space Storage, Inc. | 121,198 | 17,837,922 | ||||||
Federal Realty Investment Trust | 67,063 | 6,776,046 | ||||||
Healthpeak Properties, Inc. | 491,148 | 12,313,080 | ||||||
Host Hotels & Resorts, Inc. | 655,790 | 10,525,429 | ||||||
Invitation Homes, Inc. | 524,791 | 15,554,805 | ||||||
MASTER PORTFOLIO SCHEDULE OF INVESTMENTS | 3 |
Schedule of Investments (continued) December 31, 2022 | S&P 500 Index Master Portfolio (Percentages shown are based on Net Assets) |
| Security | Shares | Value | ||||||
| ||||||||
Equity Real Estate Investment Trusts (REITs) (continued) |
| |||||||
Iron Mountain, Inc. | 262,161 | $ | 13,068,726 | |||||
Kimco Realty Corp. | 565,139 | 11,969,644 | ||||||
Mid-America Apartment Communities, Inc. | 105,820 | 16,612,682 | ||||||
Prologis, Inc. | 840,292 | 94,726,117 | ||||||
Public Storage | 144,028 | 40,355,205 | ||||||
Realty Income Corp. | 563,686 | 35,754,603 | ||||||
Regency Centers Corp. | 140,786 | 8,799,125 | ||||||
SBA Communications Corp.(b) | 97,725 | 27,393,295 | ||||||
Simon Property Group, Inc. | 298,893 | 35,113,950 | ||||||
UDR, Inc. | 274,319 | 10,624,375 | ||||||
Ventas, Inc. | 359,643 | 16,201,917 | ||||||
VICI Properties, Inc. | 881,221 | 28,551,560 | ||||||
Vornado Realty Trust | 145,493 | 3,027,709 | ||||||
Welltower, Inc. | 423,857 | 27,783,826 | ||||||
Weyerhaeuser Co. | 670,040 | 20,771,240 | ||||||
|
| |||||||
| 768,348,405 | ||||||||
| Food & Staples Retailing — 1.5% | ||||||||
Costco Wholesale Corp. | 403,162 | 184,043,453 | ||||||
Kroger Co. | 589,337 | 26,272,644 | ||||||
Sysco Corp. | 464,696 | 35,526,009 | ||||||
Walgreens Boots Alliance, Inc. | 649,228 | 24,255,158 | ||||||
Walmart, Inc. | 1,284,972 | 182,196,180 | ||||||
|
| |||||||
| 452,293,444 | ||||||||
| Food Products — 1.2% | ||||||||
Archer-Daniels-Midland Co. | 500,125 | 46,436,606 | ||||||
Campbell Soup Co. | 184,464 | 10,468,332 | ||||||
Conagra Brands, Inc. | 437,146 | 16,917,550 | ||||||
General Mills, Inc. | 542,982 | 45,529,041 | ||||||
Hershey Co. | 132,926 | 30,781,674 | ||||||
Hormel Foods Corp. | 264,660 | 12,055,263 | ||||||
J M Smucker Co. | 97,657 | 15,474,728 | ||||||
Kellogg Co. | 231,570 | 16,497,047 | ||||||
Kraft Heinz Co. | 720,911 | 29,348,287 | ||||||
Lamb Weston Holdings, Inc. | 132,469 | 11,837,430 | ||||||
McCormick & Co., Inc. | 226,760 | 18,796,136 | ||||||
Mondelez International, Inc., Class A | 1,247,417 | 83,140,343 | ||||||
Tyson Foods, Inc., Class A | 263,622 | 16,410,470 | ||||||
|
| |||||||
| 353,692,907 | ||||||||
| Gas Utilities — 0.1% | ||||||||
Atmos Energy Corp. | 126,610 | 14,189,183 | ||||||
|
| |||||||
| Health Care Equipment & Supplies — 2.8% | ||||||||
Abbott Laboratories | 1,587,386 | 174,279,109 | ||||||
Align Technology, Inc.(a) | 66,161 | 13,953,355 | ||||||
Baxter International, Inc. | 457,033 | 23,294,972 | ||||||
Becton Dickinson and Co. | 259,570 | 66,008,651 | ||||||
Boston Scientific Corp.(a) | 1,302,980 | 60,288,885 | ||||||
Cooper Cos., Inc.(b) | 44,652 | 14,765,077 | ||||||
Dentsply Sirona, Inc. | 193,068 | 6,147,285 | ||||||
Dexcom, Inc.(a)(b) | 351,657 | 39,821,639 | ||||||
Edwards Lifesciences Corp.(a)(b) | 565,119 | 42,163,529 | ||||||
Hologic, Inc.(a) | 225,950 | 16,903,319 | ||||||
IDEXX Laboratories, Inc.(a) | 76,061 | 31,029,846 | ||||||
Intuitive Surgical, Inc.(a) | 321,729 | 85,370,790 | ||||||
Medtronic PLC | 1,209,321 | 93,988,428 | ||||||
ResMed, Inc. | 132,523 | 27,582,012 | ||||||
STERIS PLC(b) | 90,921 | 16,792,199 | ||||||
Stryker Corp. | 306,452 | 74,924,449 | ||||||
| Security | Shares | Value | ||||||
| ||||||||
Health Care Equipment & Supplies (continued) |
| |||||||
Teleflex, Inc. | 43,227 | $ | 10,790,756 | |||||
Zimmer Biomet Holdings, Inc. | 190,974 | 24,349,185 | ||||||
|
| |||||||
| 822,453,486 | ||||||||
| Health Care Providers & Services — 3.7% | ||||||||
AmerisourceBergen Corp. | 147,401 | 24,425,820 | ||||||
Cardinal Health, Inc. | 238,652 | 18,345,179 | ||||||
Centene Corp.(a) | 515,535 | 42,279,025 | ||||||
Cigna Corp. | 277,701 | 92,013,449 | ||||||
CVS Health Corp. | 1,194,868 | 111,349,749 | ||||||
DaVita, Inc.(a)(b) | 49,430 | 3,690,938 | ||||||
Elevance Health, Inc. | 218,436 | 112,051,115 | ||||||
HCA Healthcare, Inc. | 193,044 | 46,322,838 | ||||||
Henry Schein, Inc.(a)(b) | 125,852 | 10,051,799 | ||||||
Humana, Inc. | 115,183 | 58,995,581 | ||||||
Laboratory Corp. of America Holdings | 80,663 | 18,994,523 | ||||||
McKesson Corp. | 129,091 | 48,424,616 | ||||||
Molina Healthcare, Inc.(a) | 52,923 | 17,476,233 | ||||||
Quest Diagnostics, Inc. | 103,685 | 16,220,482 | ||||||
UnitedHealth Group, Inc. | 851,337 | 451,361,851 | ||||||
Universal Health Services, Inc., Class B(b) | 58,270 | 8,209,660 | ||||||
|
| |||||||
| 1,080,212,858 | ||||||||
| Hotels, Restaurants & Leisure — 2.0% | ||||||||
Booking Holdings, Inc.(a) | 35,314 | 71,167,598 | ||||||
Caesars Entertainment, Inc.(a) | 194,060 | 8,072,896 | ||||||
Carnival Corp.(a)(b) | 898,245 | 7,239,855 | ||||||
Chipotle Mexican Grill, Inc.(a)(b) | 25,328 | 35,142,347 | ||||||
Darden Restaurants, Inc. | 112,171 | 15,516,614 | ||||||
Domino’s Pizza, Inc. | 32,684 | 11,321,738 | ||||||
Expedia Group, Inc.(a) | 137,600 | 12,053,760 | ||||||
Hilton Worldwide Holdings, Inc. | 246,229 | 31,113,496 | ||||||
Las Vegas Sands Corp.(a)(b) | 299,226 | 14,383,794 | ||||||
Marriott International, Inc., Class A | 244,957 | 36,471,648 | ||||||
McDonald’s Corp. | 666,814 | 175,725,493 | ||||||
MGM Resorts International | 297,744 | 9,983,356 | ||||||
Norwegian Cruise Line Holdings Ltd.(a)(b) | 388,617 | 4,756,672 | ||||||
Royal Caribbean Cruises Ltd.(a) | 201,766 | 9,973,293 | ||||||
Starbucks Corp. | 1,044,303 | 103,594,858 | ||||||
Wynn Resorts Ltd.(a)(b) | 94,780 | 7,816,507 | ||||||
Yum! Brands, Inc. | 256,455 | 32,846,756 | ||||||
|
| |||||||
| 587,180,681 | ||||||||
| Household Durables — 0.3% | ||||||||
D.R. Horton, Inc. | 287,799 | 25,654,403 | ||||||
Garmin Ltd. | 139,008 | 12,829,048 | ||||||
Lennar Corp., Class A | 231,595 | 20,959,347 | ||||||
Mohawk Industries, Inc.(a) | 47,669 | 4,872,725 | ||||||
Newell Brands, Inc. | 341,632 | 4,468,547 | ||||||
NVR, Inc.(a) | 2,735 | 12,615,406 | ||||||
PulteGroup, Inc. | 212,784 | 9,688,056 | ||||||
Whirlpool Corp. | 48,886 | 6,915,414 | ||||||
|
| |||||||
| 98,002,946 | ||||||||
| Household Products — 1.6% | ||||||||
Church & Dwight Co., Inc. | 220,160 | 17,747,098 | ||||||
Clorox Co. | 112,871 | 15,839,187 | ||||||
Colgate-Palmolive Co. | 759,172 | 59,815,162 | ||||||
Kimberly-Clark Corp. | 307,914 | 41,799,325 | ||||||
Procter & Gamble Co. | 2,157,425 | 326,979,333 | ||||||
|
| |||||||
| 462,180,105 | ||||||||
| 4 | 2 0 2 2 BLACK ROCK ANNUAL REPORT TO SHAREHOLDERS |
Schedule of Investments (continued) December 31, 2022 | S&P 500 Index Master Portfolio (Percentages shown are based on Net Assets) |
| Security | Shares | Value | ||||||
| ||||||||
Independent Power and Renewable Electricity Producers — 0.1% | ||||||||
AES Corp. | 608,757 | $ | 17,507,852 | |||||
|
| |||||||
| Industrial Conglomerates — 0.9% | ||||||||
3M Co. | 503,870 | 60,424,090 | ||||||
General Electric Co.(b) | 998,025 | 83,624,515 | ||||||
Honeywell International, Inc. | 613,159 | 131,399,974 | ||||||
|
| |||||||
| 275,448,579 | ||||||||
| Insurance — 2.4% | ||||||||
Aflac, Inc. | 515,142 | 37,059,316 | ||||||
Allstate Corp. | 241,453 | 32,741,027 | ||||||
American International Group, Inc. | 676,425 | 42,777,117 | ||||||
Aon PLC, Class A | 188,323 | 56,523,265 | ||||||
Arch Capital Group Ltd.(a) | 334,987 | 21,030,484 | ||||||
Arthur J Gallagher & Co. | 191,964 | 36,192,893 | ||||||
Assurant, Inc. | 47,910 | 5,991,625 | ||||||
Brown & Brown, Inc. | 216,073 | 12,309,679 | ||||||
Chubb Ltd. | 377,870 | 83,358,122 | ||||||
Cincinnati Financial Corp. | 145,070 | 14,853,717 | ||||||
Everest Re Group Ltd. | 35,420 | 11,733,583 | ||||||
Globe Life, Inc. | 83,336 | 10,046,155 | ||||||
Hartford Financial Services Group, Inc. | 292,462 | 22,177,393 | ||||||
Lincoln National Corp. | 142,833 | 4,387,830 | ||||||
Loews Corp. | 183,967 | 10,730,795 | ||||||
Marsh & McLennan Cos., Inc. | 454,180 | 75,157,706 | ||||||
MetLife, Inc. | 600,030 | 43,424,171 | ||||||
Principal Financial Group, Inc.(b) | 207,172 | 17,385,874 | ||||||
Progressive Corp. | 532,359 | 69,052,286 | ||||||
Prudential Financial, Inc. | 336,681 | 33,486,292 | ||||||
Travelers Cos., Inc. | 213,355 | 40,001,929 | ||||||
W R Berkley Corp. | 187,309 | 13,593,014 | ||||||
Willis Towers Watson PLC | 99,525 | 24,341,825 | ||||||
|
| |||||||
| 718,356,098 | ||||||||
| Interactive Media & Services(a) — 3.9% | ||||||||
Alphabet, Inc., Class A | 5,437,945 | 479,789,887 | ||||||
Alphabet, Inc., Class C | 4,820,516 | 427,724,385 | ||||||
Match Group, Inc. | 259,464 | 10,765,161 | ||||||
Meta Platforms, Inc., Class A | 2,047,238 | 246,364,621 | ||||||
|
| |||||||
| 1,164,644,054 | ||||||||
| Internet & Direct Marketing Retail — 2.4% | ||||||||
Amazon.com, Inc.(a) | 8,066,795 | 677,610,780 | ||||||
eBay, Inc. | 497,210 | 20,619,299 | ||||||
Etsy, Inc.(a)(b) | 115,093 | 13,785,839 | ||||||
|
| |||||||
| 712,015,918 | ||||||||
| IT Services — 4.4% | ||||||||
Accenture PLC, Class A | 573,638 | 153,069,564 | ||||||
Akamai Technologies, Inc.(a) | 143,866 | 12,127,904 | ||||||
Automatic Data Processing, Inc. | 378,182 | 90,332,553 | ||||||
Broadridge Financial Solutions, Inc. | 107,449 | 14,412,134 | ||||||
Cognizant Technology Solutions Corp., Class A | 468,625 | 26,800,664 | ||||||
DXC Technology Co.(a) | 212,880 | 5,641,320 | ||||||
EPAM Systems, Inc.(a) | 52,068 | 17,064,766 | ||||||
Fidelity National Information Services, Inc. | 540,225 | 36,654,266 | ||||||
Fiserv, Inc.(a) | 578,143 | 58,432,913 | ||||||
FleetCor Technologies, Inc.(a) | 68,149 | 12,517,608 | ||||||
Gartner, Inc.(a) | 71,585 | 24,062,582 | ||||||
Global Payments, Inc. | 246,179 | 24,450,498 | ||||||
International Business Machines Corp. | 822,027 | 115,815,384 | ||||||
Jack Henry & Associates, Inc. | 66,175 | 11,617,683 | ||||||
Mastercard, Inc., Class A | 772,842 | 268,740,349 | ||||||
Paychex, Inc. | 292,419 | 33,791,940 | ||||||
| Security | Shares | Value | ||||||
| ||||||||
IT Services (continued) | ||||||||
PayPal Holdings, Inc.(a) | 1,037,905 | $ | 73,919,594 | |||||
VeriSign, Inc.(a) | 84,410 | 17,341,190 | ||||||
Visa, Inc., Class A | 1,488,105 | 309,168,695 | ||||||
|
| |||||||
| 1,305,961,607 | ||||||||
| Leisure Products — 0.0% | ||||||||
Hasbro, Inc. | 116,181 | 7,088,203 | ||||||
|
| |||||||
| Life Sciences Tools & Services — 1.9% | ||||||||
Agilent Technologies, Inc. | 269,522 | 40,333,967 | ||||||
Bio-Rad Laboratories, Inc., Class A(a) | 19,866 | 8,353,454 | ||||||
Bio-Techne Corp. | 143,852 | 11,922,454 | ||||||
Charles River Laboratories International, | 46,558 | 10,144,988 | ||||||
Danaher Corp. | 595,874 | 158,156,877 | ||||||
Illumina, Inc.(a) | 143,492 | 29,014,082 | ||||||
IQVIA Holdings, Inc.(a) | 170,153 | 34,862,648 | ||||||
Mettler-Toledo International, Inc.(a) | 20,370 | 29,443,817 | ||||||
PerkinElmer, Inc. | 114,240 | 16,018,733 | ||||||
Thermo Fisher Scientific, Inc. | 356,586 | 196,368,344 | ||||||
Waters Corp.(a) | 54,191 | 18,564,753 | ||||||
West Pharmaceutical Services, Inc. | 67,210 | 15,817,874 | ||||||
|
| |||||||
| 569,001,991 | ||||||||
| Machinery — 1.9% | ||||||||
Caterpillar, Inc. | 473,791 | 113,501,372 | ||||||
Cummins, Inc.(b) | 128,825 | 31,213,009 | ||||||
Deere & Co. | 250,053 | 107,212,724 | ||||||
Dover Corp. | 127,781 | 17,302,825 | ||||||
Fortive Corp. | 321,926 | 20,683,746 | ||||||
IDEX Corp. | 68,839 | 15,718,009 | ||||||
Illinois Tool Works, Inc. | 254,498 | 56,065,909 | ||||||
Ingersoll Rand, Inc. | 366,262 | 19,137,190 | ||||||
Nordson Corp. | 49,465 | 11,758,820 | ||||||
Otis Worldwide Corp. | 384,210 | 30,087,485 | ||||||
PACCAR, Inc. | 317,634 | 31,436,237 | ||||||
Parker-Hannifin Corp. | 117,163 | 34,094,433 | ||||||
Pentair PLC | 150,378 | 6,764,002 | ||||||
Snap-on, Inc. | 48,648 | 11,115,582 | ||||||
Stanley Black & Decker, Inc. | 134,067 | 10,071,113 | ||||||
Westinghouse Air Brake Technologies Corp. | 165,252 | 16,493,802 | ||||||
Xylem, Inc.(b) | 163,075 | 18,031,203 | ||||||
|
| |||||||
| 550,687,461 | ||||||||
| Media — 0.8% | ||||||||
Charter Communications, Inc., Class A(a) | 97,792 | 33,161,267 | ||||||
Comcast Corp., Class A | 3,927,524 | 137,345,514 | ||||||
DISH Network Corp., Class A(a)(b) | 234,973 | 3,299,021 | ||||||
Fox Corp., Class A | 278,201 | 8,448,964 | ||||||
Fox Corp., Class B | 124,777 | 3,549,906 | ||||||
Interpublic Group of Cos., Inc. | 359,717 | 11,982,173 | ||||||
News Corp., Class A | 353,668 | 6,436,758 | ||||||
News Corp., Class B | 114,231 | 2,106,420 | ||||||
Omnicom Group, Inc. | 185,395 | 15,122,670 | ||||||
Paramount Global, Class B(b) | 463,480 | 7,823,542 | ||||||
|
| |||||||
| 229,276,235 | ||||||||
| Metals & Mining — 0.4% | ||||||||
Freeport-McMoRan, Inc. | 1,302,333 | 49,488,654 | ||||||
Newmont Corp. | 724,983 | 34,219,197 | �� | |||||
Nucor Corp. | 233,563 | 30,785,939 | ||||||
Steel Dynamics, Inc. | 151,888 | 14,839,458 | ||||||
|
| |||||||
| 129,333,248 | ||||||||
MASTER PORTFOLIO SCHEDULE OF INVESTMENTS | 5 |
Schedule of Investments (continued) December 31, 2022 | S&P 500 Index Master Portfolio (Percentages shown are based on Net Assets) |
| Security | Shares | Value | ||||||
| ||||||||
Multiline Retail — 0.5% | ||||||||
Dollar General Corp. | 206,627 | $ | 50,881,899 | |||||
Dollar Tree, Inc.(a) | 192,863 | 27,278,543 | ||||||
Target Corp. | 419,033 | 62,452,678 | ||||||
|
| |||||||
| 140,613,120 | ||||||||
| Multi-Utilities — 0.9% | ||||||||
Ameren Corp. | 234,237 | 20,828,354 | ||||||
CenterPoint Energy, Inc. | 569,737 | 17,086,413 | ||||||
CMS Energy Corp. | 262,644 | 16,633,245 | ||||||
Consolidated Edison, Inc. | 324,232 | 30,902,552 | ||||||
Dominion Energy, Inc. | 758,542 | 46,513,795 | ||||||
DTE Energy Co. | 175,345 | 20,608,298 | ||||||
NiSource, Inc. | 375,260 | 10,289,629 | ||||||
Public Service Enterprise Group, Inc. | 451,497 | 27,663,221 | ||||||
Sempra Energy | 286,393 | 44,259,174 | ||||||
WEC Energy Group, Inc. | 286,040 | 26,819,110 | ||||||
|
| |||||||
| 261,603,791 | ||||||||
| Oil, Gas & Consumable Fuels — 4.7% | ||||||||
APA Corp. | 296,215 | 13,827,316 | ||||||
Chevron Corp. | 1,619,592 | 290,700,568 | ||||||
ConocoPhillips | 1,134,449 | 133,864,982 | ||||||
Coterra Energy, Inc. | 717,837 | 17,637,255 | ||||||
Devon Energy Corp. | 596,876 | 36,713,843 | ||||||
Diamondback Energy, Inc. | 160,876 | 22,004,619 | ||||||
EOG Resources, Inc. | 533,387 | 69,084,284 | ||||||
EQT Corp. | 335,322 | 11,343,943 | ||||||
Exxon Mobil Corp. | 3,749,381 | 413,556,724 | ||||||
Hess Corp. | 254,262 | 36,059,437 | ||||||
Kinder Morgan, Inc. | 1,810,850 | 32,740,168 | ||||||
Marathon Oil Corp. | 578,179 | 15,651,306 | ||||||
Marathon Petroleum Corp. | 426,679 | 49,661,169 | ||||||
Occidental Petroleum Corp.(b) | 661,996 | 41,699,128 | ||||||
ONEOK, Inc. | 404,436 | 26,571,445 | ||||||
Phillips 66 | 430,294 | 44,785,000 | ||||||
Pioneer Natural Resources Co. | 217,222 | 49,611,333 | ||||||
Targa Resources Corp. | 205,339 | 15,092,417 | ||||||
Valero Energy Corp. | 356,565 | 45,233,836 | ||||||
Williams Cos., Inc. | 1,111,805 | 36,578,384 | ||||||
|
| |||||||
| 1,402,417,157 | ||||||||
| Personal Products — 0.2% | ||||||||
Estee Lauder Cos., Inc., Class A | 211,156 | 52,389,915 | ||||||
|
| |||||||
| Pharmaceuticals — 4.8% | ||||||||
Bristol-Myers Squibb Co. | 1,943,397 | 139,827,414 | ||||||
Catalent, Inc.(a) | 166,156 | 7,478,682 | ||||||
Eli Lilly & Co. | 717,784 | 262,594,098 | ||||||
Johnson & Johnson | 2,380,281 | 420,476,639 | ||||||
Merck & Co., Inc. | 2,305,659 | 255,812,866 | ||||||
Organon & Co. | 229,346 | 6,405,634 | ||||||
Pfizer, Inc. | 5,108,068 | 261,737,404 | ||||||
Viatris, Inc. | 1,097,456 | 12,214,685 | ||||||
Zoetis, Inc. | 426,076 | 62,441,438 | ||||||
|
| |||||||
| 1,428,988,860 | ||||||||
| Professional Services — 0.4% | ||||||||
CoStar Group, Inc.(a) | 362,069 | 27,980,692 | ||||||
Equifax, Inc.(b) | 110,779 | 21,531,007 | ||||||
Jacobs Solutions, Inc. | 116,520 | 13,990,557 | ||||||
Leidos Holdings, Inc. | 123,695 | 13,011,477 | ||||||
| Security | Shares | Value | ||||||
| ||||||||
Professional Services (continued) | ||||||||
Robert Half International, Inc.(b) | 99,063 | $ | 7,313,821 | |||||
Verisk Analytics, Inc. | 142,058 | 25,061,872 | ||||||
|
| |||||||
| 108,889,426 | ||||||||
| Real Estate Management & Development — 0.1% | ||||||||
CBRE Group, Inc., Class A(a) | 287,647 | 22,137,313 | ||||||
|
| |||||||
| Road & Rail — 0.9% | ||||||||
CSX Corp. | 1,914,077 | 59,298,105 | ||||||
JB Hunt Transport Services, Inc. | 74,860 | 13,052,590 | ||||||
Norfolk Southern Corp. | 210,775 | 51,939,176 | ||||||
Old Dominion Freight Line, Inc.(b) | 82,953 | 23,540,402 | ||||||
Union Pacific Corp. | 559,728 | 115,902,877 | ||||||
|
| |||||||
| 263,733,150 | ||||||||
| Semiconductors & Semiconductor Equipment — 5.0% | ||||||||
Advanced Micro Devices, Inc.(a) | 1,469,270 | 95,164,618 | ||||||
Analog Devices, Inc. | 468,268 | 76,810,000 | ||||||
Applied Materials, Inc. | 783,243 | 76,272,203 | ||||||
Broadcom, Inc. | 367,534 | 205,499,285 | ||||||
Enphase Energy, Inc.(a) | 123,589 | 32,746,141 | ||||||
First Solar, Inc.(a) | 90,262 | 13,520,345 | ||||||
Intel Corp. | 3,737,066 | 98,770,654 | ||||||
KLA Corp. | 129,159 | 48,696,818 | ||||||
Lam Research Corp. | 124,667 | 52,397,540 | ||||||
Microchip Technology, Inc. | 504,142 | 35,415,976 | ||||||
Micron Technology, Inc. | 989,782 | 49,469,304 | ||||||
Monolithic Power Systems, Inc. | 40,785 | 14,421,984 | ||||||
NVIDIA Corp.(b) | 2,266,948 | 331,291,781 | ||||||
NXP Semiconductors NV | 235,922 | 37,282,754 | ||||||
ON Semiconductor Corp.(a) | 392,104 | 24,455,527 | ||||||
Qorvo, Inc.(a) | 94,933 | 8,604,727 | ||||||
Qualcomm, Inc. | 1,022,096 | 112,369,234 | ||||||
Skyworks Solutions, Inc. | 147,286 | 13,422,173 | ||||||
SolarEdge Technologies, Inc.(a) | 50,529 | 14,313,350 | ||||||
Teradyne, Inc.(b) | 142,480 | 12,445,628 | ||||||
Texas Instruments, Inc. | 826,273 | 136,516,825 | ||||||
|
| |||||||
| 1,489,886,867 | ||||||||
| Software — 8.3% | ||||||||
Adobe, Inc.(a) | 423,255 | 142,438,005 | ||||||
ANSYS, Inc.(a) | 78,802 | 19,037,775 | ||||||
Autodesk, Inc.(a) | 198,014 | 37,002,876 | ||||||
Cadence Design Systems, Inc.(a) | 249,661 | 40,105,543 | ||||||
Ceridian HCM Holding, Inc.(a)(b) | 140,965 | 9,042,905 | ||||||
Fortinet, Inc.(a) | 597,872 | 29,229,962 | ||||||
Gen Digital, Inc. | 527,781 | 11,310,347 | ||||||
Intuit, Inc. | 256,732 | 99,925,229 | ||||||
Microsoft Corp. | 6,787,782 | 1,627,845,879 | ||||||
Oracle Corp. | 1,382,521 | 113,007,267 | ||||||
Paycom Software, Inc.(a) | 44,246 | 13,729,976 | ||||||
PTC, Inc.(a) | 96,012 | 11,525,281 | ||||||
Roper Technologies, Inc.(b) | 96,647 | 41,760,202 | ||||||
Salesforce, Inc.(a) | 905,597 | 120,073,106 | ||||||
ServiceNow, Inc.(a) | 183,850 | 71,383,440 | ||||||
Synopsys, Inc.(a) | 139,361 | 44,496,574 | ||||||
Tyler Technologies, Inc.(a) | 38,201 | 12,316,384 | ||||||
|
| |||||||
| 2,444,230,751 | ||||||||
| Specialty Retail — 2.4% | ||||||||
Advance Auto Parts, Inc. | 54,557 | 8,021,516 | ||||||
AutoZone, Inc.(a) | 17,281 | 42,618,057 | ||||||
Bath & Body Works, Inc. | 208,330 | 8,779,026 | ||||||
| 6 | 2 0 2 2 BLACK ROCK ANNUAL REPORT TO SHAREHOLDERS |
Schedule of Investments (continued) December 31, 2022 | S&P 500 Index Master Portfolio (Percentages shown are based on Net Assets) |
Security
| Shares
| Value
| ||||||
| ||||||||
Specialty Retail (continued) | ||||||||
Best Buy Co., Inc. | 184,618 | $ | 14,808,210 | |||||
CarMax, Inc.(a)(b) | 143,103 | 8,713,542 | ||||||
Home Depot, Inc. | 932,022 | 294,388,469 | ||||||
Lowe’s Cos., Inc. | 565,099 | 112,590,325 | ||||||
O’Reilly Automotive, Inc.(a) | 56,971 | 48,085,233 | ||||||
Ross Stores, Inc. | 319,841 | 37,123,945 | ||||||
TJX Cos., Inc. | 1,057,047 | 84,140,941 | ||||||
Tractor Supply Co. | 100,461 | 22,600,711 | ||||||
Ulta Beauty, Inc.(a) | 47,022 | 22,056,609 | ||||||
|
| |||||||
| 703,926,584 | ||||||||
| Technology Hardware, Storage & Peripherals — 6.2% | ||||||||
Apple, Inc. | 13,614,100 | 1,768,880,013 | ||||||
Hewlett Packard Enterprise Co. | 1,185,109 | 18,914,340 | ||||||
HP, Inc. | 805,929 | 21,655,312 | ||||||
NetApp, Inc. | 200,639 | 12,050,378 | ||||||
Seagate Technology Holdings PLC(b) | 176,010 | 9,259,886 | ||||||
Western Digital Corp.(a) | 286,151 | 9,028,064 | ||||||
|
| |||||||
| 1,839,787,993 | ||||||||
| Textiles, Apparel & Luxury Goods — 0.5% | ||||||||
NIKE, Inc., Class B | 1,150,111 | 134,574,488 | ||||||
Ralph Lauren Corp. | 37,193 | 3,930,185 | ||||||
Tapestry, Inc. | 219,376 | 8,353,838 | ||||||
VF Corp. | 305,300 | 8,429,333 | ||||||
|
| |||||||
| 155,287,844 | ||||||||
| Tobacco — 0.7% | ||||||||
Altria Group, Inc. | 1,639,015 | 74,919,376 | ||||||
Philip Morris International, Inc. | 1,410,877 | 142,794,861 | ||||||
|
| |||||||
| 217,714,237 | ||||||||
| Trading Companies & Distributors — 0.2% | ||||||||
Fastenal Co. | 520,118 | 24,611,984 | ||||||
United Rentals, Inc.(a)(b) | 63,522 | 22,576,989 | ||||||
W.W.Grainger, Inc.(b) | 40,977 | 22,793,456 | ||||||
|
| |||||||
| 69,982,429 | ||||||||
| Water Utilities — 0.1% | ||||||||
American Water Works Co., Inc.(b) | 164,527 | 25,077,205 | ||||||
|
| |||||||
Security
| Shares
| Value
| ||||||
| ||||||||
Wireless Telecommunication Services — 0.3% |
| |||||||
T-Mobile U.S., Inc.(a) | 543,698 | $ | 76,117,720 | |||||
|
| |||||||
Total Common Stocks — 99.0% | 29,261,370,956 | |||||||
|
| |||||||
Investment Companies | ||||||||
Equity Funds — 0.7% |
| |||||||
iShares Core S&P 500 ETF(c) | 508,908 | 195,527,543 | ||||||
|
| |||||||
Total Investment Companies — 0.7% | 195,527,543 | |||||||
|
| |||||||
Total Long-Term Investments — 99.7% |
| 29,456,898,499 | ||||||
|
| |||||||
Short-Term Securities | ||||||||
| Money Market Funds — 1.4% | ||||||||
BlackRock Cash Funds: Institutional, SL Agency Shares, 4.53%(c)(d)(e) | 304,107,516 | 304,198,748 | ||||||
BlackRock Cash Funds: Treasury, SL Agency Shares, 4.12%(c)(d) | 113,361,188 | 113,361,188 | ||||||
|
| |||||||
Total Short-Term Securities — 1.4% | 417,559,936 | |||||||
|
| |||||||
Total Investments — 101.1% | 29,874,458,435 | |||||||
Liabilities in Excess of Other Assets — (1.1)% |
| (329,613,066 | ) | |||||
|
| |||||||
Net Assets — 100.0% | $ | 29,544,845,369 | ||||||
|
| |||||||
| (a) | Non-income producing security. |
| (b) | All or a portion of this security is on loan. |
| (c) | Affiliate of the Master Portfolio. |
| (d) | Annualized 7-day yield as of period end. |
| (e) | All or a portion of this security was purchased with the cash collateral from loaned securities. |
For Master Portfolio compliance purposes, the Master Portfolio’s industry classifications refer to one or more of the industry sub-classifications used by one or more widely recognized market indexes or rating group indexes, and/or as defined by the investment adviser. These definitions may not apply for purposes of this report, which may combine such industry sub-classifications for reporting ease.
MASTER PORTFOLIO SCHEDULE OF INVESTMENTS | 7 |
Schedule of Investments (continued) December 31, 2022 | S&P 500 Index Master Portfolio |
Affiliates
Investments in issuers considered to be affiliate(s) of the Master Portfolio during the year ended December 31, 2022 for purposes of Section 2(a)(3) of the Investment Company Act of 1940, as amended, were as follows:
| ||||||||||||||||||||||||||||||||||||||||||
Affiliated Issuer
| Value at
| Purchases
| Proceeds
| Net Realized
| Change in
| Value at
| Shares
| Income | Capital Gain
| |||||||||||||||||||||||||||||||||
| ||||||||||||||||||||||||||||||||||||||||||
BlackRock Cash Funds: Institutional, SL Agency Shares | $ | 129,540,046 | $ | 174,660,838 | (a) | $ | — | $ | (119,553 | ) | $ | 117,417 | $ | 304,198,748 | 304,107,516 | $ | 529,751 | (b) | $ | — | ||||||||||||||||||||||
BlackRock Cash Funds: Treasury, SL Agency Shares | 190,825,864 | — | (77,464,676 | )(a) | — | — | 113,361,188 | 113,361,188 | 1,995,867 | — | ||||||||||||||||||||||||||||||||
BlackRock, Inc. | 110,121,726 | 11,473,824 | (599,256 | ) | (183,383 | ) | (23,573,285 | ) | 97,239,626 | 137,222 | 2,464,688 | — | ||||||||||||||||||||||||||||||
iShares Core S&P 500 ETF | 433,216,628 | 2,954,719,505 | (3,164,439,205 | ) | (7,337,546 | ) | (20,631,839 | ) | 195,527,543 | 508,908 | 3,060,996 | — | ||||||||||||||||||||||||||||||
|
|
|
|
|
|
|
|
|
| |||||||||||||||||||||||||||||||||
| $ | (7,640,482) | $ | (44,087,707 | ) | $ | 710,327,105 | $ | 8,051,302 | $ | — | ||||||||||||||||||||||||||||||||
|
|
|
|
|
|
|
|
|
| |||||||||||||||||||||||||||||||||
| (a) | Represents net amount purchased (sold). |
| (b) | All or a portion represents securities lending income earned from the reinvestment of cash collateral from loaned securities, net of fees and collateral investment expenses, and other payments to and from borrowers of securities. |
Derivative Financial Instruments Outstanding as of Period End
Futures Contracts
| ||||||||||||||||
| Description | Number of
| Expiration
| Notional
| Value/
| ||||||||||||
| ||||||||||||||||
| Long Contracts | ||||||||||||||||
S&P 500 E-Mini Index | 560 | 03/17/23 | $ | 108,108 | $ | (463,688 | ) | |||||||||
|
| |||||||||||||||
Derivative Financial Instruments Categorized by Risk Exposure
As of period end, the fair values of derivative financial instruments located in the Statement of Assets and Liabilities were as follows:
| ||||||||||||||||||||||||||||
| Commodity Contracts | Credit Contracts | Equity Contracts | Foreign Currency Exchange Contracts | Interest Rate Contracts | Other Contracts | Total | ||||||||||||||||||||||
| ||||||||||||||||||||||||||||
Liabilities — Derivative Financial Instruments |
| |||||||||||||||||||||||||||
Futures contracts | ||||||||||||||||||||||||||||
Unrealized depreciation on futures contracts(a) | $ | — | $ | — | $ | 463,688 | $ | — | $ | — | $ | — | $ | 463,688 | ||||||||||||||
|
|
|
|
|
|
|
|
|
|
|
|
|
| |||||||||||||||
| (a) | Net cumulative unrealized appreciation (depreciation) on futures contracts and centrally cleared swaps, if any, are reported in the Master Portfolio Schedule of Investments. In the Statement of Assets and Liabilities, only current day’s variation margin is reported in receivables or payables and the net cumulative unrealized appreciation (depreciation) is included in net unrealized appreciation (depreciation). |
For the period ended December 31, 2022, the effect of derivative financial instruments in the Statement of Operations was as follows:
| ||||||||||||||||||||||||||||
| Commodity Contracts | Credit Contracts | Equity Contracts | Foreign Currency Exchange Contracts | Interest Rate Contracts | Other Contracts | Total | ||||||||||||||||||||||
| ||||||||||||||||||||||||||||
Net Realized Gain (Loss) from: | ||||||||||||||||||||||||||||
Futures contracts | $ | — | $ | — | $ | (5,630,594) | $ | — | $ | — | $ | — | $ | (5,630,594) | ||||||||||||||
|
|
|
|
|
|
|
|
|
|
|
|
|
| |||||||||||||||
Net Change in Unrealized Appreciation (Depreciation) on: | ||||||||||||||||||||||||||||
Futures contracts | $ | — | $ | — | $ | (7,380,878) | $ | — | $ | — | $ | — | $ | (7,380,878) | ||||||||||||||
|
|
|
|
|
|
|
|
|
|
|
|
|
| |||||||||||||||
Average Quarterly Balances of Outstanding Derivative Financial Instruments
| ||||
Futures contracts: | ||||
Average notional value of contracts — long | $ | 139,746,994 | ||
| ||||
| 8 | 2 0 2 2 BLACK ROCK ANNUAL REPORT TO SHAREHOLDERS |
Schedule of Investments (continued) December 31, 2022 | S&P 500 Index Master Portfolio |
For more information about the Master Portfolio’s investment risks regarding derivative financial instruments, refer to the Notes to Financial Statements.
Fair Value Hierarchy as of Period End
Various inputs are used in determining the fair value of financial instruments. For a description of the input levels and information about the Master Portfolio’s policy regarding valuation of financial instruments, refer to the Notes to Financial Statements.
The following table summarizes the Master Portfolio’s financial instruments categorized in the fair value hierarchy. The breakdown of the Master Portfolio’s financial instruments into major categories is disclosed in the Schedule of Investments above.
| ||||||||||||||||
| Level 1 | Level 2 | Level 3 | Total | |||||||||||||
| ||||||||||||||||
Assets | ||||||||||||||||
Investments | ||||||||||||||||
Long-Term Investments | ||||||||||||||||
Common Stocks | $ | 29,261,370,956 | $ | — | $ | — | $ | 29,261,370,956 | ||||||||
Investment Companies | 195,527,543 | — | — | 195,527,543 | ||||||||||||
Short-Term Securities | ||||||||||||||||
Money Market Funds | 417,559,936 | — | — | 417,559,936 | ||||||||||||
|
|
|
|
|
|
|
| |||||||||
| $ | 29,874,458,435 | $ | — | $ | — | $ | 29,874,458,435 | |||||||||
|
|
|
|
|
|
|
| |||||||||
Derivative Financial Instruments(a) | ||||||||||||||||
Liabilities | ||||||||||||||||
Equity Contracts | $ | (463,688 | ) | $ | — | $ | — | $ | (463,688 | ) | ||||||
|
|
|
|
|
|
|
| |||||||||
| (a) | Derivative financial instruments are futures contracts. Futures contracts are valued at the unrealized appreciation (depreciation) on the instrument. |
See notes to financial statements.
MASTER PORTFOLIO SCHEDULE OF INVESTMENTS | 9 |
Statement of Assets and Liabilities
December 31, 2022
| S&P 500 Index Master Portfolio | ||||
| ||||
ASSETS | ||||
Investments, at value — unaffiliated(a)(b) | $ | 29,164,131,330 | ||
Investments, at value — affiliated(c) | 710,327,105 | |||
Cash | 130,560 | |||
Cash pledged for futures contracts | 9,517,800 | |||
Receivables: | ||||
Securities lending income — affiliated | 65,956 | |||
Dividends — unaffiliated | 25,181,704 | |||
Dividends — affiliated | 265,453 | |||
Prepaid expenses | 5,456 | |||
|
| |||
Total assets | 29,909,625,364 | |||
|
| |||
LIABILITIES | ||||
Collateral on securities loaned | 304,066,304 | |||
Payables: | ||||
Withdrawals to investors | 59,459,673 | |||
Investment advisory fees | 250,499 | |||
Trustees’ fees | 61,888 | |||
Professional fees | 110,499 | |||
Variation margin on futures contracts | 831,132 | |||
|
| |||
Total liabilities | 364,779,995 | |||
|
| |||
NET ASSETS | $ | 29,544,845,369 | ||
|
| |||
NET ASSETS CONSIST OF | ||||
Investors’ capital | $ | 15,492,580,359 | ||
Net unrealized appreciation (depreciation) | 14,052,265,010 | |||
|
| |||
NET ASSETS | $ | 29,544,845,369 | ||
|
| |||
(a) Investments, at cost — unaffiliated | $ | 15,162,484,039 | ||
(b) Securities loaned, at value | $ | 296,259,268 | ||
(c) Investments, at cost — affiliated | $ | 659,245,698 | ||
See notes to financial statements.
| 10 | 2 0 2 2 BLACK ROCK ANNUAL REPORT TO SHAREHOLDERS |
Statement of Operations
Year Ended December 31, 2022
| S&P 500 Index Master Portfolio | ||||
| ||||
INVESTMENT INCOME | ||||
Dividends — unaffiliated | $ | 484,410,508 | ||
Dividends — affiliated | 7,522,935 | |||
Securities lending income — affiliated — net | 528,367 | |||
Foreign taxes withheld | (2,434,029) | |||
|
| |||
Total investment income | 490,027,781 | |||
|
| |||
EXPENSES | ||||
Investment advisory | 3,053,035 | |||
Trustees | 247,024 | |||
Professional | 29,992 | |||
|
| |||
Total expenses | 3,330,051 | |||
Less: | ||||
Fees waived and/or reimbursed by the Manager | (393,144) | |||
|
| |||
Total expenses after fees waived and/or reimbursed | 2,936,907 | |||
|
| |||
Net investment income | 487,090,874 | |||
|
| |||
REALIZED AND UNREALIZED GAIN (LOSS) | ||||
Net realized loss from: | ||||
Investments — unaffiliated | (52,489,847) | |||
Investments — affiliated | (7,640,482) | |||
Futures contracts | (5,630,594) | |||
|
| |||
| (65,760,923) | ||||
|
| |||
Net change in unrealized appreciation (depreciation) on: | ||||
Investments — unaffiliated | (6,596,893,866) | |||
Investments — affiliated | (44,087,707) | |||
Futures contracts | (7,380,878) | |||
|
| |||
| (6,648,362,451) | ||||
|
| |||
Net realized and unrealized loss | (6,714,123,374) | |||
|
| |||
NET DECREASE IN NET ASSETS RESULTING FROM OPERATIONS | $ | (6,227,032,500) | ||
|
| |||
See notes to financial statements.
MASTER PORTFOLIO FINANCIAL STATEMENTS | 11 |
Statements of Changes in Net Assets
| S&P 500 Index Master Portfolio | ||||||||||||
|
| |||||||||||
Year Ended 12/31/22 | Year Ended 12/31/21 | |||||||||||
| ||||||||||||
INCREASE (DECREASE) IN NET ASSETS | ||||||||||||
OPERATIONS | ||||||||||||
Net investment income | $ | 487,090,874 | $ | 429,887,939 | ||||||||
Net realized gain (loss) | (65,760,923 | ) | 297,816,671 | |||||||||
Net change in unrealized appreciation (depreciation) | (6,648,362,451 | ) | 7,008,302,074 | |||||||||
|
|
|
| |||||||||
Net increase (decrease) in net assets resulting from operations | (6,227,032,500 | ) | 7,736,006,684 | |||||||||
|
|
|
| |||||||||
CAPITAL TRANSACTIONS | ||||||||||||
Proceeds from contributions | 8,816,188,759 | 7,697,627,774 | ||||||||||
Value of withdrawals | (7,533,596,462 | ) | (7,937,321,540 | ) | ||||||||
|
|
|
| |||||||||
Net increase (decrease) in net assets derived from capital transactions | 1,282,592,297 | (239,693,766 | ) | |||||||||
|
|
|
| |||||||||
NET ASSETS | ||||||||||||
Total increase (decrease) in net assets | (4,944,440,203 | ) | 7,496,312,918 | |||||||||
Beginning of year | 34,489,285,572 | 26,992,972,654 | ||||||||||
|
|
|
| |||||||||
End of year | $ | 29,544,845,369 | $ | 34,489,285,572 | ||||||||
|
|
|
| |||||||||
See notes to financial statements.
| 12 | 2 0 2 2 BLACK ROCK ANNUAL REPORT TO SHAREHOLDERS |
Financial Highlights
S&P 500 Index Master Portfolio
| ||||||||||||||||||||
Year Ended
| Year Ended
| Year Ended
| Year Ended
| Year Ended
| ||||||||||||||||
Total Return | ||||||||||||||||||||
Total return |
| (18.13
| )%
|
| 28.65
| %
|
| 18.42
| %
|
| 31.44
| %
|
| (4.38
| )%
| |||||
|
|
|
|
|
|
|
|
|
| |||||||||||
Ratios to Average Net Assets(a) | ||||||||||||||||||||
Total expenses |
| 0.01
| %
|
| 0.01
| %
|
| 0.01
| %
|
| 0.03
| %
|
| 0.04
| %
| |||||
|
|
|
|
|
|
|
|
|
| |||||||||||
Total expenses after fees waived and/or reimbursed |
| 0.01
| %
|
| 0.01
| %
|
| 0.01
| %
|
| 0.02
| %
|
| 0.04
| %
| |||||
|
|
|
|
|
|
|
|
|
| |||||||||||
Net investment income |
| 1.60
| %
|
| 1.39
| %
|
| 1.82
| %
|
| 1.95
| %
|
| 1.92
| %
| |||||
|
|
|
|
|
|
|
|
|
| |||||||||||
Supplemental Data | ||||||||||||||||||||
Net assets, end of year (000) | $
| 29,544,845
|
| $
| 34,489,286
|
| $
| 26,992,973
|
| $
| 23,207,958
|
| $
| 17,256,929
|
| |||||
|
|
|
|
|
|
|
|
|
| |||||||||||
Portfolio turnover rate |
| 13
| %
|
| 6
| %
|
| 5
| %
|
| 3
| %
|
| 12
| %
| |||||
|
|
|
|
|
|
|
|
|
| |||||||||||
| (a) | Excludes fees and expenses incurred indirectly as a result of investments in underlying funds. |
See notes to financial statements.
MASTER PORTFOLIO FINANCIAL HIGHLIGHTS | 13 |
Notes to Financial Statements
| 1. | ORGANIZATION |
Master Investment Portfolio (“MIP”) is registered under the Investment Company Act of 1940, as amended (the “1940 Act”), as an open-end management investment company. MIP is organized as a Delaware statutory trust. S&P 500 Index Master Portfolio (the “Master Portfolio”) is a series of MIP. The Master Portfolio is classified as diversified.
The Master Portfolio, together with certain other registered investment companies advised by BlackRock Fund Advisors (“BFA” or the “Manager”) or its affiliates, is included in a complex of funds referred to as the BlackRock Multi-Asset Complex.
| 2. | SIGNIFICANT ACCOUNTING POLICIES |
The financial statements are prepared in conformity with accounting principles generally accepted in the United States of America (“U.S. GAAP”), which may require management to make estimates and assumptions that affect the reported amounts of assets and liabilities in the financial statements, disclosure of contingent assets and liabilities at the date of the financial statements and the reported amounts of increases and decreases in net assets from operations during the reporting period. Actual results could differ from those estimates. The Master Portfolio is considered an investment company under U.S. GAAP and follows the accounting and reporting guidance applicable to investment companies. Below is a summary of significant accounting policies:
Investment Transactions and Income Recognition: For financial reporting purposes, investment transactions are recorded on the dates the transactions are executed. Realized gains and losses on investment transactions are determined using the specific identification method. Dividend income and capital gain distributions, if any, are recorded on the ex-dividend dates. Non-cash dividends, if any, are recorded on the ex-dividend dates at fair value. Dividends from foreign securities where the ex-dividend dates may have passed are subsequently recorded when the Master Portfolio is informed of the ex-dividend dates. Under the applicable foreign tax laws, a withholding tax at various rates may be imposed on capital gains, dividends and interest. Upon notification from issuers, a portion of the dividend income received from a real estate investment trust may be redesignated as a reduction of cost of the related investment and/or realized gain.
Foreign Taxes: The Master Portfolio may be subject to foreign taxes (a portion of which may be reclaimable) on income, stock dividends, capital gains on investments, or certain foreign currency transactions. All foreign taxes are recorded in accordance with the applicable foreign tax regulations and rates that exist in the foreign jurisdictions in which the Master Portfolio invests. These foreign taxes, if any, are paid by the Master Portfolio and are reflected in its Statement of Operations as follows: foreign taxes withheld at source are presented as a reduction of income, foreign taxes on securities lending income are presented as a reduction of securities lending income, foreign taxes on stock dividends are presented as “Foreign taxes withheld”, and foreign taxes on capital gains from sales of investments and foreign taxes on foreign currency transactions are included in their respective net realized gain (loss) categories. Foreign taxes payable or deferred as of December 31, 2022, if any, are disclosed in the Statement of Assets and Liabilities.
The Master Portfolio files withholding tax reclaims in certain jurisdictions to recover a portion of amounts previously withheld. The Master Portfolio may record a reclaim receivable based on collectability, which includes factors such as the jurisdiction’s applicable laws, payment history and market convention. The Statement of Operations includes tax reclaims recorded as well as professional and other fees, if any, associated with recovery of foreign withholding taxes.
Collateralization: If required by an exchange or counterparty agreement, the Master Portfolio may be required to deliver/deposit cash and/or securities to/with an exchange, or broker-dealer or custodian as collateral for certain investments.
Indemnifications: In the normal course of business, the Master Portfolio enters into contracts that contain a variety of representations that provide general indemnification. The Master Portfolio’s maximum exposure under these arrangements is unknown because it involves future potential claims against the Master Portfolio, which cannot be predicted with any certainty.
Other: Expenses directly related to the Master Portfolio are charged to the Master Portfolio. Other operating expenses shared by several funds, including other funds managed by the Manager, are prorated among those funds on the basis of relative net assets or other appropriate methods.
| 3. | INVESTMENT VALUATION AND FAIR VALUE MEASUREMENTS |
Investment Valuation Policies: The Master Portfolio’s investments are valued at fair value (also referred to as “market value” within the financial statements) each day that the Master Portfolio is open for business and, for financial reporting purposes, as of the report date. U.S. GAAP defines fair value as the price a fund would receive to sell an asset or pay to transfer a liability in an orderly transaction between market participants at the measurement date. The Board of Trustees of MIP (the “Board”) has approved the designation of the Master Portfolio’s Manager as the valuation designee for the Master Portfolio. The Master Portfolio determines the fair values of its financial instruments using various independent dealers or pricing services under the Manager’s policies. If a security’s market price is not readily available or does not otherwise accurately represent the fair value of the security, the security will be valued in accordance with the Manager’s policies and procedures as reflecting fair value. The Manager has formed a committee (the “Valuation Committee”) to develop pricing policies and procedures and to oversee the pricing function for all financial instruments, with assistance from other BlackRock pricing committees.
Fair Value Inputs and Methodologies: The following methods and inputs are used to establish the fair value of the Master Portfolio’s assets and liabilities:
| • | Equity investments traded on a recognized securities exchange are valued at that day’s official closing price, as applicable, on the exchange where the stock is primarily traded. Equity investments traded on a recognized exchange for which there were no sales on that day may be valued at the last available bid (long positions) or ask (short positions) price. |
| • | Investments in open-end U.S. mutual funds (including money market funds) are valued at that day’s published net asset value (“NAV”). |
| 14 | 2 0 2 2 BLACK ROCK ANNUAL REPORT TO SHAREHOLDERS |
Notes to Financial Statements (continued)
| • | Futures contracts are valued based on that day’s last reported settlement or trade price on the exchange where the contract is traded. |
Generally, trading in foreign instruments is substantially completed each day at various times prior to the close of trading on the New York Stock Exchange (“NYSE”). Each business day, the Master Portfolio uses current market factors supplied by independent pricing services to value certain foreign instruments (“Systematic Fair Value Price”). The Systematic Fair Value Price is designed to value such foreign securities at fair value as of the close of trading on the NYSE, which follows the close of the local markets.
If events (e.g., market volatility, company announcement or a natural disaster) occur that are expected to materially affect the value of such investment, or in the event that application of these methods of valuation results in a price for an investment that is deemed not to be representative of the market value of such investment, or if a price is not available, the investment will be valued by the Valuation Committee in accordance with the Manager’s policies and procedures as reflecting fair value (“Fair Valued Investments”). The fair valuation approaches that may be used by the Valuation Committee include market approach, income approach and cost approach. Valuation techniques such as discounted cash flow, use of market comparables and matrix pricing are types of valuation approaches and are typically used in determining fair value. When determining the price for Fair Valued Investments, the Valuation Committee seeks to determine the price that the Master Portfolio might reasonably expect to receive or pay from the current sale or purchase of that asset or liability in an arm’s-length transaction. Fair value determinations shall be based upon all available factors that the Valuation Committee deems relevant and consistent with the principles of fair value measurement.
Fair Value Hierarchy: Various inputs are used in determining the fair value of financial instruments. These inputs to valuation techniques are categorized into a fair value hierarchy consisting of three broad levels for financial reporting purposes as follows:
| • | Level 1 – Unadjusted price quotations in active markets/exchanges for identical assets or liabilities that the Master Portfolio has the ability to access; |
| • | Level 2 – Other observable inputs (including, but not limited to, quoted prices for similar assets or liabilities in markets that are active, quoted prices for identical or similar assets or liabilities in markets that are not active, inputs other than quoted prices that are observable for the assets or liabilities (such as interest rates, yield curves, volatilities, prepayment speeds, loss severities, credit risks and default rates) or other market–corroborated inputs); and |
| • | Level 3 – Unobservable inputs based on the best information available in the circumstances, to the extent observable inputs are not available (including the Valuation Committee’s assumptions used in determining the fair value of financial instruments). |
The hierarchy gives the highest priority to unadjusted quoted prices in active markets for identical assets or liabilities (Level 1 measurements) and the lowest priority to unobservable inputs (Level 3 measurements). Accordingly, the degree of judgment exercised in determining fair value is greatest for instruments categorized in Level 3. The inputs used to measure fair value may fall into different levels of the fair value hierarchy. In such cases, for disclosure purposes, the fair value hierarchy classification is determined based on the lowest level input that is significant to the fair value measurement in its entirety. Investments classified within Level 3 have significant unobservable inputs used by the Valuation Committee in determining the price for Fair Valued Investments. Level 3 investments include equity or debt issued by privately held companies or funds that may not have a secondary market and/or may have a limited number of investors. The categorization of a value determined for financial instruments is based on the pricing transparency of the financial instruments and is not necessarily an indication of the risks associated with investing in those securities.
| 4. | SECURITIES AND OTHER INVESTMENTS |
Securities Lending: The Master Portfolio may lend its securities to approved borrowers, such as brokers, dealers and other financial institutions. The borrower pledges and maintains with the Master Portfolio collateral consisting of cash, an irrevocable letter of credit issued by a bank, or securities issued or guaranteed by the U.S. Government. The initial collateral received by the Master Portfolio is required to have a value of at least 102% of the current value of the loaned securities for securities traded on U.S. exchanges and a value of at least 105% for all other securities. The collateral is maintained thereafter at a value equal to at least 100% of the current market value of the securities on loan. The market value of the loaned securities is determined at the close of each business day of the Master Portfolio and any additional required collateral is delivered to the Master Portfolio, or excess collateral returned by the Master Portfolio, on the next business day. During the term of the loan, the Master Portfolio is entitled to all distributions made on or in respect of the loaned securities, but does not receive interest income on securities received as collateral. Loans of securities are terminable at any time and the borrower, after notice, is required to return borrowed securities within the standard time period for settlement of securities transactions.
As of period end, any securities on loan were collateralized by cash and/or U.S. Government obligations. Cash collateral invested by the securities lending agent, BlackRock Institutional Trust Company, N.A. (“BTC”), if any, is disclosed in the Schedule of Investments. Any non-cash collateral received cannot be sold, re-invested or pledged by the Master Portfolio, except in the event of borrower default. The securities on loan, if any, are disclosed in the Master Portfolio’s Schedule of Investments. The market value of any securities on loan and the value of any related collateral are shown separately in the Statement of Assets and Liabilities as a component of investments at value –unaffiliated and collateral on securities loaned, respectively.
Securities lending transactions are entered into by the Master Portfolio under Master Securities Lending Agreements (each, an “MSLA”), which provide the right, in the event of default (including bankruptcy or insolvency), for the non-defaulting party to liquidate the collateral and calculate a net exposure to the defaulting party or request additional collateral. In the event that a borrower defaults, the Master Portfolio, as lender, would offset the market value of the collateral received against the market value of the securities loaned. When the value of the collateral is greater than that of the market value of the securities loaned, the lender is left with a net amount payable to the defaulting party. However, bankruptcy or insolvency laws of a particular jurisdiction may impose restrictions on or prohibitions against such a right of offset in the event of an MSLA counterparty’s bankruptcy or insolvency. Under the MSLA, absent an event of default, the borrower can resell or re-pledge the loaned securities, and the Master Portfolio can reinvest cash collateral received in connection with loaned securities. Upon an event of default, the parties’ obligations to return the securities or collateral to the other party are extinguished, and the parties can resell or re-pledge the loaned securities or the collateral received in connection with the loaned securities in order to satisfy the defaulting party’s net payment obligation for all transactions under the MSLA. The defaulting party remains liable for any deficiency.
MASTER PORTFOLIO NOTES TO FINANCIAL STATEMENTS | 15 |
Notes to Financial Statements (continued)
As of period end, the following table is a summary of the Master Portfolio’s securities on loan by counterparty which are subject to offset under an MSLA:
| ||||||||||||||||||||||||
| Securities | Cash Collateral | Non-Cash Collateral | Net | |||||||||||||||||||||
| Counterparty | Loaned at Value | Received | (a) | Received, at Fair Value | (a) | Amount | ||||||||||||||||||
| ||||||||||||||||||||||||
Barclays Bank PLC | $ 9,011,198 | $ | (9,011,198 | ) | $ | — | $ | — | ||||||||||||||||
Barclays Capital, Inc. | 317,756 | (317,756 | ) | — | — | |||||||||||||||||||
BNP Paribas SA | 82,460,125 | (82,460,125 | ) | — | — | |||||||||||||||||||
BofA Securities, Inc. | 12,280,613 | (12,280,613 | ) | — | — | |||||||||||||||||||
Citadel Clearing LLC | 6,566,531 | (6,566,531 | ) | — | — | |||||||||||||||||||
Citigroup Global Markets, Inc. | 12,618,680 | (12,618,680 | ) | — | — | |||||||||||||||||||
Goldman Sachs & Co. LLC | 14,791,319 | (14,791,319 | ) | — | — | |||||||||||||||||||
HSBC Bank PLC | 101,567 | (101,567 | ) | — | — | |||||||||||||||||||
J.P. Morgan Securities LLC | 44,791,104 | (44,791,104 | ) | — | — | |||||||||||||||||||
Jefferies LLC | 212,695 | (212,695 | ) | — | — | |||||||||||||||||||
Morgan Stanley | 19,903,906 | (19,903,906 | ) | — | — | |||||||||||||||||||
Natixis SA | 1,688 | (1,688 | ) | — | — | |||||||||||||||||||
RBC Capital Markets LLC | 28,530,588 | (28,530,588 | ) | — | — | |||||||||||||||||||
Scotia Capital (USA), Inc. | 3,301,735 | (3,301,735 | ) | — | — | |||||||||||||||||||
SG Americas Securities LLC | 962,488 | (962,488 | ) | — | — | |||||||||||||||||||
State Street Bank & Trust Co. | 2,345,460 | (2,345,460 | ) | — | — | |||||||||||||||||||
Toronto-Dominion Bank | 51,580,760 | (51,580,760 | ) | — | — | |||||||||||||||||||
UBS AG | 583,765 | (583,765 | ) | — | — | |||||||||||||||||||
UBS Securities LLC | 2,349,461 | (2,349,461 | ) | — | — | |||||||||||||||||||
Virtu Americas LLC | 993,807 | (993,807 | ) | — | — | |||||||||||||||||||
Wells Fargo Bank N.A. | 249,096 | (249,096 | ) | — | — | |||||||||||||||||||
Wells Fargo Securities LLC | 2,304,926 | (2,304,926 | ) | — | — | |||||||||||||||||||
|
|
|
|
|
|
| ||||||||||||||||||
$ 296,259,268
| $
| (296,259,268)
|
| $
| —
|
| $
| —
|
| |||||||||||||||
|
|
|
|
|
|
| ||||||||||||||||||
| (a) | Collateral received, if any, in excess of the market value of securities on loan is not presented in this table. The total cash collateral received by the Master Portfolio is disclosed in the Master Portfolio’s Statement of Assets and Liabilities. |
The risks of securities lending include the risk that the borrower may not provide additional collateral when required or may not return the securities when due. To mitigate these risks, the Master Portfolio benefits from a borrower default indemnity provided by BlackRock, Inc. (“BlackRock”). BlackRock’s indemnity allows for full replacement of the securities loaned to the extent the collateral received does not cover the value on the securities loaned in the event of borrower default. The Master Portfolio could incur a loss if the value of an investment purchased with cash collateral falls below the market value of loaned securities or if the value of an investment purchased with cash collateral falls below the value of the original cash collateral received. Such losses are borne entirely by the Master Portfolio.
| 5. | DERIVATIVE FINANCIAL INSTRUMENTS |
The Master Portfolio engages in various portfolio investment strategies using derivative contracts both to increase the returns of the Master Portfolio and/or to manage its exposure to certain risks such as credit risk, equity risk, interest rate risk, foreign currency exchange rate risk, commodity price risk or other risks (e.g., inflation risk). Derivative financial instruments categorized by risk exposure are included in the Schedule of Investments. These contracts may be transacted on an exchange or over-the-counter (“OTC”).
Futures Contracts: Futures contracts are purchased or sold to gain exposure to, or manage exposure to, changes in interest rates (interest rate risk) and changes in the value of equity securities (equity risk) or foreign currencies (foreign currency exchange rate risk).
Futures contracts are exchange-traded agreements between the Master Portfolio and a counterparty to buy or sell a specific quantity of an underlying instrument at a specified price and on a specified date. Depending on the terms of a contract, it is settled either through physical delivery of the underlying instrument on the settlement date or by payment of a cash amount on the settlement date. Upon entering into a futures contract, the Master Portfolio is required to deposit initial margin with the broker in the form of cash or securities in an amount that varies depending on a contract’s size and risk profile. The initial margin deposit must then be maintained at an established level over the life of the contract. Amounts pledged, which are considered restricted, are included in cash pledged for futures contracts in the Statement of Assets and Liabilities.
Securities deposited as initial margin are designated in the Schedule of Investments and cash deposited, if any, are shown as cash pledged for futures contracts in the Statement of Assets and Liabilities. Pursuant to the contract, the Master Portfolio agrees to receive from or pay to the broker an amount of cash equal to the daily fluctuation in market value of the contract (“variation margin”). Variation margin is recorded as unrealized appreciation (depreciation) and, if any, shown as variation margin receivable (or payable) on futures contracts in the Statement of Assets and Liabilities. When the contract is closed, a realized gain or loss is recorded in the Statement of Operations equal to the difference between the notional amount of the contract at the time it was opened and the notional amount at the time it was closed. The use of futures contracts involves the risk of an imperfect correlation in the movements in the price of futures contracts and interest rates, foreign currency exchange rates or underlying assets.
6. INVESTMENT ADVISORY AGREEMENT AND OTHER TRANSACTIONS WITH AFFILIATES
Investment Advisory: MIP, on behalf of the Master Portfolio, entered into an Investment Advisory Agreement with the Manager, the Master Portfolio’s investment adviser and an indirect, wholly-owned subsidiary of BlackRock, to provide investment advisory services. The Manager is responsible for the management of the Master Portfolio’s portfolio and provides the personnel, facilities, equipment and certain other services necessary to the operations of the Master Portfolio.
| 16 | 2 0 2 2 BLACK ROCK ANNUAL REPORT TO SHAREHOLDERS |
Notes to Financial Statements (continued)
For such services, the Master Portfolio pays the Manager a monthly fee at an annual rate equal to 0.01% of the average daily value of the Master Portfolio’s net assets.
Administration: MIP, on behalf of the Master Portfolio, entered into an Administration Agreement with BlackRock Advisors, LLC (“BAL”), which has agreed to provide general administrative services (other than investment advice and related portfolio activities). BAL has agreed to bear all of the Master Portfolio’s ordinary operating expenses, excluding, generally, investment advisory fees, distribution fees, brokerage and other expenses related to the execution of portfolio transactions, extraordinary expenses and certain other expenses which are borne by the Master Portfolio.
BAL is not entitled to compensation for providing administrative services to the Master Portfolio, for so long as BAL (or an affiliate) is entitled to compensation for providing administrative services to corresponding feeder funds that invest substantially all of their assets in the Master Portfolio, or BAL (or an affiliate) receives investment advisory fees from the Master Portfolio.
The fees and expenses of the Master Portfolio’s trustees who are not “interested persons” of MIP, as defined in the 1940 Act (“Independent Trustees”), counsel to the Independent Trustees and the Master Portfolio’s independent registered public accounting firm (together, the “independent expenses”) are paid directly by the Master Portfolio. BFA has contractually agreed to reimburse the Master Portfolio or provide an offsetting credit against the investment advisory fees paid by the Master Portfolio in an amount equal to the independent expenses through June 30, 2023. If the Master Portfolio does not pay administration fees, BAL agrees to cap the expenses of the Master Portfolio at the rate at which it pays an investment advisory fee to BFA. The amount waived is included in fees waived and/or reimbursed by the Manager in the Statement of Operations. For the year ended December 31, 2022, the amount waived was $277,016.
Expense Waivers and Reimbursements: The Manager contractually agreed to waive its investment advisory fees by the amount of investment advisory fees the Master Portfolio pays to the Manager indirectly through its investment in affiliated money market funds (the “affiliated money market fund waiver”) through June 30, 2023. The contractual agreement may be terminated upon 90 days’ notice by a majority of the Independent Trustees or by a vote of a majority of the outstanding voting securities of the Master Portfolio. This amount is included in fees waived and/or reimbursed by the Manager in the Statement of Operations. For the year ended December 31, 2022, the amounts waived were $92,186.
The Manager has contractually agreed to waive its investment advisory fee with respect to any portion of the Master Portfolio’s assets invested in affiliated equity and fixed-income mutual funds and affiliated exchange-traded funds that have a contractual management fee through June 30, 2023. The contractual agreement may be terminated upon 90 days’ notice by a majority of the Independent Trustees, or by a vote of a majority of the outstanding voting securities of the Master Portfolio. This amount is included in fees waived and/or reimbursed by the Manager in the Statement of Operations. For the year ended December 31, 2022, the Manager waived $23,942 in investment advisory fees pursuant to this arrangement.
Securities Lending: The U.S. Securities and Exchange Commission (“SEC”) has issued an exemptive order which permits BTC, an affiliate of the Manager, to serve as securities lending agent for the Master Portfolio, subject to applicable conditions. As securities lending agent, BTC bears all operational costs directly related to securities lending, including any custodial costs. The Master Portfolio is responsible for fees in connection with the investment of cash collateral received for securities on loan (the “collateral investment fees”). The cash collateral is invested in a money market fund, BlackRock Cash Funds: Institutional or BlackRock Cash Funds: Treasury, managed by the Manager or its affiliates. However, BTC has agreed to reduce the amount of securities lending income it receives in order to effectively limit the collateral investment fees the Master Portfolio bears to an annual rate of 0.04%. The SL Agency Shares of such money market fund will not be subject to a sales load, distribution fee or service fee. The money market fund in which the cash collateral has been invested may, under certain circumstances, impose a liquidity fee of up to 2% of the value redeemed or temporarily restrict redemptions for up to 10 business days during a 90 day period, in the event that the money market fund’s weekly liquid assets fall below certain thresholds.
Securities lending income is equal to the total of income earned from the reinvestment of cash collateral, net of fees and other payments to and from borrowers of securities, and less the collateral investment fees. The Master Portfolio retains a portion of securities lending income and remits a remaining portion to BTC as compensation for its services as securities lending agent.
Pursuant to the current securities lending agreement, the Master Portfolio retains 81% of securities lending income (which excludes collateral investment fees), and this amount retained can never be less than 70% of the total of securities lending income plus the collateral investment fees.
In addition, commencing the business day following the date that the aggregate securities lending income earned across the BlackRock Multi-Asset Complex in a calendar year exceeds a specified threshold, the Master Portfolio, pursuant to the securities lending agreement, will retain for the remainder of that calendar year securities lending income in an amount equal to 81% of securities lending income (which excludes collateral investment fees), and this amount retained can never be less than 70% of the total of securities lending income plus the collateral investment fees.
The share of securities lending income earned by the Master Portfolio is shown as securities lending income — affiliated — net in the Statement of Operations. For the year ended December 31, 2022, the Master Portfolio paid BTC $203,850 for securities lending agent services.
Interfund Lending: In accordance with an exemptive order (the “Order”) from the SEC, the Master Portfolio may participate in a joint lending and borrowing facility for temporary purposes (the “Interfund Lending Program”), subject to compliance with the terms and conditions of the Order, and to the extent permitted by the Master Portfolio’s investment policies and restrictions. The Master Portfolio is currently permitted to borrow and lend under the Interfund Lending Program.
A lending BlackRock fund may lend in aggregate up to 15% of its net assets but may not lend more than 5% of its net assets to any one borrowing fund through the Interfund Lending Program. A borrowing BlackRock fund may not borrow through the Interfund Lending Program or from any other source more than 33 1/3% of its total assets (or any lower threshold provided for by the fund’s investment restrictions). If a borrowing BlackRock fund’s total outstanding borrowings exceed 10% of its total assets, each of its outstanding interfund loans will be subject to collateralization of at least 102% of the outstanding principal value of the loan. All interfund loans are for temporary or emergency purposes and the interest rate to be charged will be the average of the highest current overnight repurchase agreement rate available to a lending fund and the bank loan rate, as calculated according to a formula established by the Board.
MASTER PORTFOLIO NOTES TO FINANCIAL STATEMENTS | 17 |
Notes to Financial Statements (continued)
During the year ended December 31, 2022, the Master Portfolio did not participate in the Interfund Lending Program.
Trustees and Officers: Certain trustees and/or officers of the Master Portfolio are directors and/or officers of BlackRock or its affiliates.
Other Transactions: The Master Portfolio may purchase securities from, or sell securities to, an affiliated fund provided the affiliation is due solely to having a common investment adviser, common officers, or common trustees. For the year ended December 31, 2022, the purchase and sale transactions and any net realized gains (losses) with affiliated funds in compliance with Rule 17a-7 under the 1940 Act were as follows:
| ||||||||||||
| Master Portfolio Name | Purchases
| Sales
| Net Realized
| |||||||||
| ||||||||||||
S&P 500 Index Master Portfolio
| $
| 211,481,078
|
| $
| 122,905,651
|
| $
| (33,730,868
| )
| |||
| ||||||||||||
| 7. | PURCHASES AND SALES |
For the year ended December 31, 2022, purchases and sales of investments, excluding short-term securities, were $5,768,293,288 and $3,965,817,339, respectively.
| 8. | INCOME TAX INFORMATION |
The Master Portfolio is classified as a partnership for U.S. federal income tax purposes. As such, each investor in the Master Portfolio is treated as the owner of its proportionate share of net assets, income, expenses and realized and unrealized gains and losses of the Master Portfolio. Therefore, no U.S. federal income tax provision is required. It is intended that the Master Portfolio’s assets will be managed so an investor in the Master Portfolio can satisfy the requirements of Subchapter M of the Internal Revenue Code of 1986, as amended.
The Master Portfolio files U.S. federal and various state and local tax returns. No income tax returns are currently under examination. The statute of limitations on the Master Portfolio’s U.S. federal tax returns generally remains open for a period of three years after they are filed. The statutes of limitations on the Master Portfolio’s state and local tax returns may remain open for an additional year depending upon the jurisdiction.
Management has analyzed tax laws and regulations and their application to the Master Portfolio as of December 31, 2022, inclusive of the open tax return years, and does not believe that there are any uncertain tax positions that require recognition of a tax liability in the Master Portfolio’s financial statements.
As of December 31, 2022, gross unrealized appreciation and depreciation based on cost of investments (including short positions and derivatives, if any) for U.S. federal income tax purposes were as follows:
| ||||||||||||||||
Master Portfolio Name
| Tax Cost
| Gross Unrealized
| Gross Unrealized
| Net Unrealized
| ||||||||||||
| ||||||||||||||||
S&P 500 Index Master Portfolio | $
| 15,724,549,640
|
| $
| 15,227,612,925
|
| $
| (1,077,704,130)
|
| $
| 14,149,908,795
|
| ||||
|
|
|
|
|
|
|
| |||||||||
| 9. | BANK BORROWINGS |
MIP, on behalf of the Master Portfolio, along with certain other funds managed by the Manager and its affiliates (“Participating Funds”), are a party to a 364-day, $2.50 billion credit agreement with a group of lenders. Under this agreement, the Master Portfolio may borrow to fund shareholder redemptions. Excluding commitments designated for certain individual funds, the Participating Funds, including the Master Portfolio, can borrow up to an aggregate commitment amount of $1.75 billion at any time outstanding, subject to asset coverage and other limitations as specified in the agreement. The credit agreement has the following terms: a fee of 0.10% per annum on unused commitment amounts and interest at a rate equal to the higher of (a) Overnight Bank Funding Rate (“OBFR”) (but, in any event, not less than 0.00%) on the date the loan is made plus 0.80% per annum, (b) the Fed Funds rate (but, in any event, not less than 0.00%) in effect from time to time plus 0.80% per annum on amounts borrowed or (c) the sum of (x) Daily Simple Secured Overnight Financing Rate (“SOFR”) (but, in any event, not less than 0.00%) on the date the loan is made plus 0.10% and (y) 0.80% per annum. The agreement expires in April 2023 unless extended or renewed. These fees were allocated among such funds based upon portions of the aggregate commitment available to them and relative net assets of Participating Funds. During the year ended December 31, 2022, the Master Portfolio did not borrow under the credit agreement.
| 10. | PRINCIPAL RISKS |
In the normal course of business, the Master Portfolio invests in securities or other instruments and may enter into certain transactions, and such activities subject the Master Portfolio to various risks, including among others, fluctuations in the market (market risk) or failure of an issuer to meet all of its obligations. The value of securities or other instruments may also be affected by various factors, including, without limitation: (i) the general economy; (ii) the overall market as well as local, regional or global political and/or social instability; (iii) regulation, taxation or international tax treaties between various countries; or (iv) currency, interest rate and price fluctuations. Local, regional or global events such as war, acts of terrorism, the spread of infectious illness or other public health issues, recessions, or other events could have a significant impact on the Master Portfolio and its investments. The Master Portfolio’s prospectus provides details of the risks to which the Master Portfolio is subject.
The Manager uses a “passive” or index approach to try to achieve the Master Portfolio’s investment objective following the securities included in its underlying index during upturns as well as downturns. The Manager does not take steps to reduce market exposure or to lessen the effects of a declining market. Divergence from the underlying index and the composition of the portfolio is monitored by the Manager.
| 18 | 2 0 2 2 BLACK ROCK ANNUAL REPORT TO SHAREHOLDERS |
Notes to Financial Statements (continued)
The Master Portfolio may be exposed to additional risks when reinvesting cash collateral in money market funds that do not seek to maintain a stable NAV per share of $1.00, which may be subject to redemption gates or liquidity fees under certain circumstances.
Infectious Illness Risk: An outbreak of an infectious illness, such as the COVID-19 pandemic, may adversely impact the economies of many nations and the global economy, and may impact individual issuers and capital markets in ways that cannot be foreseen. An infectious illness outbreak may result in, among other things, closed international borders, prolonged quarantines, supply chain disruptions, market volatility or disruptions and other significant economic, social and political impacts.
Valuation Risk: The market values of equities, such as common stocks and preferred securities or equity related investments, such as futures and options, may decline due to general market conditions which are not specifically related to a particular company. They may also decline due to factors which affect a particular industry or industries. The Master Portfolio may invest in illiquid investments. An illiquid investment is any investment that the Master Portfolio reasonably expects cannot be sold or disposed of in current market conditions in seven calendar days or less without the sale or disposition significantly changing the market value of the investment. The Master Portfolio may experience difficulty in selling illiquid investments in a timely manner at the price that it believes the investments are worth. Prices may fluctuate widely over short or extended periods in response to company, market or economic news. Markets also tend to move in cycles, with periods of rising and falling prices. This volatility may cause the Master Portfolio’s NAV to experience significant increases or decreases over short periods of time. If there is a general decline in the securities and other markets, the NAV of the Master Portfolio may lose value, regardless of the individual results of the securities and other instruments in which the Master Portfolio invests.
Counterparty Credit Risk: The Master Portfolio may be exposed to counterparty credit risk, or the risk that an entity may fail to or be unable to perform on its commitments related to unsettled or open transactions, including making timely interest and/or principal payments or otherwise honoring its obligations. The Master Portfolio manages counterparty credit risk by entering into transactions only with counterparties that the Manager believes have the financial resources to honor their obligations and by monitoring the financial stability of those counterparties. Financial assets, which potentially expose the Master Portfolio to market, issuer and counterparty credit risks, consist principally of financial instruments and receivables due from counterparties. The extent of the Master Portfolio’s exposure to market, issuer and counterparty credit risks with respect to these financial assets is approximately their value recorded in the Statement of Assets and Liabilities, less any collateral held by the Master Portfolio.
A derivative contract may suffer a mark-to-market loss if the value of the contract decreases due to an unfavorable change in the market rates or values of the underlying instrument. Losses can also occur if the counterparty does not perform under the contract.
With exchange-traded futures, there is less counterparty credit risk to the Master Portfolio since the exchange or clearinghouse, as counterparty to such instruments, guarantees against a possible default. The clearinghouse stands between the buyer and the seller of the contract; therefore, credit risk is limited to failure of the clearinghouse. While offset rights may exist under applicable law, the Master Portfolio does not have a contractual right of offset against a clearing broker or clearinghouse in the event of a default (including the bankruptcy or insolvency). Additionally, credit risk exists in exchange-traded futures with respect to initial and variation margin that is held in a clearing broker’s customer accounts. While clearing brokers are required to segregate customer margin from their own assets, in the event that a clearing broker becomes insolvent or goes into bankruptcy and at that time there is a shortfall in the aggregate amount of margin held by the clearing broker for all its clients, typically the shortfall would be allocated on a pro rata basis across all the clearing broker’s customers, potentially resulting in losses to the Master Portfolio.
Concentration Risk: A diversified portfolio, where this is appropriate and consistent with a fund’s objectives, minimizes the risk that a price change of a particular investment will have a material impact on the NAV of a fund. The investment concentrations within the Master Portfolio’s portfolio are disclosed in its Schedule of Investments.
The Master Portfolio invests a significant portion of its assets in securities within a single or limited number of market sectors. When a fund concentrates its investments in this manner, it assumes the risk that economic, regulatory, political and social conditions affecting such sectors may have a significant impact on the Master Portfolio and could affect the income from, or the value or liquidity of, the Master Portfolio’s portfolio. Investment percentages in specific sectors are presented in the Schedule of Investments.
Significant Shareholder Redemption Risk: Certain shareholders may own or manage a substantial amount of fund shares and/or hold their fund investments for a limited period of time. Large redemptions of fund shares by these shareholders may force a fund to sell portfolio securities, which may negatively impact the fund’s NAV, increase the fund’s brokerage costs, and/or accelerate the realization of taxable income/gains and cause the fund to make additional taxable distributions to shareholders.
LIBOR Transition Risk: The United Kingdom’s Financial Conduct Authority announced a phase out of the London Interbank Offered Rate (“LIBOR”). Although many LIBOR rates ceased to be published or no longer are representative of the underlying market they seek to measure after December 31, 2021, a selection of widely used USD LIBOR rates will continue to be published through June 2023 in order to assist with the transition. The Master Portfolio may be exposed to financial instruments tied to LIBOR to determine payment obligations, financing terms, hedging strategies or investment value. The transition process away from LIBOR might lead to increased volatility and illiquidity in markets for, and reduce the effectiveness of new hedges placed against instruments whose terms currently include LIBOR. The ultimate effect of the LIBOR transition process on the Master Portfolio is uncertain.
| 11. | SUBSEQUENT EVENTS |
Management has evaluated the impact of all subsequent events on the Master Portfolio through the date the financial statements were issued and has determined that there were no subsequent events requiring adjustment or additional disclosure in the financial statements.
MASTER PORTFOLIO NOTES TO FINANCIAL STATEMENTS | 19 |
Report of Independent Registered Public Accounting Firm
To the Board of Trustees of Master Investment Portfolio and Investors of S&P 500 Index Master Portfolio
Opinion on the Financial Statements
We have audited the accompanying statement of assets and liabilities, including the schedule of investments, of S&P 500 Index Master Portfolio (one of the series constituting Master Investment Portfolio, referred to hereafter as the “Master Portfolio”) as of December 31, 2022, the related statement of operations for the year ended December 31, 2022, the statements of changes in net assets for each of the two years in the period ended December 31, 2022, including the related notes, and the financial highlights for each of the five years in the period ended December 31, 2022 (collectively referred to as the “financial statements”). In our opinion, the financial statements present fairly, in all material respects, the financial position of the Master Portfolio as of December 31, 2022, the results of its operations for the year then ended, the changes in its net assets for each of the two years in the period ended December 31, 2022 and the financial highlights for each of the five years in the period ended December 31, 2022 in conformity with accounting principles generally accepted in the United States of America.
Basis for Opinion
These financial statements are the responsibility of the Master Portfolio’s management. Our responsibility is to express an opinion on the Master Portfolio’s financial statements based on our audits. We are a public accounting firm registered with the Public Company Accounting Oversight Board (United States) (PCAOB) and are required to be independent with respect to the Master Portfolio in accordance with the U.S. federal securities laws and the applicable rules and regulations of the Securities and Exchange Commission and the PCAOB.
We conducted our audits of these financial statements in accordance with the standards of the PCAOB. Those standards require that we plan and perform the audit to obtain reasonable assurance about whether the financial statements are free of material misstatement, whether due to error or fraud.
Our audits included performing procedures to assess the risks of material misstatement of the financial statements, whether due to error or fraud, and performing procedures that respond to those risks. Such procedures included examining, on a test basis, evidence regarding the amounts and disclosures in the financial statements. Our audits also included evaluating the accounting principles used and significant estimates made by management, as well as evaluating the overall presentation of the financial statements. Our procedures included confirmation of securities owned as of December 31, 2022 by correspondence with the custodian, transfer agent and brokers. We believe that our audits provide a reasonable basis for our opinion.
/s/PricewaterhouseCoopers LLP
Philadelphia, Pennsylvania
February 14, 2023
We have served as the auditor of one or more BlackRock investment companies since 2000.
| 20 | 2 0 2 2 BLACK ROCK ANNUAL REPORT TO SHAREHOLDERS |
Statement Regarding Liquidity Risk Management Program
In compliance with Rule 22e-4 under the Investment Company Act of 1940, as amended (the “Liquidity Rule”), BlackRock Funds III and Master Investment Portfolio (the “Trusts”) have adopted and implemented a liquidity risk management program (the “Program”) for iShares S&P 500 Index Fund and S&P 500 Index Master Portfolio (the “Funds”), each a series of the respective Trust, which is reasonably designed to assess and manage each Fund’s liquidity risk.
The Board of Trustees (the “Board”) of the Trusts, on behalf of the Funds, met on November 8-9, 2022 (the “Meeting”) to review the Program. The Board previously appointed BlackRock Advisors, LLC or BlackRock Fund Advisors (“BlackRock”), each an investment adviser to certain BlackRock funds, as the program administrator for each Fund’s Program, as applicable. BlackRock also previously delegated oversight of the Program to the 40 Act Liquidity Risk Management Committee (the “Committee”). At the Meeting, the Committee, on behalf of BlackRock, provided the Board with a report that addressed the operation of the Program and assessed its adequacy and effectiveness of implementation, including the management of each Fund’s Highly Liquid Investment Minimum (“HLIM”) where applicable, and any material changes to the Program (the “Report”). The Report covered the period from October 1, 2021 through September 30, 2022 (the “Program Reporting Period”).
The Report described the Program’s liquidity classification methodology for categorizing each Fund’s investments (including derivative transactions) into one of four liquidity buckets. It also referenced the methodology used by BlackRock to establish each Fund’s HLIM and noted that the Committee reviews and ratifies the HLIM assigned to each Fund no less frequently than annually. The Report also discussed notable events affecting liquidity over the Program Reporting Period, including the imposition of capital controls in certain countries.
The Report noted that the Program complied with the key factors for consideration under the Liquidity Rule for assessing, managing and periodically reviewing each Fund’s liquidity risk, as follows:
| a) | The Fund’s investment strategy and liquidity of portfolio investments during both normal and reasonably foreseeable stressed conditions. During the Program Reporting Period, the Committee reviewed whether each Fund’s strategy is appropriate for an open-end fund structure with a focus on funds with more significant and consistent holdings of less liquid and illiquid assets. The Committee also factored a fund’s concentration in an issuer into the liquidity classification methodology by taking issuer position sizes into account. Where a fund participated in borrowings for investment purposes (such as tender option bonds or reverse repurchase agreements), such borrowings were factored into the Program’s calculation of a fund’s liquidity bucketing. A fund’s derivative exposure was also considered in such calculation. |
| b) | Short-term and long-term cash flow projections during both normal and reasonably foreseeable stressed conditions. During the Program Reporting Period, the Committee reviewed historical redemption activity and used this information as a component to establish each Fund’s reasonably anticipated trading size utilized for liquidity classifications. Each Fund has adopted an in-kind redemption policy which may be utilized to meet larger redemption requests. The Committee may also take into consideration a fund’s shareholder ownership concentration (which, depending on product type and distribution channel, may or may not be available), a fund’s distribution channels, and the degree of certainty associated with a fund’s short-term and long-term cash flow projections. |
| c) | Holdings of cash and cash equivalents, as well as borrowing arrangements. The Committee considered the terms of the credit facility committed to each Fund, the financial health of the institution providing the facility and the fact that the credit facility is shared among multiple funds (including that a portion of the aggregate commitment amount is specifically designated for BlackRock Floating Rate Income Portfolio, a series of BlackRock Funds V, and BlackRock Floating Rate Loan ETF, a series of BlackRock ETF Trust II). The Committee also considered other types of borrowing available to the Funds, such as the ability to use reverse repurchase agreements and interfund lending, as applicable. |
There were no material changes to the Program during the Program Reporting Period other than the enhancement of certain model components in the Program’s classification methodology. The Report provided to the Board stated that the Committee concluded that based on the operation of the functions, as described in the Report, the Program is operating as intended and is effective in implementing the requirements of the Liquidity Rule.
STATEMENT REGARDING LIQUIDITY RISK MANAGEMENT PROGRAM | 21 |
Trustee and Officer Information
| Independent Trustees(a) | ||||||||
Name Year of Birth(b) | Position(s) Held (Length of Service)(c) | Principal Occupation(s) During Past 5 Years | Number of BlackRock-Advised Registered Investment Companies (“RICs”) Consisting of Investment Portfolios (“Portfolios”) Overseen | Public Company Company Directorships Held During Past 5 Years | ||||
Mark Stalnecker 1951 | Chair of the Board (Since 2019) and Trustee (Since 2015) | Chief Investment Officer, University of Delaware from 1999 to 2013; Trustee and Chair of the Finance and Investment Committees, Winterthur Museum and Country Estate from 2005 to 2016; Member of the Investment Committee, Delaware Public Employees’ Retirement System since 2002; Member of the Investment Committee, Christiana Care Health System from 2009 to 2017; Member of the Investment Committee, Delaware Community Foundation from 2013 to 2014; Director and Chair of the Audit Committee, SEI Private Trust Co. from 2001 to 2014. | 28 RICs consisting of 164 Portfolios | None | ||||
Susan J. Carter 1956 | Trustee (Since 2016) | Trustee, Financial Accounting Foundation from 2017 to 2021; Advisory Board Member, Center for Private Equity and Entrepreneurship at Tuck School of Business from 1997 to 2021; Director, Pacific Pension Institute from 2014 to 2018; Senior Advisor, Commonfund Capital, Inc. (“CCI”) (investment adviser) in 2015; Chief Executive Officer, CCI from 2013 to 2014; President & Chief Executive Officer, CCI from 1997 to 2013; Advisory Board Member, Girls Who Invest from 2015 to 2018 and Board Member thereof since 2018; Advisory Board Member, Bridges Fund Management since 2016; Practitioner Advisory Board Member, Private Capital Research Institute (“PCRI”) since 2017; Lecturer in the Practice of Management, Yale School of Management since 2019; Advisor to Finance Committee, Altman Foundation since 2020; Investment Committee Member, Tostan since 2021. | 28 RICs consisting of 164 Portfolios | None | ||||
| Collette Chilton 1958 | Trustee (Since 2015) | Chief Investment Officer, Williams College since 2006; Chief Investment Officer, Lucent Asset Management Corporation from 1998 to 2006; Director, Boys and Girls Club of Boston since 2017; Director, B1 Capital since 2018; Director, David and Lucile Packard Foundation since 2020. | 28 RICs consisting of 164 Portfolios | None | ||||
Neil A. Cotty 1954 | Trustee (Since 2016) | Bank of America Corporation from 1996 to 2015, serving in various senior finance leadership roles, including Chief Accounting Officer from 2009 to 2015, Chief Financial Officer of Global Banking, Markets and Wealth Management from 2008 to 2009, Chief Accounting Officer from 2004 to 2008, Chief Financial Officer of Consumer Bank from 2003 to 2004, Chief Financial Officer of Global Corporate Investment Bank from 1999 to 2002. | 28 RICs consisting of 164 Portfolios | None | ||||
| Lena G. Goldberg 1949 | Trustee (Since 2019) | Director, Charles Stark Draper Laboratory, Inc. from 2013 to 2021; Senior Lecturer, Harvard Business School from 2008 to 2021; FMR LLC/Fidelity Investments (financial services) from 1996 to 2008, serving in various senior roles including Executive Vice President - Strategic Corporate Initiatives and Executive Vice President and General Counsel; Partner, Sullivan & Worcester LLP from 1985 to 1996 and Associate thereof from 1979 to 1985. | 28 RICs consisting of 164 Portfolios | None | ||||
| 22 | 2 0 2 2 BLACK ROCK ANNUAL REPORT TO SHAREHOLDERS |
Trustee and Officer Information (continued)
| Independent Trustees(a) (continued) | ||||||||
Name Year of Birth(b) | Position(s) Held (Length of Service)(c) | Principal Occupation(s) During Past 5 Years | Number of BlackRock-Advised Registered Investment Companies (“RICs”) Consisting of Investment Portfolios (“Portfolios”) Overseen | Public Company and Other Investment Company Directorships Held During Past 5 Years | ||||
Henry R. Keizer 1956 | Trustee (Since 2019) | Director, Park Indemnity Ltd. (captive insurer) since 2010; Director, MUFG Americas Holdings Corporation and MUFG Union Bank, N.A. (financial and bank holding company) from 2014 to 2016; Director, American Institute of Certified Public Accountants from 2009 to 2011; Director, KPMG LLP (audit, tax and advisory services) from 2004 to 2005 and 2010 to 2012; Director, KPMG International in 2012, Deputy Chairman and Chief Operating Officer thereof from 2010 to 2012 and U.S. Vice Chairman of Audit thereof from 2005 to 2010; Global Head of Audit, KPMGI (consortium of KPMG firms) from 2006 to 2010; Director, YMCA of Greater New York from 2006 to 2010. | 28 RICs consisting of 164 Portfolios | Hertz Global Holdings (car rental) from 2015 to 2021; GrafTech International Ltd. (materials manufacturing); WABCO (commercial vehicle safety systems) from 2015 to 2020; Sealed Air Corp. (packaging) from 2015 to 2021 | ||||
Cynthia A. Montgomery 1952 | Trustee (Since 2009) | Professor, Harvard Business School since 1989. | 28 RICs consisting of 164 Portfolios | None | ||||
Donald C. Opatrny 1952 | Trustee (Since 2019) | Director, Athena Capital Advisors LLC (investment management firm) from 2013 to 2020; Trustee, Vice Chair, Member of the Executive Committee and Chair of the Investment Committee, Cornell University from 2004 to 2019; President and Trustee, the Center for the Arts, Jackson Hole from 2011 to 2018; Member of the Board and Investment Committee, University School from 2007 to 2018; Trustee, Artstor (a Mellon Foundation affiliate) from 2010 to 2015; Member of the Investment Committee, Mellon Foundation from 2009 to 2015; President, Trustee and Member of the Investment Committee, The Aldrich Contemporary Art Museum from 2007 to 2014; Trustee and Chair of the Investment Committee, Community Foundation of Jackson Hole since 2014; Member of Affordable Housing Supply Board of Jackson, Wyoming since 2017; Member, Investment Funds Committee, State of Wyoming since 2017; Trustee, Phoenix Art Museum since 2018; Trustee, Arizona Community Foundation and Member of Investment Committee since 2020. | 28 RICs consisting of 164 Portfolios | None | ||||
Joseph P. Platt 1947 | Trustee (Since 2009) | General Partner, Thorn Partners, LP (private investments) since 1998; Director, WQED Multi-Media (public broadcasting not-for-profit) since 2001; Chair, Basic Health International (non-profit) since 2015. | 28 RICs consisting of 164 Portfolios | Greenlight Capital Re, Ltd. (reinsurance company); Consol Energy Inc. | ||||
Kenneth L. Urish 1951 | Trustee (Since 2009) | Managing Partner, Urish Popeck & Co., LLC (certified public accountants and consultants) since 1976; Past- Chairman of the Professional Ethics Committee of the Pennsylvania Institute of Certified Public Accountants and Committee Member thereof since 2007; Member of External Advisory Board, The Pennsylvania State University Accounting Department since founding in 2001; Principal, UP Strategic Wealth Investment Advisors, LLC since 2013; Trustee, The Holy Family Institute from 2001 to 2010; President and Trustee, Pittsburgh Catholic Publishing Associates from 2003 to 2008; Director, Inter- Tel from 2006 to 2007; Member, Advisory Board, ESG Competent Boards since 2020. | 28 RICs consisting of 164 Portfolios | None | ||||
TRUSTEE AND OFFICER INFORMATION | 23 |
Trustee and Officer Information (continued)
| Independent Trustees(a) (continued) | ||||||||
Name Year of Birth(b) | Position(s) Held (Length of Service)(c) | Principal Occupation(s) During Past 5 Years | Number of BlackRock-Advised Registered Investment Companies (“RICs”) Consisting of Investment Portfolios (“Portfolios”) Overseen | Public Company Company Directorships Held Past 5 Years | ||||
Claire A. Walton 1957 | Trustee (Since 2016) | Chief Operating Officer and Chief Financial Officer of Liberty Square Asset Management, LP from 1998 to 2015; General Partner of Neon Liberty Capital Management, LLC since 2003; Director, Boston Hedge Fund Group from 2009 to 2018; Director, Woodstock Ski Runners since 2013; Director, Massachusetts Council on Economic Education from 2013 to 2015. | 28 RICs consisting of 164 Portfolios | None | ||||
| Interested Trustees(a)(d) | ||||||||
Name Year of Birth(b) | Position(s) Held (Length of Service)(c) | Principal Occupation(s) During Past 5 Years | Number of BlackRock-Advised Registered Investment Companies (“RICs”) Consisting of Investment Portfolios (“Portfolios”) Overseen | Public Company and Other Investment Company Directorships Held Past 5 Years | ||||
Robert Fairbairn 1965 | Trustee (Since 2018) | Vice Chairman of BlackRock, Inc. since 2019; Member of BlackRock’s Global Executive and Global Operating Committees; Co-Chair of BlackRock’s Human Capital Committee; Senior Managing Director of BlackRock, Inc. from 2010 to 2019; oversaw BlackRock’s Strategic Partner Program and Strategic Product Management Group from 2012 to 2019; Member of the Board of Managers of BlackRock Investments, LLC from 2011 to 2018; Global Head of BlackRock’s Retail and iShares® businesses from 2012 to 2016. | 98 RICs consisting of 266 Portfolios | None | ||||
John M. Perlowski(e) 1964 | Trustee (Since 2015) President and Chief Executive Officer (Since 2010) | Managing Director of BlackRock, Inc. since 2009; Head of BlackRock Global Accounting and Product Services since 2009; Advisory Director of Family Resource Network (charitable foundation) since 2009. | 100 RICs consisting of 268 Portfolios | None | ||||
| (a) | The address of each Trustee is c/o BlackRock, Inc., 55 East 52nd Street, New York, New York 10055. |
| (b) | Independent Trustees serve until their resignation, retirement, removal or death, or until December 31 of the year in which they turn 75. The Board may determine to extend the terms of Independent Trustees on a case-by-case basis, as appropriate. |
| (c) | In connection with the acquisition of Barclays Global Investors by BlackRock, Inc. in December 2009, certain Independent Trustees were elected to the Board. Furthermore, effective January 1, 2019, three BlackRock Fund Complexes were realigned and consolidated into two BlackRock Fund Complexes. As a result, although the chart shows the year that each Independent Trustee joined the Board, certain Independent Trustees first became members of the boards of other BlackRock-advised Funds or legacy BlackRock funds as follows: Cynthia A. Montgomery, 1994; Joseph P. Platt, 1999; Kenneth L. Urish, 1999; Lena G. Goldberg, 2016; Henry R. Keizer, 2016; Donald C. Opatrny, 2015. |
| (d) | Mr. Fairbairn and Mr. Perlowski are both “interested persons,” as defined in the 1940 Act, of the Trust/MIP based on their positions with BlackRock, Inc. and its affiliates. Mr. Fairbairn and Mr. Perlowski are also board members of the BlackRock Fixed-Income Complex. |
| (e) | Mr. Perlowski is also a trustee of the BlackRock Credit Strategies Fund and BlackRock Private Investments Fund. |
| 24 | 2 0 2 2 BLACK ROCK ANNUAL REPORT TO SHAREHOLDERS |
Trustee and Officer Information (continued)
Officers Who Are Not Trustees(a)
| ||||
Name Year of Birth(b)
| Position(s) Held (Length of Service)
| Principal Occupation(s) During Past 5 Years
| ||
Roland Villacorta 1971 |
Vice President (Since 2022) |
Managing Director of BlackRock, Inc. since 2022; Head of Global Cash Management and Head of Securities Lending within BlackRock’s Portfolio Management Group since 2022; Member of BlackRock’s Global Operating Committee since 2022; Head of Portfolio Management in BlackRock’s Financial Markets Advisory Group within BlackRock Solutions from 2008 to 2015; Co-Head of BlackRock Solutions’ Portfolio Analytics Group; previously Mr. Villacorta was Co-Head of Fixed Income within BlackRock’s Risk & Quantitative Analysis Group.
| ||
Jennifer McGovern 1977 | Vice President (Since 2014) | Managing Director of BlackRock, Inc. since 2016; Director of BlackRock, Inc. from 2011 to 2015; Head of Americas Product Development and Governance for BlackRock’s Global Product Group since 2019; Head of Product Structure and Oversight for BlackRock’s U.S. Wealth Advisory Group from 2013 to 2019.
| ||
Trent Walker 1974 | Chief Financial Officer (Since 2021) | Managing Director of BlackRock, Inc. since September 2019; Executive Vice President of PIMCO from 2016 to 2019; Senior Vice President of PIMCO from 2008 to 2015; Treasurer from 2013 to 2019 and Assistant Treasurer from 2007 to 2017 of PIMCO Funds, PIMCO Variable Insurance Trust, PIMCO ETF Trust, PIMCO Equity Series, PIMCO Equity Series VIT, PIMCO Managed Accounts Trust, 2 PIMCO-sponsored interval funds and 21 PIMCO-sponsored closed-end funds.
| ||
Jay M. Fife 1970
| Treasurer (Since 2009)
| Managing Director of BlackRock, Inc. since 2007. | ||
Charles Park 1967 | Chief Compliance Officer (Since 2014) | Anti-Money Laundering Compliance Officer for certain BlackRock-advised Funds from 2014 to 2015; Chief Compliance Officer of BlackRock Advisors, LLC and the BlackRock-advised Funds in the BlackRock Multi-Asset Complex and the BlackRock Fixed-Income Complex since 2014; Principal of and Chief Compliance Officer for iShares® Delaware Trust Sponsor LLC since 2012 and BlackRock Fund Advisors (“BFA”) since 2006; Chief Compliance Officer for the BFA-advised iShares® exchange traded funds since 2006; Chief Compliance Officer for BlackRock Asset Management International Inc. since 2012.
| ||
Lisa Belle 1968 | Anti-Money Laundering Compliance Officer (Since 2019)
| Managing Director of BlackRock, Inc. since 2019; Global Financial Crime Head for Asset and Wealth Management of JP Morgan from 2013 to 2019; Managing Director of RBS Securities from 2012 to 2013; Head of Financial Crimes for Barclays Wealth Americas from 2010 to 2012.
| ||
Janey Ahn 1975
| Secretary (Since 2019)
| Managing Director of BlackRock, Inc. since 2018; Director of BlackRock, Inc. from 2009 to 2017. | ||
| (a) | The address of each Officer is c/o BlackRock, Inc., 55 East 52nd Street, New York, New York 10055. |
| (b) | Officers of the Trust/MIP serve at the pleasure of the Board. |
Further information about the Trust’s/MIP’s Trustees and Officers is available in the Trust’s/MIP’s Statement of Additional Information, which can be obtained without charge by calling (800) 441-7762.
Effective March 31, 2022, Thomas Callahan resigned as a Vice President of the Trust/MIP and effective May 10, 2022, Roland Villacorta was appointed as a Vice President of the Trust/MIP.
Effective December 31, 2022, Joseph P. Platt retired as a Trustee of the Trust/MIP.
TRUSTEE AND OFFICER INFORMATION | 25 |
Glossary of Terms Used in this Report
Portfolio Abbreviation
| ETF | Exchange-Traded Fund | |
| MSCI | Morgan Stanley Capital International | |
| S&P | Standard & Poor’s | |
| 26 | 2 0 2 2 BLACK ROCK ANNUAL REPORT TO SHAREHOLDERS |
2. | Code of Ethics. |
Homestead Funds Trust has adopted a Senior Officer Code of Ethics, as defined in Item 2 of Form N-CSR, which applies to its principal executive officer, principal financial officer, principal accounting or controller, or persons performing similar functions. The Senior Officer Code of Ethics is available on Homestead Funds Trust’s website at www.homesteadfunds.com or without charge, upon request, by calling the Chief Compliance Officer at 1-800-258-3030. During the period covered by this report, no substantive amendments were approved or waivers were granted to the Senior Officer Code of Ethics.
3. | Audit Committee Financial Expert. |
The Registrant’s board of directors has determined that Julie H. Dellinger, member of the Registrant’s audit committee, qualifies as an audit committee financial expert, as such term is defined in Instruction 2(b) to Item 3 of Form N-CSR. Ms. Dellinger is “independent” as such term is defined in paragraph (a)(2) of Item 3 of Form N-CSR.
Under applicable securities laws, a person who is determined to be an audit committee financial expert will not be deemed an “expert” for any purpose, including, without limitation, for the purposes of Section 11 of the Securities Act of 1933, as a result of being designated or identified as an audit committee financial expert. The designation or identification of a person as an audit committee financial expert does not impose on such person any duties, obligations, or liabilities that are greater than the duties, obligations, and liabilities imposed on such person as a member of the audit committee and board of directors in the absence of such designation or identification. The designation or identification of a person as an audit committee financial expert does not affect the duties, obligations or liability of any other member of the audit committee or Board of Trustees.
4. | Principal Accountant Fees and Services. |
(a) | Audit Fees1 |
Fiscal Year 2021 | $14,219 |
Fiscal Year 2022 | $18,438 |
(b) | Audit-Related Fees |
Fiscal Year 2021 | $0 |
Fiscal Year 2022 | $0 |
(c) | Tax Fees |
Fiscal Year 2021 | $0 |
Fiscal Year 2022 | $0 |
(d) | All Other Fees |
Fiscal Year 2021 | $0 |
Fiscal Year 2022 | $0 |
(e)(1) | The Registrant’s audit committee is directly responsible for approving the services to be provided by the principal accountant. |
(2) | None of the services provided to the Registrant described in paragraphs (b)-(d) of Item 4 were approved by the Audit Committee pursuant to paragraph (c)(7)(i)(C) of Rule 2-01 of Regulation S-X. |
(f)Not applicable
(g) | The National Rural Electric Cooperative Association paid the Funds’ principal accountant $2,994 and $4,060 in 2022 and 2021, respectively, for consulting services. The National Rural Electric Cooperative Association is the parent company, hence a controlling entity of Homestead Advisers Corp., the investment adviser that provided ongoing services to Homestead Funds Trust for each of its last two fiscal years. |
(h) | Homestead Funds Trust’s Audit Committee considered the provision of non-audit services, which were not approved by the Audit Committee pursuant to paragraph (c)(7)(ii) of Rule 2-01 of Regulation S-X, that the principal accountant rendered to the National Rural Electric Cooperative Association, a controlling entity of Homestead Advisers Corp., the investment adviser that provided ongoing services to Homestead Funds Trust for each of its last two fiscal years. The Audit Committee determined that these services were compatible with maintaining the principal accountant’s independence. |
5. | Audit Committee of Listed Registrants. |
Not applicable.
6. | Investments. |
(a) | The Registrant’s schedule of investments in unaffiliated issuers is included in the report to shareholders under Item 1 of this Form N-CSR. |
(b) | Not applicable. |
7. | Disclosure of Proxy Voting Policies and Procedures for Closed-End Management Investment Companies. |
Not applicable.
8. | Portfolio Managers of Closed-End Management Investment Companies. |
Not applicable.
9. |
Purchases of Equity Securities by Closed-End Management Investment Company and Affiliated Purchasers. |
Not applicable.
10. | Submission of Matters to a Vote of Security Holders. |
Not applicable.
11. | Controls and Procedures. |
(a) | Disclosure Controls and Procedures. The Registrant’s principal executive officer and principal financial officer concluded, based on their evaluation of the disclosure controls and procedures as of a date within 90 days of the filing date of this report, that the Registrant’s disclosure controls and procedures are effectively designed to provide reasonable assurance that the information required to be disclosed by the Registrant in this report is recorded, processed, summarized and reported by the filing date, including the Registrant’s principal executive officer and principal financial officer, as appropriate, to allow timely decisions regarding required disclosure. |
(b) | Internal Control. There were no changes in the Registrant’s internal control over financial reporting that occurred during the period covered by this report that have materially affected, or are reasonably likely to materially affect, the Registrant’s internal control over financial reporting. |
12. | Disclosure of Securities Lending Activities For Closed-End Management Investment Companies. |
Not applicable.
13. | Exhibits. |
(a)(1) | Not required with this filing. |
(a)(3) | Not applicable. |
(a)(4) | Not applicable. |
SIGNATURES
Pursuant to the requirements of the Securities Exchange Act of 1934 and the Investment Company Act of 1940, the registrant has duly caused this report to be signed on its behalf by the undersigned, thereunto duly authorized.
HOMESTEAD FUNDS TRUST
By: | /s/ Mark D. Santero |
| Mark D. Santero President, Chief Executive Officer and Trustee (Principal Executive Officer)
|
Date: March 7, 2023
Pursuant to the requirements of the Securities Exchange Act of 1934 and the Investment Company Act of 1940, this report has been signed below by the following persons on behalf of the registrant and in the capacities and on the dates indicated.
By: | /s/ Mark D. Santero |
| Mark D. Santero President, Chief Executive Officer and Trustee (Principal Executive Officer)
|
Date: March 7, 2023
By: | /s/ Amy M. DiMauro |
| Amy M. DiMauro Treasurer (Principal Financial & Accounting Officer)
|
Date: March 7, 2023
|
11 | These fees were for professional services rendered for the audits of the financial statements of the Intermediate Bond Fund and the Rural America Growth & Income Fund, including services that are normally provided in connection with the Funds’ statutory and regulatory filings. |