2023 Full Year Results Presentation Douglas Thompson Managing Director & CEO Gerhard Ziems Group Chief Financial Officer 20 February 2024 All units in U.S. dollars and metric tonnes, unless otherwise stated |
CRN - FY23 Results Presentation 2 Important Notices and Disclaimer The material contained in this presentation is intended to be general background information on Coronado Global Resources (Coronado) and its activities. The information is supplied in summary form and is therefore not necessarily complete. It is not intended that it be relied upon as advice to investors or potential investors, who should consider seeking independent professional advice depending upon their specific investment objectives, financial situation or particular needs. The material contained in this presentation may include information derived from publicly available sources that have not been independently verified. No representation or warranty is made as to the accuracy, completeness or reliability of the information. All amounts are in United States dollars unless otherwise indicated. The presentation of certain financial information may not be compliant with financial captions in the primary financial statements prepared under U.S. GAAP. Refer to Coronado’s 2023 Form 10-K for the year ended 31 December 2023 available at www.coronadoglobal.com for details of the basis primary financial statements prepared under U.S. GAAP. This presentation contains statements that constitute “forward-looking statements” within the meaning of Section 27A of the US Securities Act of 1933 and Section 21E of the US Securities Exchange Act of 1934. Forward looking statements are statements about matters that are not historical facts. Forward-looking statements appear in a number of places in this presentation and include statements regarding our intent, belief or current expectations with respect to our business and operations, market conditions and results of operations. This report contains forward-looking statements concerning our business, operations, financial performance and condition, the coal, steel and other industries, as well as our plans, objectives and expectations for our business, operations, financial performance and condition. Forward-looking statements may be identified by words such as “may”, “could”, “believes”, “estimates”, “expects”, “intends”, “plans”, “considers”, “forecasts”, “targets” and other similar words that involve risk and uncertainties. Forward-looking statements provide management's current expectations or predictions of future conditions, events or results. All statements that address operating performance, events or developments that we expect or anticipate will occur in the future are forward-looking statements. They may include estimates of revenues, income, earnings per share, cost savings, capital expenditures, dividends, share repurchases, liquidity, capital structure, market share, industry volume, or other financial items, descriptions of management’s plans or objectives for future operations, or descriptions of assumptions underlying any of the above. All forward-looking statements speak only as of the date they are made and reflect the company's good faith beliefs, assumptions and expectations, but they are not guarantees of future performance or events. Furthermore, the Company disclaims any obligation to publicly update or revise any forward-looking statement, except as required by law. By their nature, forward-looking statements are subject to risks and uncertainties that could cause actual results to differ materially from those suggested by the forward-looking statements. Factors that might cause such differences include, but are not limited to, a variety of economic, competitive and regulatory factors, many of which are beyond the Company's control, as described in our Annual Report on Form 10-K filed with the ASX on 20 February 2024 (AEST) and filed with SEC, as well as additional factors we may disclose from time to time in other filings with the ASX and SEC. You may get such filings for free at our website at www.coronadoglobal.com. You should understand that it is not possible to predict or identify all such factors and, consequently, you should not consider any such list to be a complete set of all potential risks or uncertainties. In this presentation, references to ore reserves (Reserves) are compliant with the Australasian Code for Reporting of Exploration Results, Mineral Resources and Ore Reserves 2012 (JORC Code) and are measured in accordance with the JORC Code. Information in this presentation relating to Coal Reserves and Coal Resources is extracted from information published by Coronado and available on the Coronado and ASX websites (2023 JORC Statement also released to the ASX on 20 February 2024). For details of the Coal Reserves and Coal Resources estimates and the Competent Persons statements, refer to relevant Australian and U.S. Operations sections in the 2023 JORC Statement. As an SEC registrant, our SEC disclosures of resources and reserves follow the requirements of subpart 1300 of Regulation S-K under the US Securities Exchange Act of 1934. Accordingly, our estimates of resources and reserves in this presentation and in our other ASX disclosures may be different than our estimates of resources and reserves as reported in our Annual Report on Form 10-K for the year ended 31 December 2023 and in other reports that we are required to file with the SEC. |
2023 Highlights Douglas Thompson Managing Director & CEO CRN – FY23 Results Presentation 3 |
Solid operational performance delivering record waste movement and higher ROM coal production 25.4 Mt Prudent capital management focused on investment - Net Cash & Strong Balance Sheet Group Revenue of $2.9 billion and Available Liquidity $489 million Progressing emission reduction projects – Second VAM under construction / Curragh Gas Project 2023 Highlights Higher waste and ROM coal production rates; Improved safety performance; Met Coal Organic Growth plans progressing 4 Organic Growth Plans progressing to plan - Curragh North UG / Buchanan expansion works Group Safety Total Recordable Incident Rate improved 45% year-on-year CRN – FY23 Results Presentation |
Passionately committed to the health & safety of our people CRN - FY23 Results Presentation 5 |
CRN - FY23 Results Presentation 6 Health and Safety Our People, Our Highest Priority Notes: Total Recordable Injury Frequency Rate (TRIFR), is the number of fatalities, lost time injuries, cases or substitute work and other injuries requiring medical treatment per million-man hours worked on a rolling 12-month basis. Total Recordable Incident Rate (TRIR) is a mathematical computation that takes into account how many Mine Safety and Health Administration (MSHA) recordable incidents our company has per 200,000 hours worked on a rolling 12-month basis. Australian Operations (TRIFR) US Operations (TRIR) 0 2 4 6 8 10 Jan-21 Apr-21 Jul-21 Oct-21 Jan-22 Apr-22 Jul-22 Oct-22 Jan-23 Apr-23 Jul-23 Oct-23 Jan-24 -80% Australian Operations Industry Average 0 1 2 3 4 Jan-21 Apr-21 Jul-21 Oct-21 Jan-22 Apr-22 Jul-22 Oct-22 Jan-23 Apr-23 Jul-23 Oct-23 Jan-24 -36% U.S. Operations Industry Average |
Critical Commodity Operational Excellence Capital Management • Completed significant investment in waste movement deficit – Curragh Complex • Executable Organic Growth Plan (Curragh UG / Buchanan): target of 20.5Mt by 2025 • Strong Culture and Capability to maximise performance; Strategic / Experienced Leadership • Met Coal is a critical material found in every renewable energy transition initiative • Structural supply shortfall in market • High-quality long life Met Coal assets (+20 years) A Proven Track Record Of Delivery For Shareholders • Strong Balance Sheet with embedded Capital Allocation Framework • Disciplined approach to investment in value accretive Growth Strategies • Committed to ESG initiatives CRN - FY23 Results Presentation 7 Shareholder Value Coronado Investment Proposition |
CRN – FY23 Results Presentation 8 Value Enhancement – a well advanced executable plan Higher Tonnages / Lower Costs / Lower Capex / Higher Margins 15.8 FY23 FY24 Est FY25 Est FY26 Est Notes: 2024 – 2026 projections are estimates and should not be taken as guidance. Mmt = Million metric tonnes. Please refer to Important Notices & Disclaimer discussing forward-looking statements on slide 2. Estimated Saleable Production (Mmt) 107.6 FY23 FY24 Est FY25 Est FY26 Est 227.8 FY23 FY24 Est FY25 Est FY26 Est Estimated Mining Costs / tonne Estimated Capital Expenditure ➢ Higher Margins forecast from higher Met Coal sales volumes and lower costs against a backdrop of forecast higher-for-longer Met Coal prices. ➢ Higher Free Cashflow anticipated from improved margins, lower capital expenditure, and uplift from expiration of Stanwell CSA in late FY26 / early FY27. ➢ Value uplift secured without raising additional debt or raising equity. |
CRN - FY23 Results Presentation 9 Capital Management & Financial Performance Gerhard Ziems Group Chief Financial Officer CRN - FY23 Results Presentation 9 |
CRN - FY23 Results Presentation 10 Coronado’s Capital Management Strategy CRN - FY23 Results Presentation 10 1. Strong Balance Sheet 2. Shareholder Returns 3. Organic Growth 4. In-Organic Growth Maintaining a strong balance sheet with enhanced liquidity and prudent debt levels. Fundamental strategy is to return funds to Shareholders. Prioritise growth expenditure projects and expansion to increase existing production rates. Utilise strong balance sheet, to pursue acquisitions of high-quality Met Coal. |
CRN - FY23 Results Presentation 11 Strong Balance Sheet maintained; High closing working capital balance as of 31 December 2023 FY 2023 Summary Financial Results CRN - FY23 Results Presentation 11 Total Group Revenues $2.9 billion (2nd highest in history) Group Realised Price Per Tonne of Met Coal Sold $215.7/t Adjusted EBITDA $382 million Net Income $156 million 91.4% of Total Group Revenues from Met Coal sales Available Liquidity $489 million as of 31 December 2023 $630 million paid in corporate taxes, government royalties and rebates in FY 2023 Group Capital Expenditure investment $228 million |
CRN - FY23 Results Presentation 12 Cash Flow Movement and Liquidity ($M) Coronado generated $268 million in Operating Cash Flows and $23 million in Free Cash Flow in FY 2023. Corporate tax ($147 million), royalties (AUS $295 million; U.S. $51 million), and Stanwell rebate ($137 million) payments contributed to lower cash flows. Closing inventory balance was $192 million, 22% higher compared to 31 December 2022 balance. Increase due to high port stockpiles due to port congestion and delays. Potential additional payment to Queensland government for stamp duty ($54 million) by 11 March 2024. Substantial capital investments for future growth in FY23 23 81 29 69 78 19 Working Capital Notes Interest Paid Tax Paid (Australia) Tax Paid (U.S.) Other Operating Cash Flows FY23 Free Cash Flow Other 8 Capex 237 382 268 FY23 EBITDA FY 2023 Free Cash Flow 335 339 268 238 25 Cash Balance 31 Dec 2022 Operating Cash Flows Investing Cash Flows Financing Cash Flows Cash Balance 31 Dec 2023 Cash Flow Statement Notes: Rounding has been applied as appropriate. Capex refers to cash capital expenditure (inclusive of capital prepayments) and is different to headline capex which includes accruals. Free cash flow is defined as net cash from operating activities less capital expenditure, acquisition expenditure, amounts reserved for capital expenditure and acquisition expenditure and amounts required for debt servicing. Financing Cash Flows are shown net of the effect of exchange rate changes on cash and restricted cash. Available liquidity $489 million at 31 December 2023. CRN - FY23 Results Presentation 12 Includes $482 million (or $31 per tonne) in government royalties and rebates |
CRN - FY23 Results Presentation 13 Coronado declares its biannual fully franked fixed dividend of $8.4 million (US 0.5 cents/CDI) The declaration of the biannual fully franked fixed dividend does not require a matching Senior Secured Notes purchase offer. Coronado continues to pursue organic and in-organic growth opportunities, and in order to provide the Company with maximum flexibility to achieve this strategy, only declares the biannual fixed dividend at this time. Subject to the delivery of our strategic growth plans, on-going operational performance and market conditions, the Board may determine to declare special dividends in future periods. FY 2023 Fixed Biannual Dividend 20 February 2024 Declaration of $8.4 million. (US 0.5 cents/CDI) fully franked dividend per dividend policy Key Dates 12 March 2024 Dividend record date 4 April 2024 Dividend payment date CRN - FY23 Results Presentation 13 |
Metallurgical Coal & Steel Markets CRN - FY23 Results Presentation 14 |
CRN - FY23 Results Presentation 15 Geothermal Hydro Nuclear Bioenergy Electricity networks Concentrated solar Hydrogen Wind power Solar photovoltaic Electric vehicles Steel (Iron Ore/Met Coal) Copper Aluminium Nickel Zinc Silicon Cobalt Graphite Manganese Silver Lithium Platinum Uranium Low to None High Source: McKinsey article “The raw-materials challenge” published 10 January 2022 https://www.mckinsey.com/industries/metals-and-mining/our-insights/the-raw-materials-challenge-how-the-metals-and-mining-sector-will-be-at-the-core-of-enabling-the-energy-transition. Minerals excluded: Dysprosium, Neodymium, Praseodymium, Terbium, Cadmium, Gallium, Iridium and Tellurium Metallurgical Coal has a Long-Term Future Steel is the No. 1 critical commodity to the development of a low carbon future |
CRN - FY23 Results Presentation 16 Energy transition is dependent on Steel; Met Coal is a critical material Steel is used in almost every aspect of the world’s infrastructure, including renewable energy infrastructure Notes: All statistics based on World Steel Association assumption of approximately 780 kilograms (kg) of Met Coal to make one tonne of steel. BOF = Blast Oxygen Furnace steel making; EAF = Electric Arc Furnace steel making. (1) Data sourced from https://www.bridgeclimb.com/explore/construction; (2) Data sourced from https://worldsteel.org/about-steel/steel-facts/; (3) Data sourced from https://worldsteel.org/steel-topics/steel-markets/automotive/; (4) Data sourced from Queensland Resources Council and World Steel Association. Sydney Harbour Bridge (1) 52,800,000 kg steel 41,200,000 kg met coal Three Gorges Hydroelectric Dam (2) 750,000,000 kg steel 585,000,000 kg met coal Average Electric Vehicle (3) 900 kg steel 700 kg met coal Average Wind Turbine (4) 285,000 kg steel 220,000 kg met coal Key global infrastructure projects for growing populations require steel. Steel is used in the construction of hydroelectric power plants around the globe, providing 40% of the world’s global renewable installed capacity in 2020. Electric vehicles are an important step in reducing emissions in transportation and require steel for production. Wind turbines are seen as critical infrastructure to reduce global emissions. Almost every component is made of steel including the foundation, tower, gears and casings. Off-shore wind farms require 2 to 5 times more steel than on-shore. |
CRN - FY23 Results Presentation 17 Steel production generated primarily from Blast Furnace methods Met Coal underpins the primary Steel production method in Asia and Globally through 2050 EAF / other steel production methods are expected to grow over time, but BOF production is forecast to remain the primary method in 2050, particularly in Asia, underpinning a need for high-quality Met Coal. Annual global crude steel production is forecast to grow 17% to 2.2 billion metric tonnes by 2050. Notes: Rounding has been applied. Data sourced from Wood Mackenzie November 2023 Coal Market Service Metallurgical Trade Investment Horizon outlook H2 2023; Bt = Billion metric tonnes; EAF = Electric Arc Furnace steel making; BOF = Blast Oxygen Furnace steel making. Total Global Crude Steel Production (Bt) Total Asia Crude Steel Production Method 2023 2050 1.8 2.2 +17% Total Global Crude Steel Production Method 73% 27% BOF EAF / Other 54% 46% 2023 2050 81% 19% 62% 38% 2023 2050 |
CRN – FY23 Results Presentation 18 Coronado Reserves and Resources Coronado maintains long-life operating assets >20 years; Met Coal resources >2 billion tonnes. Notes: Charts reflect reserves and resources as at 31 December 2023 in million metric tonnes (Mmt). Rounding has been applied. Coal resources are inclusive of coal reserves. Australian resources are reported on a 5.3% in-situ moisture basis. United States resources are reported on a dry basis. Refer market announcement titled Coronado 2023 Statement of Coal Reserves and Resources for Coronado Global Resources Inc., released to the ASX on 20 February 2024, outlining the above information in tabular form and in accordance with the Australasian Code for Reporting of Exploration Results, Mineral Resources and Mineral Reserves, 2012 (JORC Code) and the ASX Listing Rules. Certain reserves and resources may vary to those reported under Subpart 1300 of Regulation S-K promulgated by the SEC. 290 154 135 12 197 50 838 0 200 400 600 800 1,000 936 203 248 55 514 159 2,115 0 500 1,000 1,500 2,000 Reserves (Mmt) 2,500 Resources (Mmt) |
Coronado’s Unique Diversification Advantage Our high-quality Met Coal operations support customers on five continents 19 Notes: (1) Australian full year 2023 export Met coal sales volume mix. (2) Hard Coking Coal (HCC), Semi Coking Coals (SCC), Pulverized Coal Injection (PCI). (3) U.S. full year 2023 Met coal sales volume mix. (4) Group full year 2023 sales revenues split by geographic region, “Other” reflects direct sales to other destinations not listed and includes brokered sales. Europe Japan India Brazil China USA Australia South Korea Australia U.S. Met Coal Product Offering by Segment (1)(2)(3) Geographical Coal Revenue Earned by Segment (4) Canada CRN – FY23 Results Presentation 36% 34% 13% 5% 7% 5% Japan India S Korea Netherlands Australia Other 28% 9% 18% 8% 7% 31% USA / Canada India Brazil Netherlands China Other Australia U.S. 55% 39% 6% HCC PCI SCC 71% 29% Low-Vol High-Vol |
Met Coal prices well above long-term average price Australian Premium Met Coal index $316 per tonne (12 Feb 2024); Higher pricing for longer Notes: (1) Source: S&P Global Platts pricing 31 Dec 2019 to 12 February 2024; PLV HCC FOB AUS = Premium Low-Vol FOB Australian Hard Coking index, LV HCC FOB USEC = Low-Vol Hard Coking US East Coast index, PLV HCC CFR China = Premium Low-Vol Hard Coking China index. (2) Long term average price of $197 per tonne reflects the historical S&P Global Platts PLV HCC FOB AUS price market data between 2007 and 12 February 2024. Calculation data prior to January 2016 is from Bloomberg. (3) Forward curve estimates reflect the SGX Aus Coking Coal forward curve pricing as of 12 February 2024. 315.50 265.00 320.00 120.00 0 100 200 300 400 500 600 700 Dec 2019 Apr 2020 Aug 2020 Dec 2020 Apr 2021 Aug 2021 Dec 2021 Apr 2022 Aug 2022 Dec 2022 Apr 2023 Aug 2023 Dec 2023 PLV HCC FOB AUS LV HCC FOB USEC PLV HCC CFR China NEWC Thermal Long Term Historical Average Met Price $197/t (2) In 2023, Average Australian Met Coal index prices fell 19% compared to prior year; however materially increased since mid-September. Recent price increases due to a combination of tight Australian supply and heightened demand growth from steel makers who had run down inventories. Forward curve pricing projected to be ~$295/tonne in 2024 and to average ~$274/tonne in 2025(3) well above the long-term average. Coronado Met Coal price realisations in 2023 averaged 73%, which is consistent with prior year. Thermal coal prices currently at lowest levels since May 2021. Price 12 Feb 2023 Metallurgical Coal Price Indices (U$/t) (1) CRN – FY23 Results Presentation 20 |
Steel Demand Outlook Remains Firm In Key Markets Infrastructure growth in India forecast to grow substantially 21 Notes: (1) Data source Wood Mackenzie November 2023 GDP Forecasts. (2) Data sourced from AME Metallurgical Coal Strategic Market Study 2023 Q4; Mt = Million metric tonnes. Rounding has been applied. Global economic confidence is expected to improve over 2023 levels as inflationary pressures ease and interest rates stabilise, which will underpin infrastructure projects requiring steel. Infrastructure development and stimulus, particularly in India/China, will underpin their GDP growth rates. India forecast GDP growth rates north of 6.0% in 2024 - 26 and forecast to be ~6% year-on-year for the remainder of the decade. India is Coronado’s largest export customer (24% of total coal revenues). India steel production, and in turn demand for Met Coal, is expected to increase significantly due to urbanisation and industrialisation. India steel growth projected year-on-year and expected to increase by 277% to 531Mt by 2050. 6.4 4.6 3.1 1.9 1.7 1.6 1.6 1.2 6.1 4.8 1.9 1.2 1.9 2.3 2.0 0.7 6.0 4.6 1.8 1.1 1.9 2.1 2.2 0.7 India China Taiwan South Australia Japan Korea USA Brazil 2024 2025 2026 Annual Forecast GDP Growth Percentage (1) 140.8 153.0 162.9 173.4 184.6 220.5 531.3 2023 2024 2025 2026 2027 2030 2050 +277% India Total Crude Steel Production (Mt) (2) CRN – FY23 Results Presentation |
Strong Met Coal Demand Through 2050 Global export Met Coal demand is forecast to grow to 613Mt by 2050, led primarily by blast furnace steel production in India. India export Met Coal demand forecast to increase 283% by 2050. • Coronado with its long-life assets is well positioned, India remains one of our largest export markets. Global export demand growth for Met Coal is underpinned by India; Primary source growth expected to be from Australia. Export Met Coal supply to be primarily sourced from Australia with existing supply to almost double existing levels to meet projected 2050 demand. • Australia is forecast to supply 312Mt (51%) of all export Met Coal to the world by 2050. Global Export Met Coal Supply (Mt) Global Export Met Coal Demand (Mt) 167 201 312 42 56 60 29 50 66 171 46 33 29 27 39 2023 25 2030 19 2050 360 419 613 21 +88% Other Mongolia Russia Canada U.S. Australia 75 127 287 95 81 60 101 94 91 63 71 76 88 13 4 2023 16 25 2030 24 2050 358 418 613 +283% Other Brazil Indonesia JKT China India Notes: Forecast data sourced from AME Metallurgical Coal Strategic Market Study 2023 Q4; Mt = Million metric tonnes. Rounding has been applied. (1) Coronado calculation based on publicly available information regarding existing Australian mine producing capacity. 22 Potential(1) Australian Met Coal supply shortfall of ~145Mt given low new mine approval rates India projected to more than triple export Met Coal demand by 2050 CRN – FY23 Results Presentation |
FY24 Initiatives, Guidance & Organic Growth Investment Plans Douglas Thompson Managing Director & CEO CRN – FY23 Results Presentation 23 |
FY 2024 Guidance and Key Strategic Focus Areas Asset optimisation of our existing assets and continued investment in highly accretive organic growth projects are our key strategic focus areas Metric (metric tonnes / U.S. dollars) Actual FY 2023 Guidance FY 2024 Saleable Production (Mmt) 15.8 16.4 – 17.2 Mining Cost per Tonne Sold ($/t) 107.6 95 – 99 Capital Expenditure ($) 227.8 220 – 250 Coronado Strategic Priorities: ➢ The Safety of our people. ➢ Asset Optimisation - Deliver operational and commercial excellence by optimising our high-quality asset base, enhancing efficiencies and reducing costs, while delivering on our sustainability commitments. ➢ Strategic Growth - Significantly progress our organic growth pipeline at Buchanan and Curragh; investigate optionality for incremental production beyond our near-term goals; remain alert to inorganic growth opportunities. ➢ Capital Management - Maintain a responsible capital management strategy and strong balance sheet to enable delivery of our growth plans and shareholder distributions, while ensuring financial sustainability and value creation. Saleable Production levels are expected to increase in the U.S. post development of the Southern District at Buchanan and at Curragh following FY22/23 recovery of historic pre-strip/waste movement deficit, and anticipated recovery from wet weather. Mining cost per tonne sold expected to decrease due to higher production and the elimination of three contractor fleets at Curragh. Capital expenditure levels are expected to broadly align with FY23 given continued investment in expansionary organic growth projects at Curragh (UG project) and Buchanan (stockpile expansion, second set of skips). CRN – FY23 Results Presentation 24 Notes: Mining Cost per Tonne Sold assumes and AUD”: USD foreign exchange rate assumption of 0.67 for FY24. |
Operating restructure optimise efficiency and production Curragh is one of the largest coking coal mines on the planet with 936 million tonnes of resources, approx. 20-year mine life. Produces a range of HCC, SCC and PCI products with a loyal customer base. The consistent low-volatile, low-ash characteristics of Curragh’s coal means it benefits from strong demand from steel mills globally, particularly in Asia. Curragh Complex CRN - FY23 Results Presentation 25 FY 2024 Priorities: ➢ Operating restructure splits complex into three distinct operating units (Curragh North, Curragh South, Curragh Underground) ➢ Final step under the One Curragh Plan that has seen Coronado optimise the mine plan, remove complexity and enable growth. ➢ Streamlined structure provides greater oversight of operations for improved efficiencies, higher production and lower costs. ➢ Benefits targeted in FY24 from One Curragh Plan works achieved to date: ▪ Reduction in truck and excavator fleets from 16 to 13 in late Q1 2024. ▪ Ratio of waste material moved by Draglines to Truck/Shovel/Excavator to increase to 44% (from 37%). ▪ Lower strip ratio in FY24 post record waste movement recovery works in prior year. ▪ Contractor / procurement rationalization. ▪ Investment in expansion capital to unlock the Underground and Gas projects. Targeting 13.5 Mt from Curragh by 2025. |
Curragh Underground Project Met Coal uplift 2 Mtpa, 2nd quartile cost curve, Low Capex, 13.5 Mtpa by 2025 Coal Reserve, Quality and Mining Method Underground Bord and Pillar operation; Access utilizing existing open cut pit highwall in S-Pit Substantial high-quality Met coal reserve 41 million ROM tonnes to be mined in addition to existing open-cut mine Coal quality expected to mirror existing Curragh North open-cut Proposed highwall access points in S-Pit Project Timeline and Production First coal targeted for late 2024, subject to regulatory approvals Substantial exploration (drilling and seismic survey) complete to prove reserve and assess geotechnical and washability Project on target – Phase 1 target: 1.5 – 2.0 Mtpa Saleable Production (once ramped up and fully operational) Project costs expected to be in the 2nd quartile of cost curve averaging down Group/Curragh costs per tonne and the impact of the Stanwell rebate Project capex estimate of $105 million Critical Path Procurement of equipment (Continuous miners, Shuttle cars etc.) Regulatory approvals CRN – FY23 Results Presentation 26 Southern section of S-Pit, Curragh North Map of Curragh North and proposed underground seams |
Potential Substantial Future Value Uplift – Curragh(1) Estimated EBITDA uplift of ~$290 million(3) per year upon expiration of existing Stanwell coal supply arrangement (CSA) and Rebate from late 2026 / early 2027 27 Notes: Rounding has been applied. (1) Please refer to Important Notices & Disclaimer discussing forward-looking statements on slide 2. Valuation uplift figures quoted in this slide are internally generated estimates and extrapolated based on actual results incurred between 2021 and 2023. Coronado cannot guarantee in future years these extrapolated estimates quoted will occur. (2) Average of columns FY 2021 – FY 2023. (3) Rounded estimated EBITDA uplift excludes impacts of royalties on additional export tonnages. Calculated based on an estimate of $120 million cost reduction from the removal of the rebate and estimated $170 million revenue uplift (approx. $170/t uplift based on estimated pricing x 1 Mtpa). CRN – FY23 Results Presentation Stanwell Rebate (metric tonnes / U.S. dollars) FY 2021 FY 2022 FY 2023 Average(2) Stanwell Rebate $55 million $166 million $137 million $120 million Equivalent Cost per Tonne (Group Level)(3) $3/t $10/t $9/t $7/t Curragh Valuation Uplift: ➢ Estimated cost benefit of $120 million or ~$7/t ($12/t at the Curragh level) per year. Stanwell rebate expected to expire in late 2026 / early 2027. ➢ Stanwell New Coal Supply Arrangement (NCSA) commences upon expiration of CSA, expected in late 2026 / early 2027. ➢ Extra 1Mtpa to be sold as export LV-PCI, NCSA requires 2 Mtpa (down from 3 Mtpa) to be supplied to the Power Station, enabling an estimated revenue uplift from expiration of CSA of approx. $170 million per year for extra 1 Mtpa export Met Coal. ~$290 million EBITDA per year valuation uplift to Curragh and the Group |
U.S. Operations Met Coal Uplift +1 Mtpa; 7 Mtpa by 2025; Optimised operational performance FY 2024 Priorities: ➢ Improved flexibility and productivity gains following major milestone works in establishing the North and South mining districts at Buchanan (pictured). ➢ Lower costs / higher productivity given Southern district development costs complete; shorter conveyor distances; closer proximity to hoists for people, material and coal movement. ➢ Well advanced capital expansion works at Buchanan on second set of skips and additional surface stockpile space. ➢ Higher production at Logan from re-entry at Powellton UG and expanded surface works with the addition of high-wall mining. ➢ Targeting 7.0 Mt from the U.S. segment by 2025. CRN – FY23 Results Presentation 28 Buchanan Mine Southern District Northern District Buchanan is one of the largest producing and lowest cost Met Coal underground operations in the U.S. producing Low-Vol HCC and PCI popular in Asia, Europe and domestically. Buchanan is extremely well capitalised with 2 x longwalls and underground storage facilities. The Logan complex operates 4 x bord and pillar underground operations and surface operations. Logan produces a mixture of High-Vol A and B products popular domestically, Canada and some Asian locations. Development works completed Hoists Underground Bunker |
Organic Growth - Buchanan Buchanan capital works remain on target underpinning U.S. growth plans to produce 7.0Mtpa by 2025 CRN – FY23 Results Presentation 29 Mining underway in the newly developed South District, utilising new equipment. Capital works continue to invest in the construction of a new surface raw coal storage area to increase the mine’s storage capacity, ultimately reducing the risk of bottlenecks and allowing the longwall equipment to run at a higher capacity. ▪ Scheduled completion of the excavation works is April 2024, with the full project completion expected in early 2025. Construction of a second set of skips to increase the mines hoisting capacity to the surface continue. ▪ Excavation works for the production hoist and surface infrastructure ~40% complete. Project completion expected mid-2025. Plans under review to implement upgrades to the Buchanan preparation plant to increase throughput and yield, boosting U.S. Saleable Production beyond 7.0Mtpa beyond 2025. Surface Infrastructure Underground Infrastructure Installation progressing on second set of skips - Buchanan Lower Water Ring Steel Sets Receiving Bin Loader Skip Hoist House Skip Surge Bin Existing Shaft |
Rehabilitation, Emissions Reduction and Sustainability CRN – FY23 Results Presentation 30 |
Significant Rehabilitation Works Completed Past 2 Years 269 hectares completed since January 2022 (Curragh 171ha, Logan 95 ha, Greenbrier 13ha, Buchanan 4ha); More works planned in FY24 at Curragh following heavy wet weather in late FY23 CRN – FY23 Results Presentation 31 Logan Surface Greenbrier Curragh North |
Buchanan Ventilation Air Methane (VAM) Abatement Projects VAM units utilise the latest technology (RTO – Reductive Thermal Oxidation) to convert fugitive methane gas emissions to CO2. Given its success, construction of a second VAM unit at Vent Shaft 18 is underway, due for completion in mid-2024 (pictured). 30% reduction on track. Proven technology delivering tangible reduction in emissions Coronado is investing in additional emission reduction projects, but it is anticipated that these VAM unites alone will see us meet our 30% emission reduction target by 2030. CRN 32 – FY23 Results Presentation Infrastructure works on the 2nd VAM unit at Vent Shaft 18 - Buchanan Since commencing in mid-2022, Buchanan VAM unit at Vent Shaft 16 has eliminated 264,850 tCO2e, with a 95% emission destruction efficiency. |
Curragh Gas Project Curragh’s gas project is targeting the capture and beneficial use of open-cut waste mine coal gas from operations, with priority downstream use cases being for power generation and use as a diesel substitute in mining fleets. Wells Operational. Surface production facility installation works complete CRN 33 – FY23 Results Presentation Curragh Gas Project surface infrastructure Well completions were finalised in late 2023 and surface production facility installation works completed. Wells are online and operational from late-January 2024. |
CRN - FY23 Results Presentation 34 Questions CRN - FY23 Results Presentation 34 |
CRN - FY23 Results Presentation 35 Reconciliation of Non -GAAP measures This report discusses results of the Company’s operations and includes references to and analysis of certain non -GAAP measures, which are financial measures not recognized in accordance with U .. S .. GAAP .. Non -GAAP financial measures are used by the Company and investors to measure operating performance. Management uses a variety of financial and operating metrics to analyze performance. These metrics are significant in assessing operating results and profitability .. These financial and operating metrics include : (i) safety and environmental statistics ; (ii) Adjusted EBITDA, (iii) total sales volumes and average realised price per Mt sold, which we define as total coal revenues divided by total sales volume ; (iv) Metallurgical coal sales volumes and average realized Metallurgical coal price per tonne sold, which we define as metallurgical coal revenues divided by metallurgical sales volume ; (v) Mining costs per Mt sold, which we define as mining cost of coal revenues divided by sales volumes (excluding non -produced coal) for the respective segment ; (vi) Operating costs per Mt sold, which we define as operating costs divided by sales volumes for the respective segment. Investors should be aware that the Company’s presentation of Adjusted EBITDA and other non -GAAP measures may not be comparable to similarly titled financial measures used by other companies .. We define Net Cash as cash and cash equivalents (excluding restricted cash) less the outstanding aggregate principal amount of the 10 ..750 % senior secured notes due 2026 .. Reconciliations of certain forward -looking non -GAAP financial measures, including our 2024 Mining Cost per Tonne Sold guidance, to the most directly comparable GAAP financial measures are not provided because the Company is unable to provide such reconciliations without unreasonable effort, due to the uncertainty and inherent difficulty of predicting the occurrence and the financial impact of items impacting comparability and the periods in which such items may be recognised. For the same reasons, the Company is unable to address the probable significance of the unavailable information, which could be material to future results. CRN - FY23 Results Presentation 35 |
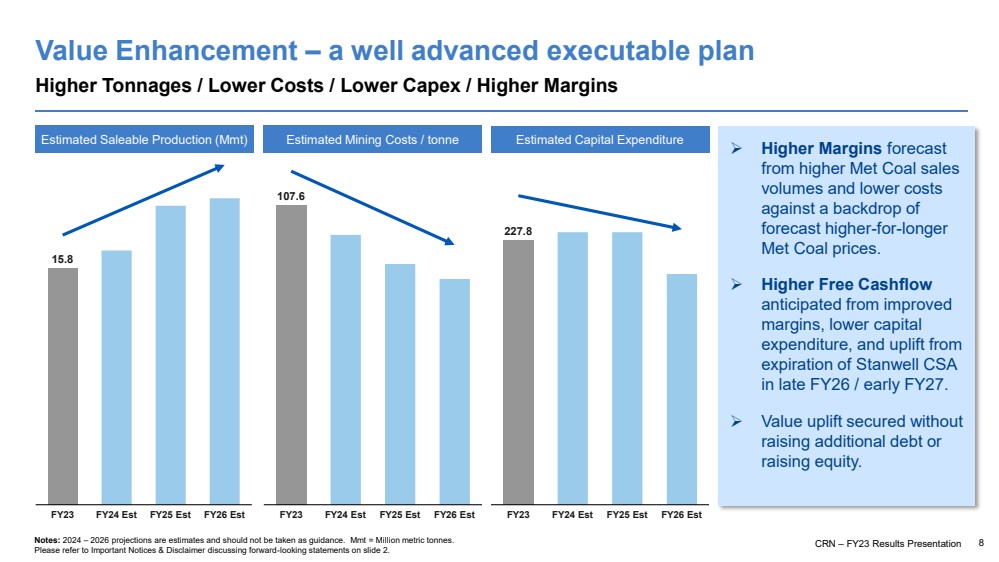
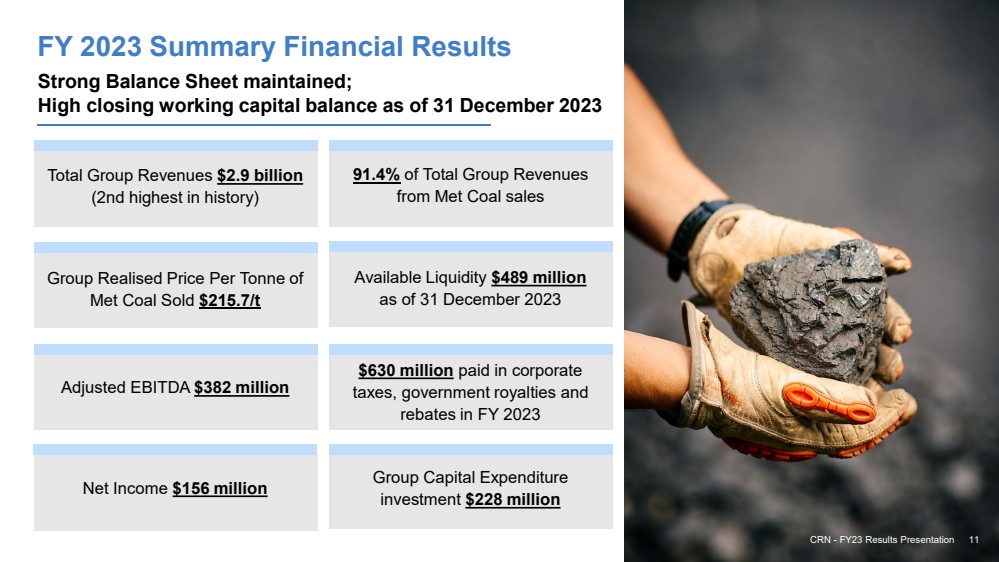
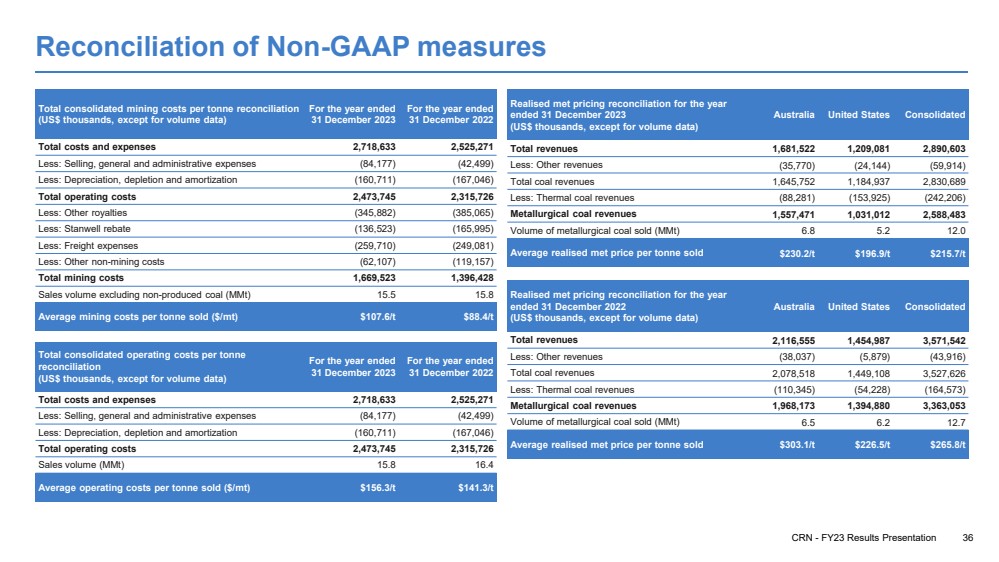
CRN - FY23 Results Presentation 36 Reconciliation of Non-GAAP measures Total consolidated mining costs per tonne reconciliation (US$ thousands, except for volume data) For the year ended 31 December 2023 For the year ended 31 December 2022 Total costs and expenses 2,718,633 2,525,271 Less: Selling, general and administrative expenses (84,177) (42,499) Less: Depreciation, depletion and amortization (160,711) (167,046) Total operating costs 2,473,745 2,315,726 Less: Other royalties (345,882) (385,065) Less: Stanwell rebate (136,523) (165,995) Less: Freight expenses (259,710) (249,081) Less: Other non-mining costs (62,107) (119,157) Total mining costs 1,669,523 1,396,428 Sales volume excluding non-produced coal (MMt) 15.5 15.8 Average mining costs per tonne sold ($/mt) $107.6/t $88.4/t Realised met pricing reconciliation for the year ended 31 December 2023 (US$ thousands, except for volume data) Australia United States Consolidated Total revenues 1,681,522 1,209,081 2,890,603 Less: Other revenues (35,770) (24,144) (59,914) Total coal revenues 1,645,752 1,184,937 2,830,689 Less: Thermal coal revenues (88,281) (153,925) (242,206) Metallurgical coal revenues 1,557,471 1,031,012 2,588,483 Volume of metallurgical coal sold (MMt) 6.8 5.2 12.0 Average realised met price per tonne sold $230.2/t $196.9/t $215.7/t Total consolidated operating costs per tonne reconciliation (US$ thousands, except for volume data) For the year ended 31 December 2023 For the year ended 31 December 2022 Total costs and expenses 2,718,633 2,525,271 Less: Selling, general and administrative expenses (84,177) (42,499) Less: Depreciation, depletion and amortization (160,711) (167,046) Total operating costs 2,473,745 2,315,726 Sales volume (MMt) 15.8 16.4 Average operating costs per tonne sold ($/mt) $156.3/t $141.3/t Realised met pricing reconciliation for the year ended 31 December 2022 (US$ thousands, except for volume data) Australia United States Consolidated Total revenues 2,116,555 1,454,987 3,571,542 Less: Other revenues (38,037) (5,879) (43,916) Total coal revenues 2,078,518 1,449,108 3,527,626 Less: Thermal coal revenues (110,345) (54,228) (164,573) Metallurgical coal revenues 1,968,173 1,394,880 3,363,053 Volume of metallurgical coal sold (MMt) 6.5 6.2 12.7 Average realised met price per tonne sold $303.1/t $226.5/t $265.8/t |
CRN - FY23 Results Presentation 37 Reconciliation of Non-GAAP measures Adjusted EBITDA reconciliation (US$ thousands) For the year ended 31 December 2023 For the year ended 31 December 2022 Net income 156,065 771,703 Add: Depreciation, depletion and amortization 160,711 167,046 Add: Interest expense, net 56,751 67,632 Add: Other foreign exchange gains (2,899) (32,259) Add: Loss on debt extinguishment 1,385 5,336 Add: Income tax (benefit) / expense (32,251) 231,574 Add: Uncertain stamp duty position 41,321 - Add: Losses on idled assets held for sale 4,846 771 Add: (Decrease) / Increase in provision for discounting and credit losses (4,216) 3,821 Adjusted EBITDA 381,713 1,215,624 Realised total pricing reconciliation (US$ thousands, except for volume data) For the year ended 31 December 2023 For the year ended 31 December 2022 Total revenue 2,890,603 3,571,542 Less: Other revenues (59,914) (43,916) Total coal revenues 2,830,689 3,527,626 Sales volume (MMt) 15.8 16.4 Average realised price per tonne sold $178.8/t $215.3/t Net cash reconciliation (US$ thousands) 31 December 2023 31 December 2022 Cash and cash equivalents 339,294 334,629 Less: Restricted cash (251) (251) Cash and cash equivalents (excluding restricted cash) 339,043 334,378 Less: Aggregate principal amount of 10.750% senior secured notes due 2026 (242,326) (242,326) Net cash 96,717 92,052 Free cash flow reconciliation (US$ thousands) For the year ended 31 December 2023 Net cash provided by operating activities 268,282 Less: Capital expenditure (237,205) Less: Other financing commitments (7,924) Free cash flow 23,153 |
Investors Andrew Mooney Vice President Investor Relations & Communications +61 458 666 639 amooney@coronadoglobal.com investors@coronadoglobal.com Registered Office Coronado Global Resources Inc. Level 33, Central Plaza One 345 Queen Street Brisbane, QLD, Australia, 4000 GPO Box 51, Brisbane QLD, Australia, 4000 +61 7 3031 7777 +61 7 3229 7401 coronadoglobal.com Media Helen McCombie Citadel Magnus +61 411 756 248 hmccombie@citadelmagnus.com Contacts |