As filed with the U.S. Securities and Exchange Commission on February 4, 2021
UNITED STATES
SECURITIES AND EXCHANGE COMMISSION
Washington, D.C. 20549
FORM N-CSR
CERTIFIED SHAREHOLDER REPORT OF REGISTERED
MANAGEMENT INVESTMENT COMPANIES
Investment Company Act file number (811-23450)
Global Beta ETF Trust
(Exact name of registrant as specified in charter)
2001 Market Street, Suite 2630
Philadelphia, PA 19103
(Address of principal executive offices) (Zip code)
Vince Lowry
2001 Market Street, Suite 2630
Philadelphia, PA 19103
(Name and address of agent for service)
(215) 531-8234
Registrant's telephone number, including area code
Date of fiscal year end: November 30
Date of reporting period: November 30, 2020
Item 1. Reports to Stockholders.
|

Annual Report
November 30, 2020
Global Beta ETF Trust
● Global Beta Smart Income ETF | | GBDV | | NYSE Arca |
● Global Beta Low Beta ETF | | GBLO | | NYSE Arca |
● Global Beta Momentum-Growth ETF | | GBGR | | NYSE Arca |
Global Beta ETF Trust |
|
Table of Contents
Page | |
Shareholder Letter | 1 |
Management’s Discussion of Fund Performance | 3 |
Global Beta Smart Income ETF | 3 |
Global Beta Low Beta ETF | 6 |
Global Beta Momentum-Growth ETF | 9 |
Schedule of Investments | 12 |
Statement of Assets and Liabilities | 21 |
Statement of Operations | 22 |
Statement of Changes in Net Assets | 23 |
Financial Highlights | 26 |
Notes to the Financial Statements | 29 |
Report of Independent Registered Accounting Firm | 36 |
Expense Example | 37 |
Approval of Advisory Agreement and Board Considerations | 39 |
Trustees and Officers | 41 |
Funds’ Liquidity Risk Management Program | 44 |
Additional Information | 45 |
Shareholder Letter | Global Beta ETF Trust |
November 30, 2020
Dear Shareholder,
From the time I wrote to you at the conclusion of our semi-annual period ending 05/31/2020, we have seen global markets soar to record valuations. There were several factors that contributed to this phenomenon: the re-opening of several shuttered businesses as a result of the COVID-19 pandemic, the federal reserve’s pledge to indefinitely keep interest rates at 0% and potentially additional accommodations, and the rise of retail brokerage activity.
In particular, the U.S. growth markets saw an enormous run up during the summer months in the wake of record earnings growth due to technological needs derived from the work/communicate remotely lifestyle resulting from the pandemic as well as the introduction of new investors pouring into the market place. From 05/31/20 through 08/31/20, the S&P 500 Growth Index returned 22.05%, which represented the 5th highest 3-month return for the index, dating back to 1991 (Source: Factset Research Systems). As a result, this saw the price-to-sales multiple of the S&P 500 Growth Index balloon to 4.98, which was a nearly 50% premium to its 3.37 5-year average, trailing from 08/31/20 (Source: Factset Research Systems). From 03/31/95 through 08/31/20, the S&P 500 Growth Index’s average 1-year, 5-year, and 10-year forward looking returns, from any point in time where the S&P 500 Growth Index’s price-to-sales ratio was above 3.5, were all negative (Source: Factset Research Systems). Consequently, the back half of this 6-month period, spanning from 08/31/20 through 11/30/20, has seen the S&P 500 Growth Index return 1.35% (Source: Factset Research Systems)
In our market commentary in October, we noted our concern with market volatility heading through the end of the year. September and October are generally two of the most volatile months in the calendar year, and they certainly lived up to their historical trend as the S&P 500 returned -6.36% from 08/31/20 through 10/31/20 (Source: Factset Research Systems).
In the middle of October, the November VIX futures options were indicating significant volatility ahead. The catalysts to that volatility were the election, the anticipated release of Pfizer-BioNTech’s and Moderna’s COVID-19 vaccine trial data, and concern about rising COVID-19 cases and hospitalizations as most of the country was heading into the flu season while experiencing much colder climates, leading to more indoor congregations. As a result, investors saw significant volatility in the 2nd half of October and through November, aside from a brief market rally earlier in November on the promising news from Pfizer-BioNTech’s vaccine trial data.
With much of the country in the middle of the flu season, and as they have settled into the winter months, hospitalizations have soared with both COVID-19 and flu patients as people congregate more indoors, which have sparked fears that the economy may be looking at another economic slowdown or even another economic lockdown. We believe an economic lockdown is unlikely, considering the very low political appetite that a decision like that would have at this point. However, we do expect targeted mitigation steps to continue throughout the country, and that some consumers will choose not to leave their homes as often as they may have in the prior months. This may wear on the economy in the fourth quarter, and it appears that the markets are beginning to price that in. It remains to be seen whether consumer spending during the holiday season may help offset some of those pressures.
However, as we look forward, based on our assessment, consumer cyclicals, value, and size are likely to see significant benefits once more federal stimulus is introduced following president-elect Joe Biden’s inauguration in the new year, and thus, are likely market catalysts in the new year. However, given that we could face a divided Congress, we expect the stimulus to be fairly modest, although, any stimulus at all will certainly propel the aforementioned sectors of the market. Although growth may underperform, we believe value can be found in the growth sector of the market through mid and small cap companies that are emerging. Overall, putting a lid on COVID-19 cases will be paramount for the market to move forward and determine the market’s go forward leadership.
Thank you and stay safe.

Justin Lowry
President and CIO, Global Beta Advisors, LLC
Must be preceded or accompanied by a prospectus.
Investing involves risk, including the possible loss of principal. Shares of any ETF are bought and sold at market price (not NAV), may trade at a discount or premium to NAV and are not individually redeemed from a Fund. Brokerage commissions will reduce returns.
The Funds’ return may not match or achieve a high degree of correlation with the return of the underlying index.
The Funds are subject to the risks of investing in equity securities. Please refer to the prospectus for a more detailed explanation of the Funds’ principal risks. There is no assurance that the investment objectives of the Funds will be achieved.
| 1 |

Shareholder Letter (Continued) | Global Beta ETF Trust |
November 30, 2020
Diversification does not assure a profit or protect against a loss in a declining market.
Global Beta Smart Income ETF, Global Beta Low Beta ETF and Global Beta Momentum-Growth ETF are distributed by Compass Distributors, LLC.
Index Definitions
S&P 500® Index: An unmanaged, market capitalization-weighted index of 500 stocks of leading large-cap U.S. companies in leading industries; gives a broad look at the U.S. equities market and those companies’ stock price performance. Indexes are unmanaged and have been provided for comparison purposes only. No fees or expenses have been reflected. Individuals cannot invest directly in an index.
S&P 500® Growth Index: Measures growth stocks using three factors: sales growth, the ratio of earnings change to price, and momentum. S&P Style Indices divide the complete market capitalization of each parent index into growth and value segments. Constituents are drawn from the S&P 500®.
| 2 |

Management’s Discussion of Fund Performance | Global Beta Smart Income ETF |
November 30, 2020
The Global Beta Smart Income ETF’s (the “Fund” or “GBDV”) seeks to track the performance (before fees and expenses) of the Global Beta Smart Income Index (the “Target Index”). The Target Index is comprised of equity securities of U.S. companies in the highest quintile of the average twelve month trailing dividend yield over each of the prior four quarters in the S&P 900 (a broad-based benchmark index), and that rank in the top half of their respective GICS sector classification. The constituent securities of the Target Index are weighted based on their revenue, with each individual index constituent capped at 5% at each quarterly rebalance.
For the period, which spans from the Fund’s inception of 12/27/19 through the end of the Fund’s annual period of 11/30/20, the Fund underperformed its benchmark, the S&P 900 Index. For the period, the Fund’s net asset value (“NAV”) return was -10.35% and the Fund’s market price return was -10.54%1. The benchmark return was 13.26% during the same period. The Fund’s market price at 11/30/20 was $17.14.
As mentioned in the fund discussion from the end of the semi-annual period, we believe the underperformance was largely attributed to the recession from the COVID-19 global health pandemic. The recession caused significant strain on the balance sheet of many companies around the world, which in turn, caused substantial uncertainty as to whether dividend paying companies would be able to make their regular dividend payments. This uncertainty led to a significant sell off in high dividend paying securities. However, as the economy has begun to come out of the recession with the reopening of businesses as well as recent developments suggesting that therapeutics and vaccines will potentially put an end to the global health pandemic in the near term; economically sensitive securities, such as dividend paying stocks, have begun to perform much better. In fact, GBDV has begun to outperform its benchmark as the fund’s NAV returned 21.60% vs 20.21% for the S&P 900 Index from the end of the semi-annual period, 05/31/20, through the end of the fund’s fiscal year end of 11/30/20.
Frequency Distribution of Premium and Discounts — Information concerning the number of days that the Fund trades at a premium or discount can be found on the Funds’ website, www.globalbetaetf.com.
ALLOCATION BY SECTOR | |
Sector | Percentage of |
Financials | 21.4% |
Information Technology | 15.0 |
Utilities | 12.6 |
Materials | 10.9 |
Consumer Staples | 10.8 |
Communication Services | 9.8 |
Health Care | 6.6 |
Industrials | 4.9 |
Energy | 3.0 |
Consumer Discretionary | 2.7 |
Real Estate | 2.3 |
Short-Term Investments and Other Assets and Liabilities | 0.0* |
Total | 100.0% |
* | Represents less than 0.05% of net assets. |
1. | A fund’s per share NAV is the value of one share of the Fund. NAV is calculated by taking the Fund’s total assets (including the market value of securities owned), subtracting liabilities, and dividing by the number of shares outstanding. The NAV Return is based on the NAV of the Fund, and the Market Price Return is based on the market price per share of the Fund. The price used to calculate market return (‘‘Market Price’’) is determined by using the midpoint between the highest bid and the lowest offer on the primary stock exchange on which the shares of the Fund are listed for trading, as of the time that the Fund’s NAV is calculated. NAV is used as a proxy for purposes of calculating Market Price Return on inception date. Market Price and NAV returns assume that dividends and capital gain distributions have been reinvested in the Fund at Market Price and NAV, respectively. |
| 3 |

Fund Performance | Global Beta Smart Income ETF |
November 30, 2020
Performance (Cumulative Total Return as of November 30, 2020)
1-Month | 3-Month | 6-Month | 9-Month | Since | |
Global Beta Smart Income ETF | |||||
NAV | 14.85% | 12.15% | 21.60% | 4.84% | -10.35% |
Market | 15.10% | 11.96% | 21.80% | 5.18% | -10.54% |
Target Index | 14.80% | 12.13% | 21.80% | 4.66% | -10.55% |
S&P 900 Index | 11.14% | 4.40% | 20.21% | 24.09% | 13.26% |
Growth of $10,000 Investment
(At Net Asset Value)
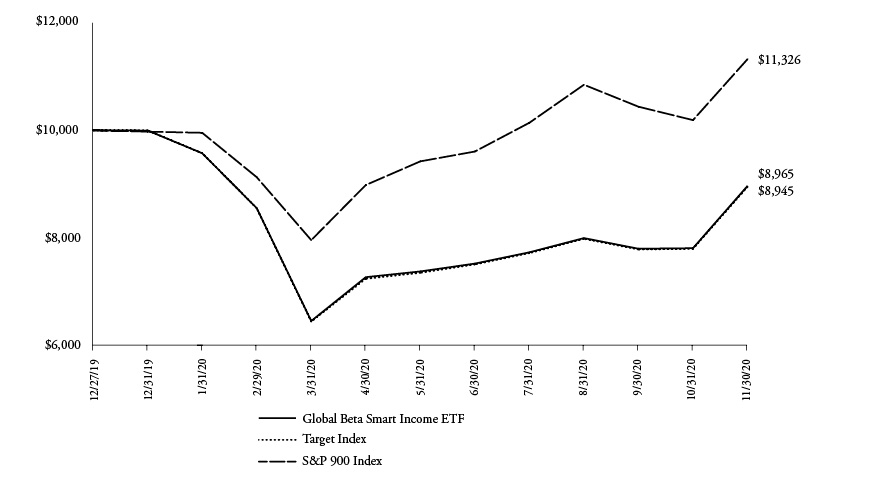
Performance measured by NAV differs from the Target Index primarily due to Fund fees and expenses and taxes.
(*) | Commencement of investment operations on December 27, 2019. |
This chart assumes an initial gross investment of $10,000 made on December 27, 2019 and reflects the fees charged on an account. Returns shown include the reinvestment of all dividends, if any, but do not include the deduction of taxes that a shareholder would pay on Fund distributions or the redemption of Fund shares. Past performance is not predictive of future performance. Investment return and principal value will fluctuate, so your shares, when redeemed, may be worth more or less than the original cost.
Past performance is no guarantee of future results. Financial markets have experienced extreme volatility and trading in many instruments has been disrupted. These circumstances may continue for an extended period of time and may continue to affect adversely the value and liquidity of the Fund’s investments. As a result, current performance may be lower or higher than the performance data quoted. Performance data current to the most recent month-end is available at www.globalbetaetf.com. Performance results assume reinvestment of all dividends and capital gain distributions and do not reflect the deduction of taxes that a shareholder would pay on fund distributions or on the redemption or sale of fund shares. The investment return and principal value of shares will vary with changes in market conditions. Shares may be worth more or less than their original cost when they are redeemed or sold in the market. Returns less than one year are not annualized. Performance for certain funds may reflect a waiver of a portion of investment advisory fees. Without such a
| 4 |

Fund Performance (Continued) | Global Beta Smart Income ETF |
November 30, 2020
waiver, performance would have been lower. As stated in the current prospectus, the Fund’s investment adviser, Global Beta Advisors LLC (“Adviser”), has agreed to reimburse the Fund through March 31, 2021 for the (i) compensation and expenses of the Trustees who are not interested persons as defined under Section 2(a)(19) of the Investment Company Act of 1940 (the “Independent Trustees”), and (ii) fees and expenses of counsel to the Independent Trustees, except for any (a) litigation expenses (including litigation to which the Trust or the Fund may be a party and indemnification of the Independent Trustees with respect thereto), and (b) extraordinary or non-routine fees or expenses. As stated in the current prospectus, the current gross and net expense ratios are 0.49% and 0.29% respectively. Please refer to the Financial Highlights herein for the most recent expense ratio information.
An index is a statistical composite that tracks a specified financial market or sector. Unlike a fund, an index does not actually hold a portfolio of securities and therefore does not incur the expenses incurred by a fund. These expenses negatively impact fund performance. Also, market returns do not include brokerage commissions that may be payable on secondary market transactions. If brokerage commissions were included, market returns would be lower. Individuals cannot invest directly in an index.
| 5 |

Management’s Discussion of Fund Performance | Global Beta Low Beta ETF |
November 30, 2020
The Global Beta Low Beta ETF (the “Fund” or “GBLO”) seeks to track the performance (before fees and expenses) of the Global Beta Low Beta Factor Index (the “Target Index”). The Target Index is comprised of equity securities of U.S. companies from the S&P 500 (a broad-based benchmark index) in the lowest quintile (i.e., the lowest 20% of the S&P 500) based on their twelve month trailing beta relative to the S&P 500. Beta is a measure of the relative volatility of a security as compared to the market. The constituent securities of the Target Index are weighted based on their revenue, with each individual index constituent capped at 5% at each quarterly rebalance.
For the period, which spans from the Fund’s inception of 7/24/20 through the end of the Fund’s annual period of 11/30/20, the Fund underperformed its benchmark, the S&P 500 Index. For the period, the Fund’s net asset value (“NAV”) return was 8.06% and the Fund’s market price return was 7.97%1. The benchmark return was 12.62% during the same period. The Fund’s market price at 11/30/20 was $21.54.
We believe this underperformance was largely due to the major run up in the S&P 500 Index for the month of August, where momentum dominated the market and little volatility existed. However, for the months of September and October, where volatility began to creep back into the market, GBLO outperformed the S&P 500 Index with a fund NAV return of -5.56% vs. the S&P 500 Index’s return of -6.36%. GBLO is expected to outperform the broad market in times of volatility and when cyclicals perform well, but typically will underperform when growth and momentum stocks are in favor. As uncertain times may still lie ahead as continues continue to battle the COVID-19 health pandemic and restore their respective economies, the market may continue to see market volatility, which may lend to stronger relative performance in GBLO. Even absent market volatility; better performance from economically sensitive securities may lend to better relative performance for GBLO versus the S&P 500 Index.
Frequency Distribution of Premium and Discounts — Information concerning the number of days that the Fund trades at a premium or discount can be found on the Funds’ website, www.globalbetaetf.com.
ALLOCATION BY SECTOR | |
Sector | Percentage of |
Consumer Staples | 34.5% |
Health Care | 26.1 |
Consumer Discretionary | 12.7 |
Communication Services | 11.0 |
Industrials | 8.3 |
Utilities | 2.4 |
Financials | 2.2 |
Information Technology | 1.3 |
Materials | 0.9 |
Real Estate | 0.3 |
Short-Term Investments and Other Assets and Liabilities | 0.2 |
Energy | 0.1 |
Total | 100.0% |
1. | A fund’s per share NAV is the value of one share of the Fund. NAV is calculated by taking the Fund’s total assets (including the market value of securities owned), subtracting liabilities, and dividing by the number of shares outstanding. The NAV Return is based on the NAV of the Fund, and the Market Price Return is based on the market price per share of the Fund. The price used to calculate market return (‘‘Market Price’’) is determined by using the midpoint between the highest bid and the lowest offer on the primary stock exchange on which the shares of the Fund are listed for trading, as of the time that the Fund’s NAV is calculated. NAV is used as a proxy for purposes of calculating Market Price Return on inception date. Market Price and NAV returns assume that dividends and capital gain distributions have been reinvested in the Fund at Market Price and NAV, respectively. |
| 6 |

Fund Performance | Global Beta Low Beta ETF |
November 30, 2020
Performance (Cumulative Total Return as of November 30, 2020)
1-Month | 3-Month | Since | |
Global Beta Low Beta ETF | |||
NAV | 8.17% | 2.15% | 8.06% |
Market | 8.34% | 1.99% | 7.97% |
Target Index | 8.21% | 2.14% | 8.11% |
S&P 500 Index | 10.95% | 3.89% | 12.62% |
Growth of $10,000 Investment
(At Net Asset Value)

Performance measured by NAV differs from the Target Index primarily due to Fund fees and expenses and taxes.
(*) | Commencement of investment operations on July 24, 2020. |
This chart assumes an initial gross investment of $10,000 made on July 24, 2020 and reflects the fees charged on an account. Returns shown include the reinvestment of all dividends, if any, but do not include the deduction of taxes that a shareholder would pay on Fund distributions or the redemption of Fund shares. Past performance is not predictive of future performance. Investment return and principal value will fluctuate, so your shares, when redeemed, may be worth more or less than the original cost.
Past performance is no guarantee of future results. Financial markets have experienced extreme volatility and trading in many instruments has been disrupted. These circumstances may continue for an extended period of time and may continue to affect adversely the value and liquidity of the Fund’s investments. As a result, current performance may be lower or higher than the performance data quoted. Performance data current to the most recent month-end is available at www.globalbetaetf.com. Performance results assume reinvestment of all dividends and capital gain distributions and do not reflect the deduction of taxes that a shareholder would pay on fund distributions or on the redemption or sale of fund shares. The investment return and principal value of shares will vary with changes in market conditions. Shares may be worth more or less than their original cost when they are redeemed or sold in the market. Returns less than one year are not annualized. Performance for certain funds may reflect a waiver of a portion of investment advisory fees. Without such a
| 7 |

Fund Performance (Continued) | Global Beta Low Beta ETF |
November 30, 2020
waiver, performance would have been lower. As stated in the current prospectus, the Fund’s investment adviser, Global Beta Advisors LLC (“Adviser”), has agreed to reimburse the Fund through March 31, 2022 for the (i) compensation and expenses of the Trustees who are not interested persons as defined under Section 2(a)(19) of the Investment Company Act of 1940 (the “Independent Trustees”), and (ii) fees and expenses of counsel to the Independent Trustees, except for any (a) litigation expenses (including litigation to which the Trust or the Fund may be a party and indemnification of the Independent Trustees with respect thereto), and (b) extraordinary or non-routine fees or expenses. As stated in the current prospectus, the current gross and net expense ratios are 0.36% and 0.29% respectively. Please refer to the Financial Highlights herein for the most recent expense ratio information.
An index is a statistical composite that tracks a specified financial market or sector. Unlike a fund, an index does not actually hold a portfolio of securities and therefore does not incur the expenses incurred by a fund. These expenses negatively impact fund performance. Also, market returns do not include brokerage commissions that may be payable on secondary market transactions. If brokerage commissions were included, market returns would be lower. Individuals cannot invest directly in an index.
| 8 |

Management’s Discussion of Fund Performance | Global Beta Momentum-Growth ETF |
November 30, 2020
The Global Beta Momentum-Growth ETF (the “Fund” or “GBGR”) seeks to track the performance (before fees and expenses) of the Global Beta Momentum-Growth Factor Index (the “Target Index”). The Target Index is comprised of equity securities of U.S. companies from the S&P 500 (a broad-based benchmark index) in the highest quintile (i.e., the highest 20% of the S&P 500) based on their year-over-year revenue growth rate, as measured by their most recently reported quarterly revenue as compared to the quarterly revenue reported four quarters ago. The constituent securities of the Target Index are weighted based on free-float market capitalization, with each individual index constituent capped at 10% at each quarterly rebalance. In addition, index constituents from the energy sector, as classified by the Global Industry Classification Standard (GICS®), are capped at 3% in the aggregate in the Target Index at each quarterly rebalance when the price of crude oil, as defined by Crude Oil WTI futures (ticker: CL00), is below its 30 day moving average.
For the period, which spans from the Fund’s inception of 7/24/20 through the end of the Fund’s annual period of 11/30/20, the Fund underperformed its benchmark, the S&P 500 Index. For the period, the Fund’s net asset value (“NAV”) return was 11.39% and the Fund’s market price return was 11.27%1. The benchmark return was 12.62% during the same period. The Fund’s market price at 11/30/20 was $22.23.
GBGR had strong relative performance in the first 1+ month as the Fund’s NAV returned 10.39% versus 8.40% for that of the S&P 500 Index from 07/24/20 through 08/31/20. However, valuations within growth-oriented stocks began to come under pressure from September through November as valuations in growth oriented securities had become elevated due to suppressed economic growth from the COVID-19 related recession.We believe this correction led to the aforementioned underperformance of GBGR to the S&P 500 Index as GBGR’s investment focus is towards growth-oriented securities. Additionally, the outcome of the election raised the possibility of more fiscal stimulus from the federal government, and major COVID-19 vaccine developers reported exceedingly positive late trial results on their vaccines, indicating the end of the COVID-19 related health pandemic may be near. Consequently, investors saw a rotation out of growth-oriented securities and into more economically sensitive, value-oriented securities, which ultimately impacted GBGR’s relative return to that of the broad-based S&P 500 Index.
Frequency Distribution of Premium and Discounts — Information concerning the number of days that the Fund trades at a premium or discount can be found on the Funds’ website, www.globalbetaetf.com.
ALLOCATION BY SECTOR | |
Sector | Percentage of |
Information Technology | 53.6% |
Health Care | 11.4 |
Financials | 9.8 |
Communication Services | 8.3 |
Consumer Discretionary | 7.0 |
Industrials | 4.7 |
Consumer Staples | 3.0 |
Utilities | 1.0 |
Real Estate | 0.6 |
Materials | 0.5 |
Short-Term Investments and Other Assets and Liabilities | 0.1 |
Total | 100.0% |
1. | A fund’s per share NAV is the value of one share of the Fund. NAV is calculated by taking the Fund’s total assets (including the market value of securities owned), subtracting liabilities, and dividing by the number of shares outstanding. The NAV Return is based on the NAV of the Fund, and the Market Price Return is based on the market price per share of the Fund. The price used to calculate market return (‘‘Market Price’’) is determined by using the midpoint between the highest bid and the lowest offer on the primary stock exchange on which the shares of the Fund are listed for trading, as of the time that the Fund’s NAV is calculated. NAV is used as a proxy for purposes of calculating Market Price Return on inception date. Market Price and NAV returns assume that dividends and capital gain distributions have been reinvested in the Fund at Market Price and NAV, respectively. |
| 9 |

Fund Performance | Global Beta Momentum-Growth ETF |
November 30, 2020
Performance (Cumulative Total Return as of November 30, 2020)
1-Month | 3-Month | Since | |
Global Beta Momentum-Growth ETF | |||
NAV | 10.14% | 0.90% | 11.39% |
Market | 10.30% | 0.64% | 11.27% |
Target Index | 10.17% | 0.61% | 11.07% |
S&P 500 Index | 10.95% | 3.89% | 12.62% |
Growth of $10,000 Investment
(At Net Asset Value)
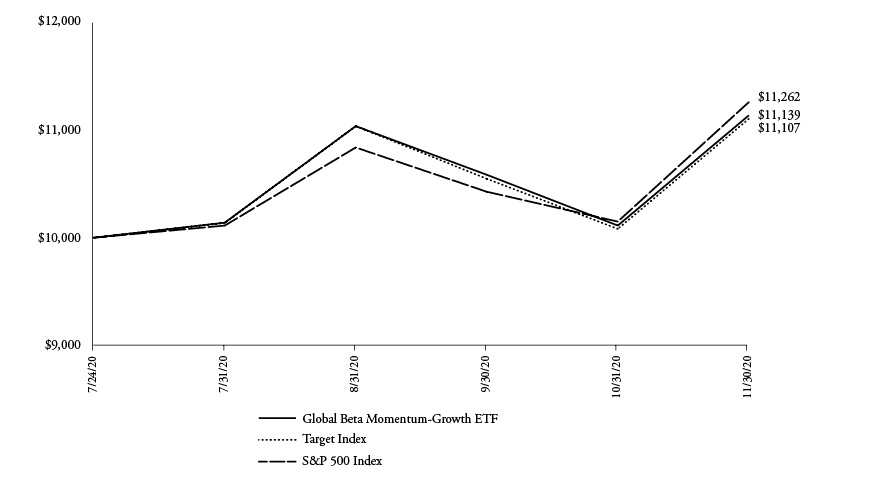
Performance measured by NAV differs from the Target Index primarily due to Fund fees and expenses and taxes.
(*) | Commencement of investment operations on July 24, 2020. |
This chart assumes an initial gross investment of $10,000 made on July 24, 2020 and reflects the fees charged on an account. Returns shown include the reinvestment of all dividends, if any, but do not include the deduction of taxes that a shareholder would pay on Fund distributions or the redemption of Fund shares. Past performance is not predictive of future performance. Investment return and principal value will fluctuate, so your shares, when redeemed, may be worth more or less than the original cost.
Past performance is no guarantee of future results. Financial markets have experienced extreme volatility and trading in many instruments has been disrupted. These circumstances may continue for an extended period of time and may continue to affect adversely the value and liquidity of the Fund’s investments. As a result, current performance may be lower or higher than the performance data quoted. Performance data current to the most recent month-end is available at www.globalbetaetf.com. Performance results assume reinvestment of all dividends and capital gain distributions and do not reflect the deduction of taxes that a shareholder would pay on fund distributions or on the redemption or sale of fund shares. The investment return and principal value of shares will vary with changes in market conditions. Shares may be worth more or less than their original cost when they are redeemed or sold in the market. Returns less than one year are not annualized. Performance for certain funds may reflect a waiver of a portion of investment advisory fees. Without such a
| 10 |

Fund Performance (Continued) | Global Beta Momentum-Growth ETF |
November 30, 2020
waiver, performance would have been lower. As stated in the current prospectus, the Fund’s investment adviser, Global Beta Advisors LLC (“Adviser”), has agreed to reimburse the Fund through March 31, 2022 for the (i) compensation and expenses of the Trustees who are not interested persons as defined under Section 2(a)(19) of the Investment Company Act of 1940 (the “Independent Trustees”), and (ii) fees and expenses of counsel to the Independent Trustees, except for any (a) litigation expenses (including litigation to which the Trust or the Fund may be a party and indemnification of the Independent Trustees with respect thereto), and (b) extraordinary or non-routine fees or expenses. As stated in the current prospectus, the current gross and net expense ratios are 0.36% and 0.29% respectively. Please refer to the Financial Highlights herein for the most recent expense ratio information.
An index is a statistical composite that tracks a specified financial market or sector. Unlike a fund, an index does not actually hold a portfolio of securities and therefore does not incur the expenses incurred by a fund. These expenses negatively impact fund performance. Also, market returns do not include brokerage commissions that may be payable on secondary market transactions. If brokerage commissions were included, market returns would be lower. Individuals cannot invest directly in an index.
| 11 |

Schedule of Investments | Global Beta Smart Income ETF |
November 30, 2020
| Number of | Value | ||||||
COMMON STOCKS — 100.0% | ||||||||
Communication Services — 9.8% | ||||||||
CenturyLink, Inc. | 3,951 | $ | 41,288 | |||||
Interpublic Group of Companies, Inc. | 1,096 | 24,419 | ||||||
Omnicom Group, Inc. | 524 | 33,012 | ||||||
Verizon Communications, Inc. | 1,142 | 68,988 | ||||||
| 167,707 | ||||||||
Consumer Discretionary — 2.7% | ||||||||
H&R Block, Inc. | 369 | 6,937 | ||||||
Leggett & Platt, Inc. | 195 | 8,405 | ||||||
Newell Brands, Inc. | 1,072 | 22,791 | ||||||
Wyndham Destinations, Inc. | 196 | 8,244 | ||||||
| 46,377 | ||||||||
Consumer Staples — 10.8% | ||||||||
Coca-Cola Co. | 1,353 | 69,815 | ||||||
General Mills, Inc. | 601 | 36,553 | ||||||
Nu Skin Enterprises, Inc. - Class A | 88 | 4,533 | ||||||
Walgreens Boots Alliance, Inc. | 1,960 | 74,500 | ||||||
| 185,401 | ||||||||
Energy — 3.0% | ||||||||
Antero Midstream Corp. | 19 | 128 | ||||||
Equitrans Midstream Corp. | 19 | 155 | ||||||
Exxon Mobil Corp. | 647 | 24,670 | ||||||
Kinder Morgan, Inc. | 103 | 1,481 | ||||||
Marathon Petroleum Corp. | 363 | 14,113 | ||||||
Valero Energy Corp. | 193 | 10,378 | ||||||
Williams Companies, Inc. | 41 | 860 | ||||||
| 51,785 | ||||||||
Financials — 21.4% | ||||||||
American Financial Group, Inc. | 224 | 20,028 | ||||||
Cathay General Bancorp | 69 | 1,949 | ||||||
CIT Group, Inc. | 361 | 12,090 | ||||||
Citizens Financial Group, Inc. | 596 | 19,465 | ||||||
Comerica, Inc. | 173 | 8,512 | ||||||
First Horizon National Corp. | 470 | 5,743 | ||||||
F.N.B. Corp. | 425 | 3,753 | ||||||
Franklin Resources, Inc. | 535 | 11,765 | ||||||
Hanover Insurance Group, Inc. | 101 | 11,347 | ||||||
Huntington Bancshares, Inc. | 1,094 | 13,216 | ||||||
Janus Henderson Group PLC ^ | 227 | 6,476 | ||||||
KeyCorp | 1,209 | 18,691 | ||||||
Mercury General Corp. | 182 | 8,094 | ||||||
MetLife, Inc. | 1,843 | 85,091 | ||||||
Navient Corp. | 1,138 | 10,663 | ||||||
New York Community Bancorp, Inc. | 418 | 4,050 | ||||||
Old Republic International Corp. | 847 | 15,178 | ||||||
People’s United Financial, Inc. | 471 | 5,840 | ||||||
Principal Financial Group, Inc. | 818 | 40,728 | ||||||
Regions Financial Corp. | 1,107 | 16,904 | ||||||
Synovus Financial Corp. | 225 | 7,103 | ||||||
United Bankshares, Inc. | 78 | 2,284 | ||||||
Unum Group | 1,316 | 29,255 | ||||||
Valley National Bancorp | 431 | 3,939 | ||||||
Webster Financial Corp. | 107 | 4,049 | ||||||
| 366,213 | ||||||||
The accompanying notes are an integral part of these financial statements.
| 12 |

Schedule of Investments (Continued) | Global Beta Smart Income ETF |
November 30, 2020
| Number of | Value | ||||||
COMMON STOCKS — 100.0% (Continued) | ||||||||
Health Care — 6.6% | ||||||||
Gilead Sciences, Inc. | 674 | $ | 40,892 | |||||
Pfizer, Inc. | 1,872 | 71,716 | ||||||
| 112,608 | ||||||||
Industrials — 4.9% | ||||||||
HNI Corp. | 142 | 5,177 | ||||||
MSC Industrial Direct Co., Inc. - Class A | 105 | 8,749 | ||||||
PACCAR, Inc. | 485 | 42,224 | ||||||
Ryder System, Inc. | 407 | 24,102 | ||||||
Werner Enterprises, Inc. | 108 | 4,319 | ||||||
| 84,571 | ||||||||
Information Technology — 15.0% | ||||||||
Hewlett Packard Enterprise Co. | 5,940 | 65,578 | ||||||
HP, Inc. | 3,592 | 78,772 | ||||||
International Business Machines Corp. | 565 | 69,789 | ||||||
NetApp, Inc. | 248 | 13,221 | ||||||
NortonLifeLock, Inc. | 231 | 4,211 | ||||||
Seagate Technology PLC | 447 | 26,288 | ||||||
| 257,859 | ||||||||
Materials — 10.9% | ||||||||
Chemours Co. | 482 | 11,727 | ||||||
Compass Minerals International, Inc. | 51 | 3,185 | ||||||
Dow, Inc. | 1,353 | 71,723 | ||||||
Eastman Chemical Co. | 218 | 21,233 | ||||||
Greif, Inc. - Class A | 134 | 6,514 | ||||||
International Paper Co. | 1,028 | 50,865 | ||||||
Olin Corp. | 981 | 21,474 | ||||||
| 186,721 | ||||||||
Real Estate — 2.3% | ||||||||
American Campus Communities, Inc. | 52 | 2,069 | ||||||
Apartment Investment and Management Co. - Class A | 65 | 1,973 | ||||||
Federal Realty Investment Trust | 22 | 1,919 | ||||||
Healthpeak Properties, Inc. | 160 | 4,618 | ||||||
Highwoods Properties, Inc. | 43 | 1,647 | ||||||
Iron Mountain, Inc. | 291 | 8,002 | ||||||
Medical Properties Trust, Inc. | 123 | 2,386 | ||||||
National Retail Properties, Inc. | 38 | 1,433 | ||||||
Omega Healthcare Investors, Inc. | 62 | 2,184 | ||||||
Physicians Realty Trust | 48 | 833 | ||||||
PotlatchDeltic Corp. | 39 | 1,815 | ||||||
Regency Centers Corp. | 55 | 2,507 | ||||||
SL Green Realty Corp. | 47 | 2,721 | ||||||
Spirit Realty Capital, Inc. | 29 | 1,068 | ||||||
STORE Capital Corp. | 48 | 1,563 | ||||||
Vornado Realty Trust | 70 | 2,724 | ||||||
| 39,462 | ||||||||
The accompanying notes are an integral part of these financial statements.
| 13 |

Schedule of Investments (Continued) | Global Beta Smart Income ETF |
November 30, 2020
| Number of | Value | ||||||
COMMON STOCKS — 100.0% (Continued) | ||||||||
Utilities — 12.6% | ||||||||
Dominion Energy, Inc. | 419 | $ | 32,887 | |||||
DTE Energy Co. | 202 | 25,414 | ||||||
Edison International | 487 | 29,882 | ||||||
FirstEnergy Corp. | 746 | 19,814 | ||||||
MDU Resources Group, Inc. | 484 | 12,071 | ||||||
National Fuel Gas Co. | 74 | 3,046 | ||||||
NorthWestern Corp. | 49 | 2,842 | ||||||
OGE Energy Corp. | 148 | 4,794 | ||||||
Pinnacle West Capital Corp. | 96 | 7,858 | ||||||
PPL Corp. | 569 | 16,171 | ||||||
Southern Co. | 779 | 46,623 | ||||||
UGI Corp. | 404 | 14,334 | ||||||
| 215,736 | ||||||||
TOTAL COMMON STOCKS (Cost $1,493,818) | 1,714,440 | |||||||
MONEY MARKET FUND — 0.1% | ||||||||
First American Government Obligations Fund - Class X, 0.05% (a) | 1,597 | 1,597 | ||||||
TOTAL MONEY MARKET FUND (Cost $1,597) | 1,597 | |||||||
TOTAL INVESTMENTS — 100.1% (Cost $1,495,415) | 1,716,037 | |||||||
LIABILITIES IN EXCESS OF OTHER ASSETS — (0.1)% | (772 | ) | ||||||
TOTAL NET ASSETS — 100.0% | $ | 1,715,265 | ||||||
^ | U.S. Dollar-denominated foreign security. |
(a) | 7-day net yield. |
The Global Industry Classification Standard (GICS®) was developed by and/or is the exclusive property of Morgan Stanley Capital International, Inc. (“MSCI”) and Standard & Poor’s Financial Services LLC (“S&P”). GICS is a service mark of MSCI and S&P and has been licensed for use by Global Beta Advisors LLC.
The accompanying notes are an integral part of these financial statements.
| 14 |

Schedule of Investments | Global Beta Low Beta ETF |
November 30, 2020
| Number of | Value | ||||||
COMMON STOCKS — 99.8% | ||||||||
Communication Services — 11.0% | ||||||||
Activision Blizzard, Inc. | 97 | $ | 7,710 | |||||
Charter Communications, Inc. - Class A * | 85 | 55,419 | ||||||
Electronic Arts, Inc. * | 51 | 6,515 | ||||||
Netflix, Inc. * | 52 | 25,516 | ||||||
Take-Two Interactive Software, Inc. * | 24 | 4,332 | ||||||
T-Mobile U.S., Inc. | 507 | 67,401 | ||||||
Verizon Communications, Inc. | 2,128 | 128,553 | ||||||
| 295,446 | ||||||||
Consumer Discretionary — 12.7% | ||||||||
Amazon.com, Inc. * | 41 | 129,890 | ||||||
Dollar General Corp. | 166 | 36,284 | ||||||
Dollar Tree, Inc. * | 309 | 33,755 | ||||||
Domino’s Pizza, Inc. | 11 | 4,318 | ||||||
eBay, Inc. | 235 | 11,851 | ||||||
Target Corp. | 611 | 109,693 | ||||||
Tiffany & Co. | 40 | 5,259 | ||||||
Tractor Supply Co. | 75 | 10,561 | ||||||
| 341,611 | ||||||||
Consumer Staples — 34.5% | ||||||||
Altria Group, Inc. | 541 | 21,548 | ||||||
Brown-Forman Corp. - Class B | 48 | 3,872 | ||||||
Campbell Soup Co. | 209 | 10,454 | ||||||
Church & Dwight Co, Inc. | 57 | 5,003 | ||||||
Clorox Co. | 36 | 7,307 | ||||||
Coca-Cola Co. | 765 | 39,474 | ||||||
Colgate-Palmolive Co. | 236 | 20,211 | ||||||
Conagra Brands, Inc. | 364 | 13,308 | ||||||
Costco Wholesale Corp. | 374 | 146,522 | ||||||
General Mills, Inc. | 340 | 20,679 | ||||||
Hershey Co. | 63 | 9,317 | ||||||
Hormel Foods Corp. | 219 | 10,332 | ||||||
J. M. Smucker Co. | 79 | 9,259 | ||||||
Kellogg Co. | 234 | 14,955 | ||||||
Kimberly-Clark Corp. | 146 | 20,339 | ||||||
Kroger Co. | 3,941 | 130,053 | ||||||
McCormick & Co., Inc. | 31 | 5,796 | ||||||
Mondelez International, Inc. - Class A | 507 | 29,127 | ||||||
Procter & Gamble Co. | 582 | 80,822 | ||||||
Tyson Foods, Inc. - Class A | 743 | 48,444 | ||||||
Walgreens Boots Alliance, Inc. | 3,656 | 138,965 | ||||||
Walmart, Inc. | 936 | 143,011 | ||||||
| 928,798 | ||||||||
Energy — 0.1% | ||||||||
Cabot Oil & Gas Corp. | 98 | 1,717 | ||||||
Financials — 2.2% | ||||||||
Aon PLC - Class A | 62 | 12,703 | ||||||
Cboe Global Markets, Inc. | 39 | 3,562 | ||||||
MarketAxess Holdings, Inc. | 2 | 1,078 | ||||||
Progressive Corp. | 485 | 42,248 | ||||||
| 59,591 | ||||||||
The accompanying notes are an integral part of these financial statements.
| 15 |

Schedule of Investments (Continued) | Global Beta Low Beta ETF |
November 30, 2020
| Number of | Value | ||||||
COMMON STOCKS — 99.8% (Continued) | ||||||||
Health Care — 26.1% | ||||||||
AbbVie, Inc. | 453 | $ | 47,375 | |||||
ABIOMED, Inc. * | 3 | 822 | ||||||
Alexion Pharmaceuticals, Inc. * | 55 | 6,716 | ||||||
Amgen, Inc. | 111 | 24,646 | ||||||
Baxter International, Inc. | 161 | 12,247 | ||||||
Becton Dickinson and Co. | 85 | 19,961 | ||||||
Biogen, Inc. * | 59 | 14,170 | ||||||
Bio-Rad Laboratories, Inc. - Class A * | 5 | 2,693 | ||||||
Bristol-Myers Squibb Co. | 666 | 41,558 | ||||||
Cerner Corp. | 89 | 6,661 | ||||||
CVS Health Corp. | 2,262 | 153,341 | ||||||
Danaher Corp. | 103 | 23,137 | ||||||
DaVita, Inc. * | 146 | 16,038 | ||||||
DexCom, Inc. * | 5 | 1,598 | ||||||
Eli Lilly and Co. | 174 | 25,343 | ||||||
Gilead Sciences, Inc. | 381 | 23,115 | ||||||
IDEXX Laboratories, Inc. * | 8 | 3,688 | ||||||
Illumina, Inc. * | 11 | 3,543 | ||||||
Incyte Corp. * | 30 | 2,536 | ||||||
Johnson & Johnson | 614 | 88,834 | ||||||
Merck & Co, Inc. | 636 | 51,128 | ||||||
PerkinElmer, Inc. | 29 | 3,857 | ||||||
Pfizer, Inc. | 1,515 | 58,040 | ||||||
Quest Diagnostics, Inc. | 75 | 9,299 | ||||||
Regeneron Pharmaceuticals, Inc. * | 16 | 8,257 | ||||||
Thermo Fisher Scientific, Inc. | 68 | 31,619 | ||||||
Vertex Pharmaceuticals, Inc. * | 23 | 5,238 | ||||||
Viatris, Inc. * | 1,008 | 16,955 | ||||||
West Pharmaceutical Services, Inc. | 8 | 2,201 | ||||||
| 704,616 | ||||||||
Industrials — 8.3% | ||||||||
3M Co. | 214 | 36,964 | ||||||
A.O. Smith Corp. | 62 | 3,491 | ||||||
C.H. Robinson Worldwide, Inc. | 165 | 15,505 | ||||||
Expeditors International of Washington, Inc. | 105 | 9,384 | ||||||
Northrop Grumman Corp. | 116 | 35,062 | ||||||
Republic Services, Inc. | 120 | 11,607 | ||||||
Rollins, Inc. | 44 | 2,516 | ||||||
United Parcel Service, Inc. - Class B | 544 | 93,062 | ||||||
Waste Management, Inc. | 147 | 17,512 | ||||||
| 225,103 | ||||||||
Information Technology — 1.3% | ||||||||
Akamai Technologies, Inc. * | 32 | 3,312 | ||||||
Broadridge Financial Solutions, Inc. | 38 | 5,582 | ||||||
Citrix Systems, Inc. | 27 | 3,346 | ||||||
F5 Networks, Inc. * | 22 | 3,582 | ||||||
FLIR Systems, Inc. | 61 | 2,333 | ||||||
Jack Henry & Associates, Inc. | 12 | 1,930 | ||||||
Juniper Networks, Inc. | 218 | 4,746 | ||||||
NortonLifeLock, Inc. | 132 | 2,406 | ||||||
Tyler Technologies, Inc. * | 4 | 1,710 | ||||||
Western Union Co. | 250 | 5,640 | ||||||
| 34,587 | ||||||||
The accompanying notes are an integral part of these financial statements.
| 16 |

Schedule of Investments (Continued) | Global Beta Low Beta ETF |
November 30, 2020
| Number of | Value | ||||||
COMMON STOCKS — 99.8% (Continued) | ||||||||
Materials — 0.9% | ||||||||
Ball Corp. | 152 | $ | 14,593 | |||||
Newmont Corp. | 179 | 10,529 | ||||||
| 25,122 | ||||||||
Real Estate — 0.3% | ||||||||
Digital Realty Trust, Inc. | 26 | 3,504 | ||||||
Extra Space Storage, Inc. | 14 | 1,578 | ||||||
Public Storage | 15 | 3,367 | ||||||
| 8,449 | ||||||||
Utilities — 2.4% | ||||||||
Alliant Energy Corp. | 77 | 4,050 | ||||||
American Electric Power Co., Inc. | 216 | 18,336 | ||||||
CMS Energy Corp. | 124 | 7,631 | ||||||
Consolidated Edison, Inc. | 187 | 14,259 | ||||||
WEC Energy Group, Inc. | 83 | 7,881 | ||||||
Xcel Energy, Inc. | 181 | 12,192 | ||||||
| 64,349 | ||||||||
TOTAL COMMON STOCKS (Cost $2,526,104) | 2,689,389 | |||||||
MONEY MARKET FUND — 0.0% # | ||||||||
First American Government Obligations Fund - Class X, 0.05% (a) | 766 | 766 | ||||||
TOTAL MONEY MARKET FUND (Cost $766) | 766 | |||||||
TOTAL INVESTMENTS — 99.8% (Cost $2,526,870) | 2,690,155 | |||||||
OTHER ASSETS LESS LIABILITIES — 0.2% | 4,377 | |||||||
TOTAL NET ASSETS — 100.0% | $ | 2,694,532 | ||||||
* | Non-income producing security. |
(a) | 7-day net yield. |
(#) | Represents less than 0.05% of net assets. |
The Global Industry Classification Standard (GICS®) was developed by and/or is the exclusive property of Morgan Stanley Capital International, Inc. (“MSCI”) and Standard & Poor’s Financial Services LLC (“S&P”). GICS is a service mark of MSCI and S&P and has been licensed for use by Global Beta Advisors LLC.
The accompanying notes are an integral part of these financial statements.
| 17 |

Schedule of Investments | Global Beta Momentum-Growth ETF |
November 30, 2020
| Number of | Value | ||||||
COMMON STOCKS — 99.9% | ||||||||
Communication Services — 8.3% | ||||||||
Activision Blizzard, Inc. | 207 | $ | 16,452 | |||||
Electronic Arts, Inc. * | 77 | 9,837 | ||||||
Facebook, Inc. - Class A * | 647 | 179,200 | ||||||
Take-Two Interactive Software, Inc. * | 31 | 5,596 | ||||||
T-Mobile U.S., Inc. | 156 | 20,739 | ||||||
| 231,824 | ||||||||
Consumer Discretionary — 7.0% | ||||||||
Advance Auto Parts, Inc. | 19 | 2,806 | ||||||
Dollar General Corp. | 68 | 14,864 | ||||||
Dollar Tree, Inc. * | 64 | 6,991 | ||||||
Domino’s Pizza, Inc. | 11 | 4,318 | ||||||
D.R. Horton, Inc. | 89 | 6,631 | ||||||
eBay, Inc. | 177 | 8,926 | ||||||
Home Depot, Inc. | 291 | 80,726 | ||||||
Lowe’s Companies, Inc. | 203 | 31,631 | ||||||
O’Reilly Automotive, Inc. * | 20 | 8,849 | ||||||
Target Corp. | 134 | 24,057 | ||||||
Tractor Supply Co. | 31 | 4,365 | ||||||
| 194,164 | ||||||||
Consumer Staples — 3.0% | ||||||||
Campbell Soup Co. | 45 | 2,251 | ||||||
Church & Dwight Co., Inc. | 66 | 5,793 | ||||||
Clorox Co. | 34 | 6,901 | ||||||
J. M. Smucker Co. | 31 | 3,633 | ||||||
Kroger Co. | 211 | 6,963 | ||||||
Walmart, Inc. | 381 | 58,213 | ||||||
| 83,754 | ||||||||
Financials — 9.8% | ||||||||
Berkshire Hathaway, Inc. - Class B * | 523 | 119,720 | ||||||
Cboe Global Markets, Inc. | 29 | 2,648 | ||||||
Chubb Ltd. ^ | 121 | 17,887 | ||||||
Cincinnati Financial Corp. | 40 | 3,054 | ||||||
Everest Re Group Ltd. ^ | 11 | 2,501 | ||||||
First Republic Bank | 46 | 5,960 | ||||||
Globe Life, Inc. | 26 | 2,420 | ||||||
Goldman Sachs Group, Inc. | 83 | 19,138 | ||||||
Intercontinental Exchange, Inc. | 147 | 15,510 | ||||||
MarketAxess Holdings, Inc. | 10 | 5,392 | ||||||
Moody’s Corp. | 44 | 12,423 | ||||||
MSCI, Inc. | 23 | 9,417 | ||||||
Nasdaq, Inc. | 31 | 3,968 | ||||||
Progressive Corp. | 157 | 13,676 | ||||||
S&P Global, Inc. | 65 | 22,866 | ||||||
Truist Financial Corp. | 361 | 16,758 | ||||||
| 273,338 | ||||||||
The accompanying notes are an integral part of these financial statements.
| 18 |

Schedule of Investments (Continued) | Global Beta Momentum-Growth ETF |
November 30, 2020
| Number of | Value | ||||||
COMMON STOCKS — 99.9% (Continued) | ||||||||
Health Care — 11.4% | ||||||||
AbbVie, Inc. | 474 | $ | 49,571 | |||||
Alexion Pharmaceuticals, Inc. * | 59 | 7,204 | ||||||
Amgen, Inc. | 158 | 35,082 | ||||||
Anthem, Inc. | 68 | 21,183 | ||||||
Bristol-Myers Squibb Co. | 609 | 38,002 | ||||||
Catalent, Inc. * | 44 | 4,230 | ||||||
Centene Corp. * | 155 | 9,556 | ||||||
Danaher Corp. | 169 | 37,962 | ||||||
Humana, Inc. | 36 | 14,419 | ||||||
Incyte Corp. * | 48 | 4,058 | ||||||
PerkinElmer, Inc. | 30 | 3,990 | ||||||
Regeneron Pharmaceuticals, Inc. * | 27 | 13,933 | ||||||
ResMed, Inc. | 39 | 8,174 | ||||||
Thermo Fisher Scientific, Inc. | 107 | 49,753 | ||||||
Vertex Pharmaceuticals, Inc. * | 70 | 15,943 | ||||||
West Pharmaceutical Services, Inc. | 20 | 5,503 | ||||||
| 318,563 | ||||||||
Industrials — 4.7% | ||||||||
Equifax, Inc. | 33 | 5,508 | ||||||
Expeditors International of Washington, Inc. | 45 | 4,022 | ||||||
Fastenal Co. | 153 | 7,566 | ||||||
Ingersoll Rand, Inc. * | 93 | 4,117 | ||||||
L3Harris Technologies, Inc. | 58 | 11,135 | ||||||
Lockheed Martin Corp. | 67 | 24,455 | ||||||
Northrop Grumman Corp. | 42 | 12,695 | ||||||
Raytheon Technologies Corp. | 394 | 28,258 | ||||||
United Parcel Service, Inc. - Class B | 189 | 32,332 | ||||||
| 130,088 | ||||||||
Information Technology — 53.6% | ||||||||
Advanced Micro Devices, Inc. * | 603 | 55,874 | ||||||
Akamai Technologies, Inc. * | 83 | 8,591 | ||||||
ANSYS, Inc. * | 44 | 14,875 | ||||||
Apple, Inc. | 2,266 | 269,767 | ||||||
Applied Materials, Inc. | 472 | 38,931 | ||||||
Autodesk, Inc. * | 113 | 31,666 | ||||||
Broadcom, Inc. | 206 | 82,725 | ||||||
Broadridge Financial Solutions, Inc. | 59 | 8,666 | ||||||
Cadence Design Systems, Inc. * | 143 | 16,631 | ||||||
Citrix Systems, Inc. | 60 | 7,435 | ||||||
Fidelity National Information Services, Inc. | 318 | 47,194 | ||||||
Fiserv, Inc. * | 290 | 33,402 | ||||||
Fortinet, Inc. * | 69 | 8,503 | ||||||
Global Payments, Inc. | 154 | 30,059 | ||||||
Intel Corp. | 2,180 | 105,403 | ||||||
Intuit, Inc. | 134 | 47,171 | ||||||
Jack Henry & Associates, Inc. | 39 | 6,274 | ||||||
KLA Corp. | 80 | 20,158 | ||||||
Lam Research Corp. | 75 | 33,949 | ||||||
Leidos Holdings, Inc. | 68 | 6,848 | ||||||
Microsoft Corp. | 1,262 | 270,156 | ||||||
NetApp, Inc. | 113 | 6,024 | ||||||
NVIDIA Corp. | 317 | 169,931 | ||||||
The accompanying notes are an integral part of these financial statements.
| 19 |

Schedule of Investments (Continued) | Global Beta Momentum-Growth ETF |
November 30, 2020
| Number of | Value | ||||||
COMMON STOCKS — 99.9% (Continued) | ||||||||
Information Technology — 53.6% (Continued) | ||||||||
PayPal Holdings, Inc. * | 605 | $ | 129,543 | |||||
Seagate Technology PLC | 116 | 6,822 | ||||||
Synopsys, Inc. * | 78 | 17,745 | ||||||
Teradyne, Inc. | 85 | 9,379 | ||||||
Western Digital Corp. | 154 | 6,911 | ||||||
| 1,490,633 | ||||||||
Materials — 0.5% | ||||||||
Newmont Corp. | 215 | 12,646 | ||||||
Real Estate — 0.6% | ||||||||
Alexandria Real Estate Equities, Inc. | 34 | 5,567 | ||||||
Mid-America Apartment Communities, Inc. | 31 | 3,911 | ||||||
Realty Income Corp. | 92 | 5,517 | ||||||
UDR, Inc. | 79 | 3,039 | ||||||
| 18,034 | ||||||||
Utilities — 1.0% | ||||||||
American Water Works Co., Inc. | 51 | 7,822 | ||||||
Edison International | 101 | 6,197 | ||||||
Pinnacle West Capital Corp. | 30 | 2,456 | ||||||
Sempra Energy | 78 | 9,943 | ||||||
| 26,418 | ||||||||
TOTAL COMMON STOCKS (Cost $2,534,977) | 2,779,462 | |||||||
Money Market Fund — 0.1% | ||||||||
First American Government Obligations Fund - Class X, 0.05% (a) | 1,976 | 1,976 | ||||||
TOTAL MONEY MARKET FUND (Cost $1,976) | 1,976 | |||||||
TOTAL INVESTMENTS — 100% (Cost $2,536,953) | 2,781,438 | |||||||
OTHER ASSETS LESS LIABILITIES — 0.0% # | 477 | |||||||
TOTAL NET ASSETS — 100.0% | $ | 2,781,915 | ||||||
^ | U.S. Dollar-denominated foreign security. |
* | Non-income producing security. |
(a) | 7-day net yield. |
(#) | Represents less than 0.05% of net assets. |
The Global Industry Classification Standard (GICS®) was developed by and/or is the exclusive property of Morgan Stanley Capital International, Inc. (“MSCI”) and Standard & Poor’s Financial Services LLC (“S&P”). GICS is a service mark of MSCI and S&P and has been licensed for use by Global Beta Advisors LLC.
The accompanying notes are an integral part of these financial statements.
| 20 |

Statement of Assets and Liabilities | Global Beta ETF Trust |
November 30, 2020
Global Beta | Global Beta | Global Beta | ||||||||||
ASSETS | ||||||||||||
Investments in securities, at value (identified cost $1,493,818, $2,526,104, $2,534,977) (See Note 2) | $ | 1,714,440 | $ | 2,689,389 | $ | 2,779,462 | ||||||
Investments in money market fund, at value (identified cost $1,597, $766, $1,976) (See Note 2) | 1,597 | 766 | 1,976 | |||||||||
Total securities, at value (identified cost $1,495,415, $2,526,870, $2,536,953) (See Note 2) | 1,716,037 | 2,690,155 | 2,781,438 | |||||||||
Receivables: | ||||||||||||
Investment securities sold | 8 | — | — | |||||||||
Dividends and interest | 10,244 | 6,992 | 3,107 | |||||||||
Due from adviser | 3,809 | 3,218 | 3,203 | |||||||||
Prepaid expenses and other assets | 167 | 1,667 | 1,667 | |||||||||
Total assets | 1,730,265 | 2,702,032 | 2,789,415 | |||||||||
LIABILITIES | ||||||||||||
Payables: | ||||||||||||
Trustee fees | 15,000 | 7,500 | 7,500 | |||||||||
Total liabilities | 15,000 | 7,500 | 7,500 | |||||||||
NET ASSETS | $ | 1,715,265 | $ | 2,694,532 | $ | 2,781,915 | ||||||
NET ASSETS CONSIST OF: | ||||||||||||
Paid-in capital | $ | 2,069,891 | $ | 2,520,466 | $ | 2,558,295 | ||||||
Total distributable earnings (loss) | (354,626 | ) | 174,066 | 223,620 | ||||||||
NET ASSETS | $ | 1,715,265 | $ | 2,694,532 | $ | 2,781,915 | ||||||
Shares issued and outstanding, $0 par value, unlimited shares authorized | 100,000 | 125,000 | 125,000 | |||||||||
Net Asset Value, Offering Price and Redemption Price Per Share | $ | 17.15 | $ | 21.56 | $ | 22.26 | ||||||
The accompanying notes are an integral part of these financial statements.
| 21 |

Statement of Operations | Global Beta ETF Trust |
For The Period Ended November 30, 2020
Global Beta | Global Beta | Global Beta | ||||||||||
INVESTMENT INCOME | ||||||||||||
Dividends | $ | 80,482 | $ | 21,484 | $ | 10,768 | ||||||
Interest | 13 | 4 | 5 | |||||||||
Total investment income | 80,495 | 21,488 | 10,773 | |||||||||
EXPENSES | ||||||||||||
Investment advisory fees | 4,569 | 2,692 | 2,741 | |||||||||
Trustee fees | 67,500 | 15,000 | 15,000 | |||||||||
Legal fees | 13,167 | 1,667 | 1,667 | |||||||||
Total expenses | 85,236 | 19,359 | 19,408 | |||||||||
Less: voluntary fees waived adviser | (2,698 | ) | — | — | ||||||||
Less: fees reimbursed by adviser | (80,667 | ) | (16,667 | ) | (16,667 | ) | ||||||
Net expenses | 1,871 | 2,692 | 2,741 | |||||||||
Net Investment Income | 78,624 | 18,796 | 8,032 | |||||||||
REALIZED & UNREALIZED GAIN (LOSS) ON INVESTMENTS | ||||||||||||
Net realized gain (loss) on: | ||||||||||||
Investments | (587,836 | ) | (15 | ) | (25,881 | ) | ||||||
In-Kind Redemptions | (119,000 | ) | 17,031 | 47,854 | ||||||||
Net realized gains (losses) | (706,836 | ) | 17,016 | 21,973 | ||||||||
Change in net unrealized appreciation on investments | 220,622 | 163,285 | 244,485 | |||||||||
Net realized and unrealized gain (loss) on investments | (486,214 | ) | 180,301 | 266,458 | ||||||||
Net increase (decrease) in net assets resulting from operations | $ | (407,590 | ) | $ | 199,097 | $ | 274,490 | |||||
(a) | Commencement of investment operations on December 27, 2019. |
(b) | Commencement of investment operations on July 24, 2020. |
The accompanying notes are an integral part of these financial statements.
| 22 |

Statement of Changes in Net Assets | Global Beta Smart Income ETF |
For the Period | ||||
OPERATIONS | ||||
Net investment income | $ | 78,624 | ||
Net realized loss | (706,836 | ) | ||
Net change in unrealized appreciation | 220,622 | |||
Net decrease in net assets resulting from operations | (407,590 | ) | ||
DISTRIBUTIONS | ||||
Distributable earnings | (66,000 | ) | ||
Total distributions | (66,000 | ) | ||
CAPITAL TRANSACTIONS | ||||
Proceeds from shares issued | $ | 2,400,000 | ||
Cost of shares redeemed | (311,145 | ) | ||
Net increase from capital transactions | 2,088,855 | |||
Total Increase in Net Assets | $ | 1,615,265 | ||
NET ASSETS | ||||
Beginning of period | 100,000 | (b) | ||
End of period | $ | 1,715,265 | ||
SHARE TRANSACTIONS | ||||
Beginning of period | 5,000 | (b) | ||
Shares issued in-kind | 125,000 | |||
Shares redeemed | (5,000 | )(b) | ||
Shares redeemed in-kind | (25,000 | ) | ||
Shares Outstanding, End of Period | 100,000 | |||
(a) | Commencement of investment operations on December 27, 2019. |
(b) | Beginning capital of $100,000 was contributed by Global Beta Advisors LLC, investment adviser to the Fund, in exchange for 5,000 Shares of the Fund in connection with the seeding of the Trust. The Shares were redeemed by the adviser on the commencement of investment operations on December 27, 2019. |
The accompanying notes are an integral part of these financial statements.
| 23 |

Statement of Changes in Net Assets | Global Beta Low Beta ETF |
For the Period | ||||
OPERATIONS | ||||
Net investment income | $ | 18,796 | ||
Net realized gain | 17,016 | |||
Net change in unrealized appreciation | 163,285 | |||
Net increase in net assets resulting from operations | 199,097 | |||
DISTRIBUTIONS | ||||
Distributable earnings | (8,000 | ) | ||
Total distributions | (8,000 | ) | ||
CAPITAL TRANSACTIONS | ||||
Proceeds from shares issued | $ | 3,014,113 | ||
Cost of shares redeemed | (510,678 | ) | ||
Net increase from capital transactions | 2,503,435 | |||
Total Increase in Net Assets | $ | 2,694,532 | ||
NET ASSETS | ||||
Beginning of period | — | |||
End of period | $ | 2,694,532 | ||
SHARE TRANSACTIONS | ||||
Beginning of period | — | |||
Shares issued in-kind | 150,000 | |||
Shares redeemed in-kind | (25,000 | ) | ||
Shares Outstanding, End of Period | 125,000 | |||
(a) | Commencement of investment operations on July 24, 2020. |
The accompanying notes are an integral part of these financial statements.
| 24 |

Statement of Changes in Net Assets | Global Beta Momentum-Growth ETF |
For the Period | ||||
OPERATIONS | ||||
Net investment income | $ | 8,032 | ||
Net realized gain | 21,973 | |||
Net change in unrealized appreciation | 244,485 | |||
Net increase in net assets resulting from operations | 274,490 | |||
DISTRIBUTIONS | ||||
Distributable earnings | (3,000 | ) | ||
Total distributions | (3,000 | ) | ||
CAPITAL TRANSACTIONS | ||||
Proceeds from shares issued | $ | 3,019,328 | ||
Cost of shares redeemed | (508,903 | ) | ||
Net increase from capital transactions | 2,510,425 | |||
Total Increase in Net Assets | $ | 2,781,915 | ||
NET ASSETS | ||||
Beginning of period | — | |||
End of period | $ | 2,781,915 | ||
SHARE TRANSACTIONS | ||||
Beginning of period | — | |||
Shares issued in-kind | 150,000 | |||
Shares redeemed in-kind | (25,000 | ) | ||
Shares Outstanding, End of Period | 125,000 | |||
(a) | Commencement of investment operations on July 24, 2020. |
The accompanying notes are an integral part of these financial statements.
| 25 |

Financial Highlights | Global Beta Smart Income ETF |
For a capital share outstanding throughout the period
For the Period | ||||
Net asset value, beginning of period | $ | 20.00 | ||
INCOME FROM INVESTMENT OPERATIONS: | ||||
Net investment income (b) | 0.74 | |||
Net realized and unrealized loss on investments(c) | (2.99 | ) | ||
Total from investment operations | (2.25 | ) | ||
LESS DISTRIBUTIONS: | ||||
From net investment income | (0.60 | ) | ||
Total distributions | (0.60 | ) | ||
Net asset value, end of period | $ | 17.15 | ||
TOTAL RETURNS: | ||||
Net Asset Value(f) | -10.35 | %^ | ||
Market Value(g) | -10.54 | %^ | ||
RATIOS/SUPPLEMENTAL DATA: | ||||
Net assets, end of period (millions) | $ | 1.7 | ||
RATIO OF EXPENSES TO AVERAGE NET ASSETS: | ||||
Before fees waived and expenses reimbursed | 5.41 | %+ | ||
After fees waived and expenses reimbursed(d) | 0.12 | %+ | ||
RATIO OF NET INVESTMENT INCOME (LOSS) TO AVERAGE NET ASSETS: | ||||
Before fees waived and expenses reimbursed | (0.30 | )%+ | ||
After fees waived and expenses reimbursed(d) | 4.99 | %+ | ||
Portfolio turnover rate(e) | 169 | %^ | ||
(a) | Commencement of investment operations on December 27, 2019. |
(b) | Calculated using average shares outstanding, during the period. |
(c) | The amounts reported for a share outstanding may not agree with the change in the aggregate gains and losses in securities for the fiscal period due to the timing of capital share transactions in relation to the fluctuating market values of the Fund’s underlying securities. |
(d) | Includes voluntary fees waived by the Adviser of $2,698 or 0.17% of average net assets for the period. |
(e) | Portfolio turnover rate excludes in-kind transactions. |
(f) | Net asset value total return is calculated assuming an initial investment made at the net asset value at the beginning of the period, reinvestment of all dividends and distributions at net asset value during the period and redemption on the last day of the period at net asset value. |
(g) | Market value total return is calculated assuming an initial investment made at market value at the beginning of the period, reinvestment of all dividends and distributions at net asset value during the period and redemption on the last day of the period at market value. The market value is determined by the midpoint of the bid/ask spread at 4:00 p.m. from the NYSE Arca, Inc. Exchange. Market value returns may vary from net asset value returns. |
^ | Not Annualized. |
+ | Annualized. |
The accompanying notes are an integral part of these financial statements.
| 26 |

Financial Highlights | Global Beta Low Beta ETF |
For a capital share outstanding throughout the period
For the Period | ||||
Net asset value, beginning of period | $ | 20.00 | ||
INCOME FROM INVESTMENT OPERATIONS: | ||||
Net investment income (b) | 0.15 | |||
Net realized and unrealized gain on investments(c) | 1.46 | |||
Total from investment operations | 1.61 | |||
LESS DISTRIBUTIONS: | ||||
From net investment income | (0.05 | ) | ||
Total distributions | (0.05 | ) | ||
Net asset value, end of period | $ | 21.56 | ||
TOTAL RETURNS: | ||||
Net Asset Value(e) | 8.06 | %^ | ||
Market Value(f) | 7.97 | %^ | ||
RATIOS/SUPPLEMENTAL DATA: | ||||
Net assets, end of period (millions) | $ | 2.7 | ||
RATIO OF EXPENSES TO AVERAGE NET ASSETS: | ||||
Before fees waived and expenses reimbursed | 2.09 | %+ | ||
After fees waived and expenses reimbursed | 0.29 | %+ | ||
RATIO OF NET INVESTMENT INCOME (LOSS) TO AVERAGE NET ASSETS: | ||||
Before fees waived and expenses reimbursed | 0.23 | %+ | ||
After fees waived and expenses reimbursed | 2.03 | %+ | ||
Portfolio turnover rate(d) | 0 | %^,# | ||
(a) | Commencement of investment operations on July 24, 2020. |
(b) | Calculated using average shares outstanding, during the period. |
(c) | The amounts reported for a share outstanding may not agree with the change in the aggregate gains and losses in securities for the fiscal period due to the timing of capital share transactions in relation to the fluctuating market values of the Fund’s underlying securities. |
(d) | Portfolio turnover rate excludes in-kind transactions. |
(e) | Net asset value total return is calculated assuming an initial investment made at the net asset value at the beginning of the period, reinvestment of all dividends and distributions at net asset value during the period and redemption on the last day of the period at net asset value. |
(f) | Market value total return is calculated assuming an initial investment made at market value at the beginning of the period, reinvestment of all dividends and distributions at net asset value during the period and redemption on the last day of the period at market value. The market value is determined by the midpoint of the bid/ask spread at 4:00 p.m. from the NYSE Arca, Inc. Exchange. Market value returns may vary from net asset value returns. |
^ | Not Annualized. |
+ | Annualized. |
# | Less than 1%. |
The accompanying notes are an integral part of these financial statements.
| 27 |

Financial Highlights | Global Beta Momentum-Growth ETF |
For a capital share outstanding throughout the period
For the Period | ||||
Net asset value, beginning of period | $ | 20.00 | ||
INCOME FROM INVESTMENT OPERATIONS: | ||||
Net investment income (b) | 0.06 | |||
Net realized and unrealized gain on investments(c) | 2.22 | |||
Total from investment operations | 2.28 | |||
LESS DISTRIBUTIONS: | ||||
From net investment income | (0.02 | ) | ||
Total distributions | (0.02 | ) | ||
Net asset value, end of period | $ | 22.26 | ||
TOTAL RETURNS: | ||||
Net Asset Value(e) | 11.39 | %^ | ||
Market Value(f) | 11.27 | %^ | ||
RATIOS/SUPPLEMENTAL DATA: | ||||
Net assets, end of period (millions) | $ | 2.8 | ||
RATIO OF EXPENSES TO AVERAGE NET ASSETS: | ||||
Before fees waived and expenses reimbursed | 2.05 | %+ | ||
After fees waived and expenses reimbursed | 0.29 | %+ | ||
RATIO OF NET INVESTMENT INCOME (LOSS) TO AVERAGE NET ASSETS: | ||||
Before fees waived and expenses reimbursed | (0.91 | )%+ | ||
After fees waived and expenses reimbursed | 0.85 | %+ | ||
Portfolio turnover rate(d) | 30 | %^ | ||
(a) | Commencement of investment operations on July 24, 2020. |
(b) | Calculated using average shares outstanding, during the period. |
(c) | The amounts reported for a share outstanding may not agree with the change in the aggregate gains and losses in securities for the fiscal period due to the timing of capital share transactions in relation to the fluctuating market values of the Fund’s underlying securities. |
(d) | Portfolio turnover rate excludes in-kind transactions. |
(e) | Net asset value total return is calculated assuming an initial investment made at the net asset value at the beginning of the period, reinvestment of all dividends and distributions at net asset value during the period and redemption on the last day of the period at net asset value. |
(f) | Market value total return is calculated assuming an initial investment made at market value at the beginning of the period, reinvestment of all dividends and distributions at net asset value during the period and redemption on the last day of the period at market value. The market value is determined by the midpoint of the bid/ask spread at 4:00 p.m. from the NYSE Arca, Inc. Exchange. Market value returns may vary from net asset value returns. |
^ | Not Annualized. |
+ | Annualized. |
The accompanying notes are an integral part of these financial statements.
| 28 |

Notes to the Financial Statements | Global Beta ETF Trust |
November 30, 2020
NOTE 1 – ORGANIZATION
The Global Beta ETF Trust (the “Trust”) was organized as a Delaware statutory trust on April 22, 2019 and is authorized to issue multiple series or portfolios. The Trust is an open-end management investment company, registered under the Investment Company Act of 1940, as amended (the “1940 Act”). The offering of the Funds’ shares (“Shares”) is registered under the Securities Act of 1933, as amended. As of the period covered by this report, the Trust consists of three operational exchange-traded funds. The Global Beta Smart Income ETF (the “Smart Income ETF”), Global Beta Low Beta ETF (the “Low Beta ETF”) and Global Beta Momentum-Growth ETF (the “Momentum-Growth ETF”), (each the “Fund”, collectively the “Funds”) each are diversified series of the Trust, pursuant to the 1940 Act. The Funds seeks to track the performance (before fees and expenses) of the Global Beta Smart Income Index, Global Beta Low Beta Factor Index and Global Beta Momentum-Growth Factor Index (their respective “Target Index”), respectively. There can be no guarantee that a Fund will achieve its investment objective. The inception dates of the Smart Income ETF, Low Beta ETF and Momentum-Growth ETF are December 27, 2019, July 24, 2020 and July 24, 2020, respectively.
NOTE 2 – SIGNIFICANT ACCOUNTING POLICIES
The Trust, which is an investment company, follows accounting and reporting guidance under Financial Accounting Standards Board (“FASB”) Accounting Standards Codification Topic 946, “Financial Services — Investment Companies.”
The following is a summary of significant accounting policies consistently followed by the Funds in the preparation of the financial statements. These policies have been prepared in conformity with accounting principles generally accepted in the United States of America (“GAAP”). The preparation of financial statements in conformity with U.S. GAAP requires management to make estimates and assumptions that affect the reported amounts and disclosures in the financial statements. Actual results could differ from those estimates.
A. Investment Valuation. The net asset value (“NAV”) of the Funds shares is calculated each business day as of the close of regular trading on the New York Stock Exchange (“NYSE”), generally 4:00 p.m., Eastern Time. NAV per share is computed by dividing the net assets by the number of shares outstanding.
When calculating the NAV of each Fund’s shares, securities held by the Funds are valued at market quotations when reliable market quotations are readily available. Exchange traded securities and instruments (including equity securities, depositary receipts and ETFs) are generally valued at the last reported sale price on the principal exchange on which such securities are traded (at the NASDAQ Official Closing Price for NASDAQ listed securities), as of the close of regular trading on the NYSE on the day the securities are being valued or, if there are no sales, at the mean of the most recent bid and asked prices. Over-the-counter securities and instruments not traded on an exchange are generally valued at the last traded price. In the absence of a recorded transaction sale price; or if the last sale price is unavailable, securities are valued at the mean between last bid and ask, as quoted. If an ask price is unavailable, last bid price is used. Such valuations would typically be categorized as Level 1 or Level 2 in the fair value hierarchy described below.
When reliable market quotations are not readily available, securities are priced at their fair value in accordance with the Trust’s valuation guidelines, which were approved by the Board of Trustees (the “Trustees” or the “Board”). The Fund may use fair value pricing in a variety of circumstances, including but not limited to, situations when the value of the Fund’s security has been materially affected by events occurring after the close of the market on which such security is principally traded (such as a corporate action or other news that may materially affect the price of such security) or trading in such security has been suspended or halted. Such valuations would typically be categorized as Level 2 or Level 3 in the fair value hierarchy described below. Fair value pricing involves subjective judgments and it is possible that a fair value determination for a security is materially different than the value that could be realized upon the sale of such security. In addition, fair value pricing could result in a difference between the prices used to calculate each Fund’s NAV and the prices used by the Funds’ Target Index. This may adversely affect the Funds’ ability to track its Target Index.
The Funds disclose the fair value of its investments in a hierarchy that distinguishes between: (1) market participant assumptions developed based on market data obtained from sources independent of the Funds (observable inputs) and (2) the Funds’ own assumptions about market participant assumptions developed based on the best information available under the circumstances (unobservable inputs). The three levels defined by the hierarchy are as follows:
● | Level 1 — Quoted prices in active markets for identical assets. |
● | Level 2 — Other significant observable inputs (including quoted prices for similar securities, interest rates, prepayment speeds, credit risk, etc.). |
| 29 |

Notes to the Financial Statements (Continued) | Global Beta ETF Trust |
November 30, 2020
● | Level 3 — Significant unobservable inputs (including the Funds’ own assumptions in determining the fair value of investments). The inputs or methodology used for valuing securities are not necessarily an indication of the risk associated with investing in those securities. |
The following is a summary of the inputs used to value the Global Beta Smart Income ETF investments as of November 30, 2020:
| Level 1 | Level 2 | Level 3 | Total | ||||||||||||
Common Stocks | ||||||||||||||||
Communication Services | $ | 167,707 | $ | — | $ | — | $ | 167,707 | ||||||||
Consumer Discretionary | 46,377 | — | — | 46,377 | ||||||||||||
Consumer Staples | 185,401 | — | — | 185,401 | ||||||||||||
Energy | 51,785 | — | — | 51,785 | ||||||||||||
Financials | 366,213 | — | — | 366,213 | ||||||||||||
Health Care | 112,608 | — | — | 112,608 | ||||||||||||
Industrials | 84,571 | — | — | 84,571 | ||||||||||||
Information Technology | 257,859 | — | — | 257,859 | ||||||||||||
Materials | 186,721 | — | — | 186,721 | ||||||||||||
Real Estate | 39,462 | — | — | 39,462 | ||||||||||||
Utilities | 215,736 | — | — | 215,736 | ||||||||||||
Total Common Stocks | 1,714,440 | — | — | 1,714,440 | ||||||||||||
Short Term Investment | ||||||||||||||||
Money Market Fund | 1,597 | — | — | 1,597 | ||||||||||||
Total Investments in Securities | $ | 1,716,037 | $ | — | $ | — | $ | 1,716,037 | ||||||||
The following is a summary of the inputs used to value the Global Beta Low Beta ETF investments as of November 30, 2020:
| Level 1 | Level 2 | Level 3 | Total | ||||||||||||
Common Stocks | ||||||||||||||||
Communication Services | $ | 295,446 | $ | — | $ | — | $ | 295,446 | ||||||||
Consumer Discretionary | 341,611 | — | — | 341,611 | ||||||||||||
Consumer Staples | 928,798 | — | — | 928,798 | ||||||||||||
Energy | 1,717 | — | — | 1,717 | ||||||||||||
Financials | 59,591 | — | — | 59,591 | ||||||||||||
Health Care | 704,616 | — | — | 704,616 | ||||||||||||
Industrials | 225,103 | — | — | 225,103 | ||||||||||||
Information Technology | 34,587 | — | — | 34,587 | ||||||||||||
Materials | 25,122 | — | — | 25,122 | ||||||||||||
Real Estate | 8,449 | — | — | 8,449 | ||||||||||||
Utilities | 64,349 | — | — | 64,349 | ||||||||||||
Total Common Stocks | 2,689,389 | — | — | 2,689,389 | ||||||||||||
Short Term Investment | ||||||||||||||||
Money Market Fund | 766 | — | — | 766 | ||||||||||||
Total Investments in Securities | $ | 2,690,155 | $ | — | $ | — | $ | 2,690,155 | ||||||||
| 30 |

Notes to the Financial Statements (Continued) | Global Beta ETF Trust |
November 30, 2020
The following is a summary of the inputs used to value the Global Beta Momentum-Growth ETF investments as of November 30, 2020:
| Level 1 | Level 2 | Level 3 | Total | ||||||||||||
Common Stocks | ||||||||||||||||
Communication Services | $ | 231,824 | $ | — | $ | — | $ | 231,824 | ||||||||
Consumer Discretionary | 194,164 | — | — | 194,164 | ||||||||||||
Consumer Staples | 83,754 | — | — | 83,754 | ||||||||||||
Financials | 273,338 | — | — | 273,338 | ||||||||||||
Health Care | 318,563 | — | — | 318,563 | ||||||||||||
Industrials | 130,088 | — | — | 130,088 | ||||||||||||
Information Technology | 1,490,633 | — | — | 1,490,633 | ||||||||||||
Materials | 12,646 | — | — | 12,646 | ||||||||||||
Real Estate | 18,034 | — | — | 18,034 | ||||||||||||
Utilities | 26,418 | — | — | 26,418 | ||||||||||||
Total Common Stocks | 2,779,462 | — | — | 2,779,462 | ||||||||||||
Short Term Investment | ||||||||||||||||
Money Market Fund | 1,976 | — | — | 1,976 | ||||||||||||
Total Investments in Securities | $ | 2,781,438 | $ | — | $ | — | $ | 2,781,438 | ||||||||
B. Real Estate Investment Trust. The Funds may obtain exposure to real estate investment trusts (“REITs”). Equity REITs invest primarily in real property while mortgage REITs make construction, development and long-term mortgage loans. Their value may be affected by changes in the value of the underlying property of the REIT, the creditworthiness of the issuer, property taxes, interest rates, and tax and regulatory requirements, such as those relating to the environment.
REITs are dependent upon management skill, are not diversified and are subject to heavy cash flow dependency, default by borrowers, self-liquidation and the possibility of failing to qualify for tax free income status under the Internal Revenue Code of 1986 and failing to be exempt from registration as a registered investment company under the 1940 Act.
C. Foreign Currency Translation. Investment securities and other assets and liabilities denominated in foreign currencies are translated into U.S. dollar amounts at the date of valuation. The Funds do not isolate that portion of the results of operations resulting from changes in foreign exchange rates on investments from fluctuations arising from changes in market prices of securities held. Such fluctuations are included with the net realized and unrealized gain or loss from investments. The Funds report net realized foreign exchange gains or losses that arise from sales of foreign currencies, currency gains or losses realized between the trade and settlement dates on foreign currency transactions, and the differences between the amounts of dividends, interest and foreign withholding taxes recorded on the Funds’ books and the U.S. dollar equivalent of the amounts actually received or paid. Net unrealized foreign exchange gains and losses arise from changes in the values of assets and liabilities, other than investments in securities at fiscal period end, resulting from changes in exchange rates.
D. Federal Income Taxes. The Funds’ policy is to comply with the requirements of Subchapter M of the Internal Revenue Code of 1986, as amended, necessary to qualify as regulated investment companies and distribute substantially all net taxable investment income and net realized gains to shareholders in a manner which results in no tax expense to the Funds. Therefore, no federal income tax provision is required. The Funds plan to file U.S. Federal and various state and local tax returns.
The Funds recognize the tax benefits of uncertain tax positions only when the position is more likely than not to be sustained. Management has analyzed the Funds’ uncertain tax positions and concluded that no liability for unrecognized tax benefits should be recorded related to uncertain tax positions. Management is not aware of any tax positions for which it is reasonably possible that the total amounts of unrecognized tax benefits will change materially in the next 12 months. Income and capital gain distributions are determined in accordance with federal income tax regulations, which may differ from U.S. GAAP. The Funds recognize interest and penalties, if any, related to unrecognized tax benefits on uncertain tax positions as income tax expenses in the Statements of Operations. During the current fiscal period, the Funds did not incur any interest or penalties.
| 31 |

Notes to the Financial Statements (Continued) | Global Beta ETF Trust |
November 30, 2020
Net capital losses incurred after October 31 and late year losses incurred after December 31 and within the taxable year are deemed to arise on the first business day of each Fund’s next taxable year.
For fiscal year ended November 30, 2020, the Funds did not have any post October losses.
Under the Regulated Investment Company Modernization Act of 2010, the Funds are permitted to carry forward capital losses for an unlimited period. Capital loss carry forwards will retain their character as either short-term or long-term capital losses. At November 30, 2020, the following Capital Loss Carryover were available:
| Indefinite Short-Term | Total | ||||||
Global Beta Smart Income ETF | $ | 579,499 | $ | 579,499 | ||||
Global Beta Momentum-Growth ETF | $ | 25,552 | $ | 25,552 | ||||
E. Security Transactions and Investment Income. Investment securities transactions are accounted for on the trade date. Gains and losses realized on sales of securities are determined on a specific identification basis. Dividend income is recorded on the ex-dividend date. Interest income is recorded on an accrual basis. Withholding taxes on foreign dividends, if any, have been provided for in accordance with the Funds’ understanding of the applicable tax rules and regulations. Distributions received from the Funds’ investments in REITs may be characterized as ordinary income, net capital gain, or a return of capital. The proper characterization of REIT distributions is generally not known until after the end of each calendar year. As such, the Funds must use estimates in reporting the character of their income and distributions for financial statement purposes. The actual character of distributions to the Funds’ shareholders will be reflected on the Form 1099 received by shareholders after the end of the calendar year. Due to the nature of REIT investments, a portion of the distributions received by the Funds’ shareholders may represent a return of capital.
F. Distributions to Shareholders. Distributions to shareholders from net investment income for the Funds are declared and paid on a quarterly basis. The net realized gains on securities normally are declared and paid on an annual basis for each Fund. Distributions are recorded on the ex-dividend date.
G. Use of Estimates. The preparation of financial statements in conformity with GAAP requires management to make estimates and assumptions that affect the reported amounts of assets and liabilities and disclosure of contingent assets and liabilities at the date of the financial statements, and the reported amounts of increases and decreases in net assets from operations during the reporting period. Actual results could differ from those estimates.
H. Share Valuation. The NAV per share of the Funds are calculated by dividing the sum of the value of the securities held by the Funds, plus cash and other assets, minus all liabilities (including estimated accrued expenses) by the total number of shares outstanding for the Funds, rounded to the nearest cent. The Funds’ shares will not be priced on the days on which the NYSE is closed for trading. The offering and redemption price per share for the Funds are equal to the NAV per share.
I. Guarantees and Indemnifications. In the normal course of business, the Trust, on behalf of the Fund, enters into contracts with third-party service providers that contain a variety of representations and warranties and that provide general indemnifications. Additionally, under the Trust organizational documents, the officers and Trustees are indemnified against certain liabilities arising out of the performance of their duties to the Trust. The Funds’ maximum exposure under these arrangements is unknown, as it involves possible future claims that may or may not be made against the Funds. The Adviser is of the view that the risk of loss to the Funds in connection with the Funds indemnification obligations is remote; however, there can be no assurance that such obligations will not result in material liabilities that adversely affect the Funds.
J. Reclassification of Capital Accounts. U.S. GAAP requires that certain components of net assets relating to permanent differences be reclassified between financial and tax reporting. These reclassifications have no effect on net assets or NAV per share and are primarily due to differing book and tax treatments for in-kind transactions. For the fiscal period ended November 30, 2020, the following adjustments were made:
| Distributable Earnings | Paid-in Capital | ||||||
Global Beta Smart Income ETF | $ | 118,964 | $ | (118,964 | ) | |||
Global Beta Low Beta ETF | $ | (17,031 | ) | $ | 17,031 | |||
Global Beta Momentum-Growth ETF | $ | (47,870 | ) | $ | 47,870 | |||
| 32 |

Notes to the Financial Statements (Continued) | Global Beta ETF Trust |
November 30, 2020
K. COVID-19. The global outbreak of COVID-19 (commonly referred to as “coronavirus”) has disrupted economic markets and the prolonged economic impact is uncertain. The ultimate economic fallout from the pandemic, and the long-term impact on economies, markets, industries and individual issuers, are not known. The operational and financial performance of the issuers of securities in which the Funds invests depends on future developments, including the duration and spread of the outbreak, and such uncertainty may in turn adversely affect the value and liquidity of the Fund’s investments, and negatively impact the Funds’ performance.
L. Subsequent Events. In preparing these financial statements, management has evaluated events and transactions for potential recognition or disclosure through the date these financial statements were issued. Effective December 18, 2020, the Momentum-Growth Fund was renamed to the Global Beta Rising Stars ETF and the investment objective has changed from seeking to track the performance of the Global Beta Momentum-Growth Factor Index to seeking to track the performance of the FactSet Rising Stars Index.
There were no other events or transactions that occurred during the period subsequent to the end of the current fiscal period that materially impacted the amounts or disclosures in the financial statements.
NOTE 3 – COMMITMENTS AND OTHER RELATED PARTY TRANSACTIONS
Global Beta Advisors LLC serves as the investment adviser to the Funds. Pursuant to an Investment Advisory Agreement (“Advisory Agreement”) between the Trust, on behalf of the Funds, and the Adviser, the Adviser provides investment advice to the Funds and oversees the day-to-day operations of the Funds, subject to the direction and control of the Board and the officers of the Trust. The Adviser administers the Fund’s business affairs, provides office facilities and equipment and certain clerical, bookkeeping and administrative services. For services provided to the Funds, the Funds each pay the Adviser a management fee at an annual rate of 0.29% based on each Funds’ average daily net assets. For the period ended November 30, 2020, the Smart Income ETF, Low Beta ETF and Momentum-Growth ETF incurred $4,569, $2,692 and $2,741 in investment advisory fees, respectively.
Under the terms of the Trust’s Advisory Agreement, the Adviser has agreed to pay all of the ordinary operating expenses of the Funds that the Funds would be otherwise required to pay except for (i) the management fee payment under Advisory Agreement, (ii) payments under the Funds’ Rule 12b-1 plan, (iii) brokerage expenses (including any costs incidental to transactions in portfolio securities or instruments), (iv) acquired fund fees and expenses, (v) taxes, (vi) interest (including borrowing costs and dividend expenses on securities sold short and overdraft charges), (vii) litigation expenses (including litigation to which the Trust or the Funds may be a party and indemnification of the Board and officers with respect thereto), (viii) compensation and expenses of the members of the Board who are not “interested” within the meaning of the 1940 Act (the “Independent Trustees”), (ix) fees and expenses of counsel to the Independent Trustees and (x) other extraordinary or non-routine expenses (including expenses arising from mergers, acquisitions or similar transactions involving any Funds).
Pursuant to an Expense Reimbursement Agreement (“Expense Agreement”), the Adviser has agreed to reimburse the Global Beta Smart Income ETF through March 31, 2021 for the (i) compensation and expenses of the Independent Trustees and (ii) fees and expenses of Counsel to the Independent Trustees, except for any (i) litigation expenses (including litigation to which the Trust or the Fund may be a party and indemnification of the Independent Trustees with respect thereto) and (ii) extraordinary or non-routine fees or expenses. For the period ended November 30, 2020, the Adviser reimbursed the Smart Income ETF, Low Beta ETF and Momentum-Growth ETF, $80,667, $16,667 and $16,667, respectively. The Adviser agreed to voluntarily waive its investment advisory fees for the Smart Income Fund through June 30, 2020. For the period ended November 30, 2020, the voluntary fees waived was $2,698. Pursuant to the Expense Agreement, waived fees are not subject to recoupment by the Adviser.
U.S. Bancorp Fund Services, LLC dba U.S. Bank Global Fund Services (“Fund Services”), an indirect wholly-owned subsidiary of U.S. Bancorp, serves as the Funds’ administrator and, in that capacity, performs various administrative and accounting services for the Funds. Funds Services also serves as the Funds’ fund accountant, transfer agent, dividend disbursing agent and registrar. Fund Services prepares various federal and state regulatory filings, reports and returns for the Funds’, including regulatory compliance monitoring and financial reporting; prepares reports and materials to be supplied to the Trustees; monitors the activities of the Funds’ custodian; coordinates the preparation and payment of the Fund’s, advisory expense, Independent Trustee compensation, and the expense of Counsel to the Independent Trustees and reviews those expense accruals. Compass Distributors, LLC (the “Distributor”) serves as the principal underwriter for shares of the Funds, and acts as the Funds’ distributor in a continuous public offering of the Funds’ shares. U.S. Bank, N.A. (“U.S. Bank”), an affiliate of Funds Services, serves as the Funds’ custodian (the “Custodian”). As of November 30, 2020, there were no fees incurred by the Funds from the service providers described above as the Adviser bore all such costs.
| 33 |

Notes to the Financial Statements (Continued) | Global Beta ETF Trust |
November 30, 2020
Compass Distributors, LLC serves as the Distributor of Creation Units for the Fund. Shares are continuously offered for sale by the Trust through the Distributor only in Creation Units, as described in Note 6. Shares in less than Creation Units are not distributed by the Distributor. The Distributor is a broker-dealer registered under the Securities Exchange Act of 1934, as amended, and a member of the Financial Industry Regulatory Authority, Inc. (“FINRA”).
At November 30, 2020, certain officers and Trustees of the Trust were also officers or employees of the Adviser or affiliated with the Distributor.
NOTE 4 – PURCHASES AND SALES OF SECURITIES
The costs of purchases and sales of securities, excluding short-term securities and in-kind transactions, during the period ended November 30, 2020:
| Purchases | Sales | ||||||
Global Beta Smart Income ETF | $ | 2,886,495 | $ | 2,865,134 | ||||
Global Beta Low Beta ETF | $ | 261,471 | $ | 10,673 | ||||
Global Beta Momentum-Growth ETF | $ | 1,419,582 | $ | 797,906 | ||||
The costs of purchases and sales of in-kind transactions associated with creations and redemptions during the period ended November 30, 2020:
| Purchases In-Kind | Sales In-Kind | ||||||
Global Beta Smart Income ETF | $ | 2,492,707 | $ | 310,185 | ||||
Global Beta Low Beta ETF | $ | 2,442,815 | $ | 184,520 | ||||
Global Beta Momentum-Growth ETF | $ | 2,393,058 | $ | 501,654 | ||||
NOTE 5 – DISTRIBUTIONS TO SHAREHOLDERS
The tax character of the distributions paid during the period ended November 30, 2020 were as follows:
| Ordinary Income | |||
Global Beta Smart Income ETF | $ | 66,000 | ||
Global Beta Low Beta ETF | $ | 8,000 | ||
Global Beta Momentum-Growth ETF | $ | 3,000 | ||
As of November 30, 2020, the components of accumulated earnings (losses) for income tax purposes were as follows:
| Global Beta | Global Beta | Global Beta | |||||||||
Federal income tax cost of investments | $ | 1,503,788 | $ | 2,527,543 | $ | 2,537,298 | ||||||
Aggregate gross unrealized appreciation | 247,722 | 219,540 | 289,787 | |||||||||
Aggregate gross unrealized depreciation | (35,473 | ) | (56,928 | ) | (45,647 | ) | ||||||
Net unrealized appreciation (depreciation) | 212,249 | 162,612 | 244,140 | |||||||||
Undistributed Ordinary Income | 12,624 | 11,449 | 5,032 | |||||||||
Undistributed Long Term Capital Gains | — | 5 | — | |||||||||
Total distributable earnings | 12,624 | 11,454 | 5,032 | |||||||||
Accumulated capital and other gain/(loss) | (579,499 | ) | — | (25,552 | ) | |||||||
Total accumulated gain/(loss) | (354,626 | ) | 174,066 | 223,620 | ||||||||
| 34 |

Notes to the Financial Statements (Continued) | Global Beta ETF Trust |
November 30, 2020
NOTE 6 – SHARE TRANSACTIONS
Shares of the Funds are listed and traded on the NYSE. Market prices for the shares may be different from their NAV. The Funds will issue and redeem Shares on a continuous basis at NAV only in large blocks of shares, typically 25,000 Shares, called “Creation Units.” Creation Units will be issued and redeemed principally in-kind for a specified basket of securities (which may include cash in lieu of certain securities), together with the deposit of a specified cash amount. Once created, shares generally will trade in the secondary market at market prices that change throughout the day in amounts less than a Creation Unit. Except when aggregated in Creation Units, shares are not redeemable securities of the Funds. Shares of the Funds may only be purchased or redeemed by certain financial institutions (“Authorized Participants”). An Authorized Participant is either (i) a broker-dealer or other participant in the clearing process through the Continuous Net Settlement System of the National Securities Clearing Corporation or (ii) a participant in The Depository Trust Company and, in each case, must have executed a Participant Agreement with the Funds’ distributor, Compass Distributors, LLC (the “Distributor”). Most retail investors will not qualify as Authorized Participants or have the resources to buy and sell whole Creation Units. Therefore, they will be unable to purchase or redeem shares directly from the Funds. Rather, most retail investors will purchase shares in the secondary market with the assistance of a broker and will be subject to customary brokerage commissions or fees.
The Funds currently offer one class of shares, which has no front-end sales load, no deferred sales charge, and no redemption fee. The standard fixed transaction fee for the Funds are $250, payable to the Custodian. Additionally, a variable fee may be charged by the Funds of up to a maximum of 2% of the value of the Creation Unit (inclusive of any transaction fees charged), for each creation or redemption. Variable fees are imposed to compensate the Funds for the transaction costs associated with creation and redemption transactions. The Adviser, subject to the approval of the Board, may adjust or waive the transaction fees from time to time. The Funds may issue an unlimited number of shares of beneficial interest, with no par value. All shares of the Funds have equal rights and privileges.
NOTE 7 – BENEFICIAL OWNERSHIP
The beneficial ownership, either directly or indirectly, of more than 25% of the voting securities of a fund creates a presumption of control of the fund, under Section 2(a)(9) of the Investment Company Act of 1940. As of the fiscal period ended November 30, 2020, a beneficial owner of the Adviser owned 62,600 shares of the Smart Income ETF, representing 62.6% of the shares outstanding, Wells Fargo Bank owned 112,000 shares of the Low Beta ETF and 102,000 shares of the Momentum-Growth ETF, representing 89.6% and 81.6% of the shares outstanding, respectively.
NOTE 8 – PRINCIPAL RISKS
As with all exchange traded funds (‘’ETFs’’), shareholders of the Funds are subject to the risk that their investment could lose money. The Funds are subject to the principal risks, any of which may adversely affect the Fund’s NAV, trading price, yield, total return and ability to meet its investment objective. A description of principal risks is included in the prospectus under the heading ‘’Principal Investment Risks’’.
| 35 |

Report of Independent Registered Accounting Firm | Global Beta ETF Trust |
To the Board of Trustees of Global Beta ETF Trust
and the Shareholders of Global Beta Smart Income ETF, Global Beta Low Beta ETF and Global Beta Momentum-Growth ETF:
Opinion on the Financial Statements
We have audited the accompanying statements of assets and liabilities, including the schedules of investments, of Global Beta Smart Income ETF, Global Beta Low Beta ETF and Global Beta Momentum-Growth ETF (collectively the “Funds”) as of November 30, 2020, the related statements of operations, statements of changes in net assets and financial highlights for the period then ended, and the related notes (collectively referred to as the “financial statements”). In our opinion, the financial statements present fairly, in all material respects, the financial position of the Funds as of November 30, 2020, and the results of their operations, changes in net assets and financial highlights for the period then ended, in conformity with accounting principles generally accepted in the United States of America.
Basis for Opinion
These financial statements and financial highlights are the responsibility of the Funds’ management. Our responsibility is to express an opinion on these financial statements and financial highlights based on our audits. We are a public accounting firm registered with the Public Company Accounting Oversight Board (United States) (“PCAOB”) and are required to be independent with respect to the Funds in accordance with the U.S. federal securities laws and the applicable rules and regulations of the Securities and Exchange Commission and the PCAOB.
We conducted our audits in accordance with the standards of the PCAOB. Those standards require that we plan and perform the audits to obtain reasonable assurance about whether the financial statements and financial highlights are free of material misstatement, whether due to error or fraud. The Funds are not required to have, nor were we engaged to perform, an audit of their internal control over financial reporting. As part of our audits we are required to obtain an understanding of internal control over financial reporting but not for the purpose of expressing an opinion on the effectiveness of the Funds’ internal control over financial reporting. Accordingly, we express no such opinion.
Our audits included performing procedures to assess the risks of material misstatement of the financial statements and financial highlights, whether due to error or fraud, and performing procedures that respond to those risks. Such procedures included examining, on a test basis, evidence regarding the amounts and disclosures in the financial statements and financial highlights. Our audits also included evaluating the accounting principles used and significant estimates made by management, as well as evaluating the overall presentation of the financial statements and financial highlights. Our procedures included confirmation of securities owned as of November 30, 2020 by correspondence with the custodian. We believe that our audits provide a reasonable basis for our opinion.
/s/WithumSmith+Brown, PC
We have served as the auditor of one or more series of the Trust since 2019.
Boston, Massachusetts
January 28, 2021
| 36 |

Expense Example | Global Beta ETF Trust |
For the Period Ended November 30, 2020 (Unaudited)
As a shareholder of the Smart Income ETF, Low Beta ETF and/or Momentum-Growth ETF, you incur two types of costs: (1) transaction costs, including brokerage commissions on purchases and sales of Fund shares, and (2) ongoing costs, including management fees and other Fund expenses. This Example is intended to help you understand your ongoing costs (in dollars)(excluding transaction costs) of investing in the Fund and to compare these costs with the ongoing costs of investing in other funds. The example is based on an investment of $1,000 invested at the beginning of the period and held for the entire six-month period (June 1, 2020 – November 30, 2020) for the Smart Income ETF. The actual dollar amounts shown as expenses paid during the period for the Low Beta ETF and Momentum Growth ETF are multiplied by 130/366, which is based on the date of inception (July 24, 2020).
Actual Expenses
The first line of the table below provides information about actual account values based on actual returns and actual expenses. You may use the information in this line, together with the amount you invested, to estimate the expenses that you paid over the period. Simply divide your account value by $1,000 (for example, an $8,600 account value divided by $1,000 = 8.6), then, multiply the result by the number in the first line under the heading entitled “Expenses Paid During the Period’’ to estimate the expenses you paid on your account during this period.
Hypothetical Example For Comparison Purposes
The second line of the table provides information about hypothetical account values based on a hypothetical return and hypothetical expenses based on the Funds’ actual expense ratio and an assumed rate of return of 5% per year before expenses, which is not the Funds’ actual return. The hypothetical account values and expenses may not be used to estimate the actual ending account balance or expenses you paid for the period. You may use this information to compare the ongoing costs of investing in the Funds and other funds. To do so, compare this 5% hypothetical example with the 5% hypothetical examples that appear in the shareholder reports of the other funds. Please note that the expenses shown in the table are meant to highlight your ongoing costs only and do not reflect any transactional costs, such as brokerage commissions paid on purchases and sales of Fund shares. Therefore, the second line of the table is useful in comparing ongoing costs only and will not help you determine the relative total costs of owning different funds. If these transactional costs were included, your costs would have been higher.
| 37 |

Expense Example (Continued) | Global Beta ETF Trust |
For the Period Ended November 30, 2020 (Unaudited)
Global Beta Smart Income ETF
| Beginning | Ending | Expenses Paid |
Actual | $1,000.00 | $1,216.00 | $1.35 |
Hypothetical (5% annual return before expenses) | $1,000.00 | $1,023.78 | $1.23 |
Global Beta Low Beta ETF
| Beginning | Ending | Expenses Paid |
Actual | $1,000.00 | $1,080.60 | $1.07 |
Hypothetical (5% annual return before expenses) | $1,000.00 | $1,016.73 | $1.04 |
Global Beta Momentum-Growth ETF
| Beginning | Ending | Expenses Paid |
Actual | $1,000.00 | $1,113.90 | $1.09 |
Hypothetical (5% annual return before expenses) | $1,000.00 | $1,016.73 | $1.04 |
* | The dollar amounts shown as expenses paid during the period are equal to the annualized expense ratio, 0.24%, multiplied by the number of days in the six-month period, 183 days, and divided by the number of days in the most recent twelve-month period, 366 days. |
** | The dollar amounts shown as expenses paid during the period are equal to the annualized expense ratio, 0.29%, multiplied by the number of days in the six-month period, 183 days, and divided by the number of days in the most recent twelve-month period, 366 days. The actual dollar amounts shown in the expenses paid during the period for the Fund are multiplied by 130/366, which is based on the date of inception (July 24, 2020). |
| 38 |

Approval of Advisory Agreement and | Global Beta ETF Trust |
At the July 21, 2020 meeting (the “Meeting”) of the Board of Trustees (the “Board”) of Global Beta ETF Trust (the “Trust”), the Board, including those Trustees (the “Independent Trustees”) who are not “interested persons” (as that term is defined in the Investment Company Act of 1940 (the “1940 Act”)) of the Trust, approved the investment advisory agreement (the “Investment Advisory Agreement”) between Global Beta Advisors LLC (the “Adviser”) and the Trust with respect to the Global Beta Low Beta ETF (“GBLO”) and the Global Beta Rising Stars ETF (formerly known as Global Beta Momentum-Growth ETF) (“GBGR”) (each a “Fund,” and, collectively, the “Funds”), for an initial two-year term. Under the Investment Advisory Agreement, the Adviser is obligated to pay all of the ordinary operating expenses of the Funds, except for certain excluded items (the “Unified Fee”).
In considering approval of the Investment Advisory Agreement, the Independent Trustees met in executive session with independent counsel, who provided assistance and advice. The Board, including the Independent Trustees, evaluated the terms of the Investment Advisory Agreement, reviewed the information provided by the Adviser in connection with the consideration of approving the Investment Advisory Agreement, and reviewed the duties and responsibilities of the Trustees in evaluating and approving the Investment Advisory Agreement.
In considering the approval of the Investment Advisory Agreement, the Board, including the Independent Trustees, reviewed the materials provided for the Meeting, including: (1) a copy of the form of Investment Advisory Agreement; (2) the Adviser’s response to a questionnaire from counsel and responses to follow-up questions related thereto; (3) the Adviser’s Form ADV; (4) financial and insurance information for the Adviser; and (5) a memorandum on the responsibilities of trustees in considering investment advisory arrangements.
In addition, the Board considered data compiled by the Adviser from an unaffiliated third party database comparing the proposed advisory fee and projected expense ratio of each Fund with the advisory fees and net expense ratios (i.e., after fee waivers and reimbursements) of an appropriate peer group of U.S.-listed index-based ETFs (each a “Peer Group,” and, collectively, the “Peer Groups”). The Board discussed the criteria used by the Adviser for selecting the Peer Group. The Board, including the Independent Trustees, concluded that the data was useful and reliable for the purpose of reviewing the Investment Advisory Agreement.
During their review of this information, the Board, including the Independent Trustees, focused on and analyzed the factors that they deemed relevant, including: (1) the nature, extent, and quality of the services to be provided by the Adviser; (2) the cost of the services to be provided and the profits to be realized by the Adviser from services rendered to the Funds; (3) comparative fee and expense data for the Funds and other investment companies with similar investment objectives; (4) the extent to which economies of scale would be realized as each Fund grows and whether the proposed advisory fee for each Fund reflects these economies of scale for the benefit of the Fund; and (5) other financial benefits to the Adviser and its affiliates resulting from services rendered to the Funds.
In particular, the Board considered and reviewed the following with respect to the Funds:
(a) The nature, extent and quality of services to be provided to the Funds by the Adviser. The Board considered the scope of services to be provided under the Investment Advisory Agreement. In considering the nature, extent and quality of the services to be provided by the Adviser, the Board reviewed the Adviser’s compliance infrastructure and its financial strength and resources. The Board also considered the Adviser’s experience working with ETFs, including serving as investment adviser to the Global Beta Smart Income ETF (“GBDV”). The Board also considered other services to be provided to each Fund by the Adviser, such as selecting broker-dealers for executing portfolio transactions, monitoring adherence to each Fund’s investment restrictions, and monitoring compliance with various Trust policies and procedures and with applicable securities regulations. Based on the factors above, as well as those discussed below, the Board concluded that it was satisfied with the nature, extent and quality of the services to be provided to each Fund by the Adviser based on its experience, personnel, operations and resources.
(b) The cost of services to be provided to the Funds by the Adviser, profitability and economies of scale. The Board reviewed the proposed expense ratio and advisory fee to be paid by each Fund and considered the advisory fees and expense ratios of comparable funds. The Board noted that GBLO’s advisory fee and net expense ratio were below the average advisory fee and net expense ratio of GBLO’s Peer Group. The Board noted that GBGR’s advisory fee was equal to the average advisory fee of GBGR’s Peer Group and GBGR’s net expense ratio was below the average net expense ratio of GBGR’s Peer Group. The Board concluded that the advisory fees were reasonable. The Board took into consideration that each advisory fee was a “unified fee,” meaning that the Adviser bears all of the ordinary operating expenses of each Fund, except for certain excluded items. The Board also took into account the proposed Expense Reimbursement Agreement. The Board considered that the Adviser does not currently manage any third-party client accounts pursuant to the Funds’ investment strategies. The Board also evaluated the compensation and benefits expected to be received by the Adviser from its relationship with the Funds, taking into account the Adviser’s profitability. The Board noted that the Adviser had borne all of the organizational expenses of each proposed
| 39 |

Approval of Advisory Agreement and Board Considerations (Unaudited) (Continued) | Global Beta ETF Trust |
Fund to date. The Board noted that, because the Funds had not yet commenced operations, it was too early to assess the potential for economies of scale, though the Board would address economies of scale when assets under management reached appropriate levels.
(c) The investment performance of the Adviser. The Board noted that there was no prior performance of each Fund to consider, but they had considered the Adviser’s experience managing related investment vehicles (including GBDV) and the performance of GBDV. They noted that such performance demonstrated the Adviser’s ability to effectively manage investments using similar strategies. After considering all of the information, the Board concluded that each Fund and its shareholders were likely to benefit from the Adviser’s management.
Conclusion. No single factor was determinative to the decision of the Board. Based on the Board’s deliberations and its evaluation of the information described above and such other matters as were deemed relevant, the Board, including the Independent Trustees, unanimously: (a) concluded that the terms of the Investment Advisory Agreement were fair and reasonable; (b) concluded that the Adviser’s fees were reasonable in light of the services that the Adviser will provide to the Funds; and (c) agreed to approve the Advisory Agreement on behalf of the Funds for an initial term of two years.
| 40 |

Trustees and Officers (Unaudited) | Global Beta ETF Trust |
The business and affairs of the Trust are managed by its officers under the oversight of its Board. The Board sets broad policies for the Trust and may appoint Trust officers. The Board oversees the performance of the Adviser and the Trust’s other service providers.
Two Trustees are owners and officers of the Adviser. The other Trustees are Independent Trustees. The fund complex includes all funds advised by the Adviser (“Fund Complex”).
The Trustees, their year of birth, term of office and length of time served, their principal business occupations during the past five years, the number of portfolios in the Fund Complex overseen and other directorships, if any, held by each Trustee, are shown below. The officers, their year of birth, term of office and length of time served and their principal business occupations during the past five years, are shown below. Unless noted otherwise, the address of each Trustee and each officer is: c/o Global Beta ETF Trust, 2001 Market Street, Suite 2630, Philadelphia, PA 19103.
Name, Address*, | Position(s) | Term of Office** and Length of Time Served | Principal Occupation(s) | Number of | Other Directorships |
Independent Trustees | |||||
Peter Burchfield Year of Birth: 1957 | Trustee | Since 2019 | Client Service Marketing Director, Henry James International (investment advisory firm) (2017 to present); Client Service Marketing Director, Navellier and Associates (investment advisory firm) (2002 to 2017) | 3 | None |
Richard Haverstick Year of Birth: 1952 | Trustee | Since 2019 | Trustee, BMT Investment Fund (registered investment company) (2017 to present); Trustee, Brandywine Realty Trust (commercial real estate) (2016 to present); Trustee, Actua Corporation (cloud technology) (2016 to 2018); Consultant, Haverstick Consulting (2015 to 2016) | 3 | BMT Investment Fund (2017 to present); Thomas Jefferson University (2013 to present); Jefferson Health (2013 to present); Brandywine Realty Trust (2016 to present) |
David Downes*** Year of Birth: 1940 | Trustee | Since 2019 | Director, Egan-Jones Ratings Company (rating agency) (June 2019 to February 2020); Treasurer, Quaker Investment Trust (registered investment company) (2018 to December 2020); Independent Director, TLC Credit, Inc. (closed-end investment company) (2009 to 2017); Trustee, Community Capital Management, (investment management company) (2006 to present); President, The Community Reinvestment Act Qualified Investment Fund (investment management company) (2004 to December 2020); Trustee, OppenheimerFunds, Inc. (registered investment company) (2005 to 2015); Trustee, GSK Employment Benefit Trust (defined benefits/defined contribution employee trust) (2006 to 2014) | 3 | Community Capital Management (2006 to December 2020); CRA Funds Advisor (2006 to December 2020); TLC Credit, Inc. (2009 to 2017) |
| 41 |

Trustees and Officers (Unaudited) (Continued) | Global Beta ETF Trust |
Name, Address*, | Position(s) | Term of Office** and Length of Time Served | Principal Occupation(s) | Number of | Other Directorships |
Interested Trustee**** | |||||
Vincent T. Lowry Year of Birth: 1951 | Chairman of the Board of Trustees and President | Since 2019 | Chief Executive Officer, Global Beta Advisors LLC (2016 to present); Lead Portfolio Manager, OppenheimerFunds, Inc. (2015 to 2017); Chief Executive Officer, VTL Associates, LLC (registered investment advisor) (2004 to 2015), Board of Directors, Datasea, Inc. (DTSS) (2020 to present) | 3 | None |
Justin Lowry Year of Birth: 1987 | Trustee | Since 2019 | President and Chief Investment Officer, Global Beta Advisors LLC (2017 to present); Director of Research, OppenheimerFunds, Inc. (2015 to 2017); Portfolio Manager and Head of Research, VTL Associates, LLC (2010 to 2015) | 3 | None |
* | Each Independent Trustee may be contacted by writing to the Independent Trustees of Global Beta ETF Trust, 2001 Market Street, Suite 2630, Philadelphia, PA 19103. |
** | Each Trustee serves until his successor is duly elected or appointed and qualified. |
*** | Mr. Downes’s FINRA Series 7, 24 and 29 licenses are held by Foreside Fund Services, LLC, an affiliate of the Distributor. |
**** | Vincent T. Lowry and Justin Lowry are considered to be interested persons of the Trust because of their relationship with the Adviser. |
| 42 |

Trustees and Officers (Unaudited) (Continued) | Global Beta ETF Trust |
Name, Address, | Position(s) | Term of Office* | Principal Occupation(s) During Past 5 Years |
Officers
The officers of the Trust not named above are: | |||
Joshua Hunter | Treasurer and Principal Financial Officer | Since 2019 | Director – Fund Principal Financial Officer, Foreside Financial Group, LLC (2015 to present); Fund Principal Financial Officer and Treasurer, FQF Trust (2015 to present); Fund Chief Financial Officer and Treasurer, Precidian ETFs Trust (2015 to present); Fund Principal Financial Officer and Treasurer, OSI ETF Trust (2016 to present); Vice President and Assistant Vice President, JPMorgan Chase & Co. (2011 to 2015) |
Jim Nash | Chief Compliance Officer | Since 2019 | Director, Fund Chief Compliance Officer, Foreside Fund Officer Services, LLC (2016 to present); Chief Compliance Officer, The Community Development Fund (2016 to present); Chief Compliance Officer, Cook & Bynum Funds (2017 to present); Chief Compliance Officer, GraniteShares ETF Trust (2017 to present); Chief Compliance Officer, Innovator ETF Trust II (f/k/a Elkhorn ETF Trust) (2017 to present); Chief Compliance Officer, Innovator ETF Trust (2018 to present); Deputy Chief Compliance Officer, ASA Gold & Precious Metals, Ltd. (March 2019 to present); Corporate Secretary, ASA Gold & Precious Metals, Ltd. (2016 to 2017 and 2018 to March 2019); Senior Associate, Regulatory Administration Advisor, JPMorgan Chase & Co. (2014 to 2016) |
Carolyn Wharton | Secretary | Since 2019 | Consultant-Marketing, Global Beta Advisors (January 2019 to present); Director of Marketing, OppenheimerFunds, Inc. (2015 to 2017); Director of Marketing and Supervising Principal, RevenueShares and VTL Associates LLC (2012 to 2015) |
* | Each officer serves until his successor is duly elected or appointed and qualified. |
| 43 |

Funds’ Liquidity Risk Management | Global Beta ETF Trust |
Pursuant to Rule 22e-4 (the “Liquidity Rule”) under the Investment Company Act of 1940, as amended (“1940 Act”), the Funds have adopted and implemented a Liquidity Risk Management Program (the “Program”). The Program addresses the Liquidity Rule’s requirements for the assessment, management and periodic review of Fund liquidity risk and compliance with the Liquidity Rule’s restrictions on investments in illiquid investments. The Global Beta Liquidity Risk Management Program Administrator (“Administrator”) has been designated to administer the Program. The Administrator consists of certain Trust officers and representatives from Global Beta Advisors, LLC, the Funds’ investment adviser.
At its October 15, 2020 meeting, the Board of Trustees (“Board”) reviewed a written report (the “Report”) prepared by the Administrator addressing the operation of the Program and assessing its adequacy and effectiveness of implementation, as required under the Liquidity Rule, for the period from the inception of the Program on December 27, 2019 through August 31, 2020 (the “Reporting Period”). Among other things, the Report summarized the Administrator’s annual liquidity risk assessment, testing for In-Kind ETF status and monitoring for compliance with the Liquidity Rule’s restrictions on investments in illiquid investments. Further, the Report noted that, in accordance with the Program, and the requirements of the Liquidity Rule, the review of each Fund’s liquidity risk included consideration of the following key factors as applicable: the Funds’ investment strategies and liquidity of portfolio investments during both normal and reasonably foreseeable stressed conditions; short-term and long-term cash flow projections during both normal and reasonably foreseeable stressed conditions; holdings of cash and cash equivalents as well as borrowing arrangements and other funding sources; the relationship between each Fund’s portfolio liquidity and the way in which, and the price and spreads at which, each Fund’s shares trade, including the efficiency of the arbitrage function and the level of active participation by market participants (including authorized participants); and the effect of the composition of baskets on the overall liquidity of each Fund’s portfolio.
The Report concluded that, during the Reporting Period: (1) there were no material changes to the Program; (2) there were no significant liquidity events impacting any Fund; and (3) that it is the Administrator’s assessment that the Program is adequately designed and has been effective in managing each Fund’s liquidity risk and in implementing the requirements of the Liquidity Rule.
The Administrator reclassified Global Beta Low Beta ETF (“GBLO”) as no longer an In-Kind ETF within the meaning of the Liquidity Rule as of September 2020, reclassified Global Beta Momentum-Growth ETF (“GBGR”) as no longer an In-Kind ETF in December 2020, and reclassified Global Beta Smart Income ETF (“GBDV”) as no longer an In-Kind ETF in January 2021. The Funds will continue to monitor liquidity risks in accordance with the requirements of the Liquidity Rule, including the determination of whether it may be appropriate to elect to qualify as In-Kind ETFs in the future.
| 44 |

Additional Information (Unaudited) | Global Beta ETF Trust |
FREQUENCY DISTRIBUTION OF PREMIUMS AND DISCOUNTS
Information regarding how often shares of each Fund traded on the Exchange at a price above (i.e., at a premium) or below (i.e., at a discount) the NAV of the Fund is available on the Fund’s website at www.globalbetaetf.com.
HOUSEHOLDING
Householding is an option available to certain fund investors. Householding is a method of delivery, based on the preference of the individual investor, in which a single copy of certain shareholder documents can be delivered to investors who share the same address, even if their accounts are registered under different names. Please contact your broker-dealer if you are interested in enrolling in householding and receiving a single copy of prospectuses and other shareholder documents, or if you are currently enrolled in householding and wish to change your householding status.
DISCLOSURE OF PORTFOLIO HOLDINGS
Global Beta ETF Trust files its complete schedule of portfolio holdings with the Securities and Exchange Commission (“SEC”) for the first and third quarters of each fiscal year to date on Form N-PORT and, for periods prior to March 31, 2020, on Form N-Q. The Forms NQ and Forms N-PORT will be available on the SEC’s website at www.sec.gov. It may also be reviewed and copied at the SEC’s Public Reference Room in Washington, D.C. Information about the Public Reference Room may be obtained by calling 1-800-SEC-0330. In addition, the Funds full portfolio holdings are updated daily and available on the Global Beta ETFs website at www.globalbetaetf.com.
PROXY VOTING POLICIES AND PROCEDURES
A description of the policies and procedures the Funds use to determine how to vote proxies relating to portfolio securities is provided in the Statement of Additional Information (“SAI”). The SAI is available without charge upon request by calling toll-free at (833) 933-2083, by accessing the SEC’s website at http://www.sec.gov, or by accessing the Funds’ website at www.globalbetaetf.com. Information on how the Fund voted proxies relating to portfolio securities during the period ended November 30 is available without charge, upon request, by calling (833) 933-2083 or by accessing the website of the SEC.
FEDERAL TAX INFORMATION
For the fiscal year ended November 30, 2020, certain dividends paid by the Funds may be subject to a maximum tax rate of 23.8%, as provided for by the Tax Cuts and Jobs Act of 2017. The percentage of dividends declared from ordinary income designated as qualified dividend income was as follows:
Global Beta Smart Income ETF | 95.38 | % | ||
Global Beta Low Beta ETF | 100.00 | % | ||
Global Beta Momentum-Growth ETF | 100.00 | % |
For corporate shareholders, the percent of ordinary income distributions qualifying for the corporate dividends received deduction for the fiscal year ended November 30, 2020 was as follows:
Global Beta Smart Income ETF | 91.50 | % | ||
Global Beta Low Beta ETF | 100.00 | % | ||
Global Beta Momentum-Growth ETF | 100.00 | % |
The percentage of taxable ordinary income distributions that are designated as short-term capital gain distributions under Internal Revenue Section 871(k)(2)(C) for each Fund were as follows.
Global Beta Smart Income ETF | 0.00 | % | ||
Global Beta Low Beta ETF | 0.00 | % | ||
Global Beta Momentum-Growth ETF | 0.00 | % |
| 45 |


Fund | Symbol | CUSIP |
Global Beta Smart Income ETF | GBDV | 37959X100 |
Global Beta Low Beta ETF | GBLD | 37959X209 |
Global Beta Momentum-Growth ETF | GBGR | 37959X308 |
This report is intended for the shareholders of the Fund and may not be used as sales literature unless preceded or accompanied by a current prospectus.
Adviser Global Beta Advisors LLC 2001 Market Street, Suite 2630 Philadelphia, PA 19103 | Distributor Compass Distributors, LLC Three Canal Plaza, 3rd Floor Portland, ME 04101 | Transfer Agent U.S. Bancorp Fund Services, LLC 615 East Michigan Street Milwaukee, WI 53202 |
Custodian U.S. Bank, N.A. Custody Operations 1555 N. River Center Drive, Suite 302 Milwaukee, WI 53212 | Independent Registered Public Accounting Firm WithumSmith+Brown PC 155 Seaport Boulevard, 3rd Floor Boston, MA 02210 | Legal Counsel Stradley Ronon Stevens & Young, LLP 2005 Market Street, Suite 2600 Philadelphia, PA 19103-7018 |
Item 2. Code of Ethics.
The registrant has adopted a code of ethics that applies to the registrant’s principal executive officer and principal financial officer. The registrant has not made any substantive amendments to its code of ethics during the period covered by this report. The registrant has not granted any waivers from any provisions of the code of ethics during the period covered by this report.
The registrant undertakes to provide to any person without charge, upon request, a copy of its Code of Ethics by mail when they call the registrant at 1-833-933-2083.
Item 3. Audit Committee Financial Expert.
The registrant’s board of trustees has determined that there is at least one audit committee financial expert serving on its audit committee. Messrs. Richard Haverstick and David Downes are each an “audit committee financial expert” and are considered to be “independent” as each term is defined in Item 3 of Form N-CSR.
Item 4. Principal Accountant Fees and Services.
The registrant has engaged its principal accountant to perform audit services, audit-related services, tax services and other services during the past fiscal year. “Audit services” refer to performing an audit of the registrant's annual financial statements or services that are normally provided by the accountant in connection with statutory and regulatory filings or engagements for those fiscal years. “Audit-related services” refer to the assurance and related services by the principal accountant that are reasonably related to the performance of the audit. “Tax services” refer to professional services rendered by the principal accountant for tax compliance, tax advice, and tax planning. The following table details the aggregate fees billed or expected to be billed for the last fiscal year for audit fees, audit-related fees, tax fees and other fees by the principal accountant.
| FYE 11/30/2020 | |
| Audit Fees | $60,000 |
| Audit-Related Fees | $0 |
| Tax Fees | $10,500 |
| All Other Fees | $0 |
The audit committee has adopted pre-approval policies and procedures that require the audit committee to pre-approve all audit and non-audit services of the registrant, including services provided to any entity affiliated with the registrant.
The percentage of fees billed by WithumSmith+Brown PC applicable to non-audit services pursuant to waiver of pre-approval requirement were as follows:
| FYE 11/30/2020 | |
| Audit-Related Fees | 0% |
| Tax Fees | 0% |
| All Other Fees | 0% |
All of the principal accountant’s hours spent on auditing the registrant’s financial statements were attributed to work performed by full-time permanent employees of the principal accountant. (If more than 50 percent of the accountant’s hours were spent to audit the registrant's financial statements for the most recent fiscal year, state how many hours were attributed to work performed by persons other than the principal accountant's full-time, permanent employees.) The following table indicates the non-audit fees billed or expected to be billed by the registrant’s accountant for services to the registrant and to the registrant’s investment adviser (and any other controlling entity, etc.—not sub-adviser) for the last year. The audit committee of the board of trustees/directors has considered whether the provision of non-audit services that were rendered to the registrant's investment adviser is compatible with maintaining the principal accountant's independence and has concluded that the provision of such non-audit services by the accountant has not compromised the accountant’s independence.
| Non-Audit Related Fees | FYE 11/30/2020 |
| Registrant | None |
| Registrant’s Investment Adviser | None |
Item 5. Audit Committee of Listed Registrants.
The registrant is an issuer as defined in Rule 10A-3 under the Securities Exchange Act of 1934, (the “Act”) and has a separately-designated standing audit committee established in accordance with Section 3(a)(58)(A) of the Act. The independent members of the committee are as follows: Richard Haverstick, David Downes and Peter Burchfield.
Item 6. Investments.
Schedule of Investments is included as part of the report to shareholders filed under Item 1 of this Form.
Item 7. Disclosure of Proxy Voting Policies and Procedures for Closed-End Management Investment Companies.
Not applicable to open-end investment companies.
Item 8. Portfolio Managers of Closed-End Management Investment Companies.
Not applicable to open-end investment companies.
Item 9. Purchases of Equity Securities by Closed-End Management Investment Company and Affiliated Purchasers.
Not applicable to open-end investment companies.
Item 10. Submission of Matters to a Vote of Security Holders.
There have been no material changes to the procedures by which shareholders may recommend nominees to the registrant’s board of trustees.
Item 11. Controls and Procedures.
| (a) | The Registrant’s President/Principal Executive Officer and Treasurer/Principal Financial Officer have reviewed the Registrant's disclosure controls and procedures (as defined in Rule 30a-3(c) under the Investment Company Act of 1940 (the “Act”)) as of a date within 90 days of the filing of this report, as required by Rule 30a-3(b) under the Act and Rules 13a-15(b) or 15d-15(b) under the Securities Exchange Act of 1934. Based on their review, such officers have concluded that the disclosure controls and procedures are effective in ensuring that information required to be disclosed in this report is appropriately recorded, processed, summarized and reported and made known to them by others within the Registrant and by the Registrant’s service provider. |
| (b) | There were no changes in the Registrant's internal control over financial reporting (as defined in Rule 30a-3(d) under the Act) that occurred during the period covered by this report that have materially affected, or is reasonably likely to materially affect, the Registrant's internal control over financial reporting. |
Item 12. Disclosure of Securities Lending Activities for Closed-End Management Investment Companies
Not applicable to open-end investment companies.
Item 13. Exhibits.
(3) Any written solicitation to purchase securities under Rule 23c-1 under the Act sent or given during the period covered by the report by or on behalf of the registrant to 10 or more persons. Not applicable to open-end investment companies.
| (b) | Certifications pursuant to Section 906 of the Sarbanes-Oxley Act of 2002. Furnished herewith. |
SIGNATURES
Pursuant to the requirements of the Securities Exchange Act of 1934 and the Investment Company Act of 1940, the registrant has duly caused this report to be signed on its behalf by the undersigned, thereunto duly authorized.
| (Registrant) | Global Beta ETF Trust | |
| By (Signature and Title)* | /s/ Vince Lowry | |
| Vince Lowry, President/Principal Executive Officer | ||
| Date | 2/3/2021 |
Pursuant to the requirements of the Securities Exchange Act of 1934 and the Investment Company Act of 1940, this report has been signed below by the following persons on behalf of the registrant and in the capacities and on the dates indicated.
| By (Signature and Title)* | /s/ Vince Lowry | |
| Vince Lowry, President/Principal Executive Officer | ||
| Date | 2/3/2021 | |
| By (Signature and Title) | /s/ Josh Hunter | |
| Josh Hunter, Principal Financial Officer | ||
| Date | 2/3/2021 |