As filed with the U.S. Securities and Exchange Commission on February 4, 2022
UNITED STATES
SECURITIES AND EXCHANGE COMMISSION
Washington, D.C. 20549
FORM N-CSR
CERTIFIED SHAREHOLDER REPORT OF REGISTERED
MANAGEMENT INVESTMENT COMPANIES
Investment Company Act file number (811-23450)
Global Beta ETF Trust
(Exact name of registrant as specified in charter)
1364 Welsh Road, Suite C120
North Wales, PA 19454
(Address of principal executive offices) (Zip code)
Vince Lowry
1364 Welsh Road, Suite C120
North Wales, PA 19454
(Name and address of agent for service)
(215) 531-8234
Registrant's telephone number, including area code
Date of fiscal year end: November 30
Date of reporting period: November 30, 2021
Item 1. Reports to Stockholders.
(a) The following is a copy of the report transmitted to shareholders pursuant to Rule 30e-1 under the Investment Company Act of 1940 (17 CFR 270.30e-1).
|

Annual Report
November 30, 2021
Global Beta ETF Trust
● Global Beta Smart Income ETF | | GBDV | | NYSE Arca |
● Global Beta Low Beta ETF | | GBLO | | NYSE Arca |
● Global Beta Rising Stars ETF | | GBGR | | NYSE Arca |
Global Beta ETF Trust |
|
Table of Contents
Page | |
Shareholder Letter | 1 |
Management’s Discussion of Fund Performance | 3 |
Global Beta Smart Income ETF | 3 |
Global Beta Low Beta ETF | 6 |
Global Beta Rising Stars ETF | 9 |
Schedule of Investments | 13 |
Statement of Assets and Liabilities | 23 |
Statement of Operations | 24 |
Statements of Changes in Net Assets | 25 |
Financial Highlights | 28 |
Notes to the Financial Statements | 31 |
Report of Independent Registered Public Accounting Firm | 38 |
Expense Examples | 39 |
Approval of Advisory Agreement and Board Considerations | 40 |
Trustees and Officers | 42 |
Funds’ Liquidity Risk Management Program | 45 |
Additional Information | 46 |
Shareholder Letter | Global Beta ETF Trust |
November 30, 2021
Dear Shareholder,
From the time I wrote to you at the conclusion of our semi-annual period ending 05/31/2021, we have seen U.S. equity markets continue to soar, led primarily by large cap technology securities. As the markets incurred some volatility in late September into early October, investors began to flock towards large cap technology securities as a means for safe growth.
Fiscal year 2021 has certainly been a tale of two halves. The S&P 500 Growth Index soared 19.10% from 05/31/21 through 11/30/21 (Source: Factset Research Systems), while the S&P 500 Value Index remained flat for the period at -0.85% from 05/31/21 through 11/30/21 (Source: Factset Research Systems). This represents a bit of a reversal from the semi-annual period where the S&P 500 Value Index outperformed the S&P 500 Growth Index by over 900 basis points1 (Source: Factset Research Systems). The beginning half of the year was met with optimism around economic re-openings, thanks to the roll out of highly effective vaccines against COVID-19. As a result, many securities that suffered extreme losses throughout the depths of the global health pandemic, such as travel and leisure securities, surged. However, more recently, concerns have crept into the market over new COVID-19 variants that may evade prior immunity and the Federal Reserve’s inability to thread the needle between supporting economic liquidity needs and extreme inflation. We mentioned in our piece back in October, “Coming Down the Home Stretch”, that tapering plans mentioned by the Federal Reserve to combat the prospect of inflation would likely create shock waves through the market, particularly towards securities with extreme valuations. We believe the last month of 2021 through the first half of calendar year 2022 will be extremely pivotal for markets.
The Consumer Price Index (“CPI”), which is a commonly used barometer for inflation, rose 11.9% (Source: Factset Research Systems) on an annualized basis for the month of October. This is the largest monthly increase in the index since June 2008 (Source: Factset Research Systems). While this may not be a foreshadowing of a major financial crisis as it was back then, it has created concern among investors about an overheating economy. With the emergence of a new COVID-19 variant, dubbed “Omicron”, the Federal Reserve must straddle between the dampening the effects that the variant may have on economic activities with inflationary pressures that have largely been created from unprecedented accommodative monetary policy. Towards the end of November 2021, the Federal Reserve indicated that it would consider accelerating its plan to taper its bond purchasing program, which was initially started in March 2020 to combat the liquidity needs created from the COVID-19 global health pandemic. It’s not entirely clear if those comments were planned prior to the development of the Omicron variant, however, we believe it indicates the Federal Reserve’s hawkish turn on current monetary policy. We believe the Federal Reserve’s actions will weigh heavily on both the debt and equity markets in the coming months.
As we look ahead to the new year, we believe that investors need to prepare for some friction in the markets as the Federal Reserve’s monetary policy will have significant influence, particularly on asset classes with extreme valuations and companies with little to no profitability. This is in contrast to the prior 18 months, when we believe that market liquidity enabled these securities to achieve astounding levels. We believe international markets are beginning to represent an opportunity, particularly with the U.S. markets in flux due to inflationary concerns. We also believe that identifying yield will come at a premium as it is unclear the levels of persistence and significance of inflation, therefore, we believe high quality assets with above average yield will be highly sought after. We believe it will be important for investors to stay diversified and to hold some cash in preparation for volatility and to be positioned with the chance to take advantage of opportunities that may arise from that volatility.
Thank you and stay safe.

Justin Lowry
President and CIO, Global Beta Advisors, LLC
1 Basis point is one hundredth of one percent.
Must be preceded or accompanied by a prospectus.
Investing involves risk, including the possible loss of principal. Shares of any ETF are bought and sold at market price (not NAV), may trade at a discount or premium to NAV and are not individually redeemed from a Fund. Brokerage commissions will reduce returns.
The Funds’ return may not match or achieve a high degree of correlation with the return of the underlying index.
The Funds are subject to the risks of investing in equity securities. Please refer to the prospectus for a more detailed explanation of the Funds’ principal risks. There is no assurance that the investment objectives of the Funds will be achieved.
Diversification does not assure a profit or protect against a loss in a declining market.
Global Beta Smart Income ETF, Global Beta Low Beta ETF and Global Beta Rising Stars ETF are distributed by Compass Distributors, LLC.
| 1 |

Shareholder Letter (Continued) | Global Beta ETF Trust |
November 30, 2021
Index Definitions
S&P 500® Value Index: Composed of stocks from the S&P 500®, broken into three factors: the ratios of book value, earnings, and sales to price. S&P Style Indices divide the complete market capitalization of each parent index into growth and value segments.
S&P 500® Growth Index: Measures growth stocks using three factors: sales growth, the ratio of earnings change to price, and momentum. S&P Style Indices divide the complete market capitalization of each parent index into growth and value segments. Constituents are drawn from the S&P 500®.
S&P 900 Index: Combines the S&P 500® and the S&P MidCap 400® to form an investable benchmark for the mid- to large-cap segment of the U.S. equity market.
S&P 1500 Index: Includes all stocks in the S&P 500, S&P 400, and S&P 600.
| 2 |

Management’s Discussion of Fund Performance | Global Beta Smart Income ETF |
November 30, 2021
The Global Beta Smart Income ETF (the “Fund” or “GBDV”) seeks to track the performance (before fees and expenses) of the Global Beta Smart Income Index (the “Target Index”). The Target Index is comprised of equity securities of U.S. companies in the highest quintile of the average twelve month trailing dividend yield over each of the prior four quarters in the S&P 900 (a broad-based benchmark index), and that rank in the top half of their respective GICS sector classification. The constituent securities of the Target Index are weighted based on their revenue, with each individual index constituent capped at 4.5% at each quarterly rebalance.
For the period, which spans from 12/1/20 through 11/30/21, the Fund underperformed its benchmark, the S&P 900 Index. For the period, the Fund’s net asset value (“NAV”) returned 25.71%1 and its market price returned 26.31%, while its benchmark returned 27.86%. The underperformance was largely attributed to the S&P 900’s exposure to large cap technology stocks. As concerns about inflation and the emergence of new COVID-19 variants arose, investors began to flock towards higher quality growth stocks. It was the Fund’s underweight to Information Technology that was the most significant impact to performance, accounting for nearly all of the Fund’s underperformance relative to its benchmark. We mentioned in our piece back in October, “Coming Down the Home Stretch”, that tapering plans mentioned by the Federal Reserve to combat the prospect of inflation would likely create shock waves throughout the market, particularly towards securities with extreme valuations and low profitability. We believe the last month of 2021 through the first half of calendar year 2022 will be extremely pivotal for markets. We also believe that obtaining quality yield will come at a premium, which may lead to outperformance in dividend related securities in the coming months.
Frequency Distribution of Premium and Discounts — Information concerning the number of days that the Fund trades at a premium or discount can be found on the Funds’ website, www.globalbetaetf.com.
ALLOCATION BY SECTOR | |
Sector | Percentage of |
Consumer Staples | 18.8% |
Health Care | 16.8 |
Financials | 16.4 |
Utilities | 12.7 |
Communication Services | 9.8 |
Materials | 7.6 |
Information Technology | 6.2 |
Industrials | 4.1 |
Energy | 3.3 |
Real Estate | 2.3 |
Consumer Discretionary | 1.4 |
Money Market Fund and Other Assets and Liabilities | 0.6 |
Total | 100.0% |
1. | A Fund’s per share net asset value (‘‘NAV’’) is the value of one share of the Fund. NAV is calculated by taking the Fund’s total assets (including the market value of securities owned), subtracting liabilities, and dividing by the number of shares outstanding. The NAV Return is based on the NAV of the Fund, and the Market Price Return is based on the market price per share of the Fund. The price used to calculate market return (‘‘Market Price’’) is determined by using the midpoint between the highest bid and the lowest offer on the primary stock exchange on which the shares of the Fund are listed for trading, as of the time that the Fund’s NAV is calculated. NAV is used as a proxy for purposes of calculating Market Price Return on inception date. Market Price and NAV returns assume that dividends and capital gain distributions have been reinvested in the Fund at Market Price and NAV, respectively. |
| 3 |

Fund Performance | Global Beta Smart Income ETF |
November 30, 2021
Performance (Average Annual Total Returns Since Inception through November 30, 2021)
1-Year | Since | |
Global Beta Smart Income ETF | ||
NAV | 25.71% | 6.38% |
Market | 26.31% | 6.53% |
Target Index | 26.04% | 6.41% |
S&P 900 Index | 27.86% | 21.13% |
Growth of $10,000 Investment
(At Net Asset Value)

Performance measured by NAV differs from the Target Index primarily due to Fund fees and expenses.
Performance for periods greater than one year is annualized.
(*) | Commencement of investment operations on December 27, 2019. |
This chart assumes an initial gross investment of $10,000 made on December 27, 2019 and reflects the fees charged on an account. Returns shown include the reinvestment of all dividends, if any, but do not include the deduction of taxes that a shareholder would pay on Fund distributions or the redemption of Fund shares. Past performance is not predictive of future performance. Investment return and principal value will fluctuate, so your shares, when redeemed, may be worth more or less than the original cost.
Past performance is no guarantee of future results. Financial markets have experienced extreme volatility and trading in many instruments has been disrupted. These circumstances may continue for an extended period of time and may continue to affect adversely the value and liquidity of the Fund’s investments. As a result, current performance may be lower or higher than the performance data quoted. Performance data current to the most recent month-end is available at www.globalbetaetf.com. Performance results assume reinvestment of all dividends and capital gain distributions and do not reflect the deduction of taxes that a shareholder would pay on fund distributions or on the redemption or sale of fund shares. The investment return and principal value of shares will vary with changes in market
| 4 |

Fund Performance (Continued) | Global Beta Smart Income ETF |
November 30, 2021
conditions. Shares may be worth more or less than their original cost when they are redeemed or sold in the market. Performance for certain funds may reflect a waiver of a portion of investment advisory fees. Without such a waiver, performance would have been lower. Prior to May 1, 2021, under the investment advisory agreement between Global Beta Advisors LLC, the Fund’s investment adviser (the “Adviser”), and the Global Beta ETF Trust (the “Trust”), on behalf of the Funds (the “Advisory Agreement”), the Adviser beared all of the ordinary operating expenses of the Fund, with the exception of the following (i) the management fee, (ii) payments under the Fund’s Rule 12b-1 plan, (iii) brokerage expenses (including any costs incidental to transactions in portfolio securities or instruments), (iv) acquired fund fees and expenses, (v) taxes, (vi) interest (including borrowing costs and dividend expenses on securities sold short and overdraft charges), (vii) litigation expenses (including litigation to which the Trust or the Fund may have been a party and indemnification of the Trustees and officers with respect thereto), (viii) compensation and expenses of the Independent Trustees, (ix) fees and expenses of counsel to the Independent Trustees, and (x) other extraordinary or non-routine expenses (including expenses arising from mergers, acquisitions or similar transactions involving the Fund). The Adviser had agreed to reimburse the Fund through April 30, 2021 for the (i) compensation and expenses of the Trustees who are not interested persons as defined under Section 2(a)(19) of the Investment Company Act of 1940 (the “Independent Trustees”), and (ii) fees and expenses of counsel to the Independent Trustees, except for any (a) litigation expenses (including litigation to which the Trust or the Fund may have been a party and indemnification of the Independent Trustees with respect thereto), and (b) extraordinary or non-routine fees or expenses.
On April 16, 2021, the Board of Trustees of the Trust approved to amend the Advisory Agreement effective May 1, 2021. Under the Advisory Agreement, in exchange for a single unitary management fee of 0.29%, the Adviser has agreed to bear all of the ordinary operating expenses of each Fund with the exception of the following: (i) the management fee, (ii) payments under the Funds’ Rule 12b-1 plan, (iii) brokerage expenses (including any costs incidental to transactions in portfolio securities or instruments), (iv) acquired fund fees and expenses, (v) taxes, (vi) interest (including borrowing costs and dividend expenses on securities sold short and overdraft charges), (vii) litigation expenses (including litigation to which the Trust or the Funds may be a party and indemnification of the Trustees and officers with respect thereto), and (viii) other extraordinary or non-routine expenses (including expenses arising from mergers, acquisitions or similar transactions involving the Funds). Please refer to the Financial Highlights herein for the most recent expense ratio information.
An index is a statistical composite that tracks a specified financial market or sector. Unlike a fund, an index does not actually hold a portfolio of securities and therefore does not incur the expenses incurred by a fund. These expenses negatively impact fund performance. Also, market returns do not include brokerage commissions that may be payable on secondary market transactions. If brokerage commissions were included, market returns would be lower. Individuals cannot invest directly in an index.
| 5 |

Management’s Discussion of Fund Performance | Global Beta Low Beta ETF |
November 30, 2021
The Global Beta Low Beta ETF (the “Fund” or “GBLO”) seeks to track the performance (before fees and expenses) of the Global Beta Low Beta Factor Index (the “Target Index”). The Target Index is comprised of equity securities of U.S. companies from the S&P 500 Index (a broad-based benchmark index) in the lowest quintile (i.e., the lowest 20% of the S&P 500 Index) based on their twelve month trailing beta relative to the S&P 500 Index. Beta is a measure of the relative volatility of a security as compared to the market. The constituent securities of the Target Index are weighted based on their revenue, with each individual index constituent capped at 5% at each quarterly rebalance.
For the period, which spans from 12/1/20 through 11/30/21, the Fund underperformed its benchmark, the S&P 500 Index. For the period, the Fund’s net asset value (“NAV”) returned 13.56%1 and its market price returned 13.68%, while its benchmark returned 27.92%. The underperformance was largely attributed to the S&P 500 Index’s exposure to large cap technology stocks. Although sentiment in the markets began to waiver over the past 6 months due to concerns over inflation and the emergence of new COVID-19 variants, investors began to flock towards higher quality growth stocks as opposed to traditional defensive stocks. We believe investors are trying to thread the needle between participating in upside with growth stocks if the Federal Reserve remains dovish on monetary policy but guard against inflationary concerns by positioning in growth stocks with higher levels of profitability. By virtue of its methodology, the Fund generally holds very little exposure to Information Technology stocks. In contrast, due to the nature of it being a market cap weighted index, the S&P 500 Index holds a substantial position in Information Technology stocks as they have become some of the world’s largest stocks by market capitalization. This gap in exposure accounts for nearly 20% of the Fund’s underperformance relative to its benchmark. As we began to see brief levels of volatility towards the end of September into October, and then again in late November; we do believe investors ought to prepare for more sustained periods of volatility. We believe, between the emergence of new COVID-19 variants and the prospect of sustained inflation, there will be a level of economic uncertainty that may weigh on investor sentiment well into 2022.
Frequency Distribution of Premium and Discounts — Information concerning the number of days that the Fund trades at a premium or discount can be found on the Funds’ website, www.globalbetaetf.com.
ALLOCATION BY SECTOR | |
Sector | Percentage of |
Health Care | 32.3% |
Consumer Staples | 31.0 |
Communication Services | 11.0 |
Utilities | 6.8 |
Industrials | 5.7 |
Information Technology | 3.8 |
Consumer Discretionary | 3.6 |
Financials | 3.4 |
Real Estate | 1.1 |
Materials | 0.9 |
Money Market Fund and Other Assets and Liabilities | 0.3 |
Energy | 0.1 |
Total | 100.0% |
1. | A Fund’s per share net asset value (‘‘NAV’’) is the value of one share of the Fund. NAV is calculated by taking the Fund’s total assets (including the market value of securities owned), subtracting liabilities, and dividing by the number of shares outstanding. The NAV Return is based on the NAV of the Fund, and the Market Price Return is based on the market price per share of the Fund. The price used to calculate market return (‘‘Market Price’’) is determined by using the midpoint between the highest bid and the lowest offer on the primary stock exchange on which the shares of the Fund are listed for trading, as of the time that the Fund’s NAV is calculated. NAV is used as a proxy for purposes of calculating Market Price Return on inception date. Market Price and NAV returns assume that dividends and capital gain distributions have been reinvested in the Fund at Market Price and NAV, respectively. |
| 6 |

Fund Performance | Global Beta Low Beta ETF |
November 30, 2021
Performance (Average Annual Total Returns Since Inception through November 30, 2021)
1-Year | Since | |
Global Beta Low Beta ETF | ||
NAV | 13.56% | 16.29% |
Market | 13.68% | 16.31% |
Target Index | 13.94% | 16.61% |
S&P 500 Index | 27.92% | 30.89% |
Growth of $10,000 Investment
(At Net Asset Value)
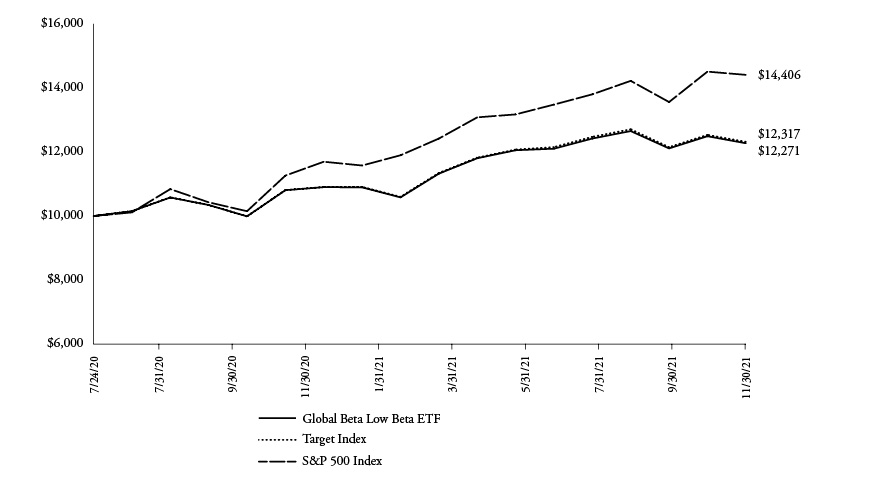
Performance measured by NAV differs from the Target Index primarily due to Fund fees and expenses.
Performance for periods greater than one year is annualized.
(*) | Commencement of investment operations on July 24, 2020. |
This chart assumes an initial gross investment of $10,000 made on July 24, 2020 and reflects the fees charged on an account. Returns shown include the reinvestment of all dividends, if any, but do not include the deduction of taxes that a shareholder would pay on Fund distributions or the redemption of Fund shares. Past performance is not predictive of future performance. Investment return and principal value will fluctuate, so your shares, when redeemed, may be worth more or less than the original cost.
Past performance is no guarantee of future results. Financial markets have experienced extreme volatility and trading in many instruments has been disrupted. These circumstances may continue for an extended period of time and may continue to affect adversely the value and liquidity of the Fund’s investments. As a result, current performance may be lower or higher than the performance data quoted. Performance data current to the most recent month-end is available at www.globalbetaetf.com. Performance results assume reinvestment of all dividends and capital gain distributions and do not reflect the deduction of taxes that a shareholder would pay on fund distributions or on the redemption or sale of fund shares. The investment return and principal value of shares will vary with changes in market
| 7 |

Fund Performance (Continued) | Global Beta Low Beta ETF |
November 30, 2021
conditions. Shares may be worth more or less than their original cost when they are redeemed or sold in the market. Performance for certain funds may reflect a waiver of a portion of investment advisory fees. Without such a waiver, performance would have been lower. Prior to May 1, 2021, under the investment advisory agreement between Global Beta Advisors LLC, the Fund’s investment adviser (the “Adviser”), and the Global Beta ETF Trust (the “Trust”), on behalf of the Funds (the “Advisory Agreement”), the Adviser beared all of the ordinary operating expenses of the Fund, with the exception of the following (i) the management fee, (ii) payments under the Fund’s Rule 12b-1 plan, (iii) brokerage expenses (including any costs incidental to transactions in portfolio securities or instruments), (iv) acquired fund fees and expenses, (v) taxes, (vi) interest (including borrowing costs and dividend expenses on securities sold short and overdraft charges), (vii) litigation expenses (including litigation to which the Trust or the Fund may have been a party and indemnification of the Trustees and officers with respect thereto), (viii) compensation and expenses of the Independent Trustees, (ix) fees and expenses of counsel to the Independent Trustees, and (x) other extraordinary or non-routine expenses (including expenses arising from mergers, acquisitions or similar transactions involving the Fund). The Adviser had agreed to reimburse the Fund through April 30, 2021 for the (i) compensation and expenses of the Trustees who are not interested persons as defined under Section 2(a)(19) of the Investment Company Act of 1940 (the “Independent Trustees”), and (ii) fees and expenses of counsel to the Independent Trustees, except for any (a) litigation expenses (including litigation to which the Trust or the Fund may have been a party and indemnification of the Independent Trustees with respect thereto), and (b) extraordinary or non-routine fees or expenses.
On April 16, 2021, the Board of Trustees of the Trust approved to amend the Advisory Agreement effective May 1, 2021. Under the Advisory Agreement, in exchange for a single unitary management fee of 0.29%, the Adviser has agreed to bear all of the ordinary operating expenses of each Fund with the exception of the following: (i) the management fee, (ii) payments under the Funds’ Rule 12b-1 plan, (iii) brokerage expenses (including any costs incidental to transactions in portfolio securities or instruments), (iv) acquired fund fees and expenses, (v) taxes, (vi) interest (including borrowing costs and dividend expenses on securities sold short and overdraft charges), (vii) litigation expenses (including litigation to which the Trust or the Funds may be a party and indemnification of the Trustees and officers with respect thereto), and (viii) other extraordinary or non-routine expenses (including expenses arising from mergers, acquisitions or similar transactions involving the Funds). Please refer to the Financial Highlights herein for the most recent expense ratio information.
An index is a statistical composite that tracks a specified financial market or sector. Unlike a fund, an index does not actually hold a portfolio of securities and therefore does not incur the expenses incurred by a fund. These expenses negatively impact fund performance. Also, market returns do not include brokerage commissions that may be payable on secondary market transactions. If brokerage commissions were included, market returns would be lower. Individuals cannot invest directly in an index.
| 8 |

Management’s Discussion of Fund Performance | Global Beta Rising Stars ETF |
November 30, 2021
The Global Beta Rising Stars ETF (the “Fund” or “GBGR”) seeks to track the performance (before fees and expenses) of the FactSet Rising Stars Index (the “Target Index”). The Target Index is comprised of 100 U.S.-listed companies with operations in the Technology sector and that are selected based on a combination of valuation and growth-related factors. The Target Index may include small, medium, and large capitalization companies. The Target Index is expected to be predominantly comprised of companies in the Technology sector and concentrated (i.e., hold 25% or more of its net assets) in companies in the software sub-industry.
Prior to December 18, 2020, the Fund was seeking to track the performance (before fees and expenses) of the Global Beta Momentum-Growth Factor Index. The Index was comprised of equity securities of U.S. companies from the S&P 500 Index in the highest quintile (i.e., the highest 20% of the S&P 500 Index) based on their year-over-year revenue growth rate, as measured by their most recently reported quarterly revenue as compared to the quarterly revenue reported four quarters ago. The constituent securities of the Index were weighted based on free-float market capitalization, with each individual index constituent capped at 10% at each quarterly rebalance.
For the period, which spans from 12/1/20 through 11/30/21, the Fund underperformed its benchmark, the S&P 1500 Index. For the period, the Fund’s net asset value (“NAV”) returned 3.84%1 and its market price returned 4.00%, while its benchmark returned 27.95%. The underperformance was largely attributed to the S&P 1500 Index holding a greater level of exposure to large cap stocks. As investor sentiment waned over the past 6 months due to concerns about inflation and emerging COVID-19 variants, investors have categorically sold off mid and small cap stocks. Mid and small cap stocks generally performed better during periods of economic growth. However, investors have begun to become more defensive and have shifted towards more mature growth stocks. Additionally, the Fund’s overweight to software stocks accounted for nearly half of its underperformance relative to its benchmark. As demand for web-based products waned with economic re-openings, software companies began to see revenue and earnings miss estimates. We believe the coming months will be challenging to navigate as the Federal Reserve tries to unwind its balance sheet of asset purchases made through the depths of the global health pandemic. If the Federal Reserve is able to curb the levels of inflation that have been observed from recent readings, we believe mid and small cap growth companies could be beneficiaries. However, if levels of inflation persist, even amidst the Federal Reserve tightening monetary policy, we believe the market will experience more sustained and substantial levels of volatility, particularly in mid and small cap stocks.
Frequency Distribution of Premium and Discounts — Information concerning the number of days that the Fund trades at a premium or discount can be found on the Funds’ website, www.globalbetaetf.com.
1. | A Fund’s per share net asset value (‘‘NAV’’) is the value of one share of the Fund. NAV is calculated by taking the Fund’s total assets (including the market value of securities owned), subtracting liabilities, and dividing by the number of shares outstanding. The NAV Return is based on the NAV of the Fund, and the Market Price Return is based on the market price per share of the Fund. The price used to calculate market return (‘‘Market Price’’) is determined by using the midpoint between the highest bid and the lowest offer on the primary stock exchange on which the shares of the Fund are listed for trading, as of the time that the Fund’s NAV is calculated. NAV is used as a proxy for purposes of calculating Market Price Return on inception date. Market Price and NAV returns assume that dividends and capital gain distributions have been reinvested in the Fund at Market Price and NAV, respectively. |
| 9 |

Management’s Discussion of Fund Performance | Global Beta Rising Stars ETF |
November 30, 2021
ALLOCATION BY SECTOR | |
Sector | Percentage of |
Software | 16.6% |
Internet and Data Services | 15.6 |
Semiconductor Equipment and Services | 12.3 |
Semiconductor Manufacturing | 5.9 |
Communications Equipment | 5.7 |
General Merchandise Retail | 4.4 |
Auto Retail | 4.0 |
Apparel and Accessories Retail | 3.9 |
Real Estate Investment Trusts (REITs) | 3.5 |
Specialty Finance | 3.5 |
Electronic Components | 3.0 |
Healthcare Support Services | 2.3 |
Home Improvement Retail | 2.0 |
Consumer Electronics | 1.9 |
Computer Hardware and Storage | 1.8 |
Finance Software and Services | 1.7 |
Aerospace and Defense Manufacturing | 1.6 |
Other Professional Services | 1.6 |
Other Telecommunications Services | 1.5 |
Manufacturing Equipment and Services | 1.4 |
Commercial Electronics | 1.2 |
Other Retail | 1.1 |
Electrical Equipment and Power Systems | 1.0 |
Machinery Manufacturing | 0.9 |
Hospitality Services | 0.8 |
Technology Consulting Services | 0.8 |
Money Market Fund and Other Assets and Liabilities | 0.0# |
Total | 100.0% |
# | Represents less than 0.05% of total net assets. |
| 10 |

Fund Performance | Global Beta Rising Stars ETF |
November 30, 2021
Performance (Average Annual Total Returns Since Inception through November 30, 2021)
1-Year | Since | |
Global Beta Rising Stars ETF | ||
NAV | 3.84% | 11.33% |
Market | 4.00% | 11.36% |
Target Index** | 4.06% | 11.27% |
S&P 1500 Index*** | 27.95% | 31.27% |
Growth of $10,000 Investment
(At Net Asset Value)

Performance measured by NAV differs from the Target Index primarily due to Fund fees and expenses.
Performance for periods greater than one year is annualized.
(*) | Commencement of investment operations on July 24, 2020. |
(**) | The Target Index performance information reflects the blended performance of the Global Beta Momentum-Growth Factor Index through December 18, 2020 and the FactSet Rising Stars Index thereafter. |
(***) | In connection with the change of the Fund’s underlying index, effective December 18, 2020, the Fund’s benchmark index changed from the S&P 500 Index to the S&P 1500 Index. |
This chart assumes an initial gross investment of $10,000 made on July 24, 2020 and reflects the fees charged on an account. Returns shown include the reinvestment of all dividends, if any, but do not include the deduction of taxes that a shareholder would pay on Fund distributions or the redemption of Fund shares. Past performance is not predictive of future performance. Investment return and principal value will fluctuate, so your shares, when redeemed, may be worth more or less than the original cost.
| 11 |

Fund Performance (Continued) | Global Beta Rising Stars ETF |
November 30, 2021
Past performance is no guarantee of future results. Financial markets have experienced extreme volatility and trading in many instruments has been disrupted. These circumstances may continue for an extended period of time and may continue to affect adversely the value and liquidity of the Fund’s investments. As a result, current performance may be lower or higher than the performance data quoted. Performance data current to the most recent month-end is available at www.globalbetaetf.com. Performance results assume reinvestment of all dividends and capital gain distributions and do not reflect the deduction of taxes that a shareholder would pay on fund distributions or on the redemption or sale of fund shares. The investment return and principal value of shares will vary with changes in market conditions. Shares may be worth more or less than their original cost when they are redeemed or sold in the market. Performance for certain funds may reflect a waiver of a portion of investment advisory fees. Without such a waiver, performance would have been lower. Prior to May 1, 2021, under the investment advisory agreement between Global Beta Advisors LLC, the Fund’s investment adviser (the “Adviser”), and the Global Beta ETF Trust (the “Trust”), on behalf of the Funds (the “Advisory Agreement”), the Adviser beared all of the ordinary operating expenses of the Fund, with the exception of the following (i) the management fee, (ii) payments under the Fund’s Rule 12b-1 plan, (iii) brokerage expenses (including any costs incidental to transactions in portfolio securities or instruments), (iv) acquired fund fees and expenses, (v) taxes, (vi) interest (including borrowing costs and dividend expenses on securities sold short and overdraft charges), (vii) litigation expenses (including litigation to which the Trust or the Fund may have been a party and indemnification of the Trustees and officers with respect thereto), (viii) compensation and expenses of the Independent Trustees, (ix) fees and expenses of counsel to the Independent Trustees, and (x) other extraordinary or non-routine expenses (including expenses arising from mergers, acquisitions or similar transactions involving the Fund). The Adviser had agreed to reimburse the Fund through April 30, 2021 for the (i) compensation and expenses of the Trustees who are not interested persons as defined under Section 2(a)(19) of the Investment Company Act of 1940 (the “Independent Trustees”), and (ii) fees and expenses of counsel to the Independent Trustees, except for any (a) litigation expenses (including litigation to which the Trust or the Fund may have been a party and indemnification of the Independent Trustees with respect thereto), and (b) extraordinary or non-routine fees or expenses.
On April 16, 2021, the Board of Trustees of the Trust approved to amend the Advisory Agreement effective May 1, 2021. Under the Advisory Agreement, in exchange for a single unitary management fee of 0.29%, the Adviser has agreed to bear all of the ordinary operating expenses of each Fund with the exception of the following: (i) the management fee, (ii) payments under the Funds’ Rule 12b-1 plan, (iii) brokerage expenses (including any costs incidental to transactions in portfolio securities or instruments), (iv) acquired fund fees and expenses, (v) taxes, (vi) interest (including borrowing costs and dividend expenses on securities sold short and overdraft charges), (vii) litigation expenses (including litigation to which the Trust or the Funds may be a party and indemnification of the Trustees and officers with respect thereto), and (viii) other extraordinary or non-routine expenses (including expenses arising from mergers, acquisitions or similar transactions involving the Funds). Please refer to the Financial Highlights herein for the most recent expense ratio information.
An index is a statistical composite that tracks a specified financial market or sector. Unlike a fund, an index does not actually hold a portfolio of securities and therefore does not incur the expenses incurred by a fund. These expenses negatively impact fund performance. Also, market returns do not include brokerage commissions that may be payable on secondary market transactions. If brokerage commissions were included, market returns would be lower. Individuals cannot invest directly in an index.
| 12 |

Schedule of Investments | Global Beta Smart Income ETF |
November 30, 2021
Investments | Number of | Value | ||||||
COMMON STOCKS — 99.4% | ||||||||
Communication Services — 9.8% | ||||||||
AT&T, Inc. | 4,345 | $ | 99,196 | |||||
Lumen Technologies, Inc. | 3,629 | 44,782 | ||||||
Verizon Communications, Inc. | 2,182 | 109,689 | ||||||
| 253,667 | ||||||||
Consumer Discretionary — 1.4% | ||||||||
H&R Block, Inc. | 309 | 7,317 | ||||||
Leggett & Platt, Inc. | 230 | 9,290 | ||||||
Newell Brands, Inc. | 935 | 20,074 | ||||||
Wingstop, Inc. | 3 | 482 | ||||||
| 37,163 | ||||||||
Consumer Staples — 18.8% | ||||||||
Altria Group, Inc. | 981 | 41,830 | ||||||
Costco Wholesale Corp. | 260 | 140,239 | ||||||
Flowers Foods, Inc. | 412 | 10,638 | ||||||
General Mills, Inc. | 691 | 42,683 | ||||||
Kellogg Co. | 492 | 30,101 | ||||||
Kraft Heinz Co. | 1,636 | 54,986 | ||||||
Philip Morris International, Inc. | 665 | 57,150 | ||||||
Walgreens Boots Alliance, Inc. | 2,463 | 110,342 | ||||||
| 487,969 | ||||||||
Energy — 3.3% | ||||||||
Equitrans Midstream Corp. | 37 | 356 | ||||||
Exxon Mobil Corp. | 958 | 57,327 | ||||||
Kinder Morgan, Inc. | 216 | 3,339 | ||||||
ONEOK, Inc. | 51 | 3,052 | ||||||
Valero Energy Corp. | 281 | �� | 18,810 | |||||
Williams Companies, Inc. | 86 | 2,304 | ||||||
| 85,188 | ||||||||
Financials — 16.4% | ||||||||
American Financial Group, Inc. | 130 | 17,369 | ||||||
Comerica, Inc. | 93 | 7,675 | ||||||
F.N.B. Corp. | 282 | 3,288 | ||||||
Federated Hermes, Inc. | 98 | 3,304 | ||||||
First Horizon Corp. | 504 | 8,129 | ||||||
Franklin Resources, Inc. | 563 | 18,241 | ||||||
Huntington Bancshares, Inc. | 777 | 11,531 | ||||||
Janus Henderson Group PLC ^ | 138 | 5,897 | ||||||
KeyCorp | 799 | 17,930 | ||||||
Mercury General Corp. | 158 | 8,061 | ||||||
Navient Corp. | 354 | 6,984 | ||||||
New York Community Bancorp, Inc. | 310 | 3,714 | ||||||
Old Republic International Corp. | 871 | 20,869 | ||||||
People’s United Financial, Inc. | 295 | 5,027 | ||||||
Principal Financial Group, Inc. | 473 | 32,438 | ||||||
Progressive Corp. | 1,098 | 102,048 | ||||||
Prudential Financial, Inc. | 1,145 | 117,088 | ||||||
Umpqua Holdings Corp. | 165 | 3,145 | ||||||
United Bankshares, Inc. | 82 | 2,930 | ||||||
Unum Group | 1,139 | 26,311 | ||||||
Valley National Bancorp | 283 | 3,804 | ||||||
| 425,783 | ||||||||
The accompanying notes are an integral part of these financial statements.
| 13 |

Schedule of Investments (Continued) | Global Beta Smart Income ETF |
November 30, 2021
Investments | Number of | Value | ||||||
COMMON STOCKS — 99.4% (Continued) | ||||||||
Health Care — 16.8% | ||||||||
AbbVie, Inc. | 1,117 | $ | 128,768 | |||||
Cardinal Health, Inc. | 2,278 | 105,312 | ||||||
Gilead Sciences, Inc. | 849 | 58,522 | ||||||
Pfizer, Inc. | 2,661 | 142,975 | ||||||
| 435,577 | ||||||||
Industrials — 4.1% | ||||||||
3M Co. | 427 | 72,607 | ||||||
CSX Corp. | 823 | 28,525 | ||||||
MSC Industrial Direct Co., Inc. - Class A | 88 | 6,926 | ||||||
| 108,058 | ||||||||
Information Technology — 6.2% | ||||||||
International Business Machines Corp. | 872 | 102,111 | ||||||
NortonLifeLock, Inc. | 224 | 5,566 | ||||||
Seagate Technology Holdings PLC ^ | 289 | 29,672 | ||||||
Western Union Co. | 532 | 8,416 | ||||||
Xerox Holdings Corp. | 780 | 14,368 | ||||||
| 160,133 | ||||||||
Materials — 7.6% | ||||||||
Amcor PLC ^ | 2,325 | 26,319 | ||||||
Compass Minerals International, Inc. | 37 | 1,800 | ||||||
Dow, Inc. | 1,735 | 95,303 | ||||||
LyondellBasell Industries NV - Class A ^ | 844 | 73,538 | ||||||
| 196,960 | ||||||||
Real Estate — 2.3% | ||||||||
American Campus Communities, Inc. | 40 | 2,070 | ||||||
CoreSite Realty Corp. | 9 | 1,539 | ||||||
Corporate Office Properties Trust | 53 | 1,360 | ||||||
Federal Realty Investment Trust | 16 | 1,963 | ||||||
Healthcare Realty Trust, Inc. | 37 | 1,159 | ||||||
Highwoods Properties, Inc. | 37 | 1,598 | ||||||
Iron Mountain, Inc. | 211 | 9,588 | ||||||
Life Storage, Inc. | 13 | 1,718 | ||||||
Medical Properties Trust, Inc. | 155 | 3,300 | ||||||
National Retail Properties, Inc. | 32 | 1,411 | ||||||
Omega Healthcare Investors, Inc. | 64 | 1,788 | ||||||
Orion Office REIT, Inc. * | 1 | 11 | ||||||
Physicians Realty Trust | 54 | 963 | ||||||
Realty Income Corp. | 56 | 3,803 | ||||||
Simon Property Group, Inc. | 89 | 13,603 | ||||||
Spirit Realty Capital, Inc. | 24 | 1,069 | ||||||
STORE Capital Corp. | 47 | 1,548 | ||||||
Urban Edge Properties | 44 | 758 | ||||||
Ventas, Inc. | 143 | 6,710 | ||||||
Vornado Realty Trust | 82 | 3,291 | ||||||
| 59,250 | ||||||||
The accompanying notes are an integral part of these financial statements.
| 14 |

Schedule of Investments (Continued) | Global Beta Smart Income ETF |
November 30, 2021
Investments | Number of | Value | ||||||
COMMON STOCKS — 99.4% (Continued) | ||||||||
Utilities — 12.7% | ||||||||
ALLETE, Inc. | 46 | $ | 2,697 | |||||
Consolidated Edison, Inc. | 391 | 30,357 | ||||||
Dominion Energy, Inc. | 413 | 29,406 | ||||||
Duke Energy Corp. | 543 | 52,676 | ||||||
Edison International | 539 | 35,186 | ||||||
Entergy Corp. | 213 | 21,372 | ||||||
FirstEnergy Corp. | 650 | 24,479 | ||||||
National Fuel Gas Co. | 74 | 4,278 | ||||||
NextEra Energy, Inc. | 446 | 38,704 | ||||||
NiSource, Inc. | 425 | 10,417 | ||||||
NorthWestern Corp. | 47 | 2,599 | ||||||
OGE Energy Corp. | 218 | 7,482 | ||||||
Pinnacle West Capital Corp. | 111 | 7,221 | ||||||
PPL Corp. | 502 | 13,971 | ||||||
Southern Co. | 740 | 45,214 | ||||||
Spire, Inc. | 78 | 4,668 | ||||||
| 330,727 | ||||||||
TOTAL COMMON STOCKS (Cost $2,427,730) | 2,580,475 | |||||||
MONEY MARKET FUND — 0.1% | ||||||||
First American Government Obligations Fund - Class X, 0.03% (a) | 1,918 | 1,918 | ||||||
TOTAL MONEY MARKET FUND (Cost $1,918) | 1,918 | |||||||
TOTAL INVESTMENTS — 99.5% (Cost $2,429,648) | 2,582,393 | |||||||
OTHER ASSETS LESS LIABILITIES — 0.5% | 13,256 | |||||||
TOTAL NET ASSETS — 100.0% | $ | 2,595,649 | ||||||
PLC - Public Limited Company
^ | U.S. Dollar-denominated foreign security. |
* | Non-income producing security. |
(a) | 7-day net yield. |
The Global Industry Classification Standard (GICS®) was developed by and/or is the exclusive property of Morgan Stanley Capital International, Inc. (“MSCI”) and Standard & Poor’s Financial Services LLC (“S&P”). GICS is a service mark of MSCI and S&P and has been licensed for use by Global Beta Advisors LLC.
The accompanying notes are an integral part of these financial statements.
| 15 |

Schedule of Investments | Global Beta Low Beta ETF |
November 30, 2021
Investments | Number of | Value | ||||||
COMMON STOCKS — 99.7% | ||||||||
Communication Services — 11.0% | ||||||||
AT&T, Inc. | 2,208 | $ | 50,409 | |||||
Discovery, Inc. - Class A * | 176 | 4,096 | ||||||
Discovery, Inc. - Class C * | 183 | 4,156 | ||||||
Fox Corp. - Class A | 150 | 5,356 | ||||||
Lumen Technologies, Inc. | 669 | 8,255 | ||||||
Verizon Communications, Inc. | 1,009 | 50,722 | ||||||
ViacomCBS, Inc. - Class B | 283 | 8,759 | ||||||
| 131,753 | ||||||||
Consumer Discretionary — 3.6% | ||||||||
AutoZone, Inc. * | 4 | 7,268 | ||||||
Dollar General Corp. | 64 | 14,163 | ||||||
Domino’s Pizza, Inc. | 4 | 2,097 | ||||||
Hanesbrands, Inc. | 149 | 2,406 | ||||||
Hasbro, Inc. | 25 | 2,423 | ||||||
McDonald’s Corp. | 37 | 9,050 | ||||||
O’Reilly Automotive, Inc. * | 9 | 5,744 | ||||||
| 43,151 | ||||||||
Consumer Staples — 31.0% | ||||||||
Campbell Soup Co. | 82 | 3,307 | ||||||
Church & Dwight Co., Inc. | 25 | 2,234 | ||||||
Clorox Co. | 18 | 2,931 | ||||||
Coca-Cola Co/The | 270 | 14,161 | ||||||
Colgate-Palmolive Co. | 91 | 6,827 | ||||||
Conagra Brands, Inc. | 138 | 4,216 | ||||||
Costco Wholesale Corp. | 132 | 71,198 | ||||||
General Mills, Inc. | 126 | 7,783 | ||||||
Hershey Co. | 21 | 3,727 | ||||||
Hormel Foods Corp. | 95 | 3,933 | ||||||
J M Smucker Co. | 27 | 3,415 | ||||||
Kellogg Co. | 90 | 5,506 | ||||||
Kimberly-Clark Corp. | 57 | 7,428 | ||||||
Kraft Heinz Co. | 301 | 10,117 | ||||||
Kroger Co. | 1,306 | 54,238 | ||||||
McCormick & Co., Inc. | 29 | 2,489 | ||||||
Molson Coors Beverage Co. - Class B | 87 | 3,866 | ||||||
Mondelez International, Inc. - Class A | 191 | 11,258 | ||||||
PepsiCo, Inc. | 199 | 31,796 | ||||||
Philip Morris International, Inc. | 122 | 10,485 | ||||||
Procter & Gamble Co. | 216 | 31,229 | ||||||
Tyson Foods, Inc. - Class A | 253 | 19,977 | ||||||
Walmart, Inc. | 419 | 58,924 | ||||||
| 371,045 | ||||||||
Energy — 0.1% | ||||||||
Coterra Energy, Inc. | 34 | 683 | ||||||
Financials — 3.4% | ||||||||
Allstate Corp. | 152 | 16,526 | ||||||
Assurant, Inc. | 24 | 3,650 | ||||||
Cboe Global Markets, Inc. | 11 | 1,418 | ||||||
Progressive Corp. | 202 | 18,774 | ||||||
| 40,368 | ||||||||
The accompanying notes are an integral part of these financial statements.
| 16 |

Schedule of Investments (Continued) | Global Beta Low Beta ETF |
November 30, 2021
Investments | Number of | Value | ||||||
COMMON STOCKS — 99.7% (Continued) | ||||||||
Health Care — 32.3% | ||||||||
Abbott Laboratories | 131 | $ | 16,476 | |||||
AmerisourceBergen Corp. | 491 | 56,833 | ||||||
Baxter International, Inc. | 61 | 4,549 | ||||||
Becton Dickinson and Co. | 32 | 7,588 | ||||||
Bristol-Myers Squibb Co. | 295 | 15,821 | ||||||
Centene Corp. * | 804 | 57,414 | ||||||
Cerner Corp. | 31 | 2,184 | ||||||
CVS Health Corp. | 720 | 64,123 | ||||||
Danaher Corp. | 34 | 10,936 | ||||||
Eli Lilly and Co. | 47 | 11,658 | ||||||
Gilead Sciences, Inc. | 155 | 10,684 | ||||||
Hologic, Inc. * | 30 | 2,242 | ||||||
Humana, Inc. | 82 | 34,416 | ||||||
Johnson & Johnson | 224 | 34,928 | ||||||
Laboratory Corp of America Holdings * | 17 | 4,850 | ||||||
Merck & Co, Inc. | 269 | 20,151 | ||||||
Pfizer, Inc. | 512 | 27,510 | ||||||
Quest Diagnostics, Inc. | 29 | 4,312 | ||||||
| 386,675 | ||||||||
Industrials — 5.7% | ||||||||
3M Co. | 79 | 13,433 | ||||||
Lockheed Martin Corp. | 80 | 26,666 | ||||||
Northrop Grumman Corp. | 44 | 15,347 | ||||||
Otis Worldwide Corp. | 63 | 5,065 | ||||||
Waste Management, Inc. | 44 | 7,070 | ||||||
| 67,581 | ||||||||
Information Technology — 3.8% | ||||||||
Citrix Systems, Inc. | 12 | 965 | ||||||
International Business Machines Corp. | 225 | 26,347 | ||||||
NortonLifeLock, Inc. | 41 | 1,019 | ||||||
Oracle Corp. | 194 | 17,604 | ||||||
| 45,935 | ||||||||
Materials — 0.9% | ||||||||
Sealed Air Corp. | 37 | 2,298 | ||||||
Sherwin-Williams Co. | 27 | 8,944 | ||||||
| 11,242 | ||||||||
Real Estate — 1.1% | ||||||||
Alexandria Real Estate Equities, Inc. | 5 | 1,000 | ||||||
Crown Castle International Corp. | 13 | 2,361 | ||||||
Digital Realty Trust, Inc. | 12 | 2,013 | ||||||
Equinix, Inc. | 3 | 2,437 | ||||||
Extra Space Storage, Inc. | 3 | 600 | ||||||
Iron Mountain, Inc. | 39 | 1,772 | ||||||
Mid-America Apartment Communities, Inc. | 4 | 825 | ||||||
Public Storage | 4 | 1,310 | ||||||
SBA Communications Corp. | 3 | 1,031 | ||||||
| 13,349 | ||||||||
The accompanying notes are an integral part of these financial statements.
| 17 |

Schedule of Investments (Continued) | Global Beta Low Beta ETF |
November 30, 2021
Investments | Number of | Value | ||||||
COMMON STOCKS — 99.7% (Continued) | ||||||||
Utilities — 6.8% | ||||||||
Alliant Energy Corp. | 24 | $ | 1,315 | |||||
Ameren Corp. | 29 | 2,366 | ||||||
American Electric Power Co., Inc. | 74 | 5,998 | ||||||
American Water Works Co., Inc. | 9 | 1,517 | ||||||
Atmos Energy Corp. | 15 | 1,355 | ||||||
CMS Energy Corp. | 45 | 2,648 | ||||||
Consolidated Edison, Inc. | 71 | 5,512 | ||||||
Dominion Energy, Inc. | 75 | 5,340 | ||||||
DTE Energy Co. | 47 | 5,092 | ||||||
Duke Energy Corp. | 99 | 9,604 | ||||||
Entergy Corp. | 39 | 3,913 | ||||||
Evergy, Inc. | 34 | 2,152 | ||||||
Eversource Energy | 45 | 3,702 | ||||||
FirstEnergy Corp. | 119 | 4,482 | ||||||
NiSource, Inc. | 78 | 1,912 | ||||||
Pinnacle West Capital Corp. | 20 | 1,301 | ||||||
PPL Corp. | 92 | 2,560 | ||||||
Public Service Enterprise Group, Inc. | 62 | 3,874 | ||||||
Southern Co. | 137 | 8,371 | ||||||
WEC Energy Group, Inc. | 35 | 3,043 | ||||||
Xcel Energy, Inc. | 79 | 5,035 | ||||||
| 81,092 | ||||||||
TOTAL COMMON STOCKS (Cost $1,137,567) | 1,192,874 | |||||||
MONEY MARKET FUND — 0.1% | ||||||||
First American Government Obligations Fund - Class X, 0.03% (a) | 1,071 | 1,071 | ||||||
TOTAL MONEY MARKET FUND (Cost $1,071) | 1,071 | |||||||
TOTAL INVESTMENTS — 99.8% (Cost $1,138,638) | 1,193,945 | |||||||
OTHER ASSETS LESS LIABILITIES — 0.2% | 2,604 | |||||||
TOTAL NET ASSETS — 100.0% | $ | 1,196,549 | ||||||
* | Non-income producing security. |
(a) | 7-day net yield. |
The Global Industry Classification Standard (GICS®) was developed by and/or is the exclusive property of Morgan Stanley Capital International, Inc. (“MSCI”) and Standard & Poor’s Financial Services LLC (“S&P”). GICS is a service mark of MSCI and S&P and has been licensed for use by Global Beta Advisors LLC.
The accompanying notes are an integral part of these financial statements.
| 18 |

Schedule of Investments | Global Beta Rising Stars ETF |
November 30, 2021
Investments | Number of | Value | ||||||
COMMON STOCKS — 100.0% | ||||||||
Aerospace and Defense Manufacturing — 1.6% | ||||||||
RADA Electronic Industries Ltd. *^ | 1,087 | $ | 10,218 | |||||
Science Applications International Corp. | 104 | 8,724 | ||||||
| 18,942 | ||||||||
Apparel and Accessories Retail — 3.9% | ||||||||
Buckle, Inc. | 516 | 24,273 | ||||||
Revolve Group, Inc. * | 168 | 12,796 | ||||||
Stitch Fix, Inc. - Class A * | 301 | 7,495 | ||||||
| 44,564 | ||||||||
Auto Retail — 4.0% | ||||||||
CarParts.com, Inc. * | 793 | 9,809 | ||||||
Carvana Co. * | 56 | 15,704 | ||||||
CDK Global, Inc. | 241 | 9,312 | ||||||
IAA, Inc. * | 242 | 11,689 | ||||||
| 46,514 | ||||||||
Commercial Electronics — 1.2% | ||||||||
Zebra Technologies Corp. - Class A * | 24 | 14,131 | ||||||
Communications Equipment — 5.7% | ||||||||
A10 Networks, Inc. | 675 | 10,408 | ||||||
Calix, Inc. * | 311 | 20,824 | ||||||
Extreme Networks, Inc. * | 1,408 | 19,008 | ||||||
Inseego Corp. * | 1,136 | 7,339 | ||||||
NETGEAR, Inc. * | 290 | 7,755 | ||||||
| 65,334 | ||||||||
Computer Hardware and Storage — 1.8% | ||||||||
Seagate Technology Holdings PLC ^ | 110 | 11,294 | ||||||
Western Digital Corp. * | 160 | 9,254 | ||||||
| 20,548 | ||||||||
Consumer Electronics — 1.9% | ||||||||
GoPro, Inc. - Class A * | 941 | 9,410 | ||||||
Sonos, Inc. * | 371 | 11,742 | ||||||
| 21,152 | ||||||||
Electrical Equipment and Power Systems — 1.0% | ||||||||
Bloom Energy Corp. - Class A * | 434 | 11,926 | ||||||
Electronic Components — 3.0% | ||||||||
Corsair Gaming, Inc. * | 635 | 14,224 | ||||||
II-VI, Inc. * | 327 | 20,447 | ||||||
| 34,671 | ||||||||
Finance Software and Services — 1.7% | ||||||||
OneConnect Financial Technology Co Ltd. *^ | 2,497 | 6,393 | ||||||
SS&C Technologies Holdings, Inc. | 170 | 12,976 | ||||||
| 19,369 | ||||||||
General Merchandise Retail — 4.4% | ||||||||
eBay, Inc. | 277 | 18,686 | ||||||
RealReal, Inc. * | 873 | 13,593 | ||||||
Target Corp. | 39 | 9,510 | ||||||
Vipshop Holdings Ltd. - ADR *^ | 935 | 9,135 | ||||||
| 50,924 | ||||||||
Healthcare Support Services — 2.3% | ||||||||
Allscripts Healthcare Solutions, Inc. * | 647 | 10,760 | ||||||
Cerner Corp. | 124 | 8,736 | ||||||
The accompanying notes are an integral part of these financial statements.
| 19 |

Schedule of Investments (Continued) | Global Beta Rising Stars ETF |
November 30, 2021
Investments | Number of | Value | ||||||
COMMON STOCKS — 100.0% (Continued) | ||||||||
Healthcare Support Services — 2.3% (Continued) | ||||||||
Change Healthcare, Inc. * | 358 | $ | 7,260 | |||||
| 26,756 | ||||||||
Home Improvement Retail — 2.0% | ||||||||
Wayfair, Inc. - Class A * | 52 | 12,887 | ||||||
Williams-Sonoma, Inc. | 52 | 10,132 | ||||||
| 23,019 | ||||||||
Hospitality Services — 0.8% | ||||||||
Dada Nexus Ltd. - ADR *^ | 520 | 9,396 | ||||||
Internet and Data Services — 15.6% | ||||||||
Angi, Inc. * | 811 | 7,794 | ||||||
Cargurus, Inc. * | 481 | 18,038 | ||||||
Cars.com, Inc. * | 826 | 13,778 | ||||||
Dropbox, Inc. Class A * | 481 | 11,837 | ||||||
Dun & Bradstreet Holdings, Inc. * | 714 | 13,566 | ||||||
Envestnet, Inc. * | 138 | 10,580 | ||||||
Gartner, Inc. * | 33 | 10,304 | ||||||
JOYY, Inc. - ADR ^ | 291 | 14,899 | ||||||
Quotient Technology, Inc. * | 1,695 | 11,882 | ||||||
Shutterstock, Inc. | 92 | 10,489 | ||||||
Spotify Technology SA *^ | 55 | 13,118 | ||||||
Vnet Group, Inc. - ADR *^ | 947 | 9,205 | ||||||
Weibo Corp. - ADR *^ | 283 | 11,266 | ||||||
Yelp, Inc. * | 328 | 11,244 | ||||||
Ziff Davis, Inc. * | 54 | 6,149 | ||||||
Zillow Group, Inc. - Class C * | 109 | 5,915 | ||||||
| 180,064 | ||||||||
Machinery Manufacturing — 0.9% | ||||||||
Rockwell Automation, Inc. | 32 | 10,758 | ||||||
Manufacturing Equipment and Services — 1.4% | ||||||||
Flex Ltd. *^ | 483 | 8,259 | ||||||
Jabil, Inc. | 139 | 8,126 | ||||||
| 16,385 | ||||||||
Other Professional Services — 1.6% | ||||||||
2U, Inc. * | 318 | 7,565 | ||||||
Blackbaud, Inc. * | 138 | 10,414 | ||||||
| 17,979 | ||||||||
Other Retail — 1.1% | ||||||||
Chewy, Inc. - Class A * | 182 | 12,423 | ||||||
Other Telecommunications Services — 1.5% | ||||||||
Casa Systems, Inc. * | 1,292 | 6,447 | ||||||
Sify Technologies Ltd. - ADR *^ | 2,864 | 10,597 | ||||||
| 17,044 | ||||||||
Real Estate Investment Trusts (REITs) — 3.5% | ||||||||
CoreSite Realty Corp. | 116 | 19,842 | ||||||
CyrusOne, Inc. | 223 | 19,851 | ||||||
| 39,693 | ||||||||
The accompanying notes are an integral part of these financial statements.
| 20 |

Schedule of Investments (Continued) | Global Beta Rising Stars ETF |
November 30, 2021
Investments | Number of | Value | ||||||
COMMON STOCKS — 100.0% (Continued) | ||||||||
Semiconductor Equipment and Services — 12.3% | ||||||||
Amkor Technology, Inc. | 334 | $ | 7,201 | |||||
Axcelis Technologies, Inc. * | 291 | 17,990 | ||||||
FormFactor, Inc. * | 360 | 15,091 | ||||||
Ichor Holdings Ltd. *^ | 312 | 14,942 | ||||||
KLA Corp. | 21 | 8,571 | ||||||
Kulicke & Soffa Industries, Inc. | 278 | 16,029 | ||||||
Lam Research Corp. | 25 | 16,996 | ||||||
Onto Innovation, Inc. * | 197 | 18,550 | ||||||
Photronics, Inc. * | 731 | 9,656 | ||||||
Veeco Instruments, Inc. * | 622 | 16,533 | ||||||
| 141,559 | ||||||||
Semiconductor Manufacturing — 5.9% | ||||||||
Broadcom, Inc. | 15 | 8,305 | ||||||
Cirrus Logic, Inc. * | 158 | 12,669 | ||||||
Diodes, Inc. * | 125 | 13,294 | ||||||
Himax Technologies, Inc. - ADR ^ | 613 | 6,099 | ||||||
Micron Technology, Inc. | 100 | 8,400 | ||||||
Skyworks Solutions, Inc. | 124 | 18,806 | ||||||
| 67,573 | ||||||||
Software — 16.6% | ||||||||
Bandwidth, Inc. - Class A * | 90 | 6,449 | ||||||
Box, Inc. - Class A * | 383 | 8,966 | ||||||
Cloopen Group Holding Ltd. *^ | 1,938 | 7,345 | ||||||
CommVault Systems, Inc. * | 143 | 8,992 | ||||||
Consensus Cloud Solutions, Inc. * | 17 | 1,065 | ||||||
InterDigital, Inc. | 149 | 10,119 | ||||||
LiveRamp Holdings, Inc. * | 267 | 12,530 | ||||||
Loyalty Ventures, Inc. * | 31 | 895 | ||||||
McAfee Corp. - Class A | 350 | 9,048 | ||||||
Momentive Global, Inc. * | 686 | 14,015 | ||||||
NetScout Systems, Inc. * | 327 | 9,777 | ||||||
New Relic, Inc. * | 176 | 19,506 | ||||||
NortonLifeLock, Inc. | 267 | 6,635 | ||||||
Nutanix, Inc. - Class A * | 257 | 8,538 | ||||||
ON24, Inc. * | 869 | 13,765 | ||||||
Perion Network Ltd. *^ | 937 | 22,629 | ||||||
SolarWinds Corp. * | 606 | 8,726 | ||||||
Yext, Inc. * | 669 | 6,463 | ||||||
Zuora, Inc. - Class A * | 799 | 15,828 | ||||||
| 191,291 | ||||||||
Specialty Finance — 3.5% | ||||||||
Alliance Data Systems Corp. | 78 | 5,317 | ||||||
EVERTEC, Inc. ^ | 296 | 12,429 | ||||||
Global Payments, Inc. | 103 | 12,261 | ||||||
Green Dot Corp. - Class A * | 282 | 10,124 | ||||||
| 40,131 | ||||||||
The accompanying notes are an integral part of these financial statements.
| 21 |

Schedule of Investments (Continued) | Global Beta Rising Stars ETF |
November 30, 2021
Investments | Number of | Value | ||||||
COMMON STOCKS — 100.0% (Continued) | ||||||||
Technology Consulting Services — 0.8% | ||||||||
Rimini Street, Inc. * | 1,413 | $ | 9,340 | |||||
TOTAL COMMON STOCKS (Cost $1,181,312) | 1,151,486 | |||||||
MONEY MARKET FUND — 0.0% # | ||||||||
First American Government Obligations Fund - Class X, 0.03% (a) | 498 | 498 | ||||||
TOTAL MONEY MARKET FUND (Cost $498) | 498 | |||||||
TOTAL INVESTMENTS — 100.0% (Cost $1,181,810) | 1,151,984 | |||||||
OTHER ASSETS LESS LIABILITIES — 0.0% # | 102 | |||||||
TOTAL NET ASSETS — 100.0% | $ | 1,152,086 | ||||||
ADR - American Depositary Receipt
PLC - Public Limited Company
* | Non-income producing security. |
^ | U.S. Dollar-denominated foreign security. |
# | Represents less than 0.05% of net assets. |
(a) | 7-day net yield. |
The Revere Business Industry Classifications System (RBICS®) was developed by and/or is the exclusive property of FactSet. RBICS is a service mark of FactSet and has been licensed for use by Global Beta Advisors LLC.
The accompanying notes are an integral part of these financial statements.
| 22 |

Statement of Assets and Liabilities | Global Beta ETF Trust |
November 30, 2021
Global Beta | Global Beta | Global Beta | ||||||||||
ASSETS | ||||||||||||
Investments in securities, at value (identified cost $2,427,730, $1,137,567, $1,181,312) (See Note 2) | $ | 2,580,475 | $ | 1,192,874 | $ | 1,151,486 | ||||||
Investments in money market fund, at value (identified cost $1,918, $1,071, $498) (See Note 2) | 1,918 | 1,071 | 498 | |||||||||
Total securities, at value (identified cost $2,429,648, $1,138,638, $1,181,810) (See Note 2) | 2,582,393 | 1,193,945 | 1,151,984 | |||||||||
Receivables: | ||||||||||||
Dividends and interest (Net of foreign tax withholding of $0, $0, $2) | 13,895 | 2,899 | 390 | |||||||||
Total assets | 2,596,288 | 1,196,844 | 1,152,374 | |||||||||
LIABILITIES | ||||||||||||
Payables: | ||||||||||||
Investment advisory fees | 639 | 295 | 288 | |||||||||
Total liabilities | 639 | 295 | 288 | |||||||||
NET ASSETS | $ | 2,595,649 | $ | 1,196,549 | $ | 1,152,086 | ||||||
NET ASSETS CONSIST OF: | ||||||||||||
Paid-in capital | $ | 2,715,698 | $ | 1,151,690 | $ | 1,289,635 | ||||||
Total distributable earnings (loss) | (120,049 | ) | 44,859 | (137,549 | ) | |||||||
NET ASSETS | $ | 2,595,649 | $ | 1,196,549 | $ | 1,152,086 | ||||||
Shares issued and outstanding, $0 par value, unlimited shares authorized | 125,000 | 50,000 | 50,000 | |||||||||
Net Asset Value, Offering Price and Redemption Price Per Share | $ | 20.77 | $ | 23.93 | $ | 23.04 | ||||||
The accompanying notes are an integral part of these financial statements.
| 23 |

Statement of Operations | Global Beta ETF Trust |
For The Year Ended November 30, 2021
Global Beta | Global Beta | Global Beta | ||||||||||
INVESTMENT INCOME | ||||||||||||
Dividends and interest (Net of foreign tax withholding of $133, $0, $43) | $ | 105,383 | $ | 36,281 | $ | 8,430 | ||||||
Total investment income | 105,383 | 36,281 | 8,430 | |||||||||
EXPENSES | ||||||||||||
Investment advisory fees (See Note 3) | 7,064 | 3,761 | 4,217 | |||||||||
Trustee fees (See Note 3) | 4,911 | 12,411 | 12,411 | |||||||||
Legal fees (See Note 3) | 1,259 | 2,758 | 2,758 | |||||||||
Total expenses | 13,234 | 18,930 | 19,386 | |||||||||
Less: fees reimbursed by adviser (See Note 3) | (6,170 | ) | (15,169 | ) | (15,169 | ) | ||||||
Net expenses | 7,064 | 3,761 | 4,217 | |||||||||
Net Investment Income | 98,319 | 32,520 | 4,213 | |||||||||
REALIZED & UNREALIZED GAIN (LOSS) ON INVESTMENTS | ||||||||||||
Net realized gain (loss) on: | ||||||||||||
Investments | 291,171 | (28,286 | ) | (85,417 | ) | |||||||
In-Kind Redemptions | 116,596 | 258,399 | 610,292 | |||||||||
Net realized gains | 407,767 | 230,113 | 524,875 | |||||||||
Change in net unrealized appreciation/depreciation on investments | (67,877 | ) | (107,978 | ) | (274,311 | ) | ||||||
Net realized and unrealized gain on investments | 339,890 | 122,135 | 250,564 | |||||||||
Net increase in net assets resulting from operations | $ | 438,209 | $ | 154,655 | $ | 254,777 | ||||||
The accompanying notes are an integral part of these financial statements.
| 24 |

Statements of Changes in Net Assets | Global Beta Smart Income ETF |
For the | For the | |||||||
OPERATIONS | ||||||||
Net investment income | $ | 98,319 | $ | 78,624 | ||||
Net realized gain (loss) | 407,767 | (706,836 | ) | |||||
Net change in unrealized appreciation/depreciation | (67,877 | ) | 220,622 | |||||
Net increase (decrease) in net assets resulting from operations | 438,209 | (407,590 | ) | |||||
DISTRIBUTIONS | ||||||||
Distributable earnings | (89,450 | ) | (66,000 | ) | ||||
Total distributions | (89,450 | ) | (66,000 | ) | ||||
CAPITAL TRANSACTIONS | ||||||||
Proceeds from shares issued | $ | 1,054,908 | $ | 2,400,000 | ||||
Cost of shares redeemed | (523,283 | ) | (311,145 | ) | ||||
Net increase from capital transactions | 531,625 | 2,088,855 | ||||||
Total Increase in Net Assets | $ | 880,384 | $ | 1,615,265 | ||||
NET ASSETS | ||||||||
Beginning of year | 1,715,265 | 100,000 | (b) | |||||
End of year | $ | 2,595,649 | $ | 1,715,265 | ||||
SHARE TRANSACTIONS | ||||||||
Beginning of year | 100,000 | 5,000 | (b) | |||||
Shares issued in-kind | 50,000 | 125,000 | ||||||
Shares redeemed | — | (5,000 | )(b) | |||||
Shares redeemed in-kind | (25,000 | ) | (25,000 | ) | ||||
Shares Outstanding, End of Year | 125,000 | 100,000 | ||||||
(a) | Commencement of investment operations on December 27, 2019. |
(b) | Beginning capital of $100,000 was contributed by Global Beta Advisors LLC, investment adviser to the Fund, in exchange for 5,000 Shares of the Fund in connection with the seeding of the Trust. The shares were redeemed by the adviser on the commencement of investment operations on December 27, 2019. |
The accompanying notes are an integral part of these financial statements.
| 25 |

Statements of Changes in Net Assets | Global Beta Low Beta ETF |
For the | For the | |||||||
OPERATIONS | ||||||||
Net investment income | $ | 32,520 | $ | 18,796 | ||||
Net realized gain | 230,113 | 17,016 | ||||||
Net change in unrealized appreciation/depreciation | (107,978 | ) | 163,285 | |||||
Net increase in net assets resulting from operations | 154,655 | 199,097 | ||||||
DISTRIBUTIONS | ||||||||
Distributable earnings | (34,235 | ) | (8,000 | ) | ||||
Total distributions | (34,235 | ) | (8,000 | ) | ||||
CAPITAL TRANSACTIONS | ||||||||
Proceeds from shares issued | $ | 2,315,677 | $ | 3,014,113 | ||||
Cost of shares redeemed | (3,934,080 | ) | (510,678 | ) | ||||
Net increase (decrease) from capital transactions | (1,618,403 | ) | 2,503,435 | |||||
Total Increase (Decrease) in Net Assets | $ | (1,497,983 | ) | $ | 2,694,532 | |||
NET ASSETS | ||||||||
Beginning of year | 2,694,532 | — | ||||||
End of year | $ | 1,196,549 | $ | 2,694,532 | ||||
SHARE TRANSACTIONS | ||||||||
Beginning of year | 125,000 | — | ||||||
Shares issued in-kind | 100,000 | 150,000 | ||||||
Shares redeemed in-kind | (175,000 | ) | (25,000 | ) | ||||
Shares Outstanding, End of Year | 50,000 | 125,000 | ||||||
(a) | Commencement of investment operations on July 24, 2020. |
The accompanying notes are an integral part of these financial statements.
| 26 |

Statements of Changes in Net Assets | Global Beta Rising Stars ETF |
For the | For the | |||||||
OPERATIONS | ||||||||
Net investment income | $ | 4,213 | $ | 8,032 | ||||
Net realized gain | 524,875 | 21,973 | ||||||
Net change in unrealized appreciation/depreciation | (274,311 | ) | 244,485 | |||||
Net increase in net assets resulting from operations | 254,777 | 274,490 | ||||||
DISTRIBUTIONS | ||||||||
Distributable earnings | (8,941 | ) | (3,000 | ) | ||||
Total distributions | (8,941 | ) | (3,000 | ) | ||||
CAPITAL TRANSACTIONS | ||||||||
Proceeds from shares issued | $ | 4,074,127 | $ | 3,019,328 | ||||
Cost of shares redeemed | (5,949,792 | ) | (508,903 | ) | ||||
Net increase (decrease) from capital transactions | (1,875,665 | ) | 2,510,425 | |||||
Total Increase (Decrease) in Net Assets | $ | (1,629,829 | ) | $ | 2,781,915 | |||
NET ASSETS | ||||||||
Beginning of year | 2,781,915 | — | ||||||
End of year | $ | 1,152,086 | $ | 2,781,915 | ||||
SHARE TRANSACTIONS | ||||||||
Beginning of year | 125,000 | — | ||||||
Shares issued in-kind | 175,000 | 150,000 | ||||||
Shares redeemed in-kind | (250,000 | ) | (25,000 | ) | ||||
Shares Outstanding, End of Year | 50,000 | 125,000 | ||||||
(a) | Commencement of investment operations on July 24, 2020. |
The accompanying notes are an integral part of these financial statements.
| 27 |

Financial Highlights | Global Beta Smart Income ETF |
For a share outstanding throughout the periods presented
For the | For the | |||||||
Net asset value, beginning of year | $ | 17.15 | $ | 20.00 | ||||
INCOME FROM INVESTMENT OPERATIONS: | ||||||||
Net investment income (b) | 0.83 | 0.74 | ||||||
Net realized and unrealized income (loss) on investments (c) | 3.55 | (2.99 | ) | |||||
Total from investment operations | 4.38 | (2.25 | ) | |||||
LESS DISTRIBUTIONS: | ||||||||
From net investment income | (0.76 | ) | (0.60 | ) | ||||
Total distributions | (0.76 | ) | (0.60 | ) | ||||
Net asset value, end of year | $ | 20.77 | $ | 17.15 | ||||
TOTAL RETURNS: | ||||||||
Net Asset Value (d) | 25.71 | % | (10.35 | )%^ | ||||
Market Value (e) | 26.31 | % | (10.54 | )%^ | ||||
RATIOS/SUPPLEMENTAL DATA: | ||||||||
Net assets, end of year (millions) | $ | 2.6 | $ | 1.7 | ||||
RATIO OF EXPENSES TO AVERAGE NET ASSETS: | ||||||||
Before fees waived and expenses reimbursed | 0.54 | % | 5.41 | %+ | ||||
After fees waived and expenses reimbursed | 0.29 | %(f) | 0.12 | %(g)+ | ||||
RATIO OF NET INVESTMENT INCOME (LOSS) TO AVERAGE NET ASSETS: | ||||||||
Before fees waived and expenses reimbursed | 3.78 | % | (0.30 | )%+ | ||||
After fees waived and expenses reimbursed | 4.04 | %(f) | 4.99 | %(g)+ | ||||
Portfolio turnover rate (h) | 117 | % | 169 | %^ | ||||
(a) | Commencement of investment operations on December 27, 2019. |
(b) | Calculated using average shares outstanding, during the year. |
(c) | The amounts reported for a share outstanding may not accord with the change in the aggregate gains and losses in securities for the fiscal period due to the timing of capital share transactions in relation to the fluctuating market values of the Fund’s underlying securities. |
(d) | Net asset value total return is calculated assuming an initial investment made at the net asset value at the beginning of the period, reinvestment of all dividends and distributions at net asset value during the period and redemption on the last day of the period at net asset value. |
(e) | Market value total return is calculated assuming an initial investment made at market value at the beginning of the period, reinvestment of all dividends and distributions at net asset value during the period and redemption on the last day of the period at market value. The market value is determined by the midpoint of the bid/ask spread at 4:00 p.m. from the NYSE Arca, Inc. Exchange. Market value returns may vary from net asset value returns. |
(f) | Effective May 1, 2021, the Advisory Agreement was amended to charge a single unitary management fee. See Note 3. |
(g) | Includes voluntary fees waived by the Adviser of $2,698 or 0.17% of average net assets for the period. |
(h) | Portfolio turnover rate excludes in-kind transactions. |
^ | Not Annualized. |
+ | Annualized. |
The accompanying notes are an integral part of these financial statements.
| 28 |

Financial Highlights | Global Beta Low Beta ETF |
For a share outstanding throughout the periods presented
For the | For the | |||||||
Net asset value, beginning of year | $ | 21.56 | $ | 20.00 | ||||
INCOME FROM INVESTMENT OPERATIONS: | ||||||||
Net investment income (b) | 0.58 | 0.15 | ||||||
Net realized and unrealized gain on investments(c) | 2.31 | 1.46 | ||||||
Total from investment operations | 2.89 | 1.61 | ||||||
LESS DISTRIBUTIONS: | ||||||||
From net investment income | (0.52 | ) | (0.05 | ) | ||||
Total distributions | (0.52 | ) | (0.05 | ) | ||||
Net asset value, end of year | $ | 23.93 | $ | 21.56 | ||||
TOTAL RETURNS: | ||||||||
Net Asset Value(d) | 13.56 | % | 8.06 | %^ | ||||
Market Value(e) | 13.68 | % | 7.97 | %^ | ||||
RATIOS/SUPPLEMENTAL DATA: | ||||||||
Net assets, end of year (millions) | $ | 1.2 | $ | 2.7 | ||||
RATIO OF EXPENSES TO AVERAGE NET ASSETS: | ||||||||
Before fees waived and expenses reimbursed | 1.46 | % | 2.09 | %+ | ||||
After fees waived and expenses reimbursed | 0.29 | %(f) | 0.29 | %+ | ||||
RATIO OF NET INVESTMENT INCOME TO AVERAGE NET ASSETS: | ||||||||
Before fees waived and expenses reimbursed | 1.34 | % | 0.23 | %+ | ||||
After fees waived and expenses reimbursed | 2.51 | %(f) | 2.03 | %+ | ||||
Portfolio turnover rate(g) | 115 | % | 0 | %^# | ||||
(a) | Commencement of investment operations on July 24, 2020. |
(b) | Calculated using average shares outstanding, during the year. |
(c) | The amounts reported for a share outstanding may not accord with the change in the aggregate gains and losses in securities for the fiscal period due to the timing of capital share transactions in relation to the fluctuating market values of the Fund’s underlying securities. |
(d) | Net asset value total return is calculated assuming an initial investment made at the net asset value at the beginning of the period, reinvestment of all dividends and distributions at net asset value during the period and redemption on the last day of the period at net asset value. |
(e) | Market value total return is calculated assuming an initial investment made at market value at the beginning of the period, reinvestment of all dividends and distributions at net asset value during the period and redemption on the last day of the period at market value. The market value is determined by the midpoint of the bid/ask spread at 4:00 p.m. from the NYSE Arca, Inc. Exchange. Market value returns may vary from net asset value returns. |
(f) | Effective May 1, 2021, the Advisory Agreement was amended to charge a single unitary management fee. See Note 3. |
(g) | Portfolio turnover rate excludes in-kind transactions. |
^ | Not Annualized. |
+ | Annualized. |
# | Less than 1%. |
The accompanying notes are an integral part of these financial statements.
| 29 |

Financial Highlights | Global Beta Rising Stars ETF |
For a share outstanding throughout the periods presented
For the | For the | |||||||
Net asset value, beginning of year | $ | 22.26 | $ | 20.00 | ||||
INCOME FROM INVESTMENT OPERATIONS: | ||||||||
Net investment income (b) | 0.07 | 0.06 | ||||||
Net realized and unrealized gain on investments(c) | 0.81 | 2.22 | ||||||
Total from investment operations | 0.88 | 2.28 | ||||||
LESS DISTRIBUTIONS: | ||||||||
From net investment income | (0.10 | ) | (0.02 | ) | ||||
Total distributions | (0.10 | ) | (0.02 | ) | ||||
Net asset value, end of year | $ | 23.04 | $ | 22.26 | ||||
TOTAL RETURNS: | ||||||||
Net Asset Value(d) | 3.84 | % | 11.39 | %^ | ||||
Market Value(e) | 4.00 | % | 11.27 | %^ | ||||
RATIOS/SUPPLEMENTAL DATA: | ||||||||
Net assets, end of year (millions) | $ | 1.2 | $ | 2.8 | ||||
RATIO OF EXPENSES TO AVERAGE NET ASSETS: | ||||||||
Before fees waived and expenses reimbursed | 1.33 | % | 2.05 | %+ | ||||
After fees waived and expenses reimbursed | 0.29 | %(f) | 0.29 | %+ | ||||
RATIO OF NET INVESTMENT INCOME (LOSS) TO AVERAGE NET ASSETS: | ||||||||
Before fees waived and expenses reimbursed | (0.75 | )% | (0.91 | )%+ | ||||
After fees waived and expenses reimbursed | 0.29 | %(f) | 0.85 | %+ | ||||
Portfolio turnover rate(g) | 312 | %(h) | 30 | %^ | ||||
(a) | Commencement of investment operations on July 24, 2020. |
(b) | Calculated using average shares outstanding, during the year. |
(c) | The amounts reported for a share outstanding may not accord with the change in the aggregate gains and losses in securities for the fiscal period due to the timing of capital share transactions in relation to the fluctuating market values of the Fund’s underlying securities. |
(d) | Net asset value total return is calculated assuming an initial investment made at the net asset value at the beginning of the period, reinvestment of all dividends and distributions at net asset value during the period and redemption on the last day of the period at net asset value. |
(e) | Market value total return is calculated assuming an initial investment made at market value at the beginning of the period, reinvestment of all dividends and distributions at net asset value during the period and redemption on the last day of the period at market value. The market value is determined by the midpoint of the bid/ask spread at 4:00 p.m. from the NYSE Arca, Inc. Exchange. Market value returns may vary from net asset value returns. |
(f) | Effective May 1, 2021, the Advisory Agreement was amended to charge a single unitary management fee. See Note 3. |
(g) | Portfolio turnover rate excludes in-kind transactions. |
(h) | Increase in the Portfolio turnover was a result of the Index change that was effective on December 18, 2020. |
^ | Not Annualized. |
+ | Annualized. |
The accompanying notes are an integral part of these financial statements.
| 30 |

Notes to the Financial Statements | Global Beta ETF Trust |
November 30, 2021
NOTE 1 – ORGANIZATION
The Global Beta ETF Trust (the “Trust”) was organized as a Delaware statutory trust on April 22, 2019 and is authorized to issue multiple series or portfolios. As of the period covered by this report, the Trust consists of three operational exchange-traded funds. The Global Beta Smart Income ETF (the “Smart Income ETF”), Global Beta Low Beta ETF (the “Low Beta ETF”) and Global Beta Rising Stars ETF (the “Rising Stars ETF”, and formerly the Global Beta Momentum-Growth ETF), (each the “Fund”, collectively the “Funds”). The Trust is an open-end management investment company, registered under the Investment Company Act of 1940, as amended (the “1940 Act”). The offering of the Funds’ shares (“Shares”) is registered under the Securities Act of 1933, as amended. The Smart Income ETF operates as a diversified series, and Low Beta ETF and Rising Stars ETF operate as non-diversified series. The Funds seeks to track the performance (before fees and expenses) of the Global Beta Smart Income Index, Global Beta Low Beta Factor Index and FactSet Rising Stars Index (their respective “Target Index”), respectively. There can be no guarantee that a Fund will achieve its investment objective. The inception dates of the Smart Income ETF, Low Beta ETF and Rising Stars ETF are December 27, 2019, July 24, 2020 and July 24, 2020, respectively.
NOTE 2 – SIGNIFICANT ACCOUNTING POLICIES
The Trust, which is an investment company, follows accounting and reporting guidance under Financial Accounting Standards Board (“FASB”) Accounting Standards Codification Topic 946, “Financial Services — Investment Companies.”
The following is a summary of significant accounting policies consistently followed by the Funds in the preparation of the financial statements. These policies have been prepared in conformity with accounting principles generally accepted in the United States of America (“GAAP”). The preparation of financial statements in conformity with U.S. GAAP requires management to make estimates and assumptions that affect the reported amounts and disclosures in the financial statements. Actual results could differ from those estimates.
A. Investment Valuation. The net asset value (“NAV”) of the Funds’ shares is calculated each business day as of the close of regular trading on the New York Stock Exchange (“NYSE”), generally 4:00 p.m., Eastern Time. NAV per share is computed by dividing the net assets by the number of shares outstanding.
When calculating the NAV of each Fund’s shares, securities held by the Funds are valued at market quotations when reliable market quotations are readily available. Exchange traded securities and instruments (including equity securities, depositary receipts and ETFs) are generally valued at the last reported sale price on the principal exchange on which such securities are traded (at the NASDAQ Official Closing Price for NASDAQ listed securities), as of the close of regular trading on the NYSE on the day the securities are being valued or, if there are no sales, at the mean of the most recent bid and asked prices. Over-the-counter securities and instruments not traded on an exchange are generally valued at the last traded price. In the absence of a recorded transaction sale price; or if the last sale price is unavailable, securities are valued at the mean between last bid and ask, as quoted. If an ask price is unavailable, last bid price is used. Such valuations would typically be categorized as Level 1 or Level 2 in the fair value hierarchy described below.
When reliable market quotations are not readily available, securities are priced at their fair value in accordance with the Trust’s valuation guidelines, which were approved by the Board of Trustees (the “Trustees” or the “Board”). The Funds may use fair value pricing in a variety of circumstances, including but not limited to, situations when the value of a security has been materially affected by events occurring after the close of the market on which such security is principally traded (such as a corporate action or other news that may materially affect the price of such security) or trading in such security has been suspended or halted. Such valuations would typically be categorized as Level 2 or Level 3 in the fair value hierarchy described below. Fair value pricing involves subjective judgments, and it is possible that a fair value determination for a security is materially different than the value that could be realized upon the sale of such security. In addition, fair value pricing could result in a difference between the prices used to calculate each Fund’s NAV and the prices used by each Fund’s Target Index. This may adversely affect each Fund’s ability to track its Target Index.
The Funds disclose the fair value of their investments in a hierarchy that distinguishes between: (1) market participant assumptions developed based on market data obtained from sources independent of the Funds (observable inputs) and (2) the Funds’ own assumptions about market participant assumptions developed based on the best information available under the circumstances (unobservable inputs). The three levels defined by the hierarchy are as follows:
● | Level 1 — Quoted prices in active markets for identical assets. |
● | Level 2 — Other significant observable inputs (including quoted prices for similar securities, interest rates, prepayment speeds, credit risk, etc.). |
| 31 |

Notes to the Financial Statements (Continued) | Global Beta ETF Trust |
November 30, 2021
● | Level 3 — Significant unobservable inputs (including the Funds’ own assumptions in determining the fair value of investments). The inputs or methodology used for valuing securities are not necessarily an indication of the risk associated with investing in those securities. |
The following is a summary of the inputs used to value the Global Beta Smart Income ETF investments as of November 30, 2021:
| Level 1 | Level 2 | Level 3 | Total | ||||||||||||
Common Stocks | $ | 2,580,475 | $ | — | $ | — | $ | 2,580,475 | ||||||||
Money Market Fund | 1,918 | — | — | 1,918 | ||||||||||||
Total Investments in Securities | $ | 2,582,393 | $ | — | $ | — | $ | 2,582,393 | ||||||||
See the Schedule of Investments for further detail of investment classification.
The following is a summary of the inputs used to value the Global Beta Low Beta ETF investments as of November 30, 2021:
| Level 1 | Level 2 | Level 3 | Total | ||||||||||||
Common Stocks | $ | 1,192,874 | $ | — | $ | — | $ | 1,192,874 | ||||||||
Money Market Fund | 1,071 | — | — | 1,071 | ||||||||||||
Total Investments in Securities | $ | 1,193,945 | $ | — | $ | — | $ | 1,193,945 | ||||||||
See the Schedule of Investments for further detail of investment classification.
The following is a summary of the inputs used to value the Global Beta Rising Stars ETF investments as of November 30, 2021:
| Level 1 | Level 2 | Level 3 | Total | ||||||||||||
Common Stocks | $ | 1,151,486 | $ | — | $ | — | $ | 1,151,486 | ||||||||
Money Market Fund | 498 | — | — | 498 | ||||||||||||
Total Investments in Securities | $ | 1,151,984 | $ | — | $ | — | $ | 1,151,984 | ||||||||
See the Schedule of Investments for further detail of investment classification.
In December 2020, the SEC adopted Rule 2a-5 under the Investment Company Act of 1940, as amended (“Rule 2a-5”), which is intended to address valuation practices and the role of a fund’s board with respect to the fair value of the investments of a registered investment company or business development company. Rule 2a-5, among other things, establishes an updated regulatory framework for registered investment company valuation practices. The Funds will not be required to comply with Rule 2a-5 until September 2022.
B. Real Estate Investment Trust. The Funds may obtain exposure to real estate investment trusts (“REITs”). Equity REITs invest primarily in real property while mortgage REITs make construction, development and long-term mortgage loans. Their value may be affected by changes in the value of the underlying property of the REIT, the creditworthiness of the issuer, property taxes, interest rates, and tax and regulatory requirements, such as those relating to the environment.
REITs are dependent upon management skill, are not diversified and are subject to heavy cash flow dependency, default by borrowers, self-liquidation and the possibility of failing to qualify for tax free income status under the Internal Revenue Code of 1986 and failing to be exempt from registration as a registered investment company under the 1940 Act.
C. Foreign Currency Translation. Investment securities and other assets and liabilities denominated in foreign currencies are translated into U.S. dollar amounts at the date of valuation. The Funds do not isolate that portion of the results of operations resulting from changes in foreign exchange rates on investments from fluctuations arising from changes in market prices of securities held. Such fluctuations are included with the net realized and unrealized gain or loss from investments. The Funds report net realized foreign exchange gains or losses that arise from sales of foreign currencies, currency gains or losses realized between the trade and settlement dates on foreign currency transactions, and the differences between the amounts of dividends, interest and foreign withholding taxes recorded on the Funds’ books and the U.S. dollar equivalent of the amounts actually received or paid. Net unrealized foreign exchange gains and losses arise from changes in the values of assets and liabilities, other than investments in securities at fiscal period end, resulting from changes in exchange rates.
| 32 |

Notes to the Financial Statements (Continued) | Global Beta ETF Trust |
November 30, 2021
D. Federal Income Taxes. The Funds’ policy is to comply with the requirements of Subchapter M of the Internal Revenue Code of 1986, as amended, necessary to qualify as regulated investment companies and distribute substantially all net taxable investment income and net realized gains to shareholders in a manner which results in no tax expense to the Funds. Therefore, no federal income tax provision is required. The Funds plan to file U.S. Federal and various state and local tax returns.
The Funds recognize the tax benefits of uncertain tax positions only when the position is more likely than not to be sustained. Management has analyzed the Funds’ uncertain tax positions and concluded that no liability for unrecognized tax benefits should be recorded related to uncertain tax positions. Management is not aware of any tax positions for which it is reasonably possible that the total amounts of unrecognized tax benefits will change materially in the next 12 months. Income and capital gain distributions are determined in accordance with federal income tax regulations, which may differ from U.S. GAAP. The Funds recognize interest and penalties, if any, related to unrecognized tax benefits on uncertain tax positions as income tax expenses in the Statements of Operations. During the current fiscal period, the Funds did not incur any interest or penalties.
Net capital losses incurred after October 31 and late year losses incurred after December 31 and within the taxable year are deemed to arise on the first business day of each Fund’s next taxable year.
For fiscal year ended November 30, 2021, the Funds did not have any post October losses.
Under the Regulated Investment Company Modernization Act of 2010, the Funds are permitted to carry forward capital losses for an unlimited period. Capital loss carry forwards will retain their character as either short-term or long-term capital losses. At November 30, 2021, the following Capital Loss Carryover were available:
| Indefinite Short-Term | Total | ||||||
Global Beta Smart Income ETF | $ | 280,993 | $ | 280,993 | ||||
Global Beta Rising Stars ETF | $ | 96,918 | $ | 96,918 | ||||
E. Security Transactions and Investment Income. Investment securities transactions are accounted for on the trade date. Gains and losses realized on sales of securities are determined on a specific identification basis. Dividend income is recorded on the ex-dividend date. Interest income is recorded on an accrual basis. Withholding taxes on foreign dividends, if any, have been provided for in accordance with the Funds’ understanding of the applicable tax rules and regulations. Distributions received from the Funds’ investments in REITs may be characterized as ordinary income, net capital gain, or a return of capital. The proper characterization of REIT distributions is generally not known until after the end of each calendar year. As such, the Funds must use estimates in reporting the character of their income and distributions for financial statement purposes. The actual character of distributions to the Funds’ shareholders will be reflected on the Form 1099 received by shareholders after the end of the calendar year. Due to the nature of REIT investments, a portion of the distributions received by the Funds’ shareholders may represent a return of capital.
F. Distributions to Shareholders. Distributions to shareholders from net investment income for the Funds are declared and paid on a quarterly basis. The net realized gains on securities normally are declared and paid on an annual basis for each Fund. Distributions are recorded on the ex-dividend date.
G. Use of Estimates. The preparation of financial statements in conformity with GAAP requires management to make estimates and assumptions that affect the reported amounts of assets and liabilities and disclosure of contingent assets and liabilities at the date of the financial statements, and the reported amounts of increases and decreases in net assets from operations during the reporting period. Actual results could differ from those estimates.
H. Share Valuation. The NAV per share of the Funds is calculated by dividing the sum of the value of the securities held by the Funds, plus cash and other assets, minus all liabilities (including estimated accrued expenses) by the total number of shares outstanding for the Funds, rounded to the nearest cent. The Funds’ shares will not be priced on the days on which the NYSE is closed for trading. The offering and redemption price per share for the Funds are equal to the NAV per share.
I. Guarantees and Indemnifications. In the normal course of business, the Trust, on behalf of the Funds, enters into contracts with third-party service providers that contain a variety of representations and warranties and that provide general indemnifications. Additionally, under the Trust organizational documents, the officers and Trustees are indemnified against certain liabilities arising out of the performance of their duties to the Trust. The Funds’ maximum exposure under these arrangements is unknown, as it involves possible future claims that may or may not be made against the Funds. The Adviser is of the view that the risk of loss to the Funds in connection with the Funds
| 33 |

Notes to the Financial Statements (Continued) | Global Beta ETF Trust |
November 30, 2021
indemnification obligations is remote; however, there can be no assurance that such obligations will not result in material liabilities that adversely affect the Funds.
J. Reclassification of Capital Accounts. U.S. GAAP requires that certain components of net assets relating to permanent differences be reclassified between financial and tax reporting. These reclassifications have no effect on net assets or NAV per share and are primarily due to differing book and tax treatments for in-kind transactions. For the fiscal year ended November 30, 2021, the following adjustments were made:
| Distributable Earnings | Paid-in Capital | ||||||
Global Beta Smart Income ETF | $ | (114,182 | ) | $ | 114,182 | |||
Global Beta Low Beta ETF | $ | (249,627 | ) | $ | 249,627 | |||
Global Beta Rising Stars ETF | $ | (607,005 | ) | $ | 607,005 | |||
K. COVID-19. The global outbreak of COVID-19 (commonly referred to as “coronavirus”) has disrupted economic markets and the prolonged economic impact is uncertain. The ultimate economic fallout from the pandemic, and the long-term impact on economies, markets, industries and individual issuers, are not known. The operational and financial performance of the issuers of securities in which the Funds invests depends on future developments, including the duration and spread of the outbreak, and such uncertainty may in turn adversely affect the value and liquidity of the Funds’ investments, and negatively impact the Funds’ performance.
L. Subsequent Events. In preparing these financial statements, management has evaluated events and transactions for potential recognition or disclosure through the date these financial statements were issued. There were no events or transactions that occurred during the period subsequent to the end of the current fiscal period that materially impacted the amounts or disclosures in the financial statements.
NOTE 3 – COMMITMENTS AND OTHER RELATED PARTY TRANSACTIONS
Global Beta Advisors LLC serves as the investment adviser (“Adviser”) to the Funds. Pursuant to an Investment Advisory Agreement (“Advisory Agreement”) between the Trust, on behalf of the Funds, and the Adviser, the Adviser provides investment advice to the Funds and oversees the day-to-day operations of the Funds, subject to the direction and control of the Board and the officers of the Trust. The Adviser administers each Fund’s business affairs, provides office facilities and equipment and certain clerical, bookkeeping and administrative services. For services provided to the Funds, each Fund pays the Adviser a management fee at an annual rate of 0.29% based on the Funds’ average daily net assets. For the year ended November 30, 2021, the Smart Income ETF, Low Beta ETF and Rising Stars ETF incurred $7,064, $3,761 and $4,217 in investment advisory fees, respectively.
Prior to May 1, 2021, under the terms of the Trust’s Advisory Agreement, the Adviser agreed to pay all of the ordinary operating expenses of the Funds that each Fund would be otherwise required to pay except for (i) the management fee payment under Advisory Agreement, (ii) payments under the Fund’s Rule 12b-1 plan, (iii) brokerage expenses (including any costs incidental to transactions in portfolio securities or instruments), (iv) acquired fund fees and expenses, (v) taxes, (vi) interest (including borrowing costs and dividend expenses on securities sold short and overdraft charges), (vii) litigation expenses (including litigation to which the Trust or the Fund may be a party and indemnification of the Board and officers with respect thereto), (viii) compensation and expenses of the members of the Board who are not “interested” within the meaning of the 1940 Act (the “Independent Trustees”), (ix) fees and expenses of counsel to the Independent Trustees and (x) other extraordinary or non-routine expenses (including expenses arising from mergers, acquisitions or similar transactions involving the Funds).
On April 16, 2021 the Board of Trustees of the Trust approved to amend the Advisory Agreement. Effective May 1, 2021 under the terms of the amended Advisory Agreement, and in exchange for a single unitary management fee, the Adviser has agreed to pay all of the ordinary operating expenses of each Fund with the exception of the following: (i) the management fee, (ii) payments under the Funds’ Rule 12b-1 plan, (iii) brokerage expenses (including any costs incidental to transactions in portfolio securities or instruments), (iv) acquired fund fees and expenses, (v) taxes, (vi) interest (including borrowing costs and dividend expenses on securities sold short and overdraft charges), (vii) litigation expenses (including litigation to which the Trust or the Funds may be a party and indemnification of the Trustees and officers with respect thereto), and (viii) other extraordinary or non-routine expenses (including expenses arising from mergers, acquisitions or similar transactions involving the Funds).
| 34 |

Notes to the Financial Statements (Continued) | Global Beta ETF Trust |
November 30, 2021
Pursuant to an Expense Reimbursement Agreement (“Expense Agreement”), the Adviser had reimbursed the Funds through April 30, 2021 for the (i) compensation and expenses of the Independent Trustees and (ii) fees and expenses of Counsel to the Independent Trustees, except for any (i) litigation expenses (including litigation to which the Trust or the Fund may be a party and indemnification of the Independent Trustees with respect thereto) and (ii) extraordinary or non-routine fees or expenses. For the year ended November 30, 2021, the Adviser reimbursed the Smart Income ETF, Low Beta ETF and Rising Stars ETF, $6,170, $15,169 and $15,169, respectively. The Adviser voluntarily waived its investment advisory fees for the Smart Income Fund through June 30, 2020. For the year ended November 30, 2020, the voluntary fees waived were $2,698. Pursuant to the Expense Agreement, waived fees are not subject to recoupment by the Adviser.
U.S. Bancorp Fund Services, LLC dba U.S. Bank Global Fund Services (“Fund Services”), an indirect wholly-owned subsidiary of U.S. Bancorp, serves as the Funds’ administrator and, in that capacity, performs various administrative and accounting services for the Funds. Funds Services also serves as the Funds’ fund accountant, transfer agent, dividend disbursing agent and registrar. Fund Services prepares various federal and state regulatory filings, reports and returns for the Funds, including regulatory compliance monitoring and financial reporting; prepares reports and materials to be supplied to the Trustees; monitors the activities of the Funds’ custodian; and coordinates the preparation and payment of the Funds’ advisory expense. U.S. Bank, N.A. (“U.S. Bank”), an affiliate of Fund Services, serves as the Funds’ custodian (the “Custodian”). As of November 30, 2021, there were no fees incurred by the Funds from the service providers described above as the Adviser bore all such costs.
Compass Distributors, LLC (the “Distributor”) serves as the principal underwriter for shares of the Funds, acts as the Funds’ distributor in a continuous public offering of the Funds’ shares, and serves as the Distributor of Creation Units for the Funds. Shares are continuously offered for sale by the Trust through the Distributor only in Creation Units, as described in Note 6. Shares in less than Creation Units are not distributed by the Distributor. The Distributor is a broker-dealer registered under the Securities Exchange Act of 1934, as amended, and a member of the Financial Industry Regulatory Authority, Inc. (“FINRA”).
At November 30, 2021, certain officers and Trustees of the Trust were also officers or employees of the Adviser or affiliated with the Distributor.
NOTE 4 – PURCHASES AND SALES OF SECURITIES
The costs of purchases and sales of securities, excluding short-term securities and in-kind transactions, during the year ended November 30, 2021, were as follows:
| Purchases | Sales | ||||||
Global Beta Smart Income ETF | $ | 2,800,311 | $ | 2,798,469 | ||||
Global Beta Low Beta ETF | $ | 1,464,999 | $ | 2,592,920 | ||||
Global Beta Rising Stars ETF | $ | 4,474,053 | $ | 5,151,228 | ||||
The costs of purchases and sales of in-kind transactions associated with creations and redemptions during the year ended November 30, 2021, were as follows:
| Purchases In-Kind | Sales In-Kind | ||||||
Global Beta Smart Income ETF | $ | 1,054,491 | $ | 519,436 | ||||
Global Beta Low Beta ETF | $ | 2,319,229 | $ | 2,805,507 | ||||
Global Beta Rising Stars ETF | $ | 4,050,502 | $ | 5,183,680 | ||||
| 35 |

Notes to the Financial Statements (Continued) | Global Beta ETF Trust |
November 30, 2021
NOTE 5 – DISTRIBUTIONS TO SHAREHOLDERS
The tax character of the distributions paid during the year ended November 30, 2021 and period ended November 30, 2020, were as follows:
| Year Ended | Period Ended | ||||||
Global Beta Smart Income ETF | $ | 89,450 | $ | 66,000 | ||||
Global Beta Low Beta ETF | $ | 34,235 | $ | 8,000 | ||||
Global Beta Rising Stars ETF | $ | 8,941 | $ | 3,000 | ||||
As of November 30, 2021, the components of accumulated earnings (losses) for income tax purposes were as follows:
| Global Beta | Global Beta | Global Beta | |||||||||
Federal income tax cost of investments | $ | 2,443,012 | $ | 1,166,111 | $ | 1,192,949 | ||||||
Aggregate gross unrealized appreciation | 252,432 | 91,251 | 114,005 | |||||||||
Aggregate gross unrealized depreciation | (113,051 | ) | (63,417 | ) | (154,970 | ) | ||||||
Net unrealized appreciation (depreciation) | 139,381 | 27,834 | (40,965 | ) | ||||||||
Undistributed Ordinary Income | 21,563 | 16,999 | 334 | |||||||||
Undistributed Long Term Capital Gains | — | 26 | — | |||||||||
Total distributable earnings | 21,563 | 17,025 | 334 | |||||||||
Accumulated capital and other gain/(loss) | (280,993 | ) | — | (96,918 | ) | |||||||
Total accumulated gain/(loss) | (120,049 | ) | 44,859 | (137,549 | ) | |||||||
NOTE 6 – SHARE TRANSACTIONS
Shares of the Funds are listed and traded on the NYSE. Market prices for the shares may be different from their NAV. The Funds will issue and redeem Shares on a continuous basis at NAV only in large blocks of shares, typically 25,000 Shares, called “Creation Units.” Creation Units will be issued and redeemed principally in-kind for a specified basket of securities (which may include cash in lieu of certain securities), together with the deposit of a specified cash amount. Once created, shares generally will trade in the secondary market at market prices that change throughout the day in amounts less than a Creation Unit. Except when aggregated in Creation Units, shares are not redeemable securities of the Funds. Shares of the Funds may only be purchased or redeemed by certain financial institutions (“Authorized Participants”). An Authorized Participant is either (i) a broker-dealer or other participant in the clearing process through the Continuous Net Settlement System of the National Securities Clearing Corporation or (ii) a participant in The Depository Trust Company and, in each case, must have executed a Participant Agreement with the Distributor. Most retail investors will not qualify as Authorized Participants or have the resources to buy and sell whole Creation Units. Therefore, they will be unable to purchase or redeem shares directly from the Funds. Rather, most retail investors will purchase shares in the secondary market with the assistance of a broker and will be subject to customary brokerage commissions or fees.
The Funds currently offer one class of shares, which has no front-end sales load, no deferred sales charge, and no redemption fee. The standard fixed transaction fee for the Funds are $250, payable to the Custodian. Additionally, a variable fee may be charged by the Funds of up to a maximum of 2% of the value of the Creation Unit (inclusive of any transaction fees charged), for each creation or redemption. Variable fees are imposed to compensate the Funds for the transaction costs associated with creation and redemption transactions. The Adviser, subject to the approval of the Board, may adjust or waive the transaction fees from time to time. The Funds may issue an unlimited number of shares of beneficial interest, with no par value. All shares of the Funds have equal rights and privileges.
NOTE 7 – BENEFICIAL OWNERSHIP
The beneficial ownership, either directly or indirectly, of more than 25% of the voting securities of a fund creates a presumption of control of the fund, under Section 2(a)(9) of the Investment Company Act of 1940. As of the year ended November 30, 2021, a beneficial owner of the Adviser owned 57,839 shares of the Smart Income ETF, representing 46.3% of the shares outstanding.
| 36 |

Notes to the Financial Statements (Continued) | Global Beta ETF Trust |
November 30, 2021
NOTE 8 – PRINCIPAL RISKS
As with all exchange traded funds (‘’ETFs’’), shareholders of the Funds are subject to the risk that their investment could lose money. The Funds are subject to the principal risks, any of which may adversely affect the Funds’ NAV, trading price, yield, total return and ability to meet its investment objective. A description of principal risks is included in the prospectus under the heading ‘’Principal Investment Risks’’.
| 37 |

Report of Independent Registered Public Accounting Firm | Global Beta ETF Trust |
To the Board of Trustees of Global Beta ETF Trust
and the Shareholders of Global Beta Smart Income ETF, Global Beta Low Beta ETF and Global Beta Rising Stars ETF (formerly Global Beta Momentum-Growth ETF):
Opinion on the Financial Statements
We have audited the accompanying statements of assets and liabilities, including the schedule of investments of Global Beta ETF Trust (the “Trust”), comprising Global Beta Smart Income ETF, Global Beta Low Beta ETF and Global Beta Rising Stars (collectively referred to as the “Funds”) as of November 30, 2021, the related statements of operations, changes in net assets and financial highlights for each of the periods indicated in the table below and the related notes (collectively referred to as the “financial statements”). In our opinion, the financial statements present fairly, in all material respects, the financial position of each of the Funds comprising the Trust as of November 30, 2021, and the results of their operations, changes in net assets and financial highlights for each of the periods indicated in the table below, in conformity with U.S. generally accepted accounting principles.
Funds comprising the Trust | Statement of operations | Statement of changes in net assets | Financial highlights |
Global Beta Smart Income ETF | For the year ended November 30, 2021 | For the year ended November 30, 2021 and the period from December 27, 2019 (inception) through November 30, 2020 | For the year ended November 30, 2021 and the period from December 27, 2019 (inception) through November 30, 2020 |
Global Beta Low Beta ETF and Global Beta Rising Stars ETF | For the year ended November 30, 2021 | For the year ended November 30, 2021 and the period from July 24, 2020 (inception) through November 30, 2020 | For the year ended November 30, 2021 and the period from July 24, 2020 (inception) through November 30, 2020 |
Basis for Opinion
These financial statements and financial highlights are the responsibility of the Funds’ management. Our responsibility is to express an opinion on these financial statements and financial highlights based on our audits. We are a public accounting firm registered with the Public Company Accounting Oversight Board (United States) (“PCAOB”) and are required to be independent with respect to the Funds in accordance with the U.S. federal securities laws and the applicable rules and regulations of the Securities and Exchange Commission and the PCAOB.
We conducted our audits in accordance with the standards of the PCAOB. Those standards require that we plan and perform the audits to obtain reasonable assurance about whether the financial statements and financial highlights are free of material misstatement, whether due to error or fraud. The Funds are not required to have, nor were we engaged to perform, an audit of their internal control over financial reporting. As part of our audits, we are required to obtain an understanding of internal control over financial reporting but not for the purpose of expressing an opinion on the effectiveness of the Funds’ internal control over financial reporting. Accordingly, we express no such opinion.
Our audits included performing procedures to assess the risks of material misstatement of the financial statements and financial highlights, whether due to error or fraud, and performing procedures that respond to those risks. Such procedures included examining, on a test basis, evidence regarding the amounts and disclosures in the financial statements and financial highlights. Our audits also included evaluating the accounting principles used and significant estimates made by management, as well as evaluating the overall presentation of the financial statements and financial highlights. Our procedures included confirmation of securities owned as of November 30, 2021 by correspondence with the custodian. We believe that our audits provide a reasonable basis for our opinion.
/s/WithumSmith+Brown, PC
We have served as the auditor of one or more series of the Trust since 2019.
Boston, Massachusetts
January 28, 2022
| 38 |

Expense Examples | Global Beta ETF Trust |
For the Period Ended November 30, 2021 (Unaudited)
As a shareholder of the Smart Income ETF, Low Beta ETF and/or Rising Stars ETF, you incur two types of costs: (1) transaction costs, including brokerage commissions on purchases and sales of Fund shares, and (2) ongoing costs, including management fees and other Fund expenses. This Example is intended to help you understand your ongoing costs (in dollars)(excluding transaction costs) of investing in the Fund and to compare these costs with the ongoing costs of investing in other funds. The example is based on an investment of $1,000 invested at the beginning of the period and held for the entire six-month period (June 1, 2021 – November 30, 2021).
Actual Expenses
The first line of the table below provides information about actual account values based on actual returns and actual expenses. You may use the information in this line, together with the amount you invested, to estimate the expenses that you paid over the period. Simply divide your account value by $1,000 (for example, an $8,600 account value divided by $1,000 = 8.6), then, multiply the result by the number in the first line under the heading entitled “Expenses Paid During the Period’’ to estimate the expenses you paid on your account during this period.
Hypothetical Example For Comparison Purposes
The second line of the table provides information about hypothetical account values based on a hypothetical return and hypothetical expenses based on the Funds’ actual expense ratio and an assumed rate of return of 5% per year before expenses, which is not the Funds’ actual return. The hypothetical account values and expenses may not be used to estimate the actual ending account balance or expenses you paid for the period. You may use this information to compare the ongoing costs of investing in the Funds and other funds. To do so, compare this 5% hypothetical example with the 5% hypothetical examples that appear in the shareholder reports of the other funds. Please note that the expenses shown in the table are meant to highlight your ongoing costs only and do not reflect any transactional costs, such as brokerage commissions paid on purchases and sales of Fund shares. Therefore, the second line of the table is useful in comparing ongoing costs only and will not help you determine the relative total costs of owning different funds. If these transactional costs were included, your costs would have been higher.
Global Beta Smart Income ETF
| Beginning | Ending | Expenses Paid |
Actual | $1,000.00 | $ 958.10 | $1.42 |
Hypothetical (5% annual return before expenses) | $1,000.00 | $ 1,023.61 | $1.47 |
Global Beta Low Beta ETF
| Beginning | Ending | Expenses Paid |
Actual | $1,000.00 | $ 1,018.20 | $1.47 |
Hypothetical (5% annual return before expenses) | $1,000.00 | $ 1,023.61 | $1.47 |
Global Beta Rising Stars ETF
| Beginning | Ending | Expenses Paid |
Actual | $1,000.00 | $ 975.40 | $1.44 |
Hypothetical (5% annual return before expenses) | $1,000.00 | $ 1,023.61 | $1.47 |
* | The dollar amounts shown as expenses paid during the period are equal to the annualized expense ratio, 0.29%, multiplied by the number of days in the six-month period, 183 days, and divided by the number of days in the most recent twelve-month period, 365 |
| 39 |

Approval of Advisory Agreement and | Global Beta ETF Trust |
At the November 2, 2021 meeting (the “Meeting”) of the Board of Trustees (the “Board”) of Global Beta ETF Trust (the “Trust”), the Board, including those Trustees (the “Independent Trustees”) who are not “interested persons” (as that term is defined in the Investment Company Act of 1940 (the “1940 Act”)) of the Trust, approved (i) the continuation of the investment advisory agreement (the “Advisory Agreement”) between Global Beta Advisors LLC (the “Adviser”) and the Trust, on behalf of the Global Beta Low Beta ETF, Global Beta Rising Stars ETF, and Global Beta Smart Income ETF (each a “Fund” and collectively the “Funds”). Under the Advisory Agreement, the Adviser is obligated to pay all of the ordinary operating expenses of each Fund, except for certain excluded items (the “Unified Fee”).
In considering approval of the continuation of the Advisory Agreement, the Independent Trustees met in executive session with independent counsel, who provided assistance and advice. The Board, including the Independent Trustees, evaluated the terms of the Advisory Agreement, reviewed the information provided by the Adviser in connection with the consideration of approving the continuation of the Advisory Agreement, and reviewed the duties and responsibilities of the Trustees in evaluating and approving the Advisory Agreement.
In considering the approval of the continuation of the Advisory Agreement, the Board, including the Independent Trustees, reviewed the materials provided for the Meeting by the Adviser, including: (i) copies of the Advisory Agreement; (ii) information describing the nature, extent and quality of the services that the Adviser provides and expects to provide to each Fund, and the fees that the Adviser charges for such services; (iii) information concerning the financial condition, businesses, operations and compliance programs of the Adviser; (iv) a copy of the current Form ADV for the Adviser; and (v) a memorandum on the responsibilities of trustees in considering investment advisory arrangements under the 1940 Act. The Board also reviewed and considered information provided by the Adviser throughout the year at prior Board meetings.
In addition, the Board considered data compiled by the Adviser from an unaffiliated third party database comparing the Unified Fee of each Fund with the net expense ratios (i.e., after fee waivers and reimbursements) of other U.S.-listed ETFs having similar investment objectives and strategies (each a “Peer Group”). The Board discussed the criteria used by the Adviser for selecting the Peer Group. The Board, including the Independent Trustees, concluded that the data was useful for the purpose of reviewing the Advisory Agreement.
During its review of this information, the Board, including the Independent Trustees, focused on and analyzed the factors that it deemed relevant. In particular, the Board considered and reviewed the following with respect to each Fund:
(a) The nature, extent and quality of services provided and to be provided to each Fund by the Adviser; Personnel and operations of the Adviser; Possible conflicts of interest. The Board reviewed the services that the Adviser provides and expects to provide to each Fund. In connection with the advisory services provided and to be provided to each Fund, the Board noted the Adviser’s responsibilities as each Fund’s investment adviser, including: overall supervisory responsibility for the general management and investment of each Fund’s securities portfolio; responsibility for daily monitoring of tracking error and quarterly reporting to the Board; responsibility for general oversight of compliance by each Fund with relevant law and compliance policies and procedures; and implementation of Board directives as they relate to each Fund.
The Board also noted additional responsibilities that the Adviser has as part of the day-to-day management of the Funds, including: implementation of the investment management program of the Funds; management of the day-to-day investment and reinvestment of the assets of the Funds; determining daily baskets of deposit securities and cash components; executing portfolio security trades for purchases and redemptions of Fund shares conducted on a cash-in-lieu basis, as well as during index rebalances and reconstitutions; and oversight of general Fund portfolio compliance with relevant law and the Trust’s compliance policies and procedures.
The Board considered the experience and background of the personnel dedicated by the Adviser to the management of the Funds, and the Adviser’s procedures to manage potential conflicts of interest. Based on its consideration and review of the foregoing information, the Board concluded that each Fund was likely to benefit from the nature, extent and quality of these services, as well as the Adviser’s ability to render such services based on its experience, personnel, operations and resources.
(b) Comparison of services provided and fees charged by the Adviser and other investment advisers to similar clients, and the cost of the services provided. The Board compared both the services rendered and the fees paid pursuant to the Advisory Agreement for the Funds to the contractual advisory fees of other registered investment advisers providing services similar ETFs in each Fund’s Peer Group. In particular, the Board compared each Fund’s Unified Fee to the net expense ratios of the other ETFs in the Peer Group.
The Board considered the appropriateness of the Unified Fee of each Fund compared to the net expense ratios of the ETFs in the Peer Group. The Board noted that the Unified Fee of each of the Funds was below the maximum and average net expense ratio of the other ETFs in the respective Peer Group.
| 40 |

Approval of Advisory Agreement and Board Considerations (Unaudited) (Continued) | Global Beta ETF Trust |
The Board received information regarding the costs and the profitability of the Adviser in connection with serving as adviser to the Funds. The Board noted the Adviser’s assumption of the contractual obligation to limit each Fund’s ordinary operating expenses through the Unified Fee, which cannot be changed without shareholder approval. The Board also considered the Adviser’s representation that it would continue to monitor the Funds’ expense ratios as compared to those of their peer groups and seek to ensure that the Funds remain competitive.
After (i) comparing each Fund’s Unified Fee with the net expense ratios of the other ETFs in the Peer Group, (ii) the nature, extent and quality of services provided and to be provided by the Adviser and the costs incurred by the Adviser in rendering those services, and (iii) the Adviser absorbing each Fund’s ordinary operating expenses under the Unified Fee, the Board concluded that the fees paid to the Adviser with respect to the Funds were fair and reasonable.
(c) The Adviser’s profitability and the extent to which economies of scale were realized as each Fund grew and whether fee levels reflect such economies of scale; “Fall-out” benefits. The Board discussed with the representatives from the Adviser regarding the Adviser’s profitability with respect to the Funds. The Board acknowledged the Adviser’s contractual obligation to limit each Fund’s expenses through the Unified Fee, and the effect of such obligation on the Adviser’s profitability based on information presented to the Board.
The Board reviewed and considered the extent to which the Adviser may realize economies of scale, if any, as each Fund grows larger and whether each Fund’s management fee structure reflects any economies of scale for the benefit of shareholders. The Board considered fall-out benefits received and to be received by the Adviser from its relationship with the Funds and the Trust. The Board noted that none of the other service providers to each Fund or the Trust were affiliates of the Adviser. The Board also noted the Adviser’s potential positive reputational benefits from the success of each Fund.
(d) Investment performance of the Adviser. The Board discussed with the representatives from the Adviser the performance of the Funds, including tracking difference with respect to each Fund’s underlying index. In particular, the Board considered the investment performance of the Funds relative to their stated objectives and the success of the Adviser in reaching such objectives. The Board also considered each Fund’s investment performance compared to: (i) its corresponding underlying index that it seeks to track, and (ii) the secondary benchmark index that each Fund uses for comparison purposes, if any. In addition, consideration was given to tracking difference data provided to the Board for the Meeting and throughout the year by the Adviser. The Board also considered each Fund’s investment performance compared to the Fund’s respective Peer Group.
The Board considered that each of the Global Beta Smart Income ETF and the Global Beta Low Beta ETF slightly underperformed its respective underlying index for the 1-year period ended August 31, 2021 and that the Global Beta Rising Stars ETF more significantly underperformed its underlying index for the 1-year periods ended August 31, 2021. The Board discussed with the Adviser the reasons for the relative performance compared to each Fund’s respective underlying index, noting that the Global Beta Smart Income ETF and the Global Beta Low Beta ETF slightly underperformed their respective underlying index as expected due to management fees accrued by each Fund, while the Global Beta Rising Stars ETF more significantly underperformed its underlying index in part due to management fees accrued, but also due to a change in the Fund’s underlying index. The Board also considered the Adviser’s statements that each of the Global Beta Low Beta ETF and the Global Beta Smart Income ETF performed close to the average of its Peer Group for the 1-year period ended August 31, 2021 and the Global Beta Rising Stars ETF underperformed its Peer Group for the 1-year periods ended August 31, 2021. The Board discussed with the Adviser the reasons for the relative performance compared to each Fund’s respective Peer Group. The Board received and considered information about the premium/discount history of the Funds, which illustrated the number of times that the market price of the Funds trading on the secondary market closed above or below the net asset value (“NAV”) of the Funds, and by how much, measured in basis points. The Board concluded that the performance of the Funds, including the tracking difference, was reasonable in light of the respective investment objectives and policies of the Funds.
Conclusion. No single factor was determinative to the decision of the Board. Based on the foregoing and such other matters as were deemed relevant, the Board, including the Independent Trustees, concluded that the Unified Fees were reasonable in relation to the services provided and to be provided by the Adviser to each Fund, as well as the costs incurred and benefits gained by the Adviser in providing such services. The Board also found the advisory fees to be reasonable in comparison to the fees charged by advisers to other comparable ETFs of similar size. As a result, the Board, including the Independent Trustees, determined that the approval of the continuation of the Advisory Agreement on behalf of each Fund would be in the best interest of each Fund and its shareholders.
| 41 |

Trustees and Officers (Unaudited) | Global Beta ETF Trust |
The business and affairs of the Trust are managed by its officers under the oversight of its Board. The Board sets broad policies for the Trust and may appoint Trust officers. The Board oversees the performance of the Adviser and the Trust’s other service providers.
Two Trustees are owners and officers of the Adviser. The other Trustees are Independent Trustees. The fund complex includes all funds advised by the Adviser (“Fund Complex”).
The Trustees, their year of birth, term of office and length of time served, their principal business occupations during the past five years, the number of portfolios in the Fund Complex overseen and other directorships, if any, held by each Trustee, are shown below. The officers, their year of birth, term of office and length of time served and their principal business occupations during the past five years, are shown below. Unless noted otherwise, the address of each Trustee and each officer is: c/o Global Beta ETF Trust,1364 Welsh Road, Suite C120, North Wales, PA 19454.
Name, Address*, | Position(s) | Term of Office** and Length of Time Served | Principal Occupation(s) | Number of | Other Directorships |
Independent Trustees | |||||
Peter Burchfield Year of Birth: 1957 | Trustee | Since 2019 | Client Service Marketing Director, Henry James International (investment advisory firm) (2017 to present); Client Service Marketing Director, Navellier and Associates (investment advisory firm) (2002 to 2017) | 3 | None |
Richard Haverstick Year of Birth: 1952 | Trustee | Since 2019 | Trustee, BMT Investment Fund (registered investment company) (2017 to present); Trustee, Brandywine Realty Trust (commercial real estate) (2016 to present); Trustee, Actua Corporation (cloud technology) (2016 to 2018); Consultant, Haverstick Consulting (2015 to 2016) | 3 | BMT Investment Fund (2017 to present); Thomas Jefferson University (2013 to present); Jefferson Health (2013 to present); Brandywine Realty Trust (2016 to present) |
David Downes*** Year of Birth: 1940 | Trustee | Since 2019 | Director, Egan-Jones Ratings Company (rating agency) (June 2019 to February 2020); Treasurer, Quaker Investment Trust (registered investment company) (2018 to December 2020); Independent Director, TLC Credit, Inc. (closed-end investment company) (2009 to 2017); Trustee, Community Capital Management, (investment management company) (2006 to present); President, The Community Reinvestment Act Qualified Investment Fund (investment management company) (2004 to December 2020); Trustee, OppenheimerFunds, Inc. (registered investment company) (2005 to 2015); Trustee, GSK Employment Benefit Trust (defined benefits/defined contribution employee trust) (2006 to 2014) | 3 | Community Capital Management (2006 to December 2020); CRA Funds Advisor (2006 to December 2020); TLC Credit, Inc. (2009 to 2017) |
| 42 |

Trustees and Officers (Unaudited) (Continued) | Global Beta ETF Trust |
Name, Address*, | Position(s) | Term of Office** and Length of Time Served | Principal Occupation(s) | Number of | Other Directorships |
Interested Trustee**** | |||||
Vincent T. Lowry Year of Birth: 1951 | Chairman of the Board of Trustees and President | Since 2019 | Chief Executive Officer, Global Beta Advisors LLC (2016 to present); Lead Portfolio Manager, OppenheimerFunds, Inc. (2015 to 2017); Chief Executive Officer, VTL Associates, LLC (registered investment advisor) (2004 to 2015), Board of Directors, Datasea, Inc. (DTSS) (2020 to 2021) | 3 | None |
Justin Lowry Year of Birth: 1987 | Trustee | Since 2019 | President and Chief Investment Officer, Global Beta Advisors LLC (2017 to present); Director of Research, OppenheimerFunds, Inc. (2015 to 2017); Portfolio Manager and Head of Research, VTL Associates, LLC (2010 to 2015) | 3 | None |
* | Each Independent Trustee may be contacted by writing to the Independent Trustees of Global Beta ETF Trust, 1364 Welsh Road, Suite C120, North Wales, PA 19454. |
** | Each Trustee serves until his successor is duly elected or appointed and qualified. |
*** | Mr. Downes’s FINRA Series 7, 24 and 29 licenses are held by Foreside Fund Services, LLC, an affiliate of the Distributor. |
**** | Vincent T. Lowry and Justin Lowry are considered to be interested persons of the Trust because of their relationship with the Adviser. |
| 43 |

Trustees and Officers (Unaudited) (Continued) | Global Beta ETF Trust |
Name, Address, | Position(s) | Term of Office* | Principal Occupation(s) During Past 5 Years |
Officers
The officers of the Trust not named above are: | |||
Joshua Hunter Year of Birth: 1981 | Treasurer and Principal Financial Officer | Since 2019 | Director, Fund Principal Financial Officer, Foreside Fund Officer Services, LLC (2015-present); Vice President/ Assistant Vice President, Treasury Services, JPMorgan Chase & Co. (2008-2015). |
Jim Nash Year of Birth: 1981 | Chief Compliance Officer | Since 2019 | Managing Director, Lead Fund Chief Compliance Officer, Foreside Fund Officer Services, LLC (2016 to present); Senior Associate, Regulatory Administration Advisor, JPMorgan Chase & Co. (2014 to 2016). |
Carolyn Wharton Year of Birth: 1984 | Secretary | Since 2019 | Consultant-Marketing, Global Beta Advisors (January 2019 to present); Director of Marketing, OppenheimerFunds, Inc. (2015 to 2017); Director of Marketing and Supervising Principal, RevenueShares and VTL Associates LLC (2012 to 2015) |
* | Each officer serves until his successor is duly elected or appointed and qualified. |
| 44 |

Funds’ Liquidity Risk Management | Global Beta ETF Trust |
Pursuant to Rule 22e-4 (the “Liquidity Rule”) under the Investment Company Act of 1940, as amended (“1940 Act”), the Funds have adopted and implemented a Liquidity Risk Management Program (the “Program”). The Program addresses the Liquidity Rule’s requirements for the assessment, management and periodic review of Fund liquidity risk and compliance with the Liquidity Rule’s restrictions on investments in illiquid investments. The Global Beta Liquidity Risk Management Program Administrator (“Administrator”) has been designated to administer the Program. The Administrator consists of certain Trust officers and representatives from Global Beta Advisors, LLC, the Funds’ investment adviser.
At its November 2, 2021 meeting, the Board of Trustees (“Board”) reviewed a written report (the “Report”) prepared by the Administrator addressing the operation of the Program and assessing its adequacy and effectiveness of implementation, as required under the Liquidity Rule, for the period from September 1, 2020 through August 31, 2021 (the “Reporting Period”). Among other things, the Report summarized the Administrator’s annual liquidity risk assessment, classification of the Funds’ portfolio investments and monitoring for compliance with the Liquidity Rule’s restrictions on investments in illiquid investments. Further, the Report noted that, in accordance with the Program, and the requirements of the Liquidity Rule, the review of each Fund’s liquidity risk included consideration of the following key factors as applicable: the Funds’ investment strategies and liquidity of portfolio investments during both normal and reasonably foreseeable stressed conditions; short-term and long-term cash flow projections during both normal and reasonably foreseeable stressed conditions; holdings of cash and cash equivalents as well as borrowing arrangements and other funding sources; the relationship between each Fund’s portfolio liquidity and the way in which, and the price and spreads at which, each Fund’s shares trade, including the efficiency of the arbitrage function and the level of active participation by market participants (including authorized participants); and the effect of the composition of baskets on the overall liquidity of each Fund’s portfolio.
The Report concluded that, during the Reporting Period: (1) there were no material changes to the Program; (2) there were no significant liquidity events impacting any Fund; and (3) that it is the Administrator’s assessment that the Program is adequately designed and has been effective in managing each Fund’s liquidity risk and in implementing the requirements of the Liquidity Rule.
| 45 |

Additional Information (Unaudited) | Global Beta ETF Trust |
FREQUENCY DISTRIBUTION OF PREMIUMS AND DISCOUNTS
Information regarding how often shares of each Fund traded on the Exchange at a price above (i.e., at a premium) or below (i.e., at a discount) the NAV of the Fund is available on the Fund’s website at www.globalbetaetf.com.
HOUSEHOLDING
Householding is an option available to certain fund investors. Householding is a method of delivery, based on the preference of the individual investor, in which a single copy of certain shareholder documents can be delivered to investors who share the same address, even if their accounts are registered under different names. Please contact your broker-dealer if you are interested in enrolling in householding and receiving a single copy of prospectuses and other shareholder documents, or if you are currently enrolled in householding and wish to change your householding status.
DISCLOSURE OF PORTFOLIO HOLDINGS
Global Beta ETF Trust files its complete schedule of portfolio holdings with the Securities and Exchange Commission (“SEC”) for the first and third quarters of each fiscal year to date on Form N-PORT which are available on the SEC’s website at www.sec.gov. Form N-PORT may also be reviewed and copied at the SEC’s Public Reference Room in Washington, D.C. Information about the Public Reference Room may be obtained by calling 1-800-SEC-0330. In addition, the Funds full portfolio holdings are updated daily and available on the Global Beta ETFs website at www.globalbetaetf.com.
PROXY VOTING POLICIES AND PROCEDURES
A description of the policies and procedures the Funds use to determine how to vote proxies relating to portfolio securities is provided in the Statement of Additional Information (“SAI”). The SAI is available without charge upon request by calling toll-free at (833) 933-2083, by accessing the SEC’s website at http://www.sec.gov, or by accessing the Funds’ website at www.globalbetaetf.com. Information on how the Fund voted proxies relating to portfolio securities during the period ended November 30 is available without charge, upon request, by calling (833) 933-2083 or by accessing the website of the SEC.
FEDERAL TAX INFORMATION
For the fiscal year ended November 30, 2021, certain dividends paid by the Funds may be subject to a maximum tax rate of 23.8%, as provided for by the Tax Cuts and Jobs Act of 2017. The percentage of dividends declared from ordinary income designated as qualified dividend income was as follows:
Global Beta Smart Income ETF | 99.36 | % | ||
Global Beta Low Beta ETF | 90.63 | % | ||
Global Beta Rising Stars ETF | 100.00 | % |
For corporate shareholders, the percent of ordinary income distributions qualifying for the corporate dividends received deduction for the fiscal year ended November 30, 2021 was as follows:
Global Beta Smart Income ETF | 98.74 | % | ||
Global Beta Low Beta ETF | 90.45 | % | ||
Global Beta Rising Stars ETF | 100.00 | % |
The percentage of taxable ordinary income distributions that are designated as short-term capital gain distributions under Internal Revenue Section 871(k)(2)(C) for each Fund was as follows:
Global Beta Low Beta ETF | 1.91 | % |
| 46 |

This page intentionally left blank
This page intentionally left blank
This page intentionally left blank

Fund | Symbol | CUSIP |
Global Beta Smart Income ETF | GBDV | 37959X100 |
Global Beta Low Beta ETF | GBLO | 37959X209 |
Global Beta Rising Stars ETF | GBGR | 37959X308 |
This report is intended for the shareholders of the Fund and may not be used as sales literature unless preceded or accompanied by a current prospectus.
Adviser Global Beta Advisors LLC 1364 Welsh Road, Suite C120, North Wales, PA 19454 | Distributor Compass Distributors, LLC Three Canal Plaza, 3rd Floor Portland, ME 04101 | Transfer Agent U.S. Bancorp Fund Services, LLC 615 East Michigan Street Milwaukee, WI 53202 |
Custodian U.S. Bank, N.A. Custody Operations 1555 N. River Center Drive, Suite 302 Milwaukee, WI 53212 | Independent Registered Public Accounting Firm WithumSmith+Brown PC 155 Seaport Boulevard, 3rd Floor Boston, MA 02210 | Legal Counsel Stradley Ronon Stevens & Young, LLP 2005 Market Street, Suite 2600 Philadelphia, PA 19103-7018 |
(b) Include a copy of each notice transmitted to stockholders in reliance on Rule 30e-3 under the Act (17 CFR 270.30e-3) that contains disclosures specified by paragraph (c)(3) of that rule.
Not applicable.
Item 2. Code of Ethics.
The registrant has adopted a code of ethics that applies to the registrant’s principal executive officer and principal financial officer. The registrant has not made any substantive amendments to its code of ethics during the period covered by this report. The registrant has not granted any waivers from any provisions of the code of ethics during the period covered by this report.
The registrant undertakes to provide to any person without charge, upon request, a copy of its Code of Ethics by mail when they call the registrant at 1-833-933-2083.
Item 3. Audit Committee Financial Expert.
The registrant’s board of trustees has determined that there is at least one audit committee financial expert serving on its audit committee. Messrs. Richard Haverstick and David Downes are each an “audit committee financial expert” and are considered to be “independent” as each term is defined in Item 3 of Form N-CSR.
Item 4. Principal Accountant Fees and Services.
The registrant has engaged its principal accountant to perform audit services, audit-related services, tax services and other services during the past two fiscal years. “Audit services” refer to performing an audit of the registrant's annual financial statements or services that are normally provided by the accountant in connection with statutory and regulatory filings or engagements for those fiscal years. “Audit-related services” refer to the assurance and related services by the principal accountant that are reasonably related to the performance of the audit. “Tax services” refer to professional services rendered by the principal accountant for tax compliance, tax advice, and tax planning. The following table details the aggregate fees billed or expected to be billed for each of the last two fiscal years for audit fees, audit-related fees, tax fees and other fees by the principal accountant.
| FYE 11/30/2021 | FYE 11/30/2020 | |
| (a) Audit Fees | $64,890 | $61,800 |
| (b) Audit-Related Fees | $0 | $0 |
| (c) Tax Fees | $11,433 | $10,815 |
| (d) All Other Fees | $0 | $0 |
(e)(1) The audit committee has adopted pre-approval policies and procedures that require the audit committee to pre-approve all audit and non-audit services of the registrant, including services provided to any entity affiliated with the registrant.
(e)(2) The percentage of fees billed by WithumSmith+Brown PC applicable to non-audit services pursuant to waiver of pre-approval requirement were as follows:
| FYE 11/30/2021 | FYE 11/30/2020 | |
| Audit-Related Fees | 0% | 0% |
| Tax Fees | 0% | 0% |
| All Other Fees | 0% | 0% |
(f) All of the principal accountant’s hours spent on auditing the registrant’s financial statements were attributed to work performed by full-time permanent employees of the principal accountant. (If more than 50 percent of the accountant’s hours were spent to audit the registrant's financial statements for the most recent fiscal year, state how many hours were attributed to work performed by persons other than the principal accountant's full-time, permanent employees.)
(g) The following table indicates the non-audit fees billed or expected to be billed by the registrant’s accountant for services to the registrant and to the registrant’s investment adviser (and any other controlling entity, etc.—not sub-adviser) for the last two years.
| Non-Audit Related Fees | FYE 11/30/2021 | FYE 11/30/2020 |
| Registrant | $11,433 | $10,815 |
| Registrant’s Investment Adviser | None | None |
(h) The audit committee of the board of trustees/directors has considered whether the provision of non-audit services that were rendered to the registrant's investment adviser is compatible with maintaining the principal accountant's independence and has concluded that the provision of such non-audit services by the accountant has not compromised the accountant’s independence.
(i) Not applicable.
(j) Not applicable.
Item 5. Audit Committee of Listed Registrants.
The registrant is an issuer as defined in Rule 10A-3 under the Securities Exchange Act of 1934, (the “Act”) and has a separately-designated standing audit committee established in accordance with Section 3(a)(58)(A) of the Act. The independent members of the committee are as follows: Richard Haverstick, David Downes and Peter Burchfield.
Item 6. Investments.
(a) Schedule of Investments is included as part of the report to shareholders filed under Item 1 of this Form.
(b) Not applicable.
Item 7. Disclosure of Proxy Voting Policies and Procedures for Closed-End Management Investment Companies.
Not applicable to open-end investment companies.
Item 8. Portfolio Managers of Closed-End Management Investment Companies.
Not applicable to open-end investment companies.
Item 9. Purchases of Equity Securities by Closed-End Management Investment Company and Affiliated Purchasers.
Not applicable to open-end investment companies.
Item 10. Submission of Matters to a Vote of Security Holders.
There have been no material changes to the procedures by which shareholders may recommend nominees to the registrant’s board of trustees.
Item 11. Controls and Procedures.
| (a) | The Registrant’s President/Principal Executive Officer and Treasurer/Principal Financial Officer have reviewed the Registrant's disclosure controls and procedures (as defined in Rule 30a-3(c) under the Investment Company Act of 1940 (the “Act”)) as of a date within 90 days of the filing of this report, as required by Rule 30a-3(b) under the Act and Rules 13a- 15(b) or 15d-15(b) under the Securities Exchange Act of 1934. Based on their review, such officers have concluded that the disclosure controls and procedures are effective in ensuring that information required to be disclosed in this report is appropriately recorded, processed, summarized and reported and made known to them by others within the Registrant and by the Registrant’s service provider. |
| (b) | There were no changes in the Registrant's internal control over financial reporting (as defined in Rule 30a-3(d) under the Act) that occurred during the period covered by this report that have materially affected, or is reasonably likely to materially affect, the Registrant's internal control over financial reporting. |
Item 12. Disclosure of Securities Lending Activities for Closed-End Management Investment Companies
Not applicable to open-end investment companies.
Item 13. Exhibits.
(2) A separate certification for each principal executive and principal financial officer pursuant to Section 302 of the Sarbanes-Oxley Act of 2002. Filed herewith.
(3) Any written solicitation to purchase securities under Rule 23c-1 under the Act sent or given during the period covered by the report by or on behalf of the registrant to 10 or more persons. Not applicable to open-end investment companies.
(4) Change in the registrant’s independent public accountant. There was no change in the registrant’s independent public accountant for the period covered by this report.
| (b) | Certifications pursuant to Section 906 of the Sarbanes-Oxley Act of 2002. Furnished herewith. |
SIGNATURES
Pursuant to the requirements of the Securities Exchange Act of 1934 and the Investment Company Act of 1940, the registrant has duly caused this report to be signed on its behalf by the undersigned, thereunto duly authorized.
| (Registrant) | Global Beta ETF Trust | |
| By: | /s/ Vince Lowry | |
| Vince Lowry, President/Principal Executive Officer | ||
| Date | 02/01/22 |
Pursuant to the requirements of the Securities Exchange Act of 1934 and the Investment Company Act of 1940, this report has been signed below by the following persons on behalf of the registrant and in the capacities and on the dates indicated.
| By: | /s/ Vince Lowry | |
| Vince Lowry, President/Principal Executive Officer | ||
| Date | 02/01/22 | |
| By: | /s/ Josh Hunter | |
| Josh Hunter, Principal Financial Officer | ||
| Date | 02/01/22 |