UNITED STATES
SECURITIES AND EXCHANGE COMMISSION
Washington, D.C. 20549
FORM N-CSR
Certified Shareholder Report of
Registered Management Investment Companies
Investment Company Act File Number: 811-23469
Capital Group U.S. Equity Fund
(Exact Name of Registrant as Specified in Charter)
6455 Irvine Center Drive
Irvine, California 92618
(Address of Principal Executive Offices)
Registrant's telephone number, including area code: (949) 975-5000
Date of fiscal year end: October 31
Date of reporting period: October 31, 2020
Gregory F. Niland
Capital Group U.S. Equity Fund
5300 Robin Hood Road
Norfolk, Virginia 23513
(Name and Address of Agent for Service)
ITEM 1 – Reports to Stockholders
 | Capital Group U.S. Equity FundSM Annual report
for the year ended
October 31, 2020 |

A U.S.-focused approach
to seeking prudent growth
and preserving wealth
Capital Group U.S. Equity Fund seeks to provide prudent growth of capital and conservation of principal.
This fund is one of more than 40 offered by Capital Group, home of American Funds, one of the nation’s largest mutual fund families. For nearly 90 years, Capital Group has invested with a long-term focus based on thorough research and attention to risk.
Fund results shown in this report are at net asset value. Results are for past periods and are not predictive of results for future periods. Current and future results may be lower or higher than those shown. Prices and returns will vary, so investors may lose money. Investing for short periods makes losses more likely. For current and month-end results, visit capitalgroup.com/pcs.
Here are the total returns on a $1,000 investment with all distributions reinvested for periods ended September 30, 2020 (the most recent calendar quarter-end), and the total annual fund operating expense ratios as of the prospectus dated January 1, 2021 (unaudited):
| | | Cumulative
total returns | | Average annual
total returns | | Gross | | Net |
| | | 1 year | | 5 years | | Lifetime* | | expense ratio | | expense ratio |
| | | | | | | | | | | |
| Capital Group U.S. Equity Fund | | 15.47% | | 14.10% | | 11.27% | | 0.45% | | 0.42% |
| * | Since April 1, 2011. The fund is newly organized for the purpose of effecting the reorganization of Capital Group U.S. Equity Fund (the “predecessor fund”) into a new Delaware statutory trust. The fund acquired the assets and assumed the liabilities of the predecessor fund on November 8, 2019, and the predecessor fund is the accounting and performance survivor of the reorganization. This means that the predecessor fund’s performance and financial history have been adopted by the fund and will be used going forward from the date of reorganization. Except where the context indicates otherwise, all references herein to the “fund” include the predecessor fund prior to November 8, 2019. In connection with the reorganization, former shareholders of the predecessor fund received shares of the fund. The performance of the fund includes the performance of the predecessor fund prior to the reorganization. The inception date shown in the table for the fund is that of the predecessor fund. |
The investment adviser is currently reimbursing a portion of other expenses so that total expenses do not exceed the fund’s unified fee. This reimbursement will be in effect through at least January 1, 2022. The adviser may elect at its discretion to extend, modify or terminate the reimbursement at that time. Visit capitalgroup.com/pcs for more information.
Investments are not FDIC-insured, nor are they deposits of or guaranteed by a bank or any other entity, so they may lose value.
Contents
Fellow investors:
U.S. equities advanced solidly in the 12 months ended October 31, 2020, despite a turbulent year dominated by the coronavirus outbreak and presidential election. Stocks fell into a bear market early in 2020 as the COVID-19 pandemic spread globally. However, better-than-expected economic data in subsequent months helped the stock market bounce back to a new high at its fastest-ever pace. Significant economic and medical questions remain, but optimism over the pace of vaccine development, coupled with emerging clarity in the U.S. political scene, helped to underpin the market as the fund year drew to a close.
Markets and economy
The period began strongly, with solid job growth and low unemployment pacing the record-long economic expansion and lengthy bull run. The COVID-19 pandemic abruptly brought those to a close. Initially, outbreaks in China disrupted supply chains, but the spread of the virus steadily weighed on economies around the world. In the U.S., businesses shuttered and companies limited person-to-person contact, resulting in a spike in unemployment and a drop in consumer activity. Major U.S. market indexes plunged, with the S&P 500 falling more than 30% from its mid-February high to late-March low — the fastest bull-to-bear transition on record.
The U.S. government quickly moved to support the economy. The Federal Reserve reduced interest rates to near zero and initiated sweeping stimulus efforts. Washington pledged more than $2 trillion in aid in the CARES Act, which included a temporary boost to unemployment support for workers. Major U.S. indexes largely recouped their losses by the end of June, and all posted gains for the period. The conclusion of the U.S. presidential election, which came shortly after the fund year closed, also removed some of the uncertainty that had hung over financial markets.
Capital Group U.S. Equity Fund portfolio
The Capital Group U.S. Equity Fund rose 8.51% for the period. That trailed its benchmark, the S&P 500 Composite Index,* which gained 9.71%. The differential underscored the fund’s risk-sensitive approach. It focuses on high-quality companies with strong balance sheets and reasonable valuations and seeks to
Results at a glance
For periods ended October 31, 2020, with all distributions reinvested
| | | Cumulative
total returns | | Average annual
total returns |
| | | 1 year | | 5 years | | Lifetime1 |
| | | | | | | |
| Capital Group U.S. Equity Fund2 | | | 8.51 | % | | | 11.53 | % | | | 10.66 | % |
| Standard & Poor’s 500 Composite Index3 | | | 9.71 | | | | 11.71 | | | | 12.12 | |
| Lipper Growth & Income Funds Average4 | | | 3.49 | | | | 7.12 | | | | 7.88 | |
| 1 | Since April 1, 2011. |
| 2 | The fund is newly organized for the purpose of effecting the reorganization of Capital Group U.S. Equity Fund (the “predecessor fund”) into a new Delaware statutory trust. The fund acquired the assets and assumed the liabilities of the predecessor fund on November 8, 2019, and the predecessor fund is the accounting and performance survivor of the reorganization. This means that the predecessor fund’s performance and financial history have been adopted by the fund and will be used going forward from the date of reorganization. Except where the context indicates otherwise, all references herein to the “fund” include the predecessor fund prior to November 8, 2019. In connection with the reorganization, former shareholders of the predecessor fund received shares of the fund. The performance of the fund includes the performance of the predecessor fund prior to the reorganization. The inception date shown in the table for the fund is that of the predecessor fund. |
| 3 | S&P source: S&P Dow Jones Indices LLC. The market index is unmanaged and, therefore, has no expenses. Investors cannot invest directly in an index. |
| 4 | Lipper source: Refinitiv Lipper. Lipper averages reflect the current composition of all eligible mutual funds (all share classes) within a given category. Lipper categories are dynamic and averages may have few funds, especially over longer periods. To see the number of funds included in the Lipper category for each fund’s lifetime, please see the Quarterly Statistical Update, available on our website. |
| Capital Group U.S. Equity Fund | 1 |
help preserve wealth during volatile periods. The fund demonstrated relative resilience during the coronavirus selloff, holding up better than the index as the market weakened. Over the past three fiscal years, the fund’s 10.36% average annual return has paralleled the 10.42% notched by the index.
The fund benefited from a wide variety of holdings in real estate, health care and communication services. Among its top contributors was Seagen, formerly Seattle Genetics, a biotech firm that benefited from a series of drug approvals and a partnership with Merck. Equinix, which owns and operates data centers, enjoyed higher demand for internet access and online storage.
Relative to the index, the fund was helped greatly by limiting its exposure to several stocks that suffered notable declines. For example, underweight holdings in ExxonMobil, AT&T and Wells Fargo all helped to limit losses.
Conversely, many technology stocks enjoyed outsize share-price growth despite high valuations. The fund holds many of these companies, though in smaller proportions than the index, which caused some of them to weigh on relative results. Apple, Amazon and Microsoft fall into this category, each having gained from the extraordinary, pandemic-fueled shift to online work, play and shopping.
And, of course, some companies simply didn’t fare well in a difficult period. Aviation manufacturer Airbus declined amid a steep falloff in air travel. Similarly, insurer Chubb suffered setbacks from COVID-19, including higher-than-anticipated payouts for event cancellations.
Market outlook
The pandemic appears likely to continue influencing the near-term direction of the economy and financial markets. A spike in COVID-19 cases toward the end of the period, coupled with an uncertain prospect for another dose of fiscal stimulus, could take a toll, particularly in industries that have already been deeply impacted.
Even so, there have been several bright spots. For example, pent-up consumer demand spurred a better-than-expected rebound in retail sales. By the end of the period, manufacturing activity was growing at a faster pace than in the previous year. Beyond that, the Fed has only partially dipped into its emergency stimulus resources, and still has deep wells to draw upon if the economy were to need it. And though questions remain about potential vaccines, including how quickly an effective product could be rolled out, positive news on that front helped to buoy the market.
Throughout the year, the portfolio management team sought to focus on companies with promising long-term prospects. The pandemic appeared likely to accelerate some trends that had already been taking hold, such as the increasing digitization of daily life, popularity of e-commerce and embrace of video streaming. The investment team also sought to find opportunities among companies outside of technology, in some cases among stocks that sold off during the downturn but maintained attractive valuations and still-robust prospects.
For example, the investment team has been drawn to insurance brokers. Investors broadly retreated from the insurance industry when the pandemic hit. But several segments of the industry are compelling, especially brokers, which connect consumers and businesses to insurers and negotiate prices. The pandemic accelerated a dynamic of recent years in which insurance companies raised premiums in response to a string of natural disasters. That benefits brokers, which receive a portion of those premiums without assuming the risk of payouts.
In times like this, stability and even-handedness can be invaluable. We strive to provide both and to help investors find confidence, even amid turbulent environments.
As always, we thank you for your trust and continued investment.
Sincerely,

John S. Armour
President
December 14, 2020
| * | Standard & Poor’s 500 Composite Index is a market capitalization-weighted index based on the results of approximately 500 widely held common stocks. This index is unmanaged, and its results include reinvested dividends and/or distributions but do not reflect the effect of sales charges, commissions, account fees, expenses or U.S. federal income taxes. Investors cannot invest directly in an index. Source: S&P Dow Jones Indices LLC. |
Refer to the fund’s prospectuses and the Risk Factors section of this report for more information on risks associated with investing in the fund.
| 2 | Capital Group U.S. Equity Fund |
The value of a $10,000 investment
How a hypothetical $10,000 investment has grown
(for the period April 1, 2011, to October 31, 2020, with all distributions reinvested)
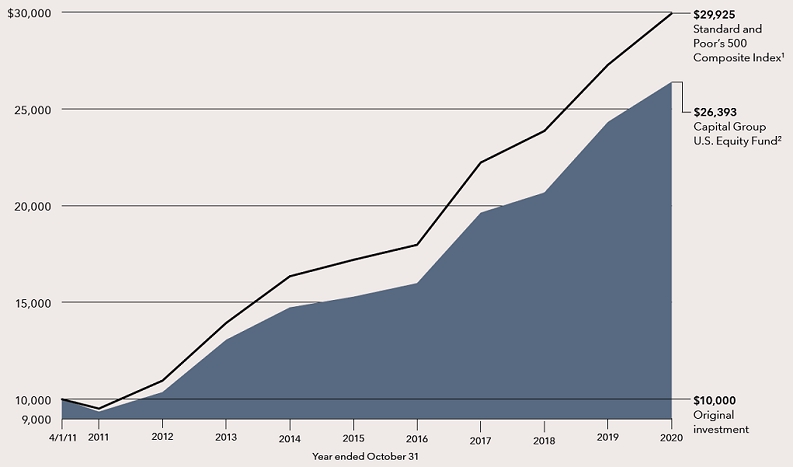
| 1 | Standard & Poor’s 500 Composite Index is a market capitalization-weighted index based on the results of approximately 500 widely held common stocks. This index is unmanaged, and its results include reinvested dividends and/or distributions but do not reflect the effect of sales charges, commissions, account fees, expenses or U.S. federal income taxes. Investors cannot invest directly in an index. Source: S&P Dow Jones Indices LLC. |
| 2 | Includes reinvested dividends and capital gain distributions. |
Results are for past periods and are not predictive of results for future periods. Current and future results may be lower or higher than those shown. The results shown are before taxes on fund distributions and sale of fund shares.
Average annual total returns based on a hypothetical $1,000 investment (for periods ended October 31, 2020)
| | | 1 year | | 5 years | | Lifetime |
| | | | | | | |
| Capital Group U.S. Equity Fund | | 8.51% | | 11.53% | | 10.66% |
Investment results assume all distributions are reinvested and reflect applicable fees and expenses. When applicable, investment results reflect expense reimbursements, without which results would have been lower. Visit capitalgroup.com for more information.
| Capital Group U.S. Equity Fund | 3 |
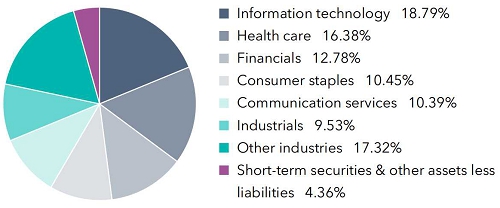
Investment portfolio
| Industry sector diversification | Percent of net assets |
| Country diversification by domicile | | Percent of
net assets |
| United States | | | 88.14 | % |
| Eurozone* | | | 2.53 | |
| United Kingdom | | | 1.67 | |
| Switzerland | | | 1.45 | |
| Denmark | | | 1.24 | |
| Canada | | | .61 | |
| Short-term securities & other assets less liabilities | | | 4.36 | |
| * | Countries using the euro as a common currency; those represented in the fund’s portfolio are Belgium, France and the Netherlands. |
| Common stocks 95.64% | | Shares | | | Value
(000) | |
| Information technology 18.79% | | | | | | | | |
| Microsoft Corp. | | | 59,695 | | | $ | 12,086 | |
| Visa Inc., Class A | | | 50,030 | | | | 9,091 | |
| Jack Henry & Associates, Inc. | | | 38,840 | | | | 5,758 | |
| Apple Inc. | | | 51,162 | | | | 5,569 | |
| Broadcom Inc. | | | 9,881 | | | | 3,455 | |
| ASML Holding NV (New York registered) (ADR) | | | 8,440 | | | | 3,049 | |
| Adobe Inc.1 | | | 5,070 | | | | 2,267 | |
| Intel Corp. | | | 42,400 | | | | 1,877 | |
| GoDaddy Inc., Class A1 | | | 25,000 | | | | 1,769 | |
| Global Payments Inc. | | | 8,945 | | | | 1,411 | |
| KLA Corp. | | | 5,800 | | | | 1,144 | |
| ServiceNow, Inc.1 | | | 1,530 | | | | 761 | |
| Accenture PLC, Class A | | | 3,330 | | | | 722 | |
| Elastic NV, non-registered shares1 | | | 5,200 | | | | 527 | |
| | | | | | | | 49,486 | |
| | | | | | | | | |
| Health care 16.38% | | | | | | | | |
| UnitedHealth Group Inc. | | | 23,835 | | | | 7,273 | |
| Seagen Inc.1 | | | 30,805 | | | | 5,138 | |
| Danaher Corp. | | | 15,573 | | | | 3,575 | |
| Merck & Co., Inc. | | | 44,385 | | | | 3,338 | |
| Eli Lilly and Company | | | 20,800 | | | | 2,714 | |
| Abbott Laboratories | | | 22,115 | | | | 2,324 | |
| AstraZeneca PLC (ADR) | | | 43,650 | | | | 2,189 | |
| Anthem, Inc. | | | 7,375 | | | | 2,012 | |
| Humana Inc. | | | 4,785 | | | | 1,911 | |
| Edwards Lifesciences Corp.1 | | | 25,350 | | | | 1,817 | |
| Gilead Sciences, Inc. | | | 26,924 | | | | 1,566 | |
| Neurocrine Biosciences, Inc.1 | | | 13,850 | | | | 1,367 | |
| Baxter International Inc. | | | 17,200 | | | | 1,334 | |
| Vertex Pharmaceuticals Inc.1 | | | 5,250 | | | | 1,094 | |
| Novo Nordisk A/S, Class B (ADR) | | | 17,100 | | | | 1,092 | |
| GlaxoSmithKline PLC (ADR) | | | 25,700 | | | | 859 | |
| Cigna Corp. | | | 4,565 | | | | 762 | |
| 4 | Capital Group U.S. Equity Fund |
| Common stocks (continued) | | Shares | | | Value
(000) | |
| Health care (continued) | | | | | | | | |
| Centene Corp.1 | | | 11,600 | | | $ | 686 | |
| Roche Holding AG (ADR) | | | 16,600 | | | | 664 | |
| Ultragenyx Pharmaceutical Inc.1 | | | 5,100 | | | | 513 | |
| Biohaven Pharmaceutical Holding Co. Ltd.1 | | | 6,200 | | | | 480 | |
| Allogene Therapeutics, Inc.1 | | | 13,100 | | | | 444 | |
| | | | | | | | 43,152 | |
| | | | | | | | | |
| Financials 12.78% | | | | | | | | |
| Marsh & McLennan Companies, Inc. | | | 59,290 | | | | 6,134 | |
| Chubb Ltd. | | | 31,780 | | | | 4,129 | |
| JPMorgan Chase & Co. | | | 39,430 | | | | 3,866 | |
| Aon PLC, Class A | | | 20,800 | | | | 3,827 | |
| Intercontinental Exchange, Inc. | | | 29,350 | | | | 2,771 | |
| Moody’s Corp. | | | 9,375 | | | | 2,465 | |
| CME Group Inc., Class A | | | 13,875 | | | | 2,091 | |
| Truist Financial Corp. | | | 47,423 | | | | 1,997 | |
| State Street Corp. | | | 31,687 | | | | 1,866 | |
| MSCI Inc. | | | 4,200 | | | | 1,469 | |
| Arthur J. Gallagher & Co. | | | 10,300 | | | | 1,068 | |
| First Republic Bank | | | 7,000 | | | | 883 | |
| Nasdaq, Inc. | | | 5,550 | | | | 672 | |
| Bank of New York Mellon Corp. | | | 12,340 | | | | 424 | |
| | | | | | | | 33,662 | |
| | | | | | | | | |
| Consumer staples 10.45% | | | | | | | | |
| Costco Wholesale Corp. | | | 13,250 | | | | 4,739 | |
| Philip Morris International Inc. | | | 53,055 | | | | 3,768 | |
| Nestlé SA (ADR) | | | 28,005 | | | | 3,144 | |
| Procter & Gamble Company | | | 20,621 | | | | 2,827 | |
| Estée Lauder Companies Inc., Class A | | | 10,480 | | | | 2,302 | |
| Carlsberg A/S, Class B (ADR) | | | 86,325 | | | | 2,187 | |
| Anheuser-Busch InBev SA/NV (ADR) | | | 35,100 | | | | 1,822 | |
| Mondelez International, Inc. | | | 28,300 | | | | 1,503 | |
| PepsiCo, Inc. | | | 9,583 | | | | 1,277 | |
| General Mills, Inc. | | | 18,816 | | | | 1,112 | |
| Hormel Foods Corp. | | | 17,200 | | | | 838 | |
| Reckitt Benckiser Group PLC (ADR) | | | 46,260 | | | | 817 | |
| Church & Dwight Co., Inc. | | | 7,500 | | | | 663 | |
| British American Tobacco PLC (ADR) | | | 16,700 | | | | 532 | |
| | | | | | | | 27,531 | |
| | | | | | | | | |
| Communication services 10.39% | | | | | | | | |
| Charter Communications, Inc., Class A1 | | | 8,526 | | | | 5,148 | |
| Activision Blizzard, Inc. | | | 56,140 | | | | 4,252 | |
| Comcast Corp., Class A | | | 92,140 | | | | 3,892 | |
| Alphabet Inc., Class C1 | | | 2,377 | | | | 3,853 | |
| Cable One, Inc. | | | 2,143 | | | | 3,711 | |
| Facebook, Inc., Class A1 | | | 13,200 | | | | 3,473 | |
| Netflix, Inc.1 | | | 2,900 | | | | 1,380 | |
| Verizon Communications Inc. | | | 16,035 | | | | 914 | |
| Electronic Arts Inc.1 | | | 6,200 | | | | 743 | |
| | | | | | | | 27,366 | |
| | | | | | | | | |
| Industrials 9.53% | | | | | | | | |
| Waste Connections, Inc. | | | 62,300 | | | | 6,188 | |
| Northrop Grumman Corp. | | | 16,240 | | | | 4,707 | |
| CSX Corp. | | | 40,950 | | | | 3,232 | |
| TransDigm Group Inc. | | | 3,385 | | | | 1,616 | |
| AMETEK, Inc. | | | 14,500 | | | | 1,424 | |
| Norfolk Southern Corp. | | | 6,531 | | | | 1,366 | |
| HEICO Corp. | | | 8,600 | | | | 903 | |
| HEICO Corp., Class A | | | 3,000 | | | | 281 | |
| Waste Management, Inc. | | | 10,620 | | | | 1,146 | |
| Capital Group U.S. Equity Fund | 5 |
| Common stocks (continued) | | Shares | | | Value
(000) | |
| Industrials (continued) | | | | | | | | |
| Airbus Group SE (ADR)1 | | | 50,200 | | | $ | 917 | |
| Honeywell International Inc. | | | 5,100 | | | | 841 | |
| Deere & Company | | | 3,200 | | | | 723 | |
| Union Pacific Corp. | | | 3,700 | | | | 656 | |
| Raytheon Technologies Corp. | | | 10,900 | | | | 592 | |
| Equifax Inc. | | | 3,750 | | | | 512 | |
| | | | | | | | 25,104 | |
| | | | | | | | | |
| Consumer discretionary 6.45% | | | | | | | | |
| Amazon.com, Inc.1 | | | 2,313 | | | | 7,023 | |
| Chipotle Mexican Grill, Inc.1 | | | 3,400 | | | | 4,085 | |
| NIKE, Inc., Class B | | | 27,605 | | | | 3,315 | |
| YUM! Brands, Inc. | | | 13,277 | | | | 1,239 | |
| EssilorLuxottica (ADR)1 | | | 14,080 | | | | 869 | |
| Darden Restaurants, Inc. | | | 4,900 | | | | 450 | |
| | | | | | | | 16,981 | |
| | | | | | | | | |
| Real estate 5.04% | | | | | | | | |
| Equinix, Inc. REIT | | | 7,350 | | | | 5,374 | |
| Crown Castle International Corp. REIT | | | 31,300 | | | | 4,889 | |
| American Tower Corp. REIT | | | 13,075 | | | | 3,003 | |
| | | | | | | | 13,266 | |
| | | | | | | | | |
| Utilities 2.09% | | | | | | | | |
| Sempra Energy | | | 13,320 | | | | 1,670 | |
| CMS Energy Corp. | | | 23,300 | | | | 1,475 | |
| AES Corp. | | | 44,000 | | | | 858 | |
| NextEra Energy, Inc. | | | 10,400 | | | | 761 | |
| Exelon Corp. | | | 18,918 | | | | 755 | |
| | | | | | | | 5,519 | |
| | | | | | | | | |
| Materials 1.91% | | | | | | | | |
| Sherwin-Williams Company | | | 2,320 | | | | 1,596 | |
| Linde PLC | | | 5,806 | | | | 1,280 | |
| Air Products and Chemicals, Inc. | | | 3,928 | | | | 1,085 | |
| Barrick Gold Corp. | | | 40,000 | | | | 1,069 | |
| | | | | | | | 5,030 | |
| | | | | | | | | |
| Energy 1.83% | | | | | | | | |
| Chevron Corp. | | | 34,940 | | | | 2,428 | |
| ConocoPhillips | | | 45,709 | | | | 1,308 | |
| TC Energy Corp. | | | 13,700 | | | | 541 | |
| EOG Resources, Inc. | | | 15,500 | | | | 531 | |
| | | | | | | | 4,808 | |
| | | | | | | | | |
| Total common stocks (cost: $144,736,000) | | | | | | | 251,905 | |
| | | | | | | | | |
| Short-term securities 4.00% | | | | | | | | |
| Money market investments 4.00% | | | | | | | | |
| Capital Group Central Cash Fund 0.11%2,3 | | | 105,320 | | | | 10,533 | |
| | | | | | | | | |
| Total short-term securities (cost: $10,532,000) | | | | | | | 10,533 | |
| Total investment securities 99.64% (cost: $155,268,000) | | | | | | | 262,438 | |
| Other assets less liabilities 0.36% | | | | | | | 957 | |
| | | | | | | | | |
| Net assets 100.00% | | | | | | $ | 263,395 | |
| 6 | Capital Group U.S. Equity Fund |
Investments in affiliates3
| | | Value of
affiliate at
11/1/2019
(000) | | | Additions
(000) | | | Reductions
(000) | | | Net
realized
loss
(000) | | | Net
unrealized
depreciation
(000) | | | Value of
affiliate at
10/31/2020
(000) | | | Dividend
income
(000) | |
| Short-term securities 4.00% | | | | | | | | | | | | | | | | | | | | | | | | | | | | |
| Money market investments 4.00% | | | | | | | | | | | | | | | | | | | | | | | | | | | | |
| Capital Group Central Cash Fund 0.11%2 | | $ | 14,356 | | | $ | 43,752 | | | $ | 47,571 | | | $ | (3 | ) | | $ | (1 | ) | | $ | 10,533 | | | $ | 100 | |
| 1 | Security did not produce income during the last 12 months. |
| 2 | Rate represents the seven-day yield at 10/31/2020. |
| 3 | Part of the same group of investment companies as the fund as defined under the Investment Company Act of 1940. |
Key to abbreviation
ADR = American Depositary Receipts
See notes to financial statements.
| Capital Group U.S. Equity Fund | 7 |
Financial statements
| Statement of assets and liabilities | |
| at October 31, 2020 | (dollars in thousands) |
| Assets: | | | | | | |
| Investment securities, at value: | | | | | | | | |
| Unaffiliated issuers (cost: $144,736) | | $ | 251,905 | | | | | |
| Affiliated issuers (cost: $10,532) | | | 10,533 | | | $ | 262,438 | |
| Cash | | | | | | | 1 | |
| Cash denominated in currencies other than U.S. dollars (cost: $7) | | | | | | | 7 | |
| Receivables for: | | | | | | | | |
| Sales of investments | | | 967 | | | | | |
| Sales of fund’s shares | | | 602 | | | | | |
| Services provided by related parties | | | 24 | | | | | |
| Dividends | | | 215 | | | | | |
| Securities lending income | | | — | * | | | | |
| Other | | | 1 | | | | 1,809 | |
| | | | | | | | 264,255 | |
| Liabilities: | | | | | | | | |
| Payables for: | | | | | | | | |
| Purchases of investments | | | 760 | | | | | |
| Investment advisory services | | | 100 | | | | 860 | |
| Net assets at October 31, 2020 | | | | | | $ | 263,395 | |
| | | | | | | | | |
| Net assets consist of: | | | | | | | | |
| Capital paid in on shares of beneficial interest | | | | | | $ | 150,564 | |
| Total distributable earnings | | | | | | | 112,831 | |
| Net assets at October 31, 2020 | | | | | | $ | 263,395 | |
| | |
| * | Amount less than one thousand. |
(dollars and shares in thousands, except per-share amounts)
Shares of beneficial interest issued and outstanding (no stated par value) —
unlimited shares authorized (10,314 total shares outstanding)
| | | | | | Shares | | | Net asset value | |
| | | Net assets | | | outstanding | | | per share | |
| Class M | | $ | 263,395 | | | | 10,314 | | | $ | 25.54 | |
See notes to financial statements.
| 8 | Capital Group U.S. Equity Fund |
Financial statements (continued)
| Statement of operations | |
| for the year ended October 31, 2020 | (dollars in thousands) |
| Investment income: | | | | | | | | |
| Income: | | | | | | | | |
| Dividends (net of non-U.S. taxes of $58; also includes $100 from affiliates) | | $ | 4,000 | | | | | |
| Interest | | | 1 | | | | | |
| Securities lending income (net of fees) | | | — | * | | $ | 4,001 | |
| Fees and expenses†: | | | | | | | | |
| Investment advisory services | | | 1,098 | | | | | |
| Trustees’ compensation | | | 43 | | | | | |
| Legal | | | 20 | | | | | |
| Other | | | 1 | | | | | |
| Total fees and expenses before reimbursements | | | 1,162 | | | | | |
| Less miscellaneous fee reimbursements | | | 64 | | | | | |
| Total fees and expenses after reimbursements | | | | | | | 1,098 | |
| Net investment income | | | | | | | 2,903 | |
| |
| Net realized gain and unrealized appreciation: | | | | | | | | |
| Net realized gain (loss) on: | | | | | | | | |
| Investments: | | | | | | | | |
| Unaffiliated issuers | | | 5,847 | | | | | |
| Affiliated issuers | | | (3 | ) | | | 5,844 | |
| Net unrealized appreciation (depreciation) on: | | | | | | | | |
| Investments: | | | | | | | | |
| Unaffiliated issuers | | | 12,307 | | | | | |
| Affiliated issuers | | | (1 | ) | | | 12,306 | |
| Net realized gain and unrealized appreciation | | | | | | | 18,150 | |
| | | | | | | | | |
| Net increase in net assets resulting from operations | | | | | | $ | 21,053 | |
| * | Amount less than one thousand. |
| † | Additional information related to non- U.S. taxes and fees and expenses is included in the notes to financial statements. |
See notes to financial statements.
| Capital Group U.S. Equity Fund | 9 |
Financial statements (continued)
| Statements of changes in net assets | |
| | (dollars in thousands) |
| | | Year ended
October 31, | |
| | | 2020 | | | | 2019 | |
| Operations: | | | | | | | | |
| Net investment income | | $ | 2,903 | | | $ | 3,469 | |
| Net realized gain | | | 5,844 | | | | 8,243 | |
| Net unrealized appreciation | | | 12,306 | | | | 26,011 | |
| Net increase in net assets resulting from operations | | | 21,053 | | | | 37,723 | |
| | | | | | | | | |
| Distributions paid to shareholders | | | (10,739 | ) | | | (17,919 | ) |
| | | | | | | | | |
| Net capital share transactions | | | 8,756 | | | | 1,163 | |
| | | | | | | | | |
| Total increase in net assets | | | 19,070 | | | | 20,967 | |
| | | | | | | | | |
| Net assets: | | | | | | | | |
| Beginning of year | | | 244,325 | | | | 223,358 | |
| End of year | | $ | 263,395 | | | $ | 244,325 | |
See notes to financial statements.
| 10 | Capital Group U.S. Equity Fund |
Notes to financial statements
1. Organization
Capital Group U.S. Equity Fund (the “fund”) is registered under the Investment Company Act of 1940 as an open-end, diversified management investment company. On September 16, 2019, the fund’s board approved the reorganization of Capital Group U.S. Equity Fund (the “predecessor fund“) into a new Delaware statutory trust. On November 8, 2019, the fund acquired the assets and assumed the liabilities of the predecessor fund. The fund’s fiscal year ends on October 31. The fund seeks to provide prudent growth of capital and conservation of principal.
2. Significant accounting policies
The fund is an investment company that applies the accounting and reporting guidance issued in Topic 946 by the U.S. Financial Accounting Standards Board. The fund’s financial statements have been prepared to comply with U.S. generally accepted accounting principles (“U.S. GAAP“). These principles require the fund’s investment adviser to make estimates and assumptions that affect reported amounts and disclosures. Actual results could differ from those estimates. Subsequent events, if any, have been evaluated through the date of issuance in the preparation of the financial statements. The fund follows the significant accounting policies described in this section, as well as the valuation policies described in the next section on valuation.
Security transactions and related investment income — Security transactions are recorded by the fund as of the date the trades are executed with brokers. Realized gains and losses from security transactions are determined based on the specific identified cost of the securities. In the event a security is purchased with a delayed payment date, the fund will segregate liquid assets sufficient to meet its payment obligations. Dividend income is recognized on the ex-dividend date and interest income is recognized on an accrual basis. Market discounts, premiums and original issue discounts on fixed-income securities are amortized daily over the expected life of the security.
Distributions paid to shareholders — Income dividends and capital gain distributions are recorded on the ex-dividend date.
Currency translation — Assets and liabilities, including investment securities, denominated in currencies other than U.S. dollars are translated into U.S. dollars at the exchange rates supplied by one or more pricing vendors on the valuation date. Purchases and sales of investment securities and income and expenses are translated into U.S. dollars at the exchange rates on the dates of such transactions. The effects of changes in exchange rates on investment securities are included with the net realized gain or loss and net unrealized appreciation or depreciation on investments in the fund’s statement of operations. The realized gain or loss and unrealized appreciation or depreciation resulting from all other transactions denominated in currencies other than U.S. dollars are disclosed separately.
3. Valuation
Capital Research and Management Company (“CRMC”), the fund’s investment adviser, values the fund’s investments at fair value as defined by U.S. GAAP. The net asset value per share is calculated once daily as of the close of regular trading on the New York Stock Exchange, normally 4 p.m. New York time, each day the New York Stock Exchange is open.
Methods and inputs — The fund’s investment adviser uses the following methods and inputs to establish the fair value of the fund’s assets and liabilities. Use of particular methods and inputs may vary over time based on availability and relevance as market and economic conditions evolve.
Equity securities are generally valued at the official closing price of, or the last reported sale price on, the exchange or market on which such securities are traded, as of the close of business on the day the securities are being valued or, lacking any sales, at the last available bid price. Prices for each security are taken from the principal exchange or market on which the security trades.
Fixed-income securities, including short-term securities, are generally valued at prices obtained from one or more pricing vendors. Vendors value such securities based on one or more of the inputs described in the following table. The table provides examples of inputs that are commonly relevant for valuing particular classes of fixed-income securities in which the fund is authorized to invest. However, these classifications are not exclusive, and any of the inputs may be used to value any other class of fixed-income security.
| Capital Group U.S. Equity Fund | 11 |
| Fixed-income class | | Examples of standard inputs |
| All | | Benchmark yields, transactions, bids, offers, quotations from dealers and trading systems, new issues, spreads and other relationships observed in the markets among comparable securities; and proprietary pricing models such as yield measures calculated using factors such as cash flows, financial or collateral performance and other reference data (collectively referred to as “standard inputs”) |
| Corporate bonds, notes & loans; convertible securities | | Standard inputs and underlying equity of the issuer |
| Bonds & notes of governments & government agencies | | Standard inputs and interest rate volatilities |
When the fund’s investment adviser deems it appropriate to do so (such as when vendor prices are unavailable or deemed to be not representative), fixed-income securities will be valued in good faith at the mean quoted bid and ask prices that are reasonably and timely available (or bid prices, if ask prices are not available) or at prices for securities of comparable maturity, quality and type.
Securities with both fixed-income and equity characteristics, or equity securities traded principally among fixed-income dealers, are generally valued in the manner described for either equity or fixed-income securities, depending on which method is deemed most appropriate by the fund’s investment adviser. The Capital Group Central Cash Fund (“CCF”), a fund within the Capital Group Central Fund Series (“Central Funds“), is valued based upon a floating net asset value, which fluctuates with changes in the value of CCF’s portfolio securities. The underlying securities are valued based on the policies and procedures in CCF’s statement of additional information.
Securities and other assets for which representative market quotations are not readily available or are considered unreliable by the fund’s investment adviser are fair valued as determined in good faith under fair valuation guidelines adopted by authority of the fund’s board of trustees as further described. The investment adviser follows fair valuation guidelines, consistent with U.S. Securities and Exchange Commission rules and guidance, to consider relevant principles and factors when making fair value determinations. The investment adviser considers relevant indications of value that are reasonably and timely available to it in determining the fair value to be assigned to a particular security, such as the type and cost of the security; contractual or legal restrictions on resale of the security; relevant financial or business developments of the issuer; actively traded similar or related securities; conversion or exchange rights on the security; related corporate actions; significant events occurring after the close of trading in the security; and changes in overall market conditions. In addition, the closing prices of equity securities that trade in markets outside U.S. time zones may be adjusted to reflect significant events that occur after the close of local trading but before the net asset value of each share class of the fund is determined. Fair valuations and valuations of investments that are not actively trading involve judgment and may differ materially from valuations that would have been used had greater market activity occurred.
Processes and structure — The fund’s board of trustees has delegated authority to the fund’s investment adviser to make fair value determinations, subject to board oversight. The investment adviser has established a Joint Fair Valuation Committee (the “Fair Valuation Committee”) to administer, implement and oversee the fair valuation process, and to make fair value decisions. The Fair Valuation Committee regularly reviews its own fair value decisions, as well as decisions made under its standing instructions to the investment adviser’s valuation teams. The Fair Valuation Committee reviews changes in fair value measurements from period to period and may, as deemed appropriate, update the fair valuation guidelines to better reflect the results of back testing and address new or evolving issues. The Fair Valuation Committee reports any changes to the fair valuation guidelines to the board of trustees. The fund’s board and audit committee also regularly review reports that describe fair value determinations and methods.
The fund’s investment adviser has also established a Fixed-Income Pricing Review Group to administer and oversee the fixed-income valuation process, including the use of fixed-income pricing vendors. This group regularly reviews pricing vendor information and market data. Pricing decisions, processes and controls over security valuation are also subject to additional internal reviews, including an annual control self-evaluation program facilitated by the investment adviser’s compliance group.
Classifications — The fund’s investment adviser classifies the fund’s assets and liabilities into three levels based on the inputs used to value the assets or liabilities. Level 1 values are based on quoted prices in active markets for identical securities. Level 2 values are based on significant observable market inputs, such as quoted prices for similar securities and quoted prices in inactive markets. Certain securities trading outside the U.S. may transfer between Level 1 and Level 2 due to valuation adjustments resulting from significant market movements following the close of local trading. Level 3 values are based on significant unobservable inputs that reflect the investment adviser’s determination of assumptions that market participants might reasonably use in valuing the securities. The valuation levels are not necessarily an indication of the risk or liquidity associated with the underlying investment. For example, U.S. government securities are reflected as Level 2 because the inputs used to determine fair value may not always be quoted prices in an active market. At October 31, 2020, all of the fund’s investments were classified as Level 1.
| 12 | Capital Group U.S. Equity Fund |
4. Risk factors
Market conditions — The prices of, and the income generated by, the securities held by the fund may decline — sometimes rapidly or unpredictably — due to various factors, including events or conditions affecting the general economy or particular industries; overall market changes; local, regional or global political, social or economic instability; governmental, governmental agency or central bank responses to economic conditions; and currency exchange rate, interest rate and commodity price fluctuations.
Economies and financial markets throughout the world are highly interconnected. Economic, financial or political events, trading and tariff arrangements, wars, terrorism, cybersecurity events, natural disasters, public health emergencies (such as the spread of infectious disease) and other circumstances in one country or region, including actions taken by governmental or quasi-governmental authorities in response to any of the foregoing, could have impacts on global economies or markets. As a result, whether or not the fund invests in securities of issuers located in or with significant exposure to the countries affected, the value and liquidity of the fund’s investments may be negatively affected by developments in other countries and regions.
Issuer risks — The prices of, and the income generated by, securities held by the fund may decline in response to various factors directly related to the issuers of such securities, including reduced demand for an issuer’s goods or services, poor management performance, major litigation, investigations or other controversies related to the issuer, changes in government regulations affecting the issuer or its competitive environment and strategic initiatives such as mergers, acquisitions or dispositions and the market response to any such initiatives.
Investing in growth-oriented stocks — Growth-oriented common stocks and other equity-type securities (such as preferred stocks, convertible preferred stocks and convertible bonds) may involve larger price swings and greater potential for loss than other types of investments.
Investing in income-oriented stocks — The value of the fund’s securities and income provided by the fund may be reduced by changes in the dividend policies of, and the capital resources available for dividend payments at, the companies in which the fund invests.
Investing outside the U.S. — Securities of issuers domiciled outside the U.S., or with significant operations or revenues outside the U.S., may lose value because of adverse political, social, economic or market developments (including social instability, regional conflicts, terrorism and war) in the countries or regions in which the issuers operate or generate revenue. These securities may also lose value due to changes in foreign currency exchange rates against the U.S. dollar and/or currencies of other countries. Issuers of these securities may be more susceptible to actions of foreign governments, such as nationalization, currency blockage or the imposition of price controls or punitive taxes, each of which could adversely impact the value of these securities. Securities markets in certain countries may be more volatile and/or less liquid than those in the U.S. Investments outside the U.S. may also be subject to different accounting practices and different regulatory, legal and reporting standards and practices, and may be more difficult to value, than those in the U.S. In addition, the value of investments outside the U.S. may be reduced by foreign taxes, including foreign withholding taxes on interest and dividends. Further, there may be increased risks of delayed settlement of securities purchased or sold by the fund. The risks of investing outside the U.S may be heightened in connection with investments in emerging markets.
Management — The investment adviser to the fund actively manages the fund’s investments. Consequently, the fund is subject to the risk that the methods and analyses, including models, tools and data, employed by the investment adviser in this process may be flawed or incorrect and may not produce the desired results. This could cause the fund to lose value or its investment results to lag relevant benchmarks or other funds with similar objectives.
5. Certain investment techniques
Securities lending — The fund has entered into securities lending transactions in which the fund earns income by lending investment securities to brokers, dealers or other institutions. Each transaction involves three parties: the fund, acting as the lender of the securities, a borrower, and a lending agent that acts as an intermediary.
Securities lending transactions are entered into by the fund under a securities lending agent agreement with the lending agent. The lending agent facilitates the exchange of securities between the fund and approved borrowers, ensures that securities loans are properly coordinated and documented, marks-to-market the value of collateral daily, secures additional collateral from a borrower if it falls below preset terms, and may reinvest cash collateral on behalf of the fund according to agreed parameters. The lending agent provides indemnification to the fund against losses resulting from a borrower default. Although risk is mitigated by the collateral and indemnification, the fund could experience a delay in recovering its securities and a potential loss of income or value if a borrower fails to return securities, collateral investments decline in value or the lending agent fails to perform.
| Capital Group U.S. Equity Fund | 13 |
The borrower is required to post highly liquid assets, such as cash or U.S. government securities, as collateral for the loan in an amount at least equal to the value of the securities loaned. Investments made with cash collateral are recognized as assets in the fund’s investment portfolio. The same amount is recorded as a liability in the fund’s statement of assets and liabilities. While securities are on loan, the fund will continue to receive the equivalent of the interest, dividends or other distributions paid by the issuer, as well as a portion of the interest on the investment of the collateral. Additionally, although the fund does not have the right to vote on securities while they are on loan, the fund has a right to consent on corporate actions and a right to recall loaned securities to vote. A borrower is obligated to return loaned securities at the conclusion of a loan or, during the pendency of a loan, on demand from the fund.
As of October 31, 2020, the fund did not have any securities out on loan.
Collateral — The fund receives highly liquid assets, such as cash or U.S. government securities, as collateral in exchange for lending investment securities. The purpose of the collateral is to cover potential losses that could occur in the event the borrower cannot meet its contractual obligation. The lending agent may reinvest cash collateral from securities lending transactions according to agreed parameters. Cash collateral reinvested by the lending agent, if any, is disclosed in the fund’s investment portfolio.
6. Taxation and distributions
Federal income taxation — The fund complies with the requirements under Subchapter M of the Internal Revenue Code applicable to mutual funds and intends to distribute substantially all of its net taxable income and net capital gains each year. The fund is not subject to income taxes to the extent such distributions are made. Therefore, no federal income tax provision is required.
As of and during the year ended October 31, 2020, the fund did not have a liability for any unrecognized tax benefits. The fund recognizes interest and penalties, if any, related to unrecognized tax benefits as income tax expense in the statement of operations. During the period, the fund did not incur any significant interest or penalties.
The fund’s tax returns are not subject to examination by federal, state and, if applicable, non-U.S. tax authorities after the expiration of each jurisdiction’s statute of limitations, which is generally three years after the date of filing but can be extended in certain jurisdictions.
Non-U.S. taxation — Dividend and interest income are recorded net of non-U.S. taxes paid. The fund may file withholding tax reclaims in certain jurisdictions to recover a portion of amounts previously withheld. These reclaims are recorded when the amount is known and there are no significant uncertainties on collectability. Gains realized by the fund on the sale of securities in certain countries, if any, may be subject to non-U.S. taxes. If applicable, the fund records an estimated deferred tax liability based on unrealized gains to provide for potential non-U.S. taxes payable upon the sale of these securities.
Distributions — Distributions paid to shareholders are based on net investment income and net realized gains determined on a tax basis, which may differ from net investment income and net realized gains for financial reporting purposes. These differences are due primarily to different treatment for items such as currency gains and losses and short-term capital gains and losses. The fiscal year in which amounts are distributed may differ from the year in which the net investment income and net realized gains are recorded by the fund for financial reporting purposes. The fund may also designate a portion of the amount paid to redeeming shareholders as a distribution for tax purposes.
During the year ended October 31, 2020, the fund reclassified $334,000 from total distributable earnings to capital paid in on shares of beneficial interest to align financial reporting with tax reporting.
As of October 31, 2020, the tax basis components of distributable earnings, unrealized appreciation (depreciation) and cost of investments were as follows (dollars in thousands):
| Undistributed ordinary income | | $ | 213 | |
| Undistributed long-term capital gains | | | 5,499 | |
| Gross unrealized appreciation on investments | | | 110,043 | |
| Gross unrealized depreciation on investments | | | (2,924 | ) |
| Net unrealized appreciation on investments | | | 107,119 | |
| Cost of investments | | | 155,319 | |
| 14 | Capital Group U.S. Equity Fund |
Distributions paid were characterized for tax purposes as follows (dollars in thousands):
| | | Year ended October 31, 2020 | | | Year ended October 31, 2019 | |
| Share class | | Ordinary
income | | | Long-term
capital gains | | | Total
distributions
paid | | | Ordinary
income | | | Long-term
capital gains | | | Total
distributions
paid | |
| | | | | | | | | | | | | | | | | | | |
| Class M | | $ | 2,946 | | | $ | 7,793 | | | $ | 10,739 | | | $ | 3,495 | | | $ | 14,424 | | | $ | 17,919 | |
7. Fees and transactions with related parties
CRMC, the fund’s investment adviser, is the parent company of American Funds Distributors®, Inc. (“AFD”), the principal underwriter of the fund’s share, and American Funds Service Company® (“AFS”), the fund’s transfer agent. CRMC, AFD and AFS are considered related parties to the fund.
Investment advisory services — The fund has an investment advisory and service agreement with CRMC that provides for monthly fees accrued daily. For the services it provides to the fund, CRMC receives a unified management fee of 0.425% of the daily net assets of the fund. Out of the fund’s unified management fee CRMC pays all expenses of managing and operating the fund except brokerage expenses, taxes, interest, fees and expenses of the independent trustees (including legal counsel fees) and extraordinary expenses, such as litigation expenses. These expenses, which are not paid by CRMC from the unified management fee, are paid by the fund, which are currently reimbursed by CRMC.
Miscellaneous fee reimbursement — Expense limitations have been imposed through at least January 1, 2021, to limit the share class’s total annual operating expense to 0.425% as a percentage of daily net assets. For the year ended October 31, 2020, CRMC reimbursed miscellaneous fees of $64,000 for the fund, which CRMC does not intend to recoup. Fees and expenses in the statement of operations are presented gross of any reimbursements from CRMC.
Affiliated officers and trustees — Officers and certain trustees of the fund are or may be considered to be affiliated with CRMC. No affiliated officers or trustees received any compensation directly from the fund.
Investment in CCF — The fund holds shares of CCF, an institutional prime money market fund managed by CRMC. CCF invests in high-quality, short-term money market instruments. CCF is used as the primary investment vehicle for the fund’s short-term investments. CCF shares are only available for purchase by CRMC, its affiliates, and other funds managed by CRMC or its affiliates, and are not available to the public. CRMC does not receive an investment advisory services fee from CCF.
Security transactions with related funds — The fund purchased securities from, and sold securities to, other funds managed by CRMC (or funds managed by certain affiliates of CRMC) under procedures adopted by the fund’s board of trustees. The funds involved in such transactions are considered related by virtue of having a common investment adviser (or affiliated investment advisers), common trustees and/or common officers. Each transaction was executed at the current market price of the security and no brokerage commissions or fees were paid in accordance with Rule 17a-7 of the 1940 Act. During the year ended October 31, 2020, the fund engaged in such purchase and sale transactions with related funds in the amounts of $1,326,000 and $1,634,000, respectively, which generated $452,000 of net realized gains from such sales.
Interfund lending — Pursuant to an exemptive order issued by the SEC, the fund, along with other CRMC-managed funds (or funds managed by certain affiliates of CRMC), may participate in an interfund lending program. The program provides an alternate credit facility that permits the funds to lend or borrow cash for temporary purposes directly to or from one another, subject to the conditions of the exemptive order. The fund did not lend or borrow cash through the interfund lending program at any time during the year ended October 31, 2020.
| Capital Group U.S. Equity Fund | 15 |
8. Capital share transactions
Capital share transactions in the fund were as follows (dollars and shares in thousands):
| | | Sales | | | Reinvestments of
distributions | | | Repurchases | | | Net increase | |
| Share class | | Amount | | | Shares | | | Amount | | | Shares | | | Amount | | | Shares | | | Amount | | | Shares | |
| | | | | | | | | | | | | | | | | | | | | | | | | | | | | | | | | |
| Year ended October 31, 2020 |
| |
| Class M | | $ | 25,632 | | | | 1,042 | | | $ | 10,453 | | | | 423 | | | $ | (27,329 | ) | | | (1,094 | ) | | $ | 8,756 | | | | 371 | |
| | | | | | | | | | | | | | | | | | | | | | | | | | | | | | | | | |
| Year ended October 31, 2019 |
| | | | | | | | | | | | | | | | | | | | | | | | | | | | | | | | | |
| Class M | | $ | 14,574 | | | | 640 | | | $ | 15,402 | | | | 762 | | | $ | (28,813 | ) | | | (1,262 | ) | | $ | 1,163 | | | | 140 | |
9. Investment transactions
The fund made purchases and sales of investment securities, excluding short-term securities and U.S. government obligations, if any, of $49,516,000 and $46,025,000, respectively, during the year ended October 31, 2020.
| 16 | Capital Group U.S. Equity Fund |
Financial highlights
| | | | | | Income from
investment operations1 | | | Dividends and distributions | | | | | | | | | | | | | | | | | | | |
| Year ended | | Net asset
value,
beginning
of year | | | Net
investment
income | | | Net gains on
securities (both
realized and
unrealized) | | | Total from
investment
operations | | | Dividends
(from net
investment
income) | | | Distributions
(from capital
gains) | | | Total
dividends
and
distributions | | | Net asset
value, end
of year | | �� | Total
return2 | | | Net assets,
end of year
(in millions) | | | Ratio of
expenses to
average net
assets before
reimbursements3 | | | Ratio of
expenses to
average net
assets after
reimbursements2,3 | | | Ratio of
net income
to average
net assets2 | |
| | | | | | | | | | | | | | | | | | | | | | | | | | | | | | | | | | | | | | | | |
| 10/31/2020 | | $ | 24.57 | | | $ | .28 | | | $ | 1.77 | | | $ | 2.05 | | | $ | (.29 | ) | | $ | (.79 | ) | | $ | (1.08 | ) | | $ | 25.54 | | | | 8.51 | % | | $ | 263 | | | | .45 | % | | | .42 | % | | | 1.12 | % |
| 10/31/2019 | | | 22.78 | | | | .34 | | | | 3.27 | | | | 3.61 | | | | (.35 | ) | | | (1.47 | ) | | | (1.82 | ) | | | 24.57 | | | | 17.65 | | | | 244 | | | | .45 | | | | .42 | | | | 1.49 | |
| 10/31/2018 | | | 22.95 | | | | .34 | | | | .85 | | | | 1.19 | | | | (.29 | ) | | | (1.07 | ) | | | (1.36 | ) | | | 22.78 | | | | 5.30 | | | | 223 | | | | .44 | | | | .43 | | | | 1.45 | |
| 10/31/2017 | | | 19.78 | | | | .32 | | | | 4.02 | | | | 4.34 | | | | (.31 | ) | | | (.86 | ) | | | (1.17 | ) | | | 22.95 | | | | 22.76 | | | | 236 | | | | .53 | | | | .52 | | | | 1.52 | |
| 10/31/2016 | | | 19.88 | | | | .33 | | | | .55 | | | | .88 | | | | (.30 | ) | | | (.68 | ) | | | (.98 | ) | | | 19.78 | | | | 4.58 | | | | 210 | | | | .66 | | | | .65 | | | | 1.68 | |
| | | | |
| | | Year ended October 31, |
| | | 2020 | | 2019 | | 2018 | | 2017 | | 2016 |
| Portfolio turnover rate for all share classes4 | | | 19 | % | | | 16 | % | | | 22 | % | | | 19 | % | | | 31 | % |
| | |
| 1 | Based on average shares outstanding. |
| 2 | This column reflects the impact, if any, of certain reimbursements from CRMC. |
| 3 | Ratios do not include expenses of any Central Funds. The fund indirectly bears its proportionate share of the expenses of any Central Funds. |
| 4 | Rates do not include the fund’s portfolio activity with respect to any Central Funds. |
See notes to financial statements.
| Capital Group U.S. Equity Fund | 17 |
Report of Independent Registered Public Accounting Firm
To the Board of Trustees and Shareholders of Capital Group U.S. Equity Fund
Opinion on the Financial Statements
We have audited the accompanying statement of assets and liabilities, including the investment portfolio, of Capital Group U.S. Equity Fund (the “Fund”) as of October 31, 2020, the related statement of operations for the year ended October 31, 2020, the statements of changes in net assets for each of the two years in the period ended October 31, 2020, including the related notes, and the financial highlights for each of the three years in the period ended October 31, 2020 (collectively referred to as the “financial statements”). In our opinion, the financial statements present fairly, in all material respects, the financial position of the Fund as of October 31, 2020, the results of its operations for the year then ended, the changes in its net assets for each of the two years in the period ended October 31, 2020 and the financial highlights for each of the three years in the period ended October 31, 2020 in conformity with accounting principles generally accepted in the United States of America.
The financial statements of the Fund as of and for the year ended October 31, 2017 and the financial highlights for each of the periods ended on or prior to October 31, 2017 (not presented herein, other than the financial highlights for each of the two years in the period ended October 31, 2017) were audited by other auditors whose report dated December 19, 2017 expressed an unqualified opinion on those financial statements and financial highlights.
Basis for Opinion
These financial statements are the responsibility of the Fund’s management. Our responsibility is to express an opinion on the Fund’s financial statements based on our audits. We are a public accounting firm registered with the Public Company Accounting Oversight Board (United States) (PCAOB) and are required to be independent with respect to the Fund in accordance with the U.S. federal securities laws and the applicable rules and regulations of the Securities and Exchange Commission and the PCAOB.
We conducted our audits of these financial statements in accordance with the standards of the PCAOB. Those standards require that we plan and perform the audit to obtain reasonable assurance about whether the financial statements are free of material misstatement, whether due to error or fraud.
Our audits included performing procedures to assess the risks of material misstatement of the financial statements, whether due to error or fraud, and performing procedures that respond to those risks. Such procedures included examining, on a test basis, evidence regarding the amounts and disclosures in the financial statements. Our audits also included evaluating the accounting principles used and significant estimates made by management, as well as evaluating the overall presentation of the financial statements. Our procedures included confirmation of securities owned as of October 31, 2020 by correspondence with the custodian, transfer agent and brokers; when replies were not received from brokers, we performed other auditing procedures. We believe that our audits provide a reasonable basis for our opinion.
/s/ PricewaterhouseCoopers LLP
Los Angeles, California
December 14, 2020
We have served as the auditor of one or more investment companies in The Capital Group Companies Investment Company Complex since 1934.
| 18 | Capital Group U.S. Equity Fund |
As a shareholder of the fund, you incur ongoing costs, including management fees and other expenses. This example is intended to help you understand your ongoing costs (in dollars) of investing in the fund so you can compare these costs with the ongoing costs of investing in other mutual funds. The example is based on an investment of $1,000 invested at the beginning of the period and held for the entire six-month period (May 1, 2020, through October 31, 2020).
Actual expenses:
The first line in the table provides information about actual account values and actual expenses. You may use the information in this line, together with the amount you invested, to estimate the expenses that you paid over the period. Simply divide your account value by $1,000 (for example, an $8,600 account value divided by $1,000 = 8.6), then multiply the result by the number in the first line under the heading titled “Expenses paid during period” to estimate the expenses you paid on your account during this period.
Hypothetical example for comparison purposes:
The second line in the table provides information about hypothetical account values and hypothetical expenses based on the actual expense ratio for the share class and an assumed rate of return of 5.00% per year before expenses, which is not the actual return of the share class. The hypothetical account values and expenses may not be used to estimate the actual ending account balance or expenses you paid for the period. You may use this information to compare the ongoing costs of investing in the fund and other funds. To do so, compare this 5.00% hypothetical example with the 5.00% hypothetical examples that appear in the shareholder reports of the other funds.
Notes:
Shareholders of the fund may be subject to an additional fee charged by CRMC’s Capital Group Private Client Services division for the ongoing services provided to the shareholder. You can estimate the impact of these fees by adding the amount of the fees to the total estimated expenses you paid on your account during the period as calculated above. In addition, your ending account value would be lower by the amount of these fees. Note that the expenses shown in the table are meant to highlight your ongoing costs only. The second line in the table is useful in comparing ongoing costs only and will not help you determine the relative total costs of owning different funds.
| | | Beginning
account value
5/1/2020 | | | Ending
account value
10/31/2020 | | | Expenses
paid during
period* | | | Annualized
expense ratio | |
| Capital Group U.S. Equity Fund | | | | | | | | | | | | | | | | |
| Actual return | | $ | 1,000.00 | | | $ | 1,076.59 | | | $ | 2.20 | | | | .42 | % |
| Assumed 5% return | | | 1,000.00 | | | | 1,023.09 | | | | 2.14 | | | | .42 | |
| * | The “expenses paid during period” are equal to the “annualized expense ratio,” multiplied by the average account value over the period, multiplied by the number of days in the period, and divided by 365 (to reflect the one-half year period). |
We are required to advise you of the federal tax status of certain distributions received by shareholders during the fiscal year. The fund hereby designates the following amounts for the fund’s fiscal year ended October 31, 2020:
| Long-term capital gains | | $ | 8,127,000 | |
| Qualified dividend income | | | 100 | % |
| Corporate dividends received deduction | | | 100 | % |
Individual shareholders should refer to their Form 1099 or other tax information, which will be mailed in January 2021, to determine the calendar year amounts to be included on their 2020 tax returns. Shareholders should consult their tax advisors.
| Capital Group U.S. Equity Fund | 19 |
This page was intentionally left blank.
| 20 | Capital Group U.S. Equity Fund |
This page was intentionally left blank.
| Capital Group U.S. Equity Fund | 21 |
This page was intentionally left blank.
| 22 | Capital Group U.S. Equity Fund |
Board of trustees and other officers
Independent trustees1
Name, year of birth and position
with fund | | Year first
elected a
trustee of
the fund2 | | Principal occupation(s) during the past five years | | Number of
portfolios in fund
complex overseen
by trustee | | Other directorships3 held
by trustee |
| Joseph C. Berenato, 1946 | | 2019 | | Former Chairman and CEO, Ducommun Incorporated (aerospace components manufacturer) | | 15 | | None |
Vanessa C. L. Chang, 1952
Chairman of the Board (Independent and Non-Executive) | | 2019 | | Former Director, EL & EL Investments (real estate) | | 16 | | Edison International/ Southern California Edison; Sykes Enterprises; Transocean Ltd. |
| James G. Ellis, 1947 | | 2019 | | Professor of Marketing and former Dean, Marshall School of Business, University of Southern California | | 98 | | Mercury General Corporation |
| Jennifer C. Feikin, 1968 | | 2019 | | Business Advisor; previously held positions at Google, AOL, 20th Century Fox and McKinsey & Company; Trustee, The Nature Conservancy of California; former Director, First Descents | | 9 | | None |
| Pablo R. González Guajardo, 1967 | | 2019 | | CEO, Kimberly-Clark de México, SAB de CV | | 16 | | América Móvil, SAB de CV; Grupo Lala, SAB de CV; Grupo Sanborns, SAB de CV; Kimberly-Clark de México, SAB de CV |
| Leslie Stone Heisz, 1961 | | 2019 | | Former Managing Director, Lazard (retired, 2010); Director, Edwards Lifesciences; Trustee, Public Storage; Director, Kaiser Permanente (California public benefit corporation); Lecturer, UCLA Anderson School of Management | | 9 | | None |
| William D. Jones, 1955 | | 2019 | | Real estate developer/owner, President and CEO, CityLink Investment Corporation (acquires, develops and manages real estate ventures in urban communities) and for the former City Scene Management Company (provided commercial asset management services) | | 17 | | Sempra Energy |
Interested trustee4,5
Name, year of birth and position
with fund | | Year first
elected a
trustee of
the fund2 | | Principal occupation(s) during the past five years and
positions held with affiliated entities or the principal
underwriter of the fund | | Number of
portfolios in fund
complex overseen
by trustee | | Other directorships3 held
by trustee |
John S. Armour, 1957
President and Trustee | | 2019 | | President – Private Client Services Division, Capital Bank and Trust Company6 | | 9 | | None |
The fund’s statement of additional information includes further details about fund trustees and is available without charge upon request by calling your relationship manager at (800) 266-9532. The address for all trustees and officers of the fund is 333 South Hope Street, Los Angeles, CA 90071, Attention: Secretary.
See page 24 for footnotes.
| Capital Group U.S. Equity Fund | 23 |
Officers5
Name, year of birth and
position with fund | | Year first elected
an officer of the
fund2 | | Principal occupation(s) during the past five years and positions held with affiliated entities or the Principal
Underwriter of the fund |
Cheryl E. Frank, 1975
Senior Vice President | | 2019 | | Partner – Capital International Investors, Capital Research and Management Company; Director, The Capital Group Companies, Inc.6 |
Gregory D. Fuss, 1959
Senior Vice President | | 2019 | | Partner – Capital International Investors, Capital Research and Management Company; Partner – Capital International Investors, Capital Bank and Trust Company6; Senior Vice President – Private Client Services Division, Capital Bank and Trust Company6 |
William L. Robbins, 1968
Senior Vice President | | 2019 | | Partner – Capital International Investors, Capital Research and Management Company; Partner – Capital International Investors, Capital Bank and Trust Company6; Chair and Director, Capital Group International, Inc.6 |
Timothy W. McHale, 1978
Vice President | | 2019 | | Senior Vice President and Senior Counsel – Fund Business Management Group, Capital Research and Management Company; Secretary, American Funds Distributors, Inc.6 |
Courtney R. Taylor, 1975
Secretary | | 2019 | | Assistant Vice President – Fund Business Management Group, Capital Research and Management Company |
Gregory F. Niland, 1971
Treasurer | | 2019 | | Vice President – Investment Operations, Capital Research and Management Company |
Susan K. Countess, 1966
Assistant Secretary | | 2019 | | Associate – Fund Business Management Group, Capital Research and Management Company |
Sandra Chuon, 1972
Assistant Treasurer | | 2019 | | Assistant Vice President – Investment Operations, Capital Research and Management Company |
Kyle J. Ilsley, 1980
Assistant Treasurer | | 2020 | | Assistant Vice President – Investment Operations, Capital Research and Management Company |
| 1 | The term independent trustee refers to a trustee who is not an “interested person” of the fund within the meaning of the Investment Company Act of 1940. |
| 2 | Trustees and officers of the fund serve until their resignation, removal or retirement. |
| 3 | This includes all directorships (other than the fund or other funds managed by Capital Research and Management Company or its affiliates) that are held by each trustee as a trustee or director of a public company or its affiliates. Unless otherwise noted, all directorships are current. |
| 4 | The term interested trustee refers to a trustee who is an “interested person” of the fund within the meaning of the Investment Company Act of 1940, on the basis of his or her affiliation with the fund’s investment adviser, Capital Research and Management Company, or affiliated entities (including the fund’s principal underwriter). |
| 5 | All of the trustees and/or officers listed are officers and/or directors/trustees of one or more of the other funds for which Capital Research and Management Company serves as investment adviser. |
| 6 | Company affiliated with Capital Research and Management Company. |
| 24 | Capital Group U.S. Equity Fund |
Office of the fund
6455 Irvine Center Drive
Irvine, CA 92618-4518
Investment adviser
Capital Research and Management Company
333 South Hope Street
Los Angeles, CA 90071-1406
Transfer agent for shareholder accounts
American Funds Service Company
(Write to the address near you.)
P.O. Box 6007
Indianapolis, IN 46206-6007
P.O. Box 2280
Norfolk, VA 23501-2280
Custodian of assets
State Street Bank and Trust Company
One Lincoln Street
Boston, MA 02111
Counsel
Morgan, Lewis & Bockius LLP
One Federal Street
Boston, MA 02110-1726
Independent registered public accounting firm
PricewaterhouseCoopers LLP
601 South Figueroa Street
Los Angeles, CA 90017-3874
Principal underwriter
American Funds Distributors, Inc.
333 South Hope Street
Los Angeles, CA 90071-1406
Investors should carefully consider investment objectives, risks, charges and expenses. This and other important information is contained in the fund prospectus, which can be obtained from Capital Research and Management Company by calling (800) 266-9532 and should be read carefully before investing.
Capital Group Private Client Services files a complete list of its portfolio holdings with the U.S. Securities and Exchange Commission (SEC) for the first and third quarters of each fiscal year on Form NPORT-P. This filing is available free of charge on the SEC website (www.sec.gov). Additionally, the list of portfolio holdings is available by calling your relationship manager at (800) 266-9532.
The proxy voting procedures and policies of Capital Group U.S. Equity Fund — which describe how we vote proxies relating to portfolio securities — are available upon request by calling your relationship manager at (800) 266-9532. The fund files its proxy voting record with the SEC for the 12 months ended June 30 by August 31. The report also is available on the SEC website or by calling your relationship manager.
Standard & Poor’s 500 Composite Index (“Index”) is a product of S&P Dow Jones Indices LLC and/or its affiliates and has been licensed for use by Capital Group. Copyright© 2020 S&P Dow Jones Indices LLC, a division of S&P Global, and/or its affiliates. All rights reserved. Redistribution or reproduction in whole or in part is prohibited without written permission of S&P Dow Jones Indices LLC.
If used as sales material after December 31, 2020, this report must be accompanied by the Capital Group U.S. Equity Fund Quarterly Results document for the most recently completed calendar quarter.
American Funds Distributors, Inc., member FINRA.
All Capital Group trademarks mentioned are owned by The Capital Group Companies, Inc., an affiliated company or fund. All other company and product names mentioned are the property of their respective companies.

ITEM 2 – Code of Ethics
The Registrant has adopted a Code of Ethics that applies to its Principal Executive Officer and Principal Financial Officer. The Registrant undertakes to provide to any person without charge, upon request, a copy of the Code of Ethics. Such request can be made by calling 800/421-4225 or to the Secretary of the Registrant, 6455 Irvine Center Drive, Irvine, California 92618.
ITEM 3 – Audit Committee Financial Expert
The Registrant’s board has determined that Pablo R. González Guajardo, a member of the Registrant’s audit committee, is an “audit committee financial expert” and "independent," as such terms are defined in this Item. This designation will not increase the designee’s duties, obligations or liability as compared to his or her duties, obligations and liability as a member of the audit committee and of the board, nor will it reduce the responsibility of the other audit committee members. There may be other individuals who, through education or experience, would qualify as "audit committee financial experts" if the board had designated them as such. Most importantly, the board believes each member of the audit committee contributes significantly to the effective oversight of the Registrant’s financial statements and condition.
ITEM 4 – Principal Accountant Fees and Services
| a) Audit Fees: | | |
| Audit | 2019* | 31,000 |
| | 2020 | 38,000 |
| | | |
| b) Audit-Related Fees: | | |
| | 2019* | None |
| | 2020 | None |
| | | |
| c) Tax Fees: | | |
| | 2019* | 7,000 |
| | 2020 | 7,000 |
| | The tax fees consist of professional services relating to the preparation of the Registrant’s tax returns. | |
| | | |
| d) All Other Fees: | | |
| | 2019* | None |
| | 2020 | None |
| | | |
| | Adviser and affiliates (includes only fees for non-audit services billed to the adviser and affiliates for engagements that relate directly to the operations and financial reporting of the Registrant and were subject to the pre-approval policies described below): | |
| a) Audit Fees: | | |
| | Not Applicable | |
| | | |
| b) Audit-Related Fees: | | |
| | 2019* | None |
| | 2020 | None |
| | The audit-related fees consist of assurance and related services relating to the examination of the Registrant’s transfer agent, principal underwriter and investment adviser conducted in accordance with Statement on Standards for Attestation Engagements Number 18 issued by the American Institute of Certified Public Accountants. | |
| | | |
| c) Tax Fees: | | |
| | 2019* | None |
| | 2020 | 15,000 |
| | The tax fees consist of consulting services relating to the Registrant’s investments. | |
| | | |
| | | |
| d) All Other Fees: | | |
| | 2019* | None |
| | 2020 | 8,000 |
| | The other fees consist of subscription services related to an accounting research tool. | |
| | | |
| | | |
| | All audit and permissible non-audit services that the Registrant’s audit committee considers compatible with maintaining the independent registered public accounting firm’s independence are required to be pre-approved by the committee. The pre-approval requirement will extend to all non-audit services provided to the Registrant, the investment adviser, and any entity controlling, controlled by, or under common control with the investment adviser that provides ongoing services to the Registrant, if the engagement relates directly to the operations and financial reporting of the Registrant. The committee will not delegate its responsibility to pre-approve these services to the investment adviser. The committee may delegate to one or more committee members the authority to review and pre-approve audit and permissible non-audit services. Actions taken under any such delegation will be reported to the full committee at its next meeting. The pre-approval requirement is waived with respect to non-audit services if certain conditions are met. The pre-approval requirement was not waived for any of the non-audit services listed above provided to the Registrant, adviser and affiliates. | |
| | | |
| | Aggregate non-audit fees paid to the Registrant’s auditors, including fees for all services billed to the Registrant, adviser and affiliates that provide ongoing services to the Registrant, were $7,000 for fiscal year 2019* and $31,000 for fiscal year 2020. The non-audit services represented by these amounts were brought to the attention of the committee and considered to be compatible with maintaining the auditors’ independence. | |
*The 2019 amount represents audit fees for the fund that were previously included in the prior registrant. The fund reorganized and became its own registrant on 11/8/2019.
ITEM 5 – Audit Committee of Listed Registrants
Not applicable to this Registrant, insofar as the Registrant is not a listed issuer as defined in Rule 10A-3 under the Securities Exchange Act of 1934.
ITEM 6 – Schedule of Investments
Not applicable, insofar as the schedule is included as part of the report to shareholders filed under Item 1 of this Form.
ITEM 7 – Disclosure of Proxy Voting Policies and Procedures for Closed-End Management Investment Companies
Not applicable to this Registrant, insofar as the Registrant is not a closed-end management investment company.
ITEM 8 – Portfolio Managers of Closed-End Management Investment Companies
Not applicable to this Registrant, insofar as the Registrant is not a closed-end management investment company.
ITEM 9 – Purchases of Equity Securities by Closed-End Management Investment Company and Affiliated Purchasers
Not applicable to this Registrant, insofar as the Registrant is not a closed-end management investment company.
ITEM 10 – Submission of Matters to a Vote of Security Holders
There have been no material changes to the procedures by which shareholders may recommend nominees to the Registrant’s board of trustees since the Registrant last submitted a proxy statement to its shareholders. The procedures are as follows. The Registrant has a nominating committee comprised solely of persons who are not considered ‘‘interested persons’’ of the Registrant within the meaning of the Investment Company Act of 1940, as amended. The committee periodically reviews such issues as the board’s composition, responsibilities, committees, compensation and other relevant issues, and recommends any appropriate changes to the full board of trustees. While the committee normally is able to identify from its own resources an ample number of qualified candidates, it will consider shareholder suggestions of persons to be considered as nominees to fill future vacancies on the board. Such suggestions must be sent in writing to the nominating committee of the Registrant, c/o the Registrant’s Secretary, and must be accompanied by complete biographical and occupational data on the prospective nominee, along with a written consent of the prospective nominee for consideration of his or her name by the nominating committee.
ITEM 11 – Controls and Procedures
| (a) | The Registrant’s Principal Executive Officer and Principal Financial Officer have concluded, based on their evaluation of the Registrant’s disclosure controls and procedures (as such term is defined in Rule 30a-3 under the Investment Company Act of 1940), that such controls and procedures are adequate and reasonably designed to achieve the purposes described in paragraph (c) of such rule. |
| | |
| (b) | There were no changes in the Registrant’s internal controls over financial reporting (as defined in Rule 30a-3(d) under the Investment Company Act of 1940) that occurred during the Registrant’s semi-annual period covered by this report that has materially affected, or is reasonably likely to materially affect, the Registrant’s internal control over financial reporting. |
ITEM 12 – Exhibits
| (a)(1) | The Code of Ethics that is the subject of the disclosure required by Item 2 is attached as an exhibit hereto. |
| | |
| (a)(2) | The certifications required by Rule 30a-2 of the Investment Company Act of 1940 and Sections 302 and 906 of the Sarbanes-Oxley Act of 2002 are attached as exhibits hereto. |
SIGNATURES
Pursuant to the requirements of the Securities Exchange Act of 1934 and the Investment Company Act of 1940, the Registrant has duly caused this report to be signed on its behalf by the undersigned, thereunto duly authorized.
| | CAPITAL GROUP U.S. EQUITY FUND |
| | |
| | By __/s/ John S. Armour________________ |
| | John S. Armour, President and Principal Executive Officer |
| | |
| | Date: December 31, 2020 |
Pursuant to the requirements of the Securities Exchange Act of 1934 and the Investment Company Act of 1940, this report has been signed below by the following persons on behalf of the Registrant and in the capacities and on the dates indicated.
| By _ /s/ John S. Armour_____________ |
John S. Armour, President and Principal Executive Officer |
| |
| Date: December 31, 2020 |
| By ___/s/ Gregory F. Niland__________________ |
Gregory F. Niland, Treasurer and Principal Financial Officer |
| |
| Date: December 31, 2020 |