UNITED STATES
SECURITIES AND EXCHANGE COMMISSION
Washington, D.C. 20549
FORM N-CSR
Certified Shareholder Report of
Registered Management Investment Companies
Investment Company Act File Number: 811-23469
Capital Group U.S. Equity Fund
(Exact Name of Registrant as Specified in Charter)
6455 Irvine Center Drive
Irvine, California 92618
(Address of Principal Executive Offices)
Registrant's telephone number, including area code: (949) 975-5000
Date of fiscal year end: October 31
Date of reporting period: October 31, 2023
Gregory F. Niland
Capital Group U.S. Equity Fund
5300 Robin Hood Road
Norfolk, Virginia 23513
(Name and Address of Agent for Service)
ITEM 1 – Reports to Stockholders
 | Capital Group U.S. Equity Fund Annual report
for the year ended
October 31, 2023 |
| | |

A U.S.-focused approach
to seeking prudent growth
and preserving wealth
Capital Group U.S. Equity Fund seeks to provide prudent growth of capital and conservation of principal.
This fund is one of more than 40 offered by Capital Group, home of American Funds, one of the nation’s largest mutual fund families. For over 90 years, Capital Group has invested with a long-term focus based on thorough research and attention to risk.
Fund results shown in this report are at net asset value. Results are for past periods and are not predictive of results for future periods. Current and future results may be lower or higher than those shown. Prices and returns will vary, so investors may lose money. Investing for short periods makes losses more likely. For current and month-end results, refer to capitalgroup.com/pcs.
Here are the total returns on a $1,000 investment with all distributions reinvested for periods ended September 30, 2023 (the most recent calendar quarter-end), and the total annual fund operating expense ratios as of the prospectus dated January 1, 2024 (unaudited):
| | | Cumulative
total returns | | Average annual
total returns | | Gross
expense ratio | | Net
expense ratio |
| | | 1 year | | 5 years | | 10 years | | Lifetime* | | |
| | | | | | | | | | | | | | | | | | | | | | | | | |
| Capital Group U.S. Equity Fund | | | 16.89 | % | | | 9.14 | % | | | 10.50 | % | | | 10.32 | % | | | 0.44 | % | | | 0.43 | % |
| * | Since April 1, 2011. The fund is newly organized for the purpose of effecting the reorganization of Capital Group U.S. Equity Fund (the “predecessor fund”) into a new Delaware statutory trust. The fund acquired the assets and assumed the liabilities of the predecessor fund on November 8, 2019, and the predecessor fund is the accounting and performance survivor of the reorganization. This means that the predecessor fund’s performance and financial history have been adopted by the fund and will be used going forward from the date of reorganization. Except where the context indicates otherwise, all references herein to the “fund” include the predecessor fund prior to November 8, 2019. In connection with the reorganization, former shareholders of the predecessor fund received shares of the fund. The performance of the fund includes the performance of the predecessor fund prior to the reorganization. The inception date shown in the table for the fund is that of the predecessor fund. |
The investment adviser is currently reimbursing a portion of other expenses. This reimbursement will be in effect through at least January 1, 2025. The adviser may elect at its discretion to extend, modify or terminate the reimbursement at that time. Refer to capitalgroup.com/pcs for more information.
Investments are not FDIC-insured, nor are they deposits of or guaranteed by a bank or any other entity, so they may lose value.
Contents
Fellow investors:
Indexes focused on the U.S. advanced during the 12 months ended October 31, 2023, due largely to explosive returns in a handful of stocks in the communication services and information technology sectors. Results across much of the rest of the market were mixed as investors grappled with a series of shifting economic signals. The period began with worries about a possible recession but ended with optimism about a potential “soft landing.”
Markets and economy
The fund year was marked by swings in investor sentiment as economic and geopolitical developments flashed occasionally conflicting signals. Overall, stocks proved hardier than many investors had anticipated, due partly to unexpected economic resilience.
The period started on a down note as elevated inflation, aggressive interest rate increases and global political instability spurred economic uncertainty. The S&P 500 seesawed between optimism and pessimism in the first half. Positives such as slowing inflation were offset by higher interest rates and falling bond prices, most notably illustrated by the collapse of several U.S. regional banks in March.
The second half was brighter. U.S. indices surged, largely due to excitement around a small slice of technology-focused companies that stood to gain from enthusiasm over artificial intelligence. Federal Reserve measures to tame inflation seemed to slow price growth without damaging the economy, raising hope of a “soft landing.” For the year ended in October, 12-month CPI growth slowed by more than 4 percentage points, while unemployment hovered below 4%. The Fed seemed to signal that it was satisfied with the situation and made no changes to rates during its last two meetings of the fund year.
Portfolio review
The Capital Group U.S. Equity Fund rose 7.8% for the period. That trailed its benchmark, the S&P 500 Index*, which gained 10.14%. Considered alongside the fund’s superior results during the previous year, the returns underscore the fund’s core objective of participating in rising markets while seeking to protect capital during periodic downdrafts. The fund had significant underweight positions in communication services and information technology, the twin sectors that drove the lion’s share of index gains. However, the fund notched strong excess returns
Results at a glance
For periods ended October 31, 2023, with all distributions reinvested
| | | Cumulative
total returns | | Average annual total returns |
| | | 1 year | | 5 years | | 10 years | | Lifetime1 |
| | | | | | | | | |
| Capital Group U.S. Equity Fund2 | | | 7.80 | % | | | 10.40 | % | | | 10.00 | % | | | 10.19 | % |
| S&P 500 Index3 | | | 10.14 | | | | 11.01 | | | | 11.18 | | | | 11.70 | |
| Lipper Growth & Income Funds Average4 | | | 5.09 | | | | 7.28 | | | | 7.58 | | | | 8.41 | |
Past results are not predictive of results in future periods.
| 1 | Since April 1, 2011. |
| 2 | The fund is newly organized for the purpose of effecting the reorganization of Capital Group U.S. Equity Fund (the “predecessor fund”) into a new Delaware statutory trust. The fund acquired the assets and assumed the liabilities of the predecessor fund on November 8, 2019, and the predecessor fund is the accounting and performance survivor of the reorganization. This means that the predecessor fund’s performance and financial history have been adopted by the fund and will be used going forward from the date of reorganization. Except where the context indicates otherwise, all references herein to the “fund” include the predecessor fund prior to November 8, 2019. In connection with the reorganization, former shareholders of the predecessor fund received shares of the fund. The performance of the fund includes the performance of the predecessor fund prior to the reorganization. The inception date shown in the table for the fund is that of the predecessor fund. |
| 3 | S&P source: S&P Dow Jones Indices LLC. The market index is unmanaged and, therefore, has no expenses. Investors cannot invest directly in an index. |
| 4 | Lipper source: Refinitiv Lipper. Results for the Lipper averages do not reflect sales charges. Lipper averages reflect the current composition of all eligible mutual funds (all share classes) within a given category. |
| | |
| Capital Group U.S. Equity Fund | 1 |
across a variety of other sectors, showcasing its diversity and flexibility.
The fund’s top contributors relative to the index reflected that broad scope, with the health care, consumer discretionary, materials and financial companies sectors all ranking highly. The largest contributors included Broadcom, a global semiconductor maker, which gained on expectations of burgeoning demand for AI-enabling microprocessors. Shares of biotechnology firm Seagen, known for its powerful cancer drugs, rose after drugmaker Pfizer won approval to purchase the researcher. Danish diabetes-focused health care company Novo Nordisk soared on the success of its new weight-loss drug, Wegovy. Fast-casual restaurant Chipotle Mexican Grill grew on strong execution, reflected in generally steady earnings growth and its deft handling of rising prices.
Several of the fund’s detractors offered strong absolute returns, but weighed on the fund relative to the index because our portfolio managers held them in moderation due to their history of volatility. Meta Platforms, the parent company of Facebook, was the most noteworthy example, but that was also the case with Amazon.com, the technology company and online retailer. The businesses enjoyed strong third-quarter earnings reports and are well-poised to take advantage of advances in AI applications.
Others were more traditional detractors. Dollar General, a chain of discount stores, fell after it cut its sales and profit outlook, citing higher levels of theft and slower than expected spending on nonessential purchases. Defense and aerospace company Northrop Grumman reported weaker than expected profit, due to thinning margins.
The fund’s mantra of sensible growth and capital preservation was illustrated in the form of two stocks it doesn’t hold, partly due to their history of volatility: Nvidia and Tesla. Nvidia, a chipmaker with a large AI business, recorded powerful growth over the past year, making it the single largest detractor for the fund relative to the index. In contrast, one of the fund’s top relative contributors for the period was electric vehicle maker Tesla. Its shares fell after a soft third-quarter earnings report and a more-cautious outlook enunciated by CEO Elon Musk. That boosted the fund’s relative results because it does not hold the company.
Market outlook
Though the U.S. economy has softened on some axes in recent months, the consensus view of Capital Group economists is that a soft landing is an increasingly likely scenario. Inflation has trended down for more than a year and is expected to continue doing so in 2024. Wages appear set to grow in real terms — a rarity during a recession, and a favorable sign for U.S. consumers. Additionally, many industries experienced recession-like downturns in recent years, suggesting that some of the weaknesses in the economy may have been purged already.
Capital Group economists do not expect the Fed to significantly trim interest rates in the coming year. Though inflation has fallen, it remains elevated and there are several potential sources of pricing pressure, such as higher wages, that could undo the central bank’s work if it acts too aggressively.
Our portfolio managers see opportunities in a variety of industries and fields outside of the narrow band of technology stocks that drove growth in 2023. The “Magnificent Seven” of Amazon, Apple, Google, Meta, Microsoft, Nvidia and Tesla made up more than a quarter of the S&P 500* at the end of the fund year, an unusually heavy level of concentration. In addition to the traditional risks of limited diversification, a Capital Group analysis shows that periods of very high concentration have historically been followed by superior returns in the broad market — a potential tailwind for the fund’s risk-averse positioning.
Regardless of what the future holds, we believe the Capital Group U.S. Equity Fund is well-situated to continue to pursue its goals of protecting capital while enjoying gains during up markets.
As always, we thank you for your trust and continued investment.
Sincerely,

William L. Robbins
President
December 14, 2023
| * | S&P 500 Index is a market capitalization-weighted index based on the results of approximately 500 widely held common stocks. This index is unmanaged, and its results include reinvested dividends and/or distributions but do not reflect the effect of sales charges, commissions, account fees, expenses or U.S. federal income taxes. Investors cannot invest directly in an index. Past results are not predictive of results in future periods. Source: S&P Dow Jones Indices LLC. |
Refer to the fund’s prospectuses and the Risk Factors section of this report for more information on risks associated with investing in the fund.
| 2 | Capital Group U.S. Equity Fund |
The value of a $10,000 investment
How a hypothetical $10,000 investment has grown
(for the period April 1, 2011, to October 31, 2023)
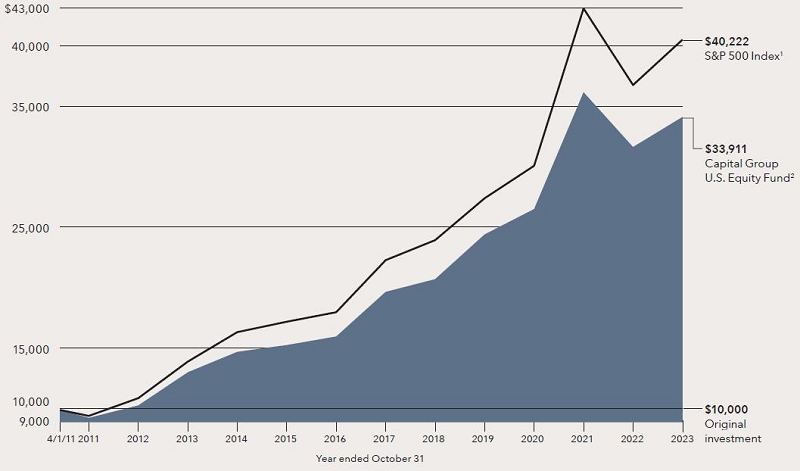
| 1 | The S&P 500 Index is a market capitalization-weighted index based on the results of approximately 500 widely held common stocks. This index is unmanaged, and its results include reinvested dividends and/or distributions but do not reflect the effect of sales charges, commissions, account fees, expenses or U.S. federal income taxes. Investors cannot invest directly in an index. Source: S&P Dow Jones Indices LLC. |
| 2 | Includes reinvested dividends and capital gain distributions. |
Results are for past periods and are not predictive of results for future periods. Current and future results may be lower or higher than those shown. The results shown are before taxes on fund distributions and sale of fund shares.
Total returns based on a hypothetical $1,000 investment (for periods ended October 31, 2023)
| | | Cumulative | | Average Annual |
| | | 1 year | | 5 years | | 10 years | | Lifetime1 |
| | | | | | | | | |
| Capital Group U.S. Equity Fund | | | 7.80 | % | | | 10.40 | % | | | 10.00 | % | | | 10.19 | % |
Investment results assume all distributions are reinvested and reflect applicable fees and expenses. When applicable, results reflect fee waivers and/or expense reimbursements, without which they would have been lower. Refer to capitalgroup.com/pcs for more information.
| Capital Group U.S. Equity Fund | 3 |
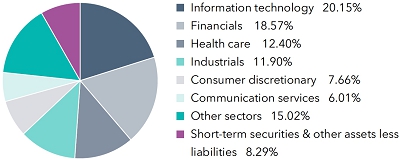
Investment portfolio
| Sector diversification | Percent of net assets |
| | |
 |
| |
| Country diversification by domicile | | Percent of
net assets |
| United States | | | 86.48 | % |
| Eurozone* | | | 2.46 | |
| United Kingdom | | | 1.35 | |
| Denmark | | | 1.09 | |
| Switzerland | | | .33 | |
| Short-term securities & other assets less liabilities | | | 8.29 | |
| * | Countries using the euro as a common currency; those represented in the fund’s portfolio are Belgium, France and the Netherlands. |
| | |
| Common stocks 91.71% | | Shares | | | Value
(000) | |
| Information technology 20.15% | | | | | | | | |
| Microsoft Corp. | | | 57,820 | | | $ | 19,550 | |
| Apple, Inc. | | | 54,104 | | | | 9,239 | |
| Broadcom, Inc. | | | 10,847 | | | | 9,126 | |
| ASML Holding NV (ADR) | | | 7,944 | | | | 4,757 | |
| KLA Corp. | | | 9,356 | | | | 4,395 | |
| ServiceNow, Inc.1 | | | 4,817 | | | | 2,803 | |
| Salesforce, Inc.1 | | | 13,830 | | | | 2,777 | |
| Trimble, Inc.1 | | | 32,518 | | | | 1,533 | |
| GoDaddy, Inc., Class A1 | | | 19,188 | | | | 1,405 | |
| Atlassian Corp., Class A1 | | | 7,726 | | | | 1,396 | |
| Analog Devices, Inc. | | | 7,202 | | | | 1,133 | |
| Micron Technology, Inc. | | | 16,741 | | | | 1,119 | |
| Adobe, Inc.1 | | | 1,848 | | | | 983 | |
| Intel Corp. | | | 16,544 | | | | 604 | |
| Applied Materials, Inc. | | | 1,821 | | | | 241 | |
| | | | | | | | 61,061 | |
| |
| Financials 18.57% | | | | | | | | |
| Visa, Inc., Class A | | | 53,354 | | | | 12,544 | |
| Marsh & McLennan Companies, Inc. | | | 54,852 | | | | 10,403 | |
| JPMorgan Chase & Co. | | | 34,321 | | | | 4,773 | |
| Aon PLC, Class A | | | 13,527 | | | | 4,185 | |
| Wells Fargo & Co. | | | 80,903 | | | | 3,218 | |
| Arthur J. Gallagher & Co. | | | 11,811 | | | | 2,781 | |
| Progressive Corp. | | | 17,354 | | | | 2,743 | |
| Chubb, Ltd. | | | 11,135 | | | | 2,390 | |
| CME Group, Inc., Class A | | | 9,975 | | | | 2,129 | |
| PNC Financial Services Group, Inc. | | | 17,734 | | | | 2,030 | |
| MSCI, Inc. | | | 4,200 | | | | 1,980 | |
| Jack Henry & Associates, Inc. | | | 10,922 | | | | 1,540 | |
| State Street Corp. | | | 19,849 | | | | 1,283 | |
| London Stock Exchange Group PLC (ADR) | | | 45,369 | | | | 1,155 | |
| Moody’s Corp. | | | 3,223 | | | | 993 | |
| Mastercard, Inc., Class A | | | 2,478 | | | | 933 | |
| Citizens Financial Group, Inc. | | | 33,722 | | | | 790 | |
| Morgan Stanley | | | 2,939 | | | | 208 | |
| S&P Global, Inc. | | | 565 | | | | 197 | |
| | | | | | | | 56,275 | |
| |
| Health care 12.40% | | | | | | | | |
| UnitedHealth Group, Inc. | | | 12,196 | | | | 6,532 | |
| Abbott Laboratories | | | 45,906 | | | | 4,341 | |
| Eli Lilly and Co. | | | 6,407 | | | | 3,549 | |
| Danaher Corp. | | | 17,979 | | | | 3,452 | |
| | |
| 4 | Capital Group U.S. Equity Fund |
| Common stocks (continued) | | Shares | | | Value
(000) | |
| Health care (continued) | | | | | | | | |
| Regeneron Pharmaceuticals, Inc.1 | | | 4,388 | | | $ | 3,422 | |
| Novo Nordisk AS, Class B (ADR) | | | 34,200 | | | | 3,303 | |
| AstraZeneca PLC (ADR) | | | 46,548 | | | | 2,943 | |
| Elevance Health, Inc. | | | 5,492 | | | | 2,472 | |
| Johnson & Johnson | | | 15,069 | | | | 2,235 | |
| Edwards Lifesciences Corp.1 | | | 32,382 | | | | 2,063 | |
| CVS Health Corp. | | | 15,535 | | | | 1,072 | |
| Alnylam Pharmaceuticals, Inc.1 | | | 5,031 | | | | 764 | |
| Zoetis, Inc., Class A | | | 4,720 | | | | 741 | |
| Karuna Therapeutics, Inc.1 | | | 2,800 | | | | 467 | |
| AbbVie, Inc. | | | 1,539 | | | | 217 | |
| | | | | | | | 37,573 | |
| |
| Industrials 11.90% | | | | | | | | |
| Waste Connections, Inc. | | | 41,191 | | | | 5,334 | |
| Northrop Grumman Corp. | | | 7,847 | | | | 3,699 | |
| Carrier Global Corp. | | | 59,542 | | | | 2,838 | |
| TransDigm Group, Inc.1 | | | 3,385 | | | | 2,803 | |
| AMETEK, Inc. | | | 16,268 | | | | 2,290 | |
| CSX Corp. | | | 74,478 | | | | 2,223 | |
| ITT, Inc. | | | 22,129 | | | | 2,066 | |
| Airbus Group SE (ADR) | | | 50,200 | | | | 1,676 | |
| Norfolk Southern Corp. | | | 8,296 | | | | 1,583 | |
| General Electric Co. | | | 12,353 | | | | 1,342 | |
| FedEx Corp. | | | 5,375 | | | | 1,290 | |
| Honeywell International, Inc. | | | 6,570 | | | | 1,204 | |
| Deere & Co. | | | 3,200 | | | | 1,169 | |
| Saia, Inc.1 | | | 3,070 | | | | 1,101 | |
| United Airlines Holdings, Inc.1 | | | 26,934 | | | | 943 | |
| RTX Corp. | | | 11,530 | | | | 938 | |
| Union Pacific Corp. | | | 4,301 | | | | 893 | |
| Veralto Corp.1 | | | 11,991 | | | | 827 | |
| HEICO Corp., Class A | | | 3,000 | | | | 382 | |
| HEICO Corp. | | | 2,400 | | | | 380 | |
| Lincoln Electric Holdings, Inc. | | | 4,031 | | | | 705 | |
| Equifax, Inc. | | | 1,211 | | | | 205 | |
| Vestis Corp.1 | | | 10,275 | | | | 157 | |
| | | | | | | | 36,048 | |
| |
| Consumer discretionary 7.66% | | | | | | | | |
| Chipotle Mexican Grill, Inc.1 | | | 2,817 | | | | 5,471 | |
| NIKE, Inc., Class B | | | 33,841 | | | | 3,478 | |
| Hilton Worldwide Holdings, Inc. | | | 21,144 | | | | 3,204 | |
| Amazon.com, Inc.1 | | | 21,555 | | | | 2,869 | |
| YUM! Brands, Inc. | | | 16,476 | | | | 1,991 | |
| Tractor Supply Co. | | | 9,524 | | | | 1,834 | |
| Marriott International, Inc., Class A | | | 5,117 | | | | 965 | |
| Churchill Downs, Inc. | | | 7,614 | | | | 836 | |
| Darden Restaurants, Inc. | | | 4,900 | | | | 713 | |
| Aramark | | | 25,351 | | | | 682 | |
| Burlington Stores, Inc.1 | | | 5,198 | | | | 629 | |
| TJX Companies, Inc. | | | 3,710 | | | | 327 | |
| Royal Caribbean Cruises, Ltd.1 | | | 2,570 | | | | 218 | |
| | | | | | | | 23,217 | |
| |
| Communication services 6.01% | | | | | | | | |
| Alphabet, Inc., Class C1 | | | 58,326 | | | | 7,308 | |
| Comcast Corp., Class A | | | 74,295 | | | | 3,068 | |
| Charter Communications, Inc., Class A1 | | | 6,474 | | | | 2,608 | |
| Take-Two Interactive Software, Inc.1 | | | 14,469 | | | | 1,935 | |
| Meta Platforms, Inc., Class A1 | | | 6,036 | | | | 1,818 | |
| Electronic Arts, Inc. | | | 11,887 | | | | 1,472 | |
| | | | | | | | 18,209 | |
| | |
| Capital Group U.S. Equity Fund | 5 |
| Common stocks (continued) | | Shares | | | Value
(000) | |
| Consumer staples 4.04% | | | | | | | | |
| Philip Morris International, Inc. | | | 41,540 | | | $ | 3,704 | |
| Church & Dwight Co., Inc. | | | 20,904 | | | | 1,901 | |
| Mondelez International, Inc. | | | 16,204 | | | | 1,073 | |
| Anheuser-Busch InBev SA/NV (ADR)2 | | | 17,900 | | | | 1,018 | |
| Nestlé SA (ADR) | | | 9,255 | | | | 997 | |
| Molson Coors Beverage Co., Class B, restricted voting shares | | | 14,354 | | | | 829 | |
| Kraft Heinz Co. | | | 23,494 | | | | 739 | |
| Estée Lauder Companies, Inc. (The), Class A | | | 5,140 | | | | 663 | |
| Hormel Foods Corp. | | | 17,200 | | | | 560 | |
| General Mills, Inc. | | | 8,459 | | | | 552 | |
| Constellation Brands, Inc., Class A | | | 881 | | | | 206 | |
| | | | | | | | 12,242 | |
| |
| Utilities 3.46% | | | | | | | | |
| Constellation Energy Corp. | | | 29,853 | | | | 3,371 | |
| PG&E Corp.1 | | | 140,048 | | | | 2,283 | |
| Sempra | | | 24,988 | | | | 1,750 | |
| CenterPoint Energy, Inc. | | | 45,667 | | | | 1,227 | |
| Southern Co. (The) | | | 12,096 | | | | 814 | |
| AES Corp. | | | 48,597 | | | | 724 | |
| CMS Energy Corp. | | | 4,046 | | | | 220 | |
| Edison International | | | 1,500 | | | | 95 | |
| | | | | | | | 10,484 | |
| |
| Energy 3.33% | | | | | | | | |
| ConocoPhillips | | | 51,887 | | | | 6,164 | |
| Chevron Corp. | | | 15,538 | | | | 2,264 | |
| EOG Resources, Inc. | | | 11,159 | | | | 1,409 | |
| Exxon Mobil Corp. | | | 2,438 | | | | 258 | |
| | | | | | | | 10,095 | |
| |
| Materials 2.55% | | | | | | | | |
| Linde PLC | | | 17,666 | | | | 6,751 | |
| Sherwin-Williams Co. | | | 4,110 | | | | 979 | |
| | | | | | | | 7,730 | |
| |
| Real estate 1.64% | | | | | | | | |
| Equinix, Inc. REIT | | | 5,911 | | | | 4,313 | |
| Public Storage REIT | | | 2,751 | | | | 657 | |
| | | | | | | | 4,970 | |
| | | | | | | | | |
| Total common stocks (cost: $148,519,000) | | | | | | | 277,904 | |
| |
| Short-term securities 7.46% | | | | | | | | |
| Money market investments 7.17% | | | | | | | | |
| Capital Group Central Cash Fund 5.45%3,4 | | | 217,101 | | | | 21,710 | |
| | |
| 6 | Capital Group U.S. Equity Fund |
| Short-term securities (continued) | | Shares | | | Value
(000) | |
| Money market investments purchased with collateral from securities on loan 0.29% | | | | | | | | |
| Invesco Short-Term Investments Trust – Government & Agency Portfolio, Institutional Class 5.27%3,5 | | | 494,015 | | | $ | 494 | |
| State Street Institutional U.S. Government Money Market Fund, Institutional Class 5.27%3,5 | | | 394,720 | | | | 395 | |
| | | | | | | | 889 | |
| | | | | | | | | |
| Total short-term securities (cost: $22,599,000) | | | | | | | 22,599 | |
| Total investment securities 99.17% (cost: $171,118,000) | | | | | | | 300,503 | |
| Other assets less liabilities 0.83% | | | | | | | 2,509 | |
| | | | | | | | | |
| Net assets 100.00% | | | | | | $ | 303,012 | |
Investments in affiliates4
| | | Value at
11/1/2022
(000) | | | Additions
(000) | | | Reductions
(000) | | | Net
realized
gain (loss)
(000) | | | Net
unrealized
appreciation
(depreciation)
(000) | | | Value at
10/31/2023
(000) | | | Dividend
or interest
income
(000) | |
| Short-term securities 7.17% | | | | | | | | | | | | | | | | | | | | | | | | | | | | |
| Money market investments 7.17% | | | | | | | | | | | | | | | | | | | | | | | | | | | | |
| Capital Group Central Cash Fund 5.45%3 | | $ | 16,181 | | | $ | 66,752 | | | $ | 61,227 | | | $ | 4 | | | $ | — | 6 | | $ | 21,710 | | | $ | 729 | |
| Money market investments purchased with collateral from securities on loan 0.00% | | | | | | | | | | | | | | | | | | | | | | | | | | | | |
| Capital Group Central Cash Fund 5.45%3 | | | 715 | | | | | | | | 715 | 7 | | | | | | | | | | | — | | | | — | 8 |
| Total 7.17% | | | | | | | | | | | | | | $ | 4 | | | $ | — | 6 | | $ | 21,710 | | | $ | 729 | |
| | |
| 1 | Security did not produce income during the last 12 months. |
| 2 | All or a portion of this security was on loan. The total value of all such securities was $966,000, which represented .32% of the net assets of the fund. Refer to Note 5 for more information on securities lending. |
| 3 | Rate represents the seven-day yield at 10/31/2023. |
| 4 | Part of the same “group of investment companies” as the fund as defined under the Investment Company Act of 1940, as amended. |
| 5 | Security purchased with cash collateral from securities on loan. Refer to Note 5 for more information on securities lending. |
| 6 | Amount less than one thousand. |
| 7 | Represents net activity. Refer to Note 5 for more information on securities lending. |
| 8 | Dividend income is included with securities lending income in the fund’s statement of operations and is not shown in this table. |
Key to abbreviation(s)
ADR = American Depositary Receipts
REIT = Real Estate Investment Trust
Refer to the notes to financial statements.
| Capital Group U.S. Equity Fund | 7 |
| Financial statements | |
| | |
Statement of assets and liabilities
at October 31, 2023 | (dollars in thousands) |
| Assets: | | | | | | | | |
| Investment securities, at value (includes $966 of investment securities on loan): | | | | | | | | |
| Unaffiliated issuers (cost: $149,408) | | $ | 278,793 | | | | | |
| Affiliated issuers (cost: $21,710) | | | 21,710 | | | $ | 300,503 | |
| Cash | | | | | | | 9 | |
| Cash collateral received for securities on loan | | | | | | | 98 | |
| Receivables for: | | | | | | | | |
| Sales of investments | | | 4,862 | | | | | |
| Services provided by related parties | | | 9 | | | | | |
| Dividends | | | 333 | | | | | |
| Securities lending income | | | — | * | | | | |
| Other | | | 1 | | | | 5,205 | |
| | | | | | | | 305,815 | |
| Liabilities: | | | | | | | | |
| Collateral for securities on loan | | | | | | | 987 | |
| Payables for: | | | | | | | | |
| Purchases of investments | | | 1,707 | | | | | |
| Repurchases of fund’s shares | | | 2 | | | | | |
| Investment advisory services | | | 107 | | | | 1,816 | |
| Net assets at October 31, 2023 | | | | | | $ | 303,012 | |
| | | | | | | | | |
| Net assets consist of: | | | | | | | | |
| Capital paid in on shares of beneficial interest | | | | | | $ | 156,876 | |
| Total distributable earnings | | | | | | | 146,136 | |
| Net assets at October 31, 2023 | | | | | | $ | 303,012 | |
| * | Amount less than one thousand. |
(dollars and shares in thousands, except per-share amounts)
Shares of beneficial interest issued and outstanding (no stated par value) —
unlimited shares authorized (10,457 total shares outstanding)
| | | Net assets | | Shares
outstanding | | Net asset value
per share |
| Class M | | $ | 303,012 | | | | 10,457 | | | $ | 28.98 | |
Refer to the notes to financial statements.
| 8 | Capital Group U.S. Equity Fund |
| Financial statements (continued) | |
| | |
Statement of operations
for the year ended October 31, 2023 | (dollars in thousands) |
| Investment income: | | | | | | | | |
| Income: | | | | | | | | |
| Dividends (net of non-U.S. taxes of $34; also includes $729 from affiliates) | | $ | 5,040 | | | | | |
| Securities lending income (net of fees) | | | 34 | | | | | |
| Interest from unaffiliated issuers | | | 4 | | | $ | 5,078 | |
| Fees and expenses*: | | | | | | | | |
| Investment advisory services | | | 1,243 | | | | | |
| Trustees’ compensation | | | 10 | | | | | |
| Legal | | | 13 | | | | | |
| Other | | | — | † | | | | |
| Total fees and expenses before reimbursement | | | 1,266 | | | | | |
| Less reimbursement of fees and expenses: | | | | | | | | |
| Miscellaneous fee reimbursement | | | 23 | | | | | |
| Total fees and expenses after reimbursement | | | | | | | 1,243 | |
| Net investment income | | | | | | | 3,835 | |
| | | | | | | | | |
| Net realized gain and unrealized appreciation: | | | | | | | | |
| Net realized gain on: | | | | | | | | |
| Investments: | | | | | | | | |
| Unaffiliated issuers | | | 17,413 | | | | | |
| Affiliated issuers | | | 4 | | | | 17,417 | |
| Net unrealized appreciation on: | | | | | | | | |
| Investments: | | | | | | | | |
| Unaffiliated issuers | | | 310 | | | | | |
| Affiliated issuers | | | — | † | | | 310 | |
| Net realized gain and unrealized appreciation | | | | | | | 17,727 | |
| Net increase in net assets resulting from operations | | | | | | $ | 21,562 | |
| * | Additional information related to class-specific fees and expenses is included in the notes to financial statements. |
| † | Amount less than one thousand. |
Refer to the notes to financial statements.
| Capital Group U.S. Equity Fund | 9 |
| Financial statements (continued) | |
| | |
| Statements of changes in net assets | |
| | (dollars in thousands) |
| | | Year ended October 31, |
| | | 2023 | | 2022 |
| Operations: | | | | | | | | |
| Net investment income | | $ | 3,835 | | | $ | 3,341 | |
| Net realized gain | | | 17,417 | | | | 7,809 | |
| Net unrealized appreciation (depreciation) | | | 310 | | | | (52,755 | ) |
| Net increase (decrease) in net assets resulting from operations | | | 21,562 | | | | (41,605 | ) |
| | | | | | | | | |
| Distributions paid to shareholders | | | (10,999 | ) | | | (18,815 | ) |
| | | | | | | | | |
| Net capital share transactions | | | 7,568 | | | | 1,072 | |
| | | | | | | | | |
| Total increase (decrease) in net assets | | | 18,131 | | | | (59,348 | ) |
| | | | | | | | | |
| Net assets: | | | | | | | | |
| Beginning of year | | | 284,881 | | | | 344,229 | |
| End of year | | $ | 303,012 | | | $ | 284,881 | |
Refer to the notes to financial statements.
| 10 | Capital Group U.S. Equity Fund |
Notes to financial statements
1. Organization
Capital Group U.S. Equity Fund (the “fund”) is registered under the Investment Company Act of 1940, as amended (the “1940 Act”), as an open-end, diversified management investment company. The fund seeks to provide prudent growth of capital and conservation of principal.
2. Significant accounting policies
The fund is an investment company that applies the accounting and reporting guidance issued in Topic 946 by the U.S. Financial Accounting Standards Board. The fund’s financial statements have been prepared to comply with U.S. generally accepted accounting principles (“U.S. GAAP”). These principles require the fund’s investment adviser to make estimates and assumptions that affect reported amounts and disclosures. Actual results could differ from those estimates. Subsequent events, if any, have been evaluated through the date of issuance in the preparation of the financial statements. The fund follows the significant accounting policies described in this section, as well as the valuation policies described in the next section on valuation.
Security transactions and related investment income — Security transactions are recorded by the fund as of the date the trades are executed with brokers. Realized gains and losses from security transactions are determined based on the specific identified cost of the securities. In the event a security is purchased with a delayed payment date, the fund will segregate liquid assets sufficient to meet its payment obligations. Dividend income is recognized on the ex-dividend date and interest income is recognized on an accrual basis. Market discounts, premiums and original issue discounts on fixed-income securities are amortized daily over the expected life of the security.
Distributions paid to shareholders — Income dividends and capital gain distributions are recorded on the ex-dividend date.
Currency translation — Assets and liabilities, including investment securities, denominated in currencies other than U.S. dollars are translated into U.S. dollars at the exchange rates supplied by one or more pricing vendors on the valuation date. Purchases and sales of investment securities and income and expenses are translated into U.S. dollars at the exchange rates on the dates of such transactions. The effects of changes in exchange rates on investment securities are included with the net realized gain or loss and net unrealized appreciation or depreciation on investments in the fund’s statement of operations. The realized gain or loss and unrealized appreciation or depreciation resulting from all other transactions denominated in currencies other than U.S. dollars are disclosed separately.
3. Valuation
Capital Research and Management Company (“CRMC”), the fund’s investment adviser, values the fund’s investments at fair value as defined by U.S. GAAP. The net asset value per share is calculated once daily as of the close of regular trading on the New York Stock Exchange, normally 4 p.m. New York time, each day the New York Stock Exchange is open.
Methods and inputs — The fund’s investment adviser uses the following methods and inputs to establish the fair value of the fund’s assets and liabilities. Use of particular methods and inputs may vary over time based on availability and relevance as market and economic conditions evolve.
Equity securities, including depositary receipts, are generally valued at the official closing price of, or the last reported sale price on, the exchange or market on which such securities are traded, as of the close of business on the day the securities are being valued or, lacking any sales, at the last available bid price. Prices for each security are taken from the principal exchange or market on which the security trades.
| Capital Group U.S. Equity Fund | 11 |
Fixed-income securities, including short-term securities, are generally valued at evaluated prices obtained from third-party pricing vendors. Vendors value such securities based on one or more of the inputs described in the following table. The table provides examples of inputs that are commonly relevant for valuing particular classes of fixed-income securities in which the fund is authorized to invest. However, these classifications are not exclusive, and any of the inputs may be used to value any other class of fixed-income security.
| Fixed-income class | | Examples of standard inputs |
| All | | Benchmark yields, transactions, bids, offers, quotations from dealers and trading systems, new issues, spreads and other relationships observed in the markets among comparable securities; and proprietary pricing models such as yield measures calculated using factors such as cash flows, financial or collateral performance and other reference data (collectively referred to as “standard inputs”) |
| Corporate bonds, notes & loans; convertible securities | | Standard inputs and underlying equity of the issuer |
| Bonds & notes of governments & government agencies | | Standard inputs and interest rate volatilities |
Securities with both fixed-income and equity characteristics, or equity securities traded principally among fixed-income dealers, are generally valued in the manner described for either equity or fixed-income securities, depending on which method is deemed most appropriate by the fund’s investment adviser. The Capital Group Central Cash Fund (“CCF”), a fund within the Capital Group Central Fund Series (“Central Funds”), is valued based upon a floating net asset value, which fluctuates with changes in the value of CCF’s portfolio securities. The underlying securities are valued based on the policies and procedures in CCF’s statement of additional information.
Securities and other assets for which representative market quotations are not readily available or are considered unreliable by the fund’s investment adviser are fair valued as determined in good faith under fair valuation guidelines adopted by the fund’s investment adviser and approved by the board of trustees as further described. The investment adviser follows fair valuation guidelines, consistent with U.S. Securities and Exchange Commission rules and guidance, to consider relevant principles and factors when making fair value determinations. The investment adviser considers relevant indications of value that are reasonably and timely available to it in determining the fair value to be assigned to a particular security, such as the type and cost of the security, contractual or legal restrictions on resale of the security, relevant financial or business developments of the issuer, actively traded similar or related securities, dealer or broker quotes, conversion or exchange rights on the security, related corporate actions, significant events occurring after the close of trading in the security, and changes in overall market conditions. In addition, the closing prices of equity securities that trade in markets outside U.S. time zones may be adjusted to reflect significant events that occur after the close of local trading but before the net asset value of each share class of the fund is determined. Fair valuations of investments that are not actively trading involve judgment and may differ materially from valuations that would have been used had greater market activity occurred.
Processes and structure — The fund’s board of trustees has designated the fund’s investment adviser to make fair value determinations, subject to board oversight. The investment adviser has established a Joint Fair Valuation Committee (the “Committee”) to administer, implement and oversee the fair valuation process and to make fair value decisions. The Committee regularly reviews its own fair value decisions, as well as decisions made under its standing instructions to the investment adviser’s valuation team. The Committee reviews changes in fair value measurements from period to period, pricing vendor information and market data, and may, as deemed appropriate, update the fair valuation guidelines to better reflect the results of back testing and address new or evolving issues. Pricing decisions, processes and controls over security valuation are also subject to additional internal reviews facilitated by the investment adviser’s global risk management group. The Committee reports changes to the fair valuation guidelines to the board of trustees. The fund’s board and audit committee also regularly review reports that describe fair value determinations and methods.
Classifications — The fund’s investment adviser classifies the fund’s assets and liabilities into three levels based on the inputs used to value the assets or liabilities. Level 1 values are based on quoted prices in active markets for identical securities. Level 2 values are based on significant observable market inputs, such as quoted prices for similar securities and quoted prices in inactive markets. Certain securities trading outside the U.S. may transfer between Level 1 and Level 2 due to valuation adjustments resulting from significant market movements following the close of local trading. Level 3 values are based on significant unobservable inputs that reflect the investment adviser’s determination of assumptions that market participants might reasonably use in valuing the securities. The valuation levels are not necessarily an indication of the risk or liquidity associated with the underlying investment. For example, U.S. government securities are reflected as Level 2 because the inputs used to determine fair value may not always be quoted prices in an active market. As of October 31, 2023, all of the fund’s investments were classifed as Level 1.
| 12 | Capital Group U.S. Equity Fund |
4. Risk factors
Market conditions — The prices of, and the income generated by, the securities held by the fund may decline — sometimes rapidly or unpredictably — due to various factors, including events or conditions affecting the general economy or particular industries or companies; overall market changes; local, regional or global political, social or economic instability; governmental, governmental agency or central bank responses to economic conditions; changes in inflation rates; and currency exchange rate, interest rate and commodity price fluctuations.
Economies and financial markets throughout the world are highly interconnected. Economic, financial or political events, trading and tariff arrangements, wars, terrorism, cybersecurity events, natural disasters, public health emergencies (such as the spread of infectious disease), bank failures and other circumstances in one country or region, including actions taken by governmental or quasi-governmental authorities in response to any of the foregoing, could have impacts on global economies or markets. As a result, whether or not the fund invests in securities of issuers located in or with significant exposure to the countries affected, the value and liquidity of the fund’s investments may be negatively affected by developments in other countries and regions.
Issuer risks — The prices of, and the income generated by, securities held by the fund may decline in response to various factors directly related to the issuers of such securities, including reduced demand for an issuer’s goods or services, poor management performance, major litigation, investigations or other controversies related to the issuer, changes in the issuer’s financial condition or credit rating, changes in government regulations affecting the issuer or its competitive environment and strategic initiatives such as mergers, acquisitions or dispositions and the market response to any such initiatives. An individual security may also be affected by factors relating to the industry or sector of the issuer or the securities markets as a whole, and conversely an industry or sector or the securities markets may be affected by a change in financial condition or other event affecting a single issuer.
Investing in growth-oriented stocks — Growth-oriented common stocks and other equity-type securities (such as preferred stocks, convertible preferred stocks and convertible bonds) may involve larger price swings and greater potential for loss than other types of investments.
Investing in income-oriented stocks — The value of the fund’s securities and income provided by the fund may be reduced by changes in the dividend policies of, and the capital resources available for dividend payments at, the companies in which the fund invests.
Investing outside the U.S. — Securities of issuers domiciled outside the U.S., or with significant operations or revenues outside the U.S., and securities tied economically to countries outside the U.S., may lose value because of adverse political, social, economic or market developments (including social instability, regional conflicts, terrorism and war) in the countries or regions in which the issuers are domiciled, operate or generate revenue or to which the securities are tied economically. These securities may also lose value due to changes in foreign currency exchange rates against the U.S. dollar and/or currencies of other countries. Issuers of these securities may be more susceptible to actions of foreign governments, such as nationalization, currency blockage or the imposition of price controls, sanctions, or punitive taxes, each of which could adversely impact the value of these securities. Securities markets in certain countries may be more volatile and/or less liquid than those in the U.S. Investments outside the U.S. may also be subject to different regulatory, legal, accounting, auditing, financial reporting and recordkeeping requirements, and may be more difficult to value, than those in the U.S. In addition, the value of investments outside the U.S. may be reduced by foreign taxes, including foreign withholding taxes on interest and dividends. Further, there may be increased risks of delayed settlement of securities purchased or sold by the fund, which could impact the liquidity of the fund’s portfolio. The risks of investing outside the U.S may be heightened in connection with investments in emerging markets.
Management — The investment adviser to the fund actively manages the fund’s investments. Consequently, the fund is subject to the risk that the methods and analyses, including models, tools and data, employed by the investment adviser in this process may be flawed or incorrect and may not produce the desired results. This could cause the fund to lose value or its investment results to lag relevant benchmarks or other funds with similar objectives.
5. Certain investment techniques
Securities lending — The fund has entered into securities lending transactions in which the fund earns income by lending investment securities to brokers, dealers or other institutions. Each transaction involves three parties: the fund, acting as the lender of the securities, a borrower, and a lending agent that acts as an intermediary.
| Capital Group U.S. Equity Fund | 13 |
Securities lending transactions are entered into by the fund under a securities lending agent agreement with the lending agent. The lending agent facilitates the exchange of securities between the fund and approved borrowers, ensures that securities loans are properly coordinated and documented, marks-to-market the value of collateral daily, secures additional collateral from a borrower if it falls below preset terms, and may reinvest cash collateral on behalf of the fund according to agreed parameters. The lending agent provides indemnification to the fund against losses resulting from a borrower default. Although risk is mitigated by the collateral and indemnification, the fund could experience a delay in recovering its securities and a potential loss of income or value if a borrower fails to return securities, collateral investments decline in value or the lending agent fails to perform.
The borrower is required to post highly liquid assets, such as cash or U.S. government securities, as collateral for the loan in an amount at least equal to the value of the securities loaned. Investments made with cash collateral are recognized as assets in the fund’s investment portfolio. The same amount is recorded as a liability in the fund’s statement of assets and liabilities. While securities are on loan, the fund will continue to receive the equivalent of the interest, dividends or other distributions paid by the issuer, as well as a portion of the interest on the investment of the collateral. Additionally, although the fund does not have the right to vote on securities while they are on loan, the fund has a right to consent on corporate actions and a right to recall loaned securities to vote. A borrower is obligated to return loaned securities at the conclusion of a loan or, during the pendency of a loan, on demand from the fund.
As of October 31, 2023, the total value of securities on loan was $966,000, and the total value of collateral received was $987,000, which consisted entirely of cash. Investment securities purchased from cash collateral are disclosed in the fund’s investment portfolio as short-term securities. Securities received as collateral, if any, are not recognized as fund assets. The contractual maturity of cash collateral received under the securities lending agreement is classified as overnight and continuous.
6. Taxation and distributions
Federal income taxation — The fund complies with the requirements under Subchapter M of the Internal Revenue Code applicable to regulated investment companies and intends to distribute substantially all of its net taxable income and net capital gains each year. The fund is not subject to income taxes to the extent such distributions are made. Therefore, no federal income tax provision is required.
As of and during the year ended October 31, 2023, the fund did not have a liability for any unrecognized tax benefits. The fund recognizes interest and penalties, if any, related to unrecognized tax benefits as income tax expense in the statement of operations. During the year, the fund did not incur any significant interest or penalties.
The fund’s tax returns are generally not subject to examination by federal, state and, if applicable, non-U.S. tax authorities after the expiration of each jurisdiction’s statute of limitations, which is typically three years after the date of filing but can be extended in certain jurisdictions.
Non-U.S. taxation — Dividend and interest income are recorded net of non-U.S. taxes paid. The fund may file withholding tax reclaims in certain jurisdictions to recover a portion of amounts previously withheld. These reclaims are recorded when the amount is known and there are no significant uncertainties on collectability. Gains realized by the fund on the sale of securities in certain countries, if any, may be subject to non-U.S. taxes. The fund generally records an estimated deferred tax liability based on unrealized gains to provide for potential non-U.S. taxes payable upon the sale of these securities.
Distributions — Distributions determined on a tax basis may differ from net investment income and net realized gains for financial reporting purposes. These differences are due primarily to different treatment for items such as currency gains and losses and short-term capital gains and losses. The fiscal year in which amounts are distributed may differ from the year in which the net investment income and net realized gains are recorded by the fund for financial reporting purposes. The fund may also designate a portion of the amount paid to redeeming shareholders as a distribution for tax purposes.
During the year ended October 31, 2023, the fund reclassified $958,000 from total distributable earnings to capital paid in on shares of beneficial interest to align financial reporting with tax reporting.
| 14 | Capital Group U.S. Equity Fund |
As of October 31, 2023, the tax basis components of distributable earnings, unrealized appreciation (depreciation) and cost of investments were as follows (dollars in thousands):
| Undistributed ordinary income | | $ | 342 | |
| Undistributed long-term capital gains | | | 16,458 | |
| Gross unrealized appreciation on investments | | | 132,469 | |
| Gross unrealized depreciation on investments | | | (3,133 | ) |
| Net unrealized appreciation on investments | | | 129,336 | |
| Cost of investments | | | 171,167 | |
Distributions paid were characterized for tax purposes as follows (dollars in thousands):
| | | Year ended October 31, 2023 | | Year ended October 31, 2022 |
| Share class | | Ordinary
income | | | Long-term
capital gains | | | Total
distributions
paid | | | Ordinary
income | | | Long-term
capital gains | | | Total
distributions
paid | |
| Class M | | $ | 3,792 | | | $ | 7,207 | | | $ | 10,999 | | | $ | 3,235 | | | $ | 15,580 | | | $ | 18,815 | |
7. Fees and transactions with related parties
CRMC, the fund’s investment adviser, is the parent company of American Funds Distributors®, Inc. (“AFD”), the principal underwriter of the fund’s share, and American Funds Service Company® (“AFS”), the fund’s transfer agent. CRMC, AFD and AFS are considered related parties to the fund.
Investment advisory services — The fund has an investment advisory and service agreement with CRMC that provides for monthly fees accrued daily. For the services it provides to the fund, CRMC receives a unified management fee of 0.425% of the daily net assets of the fund. Out of the fund’s unified management fee CRMC pays all expenses of managing and operating the fund except brokerage expenses, taxes, interest, fees and expenses of the independent trustees (including legal counsel fees) and extraordinary expenses, such as litigation expenses. These expenses, which are not paid by CRMC from the unified management fee, are paid by the fund, which are currently reimbursed by CRMC.
Miscellaneous fee reimbursement — Expense limitations have been imposed through at least January 1, 2025, to limit the share class’s total annual operating expense to 0.425% as a percentage of daily net assets. For the year ended October 31, 2023, CRMC reimbursed miscellaneous fees of $23,000 for the fund, which CRMC does not intend to recoup. Fees and expenses in the statement of operations are presented gross of any reimbursements from CRMC.
Affiliated officers and trustees — Officers and certain trustees of the fund are or may be considered to be affiliated with CRMC. No affiliated officers or trustees received any compensation directly from the fund.
Investment in CCF — The fund holds shares of CCF, an institutional prime money market fund managed by CRMC. CCF invests in high-quality, short-term money market instruments. CCF is used as the primary investment vehicle for the fund’s short-term investments. CCF shares are only available for purchase by CRMC, its affiliates, and other funds managed by CRMC or its affiliates, and are not available to the public. CRMC does not receive an investment advisory services fee from CCF.
Security transactions with related funds — The fund purchased investment securities from, and sold investment securities to, other funds managed by CRMC (or funds managed by certain affiliates of CRMC) under procedures adopted by the fund’s board of trustees. The funds involved in such transactions are considered related by virtue of having a common investment adviser (or affiliated investment advisers), common trustees and/or common officers. Each transaction was executed at the current market price of the security and no brokerage commissions or fees were paid in accordance with Rule 17a-7 of the 1940 Act. During the year ended October 31, 2023, the fund engaged in such purchase and sale transactions with related funds in the amounts of $1,541,000 and $2,425,000, respectively, which generated $446,000 of net realized gains from such sales.
| Capital Group U.S. Equity Fund | 15 |
Interfund lending — Pursuant to an exemptive order issued by the SEC, the fund, along with other CRMC-managed funds (or funds managed by certain affiliates of CRMC), may participate in an interfund lending program. The program provides an alternate credit facility that permits the funds to lend or borrow cash for temporary purposes directly to or from one another, subject to the conditions of the exemptive order. The fund did not lend or borrow cash through the interfund lending program at any time during the year ended October 31, 2023.
8. Indemnifications
The fund’s organizational documents provide board members and officers with indemnification against certain liabilities or expenses in connection with the performance of their duties to the fund. In the normal course of business, the fund may also enter into contracts that provide general indemnifications. The fund’s maximum exposure under these arrangements is unknown since it is dependent on future claims that may be made against the fund. The risk of material loss from such claims is considered remote. Insurance policies are also available to the fund’s board members and officers.
9. Capital share transactions
Capital share transactions in the fund were as follows (dollars and shares in thousands):
| | | Sales | | | Reinvestments of
distributions | | | Repurchases | | | Net increase | |
| Share class | | Amount | | | Shares | | | Amount | | | Shares | | | Amount | | | Shares | | | Amount | | | Shares | |
| | | | | | | | | | | | | | | | | | | | | | | | | |
| Year ended October 31, 2023 | | | | | | | | | | | | | | | | | | | | | |
| | | | | | | | | | | | | | | | | | | | | | | | | |
| Class M | | $ | 33,244 | | | | 1,129 | | | $ | 10,785 | | | | 377 | | | $ | (36,461 | ) | | | (1,252 | ) | | $ | 7,568 | | | | 254 | |
| | | | | | | | | | | | | | | | | | | | | | | | | | | | | | | | | |
| Year ended October 31, 2022 | | | | | | | | | | | | | | | | | | | | | | | | | | | | | |
| | | | | | | | | | | | | | | | | | | | | | | | | | | | | | | | | |
| Class M | | $ | 14,806 | | | | 492 | | | $ | 18,374 | | | | 584 | | | $ | (32,108 | ) | | | (1,067 | ) | | $ | 1,072 | | | | 9 | |
10. Investment transactions
The fund engaged in purchases and sales of investment securities, excluding short-term securities and U.S. government obligations, if any, of $72,153,000 and $80,472,000, respectively, during the year ended October 31, 2023.
| 16 | Capital Group U.S. Equity Fund |
Financial highlights
| | | | | | Income (loss) from
investment operations1 | | | Dividends and distributions | | | | | | | | | | | | | | | | | | | |
| Year ended | | Net asset
value,
beginning
of year | | | Net
investment
income | | | Net gains
(losses) on
securities (both
realized and
unrealized) | | | Total from
investment
operations | | | Dividends
(from net
investment
income) | | | Distributions
(from capital
gains) | | | Total
dividends
and
distributions | | | Net asset
value, end
of year | | | Total
return2 | | | Net assets,
end of
year
(in millions) | | | Ratio of
expenses to
average net
assets before
reimbursements3 | | | Ratio of
expenses to
average net
assets after
reimbursements2,3 | | | Ratio of
net income
to average
net assets2 | |
| 10/31/2023 | | $ | 27.92 | | | $ | .38 | | | $ | 1.77 | | | $ | 2.15 | | | $ | (.38 | ) | | $ | (.71 | ) | | $ | (1.09 | ) | | $ | 28.98 | | | | 7.80 | % | | $ | 303 | | | | .43 | % | | | .43 | % | | | 1.31 | % |
| 10/31/2022 | | | 33.77 | | | | .32 | | | | (4.33 | ) | | | (4.01 | ) | | | (.31 | ) | | | (1.53 | ) | | | (1.84 | ) | | | 27.92 | | | | (12.44 | ) | | | 285 | | | | .43 | | | | .43 | | | | 1.07 | |
| 10/31/2021 | | | 25.54 | | | | .28 | | | | 8.78 | | | | 9.06 | | | | (.29 | ) | | | (.54 | ) | | | (.83 | ) | | | 33.77 | | | | 36.12 | | | | 344 | | | | .43 | | | | .42 | | | | .94 | |
| 10/31/2020 | | | 24.57 | | | | .28 | | | | 1.77 | | | | 2.05 | | | | (.29 | ) | | | (.79 | ) | | | (1.08 | ) | | | 25.54 | | | | 8.51 | | | | 263 | | | | .45 | | | | .42 | | | | 1.12 | |
| 10/31/2019 | | | 22.78 | | | | .34 | | | | 3.27 | | | | 3.61 | | | | (.35 | ) | | | (1.47 | ) | | | (1.82 | ) | | | 24.57 | | | | 17.65 | | | | 244 | | | | .45 | | | | .42 | | | | 1.49 | |
| | | Year ended October 31, |
| | | 2023 | | 2022 | | 2021 | | 2020 | | 2019 |
| Portfolio turnover rate for all share classes4 | | | 26 | % | | | 12 | % | | | 15 | % | | | 19 | % | | | 16 | % |
| 1 | Based on average shares outstanding. |
| 2 | This column reflects the impact, if any, of certain reimbursements from CRMC. During some of the years shown, CRMC reimbursed a portion of miscellaneous fees and expenses. |
| 3 | Ratios do not include expenses of any Central Funds. The fund indirectly bears its proportionate share of the expenses of any Central Funds. |
| 4 | Rates do not include the fund’s portfolio activity with respect to any Central Funds. |
Refer to the notes to financial statements.
| Capital Group U.S. Equity Fund | 17 |
Report of Independent Registered Public Accounting Firm
To the Board of Trustees and Shareholders of Capital Group U.S. Equity Fund
Opinion on the Financial Statements
We have audited the accompanying statement of assets and liabilities, including the investment portfolio, of Capital Group U.S. Equity Fund (the “Fund”) as of October 31, 2023, the related statement of operations for the year ended October 31, 2023, the statements of changes in net assets for each of the two years in the period ended October 31, 2023, including the related notes, and the financial highlights for each of the five years in the period ended October 31, 2023 (collectively referred to as the “financial statements”). In our opinion, the financial statements present fairly, in all material respects, the financial position of the Fund as of October 31, 2023, the results of its operations for the year then ended, the changes in its net assets for each of the two years in the period ended October 31, 2023 and the financial highlights for each of the five years in the period ended October 31, 2023 in conformity with accounting principles generally accepted in the United States of America.
Basis for Opinion
These financial statements are the responsibility of the Fund’s management. Our responsibility is to express an opinion on the Fund’s financial statements based on our audits. We are a public accounting firm registered with the Public Company Accounting Oversight Board (United States) (PCAOB) and are required to be independent with respect to the Fund in accordance with the U.S. federal securities laws and the applicable rules and regulations of the Securities and Exchange Commission and the PCAOB.
We conducted our audits of these financial statements in accordance with the standards of the PCAOB. Those standards require that we plan and perform the audit to obtain reasonable assurance about whether the financial statements are free of material misstatement, whether due to error or fraud.
Our audits included performing procedures to assess the risks of material misstatement of the financial statements, whether due to error or fraud, and performing procedures that respond to those risks. Such procedures included examining, on a test basis, evidence regarding the amounts and disclosures in the financial statements. Our audits also included evaluating the accounting principles used and significant estimates made by management, as well as evaluating the overall presentation of the financial statements. Our procedures included confirmation of securities owned as of October 31, 2023 by correspondence with the custodian, transfer agent and brokers; when replies were not received from brokers, we performed other auditing procedures. We believe that our audits provide a reasonable basis for our opinion.
/s/ PricewaterhouseCoopers LLP
Los Angeles, California
December 14, 2023
We have served as the auditor of one or more investment companies in The Capital Group Companies Investment Company Complex since 1934.
| 18 | Capital Group U.S. Equity Fund |
As a shareholder of the fund, you incur ongoing costs, including management fees and other expenses. This example is intended to help you understand your ongoing costs (in dollars) of investing in the fund so you can compare these costs with the ongoing costs of investing in other mutual funds. The example is based on an investment of $1,000 invested at the beginning of the period and held for the entire six-month period (May 1, 2023, through October 31, 2023).
Actual expenses:
The first line in the table provides information about actual account values and actual expenses. You may use the information in this line, together with the amount you invested, to estimate the expenses that you paid over the period. Simply divide your account value by $1,000 (for example, an $8,600 account value divided by $1,000 = 8.6), then multiply the result by the number in the first line under the heading titled “Expenses paid during period” to estimate the expenses you paid on your account during this period.
Hypothetical example for comparison purposes:
The second line in the table provides information about hypothetical account values and hypothetical expenses based on the actual expense ratio for the share class and an assumed rate of return of 5.00% per year before expenses, which is not the actual return of the share class. The hypothetical account values and expenses may not be used to estimate the actual ending account balance or expenses you paid for the period. You may use this information to compare the ongoing costs of investing in the fund and other funds. To do so, compare this 5.00% hypothetical example with the 5.00% hypothetical examples that appear in the shareholder reports of the other funds.
Notes:
Shareholders of the fund may be subject to an additional fee charged by CRMC’s Capital Group Private Client Services division for the ongoing services provided to the shareholder. You can estimate the impact of these fees by adding the amount of the fees to the total estimated expenses you paid on your account during the period as calculated above. In addition, your ending account value would be lower by the amount of these fees. Note that the expenses shown in the table are meant to highlight your ongoing costs only. The second line in the table is useful in comparing ongoing costs only and will not help you determine the relative total costs of owning different funds.
| | | Beginning
account value
5/1/2023 | | | Ending
account value
10/31/2023 | | | Expenses
paid during
period* | | | Annualized
expense ratio | |
| Capital Group U.S. Equity Fund | | | | | | | | | | | | | | | | |
| Actual return | | $ | 1,000.00 | | | $ | 996.71 | | | $ | 2.11 | | | | .42 | % |
| Assumed 5% return | | | 1,000.00 | | | | 1,023.09 | | | | 2.14 | | | | .42 | |
| * | The “expenses paid during period” are equal to the “annualized expense ratio,” multiplied by the average account value over the period, multiplied by the number of days in the period, and divided by 365 (to reflect the one-half year period). |
We are required to advise you of the federal tax status of certain distributions received by shareholders during the fiscal year. The fund hereby designates the following amounts for the fund’s fiscal year ended October 31, 2023:
| Long-term capital gains | | $ | 8,166,000 |
| Qualified dividend income | | | 100% |
| Corporate dividends received deduction | | | 100% |
| U.S. government income that may be exempt from state taxation | | | $192,000 |
Individual shareholders should refer to their Form 1099 or other tax information, which will be mailed in January 2024, to determine the calendar year amounts to be included on their 2023 tax returns. Shareholders should consult their tax advisors.
| Capital Group U.S. Equity Fund | 19 |
Approval of Investment Advisory and Service Agreement
The fund’s board has approved the continuation of the fund’s Investment Advisory and Service Agreement (the “agreement”) with Capital Research and Management Company (“CRMC”) through January 31, 2024. The board determined in the exercise of its business judgment that the fund’s advisory fee structure was fair and reasonable in relation to the services provided, and that approving the agreement was in the best interests of the fund and its shareholders.
In reaching this decision, the board took into account its interactions with CRMC as well as information furnished to them throughout the year and otherwise provided to them, as well as information prepared specifically in connection with its review of the agreement, and were advised by its independent counsel with respect to the matters considered. They considered the following factors, among others, but did not identify any single issue or particular piece of information that, in isolation, was the controlling factor, and each board member did not necessarily attribute the same weight to each factor.
1. Nature, extent and quality of services
The board considered the depth and quality of CRMC’s investment management process, including its global research capabilities; the experience, capability and integrity of its senior management and other personnel; the low turnover rates of its key personnel; the overall financial strength and stability of CRMC and the Capital Group organization; the resources and systems CRMC devotes to investment management (the manner in which the fund’s assets are managed, including liquidity management), financial, investment operations, compliance, trading, proxy voting, shareholder communications, and other services; and the ongoing evolution of CRMC’s organizational structure designed to maintain and strengthen these qualities. The board also considered the nature, extent and quality of administrative and shareholder services provided by CRMC to the fund under the agreement and other agreements, as well as the benefits to fund shareholders from investing in a fund that is part of a large family of funds. The board considered the risks assumed by CRMC in providing services to the fund, including operational, business, financial, reputational, regulatory and litigation risks. The board concluded that the nature, extent and quality of the services provided by CRMC have benefited and should continue to benefit the fund and its shareholders.
2. Investment results
The board considered the investment results of the fund in light of its objective. They compared the fund’s investment results with those of other funds (including funds that currently form the basis of the Lipper index for the category in which the fund is included) and data such as relevant market and fund indexes over various periods (including the fund’s lifetime) through September 30, 2022. They generally placed greater emphasis on investment results over longer term periods. On the basis of this evaluation and the board’s ongoing review of investment results, and considering the relative market conditions during certain reporting periods, the board concluded that the fund’s investment results have been sufficient for renewal of the agreement, and that CRMC’s record in managing the fund indicated that its continued management should benefit the fund and its shareholders.
3. Advisory fees and total expenses
The board compared the advisory fees and total expense levels of the fund to those of other relevant funds, noting that the fund has a unitary management fee. They observed that the fund’s advisory fees and expenses generally compared favorably to those of other similar funds included in the comparable Lipper category. The board noted that, although the fees paid by CRMC clients with separately managed accounts generally were lower than those paid by the fund, the differences appropriately reflected the investment, operational, regulatory and market differences between advising the fund and separately managed accounts. They also recognized that the fees for certain separately managed accounts could be lower than those of the fund due to the sizes of the accounts and the clients’ overall relationships with CRMC. The board concluded that the fund’s cost structure was fair and reasonable in relation to the services provided, as well as in relation to the risks assumed by the adviser in sponsoring and managing the fund, and that the fund’s shareholders receive reasonable value in return for the advisory fees and other amounts paid to CRMC by the fund.
| 20 | Capital Group U.S. Equity Fund |
4. Ancillary benefits
The board considered a variety of other benefits that CRMC and its affiliates receive as a result of CRMC’s relationship with the fund, including fees paid to CRMC’s affiliated transfer agent; sales charges and distribution fees received and retained by the fund’s principal underwriter, an affiliate of CRMC; and possible ancillary benefits to CRMC and its institutional management affiliates in managing other investment vehicles. The board reviewed CRMC’s portfolio trading practices, noting that CRMC bears the cost of third-party research. The board also noted that CRMC benefited from the use of commissions from portfolio transactions made on behalf of the fund to facilitate payment to certain broker-dealers for research to comply with regulatory requirements applicable to these firms, with all such amounts reimbursed by CRMC. The board took these ancillary benefits into account in evaluating the reasonableness of the advisory fees and other amounts paid to CRMC by the fund.
5. Adviser financial information
The board reviewed information regarding CRMC’s costs of providing services to the fund, including personnel, systems and resources of investment, compliance, trading, accounting and other administrative operations. They considered CRMC’s costs and related cost allocation methodology as well as its track record of investing in technology, infrastructure and staff to maintain and expand services and capabilities, respond to industry and regulatory developments, and attract and retain qualified personnel. They noted information regarding the compensation structure for CRMC’s investment professionals. They reviewed information on the profitability of the investment adviser and its affiliates. The board also compared CRMC’s profitability and compensation data to the reported results and data of a number of large, publicly held investment management companies. The board noted the competitiveness and cyclicality of both the mutual fund industry and the capital markets, and the importance in that environment of CRMC’s long-term profitability for maintaining its independence, company culture and management continuity. They further considered CRMC’s reimbursement of fund expenses through voluntary fee caps and, as applicable, the sharing of potential economies of scale, or efficiencies, through breakpoints and other fee reductions and costs voluntarily absorbed. The board concluded that the fund’s advisory fee structure reflected a reasonable sharing of benefits between CRMC and the fund’s shareholders.
| Capital Group U.S. Equity Fund | 21 |
This page was intentionally left blank.
| 22 | Capital Group U.S. Equity Fund |
Board of trustees and other officers
Independent trustees1
Name, year of birth and position
with fund | | Year first
elected as
a director/
trustee2 | | Principal occupation(s) during the past five years | | Number of
portfolios overseen
by trustee3 | | Other directorships4 held
by trustee during the past
five years |
| John G. Freund, MD, 1953 | | 2023 | | Founder and former Managing Director, Skyline Ventures (a venture capital investor in health care companies); Co-Founder of Intuitive Surgical, Inc. (1995 – 2000); Co-Founder and former CEO of Arixa Pharmaceuticals, Inc. (2016 - 2020) | | 14 | | Collegium Pharmaceutical, Inc.; SI – Bone, Inc.; Sutro Biopharma, Inc. |
Pablo R. González Guajardo, 1967
Chair of the Board
(Independent and Non-Executive) | | 2019 | | CEO, Kimberly-Clark de México, SAB de CV | | 23 | | América Móvil, SAB de CV (telecommunications company); Grupo Sanborns, SAB de CV (retail stores and restaurants); Kimberly-Clark de México, SAB de CV (consumer staples) |
| Merit E. Janow, 1958 | | 2023 | | Dean Emerita and Professor of Practice, International Economic Law & International Affairs, Columbia University, School of International and Public Affairs | | 99 | | Aptiv (autonomous and green vehicle technology); Mastercard Incorporated |
| William D. Jones, 1955 | | 2019 | | Managing Member, CityLink LLC (investing and consulting); former President and CEO, CityLink Investment Corporation (acquires, develops and manages real estate ventures in urban communities) | | 24 | | None |
| John C. Mazziotta, MD, PhD, 1949 | | 2023 | | Physician; Professor of Neurology, University of California at Los Angeles; Vice Chancellor, UCLA Health Sciences; CEO, UCLA Health System | | 6 | | None |
| William R. McLaughlin, 1956 | | 2023 | | Advisor and former President and CEO, The Orvis Company (outdoor equipment retailer) | | 6 | | None |
| Kenneth M. Simril, 1965 | | 2023 | | President and CEO, SCI Ingredients Holdings, Inc. (food manufacturing) | | 9 | | Bunge Limited (agricultural business and food company) |
| Kathy J. Williams, 1955 | | 2023 | | Board Chair, Above and Beyond Teaching | | 11 | | None |
Interested board members5,6
Name, year of birth and position
with fund | | Year first
elected as
a director/
trustee/
officer2 | | Principal occupation(s) during the past five years and
positions held with affiliated entities or the principal
underwriter of the fund | | Number of
portfolios overseen
by trustee3 | | Other directorships4 held
by trustee during the past
five years |
William L. Robbins, 1968
President and Trustee | | 2023 | | Partner – Capital International Investors, Capital Research and Management Company; Partner – Capital International Investors, Capital Bank and Trust Company7; Chair and Director, Capital Group International, Inc.7 | | 20 | | None |
James Terrile, 1965
Trustee | | 2023 | | Partner – Capital Research Global Investors, Capital Research and Management Company; Partner – Capital Research Global Investors, Capital Bank and Trust Company7 | | 6 | | None |
The fund’s statement of additional information includes further details about fund trustees and is available without charge upon request by calling your relationship manager at (800) 266-9532. The address for all trustees and officers of the fund is 333 South Hope Street, Los Angeles, CA 90071, Attention: Secretary.
Refer to page 24 for footnotes.
| Capital Group U.S. Equity Fund | 23 |
Officers6
Name, year of birth and
position with fund | | Year first elected
an officer2 | | Principal occupation(s) during the past five years and positions held with affiliated entities or the Principal
Underwriter of the fund |
Herbert Y. Poon, 1973
Principal Executive Officer | | 2023 | | Senior Vice President and Senior Counsel – Fund Business Management Group, Capital Research and Management Company; Chief Compliance Officer, Capital Research and Management Company; Chief Compliance Officer, Capital Research Company7 |
Michael W. Stockton, 1967
Executive Vice President | | 2021 | | Senior Vice President – Fund Business Management Group, Capital Research and Management Company |
Cheryl E. Frank, 1975
Senior Vice President | | 2019 | | Partner – Capital International Investors, Capital Research and Management Company |
Gregory D. Fuss, 1959
Senior Vice President | | 2019 | | Partner – Capital International Investors, Capital Research and Management Company; Partner – Capital International Investors, Capital Bank and Trust Company7; Senior Vice President, Capital Group Private Client Services, Inc.7 |
Greg Miliotes, 1974
Senior Vice President | | 2023 | | Partner – Capital International Investors, Capital Research and Management Company; Director, Capital Research and Management Company |
Jennifer L. Butler, 1966
Secretary | | 2023 | | Assistant Vice President – Fund Business Management Group, Capital Research and Management Company |
Gregory F. Niland, 1971
Treasurer | | 2019 | | Vice President – Investment Operations, Capital Research and Management Company |
Marilyn Paramo, 1982
Assistant Secretary | | 2023 | | Associate – Fund Business Management Group, Capital Research and Management Company |
Sandra Chuon, 1972
Assistant Treasurer | | 2019 | | Vice President – Investment Operations, Capital Research and Management Company |
Mariah L. Coria, 1984
Assistant Treasurer | | 2023 | | Assistant Vice President – Investment Operations, Capital Research and Management Company |
| 1 | The term independent trustee refers to a trustee who is not an “interested person” of the fund within the meaning of the Investment Company Act of 1940. |
| 2 | Trustees and officers of the fund serve until their resignation, removal or retirement. |
| 3 | Funds managed by Capital Research and Management Company or its affiliates. |
| 4 | This includes all directorships (other than the fund or other funds managed by Capital Research and Management Company or its affiliates) that are held by each trustee as a trustee or director of a public company or its affiliates. Unless otherwise noted, all directorships are current. |
| 5 | The term interested trustee refers to a trustee who is an “interested person” of the fund within the meaning of the Investment Company Act of 1940, on the basis of his or her affiliation with the fund’s investment adviser, Capital Research and Management Company, or affiliated entities (including the fund’s principal underwriter). |
| 6 | All of the trustees and/or officers listed, with the exception of Greg Miliotes, are officers and/or directors/trustees of one or more of the other funds for which Capital Research and Management Company serves as investment adviser. |
| 7 | Company affiliated with Capital Research and Management Company. |
| 24 | Capital Group U.S. Equity Fund |
Office of the fund
6455 Irvine Center Drive
Irvine, CA 92618-4518
Investment adviser
Capital Research and Management Company
333 South Hope Street
Los Angeles, CA 90071-1406
Transfer agent for shareholder accounts
American Funds Service Company
(Write to the address nearest you.)
P.O. Box 6007
Indianapolis, IN 46206-6007
P.O. Box 2280
Norfolk, VA 23501-2280
Custodian of assets
State Street Bank and Trust Company
One Lincoln Street
Boston, MA 02111-2900
Counsel
O’Melveny & Myers LLP
400 South Hope Street
Los Angeles, CA 90071-2899
Independent registered public accounting firm
PricewaterhouseCoopers LLP
601 South Figueroa Street
Los Angeles, CA 90017-3874
Principal underwriter
American Funds Distributors, Inc.
333 South Hope Street
Los Angeles, CA 90071-1406
Investors should carefully consider investment objectives, risks, charges and expenses. This and other important information is contained in the fund prospectus, which can be obtained from Capital Research and Management Company by calling (800) 266-9532 and should be read carefully before investing.
Capital Group Private Client Services files a complete list of its portfolio holdings with the U.S. Securities and Exchange Commission (SEC) for the first and third quarters of each fiscal year on Form NPORT-P. This filing is available free of charge on the SEC website (www.sec.gov). Additionally, the list of portfolio holdings is available by calling your relationship manager at (800) 266-9532.
The proxy voting procedures and policies of Capital Group U.S. Equity Fund — which describe how we vote proxies relating to portfolio securities — are available upon request by calling your relationship manager at (800) 266-9532. The fund files its proxy voting record with the SEC for the 12 months ended June 30 by August 31. The report also is available on the SEC website or by calling your relationship manager.
The S&P 500 Index (“Index”) is a product of S&P Dow Jones Indices LLC and/or its affiliates and has been licensed for use by Capital Group. Copyright © 2023 S&P Dow Jones Indices LLC, a division of S&P Global, and/or its affiliates. All rights reserved. Redistribution or reproduction in whole or in part is prohibited without written permission of S&P Dow Jones Indices LLC.
If used as sales material after December 31, 2023, this report must be accompanied by the Capital Group U.S. Equity Fund Quarterly Results document for the most recently completed calendar quarter.
American Funds Distributors, Inc.
All Capital Group trademarks mentioned are owned by The Capital Group Companies, Inc., an affiliated company or fund. All other company and product names mentioned are the property of their respective companies.

ITEM 2 – Code of Ethics
The Registrant has adopted a Code of Ethics that applies to its Principal Executive Officer and Principal Financial Officer. The Registrant undertakes to provide to any person without charge, upon request, a copy of the Code of Ethics. Such request can be made by calling 800/421-4225 or to the Secretary of the Registrant, 6455 Irvine Center Drive, Irvine, California 92618.
ITEM 3 – Audit Committee Financial Expert
The Registrant’s board has determined that William R. McLaughlin, a member of the Registrant’s audit committee, is an “audit committee financial expert” and "independent," as such terms are defined in this Item. This designation will not increase the designee’s duties, obligations or liability as compared to his or her duties, obligations and liability as a member of the audit committee and of the board, nor will it reduce the responsibility of the other audit committee members. There may be other individuals who, through education or experience, would qualify as "audit committee financial experts" if the board had designated them as such. Most importantly, the board believes each member of the audit committee contributes significantly to the effective oversight of the Registrant’s financial statements and condition.
ITEM 4 – Principal Accountant Fees and Services
| a) Audit Fees: | | |
| Audit | 2022 | 31,000 |
| | 2023 | 33,000 |
| | | |
| b) Audit-Related Fees: | | |
| | 2022 | None |
| | 2023 | None |
| | | |
| c) Tax Fees: | | |
| | 2022 | 7,000 |
| | 2023 | 8,000 |
| | The tax fees consist of professional services relating to the preparation of the Registrant’s tax returns. | |
| | | |
| d) All Other Fees: | | |
| | 2022 | None |
| | 2023 | None |
| | | |
| | Adviser and affiliates (includes only fees for non-audit services billed to the adviser and affiliates for engagements that relate directly to the operations and financial reporting of the Registrant and were subject to the pre-approval policies described below): | |
| a) Audit Fees: | | |
| | Not Applicable | |
| | | |
| b) Audit-Related Fees: | | |
| | 2022 | None |
| | 2023 | None |
| | The audit-related fees consist of assurance and related services relating to the examination of the Registrant’s transfer agent, principal underwriter and investment adviser conducted in accordance with Statement on Standards for Attestation Engagements Number 18 issued by the American Institute of Certified Public Accountants. | |
| | | |
| c) Tax Fees: | | |
| | 2022 | None |
| | 2023 | None |
| | The tax fees consist of consulting services relating to the Registrant’s investments. | |
| | | |
| | | |
| d) All Other Fees: | | |
| | 2022 | None |
| | 2023 | None |
| | The other fees consist of subscription services related to an accounting research tool. | |
| | | |
| | | |
| | All audit and permissible non-audit services that the Registrant’s audit committee considers compatible with maintaining the independent registered public accounting firm’s independence are required to be pre-approved by the committee. The pre-approval requirement will extend to all non-audit services provided to the Registrant, the investment adviser, and any entity controlling, controlled by, or under common control with the investment adviser that provides ongoing services to the Registrant, if the engagement relates directly to the operations and financial reporting of the Registrant. The committee will not delegate its responsibility to pre-approve these services to the investment adviser. The committee may delegate to one or more committee members the authority to review and pre-approve audit and permissible non-audit services. Actions taken under any such delegation will be reported to the full committee at its next meeting. The pre-approval requirement is waived with respect to non-audit services if certain conditions are met. The pre-approval requirement was not waived for any of the non-audit services listed above provided to the Registrant, adviser and affiliates. | |
| | | |
| | Aggregate non-audit fees paid to the Registrant’s auditors, including fees for all services billed to the Registrant, adviser and affiliates that provide ongoing services to the Registrant, were $7,000 for fiscal year 2022 and $8,000 for fiscal year 2023. The non-audit services represented by these amounts were brought to the attention of the committee and considered to be compatible with maintaining the auditors’ independence. | |
ITEM 5 – Audit Committee of Listed Registrants
Not applicable to this Registrant, insofar as the Registrant is not a listed issuer as defined in Rule 10A-3 under the Securities Exchange Act of 1934.
ITEM 6 – Schedule of Investments
Not applicable, insofar as the schedule is included as part of the report to shareholders filed under Item 1 of this Form.
ITEM 7 – Disclosure of Proxy Voting Policies and Procedures for Closed-End Management Investment Companies
Not applicable to this Registrant, insofar as the Registrant is not a closed-end management investment company.
ITEM 8 – Portfolio Managers of Closed-End Management Investment Companies
Not applicable to this Registrant, insofar as the Registrant is not a closed-end management investment company.
ITEM 9 – Purchases of Equity Securities by Closed-End Management Investment Company and Affiliated Purchasers
Not applicable to this Registrant, insofar as the Registrant is not a closed-end management investment company.
ITEM 10 – Submission of Matters to a Vote of Security Holders
There have been no material changes to the procedures by which shareholders may recommend nominees to the Registrant’s board of trustees since the Registrant last submitted a proxy statement to its shareholders. The procedures are as follows. The Registrant has a nominating committee comprised solely of persons who are not considered ‘‘interested persons’’ of the Registrant within the meaning of the Investment Company Act of 1940, as amended. The committee periodically reviews such issues as the board’s composition, responsibilities, committees, compensation and other relevant issues, and recommends any appropriate changes to the full board of trustees. While the committee normally is able to identify from its own resources an ample number of qualified candidates, it will consider shareholder suggestions of persons to be considered as nominees to fill future vacancies on the board. Such suggestions must be sent in writing to the nominating committee of the Registrant, c/o the Registrant’s Secretary, and must be accompanied by complete biographical and occupational data on the prospective nominee, along with a written consent of the prospective nominee for consideration of his or her name by the nominating committee.
ITEM 11 – Controls and Procedures
| (a) | The Registrant’s Principal Executive Officer and Principal Financial Officer have concluded, based on their evaluation of the Registrant’s disclosure controls and procedures (as such term is defined in Rule 30a-3 under the Investment Company Act of 1940), that such controls and procedures are adequate and reasonably designed to achieve the purposes described in paragraph (c) of such rule. |
| | |
| (b) | There were no changes in the Registrant’s internal controls over financial reporting (as defined in Rule 30a-3(d) under the Investment Company Act of 1940) that occurred during the Registrant’s semi-annual period covered by this report that has materially affected, or is reasonably likely to materially affect, the Registrant’s internal control over financial reporting. |
ITEM 12 – Exhibits
| (a)(1) | The Code of Ethics that is the subject of the disclosure required by Item 2 is attached as an exhibit hereto. |
| | |
| (a)(2) | The certifications required by Rule 30a-2 of the Investment Company Act of 1940 and Sections 302 and 906 of the Sarbanes-Oxley Act of 2002 are attached as exhibits hereto. |
SIGNATURES
Pursuant to the requirements of the Securities Exchange Act of 1934 and the Investment Company Act of 1940, the Registrant has duly caused this report to be signed on its behalf by the undersigned, thereunto duly authorized.
| | CAPITAL GROUP U.S. EQUITY FUND |
| | |
| | By __/s/ Herbert Y. Poon________________ |
| | Herbert Y. Poon, Principal Executive Officer |
| | |
| | Date: December 29, 2023 |
Pursuant to the requirements of the Securities Exchange Act of 1934 and the Investment Company Act of 1940, this report has been signed below by the following persons on behalf of the Registrant and in the capacities and on the dates indicated.
| By _ /s/ Herbert Y. Poon_____________ |
Herbert Y. Poon, Principal Executive Officer |
| |
| Date: December 29, 2023 |
| By ___/s/ Gregory F. Niland__________________ |
Gregory F. Niland, Treasurer and Principal Financial Officer |
| |
| Date: December 29, 2023 |