- NREF Dashboard
- Financials
- Filings
-
Holdings
- Transcripts
- ETFs
- Insider
- Institutional
- Shorts
-
FWP Filing
NexPoint Real Estate Finance (NREF) FWPFree writing prospectus
Filed: 15 Jul 20, 4:52pm
Filed Pursuant to Rule 433 Issuer Free Writing Prospectus dated July 15, 2020 Registration No. 333-239862 The Company has filed a registration statement (including a prospectus) with the SEC for the offering to which this communication relates. Before you invest, you should read the prospectus in that registration statement and other documents the Company has filed with the SEC for more complete information about the Company and this offering. You may get these documents for free by visiting EDGAR on the SEC Web site at www.sec.gov. Alternatively, the Company, any underwriter or any dealer participating in the offering will arrange to send you the prospectus if you request it by calling Raymond James & Associates, Inc. at 1‐800‐248‐8863; Keefe, Bruyette & Woods, Inc., A Stifel Company, at 1‐800‐966‐1559; or Robert W. Baird & Co. Incorporated, at 1‐800‐792‐2473. The preliminary prospectus, dated July 15, 2020, is available on the SEC Web site at https://www.sec.gov/Archives/edgar/data/1786248/000119312520192765/d923206ds11.htm
CAUTIONARY STATEMENTS IMPORTANT INFORMATION NexPoint Real Estate Finance, Inc. (“NREF,” “we,” “us” or the “Company”) has filed a registration statement (including a prospectus) with the U.S. Securities and Exchange Commission (“SEC”) in connection with the offering to which this presentation relates. Before you invest in any securities, you should read the prospectus in the registration statement and the other documents the Company files with the SEC for more complete information about the Company and the offering. You may obtain these documents for free by visiting EDGAR on the SEC’s website at www.sec.gov. Copies of the preliminary prospectus relating to the offering may be obtained by contacting: Raymond James & Associates, Inc., 880 Carillon Parkway, St. Petersburg, FL 33716, telephone (800) 248-8863, email: prospectus@raymondjames.com; Keefe, Bruyette & Woods, Inc., 787 Seventh Avenue, 4th Floor, New York, NY 10019 (Attn: Capital Markets), telephone (800) 966-1559, email: uscapitalmarkets@kbw.com; Robert W. Baird & Co. Incorporated, Attention: Syndicate Department, 777 East Wisconsin Avenue, Milwaukee, WI 53202, telephone (800) 792 2473, email: syndicate@rwbaird.com. The registration statement relating to the Company’s securities to which this presentation relates has not yet become effective and the securities may not be sold nor may offers to buy be accepted prior to the time the registration statement becomes effective. This presentation shall not constitute an offer to sell or the solicitation of an offer to buy nor shall there be any sale of the securities in any jurisdiction in which such offer, solicitation or sale could be unlawful prior to registration or qualification under the securities laws of any such jurisdiction. FORWARD LOOKING STATEMENTS This presentation includes forward-looking statements. These statements reflect the current views of the Company’s management with respect to future events and financial performance. These statements include forward-looking statements within the meaning of the Private Securities Litigation Reform Act of 1995 with respect to the Company’s business and industry in general, the offering and terms of our Series A Cumulative Redeemable Preferred Stock and the intended use of proceeds, the terms and expected results of the investments the Company intends to acquire with the net proceeds from the offering, including unlevered and levered IRRs and target yields, and the Company’s pro forma capitalization and coverage and the related assumptions. Statements that include the words “expect,” “intend,” “estimate,” “may,” “should,” “anticipate” and similar statements of a future or forward-looking nature identify forward-looking statements for purposes of the federal securities laws or otherwise. Forward-looking statements address matters that involve risks and uncertainties. Accordingly, there are or will be important factors that could cause the Company’s actual results to differ materially from those indicated in these statements, including the ultimate geographic spread, duration and severity of the coronavirus (COVID-19) outbreak, and the effectiveness of actions taken, or actions that may be taken, by governmental authorities to contain the outbreak or treat its impact, as well as the factors described under “Risk Factors” in the Company’s filings. The statements made herein speak only as of the date of this presentation, and the Company does not undertake to update this information except as required by law. Past performance does not guarantee future results. Performance during time periods shown is limited and may not reflect the performance in different economic and market cycles. There can be no assurance that similar performance will be experienced. NON-GAAP FINANCIAL MEASURES This presentation contains non-GAAP financial measures. A “non-GAAP financial measure” is defined as a numerical measure of a company’s financial performance that excludes or includes amounts so as to be different than the most directly comparable measure calculated and presented in accordance with GAAP in the statements of income, balance sheets or statements of cash flows of the Company. The non-GAAP financial measures used within this presentation are net debt and core earnings. Net debt is calculated by subtracting cash and cash equivalents from total debt outstanding. We believe that the use of net debt improves the understanding of debt levels of Real Estate Investment Trusts (“REITs”) among investors and makes comparisons of debt levels among such companies more meaningful. While net debt is relevant and a widely used measure of debt levels of REITs, it does not represent total debt as defined by GAAP and should not be considered an alternative in evaluating debt levels. We present net debt because we believe it provides our investors a better understanding of our leverage ratio. Net debt should not be considered an alternative to total debt, as we may not always be able to use our available cash to repay debt. Core earnings is defined as the net income (loss) attributable to our common stockholders computed in accordance with GAAP, including realized gains and losses not otherwise included in net income (loss), excluding any unrealized gains or losses or other similar non-cash items that are included in net income (loss) for the applicable reporting period, regardless of whether such items are included in other comprehensive income (loss), or in net income (loss) and adding back amortization of stock-based compensation. We use core earnings to evaluate our performance which excludes the effects of certain GAAP adjustments and transactions that we believe are not indicative of our current operations and loan performance. We believe providing core earnings as a supplement to GAAP net income (loss) to our investors is helpful to their assessment of our performance. We also use core earnings as a component of the management fee paid to NexPoint Real Estate Advisors VII, L.P. Core earnings should not be considered as an alternative or substitute to net income (loss). Our computation of net debt and core earnings may not be comparable to net debt and core earnings reported by other REITs.
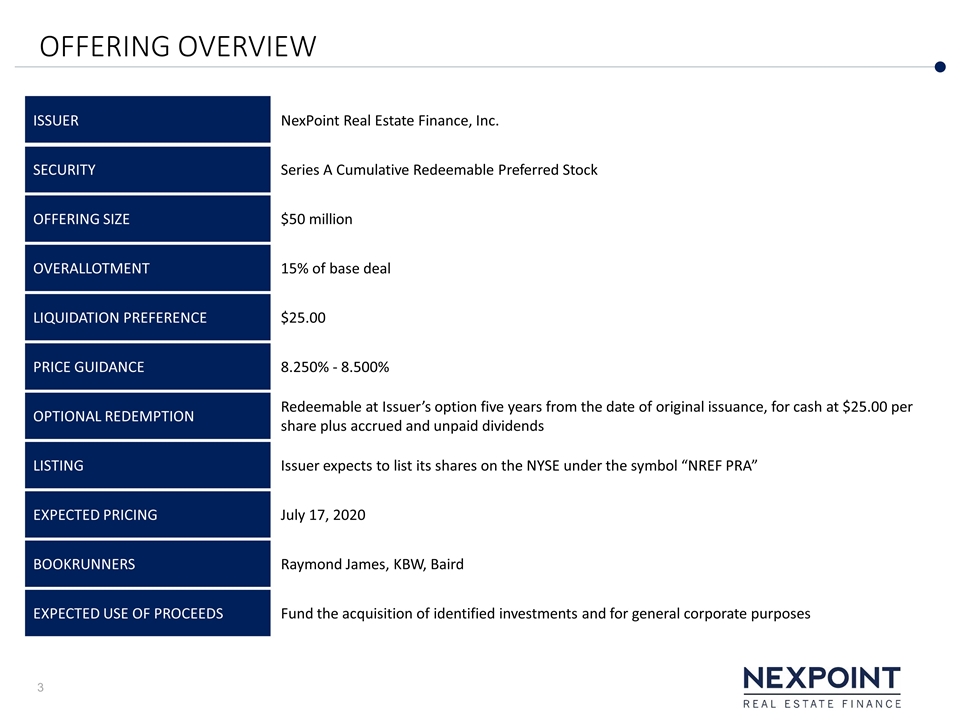
OFFERING OVERVIEW ISSUER NexPoint Real Estate Finance, Inc. SECURITY Series A Cumulative Redeemable Preferred Stock OFFERING SIZE $50 million OVERALLOTMENT 15% of base deal LIQUIDATION PREFERENCE $25.00 PRICE GUIDANCE 8.250% - 8.500% OPTIONAL REDEMPTION Redeemable at Issuer’s option five years from the date of original issuance, for cash at $25.00 per share plus accrued and unpaid dividends LISTING Issuer expects to list its shares on the NYSE under the symbol “NREF PRA” EXPECTED PRICING July 17, 2020 BOOKRUNNERS Raymond James, KBW, Baird EXPECTED USE OF PROCEEDS Fund the acquisition of identified investments and for general corporate purposes

PRESENTERS Matthew Goetz Matt McGraner Paul Richards Chief Financial Officer and Executive Vice President Brian Mitts Chief Investment Officer and Executive Vice President Senior Vice President – Investments and Asset Management VP of Originations and Investments
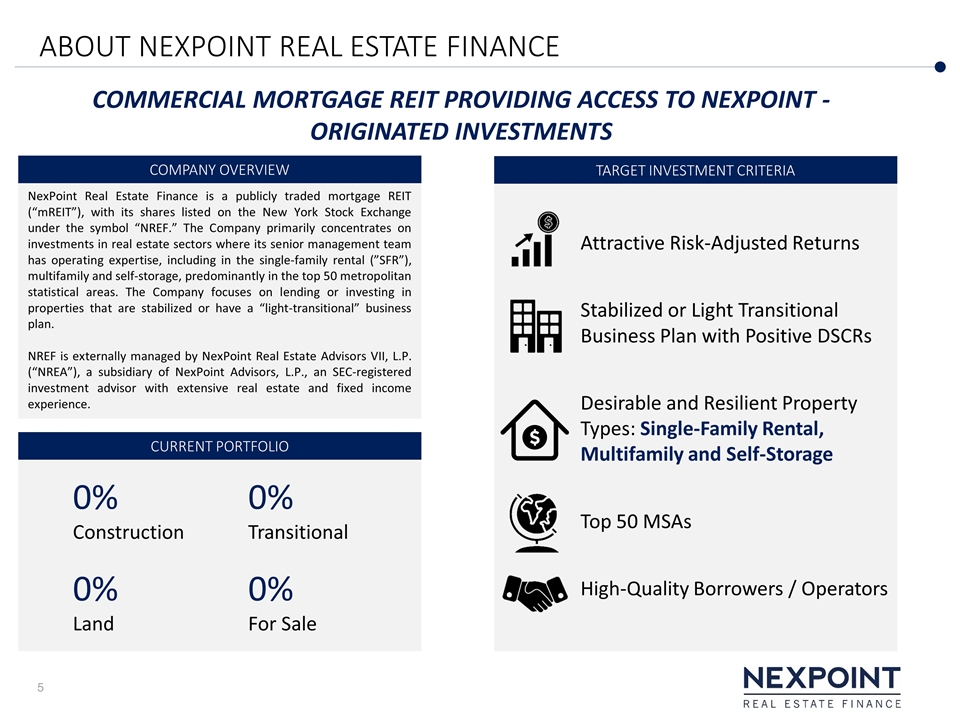
CURRENT PORTFOLIO NexPoint Real Estate Finance is a publicly traded mortgage REIT (“mREIT”), with its shares listed on the New York Stock Exchange under the symbol “NREF.” The Company primarily concentrates on investments in real estate sectors where its senior management team has operating expertise, including in the single-family rental (”SFR”), multifamily and self-storage, predominantly in the top 50 metropolitan statistical areas. The Company focuses on lending or investing in properties that are stabilized or have a “light-transitional” business plan. NREF is externally managed by NexPoint Real Estate Advisors VII, L.P. (“NREA”), a subsidiary of NexPoint Advisors, L.P., an SEC-registered investment advisor with extensive real estate and fixed income experience. COMPANY OVERVIEW ABOUT NEXPOINT REAL ESTATE FINANCE COMMERCIAL MORTGAGE REIT PROVIDING ACCESS TO NEXPOINT -ORIGINATED INVESTMENTS Attractive Risk-Adjusted Returns Stabilized or Light Transitional Business Plan with Positive DSCRs Desirable and Resilient Property Types: Single-Family Rental, Multifamily and Self-Storage Top 50 MSAs High-Quality Borrowers / Operators 0% Construction 0% Land 0% Transitional 0% For Sale TARGET INVESTMENT CRITERIA
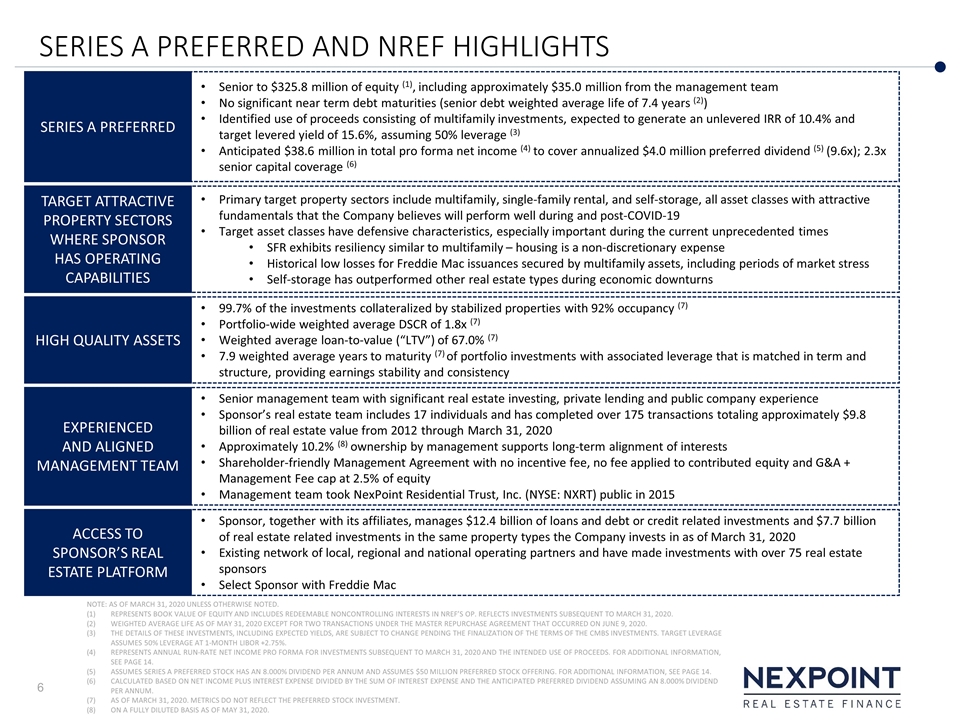
SERIES A PREFERRED AND NREF HIGHLIGHTS 99.7% of the investments collateralized by stabilized properties with 92% occupancy (7) Portfolio-wide weighted average DSCR of 1.8x (7) Weighted average loan-to-value (“LTV”) of 67.0% (7) 7.9 weighted average years to maturity (7) of portfolio investments with associated leverage that is matched in term and structure, providing earnings stability and consistency HIGH QUALITY ASSETS Senior management team with significant real estate investing, private lending and public company experience Sponsor’s real estate team includes 17 individuals and has completed over 175 transactions totaling approximately $9.8 billion of real estate value from 2012 through March 31, 2020 Approximately 10.2% (8) ownership by management supports long-term alignment of interests Shareholder-friendly Management Agreement with no incentive fee, no fee applied to contributed equity and G&A + Management Fee cap at 2.5% of equity Management team took NexPoint Residential Trust, Inc. (NYSE: NXRT) public in 2015 EXPERIENCED AND ALIGNED MANAGEMENT TEAM Sponsor, together with its affiliates, manages $12.4 billion of loans and debt or credit related investments and $7.7 billion of real estate related investments in the same property types the Company invests in as of March 31, 2020 Existing network of local, regional and national operating partners and have made investments with over 75 real estate sponsors Select Sponsor with Freddie Mac ACCESS TO SPONSOR’S REAL ESTATE PLATFORM Primary target property sectors include multifamily, single-family rental, and self-storage, all asset classes with attractive fundamentals that the Company believes will perform well during and post-COVID-19 Target asset classes have defensive characteristics, especially important during the current unprecedented times SFR exhibits resiliency similar to multifamily – housing is a non-discretionary expense Historical low losses for Freddie Mac issuances secured by multifamily assets, including periods of market stress Self-storage has outperformed other real estate types during economic downturns TARGET ATTRACTIVE PROPERTY SECTORS WHERE SPONSOR HAS OPERATING CAPABILITIES NOTE: AS OF MARCH 31, 2020 UNLESS OTHERWISE NOTED. REPRESENTS BOOK VALUE OF EQUITY AND INCLUDES REDEEMABLE NONCONTROLLING INTERESTS IN NREF’S OP. REFLECTS INVESTMENTS SUBSEQUENT TO MARCH 31, 2020. WEIGHTED AVERAGE LIFE AS OF MAY 31, 2020 EXCEPT FOR TWO TRANSACTIONS UNDER THE MASTER REPURCHASE AGREEMENT THAT OCCURRED ON JUNE 9, 2020. THE DETAILS OF THESE INVESTMENTS, INCLUDING EXPECTED YIELDS, ARE SUBJECT TO CHANGE PENDING THE FINALIZATION OF THE TERMS OF THE CMBS INVESTMENTS. TARGET LEVERAGE ASSUMES 50% LEVERAGE AT 1-MONTH LIBOR +2.75%. REPRESENTS ANNUAL RUN-RATE NET INCOME PRO FORMA FOR INVESTMENTS SUBSEQUENT TO MARCH 31, 2020 AND THE INTENDED USE OF PROCEEDS. FOR ADDITIONAL INFORMATION, SEE PAGE 14. ASSUMES SERIES A PREFERRED STOCK HAS AN 8.000% DIVIDEND PER ANNUM AND ASSUMES $50 MILLION PREFERRED STOCK OFFERING. FOR ADDITIONAL INFORMATION, SEE PAGE 14. CALCULATED BASED ON NET INCOME PLUS INTEREST EXPENSE DIVIDED BY THE SUM OF INTEREST EXPENSE AND THE ANTICIPATED PREFERRED DIVIDEND ASSUMING AN 8.000% DIVIDEND PER ANNUM. AS OF MARCH 31, 2020. METRICS DO NOT REFLECT THE PREFERRED STOCK INVESTMENT. ON A FULLY DILUTED BASIS AS OF MAY 31, 2020. Senior to $325.8 million of equity (1), including approximately $35.0 million from the management team No significant near term debt maturities (senior debt weighted average life of 7.4 years (2)) Identified use of proceeds consisting of multifamily investments, expected to generate an unlevered IRR of 10.4% and target levered yield of 15.6%, assuming 50% leverage (3) Anticipated $38.6 million in total pro forma net income (4) to cover annualized $4.0 million preferred dividend (5) (9.6x); 2.3x senior capital coverage (6) SERIES A PREFERRED
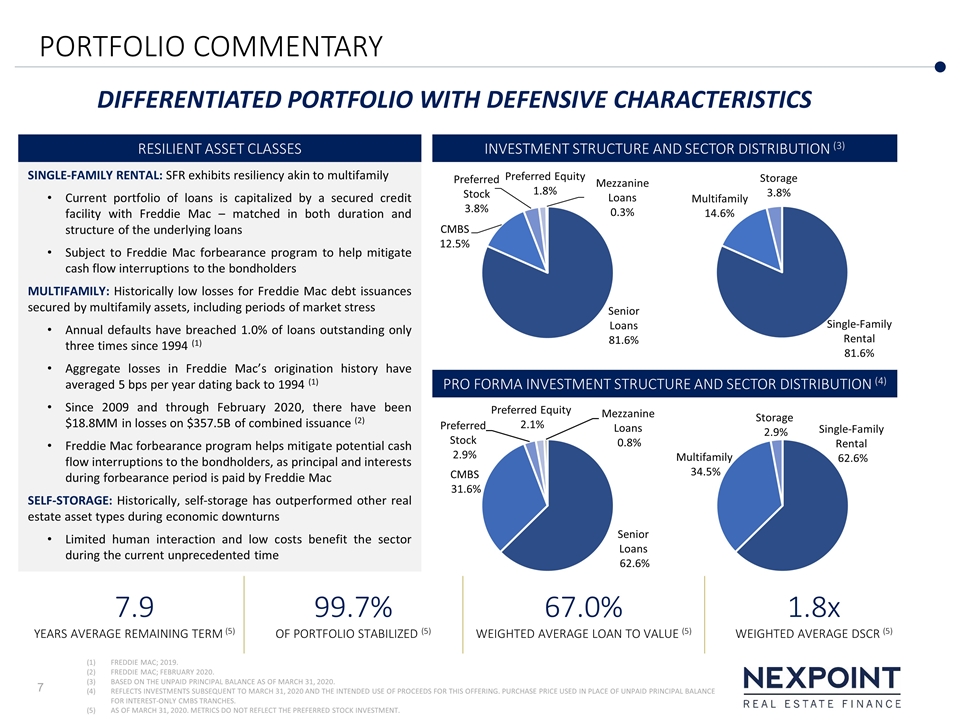
PORTFOLIO COMMENTARY SINGLE-FAMILY RENTAL: SFR exhibits resiliency akin to multifamily Current portfolio of loans is capitalized by a secured credit facility with Freddie Mac – matched in both duration and structure of the underlying loans Subject to Freddie Mac forbearance program to help mitigate cash flow interruptions to the bondholders MULTIFAMILY: Historically low losses for Freddie Mac debt issuances secured by multifamily assets, including periods of market stress Annual defaults have breached 1.0% of loans outstanding only three times since 1994 (1) Aggregate losses in Freddie Mac’s origination history have averaged 5 bps per year dating back to 1994 (1) Since 2009 and through February 2020, there have been $18.8MM in losses on $357.5B of combined issuance (2) Freddie Mac forbearance program helps mitigate potential cash flow interruptions to the bondholders, as principal and interests during forbearance period is paid by Freddie Mac SELF-STORAGE: Historically, self-storage has outperformed other real estate asset types during economic downturns Limited human interaction and low costs benefit the sector during the current unprecedented time RESILIENT ASSET CLASSES FREDDIE MAC; 2019. FREDDIE MAC; FEBRUARY 2020. BASED ON THE UNPAID PRINCIPAL BALANCE AS OF MARCH 31, 2020. REFLECTS INVESTMENTS SUBSEQUENT TO MARCH 31, 2020 AND THE INTENDED USE OF PROCEEDS FOR THIS OFFERING. PURCHASE PRICE USED IN PLACE OF UNPAID PRINCIPAL BALANCE FOR INTEREST-ONLY CMBS TRANCHES. AS OF MARCH 31, 2020. METRICS DO NOT REFLECT THE PREFERRED STOCK INVESTMENT. 7.9 YEARS AVERAGE REMAINING TERM (5) 67.0% WEIGHTED AVERAGE LOAN TO VALUE (5) 1.8x WEIGHTED AVERAGE DSCR (5) 99.7% OF PORTFOLIO STABILIZED (5) INVESTMENT STRUCTURE AND SECTOR DISTRIBUTION (3) DIFFERENTIATED PORTFOLIO WITH DEFENSIVE CHARACTERISTICS PRO FORMA INVESTMENT STRUCTURE AND SECTOR DISTRIBUTION (4)
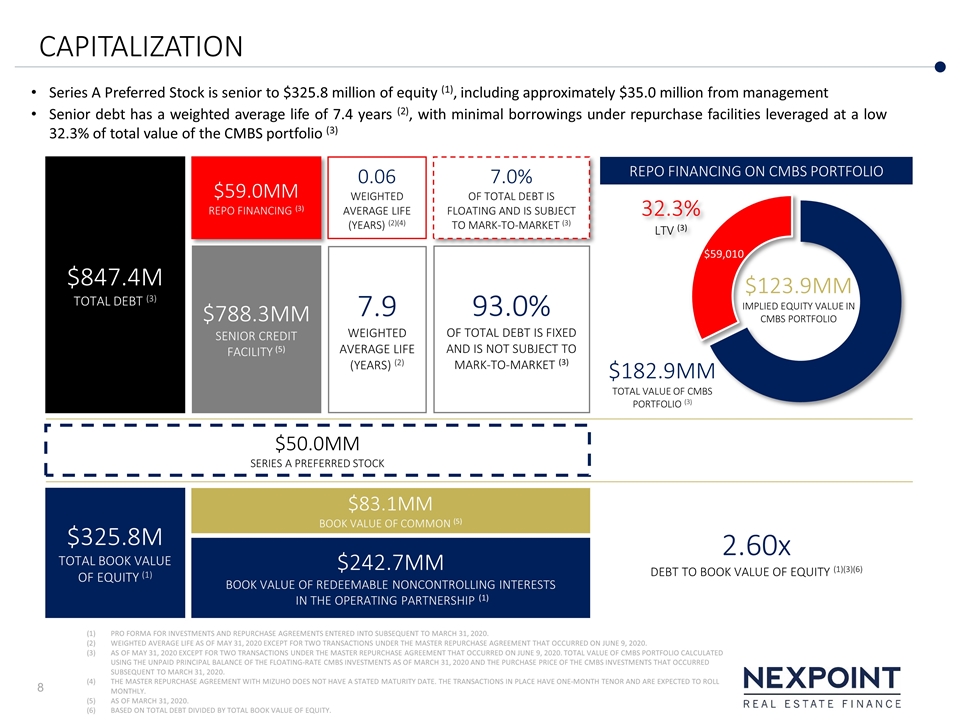
CAPITALIZATION PRO FORMA FOR INVESTMENTS AND REPURCHASE AGREEMENTS ENTERED INTO SUBSEQUENT TO MARCH 31, 2020. WEIGHTED AVERAGE LIFE AS OF MAY 31, 2020 EXCEPT FOR TWO TRANSACTIONS UNDER THE MASTER REPURCHASE AGREEMENT THAT OCCURRED ON JUNE 9, 2020. AS OF MAY 31, 2020 EXCEPT FOR TWO TRANSACTIONS UNDER THE MASTER REPURCHASE AGREEMENT THAT OCCURRED ON JUNE 9, 2020. TOTAL VALUE OF CMBS PORTFOLIO CALCULATED USING THE UNPAID PRINCIPAL BALANCE OF THE FLOATING-RATE CMBS INVESTMENTS AS OF MARCH 31, 2020 AND THE PURCHASE PRICE OF THE CMBS INVESTMENTS THAT OCCURRED SUBSEQUENT TO MARCH 31, 2020. THE MASTER REPURCHASE AGREEMENT WITH MIZUHO DOES NOT HAVE A STATED MATURITY DATE. THE TRANSACTIONS IN PLACE HAVE ONE-MONTH TENOR AND ARE EXPECTED TO ROLL MONTHLY. AS OF MARCH 31, 2020. BASED ON TOTAL DEBT DIVIDED BY TOTAL BOOK VALUE OF EQUITY. $788.3MM SENIOR CREDIT FACILITY (5) 93.0% OF TOTAL DEBT IS FIXED AND IS NOT SUBJECT TO MARK-TO-MARKET (3) 2.60x DEBT TO BOOK VALUE OF EQUITY (1)(3)(6) $83.1MM BOOK VALUE OF COMMON (5) $242.7MM BOOK VALUE OF REDEEMABLE NONCONTROLLING INTERESTS IN THE OPERATING PARTNERSHIP (1) $325.8M TOTAL BOOK VALUE OF EQUITY (1) $123.9MM IMPLIED EQUITY VALUE IN CMBS PORTFOLIO 32.3% LTV (3) $182.9MMTOTAL VALUE OF CMBS PORTFOLIO (3) $50.0MM SERIES A PREFERRED STOCK Series A Preferred Stock is senior to $325.8 million of equity (1), including approximately $35.0 million from management Senior debt has a weighted average life of 7.4 years (2), with minimal borrowings under repurchase facilities leveraged at a low 32.3% of total value of the CMBS portfolio (3) 7.9 WEIGHTED AVERAGE LIFE (YEARS) (2) $59.0MM REPO FINANCING (3) $847.4M TOTAL DEBT (3) 7.0% OF TOTAL DEBT IS FLOATING AND IS SUBJECT TO MARK-TO-MARKET (3) 0.06 WEIGHTED AVERAGE LIFE (YEARS) (2)(4) REPO FINANCING ON CMBS PORTFOLIO
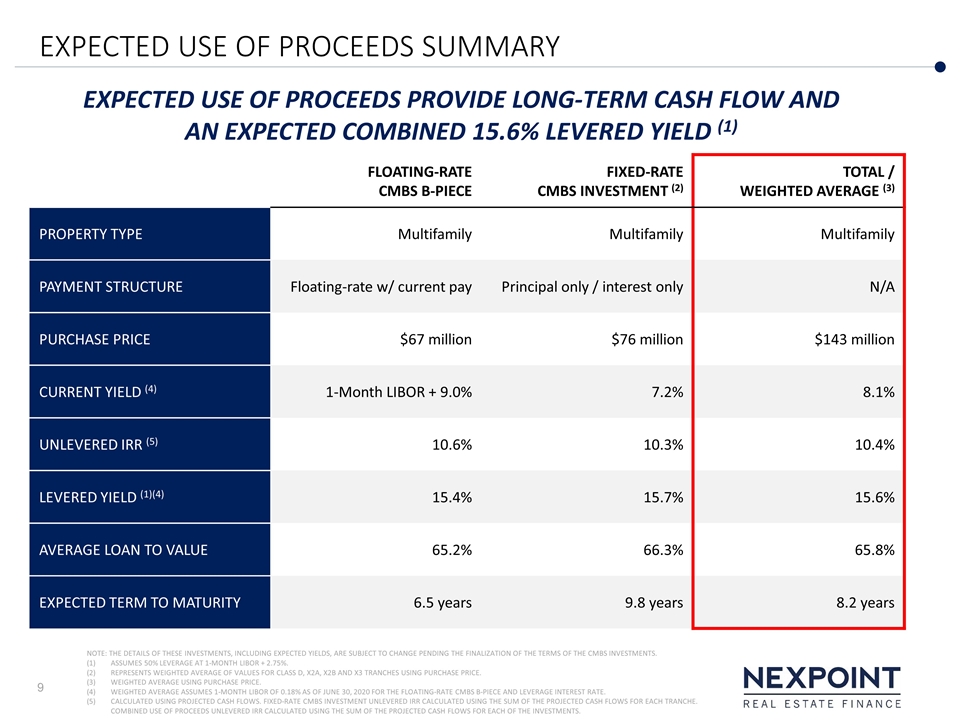
EXPECTED USE OF PROCEEDS SUMMARY NOTE: THE DETAILS OF THESE INVESTMENTS, INCLUDING EXPECTED YIELDS, ARE SUBJECT TO CHANGE PENDING THE FINALIZATION OF THE TERMS OF THE CMBS INVESTMENTS. ASSUMES 50% LEVERAGE AT 1-MONTH LIBOR + 2.75%. REPRESENTS WEIGHTED AVERAGE OF VALUES FOR CLASS D, X2A, X2B AND X3 TRANCHES USING PURCHASE PRICE. WEIGHTED AVERAGE USING PURCHASE PRICE. WEIGHTED AVERAGE ASSUMES 1-MONTH LIBOR OF 0.18% AS OF JUNE 30, 2020 FOR THE FLOATING-RATE CMBS B-PIECE AND LEVERAGE INTEREST RATE. CALCULATED USING PROJECTED CASH FLOWS. FIXED-RATE CMBS INVESTMENT UNLEVERED IRR CALCULATED USING THE SUM OF THE PROJECTED CASH FLOWS FOR EACH TRANCHE. COMBINED USE OF PROCEEDS UNLEVERED IRR CALCULATED USING THE SUM OF THE PROJECTED CASH FLOWS FOR EACH OF THE INVESTMENTS. FLOATING-RATE CMBS B-PIECE FIXED-RATE CMBS INVESTMENT (2) TOTAL / WEIGHTED AVERAGE (3) PROPERTY TYPE Multifamily Multifamily Multifamily PAYMENT STRUCTURE Floating-rate w/ current pay Principal only / interest only N/A PURCHASE PRICE $67 million $76 million $143 million CURRENT YIELD (4) 1-Month LIBOR + 9.0% 7.2% 8.1% UNLEVERED IRR (5) 10.6% 10.3% 10.4% LEVERED YIELD (1)(4) 15.4% 15.7% 15.6% AVERAGE LOAN TO VALUE 65.2% 66.3% 65.8% EXPECTED TERM TO MATURITY 6.5 years 9.8 years 8.2 years EXPECTED USE OF PROCEEDS PROVIDE LONG-TERM CASH FLOW AND AN EXPECTED COMBINED 15.6% LEVERED YIELD (1)
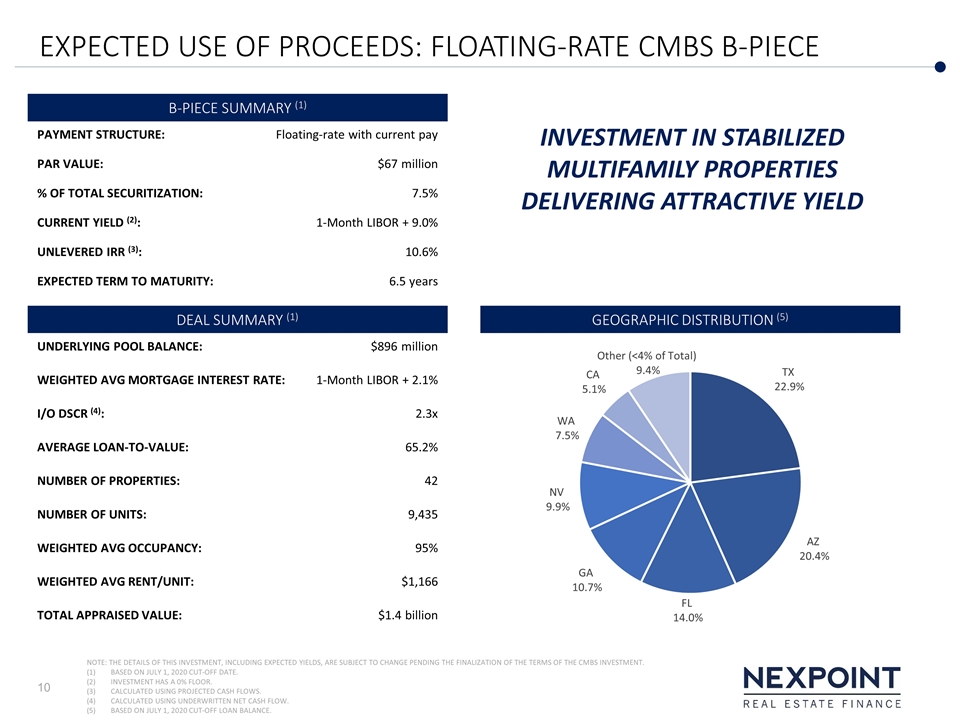
EXPECTED USE OF PROCEEDS: FLOATING-RATE CMBS B-PIECE DEAL SUMMARY (1) UNDERLYING POOL BALANCE: $896 million WEIGHTED AVG MORTGAGE INTEREST RATE: 1-Month LIBOR + 2.1% I/O DSCR (4): 2.3x AVERAGE LOAN-TO-VALUE: 65.2% NUMBER OF PROPERTIES: 42 NUMBER OF UNITS: 9,435 WEIGHTED AVG OCCUPANCY: 95% WEIGHTED AVG RENT/UNIT: $1,166 TOTAL APPRAISED VALUE: $1.4 billion B-PIECE SUMMARY (1) PAYMENT STRUCTURE: Floating-rate with current pay PAR VALUE: $67 million % OF TOTAL SECURITIZATION: 7.5% CURRENT YIELD (2): 1-Month LIBOR + 9.0% UNLEVERED IRR (3): 10.6% EXPECTED TERM TO MATURITY: 6.5 years NOTE: THE DETAILS OF THIS INVESTMENT, INCLUDING EXPECTED YIELDS, ARE SUBJECT TO CHANGE PENDING THE FINALIZATION OF THE TERMS OF THE CMBS INVESTMENT. BASED ON JULY 1, 2020 CUT-OFF DATE. INVESTMENT HAS A 0% FLOOR. CALCULATED USING PROJECTED CASH FLOWS. CALCULATED USING UNDERWRITTEN NET CASH FLOW. BASED ON JULY 1, 2020 CUT-OFF LOAN BALANCE. GEOGRAPHIC DISTRIBUTION (5) INVESTMENT IN STABILIZED MULTIFAMILY PROPERTIES DELIVERING ATTRACTIVE YIELD
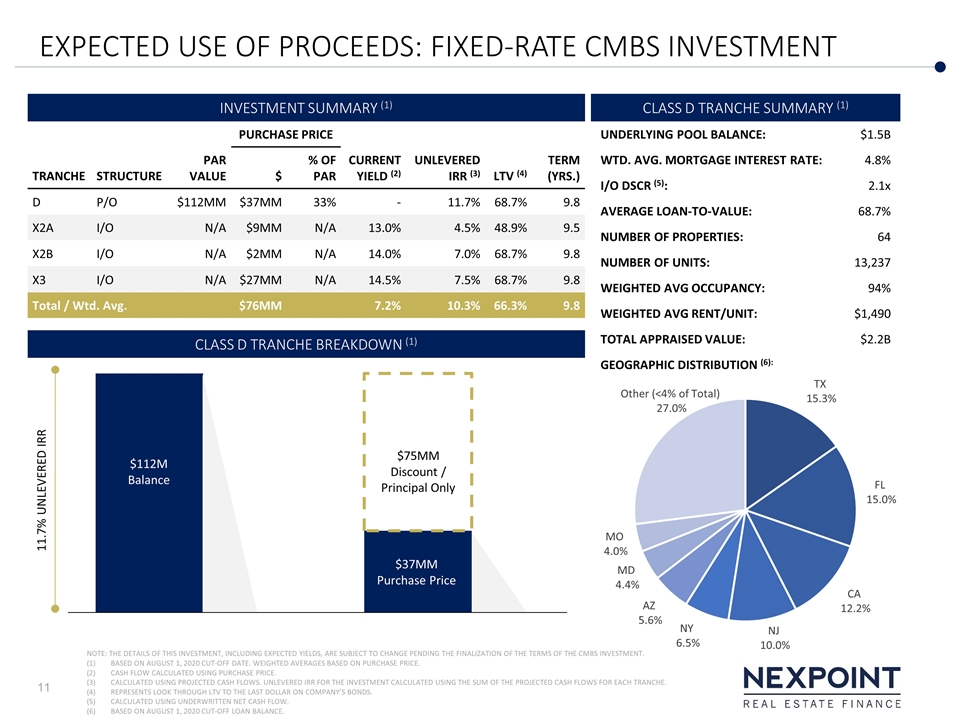
EXPECTED USE OF PROCEEDS: FIXED-RATE CMBS INVESTMENT CLASS D TRANCHE SUMMARY (1) UNDERLYING POOL BALANCE: $1.5B WTD. AVG. MORTGAGE INTEREST RATE: 4.8% I/O DSCR (5): 2.1x AVERAGE LOAN-TO-VALUE: 68.7% NUMBER OF PROPERTIES: 64 NUMBER OF UNITS: 13,237 WEIGHTED AVG OCCUPANCY: 94% WEIGHTED AVG RENT/UNIT: $1,490 TOTAL APPRAISED VALUE: $2.2B GEOGRAPHIC DISTRIBUTION (6): INVESTMENT SUMMARY (1) PURCHASE PRICE CURRENT YIELD (2) UNLEVERED IRR (3) LTV (4) TERM (YRS.) TRANCHE STRUCTURE PAR VALUE $ % OF PAR D P/O $112MM $37MM 33% - 11.7% 68.7% 9.8 X2A I/O N/A $9MM N/A 13.0% 4.5% 48.9% 9.5 X2B I/O N/A $2MM N/A 14.0% 7.0% 68.7% 9.8 X3 I/O N/A $27MM N/A 14.5% 7.5% 68.7% 9.8 Total / Wtd. Avg. $76MM 7.2% 10.3% 66.3% 9.8 NOTE: THE DETAILS OF THIS INVESTMENT, INCLUDING EXPECTED YIELDS, ARE SUBJECT TO CHANGE PENDING THE FINALIZATION OF THE TERMS OF THE CMBS INVESTMENT. BASED ON AUGUST 1, 2020 CUT-OFF DATE. WEIGHTED AVERAGES BASED ON PURCHASE PRICE. CASH FLOW CALCULATED USING PURCHASE PRICE. CALCULATED USING PROJECTED CASH FLOWS. UNLEVERED IRR FOR THE INVESTMENT CALCULATED USING THE SUM OF THE PROJECTED CASH FLOWS FOR EACH TRANCHE. REPRESENTS LOOK THROUGH LTV TO THE LAST DOLLAR ON COMPANY’S BONDS. CALCULATED USING UNDERWRITTEN NET CASH FLOW. BASED ON AUGUST 1, 2020 CUT-OFF LOAN BALANCE. 11.7% UNLEVERED IRR $37MM Purchase Price $75MM Discount / Principal Only $112M Balance CLASS D TRANCHE BREAKDOWN (1)
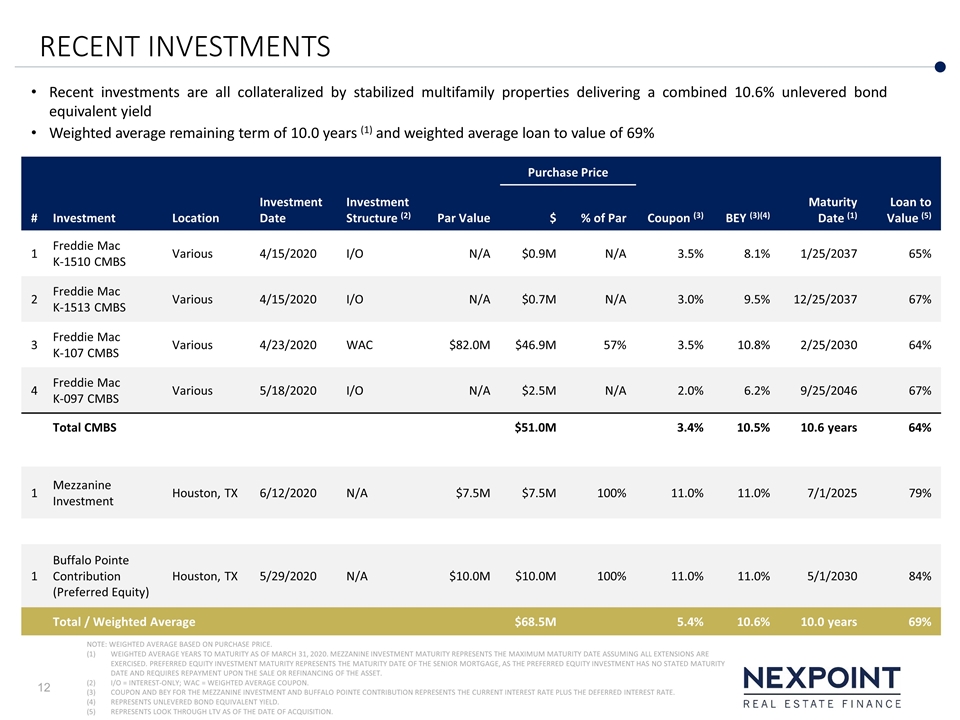
RECENT INVESTMENTS # Investment Location Investment Date Investment Structure (2) Par Value Purchase Price Coupon (3) BEY (3)(4) Maturity Date (1) Loan to Value (5) $ % of Par 1 Freddie Mac K-1510 CMBS Various 4/15/2020 I/O N/A $0.9M N/A 3.5% 8.1% 1/25/2037 65% 2 Freddie Mac K-1513 CMBS Various 4/15/2020 I/O N/A $0.7M N/A 3.0% 9.5% 12/25/2037 67% 3 Freddie Mac K-107 CMBS Various 4/23/2020 WAC $82.0M $46.9M 57% 3.5% 10.8% 2/25/2030 64% 4 Freddie Mac K-097 CMBS Various 5/18/2020 I/O N/A $2.5M N/A 2.0% 6.2% 9/25/2046 67% Total CMBS $51.0M 3.4% 10.5% 10.6 years 64% 1 Mezzanine Investment Houston, TX 6/12/2020 N/A $7.5M $7.5M 100% 11.0% 11.0% 7/1/2025 79% 1 Buffalo Pointe Contribution (Preferred Equity) Houston, TX 5/29/2020 N/A $10.0M $10.0M 100% 11.0% 11.0% 5/1/2030 84% Total / Weighted Average $68.5M 5.4% 10.6% 10.0 years 69% Recent investments are all collateralized by stabilized multifamily properties delivering a combined 10.6% unlevered bond equivalent yield Weighted average remaining term of 10.0 years (1) and weighted average loan to value of 69% NOTE: WEIGHTED AVERAGE BASED ON PURCHASE PRICE. WEIGHTED AVERAGE YEARS TO MATURITY AS OF MARCH 31, 2020. MEZZANINE INVESTMENT MATURITY REPRESENTS THE MAXIMUM MATURITY DATE ASSUMING ALL EXTENSIONS ARE EXERCISED. PREFERRED EQUITY INVESTMENT MATURITY REPRESENTS THE MATURITY DATE OF THE SENIOR MORTGAGE, AS THE PREFERRED EQUITY INVESTMENT HAS NO STATED MATURITY DATE AND REQUIRES REPAYMENT UPON THE SALE OR REFINANCING OF THE ASSET. I/O = INTEREST-ONLY; WAC = WEIGHTED AVERAGE COUPON. COUPON AND BEY FOR THE MEZZANINE INVESTMENT AND BUFFALO POINTE CONTRIBUTION REPRESENTS THE CURRENT INTEREST RATE PLUS THE DEFERRED INTEREST RATE. REPRESENTS UNLEVERED BOND EQUIVALENT YIELD. REPRESENTS LOOK THROUGH LTV AS OF THE DATE OF ACQUISITION.
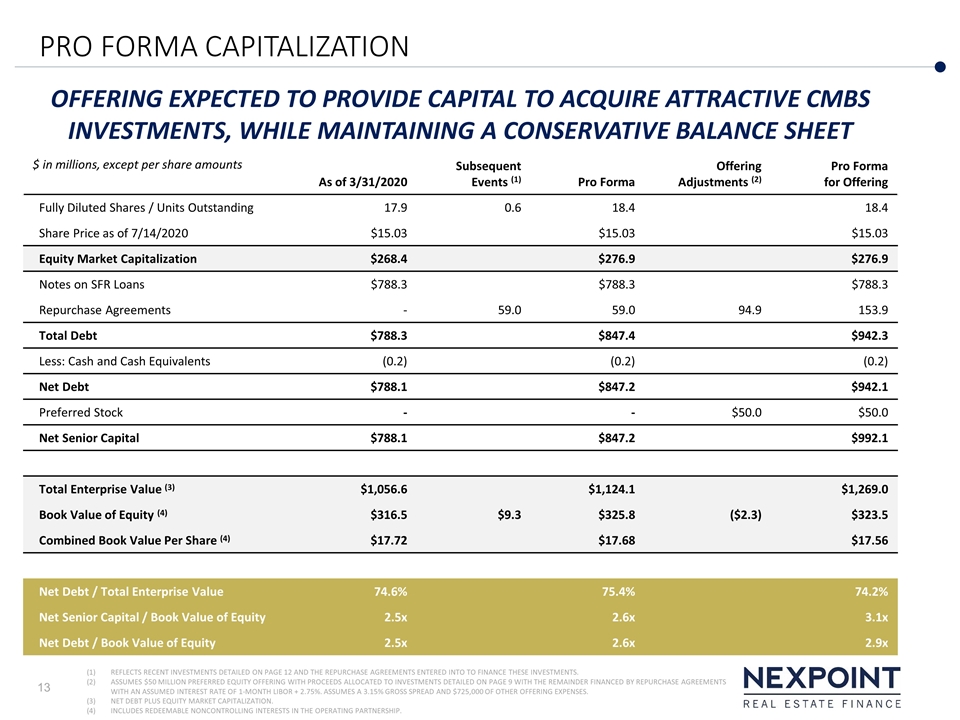
PRO FORMA CAPITALIZATION REFLECTS RECENT INVESTMENTS DETAILED ON PAGE 12 AND THE REPURCHASE AGREEMENTS ENTERED INTO TO FINANCE THESE INVESTMENTS. ASSUMES $50 MILLION PREFERRED EQUITY OFFERING WITH PROCEEDS ALLOCATED TO INVESTMENTS DETAILED ON PAGE 9 WITH THE REMAINDER FINANCED BY REPURCHASE AGREEMENTS WITH AN ASSUMED INTEREST RATE OF 1-MONTH LIBOR + 2.75%. ASSUMES A 3.15% GROSS SPREAD AND $725,000 OF OTHER OFFERING EXPENSES. NET DEBT PLUS EQUITY MARKET CAPITALIZATION. INCLUDES REDEEMABLE NONCONTROLLING INTERESTS IN THE OPERATING PARTNERSHIP. $ in millions, except per share amounts As of 3/31/2020 Subsequent Events (1) Pro Forma Offering Adjustments (2) Pro Forma for Offering Fully Diluted Shares / Units Outstanding 17.9 0.6 18.4 18.4 Share Price as of 7/14/2020 $15.03 $15.03 $15.03 Equity Market Capitalization $268.4 $276.9 $276.9 Notes on SFR Loans $788.3 $788.3 $788.3 Repurchase Agreements - 59.0 59.0 94.9 153.9 Total Debt $788.3 $847.4 $942.3 Less: Cash and Cash Equivalents (0.2) (0.2) (0.2) Net Debt $788.1 $847.2 $942.1 Preferred Stock - - $50.0 $50.0 Net Senior Capital $788.1 $847.2 $992.1 Total Enterprise Value (3) $1,056.6 $1,124.1 $1,269.0 Book Value of Equity (4) $316.5 $9.3 $325.8 ($2.3) $323.5 Combined Book Value Per Share (4) $17.72 $17.68 $17.56 Net Debt / Total Enterprise Value 74.6% 75.4% 74.2% Net Senior Capital / Book Value of Equity 2.5x 2.6x 3.1x Net Debt / Book Value of Equity 2.5x 2.6x 2.9x OFFERING EXPECTED TO PROVIDE CAPITAL TO ACQUIRE ATTRACTIVE CMBS INVESTMENTS, WHILE MAINTAINING A CONSERVATIVE BALANCE SHEET
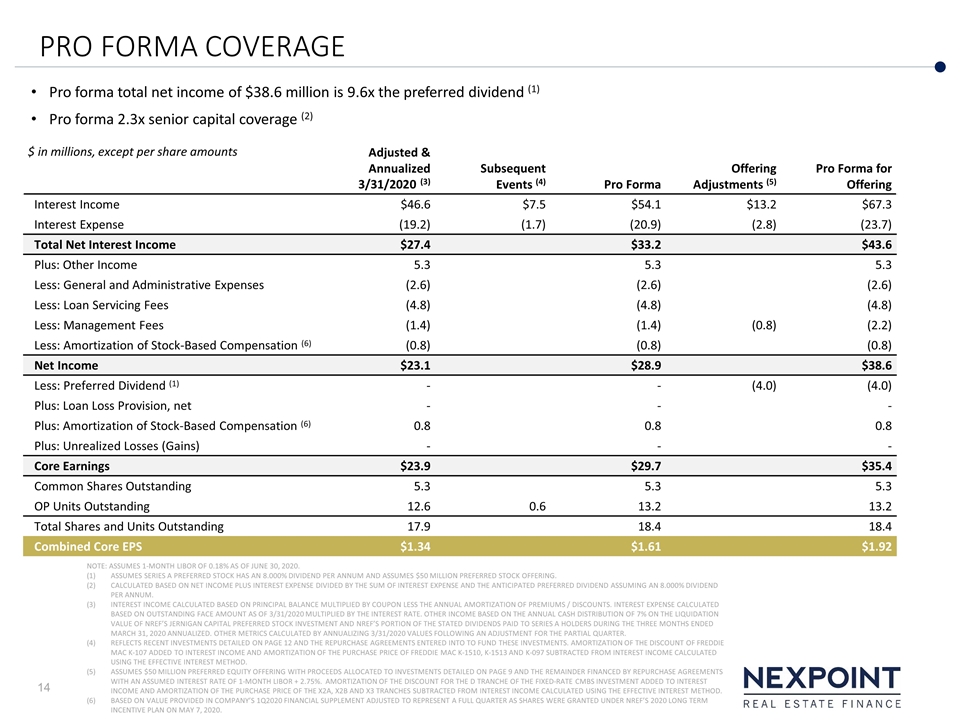
PRO FORMA COVERAGE NOTE: ASSUMES 1-MONTH LIBOR OF 0.18% AS OF JUNE 30, 2020. ASSUMES SERIES A PREFERRED STOCK HAS AN 8.000% DIVIDEND PER ANNUM AND ASSUMES $50 MILLION PREFERRED STOCK OFFERING. CALCULATED BASED ON NET INCOME PLUS INTEREST EXPENSE DIVIDED BY THE SUM OF INTEREST EXPENSE AND THE ANTICIPATED PREFERRED DIVIDEND ASSUMING AN 8.000% DIVIDEND PER ANNUM. INTEREST INCOME CALCULATED BASED ON PRINCIPAL BALANCE MULTIPLIED BY COUPON LESS THE ANNUAL AMORTIZATION OF PREMIUMS / DISCOUNTS. INTEREST EXPENSE CALCULATED BASED ON OUTSTANDING FACE AMOUNT AS OF 3/31/2020 MULTIPLIED BY THE INTEREST RATE. OTHER INCOME BASED ON THE ANNUAL CASH DISTRIBUTION OF 7% ON THE LIQUIDATION VALUE OF NREF’S JERNIGAN CAPITAL PREFERRED STOCK INVESTMENT AND NREF’S PORTION OF THE STATED DIVIDENDS PAID TO SERIES A HOLDERS DURING THE THREE MONTHS ENDED MARCH 31, 2020 ANNUALIZED. OTHER METRICS CALCULATED BY ANNUALIZING 3/31/2020 VALUES FOLLOWING AN ADJUSTMENT FOR THE PARTIAL QUARTER. REFLECTS RECENT INVESTMENTS DETAILED ON PAGE 12 AND THE REPURCHASE AGREEMENTS ENTERED INTO TO FUND THESE INVESTMENTS. AMORTIZATION OF THE DISCOUNT OF FREDDIE MAC K-107 ADDED TO INTEREST INCOME AND AMORTIZATION OF THE PURCHASE PRICE OF FREDDIE MAC K-1510, K-1513 AND K-097 SUBTRACTED FROM INTEREST INCOME CALCULATED USING THE EFFECTIVE INTEREST METHOD. ASSUMES $50 MILLION PREFERRED EQUITY OFFERING WITH PROCEEDS ALLOCATED TO INVESTMENTS DETAILED ON PAGE 9 AND THE REMAINDER FINANCED BY REPURCHASE AGREEMENTS WITH AN ASSUMED INTEREST RATE OF 1-MONTH LIBOR + 2.75%. AMORTIZATION OF THE DISCOUNT FOR THE D TRANCHE OF THE FIXED-RATE CMBS INVESTMENT ADDED TO INTEREST INCOME AND AMORTIZATION OF THE PURCHASE PRICE OF THE X2A, X2B AND X3 TRANCHES SUBTRACTED FROM INTEREST INCOME CALCULATED USING THE EFFECTIVE INTEREST METHOD. BASED ON VALUE PROVIDED IN COMPANY’S 1Q2020 FINANCIAL SUPPLEMENT ADJUSTED TO REPRESENT A FULL QUARTER AS SHARES WERE GRANTED UNDER NREF’S 2020 LONG TERM INCENTIVE PLAN ON MAY 7, 2020. $ in millions, except per share amounts Adjusted & Annualized 3/31/2020 (3) Subsequent Events (4) Pro Forma Offering Adjustments (5) Pro Forma for Offering Interest Income $46.6 $7.5 $54.1 $13.2 $67.3 Interest Expense (19.2) (1.7) (20.9) (2.8) (23.7) Total Net Interest Income $27.4 $33.2 $43.6 Plus: Other Income 5.3 5.3 5.3 Less: General and Administrative Expenses (2.6) (2.6) (2.6) Less: Loan Servicing Fees (4.8) (4.8) (4.8) Less: Management Fees (1.4) (1.4) (0.8) (2.2) Less: Amortization of Stock-Based Compensation (6) (0.8) (0.8) (0.8) Net Income $23.1 $28.9 $38.6 Less: Preferred Dividend (1) - - (4.0) (4.0) Plus: Loan Loss Provision, net - - - Plus: Amortization of Stock-Based Compensation (6) 0.8 0.8 0.8 Plus: Unrealized Losses (Gains) - - - Core Earnings $23.9 $29.7 $35.4 Common Shares Outstanding 5.3 5.3 5.3 OP Units Outstanding 12.6 0.6 13.2 13.2 Total Shares and Units Outstanding 17.9 18.4 18.4 Combined Core EPS $1.34 $1.61 $1.92 Pro forma total net income of $38.6 million is 9.6x the preferred dividend (1) Pro forma 2.3x senior capital coverage (2)