UNITED STATES
SECURITIES AND EXCHANGE COMMISSION
Washington, D.C. 20549
FORM N-CSR
CERTIFIED SHAREHOLDER REPORT OF REGISTERED
MANAGEMENT INVESTMENT COMPANIES
Investment Company Act file number | (811-23474) |
|
KKR Credit Opportunities Portfolio |
(Exact name of registrant as specified in charter) |
|
555 California Street, 50th Floor San Francisco, CA | | 94104 |
(Address of principal executive offices) | | (Zip code) |
|
Annette O’Donnell-Butner KKR Credit Advisors (US) LLC 555 California Street, 50th Floor San Francisco, CA 94104 |
(Name and address of agent for service) |
|
Registrant’s telephone number, including area code: | (415) 315-3620 | |
|
Date of fiscal year end: | October 31, 2020 | |
|
Date of reporting period: | April 30, 2020 | |
| | | | | | | | |
Item 1. Reports to Stockholders.
KKR
KKR Credit Opportunities Portfolio
Semi-Annual Report
April 30, 2020
Beginning on January 1, 2021, as permitted by regulations adopted by the U.S. Securities and Exchange Commission, paper copies of the Fund’s annual and semi-annual shareholder reports will no longer be sent by mail, unless you specifically request paper copies of the reports from the Fund or from your financial intermediary (such as a broker-dealer or bank). Instead, the reports will be made available on a website, and you will be notified by mail each time a report is posted and provided with a website link to access the report.
If you already elected to receive shareholder reports electronically, you will not be affected by this change and you need not take any action. You may elect to receive shareholder reports and other communications from the Fund electronically by contacting your financial intermediary or, if you are a direct investor, by calling the Fund at 1-855-862-6092.
You may elect to receive all future reports in paper free of charge. If you invest through a financial intermediary, you can contact your financial intermediary to request that you continue to receive paper copies of your shareholder reports; if you invest directly with the Fund, you can call the Fund at 1-855-862-6092. Your election to receive reports in paper form will apply to all funds held in your account with your financial intermediary.

| | |
Credit Opportunities Portfolio | April 30, 2020
(Unaudited) |
Table of Contents
Management Discussion of Fund Performance | 1 |
Performance Information | 5 |
Schedule of Investments | 6 |
Statement of Assets and Liabilities | 19 |
Statement of Operations | 20 |
Statements of Changes in Net Assets | 21 |
Statement of Cash Flows | 22 |
Financial Highlights | 23 |
Notes to Financial Statements | 24 |
Approval of Investment Advisory Agreement | 32 |
Dividend Reinvestment Plan | 34 |
Privacy Notice | 36 |
The KKR Credit Opportunities Portfolio (the “Fund”) files its complete schedule of portfolio holdings with the Securities and Exchange Commission (the “Commission”) for the first and third quarters of each fiscal year on Form N-PORT within sixty days after the end of the period. The Fund’s Form N-PORT is available on the Commission’s website at http://www.sec.gov.
A description of the policies and procedures that the Fund uses to determine how to vote proxies relating to portfolio securities, as well as information relating to how a Fund voted proxies relating to portfolio securities during the most recent period ended June 30 will be available (i) without charge, upon request, by calling 855-862-6092; and (ii) on the Commission’s website at http://www.sec.gov.
INFORMATION ABOUT THE FUND’S TRUSTEES
The proxy statements and annual reports include information about the Fund’s Trustees and are available without charge, upon request, by calling 855-862-6092 and by visiting the Commission’s website at www.sec.gov.
Management Discussion of Fund Performance
Looking Back on the Markets — April 30, 2020
KKR Credit Opportunities Portfolio (“KCOP”) aims to dynamically allocate across credit instruments to capitalize on changes in relative value among corporate credit investments and manage against macroeconomic risks. Our portfolio seeks exposure to companies where the perception of risk may be high but our analysis leads us to believe that that risk is lower. KCOP is focused on where we believe risk or true value is misperceived by many market participants. Our predominant focus is on large companies in sectors where names are not typically over-valued. We believe KCOP is well suited to the current credit market conditions as we seek assets that we believe are dislocated or fundamentally mispriced. We believe we are well equipped to construct a robust portfolio in times of stress and provide value to institutional portfolios that have broad credit exposure.
We began 2020 recognizing that the persistence of 2019 market trends — the zealous yearn for yield, spread compression, and continued lack of supply and the deepening bifurcation between high quality and storied credits were poised for a shakeup. Nobody could have foreseen the tragic global pandemic that has now changed the world we once knew forever. We are facing an absolutely unprecedented crisis, with the emergence and continued spread of COVID -19. This is a significant and grave public health issue that has now evolved into a global market and financial disruption. It has catalyzed lightning speed government responses as we have seen with the historical fiscal stimulus package.
This pandemic has disrupted the markets in a way we have not seen since the Great Financial Crisis (“GFC”). The sudden halting of our movement and business activities has created a ghost that is looming through our economy, daily routines, and for a large array of companies — uncertain future revenue streams. While we still cannot fully quantify the depths of the financial aftershocks that will inevitably reverberate through our economy and the consumer, we believe strongly that now is not the time to fear the market’s volatility. Instead, we believe it is a time to be prudent and take opportunities to reposition, lean into dislocated opportunities, and position for the most attractive risk adjusted investments.
In our view, the uncertainty in the market today will continue for the foreseeable future, but we are encouraged that the market is pricing risk as it proves to us that even companies in the eye of the storm have access to capital. While we have no doubt that COVID-19 will change human behavior and we will all evolve to acclimate to a new normal, we also believe that the asset prices of quality credits and businesses will rebound ahead of the fundamentals and delivery of certainty. We will continue to be credit underwriters with deep conviction and focus on the opportunities that have extended runway of liquidity and strong collateral packages to provide us with extra downside protection and comfort will we step in during the persistent uncertainty.
Market Commentary(1)
High yield bonds and loans endured an historic sell-off and recovery in March as the COVID-19 outbreak quickly morphed into an economic crisis that elicited unprecedented measures from policymakers. The Federal Reserve announced extraordinary steps including the uncapping the size of asset purchases and adding agency commercial mortgage-backed securities (“CMBS”) to the list of securities to be purchased, the creation of new credit facilities to purchase or lend to corporations in the primary and secondary markets , restarting the crisis-era term asset-backed securities loan facility (TALF), and including municipal securities in the list of eligible assets. Meanwhile, a $2 trillion economic relief bill was passed to backstop the financial markets and the U.S. economy.
High yield and loan prices recovered in April, as unprecedented measures by central banks and governments were enough to offset the near-term economic fallout from the COVID-19 outbreak. A peak in new infections in many of the world’s hot spots and a bottoming in oil prices allowed the S&P to finish with its strongest monthly gain since 1987.
1
April included historic volatility in oil prices with the May contract for WTI turning negative intra -month. The Fed announced an additional $2.3 trillion of additional credit support in early April by expanding a number of its programs, including TALF and the Main Street Lending program.
In terms of performance, the BAML High Yield Master Index II returned -13.1% in Q1 2020 and the S&P LSTA Leveraged Loan index returned -13.0%. The speed and velocity of the market sell-off was unprecedented. Notably, after the rapid sell-off in March, the high yield market experienced the fastest ever recorded decline in yields over the last week in March. The loan asset class experienced its two largest daily price increases the last week in March after experiencing six of the seven largest daily declines in the market’s history over the prior two weeks. Risk assets continued to rally in April, with the BAML High Yield Master Index II returning +4.5% and the S&P LSTA Leveraged Loan Index returning +3.8%.
There were five defaults totaling $18.8 billion in bonds and loans in March, the sixth largest monthly default on record. In Q1 2020, a total of 13 companies defaulted totaling $23.5 billion in bonds and loans. This ranked as the seventh highest quarterly default volume on record. In March, the par-weighted U.S. high yield default rated jumped to a three -year high of 3.35%. Notably, energy has accounted for 45% of total bond default volume over the last 12 months. The par weighted loan default rate ended March at 1.87%, which is the highest the loan default rate has been since October 2018.
Primary market activity stalled throughout most of March as the markets endured an historic sell -off as the COVID-19 pandemic warped into a global economic crisis. In the high yield market, only five bonds priced in March, and four of these issuances were in the first week of the month. However, on a year to date basis, gross high yield volume totaled $73 billion, which was an 11% increase compared to Q1 2019. March broke a 37-month streak of refinancing leading the use of proceeds as 100% of March volume was used for ex-refinancing purposes. Year to date, refinancing volumes totals $53.9 billion, which accounts for 74% of volume, while acquisition financing totals $8.1 billion (11%), general corporate deals total $8.8 billion (12%) and dividend deals total $0.8 billion (1%).
The loan market priced 12 deals in March, which was the lowest numbers of deals priced in a month since January 2010. On a year to date basis, the loan market priced $199 billion, which was three times higher compared to Q1 2019. With repricing and refinancing issuance falling off a cliff, issuance in Mach was nearly entirely acquisition financing. Only one refinancing deal for $24 million priced in March, while the remaining deals were for acquisition financing purposes. On a year to date basis, refinancing volume totals $45 billion.
U.S. CLO issuance dropped in March as loan issuance stalled, with no CLOs pricing since March 12th. Monthly gross volume fell to $4.9 billion across only nine deals. This followed February’s volume of $29 billion, the highest monthly volume since June 2018, and $8.0 billion in January.
In March, high yield mutual funds saw an exodus of outflows totaling $13 billion, the second largest monthly outflow on record. Flows for high yield bonds year to date total -$16.7 billion, which compares to inflows for fiscal year 2019 totaling +$18.8 billion. Loan funds have already been under pressure with redemptions and had their second record outflow and 18th consecutive outflow in March. Specifically, in March, loan funds reported outflows of $9.0 billion. Flows for loan funds year to date total -$11.6 billion, which compares to record outflows in fiscal year 2019 of -$38.3 billion.
The Market in Numbers(1)
For the period of November 1, 2019 — April 30, 2020:
· Returns: Over the six month period ending April 30, 2020, the high yield and leveraged loan markets returned -7.7%(2) and -7.1%(3) (as measured by the Bank of America Merrill Lynch High Yield Index and the S&P LSTA Leveraged Loan Index), respectively.
2
· Spreads: The option adjusted spread on the Bank of America Merrill Lynch High Yield Index ended the period at 763bps(2). The 3-year discounted spread on the S&P LSTA Leveraged Loan Index ended the period at 898bps(3).
· Volatility: As measured by the VIX index, over the last six months, the VIX increased to as high as 82.7 in mid-March 2020, before settling at 34.2(4) as of April 30, 2020.
Fund Background and Performance
KKR Credit Opportunities Portfolio (“KCOP” or, the “Fund”) is a newly organized, diversified, closed-end management investment company that continuously offers its shares (the “Shares”) and is operated as an “interval fund .” The Fund’s investment objective is to seek to provide attractive risk-adjusted returns and high current income.
The Fund seeks to achieve its investment objectives by investing in a select portfolio with exposure to two primary credit strategies:
1. Opportunistic Credit, a conviction-based approach investing in a portfolio consisting primarily of publicly traded high yield bonds, first- and second-lien secured bank loans and structured credit (e.g., collateralized loan obligation (“CLO”) and mezzanine debt) and
2. Private Credit, which includes directly originated hard and financial asset-based lending, corporate mezzanine debt, as well as directly originated first-lien, second-lien and unitranche senior loans to upper middle-market companies.
Under normal market conditions, the Fund will invest at least 80% of its Managed Assets (as defined below) in senior and subordinated corporate debt and debt related instruments, including bonds, secured bank loans, convertible securities, structured products, convertible debt securities, repurchase agreements, and municipal securities.
During an initial ramp period of approximately 6-18 months following the Fund’s commencement of operations, the Fund will invest substantially all of its assets in the Opportunistic Credit Strategy. Following that initial period, the Fund expects, under normal circumstances, to invest 70-80% of its Managed Assets in the Opportunistic Credit strategy and 20-30% of its Managed Assets in the Private Credit Strategy, though the Fund’s allocation in investments could vary from these guidelines at any time in the Fund’s discretion. Investment in the Private Credit Strategy is contingent upon the Fund first achieving sufficient scale to acquire such positions, and there can be no assurance that the Fund will ever raise sufficient assets to invest in the Private Credit Strategy. On at least a quarterly basis, the Fund’s Investment Committee will meet to, among other things, review and establish the allocation percentage between the Opportunistic Credit Strategy and Private Credit Strategy for the ensuing period. The Investment Committee will consider factors such as KKR’s macro -economic and market outlooks, assessment of the relative risk and return of each strategy, and other factors in making its determination. “Managed Assets” means the total assets of the Fund (including any assets attributable to borrowings for investment purposes) minus the sum of the Fund’s accrued liabilities (other than liabilities representing borrowings for investment purposes).
As of April 30, 2020, the Fund held 40.5% of its net assets in first and second-lien leveraged loans, 47.7% of its net assets in high-yield corporate debt, 1.0% of its net assets in collateralized loan obligations, and 0.6% of its net assets in common stock. KCOP’s investments represented obligations and equity interests in 190 positions across a diverse group of industries. The top ten issuers represented 25.3% of the Fund’s net assets while the top five industry groups represented 42.4% of the Fund’s net assets. The Fund’s Securities and Exchange Commission 30-day yield was 5.39%.
(1) Source: S&P/LSTA LCD Index Monthly and JPM High Yield Bond and Leveraged Loan Market Monitor as of April 30, 2020.
(2) Source: Bank of America Merrill Markets Online as of April 30, 2020.
(3) Source: S&P LCD Discounted Spreads as of April 30, 2020.
(4) Source: Bloomberg as of April 30, 2020.
3
Business Updates
We thank you for your partnership and continued investment in KCOP. We look forward to continued communications and will keep you apprised of the progress of KCOP specifically and the leveraged finance market place generally.
Disclosures
The Bank of America Merrill Lynch High Yield Master II Index is a market-value weighted index of below investment grade U.S. dollar-denominated corporate bonds publicly issued in the U.S. domestic market. “Yankee” bonds (debt of foreign issuers issued in the U.S. domestic market) are included in the Bank of America Merrill Lynch High Yield Master II Index provided that the issuer is domiciled in a country having investment grade foreign currency long-term debt rating. Qualifying bonds must have maturities of one year or more, a fixed coupon schedule and minimum outstanding of US$100 million. In addition, issues having a credit rating lower than BBB3, but not in default, are also included.
The Chicago Board Options Exchange (CBOE) Volatility Index (VIX) reflects the market’s expectation of 30-day volatility. It is constructed using the implied volatilities of a wide range of S&P 500 index options. The VIX reflects the market’s estimate of future volatility, based on the weighted average of the implied volatilities for a wide range of strikes. The first and second month expirations are used until 8 days from expiration, then the second and third are used.
The S&P/LSTA Leveraged Loan Index is a market value-weighted index designed to measure the performance of the U.S. leveraged loan market weightings, spreads and interest payments. The index was rolled out in 2000 and it was back-loaded with four years of data dating to 1997.
It is not possible to invest directly in an index.
Past performance is not an indication of future results. Returns represent past performance and reflect changes in share prices, the reinvestment of all dividends and capital gains, expense limitations and the effects of compounding. The prospectus contains more complete information on the investment objectives, risks, charges and expenses of the investment company, which investors should read and consider carefully before investing. The returns shown do not reflect taxes a shareholder would pay on distributions or redemptions. Total investment return and principal value of your investment will fluctuate, and your shares, when sold, may be worth more or less than their original cost. Current performance may be higher or lower than the performance data quoted. An investment in the Fund involves risk, including the risk of loss of principal. For a discussion of the Fund’s risks, see Risk Considerations, Note 3 to the financial statements. Call 855-330-3927 for performance results current to the most recent calendar quarter-end.
Must be preceded or accompanied by a prospectus.
An imbalance in supply and demand in the income market may result in valuation uncertainties and greater volatility, less liquidity, widening credit spreads and a lack of price transparency in the market. Investments in income securities may be affected by changes in the creditworthiness of the issuer and are subject to the risk of non-payment of principal and interest. The value of income securities also may decline because of real or perceived concerns about the issuer’s ability to make principal and interest payments. Borrowing to increase investments (leverage) will exaggerate the effect of any increase or decrease in the value of Fund investments. Investments rated below investment grade (typically referred to as “junk”) are generally subject to greater price volatility and illiquidity than higher rated investments. As interest rates rise, the value of certain income investments is likely to decline. Senior loans are subject to prepayment risk. Investments in foreign instruments or currencies can involve greater risk and volatility than U.S. investments because of adverse market economic, political, regulatory, geopolitical or other conditions. Changes in the value of investments entered for hedging purposes may not match those of the position being hedged. The Fund may engage in other investment practices that may involve additional risks.
4
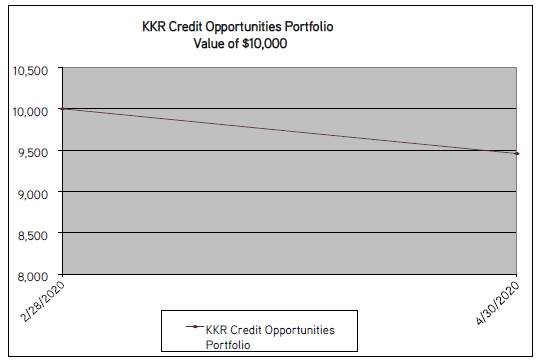
| | | | Value of | |
Average Annual Total Returns | | Since Inception | | $10,000 | |
Period Ended April 30, 2020 | | (2/28/2020) | | 4/30/2020 | |
KKR Credit Opportunities Portfolio | | -5.42 | % | $ | 9,458 | |
| | | | | | |
5
Schedule of Investments | | Par† | | Value | |
| | | | | |
Leveraged Loans - 40.5% | | | | | |
Aerospace & Defense - 0.2% | | | | | |
EaglePicher Technologies, LLC, TL 1L 02/18 | | | | | |
3.654%, (1 month US LIBOR +3.250%), 03/08/2025 (a) | | 315,198 | | $ | 293,135 | |
EaglePicher Technologies, LLC, TL 2L 02/18 | | | | | |
7.654%, (1 month US LIBOR +7.250%), 03/08/2026 (a) | | 62,000 | | 53,216 | |
PAE Holding Corp., TL 1L 09/16 | | | | | |
6.500%, (1 month US LIBOR +5.500%), 10/20/2022 (a) | | 175,126 | | 168,997 | |
| | | | 515,348 | |
Auto Components - 1.1% | | | | | |
Innovative XCessories & Services LLC , TL 1L 02/20 | | | | | |
6.298%, (3 month US LIBOR +5.000%), 03/05/2027 (a) | | 1,139,740 | | 991,574 | |
| | | | | |
Building Products - 0.5% | | | | | |
MI Windows & Doors, Inc., TL 1L 10/19 | | | | | |
6.413%, (6 month US LIBOR +5.500%), 11/06/2026 (a) | | 474,415 | | 425,788 | |
| | | | | |
Chemicals - 3.0% | | | | | |
Diversey, Inc., TL 1L 07/17 | | | | | |
3.759%, (3 month US LIBOR +3.000%), 09/26/2024 (a) | | 476,781 | | 411,969 | |
Diversey, Inc., TL 1L 09/17 EUR | | | | | |
3.250% (3 Month EURIBOR + 3.250%), 09/26/2024 (a) | | EUR | 742,087 | | 717,960 | |
Emerald Performance Materials, LLC, | | | | | |
TL 2L 07/14 8.750%, (1 month US LIBOR +7.750%), 08/01/2022 (a) | | 61,000 | | 57,035 | |
Invictus, TL 2L 01/18 | | | | | |
8.529%, (3 month US LIBOR +6.750%), 03/30/2026 (a) New | | 39,000 | | 29,348 | |
Arclin US Holding Corp., TL 2L 02/17 | | | | | |
9.154%, (1 month US LIBOR +8.750%), 02/14/2025 (a) SI | | 9,000 | | 7,423 | |
Group, Inc., TL 1L 07/18 | | | | | |
5.725%, (1 month US LIBOR +4.750%), 10/15/2025 (a) | | 573,659 | | 500,517 | |
Vantage Specialty Chemicals, Inc., TL 2L 10/17 | | | | | |
9.863%, (3 month US LIBOR +8.250%), 10/27/2025 (a) | | 457,050 | | 310,794 | |
Vantage Specialty Chemicals, Inc., TL 1L B 10/17 | | | | | |
4.735%, (6 month US LIBOR +3.500%), 10/26/2024 (a) | | 598,784 | | 479,560 | |
| | | | 2,514,606 | |
Commercial Services & Supplies - 1.0% | | | | | |
Access CIG, LLC, TL 2L 02/18 | | | | | |
8.154%, (1 month US LIBOR +7.750%), 02/27/2026 (a) | | 143,000 | | 125,125 | |
Access CIG, LLC, TL 1L 02/18 | | | | | |
4.154%, (1 month US LIBOR +3.750%), 02/27/2025 (a) | | 38,901 | | 36,449 | |
Advantage Sales & Marketing, Inc., TL 2L 06/14 | | | | | |
7.950%, (3 month US LIBOR +6.500%), 07/25/2022 (a) | | 147,000 | | 106,085 | |
| | | | | | | |
See accompanying notes to financial statements.
6
Advantage Sales & Marketing, Inc., TL 1L B 06/14 | | | | | |
4.700%, (3 month US LIBOR +3.250%), 07/23/2021 (a) | | 310,179 | | $ | 267,918 | |
ASP Acuren Merger Sub, Inc., TL 1L B 01/20 | | | | | |
4.806%, (3 month US LIBOR +4.250%), 01/23/2027 (a) | | 60,000 | | 55,200 | |
Monitronics International, Inc., TL 1L EXIT 08/19 | | | | | |
7.750%, (1 month US LIBOR +6.500%), 03/29/2024 (a) | | 541,639 | | 366,961 | |
| | | | 957,738 | |
Construction & Engineering - 3.3% | | | | | |
Brand Energy & Infrastructure Services, Inc., TL 1L 05/17 | | | | | |
5.455%, (3 month US LIBOR +4.250%), 06/21/2024 (a) | | 1,083,764 | | 923,399 | |
Total Safety US, Inc., TL 1L B 07/19 | | | | | |
7.728%, (3 month US LIBOR +6.000%), 08/16/2025 (a) | | 1,323,808 | | 1,099,707 | |
Yak Access, LLC, TL 1L B 05/18 | | | | | |
6.450%, (3 month US LIBOR +5.000%), 07/11/2025 (a) | | 1,526,307 | | 1,028,349 | |
| | | | 3,051,455 | |
Construction Materials - 0.1% | | | | | |
Quimper AB, TL 2L 02/19 EUR | | | | | |
8.250% (3 Month EURIBOR + 8.250%), 02/15/2027 (a)(b) | | EUR | 94,000 | | 95,285 | |
| | | | | |
Containers & Packaging - 0.1% | | | | | |
Canister International Group, Inc., TL 1L 12/19 | | | | | |
5.154%, (1 month US LIBOR +4.750%), 12/20/2026 (a) | | 64,633 | | 62,694 | |
| | | | | |
Distributors - 0.4% | | | | | |
Distribution International, Inc., TL 1L 06/19 | | | | | |
6.750%, (3 month US LIBOR +5.750%), 12/15/2023 (a) | | 453,857 | | 357,412 | |
| | | | | |
Diversified Consumer Services - 0.9% | | | | | |
Airbnb, Inc., TL 1L 03/20 | | | | | |
8.250%, 04/15/2025 (a) | | 242,470 | | 247,622 | |
Jostens, Inc., TL 1L 12/18 | | | | | |
6.056%, (6 month US LIBOR +5.500%), 12/19/2025 (a) | | 661,897 | | 590,952 | |
| | | | 838,574 | |
Diversified Telecommunication Services - 0.3% | | | | | |
Onvoy LLC, TL 1L 01/17 | | | | | |
5.500%, (1 month US LIBOR +4.500%), 02/10/2024 (a) | | 102,735 | | 86,586 | |
Peak 10 Holding Corp., TL 1L | | | | | |
07/17 4.950%, (3 month US LIBOR +3.500%), 08/01/2024 (a) | | 317,187 | | 232,424 | |
| | | | 319,010 | |
Electronic Equipment, Instruments & Components - 1.3% | | | | | |
Excelitas Technologies Corp., TL 2L 10/17 | | | | | |
8.937%, (3 month US LIBOR +7.500%), 12/01/2025 (a) | | 1,476,100 | | 1,245,688 | |
| | | | | |
Energy Equipment & Services - 0.1% | | | | | |
Caprock Midstream, LLC, TL 1L B 10/18 | | | | | |
5.154% (3 Month LIBOR USD + 4.750%), 11/03/2025 (a) | | 145,633 | | 71,360 | |
| | | | | | | |
See accompanying notes to financial statements.
7
Food & Staples Retailing - 1.0% | | | | | |
Action Nederland BV, TL 1L B 11/19 EUR | | | | | |
3.500% (3 Month EURIBOR + 3.750%), 01/18/2027 (a)(b) | | EUR | 644,410 | | $ | 642,845 | |
Action Nederland BV, TL 1L B 02/18 EUR | | | | | | |
3.500% (6 Month EURIBOR + 3.500%), 03/07/2025 (a)(b) | | EUR | 67,720 | | 67,306 | |
Froneri Ltd., TL 2L 01/20 USD | | | | | |
6.154%, (1 month US LIBOR +5.750%), 01/31/2028 (a)(b) | | 60,000 | | 57,300 | |
Smart & Final Stores LLC, TL 1L B 05/19 | | | | | |
7.306%, (1 month US LIBOR +6.750%), 06/20/2025 (a) | | 195,508 | | 186,710 | |
| | | | 954,161 | |
Food Products - 0.5% | | | | | |
CSM Bakery Products, TL 2L 07/13 | | | | | |
9.100%, (3 month US LIBOR +7.750%), 07/05/2021 (a)(c)(d) | | 75,000 | | 57,450 | |
CSM Bakery Products, TL 1L B 07/13 | | | | | |
5.350%, (3 month US LIBOR +4.000%), 07/03/2020 (a)(c)(d) | | 483,000 | | 407,732 | |
| | | | 465,182 | |
Health Care Providers & Services - 1.5% | | | | | |
Affordable Care Inc., TL 1L 10/15 | | | | | |
6.200%, (3 month US LIBOR +4.750%), 10/24/2022 (a) | | 431,246 | | 304,747 | |
LifePoint Hospitals, Inc., TL 1L 10/18 | | | | | |
4.154%, (1 month US LIBOR +3.750%), 11/16/2025 (a) | | 6,000 | | 5,587 | |
MultiPlan, Inc., TL 1L B 05/16 | | | | | |
4.200%, (3 month US LIBOR +2.750%), 06/07/2023 (a) | | 539,431 | | 499,734 | |
Paradigm Acquistion Corp., TL 2L 10/18 LC | | | | | |
9.113%, (3 month US LIBOR +7.500%), 10/26/2026 (a) | | 30,000 | | 24,000 | |
Team Health, Inc., TL 1L 01/17 | | | | | |
3.750%, (1 month US LIBOR +2.750%), 02/06/2024 (a) | | 712,165 | | 528,931 | |
US Anesthesia Partners, Inc., TL 1L B 01/18 | | | | | |
4.000%, (6 month US LIBOR +3.000%), 06/23/2024 (a) | | 55,690 | | 47,913 | |
| | | | 1,410,912 | |
Hotels, Restaurants & Leisure - 5.0% | | | | | |
Aimbridge Acquisition Co, Inc., TL 1L B 10/19 | | | | | |
5.017%, (3 month US LIBOR +3.750%), 02/02/2026 (a) | | 999,960 | | 818,297 | |
B&B Hotels SAS, TL 1L B3A 01/20 EUR | | | | | |
3.875% (3 Month EURIBOR + 3.875%), 07/31/2026 (a)(b) | | EUR | 1,096,500 | | 1,016,486 | |
ClubCorp Club Operations, Inc., TL 1L B 08/17 | | | | | |
4.200%, (3 month US LIBOR +2.750%), 09/18/2024 (a) | | 1,028,862 | | 770,103 | |
Diamond Resorts International, Inc., TL 1L B 06/18 | | | | | |
4.750%, (1 month US LIBOR +3.750%), 09/02/2023 (a) | | 661,313 | | 506,566 | |
Life Time Fitness, Inc., TL B 1L 01/17 | | | | | |
4.363%, (3 month US LIBOR +2.750%), 06/10/2022 (a) | | 1,495,849 | | 1,282,227 | |
Station Casinos LLC, TL 1L B 01/20 | | | | | |
2.660%, (1 month US LIBOR +2.250%), 02/08/2027 (a) | | 313,921 | | 278,757 | |
| | | | 4,672,436 | |
| | | | | | | | |
See accompanying notes to financial statements.
8
Household Products - 0.3% | | | | | |
Steinhoff, TL 1L 07/19 (SFH Super Senior) | | | | | |
10.000%, 12/31/2021 (b)(g) | | EUR | 9,000 | | $ | 9,690 | |
Steinhoff, TL 1L 08/19 (SFH A1) | | | | | | |
0.000%, 12/31/2021 (b)(g)(h) | | EUR | 605,000 | | 301,661 | |
| | | | 311,351 | |
Industrial Conglomerates - 0.1% | | | | | |
Unifrax I LLC / Unifrax Holding Co., TL 1L B 10/18 USD | | | | | |
4.306%, (6 month US LIBOR +3.750%), 12/12/2025 (a) | | 110,720 | | 84,604 | |
Unifrax I LLC / Unifrax Holding Co., TL 1L B 11/18 EUR | | | | | |
3.750% (3 Month EURIBOR + 3.750%), 12/12/2025 (a) | | EUR | 25,000 | | 21,095 | |
| | | | 105,699 | |
IT Services - 0.8% | | | | | |
PSAV, Inc., TL 2L 02/18 | | | | | |
9.013%, (3 month US LIBOR +7.250%), 09/01/2025 (a) | | 189,000 | | 120,015 | |
Sutherland Global Services, Inc., TL 1L 10/14 _US Borrower | | | | | |
6.825%, (3 month US LIBOR +5.375%), 04/23/2021 (a) | | 640,306 | | 458,885 | |
Sutherland Global Services, Inc., TL 1L 10/14_Cayman Borrower | | | | | |
6.825%, (3 month US LIBOR +5.375%), 04/23/2021 (a) | | 148,966 | | 106,759 | |
Systems Maintenance Services Holdings, Inc., TL 1L B 10/16 | | | | | |
6.450%, (3 month US LIBOR +5.000%), 10/30/2023 (a) | | 110,714 | | 85,089 | |
| | | | 770,748 | |
Leisure Products - 1.3% | | | | | |
Camping World Good Sam, TL 1L B 03/18 | | | | | |
4.116%, (3 month US LIBOR +2.750%), 11/08/2023 (a) | | 1,610,741 | | 1,208,055 | |
| | | | | |
Life Sciences Tools & Services - 1.5% | | | | | |
Albany Molecular Research, Inc., TL 2L 07/17 | | | | | |
8.000%, (3 month US LIBOR +7.000%), 08/30/2025 (a) | | 301,530 | | 268,362 | |
Albany Molecular Research, Inc., TL 1L 07/17 | | | | | |
4.250%, (1 month US LIBOR +3.250%), 08/30/2024 (a) | | 308,838 | | 285,135 | |
BioClinica-Synowledge Holdings, TL 1L 10/16 | | | | | |
5.250%, (1 month US LIBOR +4.250%), 10/20/2023 (a) | | 238,084 | | 212,291 | |
PAREXEL International Corp., TL 1L 08/17 | | | | | |
3.154%, (1 month US LIBOR +2.750%), 09/27/2024 (a) | | 651,000 | | 599,848 | |
| | | | 1,365,636 | |
Machinery - 1.3% | | | | | |
Accuride Corp., TL 1L B 10/17 | | | | | |
6.700%, (3 month US LIBOR +5.250%), 11/17/2023 (a) | | 524,435 | | 229,005 | |
CPM Holdings, Inc., TL 2L 10/18 | | | | | |
9.342%, (6 month US LIBOR +8.250%), 11/16/2026 (a) | | 92,000 | | 77,433 | |
Utility One Source LP, TL 1L B 02/20 | | | | | |
4.968%, (1 month US LIBOR +4.250%), 04/18/2025 (a) | | 712,993 | | 680,909 | |
| | | | | | | | |
See accompanying notes to financial statements.
9
WireCo WorldGroup, Inc., TL 2L 07/16 | | | | | |
10.072%, (6 month US LIBOR +9.000%), 09/30/2024 (a) | | 239,000 | | $ | 173,275 | |
WireCo WorldGroup, Inc., TL 1L 07/16 | | | | | |
6.072%, (6 month US LIBOR +5.000%), 09/29/2023 (a) | | 88,148 | | 67,323 | |
| | | | 1,227,945 | |
Media - 1.9% | | | | | |
Emerald Expositions Holding, Inc., TL 1L B 11/17 | | | | | |
3.154%, (1 month US LIBOR +2.750%), 05/22/2024 (a) | | 148,000 | | 116,069 | |
NEP Broadcasting, LLC, TL 2L 09/18 | | | | | |
8.450%, (3 month US LIBOR +7.000%), 10/19/2026 (a) | | 393,000 | | 235,800 | |
NEP Broadcasting, LLC, TL 1L B 09/18 | | | | | |
4.700%, (3 month US LIBOR +3.250%), 10/20/2025 (a) | | 421,223 | | 341,191 | |
NEP Broadcasting, LLC, TL 1L B 09/18 EUR | | | | | |
3.500% (3 Month EURIBOR + 3.500%), 10/20/2025 (a) | | EUR | 1,226,160 | | 1,074,954 | |
| | | | 1,768,014 | |
Metals & Mining - 3.0% | | | | | |
Foresight Energy LP, TL 1L 03/20 DIP | | | | | |
12.000%, (1 month US LIBOR +11.000%), 09/04/2020 (a)(c)(d)(e) | | 55,268 | | 54,293 | |
Foresight Energy LP, TL 1L 03/20 DIP DD | | | | | |
12.000%, (1 month US LIBOR +11.000%), 09/04/2020 (a)(c)(d)(e) | | 39,359 | | 38,665 | |
Foresight Energy, LLC, TL 1L B 03/17 | | | | | |
0.000%, 03/28/2022 (a)(c)(d)(h) | | 615,000 | | 65,344 | |
Sequa Corp., TL 2L 04/17 | | | | | |
10.000%, (3 month US LIBOR +9.000%), 04/28/2022 (a) Sequa | | 894,000 | | 668,265 | |
Corp., TL 1L B 11/17 | | | | | |
6.742%, (3 month US LIBOR +5.000%), 11/28/2021 (a) | | 2,416,375 | | 2,030,758 | |
| | | | 2,857,325 | |
Multiline Retail - 0.5% | | | | | |
Belk, Inc., TL 1L B 10/19 | | | | | |
7.750%, (6 month US LIBOR +6.750%), 07/31/2025 (a)(c)(d) | | 1,214,190 | | 503,889 | |
| | | | | |
Oil, Gas & Consumable Fuels - 0.1% | | | | | |
Eagleclaw Midstream Ventures, TL 1L 05/17 | | | | | |
5.250%, (1 month US LIBOR +4.250%), 06/24/2024 (a) | | 221,431 | | 107,394 | |
Oryx Midstream Ventures, LLC, TL 1L B 04/19 | | | | | |
4.404%, (1 month US LIBOR +4.000%), 05/08/2026 (a) | | 10,972 | | 7,790 | |
| | | | 115,184 | |
Personal Products - 1.1% | | | | | |
Coty, Inc., TL 1L B 04/18 | | | | | |
3.171%, (1 month US LIBOR +2.250%), 04/07/2025 (a) | | 1,009,563 | | 829,229 | |
Coty, Inc., TL 1L B 03/18 | | | | | |
2.500% (3 Month EURIBOR + 2.500%), 04/07/2025 (a) | | EUR | 49,290 | | 46,363 | |
Coty, Inc., TL 1L A 04/18 | | | | | |
2.421%, (1 month US LIBOR +1.500%), 04/05/2023 (a) | | 235,501 | | 196,643 | |
| | | | 1,072,235 | |
| | | | | | | | |
See accompanying notes to financial statements.
10
Professional Services - 0.4% | | | | | |
SIRVA Worldwide, Inc., TL 2L 07/18 | | | | | |
10.776%, (3 month US LIBOR +9.500%), 08/03/2026 (a) | | 59,000 | | $ | 38,645 | |
SIRVA Worldwide, Inc., TL 1L 07/18 | | | | | |
6.178%, (3 month US LIBOR +5.500%), 08/04/2025 (a) | | 436,996 | | 317,914 | |
| | | | 356,559 | |
Road & Rail - 1.5% | | | | | |
The Kenan Advantage Group, Inc., TL 1L B1 07/15 | | | | | |
4.000%, (1 month US LIBOR +3.000%), 07/31/2022 (a) | | 1,238,533 | | 1,030,559 | |
The Kenan Advantage Group, Inc., TL 1L B2 07/15 Canadian Borrower | | | | | |
4.000%, (1 month US LIBOR +3.000%), 07/31/2022 (a) Transplace, | | 294,525 | | 245,068 | |
TL 2L 09/17 | | | | | |
9.822%, (6 month US LIBOR +8.750%), 10/06/2025 (a) | | 180,000 | | 135,000 | |
| | | | 1,410,627 | |
Software - 5.6% | | | | | |
Applied Systems, Inc., TL 2L 09/17 | | | | | |
8.450%, (3 month US LIBOR +7.000%), 09/19/2025 (a) | | 236,000 | | 227,023 | |
Gigamon, Inc., TL 1L 11/17 | | | | | |
5.250%, (6 month US LIBOR +4.250%), 12/27/2024 (a) | | 364,737 | | 342,853 | |
Misys Ltd., TL 2L 04/17 USD | | | | | |
8.250%, (6 month US LIBOR +7.250%), 06/13/2025 (a) | | 226,000 | | 194,360 | |
Misys Ltd., TL 1L 04/17 | | | | | |
4.500%, (6 month US LIBOR +3.500%), 06/13/2024 (a) | | 170,540 | | 149,174 | |
Superion LLC, TL 1L 08/18 | | | | | |
5.200% (3 Month LIBOR USD + 3.750%), 08/15/2025 (a) | | 493,811 | | 430,028 | |
Syncsort, Inc., TL 1L B 11/18 | | | | | |
7.863% (1 Month LIBOR USD + 6.250%), 08/16/2024 (a) | | 154,608 | | 139,654 | |
Syncsort, Inc., TL 1L B 10/19 (Add-on) | | | | | |
7.580% (1 Month LIBOR USD + 6.000%), 08/16/2024 (a) | | 215,460 | | 193,578 | |
TIBCO Software Inc, TL 2L 02/20 | | | | | |
7.660%, (1 month US LIBOR +7.250%), 03/03/2028 (a) | | 1,243,520 | | 1,164,246 | |
Vertafore Inc., TL 2L 07/18 | | | | | |
7.654%, (1 month US LIBOR +7.250%), 07/02/2026 (a) | | 1,504,586 | | 1,429,830 | |
Vertafore, Inc., TL 1L 05/18 | | | | | |
3.654%, (1 month US LIBOR +3.250%), 06/04/2025 (a) | | 1,078,692 | | 998,194 | |
| | | | 5,268,940 | |
Specialty Retail - 0.3% | | | | | |
Jo-Ann Stores, Inc., TL 2L 04/18 | | | | | |
10.250%, (1 month US LIBOR +9.250%), 05/21/2024 (a) | | 66,000 | | 15,180 | |
Jo-Ann Stores, Inc., TL 1L B 10/16 | | | | | |
6.000%, (1 month US LIBOR +5.000%), 10/20/2023 (a) | | 359,000 | | 117,073 | |
| | | | | | |
See accompanying notes to financial statements.
11
Talbots, Inc., TL 1L B 11/18 | | | | | |
8.450%, (3 month US LIBOR +7.000%), 11/28/2022 (a) | | 212,000 | | $ | 164,300 | |
| | | | 296,553 | |
Technology Hardware, Storage, & Peripherals - 0.2% | | | | | |
Electronics For Imaging, Inc., TL 1L 06/19 | | | | | |
6.450%, (3 month US LIBOR +5.000%), 07/23/2026 (a)(c)(d) | | 278,303 | | 213,597 | |
| | | | | |
Textiles, Apparel & Luxury Goods - 0.1% | | | | | |
Varsity Brands Holding Co, Inc., TL 1L 11/17 | | | | | |
4.500% (3 Month LIBOR USD + 3.500%), 12/16/2024 (a) | | 145,628 | | 106,763 | |
| | | | | |
Transportation Infrastructure - 0.1% | | | | | |
Direct ChassisLink, Inc., TL 2L 04/19 | | | | | |
9.561%, (3 month US LIBOR +8.250%), 04/10/2026 (a) | | 155,000 | | 120,125 | |
| | | | | |
Wireless Telecommunication Services - 0.1% | | | | | |
GCI, Inc., TL 1L 08/17 | | | | | |
2.654%, (1 month US LIBOR +2.250%), 02/02/2022 (a) | | 108,878 | | 103,570 | |
TOTAL LEVERAGED LOANS (amortized cost $42,766,986) | | | | 38,132,038 | |
| | | | | |
High Yield Securities - 47.7% | | | | | |
Aerospace & Defense - 1.7% | | | | | |
The Boeing Co. | | | | | |
5.930%, 05/01/2060 | | 105,000 | | 105,000 | |
5.805%, 05/01/2050 | | 105,000 | | 105,000 | |
5.705%, 05/01/2040 | | 105,000 | | 105,000 | |
TransDigm, Inc. | | | | | |
8.000%, 12/15/2025 (f) | | 692,000 | | 723,140 | |
6.500%, 07/15/2024 | | 573,000 | | 532,288 | |
| | | | 1,570,428 | |
Airlines - 0.8% | | | | | |
Sabre, Inc. | | | | | |
9.250%, 04/15/2025 (f) | | 193,000 | | 204,821 | |
5.375%, 04/15/2023 (f) | | 535,000 | | 500,332 | |
| | | | 705,153 | |
Automobiles — 0.7% | | | | | |
Ford Motor Co. | | | | | |
9.625%, 04/22/2030 | | 105,000 | | 103,425 | |
9.000%, 04/22/2025 | | 225,000 | | 219,938 | |
8.500%, 04/21/2023 | | 300,000 | | 298,125 | |
| | | | 621,488 | |
Building Products - 1.8% | | | | | |
Ply Gem Holdings, Inc. | | | | | |
8.000%, 04/15/2026 (f) | | 1,330,000 | | 1,138,493 | |
SRS Distribution, Inc. | | | | | |
8.250%, 07/01/2026 (f) | | 601,000 | | 563,197 | |
| | | | 1,701,690 | |
| | | | | | |
See accompanying notes to financial statements.
12
Chemicals - 0.9% | | | | | |
Cornerstone Chemical Co. | | | | | |
6.750%, 08/15/2024 (f) | | 168,000 | | $ | 137,306 | |
Nouryon | | | | | |
6.500%, 10/01/2026 (b)(f) | | EUR | 629,000 | | 659,136 | |
| | | | 796,442 | |
Commercial Services & Supplies - 2.5% | | | | | |
Multi-Color Corp | | | | | |
6.750%, 07/15/2026 (f) | | 273,000 | | 283,374 | |
10.500%, 07/15/2027 (f) | | 751,000 | | 748,972 | |
Vivint, Inc. | | | | | |
7.875%, 12/01/2022 | | 541,000 | | 520,258 | |
7.625%, 09/01/2023 | | 1,015,000 | | 799,110 | |
| | | | 2,351,714 | |
Communications Equipment - 0.1% | | | | | |
Genesys Telecommunications Laboratories, Inc. | | | | | |
10.000%, 11/30/2024 (f) | | 97,000 | | 102,597 | |
Construction & Engineering - 2.3% | | | | | |
Maxim Crane Works LP / Maxim Finance Corp. | | | | | |
10.125%, 08/01/2024 (f) | | 2,296,000 | | 2,177,068 | |
Construction Materials - 0.4% | | | | | |
Cemex Materials LLC | | | | | |
7.700%, 07/21/2025 (f) | | 363,000 | | 331,238 | |
Containers & Packaging - 0.2% | | | | | |
Plastipak Holdings, Inc. | | | | | |
6.250%, 10/15/2025 (f) | | 207,000 | | 186,103 | |
Diversified Consumer Services - 0.3% | | | | | |
Expedia Group, Inc. | | | | | |
7.000%, 05/01/2025 (f) | | 254,000 | | 258,992 | |
Diversified Telecommunication Services - 2.0% | | | | | |
Zayo Group LLC | | | | | |
6.125%, 03/01/2028 (f) | | 1,972,000 | | 1,867,918 | |
Electronic Equipment, Instruments & Components - 4.0% | | | | | |
CommScope, Inc. | | | | | |
5.500%, 06/15/2024 (f) | | 558,000 | | 503,110 | |
6.000%, 06/15/2025 (f) | | 706,000 | | 632,682 | |
8.250%, 03/01/2027 (f) | | 2,727,000 | | 2,630,601 | |
| | | | 3,766,393 | |
Energy Equipment & Services - 0.4% | | | | | |
Transocean Inc. | | | | | |
7.250%, 11/01/2025 (f) | | 910,000 | | 366,275 | |
| | | | | | | |
See accompanying notes to financial statements.
13
Health Care Equipment & Supplies - 1.1% | | | | | |
Ortho-Clinical Diagnostics Inc. / Ortho-Clinical Diagnostics SA | | | | | |
7.250%, 02/01/2028 (f) | | 1,120,000 | | $ | 1,012,200 | |
Health Care Providers & Services - 2.1% | | | | | |
CHS/Community Health Systems, Inc. | | | | | |
8.000%, 03/15/2026 (f) | | 188,000 | | 181,097 | |
LifePoint Hospitals, Inc. | | | | | |
6.750%, 04/15/2025 (f) | | 631,000 | | 651,760 | |
9.750%, 12/01/2026 (f) | | 316,000 | | 340,111 | |
Quorum Health Corp. | | | | | |
0.000%, 04/15/2023 (h) | | 212,000 | | 37,068 | |
Radiology Partners Inc. | | | | | |
9.250%, 02/01/2028 (f) | | 708,000 | | 678,795 | |
Team Health, Inc. | | | | | |
6.375%, 02/01/2025 (f) | | 210,000 | | 116,991 | |
| | | | 2,005,822 | |
Health Care Technology - 0.4% | | | | | |
Verscend Holding Corp. | | | | | |
9.750%, 08/15/2026 (f) | | 386,000 | | 404,837 | |
Hotels, Restaurants & Leisure - 12.8% | | | | | |
Boyd Gaming Corp. | | | | | |
6.000%, 08/15/2026 | | 808,000 | | 736,977 | |
Cedar Fair LP | | | | | |
5.375%, 06/01/2024 | | 198,000 | | 186,575 | |
5.500%, 05/01/2025 (f) | | 362,000 | | 364,715 | |
5.250%, 07/15/2029 (f) | | 1,156,000 | | 999,535 | |
ClubCorp Club Operations, Inc. | | | | | |
8.500%, 09/15/2025 (f) | | 1,144,000 | | 711,911 | |
Diamond Resorts International, Inc. | | | | | |
7.750%, 09/01/2023 (f) | | 1,330,000 | | 1,079,681 | |
10.750%, 09/01/2024 (f) | | 541,000 | | 348,296 | |
Enterprise Development Authority | | | | | |
12.000%, 07/15/2024 (f) | | 665,000 | | 605,017 | |
Hilton Worldwide Finance LLC /Hilton Worldwide | | | | | |
5.375%, 05/01/2025 (f) | | 56,000 | | 56,420 | |
Marriott International Inc/MD | | | | | |
5.750%, 05/01/2025 | | 1,343,000 | | 1,404,301 | |
Merlin Entertainments PLC | | | | | |
7.000%, 05/15/2025 (b)(f) | | EUR | 783,000 | | 860,199 | |
5.750%, 06/15/2026 (b)(f) | | 690,000 | | 656,949 | |
6.625%, 11/15/2027 (b)(f) | | 1,267,000 | | 1,019,934 | |
| | | | | | | |
See accompanying notes to financial statements.
14
Six Flags Entertainment Corp. | | | | | |
4.875%, 07/31/2024 (f) | | 86,000 | | $ | 76,144 | |
7.000%, 07/01/2025 (f) | | 395,000 | | 410,721 | |
Station Casinos LLC | | | | | |
5.000%, 10/01/2025 (f) | | 1,201,000 | | 1,008,780 | |
4.500%, 02/15/2028 (f) | | 1,246,000 | | 1,004,587 | |
VAIL RESORTS, Inc. | | | | | |
6.250%, 05/15/2025 (f) | | 269,000 | | 279,088 | |
Wynn Las Vegas LLC / Wynn Las Vegas Capital Corp. | | | | | |
7.750%, 04/15/2025 (f) | | 175,000 | | 178,959 | |
| | | | 11,988,789 | |
Insurance - 2.3% | | | | | |
Alliant Holdings I, Inc. | | | | | |
6.750%, 10/15/2027 (f) | | 156,000 | | 156,351 | |
Hub International Ltd. | | | | | |
7.000%, 05/01/2026 (f) | | 2,019,000 | | 2,004,361 | |
| | | | 2,160,712 | |
IT Services - 0.1% | | | | | |
Dun & Bradstreet Corp. | | | | | |
10.250%, 02/15/2027 (f) | | 94,000 | | 102,662 | |
Machinery - 0.2% | | | | | |
Cleaver-Brooks, Inc. | | | | | |
7.875%, 03/01/2023 (f) | | 235,000 | | 195,003 | |
Media - 0.1% | | | | | |
Intelsat Jackson Holdings SA | | | | | |
5.500%, 08/01/2023 (b) | | 207,000 | | 113,503 | |
Metals & Mining - 0.0% | | | | | |
Foresight Energy, LLC | | | | | |
0.000%, 04/01/2023 (c)(d)(f)(h) | | 401,000 | | 2,005 | |
Multiline Retail - 0.0% | | | | | |
JC Penney Corp, Inc. | | | | | |
8.625%, 03/15/2025 (c)(d)(f) | | 98,000 | | 8,820 | |
Oil, Gas & Consumable Fuels - 6.6% | | | | | |
Global Partners LP / GLP Finance Corp | | | | | |
7.000%, 08/01/2027 | | 86,000 | | 69,823 | |
Indigo Natural Resources, LLC | | | | | |
6.875%, 02/15/2026 (f) | | 406,000 | | 380,138 | |
Parsley Energy, Inc. | | | | | |
5.375%, 01/15/2025 (f) | | 1,084,000 | | 979,611 | |
5.625%, 10/15/2027 (f) | | 166,000 | | 142,702 | |
PBF Holding Co. LLC / PBF Finance Corp. | | | | | |
6.000%, 02/15/2028 (f) | | 110,000 | | 78,997 | |
| | | | | | |
See accompanying notes to financial statements.
15
Rockies Express Pipeline LLC | | | | | |
3.600%, 05/15/2025 (f) | | 371,000 | | $ | 336,683 | |
4.800%, 05/15/2030 (f) | | 31,000 | | 26,660 | |
Sunoco LP | | | | | |
4.875%, 01/15/2023 | | 33,000 | | 32,333 | |
5.500%, 02/15/2026 | | 1,344,000 | | 1,306,503 | |
6.000%, 04/15/2027 | | 234,000 | | 229,508 | |
Tallgrass Energy Partners LP / Tallgrass Energy Finance Corp | | | | | |
6.000%, 03/01/2027 (f) | | 211,000 | | 141,634 | |
4.750%, 10/01/2023 (f) | | 1,559,000 | | 1,210,173 | |
Viper Energy Partners LP | | | | | |
5.375%, 11/01/2027 (f) | | 1,081,000 | | 972,521 | |
WPX Energy, Inc. | | | | | |
5.250%, 10/15/2027 | | 275,000 | | 240,529 | |
| | | | 6,147,815 | |
Pharmaceuticals - 0.1% | | | | | |
Teva Pharmaceutical Industries Ltd | | | | | |
2.200%, 07/21/2021 (b) | | 98,000 | | 95,873 | |
2.800%, 07/21/2023 (b) | | 48,000 | | 44,350 | |
| | | | 140,223 | |
Road & Rail - 0.7% | | | | | |
The Kenan Advantage Group, Inc. | | | | | |
7.875%, 07/31/2023 (f) | | 724,000 | | 610,955 | |
Software - 1.8% | | | | | |
Solera Holdings, Inc. | | | | | |
10.500%, 03/01/2024 (f) | | 1,708,000 | | 1,708,341 | |
Textiles, Apparel & Luxury Goods - 0.7% | | | | | |
Lycra | | | | | |
5.375%, 05/01/2023 (b)(f) | | EUR | 736,000 | | 443,602 | |
7.500%, 05/01/2025 (b)(f) | | 335,000 | | 187,600 | |
| | | | 631,202 | |
Trading Companies and Distributors - 0.6% | | | | | |
Neon Holdings, Inc. | | | | | |
10.125%, 04/01/2026 (f) | | 555,000 | | 502,802 | |
TruckPro LLC | | | | | |
11.000%, 10/15/2024 (f) | | 58,000 | | 56,115 | |
| | | | 558,917 | |
TOTAL HIGH YIELD SECURITIES (amortized cost $46,753,657) | | | | 44,595,305 | |
| | | | | | | |
See accompanying notes to financial statements.
16
Collateralized Loan Obligations - 1.0% | | | | | |
Diversified Financial Services - 1.0% | | | | | |
TICP CLO Ltd. | | | | | |
6.735% (3 Month LIBOR USD + 5.600%), 01/20/2031 (a)(e)(f) | | 738,460 | | $ | 503,779 | |
TRESTLES CLO, LLC | | | | | |
7.671% (3 Month LIBOR USD + 6.680%), 07/25/2029 (a)(e)(f) | | 693,640 | | 475,830 | |
| | | | 979,609 | |
TOTAL COLLATERALIZED LOAN OBLIGATIONS (amortized cost $1,205,750) | | | | 979,609 | |
| | | | | | |
| | Shares | | | |
Common Stocks - 0.6% | | | | | |
Hotels, Restaurants & Leisure - 0.6% | | | | | |
Six Flags Entertainment Corp. | | 19,721 | | 394,617 | |
VICI Properties, Inc. | | 10,112 | | 176,151 | |
| | | | 570,768 | |
TOTAL COMMON STOCKS (cost $642,794) | | | | 570,768 | |
| | | | | |
TOTAL INVESTMENTS (cost $91,369,186) - 89.8% | | | | 84,277,720 | |
OTHER ASSETS IN EXCESS OF LIABILITIES, NET - 10.2% | | | | 9,572,700 | |
NET ASSETS - 100.0% | | | | $ | 93,850,420 | |
| | | | | | |
† | In U.S. Dollars unless otherwise indicated. |
EUR | Euro |
TL | Term Loan |
(a) | Variable rate security, the coupon rate shown is the effective rate as of April 30, 2020. |
(b) | Non-U.S. security. |
(c) | Security considered restricted due to the Adviser’s knowledge of material non-public information. The total value of these securities as of April 30, 2020 was $1,351,795 and represented 1.4% of net assets. |
(d) | Security considered illiquid, as defined by the Securities and Exchange Commission. The total value of these securities as of April 30, 2020 was $1,351,795 and represented 1.4% of net assets. |
(e) | Value determined using significant unobservable inputs. |
(f) | Securities exempt from registration pursuant to Rule 144A under the Securities Act of 1933, as amended. These securities may only be resold to qualified institutional buyers in transactions exempt from registration. The total value of these securities as of April 30, 2020 was $38,289,427, which represent 40.8% of net assets. |
(g) | Represents a payment-in-kind (“PIK”) security which may pay interest/dividend in additional par/shares. (h) Non-income producing security. |
See accompanying notes to financial statements.
17
The following table represents the Fund’s investments categorized by country of risk as of April 30, 2020:
Country: | | % of Net Assets | |
United States | | 83.1 | % |
United Kingdom | | 2.8 | % |
Netherlands | | 2.1 | % |
France | | 1.1 | % |
Luxembourg | | 0.5 | % |
Israel | | 0.1 | % |
Sweden | | 0.1 | % |
| | 89.8 | % |
Liabilities Exceeding Other Assets, Net | | 10.2 | % |
| | 100.0 | % |
See accompanying notes to financial statements.
18
Statement of Assets and Liabilities
As of April 30, 2020 (Unaudited)
Assets | | | |
Investments, at value (amortized cost $91,369,186) | | $ | 84,277,720 | |
Cash and cash equivalents | | 13,158,511 | |
Receivable for investments sold | | 19,944,623 | |
Dividends and interest receivable | | 901,657 | |
Due from Adviser | | 394,044 | |
Prepaid expenses | | 24,049 | |
Deferred offering costs | | 698,325 | |
Total assets | | 119,398,929 | |
| | | |
Liabilities | | | |
Payable for investments purchased | | 23,808,274 | |
Distribution Payable | | 729,968 | |
Investment advisory fees | | 48,993 | |
Trustees’ fees | | 20,328 | |
Other accrued expenses | | 940,946 | |
Total liabilities | | 25,548,509 | |
Net assets | | $ | 93,850,420 | |
| | | |
Net Assets | | | |
Paid-in capital — (unlimited shares authorized — $0.001 par value) | | $ | 100,000,000 | |
Accumulated deficit | | (6,149,580 | ) |
Net assets | | $ | 93,850,420 | |
Net asset value, price per share (4,000,000 shares) | | $ | 23.46 | |
See accompanying notes to financial statements.
19
Statement of Operations
For the Period Ended April 30, 2020 (Unaudited)
Investment income | | | |
Interest income | | $ | 838,387 | |
Dividend income | | 3,008 | |
Other income | | 49,740 | |
Total investment income | | 891,135 | |
Expenses | | | |
Investment advisory fees | | 95,162 | |
Organizational Costs | | 429,663 | |
Offering Costs | | 109,663 | |
Legal fees | | 76,230 | |
Administration fees | | 36,826 | |
Trustees’ fees | | 20,328 | |
Audit and tax fees | | 12,602 | |
Shareholder reporting expense | | 11,011 | |
Custodian fees | | 10,841 | |
Other expenses | | 60,601 | |
Total expenses prior to expense reimbursement | | 862,927 | |
Exepnse reimbursement | | (701,760 | ) |
Net expenses | | 161,167 | |
| | | |
Net investment income | | 729,968 | |
| | | |
Realized and unrealized gain (loss) | | | |
Net realized gain (loss) on | | | |
Investments | | 972,726 | |
Foreign currency transactions | | (7,588 | ) |
Net realized loss | | 965,138 | |
Net change in unrealized appreciation (depreciation) on | | | |
Investments | | (7,110,450 | ) |
Foreign currency translation | | (4,268 | ) |
Net change in unrealized depreciation | | (7,114,718 | ) |
Net realized and unrealized loss | | (6,149,580 | ) |
Net decrease in net assets resulting from operations | | $ | (5,419,612 | ) |
See accompanying notes to financial statements.
20
Statements of Changes in Net Assets
| | Period Ended | |
| | April 30, 2020(1) | |
Increase (decrease) in net assets resulting from operations | | | |
Net investment income | | $ | 729,968 | |
Net realized gain | | 965,138 | |
Net change in unrealized depreciation | | (7,114,718 | ) |
Net decrease in nets assets resulting from operations | | (5,419,612 | ) |
| | | |
Distributions to shareholders from | | | |
Net dividend and distributions | | (729,968 | ) |
Total distributions | | (729,968 | ) |
Shareholder transactions | | | |
Subscriptions (4,000,000 shares) | | 100,000,000 | |
Net increase in net assets | | 93,850,420 | |
Net assets | | | |
Beginning of period(1) | | — | |
End of period | | $ | 93,850,420 | |
(1) The Fund commenced operations on February 28, 2020.
See accompanying notes to financial statements.
21
Statement of Cash Flows
| | For the Period Ended | |
| | April 30, 2020 (1) | |
Cash Flows from Operating Activities | | | |
Net decrease in net assets resulting from operations | | $ | (5,419,612 | ) |
Adjustments to reconcile net increase in net assets resulting from operations to net cash provided in operating activities: | | | |
Purchases of investments | | (71,919,546 | ) |
Proceeds from sales of investments | | 31,633,382 | |
Net amortization (accretion) of premiums (discounts) | | (114,012 | ) |
Net change in unrealized depreciation on investments | | 7,110,450 | |
Net change in unrealized depreciation on foreign currency translation | | 4,268 | |
Net realized gain on investments | | | |
Net realized gain on foreign currency | | 3,716 | |
Changes in assets and liabilities: | | | |
Increase in receivable for investments sold | | (19,929,023 | ) |
Increase in deferred offering costs | | (698,325 | ) |
Increase in dividends and interest receivable | | (901,775 | ) |
Increase in expense reimbursement receivable | | (394,044 | ) |
Increase in prepaid expenses | | (24,049 | ) |
Increase in payable for investments purchased | | 23,769,682 | |
Increase in investment advisory fees payable | | 48,993 | |
Increase in Trustees’ fees payable | | 20,328 | |
Increase in other accrued expenses | | 940,946 | |
Net cash used in operating activities | | (36,841,347 | ) |
Cash Flows from Financing Activities | | | |
Subscriptions | | 50,000,000 | |
Net cash provided by financing activities | | 50,000,000 | |
| | | |
Effect of exchange rate changes on cash | | (142 | ) |
Net increase in cash and cash equivalents | | 13,158,511 | |
| | | |
Cash and Cash Equivalents | | | |
Beginning Balance | | — | |
Ending Balance | | $ | 13,158,511 | |
| | | |
Supplemental disclosure of cash flow information and non-cash financing activities: | | | |
Shares issued in exchange for purchase of investments | | $ | 50,000,000 | |
Distributions payable | | $ | 729,968 | |
(1) The Fund commenced operations on February 28, 2020.
See accompanying notes to financial statements.
22
Financial Highlights
| | Period Ended | |
| | April 30, 2020 | |
Per share operating performance | | | |
Net asset value, beginning of period | | $ | 25.00 | |
Income from operations | | | |
Net investment income(1) | | 0.18 | |
Net realized and unrealized gain on investments, forward foreign currency contracts, foreign currency transactions and deferred Trustees’ fees | | (1.54 | ) |
Total income from operations | | (1.36 | ) |
Dividends from | | | |
Net investment income | | (0.18 | ) |
Total dividends | | (0.18 | ) |
Net Asset Value, end of period | | $ | 23.46 | |
Total return† | | (5.42 | )% |
| | | |
Ratios to average net assets** | | | |
Expenses, before waiver | | 5.90 | % |
Expenses, after waiver | | 1.10 | % |
Net investment income, before waiver | | 0.19 | % |
Net investment income, after waiver | | 4.99 | % |
| | | |
Supplemental data | | | |
Net assets, end of period (000’s) | | $ | 93,850 | |
Portfolio turnover rate† | | 43.24 | % |
(1) Per share calculations were performed using average shares.
† Total return and Portfolio turnover rate are for the period indicated and have not been annualized.
** Annualized.
See accompanying notes to financial statements.
23
Notes to Financial Statements
1. Organization
KKR Credit Opportunities Portfolio (the “Fund”) was formed on September 5, 2019 as a statutory trust under the laws of the state of Delaware. The Fund is a closed-end registered management investment company that will continuously offer its shares and intends to operate as an “interval fund.” The Fund seeks to provide attractive risk -adjusted returns and generate current income. The Fund is diversified for purposes of the Investment Company Act of 1940, as amended (the “1940 Act” ). The Fund commenced operations on February 28, 2020. KKR Credit Advisors (US) LLC serves as the Fund’s investment adviser (the “Adviser”).
As of April 30, 2020, an affiliate of the Adviser owned 100% of the outstanding shares of the Fund. The Fund issued 4,000,000 shares for an aggregate purchase price of $100,000,000, comprised of cash and a contribution of investments with a fair market value of $50,000,000.
2. Summary of Significant Accounting Policies
Basis of Presentation — The accompanying financial statements are presented in accordance with accounting principles generally accepted in the United States of America (“GAAP”) and are stated in United States (“U.S.”) dollars. The Fund is an investment company following accounting and reporting guidance in Financial Accounting Standards Board (“FASB”) Accounting Standards Codification (“ASC”) Topic 946, Financial Services — Investment Companies (“ASC Topic 946”). The preparation of financial statements in conformity with GAAP requires management to make estimates and assumptions that affect the reported amounts and disclosures in these financial statements. Actual results could differ from those estimates.
COVID-19 and Global Economic and Market Conditions - Following the global outbreak of COVID-19, global financial markets have experienced considerable volatility, and economic and financial market conditions have significantly deteriorated including significant declines in global equity markets. The valuations of the investments referenced in the financial statements take into account these conditions and events.
Valuation of Investments — The Board of Trustees (the “Board”) of the Fund has adopted valuation policies and procedures to ensure investments are valued in a manner consistent with GAAP as required by the 1940 Act. The Board has delegated primary responsibility in ensuring these valuation policies and procedures are followed, including those relating to fair valuation, to the Adviser.
Fair value is the price that would be received to sell an asset or paid to transfer a liability in an orderly transaction between market participants at the measurement date. Where available, fair value is based on observable market prices or parameters, or derived from such prices or parameters. Where observable prices or inputs are not available, valuation models are applied. These valuation techniques involve some level of management estimation and judgment, the degree of which is dependent on the price transparency for the instruments or market and the instruments ‘ complexity for disclosure purposes.
Assets and liabilities recorded at fair value on the Statement of Assets and Liabilities are categorized based upon the level of judgment associated with the inputs used to measure their value. Hierarchical levels, as defined under GAAP, are directly related to the amount of subjectivity associated with the inputs to fair valuations of these assets and liabilities, and are as follows:
Level 1 — Inputs are unadjusted, quoted prices in active markets for identical assets or liabilities at the measurement date.
The types of assets generally included in this category are common stocks listed in active markets.
24
Level 2 — Inputs other than quoted prices included in Level 1 that are observable for the asset or liability, either directly or indirectly . Level 2 inputs include quoted prices for similar instruments in active markets, and inputs other than quoted prices that are observable for the asset or liability.
The types of assets and liabilities generally included in this category are high yield securities and certain leveraged loans.
Level 3 — Inputs are unobservable for the asset or liability, and include situations where there is little, if any, market activity for the asset or liability.
The types of assets generally included in this category are certain leveraged loans, common stocks not actively traded and preferred stocks not actively traded.
A significant decrease in the volume and level of activity for the asset or liability is an indication that transactions or quoted prices may not be representative of fair value because in such market conditions there may be increased instances of transactions that are not orderly. In those circumstances, further analysis of transactions or quoted prices is needed, and a significant adjustment to the transactions or quoted prices may be necessary to estimate fair value.
The availability of observable inputs can vary depending on the financial asset or liability and is affected by a wide variety of factors, including, for example, the type of product, whether the product is new, whether the product is traded on an active exchange or in the secondary market, and the current market condition. To the extent that valuation is based on models or inputs that are less observable or unobservable in the market, the determination of fair value requires more judgment. Accordingly, the degree of judgment exercised by the Fund in determining fair value is greatest for instruments categorized in Level 3. In certain cases, the inputs used to measure fair value may fall into different levels of the fair value hierarchy. In such cases, for disclosure purposes , the level in the fair value hierarchy within which the fair value measurement in its entirety falls is determined based on the lowest level input that is significant to the fair value measurement in its entirety. The Fund’s assessment of the significance of a particular input to the fair value measurement in its entirety requires judgment and consideration of factors specific to the asset. The variability of the observable inputs affected by the factors described above may cause transfers between Levels 1, 2 and/or 3, which the Fund recognizes at the beginning of the period the inputs change.
Many financial assets and liabilities have bid and ask prices that can be observed in the marketplace. Bid prices reflect the highest price that the Fund and others are willing to pay for an asset. Ask prices represent the lowest price that the Fund and others are willing to accept for an asset. For financial assets and liabilities whose inputs are based on bid-ask prices, the Fund does not require that fair value always be a predetermined point in the bid-ask range. The Fund’s policy is to allow for mid-market pricing and adjust to the point within the bid-ask range that meets the Fund’s best estimate of fair value.
Depending on the relative liquidity in the markets for certain assets, the Fund may transfer assets to Level 3 if it determines that observable quoted prices, obtained directly or indirectly, are not available.
Valuation Process
The Adviser utilizes a valuation committee (“Valuation Committee”), whose members consist of the Head of Credit-US, Head of Credit-Europe, General Counsel, Chief Financial Officer and certain other employees of the Adviser. The Valuation Committee is responsible for approving pricing sources and procedures and for oversight of the Adviser’s pricing practices, including determining the valuation of investments in circumstances where no external pricing data for an investment is available.
Investments are generally valued based on quotations from third party pricing services, unless such a quotation is unavailable or is determined to be unreliable or inadequately representing the fair value of the particular assets. In that case, valuations are based on either valuation data obtained from one or more other third party pricing sources, including broker dealers selected by the Adviser , or will reflect the Valuation Committee’s good faith determination of fair value based on other factors considered relevant. The valuation process involved in Level 3 measurements for assets and liabilities is completed daily based on the methodology an d assumptions that are used in estimating the value of the investment that are approved by the Valuation Committee on at least a monthly basis and is designed to subject the valuation of Level 3 investments to an appropriate level of consistency, oversight, and review.
25
For assets classified as Level 3, the investment professionals of the Adviser are responsible for preliminary valuations based on various factors including their evaluation of financial and operating data, company specific developments, market valuations of comparable companies and model projections discussed above. All valuations are approved by the Valuation Committee.
For the period ended April 30, 2020, there have been no significant changes to the Fund’s fair value methodologies.
Investment Transactions — Investment transactions are accounted for on the trade date, the date the order to buy or sell is executed. Amortization and accretion is calculated using the effective interest method over the holding period of the investment. Realized gains and losses are calculated on the specific identified cost basis.
Cash and Cash Equivalents — Cash and cash equivalents includes cash on hand, cash held in banks and highly liquid investments with original maturities of three or fewer months. Cash equivalents consist solely of money market funds with financial institutions . As of April 30, 2020, the Fund was invested in the U.S. Bank Money Market Deposit Account.
Foreign Currency Transactions — The books and records of the Fund are maintained in U.S. Dollars. All investments denominated in foreign currency are converted to the U.S. dollar using prevailing exchange rates at the end of the reporting period. Income , expenses, gains and losses on investments denominated in foreign currency are converted to the U.S. dollar using the prevailing exchange rates on the dates when the transactions occurred.
The Fund bifurcates that portion of the results of operations resulting from changes in foreign exchange rates on investments and interest from the fluctuations arising from changes in market prices of securities held.
Distributions to Shareholders — Distributions are accrued and declared daily and paid monthly and distributable net realized capital gains, if any, are declared and distributed at least annually.
Term Loan Income — Term Loan Income consists of transaction fees including, but not limited to, delayed compensation, assignment, transfer, administration and amendment fees. Fee and other income is recorded when earned, and is recognized in Other income on the Statement of Operations.
Income Taxes — The Fund has elected to be treated and has qualified, and intends to continue to qualify in each taxable year, as a “regulated investment company” under Subchapter M of the Internal Revenue Code of 1986, as amended, and in conformity with the Regulated Investment Company Modernization Act of 2010. The Fund will not be subject to federal income tax to the extent the Fund satisfies the requirements under Section 851 of the Internal Revenue Code, including distributing all of its gross investment company taxable income and capital gains to its shareholders based on the Fund’s fiscal year end of October 31.
To avoid imposition of a 4% excise tax on undistributed income applicable to regulated investment companies, the Fund intends to declare each year as dividends in each calendar year at least 98.0% of its net investment income (earned during the calendar year) and 98.2% of its net realized capital gains (earned during the twelve months ended October 31) plus undistributed amounts, if any, from prior years.
The Fund evaluates tax positions taken or expected to be taken in the course of preparing the Fund’s tax returns to determine whether it is “more-likely than-not” (i.e., greater than 50-percent) that each tax position will be sustained upon examination by a taxing authority based on the technical merits of the position. Tax positions not deemed to meet the more-likely-than-not threshold are recorded as a tax benefit or expense in the current year. Management has analyzed the Fund’s tax positions and has concluded that no liability for unrecognized tax benefits should be recorded related to uncertain tax positions for the open tax years (2020). However, management ‘s conclusions regarding tax positions taken may be subject to review and adjustment at a later date based on factors including, but not limited to, examination by tax authorities, on-going analysis of and changes to tax laws, regulations and interpretations thereof.
As of April 30, 2020, the Fund did not have a liability for any unrecognized tax benefits. The Fund recognizes interest and penalties, if any, related to unrecognized tax benefits as income tax expense in the Statement of Operations.
26
Repurchase Offers — The Fund operates as an interval fund pursuant to Rule 23c-3 under the 1940 Act and, as such, has adopted a fundamental policy to make quarterly repurchase offers, at NAV, of no less than 10% and no more than 25% of the Fund’s shares outstanding on the Repurchase Request Deadline (as defined below). There is no guarantee that shareholders will be able to sell all of the shares they desire to sell in a quarterly repurchase offer, although each shareholder will have the right to require the Fund to purchase at least 10% of such shareholder’s shares in each quarterly repurchase. Liquidity will be provided to shareholders only through the Fund’s quarterly repurchases. Shareholders will be notified in writing of each quarterly repurchase offer and the date the repurchase offer ends (the “Repurchase Request Deadline”).
3. Risk Considerations
The Fund invests mainly in leveraged loans, high yield securities, common stocks not actively traded and preferred stocks. These investments may involve certain risks, including, but not limited to, those described below:
Market Discount Risk — The price of the Fund’s common shares of beneficial interest will fluctuate with market conditions and other factors. Shares of closed-end management investment companies frequently trade at a discount from their net asset value, which may increase the risk of loss.
Leverage Risk — Leverage is a speculative technique that may expose the Fund to greater risk and increased costs. When leverage is used, the net asset value and market price of the Fund’s shares and the Fund’s investment return will likely be more volatile.
Market Risk — Bond markets rise and fall daily. As with any investment with performance tied to these markets, the value of an investment in the Fund will fluctuate, which means that shareholders could lose money.
Interest Rate Risk — Interest rates will rise and fall over time. During periods when interest rates are low, the Fund’s yield and total return also may be low. Changes in interest rates also may affect the Fund’s share price and a sharp rise in interest rates could cause the Fund’s share price to fall. The longer the Fund’s duration, the more sensitive to interest rate movements its share price is likely to be.
Credit Risk — The Fund is subject to the risk that a decline in the credit quality of an investment could cause the Fund to lose money or underperform. The Fund could lose money if the issuer or guarantor of an investment fails to make timely principal or interest payments or otherwise honor its obligations. The Fund will be subject to credit risk with respect to the counterparties of derivative contracts (whether a clearing corporation in the case of exchange -traded instruments or another third party in the case of over-the-counter instruments) and other instruments entered into directly by the Fund.
Liquidity Risk — A particular investment may be difficult to purchase or sell. The Fund may be unable to sell illiquid securities at an advantageous time or price.
Prepayment and Extension Risk — The Fund’s investments are subject to the risk that the investments may be paid off earlier or later than expected. Either situation could cause the Fund to hold investments paying lower than market rates of interest , which could hurt the Fund’s yield or share price.
High Yield Risk — High yield securities and unrated securities of similar credit quality (sometimes called junk bonds) that the Fund may invest in are subject to greater levels of credit and liquidity risks. High yield securities are considered primarily speculative with respect to the issuer’s continuing ability to make principal and interest payments.
Foreign Investment Risk — The Fund’s investments in securities of foreign issuers may involve certain risks that are greater than those associated with investments in securities of U.S. issuers. These include risks of adverse changes in foreign economic , political, regulatory and other conditions; changes in currency exchange rates (the currencies will decline in value relative to the U.S . dollar or, in the case of hedging positions, the U.S. dollar will decline in value relative to the currency being hedged) or exchange control regulations (including limitations on currency movements and exchanges); differing accounting, auditing, financial reporting and legal standards and practices; differing securities market structures; and higher transaction costs. These risks may be heightened in connection with investments in emerging markets.
27
Issuer Risk — The value of securities may decline for a number of reasons that directly relate to the issuer, such as its financial strength, management performance, financial leverage and reduced demand for the issuer’s goods and services, as well as the historical and prospective earnings of the issuer and the value of its assets.
4. Agreements
Investment Advisory Agreement — The Adviser provides day-to-day portfolio management services to the Fund and has discretion to purchase and sell investments in accordance with the Fund’s objectives, policies, and restrictions. For the services it provides to the Fund, the Adviser receives an annual fee, payable monthly by the Fund, in an amount equal to 1.30% of the Fund’s average daily Managed Assets (the “Investment Advisory Fee”). “ The Adviser has voluntarily agreed to temporarily reduce its Investment Advisory Fee to an annual rate of 0.65% of the Fund’s average daily Managed Assets from March 1, 2020, until December 31, 2020. Effective July 1, 2020, the Adviser’s agreement to temporarily reduce its Investment Advisory Fee will terminate and the Adviser w ill receive an Investment Advisory Fee at an annual rate of 1.30% of the Fund’s average daily Managed Assets. The foregoing fee schedule may be extended, terminated or modified by the Adviser in its sole discretion and at any time, including prior to any such date listed above. “Managed Assets” means the total assets of the Fund (including any assets attributable to borrowings for investment purposes) minus the sum of the Fund’s accrued liabilities (other than liabilities representing borrowings for investment purposes).
During periods when the Fund is using leverage, the Investment Advisory Fee paid to the Adviser will be higher than if the Fund did not use leverage because the Investment Advisory Fee paid is calculated based on the Fund’s Managed Assets, which includes the assets purchased through leverage.
During the period ended April 30, 2020 the Adviser earned an Investment Advisory Fee of $95,162.
Pursuant to an Expense Limitation and Reimbursement Agreement, through December 31, 2022, the Adviser has agreed to waive its fees and/or reimburse expenses of the Fund so that certain of the Fund’s expenses (“Specified Expenses”) will not exceed 0.40% of net assets (annualized). The Fund has agreed to repay these amounts, when and if requested by the Adviser, but only if and to the extent that Specified Expenses are less than 0.40% of net assets (annualized) (or, if a lower expense limit is then in effect, such lower limit) within the 36-month period after the Adviser bears the expense. This arrangement cannot be terminated prior to without the Board’s consent. “Specified Expenses” is defined to include all expenses incurred in the business of the Fund, including organizational costs, with the exception of (i) the Management Fee, (ii) the Shareholder Servicing Fee, (iii) the Distribution Fee, (iv) brokerage costs, (v) dividend/interest payments (including any dividend payments, interest expenses, commitment fees, or other expenses related to any leverage incurred by the Fund), (vi) taxes, and (vii) extraordinary expenses (as determined in the sole discretion of the Adviser).
The Expense Limitation Agreement terminates at the end of the Limitation Period, but may be renewed by the mutual agreement of the Adviser and the Fund for successive terms.
As of April 30, 2020, the amount of Expense Limitation Payments provided by the Adviser is $701,760. The Fund’s management believes that Reimbursement Payments are not probable as of April 30, 2020.
Administrator, Custodian and Transfer Agent — U.S. Bancorp Fund Services, LLC (“Fund Services” or “Administrator”), doing business as U.S. Bank Global Fund Services, serves as the Fund’s Administrator pursuant to an administration agreement under which the Administrator provides administrative and accounting services.
U.S. Bank N.A. (the “Custodian”) serves as the Fund’s custodian pursuant to a custody agreement. The Custodian is an affiliate of Fund Services.
28
Fund Services serves as the Fund’s transfer agent pursuant to a transfer agency agreement.
Deferred Trustees’ Compensation — The Fund has a Deferred Trustees’ Compensation plan (the “Plan”) that allows the Independent Trustees to defer compensation to a future payment period. The compensation is invested in shares of the Fund. The value of a participating Independent Trustee’s deferral account is based on the shares of deferred amounts as designated by the participating Independent Trustees. Changes in the value of the Independent Trustees’ deferral account are included in the Statement of Operations. The accrued obligations under the Plan, including unrealized appreciation (depreciation), are included on the Statement of Assets and Liabilities.
Other — Certain officers of the Fund are also officers of the Adviser. Such officers are paid no fees by the Fund for serving as officers of the Fund.
5. Fair Value
The following table presents information about the Fund’s assets measured on a recurring basis as of April 30, 2020, and indicates the fair value hierarchy of the inputs utilized by the Fund to determine such fair value:
Investments in securities | | Level 1 | | Level 2 | | Level 3 | | Total | |
Leveraged loans | | $ | — | | $ | 38,039,080 | | $ | 92,958 | | $ | 38,132,038 | |
High yield securities | | — | | 44,595,305 | | — | | 44,595,305 | |
Collateralized loan obligations | | — | | — | | 979,609 | | 979,609 | |
Common stocks | | 570,768 | | — | | — | | 570,768 | |
Cash equivalents | | 11,963,134 | | — | | — | | 11,963,134 | |
Total investments in securities and cash equivalents | | $ | 12,533,902 | | $ | 82,634,385 | | $ | 1,072,567 | | $ | 96,240,854 | |
The following are the details of the restricted securities held by the Fund:
| | | | Acquisition | | Amortized | | | | % of Net | |
Issuer (1) | | Par/Shares | | date(s) | | Cost | | Value | | Assets | |
| | | | 02/28/2020 - | | | | | | | |
Belk Inc. TL1L B 10/19 | | 1,214,190 | | 03/09/2020 | | 809,371 | | 503,889 | | 0.5 | % |
CSM Bakery Products TL 1L 07/13 | | 483,000 | | 02/28/20 | | 476,176 | | 407,732 | | 0.4 | % |
CSM Bakery Products TL 2L 07/13 | | 75,000 | | 02/28/20 | | 71,936 | | 57,450 | | 0.1 | % |
Electronics For Imaging, Inc. TL 1L 06/19 | | 278,303 | | 02/28/20 | | 259,171 | | 213,597 | | 0.2 | % |
Foresight Energy LP TL 1L 03/20 DIP DD | | 39,359 | | 03/11/20 | | 39,359 | | 38,665 | | 0.0 | % |
Foresight Energy LP TL 1L 03/20 DIP | | 55,268 | | 03/11/20 | | 54,057 | | 54,293 | | 0.1 | % |
Foresight Energy, LLC TL 1L B 03/17 | | 615,000 | | 02/28/20 | | 211,560 | | 65,344 | | 0.1 | % |
Foresight Energy, LLC 11.500% 4/2023 | | 401,000 | | 02/28/20 | | 15,080 | | 2,005 | | 0.0 | % |
JC Penney Corp., Inc. 8.625% 03/2025 | | 98,000 | | 02/28/20 | | 55,617 | | 8,820 | | 0.0 | % |
(1) Refer to the Schedule of Investments for more details on securities listed.
29
The following is a reconciliation of the investments in which significant unobservable inputs (Level 3) were used in determining value:
| | | | Collateralized Debt | |
| | Leveraged Loans | | Obligation | |
Balance at February 28, 2020 | | — | | — | |
Purchases | | 92,969 | | 1,199,997 | |
Sales and paydowns | | — | | — | |
Settlements | | 447 | | 5,752 | |
Net change in appreciation/(depreciation) | | (458 | ) | (226,140 | ) |
Net realized gain/(loss) | | — | | — | |
Balance as of April 30, 2020 | | 92,958 | | 979,609 | |
Net change in appreciation/(depreciation) on | | | | | |
investments held at April 30, 2020 | | (458 | ) | (226,140 | ) |
(1) The Fund’s policy is to recognize transfers into and out of Level 3 at the beginning of each period.
The following table presents additional information about valuation techniques and inputs used for investments that are measured at fair value and categorized within Level 3 as of April 30, 2020:
| | | | | | | | Range | |
Financial | | | | Valuation | | Unobservable | | (Weighted | |
Asset | | Fair Value | | Technique (1) | | Inputs (2) | | Average)(3) | |
Leveraged Loans | | $ | 92,958 | | Yield Analysis | | Yield | | 43% | |
| | | | | | EBITDA Multiple | | 3.0x | |
| | | | | | Net Leverage | | 0.6x | |
CLO Notes | | $ | 979,609 | | Yield analysis | | Discount margin | | 12% - 14% (13)% | |
| | | | Discounted cash | | | | | |
| | | | flows | | Probability of default | | 2% | |
| | | | | | Constant prepayment | | | |
| | | | | | rate | | 20% | |
(1) For the assets that have more than one valuation technique, the Fund may rely on the techniques individually or in aggregate based on a weight ascribed to each one ranging from 0-100%. When determining the weighting ascribed to each valuation methodology, the Fund considers, among other factors, the availability of direct market comparables,
(2) The significant unobservable inputs used in the fair value measurement of the Fund’s assets and liabilities may include the last twelve months (“LTM”) EBITDA multiple, weighted average cost of capital, discount margin, probability of default, loss severity and constant prepayment rate. In determining certain of these inputs, management evaluates a variety of factors including economic, industry and market trends and developments, market valuations of comparable
(3) Weighted average amounts are based on the estimated fair values.
30
6. Investment Transactions
The cost of investments purchased and the proceeds from the sale of investments, other than short -term investments, for the period ended April 30, 2020 were as follows:
Purchases | | $ | 120,048,625 | |
Sales | | $ | 30,342.8 07 | |
There were no purchases or sales of U.S. Government securities.
7. Commitments and Contingencies
The Fund may enter into certain credit agreements, of which all or a portion may be unfunded. These commitments are disclosed in the accompanying Schedule of Investments . The Fund will maintain sufficient liquidity to fund these commitments at the borrower’s discretion.
Under the Fund’s organizational documents, its officers and Trustees are indemnified against certain liabilities arising out of the performance of their duties to the Fund. In the normal course of business, the Fund enters into contracts that contain a variety of representations that provide general indemnifications. The Fund’s maximum liability exposure under these arrangements is unknown, as future claims that have not yet occurred may be made against the Fund. However, based on experience, management expects the risk of loss to be remote.
8. Federal Income Taxes
The timing and characterization of certain income, capital gains, and return of capital distributions are determined annually in accordance with federal tax regulations, which may differ from GAAP. As a result, the net investment income (loss) and net realized gain (loss) on investment transactions for a reporting period may differ significantly from distributions during such period. These book/tax differences may be temporary or permanent in nature. To the extent these differences are permanent, they are charged or credited to paid-in capital, accumulated net investment income/loss or accumulated net realized gain/loss , as appropriate, in the period in which the differences arise.
31
Approval of Investment Advisory Agreement
Background
At a meeting of the Board of KKR Credit Opportunities Portfolio (the “Fund”) held on December 13, 2019 (the “Meeting”), the members of the Board, including the Trustees who are not “interested persons” of the Fund (the “Independent Trustees”), as defined in the Investment Company Act of 1940, as amended, considered and unanimously approved the investment advisory agreement (the “Investment Advisory Agreement”) between KKR Credit Advisors (US) LLC (the “Adviser”) and the Fund.
Prior to the Meeting, the Independent Trustees received a memorandum from their independent legal counsel concerning the duties and responsibilities of board members in considering approval of the Investment Advisory Agreement. The Board had also received and considered materials it deemed reasonably necessary for its review of the Investment Advisory Agreement, including materials prepared by the Adviser comparing fee and expense information to a collection of registered closed-end funds operated as “interval funds” believed by the Adviser to have comparable investment objectives and strategies (collectively, the “Peer Funds”).
The Independent Trustees discussed with management and separately with their independent legal counsel the materials provided by management prior to the scheduled board meeting.
In its consideration of the approval of the Investment Advisory Agreement, the Board considered various factors, including the following:
Nature, Extent and Quality of Services
In considering the nature, extent and quality of services provided by the Adviser, the Board relied on their experience as Trustees of closed-end funds as well as on the materials provided at and prior to the Meeting. The Board reviewed and considered the nature and extent of the investment advisory services to be provided by the Adviser under the Investment Advisory Agreement, including portfolio management, investment research and overseeing portfolio transactions. It was further noted that the Adviser expects to coordinate and oversee the provision of services provided to the Fund by other service providers.
The Board reviewed and considered the qualifications, background and experience of the investment team and other key personnel of the Adviser who will provide advisory and non-advisory services to the Fund. The Board also considered the resources, operations and practices of the Adviser both generally and in managing the Fund’s portfolio. The Board noted the Adviser’s extensive experience in managing portfolios of loans and fixed income securities, knowledge of loan and fixed income markets, expertise in private credit transactions, and analytical and risk management capabilities. The Board determined that the nature and extent of services to be provided by the Adviser to the Fund were appropriate and that the Fund should benefit from the nature, extent and quality of these services as a result of the Adviser’s experience, personnel, operations and resources.
Performance, Fees and Expenses of the Fund
Past performance of the Fund was not a factor considered by the Board, as the Fund would be a new fund not yet publicly offered. The Board then considered the performance of other funds with comparable investment strategies and the prior experience of the portfolio management team in managing other funds and accounts.
The Board discussed with the Adviser the Fund’s proposed fees and expenses relative to the Peer Funds and other accounts advised by the Adviser. The Board noted that the Fund’s advisory fee is generally comparable to the fees charged by the Adviser or its affiliates to other clients for which it provides comparable services or uses overlapping portfolio management team members. The Board further noted the Fund’s proposed management fee was generally in line with the advisory fees charged by comparable closed-end funds that employ investment strategies similar to the Fund. Following its review, in light of the extent and quality of services that the Board believes the Fund will receive, the Board determined that the Fund’s proposed fees and expenses were reasonable.
32
Economies of Scale
The Board considered the size and growth prospects of the Fund and how it relates to the structure of the Fund’s advisory fee schedule, which does not include breakpoints. The Board considered that the Fund’s growth prospects were uncertain and concluded that it would be premature to consider economies of scale as a factor in approving the Investment Advisory Agreement at the present time.
Profitability of the Adviser and Affiliates
The Board considered the expected profitability to the Adviser of its relationship with the Fund. The Board also examined the level of profits that could be expected to accrue to the Adviser from the fees payable under the Investment Advisory Agreement.
Other Benefits of the Relationship
The Board considered other benefits to the Adviser and its affiliates derived from their relationship with the Fund. Based on information provided by and discussions with the Adviser, the Board concluded that these benefits did not appear to be material at the present time in connection with the Fund.
Resources of the Adviser and Relationship with the Fund
The Board considered the financial circumstances of the Adviser and whether the Adviser has the resources necessary to perform its obligations under the Investment Advisory Agreement. The Board also reviewed and considered the proposed relationship between the Fund and the Adviser, including the policies and procedures formulated and adopted by the Adviser for managing the Fund’s operations and the Board’s confidence in the competence and integrity of senior managers and key personnel of the Adviser. The Board concluded that the Adviser has the financial resources necessary to fulfill its obligations under the Investment Advisory Agreement and that it is beneficial for the Fund to enter into this relationship with the Adviser.
Other Factors
The Board considered the controls and procedures adopted and implemented by the Adviser and monitored by the Fund’s Chief Compliance Officer and concluded that the conduct of business by the Adviser indicates a good faith effort on its part to adhere to high ethical standards in the conduct of the Fund’s business.
General Conclusion
After considering and weighing all of the above factors, the Board concluded that the proposed advisory fee was reasonable in light of the services to be provided by the Adviser and it would be in the best interests of the Fund and its shareholders to approve the Investment Advisory Agreement for another year. In reaching this conclusion the Board did not give particular weight to any single factor referenced above. The Board considered these factors during the Meeting and separately in executive session with only the Independent Trustees and their counsel present. Individual Board members may have ascribed different weights to these factors in their individual considerations in reaching their unanimous decision to re-approve the Investment Advisory Agreement.
33
Dividend Reinvestment Plan (Unaudited)
KKR Credit Opportunities Portfolio, a Delaware statutory trust (the “Fund”), hereby adopts the following Dividend Reinvestment Plan (the “Plan”) with respect to distributions declared by its board of trustees (the “Board”) on its shares of beneficial interest (the “Shares”):
1. Participation; Agent. The Fund’s Plan is available to shareholders of record of the Shares. [U.S. Bancorp Fund Services, LLC] (“Plan Administrator”) acting as agent for each participant in the Plan, will apply income dividends or capital gains or other distributions (each, a “Distribution” and collectively, “Distributions”), net of any applicable U.S. withholding tax, that become payable to such participant on Shares (including shares held in the participant’s name and shares accumulated under the Plan), to the purchase of additional whole and fractional Shares for such participant.
2. Eligibility and Election to Participate. Participation in the Plan is limited to registered owners of Shares. The Fund’s Board reserves the right to amend or terminate the Plan. Shareholders automatically participate in the Plan, unless and until an election is made to withdraw from the Plan on behalf of such participating shareholder. If participating in the Plan, a shareholder is required to include all of the Shares owned by such shareholder in the Plan.
3. Share Purchases. When the Fund declares a Distribution, the Plan Administrator, on the shareholder’s behalf, will receive additional authorized shares from the Fund either newly issued or repurchased from shareholders by the Fund and held as treasury stock. The number of shares to be received when Distributions are reinvested will be determined by dividing the amount of the Distribution by the Fund’s net asset value per share. There will be no sales load charged on Shares issued to a shareholder under the Plan. All shares purchased under the Plan will be held in the name of each participant. In the case of shareholders, such as banks, brokers or nominees, that hold shares for others who are beneficial owners participating under the Plan, the Plan Administrator will administer the Plan on the basis of the number of shares certified from time to time by the record shareholder as representing the total amount of shares registered in the shareholder’s name and held for the account of beneficial owners participating under the Plan.
4. Timing of Purchases. The Fund expects to issue Shares pursuant to the Plan, immediately following each Distribution payment date and the Plan Administrator will make every reasonable effort to reinvest all Distributions on the day the Distribution is paid (except where necessary to comply with applicable securities laws) by the Fund. If, for any reason beyond the control of the Plan Administrator, reinvestment of the Distributions cannot be completed within 30 days after the applicable Distribution payment date, funds held by the Plan Administrator on behalf of a participant will be distributed to that participant.
5. Account Statements. The Plan Administrator will maintain all shareholder accounts and furnish written confirmations of all transactions in the accounts, including information needed by shareholders for personal and tax records. The Plan Administrator will hold shares in the account of the shareholders in non-certificated form in the name of the participant, and each shareholder’s proxy, if any, will include those shares purchased pursuant to the Plan. The Plan Administrator will confirm to each participant each acquisition made pursuant to the Plan as soon as practicable but not later than 10 business days after the date thereof. No less frequently than quarterly, the Plan Administrator will provide to each participant an account statement showing the Distribution, the number of shares purchased with the Distribution, and the year-to-date and cumulative Distributions paid.
6. Expenses. There will be no direct expenses to participants for the administration of the Plan. There is no direct service charge to participants with regard to purchases under the Plan; however, the Fund reserves the right to amend the Plan to include a service charge payable by the participants. All fees associated with the Plan will be paid by the Fund.
7. Taxation of Distributions. The reinvestment of Distributions does not relieve the participant of any taxes which may be payable on such Distributions.
8. Voting of Shares. Shares issued pursuant to the Plan will have the same voting rights as the Shares issued pursuant to the Fund’s public offering.
34
9. Absence of Liability. Neither the Fund nor the Plan Administrator shall have any responsibility or liability beyond the exercise of ordinary care for any action taken or omitted pursuant to the Plan, nor shall they have any duties, responsibilities or liabilities except such as expressly set forth herein. Neither the Fund nor the Plan Administrator shall be liable for any act done in good faith or for any good faith omission to act, including, without limitation, any claims of liability: (a) arising out of the failure to terminate a participant’s account prior to receipt of written notice of such participant’s death, or (b) with respect to prices at which shares are purchased or sold for the participant’s account and the terms on which such purchases and sales are made. NOTWITHSTANDING THE FOREGOING, LIABILITY UNDER THE U.S. FEDERAL SECURITIES LAWS CANNOT BE WAIVED.
10. Termination of Participation. A shareholder who does not wish to have Distributions automatically reinvested may terminate participation in the Plan at any time by written instructions to that effect to the Plan Administrator. Such written instructions must be received by the Plan Administrator three (3) days prior to the record date of the Distribution or the shareholder will receive such Distribution in Shares through the Plan.
11. Amendment, Supplement, Termination, and Suspension of Plan. This Plan may be amended, supplemented, or terminated by the Fund at any time in its sole and absolute discretion. The amendment or supplement shall be filed with the Securities and Exchange Commission as an exhibit to a subsequent appropriate filing made by the Fund and shall be deemed to be accepted by each participant unless, prior to its effective date thereof, the Plan Administrator receives written notice of termination of the participant’s account. Amendment may include an appointment by the Fund or the Plan Administrator with the approval of the Fund of a successor agent, in which event such successor shall have all of the rights and obligations of the Plan Administrator under this Plan. The Fund may suspend the Plan at any time without notice to the participants.
12. Governing Law. This Plan and the authorization form signed by the participant (which is deemed a part of this Plan) and the participant’s account shall be governed by and construed in accordance with the laws of the State of New York.
35
Privacy Notice
Protection and Security of Your Personal Information
Kohlberg Kravis Roberts & Co. L.P. (“KKR”) respects our investors’ right to privacy. All financial companies choose how they share personal information. Consumers have the right under U.S. federal law to limit some, but not all, sharing of personal information. U.S. federal law also requires us to inform you how we collect, share and protect your personal information. Investors may also have additional limiting rights under their respective State’s law. This notice is provided by KKR, its affiliates, and funds (“KKR”, “we”, or “us”). Please read this notice carefully to understand what we do, and call us at (212) 750-8300 if you have any questions.
The Personal Information We Collect and How We Collect It
We collect the following types of personal information about individuals who are our investors:
· Information we receive from investors in subscription agreements, questionnaires and in other forms, such as name, address, account information, social security number, the types and amounts of investments, statements of net worth, telephone number, and other contact information;
· Information we receive from investors, affiliates and other companies about investors’ transactions with us, our affiliates, or other financial institutions with which we have relationships; and
· Information we receive from third parties such as demographic information and information collected to comply with law and regulation.
When you are no longer an investor with us, we continue to share your information as described in this notice.
How and Why We Share Personal Information
This section lists reasons why financial companies can share their customers’ personal information. With respect to each reason, we explain whether KKR chooses to share for this reason and, if we do share, whether you can limit this sharing.
· For everyday business purposes: KKR shares personal information for everyday business purposes, such as to
· process your transactions;
· provide financial products or services to you;
· maintain your investment(s);
· secure business services, including printing, mailing, and processing or analyzing data;
· secure professional services, including accounting and legal services; or
· respond to court orders and legal investigations.
You cannot limit sharing by KKR for everyday business purposes.
· For our marketing purposes: KKR shares personal information for our marketing purposes so that we can offer products and services to you. You cannot limit sharing by KKR for this reason.
· For joint marketing with other financial companies: KKR does not share personal information for joint marketing with other financial companies.
36
· For use by affiliates in providing products and services to you: KKR shares personal information for our affiliates’ use in providing you with products and services that meet your financial services needs. You cannot limit sharing by KKR for this reason.
· For the everyday business purposes of affiliates: KKR does not share personal information, including information about your credit worthiness, with our affiliates for their everyday business purposes.
· For use by affiliates to market to you: KKR does not share personal information with affiliates so that they can market to you.
· For use by non-affiliates to market to you: KKR does not share personal information with non-affiliates so that they can market to you.
U.S. Federal law gives you the right to limit sharing of your personal information only for use (i) by affiliates everyday business purposes (information about your creditworthiness), (ii) by affiliates to market to you, and (iii) by non-affiliates to market to you. U.S. State laws and individual companies may give you additional rights to limit sharing.
How We Protect Your Personal Information
To protect your personal information from unauthorized access and use, we use security measures that comply with federal law. These measures include computer safeguards and secured files and buildings.
Definitions
Affiliates: Companies related by common ownership or control. They can be financial and nonfinancial companies. KKR does not share with our affiliates, except to provide you products and services that meet your financial needs.
Non-affiliates: Companies not related by common ownership or control. They can be financial and nonfinancial companies. KKR does not share with non-affiliates so they can market to you.
Joint Marketing: A formal agreement between nonaffiliated financial companies that together market financial products and services to you. KKR does not jointly market.
37
(This page intentionally left blank)
Item 2. Code of Ethics.
Not applicable for semi-annual report.
Item 3. Audit Committee Financial Expert.
Not applicable for semi-annual report.
Item 4. Principal Accountant Fees and Services.
Not applicable for semi-annual report.
Item 5. Audit Committee of Listed Registrants.
Not applicable for semi-annual report.
Item 6. Investments.
(a) Schedule of Investments is included as part of the report to shareholders filed under Item 1 of this Form.
(b) Not applicable.
Item 7. Disclosure of Proxy Voting Policies and Procedures for Closed-End Management Investment Companies.
Not applicable for semi-annual report.
Item 8. Portfolio Managers of Closed-End Management Investment Companies.
Not applicable for semi-annual report.
Item 9. Purchases of Equity Securities by Closed-End Management Investment Company and Affiliated Purchasers.
No purchases were made during the reporting period by or on behalf of the Fund or any “affiliated purchaser,” as defined in Rule 10b-18(a)(3) under the Exchange Act (17 CFR 240.10b-18(a)(3)), of shares or other units of any class of the Fund’s equity securities that is registered by the registrant pursuant to Section 12 of the Exchange Act (15 U.S.C. 781).
Item 10. Submission of Matters to a Vote of Security Holders.
There have been no material changes to the procedures by which shareholders may recommend nominees to the registrant’s board of trustees since the registrant last provided disclosure in response to this item.
Item 11. Controls and Procedures.
(a) The registrant’s principal executive officer and principal financial officer have concluded, based on their evaluation of the registrant’s disclosure controls and procedures as of a date within 90 days of the filing date of this report on Form N-CSR, that the design and operation of such procedures are effective to provide reasonable assurance that information required to be disclosed by the investment company on Form N-CSR is recorded, processed, summarized and reported within the time periods specified in the Commission’s rules and forms.
(b) There have been no changes in the registrant’s internal control over financial reporting during the six months ended April 30, 2020 that materially affected, or are reasonably likely to materially affect, the registrant’s internal control over financial reporting.
Item 12. Disclosure of Securities Lending Activities for Closed-End Management Investment Companies
The registrant did not engage in securities lending activities during the period reported on this Form N-CSR.
Item 13. Exhibits.
(a)(1) Not applicable.
(a)(2) A separate certification for the principal executive officer and the principal financial officer of the registrant as required by Rule 30a-2(a) under the Investment Company Act of 1940, as amended, are filed herewith.
(a)(3) Not applicable.
(a)(4) Not applicable.
(b) Certifications pursuant to Section 906 of the Sarbanes-Oxley Act of 2002 are filed herewith.
SIGNATURES
Pursuant to the requirements of the Securities Exchange Act of 1934 and the Investment Company Act of 1940, the registrant has duly caused this report to be signed on its behalf by the undersigned, thereunto duly authorized.
KKR Credit Opportunities Portfolio | |
| |
By | /s/ Suzanne Donohoe | |
Suzanne Donohoe, President | |
| |
Date | July 6, 2020 | |
Pursuant to the requirements of the Securities Exchange Act of 1934 and the Investment Company Act of 1940, this report has been signed below by the following persons on behalf of the registrant and in the capacities and on the dates indicated.
By | /s/ Suzanne Donohoe | |
Suzanne Donohoe, President | |
| |
Date | July 6, 2020 | |
By | /s/ Thomas Murphy | |
Thomas Murphy, Treasurer, Chief Accounting Officer & Chief Financial Officer |
|
Date | July 6, 2020 | |