UNITED STATES
SECURITIES AND EXCHANGE COMMISSION
Washington, D.C. 20549
FORM N-CSR
CERTIFIED SHAREHOLDER REPORT OF REGISTERED
MANAGEMENT INVESTMENT COMPANIES
Investment Company Act file number (811-23474)
KKR Credit Opportunities Portfolio
(Exact name of registrant as specified in charter)
555 California Street, 50th Floor
San Francisco, CA 94104
(Address of principal executive offices) (Zip code)
Annette O’Donnell-Butner
KKR Credit Advisors (US) LLC
555 California Street, 50th Floor
San Francisco, CA 94104
(Name and address of agent for service)
(415) 315-3620
Registrant’s telephone number, including area code
Date of fiscal year end: October 31, 2021
Date of reporting period: April 30, 2021
Item 1. Reports to Stockholders.

KKR Credit Opportunities Portfolio
Semi-Annual Report
April 30, 2021
Beginning on January 1, 2021, as permitted by regulations adopted by the U.S. Securities and Exchange Commission, paper copies of the Fund’s annual and semi-annual shareholder reports will no longer be sent by mail, unless you specifically request paper copies of the reports from the Fund or from your financial intermediary (such as a broker-dealer or bank). Instead, the reports will be made available on a website, and you will be notified by mail each time a report is posted and provided with a website link to access the report.
If you already elected to receive shareholder reports electronically, you will not be affected by this change and you need not take any action. You may elect to receive shareholder reports and other communications from the Fund electronically by contacting your financial intermediary or, if you are a direct investor, by calling the Fund at 1-855-862-6092.
You may elect to receive all future reports in paper free of charge. If you invest through a financial intermediary, you can contact your financial intermediary to request that you continue to receive paper copies of your shareholder reports; if you invest directly with the Fund, you can call the Fund at 1-855-862-6092. Your election to receive reports in paper form will apply to all funds held in your account with your financial intermediary.
| | | | |
 | |
Credit Opportunities Portfolio | | April 30, 2021 (Unaudited) |
| | | | |
Table of Contents
The KKR Credit Opportunities Portfolio (the “Fund”) files its complete schedule of portfolio holdings with the Securities and Exchange Commission (the “Commission”) for the first and third quarters of each fiscal year on Form N-PORT within sixty days after the end of the period. The Fund’s Form N-PORT is available on the Commission’s website at http://www.sec.gov.
A description of the policies and procedures that the Fund uses to determine how to vote proxies relating to portfolio securities, as well as information relating to how a Fund voted proxies relating to portfolio securities during the most recent period ended June 30 will be available (i) without charge, upon request, by calling 855- 862-6092; and (ii) on the Commission’s website at http://www.sec.gov.
INFORMATION ABOUT THE FUND’S TRUSTEES
The proxy statements and annual reports include information about the Fund’s Trustees and are available without charge, upon request, by calling 855-862-6092 and by visiting the Commission’s website at www.sec.gov.
| | | | |
| |
Credit Opportunities Portfolio | | April 30, 2021 (Unaudited) |
| | | | |
Management Discussion of Fund Performance
Looking Back on the Markets — April 30, 2021
The first quarter was characterized by a risk on rally with record amounts of debt issuance, unrelenting yearn for yield, an anticipated movement in rates, and spreads continuing to inch tighter. In terms of performance, loans had a strong quarter returning +1.8% and outperforming high yield, which returned +0.9% as of March 31, 2021.
Looking back on the market one year ago: high yield spreads spiked to +1,000bps amidst a global shut down as the world succumbed to a new unknown virus and investors flocked to the exits in pursuit of instant liquidity, while the world tried to grapple with the day-to-day news developments of COVID-19. In contrast to where we stand today: high yield spreads are near their historical tights at 336bps(1) as of March 31, 2021, the vaccine roll out in the U.S. has been robust, and the re-opening rally has shown no signs of slowing down. It is remarkable to see the powers of fiscal and monetary policy at work, and the vigor and speed in which a market can snap back. With the record amounts of dry powder, fiscal stimulus, and historically low borrowing costs, both leveraged loans and high yield performance and issuance to date continue to be strong.
In the first quarter, we witnessed a flurry of activity back into floating rate assets on the heels of rising Treasury rates in the first quarter in both the retail and institutional channels. Global leveraged loan new issue volume reached a record total of $263.92 billion between institutional new issuance and pro-rata activity as of March 31, 2021. The U.S. loan market experienced more than 2x the volume it saw in Q4 2020. The movement in rates coupled with the growing optimism around vaccine roll-out spurred strong technical tailwinds setting U.S. leveraged loans up for a record quarter of issuance at $180.8 billion, which exceeded the prior record of $171.4 billion back in Q1 of 2017.
The high yield market also showed no signs of slowing down printing $149.1 billion in issuance in the U.S. market and a total combined volume of $198.4 billion globally for the first quarter of 2021. The market has grown in size by 21% since January 2020 and is now sitting at $1.47 trillion. As borrowing costs remain suppressed and liquidity runways now extended, even rising Treasury rates could not completely deter the high yield market. Many issuers were prompted by the prospect of a rising interest rate environment and “rang the bell” to term out maturity profiles at low costs. As such, 2021 refinancing activity is higher than total high yield issuance volume for any pre March 2020 quarter at a staggering 79% of total volume this year.
Default activity in the first quarter trended lower as the $3.4bn of distressed volume was the lowest quarter since Q3 of 2018. The J.P Morgan U.S. high yield default rate decreased by 129bps to 5.37% and the loan default rate decreased by 33bps to 3.66%.
From a fund flows perspective, U.S. high yield net fund outflows exceeded more than $11.8 billion in the first quarter, which is a stark reversal from the 2020 trend where high yield fund flows totaled over $38 billion for the year. Flows for floating rate funds continued to respond favorably to strong momentum in global growth and rising rates, as loan funds saw a fourth consecutive inflow in March, which totaled +2.7bn. March’s inflow followed February and January’s inflows of +$4.2n and $4.bn, respectively. Year-to-date, inflows for loan funds total $11.1bn, which compares to outflows of -$16.0bn over the first three months of 2020.
The Market in Numbers1
For the period of November 1, 2020 – April 30, 2021: update for last 6 months:
| | • | | Returns: Over the six month period ending April 30, 2021, the high yield and leveraged loan markets returned 8.12% and 5.99% (as measured by the Bank of America Merrill Lynch High Yield Index and the S&P LSTA Leveraged Loan Index), respectively. |
1
| | | | |
| |
Credit Opportunities Portfolio | | April 30, 2021 (Unaudited) |
| | | | |
| | • | | Spreads: The option adjusted spread on the Bank of America Merrill Lynch High Yield Index ended the period at 328bps (April 30, 2021). The 3-year discounted spread on the S&P LSTA Leveraged Loan Index ended the period at LIBOR plus 427bps. (April 30, 2021). |
| | • | | Volatility: As measured by the VIX index, over the last six months, the VIX peaked at 38.89 in early November and ended the period at 18.61 (April 30, 2021) |
Fund Background and Performance
KKR Credit Opportunities Portfolio (“KCOP” or, the “Fund”) is a newly organized, diversified, closed-end management investment company that continuously offers its shares (the “Shares”) and is operated as an “interval fund.” The Fund’s investment objective is to seek to provide attractive risk-adjusted returns and high current income.
The Fund seeks to achieve its investment objectives by investing in a select portfolio with exposure to two primary credit strategies:
| | 1. | Opportunistic Credit, a conviction-based approach investing in a portfolio consisting primarily of publicly traded high yield bonds, first- and second-lien secured bank loans and structured credit (e.g., collateralized loan obligation (“CLO”) and mezzanine debt) and |
| | 2. | Private Credit, which includes directly originated hard and financial asset-based lending, corporate mezzanine debt, as well as directly originated first-lien, second-lien and unitranche senior loans to upper middle-market companies. |
Under normal market conditions, the Fund will invest at least 80% of its Managed Assets (as defined below) in senior and subordinated corporate debt and debt related instruments, including bonds, secured bank loans, convertible securities, structured products, convertible debt securities, repurchase agreements, and municipal securities.
During an initial ramp period of approximately 6-18 months following the Fund’s commencement of operations, the Fund will invest substantially all of its assets in the Opportunistic Credit Strategy. Following that initial period, the Fund expects, under normal circumstances, to invest 70-80% of its Managed Assets in the Opportunistic Credit strategy and 20-30% of its Managed Assets in the Private Credit Strategy, though the Fund’s allocation in investments could vary from these guidelines at any time in the Fund’s discretion. Investment in the Private Credit Strategy is contingent upon the Fund first achieving sufficient scale to acquire such positions, and there can be no assurance that the Fund will ever raise sufficient assets to invest in the Private Credit Strategy. On at least a quarterly basis, the Fund’s Investment Committee will meet to, among other things, review and establish the allocation percentage between the Opportunistic Credit Strategy and Private Credit Strategy for the ensuing period. The Investment Committee will consider factors such as KKR’s macro-economic and market outlooks, assessment of the relative risk and return of each strategy, and other factors in making its determination. “Managed Assets” means the total assets of the Fund (including any assets attributable to borrowings for investment purposes) minus the sum of the Fund’s accrued liabilities (other than liabilities representing borrowings for investment purposes).
As of April 30, 2021, the Fund held 54.4% of its net assets in first and second-lien leveraged loans, 55.9% of its net assets in high-yield corporate debt, 0.2% of its net assets in collateralized loan obligations, 0.7% of its net assets in common stock, and 2.1% of its net assets in exchange traded funds. KCOP’s investments represented obligations and equity interests in 193 positions across a diverse group of industries. The top ten issuers represented 32.3% of the Fund’s net assets while the top five industry groups represented 41.9% of the Fund’s net assets. The Fund’s Securities and Exchange Commission 30-day yield was 4.42%.
| 1 | Source: Bloomberg, S&P LSTA and ICE BofAML data as of April 30, 2021. |
2
| | | | |
| |
Credit Opportunities Portfolio | | April 30, 2021 (Unaudited) |
| | | | |
Business Updates
We thank you for your partnership and continued investment in KCOP. We look forward to continued communications and will keep you apprised of the progress of KCOP specifically and the leveraged finance market place generally. Fund information is available on our website at kkrfunds.com/KCOP.
Disclosures
The Bank of America Merrill Lynch High Yield Master II Index is a market-value weighted index of below investment grade U.S. dollar-denominated corporate bonds publicly issued in the U.S. domestic market. “Yankee” bonds (debt of foreign issuers issued in the U.S. domestic market) are included in the Bank of America Merrill Lynch High Yield Master II Index provided that the issuer is domiciled in a country having investment grade foreign currency long-term debt rating. Qualifying bonds must have maturities of one year or more, a fixed coupon schedule and minimum outstanding of US$100 million. In addition, issues having a credit rating lower than BBB3, but not in default, are also included.
The Chicago Board Options Exchange (CBOE) Volatility Index (VIX) reflects the market’s expectation of 30-day volatility. It is constructed using the implied volatilities of a wide range of S&P 500 index options. The VIX reflects the market’s estimate of future volatility, based on the weighted average of the implied volatilities for a wide range of strikes. The first and second month expirations are used until 8 days from expiration, then the second and third are used.
The S&P/LSTA Leveraged Loan Index is a market value-weighted index designed to measure the performance of the U.S. leveraged loan market based upon market weightings, spreads and interest payments. The Index was rolled out in 2000 and it was back-loaded with four years of data dating to 1997.
It is not possible to invest directly in an index.
Past performance is not an indication of future results. Returns represent past performance and reflect changes in share prices, the reinvestment of all dividends and capital gains, expense limitations and the effects of compounding. The prospectus contains more complete information on the investment objectives, risks, charges and expenses of the investment company, which investors should read and consider carefully before investing. The returns shown do not reflect taxes a shareholder would pay on distributions or redemptions. Total investment return and principal value of your investment will fluctuate, and your shares, when sold, may be worth more or less than their original cost. Current performance may be higher or lower than the performance data quoted. An investment in the Fund involves risk, including the risk of loss of principal. For a discussion of the Fund’s risks, see Risk Considerations, Note 3 to the financial statements. Call 855-330-3927 for performance results current to the most recent calendar quarter-end.
Must be preceded or accompanied by a prospectus.
An imbalance in supply and demand in the income market may result in valuation uncertainties and greater volatility, less liquidity, widening credit spreads and a lack of price transparency in the market. Investments in income securities may be affected by changes in the creditworthiness of the issuer and are subject to the risk of non–payment of principal and interest. The value of income securities also may decline because of real or perceived concerns about the issuer’s ability to make principal and interest payments. Borrowing to increase investments (leverage) will exaggerate the effect of any increase or decrease in the value of Fund investments. Investments rated below investment grade (typically referred to as “junk”) are generally subject to greater price volatility and illiquidity than higher rated investments. As interest rates rise, the value of certain income investments is likely to decline. Senior loans are subject to prepayment risk. Investments in foreign instruments or currencies can involve greater risk and volatility than U.S. investments because of adverse market economic, political, regulatory, geopolitical or other conditions. Changes in the value of investments entered for hedging purposes may not match those of the position being hedged. The Fund may engage in other investment practices that may involve additional risks.
3
| | | | |
| |
Credit Opportunities Portfolio | | April 30, 2021 (Unaudited) |
| | | | |
| | | | | | | | | | | | | | | | |
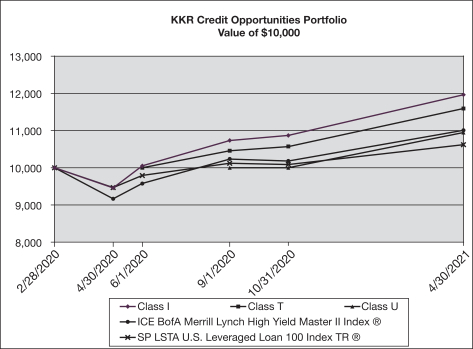
Average Annual Total Returns Period Ended April 30, 2021 | | Six Months | | | One Year | | | Since Inception | | | Value of
$10,000
4/30/2021 | |
KKR Credit Opportunities Portfolio | | | | | | | | | | | | | | | | |
Class I (02/28/2020) | | | 10.06% | | | | 26.50% | | | | 16.56% | | | $ | 11,964 | |
Class T (06/01/2020) | | | 9.72% | | | | N/A | | | | 15.94% | | | $ | 11,594 | |
Class U (09/01/2020) | | | 9.41% | | | | N/A | | | | 9.46% | | | $ | 10,946 | |
ICE BofA Merrill Lynch High Yield Master II Index® | | | 8.12% | | | | 20.10% | | | | 8.52% | | | $ | 11,004 | |
SP LSTA U.S. Leveraged Loan 100 Index TR | | | 5.31% | | | | 12.13% | | | | 5.28% | | | $ | 10,620 | |
4
| | | | |
| |
Credit Opportunities Portfolio | | April 30, 2021 (Unaudited) |
| | | | |
Schedule of Investments
| | | | | | | | | | |
| | | | | Par† | | | Value | |
Leveraged Loans - 54.4% | | | | | | | | | | |
| | | |
Aerospace & Defense - 3.4% | | | | | | | | | | |
| | | |
EaglePicher Technologies, LLC, TL 2L 02/18 | | | | | | | | | | |
| | | |
7.363% (1 Month US LIBOR + 7.250%), 03/08/2026 (a) | | | | | 1,142,419 | | | $ | 1,118,617 | |
| | | |
Ontic Engineering & Manufacturing, Inc, TL 1L B 02/21 | | | | | | | | | | |
| | | |
4.203% (3 Month US LIBOR + 4.000%), 10/30/2026 (a) | | | | | 83,479 | | | | 83,258 | |
| | | |
Sequa Corp., TL 2L 07/20 | | | | | | | | | | |
| | | |
11.750% (3 Month US LIBOR + 10.750%), 04/28/2024 (a) | | | | | 931,985 | | | | 886,938 | |
| | | |
Sequa Corp., TL 1L B 06/20 Add-on | | | | | | | | | | |
| | | |
10.000% (3 Month US LIBOR + 9.000%), 07/31/2025 (a)(d)(e) | | | | | 396,887 | | | | 417,771 | |
| | | |
Sequa Corp., TL 1L 07/20 | | | | | | | | | | |
| | | |
7.750% (3 Month US LIBOR + 6.750%), 11/28/2023 (a) | | | | | 5,453,435 | | | | 5,481,574 | |
| | | |
Standard Aero Ltd., TL 1L 04/19 | | | | | | | | | | |
| | | |
3.703% (3 Month US LIBOR + 3.500%), 04/06/2026 (a) | | | | | 4,673 | | | | 4,555 | |
| | | |
Standard Aero Ltd., TL 1L 02/20 | | | | | | | | | | |
| | | |
3.703% (3 Month US LIBOR + 3.500%), 04/06/2026 (a) | | | | | 2,512 | | | | 2,449 | |
| | | |
TransDigm Group, Inc., TL 1L F 01/20 | | | | | | | | | | |
| | | |
2.363% (1 Month US LIBOR + 2.250%), 12/09/2025 (a) | | | | | 2,668,217 | | | | 2,638,546 | |
| | | | | | | | | | |
| | | | | | | | | 10,633,708 | |
| | | | | | | | | | |
| | | |
Airlines - 0.3% | | | | | | | | | | |
| | | |
American Airlines Group, Inc., TL 1L 03/21 | | | | | | | | | | |
| | | |
5.500% (3 Month US LIBOR + 4.750%), 03/10/2028 (a) | | | | | 985,230 | | | | 1,014,521 | |
| | | | | | | | | | |
| | | | | | | | | | |
| | | |
Auto Components - 4.1% | | | | | | | | | | |
| | | |
American Tire Distributors, Inc., TL 1L 04/15 | | | | | | | | | | |
| | | |
8.500% (1 Month US LIBOR + 7.500%), 09/02/2024 (a)(g) | | | | | 4,187,833 | | | | 4,126,753 | |
| | | |
BBB Industries, LLC, TL 1L 06/18 | | | | | | | | | | |
| | | |
4.613% (1 Month US LIBOR + 4.500%), 08/01/2025 (a) | | | | | 4,981,128 | | | | 4,956,222 | |
| | | |
Innovative XCessories & Services LLC, TL 1L 02/20 | | | | | | | | | | |
| | | |
5.000% (3 Month US LIBOR + 5.000%), 03/05/2027 (a) | | | | | 1,248,650 | | | | 1,252,296 | |
| | | |
Truck Hero, Inc., TL 1L 01/21 | | | | | | | | | | |
| | | |
4.500% (1 Month US LIBOR + 3.750%), 01/20/2028 (a) | | | | | 1,165,050 | | | | 1,164,590 | |
| | | |
Wheel Pros, Inc., TL 1L B 11/20 | | | | | | | | | | |
| | | |
6.250% (1 Month US LIBOR + 5.250%), 11/10/2027 (a)(c)(d) | | | | | 1,198,413 | | | | 1,199,162 | |
| | | | | | | | | | |
| | | | | | | | | 12,699,023 | |
| | | | | | | | | | |
| | | |
Chemicals - 5.8% | | | | | | | | | | |
| | | |
Aruba Investments, Inc., TL 2L 10/20 | | | | | | | | | | |
| | | |
8.500% (6 Month US LIBOR + 7.750%), 11/24/2028 (a) | | | | | 465,220 | | | | 470,261 | |
| | | |
Flint Group GmbH, TL 1L B4 11/15 | | | | | | | | | | |
| | | |
0.750% (3 Month EURIBOR + 7.250%), 09/21/2023 (a)(b)(h) | | EUR | | | 908,283 | | | | 1,069,635 | |
| | | |
Flint Group GmbH, TL 1L B5 02/17 | | | | | | | | | | |
| | | |
0.750% (3 mon EURIBOR +4.250%), 09/21/2023 (a)(b)(h) | | EUR | | | 666,416 | | | | 784,802 | |
See accompanying notes to financial statements.
5
| | | | |
| |
Credit Opportunities Portfolio | | April 30, 2021 (Unaudited) |
| | | | |
| | | | | | | | | | |
Flint Group GmbH, TL 1L B 04/14 | | | | | | | | | | |
| | | |
0.750% (3 Month EURIBOR + 3.000%), 09/21/2023 (a)(b)(h) | | EUR | | | 5,115,553 | | | $ | 6,024,307 | |
| | | |
Flint Group GmbH, TL 1L B3 05/15 | | | | | | | | | | |
| | | |
0.750% (3 Month EURIBOR + 0.000%), 09/21/2023 (a)(b) | | EUR | | | 104,724 | | | | 123,328 | |
| | | |
Flint Group GmbH, TL 1L B6 03/17 | | | | | | | | | | |
| | | |
0.750% (3 mon EURIBOR +4.250%), 09/21/2023 (a)(b)(h) | | EUR | | | 52,368 | | | | 61,671 | |
| | | |
Flint Group GmbH, TL 1L B7 04/14 | | | | | | | | | | |
| | | |
0.750% (3 Month EURIBOR + 3.000%), 09/21/2023 (a)(b)(h) | | EUR | | | 116,174 | | | | 136,811 | |
| | | |
Flint Group GmbH, TL 1L 01/17 | | | | | | | | | | |
| | | |
0.750% (3 Month US LIBOR + 3.000%), 09/21/2023 (a)(b)(h) | | | | | 1,707,650 | | | | 1,672,644 | |
| | | |
Flint Group GmbH, TL 1L C 04/14 | | | | | | | | | | |
| | | |
0.750% (3 Month US LIBOR + 3.000%), 09/21/2023 (a)(b)(h) | | | | | 283,499 | | | | 277,687 | |
| | | |
Invictus, TL 2L 01/18 | | | | | | | | | | |
| | | |
6.863% (1 Month US LIBOR + 6.750%), 03/30/2026 (a) | | | | | 35,559 | | | | 35,537 | |
| | | |
Vantage Specialty Chemicals, Inc., TL 2L 10/17 | | | | | | | | | | |
| | | |
9.250% (3 Month US LIBOR + 8.250%), 10/27/2025 (a) | | | | | 561,410 | | | | 536,615 | |
| | | |
Vantage Specialty Chemicals, Inc., TL 1L B 10/17 | | | | | | | | | | |
| | | |
4.500% (3 Month US LIBOR + 3.500%), 10/26/2024 (a) | | | | | 6,859,346 | | | | 6,651,712 | |
| | | | | | | | | | |
| | | | | | | | | 17,845,010 | |
| | | | | | | | | | |
| | | |
Commercial Services & Supplies - 1.6% | | | | | | | | | | |
| | | |
Access CIG, LLC, TL 2L 02/18 | | | | | | | | | | |
| | | |
7.865% (1 Month US LIBOR + 7.750%), 02/27/2026 (a) | | | | | 143,000 | | | | 143,179 | |
| | | |
Access CIG, LLC, TL 1L 02/18 | | | | | | | | | | |
| | | |
3.861% (1 Month US LIBOR + 3.750%), 02/27/2025 (a) | | | | | 38,504 | | | | 38,363 | |
| | | |
Monitronics International, Inc., TL 1L EXIT 08/19 | | | | | | | | | | |
| | | |
7.750% (1 Month US LIBOR + 6.500%), 03/29/2024 (a)(c)(d) | | | | | 536,196 | | | | 527,386 | |
| | | |
VFS Global Services Pvt, Ltd., TL 1L B 06/17 | | | | | | | | | | |
| | | |
4.114% (3 Month LIBOR GBP + 4.000%), 07/29/2024 (a)(b) | | GBP | | | 1,360,050 | | | | 1,793,765 | |
| | | |
VFS Global Services Pvt, Ltd., TL 1L B 06/17 | | | | | | | | | | |
| | | |
3.250% (3 Month EURIBOR + 3.250%), 07/29/2024 (a)(b) | | EUR | | | 2,147,630 | | | | 2,475,493 | |
| | | | | | | | | | |
| | | | | | | | | 4,978,186 | |
| | | | | | | | | | |
| | | |
Construction & Engineering - 1.9% | | | | | | | | | | |
| | | |
Brand Energy & Infrastructure Services, Inc., TL 1L 05/17 | | | | | | | | | | |
| | | |
5.250% (3 Month US LIBOR + 4.250%), 06/21/2024 (a) | | | | | 1,072,620 | | | | 1,045,037 | |
| | | |
Total Safety US, Inc., TL 1L B 07/19 | | | | | | | | | | |
| | | |
7.000% (3 Month US LIBOR + 6.000%), 08/16/2025 (a) | | | | | 3,157,637 | | | | 3,170,804 | |
| | | |
Yak Access, LLC, TL 1L B 05/18 | | | | | | | | | | |
| | | |
5.113% (1 Month US LIBOR + 5.000%), 07/11/2025 (a) | | | | | 1,710,477 | | | | 1,565,087 | |
| | | | | | | | | | |
| | | | | | | | | 5,780,928 | |
| | | | | | | | | | |
| | | |
Distributors - 0.1% | | | | | | | | | | |
| | | |
Distribution International, Inc., TL 1L 06/19 | | | | | | | | | | |
| | | |
6.750% (3 Month US LIBOR + 5.750%), 12/15/2023 (a) | | | | | 449,284 | | | | 435,244 | |
| | | | | | | | | | |
See accompanying notes to financial statements.
6
| | | | |
| |
Credit Opportunities Portfolio | | April 30, 2021 (Unaudited) |
| | | | |
| | | | | | | | | | |
Diversified Consumer Services - 3.5% | | | | | | | | | | |
| | | |
Conservice, LLC, TL 1L B 05/20 | | | | | | | | | | |
| | | |
4.453% (3 Month US LIBOR + 4.250%), 05/13/2027 (a) | | | | | 25,489 | | | $ | 25,524 | |
| | | |
Jostens, Inc., TL 1L 12/18 | | | | | | | | | | |
| | | |
5.730% (3 Month US LIBOR + 5.500%), 12/19/2025 (a) | | | | | 6,998,750 | | | | 6,999,380 | |
| | | |
KinderCare Education, LLC, TL 1L B 09/18 | | | | | | | | | | |
| | | |
4.750% (3 Month US LIBOR + 3.750%), 02/21/2025 (a) | | | | | 2,641,220 | | | | 2,612,682 | |
| | | |
Learning Care Group, Inc., TL 1L B 05/20 | | | | | | | | | | |
| | | |
9.500% (6 Month US LIBOR + 8.500%), 03/13/2025 (a)(d) | | | | | 279,746 | | | | 282,544 | |
| | | |
Learning Care Group, Inc., TL 2L 03/18 | | | | | | | | | | |
| | | |
8.500% (6 Month US LIBOR + 7.500%), 03/13/2026 (a) | | | | | 194,997 | | | | 188,050 | |
| | | |
Learning Care Group, Inc., TL 1L B 02/18 | | | | | | | | | | |
| | | |
4.250% (3 Month US LIBOR + 3.250%), 03/13/2025 (a) | | | | | 811,259 | | | | 799,236 | |
| | | | | | | | | | |
| | | | | | | | | 10,907,416 | |
| | | | | | | | | | |
| | | |
Electronic Equipment, Instruments & Components - 1.0% | | | | | | | | | | |
| | | |
Excelitas Technologies Corp., TL 2L 10/17 | | | | | | | | | | |
| | | |
8.500% (3 Month US LIBOR + 7.500%), 12/01/2025 (a) | | | | | 3,088,755 | | | | 3,092,616 | |
| | | | | | | | | | |
| | | | | | | | | | |
| | | |
Energy Equipment & Services - 0.8% | | | | | | | | | | |
| | | |
Caprock Midstream, LLC, TL 1L B 10/18 | | | | | | | | | | |
| | | |
4.863% (3 Month US LIBOR + 4.750%), 11/03/2025 (a) | | | | | 2,435,629 | | | | 2,390,729 | |
| | | |
ChampionX Corp., TL 1L B 05/20 | | | | | | | | | | |
| | | |
6.000% (6 Month US LIBOR + 5.000%), 06/03/2027 (a) | | | | | 79,772 | | | | 81,567 | |
| | | | | | | | | | |
| | | | | | | | | 2,472,296 | |
| | | | | | | | | | |
| | | |
Food & Staples Retailing - 0.5% | | | | | | | | | | |
| | | |
Froneri Ltd., TL 2L 01/20 | | | | | | | | | | |
| | | |
5.863% (1 Month US LIBOR + 5.750%), 01/31/2028 (a)(b) | | | | | 60,000 | | | | 60,750 | |
| | | |
Froneri Ltd., TL 2L 01/20 | | | | | | | | | | |
| | | |
5.750% (6 Month EURIBOR + 5.750%), 01/31/2028 (a)(b) | | EUR | | | 1,046,740 | | | | 1,271,034 | |
| | | |
Smart & Final Stores, LLC, TL 1L B 05/19 | | | | | | | | | | |
| | | |
6.926% (1 Month US LIBOR + 6.750%), 06/20/2025 (a) | | | | | 191,322 | | | | 191,800 | |
| | | | | | | | | | |
| | | | | | | | | 1,523,584 | |
| | | | | | | | | | |
| | | |
Food Products - 0.3% | | | | | | | | | | |
| | | |
CSM Bakery Products, TL 2L 07/13 | | | | | | | | | | |
| | | |
11.000% (3 Month US LIBOR + 10.000%), 02/04/2022 (a)(c)(d) | | | | | 786,923 | | | | 780,203 | |
| | | | | | | | | | |
| | | | | | | | | | |
| | | |
Health Care Equipment & Supplies - 2.1% | | | | | | | | | | |
| | | |
Drive DeVilbiss Healthcare, LLC, TL 1L 03/21 | | | | | | | | | | |
| | | |
10.500% (3 month US LIBOR +9.500%), 06/01/2025 (a)(h) | | | | | 3,477,621 | | | | 3,292,160 | |
| | | |
Orchid Orthopedic Solutions, LLC, TL 1L 02/19 | | | | | | | | | | |
| | | |
4.676% (3 Month US LIBOR + 4.500%), 03/05/2026 (a) | | | | | 3,437,719 | | | | 3,267,947 | |
| | | | | | | | | | |
| | | | | | | | | 6,560,107 | |
| | | | | | | | | | |
See accompanying notes to financial statements.
7
| | | | |
| |
Credit Opportunities Portfolio | | April 30, 2021 (Unaudited) |
| | | | |
| | | | | | | | | | |
Health Care Providers & Services - 1.6% | | | | | | | | | | |
| | | |
Affordable Care Inc., TL 1L 10/15 | | | | | | | | | | |
| | | |
5.750% (3 Month US LIBOR + 4.750%), 10/24/2022 (a) | | | | | 4,995,494 | | | $ | 4,926,806 | |
| | | |
Paradigm Acquisition Corp., TL 2L 10/18 LC | | | | | | | | | | |
| | | |
7.703% (3 Month US LIBOR + 7.500%), 10/26/2026 (a) | | | | | 11,538 | | | | 11,272 | |
| | | | | | | | | | |
| | | | | | | | | 4,938,078 | |
| | | | | | | | | | |
| | | |
Hotels, Restaurants & Leisure - 4.8% | | | | | | | | | | |
| | | |
Aimbridge Acquisition Co, Inc., TL 1L B 09/20 | | | | | | | | | | |
| | | |
6.750% (1 Month US LIBOR + 6.000%), 02/02/2026 (a) | | | | | 411,811 | | | | 413,355 | |
| | | |
Aimbridge Acquisition Co, Inc., TL 1L B 10/19 | | | | | | | | | | |
| | | |
3.863% (1 Month US LIBOR + 3.750%), 02/02/2026 (a) | | | | | 4,233,475 | | | | 4,127,637 | |
| | | |
ASM Global, TL 1L 01/20 | | | | | | | | | | |
| | | |
2.613% (1 Month US LIBOR + 2.500%), 01/23/2025 (a) | | | | | 82,652 | | | | 78,919 | |
| | | |
B&B Hotels SAS, TL 1L B3A 01/20 | | | | | | | | | | |
| | | |
3.875% (6 Month EURIBOR + 3.875%), 07/31/2026 (a)(b) | | EUR | | | 1,886,660 | | | | 2,144,299 | |
| | | |
B&B Hotels SAS, TL 1L B4 03/21 | | | | | | | | | | |
| | | |
5.500%, 07/30/2026 (a)(b) | | EUR | | | 337,480 | | | | 400,158 | |
| | | |
ClubCorp Club Operations, Inc., TL 1L B 08/17 | | | | | | | | | | |
| | | |
2.953% (3 Month US LIBOR + 2.750%), 09/18/2024 (a) | | | | | 1,018,309 | | | | 982,032 | |
| | | |
Life Time Fitness, Inc., TL 1L 01/21 | | | | | | | | | | |
| | | |
5.750% (1 Month US LIBOR + 4.750%), 12/10/2024 (a) | | | | | 1,054,407 | | | | 1,059,516 | |
| | | |
Piolin BidCo SAU, TL 1L B 05/20 | | | | | | | | | | |
| | | |
7.500% (3 Month EURIBOR + 7.500%), 09/16/2026 (a)(b) | | EUR | | | 539,891 | | | | 648,276 | |
| | | |
United PF Holdings LLC, TL 1L 01/20 | | | | | | | | | | |
| | | |
4.176% (3 Month US LIBOR + 4.000%), 12/30/2026 (a) | | | | | 5,108,680 | | | | 4,959,684 | |
| | | | | | | | | | |
| | | | | | | | | 14,813,876 | |
| | | | | | | | | | |
| | | |
Household Products - 3.4% | | | | | | | | | | |
| | | |
Polyconcept North America, Inc., TL 1L B 08/16 | | | | | | | | | | |
| | | |
5.500% (6 Month US LIBOR + 4.500%), 08/16/2023 (a) | | | | | 10,171,856 | | | | 9,881,551 | |
| | | |
Steinhoff, TL 1L 07/19 (SFH Super Senior) | | | | | | | | | | |
| | | |
10.000%, 12/31/2021 (b)(c)(d)(h) | | EUR | | | 9,938 | | | | 12,207 | |
| | | |
Steinhoff, TL 1L 08/19 (SFH A1) | | | | | | | | | | |
| | | |
0.000% (3 Month EURIBOR + 0.000%), 12/31/2021 (b)(c)(d)(g)(h) | | EUR | | | 668,072 | | | | 631,309 | |
| | | | | | | | | | |
| | | | | | | | | 10,525,067 | |
| | | | | | | | | | |
| | | |
Industrial Conglomerates - 0.2% | | | | | | | | | | |
| | | |
Unifrax I LLC / Unifrax Holding Co., TL 1L B 10/18 | | | | | | | | | | |
| | | |
3.926% (3 Month US LIBOR + 3.750%), 12/12/2025 (a) | | | | | 741,572 | | | | 706,614 | |
| | | |
Unifrax I LLC / Unifrax Holding Co., TL 1L B 11/18 | | | | | | | | | | |
| | | |
3.750% (3 Month EURIBOR + 3.750%), 12/12/2025 (a) | | EUR | | | 25,000 | | | | 28,723 | |
| | | | | | | | | | |
| | | | | | | | | 735,337 | |
| | | | | | | | | | |
| | | |
IT Services - 0.4% | | | | | | | | | | |
| | | |
CoreLogic Inc/United States, TL 2L 03/21 | | | | | | | | | | |
| | | |
7.000%, 04/13/2029 (a) | | | | | 449,190 | | | | 451,997 | |
See accompanying notes to financial statements.
8
| | | | |
| |
Credit Opportunities Portfolio | | April 30, 2021 (Unaudited) |
| | | | |
| | | | | | | | | | |
PSAV, Inc., TL 1L B3 12/20 | | | | | | | | | | |
| | | |
15.000%, 10/15/2026 (h) | | | | | 553,930 | | | $ | 652,715 | |
| | | |
PSAV, Inc., TL 2L 02/18 | | | | | | | | | | |
| | | |
8.250% (3 Month US LIBOR + 7.250%), 09/01/2025 (a)(d) | | | | | 189,000 | | | | 137,025 | |
| | | | | | | | | | |
| | | | | | | | | 1,241,737 | |
| | | | | | | | | | |
| | | |
Leisure Products - 1.6% | | | | | | | | | | |
| | | |
Areas Worldwide SASU, TL 1L B1 06/19 | | | | | | | | | | |
| | | |
4.750% (6 Month EURIBOR + 4.750%), 07/01/2026 (a)(b) | | EUR | | | 4,473,094 | | | | 4,822,382 | |
| | | | | | | | | | |
| | | | | | | | | | |
| | | |
Machinery - 1.6% | | | | | | | | | | |
| | | |
Accuride Corp., TL 1L B 10/17 | | | | | | | | | | |
| | | |
6.250% (3 Month US LIBOR + 5.250%), 11/17/2023 (a) | | | | | 4,012,289 | | | | 3,813,098 | |
| | | |
CPM Holdings, Inc., TL 2L 10/18 | | | | | | | | | | |
| | | |
8.365% (1 Month US LIBOR + 8.250%), 11/16/2026 (a) | | | | | 371,172 | | | | 367,646 | |
| | | |
Welbilt, Inc. (Manitowoc Foodservice, Inc.), TL 1L B 10/18 | | | | | | | | | | |
| | | |
2.611% (1 Month US LIBOR + 2.500%), 10/23/2025 (a) | | | | | 583,820 | | | | 578,712 | |
| | | |
WireCo WorldGroup, Inc., TL 1L 07/16 | | | | | | | | | | |
| | | |
6.000% (6 Month US LIBOR + 5.000%), 09/29/2023 (a) | | | | | 85,157 | | | | 83,922 | |
| | | | | | | | | | |
| | | | | | | | | 4,843,378 | |
| | | | | | | | | | |
| | | |
Media - 2.8% | | | | | | | | | | |
| | | |
Emerald Expositions Holding, Inc., TL 1L B 11/17 | | | | | | | | | | |
| | | |
2.613% (1 Month US LIBOR + 2.750%), 05/22/2024 (a) | | | | | 8,325 | | | | 8,080 | |
| | | |
NEP Broadcasting, LLC, TL 1L 05/20 | | | | | | | | | | |
| | | |
9.250% (3 Month US LIBOR + 8.250%), 06/01/2025 (a)(d)(e) | | | | | 153,075 | | | | 157,667 | |
| | | |
NEP Broadcasting, LLC, TL 2L 09/18 | | | | | | | | | | |
| | | |
7.113% (1 Month US LIBOR + 7.000%), 10/19/2026 (a) | | | | | 393,000 | | | | 363,525 | |
| | | |
NEP Broadcasting, LLC, TL 1L B 09/18 | | | | | | | | | | |
| | | |
3.500% (3 Month EURIBOR + 3.500%), 10/20/2025 (a) | | EUR | | | 2,131,164 | | | | 2,477,331 | |
| | | |
NEP Broadcasting, LLC, TL 1L B 09/18 | | | | | | | | | | |
| | | |
3.363% (1 Month US LIBOR + 3.250%), 10/20/2025 (a) | | | | | 5,849,518 | | | | 5,698,893 | |
| | | | | | | | | | |
| | | | | | | | | 8,705,496 | |
| | | | | | | | | | |
| | | |
Metals & Mining - 0.0% | | | | | | | | | | |
| | | |
Foresight Energy LLC, TL 1L A 06/20 (Exit) | | | | | | | | | | |
| | | |
9.500% (1 Month US LIBOR + 8.000%), 06/30/2027 (a)(c)(d)(e) | | | | | 149,655 | | | | 149,655 | |
| | | | | | | | | | |
| | | | | | | | | | |
| | | |
Multiline Retail - 0.2% | | | | | | | | | | |
| | | |
Belk, Inc., TL 1L EXIT 02/21 PIK Toggle (FLSO) | | | | | | | | | | |
| | | |
10.000%, 07/31/2025 (c)(d)(g) | | | | | 893,545 | | | | 581,921 | |
| | | |
Belk, Inc., TL 1L 02/21 (FLFO) | | | | | | | | | | |
| | | |
8.500%, (3 Month US LIBOR + 7.500%), 07/31/2025 (a)(c)(d) | | | | | 53,180 | | | | 53,357 | |
| | | | | | | | | | |
| | | | | | | | | 635,278 | |
| | | | | | | | | | |
| | | |
Oil, Gas & Consumable Fuels - 1.8% | | | | | | | | | | |
| | | |
Eagleclaw Midstream Ventures, LLC, TL 1L 05/17 | | | | | | | | | | |
| | | |
5.250% (1 Month US LIBOR + 4.250%), 06/24/2024 (a) | | | | | 219,152 | | | | 217,392 | |
See accompanying notes to financial statements.
9
| | | | |
| |
Credit Opportunities Portfolio | | April 30, 2021 (Unaudited) |
| | | | |
| | | | | | | | | | |
Lucid Energy Group II Borrower LLC, TL 1L 01/18 | | | | | | | | | | |
| | | |
4.000% (1 Month US LIBOR + 3.000%), 02/17/2025 (a) | | | | | 2,602,289 | | | $ | 2,569,760 | |
| | | |
Navitas Midstream Midland Basin LLC, TL 1L B 12/17 | | | | | | | | | | |
| | | |
5.500% (1 Month US LIBOR + 4.500%), 12/13/2024 (a) | | | | | 2,827,527 | | | | 2,819,864 | |
| | | |
Oryx Midstream Services, LLC, TL 1L B 04/19 | | | | | | | | | | |
| | | |
4.113% (1 Month US LIBOR + 4.000%), 05/08/2026 (a) | | | | | 10,862 | | | | 10,712 | |
| | | | | | | | | | |
| | | | | | | | | 5,617,728 | |
| | | | | | | | | | |
| | | |
Personal Products - 0.3% | | | | | | | | | | |
| | | |
Coty Inc., TL 1L B 03/18 | | | | | | | | | | |
| | | |
2.500% (1 Month EURIBOR + 2.500%), 04/05/2025 (a)(c) | | EUR | | | 30,508 | | | | 35,468 | |
| | | |
Coty Inc., TL 1L B 04/18 | | | | | | | | | | |
| | | |
2.360% (1 Month US LIBOR + 2.250%), 04/07/2025 (a)(c) | | | | | 715,844 | | | | 688,441 | |
| | | |
Coty Inc., TL 1L 04/18 | | | | | | | | | | |
| | | |
1.500% (1 Month EURIBOR +1.500%), 04/05/2023 (a)(c) | | EUR | | | 45,703 | | | | 54,158 | |
| | | | | | | | | | |
| | | | | | | | | 778,067 | |
| | | | | | | | | | |
| | | |
Professional Services - 0.4% | | | | | | | | | | |
| | | |
SIRVA Worldwide, Inc., TL 2L 07/18 | | | | | | | | | | |
| | | |
9.693% (3 Month US LIBOR + 9.500%), 08/03/2026 (a)(d) | | | | | 59,000 | | | | 52,314 | |
| | | |
SIRVA Worldwide, Inc., TL 1L 07/18 | | | | | | | | | | |
| | | |
5.638% (3 Month US LIBOR + 5.500%), 08/04/2025 (a) | | | | | 424,707 | | | | 400,685 | |
| | | |
TMF Group Holding BV, TL 2L 12/17 | | | | | | | | | | |
| | | |
6.875% (3 Month EURIBOR + 6.875%), 06/08/2026 (a)(b) | | EUR | | | 693,210 | | | | 833,415 | |
| | | | | | | | | | |
| | | | | | | | | 1,286,414 | |
| | | | | | | | | | |
| | | |
Road & Rail - 0.1% | | | | | | | | | | |
| | | |
Transplace, TL 2L 09/17 | | | | | | | | | | |
| | | |
9.750% (6 Month US LIBOR + 8.750%), 10/06/2025 (a) | | | | | 180,000 | | | | 176,700 | |
| | | | | | | | | | |
| | | | | | | | | | |
| | | |
Software - 4.7% | | | | | | | | | | |
| | | |
Applied Systems, Inc., TL 2L 02/21 (Reprice) | | | | | | | | | | |
| | | |
6.250% (1 Month US LIBOR + 5.500%), 09/19/2025 (a) | | | | | 1,533,408 | | | | 1,550,337 | |
| | | |
Misys Ltd., TL 2L 04/17 | | | | | | | | | | |
| | | |
8.250% (6 Month US LIBOR + 7.250%), 06/13/2025 (a) | | | | | 3,169,669 | | | | 3,196,833 | |
| | | |
Misys Ltd., TL 1L 04/17 | | | | | | | | | | |
| | | |
4.500% (6 Month US LIBOR + 3.500%), 06/13/2024 (a) | | | | | 4,910,491 | | | | 4,834,869 | |
| | | |
TIBCO Software, Inc., TL 2L 02/20 | | | | | | | | | | |
| | | |
7.370% (1 Month US LIBOR + 7.750%), 03/03/2028 (a) | | | | | 3,698,372 | | | | 3,751,073 | |
| | | |
TIBCO Software, Inc., TL 1L B2 02/20 | | | | | | | | | | |
| | | |
3.870% (1 Month US LIBOR + 3.750%), 06/30/2026 (a) | | | | | 1,117,844 | | | | 1,113,133 | |
| | | | | | | | | | |
| | | | | | | | | 14,446,245 | |
| | | | | | | | | | |
| | | |
Specialty Retail - 0.2% | | | | | | | | | | |
| | | |
Douglas Holding AG, TL 1L B 03/21 | | | | | | | | | | |
| | | |
5.500%, 03/26/2026 (a)(b)(c)(d) | | EUR | | | 280,240 | | | | 334,696 | |
| | | |
Talbots, Inc., TL 1L B 11/18 | | | | | | | | | | |
| | | |
8.000% (3 Month US LIBOR + 7.000%), 11/28/2022 (a) | | | | | 212,000 | | | | 179,140 | |
| | | | | | | | | | |
| | | | | | | | | 513,836 | |
| | | | | | | | | | |
See accompanying notes to financial statements.
10
| | | | |
| |
Credit Opportunities Portfolio | | April 30, 2021 (Unaudited) |
| | | | |
| | | | | | | | | | |
Textiles, Apparel & Luxury Goods - 3.2% | | | | | | | | | | |
| | | |
Varsity Brands, Inc., TL 1L 11/17 | | | | | | | | | | |
| | | |
4.500% (1 Month US LIBOR + 3.500%), 12/16/2024 (a) | | | | | 10,158,032 | | | $ | 9,794,070 | |
| | | | | | | | | | |
| | | |
Trading Companies & Distributors - 0.2% | | | | | | | | | | |
| | | |
FleetPride Corporation, TL 1L 12/18 | | | | | | | | | | |
| | | |
4.613% (1 Month US LIBOR + 4.500%), 02/04/2026 (a) | | | | | 726,227 | | | | 721,837 | |
| | | | | | | | | | |
| | | |
Transportation Infrastructure - 1.5% | | | | | | | | | | |
| | | |
Direct ChassisLink, Inc., TL 2L 04/19 | | | | | | | | | | |
| | | |
8.438% (3 Month US LIBOR + 8.250%), 04/10/2026 (a) | | | | | 2,442,190 | | | | 2,475,318 | |
| | | |
Direct ChassisLink, Inc., TL 2L 04/21 | | | | | | | | | | |
| | | |
7.176%, 04/30/2026 (a) | | | | | 2,000,000 | | | | 2,020,000 | |
| | | | | | | | | | |
| | | | | | | | | 4,495,318 | |
| | | | | | | | | | |
TOTAL LEVERAGED LOANS (amortized cost $164,178,606) | | | | | | | | | 167,963,341 | |
| | | | | | | | | | |
| | | |
High Yield Securities - 55.9% | | | | | | | | | | |
| | | |
Airlines - 2.1% | | | | | | | | | | |
| | | |
0.000%, 04/20/2026 (f) | | | | | 924,000 | | | | 971,355 | |
| | | |
American Airlines Group, Inc | | | | | | | | | | |
| | | |
5.750%, 04/20/2029 (f) | | | | | 542,000 | | | | 581,431 | |
| | | |
Delta Air Lines, Inc. | | | | | | | | | | |
| | | |
4.375%, 04/19/2028 | | | | | 2,378,000 | | | | 2,528,424 | |
| | | |
3.750%, 10/28/2029 | | | | | 2,408,000 | | | | 2,400,815 | |
| | | | | | | | | | |
| | | | | | | | | 6,482,025 | |
| | | | | | | | | | |
| | | |
Auto Components - 1.7% | | | | | | | | | | |
| | | |
BBB Industries, LLC | | | | | | | | | | |
| | | |
9.250%, 08/01/2025 (f) | | | | | 3,456,000 | | | | 3,758,400 | |
| | | |
Truck Hero, Inc. | | | | | | | | | | |
| | | |
6.250%, 02/01/2029 (f) | | | | | 341,000 | | | | 353,283 | |
| | | |
Wheel Pros, Inc. | | | | | | | | | | |
| | | |
6.500%, 05/15/2029 (c)(d)(f) | | | | | 1,197,000 | | | | 1,201,620 | |
| | | | | | | | | | |
| | | | | | | | | 5,313,303 | |
| | | | | | | | | | |
| | | |
Biotechnology - 1.2% | | | | | | | | | | |
| | | |
Intercept Pharmaceuticals, Inc. | | | | | | | | | | |
| | | |
3.250%, 07/01/2023 | | | | | 1,941,000 | | | | 1,613,456 | |
| | | |
2.000%, 05/15/2026 | | | | | 2,531,000 | | | | 1,663,155 | |
| | | |
Radius Health, Inc. | | | | | | | | | | |
| | | |
3.000%, 09/01/2024 (c)(d) | | | | | 326,000 | | | | 313,922 | |
| | | | | | | | | | |
| | | | | | | | | 3,590,533 | |
| | | | | | | | | | |
| | | |
Building Products - 4.8% | | | | | | | | | | |
| | | |
Cornerstone (Ply Gem Holdings, Inc.) | | | | | | | | | | |
| | | |
6.125%, 01/15/2029 (f) | | | | | 143,000 | | | | 152,837 | |
| | | |
LBM Borrower, LLC | | | | | | | | | | |
| | | |
7.750%, 04/01/2027 (f) | | | | | 6,455,000 | | | | 6,661,399 | |
| | | |
6.250%, 01/15/2029 (f) | | | | | 7,153,000 | | | | 7,352,783 | |
See accompanying notes to financial statements.
11
| | | | |
| |
Credit Opportunities Portfolio | | April 30, 2021 (Unaudited) |
| | | | |
| | | | | | | | | �� | |
SRS Distribution, Inc. | | | | | | | | | | |
| | | |
8.250%, 07/01/2026 (f) | | | | | 687,000 | | | $ | 720,491 | |
| | | | | | | | | | |
| | | | | | | | | 14,887,510 | |
| | | | | | | | | | |
| | | |
Chemicals - 2.7% | | | | | | | | | | |
| | | |
Consolidated Energy Finance SA | | | | | | | | | | |
| | | |
6.875%, 06/15/2025 (b)(f) | | | | | 911,000 | | | | 916,124 | |
| | | |
6.500%, 05/15/2026 (b)(f) | | | | | 1,646,000 | | | | 1,637,770 | |
| | | |
Cornerstone Chemical Co. | | | | | | | | | | |
| | | |
6.750%, 08/15/2024 (f) | | | | | 6,000,000 | | | | 5,780,070 | |
| | | | | | | | | | |
| | | | | | | | | 8,333,964 | |
| | | | | | | | | | |
| | | |
Commercial Services & Supplies - 0.8% | | | | | | | | | | |
| | | |
Multi-Color Corp | | | | | | | | | | |
| | | |
10.500%, 07/15/2027 (f) | | | | | 2,183,000 | | | | 2,410,447 | |
| | | | | | | | | | |
| | | | | | | | | | |
| | | |
Construction & Engineering - 0.8% | | | | | | | | | | |
| | | |
Maxim Crane Works LP / Maxim Finance Corp. | | | | | | | | | | |
| | | |
10.125%, 08/01/2024 (f) | | | | | 2,484,000 | | | | 2,594,612 | |
| | | | | | | | | | |
| | | | | | | | | | |
| | | |
Construction Materials - 0.2% | | | | | | | | | | |
| | | |
Cemex Materials LLC | | | | | | | | | | |
| | | |
7.700%, 07/21/2025 (f) | | | | | 554,000 | | | | 638,485 | |
| | | | | | | | | | |
| | | | | | | | | | |
| | | |
Containers & Packaging - 0.1% | | | | | | | | | | |
| | | |
Plastipak Holdings, Inc. | | | | | | | | | | |
| | | |
6.250%, 10/15/2025 (f) | | | | | 207,000 | | | | 213,081 | |
| | | | | | | | | | |
| | | | | | | | | | |
| | | |
Diversified Telecommunication Services - 1.2% | | | | | | | | | | |
| | | |
Zayo Group LLC | | | | | | | | | | |
| | | |
6.125%, 03/01/2028 (f) | | | | | 3,507,000 | | | | 3,612,526 | |
| | | | | | | | | | |
| | | | | | | | | | |
| | | |
Electronic Equipment, Instruments & Components - 2.5% | | | | | | | | | | |
| | | |
CommScope, Inc. | | | | | | | | | | |
| | | |
6.000%, 06/15/2025 (f) | | | | | 890,000 | | | | 906,688 | |
| | | |
8.250%, 03/01/2027 (f) | | | | | 6,153,000 | | | | 6,599,092 | |
| | | |
7.125%, 07/01/2028 (f) | | | | | 310,000 | | | | 335,876 | |
| | | | | | | | | | |
| | | | | | | | | 7,841,656 | |
| | | | | | | | | | |
| | | |
Energy Equipment & Services - 0.1% | | | | | | | | | | |
| | | |
Archrock Partners LP / Archrock Partners Finance Corp | | | | | | | | | | |
| | | |
6.875%, 04/01/2027 (f) | | | | | 324,000 | | | | 345,617 | |
| | | | | | | | | | |
| | | | | | | | | | |
See accompanying notes to financial statements.
12
| | | | |
| |
Credit Opportunities Portfolio | | April 30, 2021 (Unaudited) |
| | | | |
| | | | | | | | | | |
Health Care Providers & Services - 2.9% | | | | | | | | | | |
| | | |
CHS/Community Health Systems, Inc. | | | | | | | | | | |
| | | |
8.000%, 03/15/2026 (f) | | | | | 986,000 | | | $ | 1,063,648 | |
| | | |
5.625%, 03/15/2027 (f) | | | | | 124,000 | | | | 131,661 | |
| | | |
6.875%, 04/01/2028 (f) | | | | | 882,000 | | | | 834,752 | |
| | | |
6.875%, 04/15/2029 (f) | | | | | 599,000 | | | | 626,827 | |
| | | |
6.000%, 01/15/2029 (f) | | | | | 67,000 | | | | 70,618 | |
| | | |
LifePoint Hospitals, Inc. | | | | | | | | | | |
| | | |
9.750%, 12/01/2026 (f) | | | | | 234,000 | | | | 253,013 | |
| | | |
5.375%, 01/15/2029 (f) | | | | | 518,000 | | | | 518,751 | |
| | | |
Molina Healthcare, Inc. | | | | | | | | | | |
| | | |
3.875%, 11/15/2030 (f) | | | | | 625,000 | | | | 644,531 | |
| | | |
Radiology Partners Inc. | | | | | | | | | | |
| | | |
9.250%, 02/01/2028 (f) | | | | | 4,269,000 | | | | 4,698,227 | |
| | | | | | | | | | |
| | | | | | | | | 8,842,028 | |
| | | | | | | | | | |
| | | |
Health Care Technology - 0.1% | | | | | | | | | | |
| | | |
Verscend Holding Corp. | | | | | | | | | | |
| | | |
9.750%, 08/15/2026 (f) | | | | | 314,000 | | | | 334,806 | |
| | | | | | | | | | |
| | | | | | | | | | |
| | | |
Hotels, Restaurants & Leisure - 9.7% | | | | | | | | | | |
| | | |
Carnival Corp. | | | | | | | | | | |
| | | |
5.750%, 03/01/2027 (f) | | | | | 6,416,000 | | | | 6,772,922 | |
| | | |
ClubCorp Club Operations, Inc. | | | | | | | | | | |
| | | |
8.500%, 09/15/2025 (f) | | | | | 881,000 | | | | 853,376 | |
| | | |
Diamond Resorts International, Inc. | | | | | | | | | | |
| | | |
10.750%, 09/01/2024 (f) | | | | | 5,613,000 | | | | 5,961,540 | |
| | | |
Life Time Fitness, Inc. | | | | | | | | | | |
| | | |
5.750%, 01/15/2026 (f) | | | | | 3,526,000 | | | | 3,645,602 | |
| | | |
Merlin Entertainments PLC | | | | | | | | | | |
| | | |
6.625%, 11/15/2027 (b)(f) | | | | | 1,267,000 | | | | 1,286,005 | |
| | | |
5.750%, 06/15/2026 (b)(f) | | | | | 690,000 | | | | 730,406 | |
| | | |
NCL Corp, Ltd. | | | | | | | | | | |
| | | |
6.125%, 03/15/2028 (f) | | | | | 1,927,000 | | | | 2,032,388 | |
| | | |
Royal Caribbean Cruises Ltd. | | | | | | | | | | |
| | | |
5.500%, 04/01/2028 (f) | | | | | 4,731,000 | | | | 4,967,313 | |
| | | |
Viking Cruises, Ltd. | | | | | | | | | | |
| | | |
13.000%, 05/15/2025 (f) | | | | | 237,000 | | | | 277,969 | |
| | | |
7.000%, 02/15/2029 (f) | | | | | 3,183,000 | | | | 3,306,341 | |
| | | | | | | | | | |
| | | | | | | | | 29,833,862 | |
| | | | | | | | | | |
| | | |
Independent Power and Renewable Electricity Producers - 0.4% | | | | | | | | | | |
| | | |
NRG Energy, Inc. | | | | | | | | | | |
| | | |
3.625%, 02/15/2031 (f) | | | | | 1,325,000 | | | | 1,299,823 | |
| | | | | | | | | | |
| | | | | | | | | | |
See accompanying notes to financial statements.
13
| | | | |
| |
Credit Opportunities Portfolio | | April 30, 2021 (Unaudited) |
| | | | |
| | | | | | | | | | |
Insurance - 3.6% | | | | | | | | | | |
| | | |
Alliant Holdings I, Inc. | | | | | | | | | | |
| | | |
6.750%, 10/15/2027 (f) | | | | | 1,739,000 | | | $ | 1,829,428 | |
| | | |
Aspen Insurance Holdings Ltd | | | | | | | | | | |
| | | |
7.625%, 10/15/2025 (f) | | | | | 1,875,000 | | | | 2,005,688 | |
| | | |
National Financial Partners Corp | | | | | | | | | | |
| | | |
6.875%, 08/15/2028 (f) | | | | | 6,963,000 | | | | 7,316,302 | |
| | | | | | | | | | |
| | | |
| | | | | | | | | 11,151,418 | |
| | | | | | | | | | |
| | | |
IT Services - 1.1% | | | | | | | | | | |
| | | |
West Corp. | | | | | | | | | | |
| | | |
8.500%, 10/15/2025 (f) | | | | | 3,251,000 | | | | 3,309,924 | |
| | | |
Xerox Business Services /Conduent | | | | | | | | | | |
| | | |
10.500%, 12/15/2024 (f) | | | | | 121,000 | | | | 127,353 | |
| | | | | | | | | | |
| | | | | | | | | 3,437,277 | |
| | | | | | | | | | |
| | | |
Machinery - 0.8% | | | | | | | | | | |
| | | |
Welbilt, Inc. (Manitowoc Foodservice, Inc.) | | | | | | | | | | |
| | | |
9.500%, 02/15/2024 | | | | | 2,380,000 | | | | 2,506,438 | |
| | | | | | | | | | |
| | | | | | | | | | |
| | | |
Media - 0.6% | | | | | | | | | | |
| | | |
Intelsat Jackson Holdings SA | | | | | | | | | | |
| | | |
0.000%, 08/01/2023 (b)(g) | | | | | 207,000 | | | | 127,305 | |
| | | |
Outfront Media Capital LLC / Outfront Media Capital Corp. | | | | | | | | | | |
| | | |
4.625%, 03/15/2030 (f) | | | | | 620,000 | | | | 614,575 | |
| | | |
Spotify USA, Inc. | | | | | | | | | | |
| | | |
0.000%, 03/15/2026 (f) | | | | | 1,303,000 | | | | 1,204,624 | |
| | | | | | | | | | |
| | | | | | | | | 1,946,504 | |
| | | | | | | | | | |
| | | |
Multiline Retail - 0.0% | | | | | | | | | | |
| | | |
JC Penney Corp, Inc. | | | | | | | | | | |
| | | |
0.000%, 03/15/2025 (d)(e)(f)(g) | | | | | 98,000 | | | | — | |
| | | | | | | | | | |
| | | | | | | | | | |
| | | |
Oil, Gas & Consumable Fuels - 4.1% | | | | | | | | | | |
| | | |
Genesis Energy | | | | | | | | | | |
| | | |
5.625%, 06/15/2024 | | | | | 1,902,000 | | | | 1,905,566 | |
| | | |
8.000%, 01/15/2027 | | | | | 431,000 | | | | 444,574 | |
| | | |
Global Partners LP / GLP Finance Corp. | | | | | | | | | | |
| | | |
7.000%, 08/01/2027 | | | | | 519,000 | | | | 555,810 | |
| | | |
6.875%, 01/15/2029 | | | | | 364,000 | | | | 394,258 | |
| | | |
Sunoco LP | | | | | | | | | | |
| | | |
4.500%, 05/15/2029 (f) | | | | | 933,000 | | | | 943,496 | |
| | | |
Tallgrass Energy Partners LP / Tallgrass Energy Finance Corp. | | | | | | | | | | |
| | | |
6.000%, 03/01/2027 (f) | | | | | 211,000 | | | | 214,629 | |
| | | |
6.000%, 12/31/2030 (f) | | | | | 273,000 | | | | 274,024 | |
See accompanying notes to financial statements.
14
| | | | |
| |
Credit Opportunities Portfolio | | April 30, 2021 (Unaudited) |
| | | | |
| | | | | | | | | | |
Targa Resources Partners LP / Targa Resources Partners Finance Corp. | | | | | | | | | | |
| | | |
5.000%, 01/15/2028 | | | | | 458,000 | | | $ | 482,755 | |
| | | |
4.000%, 01/15/2032 (f) | | | | | 3,304,000 | | | | 3,250,309 | |
| | | |
Vine Oil & Gas LP / Vine Oil & Gas Finance Corp. | | | | | | | | | | |
| | | |
6.750%, 04/15/2029 (f) | | | | | 4,115,000 | | | | 4,121,913 | |
| | | | | | | | | | |
| | | | | | | | | 12,587,334 | |
| | | | | | | | | | |
| | | |
Road & Rail - 2.1% | | | | | | | | | | |
| | | |
Kenan Advantage Group, Inc./The | | | | | | | | | | |
| | | |
7.875%, 07/31/2023 (f) | | | | | 6,488,000 | | | | 6,504,220 | |
| | | | | | | | | | |
| | | | | | | | | | |
| | | |
Software - 1.1% | | | | | | | | | | |
| | | |
Solera, LLC | | | | | | | | | | |
| | | |
10.500%, 03/01/2024 (c)(d)(f) | | | | | 3,196,000 | | | | 3,297,888 | |
| | | | | | | | | | |
| | | | | | | | | | |
| | | |
Specialty Retail - 4.2% | | | | | | | | | | |
| | | |
Douglas Holding AG | | | | | | | | | | |
| | | |
6.000%, 04/08/2026 (b)(c)(d)(f) | | EUR | | | 6,393,000 | | | | 7,741,089 | |
| | | |
8.250%, 10/01/2026 (b)(c)(d)(f) | | EUR | | | 4,260,000 | | | | 5,131,518 | |
| | | | | | | | | | |
| | | | | | | | | 12,872,607 | |
| | | | | | | | | | |
| | | |
Textiles, Apparel & Luxury Goods - 0.7% | | | | | | | | | | |
| | | |
Varsity Brands, Inc. | | | | | | | | | | |
| | | |
9.000% (3 Month LIBOR USD + 8.000%), 12/22/2024 (a)(f) | | | | | 2,076,000 | | | | 2,101,950 | |
| | | | | | | | | | |
| | | | | | | | | | |
| | | |
Trading Companies & Distributors - 6.3% | | | | | | | | | | |
| | | |
AerCap Holdings | | | | | | | | | | |
| | | |
6.500% (3 Month LIBOR USD + 4.300%), 06/15/2045 (b)(f) | | | | | 994,000 | | | | 1,059,853 | |
| | | |
4.625%, 10/15/2027 (b) | | | | | 3,714,000 | | | | 4,140,884 | |
| | | |
Neon Holdings, Inc. | | | | | | | | | | |
| | | |
10.125%, 04/01/2026 (f) | | | | | 4,721,000 | | | | 5,163,594 | |
| | | |
TruckPro LLC | | | | | | | | | | |
| | | |
11.000%, 10/15/2024 (f) | | | | | 3,669,000 | | | | 4,054,245 | |
| | | |
White Cap Construction Supply, Inc. | | | | | | | | | | |
| | | |
8.250%, 03/15/2026 (f) | | | | | 2,452,000 | | | | 2,551,268 | |
| | | |
6.875%, 10/15/2028 (f) | | | | | 2,443,000 | | | | 2,595,712 | |
| | | | | | | | | | |
| | | | | | | | | 19,565,556 | |
| | | | | | | | | | |
TOTAL HIGH YIELD SECURITIES (amortized cost $168,751,771) | | | | | | | | | 172,545,470 | |
| | | | | | | | | | |
| | | |
Collateralized Loan Obligations - 0.2% | | | | | | | | | | |
| | | |
Diversified Financial Services - 0.2% | | | | | | | | | | |
| | | |
Octagon Investment Partners Ltd. | | | | | | | | | | |
| | | |
7.848% (3 Month LIBOR USD + 7.660%), 10/20/2031 (a)(d)(e)(f) | | | | | 53,100 | | | | 53,948 | |
| | | |
TICP CLO Ltd. | | | | | | | | | | |
| | | |
5.788% (3 Month LIBOR USD + 5.600%), 01/20/2031 (a)(d)(e)(f) | | | | | 738,460 | | | | 707,346 | |
| | | | | | | | | | |
| | | |
| | | | | | | | | 761,294 | |
| | | | | | | | | | |
TOTAL COLLATERALIZED LOAN OBLIGATIONS (amortized cost $679,311) | | | | | | | | | 761,294 | |
| | | | | | | | | | |
See accompanying notes to financial statements.
15
| | | | |
| |
Credit Opportunities Portfolio | | April 30, 2021 (Unaudited) |
| | | | |
| | | | | | | | | | |
Common Stocks - 0.7% | | | | | | | | | | |
| | | |
Health Care Providers & Services - 0.0% | | | | | | | | | | |
| | | |
Quorum Health Corp. (d)(e) | | | | | 212,000 | | | $ | 19,800 | |
| | | | | | | | | | |
| | | | | | | | | | |
| | | |
Hotels, Restaurants & Leisure - 0.6% | | | | | | | | | | |
| | | |
Hilton Grand Vacations, Inc. | | | | | 40,347 | | | | 1,797,863 | |
| | | | | | | | | | |
| | | | | | | | | | |
| | | |
Metals & Mining - 0.1% | | | | | | | | | | |
| | | |
Foresight Energy LLC (c)(d)(e) | | | | | 17,979 | | | | 258,511 | |
| | | | | | | | | | |
TOTAL COMMON STOCKS (cost $1,917,067) | | | | | | | | | 2,076,174 | |
| | | | | | | | | | |
| | | |
Exchange Traded Funds - 2.1% | | | | | | | | | | |
| | | |
Diversified Financial Services - 2.1% | | | | | | | | | | |
| | | |
BlackRock Floating Rate Income Strategies Fund, Inc. | | | | | 23,250 | | | | 299,925 | |
| | | |
Nuveen Credit Strategies Income Fund | | | | | 53,690 | | | | 356,502 | |
| | | |
Nuveen Floating Rate Income Opportunity Fund | | | | | 94,645 | | | | 897,235 | |
| | | |
PowerShares Senior Loan Portfolio | | | | | 207,630 | | | | 4,599,004 | |
| | | |
Voya Prime Rate Trust | | | | | 42,211 | | | | 192,904 | |
| | | | | | | | | | |
| | | | | | | | | 6,345,570 | |
| | | | | | | | | | |
TOTAL EXCHANGE TRADED FUNDS (cost $6,360,945) | | | | | | | | | 6,345,570 | |
| | | | | | | | | | |
| | | |
TOTAL INVESTMENTS (cost $341,887,700) (i) - 113.2% | | | | | | | | | 349,691,849 | |
| | | | | | | | | | |
LIABILITIES EXCEEDING OTHER ASSETS, NET - (13.2)% | | | | | | | | | (40,895,545 | ) |
| | | | | | | | | | |
NET ASSETS - 100.0% | | | | | | | | $ | 308,796,304 | |
| | | | | | | | | | |
| † | | In U.S. Dollars unless otherwise indicated. | |
| (a) | | Variable rate security, the coupon rate shown is the effective rate as of April 30, 2021. | |
| (c) | | Security considered restricted due to the Adviser’s knowledge of material non-public information. The total value of these securities as of April 30, 2021 was $22,992,511 and represented 7.4% of net assets. | |
| (d) | | Security considered illiquid, as defined by the Securities and Exchange Commission. The total value of these securities as of April 30, 2021 was $24,042,859 and represented 7.8% of net assets. | |
| (e) | | Value determined using significant unobservable inputs. | |
| (f) | | Securities exempt from registration pursuant to Rule 144A under the Securities Act of 1933, as amended. These securities may only be resold to qualified institutional buyers in transactions exempt from registration. The total value of these securities as of April 30, 2021 was $154,229,403, which represent 49.9% of net assets. | |
| (g) | | Non-income producing security. | |
| (h) | | Represents a payment-in-kind (“PIK”) security which may pay interest/dividend in additional par/shares. | |
| (i) | | All investments are held as collateral for the Fund’s credit facility. | |
See accompanying notes to financial statements.
16
| | | | |
| |
Credit Opportunities Portfolio | | April 30, 2021 (Unaudited) |
| | | | |
The following table represents the Fund’s investments categorized by country of risk as of April 30, 2021:
| | | | | | |
| | | Country: | | % of Net Assets | |
| | |
| | United States | | | 97.5% | |
| | |
| | Germany | | | 7.6% | |
| | |
| | France | | | 2.4% | |
| | |
| | Netherlands | | | 2.0% | |
| | |
| | Sweden | | | 1.4% | |
| | |
| | United Kingdom | | | 1.1% | |
| | |
| | Switzerland | | | 0.8% | |
| | |
| | Luxembourg | | | 0.2% | |
| | |
| | Spain | | | 0.2% | |
| | | | | | |
| | | | | 113.2% | |
| | | | | | |
| | Liabilities Exceeding Other Assets, Net | | | (13.2)% | |
| | | | | | |
| | | | | 100.0% | |
| | | | | | |
See accompanying notes to financial statements.
17
| | | | |
| |
Credit Opportunities Portfolio | | April 30, 2021 (Unaudited) |
| | | | |
Statement of Assets and Liabilities
As of April 30, 2021 (Unaudited)
| | | | |
Assets | | | | |
| |
Investments, at value (amortized cost $341,887,700) | | $ | 349,691,849 | |
| |
Cash and cash equivalents | | | 21,233,517 | |
| |
Receivable for shares issued | | | 32,726,875 | |
| |
Dividends and interest receivable | | | 2,982,186 | |
| |
Due from Adviser | | | 14,549 | |
| |
Receivable for investments sold | | | 250,926 | |
| |
Prepaid expenses | | | 143,012 | |
| | | | |
Total assets | | | 407,042,914 | |
| | | | |
| |
Liabilities | | | | |
| |
Credit Facility (net of deferred financing costs of $51,392) | | | 57,229,835 | |
| |
Payable for investments purchased | | | 39,199,072 | |
| |
Distribution payable | | | 1,154,433 | |
| |
Investment advisory fees | | | 202,552 | |
| |
Distribution fees | | | 83,091 | |
| |
Shareholder service fees | | | 40,768 | |
| |
Trustees’ fees | | | 156,919 | |
| |
Other accrued expenses | | | 179,940 | |
| | | | |
Total liabilities | | | 98,246,610 | |
| | | | |
Net assets | | $ | 308,796,304 | |
| | | | |
| |
Net Assets | | | | |
| |
Paid-in capital — (unlimited shares authorized — $0.001 par value) | | $ | 293,973,218 | |
| |
Retained earnings | | | 14,823,086 | |
| | | | |
Net assets | | $ | 308,796,304 | |
| | | | |
| |
Class I: | | | | |
| |
Net asset value | | $ | 163,264,678 | |
| | | | |
Price per share (5,843,237 shares) | | $ | 27.94 | |
| | | | |
| |
Class T: | | | | |
| |
Net asset value | | $ | 21,446,747 | |
| | | | |
Price per share (774,564 shares) | | $ | 27.69 | |
| | | | |
| |
Class U: | | | | |
| |
Net asset value | | $ | 124,084,879 | |
| | | | |
Price per share (4,647,697 shares) | | $ | 26.70 | |
| | | | |
See accompanying notes to financial statements.
18
| | | | |
| |
Credit Opportunities Portfolio | | April 30, 2021 (Unaudited) |
| | | | |
Statement of Operations
For the Period Ended April 30, 2021 (Unaudited)
| | | | |
Investment income | | | | |
| |
Interest income | | $ | 6,660,346 | |
| |
Dividend income | | | 67,297 | |
| |
Other income | | | 281,583 | |
| | | | |
Total investment income | | | 7,009,226 | |
| | | | |
Expenses | | | | |
| |
Investment advisory fees | | | 737,273 | |
| |
Credit facility interest expense | | | 457,090 | |
| |
Offering Costs | | | 277,544 | |
| |
Legal fees | | | 179,106 | |
| |
Administration fees | | | 90,568 | |
| |
Term loan expense | | | 50,057 | |
| |
Audit and tax fees | | | 47,224 | |
| |
Trustees’ fees | | | 59,351 | |
| |
Transfer agent fees | | | 54,460 | |
| |
Shareholder service fees | | | 78,565 | |
| |
Distribution fees | | | 157,130 | |
| |
Shareholder reporting expense | | | 35,419 | |
| |
Custodian fees | | | 12,012 | |
| |
Other expenses | | | 107,021 | |
| | | | |
Total expenses prior to expense reimbursement | | | 2,342,820 | |
| |
Expense reimbursement | | | (536,415 | ) |
| | | | |
Net expenses | | | 1,806,405 | |
| | | | |
| |
Net investment income | | | 5,202,821 | |
| | | | |
| |
Realized and unrealized gain (loss) | | | | |
| |
Net realized gain (loss) on | | | | |
| |
Investments | | | 5,097,941 | |
| |
Foreign currency transactions | | | (51,782 | ) |
| | | | |
Net realized gain | | | 5,046,159 | |
| |
Net change in unrealized appreciation (depreciation) on | | | | |
| |
Investments | | | 5,300,146 | |
| |
Foreign currency translation | | | 95,468 | |
| |
Deferred Trustees’ fees | | | (27,488 | ) |
| | | | |
Net change in unrealized appreciation | | | 5,368,125 | |
| |
Net realized and unrealized gain | | | 10,414,285 | |
| | | | |
Net increase in net assets resulting from operations | | $ | 15,617,105 | |
| | | | |
See accompanying notes to financial statements.
19
| | | | |
| |
Credit Opportunities Portfolio | | April 30, 2021 (Unaudited) |
| | | | |
Statements of Changes in Net Assets
| | | | | | | | |
| | | Period Ended
April 30, 2021
(Unaudited) | | | Period Ended
October 31, 2020(1) | |
Increase (decrease) in net assets resulting from operations | | | | | | | | |
| | |
Net investment income | | $ | 5,202,821 | | | $ | 4,080,569 | |
| | |
Net realized gain | | | 5,046,159 | | | | 2,282,066 | |
| | |
Net change in unrealized appreciation | | | 5,368,125 | | | | 2,151,030 | |
| | | | | | | | |
Net increase in net assets resulting from operations | | | 15,617,105 | | | | 8,513,665 | |
| | | | | | | | |
| | |
Dividends to shareholders from | | | | | | | | |
| | |
Net dividend and distributions — Class I | | | (3,565,374 | ) | | | (4,076,334 | ) |
| | |
Net dividend and distributions — Class T | | | (380,378 | ) | | | (70,458 | ) |
| | |
Net dividend and distributions — Class U | | | (1,215,141 | ) | | | — | |
| | | | | | | | |
Total distributions | | | (5,160,893 | ) | | | (4,146,792 | ) |
| | | | | | | | |
| | |
Shareholder transactions | | | | | | | | |
Class I | | | | | | | | |
| | |
Subscriptions | | | 48,041,799 | | | | 102,640,250 | |
| | |
Issued to shareholder in reinvestment of distributions | | | 318,207 | | | | 769 | |
| | |
Shares redeemed | | | (130,979 | ) | | | — | |
| | | | | | | | |
| | | 48,229,027 | | | | 102,641,019 | |
| | | | | | | | |
Class T | | | | | | | | |
| | |
Subscriptions | | | 12,172,234 | | | | 8,164,260 | |
| | |
Issued to shareholder in reinvestment of distributions | | | 257,360 | | | | 32,833 | |
| | |
Shares redeemed | | | — | | | | — | |
| | | | | | | | |
| | | 12,429,594 | | | | 8,197,093 | |
| | | | | | | | |
Class U | | | | | | | | |
| | |
Subscriptions | | | 114,394,162 | | | | 7,421,000 | |
| | |
Issued to shareholder in reinvestment of distributions | | | 716,574 | | | | — | |
| | |
Shares redeemed | | | (55,250 | ) | | | — | |
| | | | | | | | |
| | | 115,055,486 | | | | 7,421,000 | |
| | | | | | | | |
Net increase in net assets | | | 186,170,319 | | | | 122,625,985 | |
| | |
Net assets | | | | | | | | |
| | |
Beginning of period | | | 122,625,985 | | | | — | |
| | | | | | | | |
End of period | | $ | 308,796,304 | | | $ | 122,625,985 | |
| | | | | | | | |
| (1) | The Fund commenced operations on February 28, 2020. |
See accompanying notes to financial statements.
20
| | | | |
| |
Credit Opportunities Portfolio | | April 30, 2021 (Unaudited) |
| | | | |
Statement of Cash Flows
| | | | |
| | | Period Ended
April 30, 2021
(Unaudited) | |
Cash Flows from Operating Activities: | | | | |
| |
Net increase in net assets resulting from operations | | $ | 15,617,106 | |
| |
Adjustments to reconcile net increase in net assets resulting from operations to net cash used in operating activities: | | | | |
| |
Purchases of investments | | | (309,121,784 | ) |
| |
Proceeds from sales of investments | | | 91,923,645 | |
| |
Net amortization (accretion) of premiums/discounts | | | (449,583 | ) |
| |
Net change in unrealized depreciation of investments | | | (5,300,146 | ) |
| |
Net change in unrealized appreciation on foreign currency translation | | | (95,468 | ) |
| |
Net change in unrealized appreciation on deferred Trustees’ fees | | | 27,488 | |
| |
Net realized gain from investments | | | (5,097,941 | ) |
| |
Net realized gain on investments (foreign currency related) | | | (198,464 | ) |
| |
Amortization of deferred financing costs | | | 86,215 | |
| |
Changes in assets and liabilities: | | | | |
| |
Increase in prepaid expenses | | | (143,012 | ) |
| |
Increase in receivable for investments sold | | | (223,456 | ) |
| |
Increase in dividends and interest receivable | | | (1,507,485 | ) |
| |
Decrease in due from Adviser | | | 93,693 | |
| |
Decrease in deferred offering costs | | | 277,543 | |
| |
Increase in investment advisory fees payable | | | 138,046 | |
| |
Increase in payable for investments purchased | | | 32,244,465 | |
| |
Increase in shareholder service fees | | | 40,768 | |
| |
Increase in distribution fees | | | 83,091 | |
| |
Increase in Trustees’ fees payable | | | 48,101 | |
| |
Decrease in accrued expenses and other liabilities | | | (299,946 | ) |
| | | | |
Net cash used in operating activities | | | (181,857,125 | ) |
| | | | |
Cash Flows from Financing Activities | | | | |
| |
Subscriptions for shares | | | 151,863,320 | |
| |
Cash dividends paid to shareholders, net of reinvestments | | | (3,368,917 | ) |
| |
Shares repurchased | | | (186,229 | ) |
| |
Proceeds from credit facility | | | 68,438,602 | |
| |
Paydown of credit facility | | | (17,000,000 | ) |
| | | | |
Net cash provided by financing activities | | | 199,746,776 | |
| | | | |
| |
Effect of exchange rate changes on cash | | | 9,953 | |
| | | | |
Net increase in cash and cash equivalents | | | 17,899,604 | |
| | | | |
| |
Cash and Cash Equivalents | | | | |
| |
Beginning balance | | | 3,333,913 | |
| | | | |
Ending balance | | $ | 21,233,517 | |
| | | | |
| |
Supplemental Disclosure of cash flow information and non-cash financing activities: | | | | |
| |
Cash paid for interest expense | | $ | 345,654 | |
| | | | |
See accompanying notes to financial statements.
21
| | | | |
| |
Credit Opportunities Portfolio | | April 30, 2021 (Unaudited) |
| | | | |
Financial Highlights
| | | | | | | | |
| | | Six Months
Ended
April 30, 2021
(Unaudited) | | | Period from
Commencement of
Operations to
October 31, 2020*** | |
Class I | | | | | | | | |
| | |
Per share operating performance | | | | | | | | |
| | |
Net asset value, beginning of period | | $ | 26.08 | | | $ | 25.00 | |
| | |
Income from operations | | | | | | | | |
| | |
Net investment income(1) | | | 0.77 | | | | 1.01 | |
| | |
Net realized and unrealized gain on investments, forward foreign currency contracts, foreign currency transactions and deferred Trustees’ fees | | | 1.86 | | | | 1.10 | |
| | | | | | | | |
Total income from operations | | | 2.63 | | | | 2.11 | |
| | |
Dividends from | | | | | | | | |
| | |
Net investment income | | | (0.77 | ) | | | (1.03 | ) |
| | | | | | | | |
Total dividends | | | (0.77 | ) | | | (1.03 | ) |
| | | | | | | | |
Net Asset Value, end of period | | $ | 27.94 | | | $ | 26.08 | |
| | | | | | | | |
Total return†(2) | | | 10.06% | | | | 8.71% | |
| | | | | | | | |
| | |
Ratios to average net assets** | | | | | | | | |
| | |
Expenses, before waiver | | | 2.27% | | | | 3.84% | |
| | |
Expenses, after waiver | | | 1.65% | | | | 1.68% | |
| | |
Net investment income, before waiver | | | 5.02% | | | | 3.91% | |
| | |
Net investment income, after waiver | | | 5.64% | | | | 6.06% | |
| | |
Supplemental data | | | | | | | | |
| | |
Net assets, end of period (000’s) | | $ | 163,265 | | | $ | 106,962 | |
| | |
Portfolio turnover rate(2)* | | | 38.88% | | | | 66.19% | |
| (1) | Per share calculations were performed using average shares. |
| (2) | Total return and Portfolio turnover rate are for the period indicated and have not been annualized. |
| † | Total return assumes a purchase of common stock at the net asset value on the first day and a sale at the net asset value on the last day of each period reported on the table. Total return assumes reinvestment of dividends and distributions at prices obtained pursuant to the Fund’s dividend reinvestment plan |
| * | Portfolio turnover is calculated on the basis of the Fund as a whole. |
| *** | The date of commencement of operations for Class I shares was February 28, 2020. |
See accompanying notes to financial statements.
22
| | | | |
| |
Credit Opportunities Portfolio | | April 30, 2021 (Unaudited) |
| | | | |
Financial Highlights
| | | | | | | | |
| | | Six Months
Ended
April 30, 2021
(Unaudited) | | | Period from
Commencement of
Operations to
October 31, 2020*** | |
Class T | | | | | | | | |
| | |
Per share operating performance | | | | | | | | |
| | |
Net asset value, beginning of period | | $ | 25.83 | | | $ | 25.00 | |
| | |
Income from operations | | | | | | | | |
| | |
Net investment income(1) | | | 0.66 | | | | 0.61 | |
| | |
Net realized and unrealized gain on investments, forward foreign currency contracts, foreign currency transactions and deferred Trustees’ fees | | | 1.85 | | | | 0.83 | |
| | | | | | | | |
Total income from operations | | | 2.51 | | | | 1.44 | |
| | |
Dividends from | | | | | | | | |
| | |
Net investment income | | | (0.65 | ) | | | (0.61 | ) |
| | | | | | | | |
Total dividends | | | (0.65 | ) | | | (0.61 | ) |
| | | | | | | | |
Net Asset Value, end of period | | $ | 27.69 | | | $ | 25.83 | |
| | | | | | | | |
Total return†(2) | | | 9.72% | | | | 6.65% | |
| | | | | | | | |
| | |
Ratios to average net assets** | | | | | | | | |
| | |
Expenses, before waiver | | | 2.96% | | | | 3.54% | |
| | |
Expenses, after waiver | | | 2.38% | | | | 2.49% | |
| | |
Net investment income, before waiver | | | 4.29% | | | | 4.65% | |
| | |
Net investment income, after waiver | | | 4.86% | | | | 5.70% | |
| | |
Supplemental data | | | | | | | | |
| | |
Net assets, end of period (000’s) | | $ | 21,447 | | | $ | 8,243 | |
| | |
Portfolio turnover rate(2)* | | | 38.88% | | | | 66.19% | |
| (1) | Per share calculations were performed using average shares. |
| (2) | Total return and Portfolio turnover rate are for the period indicated and have not been annualized. |
| † | Total return assumes a purchase of common stock at the net asset value on the first day and a sale at the net asset value on the last day of each period reported on the table. Total return assumes reinvestment of dividends and distributions at prices obtained pursuant to the Fund’s dividend reinvestment plan |
| * | Portfolio turnover is calculated on the basis of the Fund as a whole. |
| *** | The date of commencement of operations for Class T shares was June 1, 2020. |
See accompanying notes to financial statements.
23
| | | | |
| |
Credit Opportunities Portfolio | | April 30, 2021 (Unaudited) |
| | | | |
Financial Highlights
| | | | | | | | |
| | | Six Months
Ended
April 30, 2021
(Unaudited) | | | Period from
Commencement of
Operations to
October 31, 2020*** | |
Class U | | | | | | | | |
| | |
Per share operating performance | | | | | | | | |
| | |
Net asset value, beginning of period | | $ | 25.00 | | | $ | 25.00 | |
| | |
Income from operations | | | | | | | | |
| | |
Net investment income(1) | | | 0.65 | | | | — | |
| | |
Net realized and unrealized gain on investments, forward foreign currency contracts, foreign currency transactions and deferred Trustees’ fees | | | 1.05 | | | | — | |
| | | | | | | | |
Total income from operations | | | 1.70 | | | | — | |
| | |
Dividends from | | | | | | | | |
| | |
Net investment income | | | — | | | | — | |
| | | | | | | | |
Total dividends | | | — | | | | — | |
| | | | | | | | |
Net Asset Value, end of period | | $ | 26.70 | | | $ | 25.00 | |
| | | | | | | | |
Total return†(2) | | | 9.41% | | | | 0.00% | |
| | | | | | | | |
| | |
Ratios to average net assets** | | | | | | | | |
| | |
Expenses, before waiver | | | 2.66% | | | | 0.00% | |
| | |
Expenses, after waiver | | | 2.29% | | | | 0.00% | |
| | |
Net investment income, before waiver | | | 4.56% | | | | 0.00% | |
| | |
Net investment income, after waiver | | | 4.93% | | | | 0.00% | |
| | |
Supplemental data | | | | | | | | |
| | |
Net assets, end of period (000’s) | | $ | 124,085 | | | $ | 7,421 | |
| | |
Portfolio turnover rate(2)* | | | 38.88% | | | | 66.19% | |
| (1) | Per share calculations were performed using average shares. |
| (2) | Total return and Portfolio turnover rate are for the period indicated and have not been annualized. |
| † | Total return assumes a purchase of common stock at the net asset value on the first day and a sale at the net asset value on the last day of each period reported on the table. Total return assumes reinvestment of dividends and distributions at prices obtained pursuant to the Fund’s dividend reinvestment plan |
| * | Portfolio turnover is calculated on the basis of the Fund as a whole. |
| *** | The date of commencement of operations for Class U shares was September 1, 2020. |
See accompanying notes to financial statements.
24
| | | | |
| |
Credit Opportunities Portfolio | | April 30, 2021 (Unaudited) |
| | | | |
Notes to Financial Statements
KKR Credit Opportunities Portfolio (the “Fund”) was formed on September 5, 2019 as a statutory trust under the laws of the state of Delaware. The Fund is a closed-end registered management investment company that continuously offers its shares and operates as an “interval fund.” The Fund seeks to provide attractive risk-adjusted returns and generate current income. The Fund is diversified for purposes of the Investment Company Act of 1940, as amended (the “1940 Act”). The Fund commenced operations on February 28, 2020. KKR Credit Advisors (US) LLC serves as the Fund’s investment adviser (the “Adviser”).
As of April 30, 2021, an affiliate of the Adviser owned 35.5% of the outstanding shares of the Fund.
| 2. | Summary of Significant Accounting Policies |
Basis of Presentation — The accompanying financial statements are presented in accordance with accounting principles generally accepted in the United States of America (“GAAP”) and are stated in United States (“U.S.”) dollars. The Fund is an investment company following accounting and reporting guidance in Financial Accounting Standards Board (“FASB”) Accounting Standards Codification (“ASC”) Topic 946, Financial Services — Investment Companies (“ASC Topic 946”). The preparation of financial statements in conformity with GAAP requires management to make estimates and assumptions that affect the reported amounts and disclosures in these financial statements. Actual results could differ from those estimates.
Valuation of Investments — The Board of Trustees (the “Board”) of the Fund has adopted valuation policies and procedures to ensure investments are valued in a manner consistent with GAAP as required by the 1940 Act. The Board has delegated primary responsibility in ensuring these valuation policies and procedures are followed, including those relating to fair valuation, to the Adviser.
Fair value is the price that would be received to sell an asset or paid to transfer a liability in an orderly transaction between market participants at the measurement date. Where available, fair value is based on observable market prices or parameters, or derived from such prices or parameters. Where observable prices or inputs are not available, valuation models are applied. These valuation techniques involve some level of management estimation and judgment, the degree of which is dependent on the price transparency for the instruments or market and the instruments’ complexity for disclosure purposes.
Assets and liabilities recorded at fair value on the Statement of Assets and Liabilities are categorized based upon the level of judgment associated with the inputs used to measure their value. Hierarchical levels, as defined under GAAP, are directly related to the amount of subjectivity associated with the inputs to fair valuations of these assets and liabilities, and are as follows:
Level 1 — Inputs are unadjusted, quoted prices in active markets for identical assets or liabilities at the measurement date.
The types of assets generally included in this category are common stocks listed in active markets.
Level 2 — Inputs other than quoted prices included in Level 1 that are observable for the asset or liability, either directly or indirectly. Level 2 inputs include quoted prices for similar instruments in active markets, and inputs other than quoted prices that are observable for the asset or liability.
The types of assets and liabilities generally included in this category are high yield securities and certain leveraged loans.
25
| | | | |
| |
Credit Opportunities Portfolio | | April 30, 2021 (Unaudited) |
| | | | |
Level 3 — Inputs are unobservable for the asset or liability, and include situations where there is little, if any, market activity for the asset or liability.
The types of assets generally included in this category are certain leveraged loans, common stocks not actively traded and preferred stocks not actively traded.
A significant decrease in the volume and level of activity for the asset or liability is an indication that transactions or quoted prices may not be representative of fair value because in such market conditions there may be increased instances of transactions that are not orderly. In those circumstances, further analysis of transactions or quoted prices is needed, and a significant adjustment to the transactions or quoted prices may be necessary to estimate fair value.
The availability of observable inputs can vary depending on the financial asset or liability and is affected by a wide variety of factors, including, for example, the type of product, whether the product is new, whether the product is traded on an active exchange or in the secondary market, and the current market condition. To the extent that valuation is based on models or inputs that are less observable or unobservable in the market, the determination of fair value requires more judgment. Accordingly, the degree of judgment exercised by the Fund in determining fair value is greatest for instruments categorized in Level 3. In certain cases, the inputs used to measure fair value may fall into different levels of the fair value hierarchy. In such cases, for disclosure purposes, the level in the fair value hierarchy within which the fair value measurement in its entirety falls is determined based on the lowest level input that is significant to the fair value measurement in its entirety. The Fund’s assessment of the significance of a particular input to the fair value measurement in its entirety requires judgment and consideration of factors specific to the asset. The variability of the observable inputs affected by the factors described above may cause transfers between Levels 1, 2 and/or 3, which the Fund recognizes at the beginning of the period the inputs change.
Many financial assets and liabilities have bid and ask prices that can be observed in the marketplace. Bid prices reflect the highest price that the Fund and others are willing to pay for an asset. Ask prices represent the lowest price that the Fund and others are willing to accept for an asset. For financial assets and liabilities whose inputs are based on bid-ask prices, the Fund does not require that fair value always be a predetermined point in the bid- ask range. The Fund’s policy is to allow for mid-market pricing and adjust to the point within the bid-ask range that meets the Fund’s best estimate of fair value.
Depending on the relative liquidity in the markets for certain assets, the Fund may transfer assets to Level 3 if it determines that observable quoted prices, obtained directly or indirectly, are not available.
Investments are generally valued based on quotations from third party pricing services, unless such a quotation is unavailable or is determined to be unreliable or inadequately representing the fair value of the particular assets. In that case, valuations are based on either valuation data obtained from one or more other third party pricing sources, including broker dealers selected by the Adviser, or will reflect the Valuation Committee’s good faith determination of fair value based on other factors considered relevant. For assets classified as Level 3, valuations are based on various factors including of financial and operating data of the company, company specific developments, market valuations of comparable companies and model projections.
For the six months ended April 30, 2021, there have been no significant changes to the Fund’s fair value methodologies.
Investment Transactions — Investment transactions are accounted for on the trade date, the date the order to buy or sell is executed. Amortization and accretion is calculated using the effective interest method over the holding period of the investment. Realized gains and losses are calculated on the specific identified cost basis.
Cash and Cash Equivalents — Cash and cash equivalents includes cash on hand, cash held in banks and highly liquid investments with original maturities of three or fewer months. Cash equivalents consist solely of money market funds with financial institutions. As of April 30, 2021, the Fund was invested in the U.S. Bank Money Market Deposit Account.
26
| | | | |
| |
Credit Opportunities Portfolio | | April 30, 2021 (Unaudited) |
| | | | |
Foreign Currency Transactions — The books and records of the Fund are maintained in U.S. Dollars. All investments denominated in foreign currency are converted to the U.S. dollar using prevailing exchange rates at the end of the reporting period. Income, expenses, gains and losses on investments denominated in foreign currency are converted to the U.S. dollar using the prevailing exchange rates on the dates when the transactions occurred.
The Fund bifurcates that portion of the results of operations resulting from changes in foreign exchange rates on investments and interest from the fluctuations arising from changes in market prices of securities held.
Distributions to Shareholders — Distributions are accrued and declared daily and paid monthly and distributable net realized capital gains, if any, are declared and distributed at least annually.
Term Loan Income — Term Loan Income consists of transaction fees including, but not limited to, delayed compensation, assignment, transfer, administration and amendment fees. Fee and other income is recorded when earned, and is recognized in Other income on the Statement of Operations.
Income Taxes — The Fund has elected to be treated and has qualified, and intends to continue to qualify in each taxable year, as a “regulated investment company” under Subchapter M of the Internal Revenue Code of 1986, as amended, and in conformity with the Regulated Investment Company Modernization Act of 2010. The Fund will not be subject to federal income tax to the extent the Fund satisfies the requirements under Section 851 of the Internal Revenue Code, including distributing all of its gross investment company taxable income and capital gains to its shareholders based on the Fund’s fiscal year end of October 31.
To avoid imposition of a 4% excise tax on undistributed income applicable to regulated investment companies, the Fund intends to declare each year as dividends in each calendar year at least 98.0% of its net investment income (earned during the calendar year) and 98.2% of its net realized capital gains (earned during the twelve months ended October 31) plus undistributed amounts, if any, from prior years.
The Fund evaluates tax positions taken or expected to be taken in the course of preparing the Fund’s tax returns to determine whether it is “more-likely than-not” (i.e., greater than 50-percent) that each tax position will be sustained upon examination by a taxing authority based on the technical merits of the position. Tax positions not deemed to meet the more-likely-than-not threshold are recorded as a tax benefit or expense in the current year. Management has analyzed the Fund’s tax positions and has concluded that no liability for unrecognized tax benefits should be recorded related to uncertain tax positions for the open tax years (2020). However, management’s conclusions regarding tax positions taken may be subject to review and adjustment at a later date based on factors including, but not limited to, examination by tax authorities, on-going analysis of and changes to tax laws, regulations and interpretations thereof.
As of April 30, 2021, the Fund did not have a liability for any unrecognized tax benefits. The Fund recognizes interest and penalties, if any, related to unrecognized tax benefits as income tax expense in the Statement of Operations.
Repurchase Offers — The Fund operates as an interval fund pursuant to Rule 23c-3 under the 1940 Act and, as such, has adopted a fundamental policy to make quarterly repurchase offers, at NAV, of no less than 10% and no more than 25% of the Fund’s shares outstanding on the Repurchase Request Deadline (as defined below). There is no guarantee that shareholders will be able to sell all of the shares they desire to sell in a quarterly repurchase offer, although each shareholder will have the right to require the Fund to purchase at least 10% of such shareholder’s shares in each quarterly repurchase. Liquidity will be provided to shareholders only through the Fund’s quarterly repurchases. Shareholders will be notified in writing of each quarterly repurchase offer and the date the repurchase offer ends (the “Repurchase Request Deadline”).
Offering Costs — Offering costs include registration fees and legal fees regarding the preparation of the initial registration statement. Offering costs are accounted for as deferred costs until operations begin. Offering costs are then amortized over the first twelve months of operations on a straight-line basis. The total amount of the offering costs incurred by the Fund was $847,560 as of April 30, 2021.
27
| | | | |
| |
Credit Opportunities Portfolio | | April 30, 2021 (Unaudited) |
| | | | |
The Fund invests mainly in leveraged loans, high yield securities, common stocks not actively traded and preferred stocks. These investments may involve certain risks, including, but not limited to, those described below:
COVID-19 and Global Economic and Market Conditions – The novel strain of coronavirus (“COVID-19”) has caused, and continues to cause, severe disruptions to the U.S. and global economies. The outbreak of COVID-19 and the actions taken in response have had far reaching impact on the U.S. and global economies, contributing to significant volatility in the financial markets, resulting in increased volatility in equity prices and lower interest rates, and causing furloughs and layoffs in the labor market. Although a number of vaccines for COVID-19 have been developed and are in the process of being deployed in certain countries, including the United States, the timing for widespread vaccination and immunity is uncertain, and these vaccines may be less effective against any new mutated strains of the virus that have started to spread globally.
Given the ongoing nature of the pandemic, at this time management cannot reasonably predict the magnitude of the ultimate impact that COVID-19 will have on the Fund’s business, financial performance and operating results. Management believes COVID-19’s adverse impact on the Fund’s business, financial performance and operating results will be significantly driven by a number of factors that management is unable to predict or control, including, for example: the severity and duration of the pandemic; the pandemic’s impact on the U.S. and global economies; the timing, scope and effectiveness of additional governmental responses to the pandemic; the timing and speed of economic recovery, including the availability and distribution of treatments and vaccines for COVID-19; and the negative impact on investors, vendors and other business partners that may indirectly adversely affect the Fund.
Market Discount Risk — The price of the Fund’s common shares of beneficial interest will fluctuate with market conditions and other factors. Shares of closed-end management investment companies frequently trade at a discount from their net asset value, which may increase the risk of loss.
Leverage Risk — Leverage is a speculative technique that may expose the Fund to greater risk and increased costs. When leverage is used, the net asset value and market price of the Fund’s shares and the Fund’s investment return will likely be more volatile.
Market Risk — Bond markets rise and fall daily. As with any investment with performance tied to these markets, the value of an investment in the Fund will fluctuate, which means that shareholders could lose money.
Interest Rate Risk — Interest rates will rise and fall over time. During periods when interest rates are low, the Fund’s yield and total return also may be low. Changes in interest rates also may affect the Fund’s share price and a sharp rise in interest rates could cause the Fund’s share price to fall. The longer the Fund’s duration, the more sensitive to interest rate movements its share price is likely to be.
Credit Risk — The Fund is subject to the risk that a decline in the credit quality of an investment could cause the Fund to lose money or underperform. The Fund could lose money if the issuer or guarantor of an investment fails to make timely principal or interest payments or otherwise honor its obligations. The Fund will be subject to credit risk with respect to the counterparties of derivative contracts (whether a clearing corporation in the case of exchange-traded instruments or another third party in the case of over-the-counter instruments) and other instruments entered into directly by the Fund.
Liquidity Risk — A particular investment may be difficult to purchase or sell. The Fund may be unable to sell illiquid securities at an advantageous time or price.
Prepayment and Extension Risk — The Fund’s investments are subject to the risk that the investments may be paid off earlier or later than expected. Either situation could cause the Fund to hold investments paying lower than market rates of interest, which could hurt the Fund’s yield or share price.
28
| | | | |
| |
Credit Opportunities Portfolio | | April 30, 2021 (Unaudited) |
| | | | |
High Yield Risk — High yield securities and unrated securities of similar credit quality (sometimes called junk bonds) that the Fund may invest in are subject to greater levels of credit and liquidity risks. High yield securities are considered primarily speculative with respect to the issuer’s continuing ability to make principal and interest payments.
Foreign Investment Risk — The Fund’s investments in securities of foreign issuers may involve certain risks that are greater than those associated with investments in securities of U.S. issuers. These include risks of adverse changes in foreign economic, political, regulatory and other conditions; changes in currency exchange rates (the currencies will decline in value relative to the U.S. dollar or, in the case of hedging positions, the U.S. dollar will decline in value relative to the currency being hedged) or exchange control regulations (including limitations on currency movements and exchanges); differing accounting, auditing, financial reporting and legal standards and practices; differing securities market structures; and higher transaction costs. These risks may be heightened in connection with investments in emerging markets.
Issuer Risk — The value of securities may decline for a number of reasons that directly relate to the issuer, such as its financial strength, management performance, financial leverage and reduced demand for the issuer’s goods and services, as well as the historical and prospective earnings of the issuer and the value of its assets.
Investment Advisory Agreement — The Adviser provides day-to-day portfolio management services to the Fund and has discretion to purchase and sell investments in accordance with the Fund’s objectives, policies, and restrictions. For the services it provides to the Fund, the Adviser receives an annual fee, payable monthly by the Fund, in an amount equal to 1.30% of the Fund’s average daily Managed Assets (the “Investment Advisory Fee”). The Adviser has voluntarily agreed to temporarily reduce its Investment Advisory Fee to an annual rate of 0.65% of the Fund’s average daily Managed Assets from March 1, 2020, until June 30, 2021, and an annual rate of 1.00% from July 1, 2021 until December 31, 2021. Effective January 1, 2022, the Adviser’s agreement to temporarily reduce its Investment Advisory Fee will terminate and the Adviser will receive an Investment Advisory Fee at an annual rate of 1.30% of the Fund’s average daily Managed Assets. The foregoing fee schedule may be extended, terminated or modified by the Adviser in its sole discretion and at any time, including prior to any such date listed above. “Managed Assets” means the total assets of the Fund (including any assets attributable to borrowings for investment purposes) minus the sum of the Fund’s accrued liabilities (other than liabilities representing borrowings for investment purposes).
During periods when the Fund is using leverage, the Investment Advisory Fee paid to the Adviser will be higher than if the Fund did not use leverage because the Investment Advisory Fee paid is calculated based on the Fund’s Managed Assets, which includes the assets purchased through leverage.
During the six months ended April 30, 2021 the Adviser earned an Investment Advisory Fee of $737,273.
The Fund has entered into an Expense Limitation and Reimbursement Agreement (the “Expense Limitation Agreement”) with the Adviser pursuant to which the Advisor will agree to waive its monthly fee and pay, absorb or reimburse some or all the Fund’s “Specified Expenses” (as defined below), an “Expense Limitation Payment”, for each month during the Limitation Period (as defined below) to the extent necessary so that, for any fiscal year, the Fund’s Specified Expenses do not exceed 0.40% of the average daily value of the Fund’s net assets. “Specified Expenses” of the Fund means all expenses incurred in the business of the Fund, including organizational and operating expenses, with the exception of: (i) the Management Fee (as defined in the Fund’s prospectus), (ii) the Service Fee (as defined in the Fund’s prospectus), (iii) the Distribution Fee (as defined in the Fund’s prospectus), (iv) brokerage costs, (v) dividend/interest payments (including any dividend payments, interest expenses, commitment fees, or other expenses related to any leverage incurred by the Fund), (vi) taxes, and (vii) extraordinary expenses (as determined in the sole discretion of the Adviser). The “Limitation Period” commenced on February 28, 2020 and ends on December 31, 2022. The Fund will agree to repay these amounts (“Reimbursement Payment”) on a monthly basis, but only if and to the extent that Specified Expenses plus the Reimbursement Payment are less than 0.40% of the average daily value of the Fund’s net assets during the fiscal
29
| | | | |
| |
Credit Opportunities Portfolio | | April 30, 2021 (Unaudited) |
| | | | |
year (or, if a lower expense limit is then in effect, such lower limit). The Fund’s obligation to make Reimbursement Payments expires three years from the end of the fiscal year in which such fees are foregone or expense is incurred by the Adviser.
The Expense Limitation Agreement terminates at the end of the Limitation Period, but may be renewed by the mutual agreement of the Adviser and the Fund for successive terms.
As of April 30, 2021, the amount of Expense Limitation Payments since the inception of the Fund provided by the Adviser is $1,985,277. The Fund’s management believes that Reimbursement Payments are not probable as of April 30, 2021.
The following table reflects the Expense Support Payments that may become subject to reimbursement:
| | | | | | | | |
For the period ended | | Amount of Expense
Limitation Payment | | | Eligible for
Reimbursement
Payment through | |
| | |
October 31, 2020 | | $ | 1,448,862 | | | | October 31, 2023 | |
| | |
April 30, 2021 | | | 536,415 | | | | October 31, 2024 | |
| | | | | | | | |
| | |
| | $ | 1,985,277 | | | | | |
| | | | | | | | |
KKR Capital Markets LLC (the “Distributor”), an affiliate of the Adviser, is the principal underwriter and distributor of the Shares and serves in that capacity on a best effort basis, subject to various conditions. Shares will be offered through other brokers, dealers and other financial intermediaries (referred to as “selling agents”) that have entered into selling agreements with the Distributor. Selling agents typically receive the sales load with respect to Class T Shares purchased by their clients. The Distributor does not retain any portion of the sales load. Class T Shares are sold subject to a maximum sales load of up to 2.00% of the offering price. However, purchases of Class T Shares may be eligible for a sales load discount. The selling agents may, in their sole discretion, reduce or waive the sales load on a non-scheduled basis in individual cases. Class I Shares and Class U Shares are not subject to a sales load; however, investors could be required to pay brokerage commissions on purchases and sales of Class I Shares and Class U Shares to their selling agents.
The Fund pays the Distributor an ongoing fee (the “Shareholder Servicing Fee”) that is calculated and accrued monthly at an annualized rate of 0.25% of the net assets of the Fund attributable to Class T Shares and Class U Shares. The Shareholder Servicing Fee is for personal services provided to Shareholders and/or the maintenance of Shareholder accounts services and to reimburse the Distributor for related expenses incurred. The Distributor will generally pay all or a portion of the Shareholder Servicing Fee to the selling agents that sell Class T Shares and Class U Shares. Payment of the Shareholder Servicing Fee is governed by the Fund’s Distribution and Service Plan. During the six months ended April 30, 2021, the Fund incurred shareholder servicing fees of $78,565.
In addition, the Fund pays the Distributor an ongoing distribution fee (the “Distribution Fee”) that is calculated and accrued monthly at an annualized rate of 0.50% of the net assets of the Fund attributable to Class T Shares and Class U Shares. The Distribution Fee is for the sale and marketing of the Class T Shares and Class U Shares and to reimburse the Distributor for related expenses incurred. The Distributor will generally pay all or a portion of the Distribution Fee to the selling agents that sell Class T Shares and Class U Shares. During the six months ended April 30, 2021, the Fund incurred distribution fees of $157,130.
Payment of the Distribution Fee is governed by the Fund’s Distribution and Service Plan.
Class I Shares do not incur a Shareholder Servicing Fee or Distribution Fee.
Administrator, Custodian and Transfer Agent — U.S. Bancorp Fund Services, LLC (“Fund Services” or “Administrator”), doing business as U.S. Bank Global Fund Services, serves as the Fund’s Administrator pursuant to an administration agreement under which the Administrator provides administrative and accounting services.
30
| | | | |
| |
Credit Opportunities Portfolio | | April 30, 2021 (Unaudited) |
| | | | |
U.S. Bank N.A. (the “Custodian”) serves as the Fund’s custodian pursuant to a custody agreement. The Custodian is an affiliate of Fund Services.
Fund Services serves as the Fund’s transfer agent pursuant to a transfer agency agreement.
Deferred Trustees’ Compensation — The Fund has a Deferred Trustees’ Compensation plan (the “Plan”) that allows the Independent Trustees to defer compensation to a future payment period. The compensation is invested in shares of the Fund. The value of a participating Independent Trustee’s deferral account is based on the shares of deferred amounts as designated by the participating Independent Trustees. Changes in the value of the Independent Trustees’ deferral account are included in the Statement of Operations. The accrued obligations under the Plan, including unrealized appreciation (depreciation), are included on the Statement of Assets and Liabilities.
Other — Certain officers of the Fund are also officers of the Adviser. Such officers are paid no fees by the Fund for serving as officers of the Fund.
The following table presents information about the Fund’s assets measured at fair value on a recurring basis as of April 30, 2021, and indicates the fair value hierarchy of the inputs utilized by the Fund to determine such fair value:
| | | | | | | | | | | | | | | | |
| Investments in securities | | Level 1 | | | Level 2 | | | Level 3 | | | Total | |
| | | | |
Leveraged loans | | $ | — | | | $ | 167,238,248 | | | $ | 725,093 | | | $ | 167,963,341 | |
| | | | |
High yield securities | | | — | | | | 172,545,470 | | | | — | | | | 172,545,470 | |
| | | | |
Collateralized loan obligations | | | — | | | | — | | | | 761,294 | | | | 761,294 | |
| | | | |
Common stocks | | | 1,797,863 | | | | — | | | | 278,311 | | | | 2,076,174 | |
| | | | |
ETF | | | 6,345,570 | | | | — | | | | — | | | | 6,345,570 | |
| | | | |
Cash equivalents | | | 18,867,096 | | | | — | | | | — | | | | 18,867,096 | |
| | | | | | | | | | | | | | | | |
Total investments in securities and cash equivalents | | $ | 27,010,529 | | | $ | 339,783,718 | | | $ | 1,764,698 | | | $ | 368,558,945 | |
The following are the details of the restricted securities held by the Fund:
| | | | | | | | | | | | | | | | | | | | | | |
Issuer(1) | | Par/Shares | | | Acquisition date(s) | | | Amortized
Cost | | | Value | | | | | % of Net
Assets | |
| | | | | | |
Belk, Inc., TL 1L 02/21 (FLFO) | | | 53,180 | | | | 02/24/21 | | | | 79,800 | | | | 53,357 | | | | | | 0.0% | |
| | | | | | |
Belk, Inc., TL 1L EXIT 02/21 PIK Toggle (FLSO) | | | 893,545 | | | | 02/24/21 | | | | 721,988 | | | | 581,921 | | | | | | 0.2% | |
| | | | | | |
Coty Inc., TL 1L 04/18 | | | 45,703 | | | | 05/01/20 | | | | 34,217 | | | | 54,158 | | | | | | 0.0% | |
| | | | | | |
Coty Inc., TL 1L B 03/18 | | | 30,508 | | | | 04/06/20 | | | | 27,845 | | | | 35,468 | | | | | | 0.0% | |
| | | | | | |
Coty Inc., TL 1L B 04/18 | | | 715,844 | | |
| 04/09/20 -
05/05/20 |
| | | 630,746 | | | | 688,441 | | | | | | 0.2% | |
| | | | | | |
CSM Bakery Products, TL 2L 07/13 | | | 786,923 | | |
| 02/28/20 -
03/11/21 |
| | | 783,596 | | | | 780,203 | | | | | | 0.3% | |
| | | | | | |
Douglas Holding AG | | | 6,393,000 | | | | 03/26/21 | | | | 7,543,452 | | | | 7,741,089 | | | | | | 2.5% | |
| | | | | | |
Douglas Holding AG | | | 4,260,000 | | | | 03/26/21 | | | | 5,026,608 | | | | 5,131,518 | | | | | | 1.7% | |
| | | | | | |
Douglas Holding AG, TL 1L B 03/21 | | | 280,240 | | | | 03/26/21 | | | | 327,364 | | | | 334,696 | | | | | | 0.1% | |
| | | | | | |
Foresight Energy LLC | | | 17,979 | | |
| 06/30/20 -
08/28/20 |
| | | 199,869 | | | | 258,511 | | | | | | 0.1% | |
31
| | | | |
| |
Credit Opportunities Portfolio | | April 30, 2021 (Unaudited) |
| | | | |
| | | | | | | | | | | | | | | | | | | | | | |
Issuer(1) | | Par/Shares | | | Acquisition date(s) | | | Amortized
Cost | | | Value | | | | | % of Net
Assets | |
| | | | | | |
Foresight Energy LLC, TL 1L A 06/20 (Exit) | | | 149,655 | | | | 06/30/20 | | | | 149,655 | | | | 149,655 | | | | | | 0.0% | |
| | | | | | |
Monitronics International, Inc., TL 1L EXIT 08/19 | | | 536,196 | | | | 02/28/20 | | | | 465,618 | | | | 527,386 | | | | | | 0.2% | |
| | | | | | |
Radius Health, Inc. | | | 326,000 | | |
| 09/24/20 -
09/28/20 |
| | | 273,551 | | | | 313,922 | | | | | | 0.1% | |
| | | | | | |
Solera, LLC | | | 3,196,000 | | | | 04/15/21 | | | | 3,294,837 | | | | 3,297,888 | | | | | | 1.1% | |
| | | | | | |
Steinhoff, TL 1L 07/19 (SFH Super Senior) | | | 9,938 | | |
| 02/28/20 -
12/31/20 |
| | | 11,076 | | | | 12,207 | | | | | | 0.0% | |
| | | | | | |
Steinhoff, TL 1L 08/19 (SFH A1) | | | 668,072 | | |
| 02/28/20 -
12/31/20 |
| | | 575,804 | | | | 631,309 | | | | | | 0.2% | |
| | | | | | |
Wheel Pros, Inc. | | | 1,197,000 | | | | 04/23/21 | | | | 1,197,000 | | | | 1,201,620 | | | | | | 0.4% | |
| | | | | | |
Wheel Pros, Inc., TL 1L B 11/20 | | | 1,198,413 | | |
| 11/06/20 -
02/12/21 |
| | | 1,183,718 | | | | 1,199,162 | | | | | | 0.4% | |
| (1) | Refer to the Schedule of Investments for more details on securities listed. |
The following is a reconciliation of the investments in which significant unobservable inputs (Level 3) were used in determining value: There were no transfers in or out of level 3.
| | | | | | | | | | | | |
| | | Leveraged
Loans | | | Collateralized Debt
Obligation | | | Common
Stock | |
| | | |
Balance at October 31, 2020 | | $ | 683,566 | | | $ | 1,365,802 | | | $ | 305,554 | |
| | | |
Purchases | | | 41,533 | | | | — | | | | — | |
| | | |
Sales and paydowns | | | (19,138 | ) | | | — | | | | (14,624 | ) |
| | | |
Settlements | | | 1,247 | | | | (674,349 | ) | | | — | |
| | | |
Net change in appreciation/(depreciation) | | | 17,527 | | | | (4,171 | ) | | | 69,042 | |
| | | |
Net realized gain/(loss) | | | 358 | | | | 74,011 | | | | (81,661 | ) |
| | | | | | | | | | | | |
| | | |
Balance as of April 30, 2021 | | $ | 725,093 | | | $ | 761,294 | | | $ | 278,311 | |
| | | | | | | | | | | | |
| | | |
Net change in appreciation/(depreciation) on investments held at April 30, 2021 | | $ | 17,527 | | | $ | (4,171 | ) | | $ | 69,042 | |
| | | | | | | | | | | | |
32
| | | | |
| |
Credit Opportunities Portfolio | | April 30, 2021 (Unaudited) |
| | | | |
The following table presents additional information about valuation techniques and inputs used for investments that are measured at fair value and categorized within Level 3 as of April 30, 2021:
| | | | | | | | | | | | |
| Financial Asset | | Fair Value | | | Valuation Technique(1) | | Unobservable Inputs(2) | | Range
(Weighted
Average)(3) | |
| | | | |
Leveraged Loans | | $ | 725,093 | | | Yield Analysis | | Yield | | | 7% - 10% (9%) | |
| | | | | | | | Discount Margin | | | 3% | |
| | | | | | | | EBITDA Multiple | | | 2.8x - 11.2x (8.4x) | |
| | | | | | | | | Net Leverage | | | 0.7x - 11.0x (6.4x) | |
| | | | |
CLO Notes | | $ | 761,294 | | | Yield analysis | | Discount margin | | | 5% - 7% (11%) | |
| | | | | | Discounted cash flows | | Probability of default | | | 2% | |
| | | | | | | | | Constant prepayment rate | | | 20% | |
| | | | |
Common Stocks(4) | | $ | 278,311 | | | Market comparables | | FWD EBITDA Multple | | | 2.8x | |
| | | | | | | | Illiquidity Discount | | | 10% | |
| (1) | For the assets that have more than one valuation technique, the Fund may rely on the techniques individually or in aggregate based on a weight ascribed to each one ranging from 0-100%. When determining the weighting ascribed to each valuation methodology, the Fund considers, among other factors, the availability of direct market comparables, the applicability of a discounted cash flow analysis and the expected hold period and manner of realization for the investment. These factors can result in different weightings among the investments and in certain instances, may result in up to a 100% weighting to a single methodology. |
| (2) | The significant unobservable inputs used in the fair value measurement of the Fund’s assets and liabilities may include the last twelve months (“LTM”) EBITDA multiple, weighted average cost of capital, discount margin, probability of default, loss severity and constant prepayment rate. In determining certain of these inputs, management evaluates a variety of factors including economic, industry and market trends and developments, market valuations of comparable companies, and company specific developments including potential exit strategies and realization opportunities. Significant increases or decreases in any of these inputs in isolation could result in significantly lower or higher fair value measurement. |
| (3) | Weighted average amounts are based on the estimated fair values. |
| (4) | Of the total $278,311 of common stocks, $258,511 and $19,800 were valued solely on an appraisal based on market comparables and discounted cash flows analysis, respectively. |
| 6. | Investment Transactions |
The cost of investments purchased and the proceeds from the sale of investments, other than short-term investments, for the six months ended April 30, 2021 were as follows:
| | | | |
Purchases | | $ | 309,121,784 | |
| |
Sales | | $ | 91,923,645 | |
There were no purchases or sales of U.S. Government securities.
As a fundamental policy, which may not be changed without shareholder approval, the Fund offers shareholders the opportunity to request the repurchase of their shares on a quarterly basis. The Fund is required to offer to repurchase not less than 10% of its outstanding shares with each repurchase offer and under normal market conditions, the Board expects to authorize a 10% offer (“Repurchase Offer). The Fund may not offer to repurchase more than 25% of its outstanding shares during any offer. Quarterly repurchases will occur in the months of January, April, July and October.
33
| | | | |
| |
Credit Opportunities Portfolio | | April 30, 2021 (Unaudited) |
| | | | |
The time and dates by which Repurchase Offers must be received in good order (“Repurchase Request Deadline”) are generally 4:00 p.m. Eastern time on the first Friday of the month in which the repurchase occurs. The repurchase price will be the Fund’s NAV determined on the repurchase pricing date, which will be a date not more than 14 calendar days following the Repurchase Request Deadline (“Repurchase Pricing Date”). Payment for all shares repurchased pursuant to these offers will be made not later than seven calendar days after the repurchase pricing date (“Repurchase Payment Deadline”). Under normal circumstances, it is expected that the Repurchase Request Deadline will be the same date as the repurchase pricing date. If the tendered shares have been purchased immediately prior to the tender, the Fund will not release repurchase proceeds until payment for the tendered shares has settled.
If more shares are tendered for repurchase than the Fund has offered to repurchase, the Board may, but is not obligated to, increase the number of shares to be repurchased by up to 2% of the shares outstanding on the Repurchase Request Deadline. If there are still more shares tendered than are offered for repurchase, shares will be repurchased on a pro rata basis.
During the six months ended April 30, 2021, the Fund completed two quarterly repurchase offers. In these offers, the Fund offered to repurchase no less than 10% of the number of its outstanding shares as of the Repurchase Pricing Dates. The result of the repurchase offers were as follows:
| | | | | | | | | | | | | | | | | | | | |
Repurchase
Request Deadline | | Percentage of
Outstanding
Shares the
Fund Offered
to Repurchase(1) | | | Repurchase
Pricing Date | | Pricing
Date NAV | | Amount
Repurchased | | | Number of
Shares
Repurchased
(all classes) | | | Percentage of
Outstanding
Shares
Repurchased | |
| | | | | | |
January 15, 2021 | | | 10 | % | | December 9, 2020 | | $27.22 | | | — | | | | — | | | | 0.00 | % |
| | | | | | |
April 9, 2021 | | | 10 | % | | March 3, 2021 | | $27.29 | | $ | 186,228 | | | | 6,762.035 | | | | 0.07 | % |
| (1) | If total repurchase request exceeds 5% of the Fund’s outstanding shares, the Fund may increase the number of shares that it is offering to repurchase by up to an additional 2% of its total outstanding shares. |
| 8. | Commitments and Contingencies |
The Fund may enter into certain credit agreements, of which all or a portion may be unfunded. These commitments are disclosed in the accompanying Schedule of Investments. The Fund will maintain sufficient liquidity to fund these commitments at the borrower’s discretion.
Under the Fund’s organizational documents, its officers and Trustees are indemnified against certain liabilities arising out of the performance of their duties to the Fund. In the normal course of business, the Fund enters into contracts that contain a variety of representations that provide general indemnifications. The Fund’s maximum liability exposure under these arrangements is unknown, as future claims that have not yet occurred may be made against the Fund. However, based on experience, management expects the risk of loss to be remote.
The timing and characterization of certain income, capital gains, and return of capital distributions are determined annually in accordance with federal tax regulations, which may differ from GAAP. As a result, the net investment income (loss) and net realized gain (loss) on investment transactions for a reporting period may differ significantly from distributions during such period. These book/tax differences may be temporary or permanent in nature. To the extent these differences are permanent, they are charged or credited to paid-in capital, accumulated net investment income/loss or accumulated net realized gain/loss, as appropriate, in the period in which the differences arise.
34
| | | | |
| |
Credit Opportunities Portfolio | | April 30, 2021 (Unaudited) |
| | | | |
As of October 31, 2020, the Fund’s most recent fiscal year end, the following permanent differences have been reclassified (to)/from the following accounts:
| | | | | | | | | | |
Undistributed Net Investment Loss | | | Accumulated Net Realized Gain | | | Paid-in Capital | |
| | |
| $ | (159,874 | ) | | $ | 159,874 | | | | — | |
The tax character of distributions declared for the six months ended April 30, 2021, and the year ended October 31, 2020 was as follows:
| | | | | | | | |
| | | Ordinary
Income | | | Total | |
| | |
October 31, 2020 | | $ | 4,146,792 | | | $ | 4,146,792 | |
| | |
April 30, 2021* | | $ | 5,160,893 | | | $ | 5,160,893 | |
| * | The final tax character of any distribution declared in 2021 will be determined in January 2022 and reported to shareholders on IRS Form 1099- Div in accordance with federal income tax regulations. |
As of October 31, 2020, the Fund’s most recent fiscal year end, the components of accumulated losses on a tax basis for the Fund are as follows:
| | | | | | | | | | | | | | |
Undistributed
Ordinary
Income | | | Net
Unrealized
Appreciation | | | Other
Temporary
Differences | | | Total
Accumulated
Gains | |
| | | |
| $ | 2,925,239 | | | $ | 2,128,732 | | | $ | (687,098 | ) | | $ | 4,366,873 | |
Net capital losses earned may be carried forward indefinitely and must retain the character of the original loss. At October 31, 2020, the Fund’s most recent fiscal year end, the Fund did not have non-expiring capital loss carry-forwards.
As of October 31, 2020, the Fund’s most recent fiscal year end, the total cost of securities for federal income tax purposes and the aggregate gross unrealized appreciation and depreciation for securities held by the Fund are as follows:
| | | | | | | | | | | | | | |
Federal Tax
Cost | | | Aggregate
Gross
Unrealized
Appreciation | | | Aggregate
Gross
Unrealized
Depreciation | | | Net
Unrealized
Appreciation
(Depreciation) | |
| | | |
| $ | 118,965,871 | | | $ | 4,936,597 | | | $ | (2,807,865 | ) | | $ | 2,128,732 | |
In June 2020, the Fund entered into a credit agreement (the “BNP Paribas Credit Facility”) with BNP Paribas SA, New York Branch (“BNP Paribas”). The BNP Paribas Credit Facility provides for loans to be made in U.S. dollars and certain foreign currencies to an aggregate amount of $50 million, with an “accordion” feature that allows the Fund, under certain circumstances, to increase the size of the facility to a maximum of $150 million. The Fund may reduce or terminate the commitments under the BNP Paribas Credit Facility with three business days’ notice. The BNP Paribas Credit Facility has a scheduled termination date of June 18, 2021, however, the Fund may request at any time and from time to time to extend the termination date by 364 days. Interest on the BNP Paribas Credit Facility is generally based on London Interbank Offered Rate (“LIBOR”), or with respect to
35
| | | | |
| |
Credit Opportunities Portfolio | | April 30, 2021 (Unaudited) |
| | | | |
borrowings in foreign currencies, on a base rate applicable to such currency borrowing, plus a spread of 1.95%. The Fund also pays a commitment fee on any unused commitment amounts between 0.40% and 0.95%, depending on utilization levels. The Fund incurred upfront fees and legal costs totaling $0.22 million in connection with the BNP Paribas Credit Facility. The Fund has deferred and amortized these costs over the original term of the BNP Paribas Credit Facility, or through June 18, 2021. The amortization of these deferred financing costs is included in credit facility interest expense in the Statement of Operations. As of April 30, 2021, the Fund was in compliance with the terms of the BNP Paribas Credit Facility.
The components of interest expense, average interest rates (i.e., base interest rate in effect plus the spread) and average outstanding balances for the Fund’s credit facilities for the six months ended April 30, 2021 were as follows:
| | | | |
| |
Stated interest expense | | $ | 248,996 | |
| |
Unused commitment fees | | | 121,879 | |
| |
Amortization of deferred financing costs | | | 86,215 | |
| | | | |
Total interest expense | | $ | 457,090 | |
| | | | |
| |
Weighted average interest rate | | | 2.03 | % |
| |
Average borrowings | | $ | 24,774,580 | |
On May 3, 2021, the Fund collected the amounts recorded as receivable for shares issued as of April 30, 2021.
36
| | | | |
| |
Credit Opportunities Portfolio | | April 30, 2021 (Unaudited) |
| | | | |
Dividend Reinvestment Plan (Unaudited)
KKR Credit Opportunities Portfolio, a Delaware statutory trust (the “Fund”), hereby adopts the following Dividend Reinvestment Plan (the “Plan”) with respect to distributions declared by its board of trustees (the “Board”) on its shares of beneficial interest (the “Shares”):
1.
Participation; Agent. The Fund’s Plan is available to shareholders of record of the Shares. [U.S. Bancorp Fund Services, LLC] (“Plan Administrator”) acting as agent for each participant in the Plan, will apply income dividends or capital gains or other distributions (each, a “Distribution” and collectively, “Distributions”), net of any applicable U.S. withholding tax, that become payable to such participant on Shares (including shares held in the participant’s name and shares accumulated under the Plan), to the purchase of additional whole and fractional Shares for such participant.
2.
Eligibility and Election to Participate. Participation in the Plan is limited to registered owners of Shares. The Fund’s Board reserves the right to amend or terminate the Plan. Shareholders automatically participate in the Plan, unless and until an election is made to withdraw from the Plan on behalf of such participating shareholder. If participating in the Plan, a shareholder is required to include all of the Shares owned by such shareholder in the Plan.
3.
Share Purchases. When the Fund declares a Distribution, the Plan Administrator, on the shareholder’s behalf, will receive additional authorized shares from the Fund either newly issued or repurchased from shareholders by the Fund and held as treasury stock. The number of shares to be received when Distributions are reinvested will be determined by dividing the amount of the Distribution by the Fund’s net asset value per share. There will be no sales load charged on Shares issued to a shareholder under the Plan. All shares purchased under the Plan will be held in the name of each participant. In the case of shareholders, such as banks, brokers or nominees, that hold shares for others who are beneficial owners participating under the Plan, the Plan Administrator will administer the Plan on the basis of the number of shares certified from time to time by the record shareholder as representing the total amount of shares registered in the shareholder’s name and held for the account of beneficial owners participating under the Plan.
4.
Timing of Purchases. The Fund expects to issue Shares pursuant to the Plan, immediately following each Distribution payment date and the Plan Administrator will make every reasonable effort to reinvest all Distributions on the day the Distribution is paid (except where necessary to comply with applicable securities laws) by the Fund. If, for any reason beyond the control of the Plan Administrator, reinvestment of the Distributions cannot be completed within 30 days after the applicable Distribution payment date, funds held by the Plan Administrator on behalf of a participant will be distributed to that participant.
5.
Account Statements. The Plan Administrator will maintain all shareholder accounts and furnish written confirmations of all transactions in the accounts, including information needed by shareholders for personal and tax records. The Plan Administrator will hold shares in the account of the shareholders in non-certificated form in the name of the participant, and each shareholder’s proxy, if any, will include those shares purchased pursuant to the Plan. The Plan Administrator will confirm to each participant each acquisition made pursuant to the Plan as soon as practicable but not later than 10 business days after the date thereof. No less frequently than quarterly, the Plan Administrator will provide to each participant an account statement showing the Distribution, the number of shares purchased with the Distribution, and the year-to-date and cumulative Distributions paid.
6.
Expenses. There will be no direct expenses to participants for the administration of the Plan. There is no direct service charge to participants with regard to purchases under the Plan; however, the Fund reserves the right to amend the Plan to include a service charge payable by the participants. All fees associated with the Plan will be paid by the Fund.
37
| | | | |
| |
Credit Opportunities Portfolio | | April 30, 2021 (Unaudited) |
| | | | |
7.
Taxation of Distributions. The reinvestment of Distributions does not relieve the participant of any taxes which may be payable on such Distributions.
8.
Voting of Shares. Shares issued pursuant to the Plan will have the same voting rights as the Shares issued pursuant to the Fund’s public offering.
9.
Absence of Liability. Neither the Fund nor the Plan Administrator shall have any responsibility or liability beyond the exercise of ordinary care for any action taken or omitted pursuant to the Plan, nor shall they have any duties, responsibilities or liabilities except such as expressly set forth herein. Neither the Fund nor the Plan Administrator shall be liable for any act done in good faith or for any good faith omission to act, including, without limitation, any claims of liability: (a) arising out of the failure to terminate a participant’s account prior to receipt of written notice of such participant’s death, or (b) with respect to prices at which shares are purchased or sold for the participant’s account and the terms on which such purchases and sales are made. NOTWITHSTANDING THE FOREGOING, LIABILITY UNDER THE U.S. FEDERAL SECURITIES LAWS CANNOT BE WAIVED.
10.
Termination of Participation. A shareholder who does not wish to have Distributions automatically reinvested may terminate participation in the Plan at any time by written instructions to that effect to the Plan Administrator. Such written instructions must be received by the Plan Administrator three (3) days prior to the record date of the Distribution or the shareholder will receive such Distribution in Shares through the Plan.
11.
Amendment, Supplement, Termination, and Suspension of Plan. This Plan may be amended, supplemented, or terminated by the Fund at any time in its sole and absolute discretion. The amendment or supplement shall be filed with the Securities and Exchange Commission as an exhibit to a subsequent appropriate filing made by the Fund and shall be deemed to be accepted by each participant unless, prior to its effective date thereof, the Plan Administrator receives written notice of termination of the participant’s account. Amendment may include an appointment by the Fund or the Plan Administrator with the approval of the Fund of a successor agent, in which event such successor shall have all of the rights and obligations of the Plan Administrator under this Plan. The Fund may suspend the Plan at any time without notice to the participants.
12.
Governing Law. This Plan and the authorization form signed by the participant (which is deemed a part of this Plan) and the participant’s account shall be governed by and construed in accordance with the laws of the State of New York.
38
| | | | |
| |
Credit Opportunities Portfolio | | April 30, 2021 (Unaudited) |
| | | | |
Privacy Notice
Protection and Security of Your Personal Information
Kohlberg Kravis Roberts & Co. L.P. (“KKR”) respects our investors’ right to privacy. All financial companies choose how they share personal information. Consumers have the right under U.S. federal law to limit some, but not all, sharing of personal information. U.S. federal law also requires us to inform you how we collect, share and protect your personal information. Investors may also have additional limiting rights under their respective State’s law. This notice is provided by KKR, its affiliates, and funds (“KKR”, “we”, or “us”). Please read this notice carefully to understand what we do, and call us at (212) 750-8300 if you have any questions.
The Personal Information We Collect and How We Collect It
We collect the following types of personal information about individuals who are our investors:
| | • | | Information we receive from investors in subscription agreements, questionnaires and in other forms, such as name, address, account information, social security number, the types and amounts of investments, statements of net worth, telephone number, and other contact information; |
| | • | | Information we receive from investors, affiliates and other companies about investors’ transactions with us, our affiliates, or other financial institutions with which we have relationships; and |
| | • | | Information we receive from third parties such as demographic information and information collected to comply with law and regulation. |
When you are no longer an investor with us, we continue to share your information as described in this notice.
How and Why We Share Personal Information
This section lists reasons why financial companies can share their customers’ personal information. With respect to each reason, we explain whether KKR chooses to share for this reason and, if we do share, whether you can limit this sharing.
| | • | | For everyday business purposes: KKR shares personal information for everyday business purposes, such as to |
| | • | | process your transactions; |
| | • | | provide financial products or services to you; |
| | • | | maintain your investment(s); |
| | • | | secure business services, including printing, mailing, and processing or analyzing data; |
| | • | | secure professional services, including accounting and legal services; or |
| | • | | respond to court orders and legal investigations. |
You cannot limit sharing by KKR for everyday business purposes.
| | • | | For our marketing purposes: KKR shares personal information for our marketing purposes so that we can offer products and services to you. You cannot limit sharing by KKR for this reason. |
| | • | | For joint marketing with other financial companies: KKR does not share personal information for joint marketing with other financial companies. |
39
| | | | |
| |
Credit Opportunities Portfolio | | April 30, 2021 (Unaudited) |
| | | | |
| | • | | For use by affiliates in providing products and services to you: KKR shares personal information for our affiliates’ use in providing you with products and services that meet your financial services needs. You cannot limit sharing by KKR for this reason. |
| | • | | For the everyday business purposes of affiliates: KKR does not share personal information, including information about your credit worthiness, with our affiliates for their everyday business purposes. |
| | • | | For use by affiliates to market to you: KKR does not share personal information with affiliates so that they can market to you. |
| | • | | For use by non-affiliates to market to you: KKR does not share personal information with non-affiliates so that they can market to you. |
U.S. Federal law gives you the right to limit sharing of your personal information only for use (i) by affiliates everyday business purposes (information about your creditworthiness), (ii) by affiliates to market to you, and (iii) by non-affiliates to market to you. U.S. State laws and individual companies may give you additional rights to limit sharing.
How We Protect Your Personal Information
To protect your personal information from unauthorized access and use, we use security measures that comply with federal law. These measures include computer safeguards and secured files and buildings.
Definitions
Affiliates: Companies related by common ownership or control. They can be financial and nonfinancial companies. KKR does not share with our affiliates, except to provide you products and services that meet your financial needs.
Non-affiliates: Companies not related by common ownership or control. They can be financial and nonfinancial companies. KKR does not share with non-affiliates so they can market to you.
Joint Marketing: A formal agreement between nonaffiliated financial companies that together market financial products and services to you. KKR does not jointly market.
40
(b) Not applicable
Item 2. Code of Ethics.
Not applicable for semi-annual report.
Item 3. Audit Committee Financial Expert.
Not applicable for semi-annual report.
Item 4. Principal Accountant Fees and Services.
Not applicable for semi-annual report.
Item 5. Audit Committee of Listed Registrants.
Not applicable for semi-annual report.
Item 6. Investments.
(a) Schedule of Investments is included as part of the report to shareholders filed under Item 1 of this Form.
(b) Not applicable.
Item 7. Disclosure of Proxy Voting Policies and Procedures for Closed-End Management Investment Companies.
Not applicable for semi-annual report.
Item 8. Portfolio Managers of Closed-End Management Investment Companies.
Not applicable for semi-annual report.
Item 9. Purchases of Equity Securities by Closed-End Management Investment Company and Affiliated Purchasers.
No purchases were made during the reporting period by or on behalf of the registrant or any “affiliated purchaser,” as defined in Rule 10b-18(a)(3) under the Exchange Act (17 CFR 240.10b-18(a)(3)), of shares or other units of any class of the registrant’s equity securities that is registered by the registrant pursuant to Section 12 of the Exchange Act (15 U.S.C. 781).
Item 10. Submission of Matters to a Vote of Security Holders.
There have been no material changes to the procedures by which shareholders may recommend nominees to the registrant’s board of trustees since the registrant last provided disclosure in response to this item.
Item 11. Controls and Procedures.
(a) The registrant’s principal executive officer and principal financial officer have concluded, based on their evaluation of the registrant’s disclosure controls and procedures as of a date within 90 days of the filing date of this report on Form N-CSR, that the design and operation of such procedures are effective to provide reasonable assurance that information required to be disclosed by the investment company on Form N-CSR is recorded, processed, summarized and reported within the time periods specified in the Commission’s rules and forms.
(b) There have been no changes in the registrant’s internal control over financial reporting during the six months ended April 30, 2021 that materially affected, or are reasonably likely to materially affect, the registrant’s internal control over financial reporting.
Item 12. Disclosure of Securities Lending Activities for Closed-End Management Investment Companies
The registrant did not engage in securities lending activities during the period reported on this Form N-CSR.
Item 13. Exhibits.
(a)(1) Not applicable).
(a)(2) A separate certification for the principal executive officer and the principal financial officer of the registrant as required by Rule 30a-2(a) under the Investment Company Act of 1940, as amended, are filed herewith.
(a)(3) Not applicable.
(a)(4) Not applicable.
(b) Certifications pursuant to Section 906 of the Sarbanes-Oxley Act of 2002 are filed herewith.
SIGNATURES
Pursuant to the requirements of the Securities Exchange Act of 1934 and the Investment Company Act of 1940, the registrant has duly caused this report to be signed on its behalf by the undersigned, thereunto duly authorized.
| | |
| KKR Credit Opportunities Portfolio |
| | |
| |
| By | | /s/ Eric Mogelof |
| Eric Mogelof, President |
| |
| Date | | 6/30/2021 |
Pursuant to the requirements of the Securities Exchange Act of 1934 and the Investment Company Act of 1940, this report has been signed below by the following persons on behalf of the registrant and in the capacities and on the dates indicated.
| | |
| By | | /s/ Eric Mogelof |
| Eric Mogelof, President |
| |
| Date | | 6/30/2021 |
| |
| By | | /s/ Thomas Murphy |
| | |
| Thomas Murphy, Treasurer, Chief Accounting Officer & Chief Financial Officer |