UNITED STATES
SECURITIES AND EXCHANGE COMMISSION
Washington, D.C. 20549
FORM N-CSR
CERTIFIED SHAREHOLDER REPORT OF REGISTERED
MANAGEMENT INVESTMENT COMPANIES
Investment Company Act file number (811-23474)
KKR Credit Opportunities Portfolio
(Exact name of registrant as specified in charter)
555 California Street, 50th Floor
San Francisco, CA 94104
(Address of principal executive offices) (Zip code)
Annette O’Donnell-Butner
KKR Credit Advisors (US) LLC
555 California Street, 50th Floor
San Francisco, CA 94104
(Name and address of agent for service)
(415) 315-3620
Registrant’s telephone number, including area code
Date of fiscal year end: October 31, 2020
Date of reporting period: October 31, 2020
Item 1. Reports to Stockholders.

KKR Credit Opportunities Portfolio
Annual Report
October 31, 2020
Beginning on January 1, 2021, as permitted by regulations adopted by the U.S. Securities and Exchange Commission, paper copies of the Fund’s annual and semi-annual shareholder reports will no longer be sent by mail, unless you specifically request paper copies of the reports from the Fund or from your financial intermediary (such as a broker-dealer or bank). Instead, the reports will be made available on a website, and you will be notified by mail each time a report is posted and provided with a website link to access the report.
If you already elected to receive shareholder reports electronically, you will not be affected by this change and you need not take any action. You may elect to receive shareholder reports and other communications from the Fund electronically by contacting your financial intermediary or, if you are a direct investor, by calling the Fund at 1-855-862-6092.
You may elect to receive all future reports in paper free of charge. If you invest through a financial intermediary, you can contact your financial intermediary to request that you continue to receive paper copies of your shareholder reports; if you invest directly with the Fund, you can call the Fund at 1-855-862-6092. Your election to receive reports in paper form will apply to all funds held in your account with your financial intermediary.
| | | | |
 | |
Credit Opportunities Portfolio | | October 31, 2020 |
| | | | |
Table of Contents
The KKR Credit Opportunities Portfolio (the “Fund”) files its complete schedule of portfolio holdings with the Securities and Exchange Commission (the “Commission”) for the first and third quarters of each fiscal year on Form N-PORT within sixty days after the end of the period. The Fund’s Form N-PORT is available on the Commission’s website at http://www.sec.gov.
A description of the policies and procedures that the Fund uses to determine how to vote proxies relating to portfolio securities, as well as information relating to how a Fund voted proxies relating to portfolio securities during the most recent period ended June 30 will be available (i) without charge, upon request, by calling 855- 862-6092; and (ii) on the Commission’s website at http://www.sec.gov.
INFORMATION ABOUT THE FUND’S TRUSTEES
The proxy statements and annual reports include information about the Fund’s Trustees and are available without charge, upon request, by calling 855-862-6092 and by visiting the Commission’s website at www.sec.gov.
| | | | |
| |
Credit Opportunities Portfolio | | October 31, 2020 |
| | | | |
Management Discussion of Fund Performance
Looking Back on the Markets — October 31, 2020
KKR Credit Opportunities Portfolio (“KCOP”) aims to dynamically allocate across credit instruments to capitalize on changes in relative value among corporate credit investments and manage against macroeconomic risks. Our portfolio seeks exposure to companies where the perception of risk may be high but our analysis leads us to believe that that risk is lower. KCOP is focused on where we believe risk or true value is misperceived by many market participants. Our predominant focus is on large companies in sectors where names are not typically over-valued. We believe KCOP is well suited to the current credit market conditions as we seek assets that we believe are dislocated or fundamentally mispriced. We believe we are well equipped to construct a robust portfolio in times of stress and provide value to portfolios that have broad credit exposure.
This pandemic has disrupted the markets in a way we have not seen since the 2008 recession. The sudden halting of our movement and business activities has created a ghost that is looming through our economy, daily routines, and for a large array of companies — uncertain future revenue streams. Although it may feel as though life has stagnated since the start of the global pandemic, we do continue to make strides forward. Healthcare professionals have become more knowledgeable on how to manage COVID-19 and the race for multiple vaccines pushes onward. Like all trying times in history, we continue to be faced with challenges every day as the world finds its footing in the midst of a thick fog of continued uncertainty. We view this road ahead as our Odyssey — a continued long journey through evolving unprecedented times. The waters ahead may sometimes be calm or volatile, but we will continue to row forward. Sometimes we will move with the current, but regardless always striving toward our destination and desired outcome. As we look back on the last six months, the market continued to inch upward and onward as the U.S. Federal Reserve’s historic intervention continued to seep through the market’s pipes and corporate issuance continued to surge.
As the Fed continues to hover over the market with their excess capacity, we believe there will be more punch to come from them and that lends itself well to risk assets. However, we do believe there will be long-term implications to the Fed’s backstop and, as a result, a longer tail for these effects to surface. The tide is shifting and the growing number of issuers will present more opportunities to begin to weave complexity back into asset allocations vis-à-vis rescue financings and workouts.
We continue to see attractive opportunities in this market that span the credit realm. We believe there will be second and third derivative effects of the dislocation which may not be overly obvious today. We also believe a multi-asset credit strategy enables investors to get exposure to a curated portfolio of credit selection layered across a blend of credit products truly affording the opportunity to be agile and more flexible in future dislocations and take advantage of differing dispersion across the market. Overall, we view the current environment as an attractive one to translate thematic macro views into executable micro level investments.
Market Commentary1
High-yield bond prices rallied in early October amid hopes for a vaccine and US stimulus bill, although came under pressure as October progressed alongside stocks amid rising infections and tougher restrictions in Europe. In addition, the market was anxious due to the lack of stimulus in the US and an upcoming election. Leveraged loan prices also rose through the first three weeks of October only to succumb to a risk-off tone in the final week. In terms of performance, the BAML High Yield Master Index II returned +0.47% in October and the S&P LSTA Leveraged Loan index returned +0.20%.
Domestically, through the first ten months of the year, a total of 87 companies have defaulted, totaling $125.9bn in bonds and loans; of which there were nine defaults totaling $11.5bn in U.S. bonds and loans in October. There have also been 18 distressed transactions totaling $10.9bn. The YTD default total of $136.7bn inclusive of
1
| | | | |
| |
Credit Opportunities Portfolio | | October 31, 2020 |
| | | | |
distressed exchanges ranks as the second highest annual default total on record and only trails the $2.2bn that occurred in 2009. The bond par weighted default rate for the last 12 months is 6.87% and the loan par weighted default rate for the last 12 months is 3.99%.
Capital market activity for bonds was elevated in October from a historical sense, but did slow versus August and September’s record pace. October’s new issue volume totaled $37.3bn, down from $50.9bn in September and $54.7bn in August. YTD HY gross, refinancing, and net issuance totals $387.6bn, which is up 68% from the $230.1bn that priced over the first ten months of 2019. Meanwhile, leveraged loan issuance was very active following an extended lull since February. In particular, leveraged loan issuance totaled $49.9bn in October following September’s heaviest activity ($33.7bn) since February. The year-to-date high for net issuance was $26bn in February and October’s activity marked a high since June 2018. Institutional loan new-issue volume now totals $363.1bn YTD, which is up +22% year-over-year.
U.S. CLO issuance picked up in October, as 55 deals priced for $16.3bn, following last month’s volume of $12.1bn. October’s issuance was the highest monthly total since February’s $29.0bn. Year-to-date, 282 U.S. CLOs have priced totaling $102.2bn, compared to 298 U.S. CLOs totaling $140.5bn for the same period last year (-27%).
In October, high yield mutual funds reported a $3.9bn inflow, which followed a -$7.7bn outflow in September, which was the 11th largest outflow on record and the first since March’s -$11.7bn outflow. Notably, between March and September, high yield funds reported five consecutive months of inflows totaling a combined +$59.1bn, which included the top two largest inflows on record in May +$20.5bn and April +$17.1bn. Loan funds reported their 25th consecutive outflow in October, albeit the second lowest outflow over this two-year span. October’s outflow totaled -$254mn. Loan outflows year-to-date total $26.6bn, which compares to record outflows in FY 2019 totaling $38.3bn.
The Market in Numbers1
For the period of May 1, 2020 – October 31, 2020:
| | • | | Returns: Over the six month period ending October 31, 2020, the high yield and leveraged loan markets returned +11.08%2 and +9.54%2, as measured by the Bank of America Merrill Lynch High Yield Index and the S&P LSTA Leveraged Loan Index), respectively. |
| | • | | Spreads: The option adjusted spread on the Bank of America Merrill Lynch High Yield Index ended the period at 532bps2 (October 31st, 2020). The 3-year discounted spread on the S&P LSTA Leveraged Loan Index ended the period at 585bps3 (October 31, 2020). |
| | • | | Volatility: As measured by the VIX Index, over the last six months, the VIX increased to as high as 40.8 in June 2020, before settling at 38.02 as of October 31, 2020.4 |
Fund Background and Performance
The Fund is a newly organized, diversified, closed-end management investment company that continuously offers its shares (the “Shares”) and is operated as an “interval fund.” The Fund’s investment objective is to seek to provide attractive risk-adjusted returns and high current income.
2
| | | | |
| |
Credit Opportunities Portfolio | | October 31, 2020 |
| | | | |
The Fund seeks to achieve its investment objectives by investing in a select portfolio with exposure to two primary credit strategies:
| | 1. | Opportunistic Credit, a conviction-based approach investing in a portfolio consisting primarily of publicly traded high yield bonds, first- and second-lien secured bank loans and structured credit (e.g., collateralized loan obligation (“CLO”) and mezzanine debt); and |
| | 2. | Private Credit, which includes directly originated hard and financial asset-based lending, corporate mezzanine debt, as well as directly originated first-lien, second-lien and unitranche senior loans to upper middle-market companies. |
Under normal market conditions, the Fund will invest at least 80% of its Managed Assets5 in senior and subordinated corporate debt and debt related instruments, including bonds, secured bank loans, convertible securities, structured products, convertible debt securities, repurchase agreements, and municipal securities.
During the initial ramp period that may continue through August 31, 2021, the Fund will invest substantially all of its assets in the Opportunistic Credit Strategy. Following that initial period, the Fund expects, under normal circumstances, to invest 70-80% of its Managed Assets in the Opportunistic Credit strategy and 20-30% of its Managed Assets in the Private Credit Strategy, though the Fund’s allocation in investments could vary from these guidelines at any time in the Fund’s discretion. Investment in the Private Credit Strategy is contingent upon the Fund first achieving sufficient scale to acquire such positions, and there can be no assurance that the Fund will ever raise sufficient assets to invest in the Private Credit Strategy. On at least a quarterly basis, the Fund’s Investment Committee will meet to, among other things, review and establish the allocation percentage between the Opportunistic Credit Strategy and Private Credit Strategy for the ensuing period. The Investment Committee will consider factors such as KKR’s macro-economic and market outlooks, assessment of the relative risk and return of each strategy, and other factors in making its determination. “Managed Assets” means the total assets of the Fund (including any assets attributable to borrowings for investment purposes) minus the sum of the Fund’s accrued liabilities (other than liabilities representing borrowings for investment purposes).
As of October 31, 2020, the Fund held 43.7% of its net assets in first and second-lien leveraged loans, 53.2% of its net assets in high-yield corporate debt, 1.1% of its net assets in collateralized loan obligations, and 0.7% of its net assets in common stock. KCOP’s investments represented obligations and equity interests in 203 positions across a diverse group of industries. The top ten issuers represented 25.6% of the Fund’s net assets while the top five industry groups represented 42.0% of the Fund’s net assets. The Fund’s Securities and Exchange Commission 30-day yield for Class I, Class T, and Class U respectively, was 7.23%, 6.47% and 0.00%.
| 1 | Source: Source: S&P/LSTA LCD Index Monthly and JPM High Yield Bond and Leveraged Loan Market Monitor as of October 31, 2020. |
| 2 | Source: Bank of America Merrill Markets and S&P/LSTA Bloomberg data as of October 31, 2020. |
| 3 | Source: S&P LCD Discounted Spreads as of October 31, 2020. |
| 4 | Source: Bloomberg as of October 31, 2020. |
| 5 | “Managed Assets” means the total assets of the Fund (including any assets attributable to borrowings for investment purposes) minus the sum of the Fund’s accrued liabilities (other than liabilities representing borrowings for investment purposes). |
3
| | | | |
| |
Credit Opportunities Portfolio | | October 31, 2020 |
| | | | |
Business Updates
We thank you for your partnership and continued investment in KCOP. We look forward to continued communications and will keep you apprised of the progress of KCOP specifically and the leveraged finance market place generally. Fund information is available on our website at kkrfunds.com/KCOP.
Disclosures
The Bank of America Merrill Lynch High Yield Master II Index is a market-value weighted index of below investment grade U.S. dollar-denominated corporate bonds publicly issued in the U.S. domestic market. “Yankee” bonds (debt of foreign issuers issued in the U.S. domestic market) are included in the Bank of America Merrill Lynch High Yield Master II Index provided that the issuer is domiciled in a country having investment grade foreign currency long-term debt rating. Qualifying bonds must have maturities of one year or more, a fixed coupon schedule and minimum outstanding of US$100 million. In addition, issues having a credit rating lower than BBB3, but not in default, are also included.
The Chicago Board Options Exchange (CBOE) Volatility Index (VIX) reflects the market’s expectation of 30-day volatility. It is constructed using the implied volatilities of a wide range of S&P 500 index options. The VIX reflects the market’s estimate of future volatility, based on the weighted average of the implied volatilities for a wide range of strikes. The first and second month expirations are used until 8 days from expiration, then the second and third are used.
The S&P/LSTA Leveraged Loan Index is a market value-weighted index designed to measure the performance of the U.S. leveraged loan market based upon market weightings, spreads and interest payments. The Index was rolled out in 2000 and it was back-loaded with four years of data dating to 1997.
It is not possible to invest directly in an index.
Past performance is not an indication of future results. Returns represent past performance and reflect changes in share prices, the reinvestment of all dividends and capital gains, expense limitations and the effects of compounding. The prospectus contains more complete information on the investment objectives, risks, charges and expenses of the investment company, which investors should read and consider carefully before investing. The returns shown do not reflect taxes a shareholder would pay on distributions or redemptions. Total investment return and principal value of your investment will fluctuate, and your shares, when sold, may be worth more or less than their original cost. Current performance may be higher or lower than the performance data quoted. An investment in the Fund involves risk, including the risk of loss of principal. For a discussion of the Fund’s risks, see Risk Considerations, Note 3 to the financial statements. Call 855-330-3927 for performance results current to the most recent calendar quarter-end.
Must be preceded or accompanied by a prospectus.
An imbalance in supply and demand in the income market may result in valuation uncertainties and greater volatility, less liquidity, widening credit spreads and a lack of price transparency in the market. Investments in income securities may be affected by changes in the creditworthiness of the issuer and are subject to the risk of non–payment of principal and interest. The value of income securities also may decline because of real or perceived concerns about the issuer’s ability to make principal and interest payments. Borrowing to increase investments (leverage) will exaggerate the effect of any increase or decrease in the value of Fund investments. Investments rated below investment grade (typically referred to as “junk”) are generally subject to greater price volatility and illiquidity than higher rated investments. As interest rates rise, the value of certain income investments is likely to decline. Senior loans are subject to prepayment risk. Investments in foreign instruments or currencies can involve greater risk and volatility than U.S. investments because of adverse market economic, political, regulatory, geopolitical or other conditions. Changes in the value of investments entered for hedging purposes may not match those of the position being hedged. The Fund may engage in other investment practices that may involve additional risks.
4
| | | | |
| |
Credit Opportunities Portfolio | | October 31, 2020 |
| | | | |
| | | | | | | | |
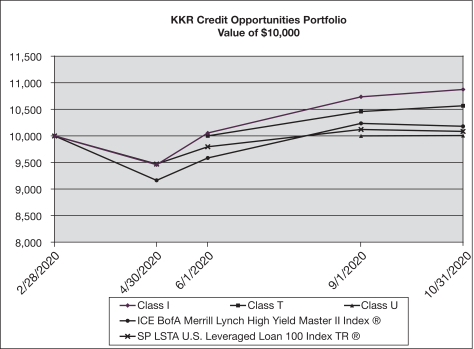
Average Annual Total Returns Period Ended October 31, 2020 | | Since Inception | | | Value of
$10,000
10/31/2020 | |
KKR Credit Opportunities Portfolio | | | | | | | | |
Class I (02/28/2020) | | | 8.71% | | | $ | 10,871 | |
Class T (06/01/2020) | | | 5.67% | | | | 10,567 | |
Class U (09/01/2020) | | | — | | | $ | 10,004 | |
ICE BofA Merrill Lynch High Yield Master II Index® | | | 1.78% | | | $ | 10,178 | |
SP LSTA U.S. Leveraged Loan 100 Index TR | | | 0.85% | | | $ | 10,085 | |
Total return assumes a purchase of common stock at the net asset value on the first day and a sale at the net asset value on the last day of each period reported on the table. Total return assumes reinvestment of dividends and distributions at prices obtained pursuant to the Fund’s dividend reinvestment plan.
5
| | | | |
| |
Credit Opportunities Portfolio | | October 31, 2020 |
| | | | |
Schedule of Investments
| | | | | | | | | | |
| | | | | Par† | | | Value | |
Leveraged Loans - 43.7% | | | | | | | | | | |
| | | |
Aerospace & Defense - 3.0% | | | | | | | | | | |
| | | |
EaglePicher Technologies, LLC, TL 2L 02/18 | | | | | | | | | | |
| | | |
7.398% (1 Month US LIBOR + 7.250%), 03/08/2026 (a) | | | | | 62,000 | | | $ | 58,487 | |
| | |
Ontic Engineering & Manufacturing, Inc., TL 1L B-DD 10/19 | | | | | | |
| | | |
4.970% (3 Month US LIBOR + 4.750%), 10/31/2026 (a) | | | | | 11,338 | | | | 11,215 | |
| | |
Ontic Engineering & Manufacturing, Inc., TL 1L B 10/19 | | | | | | |
| | | |
4.970% (3 Month US LIBOR + 4.750%), 10/30/2026 (a) | | | | | 72,561 | | | | 71,776 | |
| | |
Sequa Corp. | | | | | | |
| | | |
10.500% (3 Month US LIBOR + 10.750%), 07/31/2025 (a)(d)(e)(h) | | | | | 403,860 | | | | 407,899 | |
| | | |
Sequa Corp., TL 1L 07/20 | | | | | | | | | | |
| | | |
7.750% (3 Month US LIBOR + 6.750%), 11/28/2023 (a)(h) | | | | | 2,470,247 | | | | 2,343,647 | |
| | | |
Sequa Corp., TL 2L 07/20 | | | | | | | | | | |
| | | |
11.750% (3 Month US LIBOR + 4.000%), 04/28/2024 (a)(h) | | | | | 931,985 | | | | 745,588 | |
| | |
Standard Aero Ltd., TL 1L 04/19 | | | | | | |
| | | |
3.720% (3 Month US LIBOR + 3.500%), 04/06/2026 (a) | | | | | 4,697 | | | | 4,220 | |
| | | |
Standard Aero Ltd., TL 1L 02/20 | | | | | | | | | | |
| | | |
3.720% (3 Month US LIBOR + 3.500%), 04/06/2026 (a) | | | | | 2,525 | | | | 2,269 | |
| | | | | | | | | | |
| | | | | | | | | 3,645,101 | |
| | | | | | | | | | |
| | | |
Auto Components - 1.0% | | | | | | | | | | |
| | | |
Innovative XCessories & Services LLC, TL 1L 02/20 | | | | | | | | | | |
| | | |
6.000% (3 Month US LIBOR + 5.000%), 03/05/2027 (a) | | | | | 1,244,900 | | | | 1,232,762 | |
| | | | | | | | | | |
| | | | | | | | | | |
| | |
Building Products - 0.4% | | | | | | |
| | |
MI Windows and Doors, Inc., TL 1L 10/19 | | | | | | |
| | | |
6.500% (1 Month US LIBOR + 5.500%), 11/06/2026 (a) | | | | | 467,245 | | | | 467,245 | |
| | | | | | | | | | |
| | | | | | | | | | |
| | |
Chemicals - 3.4% | | | | | | |
| | |
Allnex USA, Inc. TL 1L B 05/16 EUR | | | | | | |
| | | |
3.250% (3 Month EURIBOR + 3.250%), 09/13/2023 (a)(b) | | EUR | | | 539,098 | | | | 606,147 | |
| | |
Aruba Investments, Inc., TL 2L 10/20 | | | | | | |
| | | |
7.750%, 10/28/2028 (a)(c)(d) | | | | | 465,220 | | | | 463,475 | |
| | |
Diversey, Inc., TL 1L 07/17 | | | | | | |
| | | |
3.214% (3 Month US LIBOR + 3.000%), 09/06/2024 (a) | | | | | 347,943 | | | | 333,851 | |
| | |
Flint Group GmbH, TL 1L B 04/14 EUR | | | | | | |
| | | |
5.000% (3 Month EURIBOR + 4.250%), 09/21/2023 (a)(b) | | EUR | | | 701,080 | | | | 730,338 | |
| | |
Flint Group GmbH, TL 1L B3 05/15 EUR | | | | | | |
| | | |
5.000% (3 Month EURIBOR + 4.250%), 09/21/2023 (a)(b) | | EUR | | | 77,036 | | | | 80,244 | |
| | |
Flint Group GmbH, TL 1L B4 11/15 EUR | | | | | | |
| | | |
5.000% (3 Month EURIBOR + 0.000%), 09/21/2023 (a)(b) | | EUR | | | 54,214 | | | | 56,471 | |
| | | |
Invictus, TL 2L 05/18 | | | | | | | | | | |
| | | |
6.897% (1 Month US LIBOR + 6.750%), 03/30/2026 (a) | | | | | 39,000 | | | | 36,538 | |
| | |
New Arclin US Holding Corp. | | | | | | |
| | | |
9.750% (1 Month US LIBOR + 8.750%), 02/14/2025 (a) | | | | | 9,000 | | | | 8,483 | |
See accompanying notes to financial statements.
6
| | | | |
| |
Credit Opportunities Portfolio | | October 31, 2020 |
| | | | |
| | | | | | | | | | |
SI Group, Inc. | | | | | | |
| | | |
4.897% (3 Month US LIBOR + 4.750%), 10/15/2025 (a) | | | | | 475,536 | | | $ | 458,892 | |
| | |
Vantage Specialty Chemicals, Inc., TL 2L 10/17 | | | | | | |
| | | |
9.250% (6 Month US LIBOR + 8.250%), 10/27/2025 (a) | | | | | 457,050 | | | | 359,262 | |
| | |
Vantage Specialty Chemicals, Inc., TL 1L B 10/17 | | | | | | |
| | | |
4.500% (6 Month US LIBOR + 3.500%), 10/26/2024 (a) | | | | | 1,008,267 | | | | 928,865 | |
| | | | | | | | | | |
| | | | | 4,062,566 | |
| | | | | | | | | | |
| | | |
Commercial Services & Supplies - 1.5% | | | | | | | | | | |
| | | |
Access CIG, LLC, TL 2L 02/18 | | | | | | | | | | |
| | | |
7.975% (1 Month US LIBOR + 7.750%), 02/27/2026 (a) | | | | | 143,000 | | | | 135,850 | |
| | | |
Access CIG, LLC, TL 1L 02/18 | | | | | | | | | | |
| | | |
3.975% (3 Month US LIBOR + 3.750%), 02/27/2025 (a) | | | | | 38,702 | | | | 37,691 | |
| | | |
Monitronics International, Inc., TL 1L EXIT 08/19 | | | | | | | | | | |
| | | |
7.750% (1 Month US LIBOR + 6.500%), 03/29/2024 (a) | | | | | 538,917 | | | | 427,992 | |
| | | |
VFS Global Services Pvt Ltd., TL 1L B 06/17 GBP | | | | | | | | | | |
| | | |
4.078%, 07/29/2024 (a)(b) | | GBP | | | 1,141,330 | | | | 1,278,987 | |
| | | | | | | | |
| | | | | | | | | 1,880,520 | |
| | | | | | | | |
| | | |
Construction & Engineering - 3.1% | | | | | | | | | | |
| | | |
Brand Energy & Infrastructure Services, Inc., TL 1L 05/17 | | | | | | | | | | |
| | | |
5.250% (3 Month US LIBOR + 4.250%), 06/21/2024 (a) | | | | | 1,078,192 | | | | 1,008,449 | |
| | | |
Total Safety US, Inc., TL 1L B 07/19 | | | | | | | | | | |
| | | |
7.000% (3 Month US LIBOR + 6.000%), 08/16/2025 (a) | | | | | 1,289,864 | | | | 1,230,531 | |
| | | |
Yak Access, LLC, TL 1L B 05/18 | | | | | | | | | | |
| | | |
5.223% (3 Month US LIBOR + 5.000%), 07/11/2025 (a) | | | | | 1,757,991 | | | | 1,489,167 | |
| | | | | | | | |
| | | | | | | | | 3,728,147 | |
| | | | | | | | |
| | | |
Construction Materials - 0.1% | | | | | | | | | | |
| | | |
Quimper AB, TL 2L 02/19 EUR | | | | | | | | | | |
| | | |
8.250% (3 Month EURIBOR + 8.250%), 02/15/2027 (a)(b) | | EUR | | | 94,000 | | | | 106,329 | |
| | | | | | | | | | |
| | | | | | | | | | |
| | | |
Distributors - 0.3% | | | | | | | | | | |
| | | |
Distribution International, Inc., TL 1L 06/19 | | | | | | | | | | |
| | | |
6.750% (3 Month US LIBOR + 5.750%), 12/15/2023 (a) | | | | | 451,570 | | | | 410,929 | |
| | | | | | | | | | |
| | | | | | | | | | |
| | | |
Diversified Consumer Services - 1.9% | | | | | | | | | | |
| | | |
Airbnb, Inc., TL 1L 03/20 | | | | | | | | | | |
| | | |
8.500% (3 Month US LIBOR + 7.500%), 04/17/2025 (a) | | | | | 241,864 | | | | 257,989 | |
| | | |
Conservice Midco LLC, TL 1L B 05/20 | | | | | | | | | | |
| | | |
4.470% (3 Month US LIBOR + 4.250%), 05/13/2027 (a) | | | | | 33,783 | | | | 33,192 | |
| | | |
Jostens, Inc., TL 1L 12/18 | | | | | | | | | | |
| | | |
5.720% (6 Month US LIBOR + 5.500%), 12/19/2025 (a) | | | | | 1,897,557 | | | | 1,790,526 | |
| | | |
Learning Care Group Inc.,TL 1L B 05/20 | | | | | | | | | | |
| | | |
9.500% (3 Month US LIBOR + 8.500%), 03/13/2025 (a) | | | | | 281,155 | | | | 283,967 | |
| | | | | | | | | | |
| | | | | | | | | 2,365,674 | |
| | | | | | | | | | |
| | | |
Diversified Telecommunication Services - 0.2% | | | | | | | | | | |
| | | |
Peak 10 Holding Corp., TL 1L 07/17 | | | | | | | | | | |
| | | |
3.720% (3 Month US LIBOR + 3.500%), 08/01/2024 (a) | | | | | 315,560 | | | | 275,721 | |
| | | | | | | | | | |
See accompanying notes to financial statements.
7
| | | | |
| |
Credit Opportunities Portfolio | | October 31, 2020 |
| | | | |
| | | | | | | | | | |
Electronic Equipment, Instruments & Components - 1.2% | | | | | | | | | | |
| | | |
Excelitas Technologies Corp., TL 2L 10/17 | | | | | | | | | | |
| | | |
8.500% (3 Month US LIBOR + 7.500%), 12/01/2025 (a) | | | | | 1,488,868 | | | $ | 1,477,240 | |
| | | | | | | | | | |
| | | | | | | | | | |
| | | |
Energy Equipment & Services - 0.2% | | | | | | | | | | |
| | | |
Caprock Midstream, LLC, TL 1L B 10/18 | | | | | | | | | | |
| | | |
4.898% (1 Month US LIBOR + 4.750%), 11/03/2025 (a) | | | | | 144,900 | | | | 103,023 | |
| | | |
ChampionX Corp., TL 1L B 05/20 | | | | | | | | | | |
| | | |
6.000% (6 Month US LIBOR + 0.000%), 06/03/2027 (a) | | | | | 81,844 | | | | 81,708 | |
| | | | | | | | | | |
| | | | | | | | | 184,731 | |
| | | | | | | | | | |
| | | |
Food & Staples Retailing - 0.2% | | | | | | | | | | |
| | | |
Froneri Ltd., TL 2L 01/20 | | | | | | | | | | |
| | | |
5.897% (1 Month US LIBOR + 5.750%), 01/31/2028 (a)(b) | | | | | 60,000 | | | | 59,700 | |
| | | |
Smart & Final Stores LLC, TL 1L B 05/19 | | | | | | | | | | |
| | | |
6.966% (1 Month US LIBOR + 6.750%), 06/20/2025 (a) | | | | | 193,784 | | | | 195,480 | |
| | | | | | | | | | |
| | | | | | | | | 255,180 | |
| | | | | | | | | | |
| | | |
Food Products - 1.1% | | | | | | | | | | |
| | | |
CSM Bakery Products, TL 2L 07/13 | | | | | | | | | | |
| | | |
11.000% (3 Month US LIBOR + 10.000%), 02/04/2022 (a) | | | | | 77,087 | | | | 74,486 | |
| | | |
CSM Bakery Products, TL 1L B 07/13 | | | | | | | | | | |
| | | |
7.250% (3 Month US LIBOR + 6.250%), 01/04/2022 (a) | | | | | 1,286,178 | | | | 1,272,113 | |
| | | | | | | | | | |
| | | | | | | | | 1,346,599 | |
| | | | | | | | | | |
| | | |
Health Care Equipment & Supplies - 0.4% | | | | | | | | | | |
| | | |
DeVilbiss Healthcare LLC, TL 1L B 11/16 | | | | | | | | | | |
| | | |
8.500% (US LIBOR + 5.500%), 01/03/2023 (a) | | | | | 410,100 | | | | 302,448 | |
| | | |
Orchid Orthopedic Solutions LLC, TL 1L 02/19 | | | | | | | | | | |
| | | |
4.720% (3 Month US LIBOR + 4.500%), 03/05/2026 (a) | | | | | 147,247 | | | | 135,222 | |
| | | | | | | | | | |
| | | | | | | | | 437,670 | |
| | | | | | | | | | |
| | | |
Health Care Providers & Services - 0.4% | | | | | | | | | | |
| | | |
Affordable Care Inc., TL 1L 10/15 | | | | | | | | | | |
| | | |
5.750% (3 Month US LIBOR + 4.750%), 10/24/2022 (a) | | | | | 428,994 | | | | 398,248 | |
| | | |
Paradigm Acquistion Corp., TL 2L 10/18 LC | | | | | | | | | | |
| | | |
7.720% (3 Month US LIBOR + 7.500%), 10/26/2026 (a) | | | | | 30,000 | | | | 26,950 | |
| | | |
US Anesthesia Partners, Inc., TL 1L B 01/18 | | | | | | | | | | |
| | | |
4.000% (6 Month US LIBOR + 3.000%), 06/23/2024 (a) | | | | | 55,404 | | | | 52,129 | |
| | | | | | | | | | |
| | | | | | | | | 477,327 | |
| | | | | | | | | | |
| | | |
Hotels, Restaurants & Leisure - 6.7% | | | | | | | | | | |
| | | |
Aimbridge Acquisition Co, Inc., TL 1L B 09/20 | | | | | | | | | | |
| | | |
6.750% (3 Month US LIBOR + 6.000%), 02/02/2026 (a) | | | | | 413,880 | | | | 409,741 | |
| | | |
Aimbridge Acquisition Co, Inc., TL 1L B 10/19 | | | | | | | | | | |
| | | |
3.902% (1 Month US LIBOR + 3.750%), 02/02/2026 (a) | | | | | 1,219,674 | | | | 1,077,381 | |
| | | |
B&B Hotels SAS, TL l B3A 01/20 EUR | | | | | | | | | | |
| | | |
3.875% (6 Month EURIBOR + 3.875%), 07/31/2026 (a)(b) | | EUR | | | 1,121,450 | | | | 1,116,918 | |
See accompanying notes to financial statements.
8
| | | | |
| |
Credit Opportunities Portfolio | | October 31, 2020 |
| | | | |
| | | | | | | | | | |
ClubCorp Club Operations, Inc., TL 1L B 08/17 | | | | | | | | | | |
| | | |
2.970% (3 Month US LIBOR + 2.750%), 09/18/2024 (a) | | | | | 1,023,586 | | | $ | 866,209 | |
| | | |
Diamond Resorts International, Inc., TL 1L B 06/18 | | | | | | | | | | |
| | | |
4.750% (1 Month US LIBOR + 3.750%), 09/02/2023 (a) | | | | | 1,005,214 | | | | 908,286 | |
| | | |
Life Time Fitness, Inc., TL B 1L 01/17 | | | | | | | | | | |
| | | |
3.750% (6 Month US LIBOR + 2.750%), 06/10/2022 (a) | | | | | 2,799,200 | | | | 2,594,523 | |
| | | |
Piolin BidCo SAU, TL 1L B 05/20 EUR | | | | | | | | | | |
| | | |
7.500% (3 Month EURIBOR + 7.500%), 05/26/2024 (a)(b) | | EUR | | | 539,891 | | | | 591,055 | |
| | | |
SMG US Midco 2, Inc., TL 1L 01/20 | | | | | | | | | | |
| | | |
2.727% (1 Month US LIBOR + 2.500%), 01/23/2025 (a) | | | | | 83,070 | | | | 70,887 | |
| | | |
United PF Holdings LLC, TL 1L 01/20 | | | | | | | | | | |
| | | |
4.216% (3 Month US LIBOR + 4.000%), 12/30/2026 (a) | | | | | 689,125 | | | | 606,430 | |
| | | | | | | | | | |
| | | | | | | | | 8,241,430 | |
| | | | | | | | | | |
| | | |
Household Products - 0.3% | | | | | | | | | | |
| | | |
Steinhoff, TL 1L 07/19 (SFH Super Senior) | | | | | | | | | | |
| | | |
10.000%, 12/31/2021 (b)(h) | | EUR | | | 9,455 | | | | 10,847 | |
| | | |
Steinhoff, TL 1L 08/19 (SFH 1) | | | | | | | | | | |
| | | |
0.000% (3 Month EURIBOR + 0.000%), 12/31/2021 (b)(g)(h) | | EUR | | | 635,586 | | | | 395,284 | |
| | | | | | | | | | |
| | | | | | | | | 406,131 | |
| | | | | | | | | | |
| | | |
Industrial Conglomerates - 0.1% | | | | | | | | | | |
| | | |
Unifrax I LLC / Unifrax Holding Co., TL 1L B 10/18 USD | | | | | | | | | | |
| | | |
3.970% (6 Month US LIBOR + 3.750%), 12/12/2025 (a) | | | | | 110,159 | | | | 97,725 | |
| | | |
Unifrax I LLC / Unifrax Holding Co., TL 1L B 11/18 EUR | | | | | | | | | | |
| | | |
3.750% (3 Month EURIBOR + 3.750%), 12/12/2025 (a) | | EUR | | | 25,000 | | | | 24,985 | |
| | | | | | | | | | |
| | | | | | | | | 122,710 | |
| | | | | | | | | | |
| | | |
IT Services - 0.1% | | | | | | | | | | |
| | | |
PSAV, Inc., TL 2L 02/18 | | | | | | | | | | |
| | | |
8.250% (3 Month US LIBOR + 7.250%), 09/01/2025 (a) | | | | | 189,000 | | | | 80,136 | |
| | | | | | | | | | |
| | | | | | | | | | |
| | | |
Leisure Products - 0.7% | | | | | | | | | | |
| | | |
Areas Worldwide SASU, TL 1L B1 06/19 | | | | | | | | | | |
| | | |
4.750% (3 Month EURIBOR + 4.750%), 07/01/2026 (a)(b) | | EUR | | | 875,023 | | | | 828,727 | |
| | | | | | | | | | |
| | | | | | | | | | |
| | | |
Life Sciences Tools & Services - 0.4% | | | | | | | | | | |
| | | |
Albany Molecular Research, Inc., TL 1L 07/17 | | | | | | | | | | |
| | | |
4.250% (3 Month US LIBOR + 3.250%), 08/30/2024 (a) | | | | | 307,254 | | | | 303,446 | |
| | | |
BioClinica-Synowledge Holdings Corp., TL 1L 10/16 | | | | | | | | | | |
| | | |
5.250% (1 Month US LIBOR + 4.500%), 10/20/2023 (a) | | | | | 236,853 | | | | 229,748 | |
| | | | | | | | | | |
| | | | | | | | | 533,194 | |
| | | | | | | | | | |
| | | |
Machinery - 1.6% | | | | | | | | | | |
| | | |
Accuride Corp.m TL 1L B 10/17 | | | | | | | | | | |
| | | |
6.250% (3 Month US LIBOR + 5.250%), 11/17/2023 (a) | | | | | 521,725 | | | | 440,531 | |
| | | |
CPM Holdings, Inc., TL 2L 10/18 | | | | | | | | | | |
| | | |
8.399% (1 Month US LIBOR + 8.250%), 11/16/2026 (a) | | | | | 92,000 | | | | 84,564 | |
See accompanying notes to financial statements.
9
| | | | |
| |
Credit Opportunities Portfolio | | October 31, 2020 |
| | | | |
| | | | | | | | | | |
Utility One Source LP, TL 1L B 02/20 | | | | | | | | | | |
| | | |
4.399% (1 Month US LIBOR + 4.250%), 04/18/2025 (a) | | | | | 626,748 | | | $ | 624,006 | |
| | | |
Welbilt, Inc. (Manitowoc Foodservice Inc), TL 1L B 10/18 | | | | | | | | | | |
| | | |
2.647% (1 Month US LIBOR + 2.500%), 10/23/2025 (a) | | | | | 583,820 | | | | 536,507 | |
| | | |
WireCo WorldGroup, Inc., TL 1L 07/16 | | | | | | | | | | |
| | | |
10.000% (6 Month US LIBOR + 9.000%), 09/30/2024 (a) | | | | | 239,000 | | | | 184,030 | |
| | | |
WireCo WorldGroup, Inc., TL 12L 07/16 | | | | | | | | | | |
| | | |
6.000% (6 Month US LIBOR + 5.000%), 09/29/2023 (a) | | | | | 87,691 | | | | 77,395 | |
| | | | | | | | | | |
| | | | | | | | | 1,947,033 | |
| | | | | | | | | | |
| | | |
Media - 2.2% | | | | | | | | | | |
| | | |
Emerald Expositions Holding, Inc., Tl 1L B 11/17 | | | | | | | | | | |
| | | |
2.647% (1 Month US LIBOR + 2.500%), 05/22/2024 (a) | | | | | 8,370 | | | | 7,600 | |
| | | |
NEP Broadcasting, LLC, TL 1L 05/20 | | | | | | | | | | |
| | | |
9.250% (1 Month US LIBOR + 0.000%), 06/01/2025 (a)(d)(e) | | | | | 122,952 | | | | 124,796 | |
| | | |
NEP Broadcasting, LLC, TL 1L 05/20 DD | | | | | | | | | | |
| | | |
0.000%, 06/01/2025 (a)(d)(e)(i) | | | | | 30,815 | | | | 462 | |
| | | |
NEP Broadcasting, LLC, TL 2L 09/18 | | | | | | | | | | |
| | | |
7.148% (1 Month US LIBOR + 7.000%), 10/19/2026 (a) | | | | | 393,000 | | | | 318,821 | |
| | | |
NEP Broadcasting, LLC, TL 1L B 09/18 EUR | | | | | | | | | | |
| | | |
3.500% (3 Month EURIBOR + 3.500%), 10/20/2025 (a) | | EUR | | | 1,219,952 | | | | 1,269,969 | |
| | | |
NEP Broadcasting, LLC, TL 1L B 09/18 | | | | | | | | | | |
| | | |
3.397% (1 Month US LIBOR + 3.250%), 10/20/2025 (a) | | | | | 1,069,560 | | | | 970,327 | |
| | | | | | | | | | |
| | | | | | | | | 2,691,975 | |
| | | | | | | | | | |
| | | |
Metals & Mining - 0.1% | | | | | | | | | | |
| | | |
Foresight Energy LLC, TL 1L A 06/20 (Exit) | | | | | | | | | | |
| | | |
9.500% (3 Month US LIBOR + 8.000%), 06/30/2027 (a)(c)(d)(e) | | | | | 150,409 | | | | 150,409 | |
| | | | | | | | | | |
| | | | | | | | | | |
| | | |
Multiline Retail - 0.3% | | | | | | | | | | |
| | | |
Belk, Inc., TL 1L B 10/19 | | | | | | | | | | |
| | | |
7.750% (6 Month US LIBOR + 6.750%), 07/31/2025 (a) | | | | | 1,192,151 | | | | 415,763 | |
| | | | | | | | | | |
| | | | | | | | | | |
| | | |
Oil, Gas & Consumable Fuels - 0.2% | | | | | | | | | | |
| | | |
Eagleclaw Midstream Ventures, TL 1L 05/17 | | | | | | | | | | |
| | | |
5.250% (3 Month US LIBOR + 4.250%), 06/24/2024 (a) | | | | | 220,292 | | | | 182,567 | |
| | | |
Oryx Midstream Services, LLC, TL 1L B 04/19 | | | | | | | | | | |
| | | |
4.147% (3 Month US LIBOR + 4.000%), 05/08/2026 (a) | | | | | 10,917 | | | | 9,962 | |
| | | | | | | | | | |
| | | | | | | | | 192,529 | |
| | | | | | | | | | |
| | | |
Personal Products - 1.1% | | | | | | | | | | |
| | | |
Coty Inc., TL 1L B 03/18 EUR | | | | | | | | | | |
| | | |
2.500% (1 Month EURIBOR + 2.500%), 04/05/2025 (a) | | EUR | | | 49,039 | | | | 52,509 | |
| | | |
Coty Inc., TL 1L B 04/18 USD | | | | | | | | | | |
| | | |
2.390% (1 Month US LIBOR + 2.250%), 04/07/2025 (a) | | | | | 1,150,653 | | | | 1,012,845 | |
| | | |
Coty Inc., TL 1L A 04/18 USD | | | | | | | | | | |
| | | |
1.890% (1 Month US LIBOR + 1.750%), 04/05/2023 (a) | | | | | 229,049 | | | | 209,580 | |
| | | |
Coty, Inc., TL 1L 04/18 EUR | | | | | | | | | | |
| | | |
1.750% (1 Month EURIBOR + 0.000%), 04/05/2023 (a) | | EUR | | | 104,885 | | | | 114,927 | |
| | | | | | | | | | |
| | | | | | | | | 1,389,861 | |
| | | | | | | | | | |
See accompanying notes to financial statements.
10
| | | | |
| |
Credit Opportunities Portfolio | | October 31, 2020 |
| | | | |
| | | | | | | | | | |
Professional Services - 0.3% | | | | | | | | | | |
| | | |
SIRVA Worldwide, Inc., TL 2L 07/18 | | | | | | | | | | |
| | | |
9.745% (3 Month US LIBOR + 9.500%), 08/03/2026 (a) | | | | | 59,000 | | | $ | 42,185 | |
| | | |
SIRVA Worldwide, Inc., TL 1L 07/18 | | | | | | | | | | |
| | | |
5.676% (3 Month US LIBOR + 5.500%), 08/04/2025 (a) | | | | | 431,371 | | | | 359,476 | |
| | | | | | | | | | |
| | | | | | | | | 401,661 | |
| | | | | | | | | | |
| | | |
Road & Rail - 2.6% | | | | | | | | | | |
| | | |
Kenan Advantage Group, Inc./The, TL 1L B2 07/15 Canadian Borrower | | | | | | | | | | |
| | | |
4.000% (1 Month US LIBOR + 3.000%), 07/31/2022 (a) | | | | | 581,365 | | | | 562,802 | |
| | | |
Kenan Advantage Group, Inc./The, TL 1L B1 07/15 | | | | | | | | | | |
| | | |
4.000% (1 Month US LIBOR + 3.000%), 07/31/2022 (a) | | | | | 2,509,935 | | | | 2,429,793 | |
| | | |
Transplace, TL 2L 09/17 | | | | | | | | | | |
| | | |
9.750% (6 Month US LIBOR + 8.750%), 10/06/2025 (a) | | | | | 180,000 | | | | 164,700 | |
| | | | | | | | | | |
| | | | | | | | | 3,157,295 | |
| | | | | | | | | | |
| | | |
Software - 4.4% | | | | | | | | | | |
| | | |
Applied Systems, Inc., TL 2L 09/17 | | | | | | | | | | |
| | | |
8.000% (3 Month US LIBOR + 7.000%), 09/19/2025 (a) | | | | | 236,000 | | | | 238,613 | |
| | | |
Gigamon, Inc., TL 1L 11/17 | | | | | | | | | | |
| | | |
5.250% (6 Month US LIBOR + 4.500%), 12/27/2024 (a) | | | | | 621,973 | | | | 614,199 | |
| | | |
Misys Ltd., TL 2L 04/17 USD | | | | | | | | | | |
| | | |
8.250% (6 Month US LIBOR + 7.250%), 06/13/2025 (a) | | | | | 846,869 | | | | 828,873 | |
| | | |
Misys Ltd., TL 2L 04/17 USD | | | | | | | | | | |
| | | |
4.500% (6 Month US LIBOR + 3.500%), 06/13/2024 (a) | | | | | 1,945,720 | | | | 1,840,864 | |
| | | |
Syncsort, Inc., TL 1L B 10/19 (Add-on) | | | | | | | | | | |
| | | |
7.000% (3 Month US LIBOR + 6.000%), 08/16/2024 (a) | | | | | 214,920 | | | | 212,234 | |
| | | |
Syncsort, Inc., TL 1L B 11/18 | | | | | | | | | | |
| | | |
6.506% (3 Month US LIBOR + 6.250%), 08/16/2024 (a) | | | | | 154,215 | | | | 151,388 | |
| | | |
TIBCO Software, Inc., TL 2L 02/20 | | | | | | | | | | |
| | | |
7.400% (1 Month US LIBOR + 7.750%), 03/03/2028 (a) | | | | | 1,585,880 | | | | 1,558,127 | |
| | | | | | | | | | |
| | | | | | | | | 5,444,298 | |
| | | | | | | | | | |
| | | |
Specialty Retail - 1.1% | | | | | | | | | | |
| | | |
Douglas Holding AG, TL 1L B1 08/17 | | | | | | | | | | |
| | | |
3.500% (3 Month EURIBOR + 3.500%), 08/12/2022 (a)(b) | | EUR | | | 387,783 | | | | 385,767 | |
| | | |
Douglas Holding AG, TL 1L B2 08/17 | | | | | | | | | | |
| | | |
3.500% (3 Month EURIBOR + 3.500%), 08/12/2022 (a)(b) | | EUR | | | 106,379 | | | | 105,826 | |
| | | |
Douglas Holding AG, TL 1L B3 08/17 | | | | | | | | | | |
| | | |
3.500% (3 Month EURIBOR + 3.250%), 08/12/2022 (a)(b) | | EUR | | | 245,864 | | | | 244,586 | |
| | | |
Douglas Holding AG, TL 1L B4 08/17 | | | | | | | | | | |
| | | |
3.500% (3 Month EURIBOR + 3.500%), 08/12/2022 (a)(b) | | EUR | | | 131,425 | | | | 130,742 | |
| | | |
Douglas Holding AG, TL 1L B5 08/17 | | | | | | | | | | |
| | | |
3.500% (3 Month EURIBOR + 3.500%), 08/12/2022 (a)(b) | | EUR | | | 39,870 | | | | 39,662 | |
| | | |
Douglas Holding AG, TL 1L B6 08/17 | | | | | | | | | | |
| | | |
3.500% (3 Month EURIBOR + 3.500%), 08/12/2022 (a)(b) | | EUR | | | 153,733 | | | | 152,933 | |
See accompanying notes to financial statements.
11
| | | | |
| |
Credit Opportunities Portfolio | | October 31, 2020 |
| | | | |
| | | | | | | | | | |
Douglas Holding AG, TL 1L B7 08/17 | | | | | | | | | | |
| | | |
3.500% (3 Month EURIBOR + 3.500%), 08/12/2022 (a)(b) | | EUR | | | 121,966 | | | $ | 121,331 | |
| | | |
Talbots, Inc., TL 1L B 11/18 | | | | | | | | | | |
| | | |
8.000% (3 Month US LIBOR + 7.000%), 11/28/2022 (a) | | | | | 212,000 | | | | 168,893 | |
| | | | | | | | | | |
| | | | | | | | | 1,349,740 | |
| | | | | | | | | | |
| | | |
Textiles, Apparel & Luxury Goods - 2.1% | | | | | | | | | | |
| | | |
Varsity Brands, Inc., TL 1L B 11/18 | | | | | | | | | | |
| | | |
4.500% (1 Month US LIBOR + 3.500%), 12/16/2024 (a) | | | | | 2,918,755 | | | | 2,534,297 | |
| | | | | | | | | | |
| | | | | | | | | | |
| | | |
Trading Companies & Distributors - 0.3% | | | | | | | | | | |
| | | |
FleetPride Corporation, TL 1L 12/18 | | | | | | | | | | |
| | | |
4.647% (3 Month US LIBOR + 4.500%), 02/04/2026 (a) | | | | | 381,942 | | | | 373,826 | |
| | | | | | | | | | |
| | | | | | | | | | |
| | | |
Transportation Infrastructure - 0.7% | | | | | | | | | | |
| | | |
Direct ChassisLink, Inc., TL 2L 04/19 | | | | | | | | | | |
| | | |
8.474% (3 Month US LIBOR + 8.250%), 04/10/2026 (a) | | | | | 881,826 | | | | 861,985 | |
| | | | | | | | | | |
TOTAL LEVERAGED LOANS (amortized cost $55,636,346) | | | | | | | | | 53,476,741 | |
| | | | | | | | | | |
| | | |
High Yield Securities - 53.2% | | | | | | | | | | |
| | | |
Aerospace & Defense - 3.7% | | | | | | | | | | |
| | | |
Avolon Holdings Ltd. | | | | | | | | | | |
| | | |
5.500%, 01/15/2026 (b)(f) | | | | | 214,000 | | | | 219,005 | |
| | | |
4.375%, 05/01/2026 (b)(f) | | | | | 1,276,000 | | | | 1,239,818 | |
| | | |
3.250%, 02/15/2027 (b)(f) | | | | | 323,000 | | | | 295,384 | |
| | | |
2.875%, 02/15/2025 (b)(f) | | | | | 103,000 | | | | 97,264 | |
| | | |
5.500%, 02/15/2024 (b)(f) | | | | | 64,000 | | | | 66,165 | |
| | | |
TransDigm, Inc. | | | | | | | | | | |
| | | |
8.000%, 12/15/2025 (f) | | | | | 963,000 | | | | 1,042,207 | |
| | | |
6.500%, 07/15/2024 | | | | | 1,627,000 | | | | 1,628,016 | |
| | | | | | | | | | |
| | | | | | | | | 4,587,859 | |
| | | | | | | | | | |
| | | |
Auto Components - 0.3% | | | | | | | | | | |
| | | |
BBB Industries, LLC | | | | | | | | | | |
| | | |
9.250%, 08/01/2025 (f) | | | | | 425,000 | | | | 421,281 | |
| | | | | | | | | | |
| | | | | | | | | | |
| | | |
Biotechnology - 0.2% | | | | | | | | | | |
| | | |
Radius Health, Inc. | | | | | | | | | | |
| | | |
3.000%, 09/01/2024 | | | | | 326,000 | | | | 273,139 | |
| | | | | | | | | | |
| | | | | | | | | | |
| | | |
Building Products - 1.5% | | | | | | | | | | |
| | | |
Beacon Roofing Supply, Inc. | | | | | | | | | | |
| | | |
4.875%, 11/01/2025 (f) | | | | | 929,000 | | | | 913,035 | |
| | | |
Cornerstone Building Brands, Inc. | | | | | | | | | | |
| | | |
6.125%, 01/15/2029 (f) | | | | | 143,000 | | | | 146,350 | |
| | | |
SRS Distribution, Inc. | | | | | | | | | | |
| | | |
8.250%, 07/01/2026 (f) | | | | | 687,000 | | | | 726,503 | |
| | | | | | | | | | |
| | | | | | | | | 1,785,888 | |
| | | | | | | | | | |
See accompanying notes to financial statements.
12
| | | | |
| |
Credit Opportunities Portfolio | | October 31, 2020 |
| | | | |
| | | | | | | | | | |
Capital Markets - 0.5% | | | | | | | | | | |
| | | |
Blackstone Mortgage Trust, Inc. | | | | | | | | | | |
| | | |
4.375%, 05/05/2022 | | | | | 637,000 | | | $ | 624,260 | |
| | | | | | | | | | |
| | | | | | | | | | |
| | | |
Chemicals - 0.1% | | | | | | | | | | |
| | | |
Cornerstone Chemical Co. | | | | | | | | | | |
| | | |
6.750%, 08/15/2024 (f) | | | | | 125,000 | | | | 117,956 | |
| | | | | | | | | | |
| | | | | | | | | | |
Commercial Services & Supplies - 2.3% | | | | | | | | | | |
| | | |
Multi-Color Corp | | | | | | | | | | |
| | | |
10.500%, 07/15/2027 (f) | | | | | 858,000 | | | | 923,959 | |
| | | |
6.750%, 07/15/2026 (f) | | | | | 273,000 | | | | 286,705 | |
| | | |
Vivint, Inc. | | | | | | | | | | |
| | | |
7.875%, 12/01/2022 | | | | | 541,000 | | | | 540,178 | |
| | | |
7.625%, 09/01/2023 | | | | | 1,015,000 | | | | 1,024,896 | |
| | | | | | | | | | |
| | | | | | | | | 2,775,738 | |
| | | | | | | | | | |
| | | |
Communications Equipment - 0.6% | | | | | | | | | | |
| | | |
Genesys Telecommunications Laboratories, Inc. | | | | | | | | | | |
| | | |
10.000%, 11/30/2024 (f) | | | | | 639,000 | | | | 675,072 | |
| | | | | | | | | | |
| | | | | | | | | | |
| | | |
Construction & Engineering - 2.0% | | | | | | | | | | |
| | | |
Maxim Crane Works LP / Maxim Finance Corp. | | | | | | | | | | |
| | | |
10.125%, 08/01/2024 (f) | | | | | 2,301,000 | | | | 2,335,756 | |
| | | |
Pike Corp. | | | | | | | | | | |
| | | |
5.500%, 09/01/2028 (f) | | | | | 93,000 | | | | 95,345 | |
| | | | | | | | | | |
| | | | | | | | | 2,431,101 | |
| | | | | | | | | | |
| | | |
Construction Materials - 0.3% | | | | | | | | | | |
| | | |
Cemex Materials LLC | | | | | | | | | | |
| | | |
7.700%, 07/21/2025 (f) | | | | | 363,000 | | | | 391,119 | |
| | | | | | | | | | |
| | | | | | | | | | |
| | | |
Containers & Packaging - 0.2% | | | | | | | | | | |
| | | |
Plastipak Holdings, Inc. | | | | | | | | | | |
| | | |
6.250%, 10/15/2025 (f) | | | | | 207,000 | | | | 207,647 | |
| | | | | | | | | | |
| | | | | | | | | | |
| | | |
Diversified Consumer Services - 1.9% | | | | | | | | | | |
| | | |
Expedia Group, Inc. | | | | | | | | | | |
| | | |
6.250%, 05/01/2025 (f) | | | | | 1,618,000 | | | | 1,780,822 | |
| | | |
4.625%, 08/01/2027 (f) | | | | | 502,000 | | | | 526,649 | |
| | | | | | | | | | |
| | | | | | | | | 2,307,471 | |
| | | | | | | | | | |
| | | |
Diversified Telecommunication Services - 1.6% | | | | | | | | | | |
| | | |
Zayo Group LLC | | | | | | | | | | |
| | | |
6.125%, 03/01/2028 (f) | | | | | 1,972,000 | | | | 1,992,647 | |
| | | | | | | | | | |
| | | | | | | | | | |
See accompanying notes to financial statements.
13
| | | | |
| |
Credit Opportunities Portfolio | | October 31, 2020 |
| | | | |
| | | | | | | | | | |
Electronic Equipment, Instruments & Components - 3.5% | | | | | | | | | | |
| | | |
CommScope, Inc. | | | | | | | | | | |
| | | |
8.250%, 03/01/2027 (f) | | | | | 2,727,000 | | | $ | 2,825,853 | |
| | | |
6.000%, 06/15/2025 (f) | | | | | 1,467,000 | | | | 1,456,334 | |
| | | | | | | | | | |
| | | | | | | | | 4,282,187 | |
| | | | | | | | | | |
| | | |
Energy Equipment & Services - 0.3% | | | | | | | | | | |
| | | |
Archrock Partners LP / Archrock Partners Finance Corp | | | | | | | | | | |
| | | |
6.875%, 04/01/2027 (f) | | | | | 324,000 | | | | 318,330 | |
| | | |
Transocean, Inc. | | | | | | | | | | |
| | | |
11.500%, 01/30/2027 (f) | | | | | 73,000 | | | | 24,271 | |
| | | | | | | | |
| | | | | | | | | 342,601 | |
| | | | | | | | | | |
| | | |
Entertainment - 0.3% | | | | | | | | | | |
| | | |
Live Nation Entertainment, Inc. | | | | | | | | | | |
| | | |
6.500%, 05/15/2027 (f) | | | | | 333,000 | | | | 356,736 | |
| | | | | | | | |
| | | | | | | | | | |
| | | |
Health Care Equipment & Supplies - 0.7% | | | | | | | | | | |
| | | |
Ortho-Clinical Diagnostics Inc. / Ortho-Clinical Diagnostics SA | | | | | | | | | | |
| | |
7.375%, 06/01/2025 (f) | | | 848,000 | | | | 896,230 | |
| | | | | | | | | | |
| | | | | | | | | | |
| | | |
Health Care Providers & Services - 1.8% | | | | | | | | | | |
| | | |
CHS/Community Health Systems, Inc. | | | | | | | | | | |
| | | |
8.000%, 03/15/2026 (f) | | | | | 986,000 | | | | 990,930 | |
| | | |
LifePoint Hospitals, Inc. | | | | | | | | | | |
| | | |
9.750%, 12/01/2026 (f) | | | | | 295,000 | | | | 318,600 | |
| | | |
Radiology Partners Inc. | | | | | | | | | | |
| | | |
9.250%, 02/01/2028 (f) | | | | | 849,000 | | | | 907,140 | |
| | | | | | | | | | |
| | | | | | | | | 2,216,670 | |
| | | | | | | | | | |
| | | |
Health Care Technology - 0.3% | | | | | | | | | | |
| | | |
Verscend Holding Corp. | | | | | | | | | | |
| | | |
9.750%, 08/15/2026 (f) | | | | | 386,000 | | | | 415,674 | |
| | | | | | | | | | |
| | | | | | | | | | |
| | | |
Hotels, Restaurants & Leisure - 9.8% | | | | | | | | | | |
| | | |
Boyd Gaming Corp | | | | | | | | | | |
| | | |
6.375%, 04/01/2026 | | | | | 663,000 | | | | 688,837 | |
| | | |
Boyd Gaming Corp. | | | | | | | | | | |
| | | |
6.000%, 08/15/2026 | | | | | 808,000 | | | | 830,826 | |
| | | |
ClubCorp Club Operations, Inc. | | | | | | | | | | |
| | | |
8.500%, 09/15/2025 (f) | | | | | 1,094,000 | | | | 906,538 | |
| | | |
Diamond Resorts International, Inc. | | | | | | | | | | |
| | | |
10.750%, 09/01/2024 (f) | | | | | 591,000 | | | | 538,487 | |
| | | |
7.750%, 09/01/2023 (f) | | | | | 1,712,000 | | | | 1,612,739 | |
| | | |
Enterprise Development Authority/The | | | | | | | | | | |
| | | |
12.000%, 07/15/2024 (f) | | | | | 1,252,000 | | | | 1,389,720 | |
| | | |
Marriott International Inc | | | | | | | | | | |
| | | |
5.750%, 05/01/2025 (c)(d) | | | | | 1,914,000 | | | | 2,133,766 | |
See accompanying notes to financial statements.
14
| | | | |
| |
Credit Opportunities Portfolio | | October 31, 2020 |
| | | | |
| | | | | | | | | | |
Marriott International Inc/MD | | | | | | | | | | |
| | | |
4.625%, 06/15/2030 (c)(d) | | | | | 13,000 | | | $ | 13,887 | |
| | | |
Merlin Entertainments PLC | | | | | | | | | | |
| | | |
6.625%, 11/15/2027 (b)(f) | | | | | 1,267,000 | | | | 1,100,326 | |
| | | |
5.750%, 06/15/2026 (b)(f) | | | | | 690,000 | | | | 637,256 | |
| | | |
7.000%, 05/15/2025 (b)(f) | | EUR | | | 783,000 | | | | 892,899 | |
Powdr Corp. | | | | | | | | | | |
| | | |
6.000%, 08/01/2025 (f) | | | | | 443,000 | | | | 448,338 | |
| | | |
Station Casinos LLC | | | | | | | | | | |
| | | |
4.500%, 02/15/2028 (f) | | | | | 635,000 | | | | 602,853 | |
| | | |
Viking Cruises Ltd. | | | | | | | | | | |
| | | |
13.000%, 05/15/2025 (f) | | | | | 237,000 | | | | 268,847 | |
| | | | | | | | | | |
| | | | | | | | | 12,065,319 | |
| | | | | | | | | | |
| | | |
Insurance - 3.2% | | | | | | | | | | |
| | | |
Alliant Holdings I, Inc. | | | | | | | | | | |
| | | |
6.750%, 10/15/2027 (f) | | | | | 338,000 | | | | 355,471 | |
| | | |
AmWINS Group, Inc. | | | | | | | | | | |
| | | |
7.750%, 07/01/2026 (f) | | | | | 122,000 | | | | 130,669 | |
| | | |
Aspen Insurance Holdings Ltd. | | | | | | | | | | |
| | | |
7.625%, 10/15/2025 (f)(h) | | | | | 984,000 | | | | 984,000 | |
| | | |
Hub International Ltd. | | | | | | | | | | |
| | | |
7.000%, 05/01/2026 (f) | | | | | 750,000 | | | | 769,504 | |
| | | |
National Financial Partners Corp | | | | | | | | | | |
| | | |
7.000%, 05/15/2025 (f) | | | | | 69,000 | | | | 73,269 | |
| | | |
6.875%, 08/15/2028 (f) | | | | | 625,000 | | | | 607,031 | |
| | | |
Radian Group, Inc. | | | | | | | | | | |
| | | |
6.625%, 03/15/2025 | | | | | 948,000 | | | | 1,027,988 | |
| | | | | | | | | | |
| | | | | | | | | 3,947,932 | |
| | | | | | | | | | |
| | | |
IT Services - 0.2% | | | | | | | | | | |
| | | |
Dun & Bradstreet Corp./The | | | | | | | | | | |
| | | |
10.250%, 02/15/2027 (f) | | | | | 56,000 | | | | 62,833 | |
| | | |
Sabre, Inc. | | | | | | | | | | |
| | | |
9.250%, 04/15/2025 (f) | | | | | 193,000 | | | | 213,024 | |
| | | | | | | | | | |
| | | | | | | | | 275,857 | |
| | | | | | | | | | |
| | | |
Machinery - 2.0% | | | | | | | | | | |
| | | |
Welbilt, Inc. (Manitowoc Foodservice, Inc.) | | | | | | | | | | |
| | | |
9.500%, 02/15/2024 | | | | | 2,380,000 | | | | 2,420,662 | |
| | | | | | | | | | |
| | | | | | | | | | |
| | | |
Media - 0.8% | | | | | | | | | | |
| | | |
Intelsat Jackson Holdings SA | | | | | | | | | | |
| | | |
0.000%, 08/01/2023 (b)(g) | | | | | 207,000 | | | | 121,871 | |
| | | |
Outfront Media Capital LLC | | | | | | | | | | |
| | | |
5.000%, 08/15/2027 (f) | | | | | 9,000 | | | | 8,543 | |
| | | |
4.625%, 03/15/2030 (f) | | | | | 930,000 | | | | 855,600 | |
| | | | | | | | | | |
| | | | | | | | | 986,014 | |
| | | | | | | | | | |
See accompanying notes to financial statements.
15
| | | | |
| |
Credit Opportunities Portfolio | | October 31, 2020 |
| | | | |
| | | | | | | | | | |
Multiline Retail - 0.0% | | | | | | | | | | |
| | | |
JC Penney Corp, Inc. | | | | | | | | | | |
| | | |
8.625%, 03/15/2025 (c)(d)(f)(g) | | | | | 98,000 | | | $ | 1,169 | |
| | | | | | | | | | |
| | | | | | | | | | |
| | | |
Oil, Gas & Consumable Fuels - 6.9% | | | | | | | | | | |
| | | |
Energy Transfer Operating LP | | | | | | | | | | |
| | | |
3.750%, 05/15/2030 | | | | | 939,000 | | | | 921,643 | |
Global Partners LP / GLP Finance Corp | | | | | | | | | | |
| | | |
7.000%, 08/01/2027 | | | | | 574,000 | | | | 592,577 | |
| | | |
Global Partners LP / GLP Finance Corp. | | | | | | | | | | |
| | | |
6.875%, 01/15/2029 (f) | | | | | 364,000 | | | | 375,803 | |
| | | |
Indigo Natural Resources, LLC | | | | | | | | | | |
| | | |
6.875%, 02/15/2026 (f) | | | | | 1,239,000 | | | | 1,220,414 | |
| | | |
Parsley Energy, Inc. | | | | | | | | | | |
| | | |
5.625%, 10/15/2027 (f) | | | | | 166,000 | | | | 176,832 | |
| | | |
5.375%, 01/15/2025 (f) | | | | | 1,084,000 | | | | 1,110,423 | |
| | | |
PBF Holding Co. LLC / PBF Finance Corp. | | | | | | | | | | |
| | | |
6.000%, 02/15/2028 (f) | | | | | 28,000 | | | | 10,868 | |
| | | |
Rockies Express Pipeline LLC | | | | | | | | | | |
| | | |
4.800%, 05/15/2030 (f) | | | | | 31,000 | | | | 29,438 | |
| | | |
3.600%, 05/15/2025 (f) | | | | | 533,000 | | | | 533,000 | |
| | | |
Tallgrass Energy Partners LP / Tallgrass Energy Finance Corp | | | | | | | | | | |
| | | |
6.000%, 03/01/2027 (f) | | | | | 211,000 | | | | 199,923 | |
| | | |
Tallgrass Energy Partners LP / Tallgrass Energy Finance Corp. | | | | | | | | | | |
| | | |
4.750%, 10/01/2023 (f) | | | | | 1,559,000 | | | | 1,485,438 | |
| | | |
Targa Resources Partners LP / Targa Resources Partners Finance Corp. | | | | | | | | | | |
| | | |
5.000%, 01/15/2028 | | | | | 458,000 | | | | 453,134 | |
| | | |
Viper Energy Partners LP | | | | | | | | | | |
| | | |
5.375%, 11/01/2027 (f) | | | | | 1,274,000 | | | | 1,302,525 | |
| | | |
WPX Energy, Inc. | | | | | | | | | | |
| | | |
4.500%, 01/15/2030 | | | | | 81,000 | | | | 77,882 | |
| | | | | | | | | | |
| | | | | | | | | 8,489,900 | |
| | | | | | | | | | |
| | | |
Road & Rail - 0.7% | | | | | | | | | | |
| | | |
Kenan Advantage Group, Inc./The | | | | | | | | | | |
| | | |
7.875%, 07/31/2023 (f) | | | | | 778,000 | | | | 780,836 | |
| | | | | | | | | | |
| | | | | | | | | | |
| | | |
Software - 2.0% | | | | | | | | | | |
| | | |
Solera Holdings, Inc. | | | | | | | | | | |
| | | |
10.500%, 03/01/2024 (f) | | | | | 2,317,000 | | | | 2,408,567 | |
| | | | | | | | | | |
| | | | | | | | | | |
| | | |
Textiles, Apparel & Luxury Goods - 0.9% | | | | | | | | | | |
| | | |
Lycra | | | | | | | | | | |
| | | |
7.500%, 05/01/2025 (b)(f) | | | | | 335,000 | | | | 236,175 | |
| | | |
5.375%, 05/01/2023 (b)(f) | | EUR | | | 736,000 | | | | 578,596 | |
See accompanying notes to financial statements.
16
| | | | |
| |
Credit Opportunities Portfolio | | October 31, 2020 |
| | | | |
| | | | | | | | | | |
Varsity Brands, Inc. | | | | | | | | | | |
| | | |
9.000% (3 Month LIBOR USD + 8.000%), 12/22/2024 (a)(f) | | | | | 309,000 | | | $ | 297,799 | |
| | | | | | | | | | |
| | | | | | | | | 1,112,570 | |
| | | | | | | | | | |
| | | |
Thrifts & Mortgage Financing - 0.9% | | | | | | | | | | |
| | | |
MGIC Investment Corp. | | | | | | | | | | |
| | | |
5.250%, 08/15/2028 | | | | | 1,070,000 | | | | 1,101,431 | |
| | | | | | | | | | |
| | | | | | | | | | |
| | | |
Trading Companies & Distributors - 3.7% | | | | | | | | | | |
| | | |
AerCap Holdings | | | | | | | | | | |
| | | |
6.500%, 07/15/2025 (b) | | | | | 1,257,000 | | | | 1,384,716 | |
| | | |
4.625%, 10/15/2027 (b) | | | | | 1,126,000 | | | | 1,116,563 | |
Neon Holdings, Inc. | | | | | | | | | | |
| | | |
10.125%, 04/01/2026 (f) | | | | | 852,000 | | | | 905,250 | |
| | | |
TruckPro LLC | | | | | | | | | | |
| | | |
11.000%, 10/15/2024 (f) | | | | | 691,000 | | | | 696,183 | |
| | | |
White Cap Buyer LLC | | | | | | | | | | |
| | | |
6.875%, 10/15/2028 (f) | | | | | 433,000 | | | | 444,637 | |
| | | | | | | | | | |
| | | | | | | | | 4,547,349 | |
| | | | | | | | | | |
TOTAL HIGH YIELD SECURITIES (amortized cost $61,043,440) | | | | | | | | | 65,238,882 | |
| | | | | | | | | | |
| | | |
Collateralized Loan Obligations - 1.1% | | | | | | | | | | |
| | | |
Diversified Financial Services - 1.1% | | | | | | | | | | |
| | | |
Octagon Investment Partners 48 Ltd. | | | | | | | | | | |
| | | |
7.892% (3 Month LIBOR USD + 7.660%), 10/20/2031 (a)(d)(e)(f) | | | | | 53,100 | | | | 52,348 | |
| | | |
TICP CLO Ltd. | | | | | | | | | | |
| | | |
5.818% (3 Month LIBOR USD + 5.600%), 01/20/2031 (a)(d)(e)(f) | | | | | 738,460 | | | | 663,822 | |
| | | |
TRESTLES CLO, LLC | | | | | | | | | | |
| | | |
6.895% (3 Month LIBOR USD + 6.680%), 07/25/2029 (a)(d)(e)(f) | | | | | 693,640 | | | | 649,632 | |
| | | | | | | | | | |
| | | | | | | | | 1,365,802 | |
| | | | | | | | | | |
TOTAL COLLATERALIZED LOAN OBLIGATIONS (amortized cost $1,279,648) | | | | | | | | | 1,365,802 | |
| | | | | | | | | | |
| | | |
Common Stocks - 0.7% | | | | | | | | | | |
| | | |
Health Care Providers & Services - 0.0% | | | | | | | | | | |
| | | |
Quorum Health Corp. (d)(e)(g) | | | | | 214,074 | | | | 36,889 | |
| | | | | | | | | | |
| | | |
Hotels, Restaurants & Leisure - 0.2% | | | | | | | | | | |
| | | |
Six Flags Entertainment Corp. | | | | | 10,937 | | | | 236,458 | |
| | | | | | | | | | |
| | | |
Machinery - 0.3% | | | | | | | | | | |
| | | |
Welbilt, Inc. (g) | | | | | 59,614 | | | | 362,453 | |
| | | | | | | | | | |
| | | |
Metals & Mining - 0.2% | | | | | | | | | | |
| | | |
Foresight Energy LLC (c)(d)(e)(g) | | | | | 17,979 | | | | 268,665 | |
| | | | | | | | | | |
TOTAL COMMON STOCKS (cost $984,139) | | | | | | | | | 904,465 | |
| | | | | | | | | | |
| | | |
TOTAL INVESTMENTS (cost $118,943,573) (j) - 98.7% | | | | | | | | | 120,985,890 | |
| | | | | | | | | | |
OTHER ASSETS EXCEEDING LIABILITIES, NET - 1.3% | | | | | | | | | 1,640,095 | |
| | | | | | | | | | |
NET ASSETS - 100.0% | | | | | | | | $ | 122,625,985 | |
| | | | | | | | | | |
See accompanying notes to financial statements.
17
| | | | |
| |
Credit Opportunities Portfolio | | October 31, 2020 |
| | | | |
| † | | In U.S. Dollars unless otherwise indicated. | |
| (a) | | Variable rate security, the coupon rate shown is the effective rate as of October 31, 2020. | |
| (c) | | Security considered restricted due to the Adviser’s knowledge of material non-public information. The total value of these securities as of October 31, 2020 was $3,031,371 and represented 2.5% of net assets. | |
| (d) | | Security considered illiquid, as defined by the Securities and Exchange Commission. The total value of these securities as of October 31, 2020 was $4,967,219 and represented 4.1% of net assets. | |
| (e) | | Value determined using significant unobservable inputs. | |
| (f) | | Securities exempt from registration pursuant to Rule 144A under the Securities Act of 1933, as amended. These securities may only be resold to qualified institutional buyers in transactions exempt from registration. The total value of these securities as of October 31, 2020 was $49,628,412, which represent 40.5% of net assets. | |
| (g) | | Non-income producing security. | |
| (h) | | Represents a payment-in-kind (“PIK”) security which may pay interest/dividend in additional par/shares. | |
| (i) | | Represents unfunded loan commitments. | |
| (j) | | All investments are held as collateral for the Fund’s credit facility. | |
The following table represents the Fund’s investments categorized by country of risk as of October 31, 2020:
| | | | | | |
| | | Country: | | % of Net Assets | |
| | |
| | United States | | | 86.4% | |
| | |
| | Netherlands | | | 2.7% | |
| | |
| | Germany | | | 2.2% | |
| | |
| | United Kingdom | | | 2.2% | |
| | |
| | Ireland | | | 1.6% | |
| | |
| | France | | | 1.6% | |
| | |
| | Sweden | | | 1.1% | |
| | |
| | Spain | | | 0.5% | |
| | |
| | Luxembourg | | | 0.4% | |
| | | | | | |
| | | | | 98.7% | |
| | | | | | |
| | Other Assets Exceeding Liabilities, Net | | | 1.3% | |
| | | | | | |
| | | | | 100.0% | |
| | | | | | |
See accompanying notes to financial statements.
18
| | | | |
| |
Credit Opportunities Portfolio | | October 31, 2020 |
| | | | |
Statement of Assets and Liabilities
As of October 31, 2020
| | | | |
Assets | | | | |
| |
Investments, at value (amortized cost $118,943,573) | | $ | 120,985,890 | |
| |
Cash and cash equivalents | | | 3,333,913 | |
| |
Receivable for shares issued | | | 9,982,000 | |
| |
Dividends and interest receivable | | | 1,474,918 | |
| |
Due from Adviser | | | 108,242 | |
| |
Receivable for investments sold | | | 26,795 | |
| |
Deferred offering costs | | | 277,543 | |
| | | | |
Total assets | | | 136,189,301 | |
| | | | |
| |
Liabilities | | | | |
| |
Credit Facility (net of deferred financing costs of $137,606) | | | 5,400,635 | |
| |
Payable for investments purchased | | | 6,882,940 | |
| |
Distribution Payable | | | 654,598 | |
| |
Investment advisory fees | | | 64,506 | |
| |
Trustees’ fees | | | 81,330 | |
| |
Other accrued expenses | | | 479,307 | |
| | | | |
Total liabilities | | | 13,563,316 | |
| | | | |
Net assets | | $ | 122,625,985 | |
| | | | |
| |
Net Assets | | | | |
| |
Paid-in capital — (unlimited shares authorized — $0.001 par value) | | $ | 118,259,112 | |
| |
Retained earnings | | | 4,366,873 | |
| | | | |
Net assets | | $ | 122,625,985 | |
| | | | |
| |
Class I: | | | | |
| |
Net asset value | | $ | 106,962,353 | |
| | | | |
Price per share (4,101,236.495 shares) | | $ | 26.08 | |
| | | | |
| |
Class T: | | | | |
| |
Net asset value | | $ | 8,242,632 | |
| | | | |
Price per share (319,080.643 shares) | | $ | 25.83 | |
| | | | |
| |
Class U: | | | | |
| |
Net asset value | | $ | 7,421,000 | |
| | | | |
Price per share (296,840.000 shares) | | $ | 25.00 | |
| | | | |
See accompanying notes to financial statements.
19
| | | | |
| |
Credit Opportunities Portfolio | | October 31, 2020 |
| | | | |
Statement of Operations
| | | | |
| | | Year Ended
October 31, 2020 | |
Investment income | | | | |
| |
Interest income | | $ | 4,881,265 | |
| |
Dividend income | | | 5,390 | |
| |
Other income | | | 313,032 | |
| | | | |
Total investment income | | | 5,199,687 | |
| | | | |
Expenses | | | | |
| |
Investment advisory fees | | | 444,324 | |
| |
Credit facility interest expense | | | 270,580 | |
| |
Offering Costs | | | 570,017 | |
| |
Organizational Costs | | | 304,805 | |
| |
Legal fees | | | 349,545 | |
| |
Administration fees | | | 129,709 | |
| |
Term loan expense | | | 126,483 | |
| |
Audit and tax fees | | | 82,500 | |
| |
Trustees’ fees | | | 80,004 | |
| |
Transfer agent fees | | | 35,851 | |
| |
Shareholder reporting expense | | | 27,203 | |
| |
Custodian fees | | | 15,653 | |
| |
Other expenses | | | 117,285 | |
| | | | |
Total expenses prior to expense reimbursement | | | 2,553,959 | |
| |
Expense reimbursement | | | (1,434,841 | ) |
| | | | |
Net expenses | | | 1,119,118 | |
| | | | |
| |
Net investment income | | | 4,080,569 | |
| | | | |
| |
Realized and unrealized gain (loss) | | | | |
| |
Net realized gain (loss) on | | | | |
| |
Investments | | | 2,441,940 | |
| |
Foreign currency transactions | | | (159,874 | ) |
| | | | |
Net realized gain | | | 2,282,066 | |
| |
Net change in unrealized appreciation (depreciation) on | | | | |
| |
Investments | | | 1,761,183 | |
| |
Foreign currency translation | | | 398,673 | |
| |
Deferred Trustees’ fees | | | (8,826 | ) |
| | | | |
Net change in unrealized appreciation (depreciation) | | | 2,151,030 | |
| |
Net realized and unrealized gain (loss) | | | 4,433,096 | |
| | | | |
Net increase in net assets resulting from operations | | $ | 8,513,665 | |
| | | | |
See accompanying notes to financial statements.
20
| | | | |
| |
Credit Opportunities Portfolio | | October 31, 2020 |
| | | | |
Statements of Changes in Net Assets
| | | | |
| | | Year Ended
October 31, 2020 | |
Increase (decrease) in net assets resulting from operations | | | | |
| |
Net investment income | | $ | 4,080,569 | |
| |
Net realized gain on investments | | | 2,282,066 | |
| |
Net change in unrealized appreciation | | | 2,151,030 | |
| | | | |
Net increase in net assets resulting from operations | | | 8,513,665 | |
| | | | |
| |
Dividends to shareholders from | | | | |
| |
Net dividend and distributions — Class I | | | (4,076,334 | ) |
| |
Net dividend and distributions — Class T | | | (70,458 | ) |
| |
Net dividend and distributions — Class U | | | — | |
| | | | |
Total distributions | | | (4,146,792 | ) |
| | | | |
Shareholder transactions | | | | |
| |
Class I | | | | |
| |
Subscriptions | | | 102,640,250 | |
| |
Issued to shareholder in reinvestment of distributions | | | 769 | |
| |
Shares redeemed | | | — | |
| | | | |
| | | 102,641,019 | |
| | | | |
Class T | | | | |
| |
Subscriptions | | | 8,164,260 | |
| |
Issued to shareholder in reinvestment of distributions | | | 32,833 | |
| |
Shares redeemed | | | — | |
| | | | |
| | | 8,197,093 | |
| | | | |
Class U | | | | |
| |
Subscriptions | | | 7,421,000 | |
| |
Issued to shareholder in reinvestment of distributions | | | — | |
| |
Shares redeemed | | | — | |
| | | | |
| | | 7,421,000 | |
| | | | |
Net increase in net assets | | $ | 122,625,985 | |
| |
Net assets | | | | |
| |
Beginning of year | | $ | — | |
| | | | |
End of year | | $ | 122,625,985 | |
| | | | |
See accompanying notes to financial statements.
21
| | | | |
| |
Credit Opportunities Portfolio | | October 31, 2020 |
| | | | |
Statement of Cash Flows
| | | | |
| | | Year Ended
October 31, 2020 | |
Cash Flows from Operating Activities: | | | | |
| |
Net increase in net assets resulting from operations | | $ | 8,513,665 | |
| |
Adjustments to reconcile net increase in net assets resulting from operations to net cash used in operating activities: | | | | |
| |
Purchases of investments | | | (136,147,227 | ) |
| |
Proceeds from sales of investments | | | 65,125,004 | |
| |
Net amortization (accretion) of premiums/discounts | | | (753,643 | ) |
| |
Net change in unrealized appreciation of investments | | | (1,761,183 | ) |
| |
Net change in unrealized appreciation on foreign currency transactions | | | (398,673 | ) |
| |
Net change in unrealized depreciation on deferred Trustees’ fees | | | 8,826 | |
| |
Net realized gain from investments | | | (2,441,940 | ) |
| |
Net realized gain on investments (foreign currency related) | | | (13,475 | ) |
| |
Amortization of deferred financing costs | | | 80,768 | |
| |
Changes in assets and liabilities: | | | | |
| |
Increase in receivable for investments sold | | | (25,483 | ) |
| |
Increase in dividends and interest receivable | | | (1,474,225 | ) |
| |
Increase in due from Adviser | | | (94,221 | ) |
| |
Increase in deferred offering costs | | | (74,380 | ) |
| |
Increase in investment advisory fees payable | | | 64,506 | |
| |
Increase in payable for investments purchased | | | 6,908,645 | |
| |
Increase in Trustees’ fees payable | | | 72,504 | |
| |
Increase in accrued expenses and other liabilities | | | 197,357 | |
| | | | |
Net cash used in operating activities | | | (62,213,175 | ) |
| | | | |
Cash Flows from Financing Activities | | | | |
| |
Subscriptions for shares, net of change in receivable | | | 63,531,218 | |
| |
Cash dividends paid to shareholders, net of reinvestments | | | (3,458,592 | ) |
| |
Deferred financing costs paid | | | (153,374 | ) |
| |
Proceeds from credit facility | | | 5,637,413 | |
| | | | |
Net cash provided by financing activities | | | 65,556,665 | |
| | | | |
| |
Effect of exchange rate changes on cash | | | (9,577 | ) |
| | | | |
Net increase in cash and cash equivalents | | $ | 3,333,913 | |
| | | | |
| |
Cash and Cash Equivalents | | | | |
| |
Beginning balance | | | — | |
| | | | |
Ending balance | | $ | 3,333,913 | |
| | | | |
| |
Supplemental Disclosure of cash flow information and non-cash financing activities: | | | | |
| |
Cash paid for interest expense | | $ | 130,616 | |
Deferred financing costs accrued in other accrued expenses | | $ | 65,000 | |
Shares issued in exchange for investments | | $ | 44,712,292 | |
| | | | |
See accompany notes to financial statements.
22
| | | | |
| |
Credit Opportunities Portfolio | | October 31, 2020 |
| | | | |
Financial Highlights
Period from February 28, 2020 (commencement of operations) to October 31, 2020.
| | | | |
| | | Period from
Commencement of
Operations to
October 31, 2020*** | |
Class I | | | | |
| |
Per share operating performance | | | | |
| |
Net asset value, beginning of year | | $ | 25.00 | |
| |
Income from operations | | | | |
| |
Net investment income(1) | | | 1.01 | |
| |
Net realized and unrealized gain | | | 1.10 | |
| | | | |
Total income from operations | | | 2.11 | |
| |
Dividends from | | | | |
| |
Net investment income | | | (1.03 | ) |
| | | | |
Total dividends | | | (1.03 | ) |
| | | | |
Net Asset Value, end of year | | $ | 26.08 | |
| | | | |
Total return†(2) | | | 8.71% | |
| | | | |
| |
Ratios to average net assets** | | | | |
| |
Expenses, before waiver | | | 3.84% | |
| |
Expenses, after waiver | | | 1.68% | |
| |
Net investment income, before waiver | | | 3.91% | |
| |
Net investment income, after waiver | | | 6.06% | |
| |
Supplemental data | | | | |
| |
Net assets, end of year (000’s) | | $ | 106,962 | |
| |
Portfolio turnover rate(2)* | | | 66.19% | |
| (1) | Per share calculations were performed using average shares. |
| (2) | Total return and portfolio turnover rate are for the period indicated and have not been annualized. |
| † | Total return assumes a purchase of common stock at the net asset value on the first day and a sale at the net asset value on the last day of each period reported on the table. Total return assumes reinvestment of dividends and distributions at prices obtained pursuant to the Fund’s dividend reinvestment plan. |
| * | Portfolio turnover is calculated on the basis of the Fund as a whole. |
| *** | The date of commencement of operations for Class I shares was February 28, 2020. |
23
| | | | |
| |
Credit Opportunities Portfolio | | October 31, 2020 |
| | | | |
Financial Highlights
Period from February 28, 2020 (commencement of operations) to October 31, 2020.
| | | | |
| | | Period from
Commencement of
Operations to
October 31, 2020*** | |
Class T | | | | |
| |
Per share operating performance | | | | |
| |
Net asset value, beginning of year | | $ | 25.00 | |
| |
Income from operations | | | | |
| |
Net investment income(1) | | | 0.61 | |
| |
Net realized and unrealized gain | | | 0.83 | |
| | | | |
Total income from operations | | | 1.44 | |
| |
Dividends from | | | | |
| |
Net investment income | | | (0.61 | ) |
| | | | |
Total dividends | | | (0.61 | ) |
| | | | |
Net Asset Value, end of year | | $ | 25.83 | |
| | | | |
Total return†(2) | | | 6.65% | |
| | | | |
| |
Ratios to average net assets** | | | | |
| |
Expenses, before waiver | | | 3.54% | |
| |
Expenses, after waiver | | | 2.49% | |
| |
Net investment income, before waiver | | | 4.65% | |
| |
Net investment income, after waiver | | | 5.70% | |
| |
Supplemental data | | | | |
| |
Net assets, end of year (000’s) | | $ | 8,243 | |
| |
Portfolio turnover rate(2)* | | | 66.19% | |
| (1) | Per share calculations were performed using average shares. |
| (2) | Total return and portfolio turnover rate are for the period indicated and have not been annualized. |
| † | Total return assumes a purchase of common stock at the net asset value on the first day and a sale at the net asset value on the last day of each period reported on the table. Total return assumes reinvestment of dividends and distributions at prices obtained pursuant to the Fund’s dividend reinvestment plan. |
| * | Portfolio turnover is calculated on the basis of the Fund as a whole. |
| *** | The date of commencement of operations for Class T shares was June 1, 2020. |
24
| | | | |
| |
Credit Opportunities Portfolio | | October 31, 2020 |
| | | | |
Financial Highlights
Period from February 28, 2020 (commencement of operations) to October 31, 2020.
| | | | |
| | | Period from
Commencement of
Operations to
October 31, 2020*** | |
Class U | | | | |
| |
Per share operating performance | | | | |
| |
Net asset value, beginning of year | | $ | 25.00 | |
| |
Income from operations | | | | |
| |
Net investment income(1) | | | — | |
| |
Net realized and unrealized gain | | | — | |
| | | | |
Total income from operations | | | — | |
| |
Dividends from | | | | |
| |
Net investment income | | | — | |
| | | | |
Total dividends | | | — | |
| | | | |
Net Asset Value, end of year | | $ | 25.00 | |
| | | | |
Total return†(2) | | | 0.00% | |
| | | | |
| |
Ratios to average net assets** | | | | |
| |
Expenses, before waiver | | | 0.00% | |
| |
Expenses, after waiver | | | 0.00% | |
| |
Net investment income, before waiver | | | 0.00% | |
| |
Net investment income, after waiver | | | 0.00% | |
| |
Supplemental data | | | | |
| |
Net assets, end of year (000’s) | | $ | 7,421 | |
| |
Portfolio turnover rate(2)* | | | 66.19% | |
| (1) | Per share calculations were performed using average shares. |
| (2) | Total return and Portfolio turnover rate are for the period indicated and have not been annualized. |
| † | Total return assumes a purchase of common stock at the net asset value on the first day and a sale at the net asset value on the last day of each period reported on the table. Total return assumes reinvestment of dividends and distributions at prices obtained pursuant to the Fund’s dividend reinvestment plan. |
| * | Portfolio turnover is calculated on the basis of the Fund as a whole. |
| *** | The date of commencement of operations for Class U shares was September 1, 2020. |
25
| | | | |
| |
Credit Opportunities Portfolio | | October 31, 2020 |
| | | | |
Notes to Financial Statements
KKR Credit Opportunities Portfolio (the “Fund”) was formed on September 5, 2019 as a statutory trust under the laws of the state of Delaware. The Fund is a closed-end registered management investment company that continuously offers its shares and operates as an “interval fund.” The Fund seeks to provide attractive risk-adjusted returns and generate current income. The Fund is diversified for purposes of the Investment Company Act of 1940, as amended (the “1940 Act”). The Fund commenced operations on February 28, 2020. KKR Credit Advisors (US) LLC serves as the Fund’s investment adviser (the “Adviser”).
As of October 31, 2020, an affiliate of the Adviser owned 84.8% of the outstanding shares of the Fund. The Fund issued 4,000,000 shares to this affiliate for an aggregate purchase price of $100,000,000, comprised of cash and a contribution of investments with a fair market value of $44,712,292.
| 2. | Summary of Significant Accounting Policies |
Basis of Presentation — The accompanying financial statements are presented in accordance with accounting principles generally accepted in the United States of America (“GAAP”) and are stated in United States (“U.S.”) dollars. The Fund is an investment company following accounting and reporting guidance in Financial Accounting Standards Board (“FASB”) Accounting Standards Codification (“ASC”) Topic 946, Financial Services — Investment Companies (“ASC Topic 946”). The preparation of financial statements in conformity with GAAP requires management to make estimates and assumptions that affect the reported amounts and disclosures in these financial statements. Actual results could differ from those estimates.
Valuation of Investments — The Board of Trustees (the “Board”) of the Fund has adopted valuation policies and procedures to ensure investments are valued in a manner consistent with GAAP as required by the 1940 Act. The Board has delegated primary responsibility in ensuring these valuation policies and procedures are followed, including those relating to fair valuation, to the Adviser.
Fair value is the price that would be received to sell an asset or paid to transfer a liability in an orderly transaction between market participants at the measurement date. Where available, fair value is based on observable market prices or parameters, or derived from such prices or parameters. Where observable prices or inputs are not available, valuation models are applied. These valuation techniques involve some level of management estimation and judgment, the degree of which is dependent on the price transparency for the instruments or market and the instruments’ complexity for disclosure purposes.
Assets and liabilities recorded at fair value on the Statement of Assets and Liabilities are categorized based upon the level of judgment associated with the inputs used to measure their value. Hierarchical levels, as defined under GAAP, are directly related to the amount of subjectivity associated with the inputs to fair valuations of these assets and liabilities, and are as follows:
Level 1 — Inputs are unadjusted, quoted prices in active markets for identical assets or liabilities at the measurement date.
The types of assets generally included in this category are common stocks listed in active markets.
Level 2 — Inputs other than quoted prices included in Level 1 that are observable for the asset or liability, either directly or indirectly. Level 2 inputs include quoted prices for similar instruments in active markets, and inputs other than quoted prices that are observable for the asset or liability.
The types of assets and liabilities generally included in this category are high yield securities and certain leveraged loans.
26
| | | | |
| |
Credit Opportunities Portfolio | | October 31, 2020 |
| | | | |
Level 3 — Inputs are unobservable for the asset or liability, and include situations where there is little, if any, market activity for the asset or liability.
The types of assets generally included in this category are certain leveraged loans, common stocks not actively traded and preferred stocks not actively traded.
A significant decrease in the volume and level of activity for the asset or liability is an indication that transactions or quoted prices may not be representative of fair value because in such market conditions there may be increased instances of transactions that are not orderly. In those circumstances, further analysis of transactions or quoted prices is needed, and a significant adjustment to the transactions or quoted prices may be necessary to estimate fair value.
The availability of observable inputs can vary depending on the financial asset or liability and is affected by a wide variety of factors, including, for example, the type of product, whether the product is new, whether the product is traded on an active exchange or in the secondary market, and the current market condition. To the extent that valuation is based on models or inputs that are less observable or unobservable in the market, the determination of fair value requires more judgment. Accordingly, the degree of judgment exercised by the Fund in determining fair value is greatest for instruments categorized in Level 3. In certain cases, the inputs used to measure fair value may fall into different levels of the fair value hierarchy. In such cases, for disclosure purposes, the level in the fair value hierarchy within which the fair value measurement in its entirety falls is determined based on the lowest level input that is significant to the fair value measurement in its entirety. The Fund’s assessment of the significance of a particular input to the fair value measurement in its entirety requires judgment and consideration of factors specific to the asset. The variability of the observable inputs affected by the factors described above may cause transfers between Levels 1, 2 and/or 3, which the Fund recognizes at the beginning of the period the inputs change.
Many financial assets and liabilities have bid and ask prices that can be observed in the marketplace. Bid prices reflect the highest price that the Fund and others are willing to pay for an asset. Ask prices represent the lowest price that the Fund and others are willing to accept for an asset. For financial assets and liabilities whose inputs are based on bid-ask prices, the Fund does not require that fair value always be a predetermined point in the bid- ask range. The Fund’s policy is to allow for mid-market pricing and adjust to the point within the bid-ask range that meets the Fund’s best estimate of fair value.
Depending on the relative liquidity in the markets for certain assets, the Fund may transfer assets to Level 3 if it determines that observable quoted prices, obtained directly or indirectly, are not available.
Investments are generally valued based on quotations from third party pricing services, unless such a quotation is unavailable or is determined to be unreliable or inadequately representing the fair value of the particular assets. In that case, valuations are based on either valuation data obtained from one or more other third party pricing sources, including broker dealers selected by the Adviser, or will reflect the Valuation Committee’s good faith determination of fair value based on other factors considered relevant. For assets classified as Level 3, valuations are based on various factors including of financial and operating data of the company, company specific developments, market valuations of comparable companies and model projections.
For the year ended October 31, 2020, there have been no significant changes to the Fund’s fair value methodologies.
Investment Transactions — Investment transactions are accounted for on the trade date, the date the order to buy or sell is executed. Amortization and accretion is calculated using the effective interest method over the holding period of the investment. Realized gains and losses are calculated on the specific identified cost basis.
Cash and Cash Equivalents — Cash and cash equivalents includes cash on hand, cash held in banks and highly liquid investments with original maturities of three or fewer months. Cash equivalents consist solely of money market funds with financial institutions. As of October 31, 2020, the Fund was invested in the U.S. Bank Money Market Deposit Account.
27
| | | | |
| |
Credit Opportunities Portfolio | | October 31, 2020 |
| | | | |
Foreign Currency Transactions — The books and records of the Fund are maintained in U.S. Dollars. All investments denominated in foreign currency are converted to the U.S. dollar using prevailing exchange rates at the end of the reporting period. Income, expenses, gains and losses on investments denominated in foreign currency are converted to the U.S. dollar using the prevailing exchange rates on the dates when the transactions occurred.
The Fund bifurcates that portion of the results of operations resulting from changes in foreign exchange rates on investments and interest from the fluctuations arising from changes in market prices of securities held.
Distributions to Shareholders — Distributions are accrued and declared daily and paid monthly and distributable net realized capital gains, if any, are declared and distributed at least annually.
Term Loan Income — Term Loan Income consists of transaction fees including, but not limited to, delayed compensation, assignment, transfer, administration and amendment fees. Fee and other income is recorded when earned, and is recognized in Other income on the Statement of Operations.
Income Taxes — The Fund has elected to be treated and has qualified, and intends to continue to qualify in each taxable year, as a “regulated investment company” under Subchapter M of the Internal Revenue Code of 1986, as amended, and in conformity with the Regulated Investment Company Modernization Act of 2010. The Fund will not be subject to federal income tax to the extent the Fund satisfies the requirements under Section 851 of the Internal Revenue Code, including distributing all of its gross investment company taxable income and capital gains to its shareholders based on the Fund’s fiscal year end of October 31.
To avoid imposition of a 4% excise tax on undistributed income applicable to regulated investment companies, the Fund intends to declare each year as dividends in each calendar year at least 98.0% of its net investment income (earned during the calendar year) and 98.2% of its net realized capital gains (earned during the twelve months ended October 31) plus undistributed amounts, if any, from prior years.
The Fund evaluates tax positions taken or expected to be taken in the course of preparing the Fund’s tax returns to determine whether it is “more-likely than-not” (i.e., greater than 50-percent) that each tax position will be sustained upon examination by a taxing authority based on the technical merits of the position. Tax positions not deemed to meet the more-likely-than-not threshold are recorded as a tax benefit or expense in the current year. Management has analyzed the Fund’s tax positions and has concluded that no liability for unrecognized tax benefits should be recorded related to uncertain tax positions for the open tax years (2020). However, management’s conclusions regarding tax positions taken may be subject to review and adjustment at a later date based on factors including, but not limited to, examination by tax authorities, on-going analysis of and changes to tax laws, regulations and interpretations thereof.
As of October 31, 2020, the Fund did not have a liability for any unrecognized tax benefits. The Fund recognizes interest and penalties, if any, related to unrecognized tax benefits as income tax expense in the Statement of Operations.
Repurchase Offers — The Fund operates as an interval fund pursuant to Rule 23c-3 under the 1940 Act and, as such, has adopted a fundamental policy to make quarterly repurchase offers, at NAV, of no less than 10% and no more than 25% of the Fund’s shares outstanding on the Repurchase Request Deadline (as defined below). There is no guarantee that shareholders will be able to sell all of the shares they desire to sell in a quarterly repurchase offer, although each shareholder will have the right to require the Fund to purchase at least 10% of such shareholder’s shares in each quarterly repurchase. Liquidity will be provided to shareholders only through the Fund’s quarterly repurchases. Shareholders will be notified in writing of each quarterly repurchase offer and the date the repurchase offer ends (the “Repurchase Request Deadline”).
Organization and Offering Costs — Organization costs are expensed as incurred. Organization costs consist of costs incurred to establish the Fund and enable it legally to do business. Organization costs will be reimbursed by the Adviser, subject to potential recoupment as described in Note 3. For the period from September 5, 2019 (date of formation) to October 31, 2020, the Fund incurred organization costs of $318,826. Offering costs include registration fees and legal fees regarding the preparation of the initial registration statement. Offering costs are
28
| | | | |
| |
Credit Opportunities Portfolio | | October 31, 2020 |
| | | | |
accounted for as deferred costs until operations begin. Offering costs are then amortized over the first twelve months of operations on a straight-line basis. The total amount of the offering costs incurred by the Fund was $847,560 for the period from September 5, 2019 (date of formation) to October 31, 2020.
The Fund invests mainly in leveraged loans, high yield securities, common stocks not actively traded and preferred stocks. These investments may involve certain risks, including, but not limited to, those described below:
COVID-19 and Global Economic and Market Conditions — The outbreak of a novel strain of corona-virus (“COVID-19”) continues to impact the United States and other countries throughout the world. Given the ongoing nature of the outbreak, it is difficult to predict or control, including, for example: the severity and duration of the pandemic; the pandemic’s impact on the U.S. and global economies, as well as the negative impact on investors, vendors and other business partners that may indirectly adversely affect the Fund.
Market Discount Risk — The price of the Fund’s common shares of beneficial interest will fluctuate with market conditions and other factors. Shares of closed-end management investment companies frequently trade at a discount from their net asset value, which may increase the risk of loss.
Leverage Risk — Leverage is a speculative technique that may expose the Fund to greater risk and increased costs. When leverage is used, the net asset value and market price of the Fund’s shares and the Fund’s investment return will likely be more volatile.
Market Risk — Bond markets rise and fall daily. As with any investment with performance tied to these markets, the value of an investment in the Fund will fluctuate, which means that shareholders could lose money.
Interest Rate Risk — Interest rates will rise and fall over time. During periods when interest rates are low, the Fund’s yield and total return also may be low. Changes in interest rates also may affect the Fund’s share price and a sharp rise in interest rates could cause the Fund’s share price to fall. The longer the Fund’s duration, the more sensitive to interest rate movements its share price is likely to be.
Credit Risk — The Fund is subject to the risk that a decline in the credit quality of an investment could cause the Fund to lose money or underperform. The Fund could lose money if the issuer or guarantor of an investment fails to make timely principal or interest payments or otherwise honor its obligations. The Fund will be subject to credit risk with respect to the counterparties of derivative contracts (whether a clearing corporation in the case of exchange-traded instruments or another third party in the case of over-the-counter instruments) and other instruments entered into directly by the Fund.
Liquidity Risk — A particular investment may be difficult to purchase or sell. The Fund may be unable to sell illiquid securities at an advantageous time or price.
Prepayment and Extension Risk — The Fund’s investments are subject to the risk that the investments may be paid off earlier or later than expected. Either situation could cause the Fund to hold investments paying lower than market rates of interest, which could hurt the Fund’s yield or share price.
High Yield Risk — High yield securities and unrated securities of similar credit quality (sometimes called junk bonds) that the Fund may invest in are subject to greater levels of credit and liquidity risks. High yield securities are considered primarily speculative with respect to the issuer’s continuing ability to make principal and interest payments.
Foreign Investment Risk — The Fund’s investments in securities of foreign issuers may involve certain risks that are greater than those associated with investments in securities of U.S. issuers. These include risks of adverse changes in foreign economic, political, regulatory and other conditions; changes in currency exchange rates (the currencies will decline in value relative to the U.S. dollar or, in the case of hedging positions, the U.S. dollar will decline in value relative to the currency being hedged) or exchange control regulations (including limitations on
29
| | | | |
| |
Credit Opportunities Portfolio | | October 31, 2020 |
| | | | |
currency movements and exchanges); differing accounting, auditing, financial reporting and legal standards and practices; differing securities market structures; and higher transaction costs. These risks may be heightened in connection with investments in emerging markets.
Issuer Risk — The value of securities may decline for a number of reasons that directly relate to the issuer, such as its financial strength, management performance, financial leverage and reduced demand for the issuer’s goods and services, as well as the historical and prospective earnings of the issuer and the value of its assets.
Investment Advisory Agreement — The Adviser provides day-to-day portfolio management services to the Fund and has discretion to purchase and sell investments in accordance with the Fund’s objectives, policies, and restrictions. For the services it provides to the Fund, the Adviser receives an annual fee, payable monthly by the Fund, in an amount equal to 1.30% of the Fund’s average daily Managed Assets (the “Investment Advisory Fee”). The Adviser has voluntarily agreed to temporarily reduce its Investment Advisory Fee to an annual rate of 0.65% of the Fund’s average daily Managed Assets from March 1, 2020, until June 30, 2021. Effective July 1, 2021, the Adviser’s agreement to temporarily reduce its Investment Advisory Fee will terminate and the Adviser will receive an Investment Advisory Fee at an annual rate of 1.30% of the Fund’s average daily Managed Assets. The foregoing fee schedule may be extended, terminated or modified by the Adviser in its sole discretion and at any time, including prior to any such date listed above. “Managed Assets” means the total assets of the Fund (including any assets attributable to borrowings for investment purposes) minus the sum of the Fund’s accrued liabilities (other than liabilities representing borrowings for investment purposes).
During periods when the Fund is using leverage, the Investment Advisory Fee paid to the Adviser will be higher than if the Fund did not use leverage because the Investment Advisory Fee paid is calculated based on the Fund’s Managed Assets, which includes the assets purchased through leverage.
During the year ended October 31, 2020 the Adviser earned an Investment Advisory Fee of $444,324.
The Fund has entered into an Expense Limitation and Reimbursement Agreement (the “Expense Limitation Agreement”) with the Adviser pursuant to which the Advisor will agree to waive its monthly fee and pay, absorb or reimburse some or all the Fund’s “Specified Expenses” (as defined below), an “Expense Limitation Payment”, for each month during the Limitation Period (as defined below) to the extent necessary so that, for any fiscal year, the Fund’s Specified Expenses do not exceed 0.40% of the average daily value of the Fund’s net assets. “Specified Expenses” of the Fund means all expenses incurred in the business of the Fund, including organizational and operating expenses, with the exception of: (i) the Management Fee (as defined in the Fund’s prospectus), (ii) the Service Fee (as defined in the Fund’s prospectus), (iii) the Distribution Fee (as defined in the Fund’s prospectus), (iv) brokerage costs, (v) dividend/interest payments (including any dividend payments, interest expenses, commitment fees, or other expenses related to any leverage incurred by the Fund), (vi) taxes, and (vii) extraordinary expenses (as determined in the sole discretion of the Adviser). The “Limitation Period” commenced on February 28, 2020 and ends on December 31, 2022. The Fund will agree to repay these amounts (“Reimbursement Payment”) on a monthly basis, but only if and to the extent that Specified Expenses plus the Reimbursement Payment are less than 0.40% of the average daily value of the Fund’s net assets during the fiscal year (or, if a lower expense limit is then in effect, such lower limit). The Fund’s obligation to make Reimbursement Payments expires three years from the end of the fiscal year in which such fees are foregone or expense is incurred by the Adviser.
The Expense Limitation Agreement terminates at the end of the Limitation Period, but may be renewed by the mutual agreement of the Adviser and the Fund for successive terms.
As of October 31, 2020, the amount of Expense Limitation Payments since the inception of the Fund provided by the Adviser is $1,448,862. During the year ended October 31, 2020 the amount of Expense Limitation Payments provided by the Adviser is $1,434,841. The Fund’s management believes that Reimbursement Payments are not probable as of October 31, 2020.
30
| | | | |
| |
Credit Opportunities Portfolio | | October 31, 2020 |
| | | | |
KKR Capital Markets LLC (the “Distributor”), an affiliate of the Adviser, is the principal underwriter and distributor of the Shares and serves in that capacity on a best effort basis, subject to various conditions. Shares will be offered through other brokers, dealers and other financial intermediaries (referred to as “selling agents”) that have entered into selling agreements with the Distributor. Selling agents typically receive the sales load with respect to Class T Shares purchased by their clients. The Distributor does not retain any portion of the sales load. Class T Shares are sold subject to a maximum sales load of up to 2.00% of the offering price. However, purchases of Class T Shares may be eligible for a sales load discount. The selling agents may, in their sole discretion, reduce or waive the sales load on a non-scheduled basis in individual cases. Class I Shares and Class U Shares are not subject to a sales load; however, investors could be required to pay brokerage commissions on purchases and sales of Class I Shares and Class U Shares to their selling agents.
The Fund pays the Distributor an ongoing fee (the “Shareholder Servicing Fee”) that is calculated and accrued monthly at an annualized rate of 0.25% of the net assets of the Fund attributable to Class T Shares and Class U Shares. The Shareholder Servicing Fee is for personal services provided to Shareholders and/or the maintenance of Shareholder accounts services and to reimburse the Distributor for related expenses incurred. The Distributor will generally pay all or a portion of the Shareholder Servicing Fee to the selling agents that sell Class T Shares and Class U Shares. Payment of the Shareholder Servicing Fee is governed by the Fund’s Distribution and Service Plan. During the period ended October 31, 2020, the Fund incurred shareholder servicing fees of $3,090.
In addition, the Fund pays the Distributor an ongoing distribution fee (the “Distribution Fee”) that is calculated and accrued monthly at an annualized rate of 0.50% of the net assets of the Fund attributable to Class T Shares and Class U Shares. The Distribution Fee is for the sale and marketing of the Class T Shares and Class U Shares and to reimburse the Distributor for related expenses incurred. The Distributor will generally pay all or a portion of the Distribution Fee to the selling agents that sell Class T Shares and Class U Shares. During the period ended October 31, 2020, the Fund incurred distribution fees of $6,180.
Payment of the Distribution Fee is governed by the Fund’s Distribution and Service Plan.
Class I Shares do not incur a Shareholder Servicing Fee or Distribution Fee.
Administrator, Custodian and Transfer Agent — U.S. Bancorp Fund Services, LLC (“Fund Services” or “Administrator”), doing business as U.S. Bank Global Fund Services, serves as the Fund’s Administrator pursuant to an administration agreement under which the Administrator provides administrative and accounting services.
U.S. Bank N.A. (the “Custodian”) serves as the Fund’s custodian pursuant to a custody agreement. The Custodian is an affiliate of Fund Services.
Fund Services serves as the Fund’s transfer agent pursuant to a transfer agency agreement.
Deferred Trustees’ Compensation — The Fund has a Deferred Trustees’ Compensation plan (the “Plan”) that allows the Independent Trustees to defer compensation to a future payment period. The compensation is invested in shares of the Fund. The value of a participating Independent Trustee’s deferral account is based on the shares of deferred amounts as designated by the participating Independent Trustees. Changes in the value of the Independent Trustees’ deferral account are included in the Statement of Operations. The accrued obligations under the Plan, including unrealized appreciation (depreciation), are included on the Statement of Assets and Liabilities.
Other — Certain officers of the Fund are also officers of the Adviser. Such officers are paid no fees by the Fund for serving as officers of the Fund.
31
| | | | |
| |
Credit Opportunities Portfolio | | October 31, 2020 |
| | | | |
The following table presents information about the Fund’s assets measured at fair value on a recurring basis as of October 31, 2020, and indicates the fair value hierarchy of the inputs utilized by the Fund to determine such fair value:
| | | | | | | | | | | | | | | | |
| Investments in securities | | Level 1 | | | Level 2 | | | Level 3 | | | Total | |
| | | | |
Leveraged loans | | $ | — | | | $ | 52,793,175 | | | $ | 683,566 | | | $ | 53,476,741 | |
| | | | |
High yield securities | | | — | | | | 65,238,882 | | | | — | | | | 65,238,882 | |
| | | | |
Collateralized loan obligations | | | — | | | | — | | | | 1,365,802 | | | | 1,365,802 | |
| | | | |
Common stocks | | | 598,911 | | | | — | | | | 305,554 | | | | 904,465 | |
| | | | |
Cash equivalents | | | 2,478,536 | | | | — | | | | — | | | | 2,478,536 | |
| | | | | | | | | | | | | | | | |
Total investments in securities and cash equivalents | | $ | 3,077,447 | | | $ | 118,032,057 | | | $ | 2,354,922 | | | $ | 123,464,426 | |
The following are the details of the restricted securities held by the Fund:
| | | | | | | | | | | | | | | | | | | | | | |
Issuer (1) | | Par/Shares | | | Acquisition
date(s) | | | Amortized
Cost | | | Value | | | | | % of Net
Assets | |
| | | | | | |
Aruba Investments, Inc., TL 2L | | | 465,220 | | | | 10/28/20 | | | $ | 458,242 | | | $ | 463,475 | | | | | | 0.4% | |
| | | | | | |
Foresight Energy LLC, Common Stock | | | 17,979 | | |
| 6/30/2020 -
8/29/2020 |
| | | 199,869 | | | | 268,665 | | | | | | 0.2% | |
| | | | | | |
Foresight Energy LLC, TL 1L A | | | 150,409 | | | | 06/30/20 | | | | 150,409 | | | | 150,409 | | | | | | 0.1% | |
| | | | | | |
JC Penney Corp., Inc. 8.625% 03/2025 | | | 98,000 | | | | 02/28/20 | | | | 55,617 | | | | 1,169 | | | | | | 0.0% | |
| | | | | | |
Marriott International, Inc. | | | 1,914,000 | | |
| 04/14/20 -
05/06/20 |
| | | 1,996,504 | | | | 2,133,766 | | | | | | 1.7% | |
| | | | | | |
Marriott International, Inc. | | | 13,000 | | | | 05/28/20 | | | | 12,919 | | | | 13,887 | | | | | | 0.0% | |
| (1) | Refer to the Schedule of Investments for more details on securities listed. |
The following is a reconciliation of the investments in which significant unobservable inputs (Level 3) were used in determining value: There were no transfers in or out of level 3.
| | | | | | | | | | | | |
| | | Leveraged
Loans | | | Collateralized Debt
Obligation | | | Common
Stock | |
| | | |
Balance at February 28, 2020 | | $ | — | | | $ | — | | | $ | — | |
| | | |
Purchases | | | 757,218 | | | | 1,252,035 | | | | 382,004 | |
| | | |
Sales and paydowns | | | (95,313 | ) | | | — | | | | — | |
| | | |
Settlements | | | 800 | | | | 27,613 | | | | — | |
| | | |
Net change in appreciation/(depreciation) | | | 20,199 | | | | 86,154 | | | | (76,450 | ) |
| | | |
Net realized gain/(loss) | | | 661 | | | | — | | | | — | |
| | | | | | | | | | | | |
| | | |
Balance as of October 31, 2020 | | $ | 683,566 | | | $ | 1,365,802 | | | $ | 305,554 | |
| | | | | | | | | | | | |
| | | |
Net change in appreciation/(depreciation) on investments held at October 31, 2020 | | $ | 20,199 | | | $ | 86,154 | | | $ | (76,450 | ) |
| | | | | | | | | | | | |
32
| | | | |
| |
Credit Opportunities Portfolio | | October 31, 2020 |
| | | | |
The following table presents additional information about valuation techniques and inputs used for investments that are measured at fair value and categorized within Level 3 as of October 31, 2020:
| | | | | | | | | | | | |
| Financial Asset | | Fair Value | | | Valuation Technique(1) | | Unobservable Inputs(2) | | Range
(Weighted
Average)(3) | |
| | | | |
Leveraged Loans | | $ | 683,566 | | | Yield Analysis | | Yield | | | 9% - 10% (10%) | |
| | | | |
| | | | | | | | Discount Margin | | | 3% | |
| | | | |
| | | | | | | | EBITDA Multiple | | | 2.5x - 9.4x (6.9x) | |
| | | | |
| | | | | | | | | Net Leverage | | | 0.5x - 9.6x (5.8x) | |
| | | | |
Collateralized Loan Obligations | | $ | 1,365,802 | | | Yield analysis | | Discount margin | | | 8% | |
| | | | | | Discounted cash flows | | Probability of default | | | 2% | |
| | | | |
| | | | | | | | | Constant prepayment rate | | | 20% | |
| | | | |
Common Stocks(4) | | $ | 305,554 | | | Market comparables | | FWD EBITDA Multiple | | | 2.5x | |
| | | | |
| | | | | | | | Illiquidity Discount | | | 10% | |
| (1) | For the assets that have more than one valuation technique, the Fund may rely on the techniques individually or in aggregate based on a weight ascribed to each one ranging from 0-100%. When determining the weighting ascribed to each valuation methodology, the Fund considers, among other factors, the availability of direct market comparables, the applicability of a discounted cash flow analysis and the expected hold period and manner of realization for the investment. These factors can result in different weightings among the investments and in certain instances, may result in up to a 100% weighting to a single methodology. |
| (2) | The significant unobservable inputs used in the fair value measurement of the Fund’s assets and liabilities may include the last twelve months (“LTM”) EBITDA multiple, weighted average cost of capital, discount margin, probability of default, loss severity and constant prepayment rate. In determining certain of these inputs, management evaluates a variety of factors including economic, industry and market trends and developments, market valuations of comparable companies, and company specific developments including potential exit strategies and realization opportunities. Significant increases or decreases in any of these inputs in isolation could result in significantly lower or higher fair value measurement. |
| (3) | Weighted average amounts are based on the estimated fair values. |
| (4) | Of the total $305,554 of common stocks, $268,655 and $17,644 were valued solely on an appraisal based on market comparables and discounted cash flows analysis, respectively. |
| 6. | Investment Transactions |
The cost of investments purchased and the proceeds from the sale of investments, other than short-term investments, for the year ended October 31, 2020 were as follows:
| | | | |
Purchases* | | $ | 180,859,519 | |
| |
Sales | | $ | 65,125,004 | |
There were no purchases or sales of U.S. Government securities.
| * | Includes a contribution of investments with a fair value of $44,712,292. |
As a fundamental policy, which may not be changed without shareholder approval, the Fund offers shareholders the opportunity to request the repurchase of their shares on a quarterly basis. The Fund is required to offer to repurchase not less than 10% of its outstanding shares with each repurchase offer and under normal market
33
| | | | |
| |
Credit Opportunities Portfolio | | October 31, 2020 |
| | | | |
conditions, the Board expects to authorize a 10% offer (“Repurchase Offer). The Fund may not offer to repurchase more than 25% of its outstanding shares during any offer. Quarterly repurchases will occur in the months of January, April, July and October.
The time and dates by which Repurchase Offers must be received in good order (“Repurchase Request Deadline”) are generally 4:00 p.m. Eastern time on the first Friday of the month in which the repurchase occurs. The repurchase price will be the Fund’s NAV determined on the repurchase pricing date, which will be a date not more than 14 calendar days following the Repurchase Request Deadline (“Repurchase Pricing Date”). Payment for all shares repurchased pursuant to these offers will be made not later than seven calendar days after the repurchase pricing date (“Repurchase Payment Deadline”). Under normal circumstances, it is expected that the Repurchase Request Deadline will be the same date as the repurchase pricing date. If the tendered shares have been purchased immediately prior to the tender, the Fund will not release repurchase proceeds until payment for the tendered shares has settled.
If more shares are tendered for repurchase than the Fund has offered to repurchase, the Board may, but is not obligated to, increase the number of shares to be repurchased by up to 2% of the shares outstanding on the Repurchase Request Deadline. If there are still more shares tendered than are offered for repurchase, shares will be repurchased on a pro rata basis.
During the year ended October 31, 2020, the Fund completed two quarterly repurchase offers. In these offers, the Fund offered to repurchase no less than 10% of the number of its outstanding shares as of the Repurchase Pricing Dates. The result of the repurchase offers were as follows:
| | | | | | | | | | | | | | | | | | | | |
Repurchase
Request Deadline | | Percentage of
Outstanding
Shares
the Fund Offered
to Repurchase(1) | | | Repurchase
Pricing Date | | Pricing
Date NAV | | Amount
Repurchased | | | Number of
Shares
Repurchased
(all classes) | | | Percentage of
Outstanding Shares
Repurchased | |
| | | | | | |
July 10, 2020 | | | 10 | % | | June 3, 2020 | | $25.30 | | | — | | | | — | | | | 0.00 | % |
| | | | | | |
October 9, 2020 | | | 10 | % | | September 2, 2020 | | $26.18 | | | — | | | | — | | | | 0.00 | % |
| (1) | If total repurchase request exceeds 5% of the Fund’s outstanding shares, the Fund may increase the number of shares that it is offering to repurchase by up to an additional 2% of its total outstanding shares. |
| 8. | Commitments and Contingencies |
The Fund may enter into certain credit agreements, of which all or a portion may be unfunded. These commitments are disclosed in the accompanying Schedule of Investments. The Fund will maintain sufficient liquidity to fund these commitments at the borrower’s discretion.
Under the Fund’s organizational documents, its officers and Trustees are indemnified against certain liabilities arising out of the performance of their duties to the Fund. In the normal course of business, the Fund enters into contracts that contain a variety of representations that provide general indemnifications. The Fund’s maximum liability exposure under these arrangements is unknown, as future claims that have not yet occurred may be made against the Fund. However, based on experience, management expects the risk of loss to be remote.
The timing and characterization of certain income, capital gains, and return of capital distributions are determined annually in accordance with federal tax regulations, which may differ from GAAP. As a result, the net investment income (loss) and net realized gain (loss) on investment transactions for a reporting period may differ significantly from distributions during such period. These book/tax differences may be temporary or permanent in nature. To
34
| | | | |
| |
Credit Opportunities Portfolio | | October 31, 2020 |
| | | | |
the extent these differences are permanent, they are charged or credited to paid-in capital, accumulated net investment income/loss or accumulated net realized gain/loss, as appropriate, in the period in which the differences arise.
As of October 31, 2020, the following permanent differences have been reclassified (to)/from the following accounts:
| | | | | | | | | | |
Undistributed Net Investment Loss | | | Accumulated Net Realized Gain | | | Paid-in Capital | |
| | |
| $ | (159,874 | ) | | $ | 159,874 | | | | — | |
The tax character of distributions declared for the year ended October 31, 2020 was as follows:
| | | | | | | | |
| | | Ordinary
Income | | | Total | |
| | |
October 31, 2020* | | $ | 4,146,792 | | | $ | 4,146,792 | |
| * | The final tax character of any distribution declared in 2020 will be determined in January 2021 and reported to shareholders on IRS Form 1099- Div in accordance with federal income tax regulations. |
As of October 31, 2020, the components of accumulated losses on a tax basis for the Fund are as follows:
| | | | | | | | | | | | | | |
Undistributed
Ordinary
Income | | | Net
Unrealized
Appreciation | | | Other
Temporary
Differences | | | Total
Accumulated
Gains | |
| | | |
| $ | 2,925,239 | | | $ | 2,128,732 | | | $ | (687,098 | ) | | $ | 4,366,873 | |
Net capital losses earned may be carried forward indefinitely and must retain the character of the original loss. At October 31, 2020, the Fund did not have non-expiring capital loss carry-forwards.
As of October 31, 2020, the total cost of securities for federal income tax purposes and the aggregate gross unrealized appreciation and depreciation for securities held by the Fund are as follows:
| | | | | | | | | | | | | | |
Federal Tax
Cost | | | Aggregate
Gross
Unrealized
Appreciation | | | Aggregate
Gross
Unrealized
Depreciation | | | Net
Unrealized
Appreciation
(Depreciation) | |
| | | |
| $ | 118,965,871 | | | $ | 4,936,597 | | | $ | (2,807,865 | ) | | $ | 2,128,732 | |
In June 2020, the Fund entered into a credit agreement (the “BNP Paribas Credit Facility”) with BNP Paribas SA, New York Branch (“BNP Paribas”). The BNP Paribas Credit Facility provides for loans to be made in U.S. dollars and certain foreign currencies to an aggregate amount of $50 million, with an “accordion” feature that allows the Fund, under certain circumstances, to increase the size of the facility to a maximum of $150 million. The Fund may reduce or terminate the commitments under the BNP Paribas Credit Facility with three business days’ notice. The BNP Paribas Credit Facility has a scheduled termination date of June 18, 2021, however, the Fund may request at any time and from time to time to extend the termination date by 364 days. Interest on the BNP Paribas Credit Facility is generally based on London Interbank Offered Rate (“LIBOR”), or with respect to borrowings in foreign currencies, on a base rate applicable to such currency borrowing, plus a spread of 1.95%.
35
| | | | |
| |
Credit Opportunities Portfolio | | October 31, 2020 |
| | | | |
The Fund also pays a commitment fee on any unused commitment amounts between 0.40% and 0.95%, depending on utilization levels. The Fund incurred upfront fees and legal costs totaling $0.22 million in connection with the BNP Paribas Credit Facility. The Fund has deferred and amortized these costs over the original term of the BNP Paribas Credit Facility, or through June 18, 2021. The amortization of these deferred financing costs is included in credit facility interest expense in the Statement of Operations. As of October 31, 2020, the Fund was in compliance with the terms of the BNP Paribas Credit Facility.
The components of interest expense, average interest rates (i.e., base interest rate in effect plus the spread) and average outstanding balances for the Fund’s credit facilities for the year ended October 31, 2020 were as follows:
| | | | |
| |
Stated interest expense | | $ | 18,729 | |
| |
Unused commitment fees | | | 171,083 | |
| |
Amortization of deferred financing costs | | | 80,768 | |
| | | | |
Total interest expense | | $ | 270,580 | |
| | | | |
| |
Weighted average interest rate | | | 1.95 | % |
| |
Average borrowings(1) | | $ | 3,630,850 | |
| (1) | Average borrowings for the BNP Facility are calculated since the initial borrowing under the facility, July 27, 2020. |
On November 2, 2020, the Fund collected the amounts recorded as receivable for shares issued as of October 31, 2020.
36
| | | | |
| |
Credit Opportunities Portfolio | | October 31, 2020 |
| | | | |

REPORT OF INDEPENDENT REGISTERED PUBLIC ACCOUNTING FIRM
To the Shareholders and the Board of Trustees of KKR Credit Opportunities Portfolio
Opinion on the Financial Statements and Financial Highlights
We have audited the accompanying statement of assets and liabilities of KKR Credit Opportunities Portfolio (the “Fund”), including the schedule of investments, as of October 31, 2020, the related statements of operations, changes in net assets, and cash flows for the year then ended, the financial highlights for the period from February 28, 2020 (commencement of operations) to October 31, 2020, and the related notes. In our opinion, the financial statements and financial highlights present fairly, in all material respects, the financial position of the Fund as of October 31, 2020, and the results of its operations, its cash flows, and the changes in its net assets for the year then ended, and the financial highlights for the period from February 28, 2020 (commencement of operations) to October 31, 2020, in conformity with accounting principles generally accepted in the United States of America.
Basis for Opinion
These financial statements and financial highlights are the responsibility of the Fund’s management. Our responsibility is to express an opinion on the Fund’s financial statements and financial highlights based on our audit. We are a public accounting firm registered with the Public Company Accounting Oversight Board (United States) (PCAOB) and are required to be independent with respect to the Fund in accordance with the U.S. federal securities laws and the applicable rules and regulations of the Securities and Exchange Commission and the PCAOB.
We conducted our audit in accordance with the standards of the PCAOB. Those standards require that we plan and perform the audit to obtain reasonable assurance about whether the financial statements and financial highlights are free of material misstatement, whether due to error or fraud. The Fund is not required to have, nor were we engaged to perform, an audit of its internal control over financial reporting. As part of our audit, we are required to obtain an understanding of internal control over financial reporting but not for the purpose of expressing an opinion on the effectiveness of the Fund’s internal control over financial reporting. Accordingly, we express no such opinion.
Our audit included performing procedures to assess the risks of material misstatement of the financial statements and financial highlights, whether due to error or fraud, and performing procedures that respond to those risks. Such procedures included examining, on a test basis, evidence regarding the amounts and disclosures in the financial statements and financial highlights. Our audit also included evaluating the accounting principles used and significant estimates made by management, as well as evaluating the overall presentation of the financial statements and financial highlights. Our procedures included confirmation of securities owned as of October 31, 2020, by correspondence with the custodians and brokers; when replies were not received from brokers, we performed other auditing procedures. We believe that our audit provides a reasonable basis for our opinion.

San Francisco, CA
December 28, 2020
We have served as the auditor of KKR Credit Opportunities Portfolio since 2019.
37
| | | | |
| |
Credit Opportunities Portfolio | | October 31, 2020 |
| | | | |
Trustees and Officers of KKR Credit Opportunities Portfolio
| | | | | | | | | | |
| Name, Age and Address | | Position(s)
Held with
the Fund | | Term of
Office and
Length of
Service | | Principal Occupation(s)
During Past Five Years
and Other Relevant
Experience | | Number of
Portfolios
In Fund
Complex
Overseen by
Trustee(2) | | Other
Directorships
Held by
Trustee
During the
Last 3
Years(3) |
|
Interested Trustees(1) |
| | | | | |
Suzanne Donohoe(4) (48) KKR Credit Advisors (US) LLC 555 California Street 50th Floor San Francisco, CA 94104 | | President | | Since Inception | | Global head of KKR’s Client and Partner Group and Member of KKR (Since 2009). | | 2 | | None. |
|
Independent Trustees(1) |
| | | | | |
Tobin V. Levy (75) KKR Credit Advisors (US) LLC 555 California Street 50th Floor San Francisco, CA 94104 | | Trustee | | Since Inception | | Executive Vice President & Chief Financial Officer, Local Initiatives Support Corporation (non-profit support and resources) (2011-2014). | | 2 | | None. |
| | | | | |
Jeffrey L. Zlot (48) KKR Credit Advisors (US) LLC 555 California Street 50th Floor San Francisco, CA 94104 | | Trustee | | Since Inception | | Managing Director, Tiedemann Advisors (formerly, Tiedemann Wealth Management) (investment consultant and investment banking) (since 1997). | | 2 | | None. |
| | | | | |
Michael E. Cahill (69) KKR Credit Advisors (US) LLC 555 California Street 50th Floor San Francisco, CA 94104 | | Trustee | | Since Inception | | Executive Vice President (2008-2013) and Managing Director and General Counsel (1991-2013), The TCW Group, Inc. and Trust Company of the West (financial services firm). | | 2 | | None. |
| | | | | |
Catherine Sidamon-Eristoff (57) KKR Credit Advisors (US) LLC 555 California Street 50th Floor San Francisco CA 94104 | | Trustee | | Since Inception | | Treasurer and Board Member, C-Change Conversations (non-profit organization) (Since 2017) Board Member, FlexPaths LLC (workplace strategy and consulting firm) (Since 2008) Managing Director, Constellation Wealth Advisors (financial services firm) (2007-2015). | | 2 | | None. |
| (1) | “Independent Trustees” are those trustees who are not “interested persons” (as defined in Section 2(a)(19) of the 1940 Act) of the Fund, and “Interested Trustees” are those trustees who are interested persons of the Fund. Ms. Donohoe is an Interested Trustee because she is a Member of KKR, the parent company of the Adviser. |
38
| | | | |
| |
Credit Opportunities Portfolio | | October 31, 2020 |
| | | | |
| (2) | The Fund Complex is comprised of the Fund and KKR Income Opportunities Fund. |
| (3) | This This column includes only directorships of companies required to report to the SEC under the Securities Exchange Act of 1934, as amended (the “Exchange Act”) (i.e., “public companies”) or other investment companies registered under the 1940 Act. |
| (4) | On December 1, 2020, Suzanne Donohoe resigned as Trustee, Chair and President of the Fund. Effective December 1, 2020, the Board of Trustees appointed Eric Mogelof to serve as Trustee, Chair and President of the Fund. Mr. Mogelof is an Interested Trustee. |
| | | | | | |
| Name and Age | | Position(s) Held
with Fund | | Term of Office and
Length of Service | | Principal Occupation(s) During
Past Five Years and Other
Relevant Experience |
| | |
Principal Officers who are not Trustees | | | | |
| | | |
| Thomas Murphy (53) | | Treasurer, Chief Financial Officer and Chief Accounting Officer | | Since Inception | | Chief Financial Officer, KKR Financial Holdings LLC (since 2015); Director (Finance & Accounting), KKR Credit Advisors (US) LLC (since 2012; Chief Accounting Officer, KKR Financial Holdings LLC (since 2009). |
| | | |
| Annette O’Donnell-Butner (51) | | Chief Compliance Officer | | Since Inception | | Chief Compliance Officer, Corporate Capital Trust, Inc. (2017-2018); Managing Director and Chief Compliance Officer, KKR Credit Advisors (US) LLC (since 2009). |
| | | |
| Michael Nguyen (37) | | Secretary and Vice President | | Since Inception | | Vice President, KKR Credit Advisors (US) LLC (2013-present). |
39
| | | | |
| |
Credit Opportunities Portfolio | | October 31, 2020 |
| | | | |
Dividend Reinvestment Plan (Unaudited)
KKR Credit Opportunities Portfolio, a Delaware statutory trust (the “Fund”), hereby adopts the following Dividend Reinvestment Plan (the “Plan”) with respect to distributions declared by its board of trustees (the “Board”) on its shares of beneficial interest (the “Shares”):
1.
Participation; Agent. The Fund’s Plan is available to shareholders of record of the Shares. [U.S. Bancorp Fund Services, LLC] (“Plan Administrator”) acting as agent for each participant in the Plan, will apply income dividends or capital gains or other distributions (each, a “Distribution” and collectively, “Distributions”), net of any applicable U.S. withholding tax, that become payable to such participant on Shares (including shares held in the participant’s name and shares accumulated under the Plan), to the purchase of additional whole and fractional Shares for such participant.
2.
Eligibility and Election to Participate. Participation in the Plan is limited to registered owners of Shares. The Fund’s Board reserves the right to amend or terminate the Plan. Shareholders automatically participate in the Plan, unless and until an election is made to withdraw from the Plan on behalf of such participating shareholder. If participating in the Plan, a shareholder is required to include all of the Shares owned by such shareholder in the Plan.
3.
Share Purchases. When the Fund declares a Distribution, the Plan Administrator, on the shareholder’s behalf, will receive additional authorized shares from the Fund either newly issued or repurchased from shareholders by the Fund and held as treasury stock. The number of shares to be received when Distributions are reinvested will be determined by dividing the amount of the Distribution by the Fund’s net asset value per share. There will be no sales load charged on Shares issued to a shareholder under the Plan. All shares purchased under the Plan will be held in the name of each participant. In the case of shareholders, such as banks, brokers or nominees, that hold shares for others who are beneficial owners participating under the Plan, the Plan Administrator will administer the Plan on the basis of the number of shares certified from time to time by the record shareholder as representing the total amount of shares registered in the shareholder’s name and held for the account of beneficial owners participating under the Plan.
4.
Timing of Purchases. The Fund expects to issue Shares pursuant to the Plan, immediately following each Distribution payment date and the Plan Administrator will make every reasonable effort to reinvest all Distributions on the day the Distribution is paid (except where necessary to comply with applicable securities laws) by the Fund. If, for any reason beyond the control of the Plan Administrator, reinvestment of the Distributions cannot be completed within 30 days after the applicable Distribution payment date, funds held by the Plan Administrator on behalf of a participant will be distributed to that participant.
5.
Account Statements. The Plan Administrator will maintain all shareholder accounts and furnish written confirmations of all transactions in the accounts, including information needed by shareholders for personal and tax records. The Plan Administrator will hold shares in the account of the shareholders in non-certificated form in the name of the participant, and each shareholder’s proxy, if any, will include those shares purchased pursuant to the Plan. The Plan Administrator will confirm to each participant each acquisition made pursuant to the Plan as soon as practicable but not later than 10 business days after the date thereof. No less frequently than quarterly, the Plan Administrator will provide to each participant an account statement showing the Distribution, the number of shares purchased with the Distribution, and the year-to-date and cumulative Distributions paid.
6.
Expenses. There will be no direct expenses to participants for the administration of the Plan. There is no direct service charge to participants with regard to purchases under the Plan; however, the Fund reserves the right to amend the Plan to include a service charge payable by the participants. All fees associated with the Plan will be paid by the Fund.
40
| | | | |
| |
Credit Opportunities Portfolio | | October 31, 2020 |
| | | | |
7.
Taxation of Distributions. The reinvestment of Distributions does not relieve the participant of any taxes which may be payable on such Distributions.
8.
Voting of Shares. Shares issued pursuant to the Plan will have the same voting rights as the Shares issued pursuant to the Fund’s public offering.
9.
Absence of Liability. Neither the Fund nor the Plan Administrator shall have any responsibility or liability beyond the exercise of ordinary care for any action taken or omitted pursuant to the Plan, nor shall they have any duties, responsibilities or liabilities except such as expressly set forth herein. Neither the Fund nor the Plan Administrator shall be liable for any act done in good faith or for any good faith omission to act, including, without limitation, any claims of liability: (a) arising out of the failure to terminate a participant’s account prior to receipt of written notice of such participant’s death, or (b) with respect to prices at which shares are purchased or sold for the participant’s account and the terms on which such purchases and sales are made. NOTWITHSTANDING THE FOREGOING, LIABILITY UNDER THE U.S. FEDERAL SECURITIES LAWS CANNOT BE WAIVED.
10.
Termination of Participation. A shareholder who does not wish to have Distributions automatically reinvested may terminate participation in the Plan at any time by written instructions to that effect to the Plan Administrator. Such written instructions must be received by the Plan Administrator three (3) days prior to the record date of the Distribution or the shareholder will receive such Distribution in Shares through the Plan.
11.
Amendment, Supplement, Termination, and Suspension of Plan. This Plan may be amended, supplemented, or terminated by the Fund at any time in its sole and absolute discretion. The amendment or supplement shall be filed with the Securities and Exchange Commission as an exhibit to a subsequent appropriate filing made by the Fund and shall be deemed to be accepted by each participant unless, prior to its effective date thereof, the Plan Administrator receives written notice of termination of the participant’s account. Amendment may include an appointment by the Fund or the Plan Administrator with the approval of the Fund of a successor agent, in which event such successor shall have all of the rights and obligations of the Plan Administrator under this Plan. The Fund may suspend the Plan at any time without notice to the participants.
12.
Governing Law. This Plan and the authorization form signed by the participant (which is deemed a part of this Plan) and the participant’s account shall be governed by and construed in accordance with the laws of the State of New York.
41
| | | | |
| |
Credit Opportunities Portfolio | | October 31, 2020 |
| | | | |
Additional Information
FEDERAL TAX INFORMATION (Unaudited)
For the fiscal year ended October 31, 2020, certain dividends paid by the Fund may be subject to a maximum rate of 20%, as provided for by the Jobs and Growth Tax Relief Reconciliation Act of 2003. The percentage of dividends declared from ordinary income designated as qualified dividend income was 0.00%.
For corporate shareholders, the percent of ordinary income distributions qualifying for corporate dividends received deduction for the fiscal year ended October 31, 2020 was 0.00%.
The percentage of taxable ordinary income distributions that are designated as short-term capital gain distributions under Internal Revenue Section 871 (k)(2)(C) for fiscal year ended October 31, 2020 was 0.00%.
The percentage of taxable ordinary income distributions that are designated as interest related dividends under Internal Revenue Section 871 (k)(1)(C) for fiscal year ended October 31, 2020 was 63.03%.
Pursuant to Section 853 of the Internal Revenue Code, the Fund did not designate any amounts as foreign taxes paid for the fiscal year ended October 31, 2020. Foreign taxes paid for purposes of Section 853 may be less than actual foreign taxes paid for financial statement purposes.
42
| | | | |
| |
Credit Opportunities Portfolio | | October 31, 2020 |
| | | | |
Privacy Notice
Protection and Security of Your Personal Information
Kohlberg Kravis Roberts & Co. L.P. (“KKR”) respects our investors’ right to privacy. All financial companies choose how they share personal information. Consumers have the right under U.S. federal law to limit some, but not all, sharing of personal information. U.S. federal law also requires us to inform you how we collect, share and protect your personal information. Investors may also have additional limiting rights under their respective State’s law. This notice is provided by KKR, its affiliates, and funds (“KKR”, “we”, or “us”). Please read this notice carefully to understand what we do, and call us at (212) 750-8300 if you have any questions.
The Personal Information We Collect and How We Collect It
We collect the following types of personal information about individuals who are our investors:
| | • | | Information we receive from investors in subscription agreements, questionnaires and in other forms, such as name, address, account information, social security number, the types and amounts of investments, statements of net worth, telephone number, and other contact information; |
| | • | | Information we receive from investors, affiliates and other companies about investors’ transactions with us, our affiliates, or other financial institutions with which we have relationships; and |
| | • | | Information we receive from third parties such as demographic information and information collected to comply with law and regulation. |
When you are no longer an investor with us, we continue to share your information as described in this notice.
How and Why We Share Personal Information
This section lists reasons why financial companies can share their customers’ personal information. With respect to each reason, we explain whether KKR chooses to share for this reason and, if we do share, whether you can limit this sharing.
| | • | | For everyday business purposes: KKR shares personal information for everyday business purposes, such as to |
| | • | | process your transactions; |
| | • | | provide financial products or services to you; |
| | • | | maintain your investment(s); |
| | • | | secure business services, including printing, mailing, and processing or analyzing data; |
| | • | | secure professional services, including accounting and legal services; or |
| | • | | respond to court orders and legal investigations. |
You cannot limit sharing by KKR for everyday business purposes.
| | • | | For our marketing purposes: KKR shares personal information for our marketing purposes so that we can offer products and services to you. You cannot limit sharing by KKR for this reason. |
| | • | | For joint marketing with other financial companies: KKR does not share personal information for joint marketing with other financial companies. |
43
| | | | |
| |
Credit Opportunities Portfolio | | October 31, 2020 |
| | | | |
| | • | | For use by affiliates in providing products and services to you: KKR shares personal information for our affiliates’ use in providing you with products and services that meet your financial services needs. You cannot limit sharing by KKR for this reason. |
| | • | | For the everyday business purposes of affiliates: KKR does not share personal information, including information about your credit worthiness, with our affiliates for their everyday business purposes. |
| | • | | For use by affiliates to market to you: KKR does not share personal information with affiliates so that they can market to you. |
| | • | | For use by non-affiliates to market to you: KKR does not share personal information with non-affiliates so that they can market to you. |
U.S. Federal law gives you the right to limit sharing of your personal information only for use (i) by affiliates everyday business purposes (information about your creditworthiness), (ii) by affiliates to market to you, and (iii) by non-affiliates to market to you. U.S. State laws and individual companies may give you additional rights to limit sharing.
How We Protect Your Personal Information
To protect your personal information from unauthorized access and use, we use security measures that comply with federal law. These measures include computer safeguards and secured files and buildings.
Definitions
Affiliates: Companies related by common ownership or control. They can be financial and nonfinancial companies. KKR does not share with our affiliates, except to provide you products and services that meet your financial needs.
Non-affiliates: Companies not related by common ownership or control. They can be financial and nonfinancial companies. KKR does not share with non-affiliates so they can market to you.
Joint Marketing: A formal agreement between nonaffiliated financial companies that together market financial products and services to you. KKR does not jointly market.
44
Item 2. Code of Ethics.
| | (a) | The registrant has adopted a code of ethics that applies to the registrant’s principal executive officer, principal financial officer and principal accounting officer. |
Item 3. Audit Committee Financial Expert.
(a)(1) The registrant’s board of trustees has determined that there is at least one audit committee financial expert serving on its audit committee.
(a)(2) Tobin V. Levy is the “audit committee financial expert” and is considered to be “independent” as each term is defined in Item 3 of Form N-CSR.
Item 4. Principal Accountant Fees and Services.
Deloitte & Touche LLP billed the Fund aggregate fees for services rendered to the Fund for the fiscal year as follows:
| | | | |
| | | FYE 10/31/2020 | |
(a)Audit Fees | | $ | 65,000 | |
(b)Audit-Related Fees | | $ | 7,500 | |
(c)Tax Fees | | $ | 10,000 | |
(d)All Other Fees | | | N/A | |
(e)(1) The Audit Committee pre-approves, to the extent required by applicable regulations (including paragraph (c)(7) of Rule 2-01 of Regulation S-X), (i) all audit and permitted non-audit services rendered by the independent accountants to the registrant and (ii) all non-audit services rendered by the independent accountants to the registrant’s investment adviser and to certain affiliates of the investment adviser.
(e)(2) The percentage of fees billed by Deloitte & Touche LLP applicable to non-audit services pursuant to waiver of pre-approval requirement were as follows:
| | | | |
| | | FYE 10/31/2020 | |
Audit-Related Fees | | | 0 | % |
Tax Fees | | | 0 | % |
All Other Fees | | | N/A | |
(f) Not applicable.
(g) The aggregate non-audit fees and services billed by Deloitte & Touche LLP for the fiscal period was $10,000.
(h) Not applicable.
Item 5. Audit Committee of Listed Registrants.
(a) The registrant has a separately-designated standing audit committee established in accordance with Section 3(a)(58)(A) of the Securities Exchange Act of 1934. This standing audit committee is comprised of Mr. Tobin V. Levy, Mr. Jeffrey L. Zlot, Ms. Catherine B. Sidamon-Eristoff and Mr. Michael E. Cahill.
Item 6. Investments.
(a) Schedule of Investments is included as part of the report to shareholders filed under Item 1 of this Form.
(b) Not applicable.
Item 7. Disclosure of Proxy Voting Policies and Procedures for Closed-End Management Investment Companies.
The registrant’s proxy voting and corporate actions policy and procedures are as follows:
PROXY VOTING POLICY AND PROCEDURES
KKR Credit Advisors (US) LLC (the “Adviser”) provides investment advisory services to its Client, and invests the assets of these Clients in securities issued by public and private issuers. The Adviser has authority to vote proxies relating to such securities on behalf of its Clients. The Securities and Exchange Commission (the “SEC”) has adopted Rule 206(4)-6 under the Investment Advisers Act of 1940, as amended (the “Advisers Act”). Under this rule, registered investment advisers that exercise voting authority over securities held in client portfolios are required to implement proxy voting policies and describe those policies to their clients.
This policy is designed to ensure that all proxies are voted in the best interest of the Adviser’s Clients, to provide disclosure of the Adviser’s proxy voting records and to ensure that certain documentation is retained.
| B. | Proxy Voting Procedures |
To assist it in its proxy-voting responsibilities, the Adviser currently subscribes to proxy-related services offered by Institutional Shareholder Services, Inc. (“ISS”). ISS provides the Adviser with its independent analysis and recommendation with respect to generally all proxy proposals that the Adviser votes on behalf of its clients, with respect to both U.S. and non-U.S. securities of publicly traded companies.
The Adviser will have the responsibility of voting proxies that it receives on behalf of its Clients. The Adviser has engaged ISS to assist with its proxy voting, however, the Adviser retains ultimate voting discretion with respect to its Clients. The Adviser may depart from an ISS recommendation in order to avoid voting decisions believed to be contrary to the best interests of its Clients. In each instance where the Adviser votes contrary to the ISS recommendation, The Adviser’s Legal/Compliance, in conjunction with the Adviser’s investment analyst who provides coverage for the relevant issuer, will document the basis for its contrary voting decision.
In addition, the Adviser may choose not to vote proxies in certain situations, such as where the Adviser has deemed the cost of voting would exceed any anticipated benefit to the Adviser’s Clients or where a proxy is received by the Adviser for a security it no longer manages on behalf of its Clients. The Adviser’s Legal/Compliance, in conjunction with the Adviser’s investment analyst who provides coverage for the relevant issuer, will document the basis for the Adviser’s decision not to vote.
The Adviser may occasionally be subject to conflicts of interest in the voting of proxies due to business or personal relationships it maintains with persons having an interest in the outcome of certain votes. The Adviser, its affiliates and/or its employees may also occasionally have business or personal relationships with the proponents of proxy proposals, participants in proxy contests, corporate directors and officers or candidates for directorships.
If at any time, the Adviser becomes aware of an existing or potential conflict of interest relating to a particular proxy proposal, the Adviser’s Conflicts Committee (“Conflicts Committee”), or its designee, must be notified. Provided the Conflicts Committee has determined that a conflict or potential for a conflict exists, the proxy must be voted in alignment with the recommendation set forth by ISS. Appropriate documentation will be maintained by the Conflicts Committee.
In accordance with Rule 204-2 under the Advisers Act, the Adviser will maintain the following records in connection with the Adviser’s proxy voting policies and procedures:
| | • | | a copy of the proxy voting policies and procedures; |
| | • | | a copy of all proxy statements received regarding securities of its Clients; |
| | • | | a record of each vote the Adviser casts on behalf of Firm Clients; |
| | • | | records of the Adviser’s Client requests for proxy voting information, including a copy of each written request for information on how the Adviser voted proxies on behalf of the Client, and a copy of any written response by the Adviser to any Client request for information on how the Adviser voted proxies on its behalf; and |
| | • | | any documentation prepared by the Adviser that was material to making a decision on how to vote, or that memorialized the basis for the voting decision. |
The foregoing records will be maintained and preserved in accordance with the Adviser’s Maintenance of Books and Records Policy.
Item 8. Portfolio Managers of Closed-End Management Investment Companies.
Information presented is as of October 31, 2020
(a)(1) Investment Team
The Fund is positioned, under the management of the Adviser, to take advantage of the full resources of KKR & Co. Inc.’s (together with its affiliates, “KKR”) global network. With more than 240 employees in
its business, including approximately 105 dedicated investment professionals, located in San Francisco, New York, Orlando, London, Dublin, Madrid, Hong Kong, Mumbai, Singapore and Sydney, the Adviser’s investment teams seek to leverage KKR’s private equity experience and extensive industry relationships in making strong investment choices on behalf of its clients. The investment professional of the Adviser, who has primary responsibility for day-to-day management and oversight of the Fund is Christopher A. Sheldon, Jeremiah S. Lane and Daniel Pietrzak. Additionally, the US Leveraged Credit Investment Committee that exercises oversight over, and provides insight to, the investment activities of the Fund is comprised of:
Christopher A. Sheldon joined KKR in 2004, and is a Member of KKR. Mr. Sheldon serves as the Head of Leveraged Credit. Mr. Sheldon is a Portfolio Manager for the Adviser’s Leveraged Credit and Private Credit funds and portfolios. Mr. Sheldon is a member of the Adviser’s US Leveraged Credit Investment Committee, Global Private Credit Investment Committee and the Adviser’s Portfolio Management Committee. Prior to joining KKR, Mr. Sheldon was a vice president and senior investment analyst with Wells Fargo’s high yield securities group. Previously, Mr. Sheldon worked at Young & Rubicam Advertising and SFM Media Corporation in their media-planning departments. Mr. Sheldon holds a B.A. from Denison University.
Jeremiah S. Lane joined KKR in 2005, and is a Member of KKR. Mr. Lane is a Portfolio Manager for the Adviser’s Leveraged Credit funds and portfolios. Mr. Lane is a member of the Adviser’s US Leveraged Investment Committee, as well as a member of the Adviser’s Portfolio Management Committee. Prior to joining KKR, Mr. Lane worked as an associate in the investment banking/technology, media and telecom group at J.P. Morgan Chase. Mr. Lane holds an A.B. with honors in History from Harvard University.
Daniel Pietrzak joined KKR in 2016 and is a Member of KKR. Mr. Pietrzak is a portfolio manager for KKR’s private credit funds and portfolios and a member of the Global Private Credit Investment Committee, Europe Direct Lending Investment Committee and KKR Credit Portfolio Management Committee. Mr. Pietrzak is Chief Investment Officer of the KKR / FS Investments joint venture and of the business development companies managed by the joint venture, including FS KKR Capital Corp., which trades on the NYSE. Prior to joining KKR, Mr. Pietrzak was a managing director and the cohead of Deutsche Bank’s structured finance business across the Americas and Europe. Previously, Mr. Pietrzak held various roles in the credit businesses of Societe Generale and CIBC World Markets. Mr. Pietrzak started his career at Price Waterhouse in New York and is a CPA. Mr. Pietrzak holds an M.B.A. in Finance from The Wharton School of the University of Pennsylvania and a B.S. in Accounting from Lehigh University.
(a)(2) Other Accounts Managed by the Portfolio Managers
The portfolio manager primarily responsible for the day-to-day management of the Fund also manages other registered investment companies, other pooled investment vehicles and other accounts, as indicated below. The following table identifies, as of October 31, 2020: (i) the number of registered investment companies, pooled investment vehicles and other accounts managed by the portfolio manager; and (ii) the total assets under management (“AUM”) of such companies, vehicles and accounts, and the number and total AUM of such companies, vehicles and accounts with respect to which the advisory fee is based on performance.
Christopher A. Sheldon ($ in millions)
| | | | | | | | | | | | | | | | |
| | | Number of
Accounts | | | Assets of
Accounts | | | Number of
Accounts
Subject to a
Performance
Fee | | | Assets Subject to
a Performance
Fee | |
Registered Investment Companies | | | 2 | | | $ | 565 | | | | 0 | | | $ | 0 | |
Pooled Investment Vehicles Other Than Registered Investment Companies | | | 17 | | | $ | 25,847 | | | | 11 | | | $ | 18,905 | |
Other Accounts | | | 33 | | | $ | 17,310 | | | | 17 | | | $ | 4,421 | |
Jeremiah S. Lane ($ in millions)
| | | | | | | | | | | | | | | | |
| | | Number of
Accounts | | | Assets of
Accounts | | | Number of
Accounts
Subject to a
Performance
Fee | | | Assets Subject to
a Performance
Fee | |
Registered Investment Companies | | | 0 | | | $ | 0 | | | | 0 | | | $ | 0 | |
Pooled Investment Vehicles Other Than Registered Investment Companies | | | 5 | | | $ | 15,658 | | | | 1 | | | $ | 14,749 | |
Other Accounts | | | 31 | | | $ | 18,208 | | | | 1 | | | $ | 215 | |
Daniel Pietrzak ($ in millions)
| | | | | | | | | | | | | | | | |
| | | Number of
Accounts | | | Assets of
Accounts | | | Number of
Accounts
Subject to a
Performance
Fee | | | Assets Subject to
a Performance
Fee | |
Registered Investment Companies | | | 0 | | | $ | 0 | | | | 0 | | | $ | 0 | |
Pooled Investment Vehicles Other Than Registered Investment Companies | | | 15 | | | $ | 20,931 | | | | 13 | | | $ | 18,103 | |
Other Accounts | | | 18 | | | $ | 5,937 | | | | 12 | | | $ | 2,970 | |
(a)(2)(iv) Conflicts Of Interest
The Adviser will experience conflicts of interest in connection with the management of the Fund, including, but not limited to, those discussed below. Dealing with conflicts of interest is complex and difficult, and new and different types of conflicts may subsequently arise.
| | • | | The members, officers and other personnel of the Adviser allocate their time, resources and other services between the Fund and other investment and business activities in which they may be involved, including other funds, investment vehicles and accounts managed by KKR. The Adviser intends to devote such time as shall be necessary to conduct the Fund’s business affairs in an appropriate manner. However, the Adviser will continue to devote the time, resources and other services necessary to managing its other investment and business activities and the Adviser is not precluded from conducting activities unrelated to the Fund. Substantial time may be spent by such members, officers and personnel monitoring the investments of other funds, investment vehicles and accounts managed by KKR. |
| | • | | The Adviser may compete with certain of its affiliates, including other entities it manages, for investments for the Fund, subjecting the Adviser to certain conflicts of interest in evaluating the suitability of investment opportunities and making or recommending acquisitions on the Fund’s behalf. The Adviser will receive advisory and other fees from the other entities it manages, and due to fee-offset provisions contained in the management agreements for such entities, the fees may not be proportionate to such entities’ investment accounts for any given transaction and the Adviser may have an incentive to favor entities from which it receives higher fees. |
| | • | | The Fund has adopted the Adviser’s allocation policy, which is designed to fairly and equitably distribute investment opportunities over time among funds or pools of capital managed by the Adviser. The Adviser’s allocation policy provides that once an investment has been approved and is deemed to be in the Fund’s best interest, the Fund will receive a pro rata share of the investment based on capital available for investment in the asset class being allocated. Determinations as to the amount of capital available for investment are based on such factors as: the amount of cash on-hand, existing commitments and reserves, the targeted leverage level, the targeted asset mix and diversification requirements, other investment policies and restrictions, and limitations imposed by applicable laws, rules, regulations or interpretations. The outcome of this determination may result in the allocation of all, some or none of an investment opportunity to the Fund. In addition, subject to applicable law, affiliates of the Adviser may invest in one of the Fund’s portfolio companies and hold a different class of securities than the Fund. To the extent that an affiliate of the Adviser holds a different class of securities than the Fund, its interests may not be aligned with the Fund’s. Notwithstanding the foregoing, the Adviser will act in the best interest of the Fund in accordance with its fiduciary duty to the Fund. |
| | • | | The appropriate allocation among the Fund and other KKR funds and accounts of expenses and fees generated in the course of evaluating and making investments often may not be clear, especially where more than one KKR fund or account participates. The Adviser will determine, in its sole discretion, the appropriate allocation of investment-related expenses, including broken deal expenses incurred in respect of unconsummated investments and expenses more generally relating to a particular investment strategy, among the funds and accounts participating or that would have participated in such investments or that otherwise participate in the relevant investment strategy, as applicable, which may result in the Fund bearing more or less of these expenses than other participants or potential participants in the relevant investments. |
| | • | | The compensation payable by the Fund to the Adviser will be approved by the Board consistent with the exercise of the requisite standard of care applicable to trustees under state law. Such compensation is payable, in most cases, regardless of the quality of the assets acquired, the services provided to the Fund or whether the Fund makes distributions to Shareholders. |
| | • | | The Adviser and its affiliates may provide a broad range of financial services to companies in which the Fund invests, in compliance with applicable law, and will generally be paid fees for such services. In addition, affiliates of the Adviser may act as an underwriter, arranger or placement agent or in another manner in connection with an offering of securities by one of the companies in the Fund’s portfolio. Any compensation received by the Adviser and its affiliates for providing these services will not be shared with the Fund and may be received before the Fund realizes a return on its investment. The Adviser may face conflicts of interest with respect to services performed for these companies, on the one hand, and investments recommended to the Fund, on the other hand. |
| | • | | KKR engages in a broad range of business activities and invests in portfolio companies and other issuers whose operations may be substantially similar to the issuers of the Fund’s portfolio investments. The performance and operation of such competing businesses could conflict with and adversely affect the performance and operation of the issuers of the Fund’s portfolio investments, and may adversely affect the prices and availability of business opportunities or transactions available to these issuers. |
| | • | | From time to time, to the extent consistent with the 1940 Act and the rules and regulations promulgated thereunder, or with exemptive relief the Fund may receive from the SEC, if any, the Fund and other clients for which the Adviser provides investment management services or carries on investment activities (including, among others, clients that are employee benefit plans subject to ERISA and related regulations) may make investments at different levels of an investment entity’s capital structure or otherwise in different classes of an issuer’s securities. These investments may inherently give rise to conflicts of interest or perceived conflicts of interest between or among the various classes of securities that may be held by the Fund and such other clients, including in the case of financial distress of the investment entity. |
| | • | | KKR and the Adviser sponsor and advise, and may in the future sponsor and advise, a broad range of investment funds, vehicles, and other accounts, including proprietary vehicles, that make investments worldwide. KKR may also make investments for its own account, including, for example, through investment and co-investment vehicles established for KKR personnel and associates. The Adviser and its affiliates are not restricted from forming additional investment funds, from entering into other investment advisory relationships (including, among others, relationships with clients that are employee benefit plans subject to ERISA and related regulations), or from engaging in other business activities, even though such activities may be in competition with the Fund and/or may involve substantial time and resources of the Adviser. For example, the Adviser may invest, on behalf of an affiliated fund, in a company that is a competitor of one of the Fund’s portfolio companies or that is a service provider, supplier, customer or other counterparty with respect to one of the Fund’s portfolio companies. In providing advice and recommendations to, or with respect to, such investments and in dealing in such investments on behalf of such other affiliated fund, to the extent permitted by law, the Adviser or its affiliates will not take into consideration the interests of the Fund and its portfolio investments and issuers thereof. Accordingly, such advice, recommendations and dealings may result in conflicts of interest for the Adviser. In addition, the Adviser’s ability to effectively implement the Fund’s investment strategies may be limited to the extent that contractual obligations relating to these permitted activities restrict the Adviser’s ability to engage in transactions that they may otherwise be interested in pursuing. Affiliates of the Adviser, whose primary business includes the origination of investments, engage in investment advisory business with accounts that compete with the Fund. |
| | • | | The Adviser and its affiliates may give advice and recommend securities to other clients which may differ from, or be contrary to, advice given to, or securities recommended or bought for, the Fund even though their investment objectives may be similar to the Fund’s. |
| | • | | To the extent not restricted by confidentiality requirements or applicable law, the Adviser may apply experience and information gained in providing services to the Fund’s portfolio companies in providing services to competing companies invested in by affiliates’ other clients, which may have adverse consequences for the Fund or its portfolio investments. In addition, in providing services in respect of such portfolio companies and other issuers of portfolio investments, the Adviser or its affiliates may come into possession of information that it is prohibited from acting on (including on behalf of the Fund) or disclosing as a result of applicable confidentiality requirements or applicable law, even though such action or disclosure would be in the interests of the Fund. |
| | • | | As a registered investment company, the Fund may be limited in its ability to invest in any investment in which the Adviser or its affiliates’ other clients have an investment. The Fund may also be limited in its ability to co-invest with the Adviser or one or more of its affiliates. Some of these co-investments would only be permitted pursuant to an exemptive order from the SEC. On June 19, 2017, the SEC issued an exemptive order granting the Fund exemptive relief that expanded the Fund’s ability to co-invest with certain of its affiliates in privately negotiated transactions subject to the conditions specified in the exemptive order. |
| | • | | The Fund depends to a significant extent on the Adviser’s access to the investment professionals and senior management of KKR and the information and deal flow generated by the KKR investment professionals and senior management during the normal course of their investment and portfolio management activities. The senior management and the investment professionals of the Adviser source, evaluate, analyze and monitor the Fund’s investments. The Fund’s future success will depend on the continued service of the senior management team and investment professionals of the Adviser. |
| | • | | The Adviser’s relationship with other advisory clients and with KKR could create a conflict of interest to the extent the Adviser becomes aware of inside information concerning investments or potential investment targets. KKR has adopted information-sharing policies and procedures which address both (i) the handling of confidential information and (ii) the information barrier that exists between the public and private sides of KKR. KKR has compliance functions to administer KKR’s information-sharing policies and procedures and monitor potential conflicts of interest. The Fund cannot assure its investors, however, that these procedures and practices will be effective. Although the Fund plans to leverage KKR’s firm-wide resources to help source, conduct due diligence on, structure, syndicate and create value for the Fund’s investments (to the extent permitted by applicable law), KKR’s information-sharing policies and procedures referenced above, as well as certain legal, contractual and tax constraints, could significantly limit the Company’s ability to do so. For example, from time to time KKR’s personnel may be in possession of material non-public information with respect to the Fund’s investments or potential investments, and as a result, such professionals may be restricted by KKR’s information-sharing policies or by law or contract, from sharing such information with the KKR professionals responsible for making the Fund’s investment decisions, even where the disclosure of such information would be in the best interests of the Fund or would otherwise influence the decisions taken by such investment professionals with respect to such investment or potential investment. In addition, this conflict and these procedures and practices may limit the freedom of the Adviser to enter into or exit from potentially profitable investments for the Fund which could have an adverse effect on the Fund’s results of operations. Conversely, the Adviser may pursue investments for the Fund without obtaining access to confidential information otherwise in its or KKR’s possession, which information, if reviewed, might otherwise impact the Adviser’s judgment with respect to such investments. Accordingly, as a result of such restrictions, the investment activities of KKR’s other businesses may differ from, or be inconsistent with, the interests of and activities that are undertaken for the Fund and there can be no assurance that the Fund will be able to fully leverage all of the available resources and industry expertise of KKR’s other businesses. Additionally, there may be circumstances in which one or more individuals associated with the Adviser will be precluded from providing services to the Fund because of certain confidential information available to those individuals or to other parts of KKR. |
| | • | | The nature of the Adviser’s businesses and the participation by its employees in creditors’ committees, steering committees, or boards of directors of portfolio companies, may result in the Adviser receiving material non-public information from time to time with respect to publicly held companies or otherwise becoming an “insider” with respect to such companies. With limited exceptions, KKR does not establish information barriers between its internal investment teams. Trading by KKR on the basis of such information, or improperly disclosing such information, may be restricted pursuant to applicable law and/or internal policies and procedures adopted by KKR to promote compliance with applicable law. Accordingly, the possession of “inside information” or “insider” status with respect to such an issuer by KKR or KKR personnel may, including where an appropriate information barrier does not exist between the relevant investment professionals or has been “crossed” by such professionals, significantly restrict the ability of the Adviser to deal in the securities of that issuer on behalf of the Fund, which may adversely impact the Fund, including by preventing the execution of an otherwise advisable purchase or sale transaction in a particular security until such information ceases to be regarded as material non-public information, which could have an adverse effect on the overall performance of such investment. In addition, affiliates of KKR in possession of such information may be prevented from disclosing such information to the Adviser, even where the disclosure of such information would be in the interests of the Fund. The Adviser may also be subject to contractual “stand-still” obligations and/or confidentiality obligations that restrict its ability to trade in certain securities on behalf of the Fund. In certain circumstances, the Fund or the Adviser may engage an independent agent to dispose of securities of issuers in which KKR may be deemed to have material non-public information on behalf of the Fund. Such independent agent may dispose of the relevant securities for a price that may be lower than the Adviser’s valuation of such securities which may take into account the material non-public information known to KKR in respect of the relevant issuer. |
| | • | | The Adviser may in the future develop new businesses such as providing investment banking, advisory and other services to corporations, financial sponsors, management or other persons. Such services may relate to transactions that could give rise to investment opportunities that are suitable for the Fund. In such case, the Adviser’s client would typically require the Adviser to act exclusively on its behalf, thereby precluding the Fund from participating in such investment opportunities. The Adviser would not be obligated to decline any such engagements in order to make an investment opportunity available to the Fund. In addition, the Adviser may come into the possession of information through these new businesses that limits the Fund’s ability to engage in potential transactions. |
| | • | | The 1940 Act limits the Fund’s ability to invest in, or hold securities of, companies that are controlled by funds managed by KKR. Any such investments could create conflicts of interest between the Fund, the Adviser and KKR. The Adviser may also have, or enter into, advisory relationships with other advisory clients (including, among others, employee benefit plans subject to ERISA and related regulations) that could lead to circumstances in which a conflict of interest between the Adviser’s advisory clients could exist or develop. In addition, to the extent that another client of the Adviser or KKR holds a different class of securities than the Fund, the interest of such client and the Fund may not be aligned. As a result of these conflicts and restrictions, the Adviser may be unable to implement the Fund’s investment strategies as effectively as it could have in the absence of such conflicts or restrictions. In order to avoid these conflicts and restrictions, the Adviser may choose to exit these investments prematurely and, as a result, the Fund would forgo any future positive returns associated with such investments. |
| | • | | Certain other KKR client accounts or proprietary accounts may have investment objectives, programs, strategies and positions that are similar to, or may conflict with, those of the Fund, or may compete with, or have interests adverse to, the Fund. This type of conflict could affect the prices and availability of the securities or interests in which the Fund invests. KKR may give advice or take action with respect to the investments held by, and transactions of, other KKR client accounts or proprietary accounts that may be different from or otherwise inconsistent with the advice given or timing or nature of any action taken with respect to the investments held by, and timing or nature of any action taken with respect to the investments held by, and transactions of, the Fund. Such different advice and/or inconsistent actions may be due to a variety of reasons, including, without limitation, the differences between the investment objective, program, strategy and tax treatment of the other KKR client accounts or proprietary accounts and the Fund or the regulatory status of other KKR client accounts and any related restrictions or obligations imposed on KKR as a fiduciary thereof. Such advice and actions may adversely impact the Fund. |
| | • | | KKR, for its own account, may enter into real-estate related transactions with Fund portfolio companies. Such transactions may include, for example, buying or selling real estate assets, acquiring or entering into leasing arrangements or amending such arrangements, or transferring options or rights of first refusal to acquire real estate assets. Such transactions, which do not involve securities, are not governed by restrictions on principal transactions and cross transactions but are subject to specific policies and procedures established by KKR to manage related conflicts. |
| | • | | The 1940 Act prohibits the Fund from participating in certain transactions with certain of its affiliates including an Adviser-affiliated broker-dealer. The Fund generally is prohibited, for example, from buying or selling any securities from or to another client of the Adviser or of KKR. The 1940 Act also prohibits certain “joint” transactions with certain of the Fund’s affiliates, which in certain circumstances could include investments in the same portfolio company (whether at the same or different times to the extent the transaction involves jointness) or transactions in which a broker-dealer affiliated with the Adviser participates as principal with the Fund. If a person acquires more than 25% of the Fund’s voting securities, the Fund will be prohibited from buying or selling any security from or to such person or certain of that person’s affiliates, or entering into prohibited joint transactions with such persons. Similar restrictions limit the Fund’s ability to transact business with its officers or trustees or their affiliates. The SEC has interpreted the 1940 Act rules governing transactions with affiliates to prohibit certain “joint transactions” involving entities that share a common investment adviser. As a result of these restrictions, the scope of investment opportunities that would otherwise be available to the Fund may be limited. These investment opportunities may be made available to other funds, vehicles and accounts advised by the Adviser that are not subject to similar restrictions under the 1940 Act. |
| | • | | Shareholders of the Fund are based in a wide variety of jurisdictions and take a wide variety of forms. Accordingly, they may have conflicting regulatory, legal, investment, tax, and other interests with respect to their investments in the Fund. The conflicting interests of individual shareholders relate to or arise from, among other things, the nature of investments made by the Fund, the selection, structuring, acquisition and management of investments, the timing of disposition of investments, internal investment policies of the shareholders and their target risk/return profiles. As a consequence, conflicts of interest may arise in connection with decisions made by the Adviser, including with respect to the nature or structuring of investments, which may be more beneficial for one shareholder than for another shareholder, especially with respect to shareholders’ individual tax situations. In addition, the Fund may make investments that may have a negative impact on related investments made by the Fund in separate transactions. In selecting and structuring investments appropriate for the Fund, the Adviser will consider the investment and tax objectives of the Fund and its shareholders as a whole, not the investment, tax, or other objectives of any shareholder individually. |
The Adviser and the portfolio managers may also face other potential conflicts of interest in managing the Fund, and the descriptions above are not a complete description of every conflict of interest that could be deemed to exist in managing the Fund and other funds and accounts advised or controlled by KKR.
(a)(3) Portfolio Manager Compensation
Consistent with KKR’s global, integrated culture, KKR has one firm-wide compensation and incentive structure based on a global profit and loss statement, which covers the portfolio manager. KKR’s compensation structure is designed to align the interests of the investment personnel serving the Fund with those of the Fund’s shareholders and to give everyone a direct financial incentive to ensure that all of KKR’s resources, knowledge and relationships around the world are utilized to maximize risk-adjusted returns for each strategy.
Each of KKR’s senior executives, including the portfolio manager responsible for the day-to-day management of the Fund, receives a base salary and is eligible for a cash bonus and equity compensation, as well as additional incentives including “dollars at work” in certain KKR fund investments (other than the Fund). The cash bonus, equity compensation and “dollars at work” are discretionary, and “dollars at work” and equity awards are typically subject to a vesting period of several years.
Compensation and other incentives are not formulaic, but rather are judgment and merit driven, and are determined based on a combination of overall firm performance, individual contribution and performance, business unit performance, and relevant market and competitive compensation practices for KKR’s various businesses and the individual roles/responsibilities within each of those businesses.
(a)(4) Securities Ownership of Portfolio Managers
As of the fiscal year ended October 31, 2020, the portfolio manager beneficially owned the following shares of the Fund:
| | | | |
Portfolio Manager | | Dollar Range of
Equity Securities Owned** | |
Christopher A. Sheldon | | | None | |
Jeremiah S. Lane | | | None | |
Daniel Pietrzak | | | None | |
| ** | Ranges (None, $1-$10,000, $10,001-$50,000, $50,001-$100,000, $100,001-$500,000, $500,001-$1,000,000 or over $1,000,000). |
Item 9. Purchases of Equity Securities by Closed-End Management Investment Company and Affiliated Purchasers.
No purchases were made during the reporting period by or on behalf of the Fund or any “affiliated purchaser,” as defined in Rule 10b-18(a)(3) under the Exchange Act (17 CFR 240.10b-18(a)(3)), of shares or other units of any class of the Fund’s equity securities that is registered by the registrant pursuant to Section 12 of the Exchange Act (15 U.S.C. 781).
Item 10. Submission of Matters to a Vote of Security Holders.
There have been no material changes to the procedures by which shareholders may recommend nominees to the registrant’s board of trustees since the registrant last provided disclosure in response to this item.
Item 11. Controls and Procedures.
(a) The registrant’s principal executive officer and principal financial officer have concluded, based on their evaluation of the registrant’s disclosure controls and procedures as of a date within 90 days of the filing date of this report on Form N-CSR, that the design and operation of such procedures are effective to provide reasonable assurance that information required to be disclosed by the investment company on Form N-CSR is recorded, processed, summarized and reported within the time periods specified in the Commission’s rules and forms.
(b) There have been no changes in the registrant’s internal control over financial reporting during the year ended October 31, 2020 that materially affected, or are reasonably likely to materially affect, the registrant’s internal control over financial reporting.
Item 12. Disclosure of Securities Lending Activities for Closed-End Management Investment Companies
The registrant did not engage in securities lending activities during the fiscal year reported on this Form N-CSR.
Item 13. Exhibits.
(a)(1) Code of Ethics attached hereto.
(a)(2) A separate certification for the principal executive officer and the principal financial officer of the registrant as required by Rule 30a-2(a) under the Investment Company Act of 1940, as amended, are filed herewith.
(a)(3) Not applicable.
(a)(4) Not applicable.
(b) Certifications pursuant to Section 906 of the Sarbanes-Oxley Act of 2002 are filed herewith.
SIGNATURES
Pursuant to the requirements of the Securities Exchange Act of 1934 and the Investment Company Act of 1940, the registrant has duly caused this report to be signed on its behalf by the undersigned, thereunto duly authorized.
| | |
| KKR Credit Opportunities Portfolio |
| |
| By | | /s/ Eric Mogelof |
| Eric Mogelof, President |
Pursuant to the requirements of the Securities Exchange Act of 1934 and the Investment Company Act of 1940, this report has been signed below by the following persons on behalf of the registrant and in the capacities and on the dates indicated.
| | |
| By | | /s/ Eric Mogelof |
| Eric Mogelof, President |
| | |
| By | | /s/ Thomas Murphy |
| Thomas Murphy, Treasurer, Chief Accounting Officer & Chief Financial Officer |