UNITED STATES
SECURITIES AND EXCHANGE COMMISSION
Washington, D.C. 20549
FORM N-CSR
CERTIFIED SHAREHOLDER REPORT OF REGISTERED
MANAGEMENT INVESTMENT COMPANIES
Investment Company Act file number (811-23474)
KKR Credit Opportunities Portfolio
(Exact name of registrant as specified in charter)
555 California Street, 50th Floor
San Francisco, CA 94104
(Address of principal executive offices) (Zip code)
Lori Hoffman
KKR Credit Advisors (US) LLC
555 California Street, 50th Floor
San Francisco, CA 94104
(Name and address of agent for service)
(415) 315-3620
Registrant’s telephone number, including area code
Date of fiscal year end: October 31, 2023
Date of reporting period: October 31, 2023
Item 1. Reports to Stockholders.
KKR Credit Opportunities Portfolio
Annual Report
October 31, 2023
| | | | | | | | |
| Credit Opportunities Portfolio | October 31, 2023 |
| |
The KKR Credit Opportunities Portfolio (the “Fund”) files its complete schedule of portfolio holdings with the Securities and Exchange Commission (the “Commission”) for the first and third quarters of each fiscal year on Form N-PORT within sixty days after the end of the period. The Fund’s Form N-PORT is available on the Commission’s website at www.sec.gov. A description of the policies and procedures that the Fund uses to determine how to vote proxies relating to portfolio securities, as well as information relating to how a Fund voted proxies relating to portfolio securities during the most recent year ended June 30 will be available (i) without charge, upon request, by calling 855-862-6092; and (ii) on the Commission’s website at www.sec.gov.
INFORMATION ABOUT THE FUND’S TRUSTEES
The statement of additional information includes information about the Fund’s Trustees and is available without charge, upon request, by calling 855-862-6092 and by visiting the Commission’s website at www.sec.gov or the Fund’s website at kkrfunds.com/kcop.
| | | | | | | | |
| Credit Opportunities Portfolio | October 31, 2023 |
| |
Management’s Discussion of Fund Performance
Looking Back on the Markets — October 31, 2023
As we reflect on the past year, we have seen a continued trend of credit markets being in flux. Rising rates, geopolitical tensions, and deteriorating credit fundamentals have all posed headwinds for credit markets as investors navigate this volatile and opaque environment. However, the path forward for the asset class is becoming a little clearer. We see a trend in which private credit is becoming a more permanent allocation for investors, and we believe that flexibility and certainty of execution will continue to be attractive for borrowers even after syndicated markets reopen. While private credit has been getting a great deal of attention lately in both the press and investment circles, we think it is a mistake to ignore opportunities in liquid credit. We think the permanence of private credit does nothing to diminish the need for public credit markets. Both have a place in a healthy, functioning borrowing system and can serve different purposes. Public credit allows for quick deployment, and the relatively high yields currently available in public markets have the potential to cushion against price volatility. The liquidity of public markets creates the potential to shift quickly when market conditions change. As capital markets reopen, we think the change in the investment environment is likely to be both significant and swift. We believe this vintage of new deals will be attractive and that taking advantage of new issuances across private credit and public credit will lead to differentiated outcomes, particularly if lenders are able to expand the new issue premium with call protection or call premiums. This is most evident in high yield bonds, private junior debt, and other subordinated capital solutions. In short, we think it will remain a good time to be a lender.
As for the capital markets, we see some green shoots emerging. U.S. initial public offering, or IPO, activity has ticked up. Our debt capital markets team has seen a ramp-up in syndicated public debt markets and expects this trend to continue in the remaining months of 2023, and we have noticed that our clients have more appetite for allocating to credit in both liquid and private markets. We think that the interest rate outlook is a tad bit clearer, and that while credit fundamentals have not yet bottomed, they may be closer to doing so. Though there will no doubt be bumps in the road from here, we note that at this point in the calendar, there is pressure to get invested and to do deals. Fear of missing out is a powerful motivator.
Overall, as we look prospectively, the fragility, uncertainty, and volatility that have become consistent features of the market environment make it hard to interpret signals: Is a pipeline of new capital markets activity the sign we’ve been waiting for? Or are bank failures and credit downgrades the alarm we’ve been anticipating? We tend to lean toward the former, but those questions are only going to be perfectly clear in hindsight. We continue to believe waiting is the wrong approach. It takes time to deploy into private credit, but commitments need to be made now to access future deal flow. Meanwhile, liquid credit offers an opportunity to put money to work immediately. We believe that factors such as rate stabilization, increased market activity and demand for capital should provide a clearer view to how the short term will play out. Our idea is: Just start.
Traded Credit Markets
In the earlier part of this year, liquid credit markets offered a rare opportunity to take advantage of high yields, wide spreads, and prices ticking back up on the strength of rising market confidence across public markets. We saw public credit markets perform well and investor sentiment improved following the large valuation reset we saw in 2022. On a year-to-date basis, by the end of October 2023, the S&P 500 was up +10.7%, but the U.S. leveraged loan market was up +10.2% and U.S. high yield bond market was up +4.7% with far less risk. In hindsight, adding publicly traded assets to a private credit allocation would have not only helped those on the sidelines get capital deployed quickly, it would have also been accretive to a portfolio in terms of both returns and diversification.
That said, opportunity has not disappeared from public markets. While timing the ideal entry point is very difficult, we think the relatively high yield available can be good buffers against price volatility. To our team’s way of thinking, a downward move in rates will trigger an upward price movement in high yield and make the floating nature of loans less attractive. So long as one has capital to deploy and the flexibility to act when a move is imminent and fixed-rate debt becomes more attractive, we think it makes sense to take advantage of the income available today.
We’re excited about the opportunity ahead of us in traded credit. Given risks on the horizon (slowing growth, margin pressures, increasing cost of capital, etc.), we do see potential for spread volatility in the coming months. However, we think a few factors are important to consider when evaluating spreads. High yield market spreads as of October 31, 2023 are 442 basis points. To put into context, on a historical basis, spreads have been tighter than that level 62% of the time over the last 10 years. Spreads are attractive, but not outright “cheap”. One factor that we believe is often
| | | | | | | | |
| Credit Opportunities Portfolio | October 31, 2023 |
| |
overlooked is the composition of the market over time – there has been a noticeable shift in the high yield market over the last ten years towards a much “cleaner” high yield market – from a ratings perspective, more of the market is BB rated than ever before (~50% BB in the US and ~60% in Europe) and more high yield issuance has been secured than ever before (vs. unsecured). If you adjust for these quality factors, spread today is incrementally more attractive versus history. We also think it’s worth considering both the entry price and overall yields available in the market, both of which are historically quite attractive. Both US bank loans and high yield bond yields are in the top 1% of where they have been over the past 10-years (more return available than 99% of days over the past 10 years). The average dollar price in the high yield market of 86 cents as of October 31, 2023 is similarly attractive (top 4% price entry point). We are positioning the portfolio to take advantage of the returns on offer in the market doing the “simple” things and are ready with dry powder to take advantage of any volatility that may (or may not) come.
Private Credit Markets
Credit markets have changed in fundamental ways over the last 15 years—shifting corporate borrowing away from syndicated markets and towards private credit. Banks began shrinking the scope of their lending activity after the Global Financial Crisis, and the pullback has continued post-COVID and in the face of the U.S. regional banking scare in March 2023. As a result of the most recent retrenchment, the loan syndication machine broke down, conditions for high yield issuance became unpredictable, and the IPO well ran dry. What was left? Private credit, which has steadily taken share from syndicated markets and moved out of the realm of the middle-market to become a viable means for financing larger deals. Meanwhile, more recently, private asset-based finance strategies have seen a growing number of attractive opportunities to lend against portfolios of high-quality assets as regional banks have started to look to shed portfolios of loans or exit from lending against certain assets. On the other side of the transaction, we think private credit is also a permanent option for sponsors and borrowers. A growing number of large financings that would have almost certainly taken place in syndicated markets in the past have instead been executed in private credit markets. A negotiation with one lender or, in a bigger transaction, a small group of like-minded lenders, offers a level of certainty and flexibility that syndicated markets often can’t, and the potential benefits of that became obvious with syndicated markets shut.
On the demand side, we see a trend in which private credit is becoming a more permanent allocation for investors. Typically, we have seen the core allocations within private credit take on the role of an income strategy that can be supplemented by opportunistic, higher-yielding corporate lending strategies or private strategies that are uncorrelated to developed market corporate risk, such as asset-based. It’s also important to consider that private equity funds hold more than $2 trillion of dry powder and will need both public and private credit to finance deals. Indeed, we believe the pace of growth in private credit is sustainable, but it need not usurp liquid credit’s traditional role. We see them working more in tandem, even in the same deal at different points in the capital structure.
Private Corporate Direct Lending
The dislocation in the syndicated loan and bond market and the rising rate environment that persisted in the trailing 12-months has been supportive of KKR’s private direct lending initiatives. A few areas of focus have included: 1) larger borrowers, which generally have less customer and supplier concentration risk, better, more experienced management teams and stronger balance sheets, 2) defensive and non-cyclical sectors while being selective and diligent about maintaining portfolio diversification, 3) avoiding sectors where raw materials comprise a large percentage cost and those with weak pricing power and 4) deploying capital into incumbent investments to support a company’s continued growth. We have invested heavily into our team and platform over the last few years and are confident in our ability to maintain our origination volume and network in an increasingly competitive market.
Private Asset-Based Finance
Private asset-based finance is a large asset class that reaches across many different segments of the economy. Disintermediation in the banking sector has been expansionary for the asset class since the financial crisis, and more recently the regional banking dislocation in the U.S. has provided unique opportunities to be a private provider of capital as they look to sell portfolios of assets to shore up liquidity. While there is an increasing opportunity for private asset-based finance as a result, our underwriting standards remain high and we are picking our spots carefully, with an eye towards downside protection. We have sought to diligence funding originators with long track records and in sectors where we are more favorably biased – namely, lending to more prime borrower segments and on a collateralized basis. We also prefer secured risk over unsecured and have found opportunities across diverse collateral such as auto loans, mortgages, and equipment leasing. Finally, we also favor real assets which can provide a natural hedge in today’s high inflationary environment.
| | | | | | | | |
| Credit Opportunities Portfolio | October 31, 2023 |
| |
Fund Description & Performance
KKR Credit Opportunities Portfolio (“KCOP” or, the “Fund”) is a diversified, closed-end management investment company that continuously offers its shares and is operated as an “interval fund.” The Fund’s investment objective is to seek to provide attractive risk-adjusted returns and high current income. The Fund seeks to achieve its investment objectives by investing in a select portfolio with exposure to two primary credit strategies:
a.Opportunistic Credit, a conviction-based approach investing in a portfolio consisting primarily of publicly traded high yield bonds, first and second lien secured bank loans and structured credit (e.g., collateralized loan obligations (“CLOs”) and mezzanine debt); and
b.Private Credit, which includes directly originated hard and financial asset-based lending, corporate mezzanine debt, as well as directly originated first lien, second lien and unitranche senior loans to primarily upper middle-market companies.
The Fund expects, under normal circumstances, to invest 70-80% of its Managed Assets in the Opportunistic Credit strategy and 20-30% of its Managed Assets in the Private Credit strategy, though the Fund’s allocation in investments could vary from these guidelines at any time in the Fund’s discretion. “Managed Assets” means the total assets of the Fund (including any assets attributable to borrowings for investment purposes) minus the sum of the Fund’s accrued liabilities (other than liabilities representing borrowings for investment purposes).
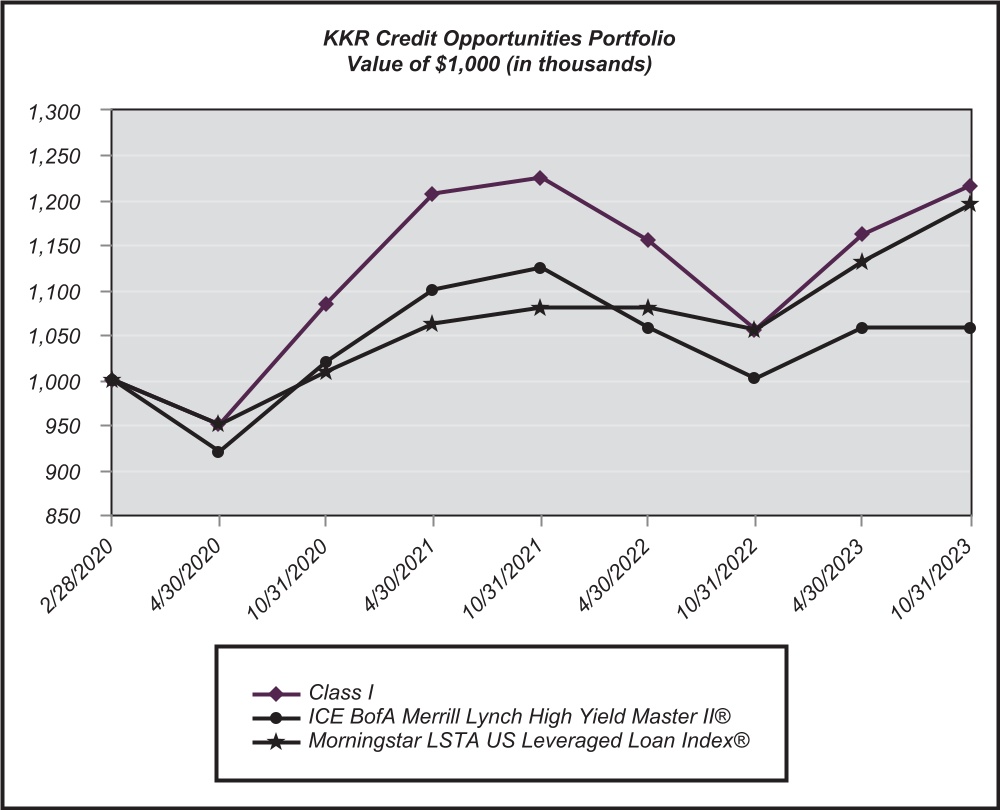
With respect to performance, following a challenging year, the Fund has recovered both on an absolute basis and relative to broader leveraged credit markets. For the 12-month period ended October 31, 2023, the Fund’s total return, net of fees and inclusive of dividends, was as follows for each share class: 14.88% (Class I), 14.72% (Class D), 14.10% (Class U), 14.08% (Class T – No Sales Load) and 11.79% (Class T – With Sales Load). By comparison, high yield (as measured by the Bank of America Merrill Lynch High Yield Master II Index) returned 5.90% and leveraged loans (as measured by the Morningstar LSTA US Leveraged Loan Index) returned 11.92%.
Looking at the trailing 12-month period, a component of this performance is derived from the underlying markets in which the Fund invests in, which were volatile and have faced headwinds amid rising rates, inflation concerns, recessionary fears, and even geopolitics. Importantly, risk assets and notably the leveraged credit markets, have seen a recovery following its lows of 2022. We also note the Fund’s use of leverage which has amplified returns in periods of positive performance and diluted returns in periods of negative performance. Over longer horizons, we believe leverage adds substantial value to the Fund, as reflected in the portfolio’s yield profile.
Diving into the Fund’s performance drivers, positions within the leisure, services and retail sectors were the top contributors during the period. On an asset class basis, leveraged loans and high yield bond positions were the strongest performers followed by structured credit, convertible bonds, and finally private credit. Performance was positive across all rating cohorts including non-rated positions. Notably strong was the selection of lower-rated names in the CCC- and B-rated cohort of the market which, in aggregate, comprised CCC-rated names followed by B-rated names which, in aggregate, comprised ~61.4% of the portfolio on average.
KCOP’s investments represented obligations and equity interests in 424 positions across a diverse group of industries. The top ten issuers represented 21.9% of the Fund’s total assets while the top five industries represented 29.9% of the Fund’s total assets. The Fund’s portfolio is comprised of the following:
| | | | | | | | |
| Investments in securities | % of net assets as of October 31, 2023 |
| | |
| Leveraged Loans | 61.2 | % |
| High Yield Securities | 52.6 | % |
| Asset Backed Securities | 7.8 | % |
| Equity and Other Investments | 5.5 | % |
| Total investments in securities | 127.1 | % |
| | | | | | | | |
| Credit Opportunities Portfolio | October 31, 2023 |
| |
Business Updates
We thank you for your partnership and continued investment in KCOP. We look forward to continued communications and will keep you apprised of the progress of KCOP specifically and the leveraged finance marketplace generally. Fund information is available on our website at kkrfunds.com/kcop.
Disclosures
The Bank of America Merrill Lynch High Yield Master II Index is a market-value weighted index of below investment grade US dollar-denominated corporate bonds publicly issued in the US domestic market. “Yankee” bonds (debt of foreign issuers issued in the US domestic market) are included in the Bank of America Merrill Lynch High Yield Master II Index provided that the issuer is domiciled in a country having investment grade foreign currency long-term debt rating. Qualifying bonds must have maturities of one year or more, a fixed coupon schedule and minimum outstanding of US$100.0 million. In addition, issues having a credit rating lower than BBB3, but not in default, are also included.
The Morningstar LSTA US Leveraged Loan Index is a market value-weighted index designed to measure the performance of the US leveraged loan market based upon market weightings, spreads and interest payments. The index was rolled out in 2000, and it was backloaded with four years of data dating to 1997.
It is not possible to invest directly in an index.
Past performance is not an indication of future results. Returns represent past performance and reflect changes in share prices, the reinvestment of all dividends and capital gains, expense limitations and the effects of compounding. The prospectus contains more complete information on the investment objectives, risks, charges and expenses of the investment company, which investors should read and consider carefully before investing. The returns shown do not reflect taxes a shareholder would pay on distributions or redemptions. Total investment return and principal value of your investment will fluctuate, and your shares, when sold, may be worth more or less than their original cost. Current performance may be higher or lower than the performance data quoted. An investment in the Fund involves risk, including the risk of loss of principal. For a discussion of the Fund’s risks, see Risk Considerations, Note 3 to the financial statements. Call 855-330-3927 or visit www.kkrfunds.com/kcop for performance results current to the most recent calendar quarter-end.
Must be preceded or accompanied by a prospectus.
An imbalance in supply and demand in the income market may result in valuation uncertainties and greater volatility, less liquidity, widening credit spreads and a lack of price transparency in the market. Investments in income securities may be affected by changes in the creditworthiness of the issuer and are subject to the risk of non–payment of principal and interest. The value of income securities also may decline because of real or perceived concerns about the issuer’s ability to make principal and interest payments. Borrowing to increase investments (leverage) will exaggerate the effect of any increase or decrease in the value of Fund investments. Investments rated below investment grade (typically referred to as “junk”) are generally subject to greater price volatility and illiquidity than higher rated investments. As interest rates rise, the value of certain income investments is likely to decline. Senior loans are subject to prepayment risk. Investments in foreign instruments or currencies can involve greater risk and volatility than US investments because of adverse market economic, political, regulatory, geopolitical or other conditions. Changes in the value of investments entered for hedging purposes may not match those of the position being hedged. The Fund may engage in other investment practices that may involve additional risks.
| | | | | | | | |
| Credit Opportunities Portfolio | October 31, 2023 |
| |
| | | | | | | | | | | | | | | | | | | | |
Average Annual Total Returns Year Ended October 31, 2023 | | One Year | | Since Inception | | Value of $1,000,000 investment at the time of inception as of 10/31/2023 |
| | | | | | |
| KKR Credit Opportunities Portfolio | | | | | | in thousands |
| Class I (commenced operations on 2/28/2020) | | 14.88 | % | | 5.46 | % | | $ | 1,216 | |
| Class T (commenced operations on 6/1/2020) | | 14.08 | % | | 4.34 | % | | $ | 1,156 | |
| Class U (commenced operations on 9/1/2020) | | 14.10 | % | | 2.77 | % | | $ | 1,090 | |
| Class D (commenced operations on 1/31/2022) | | 14.72 | % | | -0.83 | % | | $ | 986 | |
ICE BofA Merrill Lynch High Yield Master II Index® | | 5.90 | % | | 1.53 | % | | $ | 1,127 | |
| Morningstar LSTA US Leveraged Loan Index | | 11.92 | % | | 4.97 | % | | $ | 1,080 | |
Past performance is not an indication of future results. The above graph and average annual total returns table does not reflect the deduction of taxes that a shareholder would pay on Fund distributions or the sale of Fund shares.
| | | | | | | | |
| Credit Opportunities Portfolio | October 31, 2023 |
| |
Schedule of Investments
(Stated in United States Dollars, unless otherwise noted)
| | | | | | | | | | | | | | | | | | | | | | | | | | |
| Issuer | Asset | Reference Rate & Spread | Interest Rate | Maturity Date | Currency | Par | Fair Value | Footnotes |
| | | | | | | | |
| Leveraged Loans - 61.21% | | | | | | | | |
| Aerospace & Defense - 0.85% | | | | | | | | |
| Altitude II IRL WH Borrower DAC | Revolver 1L 05/23 | SOFR + 10.00% | 5.44% | 1/12/2030 | USD | 40,906 | | $ | 20,051 | | (b) (e) |
| Amentum Services Inc | TL 2L B 12/21 | SOFR + 7.60% | 12.93% | 2/15/2030 | USD | 2,767,140 | | 2,630,167 | | (b) |
| Arcfield Acquisition Corp | Revolver 1L 03/22 | SOFR + 5.75% | 0.50% | 8/4/2028 | USD | 143,583 | | — | | (a) (b) (e) |
| Arcfield Acquisition Corp | TL 1L 03/22 | LIBOR + 5.75% | 11.62% | 8/4/2029 | USD | 976,766 | | 980,087 | | (a) (b) |
| Ultra Electronics Holdings Ltd | TL 1L B 11/21 | LIBOR + 3.75% | 9.36% | 8/6/2029 | USD | 131,863 | | 128,270 | | |
| Ultra Electronics Holdings Ltd | TL 1L B 11/21 | EURIBOR + 3.25% | 7.19% | 8/6/2029 | EUR | 104,000 | | 106,853 | | |
| Vertex Aerospace Services Corp | TL 1L B 12/21 | SOFR + 3.35% | 8.67% | 12/6/2028 | USD | 1,535,227 | | 1,534,651 | | |
| | | | | | | | |
| Agricultural Products & Services - 0.05% | | | | | | | | |
| Fruits Bidco | TL 1L B1 08/23 | SOFR + 5.75% | 11.09% | 8/9/2030 | USD | 275,319 | | 269,179 | | (b) |
| Fruits Bidco | TL 1L B2 08/23 | EURIBOR + 5.75% | 9.55% | 8/9/2030 | EUR | 61,259 | | 63,335 | | (b) |
| | | | | | | | |
| Air Freight & Logistics - 1.13% | | | | | | | | |
| Envirotainer Ltd | TL 1L B1 07/22 | EURIBOR + 5.75% | 9.72% | 7/30/2029 | EUR | 4,739,642 | | 4,887,748 | | (a) (b) |
| Envirotainer Ltd | TL 1L B2 07/22 | SOFR + 5.75% | 11.14% | 7/30/2029 | USD | 2,411,934 | | 2,352,118 | | (a) (b) |
| Envirotainer Ltd | TL 1L DD 07/22 | EURIBOR + 5.75% | 1.15% | 7/30/2029 | EUR | 865,234 | | (22,691) | | (a) (b) (e) |
| | | | | | | | |
| Alternative Carriers - 1.61% | | | | | | | | |
| Level 3 Financing Inc | TL 1L 11/19 | SOFR + 1.75% | 7.19% | 3/1/2027 | USD | 10,940,710 | | 10,246,248 | | (a) |
| | | | | | | | |
| Apparel, Accessories & Luxury Goods - 3.18% | | | | | | | |
| Varsity Brands Inc | TL 1L 02/23 | SOFR + 5.11% | 10.44% | 12/15/2026 | USD | 21,176,519 | | 20,303,094 | | |
| | | | | | | | |
| Application Software - 5.35% | | | | | | | | |
| Community Brands Inc | Revolver 1L 02/22 | SOFR + 5.50% | 0.50% | 2/24/2028 | USD | 60,610 | | (1,182) | | (a) (b) (e) |
| Community Brands Inc | TL 1L 02/22 | SOFR + 5.65% | 10.92% | 2/24/2028 | USD | 1,014,846 | | 995,056 | | (a) (b) |
| Community Brands Inc | TL 1L DD 02/22 | SOFR + 5.50% | 1.00% | 2/24/2028 | USD | 121,212 | | (2,364) | | (a) (b) (e) |
| Follett Software Co | Revolver 1L 08/21 | SOFR + 5.75% | 0.50% | 8/31/2027 | USD | 136,050 | | (816) | | (a) (b) (e) |
| Follett Software Co | TL 1L 08/21 | LIBOR + 5.75% | 11.17% | 8/31/2028 | USD | 1,522,529 | | 1,513,394 | | (a) (b) |
| Med-Metrix | Revolver 1L 09/21 | SOFR + 6.00% | 0.50% | 9/15/2027 | USD | 158,828 | | — | | (a) (b) (e) |
| Med-Metrix | TL 1L 09/21 | LIBOR + 6.00% | 11.53% | 9/15/2027 | USD | 1,245,211 | | 1,245,211 | | (a) (b) |
| Med-Metrix | TL 1L DD 09/21 | LIBOR + 6.00% | 11.53% | 9/15/2027 | USD | 632,310 | | 400,421 | | (a) (b) (e) |
| SAMBA Safety Inc | Revolver 1L 09/21 | SOFR + 5.25% | 4.50% | 9/1/2027 | USD | 41,810 | | 20,545 | | (a) (b) (e) |
| SAMBA Safety Inc | TL 1L 09/21 | LIBOR + 5.25% | 10.95% | 9/1/2027 | USD | 565,564 | | 560,700 | | (a) (b) |
| Solera LLC | TL 2L 06/21 PIK Toggle | SOFR + 9.10% | 14.52% | 6/4/2029 | USD | 17,314,785 | | 17,364,577 | | (b) |
| TIBCO Software Inc | TL 1L B 09/22 | SOFR + 4.60% | 9.99% | 3/30/2029 | USD | 12,657,355 | | 12,054,675 | | |
See accompanying notes to financial statements.
6
| | | | | | | | |
| Credit Opportunities Portfolio | October 31, 2023 |
| |
| | | | | | | | | | | | | | | | | | | | | | | | | | |
| Issuer | Asset | Reference Rate & Spread | Interest Rate | Maturity Date | Currency | Par | Fair Value | Footnotes |
| | | | | | | | |
| Automotive Parts & Equipment - 2.28% | | | | | | | | |
| Innovative XCessories & Services LLC | TL 1L 02/20 | SOFR + 4.35% | 9.85% | 3/5/2027 | USD | 6,686,174 | | $ | 5,495,199 | | |
| Parts Authority Inc | TL 1L 10/20 | SOFR + 4.01% | 9.39% | 10/28/2027 | USD | 1,536,285 | | 1,460,753 | | |
| Rough Country LLC | TL 2L 07/21 | SOFR + 6.35% | 11.73% | 7/30/2029 | USD | 861,230 | | 813,862 | | |
| Truck Hero Inc | TL 1L 01/21 | SOFR + 3.86% | 9.19% | 1/31/2028 | USD | 5,007,369 | | 4,792,478 | | |
| Wheel Pros Inc | TL 1L 09/23 | SOFR + 8.88% | 14.31% | 5/11/2028 | USD | 902,052 | | 974,591 | | |
| Wheel Pros Inc | TL 1L 09/23 | SOFR + 4.50% | 9.95% | 5/11/2028 | USD | 1,218,733 | | 990,220 | | |
| | | | | | | | |
| Broadcasting - 2.47% | | | | | | | | |
| NEP Broadcasting LLC | TL 1L 05/20 | SOFR + 8.36% | 13.69% | 6/1/2025 | USD | 149,239 | | 149,239 | | (a) (b) |
| NEP Broadcasting LLC | TL 1L B 09/18 | SOFR + 3.36% | 8.69% | 10/20/2025 | USD | 4,482,478 | | 4,074,662 | | (a) |
| NEP Broadcasting LLC | TL 2L 09/18 | SOFR + 7.11% | 12.44% | 10/19/2026 | USD | 14,697,782 | | 11,545,108 | | (a) |
| | | | | | | | |
| Broadline Retail - 0.21% | | | | | | | | |
| AutoScout24 GmbH | TL 1L B 02/20 | EURIBOR + 2.75% | 6.91% | 3/31/2027 | EUR | 192,932 | | 192,444 | | |
| AutoScout24 GmbH | TL 2L 01/20 | EURIBOR + 6.00% | 10.14% | 3/31/2028 | EUR | 894,208 | | 905,560 | | |
| Belk Inc | TL 1L 02/21 | PRIME + 6.50% | 15.00% | 7/31/2025 | USD | 53,180 | | 45,895 | | (a) |
| Belk Inc | TL 1L EXIT 02/21 PIK Toggle | | | 7/31/2025 | USD | 1,000,844 | | 191,827 | | (a) (c) (f) |
| | | | | | | | |
| Building Products - 0.87% | | | | | | | | |
| DiversiTech Holdings Inc | TL 2L B 12/21 | SOFR + 7.01% | 12.40% | 12/21/2029 | USD | 1,945,020 | | 1,760,243 | | |
| VC GB Holdings Inc (Visual Comfort) | TL 2L 06/21 | SOFR + 7.01% | 12.40% | 7/23/2029 | USD | 4,110,401 | | 3,781,569 | | |
| | | | | | | | |
| Cable & Satellite - 0.97% | | | | | | | | |
| Astound Broadband (RCN/Radiate) | TL 1L B 10/21 | SOFR + 3.36% | 8.69% | 9/25/2026 | USD | 5,602,484 | | 4,651,126 | | |
| Virgin Media Inc | TL 1L 09/19 | SOFR + 2.61% | 7.95% | 1/31/2028 | USD | 1,564,478 | | 1,522,441 | | |
| | | | | | | | |
| Cargo Ground Transportation - 0.03% | | | | | | | | |
| Lazer Logistics Inc | Revolver 1L 05/23 | SOFR + 6.25% | 1.82% | 5/4/2029 | USD | 24,046 | | 2,966 | | (a) (b) (e) |
| Lazer Logistics Inc | TL 1L B 05/23 | SOFR + 6.25% | 11.72% | 5/6/2030 | USD | 198,377 | | 196,393 | | (a) (b) |
| Lazer Logistics Inc | TL 1L DD 05/23 | SOFR + 6.25% | 1.00% | 5/6/2030 | USD | 30,057 | | (301) | | (a) (b) (e) |
| | | | | | | | |
| Casinos & Gaming - 0.10% | | | | | | | | |
| Entain PLC | TL 1L B2 10/22 | SOFR + 3.60% | 8.99% | 10/31/2029 | USD | 634,704 | | 635,630 | | |
| | | | | | | | |
| Construction & Engineering - 2.09% | | | | | | | | |
| Brand Energy & Infrastructure Services Inc | TL 1L B 07/23 | SOFR + 5.50% | 10.87% | 8/1/2030 | USD | 1,533,282 | | 1,482,385 | | |
| Total Safety US Inc | TL 1L B 07/19 | SOFR + 6.26% | 11.50% | 8/16/2025 | USD | 6,129,043 | | 5,845,575 | | (a) |
| USIC Holdings Inc | TL 2L 05/21 | SOFR + 6.61% | 11.94% | 5/14/2029 | USD | 2,682,939 | | 2,475,011 | | |
| Yak Access LLC | TL 1L 03/23 | SOFR + 6.50% | 11.98% | 3/10/2028 | USD | 3,988,412 | | 3,545,698 | | |
| | | | | | | | |
See accompanying notes to financial statements.
7
| | | | | | | | |
| Credit Opportunities Portfolio | October 31, 2023 |
| |
| | | | | | | | | | | | | | | | | | | | | | | | | | |
| Issuer | Asset | Reference Rate & Spread | Interest Rate | Maturity Date | Currency | Par | Fair Value | Footnotes |
| Construction Machinery & Heavy Transportation Equipment - 1.59% | | | | | | |
| Accuride Corp | TL 1L B 07/23 | 1.62% PIK, SOFR + 5.25% | 12.19% | 5/18/2026 | USD | 7,514,153 | | $ | 6,621,847 | | (f) |
| American Trailer Works Inc | TL 1L 02/21 | SOFR + 3.85% | 9.17% | 3/3/2028 | USD | 3,601,190 | | 3,397,129 | | |
| Shaw Development LLC | TL 1L 10/23 | SOFR + 6.00% | 6.25% | 10/30/2029 | USD | 148,613 | | 147,127 | | (a) (b) |
| Shaw Development LLC | TL 1L DD 10/23 | SOFR + 6.00% | 0.50% | 10/30/2029 | USD | 17,692 | | (177) | | (a) (b) (e) |
| | | | | | | | |
| Data Processing & Outsourced Services - 1.46% | | | | | | | |
| Encora Digital LLC | TL 1L 12/21 PIK Toggle | LIBOR + 5.18% | 10.47% | 12/20/2028 | USD | 1,652,370 | | 1,649,065 | | (a) (b) |
| Encora Digital LLC | TL 1L 12/21 | 9.75% PIK | 9.75% | 12/13/2029 | USD | 506,251 | | 482,052 | | (a) (b) (f) |
| Encora Digital LLC | TL 1L DD 12/21 | SOFR + 5.18% | 10.47% | 12/20/2028 | USD | 398,160 | | 397,364 | | (a) (b) |
| West Corp | TL 1L B3 01/23 | SOFR + 4.25% | 9.63% | 4/10/2027 | USD | 7,258,448 | | 6,815,356 | | |
| | | | | | | | |
| Distributors - 1.48% | | | | | | | | |
| Caldic BV | TL 1L B 01/22 | SOFR + 3.75% | 9.13% | 2/26/2029 | USD | 107,030 | | 106,183 | | |
| Caldic BV | TL 1L B 02/22 | EURIBOR + 3.50% | 7.45% | 2/26/2029 | EUR | 61,831 | | 63,791 | | |
| Caldic BV | TL 2L 03/22 | SOFR + 7.25% | 12.63% | 2/25/2030 | USD | 6,499,085 | | 6,297,613 | | (b) |
| Parts Town LLC | TL 1L 11/21 | LIBOR + 5.50% | 11.52% | 11/1/2028 | USD | 831,724 | | 823,157 | | (a) (b) |
| Parts Town LLC | TL 1L B 11/21 | LIBOR + 5.50% | 11.52% | 11/1/2028 | USD | 913,219 | | 903,813 | | (a) (b) |
| Parts Town LLC | TL 1L DD 11/21 | SOFR + 6.13% | 11.52% | 11/1/2028 | USD | 1,274,864 | | 1,261,733 | | (a) (b) |
| | | | | | | | |
| Diversified Metals & Mining - 0.02% | | | | | | | | |
| Foresight Energy LLC | TL 1L A 06/20 | SOFR + 8.10% | 13.49% | 6/30/2027 | USD | 120,754 | | 120,754 | | (a) (b) |
| | | | | | | | |
| Diversified Support Services - 0.18% | | | | | | | | |
| Access CIG LLC | TL 2L 02/18 | SOFR + 7.75% | 13.41% | 2/27/2026 | USD | 93,173 | | 91,310 | | |
| Apex Service Partners LLC | Revolver 1L 10/23 | SOFR + 6.50% | 0.95% | 10/24/2029 | USD | 25,732 | | 858 | | (a) (b) (e) |
| Apex Service Partners LLC | TL 1L 10/23 | 2% PIK, SOFR + 7.00% | 12.40% | 10/24/2030 | USD | 298,351 | | 294,622 | | (a) (b) (f) |
| Apex Service Partners LLC | TL 1L 10/23 PIK | 14.25% PIK | 14.25% | 4/23/2031 | USD | 64,914 | | 63,376 | | (a) (b) (f) |
| Apex Service Partners LLC | TL 1L DD 10/23 | SOFR + 6.50% | 1.00% | 10/24/2030 | USD | 77,197 | | (965) | | (a) (b) (e) |
| Apex Service Partners LLC | TL 1L DD 10/23 PIK | 14.25% PIK | 14.25% | 4/23/2031 | USD | 32,458 | | (769) | | (a) (b) (e) (f) |
| Magna Legal Services LLC | Revolver 1L 11/22 | SOFR + 6.63% | 0.50% | 11/22/2028 | USD | 26,940 | | — | | (a) (b) (e) |
| Magna Legal Services LLC | TL 1L 11/22 | SOFR + 6.60% | 12.02% | 11/22/2029 | USD | 229,952 | | 231,309 | | (a) (b) |
| Magna Legal Services LLC | TL 1L DD 11/22 | SOFR + 6.60% | 6.56% | 11/22/2029 | USD | 64,374 | | 61,548 | | (a) (b) (e) |
| Trescal SA | TL 1L B1 05/23 | EURIBOR + 6.50% | 10.12% | 5/2/2030 | EUR | 197,463 | | 203,571 | | (a) (b) |
| Trescal SA | TL 1L B2 04/23 | SOFR + 6.50% | 11.86% | 5/2/2030 | USD | 215,855 | | 210,437 | | (a) (b) |
| Trescal SA | TL 1L DD 05/23 | EURIBOR + 6.50% | 1.30% | 5/2/2030 | EUR | 113,999 | | (3,026) | | (a) (b) (e) |
| | | | | | | | |
See accompanying notes to financial statements.
8
| | | | | | | | |
| Credit Opportunities Portfolio | October 31, 2023 |
| |
| | | | | | | | | | | | | | | | | | | | | | | | | | |
| Issuer | Asset | Reference Rate & Spread | Interest Rate | Maturity Date | Currency | Par | Fair Value | Footnotes |
| Electronic Equipment & Instruments - 0.73% | | | | | | | |
| Excelitas Technologies Corp | Revolver 1L 08/22 | SOFR + 5.75% | 5.03% | 8/12/2028 | USD | 351,770 | | $ | 228,615 | | (b) (e) |
| Excelitas Technologies Corp | TL 1L 08/22 | SOFR + 5.85% | 11.21% | 8/12/2029 | USD | 3,863,723 | | 3,824,700 | | (b) |
| Excelitas Technologies Corp | TL 1L 08/22 | EURIBOR + 5.75% | 9.54% | 8/12/2029 | EUR | 598,179 | | 626,169 | | (b) |
| Excelitas Technologies Corp | TL 1L DD 08/22 | SOFR + 5.75% | 1.00% | 8/12/2029 | USD | 457,301 | | (4,619) | | (b) (e) |
| | | | | | | | |
| Environmental & Facilities Services - 1.21% | | | | | | | |
| 48Forty Solutions LLC | Revolver 1L 03/22 | SOFR + 5.85% | 3.62% | 11/30/2026 | USD | 610,068 | | 219,869 | | (a) (b) (e) |
| 48Forty Solutions LLC | TL 1L 02/22 | SOFR + 5.85% | 11.41% | 11/30/2026 | USD | 4,688,090 | | 4,502,441 | | (a) (b) |
| 48Forty Solutions LLC | TL 1L 03/22 | SOFR + 5.85% | 11.41% | 11/30/2026 | USD | 3,133,346 | | 3,009,266 | | (a) (b) |
| | | | | | | | |
| Financial Exchanges & Data - 0.11% | | | | | | | | |
| IntraFi Network LLC | TL 2L 11/21 | SOFR + 6.35% | 11.67% | 11/5/2029 | USD | 751,420 | | 721,363 | | (a) |
| | | | | | | | |
| Food Distributors - 0.14% | | | | | | | | |
| Lipari Foods LLC | TL 1L 10/22 | SOFR + 6.65% | 12.03% | 10/31/2028 | USD | 766,939 | | 773,535 | | (b) |
| Lipari Foods LLC | TL 1L DD 10/22 | SOFR + 6.65% | 4.42% | 10/31/2028 | USD | 219,389 | | 100,484 | | (b) (e) |
| | | | | | | | |
| Health Care Equipment - 4.22% | | | | | | | | |
| Drive DeVilbiss Healthcare LLC | TL 1L 03/21 | 4.00% PIK, SOFR + 9.50% | 14.89% | 6/1/2025 | USD | 20,497,321 | | 16,295,370 | | (f) |
| Drive DeVilbiss Healthcare LLC | TL 1L 09/22 | 9.00% PIK, SOFR + 10.00% | 15.39% | 6/1/2025 | USD | 2,836,741 | | 2,836,741 | | (b) (f) |
| Orchid Orthopedic Solutions LLC | TL 1L 02/19 | SOFR + 4.76% | 10.15% | 3/5/2026 | USD | 6,866,086 | | 6,440,389 | | |
| PartsSource Inc | Revolver 1L 10/21 | SOFR + 5.86% | 1.41% | 8/23/2026 | USD | 87,104 | | 12,644 | | (a) (b) (e) |
| PartsSource Inc | TL 1L 10/21 | LIBOR + 5.75% | 11.39% | 8/23/2028 | USD | 1,312,243 | | 1,298,595 | | (a) (b) |
| PartsSource Inc | TL 1L DD 08/21 | SOFR + 5.75% | 3.58% | 8/23/2028 | USD | 464,562 | | 91,565 | | (a) (b) (e) |
| | | | | | | | |
| Health Care Facilities - 1.77% | | | | | | | | |
| Lakefield Veterinary Group | TL 1L 11/21 | LIBOR + 5.50% | 10.92% | 11/23/2028 | USD | 2,182,852 | | 2,123,478 | | (b) |
| Lakefield Veterinary Group | TL 1L DD 11/21 | LIBOR + 5.50% | 4.16% | 11/23/2028 | USD | 1,260,468 | | 647,518 | | (b) (e) |
| ScionHealth | TL 1L B 12/21 | SOFR + 5.36% | 10.69% | 12/23/2028 | USD | 2,415,260 | | 607,836 | | |
| VetCor Professional Practices LLC | Revolver 1L 08/22 | SOFR + 5.75% | 0.50% | 8/31/2029 | USD | 573,499 | | (2,581) | | (b) (e) |
| VetCor Professional Practices LLC | TL 1L B 08/22 | SOFR + 5.75% | 11.17% | 8/31/2029 | USD | 7,926,501 | | 7,890,832 | | (b) |
| | | | | | | | |
| Health Care Services - 1.74% | | | | | | | | |
| Affordable Care Inc | Revolver 1L 08/21 | SOFR + 5.50% | 0.50% | 8/2/2027 | USD | 177,081 | | (1,594) | | (a) (b) (e) |
| Affordable Care Inc | TL 1L 08/21 PIK | 1.25% PIK, SOFR + 5.50% | 10.92% | 8/2/2028 | USD | 1,583,764 | | 1,569,509 | | (a) (b) |
| Affordable Care Inc | TL 1L DD 08/21 | 1.25% PIK, SOFR + 5.50% | 10.92% | 8/2/2028 | USD | 284,754 | | 282,191 | | (a) (b) |
| Affordable Care Inc | TL 1L DD 08/23 | SOFR + 5.50% | 3.22% | 8/2/2028 | USD | 313,609 | | 81,792 | | (a) (b) (e) |
| American Vision Partners | Revolver 1L 09/21 | SOFR + 5.90% | 4.97% | 9/30/2026 | USD | 158,140 | | 84,779 | | (a) (b) (e) |
| American Vision Partners | TL 1L 09/21 | SOFR + 5.90% | 11.48% | 9/30/2027 | USD | 1,890,704 | | 1,845,516 | | (a) (b) |
| American Vision Partners | TL 1L DD 09/21 | SOFR + 5.90% | 11.49% | 9/30/2027 | USD | 780,806 | | 762,145 | | (a) (b) |
See accompanying notes to financial statements.
9
| | | | | | | | |
| Credit Opportunities Portfolio | October 31, 2023 |
| |
| | | | | | | | | | | | | | | | | | | | | | | | | | |
| Issuer | Asset | Reference Rate & Spread | Interest Rate | Maturity Date | Currency | Par | Fair Value | Footnotes |
| Amerivet Partners Management Inc | Revolver 1L 02/22 | SOFR + 5.50% | 0.75% | 2/25/2028 | USD | 197,240 | | $ | (1,598) | | (a) (b) (e) |
| Amerivet Partners Management Inc | TL 1L 02/22 | SOFR + 5.65% | 11.04% | 2/25/2028 | USD | 2,218,703 | | 2,156,357 | | (a) (b) |
| Amerivet Partners Management Inc | TL 1L DD 02/22 | SOFR + 5.65% | 1.00% | 2/25/2028 | USD | 877,718 | | (24,664) | | (a) (b) (e) |
| Amerivet Partners Management Inc | TL 1L DD 11/22 | SOFR + 5.50% | 6.25% | 2/25/2028 | USD | 694,453 | | 674,939 | | (a) (b) |
| CHG Healthcare Services Inc | TL 1L 09/21 | SOFR+ 3.36% | 8.69% | 9/29/2028 | USD | 1,502,534 | | 1,488,733 | | |
| Novotech Pty Ltd | TL 1L B1 07/23 | SOFR + 5.57% | 10.92% | 1/13/2028 | USD | 1,088,942 | | 1,080,993 | | (a) (b) |
| Novotech Pty Ltd | TL 1L B2 01/22 | SOFR + 6.01% | 10.71% | 1/13/2028 | USD | 1,144,851 | | 1,136,494 | | (a) (b) |
| Novotech Pty Ltd | TL 1L DD 01/22 | SOFR + 5.25% | 1.00% | 1/13/2028 | USD | 266,244 | | (1,944) | | (a) (b) (e) |
| | | | | | | | |
| Health Care Technology - 0.36% | | | | | | | | |
| athenahealth Inc | TL 1L 01/22 | SOFR + 3.50% | 8.58% | 2/15/2029 | USD | 330,701 | | 321,253 | | |
| GoodRx Inc | TL 1L 10/18 | SOFR + 2.85% | 8.17% | 10/10/2025 | USD | 1,953,191 | | 1,953,796 | | |
| | | | | | | | |
| Hotels, Resorts & Cruise Lines - 0.44% | | | | | | | | |
| Playa Resorts Holding BV | TL 1L B 11/22 | SOFR + 4.25% | 9.58% | 1/5/2029 | USD | 1,956,118 | | 1,951,541 | | |
| Travel + Leisure Co | TL 1L 12/22 | SOFR + 4.10% | 9.49% | 12/14/2029 | USD | 879,474 | | 881,814 | | |
| | | | | | | | |
| Human Resource & Employment Services - 2.51% | | | | | | | |
| Insight Global LLC | Revolver 1L 09/21 | SOFR + 6.00% | 0.50% | 9/22/2027 | USD | 427,591 | | (4,618) | | (a) (b) (e) |
| Insight Global LLC | TL 1L 02/22 | LIBOR + 6.00% | 11.48% | 9/22/2028 | USD | 1,035,019 | | 1,023,841 | | (a) (b) |
| Insight Global LLC | TL 1L 09/21 | LIBOR + 6.00% | 11.48% | 9/22/2028 | USD | 5,346,863 | | 5,289,117 | | (a) (b) |
| Oxford Global Resources LLC | Revolver 1L 08/21 | SOFR + 6.25% | 0.38% | 8/17/2027 | USD | 128,823 | | — | | (a) (b) (e) |
| Oxford Global Resources LLC | TL 1L 06/22 | SOFR + 6.15% | 11.55% | 8/17/2027 | USD | 6,561,057 | | 6,626,667 | | (a) (b) |
| Oxford Global Resources LLC | TL 1L 08/21 | SOFR + 6.25% | 11.56% | 8/17/2027 | USD | 1,464,454 | | 1,479,099 | | (a) (b) |
| Oxford Global Resources LLC | TL 1L DD 08/21 | SOFR + 6.15% | 4.32% | 8/17/2027 | USD | 256,737 | | 124,813 | | (a) (b) (e) |
| SIRVA Worldwide Inc | TL 1L 07/18 | SOFR + 5.76% | 11.00% | 8/4/2025 | USD | 1,581,969 | | 1,430,694 | | |
| SIRVA Worldwide Inc | TL 2L 07/18 | SOFR + 9.76% | 15.16% | 8/3/2026 | USD | 59,000 | | 51,035 | | |
| | | | | | | | |
| Industrial Machinery & Supplies & Components - 1.55% | | | | | | | |
| Chart Industries Inc | TL 1L B 09/23 | SOFR + 3.35% | 8.66% | 3/15/2030 | USD | 2,364,494 | | 2,363,512 | | |
| Engineered Machinery Holdings Inc | TL 2L 08/21 | SOFR + 6.26% | 11.65% | 5/21/2029 | USD | 297,640 | | 291,687 | | |
| ProMach Group Inc | TL 1L B 08/21 | SOFR + 4.11% | 9.44% | 8/31/2028 | USD | 904,250 | | 903,580 | | |
| SPX FLOW Inc | TL 1L B 03/22 | SOFR + 4.60% | 9.92% | 4/5/2029 | USD | 3,140,864 | | 3,117,511 | | (a) |
| Time Manufacturing Co | Revolver 1L 12/21 | LIBOR + 6.65% | 4.58% | 12/1/2027 | USD | 153,560 | | 74,531 | | (a) (b) (e) |
| Time Manufacturing Co | TL 1L 06/22 | EURIBOR + 6.50% | 10.28% | 12/1/2027 | EUR | 370,457 | | 368,204 | | (a) (b) |
| Time Manufacturing Co | TL 1L 12/21 | LIBOR + 6.50% | 12.07% | 12/1/2027 | USD | 916,772 | | 861,674 | | (a) (b) |
| Time Manufacturing Co | TL 1L 12/21 | EURIBOR + 6.50% | 10.28% | 12/1/2027 | EUR | 591,000 | | 587,407 | | (a) (b) |
| WireCo WorldGroup Inc | TL 1L B 10/21 | SOFR + 4.36% | 9.70% | 11/13/2028 | USD | 1,317,989 | | 1,310,575 | | |
| | | | | | | | |
See accompanying notes to financial statements.
10
| | | | | | | | |
| Credit Opportunities Portfolio | October 31, 2023 |
| |
| | | | | | | | | | | | | | | | | | | | | | | | | | |
| Issuer | Asset | Reference Rate & Spread | Interest Rate | Maturity Date | Currency | Par | Fair Value | Footnotes |
| Insurance Brokers - 3.57% | | | | | | | | |
| Alera Group Intermediate Holdings Inc | TL 1L 09/21 | SOFR + 6.10% | 11.42% | 10/2/2028 | USD | 650,259 | | $ | 643,887 | | (a) (b) |
| Alera Group Intermediate Holdings Inc | TL 1L DD 09/21 | SOFR + 6.10% | 11.42% | 10/2/2028 | USD | 184,794 | | 182,983 | | (a) (b) |
| Alera Group Intermediate Holdings Inc | TL 1L DD 12/21 | SOFR + 6.10% | 11.42% | 10/2/2028 | USD | 534,429 | | 529,192 | | (a) (b) |
| CFC Underwriting Ltd | TL 1L B 05/22 | SOFR + 5.00% | 10.30% | 5/16/2029 | USD | 5,343,384 | | 5,396,818 | | (a) (b) |
| CFC Underwriting Ltd | TL 1L DD 05/22 | SONIA + 5.00% | 1.00% | 5/16/2029 | GBP | 630,571 | | 7,659 | | (a) (b) (e) |
| Foundation Risk Partners Corp | Revolver 1L 10/21 | SOFR + 6.00% | 0.38% | 10/29/2027 | USD | 141,750 | | (1,984) | | (a) (b) (e) |
| Foundation Risk Partners Corp | TL 1L 03/22 | SOFR + 6.35% | 11.49% | 10/30/2028 | USD | 827,526 | | 815,941 | | (a) (b) |
| Foundation Risk Partners Corp | TL 1L 10/21 | SOFR + 6.25% | 11.49% | 10/29/2028 | USD | 1,322,284 | | 1,303,772 | | (a) (b) |
| Foundation Risk Partners Corp | TL 1L DD 03/22 | SOFR + 6.35% | 5.39% | 10/29/2028 | USD | 3,340,374 | | 2,359,387 | | (a) (b) (e) |
| Foundation Risk Partners Corp | TL 1L DD 10/21 | SOFR + 6.35% | 11.49% | 10/29/2028 | USD | 287,584 | | 283,558 | | (a) (b) |
| Galway Partners Holdings LLC | Revolver 1L 09/21 | SOFR + 5.25% | 0.50% | 9/30/2027 | USD | 205,492 | | (2,651) | | (a) (b) (e) |
| Galway Partners Holdings LLC | TL 1L 09/21 | SOFR + 5.35% | 10.74% | 9/29/2028 | USD | 2,885,988 | | 2,848,759 | | (a) (b) |
| Integrity Marketing Group LLC | TL 1L DD 08/23 | SOFR + 6.02% | 11.54% | 8/27/2026 | USD | 2,908,787 | | 2,895,116 | | (a) (b) |
| Integrity Marketing Group LLC | TL 1L DD 08/23 | SOFR + 6.02% | 11.44% | 8/27/2026 | USD | 5,534,103 | | 5,508,093 | | (a) (b) |
| | | | | | | | |
| Integrated Oil & Gas - 0.09% | | | | | | | | |
| CEPSA Holdco (Matador Bidco) | TL 1L B 10/19 | SOFR + 4.60% | 9.92% | 10/15/2026 | USD | 547,443 | | 548,618 | | |
| | | | | | | | |
| IT Consulting & Other Services - 3.07% | | | | | | | | |
| 3Pillar Global Inc | Revolver 1L 11/21 | SOFR + 6.00% | 1.75% | 11/23/2026 | USD | 186,240 | | 15,552 | | (a) (b) (e) |
| 3Pillar Global Inc | TL 1L 11/21 | SOFR + 6.10% | 11.43% | 11/23/2027 | USD | 1,921,292 | | 1,871,338 | | (a) (b) |
| 3Pillar Global Inc | TL 1L DD 11/21 | SOFR + 6.16% | 11.54% | 11/23/2027 | USD | 618,335 | | 602,259 | | (a) (b) |
| PSAV Inc (aka Encore) | TL 1L B1 12/20 | 0.25% PIK, SOFR + 3.60% | 8.92% | 3/3/2025 | USD | 10,224,780 | | 9,636,241 | | (f) |
| PSAV Inc (aka Encore) | TL 1L B3 12/20 | 10.00% PIK, 5.00% | 15.00% | 10/15/2026 | USD | 675,824 | | 677,936 | | (f) |
| PSAV Inc (aka Encore) | TL 2L 02/18 | SOFR + 7.36% | 12.69% | 9/1/2025 | USD | 7,628,543 | | 6,789,404 | | |
| | | | | | | | |
| Leisure Facilities - 1.70% | | | | | | | | |
| Aimbridge Acquisition Co Inc | TL 1L B 09/20 | SOFR + 4.86% | 10.19% | 2/2/2026 | USD | 21,395 | | 20,699 | | |
| Aimbridge Acquisition Co Inc | TL 1L B 10/19 | SOFR + 3.86% | 9.19% | 2/2/2026 | USD | 7,788,417 | | 7,476,880 | | |
| ClubCorp Club Operations Inc | TL 1L B 08/17 | LIBOR + 2.75% | 8.18% | 9/18/2024 | USD | 3,168,710 | | 3,083,567 | | |
| Life Time Fitness Inc | TL 1L B 05/23 | SOFR + 5.18% | 10.61% | 1/15/2026 | USD | 300,810 | | 301,449 | | |
| | | | | | | | |
| Leisure Products - 0.12% | | | | | | | | |
| Areas Worldwide SASU | TL 1L B1 06/19 | EURIBOR + 4.75% | 8.49% | 7/1/2026 | EUR | 30,687 | | 30,592 | | |
| Topgolf Callaway Brands Corp | TL 1L B 03/23 | SOFR + 3.60% | 8.92% | 3/15/2030 | USD | 706,052 | | 703,701 | | |
| | | | | | | | |
See accompanying notes to financial statements.
11
| | | | | | | | |
| Credit Opportunities Portfolio | October 31, 2023 |
| |
| | | | | | | | | | | | | | | | | | | | | | | | | | |
| Issuer | Asset | Reference Rate & Spread | Interest Rate | Maturity Date | Currency | Par | Fair Value | Footnotes |
| Life & Health Insurance - 0.45% | | | | | | | | |
| Luxembourg Life Fund - Absolute Return Fund II | TL 1L 02/22 | SOFR + 7.50% | 12.89% | 2/10/2027 | USD | 2,907,025 | | $ | 2,871,850 | | (b) |
| | | | | | | | |
| Life Sciences Tools & Services - 0.89% | | | | | | | | |
| PAREXEL International Corp | TL 2L 07/21 | SOFR + 6.61% | 11.94% | 11/15/2029 | USD | 5,766,010 | | 5,697,394 | | (b) |
| | | | | | | | |
| Oil & Gas Storage & Transportation - 0.76% | | | | | | | |
| Brazos Midstream Holdings LLC | TL 1L B 01/23 | SOFR + 3.75% | 9.08% | 2/11/2030 | USD | 533,618 | | 532,327 | | |
| Oryx Midstream Services LLC | TL 1L B 01/23 | SOFR + 3.36% | 8.69% | 10/5/2028 | USD | 2,794,302 | | 2,793,534 | | |
| UGI Energy Services LLC | TL 1L B 02/23 | SOFR + 3.35% | 8.67% | 2/22/2030 | USD | 1,548,797 | | 1,549,402 | | |
| | | | | | | | |
| Other Specialized REITs - 0.50% | | | | | | | | |
| Pretium Partners LLC P2 | TL 1L 12/21 | 11.00% | 11.00% | 12/16/2029 | USD | 3,270,612 | | 3,205,200 | | (a) (b) |
| | | | | | | | |
| Packaged Foods & Meats - 0.14% | | | | | | | | |
| NovaTaste Austria GmbH | TL 1L B 05/23 | EURIBOR + 7.00% | 10.60% | 5/30/2030 | EUR | 372,095 | | 382,857 | | (b) |
| NovaTaste Austria GmbH | TL 1L DD CAR 05/23 | EURIBOR + 7.00% | 1.50% | 5/30/2030 | EUR | 116,280 | | (3,320) | | (b) (e) |
| Solina France SASU | TL 1L 10/22 | SOFR + 6.50% | 12.23% | 7/31/2028 | USD | 500,000 | | 500,950 | | (b) |
| | | | | | | | |
| Paper & Plastic Packaging Products & Materials - 0.10% | | | | | | | |
| Pretium Packaging LLC | TL 1L A 10/23 | 2.50% PIK, SOFR + 5.00% | 5.00% | 10/2/2028 | USD | 50,184 | | 48,332 | | (a) (b) (f) |
| Pretium Packaging LLC | TL 1L A1 10/23 | SOFR + 4.60% | 9.99% | 10/2/2028 | USD | 60,575 | | 46,542 | | (a) |
| Pretium Packaging LLC | TL 2L 09/21 | LIBOR + 6.75% | 12.20% | 10/1/2029 | USD | 810,470 | | 522,510 | | (a) (b) |
| | | | | | | | |
| Pharmaceuticals - 0.33% | | | | | | | | |
| Arrotex Australia Group Pty Ltd | TL 1L B1 06/23 | BBSY + 6.75% | 10.96% | 6/30/2028 | AUD | 588,281 | | 366,329 | | (b) |
| Arrotex Australia Group Pty Ltd | TL 1L B2 06/23 | BBSY + 6.75% | 10.96% | 6/30/2028 | AUD | 149,455 | | 93,067 | | (b) |
| iNova Pharmaceuticals (Australia) Pty Limited | TL 1L B 10/22 | BBSY + 6.50% | 10.68% | 10/30/2028 | AUD | 1,317,795 | | 833,966 | | (b) |
| iNova Pharmaceuticals (Australia) Pty Limited | TL 1L DD - C 10/22 | BBSY + 6.50% | 2.60% | 10/30/2028 | AUD | 133,689 | | (110) | | (b) (e) |
| Laboratoires Vivacy SAS | TL 1L B 03/23 | EURIBOR + 6.75% | 10.72% | 9/30/2030 | EUR | 780,884 | | 804,212 | | (a) (b) |
| Laboratoires Vivacy SAS | TL 1L DD 03/23 | EURIBOR + 6.75% | 2.03% | 9/30/2030 | EUR | 62,974 | | (1,738) | | (a) (b) (e) |
| | | | | | | | |
| Property & Casualty Insurance - 0.99% | | | | | | | | |
| Alacrity Solutions Group LLC | Revolver 1L 12/21 | SOFR + 5.25% | 4.53% | 12/22/2027 | USD | 505,280 | | 250,568 | | (b) (e) |
| Alacrity Solutions Group LLC | TL 1L 12/21 | SOFR + 5.35% | 10.67% | 12/22/2028 | USD | 5,512,494 | | 5,434,767 | | (b) |
| Alacrity Solutions Group LLC | TL 1L DD 06/22 | SOFR + 5.35% | 3.07% | 12/22/2028 | USD | 2,467,864 | | 637,793 | | (b) (e) |
| | | | | | | | |
| Publishing - 0.18% | | | | | | | | |
| Emerald Expositions Holding Inc | TL 1L B 05/17 | SOFR + 5.10% | 10.42% | 5/22/2026 | USD | 1,127,829 | | 1,129,949 | | |
| | | | | | | | |
See accompanying notes to financial statements.
12
| | | | | | | | |
| Credit Opportunities Portfolio | October 31, 2023 |
| |
| | | | | | | | | | | | | | | | | | | | | | | | | | |
| Issuer | Asset | Reference Rate & Spread | Interest Rate | Maturity Date | Currency | Par | Fair Value | Footnotes |
| Real Estate Operating Companies - 0.44% | | | | | | | |
| Opendoor Labs Inc | TL 2L DD 10/21 | 10.00% | 10.00% | 4/1/2026 | USD | 2,931,835 | | $ | 2,832,152 | | (a) (b) |
| | | | | | | | |
| Real Estate Services - 0.33% | | | | | | | | |
| SitusAMC Holdings Corp | TL 1L 12/21 | SOFR + 5.60% | 10.99% | 12/22/2027 | USD | 2,078,245 | | 2,076,790 | | (a) (b) |
| | | | | | | | |
| Research & Consulting Services - 2.14% | | | | | | | |
| BDO USA PA | TL 1L 08/23 | SOFR + 6.00% | 11.32% | 8/31/2028 | USD | 146,901 | | 144,286 | | (a) (b) |
| Element Materials Technology Group US Holdings Inc | TL 1L B 03/22 | EURIBOR + 4.25% | 8.22% | 7/6/2029 | EUR | 51,387 | | 53,593 | | |
| Element Materials Technology Group US Holdings Inc | TL 1L B 04/22 | SOFR + 4.35% | 9.74% | 6/22/2029 | USD | 142,632 | | 138,472 | | |
| Element Materials Technology Group US Holdings Inc | TL 1L DD - B 04/22 | SOFR + 4.35% | 9.74% | 6/22/2029 | USD | 65,830 | | 63,910 | | |
| Element Materials Technology Group US Holdings Inc | TL 2L 07/22 | SONIA + 7.25% | 12.44% | 6/24/2030 | GBP | 1,336,815 | | 1,583,038 | | (b) |
| Element Materials Technology Group US Holdings Inc | TL 2L DD 06/22 | SONIA + 7.25% | 12.44% | 6/24/2030 | GBP | 413,113 | | 489,203 | | (b) |
| Element Materials Technology Group US Holdings Inc | TL Unsec DD 07/22 | 13.89% | 13.89% | 7/9/2031 | USD | 6,243,663 | | 5,887,774 | | (b) (f) |
| HKA | TL 1L B 08/22 | SOFR + 5.75% | 11.12% | 8/9/2029 | USD | 4,176,369 | | 4,000,961 | | (b) |
| HKA | TL 1L DD (CAR) 08/22 | SOFR + 5.75% | 11.12% | 8/9/2029 | USD | 1,318,854 | | 1,263,462 | | (b) |
| | | | | | | | |
| Specialized Consumer Services - 0.33% | | | | | | | |
| Circana Group (f.k.a. NPD Group) | Revolver 1L 08/22 | SOFR + 5.75% | 0.68% | 12/1/2027 | USD | 51,095 | | 1,022 | | (a) (b) (e) |
| Circana Group (f.k.a. NPD Group) | TL 1L 08/22 | 2.75% PIK, SOFR + 6.25% | 14.34% | 12/1/2028 | USD | 973,829 | | 983,567 | | (a) (b) (f) |
| SavATree LLC | Revolver 1L 10/21 | SOFR + 5.25% | 0.25% | 10/12/2028 | USD | 128,932 | | (1,238) | | (a) (b) (e) |
| SavATree LLC | TL 1L 10/21 | SOFR + 5.25% | 10.79% | 10/12/2028 | USD | 990,104 | | 980,598 | | (a) (b) |
| Spotless Brands LLC | TL 1L 02/23 | SOFR + 6.65% | 12.03% | 7/25/2028 | USD | 155,238 | | 155,579 | | (a) (b) |
| Spotless Brands LLC | TL 1L DD 02/23 | SOFR + 6.75% | 1.00% | 7/25/2028 | USD | 234,626 | | 2,651 | | (a) (b) (e) |
| | | | | | | | |
| Specialized Finance - 0.02% | | | | | | | | |
| BHG FUNDING 05 LLC | TL 1L DD 11/22 | Variable | 20.23% | 11/8/2027 | USD | 140,740 | | 140,726 | | (b) |
| | | | | | | | |
| Specialty Chemicals - 3.78% | | | | | | | | |
| Aruba Investments Inc | TL 2L 10/20 | SOFR + 7.85% | 13.17% | 11/24/2028 | USD | 465,220 | | 434,748 | | |
| Champion/DSM engg | TL 1L B1 03/23 | EURIBOR + 5.50% | 9.45% | 3/29/2030 | EUR | 1,839,940 | | 1,804,635 | | |
| Champion/DSM engg | TL 1L B1 03/23 | SOFR + 5.50% | 10.88% | 3/29/2030 | USD | 8,192,670 | | 7,552,659 | | |
| Flint Group GmbH | TL 1L 03/23 Super Senior | EURIBOR + 8.00% | 11.97% | 6/30/2026 | EUR | 427,556 | | 458,911 | | (a) |
| Flint Group GmbH | TL 1L 09/23 PIK | 6.90% PIK, SOFR + 7.00% | 12.67% | 12/31/2027 | USD | 339,123 | | 244,169 | | (a) (f) |
| Flint Group GmbH | TL 1L 09/23 PIK (HoldCo) EUR | 6.90% PIK, EURIBOR + 7.00% | 10.97% | 12/31/2027 | EUR | 1,168,952 | | 882,292 | | (a) (f) |
| Flint Group GmbH | TL 1L B 09/23 | 0.75% PIK, SOFR + 4.25% | 5.00% | 12/31/2026 | USD | 695,471 | | 652,585 | | (a) (f) |
See accompanying notes to financial statements.
13
| | | | | | | | |
| Credit Opportunities Portfolio | October 31, 2023 |
| |
| | | | | | | | | | | | | | | | | | | | | | | | | | |
| Issuer | Asset | Reference Rate & Spread | Interest Rate | Maturity Date | Currency | Par | Fair Value | Footnotes |
| Flint Group GmbH | TL 1L B 09/23 (OpCo) EUR | 0.75% PIK, EURIBOR + 4.25% | 9.00% | 12/31/2026 | EUR | 2,408,567 | | $ | 2,377,200 | | (a) (f) |
| Flint Group GmbH | TL 2L 09/23 PIK | 6.90% PIK, LIBOR + 7.00% | 7.00% | 12/31/2027 | USD | 452,238 | | 81,780 | | (a) (f) |
| Flint Group GmbH | TL 2L 09/23 PIK (HoldCo) EUR | 6.90% PIK, EURIBOR + 7.00% | 10.97% | 12/31/2027 | EUR | 1,558,860 | | 269,250 | | (a) (f) |
| Vantage Specialty Chemicals Inc | TL 1L B 02/23 | SOFR + 4.75% | 10.08% | 10/26/2026 | USD | 9,747,197 | | 9,397,906 | | |
| | | | | | | | |
| Systems Software - 0.33% | | | | | | | | |
| Aareon AG | TL 1L 08/23 | EURIBOR + 6.25% | 7.00% | 8/19/2030 | EUR | 296,880 | | 306,251 | | (a) (b) |
| Aareon AG | TL 1L DD CAR 08/23 | EURIBOR + 6.25% | 1.50% | 8/19/2030 | EUR | 74,220 | | (1,923) | | (a) (b) (e) |
| Aareon AG | TL Unsec DD 08/23 | 10.25% PIK | 10.25% | 8/8/2031 | EUR | 45,357 | | (1,295) | | (a) (b) (e) (f) |
| Civica Group Ltd | TL 1L 08/23 | BBSW + 6.25% | 10.31% | 8/30/2030 | AUD | 12,272 | | 7,545 | | (a) (b) |
| Civica Group Ltd | TL 1L 08/23 | SONIA + 6.25% | 6.25% | 6/30/2030 | GBP | 221,717 | | 261,262 | | (a) (b) |
| Civica Group Ltd | TL 1L DD 08/23 | SONIA + 6.25% | 1.00% | 6/30/2030 | GBP | 94,171 | | (3,408) | | (a) (b) (e) |
| SolarWinds Holdings Inc | TL 1L B 11/22 | SOFR + 3.75% | 9.07% | 2/17/2027 | USD | 1,536,260 | | 1,533,057 | | |
| | | | | | | | |
| Trading Companies & Distributors - 0.27% | | | | | | | |
| Radwell International LLC/PA | Revolver 1L 04/22 | SOFR + 6.75% | 0.77% | 4/1/2028 | USD | 68,154 | | 2,726 | | (a) (b) (e) |
| Radwell International LLC/PA | TL 1L 04/22 | SOFR + 5.85% | 12.02% | 4/1/2029 | USD | 24,115 | | 24,356 | | (a) (b) |
| Radwell International LLC/PA | TL 1L 12/22 | SOFR + 6.75% | 12.14% | 4/1/2029 | USD | 901,911 | | 919,949 | | (a) (b) |
| Univar Inc | TL 1L B 06/23 | SOFR + 4.50% | 9.81% | 8/1/2030 | USD | 794,781 | | 793,434 | | |
| TOTAL LEVERAGED LOANS (Amortized cost $404,624,336) | | | | | | $ | 390,824,352 | | |
See accompanying notes to financial statements.
14
| | | | | | | | |
| Credit Opportunities Portfolio | October 31, 2023 |
| |
| | | | | | | | | | | | | | | | | | | | |
| Issuer | Asset | Maturity Date | Currency | Par | Fair Value | Footnotes |
| | | | | | |
| High Yield Securities - 52.48% | | | | | | |
| | | | | | |
| Advertising - 0.09% | | | | | | |
| Outfront Media Capital LLC / Outfront Media Capital Corp | 5.000% 08/2027 | 8/15/2027 | USD | 648,000 | | $ | 576,162 | | (h) |
| | | | | | |
| Aerospace & Defense - 0.83% | | | | | | |
| Aviation Capital Group LLC | 5.500% 12/2024 | 12/15/2024 | USD | 485,000 | | 477,370 | | (h) |
| Rolls-Royce PLC | 4.625% 02/2026 | 2/16/2026 | EUR | 491,000 | | 513,327 | | (h) |
| Ultra Electronics Holdings Ltd | 7.25% 01/2030 | 1/31/2030 | USD | 2,162,000 | | 2,112,923 | | (a) (b) |
| Ultra Electronics Holdings Ltd | 9.0% PIK 01/2031 | 1/31/2031 | USD | 2,272,448 | | 2,166,325 | | (a) (b) (f) |
| | | | | | |
| Alternative Carriers - 0.60% | | | | | | |
| Level 3 Financing Inc | 3.750% 07/2029 | 7/15/2029 | USD | 48,000 | | 24,461 | | (a) (h) |
| Zayo Group LLC | 4.000% 03/2027 | 3/1/2027 | USD | 5,034,000 | | 3,794,667 | | (h) |
| | | | | | |
| Apparel, Accessories & Luxury Goods - 0.26% | | | | | | |
| Hanesbrands Inc | 4.875% 05/2026 | 5/15/2026 | USD | 952,000 | | 875,736 | | (h) |
| Varsity Brands Inc | S+8.000% 12/2024 | 12/22/2024 | USD | 783,000 | | 783,000 | | (b) (h) |
| | | | | | |
| Application Software - 1.21% | | | | | | |
| Cision Ltd | 9.500% 02/2028 | 2/15/2028 | USD | 10,042,000 | | 5,298,661 | | (h) |
| Cvent Holding Corp | 8.000% 06/2030 | 6/15/2030 | USD | 1,411,000 | | 1,370,469 | | (h) |
| TeamSystem SpA | 3.500% 02/2028 | 2/15/2028 | EUR | 567,000 | | 513,410 | | (h) |
| TeamSystem SpA | 6.250% 02/2028 144A | 2/15/2028 | EUR | 496,000 | | 524,507 | | (b) (h) |
| | | | | | |
| Automotive Parts & Equipment - 1.74% | | | | | | |
| Forvia SE | 2.625% 06/2025 | 6/15/2025 | EUR | 505,000 | | 516,568 | | (h) |
| IHO Verwaltungs GmbH | 3.750% 09/2026 | 9/15/2026 | EUR | 516,000 | | 514,054 | | (f) (h) |
| Patrick Industries Inc | 1.750% 12/2028 | 12/1/2028 | USD | 603,000 | | 570,136 | | |
| Power Solutions | 4.375% 05/2026 | 5/15/2026 | EUR | 505,000 | | 512,354 | | (h) |
| Truck Hero Inc | 6.250% 02/2029 | 2/1/2029 | USD | 3,356,000 | | 2,673,004 | | (h) |
| Wheel Pros Inc | 6.500% 05/2028 | 5/11/2028 | USD | 10,121,000 | | 5,807,430 | | (b) (h) |
| ZF Finance GmbH | 3.000% 09/2025 | 9/21/2025 | EUR | 500,000 | | 507,958 | | (h) |
| | | | | | |
| Automotive Retail - 1.28% | | | | | | |
| Mavis Discount Tire Inc | 6.500% 05/2029 | 5/15/2029 | USD | 9,975,000 | | 8,161,362 | | (h) |
| | | | | | |
| Biotechnology - 0.17% | | | | | | |
| Grifols SA | 1.625% 02/2025 | 2/15/2025 | EUR | 532,000 | | 541,550 | | (h) |
| Grifols SA | 3.200% 05/2025 | 5/1/2025 | EUR | 503,000 | | 510,904 | | (h) |
| | | | | | |
| Broadline Retail - 0.00% | | | | | | |
| JC Penney Corp Inc | 8.625% 03/2025 | 3/15/2025 | USD | 97,819 | | — | | (b) (c) (h) |
| | | | | | |
See accompanying notes to financial statements.
15
| | | | | | | | |
| Credit Opportunities Portfolio | October 31, 2023 |
| |
| | | | | | | | | | | | | | | | | | | | |
| Issuer | Asset | Maturity Date | Currency | Par | Fair Value | Footnotes |
| Building Products - 7.87% | | | | | | |
| Acproducts Inc (aka Cabinetworks) | 6.375% 05/2029 | 5/15/2029 | USD | 17,269,000 | | $ | 10,560,425 | | (h) |
| LBM Borrower LLC | 6.250% 01/2029 | 1/15/2029 | USD | 4,952,000 | | 3,917,255 | | (h) |
| Oldcastle Buildingenvelope Inc | 9.500% 04/2030 | 4/15/2030 | USD | 14,457,000 | | 12,768,684 | | (h) |
| PrimeSource Building Products Inc | 5.625% 02/2029 | 2/1/2029 | USD | 7,169,000 | | 5,255,097 | | (h) |
| PrimeSource Building Products Inc | 6.750% 08/2029 | 8/1/2029 | USD | 4,981,000 | | 3,804,282 | | (h) |
| Specialty Building Products Holdings LLC | 6.375% 09/2026 | 9/30/2026 | USD | 537,000 | | 500,109 | | (h) |
| SRS Distribution Inc | 6.000% 12/2029 | 12/1/2029 | USD | 8,573,000 | | 7,146,196 | | (h) |
| SRS Distribution Inc | 6.125% 07/2029 | 7/1/2029 | USD | 7,529,000 | | 6,312,427 | | (h) |
| | | | | | |
| Cable & Satellite - 2.10% | | | | | | |
| Astound Broadband (RCN/Radiate) | 6.500% 09/2028 | 9/15/2028 | USD | 6,272,000 | | 3,111,163 | | (h) |
| Block Communications Inc | 4.875% 03/2028 | 3/1/2028 | USD | 6,358,000 | | 5,226,435 | | (h) |
| Cable One Inc | 0.000% 03/2026 | 3/15/2026 | USD | 487,000 | | 399,584 | | (g) |
| Cablevision Lightpath LLC | 5.625% 09/2028 | 9/15/2028 | USD | 811,000 | | 607,709 | | (h) |
| CSC Holdings LLC (Altice USA) | 5.000% 11/2031 | 11/15/2031 | USD | 2,754,000 | | 1,410,405 | | (h) |
| CSC Holdings LLC (Altice USA) | 5.750% 01/2030 | 1/15/2030 | USD | 5,101,000 | | 2,676,748 | | (h) |
| | | | | | |
| Casinos & Gaming - 0.18% | | | | | | |
| Cirsa Funding Luxembourg SA | 5.000% 03/2027 | 3/15/2027 | EUR | 532,000 | | 512,383 | | (h) |
| Scientific Games International Inc | 7.500% 09/2031 | 9/1/2031 | USD | 677,000 | | 661,804 | | (h) |
| | | | | | |
| Commercial Printing - 0.87% | | | | | | |
| Multi-Color Corp | 10.500% 07/2027 | 7/15/2027 | USD | 4,432,000 | | 3,841,530 | | (h) |
| Multi-Color Corp | 8.250% 11/2029 | 11/1/2029 | USD | 515,000 | | 383,353 | | (h) |
| Multi-Color Corp | 9.500% 11/2028 | 11/1/2028 | USD | 1,388,000 | | 1,343,185 | | (h) |
| | | | | | |
| Commodity Chemicals - 0.43% | | | | | | |
| Ineos Quattro Holdings Ltd | 2.500% 01/2026 | 1/15/2026 | EUR | 538,000 | | 531,217 | | (h) |
| SI Group Inc | 6.750% 05/2026 | 5/15/2026 | USD | 4,943,000 | | 2,204,158 | | (h) |
| | | | | | |
| Construction & Engineering - 3.03% | | | | | | |
| Brand Energy & Infrastructure Services Inc | 10.375% 06/2029 | 8/1/2030 | USD | 7,344,000 | | 7,298,100 | | (h) |
| Maxim Crane Works LP / Maxim Finance Corp | 11.500% 09/2028 | 9/1/2028 | USD | 11,780,000 | | 11,510,827 | | (h) |
| thyssenkrupp Elevator AG | 4.375% 07/2027 | 7/15/2027 | EUR | 539,000 | | 517,831 | | (h) |
| | | | | | |
| Consumer Electronics - 0.10% | | | | | | |
| Energizer Holdings Inc | 6.500% 12/2027 | 12/31/2027 | USD | 670,000 | | 625,273 | | (h) |
| | | | | | |
| Consumer Finance - 0.08% | | | | | | |
| Navient Corp | 5.875% 10/2024 | 10/25/2024 | USD | 489,000 | | 477,995 | | |
| | | | | | |
See accompanying notes to financial statements.
16
| | | | | | | | |
| Credit Opportunities Portfolio | October 31, 2023 |
| |
| | | | | | | | | | | | | | | | | | | | |
| Issuer | Asset | Maturity Date | Currency | Par | Fair Value | Footnotes |
| Data Processing & Outsourced Services - 0.05% | | | | | | |
| Xerox Business Services /Conduent | 6.000% 11/2029 | 11/1/2029 | USD | 414,000 | | $ | 341,762 | | (h) |
| | | | | | |
| Diversified Chemicals - 0.19% | | | | | | |
| Chemours Co/The | 4.000% 05/2026 | 5/15/2026 | EUR | 529,000 | | 517,795 | | |
| Chemours Co/The | 5.375% 05/2027 | 5/15/2027 | USD | 745,000 | | 673,771 | | |
| | | | | | |
| Diversified Support Services - 0.12% | | | | | | |
| Allied Universal Holdco LLC | 6.625% 07/2026 | 7/15/2026 | USD | 364,000 | | 341,186 | | (h) |
| Techem Energy Services GmbH/Germany | 6.000% 07/2026 | 7/30/2026 | EUR | 439,599 | | 452,313 | | (h) |
| | | | | | |
| Electric Utilities - 0.08% | | | | | | |
| Electricite de France SA | 4.000% SUN REGS | | EUR | 500,000 | | 516,074 | | (h) |
| | | | | | |
| Electronic Components - 1.06% | | | | | | |
| CommScope Inc | 6.000% 03/2026 | 3/1/2026 | USD | 310,000 | | 260,812 | | (h) |
| CommScope Inc | 6.000% 06/2025 | 6/15/2025 | USD | 10,798,000 | | 6,495,051 | | (h) |
| | | | | | |
| Food Retail - 0.08% | | | | | | |
| Burger King France SAS | 7.750% 11/2027 | 11/1/2027 | EUR | 506,000 | | 505,828 | | (f) (h) |
| | | | | | |
| Health Care Facilities - 0.21% | | | | | | |
| AHP Health Partners Inc | 5.750% 07/2029 | 7/15/2029 | USD | 109,000 | | 89,482 | | (h) |
| CHS/Community Health Systems, Inc. | 6.875% 04/2028 | 4/1/2028 | USD | 2,824,000 | | 1,227,423 | | (h) |
| | | | | | |
| Health Care Technology - 0.03% | | | | | | |
| athenahealth Inc | 6.500% 02/2030 | 2/15/2030 | USD | 260,000 | | 212,698 | | (h) |
| | | | | | |
| Hotels, Resorts & Cruise Lines - 7.80% | | | | | | |
| Carnival Corp | 6.000% 05/2029 | 5/1/2029 | USD | 6,033,000 | | 5,101,604 | | (h) |
| Marriott Ownership Resorts Inc | 0.000% 01/2026 | 1/15/2026 | USD | 6,863,000 | | 5,915,906 | | (g) |
| NCL Corp Ltd | 1.125% 02/2027 | 2/15/2027 | USD | 11,602,000 | | 9,047,646 | | |
| NCL Corp Ltd | 3.625% 12/2024 | 12/15/2024 | USD | 14,811,000 | | 14,021,892 | | (h) |
| Viking Cruises Ltd | 6.250% 05/2025 | 5/15/2025 | USD | 490,000 | | 479,272 | | (h) |
| Viking Cruises Ltd | 7.000% 02/2029 | 2/15/2029 | USD | 5,473,000 | | 4,957,690 | | (h) |
| Viking Cruises Ltd | 9.125% 07/2031 | 7/15/2031 | USD | 10,424,000 | | 10,250,962 | | (h) |
| | | | | | |
| Industrial Conglomerates - 0.51% | | | | | | |
| Unifrax I LLC / Unifrax Holding Co | 5.250% 09/2028 | 9/30/2028 | USD | 3,573,000 | | 2,417,516 | | (h) |
| Unifrax I LLC / Unifrax Holding Co | 7.500% 09/2029 | 9/30/2029 | USD | 1,509,000 | | 808,937 | | (h) |
| | | | | | |
| Industrial Machinery & Supplies & Components - 1.95% | | | | | |
| Renk AG/Frankfurt am Main | 5.750% 07/2025 | 7/15/2025 | EUR | 490,000 | | 511,963 | | (h) |
| SPX FLOW Inc | 8.750% 04/2030 | 4/1/2030 | USD | 13,032,000 | | 11,961,747 | | (a) (h) |
| | | | | | |
See accompanying notes to financial statements.
17
| | | | | | | | |
| Credit Opportunities Portfolio | October 31, 2023 |
| |
| | | | | | | | | | | | | | | | | | | | |
| Issuer | Asset | Maturity Date | Currency | Par | Fair Value | Footnotes |
| Insurance Brokers - 2.12% | | | | | | |
| National Financial Partners Corp | 6.875% 08/2028 | 8/15/2028 | USD | 15,791,000 | | $ | 13,505,329 | | (h) |
| | | | | | |
| Integrated Telecommunication Services - 0.08% | | | | | | |
| Eircom Holdings Ireland Ltd | 2.625% 02/2027 | 2/15/2027 | EUR | 552,000 | | 518,027 | | (h) |
| | | | | | |
| Leisure Facilities - 3.54% | | | | | | |
| Cedar Fair LP | 5.375% 04/2027 | 4/15/2027 | USD | 513,000 | | 475,478 | | |
| Merlin Entertainments PLC | 4.500% 11/2027 | 11/15/2027 | EUR | 7,572,000 | | 6,868,168 | | (h) |
| Merlin Entertainments PLC | 6.625% 11/2027 | 11/15/2027 | USD | 7,389,000 | | 6,619,325 | | (h) |
| Six Flags Entertainment Corp | 7.250% 05/2031 | 5/15/2031 | USD | 9,407,000 | | 8,664,929 | | (h) |
| | | | | | |
| Metal, Glass & Plastic Containers - 0.08% | | | | | | |
| Trivium Packaging Finance BV | 3.750% 08/2026 | 8/15/2026 | EUR | 532,000 | | 510,690 | | (h) |
| | | | | | |
| Oil & Gas Equipment & Services - 0.15% | | | | | | |
| Archrock Partners LP / Archrock Partners Finance Corp | 6.875% 04/2027 | 4/1/2027 | USD | 488,000 | | 469,620 | | (h) |
| Solaris Midstream Holdings LLC | 7.625% 04/2026 | 4/1/2026 | USD | 498,000 | | 475,502 | | (h) |
| | | | | | |
| Oil & Gas Exploration & Production - 0.39% | | | | | | |
| Matador Resources Co | 5.875% 09/2026 | 9/15/2026 | USD | 471,000 | | 454,286 | | |
| Sitio Royalties Corp | 7.875% 11/2028 | 11/1/2028 | USD | 2,047,000 | | 2,021,239 | | (h) |
| | | | | | |
| Oil & Gas Storage & Transportation - 4.31% | | | | | | |
| Genesis Energy | 6.500% 10/2025 | 10/1/2025 | USD | 8,199,000 | | 8,017,376 | | |
| Genesis Energy | 8.000% 01/2027 | 1/15/2027 | USD | 436,000 | | 419,067 | | |
| Genesis Energy | 8.875% 04/2030 | 4/15/2030 | USD | 1,739,000 | | 1,682,536 | | |
| Global Partners LP / GLP Finance Corp | 7.000% 08/2027 | 8/1/2027 | USD | 497,000 | | 468,873 | | |
| NGL Energy Partners LP / NGL Energy Finance Corp | 7.500% 02/2026 | 2/1/2026 | USD | 16,254,000 | | 15,881,150 | | (h) |
| Rockies Express Pipeline LLC | 3.600% 05/2025 | 5/15/2025 | USD | 364,000 | | 344,834 | | (h) |
| Tallgrass Energy Partners LP / Tallgrass Energy Finance Corp | 6.000% 03/2027 | 3/1/2027 | USD | 365,000 | | 334,313 | | (h) |
| Tallgrass Energy Partners LP / Tallgrass Energy Finance Corp | 7.500% 10/2025 | 10/1/2025 | USD | 345,000 | | 340,231 | | (h) |
| | | | | | |
| Other Specialty Retail - 2.13% | | | | | | |
| Alain Afflelou SA | 4.250% 05/2026 | 5/19/2026 | EUR | 520,000 | | 518,367 | | (h) |
| Douglas Holding AG | 6.000% 04/2026 | 4/8/2026 | EUR | 6,512,000 | | 6,589,009 | | (h) |
| Douglas Holding AG | 8.250% 10/2026 | 10/1/2026 | EUR | 6,621,107 | | 6,483,525 | | (h) |
| | | | | | |
| Passenger Airlines - 2.58% | | | | | | |
| Air France-KLM | 3.875% 07/2026 | 7/1/2026 | EUR | 600,000 | | 605,718 | | (h) |
| American Airlines Group Inc | 3.750% 03/2025 | 3/1/2025 | USD | 11,901,000 | | 11,114,841 | | (h) |
| JetBlue Airways Corp | 0.500% 04/2026 | 4/1/2026 | USD | 7,651,000 | | 4,772,253 | | |
| | | | | | |
See accompanying notes to financial statements.
18
| | | | | | | | |
| Credit Opportunities Portfolio | October 31, 2023 |
| |
| | | | | | | | | | | | | | | | | | | | |
| Issuer | Asset | Maturity Date | Currency | Par | Fair Value | Footnotes |
| Pharmaceuticals - 0.08% | | | | | | |
| Nidda Healthcare Holding AG | 7.500% 08/2026 | 8/21/2026 | EUR | 484,000 | | $ | 514,508 | | (h) |
| | | | | | |
| Real Estate Services - 1.42% | | | | | | |
| Anywhere Real Estate Group LLC | 0.250% 06/2026 | 6/15/2026 | USD | 4,790,000 | | 3,575,021 | | |
| Redfin Corp | 0.000% 10/2025 | 10/15/2025 | USD | 6,764,000 | | 5,512,631 | | (g) |
| | | | | | |
| Restaurants - 1.19% | | | | | | |
| Golden Nugget Inc. | 6.750% 07/2030 | 1/15/2030 | USD | 9,527,000 | | 7,579,881 | | (h) |
| | | | | | |
| Security & Alarm Services - 0.08% | | | | | | |
| Verisure Holding AB | 3.875% 07/2026 | 7/15/2026 | EUR | 534,000 | | 535,810 | | (h) |
| | | | | | |
| Trading Companies & Distributors - 1.43% | | | | | | |
| AerCap Holdings | 6.500% 06/2045 | 6/15/2045 | USD | 4,959,000 | | 4,870,018 | | (h) |
| Neon Holdings Inc (GPD Cos Inc) | 10.125% 04/2026 | 4/1/2026 | USD | 906,000 | | 816,997 | | (h) |
| White Cap Construction Supply Inc | 8.250% 03/2026 PIK Toggle | 3/15/2026 | USD | 3,647,000 | | 3,426,122 | | (h) |
| TOTAL HIGH YIELD SECURITIES (Amortized cost $388,089,284) | | | | $ | 335,045,517 | | |
See accompanying notes to financial statements.
19
| | | | | | | | |
| Credit Opportunities Portfolio | October 31, 2023 |
| |
| | | | | | | | | | | | | | | | | | | | | | | | | | |
| Issuer | Asset | Reference Rate & Spread | Interest Rate | Maturity Date | Currency | Par | Fair Value | Footnotes |
| | | | | | | | |
| Asset Backed Securities - 7.84% | | | | | | | | |
| | | | | | | | |
| Diversified Real Estate Activities - 0.01% | | | | | | | | |
| SG Residential Mortgage Trust 2022-2 | SGR 2022-2 B1 | | 5.31% | 8/25/2062 | USD | 57,502 | | $ | 45,831 | | (h) |
| | | | | | | | |
| Specialized Finance - 7.83% | | | | | | | | |
| AB BSL CLO 4 Ltd | ABBSL 2023-4A E | SOFR + 8.16% | 13.58% | 4/20/2036 | USD | 1,685,504 | | 1,699,040 | | (b) (h) |
| Adagio X Eur Clo DAC | Adagio X EUR CLO D | EURIBOR + 0.00% | 0.00% | 10/20/2037 | EUR | 509,000 | | 538,254 | | (b) (d) (h) |
| AGL CLO 7 Ltd | AGL 2020-7A ER | SOFR + 6.35% | 12.01% | 7/15/2034 | USD | 1,187,688 | | 1,149,906 | | (b) (h) |
| Aimco CDO | AIMCO 2021-16A E | SOFR + 6.20% | 11.86% | 1/17/2035 | USD | 1,075,210 | | 1,051,299 | | (b) (h) |
| ALM Loan Funding Ltd | ALM 2020-1A D | SOFR + 6.00% | 11.66% | 10/15/2029 | USD | 865,360 | | 836,063 | | (b) (h) |
| AMMC CLO 26 Ltd | AMMC 2023-26A D | SOFR + 5.75% | 11.14% | 4/15/2036 | USD | 459,840 | | 469,434 | | (b) (h) |
| Apidos CLO XLVI Ltd | APID 2023-46A D | SOFR + 5.00% | 10.42% | 10/24/2036 | USD | 353,364 | | 353,480 | | (b) (h) |
| Arbour CLO III DAC | ARBR 3A DRR | EURIBOR + 3.10% | 7.07% | 7/15/2034 | EUR | 779,000 | | 762,626 | | (b) (h) |
| Ares LXV CLO Ltd | ARES 2022-65A E | SOFR + 7.10% | 12.48% | 7/25/2034 | USD | 1,078,040 | | 1,000,499 | | (b) (h) |
| Aurium CLO I DAC | ACLO 1A DRR | EURIBOR + 3.90% | 7.86% | 3/23/2032 | EUR | 917,000 | | 935,051 | | (b) (h) |
| Ballyrock CLO 14 Ltd | BALLY 2020-14A D | SOFR + 7.00% | 12.68% | 1/20/2034 | USD | 250,000 | | 249,691 | | (b) (h) |
| Ballyrock CLO Ltd | BALLY 2019-1A DR | SOFR + 6.75% | 12.41% | 7/15/2032 | USD | 431,180 | | 418,501 | | (b) (h) |
| Bbam US Clo I Ltd | BBAM 2022-1A D | SOFR + 6.80% | 12.19% | 4/15/2035 | USD | 1,285,000 | | 1,214,672 | | (b) (h) |
| Bbam US Clo III Ltdbbb | BBAM 2023-3A D | SOFR + 8.60% | 8.45% | 10/15/2038 | USD | 1,466,876 | | 1,436,300 | | (b) (h) |
| Birch Grove CLO Ltd | BGCLO 2023-7A D | SOFR + 5.50% | 5.50% | 10/20/2036 | USD | 282,683 | | 282,683 | | (b) (d) (h) |
| Bluemountain Euro 2021-2 CLO DAC | BLUME 2021-2A D | EURIBOR + 3.10% | 7.07% | 10/15/2035 | EUR | 403,282 | | 396,119 | | (b) (h) |
| BlueMountain Fuji Eur CLO V DAC | BLUME 5A D | EURIBOR + 3.85% | 7.82% | 1/15/2033 | EUR | 1,501,000 | | 1,532,355 | | (b) (h) |
| Bridgepoint Clo V DAC | BRGPT 5A D | EURIBOR + 5.00% | 5.15% | 4/15/2036 | EUR | 688,000 | | 727,329 | | (b) (h) |
| Broad River BSL Funding CLO | BDRVR 2020-1A ER | SOFR + 6.50% | 12.18% | 7/20/2034 | USD | 1,500,000 | | 1,435,226 | | (b) (h) |
| Cairn Clo XVII DAC | CRNCL 2023-17A D | EURIBOR + 5.30% | 9.20% | 10/18/2036 | EUR | 387,000 | | 409,083 | | (b) (h) |
| Capital Four US CLO Ltd | C4US 2022-1A D | SOFR + 5.36% | 10.78% | 10/20/2030 | USD | 363,664 | | 365,977 | | (b) (h) |
| Carlyle Global Market Strategies | CGMS 2020-2A DR | SOFR + 6.70% | 12.34% | 1/25/2035 | USD | 640,460 | | 611,339 | | (b) (h) |
| Carlyle Global Market Strategies | CGMS 2021-8A E | SOFR + 6.50% | 12.16% | 10/15/2034 | USD | 370,690 | | 356,735 | | (b) (h) |
| Carlyle Global Market Strategies | CGMS 2021-9A E | SOFR + 6.63% | 12.31% | 10/20/2034 | USD | 819,560 | | 774,928 | | (b) (h) |
| CarVal CLO | CARVL 2021-1A E | SOFR + 6.60% | 12.28% | 7/20/2034 | USD | 2,000,000 | | 1,868,844 | | (b) (h) |
| CarVal CLO | CARVL 2021-2A E | SOFR + 6.75% | 12.41% | 10/15/2034 | USD | 446,919 | | 435,619 | | (b) (h) |
| CIFC Funding Ltd | CIFC 2021-7A E | SOFR + 6.35% | 12.02% | 1/23/2035 | USD | 644,186 | | 619,020 | | (b) (h) |
| CVC Cordatus Loan Fund XVIII DAC | CORDA 18A ER | EURIBOR + 6.06% | 10.03% | 7/29/2034 | EUR | 1,198,000 | | 1,149,136 | | (b) (h) |
| Dillon's Park CLO DAC | DILPK 1A D | EURIBOR + 3.00% | 6.97% | 10/15/2034 | EUR | 430,000 | | 417,620 | | (b) (h) |
| Eaton Vance CDO Ltd | EATON 2020-2A ER | SOFR + 6.50% | 12.16% | 1/15/2035 | USD | 510,460 | | 495,607 | | (b) (h) |
| Elmwood CLO | ELMW5 2020-2A ER | SOFR + 6.10% | 11.78% | 10/20/2034 | USD | 1,500,000 | | 1,450,225 | | (b) (h) |
| Elmwood CLO VI Ltd | ELMW6 2020-3A ER | SOFR + 6.50% | 12.18% | 10/20/2034 | USD | 558,701 | | 550,924 | | (b) (h) |
See accompanying notes to financial statements.
20
| | | | | | | | |
| Credit Opportunities Portfolio | October 31, 2023 |
| |
| | | | | | | | | | | | | | | | | | | | | | | | | | |
| Issuer | Asset | Reference Rate & Spread | Interest Rate | Maturity Date | Currency | Par | Fair Value | Footnotes |
| Empower CLO Ltd | EMPWR 2023-2A D | SOFR + 5.40% | 10.74% | 7/15/2036 | USD | 379,870 | | $ | 381,775 | | (b) (h) |
| Goldentree Loan Management US Clo 12 Ltd | GLM 2022-12A E | SOFR + 7.25% | 12.67% | 4/20/2034 | USD | 291,777 | | 290,967 | | (b) (h) |
| Golub Capital Partners CLO Ltd | GCBSL 2021-58A E | SOFR + 6.81% | 12.45% | 1/25/2035 | USD | 549,013 | | 519,320 | | (b) (h) |
| Guardia 1 Ltd | GUARD 2019-1A D | 7.11% | 7.11% | 10/20/2037 | USD | 1,550,000 | | 1,282,818 | | (b) (h) |
| Harvest CLO XXI DAC | HARVT 21A DR | EURIBOR + 3.40% | 7.37% | 7/15/2031 | EUR | 602,000 | | 608,139 | | (b) (h) |
| Harvest CLO XXII DAC | HARVT 22A DR | EURIBOR + 3.55% | 7.52% | 1/15/2032 | EUR | 347,000 | | 345,042 | | (b) (h) |
| Madison Park Euro Funding XV DAC | MDPKE 15A DR | EURIBOR + 4.50% | 8.47% | 7/15/2036 | EUR | 369,000 | | 379,426 | | (b) (h) |
| Madison Park Funding LIX Ltd | MDPK 2021-59A E | SOFR + 6.60% | 12.26% | 1/18/2034 | USD | 814,787 | | 811,748 | | (b) (h) |
| Madison Park Funding Ltd | MDPK 2021-52A E | SOFR + 6.50% | 12.17% | 1/22/2035 | USD | 742,891 | | 728,416 | | (b) (h) |
| Madison Park Funding XLV Ltd | MDPK 2020-45A ER | SOFR + 6.35% | 12.01% | 7/15/2034 | USD | 429,000 | | 420,181 | | (b) (h) |
| Morgan Stanley Eaton Vance CLO Ltd | MSEV 2021-1A E | SOFR + 6.75% | 12.42% | 10/20/2034 | USD | 520,000 | | 494,518 | | (b) (h) |
| Neuberger Berman CLO Ltd | NEUB 2021-46A E | SOFR + 6.25% | 11.93% | 1/20/2036 | USD | 1,067,761 | | 1,025,977 | | (b) (h) |
| Oak Hill Credit Partners | OAKC 2021-10A E | SOFR + 6.25% | 11.91% | 1/18/2036 | USD | 497,312 | | 487,514 | | (b) (h) |
| Oaktree CLO 2023-1 Ltd | OAKCL 2023-1A D | SOFR + 5.25% | 10.64% | 4/15/2036 | USD | 1,607,042 | | 1,627,907 | | (b) (h) |
| Otranto Park | OTOPK 1A E | EURIBOR + 7.05% | 10.83% | 5/15/2035 | EUR | 428,000 | | 426,295 | | (b) (h) |
| Palmer Square CLO Ltd | PFIXD 2019-1A E | 7.11% | 7.11% | 4/20/2037 | USD | 930,641 | | 753,932 | | (b) (h) |
| Palmer Square European CLO 2022-2 DAC | PLMER 2022-2A D | EURIBOR + 6.26% | 10.24% | 1/15/2036 | EUR | 769,000 | | 820,730 | | (b) (h) |
| Pikes Peak CLO | PIPK 2021-9A E | SOFR + 6.58% | 12.23% | 10/27/2034 | USD | 405,000 | | 386,801 | | (b) (h) |
| RAD CLO 21 Ltd | RAD 2023-21A E | SOFR + 7.90% | 0.00% | 1/25/2033 | USD | 514,371 | | 514,477 | | (b) (d) (h) |
| Rad CLO 7 Ltd | RAD 2020-7A E | SOFR + 6.50% | 12.16% | 4/17/2033 | USD | 310,460 | | 302,913 | | (b) (h) |
| Rad CLO Ltd | RAD 2021-14A E | SOFR + 6.50% | 12.16% | 1/15/2035 | USD | 335,000 | | 314,187 | | (b) (h) |
| Rad CLO Ltd | RAD 2021-15A E | SOFR + 6.20% | 11.88% | 1/20/2034 | USD | 928,117 | | 870,471 | | (b) (h) |
| REESE PARK CLO LTD | RESPK 2020-1A ER | SOFR + 6.50% | 12.16% | 10/15/2034 | USD | 1,375,020 | | 1,275,722 | | (b) (h) |
| Regatta Funding Ltd | REG21 2021-3A E | SOFR + 6.75% | 12.43% | 10/20/2034 | USD | 321,680 | | 313,388 | | (b) (h) |
| Regatta Funding Ltd | REG23 2021-4A E | SOFR + 6.70% | 12.38% | 1/20/2035 | USD | 804,000 | | 752,567 | | (b) (h) |
| Regatta XX Funding Ltd | REG20 2021-2A E | SOFR + 6.25% | 11.91% | 10/15/2034 | USD | 208,000 | | 197,665 | | (b) (h) |
| RRX Ltd | GSM 2021-6A D | SOFR + 6.36% | 12.02% | 1/15/2037 | USD | 1,118,253 | | 1,054,013 | | (b) (h) |
| Sand Trust 2001-1 | SAND 2021-1A E | SOFR + 6.80% | 12.46% | 10/15/2034 | USD | 643,000 | | 602,300 | | (b) (h) |
| Sculptor European CLO V DAC | OZLME 5A DR | EURIBOR + 3.30% | 7.27% | 1/14/2032 | EUR | 1,546,000 | | 1,531,886 | | (b) (h) |
| Sound Point Euro CLO | SNDPE 2A ER | EURIBOR + 6.34% | 10.34% | 1/26/2036 | EUR | 500,000 | | 482,760 | | (b) (h) |
| Symphony CLO Ltd | SYMP 2020-22A E | SOFR + 6.25% | 11.91% | 4/18/2033 | USD | 598,680 | | 565,187 | | (b) (h) |
| TICP CLO Ltd | TICP 2017-9A E | SOFR + 5.60% | 11.28% | 1/20/2031 | USD | 738,460 | | 689,916 | | (b) (h) |
| Tikehau CLO DAC | TIKEH 2015-1A DRR | EURIBOR + 3.40% | 7.13% | 8/4/2034 | EUR | 637,000 | | 632,224 | | (b) (h) |
| Tikehau CLO V DAC | TIKEH 5A D1 | EURIBOR + 3.90% | 7.87% | 4/15/2032 | EUR | 301,000 | | 309,010 | | (b) (h) |
| Trinitas Euro CLO II DAC | TRNTE 2A ER | EURIBOR + 7.23% | 10.89% | 4/15/2035 | EUR | 1,770,566 | | 1,815,683 | | (b) (h) |
| TOTAL ASSET BACKED SECURITIES (Amortized cost $52,153,599) | | | | | | $ | 50,055,291 | | |
See accompanying notes to financial statements.
21
| | | | | | | | |
| Credit Opportunities Portfolio | October 31, 2023 |
| |
| | | | | | | | | | | | | | | | | | | | |
| Issuer | Asset | Maturity Date | Currency | Shares | Fair Value | Footnotes |
| | | | | | |
| Equity & Other Investments - 5.48% | | | | | | |
| | | | | | |
| Aerospace & Defense - 0.10% | | | | | | |
| Altitude II | Private Equity | | USD | 202,336 | | $ | 209,461 | | (a) (b) |
| Ultra Electronics Holdings Ltd | Private Equity | | USD | 43,729 | | 66,639 | | (a) (b) |
| Ultra Electronics Holdings Ltd | Private Equity | | USD | 23,486,307 | | 356,992 | | (a) (b) |
| | | | | | |
| Application Software - 0.90% | | | | | | |
| Med-Metrix | Common Stock | | USD | 597 | | 72,915 | | (a) (b) (c) |
| Med-Metrix | 8.000% 12/2050 PIK Pref Equity | 12/16/2050 | USD | 597 | | 29,862 | | (a) (b) (f) |
| TIBCO Software Inc | S+12% | 12/31/2069 | USD | 5,355 | | 5,652,118 | | (b) (f) |
| | | | | | |
| Construction & Engineering - 0.03% | | | | | | |
| Yak Access LLC | Common Stock | | USD | 11,000 | | 880 | | (a) (c) |
| Yak Access LLC | Preferred Stock | | USD | 2,637,983 | | 197,849 | | (a) (c) |
| | | | | | |
| Consumer Finance - 0.01% | | | | | | |
| SunPower Financial | Private Equity | | USD | 36,006 | | 36,580 | | (a) (b) |
| | | | | | |
| Diversified Metals & Mining - 0.06% | | | | | | |
| Foresight Energy LLC | Common Stock | | USD | 17,979 | | 367,435 | | (a) (b) (c) |
| | | | | | |
| Diversified Real Estate Activities - 0.02% | | | | | | |
| KKR Residential Opportunities I LLC | Private Equity | | USD | 118,737 | | 140,668 | | (b) |
| | | | | | |
| Diversified Support Services - 0.01% | | | | | | |
| Magna Legal Services LLC | Common Stock | | USD | 618 | | 69,876 | | (a) (b) (c) |
| | | | | | |
| Food Distributors - 0.01% | | | | | | |
| Lipari Foods LLC | Common Stock | | USD | 63,943 | | 60,913 | | (b) (c) |
| | | | | | |
| Health Care Facilities - 0.00% | | | | | | |
| Quorum Health Corp | Trade Claim | | USD | 212,000 | | 26,585 | | (b) (c) |
| | | | | | |
| Health Care Services - 0.15% | | | | | | |
| Affordable Care Inc | 11.750% 12/2069 PIK Pref Equity | 12/31/2069 | USD | 677,000 | | 666,980 | | (a) (b) (f) |
| American Vision Partners | Private Equity | | USD | 53,939 | | 41,765 | | (a) (b) |
| Amerivet Partners Management Inc | 11.500% 12/2059 | 12/31/2059 | USD | 298 | | 276,799 | | (a) (b) (f) |
| | | | | | |
| Health Care Technology - 2.22% | | | | | | |
| athenahealth Inc | Private Equity | | USD | 12,641,498 | | 14,170,740 | | (b) |
| | | | | | |
| Leisure Facilities - 0.32% | | | | | | |
| Pure Gym Ltd | Private Equity | | GBP | 1,416,469 | | 2,014,832 | | (a) (b) |
| | | | | | |
See accompanying notes to financial statements.
22
| | | | | | | | |
| Credit Opportunities Portfolio | October 31, 2023 |
| |
| | | | | | | | | | | | | | | | | | | | |
| Issuer | Asset | Maturity Date | Currency | Shares | Fair Value | Footnotes |
| Marine Transportation - 0.01% | | | | | | |
| Australis Maritime II | Private Equity | | USD | 47,812 | | $ | 49,930 | | (b) |
| | | | | | |
| Other Specialized REITs - 0.28% | | | | | | |
| Pretium Partners LLC P2 | Private Equity | | USD | 1,635,306 | | 1,798,117 | | (a) (b) |
| | | | | | |
| Single-Family Residential REITs - 1.35% | | | | | | |
| Avenue One PropCo | Private Equity | | USD | 8,555,619 | | 8,590,526 | | (b) |
| | | | | | |
| Specialized Finance - 0.01% | | | | | | |
| TDC LLP | 8.000% 06/2049 | 6/1/2049 | GBP | 47,869 | | 56,104 | | (a) (b) |
| TDC LLP | Private Equity | | GBP | 9,880 | | 12,000 | | (a) (b) |
| TOTAL EQUITY & OTHER INVESTMENTS (Cost $33,887,028) | | | | $ | 34,966,566 | | |
| | | | | | | | | | | | | | | | | | | | | | | |
| TOTAL INVESTMENTS (Cost $878,754,247) - 127.01% | | | | | $ | 810,891,726 | |
| LIABILITIES EXCEEDING OTHER ASSETS, NET - (27.01%) | | | | | (172,465,041) | |
| NET ASSETS - 100.00% | | | | | | | $ | 638,426,685 | |
TL Term loan
DD Delayed draw term loan
1L First lien
2L Second lien
(a)Security considered restricted.
(b)Value determined using significant unobservable inputs.
(c)Non-income producing security.
(d)Securities purchased on a when-issued basis. Rates do not take effect until settlement date.
(e)Investment is an unfunded or partially funded commitment.
(f)Represents a payment-in-kind (“PIK”) security which may pay interest/dividend in additional par/shares.
(g)Zero coupon bond.
(h)Securities exempt from registration pursuant to Rule 144A under the Securities Act of 1933, as amended. These securities may only be resold to qualified institutional buyers in transactions exempt from registration.
See accompanying notes to financial statements.
23
| | | | | | | | |
| Credit Opportunities Portfolio | October 31, 2023 |
| |
Statement of Assets and Liabilities
As of October 31, 2023
| | | | | |
| Assets | |
| Investments, at fair value (cost $878,754,247) | $ | 810,891,726 | |
| Cash | 41,029,415 | |
| Foreign currencies, at value (cost $3,635,334) | 3,627,936 | |
| Dividends and interest receivable | 12,305,666 | |
| Receivable for investments sold | 8,427,937 | |
| Receivable for shares issued | 2,320,038 | |
| |
| Other assets | 201,604 | |
| Total assets | 878,804,322 | |
| |
| Liabilities | |
| Credit facility (net of deferred financing costs of $529,467) | 221,369,479 | |
| Payable for investments purchased | 6,464,154 | |
| Interest payable | 4,604,366 | |
| Distribution payable | 4,563,833 | |
| Investment advisory fees payable | 1,015,203 | |
| Trustees’ fees payable | 375,092 | |
| Distribution fees payable | 155,806 | |
| Shareholder servicing fees payable | 76,896 | |
| Other accrued expenses | 1,752,808 | |
| Total liabilities | 240,377,637 | |
| |
| Commitments and Contingencies (Note 8) | |
| Net assets | $ | 638,426,685 | |
| |
| Net Assets | |
| Paid-in capital — (unlimited shares authorized — $0.001 par value) | $ | 731,171,371 | |
| Accumulated deficit | (92,744,686) | |
| Net assets | $ | 638,426,685 | |
| |
| Class D: | |
| Net asset value | $ | 2,629,190 | |
| Price per share (124,165 shares) | $ | 21.17 | |
| |
| Class I: | |
| Net asset value | $ | 232,289,996 | |
| Price per share (10,185,494 shares) | $ | 22.81 | |
| |
| Class T: | |
| Net asset value | $ | 25,294,565 | |
| Price per share (1,119,509 shares) | $ | 22.59 | |
| |
| Class U: | |
| Net asset value | $ | 378,212,934 | |
| Price per share (17,398,716 shares) | $ | 21.74 | |
See accompanying notes to financial statements.
24
| | | | | | | | |
| Credit Opportunities Portfolio | October 31, 2023 |
| |
Statement of Operations
For the Year Ended October 31, 2023
| | | | | |
| Investment income | |
| Interest income | $ | 73,853,053 | |
| Payment-in-kind interest income | 4,500,949 | |
| Other income | 1,209,991 | |
| Total investment income | 79,563,993 | |
| |
| Expenses | |
| Interest expense | 14,769,946 | |
| Investment advisory fees | 10,534,131 | |
| Distribution fees | 1,759,960 | |
| Legal fees | 1,060,680 | |
| Pricing expense | 1,029,432 | |
| Shareholder servicing fees | 886,950 | |
| Term loan expense | 591,052 | |
| Audit and tax fees | 297,924 | |
| Administration fees | 295,781 | |
| Transfer agent fees | 277,869 | |
| Custodian fees | 194,998 | |
| Shareholder reporting expense | 171,550 | |
| Trustees' fees | 125,684 | |
| Other expenses | 291,834 | |
| Total expenses prior to expense limitation agreement | 32,287,791 | |
| |
| Expense limitation | (1,238,725) | |
| |
| Net expenses | 31,049,066 | |
| |
| Net investment income | 48,514,927 | |
| |
| Realized and unrealized gains (losses) | |
| Net realized losses on | |
| Investments | (20,829,026) | |
| Foreign currency transactions | (256,058) | |
| Net realized losses | (21,085,084) | |
| Net change in unrealized appreciation (depreciation) of: | |
| Investments | 46,359,634 | |
| Foreign currency translation | 1,640,074 | |
| Deferred Trustees’ fees | (42,561) | |
| Net change in unrealized appreciation | 47,957,147 | |
| Net realized and unrealized gains | 26,872,063 | |
| Net increase in net assets resulting from operations | $ | 75,386,990 | |
See accompanying notes to financial statements.
25
| | | | | | | | |
| Credit Opportunities Portfolio | October 31, 2023 |
| |
Statements of Changes in Net Assets
| | | | | | | | |
| Year Ended October 31, 2023 | Year Ended
October 31, 2022 |
| | |
| Increase (decrease) in net assets resulting from operations | | |
| Net investment income | $ | 48,514,927 | | $ | 37,552,764 | |
| Net realized losses | (21,085,084) | | (8,110,574) | |
| Net change in unrealized appreciation (depreciation) | 47,957,147 | | (112,705,218) | |
| Net increase (decrease) in net assets resulting from operations | 75,386,990 | | (83,263,028) | |
| | |
| Distributions to shareholders | | |
| Class D | (237,664) | | (229,812) | |
| Class I | (20,114,357) | | (19,534,663) | |
| Class T | (2,066,330) | | (2,242,759) | |
| Class U | (26,252,915) | | (21,082,820) | |
| Total distributions to shareholders | (48,671,266) | | (43,090,054) | |
| | |
| Shareholder transactions (Note 7) | | |
| Class D | | |
| Subscriptions | — | | 4,000,075 | |
| Shares issued in reinvestment of distributions | — | | 50,775 | |
| Shares redeemed | (838,833) | | — | |
| (838,833) | | 4,050,850 | |
| Class I | | |
| Subscriptions | 17,678,878 | | 59,411,653 | |
| Shares issued in reinvestment of distributions | 9,555,533 | | 10,140,563 | |
| Shares redeemed | (23,326,641) | | (9,652,142) | |
| 3,907,770 | | 59,900,074 | |
| Class T | | |
| Subscriptions | 2,158,512 | | 9,855,214 | |
| Shares issued in reinvestment of distributions | 1,622,765 | | 2,036,246 | |
| Shares redeemed | (4,509,558) | | (6,604,916) | |
| (728,281) | | 5,286,544 | |
| Class U | | |
| Subscriptions | 122,380,816 | | 157,587,728 | |
| Shares issued in reinvestment of distributions | 18,648,984 | | 17,353,008 | |
| Shares redeemed | (36,107,544) | | (58,940,745) | |
| 104,922,256 | | 115,999,991 | |
| Increase in net assets from shareholder transactions | 107,262,912 | | 185,237,459 | |
| Net increase in net assets | 133,978,636 | | 58,884,377 | |
| Net assets | | |
| Beginning of period | 504,448,049 | | 445,563,672 | |
| End of period | $ | 638,426,685 | | $ | 504,448,049 | |
See accompanying notes to financial statements.
26
| | | | | | | | |
| Credit Opportunities Portfolio | October 31, 2023 |
| |
Statement of Cash Flows
| | | | | |
| Year Ended October 31, 2023 |
| |
| Cash Flows from Operating Activities: | |
| Net increase in net assets resulting from operations | $ | 75,386,990 | |
| Adjustments to reconcile net increase in net assets resulting from operations to net cash used in operating activities: | |
| Purchases of investments | (383,215,893) | |
| Proceeds from sales and repayments of investments | 320,224,264 | |
| Net change in unrealized appreciation of investments | (46,359,634) | |
| Net realized loss from investments | 20,829,026 | |
| Net accretion of premiums and discounts | (6,351,821) | |
| Payment-in-kind interest | (4,500,949) | |
| Net change in unrealized appreciation on foreign currency translation | (1,640,074) | |
| Net realized loss on investments (foreign currency related) | 1,125,477 | |
| Amortization of deferred financing costs | 704,492 | |
| Net change in unrealized depreciation on Deferred Trustees’ fees | 42,561 | |
| Changes in assets and liabilities: | |
| Decrease in receivable for investments sold | 12,307,194 | |
| Decrease in payable for investments purchased | (10,639,081) | |
| Increase in interest payable | 3,978,282 | |
| Decrease in dividends and interest receivable | 2,327,276 | |
| Increase in other accrued expenses | 819,850 | |
| Increase in investment advisory fees payable | 483,253 | |
| Increase in other assets | (146,349) | |
| |
| |
| Increase in Trustees’ fees payable | 103,184 | |
| Increase in distribution fees payable | 48,441 | |
| Increase in shareholder servicing fees payable | 24,106 | |
| Net cash used in operating activities | (14,449,405) | |
| Cash Flows from Financing Activities | |
| Paydown of credit facility | (248,141,641) | |
| Proceeds from credit facility | 242,979,799 | |
| Subscriptions for shares | 141,761,998 | |
| Shares repurchased | (64,782,610) | |
| Distributions paid to shareholders | (18,110,948) | |
| Repayment of reverse repurchase agreements | (12,508,000) | |
| Due to custodian | (2,411,022) | |
| Deferred financing costs paid | (567,090) | |
| Net cash provided by financing activities | 38,220,486 | |
| |
| Effect of exchange rate changes on cash | (32,018) | |
| Net increase in cash | 23,739,063 | |
| |
| Cash | |
| Beginning balance | 20,918,288 | |
| Ending balance | $ | 44,657,351 | |
| |
| Supplemental disclosure of cash flow information and non-cash financing activities: | |
| Cash paid for interest expense | $ | 10,188,990 | |
| Reinvestment of distributions | $ | 29,827,282 | |
See accompanying notes to financial statements.
27
| | | | | | | | |
| Credit Opportunities Portfolio | October 31, 2023 |
| |
Financial Highlights
| | | | | | | | | | | |
| Year Ended October 31, 2023 | Period from
Commencement of
Operations to
October 31, 2022*** |
| | | |
| Class D | | | |
| Per share operating performance | | | |
| Net asset value, beginning of period | $ | 20.09 | | $ | 25.00 | | |
| Income (loss) from investment operations | | | |
Net investment income(1) | 1.78 | | 1.28 | | |
| Net realized and unrealized gains (losses) | 1.09 | | (4.66) | | |
| Total from investment operations | 2.87 | | (3.38) | | |
| | | |
| Distributions from | | | |
| Net investment income | (1.79) | | (1.50) | | |
| Realized gains | — | | (0.03) | | |
| Total distributions | (1.79) | | (1.53) | | |
| Net asset value, end of period | $ | 21.17 | | $ | 20.09 | | |
Total return†(2) | 14.72 | % | (14.09) | % | |
| | | |
| Ratios to average net assets | | | |
| Expenses, before reimbursement | 5.30 | % | 3.60 | % | ** |
| Expenses, after reimbursement | 5.10 | % | 3.52 | % | ** |
| Net investment income, before reimbursement | 8.31 | % | 7.65 | % | ** |
| Net investment income, after reimbursement | 8.51 | % | 7.74 | % | ** |
| Supplemental data | | | |
| Net assets, end of period (000’s) | $ | 2,629 | | $ | 3,313 | | |
| Portfolio turnover rate* | 39 | % | 25 | % | (2) |
(1)Per share calculations were performed using average shares.
(2)Total return and Portfolio turnover rate are for the period indicated and have not been annualized.
†Total return assumes a purchase of common stock at the net asset value on the first day and a sale at the net asset value on the last day of each period reported on the table. Total return assumes reinvestment of dividends and distributions at prices obtained pursuant to the Fund’s dividend reinvestment plan.
*Portfolio turnover is calculated on the basis of the Fund as a whole.
**Annualized.
***The date of commencement of operations for Class D shares was January 31, 2022.
See accompanying notes to financial statements.
28
| | | | | | | | |
| Credit Opportunities Portfolio | October 31, 2023 |
| |
Financial Highlights
| | | | | | | | | | | | | | | | | |
| Year Ended October 31, | Period from
Commencement of
Operations to
October 31, 2020*** |
| 2023 | 2022 | 2021 |
| Class I | | | | | |
| Per share operating performance | | | | | |
| Net asset value, beginning of period | $ | 21.66 | | $ | 27.42 | | $ | 26.08 | | $ | 25.00 | | |
| Income (loss) from investment operations | | | | | |
Net investment income(1) | 1.99 | | 1.90 | | 1.67 | | 1.01 | | |
| Net realized and unrealized gains (losses) | 1.15 | | (5.52) | | 1.69 | | 1.10 | | |
| Total from investment operations | 3.14 | | (3.62) | | 3.36 | | 2.11 | | |
| | | | | |
| Distributions from | | | | | |
| Net investment income | (1.99) | | (2.11) | | (1.66) | | (1.03) | | |
| Realized gains | — | | (0.03) | | (0.36) | | — | | |
| Total distributions | (1.99) | | (2.14) | | (2.02) | | (1.03) | | |
| Net asset value, end of period | $ | 22.81 | | $ | 21.66 | | $ | 27.42 | | $ | 26.08 | | |
Total return†(2) | 14.88 | % | (13.72) | % | 12.81 | % | 8.71 | % | |
| | | | | |
| Ratios to average net assets | | | | | |
| Expenses, before reimbursement | 5.07 | % | 3.14 | % | 2.32 | % | 3.84 | % | ** |
| Expenses, after reimbursement | 4.86 | % | 3.09 | % | 2.02 | % | 1.68 | % | ** |
| Net investment income, before reimbursement | 8.55 | % | 7.60 | % | 5.73 | % | 3.91 | % | ** |
| Net investment income, after reimbursement | 8.77 | % | 7.65 | % | 6.03 | % | 6.06 | % | ** |
| Supplemental data | | | | | |
| Net assets, end of period (000’s) | $ | 232,290 | | $ | 216,971 | | $ | 211,181 | | $ | 106,962 | | |
| Portfolio turnover rate* | 39 | % | 25 | % | 78 | % | 66 | % | (2) |
(1)Per share calculations were performed using average shares.
(2)Total return and Portfolio turnover rate are for the period indicated and have not been annualized.
†Total return assumes a purchase of common stock at the net asset value on the first day and a sale at the net asset value on the last day of each period reported on the table. Total return assumes reinvestment of dividends and distributions at prices obtained pursuant to the Fund’s dividend reinvestment plan.
*Portfolio turnover is calculated on the basis of the Fund as a whole.
**Annualized.
***The date of commencement of operations for Class I shares was February 28, 2020.
See accompanying notes to financial statements.
29
| | | | | | | | |
| Credit Opportunities Portfolio | October 31, 2023 |
| |
Financial Highlights
| | | | | | | | | | | | | | | | | |
| Year Ended October 31, | Period from
Commencement of
Operations to
October 31, 2020*** |
| 2023 | 2022 | 2021 |
| Class T | | | | | |
| Per share operating performance | | | | | |
| Net asset value, beginning of period | $ | 21.46 | | $ | 27.17 | | $ | 25.83 | | $ | 25.00 | | |
| Income (loss) from investment operations | | | | | |
Net investment income(1) | 1.80 | | 1.69 | | 1.45 | | 0.61 | | |
| Net realized and unrealized gains (losses) | 1.14 | | (5.47) | | 1.68 | | 0.83 | | |
| Total from investment operations | 2.94 | | (3.78) | | 3.13 | | 1.44 | | |
| | | | | |
| Distributions from | | | | | |
| Net investment income | (1.81) | | (1.90) | | (1.43) | | (0.61) | | |
| Realized gains | — | | (0.03) | | (0.36) | | — | | |
| Total distributions | (1.81) | | (1.93) | | (1.79) | | (0.61) | | |
| Net asset value, end of period | $ | 22.59 | | $ | 21.46 | | $ | 27.17 | | $ | 25.83 | | |
Total return†(2) | 14.08 | % | (14.40) | % | 12.03 | % | 6.65 | % | |
| | | | | |
| Ratios to average net assets | | | | | |
| Expenses, before reimbursement | 5.82 | % | 3.86 | % | 3.04 | % | 3.54 | % | ** |
| Expenses, after reimbursement | 5.61 | % | 3.82 | % | 2.78 | % | 2.49 | % | ** |
| Net investment income, before reimbursement | 7.81 | % | 6.82 | % | 5.00 | % | 4.65 | % | ** |
| Net investment income, after reimbursement | 8.02 | % | 6.86 | % | 5.27 | % | 5.70 | % | ** |
| Supplemental data | | | | | |
| Net assets, end of period (000’s) | $ | 25,295 | | $ | 24,724 | | $ | 26,121 | | $ | 8,243 | | |
| Portfolio turnover rate* | 39 | % | 25 | % | 78 | % | 66 | % | (2) |
(1)Per share calculations were performed using average shares.
(2)Total return and Portfolio turnover rate are for the period indicated and have not been annualized.
†Total return assumes a purchase of common stock at the net asset value on the first day and a sale at the net asset value on the last day of each period reported on the table. Total return assumes reinvestment of dividends and distributions at prices obtained pursuant to the Fund’s dividend reinvestment plan.
*Portfolio turnover is calculated on the basis of the Fund as a whole.
**Annualized.
***The date of commencement of operations for Class T shares was June 1, 2020.
See accompanying notes to financial statements.
30
| | | | | | | | |
| Credit Opportunities Portfolio | October 31, 2023 |
| |
Financial Highlights
| | | | | | | | | | | | | | | | | |
| Year Ended October 31, | Period from
Commencement of
Operations to
October 31, 2020*** |
| 2023 | 2022 | 2021 |
| Class U | | | | | |
| Per share operating performance | | | | | |
| Net asset value, beginning of period | $ | 20.65 | | $ | 26.18 | | $ | 25.00 | | $ | 25.00 | | |
| Income (loss) from investment operations | | | | | |
Net investment income(1) | 1.74 | | 1.64 | | 1.44 | | — | | |
| Net realized and unrealized gains (losses) | 1.09 | | (5.27) | | 1.52 | | — | | |
| Total from investment operations | 2.83 | | (3.63) | | 2.96 | | — | | |
| | | | | |
| Distributions from | | | | | |
| Net investment income | (1.74) | | (1.87) | | (1.42) | | — | | |
| Realized gains | — | | (0.03) | | (0.36) | | — | | |
| Total distributions | (1.74) | | (1.90) | | (1.78) | | — | | |
| Net asset value, end of period | $ | 21.74 | | $ | 20.65 | | $ | 26.18 | | $ | 25.00 | | |
Total return†(2) | 14.10 | % | (14.48) | % | 11.69 | % | 0.00 | % | |
| | | | | |
| Ratios to average net assets | | | | | |
| Expenses, before reimbursement | 5.83 | % | 3.92 | % | 3.01 | % | 0.00 | % | ** |
| Expenses, after reimbursement | 5.62 | % | 3.86 | % | 2.87 | % | 0.00 | % | ** |
| Net investment income, before reimbursement | 7.80 | % | 6.89 | % | 5.29 | % | 0.00 | % | ** |
| Net investment income, after reimbursement | 8.01 | % | 6.94 | % | 5.43 | % | 0.00 | % | ** |
| Supplemental data | | | | | |
| Net assets, end of period (000’s) | $ | 378,213 | | $ | 259,440 | | $ | 208,262 | | $ | 7,421 | | |
| Portfolio turnover rate* | 39 | % | 25 | % | 78 | % | 66 | % | (2) |
(1)Per share calculations were performed using average shares.
(2)Total return and Portfolio turnover rate are for the period indicated and have not been annualized.
†Total return assumes a purchase of common stock at the net asset value on the first day and a sale at the net asset value on the last day of each period reported on the table. Total return assumes reinvestment of dividends and distributions at prices obtained pursuant to the Fund’s dividend reinvestment plan.
*Portfolio turnover is calculated on the basis of the Fund as a whole.
**Annualized.
***The date of commencement of operations for Class U shares was September 1, 2020.
See accompanying notes to financial statements.
31
| | | | | | | | |
| Credit Opportunities Portfolio | October 31, 2023 |
| |
Notes to Financial Statements
1. Organization
KKR Credit Opportunities Portfolio (the “Fund”) was organized on September 5, 2019 as a statutory trust under the laws of the State of Delaware. The Fund is a closed-end registered management investment company, which commenced operations on February 28, 2020 and continuously offers its shares and operates as an interval fund. The Fund seeks to provide attractive risk-adjusted returns and generate current income. The Fund is diversified for purposes of the Investment Company Act of 1940, as amended (the “1940 Act”). KKR Credit Advisors (US) LLC serves as the Fund’s investment adviser (the “Adviser”).
As of October 31, 2023, an affiliate of the Adviser owned 13.88% of the outstanding shares of the Fund.
2. Summary of Significant Accounting Policies
Basis of Presentation — The accompanying financial statements are presented in accordance with accounting principles generally accepted in the United States of America (“GAAP”) and are stated in United States (“U.S.”) dollars. The Fund is an investment company following accounting and reporting guidance in Financial Accounting Standards Board (“FASB”) Accounting Standards Codification (“ASC”) Topic 946, Financial Services — Investment Companies. The preparation of financial statements in conformity with GAAP requires management to make estimates and assumptions that affect the reported amounts and disclosures in these financial statements. Actual results could differ from those estimates.
Valuation of Investments — The Board of Trustees (the “Board”) of the Fund has adopted valuation policies and procedures to ensure investments are valued in a manner consistent with GAAP as required by the 1940 Act. The Board designated the Adviser as the valuation designee to perform fair valuations pursuant to Rule 2a-5 under the Investments Company Act of 1940 (the “Valuation Designee”). The Valuation Designee has primary responsibility for implementing the Fund’s valuation policies and procedures.
Fair value is the price that would be received to sell an asset or paid to transfer a liability in an orderly transaction between market participants at the measurement date. Where available, fair value is based on observable market prices or parameters, or derived from such prices or parameters. Where observable prices or inputs are not available, valuation models are applied. These valuation techniques involve some level of management estimation and judgment, the degree of which is dependent on the price transparency for the instruments or market and the instruments’ complexity for disclosure purposes.
Assets and liabilities recorded at fair value on the Statement of Assets and Liabilities are categorized based upon the level of judgment associated with the inputs used to measure their value. Hierarchical levels, as defined under GAAP, are directly related to the amount of subjectivity associated with the inputs to fair valuations of these assets and liabilities, and are as follows:
Level 1 — Inputs are unadjusted, quoted prices in active markets for identical assets or liabilities at the measurement date.
Level 2 — Inputs other than quoted prices included in Level 1 that are observable for the asset or liability, either directly or indirectly. Level 2 inputs include quoted prices for similar instruments in active markets, and inputs other than quoted prices that are observable for the asset or liability.
Level 3 — Inputs are unobservable for the asset or liability, and include situations where there is little, if any, market activity for the asset or liability.
A significant decrease in the volume and level of activity for the asset or liability is an indication that transactions or quoted prices may not be representative of fair value because in such market conditions there may be increased instances of transactions that are not orderly. In those circumstances, further analysis of transactions or quoted prices is needed, and a significant adjustment to the transactions or quoted prices may be necessary to estimate fair value.
| | | | | | | | |
| Credit Opportunities Portfolio | October 31, 2023 |
| |
The availability of observable inputs can vary depending on the financial asset or liability and is affected by a wide variety of factors, including, for example, the type of product, whether the product is new, whether the product is traded on an active exchange or in the secondary market, and the current market condition. To the extent that valuation is based on models or inputs that are less observable or unobservable in the market, the determination of fair value requires more judgment. Accordingly, the degree of judgment exercised by the Fund in determining fair value is greatest for instruments categorized in Level 3. In certain cases, the inputs used to measure fair value may fall into different levels of the fair value hierarchy. In such cases, for disclosure purposes, the level in the fair value hierarchy within which the fair value measurement in its entirety falls is determined based on the lowest level input that is significant to the fair value measurement in its entirety. The Fund’s assessment of the significance of a particular input to the fair value measurement in its entirety requires judgment and consideration of factors specific to the asset. The variability of the observable inputs affected by the factors described above may cause transfers between Levels 1, 2 and/or 3.
Many financial assets and liabilities have bid and ask prices that can be observed in the marketplace. Bid prices reflect the highest price that the Fund and others are willing to pay for an asset. Ask prices represent the lowest price that the Fund and others are willing to accept for an asset. For financial assets and liabilities whose inputs are based on bid-ask prices, the Fund does not require that fair value always be a predetermined point in the bid-ask range. The Fund’s policy is to allow for mid-market pricing and adjust to the point within the bid-ask range that meets the Fund’s best estimate of fair value.
Depending on the relative liquidity in the markets for certain assets, the Fund may transfer assets to Level 3 if it determines that observable quoted prices, obtained directly or indirectly, are not available.
Investments are generally valued based on quotations from third party pricing services, unless such a quotation is unavailable or is determined to be unreliable or inadequately representing the fair value of the particular assets. In that case, valuations are based on either valuation data obtained from one or more other third party pricing sources, including broker dealers selected by the Adviser, or will reflect the Valuation Committee’s good faith determination of fair value based on other factors considered relevant. For assets classified as Level 3, valuations are based on various factors including financial and operating data of the company, company specific developments, market valuations of comparable companies and model projections.
The fair value of certain unfunded investments in delayed draw term loans and revolving lines of credit may at times be priced at less than par value resulting in a financial liability in the Schedule of Investments and are valued in accordance with ASC Topic 820, Fair Value Measurements. These values are temporary and the funding of the commitment will result in these investments valued as financial assets. The interest rates shown for unfunded commitments in the Schedule of Investments represents the commitment fee the fund earns on the undrawn amounts.
For the year ended October 31, 2023, there have been no significant changes to the Fund’s fair value methodologies.
Investment Transactions — Investment transactions are accounted for on the trade date, the date the order to buy or sell is executed. Amortization and accretion is calculated using the effective interest method over the holding period of the investment. Realized gains and losses are calculated on the specific identified cost basis.
Cash and Cash Equivalents — Cash and cash equivalents includes cash on hand, cash held in banks and highly liquid investments with original maturities of three or fewer months. As of October 31, 2023, the Fund held no cash equivalents. Bank overdrafts are temporary transactions that represent disbursements made in excess of available funds in our bank accounts. The Fund recognizes bank overdrafts, if any, as a Due to custodian in the Statement of Assets and Liabilities.
Foreign Currency Transactions — The books and records of the Fund are maintained in U.S. dollars. All investments denominated in foreign currency are converted to the U.S. dollar using prevailing exchange rates at the end of the reporting period. Income, expenses, gains and losses on investments denominated in foreign currency are converted to the U.S. dollar using the prevailing exchange rates on the dates when the transactions occurred.
| | | | | | | | |
| Credit Opportunities Portfolio | October 31, 2023 |
| |
The Fund bifurcates that portion of the results of operations resulting from changes in foreign exchange rates on investments and from the fluctuations arising from changes in market prices of securities held.
Distributions to Shareholders — Distributions are accrued and declared daily and paid monthly, and distributable net realized capital gains, if any, are declared and distributed at least annually.
Income Taxes — The Fund has elected to be treated and has qualified, and intends to continue to qualify in each taxable year, as a “regulated investment company” under Subchapter M of the Internal Revenue Code of 1986, as amended, and in conformity with the Regulated Investment Company Modernization Act of 2010. The Fund will not be subject to federal income tax to the extent the Fund satisfies the requirements under Section 851 of the Internal Revenue Code, including distributing all of its gross investment company taxable income and capital gains to its shareholders based on the Fund’s fiscal year end of October 31.
To avoid imposition of a 4.0% excise tax on undistributed income applicable to regulated investment companies, the Fund intends to declare each year as dividends in each calendar year at least 98.0% of its net investment income (earned during the calendar year) and 98.2% of its net realized capital gains (earned during the year ended October 31) plus undistributed amounts, if any, from prior years.
The Fund evaluates tax positions taken or expected to be taken in the course of preparing the Fund’s tax returns to determine whether it is “more-likely-than-not” (i.e., greater than 50.0%) that each tax position will be sustained upon examination by a taxing authority based on the technical merits of the position. Tax positions not deemed to meet the more-likely-than-not threshold are recorded as a tax benefit or expense in the current year. Management has analyzed the Fund’s tax positions and has concluded that no liability for unrecognized tax benefits should be recorded related to uncertain tax positions for the open tax years (2020-2022). However, management’s conclusions regarding tax positions taken may be subject to review and adjustment at a later date based on factors including, but not limited to, examination by tax authorities, on-going analysis of and changes to tax laws, regulations and interpretations thereof.
As of October 31, 2023, the Fund did not have a liability for any unrecognized tax benefits. The Fund recognizes interest and penalties, if any, related to unrecognized tax benefits as income tax expense in the Statement of Operations. During the year ended October 31, 2023, the Fund did not incur any interest or penalties.
Repurchase Offers — The Fund operates as an interval fund pursuant to Rule 23c-3 under the 1940 Act and, as such, has adopted a fundamental policy to make quarterly repurchase offers, at NAV, of no less than 10.0% and no more than 25.0% of the Fund’s shares outstanding on the Repurchase Request Deadline (as defined below). There is no guarantee that shareholders will be able to sell all of the shares they desire to sell in a quarterly repurchase offer, although each shareholder will have the right to require the Fund to purchase at least 10.0% of such shareholder’s shares in each quarterly repurchase. Liquidity will be provided to shareholders only through the Fund’s quarterly repurchases. Shareholders will be notified in writing of each quarterly repurchase offer and the date the repurchase offer ends (the “Repurchase Request Deadline”).
Recently Adopted Accounting Pronouncements — In March 2020, the FASB issued ASU 2020-04, Reference Rate Reform (Topic 848): Facilitation of the Effects of Reference Rate Reform on Financial Reporting. ASU 2020-04 contains practical expedients for reference rate reform-related activities that impact debt, leases, derivatives, and other contracts. The guidance in ASU 2020-04 is optional and may be elected over time as reference rate reform activities occur. Management of the Fund has elected to adopt this accounting standard and apply it to contracts that are modified for the sole purpose of reference rate reform. In December 2022, the FASB issued ASU No. 2022-06, Reference Rate Reform (Topic 848): Deferral of the Sunset Date of Topic 848, which deferred the sunset day of this guidance to December 31, 2024. The adoption of these standards did not have a material impact to these financial statements.
3. Risk Considerations
The Fund invests mainly in leveraged loans, high yield securities, collateralized loan obligations, common stocks not actively traded and preferred stocks. These investments may involve certain risks, including, but not limited to, those described below:
| | | | | | | | |
| Credit Opportunities Portfolio | October 31, 2023 |
| |
Global Economic and Market Conditions — The Fund is materially affected by market, economic and political conditions and events, such as natural disasters, epidemics and pandemics, wars, supply chain disruptions, economic sanctions, globally and in the jurisdictions and sectors in which it invests or operates, including factors affecting interest rates, the availability of credit, currency exchange rates and trade barriers. For example, the COVID‐19 pandemic, the Russia‐Ukraine war, rising interest rates, heightened inflation, supply chain disruptions, geopolitical risks, economic sanctions and volatility in the banking and financial sectors have disrupted global economies and financial markets, and their prolonged economic impact is uncertain. Market, economic and political conditions and events are outside the Adviser’s control and could adversely affect the Fund’s operations and performance and the liquidity and value of the Fund’s investments and reduce the ability of the Fund to make attractive new investments.
Leverage Risk — Leverage is a speculative technique that may expose the Fund to greater risk and increased costs. When leverage is used, the net asset value of the Fund’s shares and the Fund’s investment return will likely be more volatile.
Market Risk — Bond markets rise and fall daily. As with any investment with performance tied to these markets, the value of an investment in the Fund will fluctuate, which means that shareholders could lose money.
Interest Rate Risk — Interest rates will rise and fall over time. During periods when interest rates are low, the Fund’s yield and total return also may be low. Changes in interest rates also may affect the Fund’s share price and a sharp rise in interest rates could cause the Fund’s share price to fall. The longer the Fund’s duration, the more sensitive to interest rate movements its share price is likely to be.
Credit Risk — The Fund is subject to the risk that a decline in the credit quality of an investment could cause the Fund to lose money or underperform. The Fund could lose money if the issuer or guarantor of an investment fails to make timely principal or interest payments or otherwise honor its obligations.
Second Lien Risk — Investments in second lien loans and “last out” pieces of unitranche loans will be junior in priority to the first lien loans and “first out” piece of the same unitranche loan with respect to payment of principal, interest and other amounts. Consequently, the fact that debt is secured does not guarantee that we will receive principal and interest payments according to the debt’s terms, or at all, or that we will be able to collect on the debt should it be forced to enforce its remedies.
Liquidity Risk — A particular investment may be difficult to purchase or sell. The Fund may be unable to sell illiquid securities at an advantageous time or price.
Prepayment and Extension Risk — The Fund’s investments are subject to the risk that the investments may be paid off earlier or later than expected. Either situation could cause the Fund to hold investments paying lower than market rates of interest, which could hurt the Fund’s yield or share price.
High Yield Risk — High yield securities and unrated securities of similar credit quality (sometimes called junk bonds) that the Fund may invest in are subject to greater levels of credit and liquidity risks. High yield securities are considered primarily speculative with respect to the issuer’s continuing ability to make principal and interest payments.
Foreign Investment Risk — The Fund’s investments in securities of foreign issuers may involve certain risks that are greater than those associated with investments in securities of U.S. issuers. These include risks of adverse changes in foreign economic, political, regulatory and other conditions; changes in currency exchange rates (the currencies will decline in value relative to the U.S. dollar or, in the case of hedging positions, the U.S. dollar will decline in value relative to the currency being hedged) or exchange control regulations (including limitations on currency movements and exchanges); differing accounting, auditing, financial reporting and legal standards and practices; differing securities market structures; and higher transaction costs. These risks may be heightened in connection with investments in emerging markets.
Issuer Risk — The value of securities may decline for a number of reasons that directly relate to the issuer, such as its financial strength, management performance, financial leverage and reduced demand for the issuer’s goods and services, as well as the historical and prospective earnings of the issuer and the value of its assets.
| | | | | | | | |
| Credit Opportunities Portfolio | October 31, 2023 |
| |
4. Agreements
Investment Advisory Agreement — The Adviser provides day-to-day portfolio management services to the Fund and has discretion to purchase and sell investments in accordance with the Fund’s objectives, policies, and restrictions. For the services it provides to the Fund, the Adviser receives an annual fee, payable monthly by the Fund, in an amount equal to 1.3% of the Fund’s average daily Managed Assets (the “Investment Advisory Fee”). “Managed Assets” means the total assets of the Fund (including any assets attributable to borrowings for investment purposes) minus the sum of the Fund’s accrued liabilities (other than liabilities representing borrowings for investment purposes).
During periods when the Fund is using leverage, the Investment Advisory Fee paid to the Adviser will be higher than if the Fund does not use leverage because the Investment Advisory Fee paid is calculated based on the Fund’s Managed Assets, which includes the assets purchased through leverage. During the year ended October 31, 2023, the Adviser earned an Investment Advisory Fee of $10.5 million.
The Fund has entered into an Expense Limitation and Reimbursement Agreement (the “Expense Limitation Agreement”) with the Adviser pursuant to which the Adviser will agree to waive its monthly fee and pay, absorb or reimburse some or all of the Fund’s “Specified Expenses” (as defined below), an “Expense Limitation Payment,” for each month during the Limitation Period (as defined below) to the extent necessary so that, for any fiscal year, the Fund’s Specified Expenses do not exceed 0.4% of the average daily value of the Fund’s net assets. “Specified Expenses” of the Fund means all expenses incurred in the business of the Fund, including organizational and operating expenses, with the exception of: (i) the Management Fee (as defined in the Fund’s prospectus), (ii) the Service Fee (as defined in the Fund’s prospectus), (iii) the Distribution Fee (as defined in the Fund’s prospectus), (iv) brokerage costs, (v) dividend/interest payments (including any dividend payments, interest expenses, commitment fees, or other expenses related to any leverage incurred by the Fund), (vi) taxes, and (vii) extraordinary expenses (as determined in the sole discretion of the Adviser). The “Limitation Period” commenced on February 28, 2020 with an initial term ending December 31, 2022. During October 2022, the Limitation Period was extended to December 31, 2023. The Fund will agree to repay these amounts (“Reimbursement Payment”) on a monthly basis, but only if and to the extent that Specified Expenses plus the Reimbursement Payment are less than 0.4% of the average daily value of the Fund’s net assets during the fiscal year (or, if a lower expense limit is then in effect, such lower limit). The Fund’s obligation to make Reimbursement Payments expires 36 months from the month in which such fees are foregone or expense is incurred by the Adviser.
The Expense Limitation Agreement terminates at the end of the Limitation Period, but may be renewed by the mutual agreement of the Adviser and the Fund for successive terms.
As of October 31, 2023, the amount of Expense Limitation Payments since the inception of the Fund provided by the Adviser was $4.0 million and the Reimbursement Payments to the Adviser was $0.3 million. The Fund’s management believes that Reimbursement Payments of the remaining Expense Limitation Payments were not probable as of October 31, 2023.
The following table reflects the Expense Limitation Payments that may become subject to reimbursement:
| | | | | | | | |
| For the period ended | Amount of Expense
Limitation Payment | Eligible for
Reimbursement
Payment through |
| | |
| October 31, 2021 | $ | 832,625 | | October 31, 2024 |
| October 31, 2022 | 467,117 | | October 31, 2025 |
| October 31, 2023 | 1,238,725 | | October 31, 2026 |
| $ | 2,538,467 | | |
Distributor — KKR Capital Markets LLC (the “Distributor”), an affiliate of the Adviser, is the principal underwriter and distributor of the shares and serves in that capacity on a best effort basis, subject to various conditions. Shares will be offered through other brokers, dealers and other financial intermediaries (referred to as “selling agents”) that have
| | | | | | | | |
| Credit Opportunities Portfolio | October 31, 2023 |
| |
entered into selling agreements with the Distributor. Selling agents typically receive the sales load with respect to Class T shares purchased by their clients. The Distributor does not retain any portion of the sales load. Class T shares are sold subject to a maximum sales load of up to 2.0% of the offering price. However, purchases of Class T shares may be eligible for a sales load discount. The selling agents may, in their sole discretion, reduce or waive the sales load on a non-scheduled basis in individual cases. Class D shares, Class I shares and Class U shares are not subject to a sales load; however, investors could be required to pay brokerage commissions on purchases and sales of Class D shares, Class I shares and Class U shares to their selling agents.
The Fund pays the Distributor an ongoing fee (the “Shareholder Servicing Fee”) that is calculated and accrued monthly at an annualized rate of 0.25% of the net assets of the Fund attributable to Class D shares, Class T shares and Class U shares. The Shareholder Servicing Fee is for personal services provided to Shareholders and/or the maintenance of Shareholder accounts services and to reimburse the Distributor for related expenses incurred. The Distributor will generally pay all or a portion of the Shareholder Servicing Fee to the selling agents that sell Class D shares, Class T shares and Class U shares. During the year ended October 31, 2023, the Fund incurred Shareholder Servicing Fees of $7.0 thousand, $64.2 thousand, and $815.8 thousand for Class D, Class T, and Class U, respectively.
In addition, the Fund pays the Distributor an ongoing distribution fee (the “Distribution Fee”) that is calculated and accrued monthly at an annualized rate of 0.5% of the net assets of the Fund attributable to Class T shares and Class U shares. The Distribution Fee is for the sale and marketing of the Class T shares and Class U shares and to reimburse the Distributor for related expenses incurred. The Distributor will generally pay all or a portion of the Distribution Fee to the selling agents that sell Class T shares and Class U shares. During the year ended October 31, 2023, the Fund incurred distribution fees of $0.1 million and $1.6 million for Class T and Class U shares, respectively.
Payment of the Distribution Fee and the Shareholder Servicing Fee is governed by the Fund’s Distribution and Service Plan. Class I shares do not incur a Shareholder Servicing Fee or Distribution Fee, and Class D shares do not incur a Distribution Fee.
Administrator, Custodian and Transfer Agent — U.S. Bancorp Fund Services, LLC (“Fund Services” or “Administrator”), doing business as U.S. Bank Global Fund Services, serves as the Fund’s administrator pursuant to an administration agreement under which the Administrator provides administrative and accounting services.
U.S. Bank N.A. (the “Custodian”) serves as the Fund’s custodian pursuant to a custody agreement. The Custodian is an affiliate of Fund Services.
Fund Services serves as the Fund’s transfer agent pursuant to a transfer agency agreement.
Deferred Trustees’ Compensation — The Fund has a Deferred Trustees’ Compensation plan (the “Plan”) that allows the Independent Trustees to defer compensation to a future payment period. The compensation is invested in shares of the Fund. The value of a participating Independent Trustee’s deferral account is based on the shares of deferred amounts as designated by the participating Independent Trustees. Changes in the value of the Independent Trustees’ deferral account are included in the Statement of Operations. The accrued obligations under the Plan, including unrealized appreciation (depreciation), are included on the Statement of Assets and Liabilities.
Other — Certain officers of the Fund are also officers of the Adviser. Such officers are not paid by the Fund for serving as officers of the Fund.
| | | | | | | | |
| Credit Opportunities Portfolio | October 31, 2023 |
| |
5. Fair Value
The following table presents information about the Fund’s assets measured at fair value on a recurring basis as of October 31, 2023, and indicates the fair value hierarchy of the inputs utilized by the Fund to determine such fair value:
| | | | | | | | | | | | | | |
| Investments in securities | Level 1 | Level 2 | Level 3 | Total |
| | | | |
| Leveraged Loans | $ | — | | $ | 220,841,815 | | $ | 169,982,537 | | $ | 390,824,352 | |
| High Yield Securities | — | | 323,651,332 | | 11,394,185 | | 335,045,517 | |
| Asset Backed Securities | — | | 45,831 | | 50,009,460 | | 50,055,291 | |
| Equity & Other Investments | — | | 198,729 | | 34,767,837 | | 34,966,566 | |
| Total investments in securities | $ | — | | $ | 544,737,707 | | $ | 266,154,019 | | $ | 810,891,726 | |
The following are the details of the restricted securities of the Fund:
| | | | | | | | | | | | | | | | | | | | |
Issuer(1) | Asset | Par/Shares | Cost | Fair Value | Acquisition
Date | % of Net Assets |
| | | | | | |
| Leveraged Loans | | | | | | |
| 3Pillar Global Inc | TL 1L 11/21 | 1,921,292 | $ | 1,918,632 | | $ | 1,871,338 | | 11/23/2021 | 0.29 | % |
| 3Pillar Global Inc | TL 1L DD 11/21 | 618,335 | 618,094 | | 602,259 | | 11/23/2021 | 0.09 | % |
| 48Forty Solutions LLC | TL 1L 02/22 | 4,688,090 | 4,624,361 | | 4,502,441 | | 2/11/2022 | 0.71 | % |
| 48Forty Solutions LLC | TL 1L 03/22 | 3,133,346 | 3,114,051 | | 3,009,266 | | 3/11/2022 | 0.47 | % |
| Aareon AG | TL 1L 08/23 | 296,880 | 314,754 | | 306,251 | | 8/18/2023 | 0.05 | % |
| Aareon AG | TL 1L DD CAR 08/23 | 74,220 | 78,719 | | (1,923) | | 8/18/2023 | 0.00 | % |
| Aareon AG | TL Unsec DD 08/23 | 45,357 | 47,854 | | (1,295) | | 8/18/2023 | 0.00 | % |
| Affordable Care Inc | TL 1L 08/21 PIK | 1,583,764 | 1,568,045 | | 1,569,509 | | 8/2/2021 | 0.25 | % |
| Affordable Care Inc | TL 1L DD 08/21 | 284,754 | 284,198 | | 282,191 | | 8/2/2021 | 0.04 | % |
| Affordable Care Inc | TL 1L DD 08/23 | 313,609 | 84,421 | | 81,792 | | 7/7/2023 | 0.01 | % |
| Alera Group Intermediate Holdings Inc | TL 1L 09/21 | 650,259 | 643,757 | | 643,887 | | 9/30/2021 | 0.10 | % |
| Alera Group Intermediate Holdings Inc | TL 1L DD 09/21 | 184,794 | 183,953 | | 182,983 | | 9/30/2021 | 0.03 | % |
| Alera Group Intermediate Holdings Inc | TL 1L DD 12/21 | 534,429 | 533,910 | | 529,192 | | 12/16/2021 | 0.08 | % |
| American Vision Partners | TL 1L 09/21 | 1,890,704 | 1,871,797 | | 1,845,516 | | 9/30/2021 | 0.29 | % |
| American Vision Partners | TL 1L DD 09/21 | 780,806 | 777,679 | | 762,145 | | 9/30/2021 | 0.12 | % |
| Amerivet Partners Management Inc | TL 1L 02/22 | 2,218,703 | 2,183,714 | | 2,156,357 | | 2/25/2022 | 0.34 | % |
| Amerivet Partners Management Inc | TL 1L DD 02/22 | 877,718 | 872,376 | | (24,664) | | 2/25/2022 | 0.00 | % |
| Amerivet Partners Management Inc | TL 1L DD 11/22 | 694,453 | 694,453 | | 674,939 | | 9/29/2023 | 0.11 | % |
| Apex Service Partners LLC | TL 1L 10/23 | 298,351 | 294,622 | | 294,622 | | 10/24/2023 | 0.05 | % |
| Apex Service Partners LLC | TL 1L 10/23 PIK | 64,914 | 63,373 | | 63,376 | | 10/24/2023 | 0.01 | % |
| Apex Service Partners LLC | TL 1L DD 10/23 | 77,197 | 76,232 | | (965) | | 10/24/2023 | 0.00 | % |
| Apex Service Partners LLC | TL 1L DD 10/23 PIK | 32,458 | 31,687 | | (769) | | 10/24/2023 | 0.00 | % |
| Arcfield Acquisition Corp | TL 1L 03/22 | 976,766 | 966,998 | | 980,087 | | 3/10/2022 | 0.15 | % |
| BDO USA PA | TL 1L 08/23 | 146,901 | 144,034 | | 144,286 | | 8/31/2023 | 0.02 | % |
| Belk Inc | TL 1L 02/21 | 53,180 | 63,965 | | 45,895 | | 2/24/2021 | 0.01 | % |
| Belk Inc | TL 1L EXIT 02/21 PIK Toggle | 1,000,844 | 636,996 | | 191,827 | | 2/24/2021 | 0.03 | % |
| CFC Underwriting Ltd | TL 1L B 05/22 | 5,343,384 | 5,228,868 | | 5,396,818 | | 5/16/2022 | 0.85 | % |
| CFC Underwriting Ltd | TL 1L DD 05/22 | 630,571 | 766,962 | | 7,659 | | 5/16/2022 | 0.00 | % |
| Circana Group (f.k.a. NPD Group) | TL 1L 08/22 | 973,829 | 973,829 | | 983,567 | | 8/1/2022 | 0.15 | % |
| Civica Group Ltd | TL 1L 08/23 | 12,272 | 7,720 | | 7,545 | | 8/29/2023 | 0.00 | % |
| Civica Group Ltd | TL 1L 08/23 | 221,717 | 272,143 | | 261,262 | | 8/30/2023 | 0.04 | % |
| | | | | | | | |
| Credit Opportunities Portfolio | October 31, 2023 |
| |
| | | | | | | | | | | | | | | | | | | | |
Issuer(1) | Asset | Par/Shares | Cost | Fair Value | Acquisition
Date | % of Net Assets |
| | | | | | |
| Civica Group Ltd | TL 1L DD 08/23 | 94,171 | $ | 115,588 | | $ | (3,408) | | 8/30/2023 | 0.00 | % |
| Community Brands Inc | TL 1L 02/22 | 1,014,846 | 998,935 | | 995,056 | | 2/24/2022 | 0.16 | % |
| Community Brands Inc | TL 1L DD 02/22 | 121,212 | 119,331 | | (2,364) | | 2/24/2022 | 0.00 | % |
| Encora Digital LLC | TL 1L 12/21 PIK Toggle | 1,652,370 | 1,625,316 | | 1,649,065 | | 12/20/2021 | 0.26 | % |
| Encora Digital LLC | TL 1L 12/21 | 506,251 | 495,202 | | 482,052 | | 12/20/2021 | 0.08 | % |
| Encora Digital LLC | TL 1L DD 12/21 | 398,160 | 398,160 | | 397,364 | | 12/20/2021 | 0.06 | % |
| Envirotainer Ltd | TL 1L B1 07/22 | 4,739,642 | 4,741,152 | | 4,887,748 | | 7/29/2022 | 0.77 | % |
| Envirotainer Ltd | TL 1L B2 07/22 | 2,411,934 | 2,360,090 | | 2,352,118 | | 7/29/2022 | 0.37 | % |
| Envirotainer Ltd | TL 1L DD 07/22 | 865,234 | 864,832 | | (22,691) | | 7/29/2022 | 0.00 | % |
| Flint Group GmbH | TL 1L 03/23 Super Senior | 427,556 | 466,085 | | 458,911 | | 8/15/2023 | 0.07 | % |
| Flint Group GmbH | TL 1L 09/23 PIK | 339,123 | 348,635 | | 244,169 | | 9/19/2023 | 0.04 | % |
| Flint Group GmbH | TL 1L 09/23 PIK (HoldCo) EUR | 1,168,952 | 1,273,937 | | 882,292 | | 9/19/2023 | 0.14 | % |
| Flint Group GmbH | TL 1L B 09/23 | 695,471 | 652,153 | | 652,585 | | 9/19/2023 | 0.10 | % |
| Flint Group GmbH | TL 1L B 09/23 (OpCo) EUR | 2,408,567 | 2,413,508 | | 2,377,200 | | 9/19/2023 | 0.37 | % |
| Flint Group GmbH | TL 2L 09/23 PIK | 452,238 | 442,649 | | 81,780 | | 9/19/2023 | 0.01 | % |
| Flint Group GmbH | TL 2L 09/23 PIK (HoldCo) EUR | 1,558,860 | 1,819,424 | | 269,250 | | 9/19/2023 | 0.04 | % |
| Follett Software Co | TL 1L 08/21 | 1,522,529 | 1,507,304 | | 1,513,394 | | 8/31/2021 | 0.24 | % |
| Foresight Energy LLC | TL 1L A 06/20 | 120,754 | 120,754 | | 120,754 | | 6/30/2020 | 0.02 | % |
| Foundation Risk Partners Corp | TL 1L 03/22 | 827,526 | 816,860 | | 815,941 | | 4/14/2022 | 0.13 | % |
| Foundation Risk Partners Corp | TL 1L 10/21 | 1,322,284 | 1,302,449 | | 1,303,772 | | 10/29/2021 | 0.20 | % |
| Foundation Risk Partners Corp | TL 1L DD 03/22 | 3,340,374 | 2,400,153 | | 2,359,387 | | 4/14/2022 | 0.37 | % |
| Foundation Risk Partners Corp | TL 1L DD 10/21 | 287,584 | 285,146 | | 283,558 | | 10/29/2021 | 0.04 | % |
| Galway Partners Holdings LLC | TL 1L 09/21 | 2,885,988 | 2,850,441 | | 2,848,759 | | 9/30/2021 | 0.45 | % |
| Insight Global LLC | TL 1L 02/22 | 1,035,019 | 1,029,844 | | 1,023,841 | | 2/28/2022 | 0.16 | % |
| Insight Global LLC | TL 1L 09/21 | 5,346,863 | 5,288,229 | | 5,289,117 | | 9/22/2021 | 0.83 | % |
| Integrity Marketing Group LLC | TL 1L DD 08/23 | 2,908,787 | 2,908,788 | | 2,895,116 | | 12/3/2021 | 0.45 | % |
| Integrity Marketing Group LLC | TL 1L DD 08/23 | 5,534,103 | 5,532,563 | | 5,508,093 | | 6/21/2022 | 0.86 | % |
| IntraFi Network LLC | TL 2L 11/21 | 751,420 | 743,906 | | 721,363 | | 11/1/2021 | 0.11 | % |
| Laboratoires Vivacy SAS | TL 1L B 03/23 | 780,884 | 805,785 | | 804,212 | | 3/20/2023 | 0.13 | % |
| Laboratoires Vivacy SAS | TL 1L DD 03/23 | 62,974 | 64,982 | | (1,738) | | 3/20/2023 | 0.00 | % |
| Lazer Logistics Inc | TL 1L B 05/23 | 198,377 | 196,393 | | 196,393 | | 5/4/2023 | 0.03 | % |
| Lazer Logistics Inc | TL 1L DD 05/23 | 30,057 | 29,756 | | (301) | | 5/4/2023 | 0.00 | % |
| Level 3 Financing Inc | TL 1L 11/19 | 10,940,710 | 10,373,409 | | 10,246,248 | | 9/22/2023 | 1.60 | % |
| Magna Legal Services LLC | TL 1L 11/22 | 229,952 | 226,653 | | 231,309 | | 11/22/2022 | 0.04 | % |
| Magna Legal Services LLC | TL 1L DD 11/22 | 64,374 | 64,374 | | 61,548 | | 11/22/2022 | 0.01 | % |
| Med-Metrix | TL 1L 09/21 | 1,245,211 | 1,232,758 | | 1,245,211 | | 9/15/2021 | 0.20 | % |
| Med-Metrix | TL 1L DD 09/21 | 632,310 | 399,880 | | 400,421 | | 9/15/2021 | 0.06 | % |
| NEP Broadcasting LLC | TL 1L 05/20 | 149,239 | 146,707 | | 149,239 | | 5/29/2020 | 0.02 | % |
| NEP Broadcasting LLC | TL 1L B 09/18 | 4,482,478 | 4,374,458 | | 4,074,662 | | 9/3/2021 | 0.64 | % |
| NEP Broadcasting LLC | TL 2L 09/18 | 14,697,782 | 14,146,643 | | 11,545,108 | | 10/5/2018 | 1.81 | % |
| Novotech Pty Ltd | TL 1L B1 07/23 | 1,088,942 | 1,117,612 | | 1,080,993 | | 1/14/2022 | 0.17 | % |
| Novotech Pty Ltd | TL 1L B2 01/22 | 1,144,851 | 1,137,589 | | 1,136,494 | | 1/14/2022 | 0.18 | % |
| Novotech Pty Ltd | TL 1L DD 01/22 | 266,244 | 261,924 | | (1,944) | | 1/14/2022 | 0.00 | % |
| Opendoor Labs Inc | TL 2L DD 10/21 | 2,931,835 | 2,921,947 | | 2,832,152 | | 10/1/2021 | 0.44 | % |
| Oxford Global Resources LLC | TL 1L 06/22 | 6,561,057 | 6,449,715 | | 6,626,667 | | 6/17/2022 | 1.04 | % |
| Oxford Global Resources LLC | TL 1L 08/21 | 1,464,454 | 1,449,810 | | 1,479,099 | | 8/17/2021 | 0.23 | % |
| Oxford Global Resources LLC | TL 1L DD 08/21 | 256,737 | 122,193 | | 124,813 | | 8/17/2021 | 0.02 | % |
| Parts Town LLC | TL 1L 11/21 | 831,724 | 823,406 | | 823,157 | | 11/10/2021 | 0.13 | % |
| Parts Town LLC | TL 1L B 11/21 | 913,219 | 913,219 | | 903,813 | | 3/31/2022 | 0.14 | % |
| Parts Town LLC | TL 1L DD 11/21 | 1,274,864 | 1,262,116 | | 1,261,733 | | 11/10/2021 | 0.20 | % |
| PartsSource Inc | TL 1L 10/21 | 1,312,243 | 1,291,755 | | 1,298,595 | | 10/18/2021 | 0.20 | % |
| PartsSource Inc | TL 1L DD 08/21 | 464,562 | 96,140 | | 91,565 | | 10/18/2021 | 0.01 | % |
| Pretium Packaging LLC | TL 1L A 10/23 | 50,184 | 48,358 | | 48,332 | | 10/4/2023 | 0.01 | % |
| | | | | | | | |
| Credit Opportunities Portfolio | October 31, 2023 |
| |
| | | | | | | | | | | | | | | | | | | | |
Issuer(1) | Asset | Par/Shares | Cost | Fair Value | Acquisition
Date | % of Net Assets |
| | | | | | |
| Pretium Packaging LLC | TL 1L A1 10/23 | 60,575 | $ | 64,312 | | $ | 46,542 | | 9/22/2021 | 0.01 | % |
| Pretium Packaging LLC | TL 2L 09/21 | 810,470 | 802,365 | | 522,510 | | 9/22/2021 | 0.08 | % |
| Pretium Partners LLC P2 | TL 1L 12/21 | 3,270,612 | 3,188,055 | | 3,205,200 | | 12/16/2021 | 0.50 | % |
| Radwell International LLC/PA | TL 1L 04/22 | 24,115 | 24,115 | | 24,356 | | 8/16/2022 | 0.00 | % |
| Radwell International LLC/PA | TL 1L 12/22 | 901,911 | 901,910 | | 919,949 | | 12/1/2022 | 0.14 | % |
| SAMBA Safety Inc | TL 1L 09/21 | 565,564 | 560,954 | | 560,700 | | 9/1/2021 | 0.09 | % |
| SavATree LLC | TL 1L 10/21 | 990,104 | 984,128 | | 980,598 | | 10/12/2021 | 0.15 | % |
| Shaw Development LLC | TL 1L 10/23 | 148,613 | 147,127 | | 147,127 | | 10/30/2023 | 0.02 | % |
| Shaw Development LLC | TL 1L DD 10/23 | 17,692 | 17,515 | | (177) | | 10/30/2023 | 0.00 | % |
| SitusAMC Holdings Corp | TL 1L 12/21 | 2,078,245 | 2,057,463 | | 2,076,790 | | 12/22/2021 | 0.33 | % |
| Spotless Brands LLC | TL 1L 02/23 | 155,238 | 152,573 | | 155,579 | | 2/16/2023 | 0.02 | % |
| Spotless Brands LLC | TL 1L DD 02/23 | 234,626 | 231,414 | | 2,651 | | 2/16/2023 | 0.00 | % |
| SPX FLOW Inc | TL 1L B 03/22 | 3,140,864 | 3,086,171 | | 3,117,511 | | 1/24/2023 | 0.49 | % |
| Time Manufacturing Co | TL 1L 06/22 | 370,457 | 391,074 | | 368,204 | | 6/24/2022 | 0.06 | % |
| Time Manufacturing Co | TL 1L 12/21 | 916,772 | 901,211 | | 861,674 | | 12/1/2021 | 0.13 | % |
| Time Manufacturing Co | TL 1L 12/21 | 591,000 | 657,443 | | 587,407 | | 12/1/2021 | 0.09 | % |
| Total Safety US Inc | TL 1L B 07/19 | 6,129,043 | 6,111,681 | | 5,845,575 | | 8/13/2019 | 0.92 | % |
| Trescal SA | TL 1L B1 05/23 | 197,463 | 212,228 | | 203,571 | | 5/3/2023 | 0.03 | % |
| Trescal SA | TL 1L B2 04/23 | 215,855 | 209,687 | | 210,437 | | 4/28/2023 | 0.03 | % |
| Trescal SA | TL 1L DD 05/23 | 113,999 | 122,586 | | (3,026) | | 5/3/2023 | 0.00 | % |
| | | | | | |
| Revolver | | | | | | |
| 3Pillar Global Inc | Revolver 1L 11/21 | 186,240 | 20,394 | | 15,552 | | 11/23/2021 | 0.00 | % |
| 48Forty Solutions LLC | Revolver 1L 03/22 | 610,068 | 244,027 | | 219,869 | | 3/11/2022 | 0.03 | % |
| Affordable Care Inc | Revolver 1L 08/21 | 177,081 | 177,081 | | (1,594) | | 8/2/2021 | 0.00 | % |
| American Vision Partners | Revolver 1L 09/21 | 158,140 | 88,558 | | 84,779 | | 9/30/2021 | 0.01 | % |
| Amerivet Partners Management Inc | Revolver 1L 02/22 | 197,240 | 7,890 | | (1,598) | | 2/25/2022 | 0.00 | % |
| Apex Service Partners LLC | Revolver 1L 10/23 | 25,732 | 25,732 | | 858 | | 10/24/2023 | 0.00 | % |
| Arcfield Acquisition Corp | Revolver 1L 03/22 | 143,583 | 143,583 | | — | | 3/10/2022 | 0.00 | % |
| Circana Group (f.k.a. NPD Group) | Revolver 1L 08/22 | 51,095 | 2,248 | | 1,022 | | 8/1/2022 | 0.00 | % |
| Community Brands Inc | Revolver 1L 02/22 | 60,610 | 59,690 | | (1,182) | | 2/24/2022 | 0.00 | % |
| Follett Software Co | Revolver 1L 08/21 | 136,050 | 136,050 | | (816) | | 8/31/2021 | 0.00 | % |
| Foundation Risk Partners Corp | Revolver 1L 10/21 | 141,750 | 139,624 | | (1,984) | | 10/29/2021 | 0.00 | % |
| Galway Partners Holdings LLC | Revolver 1L 09/21 | 205,492 | 202,515 | | (2,651) | | 9/30/2021 | 0.00 | % |
| Insight Global LLC | Revolver 1L 09/21 | 427,591 | 427,591 | | (4,618) | | 9/22/2021 | 0.00 | % |
| Lazer Logistics Inc | Revolver 1L 05/23 | 24,046 | 3,206 | | 2,966 | | 5/4/2023 | 0.00 | % |
| Magna Legal Services LLC | Revolver 1L 11/22 | 26,940 | 26,940 | | — | | 11/22/2022 | 0.00 | % |
| Med-Metrix | Revolver 1L 09/21 | 158,828 | 158,828 | | — | | 9/15/2021 | 0.00 | % |
| Oxford Global Resources LLC | Revolver 1L 08/21 | 128,823 | 128,823 | | — | | 8/17/2021 | 0.00 | % |
| PartsSource Inc | Revolver 1L 10/21 | 87,104 | 13,550 | | 12,644 | | 10/18/2021 | 0.00 | % |
| Radwell International LLC/PA | Revolver 1L 04/22 | 68,154 | 2,726 | | 2,726 | | 12/1/2022 | 0.00 | % |
| SAMBA Safety Inc | Revolver 1L 09/21 | 41,810 | 20,905 | | 20,545 | | 9/1/2021 | 0.00 | % |
| SavATree LLC | Revolver 1L 10/21 | 128,932 | 127,478 | | (1,238) | | 10/12/2021 | 0.00 | % |
| Time Manufacturing Co | Revolver 1L 12/21 | 153,560 | 83,760 | | 74,531 | | 12/1/2021 | 0.01 | % |
| | | | | | |
| High Yield Securities | | | | | | |
| Level 3 Financing Inc | 3.750% 07/2029 | 48,000 | 28,827 | | 24,461 | | 3/14/2023 | 0.00 | % |
| SPX FLOW Inc | 8.750% 04/2030 | 13,032,000 | 11,818,993 | | 11,961,747 | | 4/5/2022 | 1.87 | % |
| Ultra Electronics Holdings Ltd | 7.25% 01/2030 | 2,162,000 | 2,104,998 | | 2,112,923 | | 8/4/2022 | 0.33 | % |
| Ultra Electronics Holdings Ltd | 9.0% PIK 01/2031 | 2,272,448 | 2,214,288 | | 2,166,325 | | 8/4/2022 | 0.34 | % |
| | | | | | | | |
| Credit Opportunities Portfolio | October 31, 2023 |
| |
| | | | | | | | | | | | | | | | | | | | |
Issuer(1) | Asset | Par/Shares | Cost | Fair Value | Acquisition
Date | % of Net Assets |
| | | | | | |
| | | | | | |
| Equity & Other Investments | | | | | | |
| Affordable Care Inc | 11.750% 12/2069 PIK Pref Equity | 677,000 | $ | 663,528 | | $ | 666,980 | | 8/2/2021 | 0.10 | % |
| Altitude II | Private Equity | 202,336 | 202,336 | | 209,461 | | 12/15/2022 | 0.03 | % |
| American Vision Partners | Private Equity | 53,939 | 54,546 | | 41,765 | | 9/30/2021 | 0.01 | % |
| Amerivet Partners Management Inc | 11.500% 12/2059 | 298 | 288,779 | | 276,799 | | 2/25/2022 | 0.04 | % |
| Foresight Energy LLC | Common Stock | 17,979 | 205,446 | | 367,435 | | 6/30/2020 | 0.06 | % |
| Magna Legal Services LLC | Common Stock | 618 | 61,808 | | 69,876 | | 11/22/2022 | 0.01 | % |
| Med-Metrix | Common Stock | 597 | 29,862 | | 72,915 | | 9/15/2021 | 0.01 | % |
| Med-Metrix | 8.000% 12/2050 PIK Pref Equity | 597 | 29,862 | | 29,862 | | 9/15/2021 | 0.00 | % |
| Pretium Partners LLC P2 | Private Equity | 1,635,306 | 1,602,600 | | 1,798,117 | | 12/16/2021 | 0.28 | % |
| Pure Gym Ltd | Private Equity | 1,416,469 | 1,924,969 | | 2,014,832 | | 1/28/2022 | 0.32 | % |
| SunPower Financial | Private Equity | 36,006 | 36,006 | | 36,580 | | 6/7/2023 | 0.01 | % |
| TDC LLP | 8.000% 06/2049 | 47,869 | 56,770 | | 56,104 | | 4/24/2023 | 0.01 | % |
| TDC LLP | Private Equity | 9,880 | 12,463 | | 12,000 | | 6/29/2023 | 0.00 | % |
| Ultra Electronics Holdings Ltd | Private Equity | 43,729 | 437 | | 66,639 | | 9/8/2022 | 0.01 | % |
| Ultra Electronics Holdings Ltd | Private Equity | 23,486,307 | 234,863 | | 356,992 | | 8/2/2022 | 0.06 | % |
| Yak Access LLC | Common Stock | 11,000 | — | | 880 | | 3/10/2023 | 0.00 | % |
| Yak Access LLC | Preferred Stock | 2,637,983 | 2,512,913 | | 197,849 | | 6/3/2021 | 0.03 | % |
| Total | | | $ | 170,970,718 | | $ | 157,202,928 | | | |
(1)Refer to the Schedule of Investments for more details on securities listed.
The following is a reconciliation of the investments in which significant unobservable inputs (Level 3) were used in determining fair value:
| | | | | | | | | | | | | | |
| Leveraged Loans | High Yield
Securities | Asset
Backed
Securities | Equity &
Other
Investments |
| | | | |
| Balances as of October 31, 2022 | $ | 141,534,917 | | $ | 7,154,492 | | $ | 38,455,143 | | $ | 30,420,341 | |
Transfer into Level 3(1) | 15,863,734 | | — | | — | | — | |
| Purchases | 21,530,341 | | 10,372,990 | | 24,807,112 | | 2,626,245 | |
| Sales and paydowns | (12,306,039) | | (2,164,553) | | (18,452,864) | | (2,338,456) | |
| Accretion of discounts | 257,112 | | 10,923 | | 197,244 | | — | |
| Net change in appreciation (depreciation) | 2,950,358 | | (4,002,608) | | 4,277,780 | | 3,858,600 | |
| Net realized gains | 152,114 | | 22,941 | | 725,045 | | 201,107 | |
| Balances as of October 31, 2023 | $ | 169,982,537 | | $ | 11,394,185 | | $ | 50,009,460 | | $ | 34,767,837 | |
| Net change in appreciation (depreciation) on investments held at October 31, 2023 | $ | 2,777,145 | | $ | (4,004,740) | | $ | 3,661,710 | | $ | 3,858,600 | |
(1) Transferred from Level 2 to Level 3 due to a lack of observable market data, resulting from a decrease in market activity for the securities.
| | | | | | | | |
| Credit Opportunities Portfolio | October 31, 2023 |
| |
The following table presents additional information about valuation techniques and inputs used for investments that are measured at fair value and categorized within Level 3 as of October 31, 2023:
| | | | | | | | | | | | | | |
| Financial Asset | Fair Value | Valuation Technique(1) | Unobservable Inputs(2) | Range (Weighted Average)(3) |
| | | | |
| Leveraged Loans | $ | 169,982,537 | | Market Comparables | LTM EBITDA | 8.3x |
| | | FWD EBITDA | 7.8x |
| | Yield Analysis | Yield | 8.0% - 21.2% (11.8%) |
| | | EBITDA Multiple | 2.5x - 29.0x (15.1x) |
| | | | |
| Asset Backed Securities | $ | 50,009,460 | | Yield Analysis | Yield | 0.8% - 9.2% (7.5%) |
| Discounted Cash Flows | Probability of default | 2% |
| | | Constant prepayment rate | 20% |
| | | | |
| Equity & Other Investments | $ | 34,767,837 | | Market Comparables | LTM EBITDA | 2.5x - 15.8x (12.1x) |
| | FWD EBITDA | 9.6x |
| | | Illiquidity Discount | 10.0% - 15.0% (11.0%) |
| | Discounted Cash Flows | WACC | 8.5% - 25.0% (10.4%) |
| | Yield Analysis | Yield | 9.8% - 16.6% (13.6%) |
| | | EBITDA Multiple | 10.5x - 18.8x (14.5x) |
| | | | |
| | | | |
High Yield
Securities | $ | 11,394,185 | | Market Comparables | FWD EBITDA | 10.0x |
| Yield Analysis | Yield | 8.5% - 20.0% (16.3%) |
| | | EBITDA Multiple | 10.5x - 15.3x (13.6x) |
(1)For the assets that have more than one valuation technique, the Fund may rely on the techniques individually or in aggregate based on a weight ascribed to each one ranging from 0.0%-100.0%. When determining the weighting ascribed to each valuation methodology, the Fund considers, among other factors, the availability of direct market comparables, the applicability of a discounted cash flow analysis and the expected hold period and manner of realization for the investment. These factors can result in different weightings among the investments and in certain instances, may result in up to a 100.0% weighting to a single methodology.
(2)The significant unobservable inputs used in the fair value measurement of the Fund’s assets and liabilities may include the last twelve months (“LTM”) EBITDA multiple, weighted average cost of capital, discount margin, probability of default, loss severity and constant prepayment rate. In determining certain of these inputs, management evaluates a variety of factors including economic, industry and market trends and developments, market valuations of comparable companies, and company specific developments including potential exit strategies and realization opportunities. Significant increases or decreases in any of these inputs in isolation could result in significantly lower or higher fair value measurement.
(3)Weighted average amounts are based on the estimated fair values.
6. Investment Transactions
The cost of investments purchased and the proceeds from the sale of investments, other than short-term investments, for the year ended October 31, 2023 were as follows:
| | | | | |
| Purchases | $ | 383,215,893 | |
| Sales | $ | 320,224,264 | |
There were no purchases or sales of U.S. Government securities.
7. Shareholder Transactions
As a fundamental policy, which may not be changed without shareholder approval, the Fund offers shareholders the opportunity to request the repurchase of their shares on a quarterly basis. The Fund is required to offer to repurchase no less than 10.0% of its outstanding shares with each repurchase offer and under normal market conditions, the Board expects to authorize a 10.0% offer (“Repurchase Offer”). The Fund may not offer to repurchase more than 25.0% of its outstanding shares during any offer. Quarterly repurchases will occur in the months of January, April, July and October.
| | | | | | | | |
| Credit Opportunities Portfolio | October 31, 2023 |
| |
The time and dates by which Repurchase Offers must be received in good order (“Repurchase Request Deadline”) are generally 4:00 p.m. Eastern time on the first Friday of the month in which the repurchase occurs. The repurchase price will be the Fund’s NAV determined on the repurchase pricing date, which will be a date not more than 14 calendar days following the Repurchase Request Deadline (“Repurchase Pricing Date”). Payment for all shares repurchased pursuant to these offers will be made no later than seven calendar days after the Repurchase Pricing Date (“Repurchase Payment Deadline”). Under normal circumstances, it is expected that the Repurchase Request Deadline will be the same date as the Repurchase Pricing Date. If the tendered shares have been purchased immediately prior to the tender, the Fund will not release repurchase proceeds until payment for the tendered shares has settled.
If more shares are tendered for repurchase than the Fund has offered to repurchase, the Board may, but is not obligated to, increase the number of shares to be repurchased by up to 2.0% of the shares outstanding on the Repurchase Request Deadline. If there are still more shares tendered than are offered for repurchase, shares will be repurchased on a pro rata basis.
During the year ended October 31, 2023, the Fund completed four quarterly repurchase offers. In these offers, the Fund offered to repurchase no less than 10.0% of the number of its outstanding shares as of the Repurchase Pricing Dates. The result of the repurchase offers were as follows:
| | | | | | | | | | | | | | | | | | | | |
Repurchase
Request Deadline | Percentage of Outstanding Share the Fund Offered to Repurchase(1) | Repurchase
Pricing Date | Pricing
Date NAV | Amount
Repurchased | Number of
Shares
Repurchased
(all classes) | Percentage of
Outstanding
Shares
Repurchased |
| | | | | | |
| 1/13/2023 | 10% | 1/13/2023 | $21.65 | $ | 15,390,950 | | 707,329 | 2.84% |
| 4/14/2023 | 10% | 4/14/2023 | $21.93 | $ | 10,013,464 | | 457,406 | 1.73% |
| 7/7/2023 | 10% | 7/7/2023 | $22.36 | $ | 22,563,392 | | 1,016,463 | 3.64% |
| 10/6/2023 | 10% | 10/6/2023 | $22.49 | $ | 16,814,770 | | 744,525 | 2.55% |
| | | | | | |
| | | | | | |
(1)If total repurchase request exceeds 10.0% of the Fund’s outstanding shares, the Fund may increase the number of shares that it is offering to repurchase by up to an additional 2.0% of its total outstanding shares.
| | | | | | | | |
| Credit Opportunities Portfolio | October 31, 2023 |
| |
Transactions to the Fund’s shares were as follows:
| | | | | | | | | | | | | | | | | | | | | | | |
| Year Ended October 31, 2023 | | Year Ended October 31, 2022 |
| Shares | | Amount | | Shares | | Amount |
| Shares Sold | | | | | | | |
| Class D | — | | | $ | — | | | 162,500 | | | $ | 4,000,075 | |
| Class I | 774,295 | | | 17,678,878 | | | 2,321,964 | | | 59,411,653 | |
| Class T | 94,977 | | | 2,158,512 | | | 377,021 | | | 9,855,214 | |
| Class U | 5,630,395 | | | 122,380,816 | | | 6,457,556 | | | 157,587,728 | |
| Reinvested Dividends | | | | | | | |
| Class D | — | | | — | | | 2,345 | | | 50,775 | |
| Class I | 423,009 | | | 9,555,533 | | | 408,896 | | | 10,140,563 | |
| Class T | 72,481 | | | 1,622,765 | | | 81,985 | | | 2,036,246 | |
| Class U | 863,295 | | | 18,648,984 | | | 731,912 | | | 17,353,008 | |
| Shares Redeemed | | | | | | | |
| Class D | (40,680) | | | (838,833) | | | — | | | — | |
| Class I | (1,027,053) | | | (23,326,641) | | | (418,074) | | | (9,652,142) | |
| Class T | (200,082) | | | (4,509,558) | | | (268,332) | | | (6,604,916) | |
| Class U | (1,657,908) | | | (36,107,544) | | | (2,581,698) | | | (58,940,745) | |
| Net Increase in Net Assets | 4,932,729 | | | $ | 107,262,912 | | | 7,276,075 | | | $ | 185,237,459 | |
8. Commitments and Contingencies
The Fund may enter into certain credit agreements, of which all or a portion may be unfunded. The Fund will maintain sufficient liquidity to fund these commitments at the borrower’s discretion. As of October 31, 2023, total unfunded commitments on these credit agreements were $12.6 million.
Under the Fund’s organizational documents, its officers and Trustees are indemnified against certain liabilities arising out of the performance of their duties to the Fund. In the normal course of business, the Fund enters into contracts that contain a variety of representations that provide general indemnifications. The Fund’s maximum liability exposure under these arrangements is unknown, as future claims that have not yet occurred may be made against the Fund. However, based on experience, management expects the risk of loss to be remote.
9. Federal Income Taxes
The timing and characterization of certain income, capital gains, and return of capital distributions are determined annually in accordance with federal tax regulations, which may differ from GAAP. As a result, the net investment income and net realized losses on investment transactions for a reporting period may differ significantly from distributions during such period. These book to tax differences may be temporary or permanent in nature.
As of October 31, 2023, the permanent differences reclassified (to)/from Accumulated Deficit and Paid-in Capital were not material to the Fund’s financial statements.
| | | | | | | | |
| Credit Opportunities Portfolio | October 31, 2023 |
| |
The tax character of distributions declared for the year ended October 31, 2023 and 2022 were as follows:
| | | | | | | | | | | |
| Ordinary
Income | Realized
Gains | Total |
| | | |
| October 31, 2023* | $ | 48,671,266 | | $ | — | | $ | 48,671,266 | |
| October 31, 2022 | 42,316,016 | | 774,038 | | 43,090,054 | |
*The final tax character of any distribution declared during 2023 will be determined in January 2024 and reported to shareholders on IRS Form 1099-Div in accordance with federal income tax regulations.
As of October 31, 2023, the components of accumulated distributable earnings on a tax basis for the Fund are as follows:
| | | | | | | | | | | | | | |
Undistributed
Ordinary
Income | Net
Unrealized
Depreciation | Undistributed
Long Term
Gains | Other
Temporary
Differences | Total
Accumulated
Losses |
| | | | |
| $4,573,631 | $(63,784,874) | $ | — | | $(33,533,443) | $(92,744,686) |
Net capital losses earned may be carried forward indefinitely and must retain the character of the original loss. As of October 31, 2023, the Fund had non-expiring capital loss carry-forwards of $28.6 million.
As of October 31, 2023, the total cost of securities for federal income tax purposes and the aggregate gross unrealized appreciation and depreciation for securities held by the Fund are as follows:
| | | | | | | | | | | |
Federal Tax
Cost | Aggregate
Gross
Unrealized
Appreciation | Aggregate
Gross
Unrealized
Depreciation | Net
Unrealized
Depreciation |
| | | |
| $882,761,854 | $11,467,659 | $(75,252,533) | $(63,784,874) |
10. Borrowings
Credit facility: On August 23, 2021, the Fund entered into a multi-currency credit facility agreement (the “JPM Credit Facility”) with JPMorgan Chase Bank, National Association to borrow $200.0 million, with options to increase the financing commitment up to $500.0 million. Borrowings accrued interest based on the Secured Overnight Financing Rate (“SOFR”), or at a base rate applicable to each currency’s borrowing, plus a spread of 1.60%, or 1.70%. The JPM Credit Facility was terminated on July 13, 2023.
On July 13, 2023, the Fund entered into a multi-currency credit facility agreement (the “BNP Credit Facility”) with BNP Paribas SA to borrow up to $300.0 million, with options to increase the commitment in $5.0 million increments. Borrowings accrue interest based on SOFR, or at a rate applicable to each currency’s borrowings, plus a spread of 1.95%. Commitment fees accrue daily at a rate of 0.35% or 0.65%, depending on the utilization levels. The BNP Credit Facility contains certain covenants that require the maintenance of ratios throughout the borrowing period. As of October 31, 2023, the Fund is in compliance with these covenants.The initial term of the BNP Credit Facility ends on July 13, 2025, with an option to extend the term. The fair value of the BNP Credit Facility approximates its carrying value due to variable interest rates that periodically reset to market rates. This fair value was determined using Level 2 inputs in the fair value hierarchy.
| | | | | | | | |
| Credit Opportunities Portfolio | October 31, 2023 |
| |
The components of interest expense, average interest rates (i.e., base interest rate in effect plus the spread) and average outstanding balances for the JPM Credit Facility and BNP Credit Facility for the year ended October 31, 2023 were as follows:
| | | | | |
| Stated interest expense | $ | 13,712,047 | |
| Unused commitment fees | 353,407 | |
| Amortization of deferred financing costs | 704,492 | |
| Total interest expense | $ | 14,769,946 | |
| Weighted average interest rate | 6.10 | % |
| Average borrowings | $ | 224,661,064 | |
Reverse Repurchase Agreements: On May 25, 2022, the Fund executed a Master Repurchase Agreement (“MRA”) with J.P. Morgan Securities LLC (“JPM”) as the counterparty to the agreement. In this reverse repurchase agreement, the Fund delivers a security in exchange for cash to JPM with a simultaneous agreement to repurchase the same or substantially the same security at an agreed upon price and date. The Fund is entitled to receive the principal and interest payments, if any, made on the security delivered to JPM during the term of the agreement.
Reverse repurchase agreements involve the risk that the market value of the securities retained in lieu of sale by the Fund may decline below the price of the securities the Fund has sold but is obligated to repurchase. In the event the buyer of securities under a reverse repurchase agreement files for bankruptcy or becomes insolvent, such buyer or its trustee or receiver may receive an extension of time to determine whether to enforce the Fund’s obligation to repurchase the securities, and the Fund’s use of the proceeds of the reverse repurchase agreement may effectively be restricted pending such decision. Also, the Fund would bear the risk of loss to the extent that the proceeds of the reverse repurchase agreement are less than the value of the securities subject to such agreements.
As of October 31, 2023, the Fund had no reverse repurchase agreements outstanding under the MRA.
11. Senior Securities Asset Coverage
The following table sets forth certain information regarding the Fund’s senior securities as of October 31, 2023 and the prior fiscal years. The Fund’s senior securities during this time period are comprised solely of outstanding indebtedness from its credit facility, which constitutes a “senior security” as defined in the 1940 Act. Pursuant to Rule 18f-4 under the 1940 Act, the Fund has elected to treat its reverse repurchase agreement as a derivative and, therefore, it does not qualify as a “senior security” for purposes of the 1940 Act.
| | | | | | | | |
| Period Ended | Amount
Outstanding | Asset Coverage Per $1,000(1) |
| October 31, 2023 | $ | 221,898,946 | | $ | 3,877 | |
| October 31, 2022 | 222,594,402 | | 3,266 | |
| October 31, 2021 | 148,684,939 | | 3,997 | |
| October 31, 2020 | 5,538,241 | | 23,142 | |
(1)Asset covered per $1,000 of debt is calculated by subtracting the Fund’s liabilities and indebtedness not representing senior securities from the Fund’s total assets, dividing the result by the aggregate amount of the Fund’s senior securities representing indebtedness then outstanding, and multiplying the result by 1,000.
12. Subsequent Events
On December 14, 2023, the Board approved the extension of the Expense Limitation Agreement to February 28, 2025.
| | | | | | | | |
| Credit Opportunities Portfolio | October 31, 2023 |
| |
| | | | | |
| Deloitte & Touche LLP 555 Mission Street Suite 1400 San Francisco, CA 94105 USA
Tel: +1 415 783 4000 www.deloitte.com |
REPORT OF INDEPENDENT REGISTERED PUBLIC ACCOUNTING FIRM
To the Shareholders and the Board of Trustees of KKR Credit Opportunities Portfolio
Opinion on the Financial Statements and Financial Highlights
We have audited the accompanying statement of assets and liabilities of KKR Credit Opportunities Portfolio (the “Fund”), including the schedule of investments, as of October 31, 2023, the related statements of operations and cash flows for the year then ended, the statements of changes in net assets for each of the two years in the period then ended, the financial highlights for each of the three years in the period then ended and for the period from February 28, 2020 (commencement of operations) to October 31, 2020, and the related notes (collectively referred to as the “financial statements”). In our opinion, the financial statements present fairly, in all material respects, the financial position and schedule of investments of the Fund as of October 31, 2023, the results of its operations and its cash flows for the year then ended, the changes in net assets in each of the two years in the period then ended, and financial highlights in each of the three years in the period then ended and in the period from February 28, 2020 (commencement of operations) to October 31, 2020, in conformity with accounting principles generally accepted in the United States of America.
Basis for Opinion
These financial statements are the responsibility of the Fund's management. Our responsibility is to express an opinion on the Fund's financial statements based on our audits. We are a public accounting firm registered with the Public Company Accounting Oversight Board (United States) (PCAOB) and are required to be independent with respect to the Fund in accordance with the U.S. federal securities laws and the applicable rules and regulations of the Securities and Exchange Commission and the PCAOB.
We conducted our audits in accordance with the standards of the PCAOB. Those standards require that we plan and perform the audit to obtain reasonable assurance about whether the financial statements are free of material misstatement, whether due to error or fraud. The Fund is not required to have, nor were we engaged to perform, an audit of its internal control over financial reporting. As part of our audits, we are required to obtain an understanding of internal control over financial reporting but not for the purpose of expressing an opinion on the effectiveness of the Fund's internal control over financial reporting. Accordingly, we express no such opinion.
Our audits included performing procedures to assess the risks of material misstatement of the financial statements and financial highlights, whether due to error or fraud, and performing procedures that respond to those risks. Such procedures included examining, on a test basis, evidence regarding the amounts and disclosures in the financial statements and financial highlights. Our audits also included evaluating the accounting principles used and significant estimates made by management, as well as evaluating the overall presentation of the financial statements and financial highlights. Our procedures included confirmation of securities owned as of October 31, 2023, by correspondence with the custodian, loan agents, and brokers; when replies were not received from brokers, we performed other auditing procedures. We believe that our audits provide a reasonable basis for our opinion.
December 20, 2023
We have served as the auditor of the Fund since 2019.
| | | | | | | | |
| Credit Opportunities Portfolio | October 31, 2023 |
| |
Trustees and Officers
| | | | | | | | | | | | | | | | | |
| Name, Age and Address | Position(s)
Held with
the Fund | Term of
Office and
Length of
Service | Principal Occupation(s)
During Past Five Years
and Other Relevant
Experience | Number of Portfolios in Fund Complex Overseen by Trustee(2) | Other Directorships Held by Trustee(3) |
| | | | | |
Interested Trustees(1) | | | | | |
| | | | | |
Eric Mogelof (48)
KKR Credit Advisors (US) LLC
555 California Street
50th Floor
San Francisco, CA 94104 | Trustee, Chair and President | Since December 2020 | Global head of KKR’s Client and Partner Group and Member of KKR (Since 2020); Head of U.S. Global Wealth Management (2017-2020) and Head of Asia Pacific (2014-2017), PIMCO. | 2 | None. |
| | | | | |
Independent Trustees(1) | | | | | |
| | | | | |
Tobin V. Levy (79)
KKR Credit Advisors (US) LLC
555 California Street
50th Floor
San Francisco, CA 94104 | Trustee | Since Inception | Executive Vice President & Chief Financial Officer, Local Initiatives Support Corporation (non-profit support and resources) (2011-2014). | 2 | None. |
| | | | | |
Jeffrey L. Zlot (51)
KKR Credit Advisors (US) LLC
555 California Street
50th Floor
San Francisco, CA 94104 | Trustee | Since Inception | Managing Director, Tiedemann Advisors (formerly, Tiedemann Wealth Management) (investment consultant and investment banking) (since 1997). | 2 | None. |
| | | | | |
Michael E. Cahill (72)
KKR Credit Advisors (US) LLC
555 California Street
50th Floor
San Francisco, CA 94104 | Trustee | Since Inception | Executive Vice President (2008-2013) and Managing Director and General Counsel (1991-2013), The TCW Group, Inc. and Trust Company of the West (financial services firm). | 2 | None. |
| | | | | |
Catherine Sidamon-Eristoff (59)
KKR Credit Advisors (US) LLC
555 California Street
50th Floor
San Francisco, CA | Trustee | Since Inception | Treasurer and Board Member, C-Change Conversations (non-profit organization) (Since 2017) Board Member, FlexPaths LLC (workplace strategy and consulting firm) (Since 2008) Managing Director, Constellation Wealth
Advisors (financial services firm) (2007-2015). | 4 | None. |
(1)“Independent Trustees” are those trustees who are not “interested persons” (as defined in Section 2(a)(19) of the 1940 Act) of the Fund, and “Interested Trustees” are those trustees who are interested persons of the Fund. Mr. Mogelof is an Interested Trustee because he is a Member of KKR, the parent company of the Adviser.
(2)The Fund Complex is comprised of the Fund, KKR Real Estate Select Trust, KKR Income Opportunities Fund, KKR Asset-Based Income Fund, and KKR US Direct Lending Fund-U.
| | | | | | | | |
| Credit Opportunities Portfolio | October 31, 2023 |
| |
(3)This column includes only directorships of companies required to report to the SEC under the Securities Exchange Act of 1934, as amended (the “Exchange Act”) (i.e., “public companies”) or other investment companies registered under the 1940 Act.
| | | | | | | | | | | |
| Name and Age | Position(s) Held
with Fund | Term of Office and
Length of Service | Principal Occupation(s) During
Past Five Years and Other
Relevant Experience |
| | | |
| Principal Officers who are not Trustees | | |
| | | |
| Thomas Murphy (56) | Treasurer, Chief Financial Officer and Chief Accounting Officer | Since Inception | Chief Financial Officer, KKR Financial Holdings LLC (since 2015); Director (Finance & Accounting), KKR Credit Advisors (US) LLC (since 2012); Chief Accounting Officer, KKR Financial Holdings LLC (since 2009); Managing Director, KKR Credit Advisors (US) LLC (since 2021). |
| | | |
| Michael Nguyen (41) | Chief Compliance Officer | Since June 2022 | Director, KKR Credit Advisors (US) LLC (2022-present), Principal, KKR Credit Advisors (US) LLC (2013-2022). |
| | | |
| Lori Hoffman (35) | Secretary and Vice President | Since June 2022 | Principal, KKR Credit Advisors (US) LLC (2020-present); Associate, Dechert LLP (2013-2020) |
| | | | | | | | |
| Credit Opportunities Portfolio | October 31, 2023 |
| |
Dividend Reinvestment Plan (Unaudited)
KKR Credit Opportunities Portfolio, a Delaware statutory trust (the “Fund”), hereby adopts the following Dividend Reinvestment Plan (the “Plan”) with respect to distributions declared by its board of trustees (the “Board”) on its shares of beneficial interest (the “Shares”):
1.Participation; Agent. The Fund’s Plan is available to shareholders of record of the Shares. U.S. Bancorp Fund Services, LLC (“Plan Administrator”) acting as agent for each participant in the Plan, will apply income dividends or capital gains or other distributions (each, a “Distribution” and collectively, “Distributions”), net of any applicable U.S. withholding tax, that become payable to such participant on Shares (including shares held in the participant’s name and shares accumulated under the Plan), to the purchase of additional whole and fractional Shares for such participant.
2.Eligibility and Election to Participate. Participation in the Plan is limited to registered owners of Shares. The Fund’s Board reserves the right to amend or terminate the Plan. Shareholders automatically participate in the Plan, unless and until an election is made to withdraw from the Plan on behalf of such participating shareholder. If participating in the Plan, a shareholder is required to include all of the Shares owned by such shareholder in the Plan.
3.Share Purchases. When the Fund declares a Distribution, the Plan Administrator, on the shareholder’s behalf, will receive additional authorized shares from the Fund either newly issued or repurchased from shareholders by the Fund and held as treasury stock. The number of shares to be received when Distributions are reinvested will be determined by dividing the amount of the Distribution by the Fund’s net asset value per share. There will be no sales load charged on Shares issued to a shareholder under the Plan. All shares purchased under the Plan will be held in the name of each participant. In the case of shareholders, such as banks, brokers or nominees, that hold shares for others who are beneficial owners participating under the Plan, the Plan Administrator will administer the Plan on the basis of the number of shares certified from time to time by the record shareholder as representing the total amount of shares registered in the shareholder’s name and held for the account of beneficial owners participating under the Plan.
4.Timing of Purchases. The Fund expects to issue Shares pursuant to the Plan, immediately following each Distribution payment date, and the Plan Administrator will make every reasonable effort to reinvest all Distributions on the day the Distribution is paid (except where necessary to comply with applicable securities laws) by the Fund. If, for any reason beyond the control of the Plan Administrator, reinvestment of the Distributions cannot be completed within 30 days after the applicable Distribution payment date, funds held by the Plan Administrator on behalf of a participant will be distributed to that participant.
5.Account Statements. The Plan Administrator will maintain all shareholder accounts and furnish written confirmations of all transactions in the accounts, including information needed by shareholders for personal and tax records. The Plan Administrator will hold shares in the account of the shareholders in non-certificated form in the name of the participant, and each shareholder’s proxy, if any, will include those shares purchased pursuant to the Plan. The Plan Administrator will confirm to each participant each acquisition made pursuant to the Plan as soon as practicable but not later than 10 business days after the date thereof. No less frequently than quarterly, the Plan Administrator will provide to each participant an account statement showing the Distribution, the number of shares purchased with the Distribution, and the year-to-date and cumulative Distributions paid.
6.Expenses. There will be no direct expenses to participants for the administration of the Plan. There is no direct service charge to participants with regard to purchases under the Plan; however, the Fund reserves the right to amend the Plan to include a service charge payable by the participants. All fees associated with the Plan will be paid by the Fund.
7.Taxation of Distributions. The reinvestment of Distributions does not relieve the participant of any taxes which may be payable on such Distributions.
8.Voting of Shares. Shares issued pursuant to the Plan will have the same voting rights as the Shares issued pursuant to the Fund’s public offering.
| | | | | | | | |
| Credit Opportunities Portfolio | October 31, 2023 |
| |
9.Absence of Liability. Neither the Fund nor the Plan Administrator shall have any responsibility or liability beyond the exercise of ordinary care for any action taken or omitted pursuant to the Plan, nor shall they have any duties, responsibilities or liabilities except such as expressly set forth herein. Neither the Fund nor the Plan Administrator shall be liable for any act done in good faith or for any good faith omission to act, including, without limitation, any claims of liability: (a) arising out of the failure to terminate a participant’s account prior to receipt of written notice of such participant’s death, or (b) with respect to prices at which shares are purchased or sold for the participant’s account and the terms on which such purchases and sales are made. NOTWITHSTANDING THE FOREGOING, LIABILITY UNDER THE U.S. FEDERAL SECURITIES LAWS CANNOT BE WAIVED.
10.Termination of Participation. A shareholder who does not wish to have Distributions automatically reinvested may terminate participation in the Plan at any time by written instructions to that effect to the Plan Administrator. Such written instructions must be received by the Plan Administrator three (3) days prior to the record date of the Distribution or the shareholder will receive such Distribution in Shares through the Plan.
11.Amendment, Supplement, Termination, and Suspension of Plan. This Plan may be amended, supplemented, or terminated by the Fund at any time in its sole and absolute discretion. The amendment or supplement shall be filed with the Securities and Exchange Commission as an exhibit to a subsequent appropriate filing made by the Fund and shall be deemed to be accepted by each participant unless, prior to its effective date thereof, the Plan Administrator receives written notice of termination of the participant’s account. Amendment may include an appointment by the Fund or the Plan Administrator, with the approval of the Fund, of a successor agent, in which event such successor shall have all of the rights and obligations of the Plan Administrator under this Plan. The Fund may suspend the Plan at any time without notice to the participants.
12.Governing Law. This Plan and the authorization form signed by the participant (which is deemed a part of this Plan) and the participant’s account shall be governed by and construed in accordance with the laws of the State of New York.
| | | | | | | | |
| Credit Opportunities Portfolio | October 31, 2023 |
| |
Additional Information
FEDERAL TAX INFORMATION
For the fiscal year ended October 31, 2023, certain dividends paid by the Fund may be subject to a maximum rate of 20.0%, as provided for by the Jobs and Growth Tax Relief Reconciliation Act of 2003. The percentage of dividends declared from ordinary income designated as qualified dividend income was 0.0%.
For corporate shareholders, the percent of ordinary income distributions qualifying for corporate dividends received deduction for the fiscal year ended October 31, 2023 was 0.0%.
The percentage of taxable ordinary income distributions that are designated as short-term capital gain distributions under Internal Revenue Section 871 (k)(2)(C) for fiscal year ended October 31, 2023 was 0.0%.
The percentage of taxable ordinary income distributions that are designated as interest related dividends under Internal Revenue Section 871 (k)(1)(C) for fiscal year ended October 31, 2023 was 85.3%.
Pursuant to Section 853 of the Internal Revenue Code, the Fund did not designate any amounts as foreign taxes paid for the fiscal year ended October 31, 2023. Foreign taxes paid for purposes of Section 853 may be less than actual foreign taxes paid for financial statement purposes.
| | | | | | | | |
| Credit Opportunities Portfolio | October 31, 2023 |
| |
Approval of Investment Advisory Agreement
Background
At a meeting of the Board of Trustees (the “Board”) of KKR Credit Opportunities Portfolio (the “Fund”) held on June 14, 2023 (the “Meeting”), the members of the Board, including the Trustees who are not “interested persons” of the Fund (the “Independent Trustees”), as defined in the Investment Company Act of 1940, as amended, considered and unanimously approved the continuance of the investment advisory agreement between KKR Credit Advisors (US) LLC (the “Adviser”) and the Fund (the “Investment Advisory Agreement”).
Prior to the Meeting, the Independent Trustees received a memorandum from their independent legal counsel concerning their duties and responsibilities in considering approval of the Investment Advisory Agreement. The Board had also received and considered materials it deemed reasonably necessary for its review of the Investment Advisory Agreement, including materials and reports prepared by the Adviser and a third-party service provider comparing fee, expense and performance information to that of a collection of registered closed-end funds operated as “interval funds” believed by the Adviser to have comparable investment objectives and strategies to the Fund (the “Peer Funds”) as well as the Fund’s Morningstar category.
The Independent Trustees discussed with management and separately with their independent legal counsel the materials provided by management prior to the Meeting.
In its consideration of the approval of the Investment Advisory Agreement, the Board considered various factors, including the following:
Nature, Extent and Quality of Services
In considering the nature, extent and quality of services provided by the Adviser, the Board members relied on their ongoing experience as Trustees of the Fund as well as on the materials provided at and prior to the Meeting. The Board reviewed and considered the nature and extent of the investment advisory services provided by the Adviser under the Investment Advisory Agreement, including portfolio management, investment research and overseeing portfolio transactions. It was further noted that the Adviser coordinates and oversees the provision of services provided to the Fund by other service providers.
The Board reviewed and considered the qualifications, background and experience of the investment team and other key personnel of the Adviser who provide advisory and non-advisory services to the Fund. The Board also considered the resources, operations and practices of the Adviser both generally and in managing the Fund’s portfolio. The Board noted the Adviser’s extensive experience in managing portfolios of loans and fixed income securities, knowledge of loan and fixed income markets, expertise in private credit transactions, and analytical and risk management capabilities. The Board determined that the nature, extent and quality of services provided by the Adviser to the Fund were appropriate and that the Fund should continue to benefit from the nature, extent and quality of these services as a result of the Adviser’s experience, personnel, operations and resources.
Performance, Fees and Expenses of the Fund
The Board considered the performance of the Fund for the one-year and three-year periods (as of December 31, 2022) under the management of the Adviser on an absolute basis and in comparison to that of the Peer Funds and the Fund’s Morningstar category. The Board also considered the Adviser’s rationale for including certain funds among the Peer Funds for purposes of comparison, as well as the reasons why the Adviser believes that the Fund’s Morningstar category provides an imprecise comparison. The Adviser also discussed with the Board the key contributors and detractors to the Fund’s performance during the period.
The Board then discussed with the Adviser the Fund’s fees and expenses relative to the Peer Funds, Morningstar category and other accounts advised by the Adviser. The Board noted that the Fund’s advisory fee is generally comparable to the fees charged by the Adviser or its affiliates to other clients for which it provides comparable services or uses overlapping portfolio management team members. The Board further noted that the Fund’s advisory fee was slightly higher than the median advisory fee of its Morningstar category. The Board also took into account the impact of leverage on the advisory fee paid by the Fund. In addition to the advisory fee, the Board also reviewed the Fund’s net expense ratio and observed that the Fund’s net expense ratio was higher than the median but within the
| | | | | | | | |
| Credit Opportunities Portfolio | October 31, 2023 |
| |
range of its Morningstar category. Following its review, in light of the extent and high quality of services that the Fund receives, the Board determined that the Fund’s performance under the management of the Adviser was satisfactory and that the Fund’s fees and expenses were reasonable.
Economies of Scale
The Board considered the size and growth prospects of the Fund and how it relates to the structure of the Fund’s advisory fee schedule, which does not include breakpoints. The Board concluded that the Fund’s advisory fee is appropriate in light of the projected size of the Fund and appropriately reflect the current economic and competitive environment for the Adviser. The Trustees also observed that they will have the opportunity to periodically re-examine whether the Fund has achieved economies of scale in the future as the Fund grows to determine if and how any such economies of scale could be shared with the Fund and its investors.
Profitability of the Adviser
The Board considered the profitability to the Adviser as a result of its relationship with the Fund. The Board had been provided information concerning costs incurred and profits realized by the Adviser under the Investment Advisory Agreement. The Adviser discussed with the Board its cost allocation methodology and the reasons why the Adviser believed it to be reasonable. The Board also examined the level of profits that could be expected to accrue to the Adviser from the fees payable under the Investment Advisory Agreement. After discussion and analysis, the Board concluded that the profitability was in no case such as to render the advisory fee excessive.
Other Benefits of the Relationship
The Board considered other benefits to the Adviser derived from its relationship with the Fund. Based on information provided by and discussions with the Adviser, the Board concluded that these benefits did not appear to be material at that time.
Resources of the Adviser and Relationship with the Fund
The Board considered the financial circumstances of the Adviser and whether the Adviser has the resources necessary to perform its obligations under the Investment Advisory Agreement. The Board also reviewed and considered the relationship between the Fund and the Adviser, including the policies and procedures formulated and adopted by the Adviser for managing the Fund’s operations and the Board’s confidence in the competence and integrity of senior managers and key personnel of the Adviser. The Board concluded that the Adviser has the financial resources necessary to fulfill its obligations under the Investment Advisory Agreement and that it is beneficial for the Fund to continue its relationship with the Adviser.
Other Factors
The Board considered the controls and procedures adopted and implemented by the Adviser and monitored by the Fund’s Chief Compliance Officer and concluded that the conduct of business by the Adviser demonstrates a good faith effort on its part to adhere to high ethical standards in the conduct of the Fund’s business.
General Conclusion
After considering and weighing all of the above factors, the Board concluded that the Fund’s advisory fee was reasonable in light of the services provided by the Adviser and it would be in the best interests of the Fund and its shareholders to approve the renewal of the Investment Advisory Agreement for another year. In reaching this conclusion the Board did not give particular weight to any single factor referenced above. The Board considered these factors during the Meeting and over the course of numerous meetings, some of which were in executive session with only the Independent Trustees and their independent legal counsel present. Individual Trustees may have ascribed different weights to these factors in their individual considerations in reaching their unanimous decision to approve the renewal of the Investment Advisory Agreement.
| | | | | | | | |
| Credit Opportunities Portfolio | October 31, 2023 |
| |
Privacy Notice
Protection and Security of Your Personal Information
Kohlberg Kravis Roberts & Co. L.P. (“KKR”) respects our investors’ right to privacy. All financial companies choose how they share personal information. Consumers have the right under U.S. federal law to limit some, but not all, sharing of personal information. U.S. federal law also requires us to inform you how we collect, share and protect your personal information. Investors may also have additional limiting rights under their respective State’s law. This notice is provided by KKR, its affiliates, and funds (“KKR”, “we”, or “us”). Please read this notice carefully to understand what we do, and call us at (212) 750-8300 if you have any questions.
The Personal Information We Collect and How We Collect It
We collect the following types of personal information about individuals who are our investors:
•Information we receive from investors in subscription agreements, questionnaires and in other forms, such as name, address, account information, social security number, the types and amounts of investments, statements of net worth, telephone number, and other contact information;
•Information we receive from investors, affiliates and other companies about investors’ transactions with us, our affiliates, or other financial institutions with which we have relationships; and
•Information we receive from third parties such as demographic information and information collected to comply with law and regulation.
When you are no longer an investor with us, we continue to share your information as described in this notice.
How and Why We Share Personal Information
This section lists reasons why financial companies can share their customers’ personal information. With respect to each reason, we explain whether KKR chooses to share for this reason and, if we do share, whether you can limit this sharing.
•For everyday business purposes: KKR shares personal information for everyday business purposes, such as to
•process your transactions;
•provide financial products or services to you;
•maintain your investment(s);
•secure business services, including printing, mailing, and processing or analyzing data;
•secure professional services, including accounting and legal services; or
•respond to court orders and legal investigations.
You cannot limit sharing by KKR for everyday business purposes.
•For our marketing purposes: KKR shares personal information for our marketing purposes so that we can offer products and services to you. You cannot limit sharing by KKR for this reason.
•For joint marketing with other financial companies: KKR does not share personal information for joint marketing with other financial companies.
•For use by affiliates in providing products and services to you: KKR shares personal information for our affiliates’ use in providing you with products and services that meet your financial services needs. You cannot limit sharing by KKR for this reason.
| | | | | | | | |
| Credit Opportunities Portfolio | October 31, 2023 |
| |
•For the everyday business purposes of affiliates: KKR does not share personal information, including information about your credit worthiness, with our affiliates for their everyday business purposes.
•For use by affiliates to market to you: KKR does not share personal information with affiliates so that they can market to you.
•For use by non-affiliates to market to you: KKR does not share personal information with non-affiliates so that they can market to you.
U.S. Federal law gives you the right to limit sharing of your personal information only for use (i) by affiliates everyday business purposes (information about your creditworthiness), (ii) by affiliates to market to you, and (iii) by non-affiliates to market to you. U.S. State laws and individual companies may give you additional rights to limit sharing.
How We Protect Your Personal Information
To protect your personal information from unauthorized access and use, we use security measures that comply with federal law. These measures include computer safeguards and secured files and buildings.
Definitions
Affiliates: Companies related by common ownership or control. They can be financial and nonfinancial companies. KKR does not share with our affiliates, except to provide you products and services that meet your financial needs.
Non-affiliates: Companies not related by common ownership or control. They can be financial and nonfinancial companies. KKR does not share with non-affiliates so they can market to you.
Joint Marketing: A formal agreement between nonaffiliated financial companies that together market financial products and services to you. KKR does not jointly market.
| | | | | | | | |
| Credit Opportunities Portfolio | October 31, 2023 |
| |
(b) Not applicable
Item 2. Code of Ethics.
(a) The registrant has adopted a code of ethics that applies to the registrant’s principal executive officer, principal financial officer and principal accounting officer (the “Code of Ethics”).
(b) Not applicable.
(c) During the period covered by this report, no amendments were made to the provisions of the Code of Ethics.
(d) During the period covered by this report, the registrant did not grant any waivers, including an implicit waiver, from any provision of the Code of Ethics.
(e) Not applicable.
(f) A copy of the Code of Ethics is available as provided in Item 13(a)(1) of this report.
Item 3. Audit Committee Financial Expert.
(a)(1) The registrant’s board of trustees has determined that there is at least one audit committee financial expert serving on its audit committee.
(a)(2) Tobin V. Levy is the “audit committee financial expert” and is considered to be “independent” as each term is defined in Item 3 of Form N-CSR.
Item 4. Principal Accountant Fees and Services.
Deloitte & Touche LLP billed the Fund aggregate fees for services rendered to the Fund for the fiscal year as follows:
| | | | | | | | |
| 10/31/2023 | 10/31/2022 |
| (a)Audit Fees | 300,000 | 250,000 |
| (b)Audit-Related Fees | 25,000 | 25,000 |
| (c)Tax Fees | 11,610 | 10,410 |
| (d)All Other Fees | N/A | N/A |
(e)(1) The Audit Committee pre-approves, to the extent required by applicable regulations (including paragraph (c)(7) of Rule 2-01 of Regulation S-X), (i) all audit and permitted non-audit services rendered by the independent accountants to the registrant and (ii) all non-audit services rendered by the independent accountants to the registrant’s investment adviser and to certain affiliates of the investment adviser.
(e)(2) The percentage of fees billed by Deloitte & Touche LLP applicable to non-audit services pursuant to waiver of pre-approval requirement were as follows:
| | | | | | | | |
| 10/31/2023 | 10/31/2022 |
| Audit-Related Fees | —% | —% |
| Tax Fees | —% | —% |
| All Other Fees | N/A | N/A |
(f) Not applicable.
(g) The aggregate non-audit fees and services billed by Deloitte & Touche LLP for the fiscal periods were $11,610 and $10,410.
| | | | | | | | |
| Credit Opportunities Portfolio | October 31, 2023 |
| |
(h) Not applicable.
(i) Not applicable.
(j) Not applicable.
Item 5. Audit Committee of Listed Registrants.
(a) Not applicable to registrants who are not listed issuers (as defined in Rule 10A-3 under the Securities Exchange Act of 1934).
Item 6. Investments.
(a) Schedule of Investments is included as part of the report to shareholders filed under Item 1 of this Form.
(b) Not applicable.
Item 7. Disclosure of Proxy Voting Policies and Procedures for Closed-End Management Investment Companies.
The registrant’s proxy voting and corporate actions policy and procedures are as follows:
PROXY VOTING POLICY AND PROCEDURES
A.General
KKR Credit Advisors (US) LLC (the “Adviser”) provides investment advisory services to its Client, and invests the assets of these Clients in securities issued by public and private issuers. The Adviser has authority to vote proxies relating to such securities on behalf of its Clients. The Securities and Exchange Commission (the “SEC”) has adopted Rule 206(4)-6 under the Investment Advisers Act of 1940, as amended (the “Advisers Act”). Under this rule, registered investment advisers that exercise voting authority over securities held in client portfolios are required to implement proxy voting policies and describe those policies to their clients.
This policy is designed to ensure that all proxies are voted in the best interest of the Adviser’s Clients, to provide disclosure of the Adviser’s proxy voting records and to ensure that certain documentation is retained.
B. Proxy Voting Procedures
To assist it in its proxy-voting responsibilities, the Adviser currently subscribes to proxy-related services offered by Institutional Shareholder Services, Inc. (“ISS”). ISS provides the Adviser with its independent analysis and recommendation with respect to generally all proxy proposals that the Adviser votes on behalf of its clients, with respect to both U.S. and non-U.S. securities of publicly traded companies.
The Adviser will have the responsibility of voting proxies that it receives on behalf of its Clients. The Adviser has engaged ISS to assist with its proxy voting, however, the Adviser retains ultimate voting discretion with respect to its Clients. The Adviser may depart from an ISS recommendation in order to avoid voting decisions believed to be contrary to the best interests of its Clients. In each instance where the Adviser votes contrary to the ISS recommendation, The Adviser’s Legal/Compliance, in conjunction with the Adviser’s investment analyst who provides coverage for the relevant issuer, will document the basis for its contrary voting decision.
In addition, the Adviser may choose not to vote proxies in certain situations, such as where the Adviser has deemed the cost of voting would exceed any anticipated benefit to the Adviser’s Clients or where a proxy is received by the Adviser for a security it no longer manages on behalf of its Clients. The Adviser’s Legal/Compliance, in conjunction with the Adviser’s investment analyst who provides coverage for the relevant issuer, will document the basis for the Adviser’s decision not to vote.
C. Conflicts of Interest
| | | | | | | | |
| Credit Opportunities Portfolio | October 31, 2023 |
| |
The Adviser may occasionally be subject to conflicts of interest in the voting of proxies due to business or personal relationships it maintains with persons having an interest in the outcome of certain votes. The Adviser, its affiliates and/or its employees may also occasionally have business or personal relationships with the proponents of proxy proposals, participants in proxy contests, corporate directors and officers or candidates for directorships.
If at any time, the Adviser becomes aware of an existing or potential conflict of interest relating to a particular proxy proposal, the Adviser’s Conflicts Committee (“Conflicts Committee”), or its designee, must be notified. Provided the Conflicts Committee has determined that a conflict or potential for a conflict exists, the proxy must be voted in alignment with the recommendation set forth by ISS. Appropriate documentation will be maintained by the Conflicts Committee.
D. Proxy Voting Records
In accordance with Rule 204-2 under the Advisers Act, the Adviser will maintain the following records in connection with the Adviser’s proxy voting policies and procedures:
•a copy of the proxy voting policies and procedures;
•a copy of all proxy statements received regarding securities of its Clients;
•a record of each vote the Adviser casts on behalf of Firm Clients;
•records of the Adviser’s Client requests for proxy voting information, including a copy of each written request for information on how the Adviser voted proxies on behalf of the Client, and a copy of any written response by the Adviser to any Client request for information on how the Adviser voted proxies on its behalf; and
•any documentation prepared by the Adviser that was material to making a decision on how to vote, or that memorialized the basis for the voting decision.
The foregoing records will be maintained and preserved in accordance with the Adviser’s Maintenance of Books and Records Policy.
Item 8. Portfolio Managers of Closed-End Management Investment Companies.
(a)(1) Investment Team
The Fund is positioned, under the management of the Adviser, to take advantage of the full resources of KKR & Co. Inc.’s (together with its affiliates, “KKR”) global network. With more than 2,500 employees in its business, including more than 750 dedicated investment professionals, located in San Francisco, New York, Orlando, London, Dublin, Madrid, Hong Kong, Mumbai, Singapore and Sydney, the Adviser’s investment teams seek to leverage KKR’s private equity experience and extensive industry relationships in making strong investment choices on behalf of its clients. The investment professional of the Adviser, who has primary responsibility for day-to-day management and oversight of the Fund is Christopher A. Sheldon, Jeremiah S. Lane and Daniel Pietrzak. Additionally, the US Leveraged Credit Investment Committee that exercises oversight over, and provides insight to, the investment activities of the Fund is comprised of:
Christopher A. Sheldon joined KKR in 2004, and is a Member of KKR. Mr. Sheldon serves as the Head of Leveraged Credit. Mr. Sheldon is a Portfolio Manager for the Adviser’s Leveraged Credit and Private Credit funds and portfolios. Mr. Sheldon is a member of the Adviser’s US Leveraged Credit Investment Committee, Global Private Credit Investment Committee and the Adviser’s Portfolio Management Committee. Prior to joining KKR, Mr. Sheldon was a vice president and senior investment analyst with Wells Fargo’s high yield securities group. Previously, Mr. Sheldon worked at Young & Rubicam Advertising and SFM Media Corporation in their media-planning departments. Mr. Sheldon holds a B.A. from Denison University.
Jeremiah S. Lane joined KKR in 2005, and is a Member of KKR. Mr. Lane is a Portfolio Manager for the Adviser’s Leveraged Credit funds and portfolios. Mr. Lane is a member of the Adviser’s US Leveraged Investment Committee, as well as a member of the Adviser’s Portfolio Management Committee. Prior to joining KKR, Mr. Lane worked as an associate in the investment banking/technology, media and telecom group at J.P. Morgan Chase. Mr. Lane holds an A.B. with honors in History from Harvard University.
Daniel Pietrzak joined KKR in 2016 and is a Member of KKR. Mr. Pietrzak is a portfolio manager for KKR’s private credit funds and portfolios and a member of the Global Private Credit Investment Committee, Europe Direct Lending Investment Committee and KKR Credit Portfolio Management Committee. Mr. Pietrzak is Chief Investment Officer of
| | | | | | | | |
| Credit Opportunities Portfolio | October 31, 2023 |
| |
the KKR / FS Investments joint venture and of the business development companies managed by the joint venture, including FS KKR Capital Corp., which trades on the NYSE. Prior to joining KKR, Mr. Pietrzak was a managing director and the co-head of Deutsche Bank’s structured finance business across the Americas and Europe. Previously, Mr. Pietrzak held various roles in the credit businesses of Societe Generale and CIBC World Markets. Mr. Pietrzak started his career at Price Waterhouse in New York and is a CPA. Mr. Pietrzak holds an M.B.A. in Finance from The Wharton School of the University of Pennsylvania and a B.S. in Accounting from Lehigh University.
(a)(2) Other Accounts Managed by the Portfolio Managers
The portfolio manager primarily responsible for the day-to-day management of the Fund also manages other registered investment companies, other pooled investment vehicles and other accounts, as indicated below. The following table identifies, as of October 31, 2023: (i) the number of registered investment companies, pooled investment vehicles and other accounts managed by the portfolio manager; and (ii) the total assets under management (“AUM”) of such companies, vehicles and accounts, and the number and total AUM of such companies, vehicles and accounts with respect to which the advisory fee is based on performance.
| | | | | | | | | | | | | | |
| Christopher A. Sheldon | Number of Accounts | Assets of Accounts (in millions) | Number of Accounts Subject to a Performance Fee | Assets Subject to a Performance Fee (in millions) |
| Registered Investment Companies | 1 | $ | 548 | | — | $ | — | |
| Pooled Investment Vehicles Other Than Registered Investment Companies | 13 | $ | 11,975 | | 6 | $ | 5,540 | |
| Other Accounts | 13 | $ | 4,365 | | 9 | $ | 2,669 | |
| | | | | | | | | | | | | | |
| Jeremiah S. Lane | Number of Accounts | Assets of Accounts (in millions) | Number of Accounts Subject to a Performance Fee | Assets Subject to a Performance Fee (in millions) |
| Registered Investment Companies | 1 | $ | 548 | | — | $ | — | |
| Pooled Investment Vehicles Other Than Registered Investment Companies | 8 | $ | 82,201 | | 1 | $ | 15,400 | |
| Other Accounts | 60 | $ | 23,661 | | 2 | $ | 378 | |
| | | | | | | | | | | | | | |
| Daniel Pietrzak | Number of Accounts | Assets of Accounts (in millions) | Number of Accounts Subject to a Performance Fee | Assets Subject to a Performance Fee (in millions) |
| Registered Investment Companies | 1 | $ | 419 | | — | $ | — | |
| Pooled Investment Vehicles Other Than Registered Investment Companies | 13 | $ | 68,915 | | 12 | $ | 19,977 | |
| Other Accounts | 16 | $ | 5,985 | | 11 | $ | 2,643 | |
(a)(2)(iv) Conflicts Of Interest
The Adviser will experience conflicts of interest in connection with the management of the Fund, including, but not limited to, those discussed below. Dealing with conflicts of interest is complex and difficult, and new and different types of conflicts may subsequently arise.
| | | | | | | | |
| Credit Opportunities Portfolio | October 31, 2023 |
| |
The members, officers and other personnel of the Adviser allocate their time, resources and other services between the Fund and other investment and business activities in which they are involved, including other funds, investment vehicles and accounts managed by KKR. The Adviser intends to devote such time as shall be necessary to conduct the Fund’s business affairs in an appropriate manner. However, the Adviser will continue to devote the time, resources and other services necessary to managing its other investment and business activities, and the Adviser is not precluded from conducting activities unrelated to the Fund. Substantial time will be spent by such members, officers and personnel monitoring the investments of other funds, investment vehicles and accounts managed by KKR.
The Adviser will, at times, compete with certain of its affiliates, including other entities it manages, for investments for the Fund, subjecting the Adviser to certain conflicts of interest in evaluating the suitability of investment opportunities and making or recommending acquisitions on the Fund’s behalf. The Adviser will receive advisory and other fees from the other entities it manages, and due to fee-offset provisions contained in the management agreements for such entities, the fees, at times, will not be proportionate to such entities’ investment accounts for any given transaction and the Adviser may have an incentive to favor entities from which it receives higher fees.
The Fund has adopted the Adviser’s allocation policy, which is designed to fairly and equitably distribute investment opportunities over time among funds or pools of capital managed by the Adviser, which may include proprietary accounts, including investment or co-investment vehicles established for personnel of KKR or its affiliates. The Adviser’s allocation policy provides that once an investment has been approved and is deemed to be in the Fund’s best interest, the Fund will receive a pro rata share of the investment based on capital available for investment in the asset class being allocated. Determinations as to the amount of capital available for investment are based on such factors as: the amount of cash on-hand, existing commitments and reserves, the targeted leverage level, the targeted asset mix and diversification requirements, other investment policies and restrictions, and limitations imposed by applicable laws, rules, regulations or interpretations. The outcome of this determination will result in the allocation of all, some or none of an investment opportunity to the Fund. In addition, subject to applicable law, affiliates of the Adviser will, from time to time, invest in one of the Fund’s portfolio companies and hold a different class of securities than the Fund. To the extent that an affiliate of the Adviser holds a different class of securities than the Fund, its interests might not be aligned with the Fund’s. Notwithstanding the foregoing, the Adviser will act in the best interest of the Fund in accordance with its fiduciary duty to the Fund.
The appropriate allocation among the Fund and other KKR funds and accounts of expenses and fees generated in the course of evaluating and making investments often will not be clear, especially where more than one KKR fund or account participates. The Adviser will determine, in its sole discretion, the appropriate allocation of investment-related expenses, including broken deal expenses incurred in respect of unconsummated investments and expenses more generally relating to a particular investment strategy, among the funds and accounts participating or that would have participated in such investments or that otherwise participate in the relevant investment strategy, as applicable, which could result in the Fund bearing more or less of these expenses than other participants or potential participants in the relevant investments.
The compensation payable by the Fund to the Adviser will be approved by the Board consistent with the exercise of the requisite standard of care applicable to trustees under state law. Such compensation is payable, in most cases, regardless of the quality of the assets acquired, the services provided to the Fund or whether the Fund makes distributions to Shareholders.
The Adviser and its affiliates will, at times, provide a broad range of financial services to companies in which the Fund invests, in compliance with applicable law, and will generally be paid fees for such services. In addition, affiliates of the Adviser could act as an underwriter or placement agent in connection with an offering of securities by one of the companies in the Fund’s portfolio. Any compensation received by the Adviser and its affiliates for providing these services will not be shared with the Fund and could be received before the Fund realizes a return on its investment. The Adviser will face conflicts of interest with respect to services performed for these companies, on the one hand, and investments recommended to the Fund, on the other hand.
KKR engages in a broad range of business activities and invests in portfolio companies and other issuers whose operations could be substantially similar to the issuers of the Fund’s portfolio investments. The performance and operation of such competing businesses could conflict with and adversely affect the performance and operation of the
| | | | | | | | |
| Credit Opportunities Portfolio | October 31, 2023 |
| |
issuers of the Fund’s portfolio investments and could adversely affect the prices and availability of business opportunities or transactions available to these issuers.
From time to time, to the extent consistent with the 1940 Act and the rules and regulations promulgated thereunder, or with exemptive relief the Fund receives from the SEC, if any, the Fund and other clients for which the Adviser provides investment management services or carries on investment activities (including, among others, clients that are employee benefit plans subject to ERISA and related regulations) will make investments at different levels of an investment entity’s capital structure or otherwise in different classes of an issuer’s securities. These investments inherently give rise to conflicts of interest or perceived conflicts of interest between or among the various classes of securities held by the Fund and such other clients, including in the case of financial distress of the investment entity.
KKR and the Adviser sponsor and advise, and expect in the future to sponsor and advise, a broad range of investment funds, vehicles, and other accounts, including proprietary vehicles, that make investments worldwide. KKR will, from time to time, also make investments for its own account, including, for example, through investment and co-investment vehicles established for KKR personnel and associates. The Adviser and its affiliates are not restricted from forming additional investment funds, from entering into other investment advisory relationships (including, among others, relationships with clients that are employee benefit plans subject to ERISA and related regulations) or from engaging in other business activities, even to the extent such activities are in competition with the Fund and/or involve substantial time and resources of the Adviser. For example, the Adviser could invest, on behalf of an affiliated fund, in a company that is a competitor of one of the Fund’s portfolio companies or that is a service provider, supplier, customer or other counterparty with respect to one of the Fund’s portfolio companies or the Adviser could, on behalf of other entities it manages, acquire assets originated by, or provide financing to, portfolio companies and other issuers in which the Fund invests. In providing advice and recommendations to, or with respect to, such investments and in dealing in such investments on behalf of such other affiliated fund, to the extent permitted by law, the Adviser or its affiliates will not take into consideration the interests of the Fund and its portfolio investments and issuers thereof. Accordingly, such advice, recommendations and dealings will result in conflicts of interest for the Adviser. In addition, the Adviser’s ability to effectively implement the Fund’s investment strategies will be limited to the extent that contractual obligations relating to these permitted activities restrict the Adviser’s ability to engage in transactions that it would otherwise be interested in pursuing. Affiliates of the Adviser, whose primary business includes the origination of investments, engage in investment advisory business with accounts that compete with the Fund.
The Adviser and its affiliates will, from time to time, give advice and recommend securities to other clients that differs from, or is contrary to, advice given to or securities recommended or bought for the Fund even though their investment objectives are similar to the Fund’s.
To the extent not restricted by confidentiality requirements or applicable law, the Adviser will, from time to time, apply experience and information gained in providing services to the Fund’s portfolio companies in providing services to competing companies invested in by affiliates’ other clients, which could have adverse consequences for the Fund or its portfolio investments. In addition, in providing services in respect of such portfolio companies and other issuers of portfolio investments, the Adviser or its affiliates will, from time to time, come into possession of information that it is prohibited from acting on (including on behalf of the Fund) or disclosing as a result of applicable confidentiality requirements or applicable law, even though such action or disclosure would be in the interests of the Fund.
As a registered investment company, the Fund is limited in its ability to make investments in issuers in which the Adviser or its affiliates’ other clients have an investment. The Fund is limited in its ability to co-invest with the Adviser or one or more of its affiliates without an exemptive order from the SEC. On January 5, 2022, the SEC issued an exemptive order granting exemptive relief that expanded the Fund’s ability to co-invest with certain of its affiliates in privately negotiated transactions subject to restrictive conditions specified in the exemptive order intended to mitigate certain conflicts of interest.
On February 1, 2021, KKR acquired control of Global Atlantic Financial Group Limited (“Global Atlantic”), a retirement and life insurance company. KKR, including the Adviser, will serve as Global Atlantic’s investment manager. KKR, including the Adviser, generally expects to treat any Global Atlantic account as a client account for the purposes of allocating investment opportunities and related fees and expenses. Certain Global Atlantic accounts may co-invest alongside the Fund in some or all investments in the Fund’s Private Credit Strategy. Due to the limited nature of many Private Credit investment opportunities, the Adviser expects that participation by Global Atlantic accounts in co-
| | | | | | | | |
| Credit Opportunities Portfolio | October 31, 2023 |
| |
investment transactions will generally reduce the allocations otherwise available to other co-investing accounts, including the Fund. The establishment of Global Atlantic accounts investing directly in the Private Credit Strategy investments will create a conflict of interest in that KKR will be incentivized to allocate more attractive investments and scarce investment opportunities to these proprietary entities and accounts rather than to the Fund. To mitigate this conflict, KKR will allocate investment opportunities in a manner that is consistent with an allocation methodology established by KKR and its affiliates (including the Adviser), as described above, in a manner designed to ensure allocations of such opportunities are made on a fair and equitable basis over time.
The Fund depends to a significant extent on the Adviser’s access to the investment professionals and senior management of KKR and the information and deal flow generated by the KKR investment professionals and senior management during the normal course of their investment and portfolio management activities. The senior management and the investment professionals of the Adviser source, evaluate, analyze and monitor the Fund’s investments. The Fund’s future success will depend on the continued service of the senior management team and investment professionals of the Adviser.
The Adviser’s relationship with other advisory clients and with KKR could create a conflict of interest to the extent the Adviser becomes aware of inside information concerning investments or potential investment targets. KKR has adopted information-sharing policies and procedures which address both (i) the handling of confidential information and (ii) the information barrier that exists between the public and private sides of KKR. KKR has compliance functions to administer KKR’s information-sharing policies and procedures and monitor potential conflicts of interest. The Fund cannot assure its investors, however, that these procedures and practices will be effective. Although the Fund plans to leverage KKR’s firm-wide resources to help source, conduct due diligence on, structure, syndicate and create value for the Fund’s investments (to the extent permitted by applicable law), KKR’s information-sharing policies and procedures referenced above, as well as certain legal, contractual and tax constraints, could significantly limit the KKR’s ability to do so. For example, from time to time KKR’s personnel will be in possession of material non-public information with respect to the Fund’s investments or potential investments, and as a result, such professionals will be restricted by KKR’s information-sharing policies or by law or contract, from sharing such information with the KKR professionals responsible for making the Fund’s investment decisions, even where the disclosure of such information would be in the best interest of the Fund or would otherwise influence the decisions taken by such investment professionals with respect to such investment or potential investment. In addition, this conflict and these procedures and practices could limit the freedom of the Adviser to enter into or exit from potentially profitable investments for the Fund which could have an adverse effect on the Fund’s results of operations. Conversely, the Adviser could pursue investments for the Fund without obtaining access to confidential information otherwise in its or KKR’s possession, which information, if reviewed, might otherwise impact the Adviser’s judgment with respect to such investments. Accordingly, as a result of such restrictions, the investment activities of KKR’s other businesses will differ from, or be inconsistent with, the interests of and activities that are undertaken for the Fund and there can be no assurance that the Fund will be able to fully leverage all of the available resources and industry expertise of KKR’s other businesses. Additionally, there will be circumstances in which one or more individuals associated with the Adviser will be precluded from providing services to the Fund because of certain confidential information available to those individuals or to other parts of KKR.
The nature of the Adviser’s businesses and the participation by its employees in creditors’ committees steering committees, or boards of directors of portfolio companies will, from time to time, result in the Adviser receiving material non-public information from time to time with respect to publicly held companies or otherwise becoming an “insider” with respect to such companies. With limited exceptions, KKR does not establish information barriers between its internal investment teams. Trading by KKR on the basis of such information, or improperly disclosing such information, could be restricted pursuant to applicable law and/or internal policies and procedures adopted by KKR to promote compliance with applicable law. Accordingly, the possession of “inside information” or “insider” status with respect to such an issuer by KKR or KKR personnel could, including where an appropriate information barrier does not exist between the relevant investment professionals or has been “crossed” by such professionals, significantly restrict the ability of the Adviser to deal in the securities of that issuer on behalf of the Fund, which could adversely impact the Fund, including by preventing the execution of an otherwise advisable purchase or sale transaction in a particular security until such information ceases to be regarded as material non-public information, which could have an adverse effect on the overall performance of such investment. In addition, affiliates of KKR in possession of such information could be prevented from disclosing such information to the Adviser, even where the disclosure of such information would be in the interests of the Fund. From time to time, the Adviser will also be subject to contractual “stand-still” obligations and/or confidentiality obligations that restrict its ability to trade in certain
| | | | | | | | |
| Credit Opportunities Portfolio | October 31, 2023 |
| |
securities on behalf of the Fund. In certain circumstances, the Fund or the Adviser will engage an independent agent to dispose of securities of issuers in which KKR could be deemed to have material non-public information on behalf of the Fund. Such independent agent could dispose of the relevant securities for a price that is lower than the Adviser’s valuation of such securities which could take into account the material non-public information known to KKR in respect of the relevant issuer.
The Adviser could develop new businesses such as providing investment banking, advisory and other services to corporations, financial sponsors, management or other persons. Such services could relate to transactions that could give rise to investment opportunities that are suitable for the Fund. In such case, the Adviser’s client would typically require the Adviser to act exclusively on its behalf, thereby precluding the Fund from participating in such investment opportunities. The Adviser would not be obligated to decline any such engagements in order to make an investment opportunity available to the Fund. In addition, the Adviser could come into the possession of information through these new businesses that limits the Fund’s ability to engage in potential transactions.
The 1940 Act limits the Fund’s ability to invest in, or hold securities of, companies that are controlled by funds managed by KKR. Any such investments could create conflicts of interest between the Fund, the Adviser and KKR. The Adviser will also have, or enter into, advisory relationships with other advisory clients (including, among others, employee benefit plans subject to ERISA and related regulations) that could lead to circumstances in which a conflict of interest between the Adviser’s advisory clients could exist or develop. In addition, to the extent that another client of the Adviser or KKR holds a different class of securities than the Fund, the interest of such client and the Fund might not be aligned. As a result of these conflicts and restrictions, the Adviser could be unable to implement the Fund’s investment strategies as effectively as it could have in the absence of such conflicts or restrictions. In order to avoid these conflicts and restrictions, the Adviser could choose to exit these investments prematurely and, as a result, the Fund would forgo any future positive returns associated with such investments.
Certain other KKR client accounts or proprietary accounts have investment objectives, programs, strategies and positions that are similar to, or conflict with, those of the Fund, or compete with, or have interests adverse to, the Fund. This type of conflict could affect the prices and availability of the securities or interests in which the Fund invests. KKR will, from time to time, give advice or take action with respect to the investments held by, and transactions of, other KKR client accounts or proprietary accounts that could be different from or otherwise inconsistent with the advice given or timing or nature of any action taken with respect to the investments held by, and timing or nature of any action taken with respect to the investments held by, and transactions of, the Fund. Such different advice and/or inconsistent actions could be due to a variety of reasons, including, without limitation, the differences between the investment objective, program, strategy and tax treatment of the other KKR client accounts or proprietary accounts and the Fund or the regulatory status of other KKR client accounts and any related restrictions or obligations imposed on KKR as a fiduciary thereof. Such advice and actions could adversely impact the Fund.
KKR, for its own account or for the account of other KKR clients, could enter into real estate-related transactions with Fund portfolio companies. Such transactions could include, for example, buying or selling real estate assets, acquiring or entering into leasing arrangements or amending such arrangements or transferring options or rights of first refusal to acquire real estate assets. Such transactions, which do not involve securities, are not governed by restrictions on principal transactions and cross transactions but are subject to specific policies and procedures established by KKR to manage related conflicts.
The 1940 Act prohibits the Fund from participating in certain transactions with certain of its affiliates including an Adviser-affiliated broker-dealer. The Fund generally is prohibited, for example, from buying or selling any securities from or to another client of the Adviser or of KKR. The 1940 Act also prohibits certain “joint” transactions with certain of the Fund’s affiliates, which in certain circumstances could include investments in the same portfolio company (whether at the same or different times to the extent the transaction involves jointness) or transactions in which a broker-dealer affiliated with the Adviser participates as principal with the Fund. If a person acquires more than 25% of the Fund’s voting securities, the Fund will generally be prohibited from buying or selling any security from or to such person or certain of that person’s affiliates, or entering into prohibited joint transactions with such persons. Similar restrictions limit the Fund’s ability to transact business with its officers or trustees or their affiliates. The SEC has interpreted the 1940 Act rules governing transactions with affiliates to prohibit certain “joint transactions” involving entities that share a common investment adviser. As a result of these restrictions, the scope of investment opportunities that would otherwise be available to the Fund will be limited. These investment opportunities will
| | | | | | | | |
| Credit Opportunities Portfolio | October 31, 2023 |
| |
generally be made available to other funds, vehicles and accounts advised by the Adviser that are not subject to similar restrictions under the 1940 Act.
The Fund’s shareholders are based in a wide variety of jurisdictions and take a wide variety of forms. Accordingly, they could have conflicting regulatory, legal, investment, tax, and other interests with respect to their investments in the Fund. The conflicting interests of individual shareholders relate to or arise from, among other things, the nature of investments made by the Fund, the selection, structuring, acquisition and management of investments, the timing of disposition of investments, internal investment policies of the shareholders and their target risk/return profiles. As a consequence, conflicts of interest could arise in connection with decisions made by the Adviser, including with respect to the nature or structuring of investments, which could be more beneficial for one shareholder than for another shareholder, especially with respect to shareholders’ individual tax situations. In addition, the Fund could make investments that have a negative impact on related investments made by the Fund in separate transactions. In selecting and structuring investments appropriate for the Fund, the Adviser will consider the investment and tax objectives of the Fund and its shareholders as a whole, not the investment, tax or other objectives of any shareholder individually.
The Adviser and the portfolio managers may also face other potential conflicts of interest in managing the Fund, and the descriptions above are not a complete description of every conflict of interest that could be deemed to exist in managing the Fund and other funds and accounts advised or controlled by KKR.
(a)(3) Portfolio Manager Compensation
Consistent with KKR’s global, integrated culture, KKR has one firm-wide compensation and incentive structure based on a global profit and loss statement, which covers the portfolio manager. KKR’s compensation structure is designed to align the interests of the investment personnel serving the Fund with those of the Fund’s shareholders and to give everyone a direct financial incentive to ensure that all of KKR’s resources, knowledge and relationships around the world are utilized to maximize risk-adjusted returns for each strategy.
Each of KKR’s senior executives, including the portfolio manager responsible for the day-to-day management of the Fund, receives a base salary and is eligible for a cash bonus and equity compensation, as well as additional incentives including “dollars at work” in certain KKR fund investments (other than the Fund). The cash bonus, equity compensation and “dollars at work” are discretionary, and “dollars at work” and equity awards are typically subject to a vesting period of several years.
Compensation and other incentives are not formulaic, but rather are judgment and merit driven, and are determined based on a combination of overall firm performance, individual contribution and performance, business unit performance, and relevant market and competitive compensation practices for KKR’s various businesses and the individual roles/responsibilities within each of those businesses.
(a)(4) Securities Ownership of Portfolio Managers
As of the fiscal year ended October 31, 2023, the portfolio manager beneficially owned the following shares of the Fund:
| | | | | |
| Portfolio Manager | Dollar Range of Equity Securities Owned** |
| Christopher A. Sheldon | None |
| Jeremiah S. Lane | None |
| Daniel Pietrzak | None |
** Ranges (None, $1-$10,000, $10,001-$50,000, $50,001-$100,000, $100,001-$500,000, $500,001-$1,000,000 or over $1,000,000).
(b) Not applicable.
Item 9. Purchases of Equity Securities by Closed-End Management Investment Company and Affiliated Purchasers.
| | | | | | | | |
| Credit Opportunities Portfolio | October 31, 2023 |
| |
No purchases were made during the reporting period by or on behalf of the registrant or any “affiliated purchaser,” as defined in Rule 10b-18(a)(3) under the Exchange Act (17 CFR 240.10b-18(a)(3)), of shares or other units of any class of the registrant’s equity securities that is registered by the registrant pursuant to Section 12 of the Exchange Act (15 U.S.C. 781).
Item 10. Submission of Matters to a Vote of Security Holders.
There have been no material changes to the procedures by which shareholders may recommend nominees to the registrant’s board of trustees since the registrant last provided disclosure in response to this item.
Item 11. Controls and Procedures.
(a) The registrant’s principal executive officer and principal financial officer have concluded, based on their evaluation of the registrant’s disclosure controls and procedures as of a date within 90 days of the filing date of this report on Form N-CSR, that the design and operation of such procedures are effective to provide reasonable assurance that information required to be disclosed by the investment company on Form N-CSR is recorded, processed, summarized and reported within the time periods specified in the Commission’s rules and forms.
(b) There have been no changes in the registrant’s internal control over financial reporting during the period covered by this report that materially affected, or are reasonably likely to materially affect, the registrant’s internal control over financial reporting.
Item 12. Disclosure of Securities Lending Activities for Closed-End Management Investment Companies
The registrant did not engage in securities lending activities during the period reported on this Form N-CSR.
Item 13. Exhibits.
(a)(3) Not applicable.
(a)(4) Not applicable.
| | | | | | | | |
| Credit Opportunities Portfolio | October 31, 2023 |
| |
SIGNATURES
Pursuant to the requirements of the Securities Exchange Act of 1934 and the Investment Company Act of 1940, the registrant has duly caused this report to be signed on its behalf by the undersigned, thereunto duly authorized.
| | |
|
| KKR Credit Opportunities Portfolio |
|
By /s/ Eric Mogelof |
| Eric Mogelof, President |
|
Date December 22, 2023 |
Pursuant to the requirements of the Securities Exchange Act of 1934 and the Investment Company Act of 1940, this report has been signed below by the following persons on behalf of the registrant and in the capacities and on the dates indicated.
| | |
By /s/ Eric Mogelof |
| Eric Mogelof, President |
|
Date December 22, 2023 |
| | |
By /s/ Thomas Murphy |
Thomas Murphy, Treasurer, Chief
Accounting Officer & Chief
Financial Officer |
|
Date December 22, 2023 |