UNITED STATES
SECURITIES AND EXCHANGE COMMISSION
Washington, D.C. 20549
FORM N-CSR
CERTIFIED SHAREHOLDER REPORT OF REGISTERED
MANAGEMENT INVESTMENT COMPANIES
Investment Company Act file number: 811-23483
Axonic Funds
(exact name of registrant as specified in charter)
520 Madison Avenue, 42nd Floor
New York, NY 10022
(Address of Principal Office)
Clayton DeGiacinto, President
c/o Axonic Capital LLC
520 Madison Avenue, 42nd Floor
New York, New York 10022
(Name and Address of Agent for Service)
Copies of information to:
Jeffrey Skinner
Kilpatrick Townsend & Stockton LLP
1001 West Fourth Street
Winston-Salem, NC 27101
Registrant’s telephone number, including area code: (212) 259-0430
Date of fiscal year end: October 31
Date of reporting period: December 31, 2019 – October 31, 2020
Item 1. Report to Stockholders.
AXONIC STRATEGIC INCOME FUND
ANNUAL REPORT
October 31, 2020

TABLE OF CONTENTS
| Shareholder Letter | 1 |
| Fund Commentary | 2 |
| Portfolio Update | 3 |
| Disclosure of Fund Expenses | 5 |
| Schedule of Investments | 6 |
| Statement of Assets and Liabilities | 11 |
| Statement of Operations | 12 |
| Statement of Changes in Net Assets | 13 |
| Financial Highlights | 14 |
| Notes to Financial Statements | 16 |
| Report of Independent Registered Public Accounting Firm | 22 |
| Additional Information | 23 |
| Trustees and Officers | 24 |
| Privacy Policy | 26 |
Electronic Report Disclosure Beginning on January 1, 2021, as permitted by regulations adopted by the U.S. Securities and Exchange Commission, paper copies of the Fund’s annual and semi-annual shareholder reports will no longer be sent by mail, unless you specifically request paper copies of the reports from the Fund or from your financial intermediary, such as a broker-dealer or bank. Instead, the reports will be made available on the Fund’s website www.axonicfunds.com, and you will be notified by mail each time a report is posted and provided with a website link to access the report.
If you already elected to receive shareholder reports electronically, you will not be affected by this change and you need not take any action. You may elect to receive shareholder reports and other communications from the Fund electronically by calling the Fund at (833) 429-6642, or submit a signed letter of instruction requesting paperless reports to PO Box 219445, Kansas City, MO 64121. If you own these shares through a financial intermediary, you may contact your financial intermediary to request your shareholder reports electronically.
You may elect to receive all future reports in paper free of charge. You can inform the Fund that you wish to continue receiving paper copies of your shareholder reports by calling the Fund at (833) 429-6642, or by submitting a signed letter of instruction requesting paper reports to PO Box 219445, Kansas City, MO 64121. If you own these shares through a financial intermediary, contact the financial intermediary to request paper copies. Your election to receive reports in paper will apply to all funds held with the fund complex or your financial intermediary.
| Axonic Strategic Income Fund | Shareholder Letter |
October 31, 2020 (Unaudited)
Dear Shareholder,
2020 turned out to be the year of the global pandemic. What started out as a benign investing environment following a strong 2019 changed suddenly with the onset of COVID-19. The almost overnight shut down of the US Economy resulted in a significant sell-off in risk assets at the end of Q1. The sell-off was historic in both magnitude and speed in which the losses occurred, and like the coronavirus was also indiscriminate. Equity markets suffered losses in excess of 30% at the lows while credit spreads widened significantly. Structured credit was not immune to the dislocation.
In the subsequent weeks following the mandatory shutdown we experienced unprecedented government action in the form of Monetary and Fiscal policy. With regards to Fiscal Policy throughout March and April the US government passed three main relief packages, and one supplemental one, totaling $2.8 trillion targeting both individuals and businesses. In terms of Monetary Policy the Federal Reserve (Fed) stimulus involved three areas: interest rate cuts, asset purchases, and loans. The Fed cut its benchmark interest rate to basically zero (0-.25%) from (1.5%-1.75%). The Fed enacted and still continues an aggressive quantitative easing program with the direct purchase of US Treasuries and Mortgage Backed Securities among other assets. In addition the Fed has enacted a number of other programs to facilitate the functioning of markets to include repo operations, lending to financial institutions, purchasing of money market mutual funds, and a corporate credit facility to buy corporate bonds to ensure corporations can get credit to name a few. All of this stimulus had the desired effect - a significant market recovery despite the uncertainty around the spread of the virus and the lack of economic activity.
As we head into 2021 and the implementation of a vaccine program we maintain a high conviction around the fundamental performance of our assets in the fund. As the US economy continues to recover from the deep economic contraction experienced in the first half of 2020 we believe our exposures will continue to benefit. While the average US consumer faces uncertainty in the current environment, we take comfort in recent data points that depict a consumer that has entered this recession in a better position than previous ones. These data points include: a personal savings rate that remains well above the historical average, household debt to GDP that is approximately 25% below its peak, a robust level of home price appreciation, and an improving unemployment picture. Given this backdrop we believe that owning senior, investment grade RMBS, CMBS, and ABS bonds represents an attractive opportunity to generate strong risk-adjusted returns.
Thank you for your continued support.
 | |
| | |
| Clayton DeGiacinto | |
| Managing Partner, Chief Investment Officer | |
| Axonic Capital LLC | |
Must be proceeded by or accompanied by a prospectus.
The views and information discussed in this commentary are as of the date of publication, are subject to change, and may not reflect the firm’s current views. The views expressed represent an assessment of market conditions at a specific point in time, are opinions only and should not be relied upon as investment advice regarding a particular investment or markets in general. Such information does not constitute a recommendation to buy or sell specific securities or investment vehicles.
Past performance does not guarantee future results.
| Annual Report | October 31, 2020 | 1 |
| Axonic Strategic Income Fund | Fund Commentary |
October 31, 2020 (Unaudited)
The Axonic Strategic Income Fund (Institutional Class) (“the Fund”) was down -2.11% for the fiscal year ended October 31, 2020 on a price per share performance basis, while the Fund’s benchmark, the Bloomberg Barclays U.S. Aggregate Bond Index, returned 6.32% for the year to date ended October 31, 2020. However the Fund, which was in its initial annual performance period, returned positive performance on a relative dollar basis1 of approximately $30.2 million of net income.
The historic, sudden sell off of risk assets in February with the domestic onset of COVID-19, while catastrophic, presented what we believe was an opportunity as the Fund was defensively positioned and in the infancy of the Fund’s capital raising efforts. The strong relative dollar-based return of the Fund was attributable to the deployment of shareholder capital to price dislocated senior commercial mortgage-backed securities (“CMBS”)2, non-agency residential mortgage-backed securities (“RMBS”)3 and asset backed securities (“ABS”)4. Investing in well collateralized assets that produced stable income and took advantage of fundamentally sound, though price dislocated, assets produced a strong total return for the Fund through a combination of income and price appreciation. The Fund’s multi-asset class investment strategy resulted in the Fund’s generation of gross income and appreciation, with the CMBS and credit opportunistic investments contributing 46.60%, RMBS 38.98%, ABS 14.06% and lastly equity opportunistic 0.37% of the total gross income production of the Fund.
We maintain a high conviction around the fundamental performance of the assets in the Fund and believe the current U.S. recovery provides an attractive opportunity to generate strong risk-adjusted returns.
| 1 | Relative dollar based return is dollars of net income as reported on the Statement of Operations. |
| 2 | Commercial mortgage-backed securities (“CMBS”) are fixed-income investment products that are backed by mortgages on commercial properties rather than residential real estate. |
| 3 | Residential mortgage-backed securities (“RMBS”) are debt-based securities (similar to a bond), backed by the interest paid on loans for residences. |
| 4 | Asset backed securities (“CMBS”) are investment securities—a bond or note—which is collateralized by a pool of assets, such as loans, leases, credit card debt, royalties, or receivables. |
The views and information discussed in this commentary are as of the date of publication, are subject to change, and may not reflect the firm’s current views. The views expressed represent an assessment of market conditions at a specific point in time, are opinions only and should not be relied upon as investment advice regarding a particular investment or markets in general. Such information does not constitute a recommendation to buy or sell specific securities or investment vehicles.
Past performance does not guarantee future results.
| Axonic Strategic Income Fund | Portfolio Update |
October 31, 2020 (Unaudited)
Average Annual Total Returns (as of October 31, 2020)
| | 1 Month | Quarter | 6 Month | YTD | Since Inception* |
| Axonic Strategic Income Fund – A – NAV | 0.19% | 1.62% | – | 2.17% | 2.17% |
| Axonic Strategic Income Fund – A – LOAD | -2.04% | -0.66% | – | -0.13% | -0.13% |
| Axonic Strategic Income Fund – I – NAV | 0.19% | 1.76% | 7.10% | -2.11% | -2.11% |
| Bloomberg Barclays US Aggregate Bond Index(a) | -0.45% | -1.30% | 1.27% | 6.32% | 6.23% |
The performance data quoted above represents past performance. Past performance is not a guarantee of future results. Investment return and value of the Fund shares will fluctuate so that an investor’s shares, when repurchased, may be worth more or less than their original cost. Performance may be lower or higher than performance data quoted. Fund performance current to the most recent month-end is available by calling (833) 429-6642 or by visiting www.axonicfunds.com.
| * | Class A has an inception date of July 16, 2020. Class I has an Inception date of December 30, 2019. |
| (a) | The Bloomberg Barclays U.S. Aggregate Bond Index is an unmanaged index which represents the U.S. investment-grade fixed-rate bond market (including government and corporate securities, mortgage pass-through securities and asset-backed securities). Investors cannot invest directly in an index or benchmark. |
Excludes adjustments in accordance with accounting principles generally accepted in the United States of America and as such, the net asset value and total return for shareholder transactions reported to the market may differ from the net asset value for financial reporting purposes.
Performance data quoted represents past performance, which is not a guarantee of future results. Current performance may be lower or higher than the performance quoted. The principal value and investment return of an investment will fluctuate so that your shares, if repurchased, may be worth more or less than their original cost. Total return measures net investment income and capital gain or loss from portfolio investments. All performance shown assumes reinvestment of dividends and capital gains distributions. For the most current month-end performance please call 1-833-429-6642 (833-4Axonic) or download one at www.axonicfunds.com.
Performance of $10,000 Initial Investment (as of October 31, 2020)
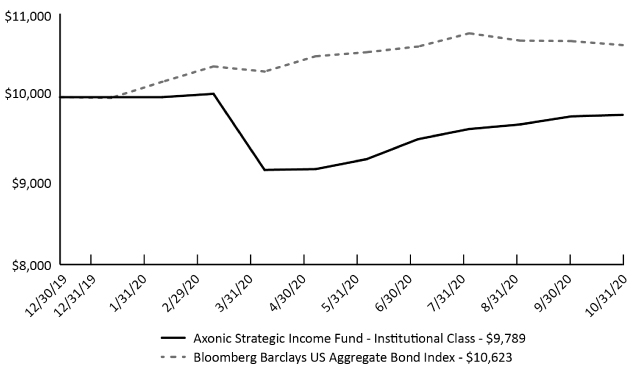
The graph shown above represents historical performance of a hypothetical investment of $10,000 in the Institutional Class since inception. Past performance does not guarantee future results. All returns reflect reinvested dividends, but do not reflect the deduction of taxes that a shareholder would pay on Fund distributions or the repurchase of Fund shares.
| Annual Report | October 31, 2020 | 3 |
| Axonic Strategic Income Fund | Portfolio Update |
October 31, 2020 (Unaudited)
| Top Ten Holdings (as a % of Net Assets)* | | | | |
| | | | | |
| SB Multifamily Repack Trust, Series 2020-FRR1, Class A | | | 5.72 | % |
| Hudsons Bay Simon JV Trust, Series 2015-HBFL, Class AFL | | | 3.68 | % |
| Ambac LSNI LLC | | | 3.29 | % |
| START Ireland, Series 2019-1, Class A | | | 2.19 | % |
| Multifamily Connecticut Avenue Securities, Series 2019-01, Class M10 | | | 2.07 | % |
| CSMC, Series 2020-FACT, Class F | | | 1.80 | % |
| BMD2 Re-Remic Trust, Series 2019-FRR1, Class 7A | | | 1.80 | % |
| JP Morgan Chase Commercial Mortgage Securities Corp., Series 2019-MARG, Class D | | | 1.80 | % |
| CPS Auto Receivables Trust, Series 2019-A, Class E | | | 1.66 | % |
| Toorak Mortgage Corp., Ltd., Series 2019-1, Class A2 | | | 1.57 | % |
| Top Ten Holdings | | | 25.58 | % |
| Portfolio Composition (as a % of Net Assets)* | | | | |
| | | | | |
| Commercial Mortgage-Backed Securities | | | 35.56 | % |
| Residential Mortgage-Backed Securities | | | 29.23 | % |
| Asset-Backed Securities | | | 10.25 | % |
| Corporate Bonds | | | 4.79 | % |
| Bank Loans | | | 3.68 | % |
| Common Stocks- Financials | | | 0.93 | % |
| Preferred Stocks- Financials | | | 0.01 | % |
| Cash Equivalents & Other Net Assets | | | 15.55 | % |
| | | | 100.00 | % |
| * | Holdings are subject to change, and may not reflect the current or future position of the portfolio. Tables present indicative values only. |
| Axonic Strategic Income Fund | Disclosure of Fund Expenses |
October 31, 2020 (Unaudited)
As a shareholder of the Axonic Strategic Income Fund (the "Fund"), you will incur two types of costs: (1) transaction costs, including any applicable redemption fees; and (2) ongoing costs, including management fees, distribution and/or service (12b-1) fees (if applicable) and other Fund expenses. The following examples are intended to help you understand your ongoing costs (in dollars) of investing in a Fund and to compare these costs with the ongoing costs of investing in other mutual funds. The examples are based on an investment of $1,000 invested on May 1, 2020 and held through October 31, 2020.
Actual Expenses
The first line under each class of the table below provides information about actual account values and actual expenses. You may use the information in this line, together with the amount you invested, to estimate the expenses that you paid over the period. Simply divide your account value by $1,000 (for example, an $8,600 account value divided by $1,000 = 8.6), then multiply the result by the number in the first line under the heading “Expenses Paid During Period 05/01/2020 – 10/31/2020” to estimate the expenses you paid on your account during this period.
Hypothetical Example for Comparison Purposes
The second line under each class of the table below provides information about hypothetical account values and hypothetical expenses based on the Fund’s actual expense ratio and an assumed rate of return of 5% per year before expenses, which is not the Fund’s actual return. The hypothetical account values and expenses may not be used to estimate the actual ending account balance or expenses you paid for the period. You may use this information to compare the ongoing costs of investing in the Fund and to other funds. To do so, compare this 5% hypothetical example with the 5% hypothetical examples that appear in the shareholder reports of the other funds. Please note that the expenses shown in the table are meant to highlight your ongoing costs only and do not reflect any transactional costs, such as redemption fees, if any. Therefore, the second line under each class of the table below is useful in comparing ongoing costs only, and will not help you determine the relative total costs of owning different funds. In addition, if these transactional costs were included, your costs would have been higher.
| | | Beginning Account Value May 1, 2020 | | Ending Account Value October 31, 2020 | | Expense Ratio(a) | | Expenses Paid During Period May 1, 2020 – October 31, 2020(b) |
| Axonic Strategic Income Fund | | | | | | | | | | | | | | | | |
| Class A | | | | | | | | | | | | | | | | |
| Actual | | $ | 1,000.00 | | | $ | 1,021.70 | | | | 1.50% | | | $ | 4.43 | |
| Hypothetical (5% return before expenses) | | $ | 1,000.00 | | | $ | 1,017.60 | | | | 1.50% | | | $ | 7.61 | |
| Institutional | | | | | | | | | | | | | | | | |
| Actual | | $ | 1,000.00 | | | $ | 1,069.80 | | | | 1.10% | | | $ | 5.72 | |
| Hypothetical (5% return before expenses) | | $ | 1,000.00 | | | $ | 1,019.61 | | | | 1.10% | | | $ | 5.58 | |
| (a) | Annualized, based on the Fund’s most recent fiscal half year expenses. |
| (b) | Expenses are equal to the Fund’s annualized expense ratio multiplied by the average account value over the period, multiplied by the number of days in the most recent fiscal half year (184), divided by 366. |
See Notes to Financial Statements.
| Annual Report | October 31, 2020 | 5 |
| Axonic Strategic Income Fund | Schedule of Investments |
October 31, 2020
| Description | | Shares | | Value |
| COMMON STOCKS (0.93%) | | | | | | | | |
| Financials (0.93%) | | | | | | | | |
| Chimera Investment Corp. REIT | | | 451,952 | | | $ | 3,773,799 | |
| Nexpoint Real Estate Finance, Inc. REIT | | | 13,170 | | | | 180,561 | |
| PennyMac Mortgage Investment Trust REIT | | | 131,767 | | | | 1,972,552 | |
| | | | | | | | 5,926,912 | |
| TOTAL COMMON STOCKS | | | | | | | | |
| (Cost $6,405,403) | | | | | | | 5,926,912 | |
| | | | | | | | | |
| PREFERRED STOCKS (0.01%) | | | | | | | | |
| Financials (0.01%) | | | | | | | | |
| New Residential Investment Corp., Series C, 3M US L + 4.97%, (a)(b) | | | 2,000 | | | $ | 35,460 | |
| | | | | | | | | |
| TOTAL PREFERRED STOCKS | | | | | | | | |
| (Cost $49,880) | | | | | | | 35,460 | |
| | | Rate | | Maturity Date | | Principal Amount | | Value |
| ASSET-BACKED SECURITIES (10.25%) | | | | | | | | | | | | |
| Carvana Auto Receivables Trust, Series 2019-3A, Class E(c) | | 4.60% | | 07/15/24 | | $ | 4,236,000 | | | $ | 4,379,177 | |
| Castlelake Aircraft Securitization Trust, Series 2018-1, Class A(c) | | 4.13% | | 06/15/25 | | | 1,874,839 | | | | 1,743,788 | |
| Castlelake Aircraft Securitization Trust, Series 2018-1, Class B(c) | | 5.30% | | 06/15/25 | | | 553,599 | | | | 383,811 | |
| Castlelake Aircraft Structured Trust, Series 2019-1A, Class A(c) | | 3.97% | | 04/15/26 | | | 2,297,105 | | | | 2,111,496 | |
| Chase Auto Credit Linked Notes, Series 2020-1, Class E(c) | | 3.72% | | 11/25/23 | | | 1,000,000 | | | | 1,002,800 | |
| CPS Auto Receivables Trust, Series 2017-D, Class E(c) | | 5.30% | | 06/17/24 | | | 500,000 | | | | 514,700 | |
| CPS Auto Receivables Trust, Series 2019-A, Class E(c) | | 5.81% | | 03/15/23 | | | 10,000,000 | | | | 10,587,999 | |
| Falcon Aerospace, Ltd., Series 2019-1, Class A(c) | | 3.60% | | 09/15/26 | | | 980,143 | | | | 914,669 | |
| Flagship Credit Auto Trust, Series 2020-3, Class E(c) | | 4.98% | | 03/15/25 | | | 250,000 | | | | 265,100 | |
| Hertz Vehicle Financing II LP, Series 2016-2A, Class C(c) | | 4.99% | | 03/25/21 | | | 1,750,000 | | | | 1,737,400 | |
| Hertz Vehicle Financing II LP, Series 2016-4A, Class C(c) | | 5.06% | | 07/25/21 | | | 2,100,000 | | | | 2,082,360 | |
| Horizon Aircraft Finance I, Ltd., Series 2018-1, Class A(c) | | 4.46% | | 12/15/25 | | | 474,884 | | | | 442,402 | |
| Horizon Aircraft Finance III, Ltd., Series 2019-2, Class A(c) | | 3.43% | | 11/15/26 | | | 4,828,860 | | | | 4,481,182 | |
| Horizon Aircraft Finance III, Ltd., Series 2019-2, Class B(c) | | 4.46% | | 11/15/26 | | | 385,595 | | | | 289,736 | |
| LUNAR AIRCRAFT, Ltd., Series 2020-1A, Class A(c) | | 3.38% | | 02/15/27 | | | 1,254,994 | | | | 1,159,991 | |
| Pioneer Aircraft Finance, Ltd., Series 2019-1, Class A(c) | | 3.97% | | 06/15/26 | | | 3,194,518 | | | | 2,951,735 | |
| Project Silver, Series 2019-1, Class A(c) | | 3.97% | | 07/15/26 | | | 2,359,437 | | | | 2,217,399 | |
| Santander Consumer Auto Receivables Trust, Series 2020-BA, Class E(c) | | 4.13% | | 10/15/24 | | | 1,344,000 | | | | 1,374,778 | |
| START Ireland, Series 2019-1, Class A(c) | | 4.09% | | 03/15/26 | | | 14,739,295 | | | | 13,924,211 | |
| Tesla Auto Lease Trust, Series 2020-A, Class E(c) | | 4.64% | | 04/20/23 | | | 2,500,000 | | | | 2,599,500 | |
| Thunderbolt II Aircraft Lease, Ltd., Series 2018-A, Class A(c)(d) | | 4.15% | | 09/15/38 | | | 3,543,200 | | | | 3,337,340 | |
| Thunderbolt II Aircraft Lease, Ltd., Series 2018-A, Class B(c)(d) | | 5.07% | | 09/15/38 | | | 3,491,964 | | | | 2,491,866 | |
| Thunderbolt III Aircraft Lease, Ltd., Series 2019-1, Class A(c) | | 3.67% | | 11/15/26 | | | 678,766 | | | | 635,189 | |
| Thunderbolt III Aircraft Lease, Ltd., Series 2019-1, Class B(c) | | 4.75% | | 11/15/26 | | | 1,076,722 | | | | 766,734 | |
| WAVE LLC, Series 2019-1, Class B(c) | | 4.58% | | 09/15/27 | | | 4,141,773 | | | | 2,986,632 | |
| | | | | | | | | | | | | |
| TOTAL ASSET-BACKED SECURITIES | | | | | | | | | | | | |
| (Cost $63,405,303) | | | | | | | | | | | 65,381,995 | |
| | | | | | | | | | | | | |
| BANK LOAN (3.68%) | | | | | | | | | | | | |
| Fly Willow Funding, Ltd.(a) | | 7.00% | | 10/15/25 | | | 12,000,000 | | | | 11,520,000 | |
See Notes to Financial Statements.
| Axonic Strategic Income Fund | Schedule of Investments |
October 31, 2020
| | | Rate | | Maturity Date | | Principal Amount | | Value |
| KREF Holdings X LLC(a) | | 5.75% | | 08/05/27 | | $ | 12,000,000 | | | $ | 11,940,000 | |
| | | | | | | | | | | | | |
| TOTAL BANK LOAN | | | | | | | | | | | | |
| (Cost $23,166,394) | | | | | | | | | | | 23,460,000 | |
| | | | | | | | | | | | | |
| COMMERCIAL MORTGAGE-BACKED SECURITIES (35.56%) | | | | | | | | | | | | |
| Ashford Hospitality Trust, Series 2018-ASHF, Class A(a)(c) | | 1M US L + 0.90% | | 04/15/35 | | | 5,995,652 | | | | 5,637,112 | |
| Ashford Hospitality Trust, Series 2018-KEYS, Class A(a)(c) | | 1M US L + 1.00% | | 06/15/35 | | | 10,000,000 | | | | 9,428,000 | |
| Atrium Hotel Portfolio Trust, Series 2017-ATRM, Class E(a)(c) | | 1M US L + 3.05% | | 12/15/36 | | | 1,534,710 | | | | 1,242,501 | |
| BBCMS Mortgage Trust, Series 2018-TALL, Class E(a)(c) | | 1M US L + 2.44% | | 03/15/21 | | | 7,461,000 | | | | 6,908,140 | |
| BMD2 Re-Remic Trust, Series 2019-FRR1, Class 7A1(c) | | 2.87% | | 05/25/52 | | | 6,560,276 | | | | 6,240,988 | |
| BMD2 Re-Remic Trust, Series 2019-FRR1, Class 7A(a)(c) | | 3.67% | | 05/25/52 | | | 12,194,956 | | | | 11,461,247 | |
| Cantor Commercial Real Estate Lending, Series 2019-CF2, Class SWC(c) | | 3.84% | | 09/15/29 | | | 5,890,000 | | | | 5,240,922 | |
| Cantor Commercial Real Estate Lending, Series 2019-CF2, Class SWD(c) | | 4.52% | | 09/15/29 | | | 4,988,052 | | | | 4,434,877 | |
| CFK Trust, Series 2020-MF2, Class E(a)(c) | | 3.46% | | 03/15/27 | | | 8,825,352 | | | | 8,317,012 | |
| CSMC, Series 2020-FACT, Class F(a)(c) | | 1M US L + 6.16% | | 10/15/37 | | | 11,500,000 | | | | 11,486,200 | |
| Freddie Mac Multifamily Structured Pass Through Certificates, Series 2019-K101, Class X3(a) | | 1.89% | | 01/25/30 | | | 66,000,000 | | | | 9,068,400 | |
| Freddie Mac Multifamily Structured Pass Through Certificates, Series 2020-K115, Class X3(a) | | 2.96% | | 07/25/30 | | | 21,702,896 | | | | 4,891,833 | |
| Freddie Mac Multifamily Structured Pass Through Certificates, Series 2020-K111, Class X3(a) | | 3.18% | | 07/25/30 | | | 16,048,603 | | | | 3,874,133 | |
| Freddie Mac Multifamily Structured Pass Through Certificates, Series 2020-K110, Class X3(a) | | 3.40% | | 05/25/30 | | | 15,923,654 | | | | 4,057,347 | |
| FREMF Mortgage Trust, Series 2020-KI05, Class B(a)(c) | | 1M US L + 2.30% | | 07/25/22 | | | 1,104,880 | | | | 1,070,961 | |
| FRESB Mortgage Trust, Series 2020-SB76, Class X1(a) | | 1.32% | | 05/25/30 | | | 14,882,145 | | | | 1,157,831 | |
| FRESB Mortgage Trust, Series 2020-SB77, Class X1(a) | | 1.09% | | 06/25/27 | | | 22,155,862 | | | | 1,526,539 | |
| FRESB Mortgage Trust, Series 2020-SB78, Class X1(a) | | 1.18% | | 06/25/30 | | | 11,700,368 | | | | 1,104,515 | |
| FRESB Mortgage Trust, Series 2020-SB79, Class X1(a) | | 1.24% | | 07/25/40 | | | 17,577,651 | | | | 1,511,678 | |
| Hudsons Bay Simon JV Trust, Series 2015-HBFL, Class AFL(a)(c) | | 1M US L + 1.83% | | 08/05/34 | | | 24,653,000 | | | | 23,420,349 | |
| JP Morgan Chase Commercial Mortgage Securities Corp., Series 2019-MARG, Class D(a)(c) | | 1M US L + 2.11% | | 05/15/21 | | | 12,200,000 | | | | 11,443,600 | |
| MRCD 2019-MARK Mortgage Trust, Series 2019-PARK, Class F(c) | | 2.72% | | 12/15/24 | | | 4,373,000 | | | | 4,159,160 | |
| MRCD 2019-MARK Mortgage Trust, Series 2019-PARK, Class G(c) | | 2.72% | | 12/15/24 | | | 8,311,000 | | | | 7,712,608 | |
| Multifamily Connecticut Avenue Securities, Series 2019-01, Class M10(a)(c) | | 1M US L + 3.25% | | 10/15/49 | | | 14,676,759 | | | | 13,203,211 | |
| Multifamily Connecticut Avenue Securities, Series 2019-01, Class M7(a)(c) | | 1M US L + 1.70% | | 10/15/49 | | | 3,494,530 | | | | 3,338,325 | |
| Multifamily Connecticut Avenue Securities, Series 2020-01, Class M10(a)(c) | | 1M US L + 3.75% | | 03/25/50 | | | 10,448,822 | | | | 9,652,622 | |
| SB Multifamily Repack Trust, Series 2020-FRR1, Class A(c) | | 5.60% | | 05/27/26 | | | 38,047,278 | | | | 36,460,705 | |
| VNDO Mortgage Trust, Series 2013-PENN, Class B(a)(c) | | 3.95% | | 12/13/20 | | | 997,553 | | | | 996,855 | |
| VNDO Mortgage Trust, Series 2013-PENN, Class C(a)(c) | | 3.95% | | 12/13/20 | | | 1,131,295 | | | | 1,127,449 | |
| VNDO Mortgage Trust, Series 2013-PENN, Class D(a)(c) | | 3.95% | | 12/13/20 | | | 6,068,701 | | | | 6,028,648 | |
| Wells Fargo Re-REMIC Trust, Series 2013-FRR1, Class BK20(c)(e) | | 0.00% | | 06/27/22 | | | 1,662,589 | | | | 1,541,553 | |
| Wells Fargo Re-REMIC Trust, Series 2013-FRR1, Class BK26(c)(e) | | 0.00% | | 12/27/22 | | | 10,867,466 | | | | 9,221,045 | |
| | | | | | | | | | | | | |
| TOTAL COMMERCIAL MORTGAGE-BACKED SECURITIES | | | | | | | | | | | | |
| (Cost $218,282,831) | | | | | | | | | | | 226,966,366 | |
See Notes to Financial Statements.
| Annual Report | October 31, 2020 | 7 |
| Axonic Strategic Income Fund | Schedule of Investments |
October 31, 2020
| | | Rate | | Maturity Date | | Principal Amount | | Value |
| | | | | | | | | |
| CORPORATE BONDS (4.79%) | | | | | | | | | | | | | | |
| Ambac Assurance Corp.(b)(c) | | 5.10% | | | 12/31/49 | | | $ | 4,834,576 | | | $ | 6,556,893 | |
| Ambac LSNI LLC(a)(c) | | 3M US L + 5.00% | | | 02/12/23 | | | | 20,910,616 | | | | 20,956,411 | |
| Hawaiian Airlines Class A Pass Through Certificates, Series 2020-1, Class A(c) | | 7.38% | | | 09/15/27 | | | | 2,976,000 | | | | 3,083,396 | |
| | | | | | | | | | | | | | | |
| TOTAL CORPORATE BONDS | | | | | | | | | | | | | | |
| (Cost $29,989,989) | | | | | | | | | | | | | 30,596,700 | |
| | | | | | | | | | | | | | | |
| RESIDENTIAL MORTGAGE-BACKED SECURITIES (29.23%) | | | | | | | | | | | | | | |
| ABFC, Series 2004-OPT5, Class M1(a) | | 1M US L + 1.13% | | | 03/25/34 | | | | 609,987 | | | | 549,754 | |
| Accredited Mortgage Loan Trust, Series 2006-2, Class M2(a) | | 1M US L + 0.29% | | | 09/25/36 | | | | 8,818,000 | | | | 6,650,778 | |
| Ace Securities Corp., Series 2005-HE7, Class M2(a) | | 1M US L + 0.69% | | | 11/25/35 | | | | 3,856,458 | | | | 3,479,614 | |
| Alternative Loan Trust, Series 2005-11CB, Class 3A2(a) | | 1M US L + 0.50% | | | 06/25/35 | | | | 1,294,104 | | | | 1,021,409 | |
| Alternative Loan Trust, Series 2006-6CB, Class 2A10 | | 6.00% | | | 05/25/36 | | | | 8,561,007 | | | | 5,540,126 | |
| Angel Oak Mortgage Trust, Series 2020-3, Class M1(a)(c) | | 3.81% | | | 06/25/24 | | | | 5,000,000 | | | | 5,132,235 | |
| Angel Oak Mortgage Trust I LLC, Series 2019-2, Class B1(a)(c) | | 5.02% | | | 04/25/23 | | | | 600,132 | | | | 607,395 | |
| Arroyo Mortgage Trust, Series 2020-1, Class M1(c) | | 4.28% | | | 02/25/26 | | | | 2,850,000 | | | | 2,864,584 | |
| BCAP LLC, Series 2014-RR2, Class 6A9(a)(c) | | 1M US L + 0.24% | | | 11/26/23 | | | | 2,397,240 | | | | 1,414,450 | |
| Bear Stearns ALT-A Trust, Series 2005-7, Class 1M1(a) | | 1M US L + 0.72% | | | 08/25/35 | | | | 9,044,839 | | | | 8,038,882 | |
| Bear Stearns Asset Backed Securities I Trust, Series 2007-HE3, Class 1A3(a) | | 1M US L + 0.25% | | | 04/25/37 | | | | 1,481,429 | | | | 1,640,451 | |
| Bear Stearns Asset Backed Securities I Trust, Series 2007-HE3, Class 1A4(a) | | 1M US L + 0.35% | | | 04/25/37 | | | | 511,620 | | | | 480,269 | |
| Bear Stearns Asset Backed Securities I Trust, Series 2007-HE7, Class M1(a) | | 1M US L + 0.40% | | | 10/25/37 | | | | 3,986,727 | | | | 3,125,322 | |
| Bear Stearns Mortgage Funding Trust, Series 2006-AR3, Class 1A2A(a) | | 1M US L + 0.24% | | | 10/25/36 | | | | 464,902 | | | | 480,854 | |
| Bellemeade Re, Ltd., Series 2020-2A, Class M2(a)(c) | | 1M US L + 6.00% | | | 08/26/30 | | | | 2,406,753 | | | | 2,464,532 | |
| Bellemeade Re, Ltd., Series 2020-3A, Class M1C(a)(c) | | 1M US L + 3.70% | | | 10/25/30 | | | | 4,500,000 | | | | 4,497,676 | |
| Bellemeade Re, Ltd., Series 2020-3A, Class B1(a)(c) | | 1M US L + 6.35% | | | 10/25/30 | | | | 2,000,000 | | | | 1,997,648 | |
| CHL Mortgage Pass-Through Trust, Series 2006-21, Class A10 | | 5.75% | | | 02/25/37 | | | | 1,716,248 | | | | 1,302,604 | |
| COLT Mortgage Loan Trust, Series 2020-1R, Class M1(a)(c) | | 2.80% | | | 09/25/65 | | | | 3,000,000 | | | | 2,991,120 | |
| COLT Mortgage Loan Trust, Series 2020-1R, Class B1(a)(c) | | 4.31% | | | 09/25/65 | | | | 2,000,000 | | | | 2,029,512 | |
| Connecticut Avenue Securities Trust, Series 2019-R02, Class 1B1(a)(c) | | 1M US L + 4.15% | | | 08/25/31 | | | | 2,706,513 | | | | 2,610,287 | |
| Connecticut Avenue Securities Trust, Series 2020-R01, Class 1M2(a)(c) | | 1M US L + 2.05% | | | 01/25/40 | | | | 4,250,000 | | | | 4,156,119 | |
| Countrywide Asset-Backed Certificates, Series 2006-25, Class M1(a) | | 1M US L + 0.25% | | | 02/25/36 | | | | 3,277,021 | | | | 2,615,102 | |
| Countrywide Asset-Backed Certificates, Series 2007-6, Class 2A4(a) | | 1M US L + 0.31% | | | 09/25/37 | | | | 3,406,837 | | | | 2,545,162 | |
| Deephaven Residential Mortgage Trust, Series 2018-1A, Class B1(a)(c) | | 4.34% | | | 02/25/22 | | | | 2,900,000 | | | | 2,866,800 | |
| Deephaven Residential Mortgage Trust, Series 2018-2A, Class B2(a)(c) | | 6.04% | | | 06/25/22 | | | | 1,900,000 | | | | 1,899,593 | |
| Deephaven Residential Mortgage Trust, Series 2020-2, Class B3(a)(c) | | 5.83% | | | 05/25/65 | | | | 3,030,707 | | | | 2,965,400 | |
| Fannie Mae Connecticut Avenue Securities, Series 2018-C04, Class 2M2(a) | | 1M US L + 2.55% | | | 12/25/30 | | | | 4,998,535 | | | | 4,878,950 | |
| Fannie Mae Connecticut Avenue Securities, Series 2018-C01, Class 1B1(a) | | 1M US L + 3.55% | | | 07/25/30 | | | | 768,852 | | | | 708,169 | |
| Freddie Mac Stacr Remic Trust, Series 2020-DNA1, Class M2(a)(c) | | 1M US L + 1.70% | | | 01/25/50 | | | | 1,700,000 | | | | 1,662,863 | |
See Notes to Financial Statements.
| Axonic Strategic Income Fund | Schedule of Investments |
October 31, 2020
| | | Rate | | Maturity Date | | Principal Amount | | Value |
| Freddie Mac Stacr Remic Trust, Series 2020-DNA4, Class M2(a)(c) | | 1M US L + 3.75% | | | 08/25/50 | | | $ | 923,988 | | | $ | 933,412 | |
| Freddie Mac Stacr Remic Trust, Series 2020-DNA4, Class B1(a)(c) | | 1M US L + 6.00% | | | 08/25/50 | | | | 2,427,528 | | | | 2,501,142 | |
| Freddie Mac Stacr Remic Trust, Series 2020-DNA5, Class M2(a)(c) | | 2.89% | | | 10/25/50 | | | | 4,545,982 | | | | 4,543,135 | |
| Freddie Mac Stacr Remic Trust, Series 2020-DNA5, Class B1(a)(c) | | 4.89% | | | 10/25/50 | | | | 2,796,965 | | | | 2,807,468 | |
| GS Mortgage-Backed Securities Trust, Series 2020-NQM1, Class M1(a)(c) | | 3.29% | | | 09/25/25 | | | | 2,100,000 | | | | 2,070,793 | |
| GSAMP Trust, Series 2006-HE7, Class M2(a) | | 1M US L + 0.29% | | | 10/25/36 | | | | 597,903 | | | | 541,597 | |
| Home Equity Asset Trust, Series 2005-6, Class M5(a) | | 1M US L + 0.63% | | | 12/25/35 | | | | 4,673,931 | | | | 4,153,034 | |
| HSI Asset Securitization Corp. Trust, Series 2005-NC1, Class M4(a) | | 1M US L + 0.99% | | | 07/25/35 | | | | 1,293,157 | | | | 1,110,822 | |
| JP Morgan Alternative Loan Trust, Series 2006-A3, Class 1A1(a) | | 1M US L + 0.32% | | | 07/25/36 | | | | 2,593,536 | | | | 2,301,585 | |
| JP Morgan Mortgage Acquisition Corp., Series 2005-OPT1, Class M6(a) | | 1M US L + 1.07% | | | 06/25/35 | | | | 1,513,980 | | | | 1,127,936 | |
| L1C LLC, Series 2020-1(c) | | 5.29% | | | 07/25/21 | | | | 8,000,000 | | | | 8,005,337 | |
| Lehman XS Trust, Series 2006-GP1, Class A3A(a) | | 1M US L + 0.46% | | | 05/25/46 | | | | 4,874,270 | | | | 5,107,294 | |
| LHOME Mortgage Trust, Series 2019-RTL1, Class A2(c)(d) | | 4.95% | | | 10/25/21 | | | | 4,426,000 | | | | 4,425,971 | |
| LHOME Mortgage Trust, Series 2019-RTL2, Class A2(c)(d) | | 4.34% | | | 03/25/22 | | | | 1,091,000 | | | | 1,077,403 | |
| LHOME Mortgage Trust, Series 2019-RTL3, Class A2(c)(d) | | 4.34% | | | 07/25/22 | | | | 2,182,000 | | | | 2,150,831 | |
| LHOME Mortgage Trust, Series 2020-RTL2, Class M(c) | | 7.87% | | | 04/25/23 | | | | 6,250,000 | | | | 6,290,604 | |
| Long Beach Mortgage Loan Trust, Series 2005-1, Class M6(a) | | 1M US L + 1.58% | | | 02/25/35 | | | | 2,251,050 | | | | 2,036,378 | |
| MASTR Alternative Loan Trust, Series 2007-1, Class 2A15(a) | | 1M US L + 0.37% | | | 10/25/36 | | | | 1,147,262 | | | | 259,726 | |
| Nationstar Home Equity Loan Trust, Series 2006-B, Class M4(a) | | 1M US L + 0.44% | | | 09/25/36 | | | | 1,239,126 | | | | 1,125,197 | |
| New Century Home Equity Loan Trust, Series 2005-3, Class M7(a) | | 1M US L + 1.95% | | | 07/25/35 | | | | 820,121 | | | | 760,033 | |
| Newcastle Mortgage Securities Trust, Series 2007-1, Class M1(a) | | 1M US L + 0.50% | | | 04/25/37 | | | | 601,382 | | | | 473,479 | |
| RAAC, Series 2007-SP1, Class M3(a) | | 1M US L + 1.00% | | | 03/25/37 | | | | 2,664,474 | | | | 2,383,201 | |
| RALI, Series 2005-QS12, Class A8(a) | | 1M US L + 0.35% | | | 08/25/35 | | | | 480,630 | | | | 379,489 | |
| RALI, Series 2006-QS2, Class 1A10(a) | | 1M US L + 0.50% | | | 02/25/36 | | | | 1,550,619 | | | | 1,154,444 | |
| RALI, Series 2006-QS8, Class A4(a) | | 1M US L + 0.45% | | | 08/25/36 | | | | 1,756,019 | | | | 1,300,758 | |
| RAMP, Series 2004-RS12, Class MII5(a) | | 1M US L + 2.63% | | | 12/25/34 | | | | 2,316,425 | | | | 1,841,046 | |
| RAMP, Series 2006-NC1, Class M2(a) | | 1M US L + 0.60% | | | 01/25/36 | | | | 4,870,861 | | | | 4,047,775 | |
| RAMP, Series 2006-RZ5, Class M1(a) | | 1M US L + 0.36% | | | 08/25/46 | | | | 4,580,225 | | | | 4,022,180 | |
| RASC, Series 2005-KS4, Class M5(a) | | 1M US L + 1.80% | | | 05/25/35 | | | | 1,063,734 | | | | 982,720 | |
| RBSSP Resecuritization Trust, Series 2012-6, Class 8A2(a)(c) | | 1M US L + 0.50% | | | 04/26/35 | | | | 1,056,187 | | | | 881,933 | |
| Saxon Asset Securities Trust, Series 2005-1, Class M4(a) | | 1M US L + 1.13% | | | 03/25/35 | | | | 730,404 | | | | 589,844 | |
| Saxon Asset Securities Trust, Series 2005-4, Class M4(a) | | 1M US L + 0.93% | | | 11/25/37 | | | | 1,446,851 | | | | 1,110,936 | |
| Soundview Home Equity Loan Trust, Series 2007-NS1, Class M1(a) | | 1M US L + 0.35% | | | 01/25/37 | | | | 3,065,417 | | | | 2,781,663 | |
| Specialty Underwriting & Residential Finance, Series 2005-BC1, Class B1(a) | | 1M US L + 1.80% | | | 12/25/35 | | | | 1,901,019 | | | | 1,701,386 | |
| STACR Trust, Series 2018-DNA2, Class M2(a)(c) | | 1M US L + 2.15% | | | 12/25/30 | | | | 2,080,000 | | | | 2,030,484 | |
| Structured Asset Securities Corporation, Series 2006-EQ1A, Class M1(a)(c) | | 1M US L + 0.29% | | | 07/25/36 | | | | 6,470,453 | | | | 6,138,100 | |
| Structured Asset Securities Corporation, Series 2005-AR1, Class M3(a) | | 1M US L + 0.75% | | | 09/25/35 | | | | 928,243 | | | | 791,970 | |
| Toorak Mortgage Corp., Ltd., Series 2019-1, Class A2(c)(d) | | 4.95% | | | 11/25/21 | | | | 10,000,000 | | | | 10,007,626 | |
| Traingle Re, Ltd., Series 2020-1, Class M1B(a)(c) | | 1M US L + 3.90% | | | 10/25/30 | | | | 1,015,594 | | | | 1,014,954 | |
| Traingle Re, Ltd., Series 2020-1, Class M1C(a)(c) | | 1M US L + 4.50% | | | 10/25/30 | | | | 1,015,594 | | | | 1,014,849 | |
| Velocity Commercial Capital Loan Trust, Series 2018-1, Class M4(c) | | 5.01% | | | 11/25/29 | | | | 1,265,714 | | | | 1,246,475 | |
| Velocity Commercial Capital Loan Trust, Series 2019-3, Class M5(a)(c) | | 4.73% | | | 08/25/28 | | | | 477,184 | | | | 400,644 | |
| Vista Point Securitization Trust, Series 2020-1, Class M1(a)(c) | | 4.15% | | | 03/25/65 | | | | 2,100,000 | | | | 2,157,858 | |
See Notes to Financial Statements.
| Annual Report | October 31, 2020 | 9 |
| Axonic Strategic Income Fund | Schedule of Investments |
October 31, 2020
| | | Rate | | Maturity Date | | Principal Amount | | Value |
| Washington Mutual Mortgage Pass-Through Certificates WMALT, Series 2005-3, Class 1CB3(a) | | 1M US L + 0.45% | | | 05/25/35 | | | $ | 1,882,765 | | | $ | 1,546,923 | |
| | | | | | | | | | | | | | | |
| TOTAL RESIDENTIAL MORTGAGE-BACKED SECURITIES | | | | | | | | | | | | | | |
| (Cost $176,953,515) | | | | | | | | | | | | | 186,548,095 | |
| | | 7-Day | | | | |
| | | Yield | | Shares | | Value |
| SHORT TERM INVESTMENTS - COMMON SHARES (16.89%) | | | | | | | | | | | | |
| First American Government Obligations Fund | | | 0.04% | | | | 107,782,827 | | | $ | 107,782,827 | |
| | | | | | | | | | | | | |
| TOTAL SHORT TERM INVESTMENTS | | | | | | | | | | | | |
| (Cost $107,782,827) | | | | | | | | | | | 107,782,827 | |
| | | | | | | | | | | | | |
| TOTAL INVESTMENTS (101.34%) | | | | | | | | | | | | |
| (Cost $626,036,142) | | | | | | | | | | $ | 646,698,355 | |
| | | | | | | | | | | | | |
| Liabilities in Excess of Other Assets (-1.34%) | | | | | | | | | | | (8,563,030 | ) |
| NET ASSETS (100.00%) | | | | | | | | | | $ | 638,135,325 | |
| (a) | Floating or variable rate security. The Reference Rate is described below. The Interest Rate in effect as of October 31, 2020 is based on the Reference Rate plus the displayed spread as of the security’s last reset date. |
| (c) | Security exempt from registration under Rule 144A of the Securities Act of 1933. Such securities may normally be sold to qualified institutional buyers in transactions exempt from registration. The total value of Rule 144A securities amounts to $395,612,018, which represents 62.00% of net assets as of October 31, 2020. |
| (d) | Step bond. Coupon changes periodically based upon a predetermined schedule. Interest rate disclosed is that which is in effect at October 31, 2020. |
| | (e) | Zero coupon. |
Investment Abbreviations:
REIT - Real Estate Investment Trust
LIBOR - London Interbank Offered Rate
Libor Rates:
1M US L - 1 Month LIBOR as of October 31, 2020 was 0.14%
3M US L - 3 Month LIBOR as of October 31, 2020 was 0.22%
See Notes to Financial Statements.
| Axonic Strategic Income Fund | Statement of Assets and Liabilities |
October 31, 2020
| ASSETS: | | |
| Investments, at fair value (Cost $626,036,142) | | $ | 646,698,355 | |
| Receivable for investment securities sold | | | 9,127,953 | |
| Dividend receivable | | | 797 | |
| Interest receivable | | | 1,403,334 | |
| Receivable for shares sold | | | 2,885,367 | |
| Deferred offering costs (Note 2) | | | 19,841 | |
| Prepaid expenses and other assets | | | 17,390 | |
| Total Assets | | | 660,153,037 | |
| | | | | |
| LIABILITIES: | | | | |
| Payable for investment securities purchased | | | 18,624,041 | |
| Income distribution payable | | | 1,813,941 | |
| Capital shares payable | | | 878,420 | |
| Accrued legal and audit fees payable | | | 100,970 | |
| Due to Adviser | | | 322,439 | |
| Accrued fund accounting and administration fees payable | | | 136,736 | |
| Distribution and shareholder service fees payable | | | 12,714 | |
| Accrued Chief Compliance Officer fee payable | | | 2,083 | |
| Other payables and accrued expenses | | | 126,368 | |
| Total Liabilities | | | 22,017,712 | |
| Net Assets | | $ | 638,135,325 | |
| | | | | |
| COMPOSITION OF NET ASSETS: | | | | |
| Paid-in capital | | $ | 613,362,773 | |
| Total distributable earnings | | | 24,772,552 | |
| Net Assets | | $ | 638,135,325 | |
| | | | | |
| PRICING OF SHARES: | | | | |
| Class A | | | | |
| Net Assets | | $ | 22,495,377 | |
| Shares of beneficial interest outstanding (unlimited number of shares, no par value common share authorized) | | | 2,323,971 | |
| Net Asset Value and redemption price per share | | $ | 9.68 | |
| Institutional Class | | | | |
| Net Assets | | $ | 615,639,948 | |
| Shares of beneficial interest outstanding (unlimited number of shares, no par value common share authorized) | | | 63,550,117 | |
| Net Asset Value and redemption price per share | | $ | 9.69 | |
See Notes to Financial Statements.
| Annual Report | October 31, 2020 | 11 |
| Axonic Strategic Income Fund | Statement of Operations |
For the Period December 31, 2019 (Commencement of Operations) to October 31, 2020
| INVESTMENT INCOME: | | | | |
| Dividends | | $ | 204,349 | |
| Interest | | | 8,268,555 | |
| Total Investment Income | | | 8,472,904 | |
| | | | | |
| EXPENSES: | | | | |
| Offering costs (Note 2) | | | 105,312 | |
| Fund accounting and administration fees (Note 3) | | | 239,341 | |
| Legal fees | | | 200,361 | |
| Audit and tax fees | | | 25,500 | |
| Shareholder service fees | | | | |
| Class A | | | 8,308 | |
| Distribution fees | | | | |
| Class A | | | 13,847 | |
| Insurance expenses | | | 43,764 | |
| Transfer agent fees (Note 3) | | | 81,143 | |
| Advisory fees (Note 3) | | | 2,037,161 | |
| Custodian fees | | | 26,861 | |
| Trustees’ fees and expenses (Note 3) | | | 12,053 | |
| Printing expenses | | | 9,877 | |
| Chief Compliance Officer fee (Note 3) | | | 20,833 | |
| Other expenses | | | 85,051 | |
| Total expenses before waiver/reimbursement (Note 3) | | | 2,909,412 | |
| Expense waiver/reimbursement (Note 3) | | | (225,792 | ) |
| Net expenses | | | 2,683,620 | |
| Net Investment Income | | | 5,789,284 | |
| | | | | |
| REALIZED AND UNREALIZED GAIN/(LOSS) ON INVESTMENTS: | | | | |
| Net realized gain on investments | | | 3,792,942 | |
| Net change in unrealized appreciation on investments | | | 20,662,213 | |
| Net Realized and Unrealized Gain on Investments | | | 24,455,155 | |
| | | | | |
| Net Increase in Net Assets from Operations | | $ | 30,244,439 | |
See Notes to Financial Statements.
| Axonic Strategic Income Fund | Statement of Changes in Net Assets |
| | | For the Period
December 31, 2019
(Commencement of
Operations) to
October 31, 2020 |
| FROM OPERATIONS: | | | | |
| Net investment income | | $ | 5,789,284 | |
| Net realized gain on investments | | | 3,792,942 | |
| Net change in unrealized appreciation on investments | | | 20,662,213 | |
| Net Increase in Net Assets from Operations | | | 30,244,439 | |
| | | | | |
| | | | | |
| DISTRIBUTIONS TO SHAREHOLDERS: | | | | |
| From distributable earnings | | | | |
| Institutional Class | | | (5,303,262 | ) |
| Class A | | | (168,760 | ) |
| Decrease in Net Assets from Distributions to Shareholders | | | (5,472,022 | ) |
| | | | | |
| CAPITAL SHARE TRANSACTIONS: | | | | |
| Class A | | | | |
| Proceeds from sale of shares of beneficial interest | | | 22,873,405 | |
| Shares issued in reinvestment of distributions | | | 168,700 | |
| Disbursements for redemption of shares of beneficial interest | | | (776,228 | ) |
| Institutional Class | | | | |
| Proceeds from sale of shares of beneficial interest | | | 616,565,142 | |
| Shares issued in reinvestment of distributions | | | 3,263,343 | |
| Disbursements for redemption of shares of beneficial interest | | | (28,831,454 | ) |
| Net Increase from Capital Share Transactions | | | 613,262,908 | |
| Net Increase in Net Assets | | | 638,035,325 | |
| | | | | |
| NET ASSETS: | | | | |
| Beginning of period | | | 100,000 | |
| End of period | | $ | 638,135,325 | |
| | | | | |
| OTHER INFORMATION: | | | | |
| CAPITAL SHARE TRANSACTIONS: | | | | |
| Class A | | | | |
| Beginning shares | | | – | |
| Issued | | | 2,386,963 | |
| Distributions reinvested | | | 17,487 | |
| Redeemed | | | (80,479 | ) |
| Institutional Class | | | | |
| Beginning shares | | | 10,000 | |
| Issued | | | 66,211,177 | |
| Distributions reinvested | | | 339,007 | |
| Redeemed | | | (3,010,067 | ) |
| Net increase in capital shares | | | 65,864,088 | |
| Ending shares | | | 65,874,088 | |
See Notes to Financial Statements.
| Annual Report | October 31, 2020 | 13 |
| Axonic Strategic Income Fund Class A | Financial Highlights |
For a Share Outstanding Throughout the Period Presented
| | | For the Period
July 17, 2020
(Commencement of
Operations) to
October 31, 2020 |
| OPERATING PERFORMANCE: | | | | |
| Net asset value - beginning of period | | $ | 9.55 | |
| INCOME/(LOSS) FROM INVESTMENT OPERATIONS: | | | | |
| Net investment income(a) | | | 0.06 | |
| Net realized and unrealized gain on investments | | | 0.15 | |
| Total Income from Investment Operations | | | 0.21 | |
| | | | | |
| DISTRIBUTIONS TO SHAREHOLDERS: | | | | |
| From net investment income | | | (0.08 | ) |
| Total Distributions to Shareholders | | | (0.08 | ) |
| | | | | |
| Net asset value - end of period | | $ | 9.68 | |
| | | | | |
| Total Investment Return - Net Asset Value(b) | | | 2.17 | %(c)(d) |
| | | | | |
| RATIOS AND SUPPLEMENTAL DATA: | | | | |
| Net assets end of period (000s) | | $ | 22,495 | |
| Ratio of expenses to average net assets excluding reimbursement(e) | | | 1.84 | %(f) |
| Ratio of expenses to average net assets including reimbursement(e) | | | 1.50 | %(f) |
| Ratio of net investment income to average net assets(e) | | | 2.28 | %(f) |
| Portfolio turnover rate | | | 54 | %(c) |
| (a) | Calculated using average shares method. |
| (b) | Total returns are for the period indicated and have not been annualized. Total returns would have been lower had certain expenses not been reimbursed during the period. Returns shown do not reflect the deduction of taxes that a shareholder would pay on Fund distributions or the redemption of Fund shares. Returns shown exclude applicable sales charges. |
| (d) | Includes adjustments in accordance with accounting principles generally accepted in the United States of America and, consequently, the net asset values for financial reporting purposes and the returns based upon those net asset values may differ from the net asset values and returns for shareholder transactions. |
| (e) | Expenses and net investment income/(loss) amounts used to calculate the ratios above include amounts allocated to investors. An individual investor’s results may vary based on a variety of factors and the timing of capital transactions. |
| | (f) | Annualized. |
See Notes to Financial Statements.
| Axonic Strategic Income Fund Institutional Class | Financial Highlights |
For a Share Outstanding Throughout the Period Presented
| | | For the Period
December 31, 2019
(Commencement of
Operations) to
October 31, 2020 |
| OPERATING PERFORMANCE: | | | | |
| Net asset value - beginning of period | | $ | 10.00 | |
| INCOME/(LOSS) FROM INVESTMENT OPERATIONS: | | | | |
| Net investment income(a) | | | 0.19 | |
| Net realized and unrealized gain on investments | | | (0.40 | )(b) |
| Total Loss from Investment Operations | | | (0.21 | ) |
| | | | | |
| DISTRIBUTIONS TO SHAREHOLDERS: | | | | |
| From net investment income | | | (0.10 | ) |
| Total Distributions to Shareholders | | | (0.10 | ) |
| | | | | |
| Net asset value - end of period | | $ | 9.69 | |
| | | | | |
| Total Investment Return - Net Asset Value(c) | | | (2.11 | %)(d)(e) |
| | | | | |
| RATIOS AND SUPPLEMENTAL DATA: | | | | |
| Net assets end of period (000s) | | $ | 615,640 | |
| Ratio of expenses to average net assets excluding reimbursement(f) | | | 1.19 | %(g) |
| Ratio of expenses to average net assets including reimbursement(f) | | | 1.10 | %(g) |
| Ratio of net investment income to average net assets(f) | | | 2.40 | %(g) |
| Portfolio turnover rate | | | 54 | %(d) |
| (a) | Calculated using average shares method. |
| (b) | Realized and unrealized gains and losses per share in this caption are balancing amounts necessary to reconcile the change in net asset value per share for the period, and may not reconcile with the aggregate gains and losses in the Statement of Operations due to share transactions for the period. |
| (c) | Total returns are for the period indicated and have not been annualized. Total returns would have been lower had certain expenses not been reimbursed during the period. Returns shown do not reflect the deduction of taxes that a shareholder would pay on Fund distributions or the redemption of Fund shares. Returns shown exclude applicable sales charges. |
| (e) | Includes adjustments in accordance with accounting principles generally accepted in the United States of America and, consequently, the net asset values for financial reporting purposes and the returns based upon those net asset values may differ from the net asset values and returns for shareholder transactions. |
| (f) | Expenses and net investment income/(loss) amounts used to calculate the ratios above include amounts allocated to investors. An individual investor’s results may vary based on a variety of factors and the timing of capital transactions. |
See Notes to Financial Statements.
| Annual Report | October 31, 2020 | 15 |
| Axonic Strategic Income Fund | Notes to Financial Statements |
October 31, 2020
1. ORGANIZATION
Axonic Strategic Income Fund (the “Fund”) is registered under the Investment Company Act of 1940, as amended (“1940 Act”), as a non-diversified, open-end management investment company. The Fund was organized as a Delaware statutory trust on October 17, 2019 pursuant to a Declaration of Trust governed by the laws of the State of Delaware. Axonic Capital LLC (the “Adviser”) acts as the Fund’s investment adviser. The Adviser is a registered investment adviser and is responsible for making the investment decisions for the Fund’s portfolio. The Fund’s investment objective is to seek total return. The Fund’s portfolio will be deemed to be non-diversified under the 1940 Act, meaning it may invest a greater percentage of its assets in a single or limited number of issuers than a diversified fund. Under normal circumstances, the Fund will concentrate its investments (i.e., invest 25% or more of its total assets (measured at the time of purchase)) in Mortgage-Backed Securities (“MBS”) and other mortgage-related securities (such as CMOs), which the Fund treats as investments in a group of industries.
The Fund currently offers Class A and Class I shares. Class A shares commenced operations on July 17, 2020 and Class I commenced operations on December 31, 2019. Class A shares are offered subject to a maximum sales charge of 2.25%. Class I shares are offered at NAV and are not subject to sales charges. The Fund may offer additional classes of shares in the future.
2. SIGNIFICANT ACCOUNTING POLICIES
The following is a summary of significant accounting policies followed by the Fund in preparation of its financial statements. These policies are in conformity with accounting principles generally accepted in the United States of America (“GAAP”). The Fund is considered an investment company for financial reporting purposes under GAAP. The Fund follows the investment company accounting and reporting guidance of the Financial Accounting Standards Board (“FASB”) Accounting Standard Codification (“ASC”) Topic 946 “Financial Services – Investment Companies” including FASB Accounting Standard Update (“ASU”) 2013-08. The preparation of financial statements requires management to make estimates and assumptions that affect the reported amounts of assets and liabilities and disclosure of contingent assets and liabilities at the date of the financial statements and the reported amounts of income and expenses for the period. Actual results could differ from those estimates.
Securities Valuation – The Fund’s Board of Trustees (the “Board”) has approved pricing policies and procedures and fair valuation policies and procedures pursuant to which the Fund will value its investments. The Adviser has appointed an independent Administrator of the Fund, pursuant to the administration agreement, under which the Administrator independently calculates the daily Net Asset Value per share (“NAV”) of the Fund. In doing so, the Administrator, on a daily basis, in compliance with the policies and procedures described above, independently values the investment positions within the Fund’s portfolio. The Administrator at its discretion may notify the Fund or the Board of any valuation conflicts and/or non-compliance with the policies and procedures. The Administrator and the Adviser will include in quarterly written reports to the Board confirmation that the policies and procedures provide fair and accurate prices. Securities listed on an exchange are valued at the last reported sale price at the close of the regular trading session of the exchange on the business day the value is being determined. Investments in shares of funds, including money market funds, that are not traded on an exchange are valued at the end of day net asset value (“NAV”) per share of such fund.
Structured credit and other similar debt securities including, but not limited to, asset-backed securities, collateralized debt obligations, collateralized loan obligations, collateralized mortgage obligations, mortgage-backed securities, commercial mortgage-backed security, and other securitized investments backed by certain debt or other receivables (collectively, “Structured Credit Securities”), are valued on the basis of valuations provided by independent pricing services and /or dealers in those instruments recommended by the Adviser and approved by the Board. In determining fair value, pricing services and dealers will generally use information with respect to transactions in the securities being valued, quotations from other dealers, market transactions in comparable securities, analyses and evaluations of various relationships between securities, and yield to maturity information. The Adviser will, based on its reasonable judgment, select the pricing service or dealer quotation that most accurately reflects the fair market value of the Structured Credit Security while taking into account the information utilized by the pricing service or dealer to formulate the quotation in addition to any other relevant factors.
When price quotations for certain securities are not readily available, or if the available quotations are not believed to be reflective of market value by the Adviser, those securities will be valued at “fair value” as determined in good faith by the Adviser’s Valuation Committee using the fair valuation policies and procedures adopted by, and under the supervision of, the Board. There can be no assurance that the Fund could purchase or sell a portfolio security at the price used to calculate the Fund’s NAV.
The fair valuation policies and procedures may be used to value a substantial portion of the assets of the Fund. The Fund may use the fair value of a security to calculate its NAV when, for example, (1) a portfolio security is not traded in a public market or the principal market in which the security trades is closed, (2) trading in a portfolio security is suspended and has not resumed prior to the normal market close, (3) a portfolio security is not traded in significant volume for a substantial period, or (4) the Adviser determines that the quotation or price for a portfolio security provided by an independent pricing service and broker-dealer is inaccurate.
| Axonic Strategic Income Fund | Notes to Financial Statements |
October 31, 2020
The “fair value” of securities may be difficult to determine and thus judgment plays a greater role in the valuation process. The fair valuation methodology may include or consider the following guidelines, as appropriate: (1) evaluation of all relevant factors, including but not limited to, pricing history, current market level and supply and demand of the respective security; (2) comparison to the values and current pricing of securities that have comparable characteristics; (3) knowledge of historical market information with respect to the security; and (4) other factors relevant to the security which would include, but not be limited to, duration, yield, fundamental analytical data, the Treasury yield curve and credit quality.
Fair Value Measurements – A three-tier hierarchy has been established to classify fair value measurements for disclosure purposes. Inputs refer broadly to the assumptions that market participants would use in pricing the asset or liability, including assumptions about risk. Inputs may be observable or unobservable. Observable inputs are inputs that reflect the assumptions market participants would use in pricing the asset or liability that are developed based on market data obtained from sources independent of the reporting entity. Unobservable inputs are inputs that reflect the reporting entity’s own assumptions about the assumptions market participants would use in pricing the asset or liability that are developed based on the best information available. In accordance with the authoritative guidance on fair value measurements and disclosure under GAAP, the Fund discloses the fair value of its investments in a hierarchy that prioritizes the inputs to valuation techniques used to measure the fair value.
Various inputs are used in determining the value of the Fund’s investments as of the reporting period end. These inputs are categorized in the following hierarchy under applicable financial accounting standards:
| Level 1 – | Unadjusted quoted prices in active markets for identical, unrestricted assets or liabilities that the Fund has the ability to access at the measurement date; |
| Level 2 – | Quoted prices which are not active, quoted prices for similar assets or liabilities in active markets or inputs other than quoted prices that are observable (either directly or indirectly) for substantially the full term of the asset or liability at the measurement date; and |
| Level 3 – | Significant unobservable prices or inputs (including the Fund’s own assumptions in determining the fair value of investments) where there is little or no market activity for the asset or liability at the measurement date. |
The availability of observable inputs can vary from security to security and is affected by a wide variety of factors, including, for example, the type of security, whether the security is new and not yet established in the marketplace, the liquidity of markets and other characteristics particular to the security. To the extent that valuation is based on models or inputs that are less observable or unobservable in the market, the determination of fair value requires more judgment. Accordingly, the degree of judgment exercised in determining fair value is greatest for instruments categorized in Level 3.
An investment level within the fair value hierarchy is based on the lowest level input, individually or in the aggregate, that is significant to fair value measurement. To the extent practicable, the Adviser generally endeavors to maximize the use of observable inputs and minimize the use of unobservable inputs by requiring that the most observable inputs are to be used when available.
| Annual Report | October 31, 2020 | 17 |
| Axonic Strategic Income Fund | Notes to Financial Statements |
October 31, 2020
The inputs or methodologies used for valuing securities are not necessarily an indication of the risk or liquidity associated with investing in those securities. The following is a summary of the inputs used in valuing the Fund’s investments as of October 31, 2020:
| Investments in Securities at Value(a) | | Level 1 -
Quoted Prices | | Level 2 -
Other Significant Observable Inputs | | Level 3 -
Significant Unobservable Inputs | | Total |
| Common Stocks | | $ | 5,926,912 | | | $ | – | | | $ | – | | | $ | 5,926,912 | |
| Preferred Stocks | | | 35,460 | | | | – | | | | – | | | | 35,460 | |
| Asset-Backed Securities | | | – | | | | 65,381,995 | | | | – | | | | 65,381,995 | |
| Bank Loan | | | – | | | | 23,460,000 | | | | – | | | | 23,460,000 | |
| Commercial Mortgage-Backed Securities | | | – | | | | 226,966,366 | | | | – | | | | 226,966,366 | |
| Corporate Bonds | | | – | | | | 30,596,700 | | | | – | | | | 30,596,700 | |
| Residential Mortgage-Backed Securities | | | – | | | | 186,548,095 | | | | – | | | | 186,548,095 | |
| Short Term Investments | | | 107,782,827 | | | | – | | | | – | | | | 107,782,827 | |
| Total | | $ | 113,745,199 | | | $ | 532,953,156 | | | $ | – | | | $ | 646,698,355 | |
| (a) | For detailed descriptions of industries, see the accompanying Schedule of Investments. |
Securities Transactions and Investment Income – Investment security transactions are accounted for on a trade date basis. Cost is determined and gains and losses are based upon the specific identification method for both financial statement and federal income tax purposes. Dividend income is recorded on the ex-dividend date and interest income is recorded on the accrual basis. Dividend income from REITs is recognized on the ex-dividend date. It is common for distributions from REITs to exceed taxable earnings and profits, resulting in the excess portion of such dividends being designated as a return of capital. The calendar year-end amounts of ordinary income, capital gains, and return of capital included in distributions received from the Fund’ investment in REITs are reported to the Fund after the end of the calendar year; accordingly, the Fund estimates these amounts for accounting purposes until the characterization of REIT distributions is reported to the Fund after the end of the calendar year. Estimates are based on the most recent REIT distribution information available.
Premium and Discount Amortization/Paydown Gains and Losses – All premiums and discounts on fixed-income securities are amortized/accreted over the estimated lives of such securities for financial statement purposes using the effective interest method. Gains and losses realized on principal payments of mortgage-backed securities (paydown gains and losses) are classified as part of interest income.
Concentration of Credit Risk – The Fund places its cash with one banking institution, which is insured by Federal Deposit Insurance Corporation (“FDIC”). The FDIC limit is $250,000. At various times throughout the year, the amount on deposit may exceed the FDIC limit and subject the Fund to a credit risk. The Fund does not believe that such deposits are subject to any unusual risk associated with investment activities.
Federal and Other Taxes – No provision for income taxes is included in the accompanying financial statements, as the Fund intends to distribute to shareholders all taxable investment income and realized gains and otherwise comply with Subchapter M of the Internal Revenue Code of 1986, as amended, applicable to regulated investment companies.
The Fund evaluates tax positions taken (or expected to be taken) in the course of preparing the Fund’s tax provisions to determine whether these positions meet a “more-likely-than-not” standard that, based on the technical merits, have a more than fifty percent likelihood of being sustained by a taxing authority upon examination. A tax position that meets the “more-likely-than-not” recognition threshold is measured to determine the amount of benefit to recognize in the financial statements.
As of and during the period ended October 31, 2020, the Fund did not have a liability for any unrecognized tax benefits. The Fund files U.S. federal, state and local tax returns as required. The Fund’s tax returns are subject to examination by the relevant tax authorities until expiration of the applicable statute of limitations which is generally three years after the filing of the tax return for federal purposes and four years for most state returns. Tax returns for the initial period have incorporated no uncertain tax positions that require a provision for income taxes.
Distributions to Shareholders – Distributions from the Fund’s net investment income are accrued daily and typically paid quarterly. However, there can be no assurances that the Fund will achieve any level of distribution to its Shareholders. The Fund intends to make sufficient distributions of its ordinary taxable income and capital gain net income prior to the end of each calendar year to avoid liability for the excise tax. The character of income and gains to be distributed is determined in accordance with income tax regulations, which may differ from GAAP.
| Axonic Strategic Income Fund | Notes to Financial Statements |
October 31, 2020
Offering Costs - Offering costs incurred by the Fund were treated as deferred charges until operations commenced and are being amortized over a 12-month period using the straight line method. As of October 31, 2020, $105,312 in offering costs have been amortized. Unamortized amounts are included in deferred offering costs in the Statement of Assets and Liabilities.
Indemnification - The Fund indemnifies its officers and trustees for certain liabilities that may arise from the performance of their duties to the Fund. Additionally, in the normal course of business, the Fund enters into contracts that contain a variety of representations and warranties which provide general indemnities. The Fund’s maximum exposure under these arrangements is unknown, as this would involve future claims that may be made against the Fund that have not yet occurred. However, the Fund expects the risk of loss due to these warranties and indemnities to be remote.
3. ADVISORY FEES AND OTHER TRANSACTIONS WITH SERVICE PROVIDERS
Advisory Fees - Pursuant to the investment advisory agreement by and between the Trust, on behalf of the Fund, and the Adviser (the “Investment Advisory Agreement”), and in consideration of the advisory services provided by the Adviser to the Fund, the Adviser is entitled to a management fee equal to 0.85% of the Fund’s average daily net assets. For the period ended October 31, 2020, the Fund incurred $2,037,161 in Advisory fees.
The Adviser has contractually agreed to waive its fees and/or reimburse certain expenses (inclusive of organizational and offering costs, but exclusive of any taxes, interest on borrowings, dividends on securities sold short, brokerage commissions, 12b-1 fees, acquired fund fees and expenses, expenses incurred in connection with any merger or reorganization and extraordinary expenses) to limit the Fund’s Total Annual Fund Operating Expenses after Fee Waiver/Expense Reimbursement to 1.10% of the Fund’s average daily net assets (the “Expense Limit”) through December 31, 2021. The Expense Limit excludes certain expenses and, consequently, the Fund’s Total Annual Fund Operating Expenses after Fee Waiver/Expense Reimbursement may be higher than the Expense Limit. The contractual waiver and expense reimbursement may be changed or eliminated at any time by the Board of Trustees, on behalf of the Fund, upon 60 days’ written notice to the Adviser. The contractual fee waiver and expense reimbursement may not be terminated by the Adviser without the consent of the Board of Trustees. The Adviser may recoup from the Fund any waived amount or reimbursed expenses pursuant to this agreement if such recoupment does not cause the Fund to exceed the current Expense Limit or the Expense Limit in place at the time of the waiver or reimbursement (whichever is lower) and the recoupment is made within three years after the end of the month in which the Adviser incurred the expense. During the period ended October 31, 2020, the Adviser reimbursed expenses of $225,792.
As of October 31, 2020, the following amounts were available for recoupment by the Adviser based upon their potential expiration dates:
| | | Expires |
| Fund | | 2023 |
| Axonic Strategic Income Fund | | | | |
| Class A | | $ | 19,140 | |
| Institutional Class | | | 206,652 | |
Chief Compliance Officer ("CCO") Services - The CCO of the Fund is an affiliate of the Fund. For the period ended October 31, 2020, the total related amounts paid by the Fund for CCO fees are included in Chief Compliance Officer fees on the Fund’s Statement of Operations.
Fund Accounting and Administration Fees and Expenses - ALPS Fund Services, Inc. (“ALPS”) serves as the Fund’s administrator and accounting agent (the “Administrator”) and receives customary fees from the Fund for such services.
Transfer Agent - DST Systems Inc., an affiliate of ALPS, serves as transfer, dividend paying and shareholder servicing agent for the Fund (“Transfer Agent”).
Distributor - The Fund has entered into a distribution agreement with ALPS Distributors, Inc. (the “Distributor”) to provide distribution services to the Fund. There are no fees paid to the Distributor pursuant to the distribution agreement.
The Distributor acts as the Fund’s principal underwriter in a continuous public offering of the Fund’s shares. The Distributor is an affiliate of ALPS. During the period ended October 31, 2020, no fees were retained by the Distributor.
| Annual Report | October 31, 2020 | 19 |
| Axonic Strategic Income Fund | Notes to Financial Statements |
October 31, 2020
Trustees - Officers of the Trust and the Trustees who are interested persons of the Trust or the Adviser receive no salary from the Trust. The Independent Trustees also serve as independent trustees on the Board of Trustees of the Axonic Alternative Income Fund, a closed-end interval fund for which Axonic Capital LLC also serves as the investment adviser. For their service on the Board and the Board of Trustees of Axonic Alternative Income Fund, the Independent Trustees receive the following fees, which are split between the Fund and the Axonic Alternative Income Fund pro rata based on assets under management: an annual retainer of $4,000 and a fee of $2,000 for each Board meeting attended in person and $1,000 for each Board meeting attended by telephone. The Fund reimburses each Trustee and officer of the Trust for his or her travel and other expenses relating to attendance at Board or committee meetings.
4. INVESTMENT TRANSACTIONS
The cost of purchases and proceeds from the sale of securities, other than short-term securities, for the year ended October 31, 2020, amounted to $630,613,982 and $117,637,174, respectively.
5. TAX BASIS INFORMATION
Distributions are determined in accordance with federal income tax regulations, which differ from GAAP, and, therefore, may differ significantly in amount or character from net investment income and realized gains for financial reporting purposes. Financial reporting records are adjusted for permanent book/tax differences to reflect tax character but are not adjusted for temporary differences.
For the year ended October 31, 2020, the following reclassifications, which had no impact on results of operations or net assets, were recorded to reflect tax character. The main cause of the permanent differences was non-deductible expenses for tax purposes.
| | Decrease
Paid-in capital | | Increase in Distributable Earnings |
| | $ | (135 | ) | | $ | 135 | |
The tax character of distributions paid for the period ended October 31, 2020, was as follows:
| 2020 | | |
| Distributions Paid From: | | | | |
| Ordinary Income | | $ | 5,472,022 | |
| Total | | $ | 5,472,022 | |
As of October 31, 2020, the components of distributable earnings / (accumulated deficit) on a tax basis were as follows:
| Accumulated net investment income | | $ | 4,106,638 | |
| Accumulated net realized gain | | | 3,701 | |
| Net unrealized appreciation | | | 20,662,213 | |
| Total | | $ | 24,772,552 | |
As of October 31, 2020, net unrealized appreciation/(depreciation) of investments based on the federal tax cost were as follows:
| Cost of investments for income tax purposes | | $ | 626,036,142 | |
| Gross appreciation (excess of value over tax cost) | | $ | 21,744,993 | |
| Gross depreciation (excess of tax cost over value) | | | (1,082,780 | ) |
| Net unrealized appreciation | | $ | 20,662,213 | |
| Axonic Strategic Income Fund | Notes to Financial Statements |
October 31, 2020
On June 10, 2020, the Fund entered into a $40,000,000 uncommitted, secured, revolving line of credit agreement (“Credit Agreement”) with U.S. Bank National Association for redemption purposes, subject to annual renewal and other limitations of the 1940 Act for borrowings. Borrowings under the Credit Agreement bear interest of the lender’s prime rate at the time of borrowing. Borrowings under the Credit Agreement are secured by a perfected, first priority security interest in the assets of the Fund. The Fund had no borrowings during the period ended October 31, 2020.
7. SIGNIFICANT SHAREHOLDERS
The beneficial ownership, either directly or indirectly, of more than 25% of the voting securities of a Fund creates a presumption of control of the Fund under Section 2(a)(9) of the 1940 Act. As of October 31, 2020, the following entities owned beneficially more than 25% of the Fund’s outstanding shares. The shares may be held under omnibus accounts (whereby the transactions of two or more shareholders are combined and carried in the name of the originating broker rather than designated separately). Any transaction by these investors could have a material impact on the share class.
| Name | Percentage | |
| National Financial Services LLC | 51.35% | |
| Charles Schwab & Co Inc | 41.04% | |
| Annual Report | October 31, 2020 | 21 |
| Axonic Strategic Income Fund | Report of Independent Registered
Public Accounting Firm |
To the Shareholders of Axonic Strategic Income Fund
and Board of Trustees of Axonic Funds
Opinion on the Financial Statements
We have audited the accompanying statement of assets and liabilities, including the schedule of investments, of Axonic Strategic Income Fund (the “Fund”), a series of Axonic Funds (the “Trust”), as of October 31, 2020, the related statements of operations and changes in net assets, and the financial highlights, including the related notes, for the period December 31, 2019 (commencement of operations) through October 31, 2020 (collectively referred to as the “financial statements”). In our opinion, the financial statements present fairly, in all material respects, the financial position of the Fund as of October 31, 2020, and the results of its operations, the changes in its net assets, and the financial highlights for the period then ended, in conformity with accounting principles generally accepted in the United States of America.
Basis for Opinion
These financial statements are the responsibility of the Fund’s management. Our responsibility is to express an opinion on the Fund’s financial statements based on our audit. We are a public accounting firm registered with the Public Company Accounting Oversight Board (United States) (“PCAOB”) and are required to be independent with respect to the Fund in accordance with the U.S. federal securities laws and the applicable rules and regulations of the Securities and Exchange Commission and the PCAOB.
We conducted our audit in accordance with the standards of the PCAOB. Those standards require that we plan and perform the audit to obtain reasonable assurance about whether the financial statements are free of material misstatement whether due to error or fraud.
Our audit included performing procedures to assess the risks of material misstatement of the financial statements, whether due to error or fraud, and performing procedures that respond to those risks. Such procedures included examining, on a test basis, evidence regarding the amounts and disclosures in the financial statements. Our procedures included confirmation of securities owned as of October 31, 2020, by correspondence with the custodian, agent banks, and brokers. Our audit also included evaluating the accounting principles used and significant estimates made by management, as well as evaluating the overall presentation of the financial statements. We believe that our audit provides a reasonable basis for our opinion.
We have served as the Fund’s auditor since 2019.
 | |
| | |
| COHEN & COMPANY, LTD. | |
| Cleveland, Ohio | |
| December 23, 2020 | |
| Axonic Strategic Income Fund | Additional Information |
October 31, 2020 (Unaudited)
PROXY VOTING POLICIES AND VOTING RECORD
A description of the policies and procedures that the Fund uses to vote proxies relating to portfolio securities is available without charge upon request by calling toll-free 888-926-2688, or on the SEC’s website at http://www.sec.gov. Information regarding how the Fund voted proxies relating to its portfolio securities during the most recent 12-month period ended June 30th is available without charge upon request by calling toll-free 833-429-6642, or on the SEC’s website at http://www.sec.gov.
QUARTERLY PORTFOLIO HOLDINGS
The Fund files its complete schedule of portfolio holdings with the SEC for the first and third quarters of each fiscal year as an exhibit to its reports on Form N-PORT; the Fund’s Form N-PORT reports are available on the SEC’s Website at http://www.sec.gov.
| Annual Report | October 31, 2020 | 23 |
| Axonic Strategic Income Fund | Trustees and Officers |
October 31, 2020 (Unaudited)
The Board is responsible for the overall management of the Trust, including general supervision and review of the investment activities of the Fund. The Board, in turn, elects the officers of the Trust, who are responsible for administering the day-to-day operations of the Fund. Unless otherwise indicated in the table below, the address of each Trustee and officer of the Fund is 520 Madison Avenue, 42nd Floor, New York, New York 10022. Information about the Trustees and officers of the Fund is provided in the table below. Additional information about members of the Board of Trustees and Officers of the Trust is available in the Statement of Additional Information, which is available, without charge, upon request, by calling the Funds (toll-free) at 1-833-429-6642 (833-4Axonic).
| Name and Year of Birth | Position with the Fund | Term of Office and Length of Time Served | Principal Occupation(s) During Past 5 Years | Number of Portfolios in Fund Complex* Overseen by Trustee | Other Directorships Held During the Past 5 Years |
| INDEPENDENT TRUSTEES OF THE TRUST |
| Joshua M. Barlow 1978 | Independent Trustee | Indefinite Term; Since Inception | Managing Director, Valhalla Fiduciary (June 2018 - present); Head of Operational Due Diligence and Accounting and other positions, PAAMCO (Pacific Alternative Asset Management Company, LLC) (March 2006 - June 2018). | 2 | Axonic Alternative Income Fund |
| Charles D. Mires 1960 | Independent Trustee | Indefinite Term; Since Inception | Director CIB Marine Bancshares, Inc. (2010 - present); Retired from full time employment December, 2015; Director of Fixed Income, Alternative Strategies, and Third Party Mandates, Franklin Street Partners (2011- 2015). | 2 | Axonic Alternative Income Fund; CIB Marine Bancshares, Inc. |
| Thomas S. Vales 1964 | Independent Trustee | Indefinite Term; Since April 15, 2020 | Chief Executive Officer, TMC Bonds LLC (an alternative trading system for fixed income) (2000 - 2019); Member, FINRA Fixed Income Advisory Committee (2016-2018). | 2 | Axonic Alternative Income Fund |
| INTERESTED TRUSTEE OF THE TRUST** |
| Clayton DeGiacinto 1972 | Trustee, President (Principal Executive Officer) | Indefinite Term; Since Inception | Managing Member and Chief Investment Officer, Axonic Capital LLC (2010 - present). | 2 | Axonic Alternative Income Fund |
| * | The Fund complex consists of the Fund and the Axonic Alternative Income Fund, a registered closed-end interval fund for which Axonic Capital LLC also serves as the investment adviser. |
| ** | Clayton DeGiacinto is an Interested Trustee because he is the Managing Member and Chief Investment Officer of the Adviser. |
| Axonic Strategic Income Fund | Trustees and Officers |
October 31, 2020 (Unaudited)
| Name and Year of Birth | Position with the Fund | Term of Office and Length of Time Served | Principal Occupation(s) During Past 5 Years |
| OFFICERS OF THE TRUST |
| John Kelly 1978 | Treasurer (Principal Financial Officer) | Indefinite Term; Since Inception | Chief Financial Officer, Axonic Capital LLC (2017 - present); Controller, J. Goldman & Co. LP (June 2015- 2017); Manager of Financial Reporting, Moore Capital Management LP (2003 - 2015). |
| Joseph Grogan 1980 | Secretary; Chief Compliance Officer | Indefinite Term; Since Inception | Chief Compliance Officer, Axonic Capital LLC (February 2018 - present); Chief Compliance Officer, Claren Road Asset Management, LLC (January 2015 - February 2018); Director of Compliance, Claren Road Asset Management, LLC (July 2011 - January 2015). |
| Annual Report | October 31, 2020 | 25 |
| Axonic Strategic Income Fund | Privacy Policy |
October 31, 2020 (Unaudited)
DATA PRIVACY POLICY AND PROCEDURE
Policy Statement:
Axonic Strategic Income Fund (the “Fund”) has in effect the following policy (the “Data Privacy Policy”) with respect to nonpublic personal information about its customers.
The Fund collects nonpublic personal information about its customers1 from the following sources:
| · | account applications and other forms, which may include a customer’s name, address, social security number, and information about a customer’s investment goals and risk tolerance; |
| · | account history, including information about the transactions and balances in a customer’s account; and |
| · | correspondence, written, or telephonic, between a customer and the Fund or service providers to the Fund. |
In addition, the Fund may obtain consumer information about its customers from consumer reports.
The Fund will not release nonpublic personal or consumer information about its customers or their accounts unless one of the following conditions is met:
| · | Prior written consent is received. |
| · | The Fund believes the recipient to be the customer of the Fund or such Fund customer’s authorized representative. |
| · | The Fund is required by law to release information to the recipient. |
The Fund does not give or sell nonpublic personal or consumer information about its customers or their fund accounts to any other company, individual, or group.
The Fund will only use nonpublic personal or consumer information about its customers and their accounts to attempt to better serve their investment needs or to suggest services or educational materials that may be of interest to them.
The Fund restricts access to nonpublic personal and consumer information about customers to those employees who need to know that information in order to provide products or services. The Fund may also share personal information with companies that it hires to provide support services. When the Fund or its Transfer Agent shares nonpublic personal or consumer information with other service providers, it protects that information with a strict confidentiality agreement. The Fund also maintains reasonable physical, electronic and procedural safeguards that comply with federal standards to protect against unauthorized access to and properly dispose of customers’ nonpublic personal and consumer information.
The Fund will adhere to the policies and practices described in this notice for current and former shareholders of the Fund.
II. Physical, Electronic and Procedural Safeguards
The following includes a list of the primary physical, electronic and procedural safeguards employed by the Transfer Agent to ensure against unauthorized access and proper disposal of customers’ nonpublic personal and consumer information.
| · | The Fund shall distribute this Data Privacy Policy annually to shareholders through the Fund’s annual report to shareholders to ensure compliance with shareholder notification requirements mandated by Regulation S-P. |
| · | Should a change in this Data Privacy Policy occur during the year that requires a change to this Data Privacy Policy, the Principal Underwriter or Transfer Agent will provide existing customers of the Fund with an updated Data Privacy Policy. |
| · | The Transfer Agent shall maintain a third-party list that identifies any non-affiliated third-parties that do business with the Transfer Agent, the type(s) of service(s) provided, whether there is an exchange of non-public personal information, and whether these relationships fall outside of any exceptions and/or exemptions to the opt-out requirements afforded under Regulation S-P. Appropriate confidentiality language must exist in the contractual arrangements with each of these relations. |
| 1 | For purposes of this Data Privacy Policy, the terms “customer” or “customers” includes both shareholders of the Fund and individuals who provide nonpublic personal information to the Fund, but do not invest in Fund shares. |
| Axonic Strategic Income Fund | Privacy Policy |
October 31, 2020 (Unaudited)
| · | The Transfer Agent, the Administrator, the Fund Accounting Agent, the Principal Underwriter, and Investment Adviser shall maintain procedures related to the security of nonpublic personal information and consumer information (including physical, electronic and procedural safeguards) and properly disposal of such information. |
| · | Any data privacy related questions, concerns or breaches will be brought to the attention of the Fund’s CCO. |
Procedures:
| 1. | The Fund’s CCO will determine that the policies and procedures of the Transfer Agent, Principal Underwriter and the Fund’s other service providers are reasonably designed to safeguard customer information and require only appropriate and authorized access to, and use of, customer information through the application of appropriate administrative, technical, physical, and procedural safeguards that comply with applicable federal standards and regulations. |
| 2. | The Fund’s CCO will continually monitor applicable regulations that may cause policies of the Fund and/or its service providers subject to the requirements of Regulation S-P to change. |
| 3. | Annually, the Fund’s CCO will review any independent reviews applicable to data security at its service providers who have access to or otherwise obtain nonpublic personal information in fulfilling their obligations to the Fund. |
| 4. | Annually, the Fund’s CCO will inquire and review, where applicable, any related data privacy issues reported by the Fund’s service providers who have access to or otherwise obtain nonpublic personal information in fulfilling their obligations to the Fund. |
Adopted: December 31, 2019
| Annual Report | October 31, 2020 | 27 |

AXONIC STRATEGIC INCOME FUND
ANNUAL REPORT
October 31, 2020
| (a) | The registrant, as of the end of the period covered by the report, has adopted a code of ethics that applies to the registrant’s principal executive officer, principal financial officer, principal accounting officer or controller or any persons performing similar functions on behalf of the registrant. |
| (c) | During the period covered by this report, no amendments were made to the provisions of the code of ethics adopted in Item 2(a) above. |
| (d) | During the period covered by this report, no implicit or explicit waivers to the provision of the code of ethics adopted in Item 2(a) above were granted. |
| (f) | The registrant’s Code of Ethics is attached as Exhibit 13.A.1 hereto. |
| Item 3. | Audit Committee Financial Expert. |
The registrant’s Board of Trustees has determined that the registrant has at least one audit committee financial expert serving on its audit committee. The Board of Trustees has designated Joshua M. Barlow as the registrant’s “audit committee financial expert.” Joshua M. Barlow is “independent” as defined in paragraph (a)(2) of Item 3 to Form N-CSR.
| Item 4. | Principal Accountant Fees and Services. Fund Admin top update |
| (a) | Audit Fees: The aggregate fees billed for professional services rendered by the principal accountant for the audit of the registrant's annual financial statements or services that are normally provided by the accountant in connection with statutory and regulatory filings or engagements for the fiscal period from December 31, 2019 (commencement of operations) through October 31, 2020 were $20,000. |
| (b) | Audit-Related Fees: The aggregate fees billed for the fiscal period from December 31, 2019 (commencement of operations) through October 31, 2020 for assurance and related services by the principal accountant that are reasonably related to the performance of the audit of the registrant's financial statements and are not reported under paragraph (a) of this Item were $0. |
| (c) | Tax Fees: The aggregate fees billed for the fiscal period from December 31, 2019 (commencement of operations) through October 31, 2020 for professional services rendered by the principal accountant for tax compliance, tax advice, and tax planning were $5,500. |
| (d) | All Other Fees: The aggregate fees billed for the fiscal period from December 31, 2019 (commencement of operations) through October 31, 2020, for products and services provided by the principal accountant, other than the services reported in paragraphs (a) through (c) of this Item were $0. |
| (e)(1) | Audit Committee Pre-Approval Policies and Procedures: All services to be performed by the Registrant's principal auditors must be pre-approved by the registrant's audit committee. |
| (e)(2) | There were no non-audit services approved or required to be approved by the registrant’s audit committee pursuant to (c)(7)(i)(C) of Rule 2-01 of Regulation S-X. |
| (g) | The aggregate non-audit fees billed by the registrant’s accountant for services rendered to the registrant, and rendered to the registrant’s investment adviser, and any entity controlling, controlled by, or under common control with the adviser that provides ongoing services to the registrant for the fiscal period from December 31, 2019 (commencement of operations) through October 31, 2020 were $0. |
| Item 5. | Audit Committee of Listed Registrants. |
Not applicable.
(a) Schedule of Investments in securities of unaffiliated issuers as of the close of the reporting period is included as part of the Report to Stockholders filed under Item 1 of this Form N-CSR.
(b) Not applicable to the Registrant.
| Item 7. | Disclosure of Proxy Voting Policies and Procedures for Closed-End Management Investment Companies. Update? |
Not applicable.
| Item 8. | Portfolio Managers of Closed-End Management Investment Companies. Advisor to Update |
Not applicable.
| Item 9. | Purchases of Equity Securities by Closed-End Management Investment Company and Affiliated Purchasers. |
Not applicable.
| Item 10. | Submission of Matters to a Vote of Security Holders. |
There have been no material changes to the procedures by which shareholders may recommend nominees to the Registrant’s Board of Trustees, where those changes were implemented after the Registrant last provided disclosure in response to the requirements of Item 407(c)(2)(iv) of Regulation S-K, or this Item.
| Item 11. | Controls and Procedures. |
| (a) | The Registrant’s principal executive officer and principal financial officer have concluded that the Registrant’s disclosure controls and procedures (as defined in Rule 30a-3(c) under the Investment Company Act of 1940, as amended) are effective as of a date within 90 days of the filing date of this report. |
| (b) | There was no change in the Registrant’s internal control over financial reporting (as defined in Rule 30a-3(d) under the Investment Company Act of 1940, as amended) that occurred during the period covered by this report that has materially affected, or is reasonably likely to materially affect, the Registrant’s internal control over financial reporting. |
| Item 12. | Disclosure of Securities Lending Activities for Closed-End Management Investment Companies. |
Not applicable.
SIGNATURES
Pursuant to the requirements of the Securities Exchange Act of 1934 and the Investment Company Act of 1940, the Registrant has duly caused this report to be signed on its behalf by the undersigned, thereunto duly authorized.
Axonic Funds
| By: | /s/ Clayton DeGiacinto | |
| | Clayton DeGiacinto (Principal Executive Officer) | |
| | Chief Executive Officer and President | |
| | | |
| Date: | January 8, 2021 | |
Pursuant to the requirements of the Securities Exchange Act of 1934 and the Investment Company Act of 1940, this report has been signed below by the following persons on behalf of the Registrant and in the capacities and on the dates indicated.
Axonic Funds
| By: | /s/ Clayton DeGiacinto | |
| | Clayton DeGiacinto (Principal Executive Officer) | |
| | Chief Executive Officer and President | |
| | | |
| Date: | January 8, 2021 | |
| By: | /s/ John R. Kelly | |
| | John R. Kelly (Principal Financial Officer) | |
| | Treasurer and Chief Financial Officer | |
| | | |
| Date: | January 8, 2021 | |