UNITED STATES
SECURITIES AND EXCHANGE COMMISSION
Washington, D.C. 20549
FORM N-CSR
CERTIFIED SHAREHOLDER REPORT OF REGISTERED
MANAGEMENT INVESTMENT COMPANIES
Investment Company Act file number: 811-23483
Axonic Funds
(exact name of registrant as specified in charter)
520 Madison Avenue, 42nd Floor
New York, NY 10022
(Address of Principal Office)
Clayton DeGiacinto, President
c/o Axonic Capital LLC
520 Madison Avenue, 42nd Floor
New York, New York 10022
(Name and Address of Agent for Service)
Copies of information to:
Jeffrey Skinner
Kilpatrick Townsend & Stockton LLP
1001 West Fourth Street
Winston-Salem, NC 27101
Registrant’s telephone number, including area code: (212) 259-0430
Date of fiscal year end: October 31
Date of reporting period: October 31, 2024
Form N-CSR is to be used by management investment companies to file reports with the Commission not later than 10 days after the transmission to stockholders of any report that is required to be transmitted to stockholders under Rule 30e-1 under the Investment Company Act of 1940 (17 CFR 270.30e-1). The Commission may use the information provided on Form N-CSR in its regulatory, disclosure review, inspection, and policymaking roles.
A registrant is required to disclose the information specified by Form N-CSR, and the Commission will make this information public. A registrant is not required to respond to the collection of information contained in Form N-CSR unless the Form displays a currently valid Office of Management and Budget (“OMB”) control number. Please direct comments concerning the accuracy of the information collection burden estimate and any suggestions for reducing the burden to Secretary, Securities and Exchange Commission, 100 F Street, NE, Washington, DC 20549-1090. The OMB has reviewed this collection of information under the clearance requirements of 44 U.S.C. § 3507.
| Item 1. | Report to Stockholders. |
Axonic Strategic Income Fund
ANNUAL SHAREHOLDER REPORT - October 31, 2024
This annual shareholder report contains important information about Axonic Strategic Income Fund - A for the period of November 1, 2023 to October 31, 2024.
You can find additional information about the Fund at https://www.axonicfunds.com/funds/daily-fund-axsax/. You can also request this information by contacting us at 833-429-6642.
What were the Fund’s cost for the last year?
(based on a hypothetical $10,000 investment)
| Class Name | Cost of a $10,000 Investment | Cost Paid as a percentage of a $10,000 Investment |
|---|
| Axonic Strategic Income Fund - A | $145.27 | 1.42% |
|---|
How did the Fund perform last year?
The Axonic Strategic Income Fund had another year of strong performance. The Fund returned 10.93% for the 12 month period ending on October 31, 2024, outperforming the Bloomberg US Aggregate Bond Index which returned 10.55% over the same time period. The Fund’s outperformance of the benchmark was a function of low duration and a high level of income which insulated returns from periodic interest rate volatility throughout the year.
Performance was driven by credit spread tightening and consistent income generated by the Fund’s holdings across the structured credit universe. The Fund was profitable across the three core areas of focus: Residential Mortgage Backed Securities (RMBS), Commercial Mortgage Backed Securities (CMBS), and Asset Backed Securities (ABS). Although credit spreads tightened throughout the year, structured credit markets continue to offer attractive yields going forward as spreads remain wide of similarly rated corporate credit investments on a historical basis.
How has the Fund performed since inception?
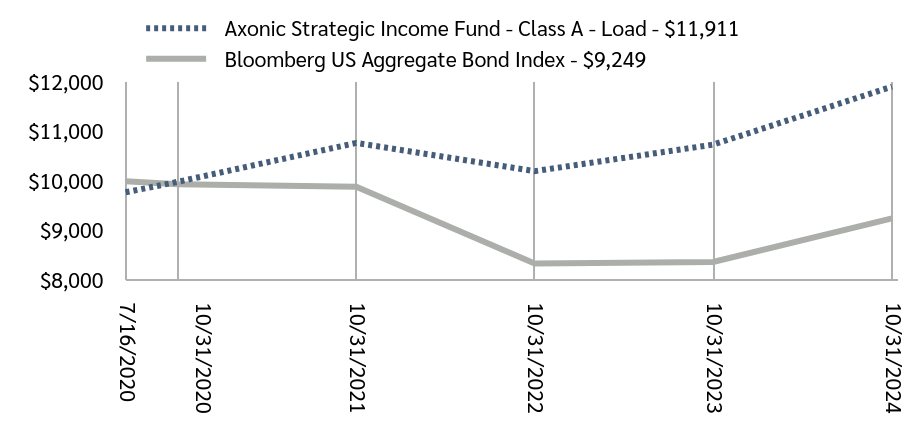
TOTAL RETURN BASED ON $10,000 INVESTMENT
| Axonic Strategic Income Fund - Class A - Load - $11,911 | Bloomberg US Aggregate Bond Index - $9,249 |
|---|
| 7/16/2020 | $9,774.82 | $10,000.00 |
|---|
| 10/31/2020 | $9,987.45 | $9,935.03 |
|---|
| 10/31/2021 | $10,771.83 | $9,887.53 |
|---|
| 10/31/2022 | $10,202.17 | $8,336.91 |
|---|
| 10/31/2023 | $10,737.50 | $8,366.60 |
|---|
| 10/31/2024 | $11,910.71 | $9,248.97 |
|---|
AVERAGE ANNUAL TOTAL RETURNS
| Class A | 1 Year | Since Inception |
|---|
| Class A - NAV (Incep. July 16, 2020) | 10.93% | 4.71% |
|---|
| Class A - Load | 8.43% | 4.16% |
|---|
| Bloomberg US Aggregate Bond Index | 10.55% | -1.80% |
|---|
The Fund’s past performance is not a good predictor of the Fund’s future performance. The table and graph presented above do not reflect the deduction of taxes a shareholder would pay on fund distributions or the redemption of fund shares. Call 1-833-429-6642 for current month-end performance.
- Total Net Assets$2,956,778,428
- # of Portfolio Holdings414
- Portfolio Turnover Rate (Class A)72%
- Advisory Fees Paid$20,382,847
What did the Fund invest in?
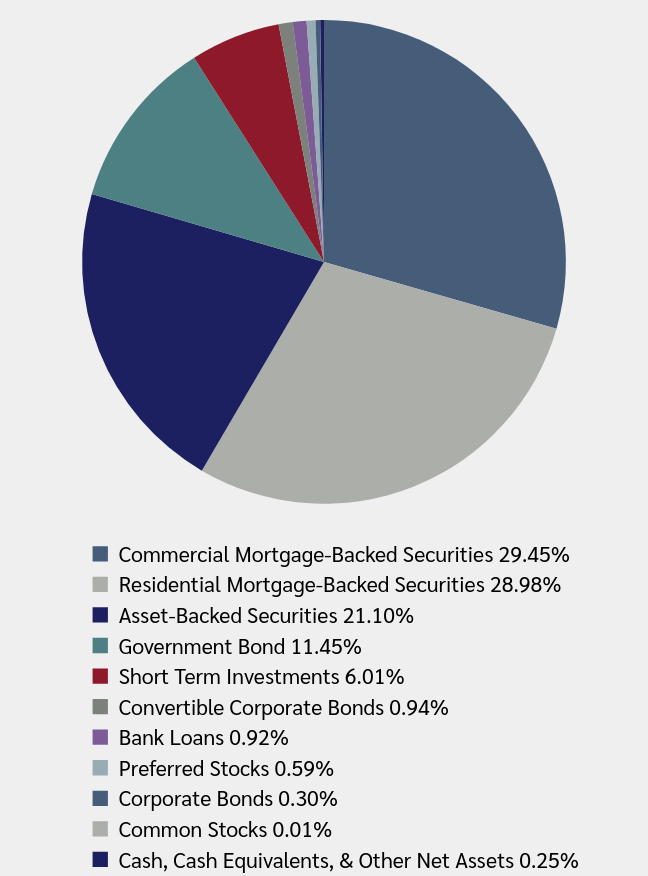
ASSET CLASS WEIGHTINGS (as a % of Net Assets)
| Value | Value |
|---|
| Commercial Mortgage-Backed Securities | 29.45% |
| Residential Mortgage-Backed Securities | 28.98% |
| Asset-Backed Securities | 21.10% |
| Government Bond | 11.45% |
| Short Term Investments | 6.01% |
| Convertible Corporate Bonds | 0.94% |
| Bank Loans | 0.92% |
| Preferred Stocks | 0.59% |
| Corporate Bonds | 0.30% |
| Common Stocks | 0.01% |
| Cash, Cash Equivalents, & Other Net Assets | 0.25% |
TOP TEN HOLDINGS (as a % of Net Assets)
| Top 10 | Top 10 |
|---|
| U.S. Treasury Bond 3.88%, due 08/15/2034 | 11.45% |
| LHOME Mortgage Trust, Series 2023-RTL1, Class A1 | 1.36% |
| Extended Stay America Trust, Series 2021-ESH, Class F | 1.08% |
| Saluda Grade Alternative Mortgage Trust, Series 2024-RTL5, Class A1 | 1.05% |
| LHOME Mortgage Trust, Series 2022-RTL3, Class A1 | 1.02% |
| BXSC Commercial Mortgage Trust, Series 2022-WSS, Class E | 1.01% |
| MFA , Series 2023-RTL2, Class A1 | 0.95% |
| Dominion Mortgage Trust, Series 2021-RTL1, Class A1 | 0.95% |
| Pagaya AI Debt Trust, Series 2024-3, Class C | 0.95% |
| Saluda Grade Alternative Mortgage Trust, Series 2024-RTL4, Class A1 | 0.84% |
| Top Ten Holdings | 20.66% |
There have been no material fund Changes during the reporting period.
Changes in and Disagreements with Accountants
There have been no changes in or disagreements with the Fund's independent accounting firm during the reporting period.
Availability of Additional Information
Additional information about the Fund, including its prospectus, financial information, holdings, and proxy voting information, can be found by visiting https://www.axonicfunds.com/funds/daily-fund-axsax/.
If you have consented to receive a single annual or semi-annual shareholder report at a shared address you may revoke this consent by calling the Transfer Agent 833-429-6642.
Axonic Strategic Income Fund — Class A - AXSAX
ANNUAL SHAREHOLDER REPORT - October 31, 2024
Distributor, ALPS Distributors, Inc.
Axonic Strategic Income Fund
ANNUAL SHAREHOLDER REPORT - October 31, 2024
This annual shareholder report contains important information about Axonic Strategic Income Fund - I for the period of November 1, 2023 to October 31, 2024.
You can find additional information about the Fund at https://www.axonicfunds.com/funds/daily-fund/. You can also request this information by contacting us at 833-429-6642.
What were the Fund’s cost for the last year?
(based on a hypothetical $10,000 investment)
| Class Name | Cost of a $10,000 Investment | Cost Paid as a percentage of a $10,000 Investment |
|---|
| Axonic Strategic Income Fund - I | $105.48 | 1.03% |
|---|
How did the Fund perform last year?
The Axonic Strategic Income Fund had another year of strong performance. The Fund returned 11.31% for the 12 month period ending on October 31, 2024, outperforming the Bloomberg US Aggregate Bond Index which returned 10.55% over the same time period. The Fund’s outperformance of the benchmark was a function of low duration and a high level of income which insulated returns from periodic interest rate volatility throughout the year.
Performance was driven by credit spread tightening and consistent income generated by the Fund’s holdings across the structured credit universe. The Fund was profitable across the three core areas of focus: Residential Mortgage Backed Securities (RMBS), Commercial Mortgage Backed Securities (CMBS), and Asset Backed Securities (ABS). Although credit spreads tightened throughout the year, structured credit markets continue to offer attractive yields going forward as spreads remain wide of similarly rated corporate credit investments on a historical basis.
How has the Fund performed since inception?
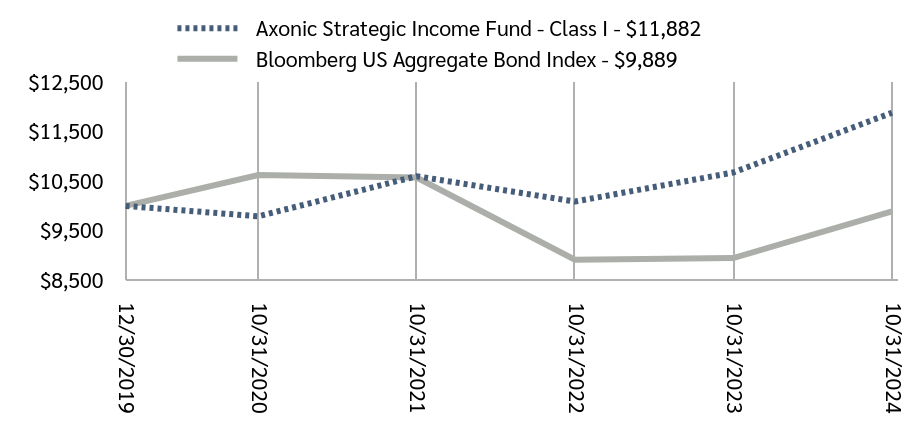
TOTAL RETURN BASED ON $10,000 INVESTMENT
| Axonic Strategic Income Fund - Class I - $11,882 | Bloomberg US Aggregate Bond Index - $9,889 |
|---|
| 12/30/2019 | $10,000.00 | $10,000.00 |
|---|
| 10/31/2020 | $9,789.82 | $10,622.96 |
|---|
| 10/31/2021 | $10,600.21 | $10,572.17 |
|---|
| 10/31/2022 | $10,087.63 | $8,914.18 |
|---|
| 10/31/2023 | $10,674.93 | $8,945.93 |
|---|
| 10/31/2024 | $11,882.03 | $9,889.39 |
|---|
AVERAGE ANNUAL TOTAL RETURNS
| Class I | 1 Year | Since Inception |
|---|
| Class I (Incep. December 30, 2019) | 11.31% | 3.63% |
|---|
| Bloomberg US Aggregate Bond Index | 10.55% | -0.23% |
|---|
The Fund’s past performance is not a good predictor of the Fund’s future performance. The table and graph presented above do not reflect the deduction of taxes a shareholder would pay on fund distributions or the redemption of fund shares. Call 1-833-429-6642 for current month-end performance.
- Total Net Assets$2,956,778,428
- # of Portfolio Holdings414
- Portfolio Turnover Rate (Class I)72%
- Advisory Fees Paid$20,382,847
What did the Fund invest in?
ASSET CLASS WEIGHTINGS (as a % of Net Assets)
| Value | Value |
|---|
| Commercial Mortgage-Backed Securities | 29.45% |
| Residential Mortgage-Backed Securities | 28.98% |
| Asset-Backed Securities | 21.10% |
| Government Bond | 11.45% |
| Short Term Investments | 6.01% |
| Convertible Corporate Bonds | 0.94% |
| Bank Loans | 0.92% |
| Preferred Stocks | 0.59% |
| Corporate Bonds | 0.30% |
| Common Stocks | 0.01% |
| Cash, Cash Equivalents, & Other Net Assets | 0.25% |
TOP TEN HOLDINGS (as a % of Net Assets)
| Top 10 | Top 10 |
|---|
| U.S. Treasury Bond 3.88%, due 08/15/2034 | 11.45% |
| LHOME Mortgage Trust, Series 2023-RTL1, Class A1 | 1.36% |
| Extended Stay America Trust, Series 2021-ESH, Class F | 1.08% |
| Saluda Grade Alternative Mortgage Trust, Series 2024-RTL5, Class A1 | 1.05% |
| LHOME Mortgage Trust, Series 2022-RTL3, Class A1 | 1.02% |
| BXSC Commercial Mortgage Trust, Series 2022-WSS, Class E | 1.01% |
| MFA , Series 2023-RTL2, Class A1 | 0.95% |
| Dominion Mortgage Trust, Series 2021-RTL1, Class A1 | 0.95% |
| Pagaya AI Debt Trust, Series 2024-3, Class C | 0.95% |
| Saluda Grade Alternative Mortgage Trust, Series 2024-RTL4, Class A1 | 0.84% |
| Top Ten Holdings | 20.66% |
There have been no material fund Changes during the reporting period.
Changes in and Disagreements with Accountants
There have been no changes in or disagreements with the Fund's independent accounting firm during the reporting period.
Availability of Additional Information
Additional information about the Fund, including its prospectus, financial information, holdings, and proxy voting information, can be found by visiting https://www.axonicfunds.com/funds/daily-fund/.
If you have consented to receive a single annual or semi-annual shareholder report at a shared address you may revoke this consent by calling the Transfer Agent 833-429-6642.
Axonic Strategic Income Fund — Class I - AXSIX
ANNUAL SHAREHOLDER REPORT - October 31, 2024
Distributor, ALPS Distributors, Inc.
| (a) | As of the end of the period covered by this report, the registrant has adopted a code of ethics, as defined in Item 2(b) of Form-CSR, that applies to the registrant’s principal executive officer, principal financial officer, principal accounting officer or controller or any persons performing similar functions, regardless of whether these individuals are employed by the registrant or a third party (the “Code of Ethics”). |
| (c) | During the period covered by this report, no amendments were made to the provisions of the Code of Ethics. |
| (d) | During the period covered by this report, the registrant did not grant a waiver, including an implicit waiver, from a provision of the Code of Ethics. |
| (f) | A copy of the Code of Ethics is filed as an exhibit pursuant to Item 19(a)(1) of this Form N-CSR. |
| Item 3. | Audit Committee Financial Expert. |
The registrant’s board of trustees has determined that the registrant has at least one audit committee financial expert serving on its audit committee. Joshua M. Barlow is the “audit committee financial expert” and is “independent”, as each term is defined in Item 3 of Form N-CSR.
| Item 4. | Principal Accountant Fees and Services. |
| (a) | Audit Fees: For the registrant’s last two fiscal years ended October 31, 2023 and October 31, 2024, the aggregate fees billed for professional services rendered by the principal accountant for the audit of the registrant’s annual financial statements or services that are normally provided by the accountant in connection with statutory and regulatory filings or engagements were $42,000 and $42,000, respectively. |
| (b) | Audit-Related Fees: For the registrant’s last two fiscal years ended October 31, 2023 and October 31, 2024, there were no fees billed for assurances and related services by the principal accountant that are reasonably related to the performance of the audit of the registrant’s financial statements and are not reported under paragraph (a) of this Item. |
| (c) | Tax Fees: For the registrant’s last two fiscal years ended October 31, 2023 and October 31, 2024, the aggregate fees billed for professional services rendered by the principal accountant for tax compliance, tax advice and tax planning, which were comprised of the preparation of excise filings and income tax returns for the registrant, were $7,000 and $7,000 respectively. |
| (d) | All Other Fees: For the registrant’s last two fiscal years ended October 31, 2023 and October 31, 2024, there were no fees billed for products and services provided by the principal accountant, other than the services reported in paragraphs (a) through (c) of this Item. |
| (e)(1) | Audit Committee Pre-Approval Policies and Procedures: Before an accountant is engaged by the registrant or its subsidiaries to render audit or non-audit services or by the registrant’s investment adviser to render non-audit services, the engagement must be pre-approved by the registrant's audit committee. |
| (e)(2) | There were no non-audit services approved or required to be approved by the registrant’s audit committee pursuant to (c)(7)(i)(C) of Rule 2-01 of Regulation S-X. |
| (g) | There were no non-audit fees billed by the registrant’s accountant for services rendered to the registrant, and rendered to the registrant’s investment adviser, and any entity controlling, controlled by, or under common control with the adviser that provides ongoing services to the registrant for the last two fiscal years ended October 31, 2023 and October 31, 2024. |
| Item 5. | Audit Committee of Listed Registrants. |
Not applicable.
| (a) | Schedule of Investments in securities of unaffiliated issuers as of the close of the reporting period is included as part of the report to shareholders filed under Item 1(a) of this form |
| (b) | Not applicable to the Registrant. |
| Item 7. | Financial Statements and Financial Highlights for Open-End Management Investment Companies. |
| (a) | The registrant’s most recent annual financial statements required, and for the period covered by this report, by Regulation S-X are attached herewith. |
| (b) | The registrant’s financial highlights, audited for the latest 5 years as required in Regulation S-X, are attached herewith. |
AXONIC STRATEGIC INCOME FUND
ANNUAL FINANCIAL STATEMENTS
& OTHER INFORMATION
October 31, 2024

TABLE OF CONTENTS
Consolidated Financial Statements and Consolidated Financial Highlights for Open-End Management Investment Companies
| Consolidated Schedule of Investments | 1 |
| Consolidated Statement of Assets and Liabilities | 16 |
| Consolidated Statement of Operations | 17 |
| Consolidated Statements of Changes in Net Assets | 18 |
| Consolidated Financial Highlights | 19 |
| Notes to Consolidated Financial Statements and Consolidated Financial Highlights | 21 |
| Report of Independent Registered Public Accounting Firm | 29 |
| Additional Information | 30 |
| Changes in and Disagreements with Accountants for Open-End Management Investment Companies | 31 |
| Proxy Disclosures for Open-End Management Investment Companies | 32 |
| Remuneration Paid to Directors, Officers, and Others of Open-End Management Investment Companies | 33 |
| Statement Regarding Basis for Approval of Investment Advisory Contract | 34 |
| Axonic Strategic Income Fund | Consolidated Schedule of Investments |
October 31, 2024
| Description | | Shares | | | Value | |
| COMMON STOCKS (0.01%) | | | | | | |
| United States (0.01%) | | | | | | |
| Financials (0.01%) | | | | | | |
| Redwood Trust, Inc. REIT | | | 44,220 | | | $ | 323,691 | |
| TOTAL COMMON STOCKS | | | | | | | | |
| (Cost $501,080) | | | | | | | 323,691 | |
| | | Rate | | Shares | | | Value | |
| PREFERRED STOCKS (0.59%) | | | | | | | | |
| United States (0.59%) | | | | | | | | |
| Financials (0.59%) | | | | | | | | |
| ACRES Commercial Realty Corp., Series D(a) | | 7.88% | | | 200,000 | | | | 4,646,000 | |
| Arbor Realty Trust, Series F | | 6.25% | | | 160,148 | | | | 3,313,462 | |
| Granite Point Mortgage Trust, Inc., Series A(a)(b) | | 1D US SOFR + 5.83% | | | 69,826 | | | | 1,175,172 | |
| Rithm Capital Corp., Series D(a)(b) | | 7.00% | | | 166,420 | | | | 4,022,371 | |
| New York Mortgage Trust, Inc., Series F(a)(b) | | 6.88% | | | 86,218 | | | | 1,915,764 | |
| TPG RE Finance Trust, Inc., Series C(a) | | 6.25% | | | 120,705 | | | | 2,347,712 | |
| TOTAL PREFERRED STOCKS | | | | | | | | | | |
| (Cost $19,246,717) | | | | | | | | | 17,420,481 | |
| | | Rate | | Maturity Date | | Principal Amount | | | Value | |
| ASSET-BACKED SECURITIES (21.10%) | | | | | | | | | | |
| Bermuda (0.06%) | | | | | | | | | | |
| Start II, Ltd., Series 2019-1, Class B(c) | | 5.10% | | 03/15/26 | | $ | 1,857,968 | | | $ | 1,771,944 | |
| Cayman Islands (2.09%) | | | | | | | | | | | | |
| Falcon Aerospace, Ltd., Series 2019-1, Class B(c) | | 4.79% | | 09/15/26 | | | 3,380,744 | | | | 2,953,756 | |
| GAIA Aviation, Ltd., Series 2019-1, Class B(c)(d) | | 5.19% | | 12/15/26 | | | 13,426,043 | | | | 12,248,579 | |
| Horizon Aircraft Finance II, Ltd., Series 2019-1, Class A(c) | | 3.72% | | 07/15/26 | | | 1,305,907 | | | | 1,235,257 | |
| Horizon Aircraft Finance III, Ltd., Series 2019-2, Class A(c) | | 3.43% | | 11/15/26 | | | 4,422,853 | | | | 4,031,431 | |
| JOL Air, Ltd., Series 2019-1, Class B(c) | | 4.95% | | 04/15/26 | | | 11,944,540 | | | | 11,417,786 | |
| KDAC Aviation Finance, Ltd., Series 2017-1A, Class A(c) | | 4.21% | | 12/15/24 | | | 3,901,141 | | | | 3,792,689 | |
| Navigator Aviation, Ltd., Series 2024-1, Class B(c) | | 6.09% | | 08/15/31 | | | 1,976,190 | | | | 1,924,217 | |
| Pioneer Aircraft Finance, Ltd., Series 2019-1, Class A(c) | | 3.97% | | 06/15/26 | | | 11,439,577 | | | | 10,825,271 | |
| Pioneer Aircraft Finance, Ltd., Series 2019-1, Class B(c) | | 4.95% | | 06/15/26 | | | 1,656,250 | | | | 1,282,434 | |
| Project Silver, Series 2019-1, Class A(c) | | 3.97% | | 07/15/26 | | | 164,723 | | | | 153,720 | |
| Shenton Aircraft Investment I, Ltd., Series 2015-1A, Class A(c) | | 4.75% | | 11/15/27 | | | 4,561,104 | | | | 4,300,665 | |
| Thunderbolt III Aircraft Lease, Ltd., Series 2019-1, Class B(c) | | 4.75% | | 11/15/26 | | | 10,868,487 | | | | 7,464,477 | |
| Ireland (0.22%) | | | | | | | | | | | | |
| Lunar Structured Aircraft Portfolio Notes, Series 2021-1, Class C(c) | | 5.68% | | 09/15/28 | | | 7,070,721 | | | | 6,488,094 | |
| United States (18.73%) | | | | | | | | | | | | |
| Achieve Personal Loan Master Pass-Through Trust Series 2023- PT1, Series 2023-1, Class PT(b)(c) | | 20.93% | | 09/15/53 | | | 701,291 | | | | 389,777 | |
| Achieve Personal Loan Master Pass-Through Trust Series 2023- PT2, Series 2023-2, Class PT(b)(c) | | 20.79% | | 10/15/53 | | | 947,538 | | | | 848,615 | |
| ACHM Trust, Series 2023-HE2, Class A(b)(c) | | 7.50% | | 10/25/38 | | | 6,632,936 | | | | 6,815,403 | |
| ACHV ABS TRUST, Series 2024-2PL, Class A(c) | | 5.07% | | 10/27/31 | | | 2,057,746 | | | | 2,058,158 | |
| ACHV ABS TRUST, Series 2024-2PL, Class B(c) | | 5.43% | | 10/27/31 | | | 1,214,000 | | | | 1,214,243 | |
| ACHV ABS TRUST, Series 2024-2PL, Class C(c) | | 5.72% | | 10/27/31 | | | 658,000 | | | | 658,197 | |
| ACHV ABS TRUST, Series 2024-2PL, Class D(c) | | 6.40% | | 10/27/31 | | | 748,000 | | | | 746,803 | |
See Notes to Consolidated Financial Statements and Consolidated Financial Highlights.
| Annual Report | October 31, 2024 | 1 |
| Axonic Strategic Income Fund | Consolidated Schedule of Investments |
October 31, 2024
| | | Rate | | Maturity Date | | Principal Amount | | | Value | |
| ACHV ABS TRUST, Series 2024-2PL, Class R(c) | | 0.00% | | 10/27/31 | | $ | 1,815 | | | $ | 735,075 | |
| ACM Auto Trust 2024-1, Series 2024-1A, Class A(c) | | 7.71% | | 01/21/31 | | | 16,666,183 | | | | 16,752,847 | |
| Affirm Asset Securitization Trust, Series 2024-X1, Class C(c) | | 6.57% | | 05/15/29 | | | 1,750,000 | | | | 1,766,450 | |
| Affirm Asset Securitization Trust, Series 2024-X1, Class D(c) | | 7.29% | | 05/15/29 | | | 1,500,000 | | | | 1,525,950 | |
| Avant Credit Card Master Trust, Series 2024-1A, Class D(c) | | 8.80% | | 10/16/27 | | | 5,000,000 | | | | 4,962,500 | |
| Avant Credit Card Master Trust, Series 2024-1A, Class C(c) | | 6.23% | | 10/16/27 | | | 2,000,000 | | | | 1,992,800 | |
| Business Jet Securities 2024-1 LLC, Series 2024-1A, Class B(c) | | 6.92% | | 05/15/30 | | | 9,497,702 | | | | 9,670,560 | |
| Business Jet Securities 2024-1 LLC, Series 2024-1A, Class C(c) | | 9.13% | | 05/15/30 | | | 1,732,684 | | | | 1,756,248 | |
| Business Jet Securities 2024-2 LLC, Series 2024-2A, Class B(c) | | 5.75% | | 09/15/30 | | | 7,642,361 | | | | 7,664,524 | |
| Business Jet Securities 2024-2 LLC, Series 2024-2A, Class C(c) | | 7.97% | | 09/15/30 | | | 2,819,444 | | | | 2,812,960 | |
| Castlelake Aircraft Securitization Trust, Series 2018-1, Class B(c) | | 5.30% | | 06/15/25 | | | 4,334,216 | | | | 3,471,707 | |
| Castlelake Aircraft Structured Trust, Series 2017-1R, Class C(c) | | 6.50% | | 08/15/25 | | | 15,185,549 | | | | 11,120,378 | |
| Castlelake Aircraft Structured Trust, Series 2019-1A, Class A(c) | | 3.97% | | 04/15/26 | | | 10,306,922 | | | | 9,736,950 | |
| Castlelake Aircraft Structured Trust, Series 2019-1A, Class B(c) | | 5.10% | | 04/15/26 | | | 2,422,091 | | | | 1,793,316 | |
| Castlelake Aircraft Structured Trust, Series 2021-1A, Class B(c) | | 6.66% | | 07/15/27 | | | 775,323 | | | | 752,761 | |
| Castlelake Aircraft Structured Trust, Series 2021-1A, Class C(c) | | 7.00% | | 10/15/26 | | | 5,731,596 | | | | 5,406,614 | |
| ClickLease Equipment Receivables , Series 2024-1, Class C(c) | | 8.40% | | 02/15/27 | | | 9,560,000 | | | | 9,807,604 | |
| Cologix Data Centers US Issuer LLC, Series 2021-1A, Class C(c) | | 5.99% | | 12/28/26 | | | 3,700,000 | | | | 3,396,600 | |
| FAT Brands Fazoli's Native I LLC, Series 2021-1, Class B2(c) | | 8.00% | | 01/25/25 | | | 1,950,000 | | | | 1,778,985 | |
| FAT Brands GFG Royalty I LLC, Series 2021-1A, Class A2(c)(d) | | 7.00% | | 07/25/51 | | | 23,939,175 | | | | 22,363,977 | |
| FAT Brands GFG Royalty I LLC, Series 2022-1A, Class A2(c) | | 7.00% | | 07/25/51 | | | 2,437,500 | | | | 2,299,538 | |
| FAT Brands GFG Royalty I LLC, Series 2021-1A, Class B2(c)(d) | | 8.00% | | 07/25/51 | | | 8,945,625 | | | | 7,777,326 | |
| FAT Brands Royalty LLC, Series 2021-1A, Class A2(c) | | 5.75% | | 07/25/26 | | | 3,900,000 | | | | 3,389,880 | |
| FAT Brands Twin Peaks I LLC, Series 2021-1A, Class A2(c) | | 8.00% | | 01/25/25 | | | 13,665,600 | | | | 13,203,703 | |
| FAT Brands Twin Peaks I LLC, Series 2021-1A, Class B2(c) | | 10.00% | | 01/25/25 | | | 2,925,000 | | | | 2,830,815 | |
| FIGRE Trust 2023-HE2, Series 2024-HE4, Class D(b)(c) | | 5.92% | | 09/25/54 | | | 2,000,000 | | | | 1,948,921 | |
| FIGRE Trust 2023-HE2, Series 2024-HE4, Class E(b)(c) | | 6.81% | | 09/25/54 | | | 1,000,000 | | | | 973,477 | |
| First Investors Auto Owner Trust, Series 2021-1A, Class F(c) | | 5.37% | | 02/15/25 | | | 1,270,000 | | | | 1,252,855 | |
| Flexential Issuer 2021-1, Series 2021-1A, Class C(c) | | 6.93% | | 11/25/26 | | | 8,000,000 | | | | 7,520,800 | |
| Flexential Issuer 2021-1, Series 2021-1A, Class B(c) | | 3.72% | | 11/25/26 | | | 7,934,000 | | | | 7,408,769 | |
| FREED ABS Trust, Series 2022-1FP, Class D(c) | | 3.35% | | 03/19/29 | | | 3,242,074 | | | | 3,193,443 | |
| FREED ABS Trust, Series 2022-4FP, Class D(c) | | 7.40% | | 12/18/29 | | | 8,342,000 | | | | 8,437,933 | |
| Hertz Vehicle Financing III LP, Series 2021-2A, Class D(c) | | 4.34% | | 12/25/26 | | | 5,000,000 | | | | 4,586,500 | |
| Horizon Aircraft Finance I, Ltd., Series 2018-1, Class A(c) | | 4.46% | | 12/15/25 | | | 4,109,223 | | | | 3,933,348 | |
| HTAP, Series 2024-1, Class A(c) | | 7.00% | | 12/25/30 | | | 1,454,390 | | | | 1,437,972 | |
| HTAP Issuer Trust, Series 2024-2, Class A(c) | | 6.50% | | 04/25/42 | | | 13,400,039 | | | | 13,054,731 | |
| JPMorgan Chase Bank NA - Chase Auto Credit Linked Notes, Series 2021-2, Class G(c) | | 8.48% | | 07/25/25 | | | 2,350,000 | | | | 2,339,660 | |
| Lendingpoint Asset Securitization Trust, Series 2021-B, Class D(c) | | 6.12% | | 12/16/24 | | | 3,000,000 | | | | 1,133,700 | |
| Lunar Aircraft, Ltd., Series 2020-1A, Class B(c) | | 4.34% | | 02/15/27 | | | 4,341,575 | | | | 4,145,336 | |
| MAPS 2021-1 Trust, Series 2021-1A, Class C(c) | | 5.44% | | 06/15/28 | | | 344,267 | | | | 341,926 | |
| Marlette Funding Trust 2024-1, Series 2024-1A, Class D(c) | | 6.93% | | 10/15/28 | | | 3,750,000 | | | | 3,789,375 | |
| Marlette Funding Trust 2024-1, Series 2024-1A, Class C(c) | | 6.34% | | 10/15/27 | | | 5,300,000 | | | | 5,364,130 | |
| ME Funding LLC, Series 2024-1A, Class A2(c) | | 8.10% | | 04/30/27 | | | 19,064,738 | | | | 18,799,738 | |
| New Residential Mortgage Loan Trust, Series 2022-SFR1, Class G(c) | | 5.00% | | 02/17/27 | | | 5,000,000 | | | | 4,488,924 | |
| Pagaya AI Debt Grantor Trust 2024-6 And Pagaya AI Debt Trust, Series 2024-6, Class C(c) | | 7.07% | | 06/15/26 | | | 9,997,430 | | | | 10,096,404 | |
| Pagaya AI Debt Grantor Trust, Series 2024-8, Class C(c) | | 6.03% | | 01/15/32 | | | 3,775,000 | | | | 3,767,828 | |
| Pagaya AI Debt Grantor Trust, Series 2024-8, Class D(c) | | 6.53% | | 01/15/32 | | | 19,175,000 | | | | 19,215,268 | |
| Pagaya AI Debt Selection Trust, Series 2024-7, Class C(c) | | 7.10% | | 12/15/31 | | | 14,996,741 | | | | 15,148,208 | |
See Notes to Consolidated Financial Statements and Consolidated Financial Highlights.
| Axonic Strategic Income Fund | Consolidated Schedule of Investments |
October 31, 2024
| | | Rate | | Maturity Date | | Principal Amount | | | Value | |
| Pagaya AI Debt Trust, Series 2022-2, Class B(c) | | 6.63% | | 01/15/30 | | $ | 4,999,702 | | | $ | 5,012,202 | |
| Pagaya AI Debt Trust, Series 2023-1, Class A(c) | | 7.56% | | 07/15/30 | | | 677,928 | | | | 679,555 | |
| Pagaya AI Debt Trust, Series 2023-3, Class A(c) | | 7.60% | | 12/16/30 | | | 1,282,928 | | | | 1,290,240 | |
| Pagaya AI Debt Trust, Series 2023-6, Class ABC(b)(c) | | 7.78% | | 06/16/31 | | | 5,056,031 | | | | 5,101,535 | |
| Pagaya AI Debt Trust, Series 2023-7, Class C(c) | | 8.80% | | 07/15/31 | | | 4,998,137 | | | | 5,131,088 | |
| Pagaya AI Debt Trust, Series 2024-1, Class B(c) | | 7.11% | | 07/15/31 | | | 5,680,450 | | | | 5,753,159 | |
| Pagaya AI Debt Trust, Series 2024-1, Class ABC(b)(c) | | 7.28% | | 07/15/31 | | | 7,197,863 | | | | 7,245,369 | |
| Pagaya AI Debt Trust, Series 2024-2, Class ABC(b)(c) | | 6.75% | | 08/15/31 | | | 3,146,599 | | | | 3,169,884 | |
| Pagaya AI Debt Trust, Series 2024-2, Class C(c) | | 7.57% | | 08/15/31 | | | 14,839,562 | | | | 15,002,797 | |
| Pagaya AI Debt Trust, Series 2024-2, Class B(c) | | 6.61% | | 08/15/31 | | | 10,692,976 | | | | 10,775,312 | |
| Pagaya AI Debt Trust, Series 2024-3, Class C(c) | | 7.30% | | 03/15/26 | | | 27,700,000 | | | | 27,954,840 | |
| Prosper Marketplace Issuance Trust Series 2023-1, Series 2023-1A, Class B(c) | | 7.48% | | 11/15/25 | | | 2,300,000 | | | | 2,321,620 | |
| Prosper Marketplace Issuance Trust Series 2024-1, Series 2024-1A, Class C(c) | | 6.96% | | 10/15/26 | | | 9,525,000 | | | | 9,625,965 | |
| Saluda Grade Alternative Mortgage Trust, Series 2022-SEQ2, Class A1(b)(c) | | 3.50% | | 02/25/52 | | | 6,666,500 | | | | 6,540,888 | |
| Santander Consumer Auto Receivables Trust, Series 2021-AA, Class F(c) | | 5.79% | | 07/15/25 | | | 1,370,000 | | | | 1,381,371 | |
| Sapphire Aviation Finance II, Ltd., Series 2020-1A, Class C(c) | | 6.78% | | 03/15/27 | | | 3,044,876 | | | | 1,563,848 | |
| Sprite, Ltd., Series 2021-1, Class B(c) | | 5.10% | | 10/15/28 | | | 1,811,029 | | | | 1,736,596 | |
| Stellar Jay Ireland DAC, Series 2021-1, Class A(c) | | 3.97% | | 03/15/28 | | | 3,171,254 | | | | 2,981,931 | |
| Stellar Jay Ireland DAC, Series 2021-1, Class B(c) | | 5.93% | | 03/15/28 | | | 3,019,592 | | | | 2,579,939 | |
| Stonepeak 2021-1 ABS, Series 2021-1A, Class C(c) | | 5.93% | | 05/15/28 | | | 12,420,575 | | | | 11,400,846 | |
| Stonepeak 2021-1 ABS, Series 2021-1A, Class AA(c) | | 2.30% | | 12/15/27 | | | 1,071,980 | | | | 1,023,955 | |
| TGIF Funding LLC, Series 2017-1A, Class A2(c) | | 6.20% | | 04/30/47 | | | 5,052,685 | | | | 4,974,874 | |
| Theorem Funding Trust 2022-3, Series 2022-3A, Class A(c) | | 7.60% | | 04/15/29 | | | 582,583 | | | | 586,836 | |
| Towd Point HE Trust, Series 2023-1, Class M2B(c) | | 6.50% | | 02/25/63 | | | 3,000,000 | | | | 2,934,143 | |
| Unison Trust, Series 2023-2, Class A(c) | | 6.50% | | 11/25/53 | | | 16,004,322 | | | | 15,266,012 | |
| Unlock HEA Trust, Series 2022-1, Class A(c)(d) | | 7.00% | | 07/25/29 | | | 7,892,251 | | | | 7,857,512 | |
| Unlock Hea Trust 2023-1, Series 2023-1 A, Class A(c) | | 7.00% | | 10/25/38 | | | 2,721,140 | | | | 2,704,406 | |
| Unlock HEA Trust, Series 2024-2, Class A(c) | | 6.50% | | 03/25/32 | | | 4,500,000 | | | | 4,405,256 | |
| Upstart Securitization Trust 2021-2, Series 2021-2 C, Class C(c) | | 3.61% | | 06/20/31 | | | 4,894,545 | | | | 4,827,979 | |
| Upstart Securitization Trust, Series 2023-2, Class A(c) | | 6.77% | | 01/20/26 | | | 4,838,202 | | | | 4,850,298 | |
| Veros Auto Receivables Trust, Series 2022-1, Class B(c) | | 4.39% | | 12/15/28 | | | 837,449 | | | | 835,858 | |
| Veros Auto Receivables Trust, Series 2024-1, Class C(c) | | 7.57% | | 12/15/28 | | | 1,900,000 | | | | 1,923,560 | |
| Vista Point Securitization Trust, Series 2024-CES2, Class M1(b)(c) | | 6.36% | | 09/25/28 | | | 1,506,000 | | | | 1,479,653 | |
| Vista Point Securitization Trust, Series 2024-CES2, Class B1(b)(c) | | 7.50% | | 09/25/28 | | | 1,000,000 | | | | 968,538 | |
| WAVE LLC, Series 2019-1, Class A(c) | | 3.60% | | 09/15/27 | | | 827,403 | | | | 748,717 | |
| WAVE LLC, Series 2019-1, Class B(c) | | 4.58% | | 09/15/27 | | | 6,963,966 | | | | 5,289,132 | |
| Willis Engine Structured Trust IV, Series 2018-A, Class B(c)(d) | | 5.44% | | 09/15/26 | | | 2,902,229 | | | | 2,860,727 | |
| CIM Trust, Series 2021-NR2, Class A1(c)(d) | | 5.57% | | 07/25/59 | | | 1,564,513 | | | | 1,553,407 | |
| MFA , Series 2024-NPL1, Class A1(d) | | 6.33% | | 09/25/54 | | | 5,949,153 | | | | 5,948,960 | |
| PRET LLC, Series 2024-NPL3, Class A1(c)(d) | | 7.52% | | 04/25/27 | | | 7,538,581 | | | | 7,596,764 | |
| PRET LLC, Series 2024-NPL4, Class A1(c)(d) | | 7.00% | | 07/25/27 | | | 7,257,319 | | | | 7,254,304 | |
| PRET LLC, Series 2024-NPL5, Class A1(c)(d) | | 5.96% | | 09/25/54 | | | 22,000,000 | | | | 21,922,916 | |
| PRET LLC, Series 2024-RN2, Class A1(c)(d) | | 7.13% | | 06/25/27 | | | 4,971,787 | | | | 4,998,449 | |
| PRPM LLC, Series 2022-3, Class A1(c)(d) | | 5.56% | | 06/25/25 | | | 3,280,494 | | | | 3,262,843 | |
| RAMP, Series 2007-RS1, Class A4(b) | | 1M CME TERM SOFR + 0.67% | | 02/25/37 | | | 17,244,743 | | | | 3,772,712 | |
See Notes to Consolidated Financial Statements and Consolidated Financial Highlights.
| Annual Report | October 31, 2024 | 3 |
| Axonic Strategic Income Fund | Consolidated Schedule of Investments |
October 31, 2024
| | | Rate | | Maturity Date | | Principal Amount | | | Value | |
| RMF Buyout Issuance Trust, Series 2021-HB1, Class M4(b)(c) | | 4.70% | | 11/25/31 | | $ | 3,250,000 | | | $ | 2,869,425 | |
| | | | | | | | | | | | | |
| TOTAL ASSET-BACKED SECURITIES | | | | | | | | | | | | |
| (Cost $636,897,350) | | | | | | | | | | | 623,737,051 | |
| | | | | | | | | | | | | |
| BANK LOANS (0.92%) | | | | | | | | | | | | |
| United States (0.92%) | | | | | | | | | | | | |
| Financials (0.05%) | | | | | | | | | | | | |
| UTEX-DEFEASED(e) | | 6.57% | | 02/01/26 | | | 1,372,778 | | | | 1,366,463 | |
| Mortgage Securities (0.87%) | | | | | | | | | | | | |
| Copper Hill Sportsmans RT | | 7.25% | | 02/01/27 | | | 6,948,212 | | | | 6,676,397 | |
| Tower Bellflower LLC | | 1M CME TERM SOFR + 4.10% | | 02/01/27 | | | 19,050,000 | | | | 19,015,710 | |
| | | | | | | | | | | | | |
| TOTAL BANK LOANS | | | | | | | | | | | | |
| (Cost $26,748,891) | | | | | | | | | | | 27,058,570 | |
| | | | | | | | | | | | | |
| COMMERCIAL MORTGAGE-BACKED SECURITIES (29.45%) | | | | | | | | | | | | |
| United States (29.45%) | | | | | | | | | | | | |
| BAMLL Commercial Mortgage Securities Trust, Series 2022-DKLX, Class E(b)(c) | | 1M CME TERM SOFR + 4.13% | | 01/15/39 | | | 7,515,000 | | | | 7,511,242 | |
| Banc of America Re-Remic Trust, Series 2023-FRR1, Class D(c) | | 0.00% | | 02/27/32 | | | 9,155,000 | | | | 5,276,942 | |
| BANK 2019-BNK17, Series 2019-BN17, Class E(c) | | 3.00% | | 04/15/29 | | | 1,849,000 | | | | 1,406,164 | |
| BANK 2021-BNK31, Series 2021-BN31, Class E(b)(c) | | 2.50% | | 02/15/31 | | | 2,423,000 | | | | 1,647,882 | |
| BANK 2021-BNK36, Series 2021-BN36, Class E(b)(c) | | 2.50% | | 10/15/31 | | | 2,250,000 | | | | 1,478,250 | |
| BANK, Series 2022-BNK41, Class D(c) | | 2.50% | | 04/15/32 | | | 1,500,000 | | | | 1,021,650 | |
| BBCMS Mortgage Trust, Series 2018-TALL, Class C(b)(c) | | 1M CME TERM SOFR + 1.32% | | 03/15/37 | | | 3,312,000 | | | | 2,994,710 | |
| BBCMS Mortgage Trust, Series 2018-TALL, Class E(b)(c) | | 1M CME TERM SOFR + 2.44% | | 03/15/37 | | | 14,615,000 | | | | 12,161,141 | |
| BBCMS Mortgage Trust, Series 2020-BID, Class A(b)(c) | | 1M CME TERM SOFR + 2.25% | | 10/15/25 | | | 10,345,000 | | | | 10,331,551 | |
| BBCMS Mortgage Trust, Series 2023-5C23, Class E(b)(c) | | 7.46% | | 11/15/28 | | | 4,079,000 | | | | 3,779,193 | |
| BCP Trust, Series 2021-330N, Class E(b)(c) | | 1M CME TERM SOFR + 3.64% | | 06/15/38 | | | 15,300,000 | | | | 11,162,880 | |
| BCP Trust, Series 2021-330N, Class D(b)(c) | | 1M CME TERM SOFR + 2.61% | | 06/15/38 | | | 2,389,270 | | | | 1,876,533 | |
| BCP Trust, Series 2021-330N, Class C(b)(c) | | 1M CME TERM SOFR + 1.71% | | 06/15/38 | | | 4,089,000 | | | | 3,359,931 | |
| BCP Trust, Series 2021-330N, Class B(b)(c) | | 1M CME TERM SOFR + 1.31% | | 06/15/38 | | | 4,200,000 | | | | 3,846,780 | |
| BCP Trust, Series 2021-330N, Class F(b)(c) | | 1M CME TERM SOFR + 4.63% | | 06/15/38 | | | 8,500,000 | | | | 5,130,600 | |
| BCRR , Series 2016-FRR3, Class E(b)(c) | | 18.46% - 30D US SOFR% | | 05/26/26 | | | 24,057,599 | | | | 23,590,882 | |
| Benchmark Mortgage Trust, Series 2023-V3, Class XA(b)(f) | | 0.81% | | 03/15/28 | | | 76,575,918 | | | | 2,013,947 | |
| BMD2 Re-Remic Trust, Series 2019-FRR1, Class 3C(c) | | 0.00% | | 05/25/52 | | | 12,585,000 | | | | 9,560,824 | |
| BMD2 Re-Remic Trust, Series 2019-FRR1, Class 5C(c) | | 0.00% | | 05/25/52 | | | 6,619,500 | | | | 4,722,351 | |
| BMD2 Re-Remic Trust, Series 2019-FRR1, Class 3AB(c) | | 0.00% | | 05/25/52 | | | 6,000,000 | | | | 4,641,600 | |
| BMO Mortgage Trust, Series 2023-5C1, Class XA(b)(f) | | 0.58% | | 07/15/28 | | | 134,059,920 | | | | 2,547,138 | |
| BMO Mortgage Trust, Series 2023-5C1, Class C(b) | | 7.12% | | 08/15/28 | | | 1,000,000 | | | | 1,013,600 | |
See Notes to Consolidated Financial Statements and Consolidated Financial Highlights.
| Axonic Strategic Income Fund | Consolidated Schedule of Investments |
October 31, 2024
| | | Rate | | Maturity Date | | Principal Amount | | | Value | |
| BX Mortgage Trust, Series 2022-MVRK, Class G(b)(c) | | 1M US SOFR +
5.61% | |
03/15/27 | | $ | 12,865,179 | | | $ | 12,493,376 | |
| BX Commercial Mortgage Trust, Series 2024-KING, Class E(b)(c) | | 1M CME TERM SOFR + 3.69% | | 05/15/26 | | | 2,400,000 | | | | 2,394,240 | |
| BX Commercial Mortgage Trust, Series 2024-MF, Class D(b)(c) | | 1M CME TERM SOFR + 2.69% | | 02/15/26 | | | 8,943,091 | | | | 8,873,335 | |
| BX Trust, Series 2018-GW, Class E(b)(c) | | 1M CME TERM SOFR + 2.27% | | 05/15/25 | | | 16,731,000 | | | | 16,694,192 | |
| BX Trust, Series 2018-GW, Class F(b)(c) | | 1M CME TERM SOFR + 2.72% | | 05/15/25 | | | 5,000,000 | | | | 4,987,500 | |
| BX Trust, Series 2022-IND, Class E(b)(c) | | 1M CME TERM SOFR + 3.99% | | 04/15/27 | | | 10,793,326 | | | | 10,778,215 | |
| BX Trust, Series 2023-DELC, Class E(b)(c) | | 1M CME TERM SOFR + 5.29% | | 05/15/25 | | | 6,000,000 | | | | 6,046,200 | |
| BXSC Commercial Mortgage Trust, Series 2022-WSS, Class E(b)(c) | | 1M CME TERM SOFR + 4.13% | | 03/15/27 | | | 30,005,000 | | | | 29,800,966 | |
| BXSC Commercial Mortgage Trust, Series 2022-WSS, Class D(b)(c) | | 1M CME TERM SOFR + 3.19% | | 03/15/27 | | | 15,000,000 | | | | 15,000,000 | |
| BXSC Commercial Mortgage Trust, Series 2022-WSS, Class F(b)(c) | | 1M CME TERM SOFR + 5.33% | | 03/15/27 | | | 5,100,000 | | | | 5,060,220 | |
| Cali 2024-Sun, Series 2024-SUN, Class D(b)(c) | | 1M CME TERM SOFR + 3.63% | | 07/15/26 | | | 11,900,000 | | | | 11,936,890 | |
| Cantor Commercial Real Estate Lending, Series 2019-CF1, Class 65D(b)(c) | | 4.66% | | 05/15/52 | | | 4,600,000 | | | | 1,132,980 | |
| Cantor Commercial Real Estate Lending, Series 2019-CF2, Class SWD(c) | | 4.52% | | 09/15/29 | | | 4,988,052 | | | | 4,280,247 | |
| Cascade Funding Mortgage Trust, Series 2021-FRR1, Class CK58(c) | | 0.00% | | 09/29/29 | | | 24,870,000 | | | | 20,875,878 | |
| COLT Mortgage Loan Trust, Series 2020-3, Class A1(b)(c) | | 1.51% | | 04/27/65 | | | 4,071,221 | | | | 3,895,035 | |
| Commercial Mortgage Lease-Backed Certificates Series-1, Series 2001-CMLB, Class J(b)(c) | | 6.25% | | 06/20/31 | | | 290,807 | | | | 286,503 | |
| Countrywide Alternative Loan, Series 2007-17CB, Class A6 | | 5.01% | | 08/25/37 | | | 6,548,467 | | | | 2,845,506 | |
| Credit Suisse Commercial Mortgage Trust 2020-FACT E(b)(c) | | 10.59% | | 10/15/25 | | | 1,745,000 | | | | 1,620,756 | |
| Credit Suisse Mortgage Capital Certificates, Series 2020-FACT, Class F(b)(c) | | 1M CME TERM SOFR + 6.16% | | 10/15/25 | | | 11,340,000 | | | | 9,818,172 | |
| CSMC, Series 2020-FACT, Class C(b)(c) | | 1M CME TERM SOFR + 2.96% | | 10/15/25 | | | 5,000,000 | | | | 4,764,000 | |
| DC Trust, Series 2024-HLTN, Class D(b)(c) | | 7.71% | | 04/13/28 | | | 2,439,000 | | | | 2,477,292 | |
| Extended Stay America Trust, Series 2021-ESH, Class E(b)(c) | | 1M CME TERM SOFR + 2.96% | | 07/15/26 | | | 7,288,628 | | | | 7,290,815 | |
| Extended Stay America Trust, Series 2021-ESH, Class F(b)(c) | | 1M CME TERM SOFR + 3.81% | | 07/15/26 | | | 31,865,526 | | | | 31,983,428 | |
| Freddie Mac Mscr Trust Mn7, Series 2023-MN7, Class M2(b)(c) | | 30D US SOFR + 5.70% | | 04/25/33 | | | 2,300,000 | | | | 2,512,750 | |
| Freddie Mac Mscr Trust Mn8, Series 2024-MN8, Class M1(b)(c) | | 30D US SOFR + 2.85% | | 05/25/29 | | | 12,046,749 | | | | 12,192,515 | |
| Freddie Mac Mscr Trust Mn8, Series 2024-MN8, Class M2(b)(c) | | 30D US SOFR + 4.25% | | 06/25/33 | | | 2,300,000 | | | | 2,387,170 | |
| Freddie Mac Multifamily Structured Credit Risk, Series 2024-MN9, Class M2(b)(c) | | 30D US SOFR + 3.25% | | 10/25/44 | | | 2,500,000 | | | | 2,500,000 | |
See Notes to Consolidated Financial Statements and Consolidated Financial Highlights.
| Annual Report | October 31, 2024 | 5 |
| Axonic Strategic Income Fund | Consolidated Schedule of Investments |
October 31, 2024
| | | Rate | | Maturity Date | | Principal Amount | | | Value | |
| Freddie Mac Multifamily Structured Credit Risk, Series 2021-MN1, Class M2(b)(c) | | 30D US SOFR + 3.75% | | 01/25/51 | | $ | 2,000,000 | | | $ | 2,039,200 | |
| Freddie Mac Multifamily Structured Pass Through Certificates, Series 2024-162, Class X3(b) | | 5.89% | | 01/25/34 | | | 8,700,000 | | | | 3,386,040 | |
| Freddie Mac Multifamily Structured Pass Through Certificates, Series 2023-153, Class X3(b) | | 4.68% | | 01/25/33 | | | 19,488,345 | | | | 5,542,485 | |
| Freddie Mac Multifamily Structured Pass Through Certificates, Series 2023-154, Class X3(b) | | 5.10% | | 01/25/33 | | | 11,437,000 | | | | 3,564,913 | |
| Freddie Mac Multifamily Structured Pass Through Certificates, Series 2022-151, Class X3(b) | | 4.38% | | 11/25/32 | | | 6,840,000 | | | | 1,793,448 | |
| Freddie Mac Multifamily Structured Pass Through Certificates, Series 2018-Q008, Class X(b) | | 1.41% | | 12/25/24 | | | 11,282,941 | | | | 141,037 | |
| FREMF Mortgage Trust, Series 2016-KF24, Class B(b)(c) | | 30D US SOFR + 5.11% | | 10/25/26 | | | 3,031,207 | | | | 3,004,836 | |
| FREMF Mortgage Trust, Series 2018-KF49, Class B(b)(c) | | 30D US SOFR + 2.01% | | 06/25/25 | | | 4,849,698 | | | | 4,809,931 | |
| FREMF Mortgage Trust, Series 2018-KF49, Class C(b)(c) | | 30D US SOFR + 6.11% | | 06/25/25 | | | 20,662,824 | | | | 20,480,991 | |
| FREMF Mortgage Trust, Series 2018-KF51, Class B(b)(c) | | 30D US SOFR + 1.96% | | 08/25/25 | | | 3,262,211 | | | | 3,237,418 | |
| FRESB Mortgage Trust, Series 2019-SB66, Class X1(b)(f) | | 0.38% | | 07/25/29 | | | 29,292,181 | | | | 861,149 | |
| FRESB Mortgage Trust, Series 2020-SB74, Class X1(b)(f) | | 1.09% | | 03/25/30 | | | 25,273,349 | | | | 798,638 | |
| FRESB Mortgage Trust, Series 2020-SB79, Class X1(b)(f) | | 1.08% | | 07/25/40 | | | 15,015,784 | | | | 506,392 | |
| FRESB Mortgage Trust, Series 2020-SB80, Class X1(b)(f) | | 1.20% | | 09/25/30 | | | 55,134,121 | | | | 2,652,343 | |
| FRESB Mortgage Trust, Series 2020-SB81, Class X1(b)(f) | | 1.03% | | 10/25/30 | | | 18,326,685 | | | | 757,854 | |
| FRESB Mortgage Trust, Series 2021-SB82, Class X1(b)(f) | | 1.06% | | 10/25/40 | | | 44,106,665 | | | | 1,202,762 | |
| FRESB Mortgage Trust, Series 2021-SB83, Class X1(b)(f) | | 0.87% | | 01/25/41 | | | 27,833,792 | | | | 831,287 | |
| FRESB Mortgage Trust, Series 2021-SB84, Class X1(b)(f) | | 0.49% | | 01/25/31 | | | 26,472,624 | | | | 599,822 | |
| FRESB Mortgage Trust, Series 2022-SB95, Class X1(b)(f) | | 0.00% | | 11/25/31 | | | 115,309,559 | | | | 1,328,816 | |
| FS Commercial Mortgage Trust, Series 2023-4SZN, Class E(b)(c) | | 10.42% | | 11/10/27 | | | 15,740,000 | | | | 16,330,250 | |
| FS Trust, Series 2024-HULA, Class D(b)(c) | | 1M CME TERM SOFR + 2.94% | | 08/15/26 | | | 1,850,000 | | | | 1,851,480 | |
| FS Trust, Series 2024-HULA, Class E(b)(c) | | 1M CME TERM SOFR + 3.44% | | 08/15/26 | | | 5,000,000 | | | | 5,004,500 | |
| GAM RE-REMIC Trust, Series 2022-FRR3, Class EK41(c) | | 0.00% | | 10/27/47 | | | 2,445,000 | | | | 2,429,107 | |
| Government National Mortgage Association, Series 2018-16, Class IO(b)(f) | | 0.59% | | 03/16/59 | | | 68,848,793 | | | | 2,519,866 | |
| Great Wolf Trust, Series 2024-WOLF, Class E(b)(c) | | 6.12% | | 03/15/39 | | | 24,100,000 | | | | 24,295,210 | |
| Great Wolf Trust, Series 2024-WOLF, Class D(b)(c) | | 1M CME TERM SOFR + 2.89% | | 03/15/29 | | | 14,100,000 | | | | 14,152,170 | |
| HILT COMMERCIAL MORTGAGE TRUST, Series 2024-ORL, Class D(b)(c) | | 1M CME TERM SOFR + 3.19% | | 05/15/26 | | | 2,000,000 | | | | 1,987,600 | |
| Hilton USA Trust, Series 2016-HHV, Class F | | 4.19% | | 11/05/38 | | | 10,000,000 | | | | 9,470,313 | |
| HLTN Commercial Mortgage Trust, Series 2024-DPLO, Class D(b)(c) | | 1M CME TERM SOFR + 3.34% | | 06/15/26 | | | 16,000,000 | | | | 16,036,800 | |
| Hudsons Bay Simon JV Trust, Series 2015-HB7, Class A7(c) | | 3.91% | | 08/05/34 | | | 8,381,387 | | | | 8,298,411 | |
| Hudsons Bay Simon JV Trust 2015-HBS, Series 2015-HB7, Class B7(c) | | 4.67% | | 08/05/34 | | | 3,000,000 | | | | 2,871,900 | |
| Hudsons Bay Simon JV Trust 2015-HBS, Series 2015-HB10, Class A10(c) | | 4.15% | | 08/05/25 | | | 2,764,207 | | | | 2,659,720 | |
See Notes to Consolidated Financial Statements and Consolidated Financial Highlights.
| Axonic Strategic Income Fund | Consolidated Schedule of Investments |
October 31, 2024
| | | Rate | | Maturity Date | | Principal Amount | | | Value | |
| Hudsons Bay Simon JV Trust 2015-HBS, Series 2015-HB10, Class B10(c) | | 4.91% | | 08/05/34 | | $ | 4,250,000 | | | $ | 4,048,975 | |
| HYT Commercial Mortgage Trust, Series 2024-RGCY, Class D(b)(c) | | 1M CME TERM SOFR + 3.44% | | 09/15/26 | | | 17,900,000 | | | | 17,855,250 | |
| INTOWN Mortgage Trust, Series 2022-STAY, Class A(b)(c) | | 1M CME TERM SOFR + 2.49% | | 08/15/39 | | | 10,445,000 | | | | 10,455,445 | |
| INTOWN Mortgage Trust, Series 2022-STAY, Class B(b)(c) | | 1M CME TERM SOFR + 3.29% | | 08/15/39 | | | 4,395,000 | | | | 4,398,955 | |
| INTOWN Mortgage Trust, Series 2022-STAY, Class C(b)(c) | | 1M CME TERM SOFR + 3.69% | | 08/15/39 | | | 495,000 | | | | 495,446 | |
| INTOWN Mortgage Trust, Series 2022-STAY, Class D(b)(c) | | 1M CME TERM SOFR + 4.13% | | 08/15/39 | | | 845,000 | | | | 847,789 | |
| INTOWN Mortgage Trust, Series 2022-STAY, Class E(b)(c) | | 1M CME TERM SOFR + 5.03% | | 04/15/27 | | | 2,344,000 | | | | 2,357,361 | |
| JP Morgan Chase Commercial Mortgage Securities Trust 2007- LDP12, Series 2007-LD12, Class AJ(b) | | 6.35% | | 02/15/51 | | | 3,877,154 | | | | 3,847,687 | |
| JP Morgan Chase Commercial Mortgage Securities Trust, Series 2008-C2, Class AM(b) | | 6.83% | | 02/15/51 | | | 3,580,298 | | | | 1,973,102 | |
| JP Morgan Chase Commercial Mortgage Securities Trust, Series 2022-NLP, Class B(b)(c) | | 1M CME TERM SOFR + 1.11% | | 04/15/27 | | | 22,454,430 | | | | 21,452,963 | |
| JP Morgan Chase Commercial Mortgage Securities Trust, Series 2022-NLP, Class A(b)(c) | | 1M CME TERM SOFR + 0.60% | | 04/15/27 | | | 3,606,377 | | | | 3,471,498 | |
| JP Morgan Chase Commercial Mortgage Securities Trust, Series 2022-NLP, Class G(b)(c) | | 1M US SOFR + 4.27% | | 04/15/27 | | | 7,400,199 | | | | 6,108,864 | |
| JW Commercial Mortgage Trust, Series 2024-MRCO, Class D(b)(c) | | 1M CME TERM SOFR + 3.19% | | 06/15/26 | | | 10,000,000 | | | | 9,950,000 | |
| MCR Mortgage Trust, Series 2024-TWA, Class E(c) | | 8.73% | | 06/12/27 | | | 20,000,000 | | | | 20,168,000 | |
| Merchants Bank of Indiana Multifamily Housing Mortgage Loan Trust, Series 2024-Q025, Class B(b) | | 30D US SOFR + 3.85% | | 12/25/30 | | | 16,232,000 | | | | 16,191,420 | |
| MRCD 2019-MARK Mortgage Trust, Series 2019-PARK, Class G(c) | | 2.72% | | 12/15/24 | | | 8,944,000 | | | | 5,187,974 | |
| MTK Mortgage Trust, Series 2021-GRNY, Class A(b)(c) | | 1M CME TERM SOFR + 1.86% | | 12/15/38 | | | 10,500,000 | | | | 10,401,300 | |
| MTK Mortgage Trust, Series 2021-GRNY, Class B(b)(c) | | 1M CME TERM SOFR + 2.76% | | 12/15/38 | | | 22,648,900 | | | | 22,082,678 | |
| MTK Mortgage Trust, Series 2021-GRNY, Class F(b)(c) | | 1M CME TERM SOFR + 5.91% | | 12/15/38 | | | 2,600,000 | | | | 2,406,040 | |
| MTN Commercial Mortgage Trust, Series 2022-LPFL, Class F(b)(c) | | 1M US SOFR + 5.29% | | 03/15/27 | | | 10,000,000 | | | | 9,645,000 | |
| Multifamily Connecticut Avenue Securities, Series 2019-01, Class M10(b)(c) | | 30D US SOFR + 3.36% | | 10/25/49 | | | 1,816,676 | | | | 1,833,389 | |
| Multifamily Connecticut Avenue Securities, Series 2020-01, Class M10(b)(c) | | 30D US SOFR + 3.86% | | 03/25/50 | | | 13,429,546 | | | | 13,632,332 | |
| Multifamily Connecticut Avenue Securities Trust, Series 2023-01, Class M10(b)(c) | | 30D US SOFR + 6.50% | | 02/25/32 | | | 5,000,000 | | | | 5,668,000 | |
| Multifamily Connecticut Avenue Securities Trust, Series 2024-01, Class M10(b)(c) | | 30D US SOFR + 3.85% | | 07/25/54 | | | 1,400,000 | | | | 1,437,100 | |
| NCMF Trust, Series 2022-MFP, Class G(b)(c) | | 1M CME TERM SOFR + 5.13% | | 03/15/27 | | | 12,600,000 | | | | 12,257,280 | |
| PGA Trust, Series 2024-RSR2, Class B(b)(c) | | 1M CME TERM SOFR + 2.39% | | 06/15/26 | | | 4,910,000 | | | | 4,945,352 | |
See Notes to Consolidated Financial Statements and Consolidated Financial Highlights.
| Annual Report | October 31, 2024 | 7 |
| Axonic Strategic Income Fund | Consolidated Schedule of Investments |
October 31, 2024
| | | Rate | | Maturity Date | | Principal Amount | | | Value | |
| PGA Trust, Series 2024-RSR2, Class D(b)(c) | | 1M CME TERM SOFR + 3.49% | | 06/15/26 | | $ | 5,000,000 | | | $ | 5,031,000 | |
| PGA Trust, Series 2024-RSR2, Class E(b)(c) | | 1M CME TERM SOFR + 3.89% | | 06/15/26 | | | 2,000,000 | | | | 2,013,400 | |
| RFM Reremic Trust, Series 2022-FRR1, Class CK55(c) | | 0.00% | | 03/28/49 | | | 7,500,000 | | | | 6,696,750 | |
| ROCK Trust, Series 2024-CNTR, Class D(c) | | 7.11% | | 11/13/29 | | | 5,493,000 | | | | 5,563,860 | |
| SB Multifamily Repack Trust, Series 2020-FRR1, Class A(c) | | 5.60% | | 05/27/26 | | | 13,272,865 | | | | 13,112,263 | |
| SFAVE Commercial Mortgage Securities Trust, Series 2015-5AVE, Class C(b)(c) | | 4.39% | | 01/05/35 | | | 8,133,239 | | | | 6,244,701 | |
| SFAVE Commercial Mortgage Securities Trust, Series 2015-5AVE, Class B(b)(c) | | 4.39% | | 01/05/35 | | | 4,991,000 | | | | 4,010,768 | |
| SFAVE Commercial Mortgage Securities Trust, Series 2015-5AVE, Class A1(b)(c) | | 3.87% | | 01/05/35 | | | 6,497,500 | | | | 5,382,529 | |
| SFAVE Commercial Mortgage Securities Trust, Series 2015-5AVE, Class A2A(b)(c) | | 3.66% | | 01/05/35 | | | 3,195,000 | | | | 2,611,593 | |
| SFAVE Commercial Mortgage Securities Trust, Series 2015-5AVE, Class A2B(b)(c) | | 4.14% | | 01/05/35 | | | 5,195,000 | | | | 4,402,763 | |
| SMR Mortgage Trust, Series 2022-IND, Class B(b)(c) | | 1M CME TERM SOFR + 2.40% | | 02/15/39 | | | 4,578,386 | | | | 4,480,408 | |
| SMR Mortgage Trust, Series 2022-IND, Class C(b)(c) | | 1M CME TERM SOFR + 2.95% | | 02/15/39 | | | 1,831,354 | | | | 1,791,980 | |
| SMR Mortgage Trust, Series 2022-IND, Class D(b)(c) | | 1M CME TERM SOFR + 3.95% | | 02/15/39 | | | 4,819,209 | | | | 4,714,632 | |
| SMR Mortgage Trust, Series 2022-IND, Class E(b)(c) | | 1M CME TERM SOFR + 5.00% | | 02/15/39 | | | 10,347,152 | | | | 10,158,834 | |
| SREIT Trust, Series 2021-MFP, Class G(b)(c) | | 1M CME TERM SOFR + 3.09% | | 11/15/26 | | | 24,400,004 | | | | 24,026,684 | |
| THPT Mortgage Trust, Series 2023-THL, Class C(b)(c) | | 8.53% | | 12/10/26 | | | 4,844,448 | | | | 4,999,955 | |
| THPT Mortgage Trust, Series 2023-THL, Class F(b)(c) | | 7.19% | | 12/10/26 | | | 9,158,000 | | | | 8,545,330 | |
| Velocity Commercial Capital Loan Trust, Series 2019-2, Class M5(b)(c) | | 4.93% | | 03/25/27 | | | 247,938 | | | | 199,088 | |
| Velocity Commercial Capital Loan Trust, Series 2019-1, Class M6(b)(c) | | 6.79% | | 10/29/29 | | | 1,156,171 | | | | 893,761 | |
| Velocity Commercial Capital Loan Trust, Series 2021-1, Class M6(b)(c) | | 5.03% | | 03/25/31 | | | 1,770,817 | | | | 1,073,606 | |
| Velocity Commercial Capital Loan Trust, Series 2021-3, Class M6(b)(c) | | 5.03% | | 11/25/31 | | | 635,476 | | | | 457,130 | |
| Velocity Commercial Capital Loan Trust, Series 2022-1, Class M5(b)(c) | | 5.81% | | 06/25/32 | | | 3,586,072 | | | | 2,508,582 | |
| Velocity Commercial Capital Loan Trust, Series 2022-1, Class M6(b)(c) | | 5.81% | | 08/25/33 | | | 2,110,949 | | | | 1,371,326 | |
| Velocity Commercial Capital Loan Trust, Series 2022-2, Class M5(b)(c) | | 5.79% | | 04/25/52 | | | 3,309,118 | | | | 2,584,090 | |
| WB Commercial Mortgage Trust, Series 2024-HQ, Class C(b)(c) | | 6.90% | | 03/15/28 | | | 8,500,000 | | | | 8,468,550 | |
| WCORE Commercial Mortgage Trust, Series 2024-CORE, Class D(b)(c) | | 1M CME TERM SOFR + 2.94% | | 11/15/26 | | | 2,000,000 | | | | 1,995,000 | |
See Notes to Consolidated Financial Statements and Consolidated Financial Highlights.
| Axonic Strategic Income Fund | Consolidated Schedule of Investments |
October 31, 2024
| | | Rate | | Maturity Date | | Principal Amount | | | Value | |
| WCORE Commercial Mortgage Trust, Series 2024-CORE, Class E(b)(c) | | 1M CME TERM SOFR + 3.94% | | 11/15/26 | | $ | 3,000,000 | | | $ | 2,992,500 | |
| | | | | | | | | | | | | |
| TOTAL COMMERCIAL MORTGAGE-BACKED SECURITIES | | | | | | | | | | | | |
| (Cost $907,107,343) | | | | | | | | | | | 870,900,944 | |
| | | | | | | | | | | | | |
| CONVERTIBLE CORPORATE BONDS (0.94%) | | | | | | | | | | | | |
| United States (0.94%) | | | | | | | | | | | | |
| PennyMac Corp. | | 5.50% | | 11/01/24 | | | 5,000,000 | | | | 4,987,500 | |
| PennyMac Corp. | | 5.50% | | 03/15/26 | | | 10,682,000 | | | | 10,482,247 | |
| Redwood Trust, Inc. | | 7.75% | | 06/15/27 | | | 1,000,000 | | | | 1,009,718 | |
| RWT Holdings, Inc. | | 5.75% | | 10/01/25 | | | 11,300,000 | | | | 11,353,110 | |
| | | | | | | | | | | | | |
| TOTAL CONVERTIBLE CORPORATE BONDS | | | | | | | | | | | | |
| (Cost $27,227,181) | | | | | | | | | | | 27,832,575 | |
| | | | | | | | | | | | | |
| CORPORATE BONDS (0.30%) | | | | | | | | | | | | |
| United States (0.30%) | | | | | | | | | | | | |
| GKN Subordinated CTL Pass-Through Trust/Auburn MI(b)(c) | | 0.00% | | 03/15/30 | | | 7,076,849 | | | | 4,188,079 | |
| Rithm Capital Corp.(c) | | 6.25% | | 10/15/25 | | | 4,673,000 | | | | 4,684,683 | |
| | | | | | | | | | | | | |
| TOTAL CORPORATE BONDS | | | | | | | | | | | | |
| (Cost $9,420,975) | | | | | | | | | | | 8,872,762 | |
| | | | | | | | | | | | | |
| GOVERNMENT BOND (11.45%) | | | | | | | | | | | | |
| United States (11.45%) | | | | | | | | | | | | |
| U.S. Treasury Bond | | 3.88% | | 08/15/34 | | | 350,000,000 | | | | 338,652,335 | |
| | | | | | | | | | | | | |
| TOTAL GOVERNMENT BOND | | | | | | | | | | | | |
| (Cost $349,393,492) | | | | | | | | | | | 338,652,335 | |
| | | | | | | | | | | | | |
| RESIDENTIAL MORTGAGE-BACKED SECURITIES (28.98%) | | | | | | | | | | | | |
| United States (28.98%) | | | | | | | | | | | | |
| A&D Mortgage Trust, Series 2023-NQM2, Class A1(c)(d) | | 6.13% | | 04/25/27 | | | 1,914,327 | | | | 1,921,212 | |
| A&D Mortgage Trust, Series 2023-NQM4, Class A3(c)(d) | | 8.10% | | 10/25/27 | | | 880,536 | | | | 902,249 | |
| A&D Mortgage Trust, Series 2023-NQM5, Class B1(b)(c) | | 8.18% | | 11/25/68 | | | 3,000,000 | | | | 3,001,821 | |
| A&D Mortgage Trust, Series 2024-NQM1, Class A1(c)(d) | | 6.20% | | 02/25/69 | | | 4,623,512 | | | | 4,637,806 | |
| A&D Mortgage Trust, Series 2024-NQM1, Class B1(b)(c) | | 8.57% | | 02/25/69 | | | 3,017,000 | | | | 3,058,850 | |
| A&D Mortgage Trust, Series 2024-NQM4, Class M1(b)(c) | | 5.93% | | 08/25/69 | | | 6,800,000 | | | | 6,737,407 | |
| A&D Mortgage Trust, Series 2024-NQM4, Class B1B(b)(c) | | 8.05% | | 08/25/69 | | | 2,221,667 | | | | 2,200,940 | |
| AlphaFlow Transitional Mortgage Trust, Series 2021-WL1, Class A2(c)(d) | | 5.61% | | 01/25/26 | | | 248,020 | | | | 58,191 | |
| Alternative Loan Trust, Series 2006-18CB, Class A1(b) | | 1M CME TERM SOFR + 0.58% | | 07/25/36 | | | 9,009,808 | | | | 3,739,724 | |
| Alternative Loan Trust, Series 2006-18CB, Class A7(b) | | 1M CME TERM SOFR + 0.46% | | 07/25/36 | | | 23,851,024 | | | | 9,699,353 | |
| Alternative Loan Trust, Series 2006-20CB, Class A4(b) | | 1M CME TERM SOFR + 0.46% | | 07/25/36 | | | 4,731,934 | | | | 1,512,970 | |
| Alternative Loan Trust, Series 2006-24CB, Class A5(b) | | 1M CME TERM SOFR + 0.71% | | 08/25/36 | | | 5,142,370 | | | | 2,257,686 | |
| Alternative Loan Trust, Series 2006-24CB, Class A19(b) | | 1M CME TERM SOFR + 0.61% | | 08/25/36 | | | 2,372,906 | | | | 1,024,501 | |
See Notes to Consolidated Financial Statements and Consolidated Financial Highlights.
| Annual Report | October 31, 2024 | 9 |
| Axonic Strategic Income Fund | Consolidated Schedule of Investments |
October 31, 2024
| | | Rate | | Maturity Date | | Principal Amount | | | Value | |
| Alternative Loan Trust, Series 2006-2CB, Class A4(b) | | 1M CME TERM SOFR + 0.51% | | 03/25/36 | | $ | 3,664,543 | | | $ | 1,278,209 | |
| Alternative Loan Trust, Series 2006-40T1, Class 1A3(b) | | 1M CME TERM SOFR + 0.66% | | 01/25/37 | | | 4,192,850 | | | | 2,173,311 | |
| Alternative Loan Trust, Series 2006-42, Class 1A1(b) | | 1M CME TERM SOFR + 0.71% | | 01/25/47 | | | 6,336,430 | | | | 2,827,985 | |
| Alternative Loan Trust, Series 2006-6CB, Class 2A13(b) | | 1M CME TERM SOFR + 0.51% | | 05/25/36 | | | 3,868,282 | | | | 1,084,768 | |
| Alternative Loan Trust, Series 2007-2CB, Class 1A12(b) | | 1M CME TERM SOFR + 0.61% | | 03/25/37 | | | 1,580,153 | | | | 680,017 | |
| Alternative Loan Trust, Series 2007-5CB, Class 1A19(b) | | 1M CME TERM SOFR + 0.56% | | 04/25/37 | | | 12,766,961 | | | | 5,194,345 | |
| Alternative Loan Trust, Series 2007-5CB, Class 1A21(b) | | 1M CME TERM SOFR + 0.65% | | 04/25/37 | | | 2,045,248 | | | | 845,521 | |
| American Home Mortgage Investment Trust, Series 2007-1, Class GA1C(b) | | 1M CME TERM SOFR + 0.30% | | 05/25/47 | | | 14,733,516 | | | | 8,543,437 | |
| AMSR, Series 2021-SFR3, Class G(c) | | 3.80% | | 10/17/26 | | | 7,000,000 | | | | 6,539,159 | |
| Angel Oak Mortgage Trust, Series 2020-R1, Class A1(b)(c) | | 0.99% | | 12/25/24 | | | 1,825,555 | | | | 1,700,847 | |
| Angel Oak Mortgage Trust I LLC, Series 2019-1, Class M1(b)(c) | | 4.50% | | 11/25/48 | | | 1,209,898 | | | | 1,202,486 | |
| Banc of America Funding 2006 8T2 Trust, Series 2006-8T2, Class A6(d) | | 6.55% | | 10/25/36 | | | 1,528,410 | | | | 1,318,135 | |
| Banc of America Funding , Series 2015-R2, Class 9A2(b)(c) | | 4.20% | | 07/27/27 | | | 10,778,374 | | | | 9,765,692 | |
| Bear Stearns Mortgage Funding Trust, Series 2006-AR3, Class 1A2A(b) | | 1M CME TERM SOFR + 0.59% | | 10/25/36 | | | 318,188 | | | | 294,390 | |
| Bear Stearns Mortgage Funding Trust, Series 2006-AR3, Class 1A2G(b) | | 1M CME TERM SOFR + 0.59% | | 10/25/36 | | | 2,543,284 | | | | 2,353,062 | |
| Bear Stearns Mortgage Funding Trust, Series 2007-AR2, Class A2(b) | | 1M CME TERM SOFR + 0.51% | | 03/25/37 | | | 5,863,175 | | | | 5,238,980 | |
| Bear Stearns Mortgage Funding Trust, Series 2007-AR4, Class G2AB(b) | | 1M CME TERM SOFR + 0.35% | | 04/25/37 | | | 5,279,692 | | | | 4,703,490 | |
| Bear Stearns Mortgage Funding Trust, Series 2007-AR5, Class 1A2G(b) | | 1M CME TERM SOFR + 0.55% | | 06/25/37 | | | 762,588 | | | | 637,902 | |
| Bear Stearns Mortgage Funding Trust, Series 2007-AR5, Class 2A2(b) | | 1M CME TERM SOFR + 0.34% | | 06/25/37 | | | 1,940,924 | | | | 1,702,509 | |
| Boston Lending Trust, Series 2022-1, Class M2(b)(c) | | 2.75% | | 02/25/27 | | | 2,694,508 | | | | 2,149,139 | |
| BRAVO Residential Funding Trust, Series 2021-NQM1, Class A1(b)(c) | | 0.94% | | 02/25/49 | | | 2,507,152 | | | | 2,311,405 | |
| BRAVO Residential Funding Trust, Series 2021-NQM1, Class A3(b)(c) | | 1.33% | | 02/25/49 | | | 799,851 | | | | 739,864 | |
| CHL Mortgage Pass-Through Trust, Series 2007-4, Class 1A51(b) | | 1M CME TERM SOFR + 0.71% | | 05/25/37 | | | 2,221,771 | | | | 787,444 | |
| CHNGE Mortgage Trust, Series 2022-4, Class A1(c)(d) | | 6.00% | | 10/25/57 | | | 10,780,681 | | | | 10,793,196 | |
| CHNGE Mortgage Trust, Series 2023-2, Class A1(c)(d) | | 6.53% | | 05/25/27 | | | 1,315,673 | | | | 1,321,560 | |
| CHNGE Mortgage Trust, Series 2023-3, Class A1(c)(d) | | 7.10% | | 06/25/27 | | | 4,930,503 | | | | 4,986,080 | |
| CHNGE Mortgage Trust, Series 2023-4, Class A1(c)(d) | | 7.57% | | 09/25/58 | | | 7,182,915 | | | | 7,316,942 | |
| CitiMortgage Alternative Loan Trust, Series 2007-A2, Class 1A1(b) | | 1M CME TERM SOFR + 0.71% | | 02/25/37 | | | 1,249,743 | | | | 1,057,968 | |
| COLTMortgage Pass-Through Certificates, Series 2021-1R, Class A3(b)(c) | | 1.42% | | 05/25/65 | | | 2,743,999 | | | | 2,382,883 | |
| Cross Mortgage Trust, Series 2024-H6, Class B1A(b)(c) | | 6.64% | | 09/25/69 | | | 1,079,000 | | | | 1,052,458 | |
| Deephaven Residential Mortgage Trust, Series 2020-2, Class A3(c) | | 2.86% | | 05/25/65 | | | 3,341,640 | | | | 3,292,696 | |
| Dominion Mortgage Trust, Series 2021-RTL1, Class A1(c)(d) | | 2.49% | | 02/25/25 | | | 28,333,333 | | | | 27,963,249 | |
See Notes to Consolidated Financial Statements and Consolidated Financial Highlights.
| Axonic Strategic Income Fund | Consolidated Schedule of Investments |
October 31, 2024
| | | Rate | | Maturity Date | | Principal Amount | | | Value | |
| Dominion Mortgage Trust, Series 2021-RTL1, Class M(c)(d) | | 5.73% | | 02/25/25 | | $ | 3,500,000 | | | $ | 3,139,384 | |
| GCAT, Series 2021-NQM4, Class A1(b)(c) | | 1.09% | | 08/25/25 | | | 586,665 | | | | 478,044 | |
| GS Mortgage-Backed Securities Trust, Series 2021-NQM1, Class B2(b)(c) | | 4.21% | | 07/25/61 | | | 1,000,000 | | | | 759,512 | |
| HarborView Mortgage Loan Trust, Series 2006-4, Class 1A2A(b) | | 1M CME TERM SOFR + 0.49% | | 05/19/46 | | | 9,596,518 | | | | 4,880,846 | |
| Home Partners of America, Series 2021-2, Class G(c) | | 4.51% | | 12/17/26 | | | 5,763,374 | | | | 5,314,984 | |
| Imperial Fund Mortgage Trust, Series 2020-NQM1, Class A1(b)(c) | | 1.38% | | 10/25/55 | | | 5,074,679 | | | | 4,680,250 | |
| Imperial Fund Mortgage Trust, Series 2023-NQM1, Class B1(b)(c) | | 8.16% | | 02/25/68 | | | 1,500,000 | | | | 1,491,310 | |
| Lehman Mortgage Trust, Series 2005-2, Class 3A1(b) | | 1M CME TERM SOFR + 0.86% | | 12/25/35 | | | 3,656,895 | | | | 1,785,153 | |
| Lehman Mortgage Trust, Series 2005-2, Class 2A1(b) | | 1M CME TERM SOFR + 0.79% | | 12/25/35 | | | 4,727,492 | | | | 2,433,604 | |
| Lehman Mortgage Trust, Series 2006-9, Class 1A5(b) | | 1M CME TERM SOFR + 0.71% | | 01/25/37 | | | 1,660,804 | | | | 903,794 | |
| Lehman Mortgage Trust, Series 2007-2, Class 2A1(b) | | 1M CME TERM SOFR + 0.42% | | 02/25/37 | | | 24,979,343 | | | | 4,475,861 | |
| Lehman Mortgage Trust, Series 2007-3, Class 1A3(b) | | 1M CME TERM SOFR + 0.41% | | 03/25/37 | | | 11,165,413 | | | | 2,780,725 | |
| Lehman Mortgage Trust, Series 2008-3, Class A1(b) | | 1M CME TERM SOFR + 0.48% | | 02/25/37 | | | 30,883,557 | | | | 7,161,103 | |
| Lehman XS Trust, Series 2007-6, Class 3A31(d) | | 4.25% | | 05/25/37 | | | 3,171,761 | | | | 2,861,586 | |
| Lehman XS Trust, Series 2007-6, Class 3A32(b) | | 1M CME TERM SOFR + 0.61% | | 05/25/37 | | | 6,727,424 | | | | 6,152,152 | |
| LHOME Mortgage Trust, Series 2022-RTL1, Class A1(c) | | 5.97% | | 02/25/27 | | | 5,160,372 | | | | 5,153,120 | |
| LHOME Mortgage Trust, Series 2022-RTL2, Class M(c)(d) | | 8.00% | | 04/25/27 | | | 4,413,000 | | | | 4,405,398 | |
| LHOME Mortgage Trust, Series 2022-RTL3, Class A1(c)(d) | | 8.15% | | 06/25/25 | | | 30,000,000 | | | | 30,105,918 | |
| LHOME Mortgage Trust, Series 2023-RTL1, Class A1(c)(d) | | 7.87% | | 01/25/28 | | | 40,000,000 | | | | 40,222,049 | |
| LHOME Mortgage Trust, Series 2023-RTL2, Class A1(c)(d) | | 8.00% | | 06/25/28 | | | 15,000,000 | | | | 15,178,296 | |
| LHOME Mortgage Trust, Series 2023-RTL3, Class A1(c)(d) | | 8.00% | | 08/25/28 | | | 22,500,000 | | | | 22,876,157 | |
| LHOME Mortgage Trust, Series 2023-RTL3, Class A2(c)(d) | | 9.00% | | 08/25/28 | | | 3,000,000 | | | | 3,027,177 | |
| LHOME Mortgage Trust, Series 2023-RTL4, Class A1(c)(d) | | 7.63% | | 06/25/26 | | | 13,750,000 | | | | 13,980,556 | |
| LHOME Mortgage Trust, Series 2024-RTL1, Class A2(c)(d) | | 9.17% | | 01/25/29 | | | 6,000,000 | | | | 6,087,107 | |
| LHOME Mortgage Trust, Series 2024-RTL1, Class A1(c)(d) | | 7.02% | | 01/25/29 | | | 8,500,000 | | | | 8,566,258 | |
| LHOME Mortgage Trust, Series 2024-RTL2, Class A2(c)(d) | | 8.90% | | 10/25/26 | | | 4,100,000 | | | | 4,152,321 | |
| LHOME Mortgage Trust, Series 2024-RTL2, Class A1(c)(d) | | 7.13% | | 10/25/26 | | | 11,631,000 | | | | 11,769,869 | |
| LHOME Mortgage Trust, Series 2024-RTL3, Class A2(c)(d) | | 8.37% | | 12/25/26 | | | 10,500,000 | | | | 10,570,787 | |
| LHOME Mortgage Trust, Series 2024-RTL3, Class A1(c)(d) | | 6.90% | | 12/25/26 | | | 5,000,000 | | | | 5,052,750 | |
| LHOME Mortgage Trust, Series 2024-RTL4, Class M1(b)(c) | | 7.79% | | 01/25/27 | | | 6,000,000 | | | | 6,048,564 | |
| LHOME Mortgage Trust, Series 2024-RTL5, Class M1(b)(c) | | 6.82% | | 09/25/39 | | | 9,400,000 | | | | 9,302,803 | |
| LHOME Mortgage Trust, Series 2024-RTL5, Class M2(b)(c) | | 8.18% | | 09/25/39 | | | 6,900,000 | | | | 6,830,213 | |
| Merrill Lynch Alternative Note Asset Trust, Series 2007-AF1, Class 1A10(b) | | 1M CME TERM SOFR + 0.46% | | 05/25/37 | | | 16,127,271 | | | | 2,559,590 | |
| MFA 2023-NQM3 Trust, Series 2023-RTL1, Class A1(c)(d) | | 7.58% | | 08/25/27 | | | 7,202,948 | | | | 7,207,390 | |
| MFA , Series 2023-RTL2, Class A1(c)(d) | | 8.50% | | 04/25/26 | | | 27,486,000 | | | | 28,113,745 | |
| MFA , Series 2024-NQM2, Class B1B(b)(c) | | 7.29% | | 08/25/69 | | | 5,448,000 | | | | 5,358,024 | |
| MFA , Series 2024-RTL3, Class A2(c)(d) | | 6.54% | | 11/25/39 | | | 4,600,000 | | | | 4,599,983 | |
| NYMT Loan Trust, Series 2022-BPL1, Class A1(c)(d) | | 3.97% | | 11/25/27 | | | 5,672,293 | | | | 5,660,171 | |
| NYMT Loan Trust, Series 2024-BPL1, Class A1(c)(d) | | 7.15% | | 07/25/26 | | | 5,000,000 | | | | 5,044,178 | |
| NYMT Loan Trust, Series 2024-BPL1, Class A2(c)(d) | | 8.62% | | 07/25/26 | | | 7,860,000 | | | | 7,898,153 | |
See Notes to Consolidated Financial Statements and Consolidated Financial Highlights.
| Annual Report | October 31, 2024 | 11 |
| Axonic Strategic Income Fund | Consolidated Schedule of Investments |
October 31, 2024
| | | Rate | | Maturity Date | | Principal Amount | | | Value | |
| NYMT Loan Trust, Series 2024-BPL2, Class A1(c)(d) | | 6.51% | | 05/25/39 | | $ | 4,000,000 | | | $ | 4,039,786 | |
| NYMT Loan Trust, Series 2024-BPL2, Class M(c) | | 8.41% | | 05/25/39 | | | 7,500,000 | | | | 7,574,242 | |
| NYMT Loan Trust, Series 2024-BPL3, Class M1(b)(c) | | 6.90% | | 09/25/39 | | | 5,800,000 | | | | 5,735,751 | |
| Pret LLC, Series 2024-NPL6, Class A1(c)(d) | | 5.93% | | 10/25/54 | | | 10,355,000 | | | | 10,354,777 | |
| Progress Residential , Series 2021-SFR10, Class G(c) | | 4.86% | | 12/17/28 | | | 3,746,740 | | | | 3,355,122 | |
| Progress Residential , Series 2022-SFR1, Class G(c) | | 5.52% | | 02/17/29 | | | 2,000,000 | | | | 1,820,794 | |
| PRPM , Series 2023-NQM2, Class A2(c)(d) | | 7.00% | | 09/25/27 | | | 7,338,396 | | | | 7,435,481 | |
| PRPM LLC, Series 2024-2, Class A1(c)(d) | | 7.03% | | 03/25/27 | | | 3,070,174 | | | | 3,106,276 | |
| PRPM LLC, Series 2024-4, Class A1(c)(d) | | 6.41% | | 07/25/27 | | | 11,688,616 | | | | 11,711,181 | |
| Rain City Mortgage Trust, Series 2024-RTL1, Class A1(b)(c) | | 6.53% | | 11/25/29 | | | 15,000,000 | | | | 14,986,536 | |
| Rain City Mortgage Trust, Series 2024-RTL1, Class A2(b)(c) | | 8.02% | | 11/25/29 | | | 10,000,000 | | | | 9,989,001 | |
| RALI, Series 2006-QS18, Class 2A1(b) | | 1M CME TERM SOFR + 0.56% | | 12/25/36 | | | 16,004,569 | | | | 10,655,639 | |
| RALI, Series 2006-QS2, Class 1A10(b) | | 1M CME TERM SOFR + 0.61% | | 02/25/36 | | | 1,088,674 | | | | 805,921 | |
| RALI, Series 2006-QS2, Class 1A14(b) | | 1M CME TERM SOFR + 0.81% | | 02/25/36 | | | 5,252,152 | | | | 3,930,043 | |
| RALI, Series 2006-QS4, Class A5(b) | | 1M CME TERM SOFR + 0.61% | | 04/25/36 | | | 1,590,093 | | | | 1,148,598 | |
| RALI, Series 2006-QS8, Class A4(b) | | 1M CME TERM SOFR + 0.56% | | 08/25/36 | | | 925,525 | | | | 685,602 | |
| RALI, Series 2007-QO5, Class A(b) | | 12M US FED + 3.12% | | 08/25/47 | | | 9,462,102 | | | | 1,564,645 | |
| RALI, Series 2007-QS7, Class 2A1 | | 6.75% | | 06/25/37 | | | 28,415,390 | | | | 11,825,005 | |
| RBSSP Resecuritization Trust, Series 2009-7, Class 5A3(b)(c) | | 1M CME TERM SOFR + 0.51% | | 06/26/37 | | | 3,216,970 | | | | 2,269,703 | |
| Residential Asset Securitization Trust, Series 2006-R1, Class A2(b) | | 1M CME TERM SOFR + 0.51% | | 01/25/46 | | | 9,888,832 | | | | 2,836,535 | |
| Residential Asset Securitization Trust, Series 2007-A1, Class A1 | | 6.00% | | 03/25/37 | | | 3,526,331 | | | | 1,119,461 | |
| Residential Mortgage Loan Trust, Series 2020-1, Class A3(b)(c) | | 2.68% | | 01/26/60 | | | 508,596 | | | | 494,347 | |
| RMF Proprietary Issuance Trust, Series 2022-1, Class M2(b)(c) | | 3.00% | | 01/25/28 | | | 5,000,000 | | | | 4,015,500 | |
| Roc Mortgage Trust, Series 2021-RTL1, Class A1(b)(c) | | 3.49% | | 08/25/26 | | | 8,281,611 | | | | 8,220,580 | |
| Roc Mortgage Trust, Series 2021-RTL1, Class M(b)(c) | | 6.68% | | 08/25/26 | | | 6,745,000 | | | | 6,450,046 | |
| Roc Mortgage Trust, Series 2024-RTL1, Class A2(c)(d) | | 6.06% | | 10/25/39 | | | 4,250,000 | | | | 4,229,220 | |
| Roc Mortgage Trust, Series 2024-RTL1, Class M1(b)(c) | | 7.28% | | 10/25/39 | | | 5,000,000 | | | | 4,976,052 | |
| SAIF Securitization Trust, Series 2024-CES1, Class M1(c)(d) | | 6.73% | | 08/25/28 | | | 3,036,000 | | | | 3,015,119 | |
| SAIF Securitization Trust, Series 2024-CES1, Class A3(c)(d) | | 6.33% | | 08/25/28 | | | 745,000 | | | | 741,758 | |
| SAIF Securitization Trust, Series 2024-CES1, Class A1(c)(d) | | 5.97% | | 08/25/28 | | | 14,543,682 | | | | 14,516,044 | |
| Saluda Grade Alternative Mortgage Trust, Series 2024-INV1, Class M1(b)(c) | | 6.60% | | 07/25/28 | | | 2,000,000 | | | | 2,006,079 | |
| Saluda Grade Alternative Mortgage Trust, Series 2024-RTL4, Class A1(c)(d) | | 7.50% | | 02/25/30 | | | 24,750,000 | | | | 24,878,908 | |
| Saluda Grade Alternative Mortgage Trust, Series 2024-RTL5, Class A1(c)(d) | | 7.76% | | 04/25/30 | | | 30,500,000 | | | | 30,907,623 | |
| Saluda Grade Alternative Mortgage Trust, Series 2024-RTL5, Class M(c)(d) | | 12.95% | | 04/25/30 | | | 2,500,000 | | | | 2,578,032 | |
| Saluda Grade Alternative Mortgage Trust, Series 2024-RTL6, Class A1(c)(d) | | 7.44% | | 12/25/26 | | | 23,389,000 | | | | 23,578,004 | |
| Saluda Grade Alternative Mortgage Trust, Series 2024-RTL6, Class A2(c)(d) | | 8.68% | | 12/25/26 | | | 12,250,000 | | | | 12,385,703 | |
| SG Residential Mortgage Trust, Series 2019-3, Class A2(b)(c) | | 2.88% | | 09/25/59 | | | 190,294 | | | | 189,081 | |
See Notes to Consolidated Financial Statements and Consolidated Financial Highlights.
| Axonic Strategic Income Fund | Consolidated Schedule of Investments |
October 31, 2024
| | | Rate | | Maturity Date | | Principal Amount | | | Value | |
| SG Residential Mortgage Trust, Series 2019-3, Class A3(b)(c) | | 3.08% | | 09/25/59 | | $ | 535,495 | | | $ | 532,166 | |
| Spruce Hill Mortgage Loan Trust, Series 2020-SH2, Class M1(b)(c) | | 4.33% | | 06/25/55 | | | 2,005,936 | | | | 1,986,629 | |
| Starwood Mortgage Residential Trust, Series 2019-INV1, Class A3(b)(c) | | 2.92% | | 09/27/49 | | | 5,641,024 | | | | 5,473,821 | |
| Starwood Mortgage Residential Trust, Series 2021-2, Class A2(b)(c) | | 1.17% | | 05/25/65 | | | 742,222 | | | | 693,215 | |
| Starwood Mortgage Residential Trust, Series 2021-2, Class A3(b)(c) | | 1.43% | | 05/25/65 | | | 905,149 | | | | 847,415 | |
| Structured Asset Mortgage Investments II Trust, Series 2007-AR2, Class 1A2(b) | | 1M CME TERM SOFR + 0.49% | | 02/25/37 | | | 4,595,654 | | | | 5,490,467 | |
| Toorak Mortgage Trust, Series 2022-1, Class A1(c)(d) | | 4.97% | | 03/25/29 | | | 2,788,872 | | | | 2,770,107 | |
| Toorak Mortgage Trust, Series 2024-1, Class M1(c)(d) | | 12.55% | | 02/25/31 | | | 6,000,000 | | | | 6,057,122 | |
| Toorak Mortgage Trust, Series 2024-1, Class A2(c)(d) | | 9.60% | | 02/25/31 | | | 7,000,000 | | | | 7,055,264 | |
| Toorak Mortgage Trust, Series 2024-1, Class A1(c)(d) | | 7.33% | | 02/25/31 | | | 20,000,000 | | | | 20,173,916 | |
| Toorak Mortgage Trust, Series 2024-RRTL1, Class A2(c)(d) | | 7.57% | | 03/25/26 | | | 6,000,000 | | | | 6,106,303 | |
| Toorak Mortgage Trust, Series 2024-RRTL1, Class M1(b)(c) | | 9.16% | | 03/25/26 | | | 4,000,000 | | | | 4,072,267 | |
| Toorak Mortgage Trust, Series 2024-RRTL2, Class A2(c)(d) | | 5.90% | | 09/25/39 | | | 8,875,000 | | | | 8,812,840 | |
| Toorak Mortgage Trust, Series 2024-RRTL2, Class M1(b)(c) | | 7.26% | | 09/25/39 | | | 6,000,000 | | | | 5,948,731 | |
| Toorak Mortgage Trust, Series 2024-RRTL2, Class B1(b)(c) | | 8.18% | | 09/25/39 | | | 2,800,000 | | | | 2,776,419 | |
| TVC Mortgage Trust, Series 2023-RTL1, Class A1(c)(d) | | 8.25% | | 11/25/27 | | | 12,000,000 | | | | 12,103,625 | |
| TVC Mortgage Trust, Series 2024-RRTL1, Class A2(c)(d) | | 5.96% | | 02/25/27 | | | 2,000,000 | | | | 1,986,695 | |
| Velocity Commercial Capital Loan Trust, Series 2023-RTL1, Class A1(c)(d) | | 8.00% | | 01/25/26 | | | 7,903,000 | | | | 7,922,833 | |
| Verus Securitization Trust, Series 2021-R1, Class A1(b)(c) | | 0.82% | | 10/25/63 | | | 1,535,212 | | | | 1,452,497 | |
| Verus Securitization Trust, Series 2021-R1, Class A2(b)(c) | | 1.06% | | 10/25/63 | | | 1,139,482 | | | | 1,079,718 | |
| Verus Securitization Trust, Series 2021-R1, Class A3(b)(c) | | 1.26% | | 10/25/63 | | | 2,728,730 | | | | 2,585,758 | |
| Verus Securitization Trust, Series 2021-R3, Class B2(b)(c) | | 4.07% | | 04/25/64 | | | 3,000,000 | | | | 2,601,920 | |
| Verus Securitization Trust, Series 2023-3, Class A2(c)(d) | | 6.44% | | 03/25/68 | | | 776,645 | | | | 779,073 | |
| Verus Securitization Trust, Series 2024-7, Class B1(b)(c) | | 6.50% | | 09/25/69 | | | 3,300,000 | | | | 3,212,127 | |
| | | | | | | | | | | | | |
| TOTAL RESIDENTIAL MORTGAGE-BACKED SECURITIES | | | | | | | | | | | | |
| (Cost $881,410,599) | | | | | | | | | | | 856,713,847 | |
| | | 7-Day Yield | | | Shares | | | Value | |
| SHORT TERM INVESTMENTS - COMMON SHARES (6.01%) | | | | | | | | | | | | |
| Money Market Fund (6.01%) | | | | | | | | | | | | |
| First American Government Obligations Fund | | | 4.79 | % | | | 177,778,603 | | | | 177,778,603 | |
| | | | | | | | | | | | | |
| TOTAL SHORT TERM INVESTMENTS | | | | | | | | | | | | |
| (Cost $177,778,603) | | | | | | | | | | | 177,778,603 | |
| | | | | | | | | | | | | |
| TOTAL INVESTMENTS (99.75%) | | | | | | | | | | | | |
| (Cost $3,035,732,231) | | | | | | | | | | $ | 2,949,290,859 | |
| | | | | | | | | | | | | |
| Other Assets In Excess Of Liabilities (0.25%) | | | | | | | | | | | 7,487,569 | |
| NET ASSETS (100.00%) | | | | | | | | | | $ | 2,956,778,428 | |
See Notes to Consolidated Financial Statements and Consolidated Financial Highlights.
| Annual Report | October 31, 2024 | 13 |
| Axonic Strategic Income Fund | Consolidated Schedule of Investments |
October 31, 2024
| (b) | Floating or variable rate security. The Reference Rates are described below. Interest rate shown reflects the rate in effect at October 31, 2024. For securities based on a published reference rate and spread, the reference rate and spread are indicated in the description above. Certain variable rate securities are not based on a published reference rate and spread but are determined by the issuer or agent and are based on current market conditions. These securities do not indicate a reference rate and spread in their description above. |
| (c) | Security exempt from registration under Rule 144A of the Securities Act of 1933. Such securities may normally be sold to qualified institutional buyers in transactions exempt from registration. The total value of Rule 144A securities amounts to $2,148,960,360, which represents 72.68% of net assets as of October 31, 2024. |
| (d) | Step bond. Coupon changes periodically based upon a predetermined schedule. Interest rate disclosed is that which is in effect at October 31, 2024. |
| (e) | The Fund's interest in this loan are held through a wholly-owned LLC of the Fund. See Notes 1 and 2 to the Consolidated Financial Statements and Consolidated Financial Highlights. |
| (f) | Interest only securities. |
Investment Abbreviations:
REIT - Real Estate Investment Trust
SOFR - Secured Overnight Financing Rate
FED - Federal Funds Rate
Reference Rates:
1M CME Term SOFR - 1 Month CME SOFR as of October 31, 2024 was 4.66%
12M US FED - 12 Month US FED as of October 31, 2024 was 4.83%
1D US SOFR - 1 Day US SOFR as of October 31, 2024 was 4.90%
1M US SOFR - 1 Month US SOFR as of October 31, 2024 was 4.85%
30D US SOFR - 30 Day US SOFR as of October 31, 2024 was 4.85%
See Notes to Consolidated Financial Statements and Consolidated Financial Highlights.
| Axonic Strategic Income Fund | Consolidated Schedule of Investments |
October 31, 2024
INTEREST RATE SWAP CONTRACTS (CENTRALLY CLEARED)
Pay/Receive Floating Rate* | | Clearing House | | Floating Rate | | Expiration Date | | Notional Amount** | | | Currency | | Fixed Rate | | Fair Value | | | Unrealized Appreciation/ (Depreciation) | |
| Receive | | Goldman Sachs & Co. LLC | | 1D US SOFR | | 04/07/2027 | | | 4,000,000 | | | USD | | 2.46% | | $ | 133,193 | | | $ | 133,193 | |
| Pay | | Goldman Sachs & Co. LLC | | 1D US SOFR | | 10/25/2034 | | | 50,000,000 | | | USD | | 3.78% | | | 9,617 | | | | 9,617 | |
| Receive | | Goldman Sachs & Co. LLC | | 3M US SOFR | | 05/25/2026 | | | 20,000,000 | | | USD | | 0.91% | | | 1,014,334 | | | | 1,014,334 | |
| Receive | | Goldman Sachs & Co. LLC | | 3M US SOFR | | 08/05/2026 | | | 50,000,000 | | | USD | | 0.73% | | | 2,962,213 | | | | 2,962,213 | |
| Receive | | Goldman Sachs & Co. LLC | | 1D US SOFR | | 07/07/2027 | | | 5,000,000 | | | USD | | 2.54% | | | 170,578 | | | | 170,578 | |
| Receive | | Goldman Sachs & Co. LLC | | 1D US SOFR | | 08/05/2025 | | | 2,000,000 | | | USD | | 2.83% | | | 22,198 | | | | 22,198 | |
| Receive | | Goldman Sachs & Co. LLC | | 1D US SOFR | | 04/11/2025 | | | 2,800,000 | | | USD | | 2.51% | | | 24,676 | | | | 24,676 | |
| Receive | | Goldman Sachs & Co. LLC | | 1D US SOFR | | 03/21/2026 | | | 9,000,000 | | | USD | | 1.99% | | | 251,923 | | | | 251,924 | |
| Pay | | Goldman Sachs & Co. LLC | | 1D US SOFR | | 02/13/2034 | | | 26,664,000 | | | USD | | 3.82% | | | 91,236 | | | | 91,236 | |
| Receive | | Goldman Sachs & Co. LLC | | 1D US SOFR | | 04/19/2026 | | | 2,000,000 | | | USD | | 2.50% | | | 43,827 | | | | 43,827 | |
| Receive | | Goldman Sachs & Co. LLC | | 1D US SOFR | | 08/05/2025 | | | 2,000,000 | | | USD | | 2.88% | | | 21,473 | | | | 21,473 | |
| Receive | | Goldman Sachs & Co. LLC | | 1D US SOFR | | 04/14/2025 | | | 3,000,000 | | | USD | | 2.43% | | | 27,903 | | | | 27,903 | |
| Receive | | Goldman Sachs & Co. LLC | | 1D US SOFR | | 05/13/2026 | | | 3,837,000 | | | USD | | 2.69% | | | 76,379 | | | | 76,379 | |
| | | | | | | | | | | | | | | | | $ | 4,849,551 | | | $ | 4,849,551 | |
| | | | | | | | | | | | | | | | | | | | | | | |
| Pay | | Goldman Sachs & Co. LLC | | 1D US SOFR | | 01/22/2034 | | | 13,256,000 | | | USD | | 3.74% | | $ | (40,117 | ) | | $ | (40,117 | ) |
| Pay | | Goldman Sachs & Co. LLC | | 1D US SOFR | | 10/17/2034 | | | 50,000,000 | | | USD | | 3.57% | | | (872,327 | ) | | | (872,327 | ) |
| Pay | | Goldman Sachs & Co. LLC | | 1D US SOFR | | 10/11/2034 | | | 21,500,000 | | | USD | | 3.60% | | | (321,500 | ) | | | (321,500 | ) |
| Pay | | Goldman Sachs & Co. LLC | | 1M US SOFR | | 04/24/2033 | | | 35,542,920 | | | USD | | 3.38% | | | (1,234,437 | ) | | | (1,234,437 | ) |
| Pay | | Goldman Sachs & Co. LLC | | 1M US SOFR | | 04/03/2033 | | | 34,745,115 | | | USD | | 3.39% | | | (1,158,586 | ) | | | (1,158,586 | ) |
| | | | | | | | | | | | | | | | | $ | (3,626,967 | ) | | $ | (3,626,967 | ) |
| | | | | | | | | | | | | | | | | $ | 1,222,584 | | | $ | 1,222,584 | |
| * | The swap contracts with the floating rates of 1D US SOFR pay and receive amounts annually, while 1M US SOFR pay amounts semiannually and receive amounts quarterly, and while 3M US SOFR pay amounts monthly and receive amounts semiannually. |
| ** | The notional amount of each interest rate swap contract is stated in the currency in which the derivative is denominated. |
See Notes to Consolidated Financial Statements and Consolidated Financial Highlights.
| Annual Report | October 31, 2024 | 15 |
| Axonic Strategic Income Fund | Consolidated Statement of Assets and Liabilities |
October 31, 2024
| ASSETS: | | | |
| Investments, at fair value (Cost $3,035,732,231) | | $ | 2,949,290,859 | |
| Net unrealized appreciation on interest rate swap contracts | | | 1,222,584 | |
| Receivable for investment securities sold | | | 1,273 | |
| Dividend receivable | | | 72,809 | |
| Interest receivable | | | 12,135,052 | |
| Capital shares sold receivable | | | 18,193,253 | |
| Deposit held with broker for interest rate swap contracts | | | 8,724,348 | |
| Prepaid expenses and other assets | | | 53,756 | |
| Total Assets | | | 2,989,693,934 | |
| | | | | |
| LIABILITIES: | | | | |
| Payable for investments purchased | | | 19,157,564 | |
| Income distribution payable | | | 3,754,899 | |
| Due to custodian | | | 99,515 | |
| Capital shares redeemed payable | | | 7,005,422 | |
| Accrued legal and audit fees payable | | | 76,587 | |
| Due to Adviser | | | 2,103,801 | |
| Accrued fund accounting and administration fees payable | | | 582,930 | |
| Distribution and shareholder service fees payable | | | 43,035 | |
| Accrued Chief Compliance Officer fee payable | | | 2,917 | |
| Other payables and accrued expenses | | | 88,836 | |
| Total Liabilities | | | 32,915,506 | |
| Net Assets | | $ | 2,956,778,428 | |
| | | | | |
| COMPOSITION OF NET ASSETS: | | | | |
| Paid-in capital | | $ | 3,034,452,955 | |
| Total distributable earnings (accumulated deficit) | | | (77,674,527 | ) |
| Net Assets | | $ | 2,956,778,428 | |
| | | | | |
| PRICING OF SHARES: | | | | |
| Class A | | | | |
| Net Assets | | $ | 79,893,485 | |
| Shares of beneficial interest outstanding (unlimited number of shares, no par value common share authorized) | | | 9,018,504 | |
| Net Asset Value and redemption price per share | | $ | 8.86 | |
| Class I | | | | |
| Net Assets | | $ | 2,876,884,943 | |
| Shares of beneficial interest outstanding (unlimited number of shares, no par value common share authorized) | | | 319,345,016 | |
| Net Asset Value and redemption price per share | | $ | 9.01 | |
See Notes to Consolidated Financial Statements and Consolidated Financial Highlights.
| Axonic Strategic Income Fund | Consolidated Statement of Operations |
For the Year Ended October 31, 2024
| INVESTMENT INCOME: | | | |
| Dividends | | $ | 22,145,003 | |
| Interest | | | 179,350,976 | |
| Total Investment Income | | | 201,495,979 | |
| | | | | |
| EXPENSES: | | | | |
| Advisory fees (Note 4) | | | 20,382,847 | |
| Audit and tax fees | | | 61,606 | |
| Chief Compliance Officer fees (Note 4) | | | 101,277 | |
| Custodian fees | | | 198,082 | |
| Distribution fees | | | | |
| Class A | | | 167,299 | |
| Fund accounting and administration fees (Note 4) | | | 2,807,484 | |
| Insurance expenses | | | 62,103 | |
| Legal fees | | | 503,978 | |
| Printing expenses | | | 70,940 | |
| Registration expenses | | | 174,338 | |
| Shareholder service fees | | | | |
| Class A | | | 106,380 | |
| Transfer agent fees (Note 4) | | | 261,262 | |
| Trustees' fees and expenses (Note 4) | | | 174,629 | |
| Other expenses | | | 56,348 | |
| Net expenses | | | 25,128,573 | |
| Net Investment Income | | | 176,367,406 | |
| | | | | |
| REALIZED AND UNREALIZED GAIN/(LOSS) ON INVESTMENTS: | | | | |
| Net realized loss on investments | | | (19,847,463 | ) |
| Net realized gain on interest rate swap contracts | | | 22,349,109 | |
| Net change in unrealized depreciation on investments | | | 67,400,916 | |
| Net change in unrealized appreciation on interest rate swap contracts | | | 5,040 | |
| Net Realized and Unrealized Gain on Investments | | | 69,907,602 | |
| | | | | |
| Net Increase in Net Assets from Operations | | $ | 246,275,008 | |
See Notes to Consolidated Financial Statements and Consolidated Financial Highlights.
| Annual Report | October 31, 2024 | 17 |
| Axonic Strategic Income Fund | Consolidated Statements of Changes in Net Assets |
| | | For the Year Ended October 31, 2024 | | | For the Year Ended October 31, 2023 | |
| FROM OPERATIONS: | | | | | | |
| Net investment income | | $ | 176,367,406 | | | $ | 108,749,445 | |
| Net realized gain | | | 2,501,646 | | | | 5,128,698 | |
| Net change in unrealized appreciation/(depreciation) | | | 67,405,956 | | | | (31,709,113 | ) |
| Net Increase in Net Assets from Operations | | | 246,275,008 | | | | 82,169,030 | |
| | | | | | | | | |
| DISTRIBUTIONS TO SHAREHOLDERS: | | | | | | | | |
| From distributable earnings | | | | | | | | |
| Class A | | | (5,727,142 | ) | | | (3,336,744 | ) |
| Class I | | | (185,237,615 | ) | | | (92,176,627 | ) |
| Decrease in Net Assets from Distributions to Shareholders | | | (190,964,757 | ) | | | (95,513,371 | ) |
| | | | | | | | | |
| CAPITAL SHARE TRANSACTIONS: | | | | | | | | |
| Class A | | | | | | | | |
| Proceeds from sale of shares of beneficial interest | | | 26,674,786 | | | | 37,021,653 | |
| Distributions reinvested | | | 4,822,169 | | | | 3,053,488 | |
| Disbursements for redemption of shares of beneficial interest | | | (15,446,284 | ) | | | (21,606,067 | ) |
| Class I | | | | | | | | |
| Proceeds from sale of shares of beneficial interest | | | 1,367,847,706 | | | | 1,115,039,459 | |
| Distributions reinvested | | | 141,142,030 | | | | 67,278,841 | |
| Disbursements for redemption of shares of beneficial interest | | | (541,395,601 | ) | | | (627,928,046 | ) |
| Net Increase from Capital Share Transactions | | | 983,644,806 | | | | 572,859,328 | |
| Net Increase in Net Assets | | | 1,038,955,057 | | | | 559,514,987 | |
| | | | | | | | | |
| NET ASSETS: | | | | | | | | |
| Beginning of period | | | 1,917,823,371 | | | | 1,358,308,384 | |
| End of period | | $ | 2,956,778,428 | | | $ | 1,917,823,371 | |
| | | | | | | | | |
| OTHER INFORMATION: | | | | | | | | |
| CAPITAL SHARE TRANSACTIONS: | | | | | | | | |
| Class A | | | | | | | | |
| Beginning shares | | | 7,196,036 | | | | 5,072,634 | |
| Issued | | | 3,028,752 | | | | 4,257,979 | |
| Distributions reinvested | | | 549,566 | | | | 351,474 | |
| Redeemed | | | (1,755,850 | ) | | | (2,486,051 | ) |
| Net increase in capital shares | | | 1,822,468 | | | | 2,123,402 | |
| Ending shares | | | 9,018,504 | | | | 7,196,036 | |
| Class I | | | | | | | | |
| Beginning shares | | | 211,105,129 | | | | 148,201,874 | |
| Issued | | | 153,014,959 | | | | 126,750,994 | |
| Distributions reinvested | | | 15,838,470 | | | | 7,657,616 | |
| Redeemed | | | (60,613,542 | ) | | | (71,505,355 | ) |
| Net increase in capital shares | | | 108,239,887 | | | | 62,903,255 | |
| Ending shares | | | 319,345,016 | | | | 211,105,129 | |
See Notes to Consolidated Financial Statements and Consolidated Financial Highlights.
| Axonic Strategic Income Fund | |
| Class A | Consolidated Financial Highlights |
For a Share Outstanding Throughout each Period Presented
| | | For the Year Ended October 31, 2024 | | | For the Year Ended October 31, 2023 | | | For the Year Ended October 31, 2022 | | | For the Year Ended October 31, 2021 | | | For the Period July 17, 2020 (Commencement of Operations) to October 31, 2020 | |
| OPERATING PERFORMANCE: | | | | | | | | | | | | | | | | | | | | |
| Net asset value - beginning of period | | $ | 8.67 | | | $ | 8.78 | | | $ | 9.94 | | | $ | 9.68 | | | $ | 9.55 | |
| INCOME/(LOSS) FROM INVESTMENT OPERATIONS: | | | | | | | | | | | | | | | | | | | | |
| Net investment income(a) | | | 0.62 | | | | 0.60 | | | | 0.37 | | | | 0.44 | | | | 0.06 | |
| Net realized and unrealized gain/(loss) on investments | | | 0.29 | | | | (0.16 | ) | | | (0.90 | ) | | | 0.30 | (b) | | | 0.15 | (b) |
| Total Income/(Loss) from Investment Operations | | | 0.91 | | | | 0.44 | | | | (0.53 | ) | | | 0.74 | | | | 0.21 | |
| | | | | | | | | | | | | | | | | | | | | |
| DISTRIBUTIONS TO SHAREHOLDERS: | | | | | | | | | | | | | | | | | | | | |
| From net investment income | | | (0.72 | ) | | | (0.53 | ) | | | (0.43 | ) | | | (0.43 | ) | | | (0.08 | ) |
| From net realized gains | | | – | | | | (0.02 | ) | | | (0.20 | ) | | | (0.05 | ) | | | – | |
| Total Distributions to Shareholders | | | (0.72 | ) | | | (0.55 | ) | | | (0.63 | ) | | | (0.48 | ) | | | (0.08 | ) |
| | | | | | | | | | | | | | | | | | | | | |
| Net asset value - end of period | | $ | 8.86 | | | $ | 8.67 | | | $ | 8.78 | | | $ | 9.94 | | | $ | 9.68 | |
| | | | | | | | | | | | | | | | | | | | | |
| Total Investment Return - Net Asset Value(c) | | | 10.93 | %(d) | | | 5.25 | %(d) | | | (5.29 | %)(d) | | | 7.85 | %(d) | | | 2.17 | %(d)(e) |
| | | | | | | | | | | | | | | | | | | | | |
| RATIOS AND SUPPLEMENTAL DATA: | | | | | | | | | | | | | | | | | | | | |
| Net assets end of period (000s) | | $ | 79,893 | | | $ | 62,415 | | | $ | 44,534 | | | $ | 40,414 | | | $ | 22,495 | |
| Ratio of expenses to average net assets excluding reimbursement/recoupment(f) | | | 1.42 | % | | | 1.42 | % | | | 1.39 | % | | | 1.60 | % | | | 1.84 | %(g) |
| Ratio of expenses to average net assets including reimbursement/recoupment(f) | | | 1.42 | % | | | 1.44 | % | | | 1.50 | % | | | 1.50 | % | | | 1.50 | %(g) |
| Ratio of net investment income to average net assets(f) | | | 7.04 | % | | | 6.90 | % | | | 3.93 | % | | | 4.40 | % | | | 2.28 | %(g) |
| Portfolio turnover rate | | | 72 | % | | | 38 | % | | | 32 | % | | | 66 | % | | | 54 | %(e) |
| (a) | Calculated using average shares method. |
| (b) | Realized and unrealized gains and losses per share in this caption are balancing amounts necessary to reconcile the change in net asset value per share for the period and may not reconcile with the aggregate gains and losses in the Consolidated Statement of Operations due to share transactions for the period. |
| (c) | During periods in which certain expenses were reimbursed, total returns would have been lower. During periods in which certain expenses were recouped, total returns would have been higher. Returns shown do not reflect the deduction of taxes that a shareholder would pay on Fund distributions or the redemption of Fund shares. Returns shown exclude applicable sales charges. |
| (d) | Includes adjustments in accordance with accounting principles generally accepted in the United States of America and, consequently, the net asset values for financial reporting purposes and the returns based upon those net asset values may differ from the net asset values and returns for shareholder transactions. |
| (f) | Expenses and net investment income/(loss) amounts used to calculate the ratios above include amounts allocated to investors. An individual investor's results may vary based on a variety of factors and the timing of capital transactions. |
See Notes to Consolidated Financial Statements and Consolidated Financial Highlights.
| Annual Report | October 31, 2024 | 19 |
| Axonic Strategic Income Fund | |
| Class I | Consolidated Financial Highlights |
For a Share Outstanding Throughout each Period Presented
| | | For the Year Ended October 31, 2024 | | | For the Year Ended October 31, 2023 | | | For the Year Ended October 31, 2022 | | | For the Year Ended October 31, 2021 | | | For the Period December 31, 2019 (Commencement of Operations) to October 31, 2020 | |
| OPERATING PERFORMANCE: | | | | | | | | | | | | | | | |
| Net asset value - beginning of period | | $ | 8.79 | | | $ | 8.86 | | | $ | 9.99 | | | $ | 9.69 | | | $ | 10.00 | |
| INCOME/(LOSS) FROM INVESTMENT OPERATIONS: | | | | | | | | | | | | | | | | | | | | |
| Net investment income(a) | | | 0.66 | | | | 0.65 | | | | 0.42 | | | | 0.48 | | | | 0.19 | |
| Net realized and unrealized gain/(loss) on investments | | | 0.30 | | | | (0.15 | ) | | | (0.92 | ) | | | 0.30 | (b) | | | (0.40 | )(b) |
| Total Income/(Loss) from Investment Operations | | | 0.96 | | | | 0.50 | | | | (0.50 | ) | | | 0.78 | | | | (0.21 | ) |
| | | | | | | | | | | | | | | | | | | | | |
| DISTRIBUTIONS TO SHAREHOLDERS: | | | | | | | | | | | | | | | | | | | | |
| From net investment income | | | (0.74 | ) | | | (0.55 | ) | | | (0.43 | ) | | | (0.43 | ) | | | (0.10 | ) |
| From net realized gains | | | – | | | | (0.02 | ) | | | (0.20 | ) | | | (0.05 | ) | | | – | |
| Total Distributions to Shareholders | | | (0.74 | ) | | | (0.57 | ) | | | (0.63 | ) | | | (0.48 | ) | | | (0.10 | ) |
| | | | | | | | | | | | | | | | | | | | | |
| Net asset value - end of period | | $ | 9.01 | | | $ | 8.79 | | | $ | 8.86 | | | $ | 9.99 | | | $ | 9.69 | |
| | | | | | | | | | | | | | | | | | | | | |
| Total Investment Return - Net Asset Value(c) | | | 11.31 | %(d) | | | 5.82 | %(d) | | | (4.84 | %)(d) | | | 8.28 | %(d) | | | (2.11 | %)(d)(e) |
| | | | | | | | | | | | | | | | | | | | | |
| RATIOS AND SUPPLEMENTAL DATA: | | | | | | | | | | | | | | | | | | | | |
| Net assets end of period (000s) | | $ | 2,876,885 | | | $ | 1,855,409 | | | $ | 1,313,775 | | | $ | 1,306,541 | | | $ | 615,640 | |
| Ratio of expenses to average net assets excluding reimbursement/recoupment(f) | | | 1.03 | % | | | 1.02 | % | | | 1.00 | % | | | 1.02 | % | | | 1.19 | %(g) |
| Ratio of expenses to average net assets including reimbursement/recoupment(f) | | | 1.03 | % | | | 1.02 | % | | | 1.00 | % | | | 1.04 | % | | | 1.10 | %(g) |
| Ratio of net investment income to average net assets(f) | | | 7.42 | % | | | 7.31 | % | | | 4.42 | % | | | 4.87 | % | | | 2.40 | %(g) |
| Portfolio turnover rate | | | 72 | % | | | 38 | % | | | 32 | % | | | 66 | % | | | 54 | %(e) |
| (a) | Calculated using average shares method. |
| (b) | Realized and unrealized gains and losses per share in this caption are balancing amounts necessary to reconcile the change in net asset value per share for the period and may not reconcile with the aggregate gains and losses in the Consolidated Statement of Operations due to share transactions for the period. |
| (c) | During periods in which certain expenses were reimbursed, total returns would have been lower. During periods in which certain expenses were recouped, total returns would have been higher. Returns shown do not reflect the deduction of taxes that a shareholder would pay on Fund distributions or the redemption of Fund shares. Returns shown exclude applicable sales charges. |
| (d) | Includes adjustments in accordance with accounting principles generally accepted in the United States of America and, consequently, the net asset values for financial reporting purposes and the returns based upon those net asset values may differ from the net asset values and returns for shareholder transactions. |
| (f) | Expenses and net investment income/(loss) amounts used to calculate the ratios above include amounts allocated to investors. An individual investor's results may vary based on a variety of factors and the timing of capital transactions. |
See Notes to Consolidated Financial Statements and Consolidated Financial Highlights.
| | Notes to Consolidated Financial Statements |
| Axonic Strategic Income Fund | and Consolidated Financial Highlights |
October 31, 2024
1. ORGANIZATION
Axonic Strategic Income Fund (the “Fund”), is a diversified series of the Axonic Funds (the ”Trust”), which is registered under the Investment Company Act of 1940, as amended (“1940 Act”) as an open-end management investment company. The Trust was organized as a Delaware statutory trust on October 17, 2019 pursuant to a Declaration of Trust governed by the laws of the State of Delaware. Axonic Capital LLC (the “Adviser”) acts as the Fund’s investment adviser. The Adviser is a registered investment adviser and is responsible for making the investment decisions for the Fund’s portfolio. The Fund’s investment objective is to seek total return. Under normal circumstances, the Fund will concentrate its investments (i.e., invest 25% or more of its total assets (measured at the time of purchase)) in Mortgage-Backed Securities (“MBS”) and other mortgage-related securities (such as CMOs), which the Fund treats as investments in a group of industries.
The Fund currently offers Class A and Class I shares. Class A shares commenced operations on July 17, 2020 and Class I commenced operations on December 31, 2019. Class A shares are offered subject to a maximum sales charge of 2.25%. Class I shares are offered at NAV and are not subject to sales charges. The Fund may offer additional classes of shares in the future.
The Fund's assets may be invested in a wholly-owned and controlled subsidiary of the Fund, Axonic Strategic Loan Funds LLC (the "Subsidiary"). The Subsidiary has the same investment objective as the Fund and is a Delaware limited liability company. To the extent permitted by the 1940 Act, the Fund may make investments through the Subsidiary, which is a pass-through entity.
2. SIGNIFICANT ACCOUNTING POLICIES
The following is a summary of significant accounting policies followed by the Fund in preparation of its consolidated financial statements. These policies are in conformity with accounting principles generally accepted in the United States of America (“GAAP”). The Fund is considered an investment company for financial reporting purposes under GAAP. The Fund follows the investment company accounting and reporting guidance of the Financial Accounting Standards Board (“FASB”) Accounting Standard Codification (“ASC”) Topic 946 “Financial Services – Investment Companies.” The preparation of the consolidated financial statements requires management to make estimates and assumptions that affect the reported amounts of assets and liabilities and disclosure of contingent assets and liabilities at the date of the consolidated financial statements and the reported amounts of income and expenses for the period. Actual results could differ from those estimates.
Consolidation of Subsidiary – The consolidated financial statements include the financial position and the results of operations of the Fund and its Subsidiary. As of October 31, 2024, the total value of investments held by the Subsidiary is $1,366,463, or 0.05% of the Fund’s net assets.
All intercompany accounts and transactions have been eliminated in these consolidated financial statements.
Securities Valuation – The Fund values it investments at fair value. The Fund’s Board of Trustees (the “Board”) has approved pricing policies and procedures and fair valuation policies and procedures pursuant to which the Fund will value its investments. The Adviser has appointed an independent Administrator of the Fund, pursuant to the administration agreement, under which the Administrator independently calculates the daily Net Asset Value per share (“NAV”) of the Fund. In doing so, the Administrator, on a daily basis, in compliance with the policies and procedures described above, independently values the investment positions within the Fund’s portfolio. The Administrator at its discretion may notify the Fund or the Board of any valuation conflicts and/or non-compliance with the policies and procedures. The Administrator and the Adviser will include in quarterly written reports to the Board confirmation that the policies and procedures provide fair and accurate prices. Securities listed on an exchange are valued at the last reported sale price at the close of the regular trading session of the exchange on the business day the value is being determined. Investments in shares of funds, including money market funds, that are not traded on an exchange are valued at the end of day NAV of such fund.
Securities for which market prices are not “readily available” are valued in good faith by the Fund's Adviser as “valuation designee” under the oversight of the Fund's Board. The Adviser has adopted written policies and procedures for valuing securities and other assets in circumstances where market quotes are not readily available. In the event that market quotes are not readily available, and the security or asset cannot be valued pursuant to one of the valuation methods, the value of the security or asset will be determined in good faith by the Adviser pursuant to its policies and procedures. On a quarterly basis, the Adviser's fair valuation determinations will be reviewed by the Board. The Advisor may, in turn and subject to its oversight, delegate pricing of securities for which market prices are readily available to the Funds' administrator. All fair valuation determinations shall be made by the Fair Value Committee (the “Committee”), in accordance with policies and procedures established by the Adviser. Some of the more common reasons that may necessitate that a security be valued using Fair Value Procedures include: the security's trading has been halted or suspended; the security has been de-listed from a national exchange; the security's primary trading market is temporarily closed at a time when under normal conditions it would be open; the security has not been traded for an extended period of time; the security's primary pricing source is not able or willing to provide a price; a significant event with respect to a security or securities has occurred after the close of the market or exchange on which the security or securities principally trades and before the time the Fund calculates net asset value; or trading of the security is subject to local government -imposed restrictions. When a security is valued in accordance with the Fair Value Procedures, the Committee will determine the value after taking into consideration relevant information reasonably available to the Committee.
| Annual Report | October 31, 2024 | 21 |
| | Notes to Consolidated Financial Statements |
| Axonic Strategic Income Fund | and Consolidated Financial Highlights |
October 31, 2024
Structured credit and other similar debt securities including, but not limited to, asset-backed securities, collateralized debt obligations, collateralized loan obligations, collateralized mortgage obligations, mortgage-backed securities, commercial mortgage-backed security, and other securitized investments backed by certain debt or other receivables (collectively, “Structured Credit Securities”), are valued on the basis of valuations provided by independent pricing services and /or dealers in those instruments recommended by the Adviser and approved by the Board. Interest Rate Swaps are valued by an independent pricing service as approved by the Manager. For centrally cleared swaps, the daily change in valuation and upfront payments, if any, are recorded as a receivable or payable for variation margin on the Consolidated Statement of Assets and Liabilities. In determining fair value, pricing services and dealers will generally use information with respect to transactions in the securities being valued, quotations from other dealers, market transactions in comparable securities, analyses and evaluations of various relationships between securities, and yield to maturity information. The Adviser will, based on its reasonable judgment, select the pricing service or dealer quotation that most accurately reflects the fair market value of the Structured Credit Security while taking into account the information utilized by the pricing service or dealer to formulate the quotation in addition to any other relevant factors.
When price quotations for certain securities are not readily available, or if the available quotations are not believed to be reflective of market value by the Adviser, those securities will be valued at “fair value” as determined in good faith by the Adviser’s Valuation Committee using the fair valuation policies and procedures adopted by, and under the supervision of, the Board. There can be no assurance that the Fund could purchase or sell a portfolio security at the price used to calculate the Fund’s NAV.
The fair valuation policies and procedures may be used to value a substantial portion of the assets of the Fund. The Fund may use the fair value of a security to calculate its NAV when, for example, (1) a portfolio security is not traded in a public market or the principal market in which the security trades is closed, (2) trading in a portfolio security is suspended and has not resumed prior to the normal market close, (3) a portfolio security is not traded in significant volume for a substantial period, or (4) the Adviser determines that the quotation or price for a portfolio security provided by an independent pricing service and broker-dealer is inaccurate.
The “fair value” of securities may be difficult to determine and thus judgment plays a greater role in the valuation process. The fair valuation methodology may include or consider the following guidelines, as appropriate: (1) evaluation of all relevant factors, including but not limited to, pricing history, current market level and supply and demand of the respective security; (2) comparison to the values and current pricing of securities that have comparable characteristics; (3) knowledge of historical market information with respect to the security; and (4) other factors relevant to the security which would include, but not be limited to, duration, yield, fundamental analytical data, the Treasury yield curve and credit quality.
Fair Value Measurements – A three-tier hierarchy has been established to classify fair value measurements for disclosure purposes. Inputs refer broadly to the assumptions that market participants would use in pricing the asset or liability, including assumptions about risk. Inputs may be observable or unobservable. Observable inputs are inputs that reflect the assumptions market participants would use in pricing the asset or liability that are developed based on market data obtained from sources independent of the reporting entity. Unobservable inputs are inputs that reflect the reporting entity’s own assumptions about the assumptions market participants would use in pricing the asset or liability that are developed based on the best information available. In accordance with the authoritative guidance on fair value measurements and disclosure under GAAP, the Fund discloses the fair value of its investments in a hierarchy that prioritizes the inputs to valuation techniques used to measure the fair value.
Various inputs are used in determining the value of the Fund’s investments as of the reporting period end. These inputs are categorized in the following hierarchy under applicable financial accounting standards:
| Level 1 – | Unadjusted quoted prices in active markets for identical, unrestricted assets or liabilities that the Fund has the ability to access at the measurement date; |
| | |
| Level 2 – | Quoted prices which are not active, quoted prices for similar assets or liabilities in active markets or inputs other than quoted prices that are observable (either directly or indirectly) for substantially the full term of the asset or liability at the measurement date; and |
| | |
| Level 3 – | Significant unobservable prices or inputs (including the Fund’s own assumptions in determining the fair value of investments) where there is little or no market activity for the asset or liability at the measurement date. |
The availability of observable inputs can vary from security to security and is affected by a wide variety of factors, including, for example, the type of security, whether the security is new and not yet established in the marketplace, the liquidity of markets and other characteristics particular to the security. To the extent that valuation is based on models or inputs that are less observable or unobservable in the market, the determination of fair value requires more judgment. Accordingly, the degree of judgment exercised in determining fair value is greatest for instruments categorized in Level 3.
| | Notes to Consolidated Financial Statements |
| Axonic Strategic Income Fund | and Consolidated Financial Highlights |
October 31, 2024
An investment level within the fair value hierarchy is based on the lowest level input, individually or in the aggregate, that is significant to fair value measurement. To the extent practicable, the Adviser generally endeavors to maximize the use of observable inputs and minimize the use of unobservable inputs by requiring that the most observable inputs are to be used when available.
The inputs or methodologies used for valuing securities are not necessarily an indication of the risk or liquidity associated with investing in those securities. The following is a summary of the inputs used in valuing the Fund’s investments as of October 31, 2024:
| Investments in Securities at Value(a) | | Level 1 – Quoted Prices | | | Level 2 – Other Significant Observable Inputs | | | Level 3 – Significant Unobservable Inputs | | | Total | |
| Common Stocks | | $ | 323,691 | | | $ | – | | | $ | – | | | $ | 323,691 | |
| Preferred Stocks | | | 17,420,481 | | | | – | | | | – | | | | 17,420,481 | |
| Asset-Backed Securities | | | – | | | | 623,737,051 | | | | – | | | | 623,737,051 | |
| Bank Loans | | | – | | | | 27,058,570 | | | | – | | | | 27,058,570 | |
| Commercial Mortgage-Backed Securities | | | – | | | | 870,900,944 | | | | – | | | | 870,900,944 | |
| Convertible Corporate Bonds | | | – | | | | 27,832,575 | | | | – | | | | 27,832,575 | |
| Corporate Bonds | | | – | | | | 8,872,762 | | | | – | | | | 8,872,762 | |
| Government Bonds | | | – | | | | 338,652,335 | | | | – | | | | 338,652,335 | |
| Residential Mortgage-Backed Securities | | | – | | | | 856,713,847 | | | | – | | | | 856,713,847 | |
| Short Term Investments | | | 177,778,603 | | | | – | | | | – | | | | 177,778,603 | |
| Total | | $ | 195,522,775 | | | $ | 2,753,768,084 | | | $ | – | | | $ | 2,949,290,859 | |
| Other Financial Instruments(b) | | | | | | | | | | | | | | | | |
| Assets: | | | | | | | | | | | | | | | | |
| Interest Rate Swap Contracts | | $ | – | | | $ | 4,849,551 | | | $ | – | | | $ | 4,849,551 | |
| Liabilities: | | | | | | | | | | | | | | | | |
| Interest Rate Swap Contracts | | $ | – | | | $ | (3,626,967 | ) | | $ | – | | | $ | (3,626,967 | ) |
| Total | | $ | – | | | $ | 1,222,584 | | | $ | – | | | $ | 1,222,584 | |
| (a) | For detailed descriptions of industries, see the accompanying Consolidated Schedule of Investments. |
| (b) | Other financial instruments are derivative instruments reflected in the Consolidated Schedule of Investments. The derivatives shown in this table are reported at their unrealized appreciation/(depreciation) at measurement date, which represents the change in the contract's value. |
Securities Transactions and Investment Income – Investment security transactions are accounted for on a trade date basis. Cost is determined and gains and losses are based upon the specific identification method for both financial statement and federal income tax purposes. Dividend income is recorded on the ex-dividend date and interest income is recorded on the accrual basis. Dividend income from REITs is recognized on the ex-dividend date. It is common for distributions from REITs to exceed taxable earnings and profits, resulting in the excess portion of such dividends being designated as a return of capital. The calendar year-end amounts of ordinary income, capital gains, and return of capital included in distributions received from the Fund’s investment in REITs are reported to the Fund after the end of the calendar year; accordingly, the Fund estimates these amounts for accounting purposes until the characterization of REIT distributions is reported to the Fund after the end of the calendar year. Estimates are based on the most recent REIT distribution information available.
Premium and Discount Amortization/Paydown Gains and Losses – All premiums and discounts on fixed-income securities are amortized/accreted over the estimated lives of such securities for financial statement purposes using the effective interest method. Gains and losses realized on principal payments of mortgage-backed securities (paydown gains and losses) are classified as part of interest income.
Concentration of Credit Risk – The Fund places its cash with one banking institution, which is insured by Federal Deposit Insurance Corporation (“FDIC”). The FDIC limit is $250,000. At various times throughout the year, the amount on deposit may exceed the FDIC limit and subject the Fund to a credit risk. The Fund does not believe that such deposits are subject to any unusual risk associated with investment activities.
Federal and Other Taxes – No provision for income taxes is included in the accompanying consolidated financial statements, as the Fund intends to distribute to shareholders all taxable investment income and realized gains and otherwise comply with Subchapter M of the Internal Revenue Code of 1986, as amended, applicable to regulated investment companies.
| Annual Report | October 31, 2024 | 23 |
| | Notes to Consolidated Financial Statements |
| Axonic Strategic Income Fund | and Consolidated Financial Highlights |
October 31, 2024
The Fund evaluates tax positions taken (or expected to be taken) in the course of preparing the Fund’s tax provisions to determine whether these positions meet a “more-likely-than-not” standard that, based on the technical merits, have a more than fifty percent likelihood of being sustained by a taxing authority upon examination. A tax position that meets the “more-likely-than-not” recognition threshold is measured to determine the amount of benefit to recognize in the consolidated financial statements.
As of and during the year ended October 31, 2024, the Fund did not have a liability for any unrecognized tax benefits. The Fund recognizes interest and penalties, if any, related to tax liabilities as income tax expense in the Consolidated Statement of Operations. The Fund files U.S. federal, state and local tax returns as required. The Fund’s tax returns are subject to examination by the relevant tax authorities until expiration of the applicable statute of limitations which is generally three years after the filing of the tax return for federal purposes and four years for most state returns. Tax returns for all open tax years have incorporated no uncertain tax positions that require a provision for income taxes.
Distributions to Shareholders – Distributions from the Fund’s net investment income are accrued daily and typically paid monthly. However, there can be no assurances that the Fund will achieve any level of distribution to its Shareholders. The Fund intends to make sufficient distributions of its ordinary taxable income and capital gain net income prior to the end of each calendar year to avoid liability for the excise tax. The character of income and gains to be distributed is determined in accordance with income tax regulations, which may differ from GAAP.
Indemnification – The Fund indemnifies its officers and trustees for certain liabilities that may arise from the performance of their duties to the Fund. Additionally, in the normal course of business, the Fund enters into contracts that contain a variety of representations and warranties which provide general indemnities. The Fund’s maximum exposure under these arrangements is unknown, as this would involve future claims that may be made against the Fund that have not yet occurred. However, the Fund expects the risk of loss due to these warranties and indemnities to be remote.
3. SWAP AGREEMENTS
The Fund may transact in credit default swaps, total return swaps, interest rate swaps, equity swaps, currency swaps and other types of swaps. Such transactions are subject to market risk, liquidity risk, risk of default by the other party to the transaction, known as “counterparty risk,” regulatory risk and risk of imperfect correlation between the value of such instruments and the underlying assets and may involve commissions or other costs.
Swap agreements are primarily entered into by institutional investors and the value of such agreements may be extremely volatile. Certain swap agreements are traded OTC between two parties, while other more standardized swaps must be transacted through a futures commission merchant and centrally cleared or exchange-traded. While central clearing and exchange-trading are intended to reduce counterparty credit and liquidity risk, they do not make a swap transaction risk-free. The current regulatory environment regarding swap agreements is subject to change. The Adviser will continue to monitor these developments, particularly to the extent regulatory changes affect the Fund’s ability to enter into or close out swap agreements.
The swap market has matured in recent years with a large number of banks and investment banking firms acting both as principals and as agents utilizing standardized swap documentation. As a result, the swap market has become relatively liquid; however there is no guarantee that the swap market will continue to provide liquidity and may be subject to liquidity risk, which exists when a particular swap is difficult to purchase or sell. The absence of liquidity may also make it more difficult for the Fund to ascertain a market value for such instruments. The inability to close derivative positions also could have an adverse impact on the Fund’s ability to effectively hedge its portfolio. If the Adviser is incorrect in its forecasts of market values, interest rates or currency exchange rates, the investment performance of the Fund would be less favorable than it would have been if these investment techniques were not used. In a total return swap, the Fund pays the counterparty a floating short-term interest rate and receives in exchange the total return of underlying loans or debt securities. The Fund bears the risk of default on the underlying loans or debt securities, based on the notional amount of the swap and, therefore, incurs a form of leverage. The Fund would typically have to post collateral to cover this potential obligation.
The Fund will “cover” its swap positions by segregating an amount of cash and/or liquid securities as required by the 1940 Act and applicable SEC interpretations and guidance from time to time.
Offsetting Arrangements: Certain derivative contracts and reverse repurchase agreements are executed under standardized netting agreements. A netting arrangement creates an enforceable right of off-set that becomes effective, and affects the realization of settment on individual assets, liabilities and collateral amounts, only following a specified event of default or early termination. Default events may include the failure to make payments or deliver securities timely, material advse changes in financial condition or insolvency, the breach of minimum regulatory capital requirements, or loss of license, charter, or other legal authorization necessary to perform under the contract. These agreements mitigate counterparty risk by providing for a single net settlement with a counterparty for all financial transactions covered by the agreement in an event of default as defined under such agreement. The Fund invests in futures, interest rate swaps, and credit default swaps that are centrally cleared and not subject to the master netting agreements.
| | Notes to Consolidated Financial Statements |
| Axonic Strategic Income Fund | and Consolidated Financial Highlights |
October 31, 2024
The table below is a summary of the effect of interest rate swaps on the Consolidated Statement of Assets and Liabilities.
| Risk Exposure | | Consolidated Statement of Assets and Liabilities Location | | Asset Derivatives Net Unrealized Appreciation | | | Liability Derivatives Net Unrealized Depreciation | |
| Axonic Strategic Income Fund | | | | | | | | |
| Interest Rate Risk (Swap Contracts) | | Unrealized appreciation/depreciation on interest rate swap contracts(a) | | $ | 1,222,584 | | | $ | – | |
| Total | | | | $ | 1,222,584 | | | $ | – | |
| (a) | The value presented includes cumulative gain/(loss) on swap contracts; however, the value reflected on the accompanying Consolidated Statement of Assets and Liabilities is the unsettled variation margin receivable/(payable) and/or unrealized appreciation/(depreciation) as of October 31, 2024. |
The average notional value of interest rate swap contracts from the period of initial investment to October 31, 2024, was $360,797,035.
The effect of interest rate swap contracts on the Consolidated Statement of Operations for the year ended October 31, 2024, is shown in the table below.
| Risk Exposure | | Consolidated Statement of Operations Location | | Net Realized Gain/(Loss) | | | Net Change in Unrealized Appreciation/ (Depreciation) | |
| Axonic Strategic Income Fund | | | | | | | | |
| Interest Rate Risk (Swap Contracts) | | Net realized gain on interest rate swap contracts/Net change in unrealized appreciation on interest rate swap contracts | | $ | 22,349,109 | | | $ | 5,040 | |
| Total | | | | $ | 22,349,109 | | | $ | 5,040 | |
4. ADVISORY FEES AND OTHER TRANSACTIONS WITH SERVICE PROVIDERS
Advisory Fees – Pursuant to the investment advisory agreement by and between the Trust, on behalf of the Fund, and the Adviser (the “Investment Advisory Agreement”), and in consideration of the advisory services provided by the Adviser to the Fund, the Adviser is entitled to a management fee equal to 0.85% of the Fund’s average daily net assets. For the year ended October 31, 2024, the Fund incurred $20,382,847 in Advisory fees.
The Adviser has contractually agreed to waive its fees and/or reimburse certain expenses (inclusive of organizational and offering costs, but exclusive of any taxes, interest on borrowings, dividends on securities sold short, brokerage commissions, 12b-1 fees, acquired fund fees and expenses, expenses incurred in connection with any merger or reorganization and extraordinary expenses) to limit the Fund’s Total Annual Fund Operating Expenses after Fee Waiver/Expense Reimbursement to 1.10% of the Fund’s average daily net assets (the “Expense Limit”) through December 31, 2024. The Expense Limit excludes certain expenses and, consequently, the Fund’s Total Annual Fund Operating Expenses after Fee Waiver/Expense Reimbursement may be higher than the Expense Limit. The contractual waiver and expense reimbursement may be changed or eliminated at any time by the Board of Trustees, on behalf of the Fund, upon 60 days’ written notice to the Adviser. The contractual fee waiver and expense reimbursement may not be terminated by the Adviser without the consent of the Board of Trustees. The Adviser may recoup from the Fund any waived amount or reimbursed expenses pursuant to this agreement if such recoupment does not cause the Fund to exceed the current Expense Limit or the Expense Limit in place at the time of the waiver or reimbursement (whichever is lower) and the recoupment is made within three years after the end of the month in which the Adviser incurred the expense. As of October 31, 2024, the Adviser did not have any amounts available for recoupment.
Chief Compliance Officer ("CCO") Services – The CCO of the Fund is an affiliate of the Fund. For the year ended October 31, 2024, the total related amounts paid by the Fund for CCO fees are included in Chief Compliance Officer fees on the Fund’s Consolidated Statement of Operations.
| Annual Report | October 31, 2024 | 25 |
| | Notes to Consolidated Financial Statements |
| Axonic Strategic Income Fund | and Consolidated Financial Highlights |
October 31, 2024
Fund Accounting and Administration Fees and Expenses – ALPS Fund Services, Inc. (“ALPS”) serves as the Fund’s administrator and accounting agent (the “Administrator”) and receives customary fees from the Fund for such services.
Transfer Agent – DST Systems Inc., an affiliate of ALPS, serves as transfer, dividend paying and shareholder servicing agent for the Fund (“Transfer Agent”).
Distributor – The Fund has entered into a distribution agreement with ALPS Distributors, Inc. (the “Distributor”) to provide distribution services to the Fund. There are no fees paid to the Distributor pursuant to the distribution agreement.
The Distributor acts as the Fund’s principal underwriter in a continuous public offering of the Fund’s shares. The Distributor is an affiliate of ALPS. During the year ended October 31, 2024, no fees were retained by the Distributor.
Trustees – Officers of the Trust and the Trustees who are “interested persons” of the Trust or the Adviser receive no salary from the Trust. The Independent Trustees also serve as independent trustees on the Board of Trustees of the Axonic Alternative Income Fund, a closed-end interval fund for which Axonic Capital LLC also serves as the investment adviser. For their service on the Board and the Board of Trustees of Axonic Alternative Income Fund, the Independent Trustees receive the following fees, which are split between the Fund and the Axonic Alternative Income Fund pro rata based on assets under management: $55,000 annual retainer for each Independent Trustee, $10,000 annually for each of the Valuation Committee Chair, Audit Committee Chair and Nominating and Governance Committee Chair, $5,000 for each quarterly meeting, and $1,000 for each special meeting. The Fund reimburses each Trustee and officer of the Trust for his or her travel and other expenses relating to attendance at Board or committee meetings.
5. INVESTMENT TRANSACTIONS
The cost of purchases and proceeds from the sale of securities, other than short-term securities, for the year ended October 31, 2024, amounted to $2,550,957,456 and $1,434,027,418 respectively.
6. TAX BASIS INFORMATION
Distributions are determined in accordance with federal income tax regulations, which differ from GAAP, and, therefore, may differ significantly in amount or character from net investment income and realized gains for financial reporting purposes. Financial reporting records are adjusted for permanent book/tax differences to reflect tax character but are not adjusted for temporary differences.
For the year ended October 31, 2024, there were no permanent differences that resulted in adjustments to accumulated deficit or additional paid-in capital.
The tax character of distributions paid for the year ended October 31, 2024, was as follows:
| 2024 | | | |
| Distributions Paid From: | | | | |
| Ordinary Income | | $ | 190,964,757 | |
| Return of Capital | | | – | |
| Total | | $ | 190,964,757 | |
The tax character of distributions paid for the year ended October 31, 2023, was as follows:
| 2023 | | | |
| Distributions Paid From: | | | | |
| Ordinary Income | | $ | 93,657,083 | |
| Long-Term Capital Gain | | | 1,856,288 | |
| Return of Capital | | | – | |
| Total | | $ | 95,513,371 | |
| | Notes to Consolidated Financial Statements |
| Axonic Strategic Income Fund | and Consolidated Financial Highlights |
October 31, 2024
As of October 31, 2024, the components of distributable earnings / (accumulated deficit) on a tax basis were as follows:
| Accumulated net investment income | | $ | 16,897,062 | |
| Accumulated net realized loss | | | (1,789,315 | ) |
| Net unrealized depreciation | | | (89,027,375 | ) |
| Dividends payable | | | (3,754,899 | ) |
| Total | | $ | (77,674,527 | ) |
Under current law, capital losses maintain their character as short-term or long-term and are carried forward to the next year without expiration. As of the current fiscal year end, the following amounts are available as carry forwards to the next tax year:
| Short Term | Long Term |
| $ – | $ 1,789,315 |
As of October 31, 2024, net unrealized appreciation/(depreciation) of investments based on the federal tax cost were as follows:
| Cost of investments for income tax purposes | | $ | 3,039,540,818 | |
| Gross appreciation (excess of value over tax cost) | | $ | 18,692,021 | |
| Gross depreciation (excess of tax cost over value) | | | (108,941,980 | ) |
| Net appreciation of Interest Rate Swap Contracts | | | 1,222,584 | |
| Net unrealized depreciation | | $ | (89,027,375 | ) |
The differences between book and tax basis cost of investments and net unrealized appreciation (depreciation) are primarily attributable to wash sales.
7. LINE OF CREDIT
The Fund entered into an uncommitted, secured, revolving line of credit agreement (“Credit Agreement”) with U.S. Bank National Association for redemption purposes, subject to annual renewal and other limitations of the 1940 Act for borrowings. The revolving line of credit agreement's maximum borrowing amounts to the lesser of (i) $350,000,000, (ii) 15% of the gross market value of the Fund, and (iii) 33.33% of the market value of the unencumbered assets of the Fund. On June 28, 2024, the Credit Agreement was amended to extend the termination date to June 27, 2025. Borrowings under the Credit Agreement bear interest of the lender’s prime rate at the time of borrowing. This Note shall bear interest at a rate per annum equal to the greater of (i) zero percent (0.00%) and (ii) the Prime Rate minus one percent (1.00%), which interest shall be payable monthly, in arrears. Borrowings under the Credit Agreement are secured by a perfected, first priority security interest in the assets of the Fund. The Fund had no borrowings during the year ended October 31, 2024.
8. SIGNIFICANT SHAREHOLDERS
The beneficial ownership, either directly or indirectly, of more than 25% of the voting securities of a Fund creates a presumption of control of the Fund under Section 2(a)(9) of the 1940 Act. As of October 31, 2024, the following entities owned beneficially more than 25% of the Fund’s outstanding shares. The shares may be held under omnibus accounts (whereby the transactions of two or more shareholders are combined and carried in the name of the originating broker rather than designated separately). Any transaction by these investors could have a material impact on the share class.
| Name | Percentage |
| Charles Schwab & Co Inc | 40.52% |
| National Financial Services LLC | 33.83% |
| Annual Report | October 31, 2024 | 27 |
| | Notes to Consolidated Financial Statements |
| Axonic Strategic Income Fund | and Consolidated Financial Highlights |
October 31, 2024
9. SUBSEQUENT EVENTS
Subsequent events after the date of the Consolidated Statement of Assets and Liabilities have been evaluated through the date the consolidated financial statements were issued. Management has determined that there were no subsequent events to report through the issuance of these consolidated financial statements.
| | Report of Independent |
| Axonic Strategic Income Fund | Registered Public Accounting Firm |
To the Shareholders of Axonic Strategic Income Fund and the Board of Trustees of Axonic Funds
Opinion on the Financial Statements
We have audited the accompanying consolidated statement of assets and liabilities, including the consolidated schedule of investments, of Axonic Strategic Income Fund (the “Fund”), a series of Axonic Funds, as of October 31, 2024, the related consolidated statement of operations for the year then ended, the consolidated statement of changes in net assets for each of the two years in the period then ended, the consolidated financial highlights for each of the four years in the period then ended and the period December 31, 2019 (commencement of operations) to October 31, 2020, and the related notes (collectively referred to as the “financial statements”). In our opinion, the financial statements present fairly, in all material respects, the financial position of the Fund as of October 31, 2024, the results of its operations for the year then ended, the changes in net assets for each of the two years in the period then ended, and the financial highlights for each of the five periods in the period then ended, in conformity with accounting principles generally accepted in the United States of America.
Basis for Opinion
These financial statements are the responsibility of the Fund’s management. Our responsibility is to express an opinion on the Fund’s financial statements based on our audits. We are a public accounting firm registered with the Public Company Accounting Oversight Board (United States) (“PCAOB”) and are required to be independent with respect to the Fund in accordance with the U.S. federal securities laws and the applicable rules and regulations of the Securities and Exchange Commission and the PCAOB.
We conducted our audits in accordance with the standards of the PCAOB. Those standards require that we plan and perform the audit to obtain reasonable assurance about whether the financial statements are free of material misstatement whether due to error or fraud.
Our audits included performing procedures to assess the risks of material misstatement of the financial statements, whether due to error or fraud, and performing procedures that respond to those risks. Such procedures included examining, on a test basis, evidence regarding the amounts and disclosures in the financial statements. Our procedures included confirmation of securities owned as of October 31, 2024, by correspondence with the custodian and brokers; when replies were not received from brokers, we performed other auditing procedures. Our audits also included evaluating the accounting principles used and significant estimates made by management, as well as evaluating the overall presentation of the financial statements. We believe that our audits provide a reasonable basis for our opinion.
We have served as the Fund’s auditor since 2019.

COHEN & COMPANY, LTD.
Cleveland, Ohio
December 30, 2024
| Annual Report | October 31, 2024 | 29 |
| Axonic Strategic Income Fund | Additional Information |
October 31, 2024 (Unaudited)
PROXY VOTING POLICIES AND VOTING RECORD
A description of the policies and procedures that the Fund uses to vote proxies relating to portfolio securities is available without charge upon request by calling toll-free 888-926-2688, or on the SEC’s website at http://www.sec.gov. Information regarding how the Fund voted proxies relating to its portfolio securities during the most recent 12-month period ended June 30th is available without charge upon request by calling toll-free 833-429-6642, or on the SEC’s website at http://www.sec.gov.
QUARTERLY PORTFOLIO HOLDINGS
The Fund files its complete schedule of portfolio holdings with the SEC for the first and third quarters of each fiscal year as an exhibit to its reports on Form N-PORT; the Fund’s Form N-PORT reports are available on the SEC’s Website at http://www.sec.gov.
| Axonic Strategic | Changes in and Disagreements with Accountants |
| Income Fund | for Open-End Management Investment Companies |
October 31, 2024 (Unaudited)
There have been no changes in or disagreement with the Fund's independent accounting firm during the reporting period.
| Annual Report | October 31, 2024 | 31 |
| | Proxy Disclosures for |
| Axonic Strategic Income Fund | Open-End Management Investment Companies |
October 31, 2024 (Unaudited)
Not applicable for this reporting period.
| Axonic Strategic | Remuneration Paid to Directors, Officers, and Others |
| Income Fund | of Open-End Management Investment Companies |
October 31, 2024 (Unaudited)
The following chart provides certain information about the Trustee or Directors fees paid by the Trust for the fiscal year ended October 31, 2024:
| | | Aggregate Regular Compensation From the Trust | | | Aggregate Special Compensation from the Trust | | | Total Compensation from the Trust | |
| Joshua M. Barlow | | $ | 57,169 | | | $ | – | | | $ | 57,169 | |
| Charles D. Mires | | $ | 56,017 | | | $ | – | | | $ | 56,017 | |
| Thomas S. Vales | | $ | 56,017 | | | $ | – | | | $ | 56,017 | |
| Clayton DeGiacinto | | $ | – | | | $ | – | | | $ | – | |
| John Kelly | | $ | – | | | $ | – | | | $ | – | |
| Chris Hughes | | $ | – | | | $ | – | | | $ | – | |
| Theodore Uhl | | $ | – | | | $ | – | | | $ | – | |
| Total | | $ | 169,203 | | | $ | – | | | $ | 169,203 | |
Officers who are employed by the Adviser receive no compensation or expense reimbursement from the Trust.
| Annual Report | October 31, 2024 | 33 |
| | Statement Regarding Basis |
| Axonic Strategic Income Fund | for Approval of Investment Advisory Contract |
October 31, 2024 (Unaudited)
Not applicable for this reporting period.

AXONIC STRATEGIC INCOME FUND
ANNUAL REPORT
October 31, 2024
| Item 8. | Changes in and Disagreements with Accountants for Open-End Management Investment Companies. |
Not applicable.
| Item 9. | Proxy Disclosures for Open-End Management Investment Companies. |
Not applicable.
| Item 10. | Remuneration Paid to Directors, Officers, and Others of Open-End Management Investment Companies. |
Any Remuneration Paid to Directors, Officers, and Others is included as part of the Financial Statements and Financial Highlights filed under Item 7 of this Report.
| Item 11. | Statement Regarding Basis for Approval of Investment Advisory Contract. |
Not applicable during the period covered by this Report.
| Item 12. | Disclosure of Proxy Voting Policies and Procedures for Closed-End Management Investment Companies. |
Not applicable.
| Item 13. | Portfolio Managers of Closed-End Management Investment Companies. |
Not applicable.
| Item 14. | Purchases of Equity Securities by Closed-End Management Investment Company and Affiliated Purchasers. |
Not applicable.
| Item 15. | Submission of Matters to a Vote of Security Holders. |
There have been no material changes to the procedures by which shareholders may recommend nominees to the Registrant’s Board of Trustees, where those changes were implemented after the Registrant last provided disclosure in response to the requirements of Item 407(c)(2)(iv) of Regulation S-K, or this Item.
| Item 16. | Controls and Procedures. |
| (a) | The Registrant’s principal executive officer and principal financial officer have concluded that the Registrant’s disclosure controls and procedures (as defined in Rule 30a-3(c) under the Investment Company Act of 1940, as amended) are effective as of a date within 90 days of the filing date of this report that includes the disclosure required by this paragraph, based on the evaluation of these controls and procedures required by Rule 30a-3(b) under the Act (17 CFR 270.30a-3(b)) and Rules 13a-15(b) or 15d-15(b) under the Exchange Act (17 CFR 240.13a-15(b) or 240.15d-15(b)). |
| (b) | There was no change in the Registrant’s internal control over financial reporting (as defined in Rule 30a-3(d) under the Investment Company Act of 1940, as amended) that occurred during the period covered by this report that has materially affected, or is reasonably likely to materially affect, the Registrant’s internal control over financial reporting. |
| Item 17. | Disclosure of Securities Lending Activities for Closed-End Management Investment Companies. |
Not applicable.
| Item 18. | Recovery of Erroneously Awarded Compensation. |
SIGNATURES
Pursuant to the requirements of the Securities Exchange Act of 1934 and the Investment Company Act of 1940, the Registrant has duly caused this report to be signed on its behalf by the undersigned, thereunto duly authorized.
Axonic Funds
| By: | /s/ Clayton DeGiacinto | |
| | Clayton DeGiacinto (Principal Executive Officer) | |
| | Chief Executive Officer and President | |
| | | |
| Date: | January 10, 2025 | |
Pursuant to the requirements of the Securities Exchange Act of 1934 and the Investment Company Act of 1940, this report has been signed below by the following persons on behalf of the Registrant and in the capacities and on the dates indicated.
Axonic Funds
| By: | /s/ Clayton DeGiacinto | |
| | Clayton DeGiacinto (Principal Executive Officer) | |
| | Chief Executive Officer and President | |
| | | |
| Date: | January 10, 2025 | |
| | | |
| By: | /s/ John R. Kelly | |
| | John R. Kelly (Principal Financial Officer) | |
| | Treasurer and Chief Financial Officer | |
| | | |
| Date: | January 10, 2025 | |