UNITED STATES
SECURITIES AND EXCHANGE COMMISSION
Washington, D.C. 20549
FORM N-CSR
CERTIFIED SHAREHOLDER REPORT OF REGISTERED
MANAGEMENT INVESTMENT COMPANIES
Investment Company Act File Number: 811-23494
T. Rowe Price Exchange-Traded Funds, Inc.
(Exact name of registrant as specified in charter)
100 East Pratt Street, Baltimore, MD 21202
(Address of principal executive offices)
David Oestreicher
100 East Pratt Street, Baltimore, MD 21202
(Name and address of agent for service)
Registrant’s telephone number, including area code: (410) 345-2000
Date of fiscal year end: May 31
Date of reporting period: May 31, 2024
Item 1. Reports to Shareholders
(a) Report pursuant to Rule 30e-1

Annual Shareholder Report
May 31, 2024
U.S. High Yield ETF (THYF)
Principal Listing Exchange: NYSE Arca, Inc.
This annual shareholder report contains important information about U.S. High Yield ETF ("the fund") for the period of June 1, 2023 to May 31, 2024. You can find the fund’s prospectus, financial information on Form N-CSR (which includes required tax information for dividends), holdings, proxy voting information, and other information at www.troweprice.com/prospectus. You can also request this information without charge by contacting T. Rowe Price at 1-800-638-5660 or info@troweprice.com or by contacting your intermediary.
What were the fund costs for the last year? (based on a hypothetical $10,000 investment)
| Costs of a $10,000 investment | Costs paid as a percentage of a $10,000 investment | |
|---|---|---|
| U.S. High Yield ETF | $59 | 0.56% |
What drove fund performance during the past 12 months?
High yield bonds strongly advanced in the 12-month period ended May 31, 2024, as a pause in rate hikes, receding recession fears, healthy risk appetite, and favorable technical conditions—a pickup in primary issuance and improved market liquidity—supported performance.
Compared with the style-specific ICE BofA US High Yield Constrained Index, the fund’s strongest relative results were in the media, services, and leisure segments. By credit quality, our selection in the B and BB rating tiers provided meaningful relative contributions. Our underweight to BBs was also beneficial as lower qualities outperformed. The fund’s off-benchmark allocation to bank loans added relative value as they outperformed high yield bonds for the year.
Relative to the style-specific benchmark, the fund’s weakest results were in the health care, capital goods, and technology and electronics industries. Our selection among CCC rated bonds also detracted.
The fund seeks total return and, secondarily, current income by investing primarily in U.S. below investment-grade corporate debt securities. We utilized the market’s rally to trim or exit names that we believed to be fully valued and redeployed the proceeds into higher-conviction ideas, selectively taking advantage of stronger primary issuance. We expect more income-like returns from here given tight spread levels. We significantly increased the credit quality of the fund and sought to maintain a current yield advantage versus the index by exchanging lower-coupon COVID-era bonds for higher-coupon paper and increasing bank loan exposure.
How has the fund performed?
Cumulative Returns of a Hypothetical $10,000 Investment as of May 31, 2024
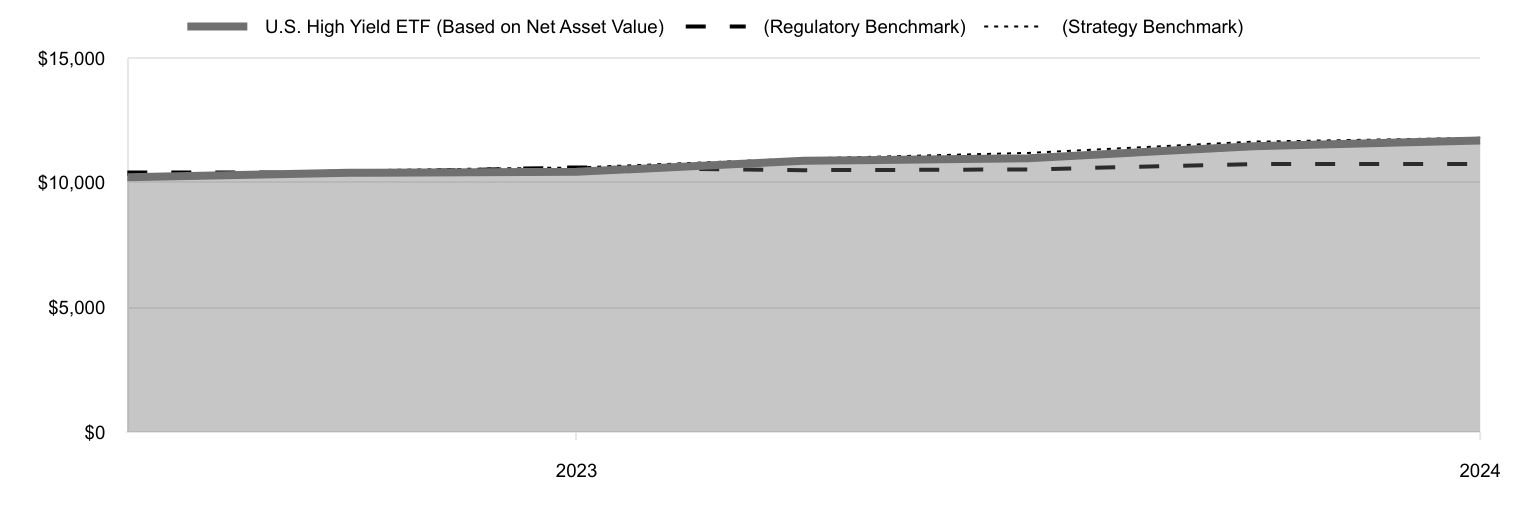
| U.S. High Yield ETF (Based on Net Asset Value) | (Regulatory Benchmark) | (Strategy Benchmark) | |
|---|---|---|---|
| 2022 | $10,218 | $10,406 | $10,306 |
| 2023 | $10,393 | $10,401 | $10,492 |
| 2023 | $10,436 | $10,613 | $10,610 |
| 2023 | $10,877 | $10,501 | $10,970 |
| 2023 | $10,982 | $10,529 | $11,194 |
| 2024 | $11,461 | $10,748 | $11,644 |
| 2024 | $11,691 | $10,752 | $11,797 |
202406-3653144, 202407-3567240
ETF1046-052 07/24
Average Annual Total Returns
| 1 Year | Since Inception 10/25/22 | |
|---|---|---|
| U.S. High Yield ETF (Based on Net Asset Value) | 12.02% | 10.27% |
| U.S. High Yield ETF (At Market Price) | 11.93% | 10.62% |
| Bloomberg U.S. Aggregate Bond Index (Regulatory Benchmark) | 1.31% | 4.64% |
| ICE BofA US High Yield Constrained Index (Strategy Benchmark) | 11.18% | 10.89% |
The preceding line graph shows the value of a hypothetical $10,000 investment in the fund over the past 10 fiscal year periods or since inception (for funds lacking 10-year records). The fund’s performance information included in the line graph and table above is compared with a regulatory required index that represents an overall securities market (Regulatory Benchmark). In addition, the line graph and table may also include one or more indexes that more closely aligns to the fund's investment strategy (Strategy Benchmark(s)). Due to new SEC Rules on shareholder reporting the fund adopted a new broad-based securities market index, referred to as the Regulatory Benchmark. Market index returns do not include expenses, which are deducted from fund returns. The fund's total return figures reflect the reinvestment of dividends and capital gains, if any. Neither the fund’s returns nor the index returns reflect the deduction of taxes that a shareholder would pay on fund distributions or redemptions of fund shares. The fund’s past performance is not a good predictor of the fund’s future performance. Updated performance information can be found at www.troweprice.com.
What are some fund statistics?
Fund Statistics
- Total Net Assets (000s)$53,719
- Number of Portfolio Holdings105
- Investment Advisory Fees Paid (000s)$223
- Portfolio Turnover Rate86.7%
What did the fund invest in?
Credit Quality Allocation* (as a % of Net Assets)
| BBB Rated | 2.9% |
| BB Rated | 31.5 |
| B Rated | 45.3 |
| CCC Rated | 7.1 |
| Bank Debt | 11.3 |
| Reserves | 1.9 |
*Credit ratings for the securities held in the Fund are provided by Moody's, Standard & Poor's, and Fitch and are converted to the Standard & Poor's nomenclature. A rating of AAA represents the highest-rated securities, and a rating of D represents the lowest rated securities. When a rating is available from all three agencies, the median rating is used. If there are two ratings, the lower rating is used, and if only one rating is available, that rating is used. If a rating is not available, the security is classified as Not Rated. The rating of the underlying investment vehicle is used to determine the creditworthiness of credit default swaps and sovereign securities. The Fund is not rated by any agency.
Top Ten Holdings (as a % of Net Assets)
| AG Merger Sub II | 2.1% |
| Six Flags Entertainment | 2.0 |
| Aretec Escrow Issuer 2 | 1.9 |
| Sigma Holdco | 1.8 |
| Vistra | 1.8 |
| Energy Transfer | 1.8 |
| Enbridge | 1.7 |
| Heartland Dental/Heartland Dental Finance | 1.6 |
| Encino Acquisition Partners Holdings | 1.4 |
| Civitas Resources | 1.4 |
If you invest directly with T. Rowe Price, you can elect to receive future shareholder reports or other important documents through electronic delivery by enrolling at www.troweprice.com/paperless. If you invest through a financial intermediary such as an investment advisor, a bank, retirement plan sponsor or a brokerage firm, please contact that organization and ask if it can provide electronic delivery.
Bloomberg and ICE do not accept any liability for any errors or omissions in the indexes or data, and hereby expressly disclaim all warranties of originality, accuracy, completeness, timeliness, merchantability and fitness for a particular purpose. No party may rely on any indexes or data contained in this communication. Visit www.troweprice.com/en/us/market-data-disclosures for additional legal notices & disclaimers.
T. Rowe Price Investment Services, Inc.
100 East Pratt Street
Baltimore, MD 21202
U.S. High Yield ETF (THYF)

Principal Listing Exchange: NYSE Arca, Inc.
Item 1. (b) Notice pursuant to Rule 30e-3.
Not applicable.
Item 2. Code of Ethics.
The registrant has adopted a code of ethics, as defined in Item 2 of Form N-CSR, applicable to its principal executive officer, principal financial officer, principal accounting officer or controller, or persons performing similar functions. A copy of this code of ethics is filed as an exhibit to this Form N-CSR. No substantive amendments were approved or waivers were granted to this code of ethics during the period covered by this report.
Item 3. Audit Committee Financial Expert.
The registrant’s Board of Directors has determined that Mr. Paul F. McBride qualifies as an audit committee financial expert, as defined in Item 3 of Form N-CSR. Mr. McBride is considered independent for purposes of Item 3 of Form N-CSR.
Item 4. Principal Accountant Fees and Services.
(a) – (d) Aggregate fees billed for the last two fiscal years for professional services rendered to, or on behalf of, the registrant by the registrant’s principal accountant were as follows:
| 2024 | 2023 | |||||||||||||
Audit Fees | $ | 33,840 | $ | 34,209 | ||||||||||
Audit-Related Fees | - | - | ||||||||||||
Tax Fees | - | 6,939 | ||||||||||||
All Other Fees | - | - | ||||||||||||
Audit fees include amounts related to the audit of the registrant’s annual financial statements and services normally provided by the accountant in connection with statutory and regulatory filings. Audit-related fees include amounts reasonably related to the performance of the audit of the registrant’s financial statements and specifically include the issuance of a report on internal controls and, if applicable, agreed-upon procedures related to fund acquisitions. Tax fees include amounts related to services for tax compliance, tax planning, and tax advice. The nature of these services specifically includes the review of distribution calculations and the preparation of Federal, state, and excise tax returns. All other fees include the registrant’s pro-rata share of amounts for agreed-upon procedures in conjunction with service contract approvals by the registrant’s Board of Directors/Trustees.
(e)(1) The registrant’s audit committee has adopted a policy whereby audit and non-audit services performed by the registrant’s principal accountant for the registrant, its investment adviser, and any entity controlling, controlled by, or under common control with the investment adviser that provides ongoing services to the registrant require pre-approval in advance at regularly scheduled audit committee meetings. If such a service is required between regularly scheduled audit committee meetings, pre-approval may be authorized by one audit committee member with ratification at the next scheduled audit committee meeting. Waiver of pre-approval for audit or non-audit services requiring fees of a de minimis amount is not permitted.
(2) No services included in (b) – (d) above were approved pursuant to paragraph (c)(7)(i)(C) of Rule 2-01 of Regulation S-X.
(f) Less than 50 percent of the hours expended on the principal accountant’s engagement to audit the registrant’s financial statements for the most recent fiscal year were attributed to work performed by persons other than the principal accountant’s full-time, permanent employees.
(g) The aggregate fees billed for the most recent fiscal year and the preceding fiscal year by the registrant’s principal accountant for non-audit services rendered to the registrant, its investment adviser, and any entity controlling, controlled by, or under common control with the investment adviser that provides ongoing services to the registrant were $1,230,000 and $1,521,000, respectively.
(h) All non-audit services rendered in (g) above were pre-approved by the registrant’s audit committee. Accordingly, these services were considered by the registrant’s audit committee in maintaining the principal accountant’s independence.
(i) Not applicable.
(j) Not applicable.
Item 5. Audit Committee of Listed Registrants.
Not applicable.
Item 6. Investments.
(a) Not applicable. The complete schedule of investments is included in Item 7 of this Form N-CSR.
(b) Not applicable.
Item 7. Financial Statements and Financial Highlights for Open-End Management Investment Companies.
(a – b) Report pursuant to Regulation S-X.

| T. ROWE PRICE | |
| THYF | U.S. High Yield ETF |
| For more insights from T. Rowe Price investment professionals, go to troweprice.com. |

| ■ | Timely delivery of important documents |
| ■ | Convenient access to your documents anytime, anywhere |
| ■ | Strong security protocols to safeguard sensitive data |

| Year Ended | 10/25/22(1) Through | |
| 5/31/24 | 5/31/23 | |
| NET ASSET VALUE | ||
| Beginning of period | $ 49.57 | $ 50.00 |
| Investment activities | ||
| Net investment income(2) (3) | 4.11 | 2.62 |
| Net realized and unrealized gain/loss | 1.63 | (0.45) |
| Total from investment activities | 5.74 | 2.17 |
| Distributions | ||
| Net investment income | (4.03) | (2.60) |
| Net realized gain | (0.12) | - |
| Total distributions | (4.15) | (2.60) |
| NET ASSET VALUE | ||
| End of period | $ 51.16 | $ 49.57 |
| Ratios/Supplemental Data | ||
| Total return, based on NAV(3) (4) | 12.02% | 4.36% |
| Ratios to average net assets:(3) | ||
| Gross expenses before waivers/payments by Price Associates | 0.56% | 0.56%(5) |
| Net expenses after waivers/payments by Price Associates | 0.56% | 0.56%(5) |
| Net investment income | 8.11% | 8.61%(5) |
| Portfolio turnover rate | 86.7% | 25.6% |
| Net assets, end of period (in thousands) | $ 53,719 | $ 22,306 |
| (1) | Inception date |
| (2) | Per share amounts calculated using average shares outstanding method. |
| (3) | Includes the impact of expense-related arrangements with Price Associates. |
| (4) | Total return reflects the rate that an investor would have earned on an investment in the fund during each period, assuming reinvestment of all distributions. Total return is not annualized for periods less than one year. |
| (5) | Annualized |
| PORTFOLIO OF INVESTMENTS‡ | Par/Shares | $ Value |
| (Amounts in 000s) | ||
| BANK LOANS 11.2% | ||
| Consumer Goods 0.9% | ||
| Naked Juice, FRN, 3M TSFR + 6.00%, 11.402%, 1/24/30 | 580 | 485 |
| Energy 0.6% | ||
| GIP III Stetson I, FRN, 1M TSFR + 3.50%, 8.829%, 10/31/28 | 343 | 345 |
| Financial Services 0.4% | ||
| Advisor Group, FRN, 1M TSFR + 4.00%, 9.329%, 8/17/28 | 219 | 220 |
| Health Care 1.5% | ||
| Endo Luxembourg Finance Company, FRN, 3M TSFR + 4.50%, 9.826%, 4/9/31 | 250 | 250 |
| Surgery Center Holdings, FRN, 1M TSFR + 3.50%, 8.821%, 12/19/30 | 530 | 532 |
| 782 | ||
| Leisure 1.4% | ||
| Caesars Entertainment, FRN, 1M TSFR + 2.75%, 8.097%, 2/6/31 | 565 | 566 |
| Life Time Fitness, FRN, 3M TSFR + 4.00%, 9.591%, 1/15/26 | 185 | 185 |
| 751 | ||
| Media 1.0% | ||
| Magnite, FRN, 3M TSFR + 4.50%, 9.596%, 2/6/31 | 535 | 538 |
| Retail 0.6% | ||
| LSF9 Atlantis Holdings, FRN, 1M TSFR + 6.50%, 11.829%, 3/31/29 (1)(2) | 307 | 312 |
| Services 1.0% | ||
| Vestis, FRN, 3M TSFR + 2.25%, 7.577%, 2/22/31 | 560 | 558 |
| Technology & Electronics 2.1% | ||
| Applied Systems, FRN, 3M TSFR + 3.50%, 8.809%, 2/24/31 (2) | 550 | 554 |
| Par/Shares | $ Value | |
| (Amounts in 000s) | ||
| UKG, FRN, 3M TSFR + 3.50%, 8.820%, 2/10/31 | 550 | 554 |
| 1,108 | ||
| Transportation 1.7% | ||
| Mileage Plus Holdings, FRN, 3M TSFR + 5.25%, 10.733%, 6/21/27 | 416 | 425 |
| WestJet Loyalty, FRN, 3M TSFR + 3.75%, 9.052%, 2/14/31 | 510 | 513 |
| 938 | ||
| Total Bank Loans (Cost $6,016) | 6,037 | |
| CORPORATE BONDS 85.3% | ||
| Automotive 3.3% | ||
| Adient Global Holdings, 4.875%, 8/15/26 (3) | 275 | 267 |
| Adient Global Holdings, 8.25%, 4/15/31 (3) | 110 | 114 |
| Aston Martin Capital Holdings, 10.00%, 3/31/29 (3) | 685 | 659 |
| Clarios Global, 8.50%, 5/15/27 (3) | 465 | 467 |
| Jaguar Land Rover Automotive, 5.50%, 7/15/29 (3) | 275 | 261 |
| 1,768 | ||
| Basic Industry 5.3% | ||
| Camelot Return Merger Sub, 8.75%, 8/1/28 (3) | 535 | 528 |
| ERO Copper, 6.50%, 2/15/30 (3) | 500 | 484 |
| First Quantum Minerals, 6.875%, 10/15/27 (3) | 541 | 533 |
| LGI Homes, 8.75%, 12/15/28 (3) | 515 | 532 |
| Miter Brands Acquisition Holdco / MIWD Borrower, 6.75%, 4/1/32 (3) | 210 | 208 |
| White Cap Parent, 8.25%, 3/15/26, (8.25% Cash or 9.00% PIK) (3)(4) | 545 | 538 |
| 2,823 | ||
| Capital Goods 4.6% | ||
| AAR Escrow Issuer, 6.75%, 3/15/29 (3) | 545 | 551 |
| Bombardier, 7.25%, 7/1/31 (3) | 540 | 548 |
| GrafTech Finance, 4.625%, 12/15/28 (3) | 125 | 81 |
| Par/Shares | $ Value | |
| (Amounts in 000s) | ||
| GrafTech Global Enterprise, 9.875%, 12/15/28 (3) | 117 | 88 |
| TransDigm, 5.50%, 11/15/27 | 640 | 623 |
| Trivium Packaging Finance, 5.50%, 8/15/26 (3) | 600 | 591 |
| 2,482 | ||
| Consumer Goods 3.6% | ||
| Coty Inc./HFC Prestige Products Inc/HFC Prestige International US, 6.625%, 7/15/30 (3) | 529 | 533 |
| HLF Financing / Herbalife International, 12.25%, 4/15/29 (3) | 410 | 403 |
| Sigma Holdco, 7.875%, 5/15/26 (3) | 1,000 | 972 |
| 1,908 | ||
| Energy 18.5% | ||
| Ascent Resources Utica Holdings, 8.25%, 12/31/28 (3) | 505 | 514 |
| Civitas Resources, 8.75%, 7/1/31 (3) | 710 | 756 |
| Comstock Resources, 6.75%, 3/1/29 (3) | 580 | 560 |
| CVR Energy, 8.50%, 1/15/29 (3) | 545 | 547 |
| Enbridge, VR, 8.25%, 1/15/84 (5) | 855 | 885 |
| Encino Acquisition Partners Holdings, 8.75%, 5/1/31 (3) | 745 | 766 |
| Energy Transfer, VR, 6.50%, (5)(6) | 480 | 470 |
| Energy Transfer, VR, 8.00%, 5/15/54 (5) | 472 | 492 |
| Energy Transfer Operating, VR, 6.75%, (5)(6) | 70 | 69 |
| Harvest Midstream I, 7.50%, 9/1/28 (3) | 200 | 202 |
| Howard Midstream Energy Partners, 6.75%, 1/15/27 (3) | 475 | 474 |
| Kinetik Holdings, 6.625%, 12/15/28 (3) | 505 | 509 |
| Matador Resources, 6.50%, 4/15/32 (3) | 511 | 508 |
| NGL Energy Partners, 8.125%, 2/15/29 (3) | 521 | 530 |
| PBF Holding, 7.875%, 9/15/30 (3) | 555 | 568 |
| Permian Resources Operating, 7.00%, 1/15/32 (3) | 530 | 540 |
| Sunoco, 7.00%, 5/1/29 (3) | 515 | 524 |
| Tallgrass Energy Partners / Tallgrass Energy Finance, 7.375%, 2/15/29 (3) | 515 | 516 |
| Weatherford International, 8.625%, 4/30/30 (3) | 490 | 507 |
| 9,937 |
| Par/Shares | $ Value | |
| (Amounts in 000s) | ||
| Financial Services 10.2% | ||
| AG Merger Sub II, 10.75%, 8/1/27 (3) | 1,080 | 1,111 |
| AG TTMT Escrow Issuer, 8.625%, 9/30/27 (3) | 160 | 165 |
| Aretec Escrow Issuer 2, 10.00%, 8/15/30 (3) | 950 | 1,037 |
| Credit Acceptance, 9.25%, 12/15/28 (3) | 445 | 468 |
| Encore Capital Group, 9.25%, 4/1/29 (3) | 495 | 515 |
| FirstCash, 6.875%, 3/1/32 (3) | 492 | 487 |
| OneMain Finance, 7.875%, 3/15/30 | 535 | 545 |
| PennyMac Financial Services, 7.875%, 12/15/29 (3) | 620 | 635 |
| PRA Group, 8.375%, 2/1/28 (3) | 530 | 525 |
| 5,488 | ||
| Health Care 5.6% | ||
| CHS/Community Health Systems, 8.00%, 3/15/26 (3) | 232 | 233 |
| CHS/Community Health Systems, 8.00%, 12/15/27 (3) | 330 | 328 |
| Endo Finance Holdings, 8.50%, 4/15/31 (3) | 260 | 266 |
| Heartland Dental/Heartland Dental Finance, 10.50%, 4/30/28 (3) | 830 | 883 |
| IQVIA, 6.50%, 5/15/30 (3) | 670 | 675 |
| Tenet Healthcare, 6.25%, 2/1/27 | 650 | 648 |
| 3,033 | ||
| Insurance 2.3% | ||
| Alliant Holdings Intermediate / Alliant Holdings, 7.00%, 1/15/31 (3) | 540 | 542 |
| Panther Escrow Issuer, 7.125%, 6/1/31 (3) | 680 | 684 |
| 1,226 | ||
| Leisure 5.8% | ||
| Carnival, 6.00%, 5/1/29 (3) | 395 | 385 |
| Carnival Holdings Bermuda, 10.375%, 5/1/28 (3) | 610 | 658 |
| Life Time, 5.75%, 1/15/26 (3) | 555 | 551 |
| NCL, 8.375%, 2/1/28 (3) | 480 | 500 |
| Par/Shares | $ Value | |
| (Amounts in 000s) | ||
| Six Flags Entertainment, 7.25%, 5/15/31 (3) | 1,053 | 1,048 |
| 3,142 | ||
| Media 4.0% | ||
| CCO Holdings/CCO Holdings Capital, 4.50%, 5/1/32 | 720 | 569 |
| DISH Network, 11.75%, 11/15/27 (3) | 425 | 425 |
| Outfront Media Capital, 7.375%, 2/15/31 (3) | 605 | 624 |
| Sirius XM Radio, 5.50%, 7/1/29 (3) | 550 | 510 |
| 2,128 | ||
| Real Estate 1.0% | ||
| Brookfield Property REIT, 4.50%, 4/1/27 (3) | 605 | 559 |
| 559 | ||
| Retail 4.0% | ||
| eG Global Finance, 12.00%, 11/30/28 (3) | 575 | 593 |
| Hudson Automotive Group, 8.00%, 5/15/32 (3) | 300 | 309 |
| IRB Holding, 7.00%, 6/15/25 (3) | 530 | 528 |
| LSF9 Atlantis Holdings/Victra Finance, 7.75%, 2/15/26 (3) | 734 | 725 |
| 2,155 | ||
| Services 4.8% | ||
| Avis Budget Car Rental / Avis Budget Finance, 8.00%, 2/15/31 (3) | 510 | 502 |
| Herc Holdings, 5.50%, 7/15/27 (3) | 500 | 487 |
| Ritchie Bros Holdings, 6.75%, 3/15/28 (3) | 175 | 177 |
| Ritchie Bros Holdings, 7.75%, 3/15/31 (3) | 310 | 323 |
| Sabre GLBL, 11.25%, 12/15/27 (3) | 590 | 574 |
| Williams Scotsman, 7.375%, 10/1/31 (3) | 500 | 513 |
| 2,576 | ||
| Technology & Electronics 5.2% | ||
| Cloud Software Group, 8.25%, 6/30/32 (3) | 535 | 538 |
| McAfee, 7.375%, 2/15/30 (3) | 550 | 509 |
| Open Text, 6.90%, 12/1/27 (3) | 628 | 642 |
| Par/Shares | $ Value | |
| (Amounts in 000s) | ||
| Seagate HDD Cayman, 8.25%, 12/15/29 (3) | 220 | 235 |
| Seagate HDD Cayman, 8.50%, 7/15/31 (3) | 265 | 282 |
| Sensata Technologies, 4.00%, 4/15/29 (3) | 640 | 580 |
| 2,786 | ||
| Telecommunications 1.5% | ||
| Level 3 Financing, 10.50%, 4/15/29 (3) | 530 | 529 |
| Viasat, 6.50%, 7/15/28 (3) | 400 | 294 |
| 823 | ||
| Transportation 2.0% | ||
| American Airlines/AAdvantage, 5.75%, 4/20/29 (3) | 560 | 541 |
| VistaJet Malta Finance, 6.375%, 2/1/30 (3) | 520 | 417 |
| VistaJet Malta Finance, 9.50%, 6/1/28 (3) | 120 | 109 |
| 1,067 | ||
| Utility 3.6% | ||
| NRG Energy, VR, 10.25%, (3)(5)(6) | 432 | 470 |
| Talen Energy Supply, 8.625%, 6/1/30 (3) | 455 | 488 |
| Vistra, VR, 8.00%, (3)(5)(6) | 953 | 962 |
| 1,920 | ||
| Total Corporate Bonds (Cost $45,228) | 45,821 | |
| SHORT-TERM INVESTMENTS 1.4% | ||
| Money Market Funds 1.4% | ||
| T. Rowe Price Government Reserve Fund, 5.39% (7)(8) | 748 | 748 |
| Total Short-Term Investments (Cost $748) | 748 | |
| Total Investments in Securities 97.9% of Net Assets (Cost $51,992) | $52,606 | |
| ‡ | Shares are denominated in U.S. dollars unless otherwise noted. |
| (1) | Level 3 in fair value hierarchy. See Note 2. |
| (2) | All or a portion of this loan is unsettled as of May 31, 2024. The interest rate for unsettled loans will be determined upon settlement after period end. |
| (3) | Security was purchased pursuant to Rule 144A under the Securities Act of 1933 and may be resold in transactions exempt from registration only to qualified institutional buyers. Total value of such securities at period-end amounts to $41,520 and represents 77.3% of net assets. |
| (4) | Security has the ability to pay in-kind or pay in cash. When applicable, separate rates of such payments are disclosed. |
| (5) | Security is a fix-to-float security, which carries a fixed coupon until a certain date, upon which it switches to a floating rate. Reference rate and spread are provided if the rate is currently floating. |
| (6) | Perpetual security with no stated maturity date. |
| (7) | Seven-day yield |
| (8) | Affiliated Companies |
| 1M TSFR | One month term SOFR (Secured overnight financing rate) |
| 3M TSFR | Three month term SOFR (Secured overnight financing rate) |
| FRN | Floating Rate Note |
| PIK | Payment-in-kind |
| VR | Variable Rate; rate shown is effective rate at period-end. The rates for certain variable rate securities are not based on a published reference rate and spread but are determined by the issuer or agent and based on current market conditions. |
| Affiliate | Net Realized Gain (Loss) | Changes in Net Unrealized Gain/Loss | Investment Income |
| T. Rowe Price Government Reserve Fund | $— | $— | $83 |
| Totals | $—# | $— | $83+ |
| Supplementary Investment Schedule | ||||
| Affiliate | Value 5/31/23 | Purchase Cost | Sales Cost | Value 5/31/24 |
| T. Rowe Price Government Reserve Fund | $476 | ¤ | ¤ | $748 |
| Total | $748^ | |||
| # | Capital gain distributions from mutual funds represented $0 of the net realized gain (loss). |
| + | Investment income comprised $83 of dividend income and $0 of interest income. |
| ¤ | Purchase and sale information not shown for cash management funds. |
| ^ | The cost basis of investments in affiliated companies was $748. |
| Assets | |
| Investments in securities, at value (cost $51,992) | $52,606 |
| Interest and dividends receivable | 907 |
| Receivable for investment securities sold | 460 |
| Cash | 7 |
| Total assets | 53,980 |
| Liabilities | |
| Payable for investment securities purchased | 236 |
| Investment management and administrative fees payable | 25 |
| Total liabilities | 261 |
| NET ASSETS | $53,719 |
| Net assets consists of: | |
| Total distributable earnings (loss) | $645 |
| Paid-in capital applicable to 1,050,000 shares of $0.0001 par value capital stock outstanding; 4,000,000,000 shares authorized | 53,074 |
| NET ASSETS | $53,719 |
| NET ASSET VALUE PER SHARE | $51.16 |
| Year Ended | |
| 5/31/24 | |
| Investment Income (Loss) | |
| Income | |
| Interest | $3,382 |
| Dividend | 83 |
| Total income | 3,465 |
| Investment management and administrative expense | 223 |
| Net investment income | 3,242 |
| Realized and Unrealized Gain / Loss | |
| Net realized gain on securities | 15 |
| Change in net unrealized gain / loss on securities | 928 |
| Net realized and unrealized gain / loss | 943 |
| INCREASE IN NET ASSETS FROM OPERATIONS | $4,185 |
| Year Ended | 10/25/22 Through | ||
| 5/31/24 | 5/31/23 | ||
| Increase (Decrease) in Net Assets | |||
| Operations | |||
| Net investment income | $3,242 | $1,123 | |
| Net realized gain | 15 | 96 | |
| Change in net unrealized gain / loss | 928 | (314) | |
| Increase in net assets from operations | 4,185 | 905 | |
| Distributions to shareholders | |||
| Net earnings | (3,323) | (1,122) | |
| Capital share transactions* | |||
| Shares sold | 30,551 | 22,523 | |
| Increase in net assets from capital share transactions | 30,551 | 22,523 | |
| Net Assets | |||
| Increase during period | 31,413 | 22,306 | |
| Beginning of period | 22,306 | - | |
| End of period | $53,719 | $22,306 | |
| *Share information | |||
| Shares sold | 600 | 450 | |
| Increase in shares outstanding | 600 | 450 |
| ($000s) | Level 1 | Level 2 | Level 3 | Total Value |
| Assets | ||||
| Corporate Bonds | $— | $45,821 | $— | $45,821 |
| Bank Loans | — | 5,725 | 312 | 6,037 |
| Short-Term Investments | 748 | — | — | 748 |
| Total | $748 | $51,546 | $312 | $52,606 |
| ($000s) | ||
| May 31, | May 31, | |
| 2024 | 2023 | |
| Ordinary income (including short-term capital gains, if any) | $3,323 | $1,122 |
| ($000s) | |
| Cost of investments | $51,998 |
| Unrealized appreciation | $838 |
| Unrealized depreciation | (230) |
| Net unrealized appreciation (depreciation) | $608 |
| ($000s) | |
| Undistributed ordinary income | $15 |
| Undistributed long-term capital gain | 22 |
| Net unrealized appreciation (depreciation) | 608 |
| Total distributable earnings (loss) | $645 |
Item 8. Changes in and Disagreements with Accountants for Open-End Management Investment Companies.
Not applicable.
Item 9. Proxy Disclosures for Open-End Management Investment Companies.
Not applicable.
Item 10. Remuneration Paid to Directors, Officers, and Others of Open-End Management Investment Companies.
Remuneration paid to Directors is included in Item 7 of this Form N-CSR.
Item 11. Statement Regarding Basis for Approval of Investment Advisory Contract.
If applicable, see Item 7.
Item 12. Disclosure of Proxy Voting Policies and Procedures for Closed-End Management Investment Companies.
Not applicable.
Item 13. Portfolio Managers of Closed-End Management Investment Companies.
Not applicable.
Item 14. Purchases of Equity Securities by Closed-End Management Investment Company and Affiliated Purchasers.
Not applicable.
Item 15. Submission of Matters to a Vote of Security Holders.
There has been no change to the procedures by which shareholders may recommend nominees to the registrant’s board of directors.
Item 16. Controls and Procedures.
(a) The registrant’s principal executive officer and principal financial officer have evaluated the registrant’s disclosure controls and procedures within 90 days of this filing and have concluded that the registrant’s disclosure controls and procedures were effective, as of that date, in ensuring that information required to be disclosed by the registrant in this Form N-CSR was recorded, processed, summarized, and reported timely.
(b) The registrant’s principal executive officer and principal financial officer are aware of no change in the registrant’s internal control over financial reporting that occurred during the period covered by this report that has materially affected, or is reasonably likely to materially affect, the registrant’s internal control over financial reporting.
Item 17. Disclosure of Securities Lending Activities for Closed-End Management Investment Companies.
Not applicable.
Item 18. Recovery of Erroneously Awarded Compensation.
Not applicable.
Item 19. Exhibits.
| (a)(1) | The registrant’s code of ethics pursuant to Item 2 of Form N-CSR is attached. | |
| (2) | Listing standards relating to recovery of erroneously awarded compensation: not applicable. | |
| (3) | ||
| (b) | ||
SIGNATURES
Pursuant to the requirements of the Securities Exchange Act of 1934 and the Investment Company Act of 1940, the registrant has duly caused this report to be signed on its behalf by the undersigned, thereunto duly authorized.
| T. Rowe Price U.S. High Yield ETF | ||||
| By | /s/ David Oestreicher | |||
| David Oestreicher | ||||
| Principal Executive Officer | ||||
| Date | July 18, 2024 | |||
Pursuant to the requirements of the Securities Exchange Act of 1934 and the Investment Company Act of 1940, this report has been signed below by the following persons on behalf of the registrant and in the capacities and on the dates indicated.
| By | /s/ David Oestreicher | |||
| David Oestreicher | ||||
| Principal Executive Officer | ||||
| Date | July 18, 2024 | |||
| By | /s/ Alan S. Dupski | |||
| Alan S. Dupski | ||||
| Principal Financial Officer | ||||
| Date | July 18, 2024 | |||