UNITED STATES
SECURITIES AND EXCHANGE COMMISSION
Washington, D.C. 20549
FORM N-CSR
CERTIFIED SHAREHOLDER REPORT OF REGISTERED
MANAGEMENT INVESTMENT COMPANIES
Investment Company Act File Number: 811-23494
| T. Rowe Price Exchange-Traded Funds, Inc. |
|
| (Exact name of registrant as specified in charter) |
| |
| 100 East Pratt Street, Baltimore, MD 21202 |
|
| (Address of principal executive offices) |
| |
| David Oestreicher |
| 100 East Pratt Street, Baltimore, MD 21202 |
|
| (Name and address of agent for service) |
Registrant’s telephone number, including area code: (410) 345-2000
Date of fiscal year end: December 31
Date of reporting period: December 31, 2020
ANNUAL REPORT
December 31, 2020
| | T. ROWE PRICE |
| TDVG | Dividend Growth ETF |
| | For more insights from T. Rowe Price investment professionals, go to troweprice.com. |
T. ROWE PRICE DIVIDEND GROWTH ETF
HIGHLIGHTS
| ■ | The Dividend Growth ETF posted a solid 13.52% gain but lagged the performance of its benchmark, the S&P 500 Index, in the roughly five-month period since the fund’s inception on August 4, 2020, through December 31, 2020. |
| ■ | While the fund generated strong absolute returns, stock selection detracted from the portfolio’s relative performance. |
| ■ | The fund’s largest allocations at the end of the period were in the information technology, health care, and financials sectors. |
| ■ | We intend to seek out attractively valued companies that are well positioned to emerge from the coronavirus pandemic with lasting competitive advantages while avoiding firms that face secular challenges. |
Sign up for e-delivery of your statements, confirmations, and prospectuses or shareholder reports.
If you invest directly with T. Rowe Price, go to troweprice.com/paperless.
If you invest through an investment advisor, a bank, or a brokerage firm, please contact that organization and ask if it can provide electronic documentation.
It’s fast—receive your statements and
confirmations faster than U.S. mail.
It’s convenient—access your important account documents whenever you need them.
It’s secure—we protect your online accounts using “True Identity” to confirm new accounts and make verification faster and more secure.
It can save you money—where applicable,
T. Rowe Price passes on the cost savings to
fund holders.*
Log in to your account at troweprice.com for more information.
*Certain mutual fund accounts that are assessed an annual account service fee can also save money by switching to e-delivery.
T. ROWE PRICE DIVIDEND GROWTH ETF
CIO Market Commentary
Dear Shareholders
Nearly all major stock and bond indexes produced positive results during 2020 as markets recovered from the steep sell-off that resulted from the spread of the coronavirus. Extraordinary fiscal and monetary support from global governments and central banks helped spur the rebound, although the pandemic continued to pose significant public health and economic challenges as the year came to an end.
In the U.S., the large-cap Dow Jones Industrial Average and S&P 500 Index reached record highs, as did the technology-heavy Nasdaq Composite Index—a result that few would have predicted in late March after the benchmarks tumbled more than 30% as governments instituted lockdowns to try to halt the spread of the virus. Large-cap information technology and internet-related firms helped lead the rebound as they benefited from the work-from-home environment and an acceleration in demand for online services.
Within the S& P 500, the technology and consumer discretionary sectors were the top performers, and communication services and materials stocks also outperformed. Despite a late rally, the energy sector trailed with significant losses due to a plunge in oil prices.
Most equity markets outside the U.S. also performed well. Emerging markets outpaced developed markets, and Asian shares delivered strong results as China and other countries in the region proved relatively successful in containing the coronavirus.
Growth stocks significantly outpaced their value counterparts for the full year; however, value shares rallied late in the period. Positive vaccine news in November raised hopes for a return to normalcy in 2021 and boosted sectors that had been beaten down in the initial phases of the pandemic.
Within the fixed income universe, corporate bonds delivered strong results as the market easily absorbed a torrent of new issuance. After falling to record lows in March, intermediate- and longer-term Treasury yields ticked higher later in the year but remained very low by historical standards, a factor that encouraged investors to seek out riskier securities with higher return potential.
While investors had reason to cheer the market’s recovery, the global economic outlook remained unclear as the year came to an end. Most notable on the positive side was the start of vaccine distributions, which provided hope that the pandemic was in its final phase. In addition, Congress passed a $900 billion coronavirus relief package, supplementing the $2.4 trillion allocated to address
T. ROWE PRICE DIVIDEND GROWTH ETF
the crisis earlier in the year, and the Fed continued to pledge very accommodative monetary policies for the foreseeable future. Meanwhile, political uncertainty diminished with Joe Biden’s victory in the U.S. presidential election and the completion of a Brexit trade deal between the UK and the European Union.
On the negative side, concerns about a resurgence in virus hospitalizations led to new lockdowns and business restrictions in many countries, which in turn appeared to threaten economic recoveries. In the U.S., after a strong recovery in the summer and fall, the pace of hiring slowed late in the year, and household spending declined in November for the first time since April.
It was a remarkable 12-month period in many ways, but as far as markets are concerned, I can recall no calendar year that so starkly displayed evidence of both fear and greed. Fear emerged during the March sell-off and again in April as oil futures briefly traded in negative territory. Greed surfaced later as some assets seemed to continue to rally without fundamental support. Bitcoin rocketed to a record high of $29,000 by year-end, and the amount of money raised by initial public offerings also climbed to historic levels. While valuations are still attractive in some areas of the market, other sectors appear to have already priced in a strong rebound in earnings and are trading at elevated levels.
There are both risks and potential rewards in this environment, and we believe strong fundamental analysis and skilled active security selection will remain critical components of investment success.
Thank you for your continued confidence in T. Rowe Price.
Sincerely,
Robert Sharps
Group Chief Investment Officer
T. ROWE PRICE DIVIDEND GROWTH ETF
Management’s Discussion of Fund Performance
INVESTMENT OBJECTIVE
The fund seeks dividend income and long-term capital growth.
FUND COMMENTARY
How did the fund perform during the period?
The Dividend Growth ETF net asset value (NAV) and market price returned 13.52% in the period since the fund’s inception (August 4, 2020) through December 31, 2020. The portfolio underperformed its primary benchmark, the S& P 500 Index, and peer group, the Lipper Large-Cap Core Funds Index. However, the fund outperformed its style-specific, dividend growth-focused benchmark, the NASDAQ US Broad Dividend Achievers Index. (Past performance cannot guarantee future results.)
What factors influenced the fund’s performance?
We would like to welcome new investors to the fund. As you know, the T. Rowe
PERFORMANCE COMPARISON
| | |
| Period Ended 12/31/20 | Total Return
Since Inception
8/4/20 |
| | |
| Dividend Growth ETF (Based on Net Asset Value) | 13.52% |
| Dividend Growth ETF (At Market Price)* | 13.52 |
| S&P 500 Index | 14.40 |
| Lipper Large-Cap Core Funds Index | 14.46 |
*Market returns are based on the midpoint of the bid/ask spread at market close (typically, 4 p.m. ET) and do not represent returns an investor would have received if shares were traded at other times.
T. ROWE PRICE DIVIDEND GROWTH ETF
Price Dividend Growth ETF seeks to provide dividend income and long-term capital appreciation. We employ fundamental research and active bottom-up stock selection to construct a portfolio of high-quality, largely U.S.-based companies that we believe can grow their dividends over time. Our investment process focuses on identifying companies trading at attractive valuations with strong competitive advantages and durable business models that will allow for the compounding of earnings and dividends over time. We believe that well-timed investments in companies that pay and increase their dividends over time have a high probability of outperforming the broad U.S. market. Our strategy seeks to provide our shareholders with a growing stream of income and superior risk-adjusted returns.
Within the portfolio, stock selection and an underweight allocation to consumer discretionary holdings generated the best relative performance contribution. We leaned into holdings that had been, in our view, oversold on pandemic-related weakness. Given the uncertainties related to the coronavirus, we strategically built positions in high-quality specialty retailers; entertainment; and the hotels, restaurants, and leisure segments and were rewarded with solid gains in the period. Shares of off-price retailer Ross Stores traded sharply higher on positive vaccine news in early November, which gave investors more confidence that the economy will fully reopen in a few quarters’ time. (Please refer to the fund’s portfolio of investments for a complete list of our holdings and the amount each represents in the portfolio.)
Hilton Worldwide Holdings and Marriott International, the operators of global hotel, residential, and timeshare properties, also rallied on solid operational execution amid a challenging near-term environment. Although the recent resurgence in coronavirus infections is likely to be a near-term headwind for the travel/hotels segment, in our view, both high-quality hoteliers should benefit from their scale and optimism related to the prospects for an effective coronavirus vaccination rollout and solid operational execution amid a challenging environment.
Our communication services holdings contributed strong absolute and relative returns thanks to adept stock selection, although our underweight allocation (several of the mega-caps in the benchmark do not pay dividends) detracted. The sector is composed of a wide range of media and entertainment and telecommunication services companies. Shares of Walt Disney gained more than 50% in the period under review and was among the sector’s top relative performance contributors. We believe the media conglomerate and theme park operator has a long growth runway from current levels due to its superior intellectual property portfolio and its subscriber gains since the launch of Disney+.
T. ROWE PRICE DIVIDEND GROWTH ETF
The utilities sector detracted the most from relative results due to stock selection and our overweight allocation as the sector underperformed in the period under review. Atmos Energy was the largest detractor in the group. Its shares declined about 8%, leading us to systematically trim the position in the fourth quarter believing other opportunities in the sector held more promising long-term prospects.
The portfolio’s other poor relative performers came from a variety of other sectors. Our large positions in Becton, Dickinson & Company (health care), American Tower (real estate), and Kimberly-Clark (consumer staples) were also large relative performance detractors.
How is the fund positioned?
As shown in the Sector Diversification chart, the fund’s largest allocations at the end of the period were in information technology, health care, and financials, accounting for about half of the portfolio’s net assets. These are sectors where we believe we can find high-quality companies with sustainable competitive advantages, durable business models, attractive valuations, and potential for strong dividend growth.
Our sector allocations are primarily driven by our risk-aware, bottom-up stock selection process. We believe the portfolio is well positioned to deliver strong long-term returns by adhering to its investment philosophy of buying high-quality dividend growth companies at attractive valuations. We scour the market for high-quality companies that have opportunities to increase their market share or have barriers to entry around their business that will allow them to grow organically in a variety of market environments.
The fund’s largest positions are shown in the Twenty-Five Largest Holdings table on page 9. The information technology sector is our top absolute allocation but a significant underweight versus the benchmark. While we view many names in the sector as cyclical, we believe that our information technology companies are poised for strong secular growth. Our top allocations are in IT services and software companies, industries that are positioned to benefit from increasing demand for business technology solutions. Our largest holdings include Microsoft, Apple, and Visa. Although each holding generated a strong absolute contribution, our underweight to Apple hurt the portfolio’s relative returns.
The health care sector is among our largest allocations and a substantial overweight in the portfolio. We believe that select companies offer compelling value and stable long-term growth potential and can perform well in multiple economic scenarios. Our top health care holdings at the end of the reporting period were Danaher (equipment), UnitedHealth Group (managed care), and Thermo Fisher Scientific (life sciences).
T. ROWE PRICE DIVIDEND GROWTH ETF
What is portfolio management’s outlook?
The encouraging progress in distribution and the efficacy of coronavirus vaccines are positives for the year ahead. As pandemic conditions recede and economies reopen, a broader economic recovery is likely to benefit many of the sectors that have been hurt by social distancing initiatives. We are also mindful that aggressive monetary and fiscal stimulus measures, which have helped fuel the recovery in equities, will likely need to be continued. Federal Reserve Chairman Jerome Powell said that he would leave short-term interest rates near 0% until at least 2023. We believe that additional fiscal stimulus is probable and would help boost employment growth, consumer spending, and a broad economic recovery.
Going forward, we will continue to seek out attractively valued companies that are well positioned to emerge from the pandemic with lasting competitive advantages while avoiding firms that face secular challenges. In our opinion, further market gains will need to be driven mainly by earnings, given the price/earnings multiple expansion over the last 12 months. We remain positive
SECTOR DIVERSIFICATION
| | Percent of
Net Assets |
| | 12/31/20 |
| Information Technology | 22.2% |
| Health Care | 16.6 |
| Financials | 12.8 |
| Industrials and Business Services | 12.1 |
| Consumer Discretionary | 8.2 |
| Consumer Staples | 7.2 |
| Materials | 5.9 |
| Utilities | 4.4 |
| Communication Services | 3.4 |
| Real Estate | 2.5 |
| Energy | 1.4 |
| Other and Reserves | 3.3 |
| Total | 100.0% |
T. ROWE PRICE DIVIDEND GROWTH ETF
on the longer-term outlook for dividend-paying and dividend-growing stocks. The fundamentals underpinning our holdings remain sound. Although select areas of the market have run up sharply and appear richly priced, we are finding opportunities and value in utilities, real estate investment trusts, and consumer staples companies that have lagged the broad market. The portfolio is positioned for a modest economic growth environment, and, as always, we are looking to add durable, high-quality, dividend-growing companies in sectors that can outperform regardless of the economic environment, which has led to our overweight allocations in industrials and business services, materials, and health care.
Stock selection is expected to be our primary relative performance driver over the long term, and we are confident that our in-depth, independent research and collaborative investment approach can add value. We have relied on our disciplined investment philosophy and process through this period of volatility and heightened uncertainty. We intend to rely and remain focused on investing in high-quality dividend-paying companies with strong prospects for dividend growth. Market disruption in the months ahead could produce attractive buying opportunities for long-term investors, and we stand ready to add to the portfolio when valuations are appropriate.
The views expressed reflect the opinions of T. Rowe Price as of the date of this report and are subject to change based on changes in market, economic, or other conditions. These views are not intended to be a forecast of future events and are no guarantee of future results.
T. ROWE PRICE DIVIDEND GROWTH ETF
RISKS OF STOCK INVESTING
A fund’s share price can fall because of weakness in the stock or bond markets, a particular industry, or specific holdings. Stock markets can decline for many reasons, including adverse political or economic developments, changes in investor psychology, or heavy institutional selling. The prospects for an industry or company may deteriorate because of a variety of factors, including disappointing earnings or changes in the competitive environment. In addition, the investment manager’s assessment of companies held in a fund may prove incorrect, resulting in losses or poor performance even in rising markets. Funds investing in stocks with a dividend orientation may have somewhat lower potential for price appreciation than those concentrating on rapidly growing firms. Also, a company may reduce or eliminate its dividend.
BENCHMARK INFORMATION
Note: Lipper, a Thomson Reuters Company, is the source for all Lipper content reflected in these materials. Copyright 2021 © Refinitiv. All rights reserved. Any copying, republication or redistribution of Lipper content is expressly prohibited without the prior written consent of Lipper. Lipper shall not be liable for any errors or delays in the content, or for any actions taken in reliance thereon.
Note: The NASDAQ US Broad Dividend Achievers Index is composed of U.S. accepted securities with at least 10 consecutive years of increasing annual regular dividend payments.
Note: ©2021, S&P Global Market Intelligence. Reproduction of any information, data or material, including ratings (Content) in any form is prohibited except with the prior written permission of the relevant party. Such party, its affiliates and suppliers (Content Providers) do not guarantee the accuracy, adequacy, completeness, timeliness or availability of any Content and are not responsible for any errors or omissions (negligent or otherwise), regardless of the cause, or for the results obtained from the use of such Content. In no event shall Content Providers be liable for any damages, costs, expenses, legal fees, or losses (including lost income or lost profit and opportunity costs) in connection with any use of the Content.
T. ROWE PRICE DIVIDEND GROWTH ETF
PORTFOLIO HIGHLIGHTS
TWENTY-FIVE LARGEST HOLDINGS
| | Percent of
Net Assets |
| | 12/31/20 |
| Microsoft | 5.2% |
| Apple | 4.7 |
| Visa | 3.0 |
| JPMorgan Chase & Co. | 2.6 |
| Danaher | 2.4 |
| UnitedHealth Group | 2.1 |
| Thermo Fisher Scientific | 1.9 |
| Accenture | 1.8 |
| Mondelez International | 1.6 |
| Roper Technologies | 1.5 |
| Comcast | 1.5 |
| Texas Instruments | 1.5 |
| PepsiCo | 1.5 |
| Honeywell International | 1.4 |
| Chubb | 1.4 |
| Marsh & McLennan | 1.4 |
| Dollar General | 1.4 |
| Morgan Stanley | 1.4 |
| AbbVie | 1.4 |
| Walt Disney | 1.4 |
| NextEra Energy | 1.4 |
| Ross Stores | 1.3 |
| Ball | 1.3 |
| Stryker | 1.3 |
| Union Pacific | 1.2 |
| Total | 47.6% |
Note: The information shown does not reflect any exchange-traded funds (ETFs), cash reserves, or collateral for securities lending that may be held in the portfolio.
T. ROWE PRICE DIVIDEND GROWTH ETF
AVERAGE ANNUAL COMPOUND TOTAL RETURN
| Period Ended 12/31/20 | Since
Inception
8/4/20 |
| Dividend Growth ETF (Based on Net Asset Value) | 13.52%* |
| Dividend Growth ETF (At Market Price) | 13.52* |
The fund’s performance information represents only past performance and is not necessarily an indication of future results. Current performance may be lower or higher than the performance data cited. Share price, principal value, and return will vary, and you may have a gain or loss when you sell your shares. Market returns are based on the midpoint of the bid/ask spread at market close (typically, 4 p.m. ET) and do not represent returns an investor would receive if shares were traded at other times. For the most recent month-end performance, please visit our website (troweprice.com).
This table shows how the fund would have performed each year if its actual (or cumulative) returns had been earned at a constant rate. Average annual total return figures include changes in principal value, reinvested dividends, and capital gain distributions. Returns do not reflect taxes that the shareholder may pay on fund distributions or the redemption of fund shares. When assessing performance, investors should consider both short- and long-term returns.
*Returns for periods of less than one year are not annualized.
PREMIUM/DISCOUNT INFORMATION
The frequency at which the daily market prices were at a discount or premium to the fund’s net asset value is available on the fund’s website (troweprice.com).
EXPENSE RATIO
The expense ratio shown is as of the fund’s most recent prospectus. This number may vary from the expense ratio shown elsewhere in this report because it is based on a different time period and, if applicable, includes acquired fund fees and expenses but does not include fee or expense waivers.
T. ROWE PRICE DIVIDEND GROWTH ETF
FUND EXPENSE EXAMPLE
As a shareholder, you may incur two types of costs: (1) transaction costs, such as brokerage commissions on purchases and sales, and (2) ongoing costs, including management fees and other fund expenses. The following example is intended to help you understand your ongoing costs (in dollars) of investing in the fund and to compare these costs with the ongoing costs of investing in other funds. The example is based on an investment of $1,000 invested at the beginning of the most recent six-month period and held for the entire period.
Actual Expenses
The first line of the following table (Actual) provides information about actual account values and expenses based on the fund’s actual returns. You may use the information on this line, together with your account balance, to estimate the expenses that you paid over the period. Simply divide your account value by $1,000 (for example, an $8,600 account value divided by $1,000 = 8.6), then multiply the result by the number on the first line under the heading “Expenses Paid During Period” to estimate the expenses you paid on your account during this period.
Hypothetical Example for Comparison Purposes
The information on the second line of the table (Hypothetical) is based on hypothetical account values and expenses derived from the fund’s actual expense ratio and an assumed 5% per year rate of return before expenses (not the fund’s actual return). You may compare the ongoing costs of investing in the fund with other funds by contrasting this 5% hypothetical example and the 5% hypothetical examples that appear in the shareholder reports of the other funds. The hypothetical account values and expenses may not be used to estimate the actual ending account balance or expenses you paid for the period.
You should also be aware that the expenses shown in the table highlight only your ongoing costs and do not reflect any transaction costs, such as brokerage commissions paid on purchases and sales of shares. Therefore, the second line of the table is useful in comparing ongoing costs only and will not help you determine the relative total costs of owning different funds. To the extent a fund charges transaction costs, however, the total cost of owning that fund is higher.
T. ROWE PRICE DIVIDEND GROWTH ETF
FUND EXPENSE EXAMPLE (CONTINUED)
T. Rowe Price Dividend Growth ETF
| | Beginning
Account Value
8/5/201 | Ending
Account Value
12/31/20 | Expenses Paid
During Period
8/5/20 to 12/31/201,2 |
| Actual | $1,000.00 | $1,135.20 | $2.17 |
| | 7/1/201 | 12/31/20 | 7/1/20 to
12/31/201,3 |
| Hypothetical (assumes 5% return before expenses) | 1,000.00 | 1,022.60 | 2.54 |
| 1 | The actual expense example is based on the period since the fund’s start of operations on 8/5/20, one day after inception; the hypothetical expense example is based on the half-year period beginning 7/1/20, as required by the Securities Exchange Commission. |
| 2 | Expenses are equal to the fund’s annualized expense ratio for the period (0.50%), multiplied by the average account value over the period, multiplied by the number of days in the period (149), and divided by the days in the year (366) since the fund’s start of operations. |
| 3 | Expenses are equal to the fund’s annualized expense ratio for the period (0.50%), multiplied by the average account value over the period, multiplied by the number of days in the most recent fiscal half-year (184), and divided by the days in the year (366) to reflect the half-year period. |
T. ROWE PRICE DIVIDEND GROWTH ETF
For a share outstanding throughout the period
| | 8/4/20(1)
Through |
| | 12/31/20 |
| NET ASSET VALUE | |
| Beginning of period | $ 25.00 |
| Investment activities | |
| Net investment income(2) (3) | 0.14 |
| Net realized and unrealized gain/loss | 3.24 |
| Total from investment activities | 3.38 |
| Distributions | |
| Net Investment Income | (0.12) |
| NET ASSET VALUE | |
| End of period | $ 28.26 |
| Ratios/Supplemental Data |
| Total return, based on NAV(3) (4) | 13.52% |
Ratios to average net
assets:(3) | |
Gross expenses before
waivers/payments by
Price Associates | 0.50%(5) |
Net expenses after
waivers/payments by
Price Associates | 0.50%(5) |
| Net investment income | 1.31%(5) |
| Portfolio turnover rate(6) | 6.7% |
Net assets, end of period
(in thousands) | $ 37,020 |
| (1) | Inception date |
| (2) | Per share amounts calculated using average shares outstanding method. |
| (3) | See Note 5 for details to expense-related arrangements with Price Associates. |
| (4) | Total return reflects the rate that an investor would have earned on an investment in the fund during the period, assuming reinvestment of all distributions. Total return is not annualized for periods less than one year. |
| (5) | Annualized |
| (6) | Portfolio turnover excludes securities received or delivered through in-kind share transactions. |
The accompanying notes are an integral part of these financial statements.
T. ROWE PRICE DIVIDEND GROWTH ETF
December 31, 2020
| PORTFOLIO OF INVESTMENTS‡ | Shares | $ Value |
| (Cost and value in $000s) | | |
| COMMON STOCKS 96.7% |
| COMMUNICATION SERVICES 3.4% |
| Diversified Telecommunication Services 0.5% | | |
| AT&T | 6,120 | 176 |
| | | 176 |
| Entertainment 1.4% | | |
| Walt Disney (1) | 2,795 | 506 |
| | | 506 |
| Media 1.5% | | |
| Comcast, Class A | 10,615 | 556 |
| Fox, Class A | 412 | 12 |
| | | 568 |
| Total Communication Services | | 1,250 |
| CONSUMER DISCRETIONARY 8.2% |
| Hotels Restaurants & Leisure 3.3% | | |
| Hilton Worldwide Holdings | 2,556 | 284 |
| Las Vegas Sands | 2,444 | 146 |
| Marriott International, Class A | 1,622 | 214 |
| McDonald's | 1,700 | 365 |
| Yum! Brands | 2,027 | 220 |
| | | 1,229 |
| Multiline Retail 1.4% | | |
| Dollar General | 2,517 | 529 |
| | | 529 |
| Specialty Retail 2.9% | | |
| Home Depot | 1,555 | 413 |
| Ross Stores | 4,047 | 497 |
T. ROWE PRICE DIVIDEND GROWTH ETF
| | Shares | $ Value |
| (Cost and value in $000s) | | |
| Tractor Supply | 1,030 | 145 |
| | | 1,055 |
| Textiles, Apparel & Luxury Goods 0.6% | | |
| NIKE, Class B | 1,482 | 210 |
| | | 210 |
| Total Consumer Discretionary | | 3,023 |
| CONSUMER STAPLES 7.2% |
| Beverages 3.0% | | |
| Coca-Cola | 7,670 | 421 |
| Diageo, ADR | 740 | 117 |
| PepsiCo | 3,695 | 548 |
| | | 1,086 |
| Food & Staples Retailing 0.6% | | |
| Costco Wholesale | 577 | 217 |
| | | 217 |
| Food Products 2.2% | | |
| McCormick, SH | 2,542 | 243 |
| Mondelez International, Class A | 9,799 | 573 |
| | | 816 |
| Household Products 0.7% | | |
| Colgate-Palmolive | 2,178 | 186 |
| Kimberly-Clark | 626 | 85 |
| | | 271 |
| Tobacco 0.7% | | |
| Philip Morris International | 3,208 | 266 |
| | | 266 |
| Total Consumer Staples | | 2,656 |
T. ROWE PRICE DIVIDEND GROWTH ETF
| | Shares | $ Value |
| (Cost and value in $000s) | | |
| ENERGY 1.4% |
| Oil, Gas & Consumable Fuels 1.4% | | |
| EOG Resources | 4,651 | 232 |
| TC Energy | 1,985 | 81 |
| TOTAL SE, ADR | 5,079 | 213 |
| Total Energy | | 526 |
| FINANCIALS 12.8% |
| Banks 4.0% | | |
| JPMorgan Chase & Co. | 7,711 | 980 |
| PNC Financial Services Group | 1,370 | 204 |
| Wells Fargo & Co. | 9,886 | 298 |
| | | 1,482 |
| Capital Markets 3.6% | | |
| Charles Schwab | 6,660 | 353 |
| CME Group | 1,169 | 213 |
| Morgan Stanley | 7,609 | 521 |
| S&P Global | 750 | 247 |
| | | 1,334 |
| Consumer Finance 0.4% | | |
| American Express | 1,094 | 132 |
| | | 132 |
| Insurance 4.8% | | |
| Aon, Class A | 1,574 | 333 |
| Chubb | 3,446 | 530 |
| Marsh & McLennan | 4,530 | 530 |
| Progressive | 1,745 | 173 |
| Willis Towers Watson | 1,017 | 214 |
| | | 1,780 |
| Total Financials | | 4,728 |
T. ROWE PRICE DIVIDEND GROWTH ETF
| | Shares | $ Value |
| (Cost and value in $000s) | | |
| HEALTH CARE 16.6% |
| Biotechnology 1.4% | | |
| AbbVie | 4,797 | 514 |
| | | 514 |
| Health Care Equipment & Supplies 5.6% | | |
| Becton Dickinson & Co. | 1,618 | 405 |
| Danaher | 3,964 | 881 |
| Medtronic | 2,820 | 330 |
| Stryker | 1,905 | 467 |
| | | 2,083 |
| Health Care Providers & Services 2.8% | | |
| Cigna | 1,138 | 237 |
| CVS Health | 495 | 34 |
| UnitedHealth Group | 2,175 | 762 |
| | | 1,033 |
| Life Sciences Tools & Services 3.0% | | |
| Agilent Technologies | 3,401 | 403 |
| Thermo Fisher Scientific | 1,503 | 700 |
| | | 1,103 |
| Pharmaceuticals 3.8% | | |
| Eli Lilly & Co. | 1,288 | 218 |
| Johnson & Johnson | 2,555 | 402 |
| Merck & Co. | 1,552 | 127 |
| Pfizer | 6,476 | 238 |
| Viatris (1) | 282 | 5 |
| Zoetis | 2,478 | 410 |
| | | 1,400 |
| Total Health Care | | 6,133 |
T. ROWE PRICE DIVIDEND GROWTH ETF
| | Shares | $ Value |
| (Cost and value in $000s) | | |
| INDUSTRIALS & BUSINESS SERVICES 12.1% |
| Aerospace & Defense 0.7% | | |
| Howmet Aerospace | 796 | 23 |
| Northrop Grumman | 782 | 238 |
| | | 261 |
| Air Freight & Logistics 1.0% | | |
| United Parcel Service, Class B | 2,160 | 364 |
| | | 364 |
| Commercial Services & Supplies 1.3% | | |
| Cintas | 340 | 120 |
| Waste Connections | 3,391 | 348 |
| | | 468 |
| Electrical Equipment 0.2% | | |
| Rockwell Automation | 378 | 95 |
| | | 95 |
| Industrial Conglomerates 4.1% | | |
| General Electric | 38,707 | 418 |
| Honeywell International | 2,514 | 535 |
| Roper Technologies | 1,313 | 566 |
| | | 1,519 |
| Machinery 2.3% | | |
| Cummins | 616 | 140 |
| Deere | 554 | 149 |
| Fortive | 2,651 | 188 |
| Illinois Tool Works | 1,075 | 219 |
| PACCAR | 1,737 | 150 |
| | | 846 |
T. ROWE PRICE DIVIDEND GROWTH ETF
| | Shares | $ Value |
| (Cost and value in $000s) | | |
| Professional Services 0.7% | | |
| Equifax | 1,439 | 277 |
| | | 277 |
| Road & Rail 1.8% | | |
| JB Hunt Transport Services | 1,574 | 215 |
| Union Pacific | 2,101 | 437 |
| | | 652 |
| Total Industrials & Business Services | | 4,482 |
| INFORMATION TECHNOLOGY 22.2% |
| Electronic Equipment, Instruments & Components 1.5% | | |
| Amphenol, Class A | 1,817 | 238 |
| TE Connectivity | 2,374 | 287 |
| Vontier (1) | 299 | 10 |
| | | 535 |
| IT Services 7.2% | | |
| Accenture, Class A | 2,569 | 671 |
| Automatic Data Processing | 1,214 | 214 |
| Broadridge Financial Solutions | 1,699 | 260 |
| Fidelity National Information Services | 3,037 | 430 |
| Visa, Class A | 4,995 | 1,093 |
| | | 2,668 |
| Semiconductors & Semiconductor Equipment 3.6% | | |
| Applied Materials | 3,979 | 343 |
| Microchip Technology | 1,816 | 251 |
| QUALCOMM | 1,205 | 184 |
| Texas Instruments | 3,383 | 555 |
| | | 1,333 |
T. ROWE PRICE DIVIDEND GROWTH ETF
| | Shares | $ Value |
| (Cost and value in $000s) | | |
| Software 5.2% | | |
| Microsoft | 8,724 | 1,940 |
| | | 1,940 |
| Technology Hardware, Storage & Peripherals 4.7% | | |
| Apple | 13,160 | 1,746 |
| | | 1,746 |
| Total Information Technology | | 8,222 |
| MATERIALS 5.9% |
| Chemicals 3.3% | | |
| Air Products & Chemicals | 1,343 | 367 |
| Ecolab | 243 | 52 |
| Linde (1) | 1,137 | 300 |
| PPG Industries | 746 | 108 |
| RPM International | 2,230 | 202 |
| Sherwin-Williams | 270 | 198 |
| | | 1,227 |
| Containers & Packaging 2.6% | | |
| Avery Dennison | 1,841 | 286 |
| Ball | 5,289 | 493 |
| Sealed Air | 4,308 | 197 |
| | | 976 |
| Total Materials | | 2,203 |
| REAL ESTATE 2.5% |
| Equity Real Estate Investment Trusts 2.5% | | |
| American Tower, REIT | 1,819 | 409 |
| Crown Castle International, REIT | 1,836 | 292 |
| Equity Residential, REIT | 3,614 | 214 |
| Total Real Estate | | 915 |
T. ROWE PRICE DIVIDEND GROWTH ETF
| | Shares | $ Value |
| (Cost and value in $000s) | | |
| UTILITIES 4.4% |
| Electric Utilities 2.2% | | |
| American Electric Power | 2,484 | 207 |
| Eversource Energy | 1,472 | 127 |
| NextEra Energy | 6,512 | 503 |
| | | 837 |
| Gas Utilities 0.6% | | |
| Atmos Energy | 2,444 | 233 |
| | | 233 |
| Multi-Utilities 1.1% | | |
| Ameren | 1,200 | 93 |
| Sempra Energy | 2,415 | 308 |
| | | 401 |
| Water Utilities 0.5% | | |
| American Water Works | 1,119 | 172 |
| | | 172 |
| Total Utilities | | 1,643 |
| Total Common Stocks (Cost $32,578) | | 35,781 |
| SHORT-TERM INVESTMENTS 2.7% |
| Money Market Funds 2.7% | | |
| State Street Institutional U.S. Government Money Market Fund, 0.03% (2) | 1,015,685 | 1,016 |
| Total Short-Term Investments (Cost $1,016) | | 1,016 |
Total Investments in Securities
99.4% of Net Assets (Cost $33,594) | | $36,797 |
| ‡ | Shares are denominated in U.S. dollars unless otherwise noted. |
| (1) | Non-income producing. |
| (2) | Seven-day yield |
| ADR | American Depositary Receipts |
T. ROWE PRICE DIVIDEND GROWTH ETF
| REIT | A domestic Real Estate Investment Trust whose distributions pass-through with original tax character to the shareholder |
The accompanying notes are an integral part of these financial statements.
T. ROWE PRICE DIVIDEND GROWTH ETF
December 31, 2020
STATEMENT OF ASSETS AND LIABILITIES
($000s, except shares and per share amounts)
| Assets | |
| Investments in securities, at value (cost $33,594) | $36,797 |
| Receivable for shares sold | 283 |
| Receivable for investment securities sold | 197 |
| Dividends receivable | 41 |
| Other assets | 1 |
| Total assets | 37,319 |
| Liabilities | |
| Payable for investment securities purchased | 284 |
| Investment management and administrative fees payable | 14 |
| Other liabilities | 1 |
| Total liabilities | 299 |
| NET ASSETS | $37,020 |
| Net assets consists of: | |
| Total distributable earnings (loss) | 3,117 |
Paid-in capital applicable to 1,310,000 shares of $0.0001 par value
capital stock outstanding; 4,000,000,000 shares authorized | 33,903 |
| NET ASSETS | $37,020 |
| NET ASSET VALUE PER SHARE | $28.26 |
The accompanying notes are an integral part of these financial statements.
T. ROWE PRICE DIVIDEND GROWTH ETF
STATEMENT OF OPERATIONS
($000s)
| | 8/4/20
Through
12/31/20 |
| Investment Income (Loss) | |
| Dividend income (net of foreign withholding taxes $2) | $168 |
| Investment management and administrative expense | 46 |
| Net investment income | 122 |
| Realized and Unrealized Gain / Loss | |
| Net realized loss on securities | (90) |
| Change in net unrealized gain / loss on securities | 3,203 |
| Net realized and unrealized gain / loss | 3,113 |
| INCREASE IN NET ASSETS FROM OPERATIONS | $3,235 |
The accompanying notes are an integral part of these financial statements.
T. ROWE PRICE DIVIDEND GROWTH ETF
STATEMENT OF CHANGES IN NET ASSETS
($000s)
| | 8/4/20
Through
12/31/20 |
| Increase (Decrease) in Net Assets | |
| Operations | |
| Net investment income | $122 |
| Net realized loss | (90) |
| Change in net unrealized gain / loss | 3,203 |
| Increase in net assets from operations | 3,235 |
| Distributions to shareholders | |
| Net earnings | (118) |
| Capital share transactions* | |
| Shares sold | 33,903 |
| Increase in net assets from capital share transactions | 33,903 |
| Net Assets | |
| Increase during period | 37,020 |
| Beginning of period | - |
| End of period | $37,020 |
| *Share information | |
| Shares sold | 1,310 |
| Increase in shares outstanding | 1,310 |
The accompanying notes are an integral part of these financial statements.
T. ROWE PRICE DIVIDEND GROWTH ETF
NOTES TO FINANCIAL STATEMENTS
T. Rowe Price Exchange-Traded Funds, Inc. (the corporation) is registered under the Investment Company Act of 1940 (the 1940 Act). The Dividend Growth ETF (the fund) is a diversified, open-end management investment company established by the corporation. The fund incepted on August 4, 2020. The fund seeks to provide dividend income and long-term capital growth.
The fund is considered an actively-managed exchange-traded fund (ETF) that does not disclose its portfolio holdings daily, which is different from a traditional ETF and may create additional risks. In order to provide market participants with information on the fund’s investments, the fund will publish a “Proxy Portfolio” on its website daily. A Proxy Portfolio is a basket of securities that is designed to closely track the daily performance of the fund’s portfolio holdings. While the Proxy Portfolio includes some of the fund’s holdings, it is not the fund’s actual portfolio. The fund does disclose its full portfolio holdings on a quarterly basis, similar to mutual funds.
NOTE 1 – SIGNIFICANT ACCOUNTING POLICIES
Basis of Preparation
The fund is an investment company and follows accounting and reporting guidance in the Financial Accounting Standards Board (FASB) Accounting Standards Codification Topic 946 (ASC 946). The accompanying financial statements were prepared in accordance with accounting principles generally accepted in the United States of America (GAAP), including, but not limited to, ASC 946. GAAP requires the use of estimates made by management. Management believes that estimates and valuations are appropriate; however, actual results may differ from those estimates, and the valuations reflected in the accompanying financial statements may differ from the value ultimately realized upon sale or maturity.
Investment Transactions, Investment Income, and Distributions
Investment transactions are accounted for on the trade date basis. Income and expenses are recorded on the accrual basis. Realized gains and losses are reported on the identified cost basis. Income tax-related interest and penalties, if incurred, are recorded as income tax expense. Dividends received from other investment companies are reflected as dividend income; capital gain distributions are reflected as realized gain/loss. Dividend income and capital gain distributions are recorded on the ex-dividend date. Distributions from REITs are initially recorded as dividend income and, to the extent such represent a return of capital or capital gain for tax purposes, are reclassified when such information becomes
T. ROWE PRICE DIVIDEND GROWTH ETF
available. Non-cash dividends, if any, are recorded at the fair market value of the asset received. Distributions to shareholders are recorded on the ex-dividend date. Income distributions, if any, are declared and paid quarterly. A capital gain distribution may also be declared and paid by the fund annually. Dividends and distributions cannot be automatically reinvested in additional shares of the fund.
Capital Share Transactions
The fund issues and redeems shares at its net asset value (NAV) only with Authorized Participants and only in large blocks of 5,000 shares (each, a “Creation Unit”). Individual fund shares may not be purchased or redeemed directly with the fund. An Authorized Participant may purchase or redeem a Creation Unit of the fund each business day that the fund is open in exchange for the delivery of a designated portfolio of in-kind securities and/or cash. When purchasing or redeeming Creation Units, Authorized Participants are also required to pay a fixed purchase or redemption transaction fee as well as any applicable additional variable charge to defray the transaction cost to a fund.
Individual fund shares may be purchased and sold only on a national securities exchange through brokers. Shares are listed for trading on NYSE Arca, Inc. and because the shares will trade at market prices rather than NAV, shares may trade at prices greater than NAV (at a premium), at NAV, or less than NAV (at a discount).
Indemnification
In the normal course of business, the fund may provide indemnification in connection with its officers and directors, service providers, and/or private company investments. The fund’s maximum exposure under these arrangements is unknown; however, the risk of material loss is currently considered to be remote.
NOTE 2 – VALUATION
On each day that the NYSE Arca is open, the fund’s shares are ordinarily valued as of the close of regular trading (normally 4:00 p.m. Eastern time) (“NYSE Close”).
The fund’s financial instruments are valued and its NAV per share is computed at the NYSE Close. However, the NAV per share may be calculated at a time other than the normal close of the NYSE if trading on the NYSE is restricted, if the NYSE closes earlier, or as may be permitted by the SEC.
Security Valuation
The fund’s financial instruments are reported at fair value, which GAAP defines as the price that would be received to sell an asset or paid to transfer a liability in an orderly transaction between market participants at the measurement date. The T. Rowe Price
T. ROWE PRICE DIVIDEND GROWTH ETF
Valuation Committee (the Valuation Committee) is an internal committee that has been delegated certain responsibilities by the fund’s Board of Directors (the Board) to ensure that financial instruments are appropriately priced at fair value in accordance with GAAP and the 1940 Act. Subject to oversight by the Board, the Valuation Committee develops and oversees pricing-related policies and procedures and approves all fair value determinations. Specifically, the Valuation Committee establishes policies and procedures used in valuing financial instruments, including those which cannot be valued in accordance with normal procedures or using pricing vendors; determines pricing techniques, sources, and persons eligible to effect fair value pricing actions; evaluates the services and performance of the pricing vendors; oversees the pricing process to ensure policies and procedures are being followed; and provides guidance on internal controls and valuation-related matters. The Valuation Committee provides periodic reporting to the Board on valuation matters.
Various valuation techniques and inputs are used to determine the fair value of financial instruments. GAAP establishes the following fair value hierarchy that categorizes the inputs used to measure fair value:
Level 1 – quoted prices (unadjusted) in active markets for identical financial instruments that the fund can access at the reporting date
Level 2 – inputs other than Level 1 quoted prices that are observable, either directly or indirectly (including, but not limited to, quoted prices for similar financial instruments in active markets, quoted prices for identical or similar financial instruments in inactive markets, interest rates and yield curves, implied volatilities, and credit spreads)
Level 3 – unobservable inputs (including the fund’s own assumptions in determining fair value)
Observable inputs are developed using market data, such as publicly available information about actual events or transactions, and reflect the assumptions that market participants would use to price the financial instrument. Unobservable inputs are those for which market data are not available and are developed using the best information available about the assumptions that market participants would use to price the financial instrument. GAAP requires valuation techniques to maximize the use of relevant observable inputs and minimize the use of unobservable inputs. When multiple inputs are used to derive fair value, the financial instrument is assigned to the level within the fair value hierarchy based on the lowest-level input that is significant to the fair value of the financial instrument. Input levels are not necessarily an indication of the risk or liquidity associated with financial instruments at that level but rather the degree of judgment used in determining those values.
T. ROWE PRICE DIVIDEND GROWTH ETF
Valuation Techniques
Equity securities, including exchange-traded funds, listed or regularly traded on a securities exchange are valued at the last quoted sale price or, for certain markets, the official closing price at the time the valuations are made. A security that is listed or traded on more than one exchange is valued at the quotation on the exchange determined to be the primary market for such security. Listed securities not traded on a particular day are valued at the mean of the closing bid and asked prices for domestic securities.
Investments in mutual funds are valued at the mutual fund’s closing NAV per share on the day of valuation. Assets and liabilities other than financial instruments, including short-term receivables and payables, are carried at cost, or estimated realizable value, if less, which approximates fair value.
Investments for which market quotations or market-based valuations are not readily available or deemed unreliable are valued at fair value as determined in good faith by the Valuation Committee, in accordance with fair valuation policies and procedures. The objective of any fair value pricing determination is to arrive at a price that could reasonably be expected from a current sale. Financial instruments fair valued by the Valuation Committee are primarily private placements, restricted securities, warrants, rights, and other securities that are not publicly traded. Factors used in determining fair value vary by type of investment and may include market or investment specific considerations. The Valuation Committee typically will afford greatest weight to actual prices in arm’s length transactions, to the extent they represent orderly transactions between market participants, transaction information can be reliably obtained, and prices are deemed representative of fair value. However, the Valuation Committee may also consider other valuation methods such as market-based valuation multiples; a discount or premium from market value of a similar, freely traded security of the same issuer; discounted cash flows; yield to maturity; or some combination. Fair value determinations are reviewed on a regular basis and updated as information becomes available, including actual purchase and sale transactions of the investment. Because any fair value determination involves a significant amount of judgment, there is a degree of subjectivity inherent in such pricing decisions, and fair value prices determined by the Valuation Committee could differ from those of other market participants.
Valuation Inputs
On December 31, 2020, all of the fund’s financial instruments were classified as Level 1 based on the inputs used to determine their fair values.
T. ROWE PRICE DIVIDEND GROWTH ETF
NOTE 3 – OTHER INVESTMENT TRANSACTIONS
Purchases and sales of portfolio securities excluding in-kind transactions and short-term securities aggregated $16,106,000 and $1,606,000, respectively, for the year ended December 31, 2020. Portfolio securities received or delivered through in-kind transactions aggregated $18,170,000 and $0, respectively, for the period ended December 31, 2020.
NOTE 4 – FEDERAL INCOME TAXES
No provision for federal income taxes is required since the fund intends to qualify as a regulated investment company under Subchapter M of the Internal Revenue Code and distribute to shareholders all of its taxable income and gains. Distributions determined in accordance with federal income tax regulations may differ in amount or character from net investment income and realized gains for financial reporting purposes.
The fund files U.S. federal, state, and local tax returns as required. The fund’s tax returns are subject to examination by the relevant tax authorities until expiration of the applicable statute of limitations, which is generally three years after the filing of the tax return but which can be extended to six years in certain circumstances.
Financial reporting records are adjusted for permanent book/tax differences to reflect tax character but are not adjusted for temporary differences.
Distributions during the period ended December 31, 2020, totaled $118,000, and were characterized as ordinary income for tax purposes. At December 31, 2020, the tax-basis cost of investments including derivatives, and components of net assets were as follows:
| ($000s) | |
| Cost of investments | $33,685 |
| Unrealized appreciation | $3,245 |
| Unrealized depreciation | (133) |
| Net unrealized appreciation (depreciation) | 3,112 |
| Undistributed ordinary income | 5 |
| Paid-in capital | 33,903 |
| Net assets | $37,020 |
The difference between book-basis and tax-basis net unrealized appreciation (depreciation) is attributable to the deferral of losses from wash sales for tax purposes.
T. ROWE PRICE DIVIDEND GROWTH ETF
The fund intends to retain realized gains to the extent of available capital loss carryforwards. Net realized capital losses may be carried forward indefinitely to offset future realized capital gains. As of December 31, 2020, the fund had less than $1,000 of available capital loss carryforwards.
NOTE 5 – RELATED PARTY TRANSACTIONS
The fund is managed by T. Rowe Price Associates, Inc. (Price Associates), a wholly owned subsidiary of T. Rowe Price Group, Inc. (Price Group). The investment management and administrative agreement between the fund and Price Associates provides for an all-inclusive annual fee equal to 0.50% of the fund’s average daily net assets. The fee is computed daily and paid monthly. The all-inclusive fee covers investment management services and ordinary, recurring operating expenses, but does not cover interest and borrowing expenses; taxes; brokerage commissions and other transaction costs; fund proxy expenses; and nonrecurring expenses. All costs related to organization and offering of the fund are borne by Price Associates.
As of December 31, 2020, T. Rowe Price Group, Inc., or its wholly owned subsidiaries, owned 600,000 shares of the fund, representing 46% of the fund’s net assets.
The fund may participate in securities purchase and sale transactions with other funds or accounts advised by Price Associates (cross trades), in accordance with procedures adopted by the fund’s Board and Securities and Exchange Commission rules, which require, among other things, that such purchase and sale cross trades be effected at the independent current market price of the security. During the period ended December 31, 2020, the aggregate value of purchases and sales cross trades with other funds or accounts advised by Price Associates was less than 1% of the fund’s net assets as of December 31, 2020.
Price Associates has voluntarily agreed to reimburse the fund from its own resources on a monthly basis for the cost of investment research embedded in the cost of the fund’s securities trades. This agreement may be rescinded at any time. For the period ended December 31, 2020, this reimbursement amounted to less than $1,000.
NOTE 6 – OTHER MATTERS
Unpredictable events such as environmental or natural disasters, war, terrorism, pandemics, outbreaks of infectious diseases, and similar public health threats may significantly affect the economy and the markets and issuers in which a fund invests. Certain events may cause instability across global markets, including reduced liquidity and
T. ROWE PRICE DIVIDEND GROWTH ETF
disruptions in trading markets, while some events may affect certain geographic regions, countries, sectors, and industries more significantly than others, and exacerbate other pre-existing political, social, and economic risks. In 2020, a novel strain of coronavirus (COVID-19) resulted in disruptions to global business activity and caused significant volatility and declines in global financial markets.
These types of events, such as the global pandemic caused by COVID-19, may also cause widespread fear and uncertainty, and result in, among other things: enhanced health screenings, quarantines, cancellations, and travel restrictions, including border closings; disruptions to business operations, supply chains and customer activity; exchange trading suspensions and closures, and overall reduced liquidity of securities, derivatives, and commodities trading markets; reductions in consumer demand and economic output; and significant challenges in healthcare service preparation and delivery. The fund could be negatively impacted if the value of a portfolio holding were harmed by such political or economic conditions or events. In addition, the operations of the fund, its investment advisers, and the fund’s service providers may be significantly impacted, or even temporarily halted, as a result of any impairment to their information technology and other operational systems, extensive employee illnesses or unavailability, government quarantine measures, and restrictions on travel or meetings and other factors related to public emergencies.
Governmental and quasi-governmental authorities and regulators have in the past responded to major economic disruptions with a variety of significant fiscal and monetary policy changes, including but not limited to, direct capital infusions into companies, new monetary programs, and dramatically lower interest rates. An unexpected or quick reversal of these policies, or the ineffectiveness of these policies, could negatively impact overall investor sentiment and further increase volatility in securities markets. The impact of this outbreak has adversely affected the economies of many nations and the entire global economy and may impact individual issuers and capital markets in ways that cannot be foreseen. Other infectious illness outbreaks that may arise in the future could have similar or other unforeseen effects. The duration of this outbreak or others and their effects cannot be determined with certainty.
T. ROWE PRICE DIVIDEND GROWTH ETF
REPORT OF INDEPENDENT REGISTERED PUBLIC ACCOUNTING FIRM
To the Board of Directors of T. Rowe Price Exchange-Traded Funds, Inc. and Shareholders of T. Rowe Price Dividend Growth ETF
Opinion on the Financial Statements
We have audited the accompanying statement of assets and liabilities, including the portfolio of investments, of T. Rowe Price Dividend Growth ETF (one of the funds constituting T. Rowe Price Exchange-Traded Funds, Inc., referred to hereafter as the "Fund") as of December 31, 2020, and the related statements of operations and changes in net assets, including the related notes, and the financial highlights for the period August 4, 2020 (Inception) through December 31, 2020 (collectively referred to as the “financial statements”). In our opinion, the financial statements present fairly, in all material respects, the financial position of the Fund as of December 31, 2020, and the results of its operations, changes in its net assets, and the financial highlights for the period August 4, 2020 (Inception) through December 31, 2020 in conformity with accounting principles generally accepted in the United States of America.
Basis for Opinion
These financial statements are the responsibility of the Fund’s management. Our responsibility is to express an opinion on the Fund’s financial statements based on our audit. We are a public accounting firm registered with the Public Company Accounting Oversight Board (United States) (PCAOB) and are required to be independent with respect to the Fund in accordance with the U.S. federal securities laws and the applicable rules and regulations of the Securities and Exchange Commission and the PCAOB.
We conducted our audit of these financial statements in accordance with the standards of the PCAOB. Those standards require that we plan and perform the audit to obtain reasonable assurance about whether the financial statements are free of material misstatement, whether due to error or fraud.
T. ROWE PRICE DIVIDEND GROWTH ETF
REPORT OF INDEPENDENT REGISTERED PUBLIC ACCOUNTING FIRM
(CONTINUED)
Our audit included performing procedures to assess the risks of material misstatement of the financial statements, whether due to error or fraud, and performing procedures that respond to those risks. Such procedures included examining, on a test basis, evidence regarding the amounts and disclosures in the financial statements. Our audit also included evaluating the accounting principles used and significant estimates made by management, as well as evaluating the overall presentation of the financial statements. Our procedures included confirmation of securities owned as of December 31, 2020 by correspondence with the custodian and brokers; when replies were not received from brokers, we performed other auditing procedures. We believe that our audit provides a reasonable basis for our opinion.
PricewaterhouseCoopers LLP
Baltimore, Maryland
February 19, 2021
We have served as the auditor of one or more investment companies in the T. Rowe Price group of investment companies since 1973.
T. ROWE PRICE DIVIDEND GROWTH ETF
TAX INFORMATION (UNAUDITED) FOR THE TAX YEAR ENDED 12/31/20
We are providing this information as required by the Internal Revenue Code. The amounts shown may differ from those elsewhere in this report because of differences between tax and financial reporting requirements. The fund’s distributions to shareholders included:
For taxable non-corporate shareholders, $159,000 of the fund’s income represents qualified dividend income subject to a long-term capital gains tax rate of not greater than 20%.
For corporate shareholders, $137,000 of the fund’s income qualifies for the dividends received deduction.
INFORMATION ON PROXY VOTING POLICIES, PROCEDURES, AND RECORDS
A description of the policies and procedures used by T. Rowe Price funds and portfolios to determine how to vote proxies relating to portfolio securities is available in each fund’s Statement of Additional Information. You may request this document by calling 1-800-638-5660 or by accessing the SEC’s website, sec.gov.
The description of our proxy voting policies and procedures is also available on our corporate website. To access it, please visit the following Web page:
https://www.troweprice.com/corporate/en/utility/policies.html
Scroll down to the section near the bottom of the page that says, “Proxy Voting Policies.” Click on the Proxy Voting Policies link in the shaded box.
Each fund’s most recent annual proxy voting record is available on our website and through the SEC’s website. To access it through T. Rowe Price, visit the website location shown above, and scroll down to the section near the bottom of the page that says, “Proxy Voting Records.” Click on the Proxy Voting Records link in the shaded box.
HOW TO OBTAIN QUARTERLY PORTFOLIO HOLDINGS
The fund files a complete schedule of portfolio holdings with the Securities and Exchange Commission (SEC) for the first and third quarters of each fiscal year as an exhibit to its reports on Form N-PORT. The fund’s Form N-PORT is available electronically on the SEC’s website (sec.gov).
T. ROWE PRICE DIVIDEND GROWTH ETF
ABOUT THE FUND’S DIRECTORS AND OFFICERS
Your fund is overseen by a Board of Directors (Board) that meets regularly to review a wide variety of matters affecting or potentially affecting the fund, including performance, investment programs, compliance matters, advisory fees and expenses, service providers, and business and regulatory affairs. The Board elects the fund’s officers, who are listed in the final table. At least 75% of the Board’s members are considered to be independent, i.e., not “interested persons” as defined in Section 2(a)(19) of the 1940 Act, of the Boards of T. Rowe Price Associates, Inc. (T. Rowe Price), and its affiliates; “interested” directors and officers are employees of T. Rowe Price. The business address of each director and officer is 100 East Pratt Street, Baltimore, Maryland 21202. The Statement of Additional Information includes additional information about the fund directors and is available without charge by calling a T. Rowe Price representative at 1-800-638-5660.
INDEPENDENT DIRECTORS(a)
Name
(Year of Birth)
Year Elected
[Number of T. Rowe Price
Portfolios Overseen] | Principal Occupation(s) and Directorships of Public Companies and
Other Investment Companies During the Past Five Years |
Teresa Bryce Bazemore(b)
(1959)
2018
[190] | President, Radian Guaranty (2008 to 2017); Chief Executive Officer,
Bazemore Consulting LLC (2018 to present); Director, Chimera
Investment Corporation (2017 to present); Director, Federal Home Loan
Bank of Pittsburgh (2017 to February 2019) |
Ronald J. Daniels
(1959)
2018
[190] | President, The Johns Hopkins University(b) and Professor, Political Science Department, The Johns Hopkins University (2009 to present); Director, Lyndhurst Holdings (2015 to present); Director, BridgeBio Pharma, Inc. (2020 to present) |
Bruce W. Duncan
(1951)
2013
[190] | President, Chief Executive Officer, and Director, CyrusOne, Inc. (2020 to present); Chief Executive Officer and Director (2009 to 2016), Chairman of the Board (2016 to 2020), and President (2009 to 2016), First Industrial Realty Trust, owner and operator of industrial properties; Chairman of the Board (2005 to 2016) and Director (1999 to 2016), Starwood Hotels & Resorts, a hotel and leisure company; Member, Investment Company Institute Board of Governors (2017 to 2019); Member, Independent Directors Council Governing Board (2017 to 2019); Senior Advisor, KKR (2018 to present); Director, Boston Properties (2016 to present); Director, Marriott International, Inc. (2016 to 2020) |
Robert J. Gerrard, Jr.
(1952)
2012
[190] | Advisory Board Member, Pipeline Crisis/Winning Strategies, a
collaborative working to improve opportunities for young African
Americans (1997 to 2016); Chairman of the Board, all funds
(since July 2018) |
T. ROWE PRICE DIVIDEND GROWTH ETF
INDEPENDENT DIRECTORS(a) (CONTINUED)
Name
(Year of Birth)
Year Elected
[Number of T. Rowe Price
Portfolios Overseen] | Principal Occupation(s) and Directorships of Public Companies and
Other Investment Companies During the Past Five Years |
Paul F. McBride
(1956)
2013
[190] | Advisory Board Member, Vizzia Technologies (2015 to present); Board
Member, Dunbar Armored (2012 to 2018) |
Cecilia E. Rouse, Ph.D.
(1963)
2012
[190] | Dean, Princeton School of Public and International Affairs (2012 to present); Professor and Researcher, Princeton University (1992 to present); Director of Education Studies Committee, MDRC, a nonprofit education and social policy research organization (2011to 2020); Member, National Academy of Education (2010 to present); Board Member, National Bureau of Economic Research (2011 to present); Board Member of the Council on Foreign Relations (2018 to present); Board Member, The Pennington School (2017 to present); Board Member, the University of Rhode Island (2020 to present); Chair of Committee on the Status of Minority Groups in the Economic Profession of the American Economic Association (2012 to 2018); Vice President (2015 to 2016) and Board Member (2018 to present), American Economic Association |
John G. Schreiber
(1946)
2001
[190] | Owner/President, Centaur Capital Partners, Inc., a real estate investment company (1991 to present); Cofounder, Partner, and Cochairman of the Investment Committee, Blackstone Real Estate Advisors, L.P. (1992 to 2015); Director, Blackstone Mortgage Trust, a real estate finance company (2012 to 2016); Director and Chairman of the Board, Brixmor Property Group, Inc. (2013 to present); Director, Hilton Worldwide (2007 to present); Director, Hudson Pacific Properties (2014 to 2016); Director, Invitation Homes (2014 to 2017); Director, JMB Realty Corporation (1980 to present) |
T. ROWE PRICE DIVIDEND GROWTH ETF
INTERESTED DIRECTORS(a)
Name
(Year of Birth)
Year Elected*
[Number of T. Rowe Price
Portfolios Overseen] | Principal Occupation(s) and Directorships of Public Companies and
Other Investment Companies During the Past Five Years |
David Oestreicher
(1967)
2018
[190] | General Counsel, Vice President, and Secretary, T. Rowe Price Group, Inc.; Chairman of the Board, Chief Executive Officer, President, and Secretary, T. Rowe Price Trust Company; Director, Vice President, and Secretary, T. Rowe Price Investment Services, Inc.; T. Rowe Price Retirement Plan Services, Inc., and T. Rowe Price Services, Inc., Vice President and Secretary, T. Rowe Price, T. Rowe Price International;
Vice President, T. Rowe Price Hong Kong (Price Hong Kong), T. Rowe Price Japan (Price Japan) and T. Rowe Price Singapore (Price Singapore); Principal Executive Officer and Executive Vice President, all funds |
Robert W. Sharps, CFA, CPA
(1971)
2017
[190] | Director and Vice President, T. Rowe Price; Vice President, T. Rowe
Price Group, Inc., and T. Rowe Price Trust Company; President,
Exchange-Traded Funds, Inc. |
(a)All information about the interested directors was current as of December 31, 2019, unless otherwise indicated, except for the number of portfolios overseen, which is current as of the date of this report.
*Each interested director serves until retirement, resignation, or election of a successor.
OFFICERS
Name (Year of Birth)
Position Held With Exchange-Traded
Funds, Inc. | Principal Occupation(s) |
Darrell N. Braman (1963)
Vice President | Vice President, Price Hong Kong, Price Singapore, T. Rowe Price, T. Rowe Price Group, Inc., T. Rowe Price International, T. Rowe Price Investment Services, Inc., and T. Rowe Price Services, Inc. |
Timothy Coyne (1967)
Executive Vice President | Vice President, T. Rowe Price and T. Rowe Price Group, Inc. |
Alan S. Dupski, CPA (1982)
Principal Financial Officer, Vice
President, and Treasurer | Vice President, T. Rowe Price, T. Rowe Price Group, Inc., and T. Rowe Price Trust Company |
Joseph B. Fath, CPA (1971)
Executive Vice President | Vice President, T. Rowe Price, T. Rowe Price Group, Inc., and T. Rowe Price Trust Company |
John R. Gilner (1961)
Chief Compliance Officer | Chief Compliance Officer and Vice President, T. Rowe Price; Vice President, T. Rowe Price Group, Inc., and T. Rowe Price Investment Services, Inc. |
T. ROWE PRICE DIVIDEND GROWTH ETF
OFFICERS (CONTINUED)
Name (Year of Birth)
Position Held With Exchange-Traded
Funds, Inc. | Principal Occupation(s) |
Gary J. Greb (1961)
Vice President | Vice President, T. Rowe Price, T. Rowe Price International, and T. Rowe Price Trust Company |
Thomas J. Huber, CFA (1966)
Executive Vice President | Vice President, T. Rowe Price, T. Rowe Price Group, Inc., and T. Rowe Price Trust Company |
Paul J. Krug, CPA (1964)
Vice President | Vice President, T. Rowe Price, T. Rowe Price Group, Inc., and T. Rowe Price Trust Company |
John D. Linehan, CFA (1965)
Executive Vice President | Vice President, T. Rowe Price, T. Rowe Price Group, Inc., and T. Rowe Price Trust Company |
Fran M. Pollack-Matz (1961)
Vice President and Secretary | Vice President, T. Rowe Price and T. Rowe Price Group, Inc. |
Larry J. Puglia, CFA, CPA (1960)
Executive Vice President | Vice President, T. Rowe Price, T. Rowe Price Group, Inc., and T. Rowe Price Trust Company |
Shannon H. Rauser (1987)
Assistant Secretary | Assistant Vice President, T. Rowe Price |
Megan Warren (1968)
Vice President | Vice President, T. Rowe Price, T. Rowe Price Group, Inc., T. Rowe Price Retirement Plan Services, Inc., T. Rowe Price Services, Inc., and T. Rowe Price Trust Company; formerly, Executive Director, JPMorgan Chase (to 2017) |
Unless otherwise noted, officers have been employees of T. Rowe Price or T. Rowe Price International for at least 5 years.
This page intentionally left blank.
This page intentionally left blank.
This page intentionally left blank.
This page intentionally left blank.
This page intentionally left blank.
This page intentionally left blank.
100 East Pratt Street
Baltimore, MD 21202
Call 1-800-638-5660 to request a prospectus or summary prospectus; each includes investment objectives, risks, fees, expenses, and other information that you should read and consider carefully before investing.
T. Rowe Price Investment Services, Inc.
Item 1. (b) Notice pursuant to Rule 30e-3.
Not applicable.
Item 2. Code of Ethics.
The registrant has adopted a code of ethics, as defined in Item 2 of Form N-CSR, applicable to its principal executive officer, principal financial officer, principal accounting officer or controller, or persons performing similar functions. A copy of this code of ethics is filed as an exhibit to this Form N-CSR. No substantive amendments were approved or waivers were granted to this code of ethics during the period covered by this report.
Item 3. Audit Committee Financial Expert.
The registrant’s Board of Directors/Trustees has determined that Mr. Bruce W. Duncan qualifies as an audit committee financial expert, as defined in Item 3 of Form N-CSR. Mr. Duncan is considered independent for purposes of Item 3 of Form N-CSR.
Item 4. Principal Accountant Fees and Services.
(a) – (d) Aggregate fees billed for the last two fiscal years for professional services rendered to, or on behalf of, the registrant by the registrant’s principal accountant were as follows:
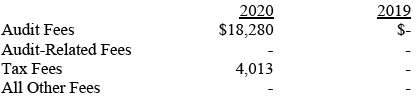
Audit fees include amounts related to the audit of the registrant’s annual financial statements and services normally provided by the accountant in connection with statutory and regulatory filings. Audit-related fees include amounts reasonably related to the performance of the audit of the registrant’s financial statements and specifically include the issuance of a report on internal controls and, if applicable, agreed-upon procedures related to fund acquisitions. Tax fees include amounts related to services for tax compliance, tax planning, and tax advice. The nature of these services specifically includes the review of distribution calculations and the preparation of Federal, state, and excise tax returns. All other fees include the registrant’s pro-rata share of amounts for agreed-upon procedures in conjunction with service contract approvals by the registrant’s Board of Directors/Trustees.
(e)(1) The registrant’s audit committee has adopted a policy whereby audit and non-audit services performed by the registrant’s principal accountant for the registrant, its investment adviser, and any entity controlling, controlled by, or under common control with the investment adviser that provides ongoing services to the registrant require pre-approval in advance at regularly scheduled audit committee meetings. If such a service is required between regularly scheduled audit committee meetings, pre-approval may be authorized by one audit committee member with ratification at the next scheduled audit committee meeting. Waiver of pre-approval for audit or non-audit services requiring fees of a de minimis amount is not permitted.
(2) No services included in (b) – (d) above were approved pursuant to paragraph (c)(7)(i)(C) of Rule 2-01 of Regulation S-X.
(f) Less than 50 percent of the hours expended on the principal accountant’s engagement to audit the registrant’s financial statements for the most recent fiscal year were attributed to work performed by persons other than the principal accountant’s full-time, permanent employees.
(g) The aggregate fees billed for the most recent fiscal year and the preceding fiscal year by the registrant’s principal accountant for non-audit services rendered to the registrant, its investment adviser, and any entity controlling, controlled by, or under common control with the investment adviser that provides ongoing services to the registrant were $3,781,000 and $3,227,000, respectively.
(h) All non-audit services rendered in (g) above were pre-approved by the registrant’s audit committee. Accordingly, these services were considered by the registrant’s audit committee in maintaining the principal accountant’s independence.
Item 5. Audit Committee of Listed Registrants.
(a) The Audit Committee is a separately-designated standing audit committee in accordance with Section 3(a)(58)(A) of the Securities Exchange Act of 1934. As of December 31, 2020, the members of the Audit Committee were Teresa Bryce Bazemore, Ronald J. Daniels, Robert J. Gerrard, Jr., and John G. Schreiber.
(b) N/A
Item 6. Investments.
(a) Not applicable. The complete schedule of investments is included in Item 1 of this Form N-CSR.
(b) Not applicable.
Item 7. Disclosure of Proxy Voting Policies and Procedures for Closed-End Management Investment Companies.
Not applicable.
Item 8. Portfolio Managers of Closed-End Management Investment Companies.
Not applicable.
Item 9. Purchases of Equity Securities by Closed-End Management Investment Company and Affiliated Purchasers.
Not applicable.
Item 10. Submission of Matters to a Vote of Security Holders.
There has been no change to the procedures by which shareholders may recommend nominees to the registrant’s board of directors.
Item 11. Controls and Procedures.
(a) The registrant’s principal executive officer and principal financial officer have evaluated the registrant’s disclosure controls and procedures within 90 days of this filing and have concluded that the registrant’s disclosure controls and procedures were effective, as of that date, in ensuring that information required to be disclosed by the registrant in this Form N-CSR was recorded, processed, summarized, and reported timely.
(b) The registrant’s principal executive officer and principal financial officer are aware of no change in the registrant’s internal control over financial reporting that occurred during the period covered by this report that has materially affected, or is reasonably likely to materially affect, the registrant’s internal control over financial reporting.
Item 12. Disclosure of Securities Lending Activities for Closed-End Management Investment Companies.
Not applicable.
Item 13. Exhibits.
(a)(1) The registrant’s code of ethics pursuant to Item 2 of Form N-CSR is attached.
(2) Separate certifications by the registrant's principal executive officer and principal financial officer, pursuant to Section 302 of the Sarbanes-Oxley Act of 2002 and required by Rule 30a-2(a) under the Investment Company Act of 1940, are attached.
(3) Written solicitation to repurchase securities issued by closed-end companies: not applicable.
(b) A certification by the registrant’s principal executive officer and principal financial officer, pursuant to Section 906 of the Sarbanes-Oxley Act of 2002 and required by Rule 30a-2(b) under the Investment Company Act of 1940, is attached.
SIGNATURES
Pursuant to the requirements of the Securities Exchange Act of 1934 and the Investment Company Act of 1940, the registrant has duly caused this report to be signed on its behalf by the undersigned, thereunto duly authorized.
T. Rowe Price Exchange-Traded Funds, Inc.
| By | | /s/ David Oestreicher |
| | | David Oestreicher |
| | | Principal Executive Officer |
| |
| Date | | February 19, 2021 | | | | |
Pursuant to the requirements of the Securities Exchange Act of 1934 and the Investment Company Act of 1940, this report has been signed below by the following persons on behalf of the registrant and in the capacities and on the dates indicated.
| By | | /s/ David Oestreicher |
| | | David Oestreicher |
| | | Principal Executive Officer |
| |
| Date | | February 19, 2021 | | | | |
| |
| |
| By | | /s/ Alan S. Dupski |
| | | Alan S. Dupski |
| | | Principal Financial Officer |
| |
| Date | | February 19, 2021 | | | | |