UNITED STATES
SECURITIES AND EXCHANGE COMMISSION
Washington, D.C. 20549
FORM N-CSR
CERTIFIED SHAREHOLDER REPORT OF REGISTERED
MANAGEMENT INVESTMENT COMPANIES
Investment Company Act File Number: 811-23494
| T. Rowe Price Exchange-Traded Funds, Inc. |
|
| (Exact name of registrant as specified in charter) |
| |
| 100 East Pratt Street, Baltimore, MD 21202 |
|
| (Address of principal executive offices) |
| |
| David Oestreicher |
| 100 East Pratt Street, Baltimore, MD 21202 |
|
| (Name and address of agent for service) |
Registrant’s telephone number, including area code: (410) 345-2000
Date of fiscal year end: October 31
Date of reporting period: October 31, 2021
Item 1. Reports to Shareholders
(a) Report pursuant to Rule 30e-1.
ANNUAL REPORT
October 31, 2021
| | T. ROWE PRICE |
| TAGG | QM U.S. Bond ETF |
| | For more insights from T. Rowe Price investment professionals, go to troweprice.com. |
T. ROWE PRICE QM U.S. BOND ETF
HIGHLIGHTS
| ■ | The QM U.S. Bond ETF underperformed the Bloomberg U.S. Aggregate Bond Index, based on net asset value, but performed roughly in line with the index at market price from its inception on September 28, 2021, through October 31, 2021. |
| ■ | The fund’s sector allocations had an overall positive effect on relative returns, but security selection within the portfolio detracted, largely offsetting the contribution from sector positioning. |
| ■ | Historically, certain sectors, such as shorter-maturity corporate bonds and securitized credit sectors, have been more efficient at generating risk-adjusted returns over time than other market segments. Our strategy emphasizes these more efficient parts of the opportunity set. |
| ■ | Although we are not expecting a spike in rates given lingering macro risks, we believe there is now a greater likelihood of a renewed move higher in yields. In our view, any policy missteps by the Fed could lead to increased levels of market volatility. However, bouts of volatility could also provide tactical opportunities, particularly given the strong growth environment. |
Sign up for e-delivery of your statements, confirmations, and prospectuses or shareholder reports.
If you invest directly with T. Rowe Price, go to troweprice.com/paperless.
If you invest through an investment advisor, a bank, or a brokerage firm, please contact that organization and ask if it can provide electronic documentation.
It’s fast—receive your statements and
confirmations faster than U.S. mail.
It’s convenient—access your important account documents whenever you need them.
It’s secure—we protect your online accounts using “True Identity” to confirm new accounts and make verification faster and more secure.
It can save you money—where applicable,
T. Rowe Price passes on the cost savings to
fund holders.*
Log in to your account at troweprice.com for more information.
*Certain mutual fund accounts that are assessed an annual account service fee can also save money by switching to e-delivery.
T. ROWE PRICE QM U.S. BOND ETF
CIO Market Commentary
Dear Shareholders
Global stock markets produced strong returns during your fund’s fiscal year, the 12-month period ended October 31, 2021. The rollout of coronavirus vaccines helped drive extraordinary gains in the first half of the reporting period, and while the equity rally slowed in recent months, some benchmarks continued to grind out new record highs as the period came to an end.
In the U.S., the S&P 500 Index was up 43% (including dividends) for the 12-month period, and most developed market benchmarks advanced more than 30%. Emerging markets produced solid results for the full year but faced increased volatility in the second half of the period. According to MSCI, value stocks narrowly outperformed their growth counterparts over the 12 months. At the sector level, energy stocks delivered very strong returns as oil prices reached multiyear highs, and banks also performed well, supported by higher longer-term interest rates and improved lending margins.
Fixed income markets faced headwinds as Treasury yields rose rapidly in the first quarter of 2021 from the historically low levels seen last year, although high yield bonds performed well. Meanwhile, the U.S. dollar was mixed against foreign currencies over the full year.
Strong corporate earnings growth supported stocks and corporate bonds throughout the period, but investors faced new worries as the period progressed. The spread of the delta variant of the coronavirus dashed hopes that vaccines would bring about a quick end to the pandemic, and economic growth, while still positive, began to slow. U.S. gross domestic product decelerated from a 6.7% annual pace in the second quarter to 2.0% in the third quarter (according to the initial estimate) amid weaker consumer spending. Some Purchasing Managers’ Indexes showed evidence of slowing economic activity globally.
Investors also worried about how developments in China would impact the global economy. The Chinese government announced more stringent business regulations during the period, particularly on the technology sector, and the precarious debt load of a large property developer added to market concerns.
Meanwhile, inflation surged as the release of pent-up demand and supply chain disruptions contributed to higher prices around the globe. Inflation measures in the U.S., UK, and eurozone all reached their highest levels in more than a decade and far exceeded central bank targets, although most policymakers argued that elevated inflation was a transitory phenomenon caused by the reopening of economies.
T. ROWE PRICE QM U.S. BOND ETF
The fiscal and monetary stimulus that global governments and central banks enacted in response to the pandemic continued to be supportive for markets but appears to have peaked. Just after our reporting period ended, the Federal Reserve announced it would begin trimming its purchases of Treasury bonds and mortgage-backed securities in November and would likely wrap up its asset purchases by next summer. The Fed’s latest projections indicated that a rate hike isn’t likely until the second half of next year at the earliest, but other central banks have begun telegraphing that rate hikes could come soon.
How markets respond to the normalization of monetary policy is an open question. While fading stimulus might pose some challenges for investors, I believe it could contribute to a return of price sensitivity in global markets, which bodes well for selective investors focused on fundamentals.
While I do not expect robust overall equity returns in the near term given the market’s elevated valuations, I am mindful that investors have not yet enjoyed all the potential fruits of the recovery. Many companies have yet to see business return to pre-pandemic levels, and identifying which ones are either regaining their footing or disrupting markets through innovation will be key. I’m confident our portfolio managers and global research organization will serve our investors well in this environment.
Thank you for your continued confidence in T. Rowe Price.
Sincerely,
Robert Sharps
Group Chief Investment Officer
T. ROWE PRICE QM U.S. BOND ETF
Management’s Discussion of Fund Performance
INVESTMENT OBJECTIVE
The fund seeks to provide a total return that exceeds the performance of the U.S. investment-grade bond market.
FUND COMMENTARY
How did the fund perform since inception?
The QM U.S. Bond ETF returned -0.08% (based on net asset value) and 0.02% (at market price) from its inception on September 28, 2021, through October 31, 2021. Based on net asset value, the fund underperformed its benchmark, the Bloomberg U.S. Aggregate Bond Index, but performed roughly in line with the index at market price. (Past performance cannot guarantee future results.)
What factors influenced the fund’s performance?
The fund began operations a little more than a month before the end of the
PERFORMANCE COMPARISON
| | |
| Period Ended 10/31/21 | Total Return
Since
Inception
9/28/21 |
| | |
| QM U.S. Bond ETF (Based on Net Asset Value) | -0.08% |
| QM U.S. Bond ETF (At Market Price)* | 0.02 |
| Bloomberg U.S. Aggregate Bond Index | 0.07 |
*Market returns are based on the midpoint of the bid/ask spread at market close (typically, 4 p.m. ET) and do not represent returns an investor would have received if shares were traded at other times.
T. ROWE PRICE QM U.S. BOND ETF
reporting period. Around that time, Treasury yields began rising. Demand for U.S. Treasuries waned amid signals from the Federal Reserve that tapering asset purchases and rate hikes might be coming sooner than many had expected earlier in the year, pushing short-term yields higher in particular.
In the short history since inception, the fund’s sector allocations had an overall positive effect on relative returns, but security selection within the portfolio detracted and largely offset the contribution from sector positioning.
The fund’s overweight position, on a risk-weighted basis, in agency mortgage-backed securities (MBS) and commercial mortgage-backed securities (CMBS) helped as those sectors performed well recently. Agency MBS spreads widened over the summer but tightened more recently as the Federal Reserve began removing uncertainties surrounding its asset tapering plans.
However, security selection within the investment-grade corporate sector dragged on relative returns. Holding Enbridge Energy, a North American energy infrastructure company, detracted as natural gas prices were volatile in October. Additionally, Enbridge announced its plans to acquire Moda Midstream for $3 billion. Current bonds came under pressure as the deal will raise Enbridge’s overall debt, but we believe the deal will only modestly increase leverage and makes strategic sense. (Please refer to the fund’s portfolio of investments for a complete list of holdings and the amount each represents in the portfolio.)
How is the fund positioned?
To aid in the fund’s objective, we attempt to compensate for fund expenses by efficiently matching the benchmark risk factors in a more yield-advantageous manner. Using quantitative techniques as a guide, our methodology centers on underweighting the less efficient subsectors of the index and emphasizing areas that have historically produced stronger risk-adjusted returns.
We believe we can exploit structural and historical differences, in part, by managing sector allocations within the high-grade fixed income market. The various credit subcomponents of the Bloomberg benchmark have differing risk/return profiles. These differences have generally persisted over time and stem from factors such as supply and demand technicals, issuer maturity preferences, and credit quality characteristics. To aid in this endeavor, we employ a quantitative approach along with incorporating fundamental elements to a modest degree through tactical sector allocation and security selection.
The fund held a nominal overweight to investment-grade corporates to earn additional yield versus the benchmark. But we remain underweight on a risk-weighted basis due to an emphasis on the shorter end of the credit curve,
T. ROWE PRICE QM U.S. BOND ETF
which we believe is a more efficient area of the market. We also maintained
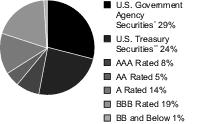
CREDIT QUALITY DIVERSIFICATION
Based on net assets as of 10/31/21.
Sources: Credit ratings for the securities held in the fund are provided by Moody’s, Standard & Poor’s, and Fitch and are converted to the Standard & Poor’s nomenclature. If the rating agencies differ, the highest rating is applied to the security. If a rating is not available, the security is classified as Not Rated. T. Rowe Price uses the rating of the underlying investment vehicle to determine the creditworthiness of credit default swaps. The fund is not rated by any agency. Securities that have not been rated by any rating agency totaled 1.36% of the portfolio at the end of the reporting period.
*U.S. government agency securities are issued or guaranteed by a U.S. government agency and may include conventional pass-through securities and collateralized mortgage obligations; unlike Treasuries, government agency securities are not issued directly by the U.S. government and are generally unrated but may have credit support from the U.S. Treasury (e.g., FHLMC and FNMA issues) or a direct government guarantee (e.g., GNMA issues). Therefore, this category may include rated and unrated securities.
**U.S. Treasury securities are issued by the U.S. Treasury and are backed by the full faith and credit of the U.S. government. The ratings of U.S. Treasury securities are derived from the ratings on the U.S. government.
T. ROWE PRICE QM U.S. BOND ETF
notable positions in securitized credit sectors, including CMBS, asset-backed securities, and non-agency MBS, as they continued to benefit from a generally strong fundamental backdrop. We aim to convert tracking error into a modest amount of excess return by building a yield advantage versus the benchmark and exploiting structural fixed income market and index inefficiencies. (Tracking error is a statistic that attempts to measure the difference of returns between the portfolio and the benchmark.)
What is portfolio management’s outlook?
The decline in Treasury yields—particularly real (inflation-adjusted) yields—from late March through early August signaled the market’s concerns about the duration of the economic cycle; however, several of the factors that had held down yields in recent months have started to dissipate and are now a tailwind, allowing yields to push higher. Notably, growth expectations have reset at more appropriate levels; inflation appears to be in the process of peaking, which would support a healthier economic environment; and recent Federal Reserve meetings have removed uncertainty about tapering plans.
Although we are not expecting a spike in rates given lingering macro risks, in our view there is now a greater likelihood of a renewed move higher in yields. Despite the assumptions of many market participants that the Fed may be moving in a hawkish direction, we believe the central bank is attempting to execute a dovish turn. In our view, the Fed’s latest policy projections, which depict a slow and shallow rate hike trajectory in the face of persistently above-target inflation, showed a firm commitment to the central bank’s relatively new average inflation-targeting policy, which could see the Fed letting inflation run higher than 2% for an extended period. We believe this framework could support strong economic growth and can lead to higher yields.
Any policy missteps by the Fed could lead to increased levels of market volatility. However, we believe bouts of volatility should also provide tactical opportunities, particularly given the strong growth environment. Although credit valuations remain broadly unattractive following the extended rally that began in late March 2020, it is our view that strong corporate and consumer balance sheets and solid corporate earnings growth should provide support from a fundamental perspective. Against this backdrop, we remain confident in our approach to bond indexing, in which quantitative portfolio construction is buttressed by a strong fundamental credit research platform.
The views expressed reflect the opinions of T. Rowe Price as of the date of this report and are subject to change based on changes in market, economic, or other conditions. These views are not intended to be a forecast of future events and are no guarantee of future results.
T. ROWE PRICE QM U.S. BOND ETF
RISKS OF INVESTING IN FIXED INCOME SECURITIES
Funds that invest in fixed income securities are subject to price declines due to rising interest rates, with long-term securities generally most sensitive to rate fluctuations. Other risks include credit rating downgrades and defaults on scheduled interest and principal payments. Mortgage-backed securities are subject to prepayment risk, particularly if falling rates lead to heavy refinancing activity, and extension risk, which results from an increase in interest rates that causes a mortgage bond’s average maturity to lengthen unexpectedly due to a drop in mortgage prepayments. This would increase the fund’s sensitivity to rising interest rates and its potential for price declines.
BENCHMARK INFORMATION
Note: Bloomberg® and Bloomberg U.S. Aggregate Bond Index are service marks of Bloomberg Finance L.P. and its affiliates, including Bloomberg Index Services Limited (“BISL”), the administrator of the index (collectively, “Bloomberg”) and have been licensed for use for certain purposes by T. Rowe Price. Bloomberg is not affiliated with T. Rowe Price, and Bloomberg does not approve, endorse, review, or recommend its products. Bloomberg does not guarantee the timeliness, accurateness, or completeness of any data or information relating to its products.
T. ROWE PRICE QM U.S. BOND ETF
AVERAGE ANNUAL COMPOUND TOTAL RETURN
| Period Ended 10/31/21 | Since
Inception
9/28/21 |
| QM U.S. Bond ETF (Based on Net Asset Value) | -0.08%* |
| QM U.S. Bond ETF (At Market Price) | 0.02* |
This table shows how the fund would have performed each year if its actual (or cumulative) returns for the periods shown had been earned at a constant rate. Average annual total return figures include changes in principal value, reinvested dividends, and capital gain distributions. Returns do not reflect taxes that the shareholder may pay on fund distributions or the redemption of fund shares. When assessing performance, investors should consider both short- and long-term returns. Past performance cannot guarantee future results. Market returns are based on the midpoint of the bid/ask spread at market close (typically, 4 p.m. ET) and do not represent returns an investor would have received if shares were traded at other times.
*Returns for periods of less than one year are not annualized.
PREMIUM/DISCOUNT INFORMATION
The frequency at which the daily market prices were at a discount or premium to the fund’s net asset value is available on the fund’s website (troweprice.com).
EXPENSE RATIO
The expense ratio shown is as of the fund’s most recent prospectus. This number may vary from the expense ratio shown elsewhere in this report because it is based on a different time period and, if applicable, includes acquired fund fees and expenses but does not include fee or expense waivers.
T. ROWE PRICE QM U.S. BOND ETF
FUND EXPENSE EXAMPLE
As a shareholder, you may incur two types of costs: (1) transaction costs, such as brokerage commissions on purchases and sales, and (2) ongoing costs, including management fees and other fund expenses. The following example is intended to help you understand your ongoing costs (in dollars) of investing in the fund and to compare these costs with the ongoing costs of investing in other funds. The example is based on an investment of $1,000 invested at the beginning of the most recent six-month period and held for the entire period.
Actual Expenses
The first line of the following table (Actual) provides information about actual account values and expenses based on the fund’s actual returns. You may use the information on this line, together with your account balance, to estimate the expenses that you paid over the period. Simply divide your account value by $1,000 (for example, an $8,600 account value divided by $1,000 = 8.6), then multiply the result by the number on the first line under the heading “Expenses Paid During Period” to estimate the expenses you paid on your account during this period.
Hypothetical Example for Comparison Purposes
The information on the second line of the table (Hypothetical) is based on hypothetical account values and expenses derived from the fund’s actual expense ratio and an assumed 5% per year rate of return before expenses (not the fund’s actual return). You may compare the ongoing costs of investing in the fund with other funds by contrasting this 5% hypothetical example and the 5% hypothetical examples that appear in the shareholder reports of the other funds. The hypothetical account values and expenses may not be used to estimate the actual ending account balance or expenses you paid for the period.
You should also be aware that the expenses shown in the table highlight only your ongoing costs and do not reflect any transaction costs, such as brokerage commissions paid on purchases and sales of shares. Therefore, the second line of the table is useful in comparing ongoing costs only and will not help you determine the relative total costs of owning different funds. To the extent a fund charges transaction costs, however, the total cost of owning that fund is higher.
T. ROWE PRICE QM U.S. BOND ETF
FUND EXPENSE EXAMPLE (continued)
T. Rowe Price QM U.S. Bond ETF
| | Beginning
Account Value
9/29/211 | Ending
Account Value
10/31/21 | Expenses Paid
During Period
9/29/21 to 10/31/211,2 |
| Actual | $1,000.00 | $999.20 | $0.07 |
| | 5/1/211 | 10/31/21 | 5/1/21 to
10/31/211,3 |
| Hypothetical (assumes 5% return before expenses) | 1,000.00 | 1,024.80 | 0.41 |
| 1 | The actual expense example is based on the period since the fund’s start of operations on 9/29/21, one day after inception; the hypothetical expense example is based on the half-year period beginning 5/1/21, as required by the Securities and Exchange Commission. |
| 2 | Expenses are equal to the fund’s annualized expense ratio for the period (0.08%), multiplied by the average account value over the period, multiplied by the number of days in the period (33), and divided by the days in the year (365) since the fund’s start of operations. |
| 3 | Expenses are equal to the fund’s annualized expense ratio for the period (0.08%), multiplied by the average account value over the period, multiplied by the number of days in the most recent fiscal half year (184), and divided by the days in the year (365) to reflect the half-year period. |
T. ROWE PRICE QM U.S. BOND ETF
QUARTER-END RETURNS
| Period Ended 9/30/21 | Since
Inception
9/28/21 |
| QM U.S. Bond ETF (Based on Net Asset Value) | 0.04%* |
| QM U.S. Bond ETF (At Market Price) | 0.10* |
The fund’s performance information represents only past performance and is not necessarily an indication of future results. Current performance may be lower or higher than the performance data cited. Share price, principal value, and return will vary, and you may have a gain or loss when you sell your shares. Market returns are based on the midpoint of the bid/ask spread at market close (typically, 4 p.m. ET) and do not represent returns an investor would receive if shares were traded at other times. For the most recent month-end performance, please visit our website (troweprice.com) or contact a T. Rowe Price representative at 1-800-225-5132.
This table provides returns through the most recent calendar quarter-end rather than through the end of the fund’s fiscal period. It shows how the fund would have performed each year if its actual (or cumulative) returns for the periods shown had been earned at a constant rate. Average annual total return figures include changes in principal value, reinvested dividends, and capital gain distributions. Returns do not reflect taxes that the shareholder may pay on fund distributions or the redemption of fund shares. When assessing performance, investors should consider both short- and long-term returns.
*Returns for periods of less than one year are not annualized.
T. ROWE PRICE QM U.S. BOND ETF
For a share outstanding throughout the period
| | 9/28/21(1)
Through |
| | 10/31/21 |
| NET ASSET VALUE | |
| Beginning of period | $ 50.00 |
| Investment activities | |
| Net investment income(2) (3) | 0.06 |
| Net realized and unrealized gain/loss | (0.07) |
| Total from investment activities | (0.01)(4) |
| Distributions | |
| Net Investment Income | (0.03) |
| NET ASSET VALUE | |
| End of period | $ 49.96 |
T. ROWE PRICE QM U.S. BOND ETF
For a share outstanding throughout the period
| | 9/28/21(1)
Through |
| | 10/31/21 |
| Ratios/Supplemental Data |
| Total return, based on NAV(3) (5) | (0.08)% |
Ratios to average net
assets:(3) | |
Gross expenses before
waivers/payments by
Price Associates | 0.08%(6) |
Net expenses after
waivers/payments by
Price Associates | 0.08%(6) |
| Net investment income | 1.29%(6) |
| Portfolio turnover rate(7) | 50.9% |
| Portfolio turnover rate, excluding mortgage dollar roll transactions | 11.7% |
Net assets, end of period
(in thousands) | $ 27,477 |
| (1) | Inception date |
| (2) | Per share amounts calculated using average shares outstanding method. |
| (3) | See Note 6 for details to expense-related arrangements with Price Associates. |
| (4) | The amount presented is inconsistent with the fund's results of operations because of the timing of redemptions of fund shares in relation to fluctuating market values for the investment portfolio. |
| (5) | Total return reflects the rate that an investor would have earned on an investment in the fund during period, assuming reinvestment of all distributions. Total return is not annualized for periods less than one year. |
| (6) | Annualized |
| (7) | See Note 4. The portfolio turnover rate calculation includes purchases and sales from the mortgage dollar roll transactions. |
The accompanying notes are an integral part of these financial statements.
T. ROWE PRICE QM U.S. BOND ETF
October 31, 2021
| PORTFOLIO OF INVESTMENTS‡ | Par/Shares | $ Value |
| (Amounts in 000s, except Par/Shares) | | |
| ASSET-BACKED SECURITIES 4.0% |
| Car Loan 0.4% | | |
| CarMax Auto Owner Trust, Series 2021-1, Class D, 1.28%, 7/15/27 | 100,000 | 99 |
| | | 99 |
| Other Asset-Backed Securities 0.9% | | |
| Symphony Static, Series 2021-1A, Class A, CLO, FRN, 3M USD LIBOR + 0.83%, 0.959%, 10/25/29 (1) | 250,000 | 250 |
| | | 250 |
| Student Loan 2.7% | | |
| Navient Private Education Refi Loan Trust, Series 2020-A, Class A2A, 2.46%, 11/15/68 (1) | 200,000 | 205 |
| Navient Private Education Refi Loan Trust, Series 2019-CA, Class A2, 3.13%, 2/15/68 (1) | 189,487 | 193 |
| Navient Private Education Refi Loan Trust, Series 2021-A, Class A, 0.84%, 5/15/69 (1) | 124,926 | 124 |
| Nelnet Student Loan Trust, Series 2021-CA, Class AFX, 1.32%, 4/20/62 (1) | 96,555 | 96 |
| Nelnet Student Loan Trust, Series 2021-DA, Class AFX, 1.63%, 4/20/62 (1) | 135,000 | 135 |
| | | 753 |
Total Asset-Backed Securities
(Cost $1,106) | | 1,102 |
| CORPORATE BONDS 33.3% |
| FINANCIAL INSTITUTIONS 12.9% | | |
| Banking 5.5% | | |
| Ally Financial, 2.20%, 11/2/28 | 35,000 | 34 |
| Bank of America, VR, 2.592%, 4/29/31 (2) | 125,000 | 126 |
| Bank of America, VR, 2.676%, 6/19/41 (2) | 60,000 | 58 |
| Bank of America, VR, 3.824%, 1/20/28 (2) | 10,000 | 11 |
| Bank of America, VR, 4.244%, 4/24/38 (2) | 15,000 | 18 |
| Capital One Financial, 3.65%, 5/11/27 | 30,000 | 33 |
T. ROWE PRICE QM U.S. BOND ETF
| | Par/Shares | $ Value |
| (Amounts in 000s, except Par/Shares) | | |
| Capital One Financial, 3.90%, 1/29/24 | 85,000 | 90 |
| Citigroup, VR, 2.572%, 6/3/31 (2) | 45,000 | 45 |
| Citigroup, VR, 3.106%, 4/8/26 (2) | 25,000 | 26 |
| Citigroup, 5.875%, 1/30/42 | 20,000 | 29 |
| Discover Financial Services, 3.75%, 3/4/25 | 105,000 | 112 |
| Fifth Third Bancorp, 1.625%, 5/5/23 | 75,000 | 76 |
| Goldman Sachs Group, VR, 2.65%, 10/21/32 (2) | 30,000 | 30 |
| Goldman Sachs Group, VR, 3.272%, 9/29/25 (2) | 10,000 | 11 |
| Goldman Sachs Group, 3.80%, 3/15/30 | 15,000 | 17 |
| Goldman Sachs Group, 4.25%, 10/21/25 | 25,000 | 27 |
| Goldman Sachs Group, 6.75%, 10/1/37 | 15,000 | 21 |
| JPMorgan Chase, VR, 2.522%, 4/22/31 (2) | 125,000 | 126 |
| JPMorgan Chase, VR, 2.956%, 5/13/31 (2) | 10,000 | 10 |
| JPMorgan Chase, VR, 3.882%, 7/24/38 (2) | 75,000 | 85 |
| Morgan Stanley, 3.125%, 7/27/26 | 35,000 | 37 |
| Morgan Stanley, VR, 3.622%, 4/1/31 (2) | 10,000 | 11 |
| Morgan Stanley, VR, 3.971%, 7/22/38 (2) | 60,000 | 69 |
| Morgan Stanley, 4.30%, 1/27/45 | 15,000 | 19 |
| Royal Bank of Canada, 2.30%, 11/3/31 | 50,000 | 50 |
| Sumitomo Mitsui Financial Group, 3.748%, 7/19/23 | 90,000 | 95 |
| Synchrony Financial, 4.25%, 8/15/24 | 130,000 | 140 |
| Wells Fargo & Co, VR, 2.188%, 4/30/26 (2) | 35,000 | 36 |
| Wells Fargo & Co, VR, 2.393%, 6/2/28 (2) | 35,000 | 36 |
| Wells Fargo & Co, VR, 2.572%, 2/11/31 (2) | 40,000 | 40 |
| | | 1,518 |
| Brokerage Asset Managers Exchanges 0.3% | | |
| Intercontinental Exchange, 1.85%, 9/15/32 | 15,000 | 14 |
| Intercontinental Exchange, 3.45%, 9/21/23 | 70,000 | 74 |
| | | 88 |
| Finance Companies 0.9% | | |
| AerCap Ireland Capital, 2.45%, 10/29/26 | 150,000 | 151 |
| Air Lease, 3.625%, 4/1/27 | 10,000 | 10 |
T. ROWE PRICE QM U.S. BOND ETF
| | Par/Shares | $ Value |
| (Amounts in 000s, except Par/Shares) | | |
| Avolon Holdings Funding, 3.95%, 7/1/24 (1) | 75,000 | 79 |
| | | 240 |
| Insurance 3.1% | | |
| Anthem, 4.55%, 3/1/48 | 30,000 | 38 |
| Anthem, 4.65%, 1/15/43 | 10,000 | 12 |
| Aon, 3.875%, 12/15/25 | 95,000 | 104 |
| Chubb INA Holdings, 3.35%, 5/15/24 | 85,000 | 90 |
| Equitable Holdings, 3.90%, 4/20/23 | 75,000 | 78 |
| Fidelity National Financial, 4.50%, 8/15/28 | 70,000 | 79 |
| First American Financial, 4.60%, 11/15/24 | 70,000 | 76 |
| Humana, 2.15%, 2/3/32 | 10,000 | 10 |
| Marsh & McLennan, 2.25%, 11/15/30 | 75,000 | 75 |
| Marsh & McLennan, 3.50%, 6/3/24 | 20,000 | 21 |
| New York Life Insurance, 3.75%, 5/15/50 (1) | 20,000 | 23 |
| Principal Financial Group, 2.125%, 6/15/30 | 55,000 | 54 |
| Principal Financial Group, 3.40%, 5/15/25 | 10,000 | 11 |
| Principal Financial Group, 3.70%, 5/15/29 | 45,000 | 50 |
| Teachers Insurance & Annuity Association of America, 4.27%, 5/15/47 (1) | 20,000 | 24 |
| UnitedHealth Group, 2.00%, 5/15/30 | 10,000 | 10 |
| UnitedHealth Group, 3.50%, 8/15/39 | 70,000 | 77 |
| UnitedHealth Group, 4.75%, 7/15/45 | 15,000 | 20 |
| | | 852 |
| Real Estate Investment Trusts 3.1% | | |
| Alexandria Real Estate Equities, 3.95%, 1/15/27 | 40,000 | 44 |
| Alexandria Real Estate Equities, 4.00%, 2/1/50 | 40,000 | 47 |
| American Campus Communities Operating Partnership, 3.625%, 11/15/27 | 40,000 | 43 |
| American Campus Communities Operating Partnership, 4.125%, 7/1/24 | 65,000 | 70 |
| Boston Properties, 3.125%, 9/1/23 | 120,000 | 124 |
| Brixmor Operating Partnership, 3.90%, 3/15/27 | 15,000 | 16 |
| Brixmor Operating Partnership, 4.05%, 7/1/30 | 15,000 | 17 |
T. ROWE PRICE QM U.S. BOND ETF
| | Par/Shares | $ Value |
| (Amounts in 000s, except Par/Shares) | | |
| Duke Realty, 4.00%, 9/15/28 | 35,000 | 39 |
| ERP Operating, 3.00%, 4/15/23 | 75,000 | 77 |
| Essex Portfolio, 2.65%, 3/15/32 | 35,000 | 35 |
| Essex Portfolio, 4.50%, 3/15/48 | 20,000 | 25 |
| Healthpeak Properties, 2.875%, 1/15/31 | 15,000 | 16 |
| Kilroy Realty, 3.45%, 12/15/24 | 35,000 | 37 |
| Kilroy Realty, 4.375%, 10/1/25 | 20,000 | 22 |
| Life Storage, 4.00%, 6/15/29 | 15,000 | 17 |
| Prologis, 2.125%, 4/15/27 | 50,000 | 51 |
| Regency Centers, 3.60%, 2/1/27 | 40,000 | 43 |
| Simon Property Group, 3.80%, 7/15/50 | 35,000 | 39 |
| VEREIT Operating Partnership, 3.95%, 8/15/27 | 25,000 | 28 |
| VEREIT Operating Partnership, 4.625%, 11/1/25 | 45,000 | 50 |
| | | 840 |
| Total Financial Institutions | | 3,538 |
| INDUSTRIAL 18.4% | | |
| Basic Industry 0.1% | | |
| LYB International Finance II, 3.50%, 3/2/27 | 25,000 | 27 |
| | | 27 |
| Capital Goods 0.9% | | |
| General Dynamics, 3.25%, 4/1/25 | 10,000 | 11 |
| L3Harris Technologies, 3.832%, 4/27/25 | 20,000 | 22 |
| Lockheed Martin, 4.07%, 12/15/42 | 15,000 | 18 |
| Republic Services, 2.50%, 8/15/24 | 70,000 | 73 |
| Republic Services, 3.375%, 11/15/27 | 20,000 | 21 |
| Roper Technologies, 1.40%, 9/15/27 | 35,000 | 34 |
| Roper Technologies, 2.00%, 6/30/30 | 15,000 | 15 |
| Roper Technologies, 2.95%, 9/15/29 | 25,000 | 26 |
| Roper Technologies, 3.80%, 12/15/26 | 25,000 | 27 |
| | | 247 |
T. ROWE PRICE QM U.S. BOND ETF
| | Par/Shares | $ Value |
| (Amounts in 000s, except Par/Shares) | | |
| Communications 3.6% | | |
| America Movil SAB de CV, 6.375%, 3/1/35 | 45,000 | 62 |
| American Tower, 2.40%, 3/15/25 | 65,000 | 67 |
| AT&T, 2.25%, 2/1/32 | 15,000 | 14 |
| AT&T, 3.50%, 6/1/41 | 120,000 | 124 |
| Charter Communications Operating, 2.80%, 4/1/31 | 35,000 | 35 |
| Charter Communications Operating, 3.70%, 4/1/51 | 20,000 | 20 |
| Charter Communications Operating, 4.908%, 7/23/25 | 80,000 | 89 |
| Comcast, 1.95%, 1/15/31 | 15,000 | 15 |
| Comcast, 3.90%, 3/1/38 | 95,000 | 108 |
| Comcast, 3.95%, 10/15/25 | 25,000 | 27 |
| Crown Castle International, 2.25%, 1/15/31 | 25,000 | 24 |
| Crown Castle International, 3.70%, 6/15/26 | 25,000 | 27 |
| Time Warner Cable, 6.55%, 5/1/37 | 10,000 | 13 |
| Time Warner Cable, 6.75%, 6/15/39 | 10,000 | 14 |
| T-Mobile USA, 3.75%, 4/15/27 | 95,000 | 103 |
| Verizon Communications, 2.65%, 11/20/40 | 165,000 | 155 |
| Verizon Communications, 4.00%, 3/22/50 | 10,000 | 11 |
| Vodafone Group, 4.25%, 9/17/50 | 10,000 | 12 |
| WPP Finance 2010, 3.75%, 9/19/24 | 75,000 | 80 |
| | | 1,000 |
| Consumer Cyclical 3.0% | | |
| Amazon.com, 3.875%, 8/22/37 | 75,000 | 88 |
| AutoZone, 1.65%, 1/15/31 | 30,000 | 28 |
| AutoZone, 3.125%, 4/18/24 | 45,000 | 47 |
| BMW US Capital, 3.80%, 4/6/23 (1) | 75,000 | 78 |
| Delphi, 4.15%, 3/15/24 | 15,000 | 16 |
| Home Depot, 5.875%, 12/16/36 | 90,000 | 126 |
| Hyatt Hotels, 3.375%, 7/15/23 | 75,000 | 77 |
| Hyundai Capital America, 5.75%, 4/6/23 (1) | 70,000 | 75 |
| McDonald's, 3.30%, 7/1/25 | 10,000 | 11 |
| O'Reilly Automotive, 3.90%, 6/1/29 | 65,000 | 72 |
T. ROWE PRICE QM U.S. BOND ETF
| | Par/Shares | $ Value |
| (Amounts in 000s, except Par/Shares) | | |
| QVC, 4.45%, 2/15/25 | 10,000 | 11 |
| QVC, 4.85%, 4/1/24 | 95,000 | 102 |
| Ross Stores, 1.875%, 4/15/31 | 10,000 | 10 |
| Ross Stores, 4.60%, 4/15/25 | 35,000 | 39 |
| TJX, 1.60%, 5/15/31 | 30,000 | 29 |
| | | 809 |
| Consumer Non-Cyclical 4.5% | | |
| Abbott Laboratories, 1.15%, 1/30/28 | 10,000 | 10 |
| Abbott Laboratories, 4.75%, 11/30/36 | 75,000 | 96 |
| AbbVie, 3.20%, 5/14/26 | 15,000 | 16 |
| AbbVie, 4.45%, 5/14/46 | 40,000 | 49 |
| AbbVie, 4.70%, 5/14/45 | 40,000 | 50 |
| Agilent Technologies, 3.875%, 7/15/23 | 45,000 | 47 |
| Anheuser-Busch InBev Worldwide, 5.45%, 1/23/39 | 15,000 | 20 |
| Anheuser-Busch InBev Worldwide, 5.55%, 1/23/49 | 60,000 | 84 |
| BAT Capital, 4.39%, 8/15/37 | 40,000 | 43 |
| Becton Dickinson & Company, 2.823%, 5/20/30 | 35,000 | 36 |
| Becton Dickinson & Company, 3.70%, 6/6/27 | 45,000 | 49 |
| Biogen, 2.25%, 5/1/30 | 80,000 | 79 |
| Boston Scientific, 3.75%, 3/1/26 | 40,000 | 44 |
| Bristol-Myers Squibb, 4.25%, 10/26/49 | 15,000 | 19 |
| Cigna, 3.75%, 7/15/23 | 90,000 | 94 |
| CommonSpirit Health, 2.76%, 10/1/24 | 50,000 | 52 |
| CommonSpirit Health, 2.782%, 10/1/30 | 20,000 | 20 |
| CVS Health, 1.875%, 2/28/31 | 15,000 | 14 |
| CVS Health, 2.70%, 8/21/40 | 15,000 | 14 |
| CVS Health, 3.25%, 8/15/29 | 50,000 | 53 |
| CVS Health, 5.125%, 7/20/45 | 10,000 | 13 |
| Hackensack Meridian Health, 4.211%, 7/1/48 | 40,000 | 51 |
| Hasbro, 3.00%, 11/19/24 | 25,000 | 26 |
| Hasbro, 3.55%, 11/19/26 | 35,000 | 38 |
| HCA, 4.125%, 6/15/29 | 50,000 | 55 |
| MedStar Health, Series 20A, 3.626%, 8/15/49 | 30,000 | 33 |
T. ROWE PRICE QM U.S. BOND ETF
| | Par/Shares | $ Value |
| (Amounts in 000s, except Par/Shares) | | |
| Memorial Sloan-Kettering Cancer Center, Series 2015, 4.20%, 7/1/55 | 10,000 | 13 |
| Northwell Healthcare, 3.979%, 11/1/46 | 20,000 | 23 |
| Shire Acquisitions Investments Ireland, 2.875%, 9/23/23 | 90,000 | 93 |
| Stanford Health Care, Series 2018, 3.795%, 11/15/48 | 10,000 | 12 |
| | | 1,246 |
| Energy 2.8% | | |
| Boardwalk Pipelines, 3.40%, 2/15/31 | 25,000 | 26 |
| Boardwalk Pipelines, 4.95%, 12/15/24 | 25,000 | 27 |
| BP Capital Markets America, 1.749%, 8/10/30 | 30,000 | 29 |
| BP Capital Markets America, 3.194%, 4/6/25 | 20,000 | 21 |
| BP Capital Markets America, 3.41%, 2/11/26 | 45,000 | 49 |
| Cameron LNG, 3.701%, 1/15/39 (1) | 40,000 | 44 |
| Canadian Natural Resources, 2.95%, 7/15/30 | 20,000 | 21 |
| ConocoPhillips, 2.40%, 2/15/31 (1) | 10,000 | 10 |
| ConocoPhillips, 4.95%, 3/15/26 | 15,000 | 17 |
| Diamondback Energy, 2.875%, 12/1/24 | 35,000 | 36 |
| Enbridge, 4.00%, 10/1/23 | 70,000 | 74 |
| Enbridge Energy Partners, 5.50%, 9/15/40 | 10,000 | 13 |
| Energy Transfer, 5.25%, 4/15/29 | 20,000 | 23 |
| Occidental Petroleum, 3.00%, 2/15/27 | 20,000 | 20 |
| Pioneer Natural Resources, 1.125%, 1/15/26 | 10,000 | 10 |
| Sabine Pass Liquefaction, 4.50%, 5/15/30 | 15,000 | 17 |
| Schlumberger Holdings, 3.75%, 5/1/24 (1) | 80,000 | 85 |
| Spectra Energy Partners, 4.75%, 3/15/24 | 140,000 | 149 |
| TotalEnergies Capital International, 2.986%, 6/29/41 | 60,000 | 62 |
| Transcontinental Gas Pipe Line, 4.60%, 3/15/48 | 10,000 | 12 |
| Woodside Finance, 4.50%, 3/4/29 (1) | 20,000 | 22 |
| | | 767 |
| Industrial Other 0.1% | | |
| Northwestern University, Series 2020, 2.64%, 12/1/50 | 20,000 | 20 |
| | | 20 |
T. ROWE PRICE QM U.S. BOND ETF
| | Par/Shares | $ Value |
| (Amounts in 000s, except Par/Shares) | | |
| Technology 2.9% | | |
| Apple, 1.25%, 8/20/30 | 100,000 | 94 |
| Apple, 3.20%, 5/11/27 | 15,000 | 16 |
| Fiserv, 3.20%, 7/1/26 | 10,000 | 11 |
| Keysight Technologies, 4.55%, 10/30/24 | 10,000 | 11 |
| Moody's, 2.00%, 8/19/31 | 25,000 | 24 |
| NXP, 3.15%, 5/1/27 (1) | 95,000 | 100 |
| QUALCOMM, 2.15%, 5/20/30 | 90,000 | 91 |
| QUALCOMM, 3.25%, 5/20/27 | 20,000 | 22 |
| RELX Capital, 3.00%, 5/22/30 | 25,000 | 26 |
| ServiceNow, 1.40%, 9/1/30 | 60,000 | 56 |
| Texas Instruments, 1.75%, 5/4/30 | 80,000 | 79 |
| Visa, 1.90%, 4/15/27 | 110,000 | 112 |
| VMware, 1.40%, 8/15/26 | 95,000 | 94 |
| Western Union, 2.85%, 1/10/25 | 10,000 | 10 |
| Western Union, 6.20%, 11/17/36 | 50,000 | 63 |
| | | 809 |
| Transportation 0.5% | | |
| American Airlines PTT, Series 2014-1, 3.70%, 10/1/26 | 9,380 | 10 |
| ERAC USA Finance, 4.50%, 2/15/45 (1) | 10,000 | 12 |
| Kansas City Southern, 2.875%, 11/15/29 | 25,000 | 26 |
| Kansas City Southern, 3.50%, 5/1/50 | 15,000 | 16 |
| Kansas City Southern, 4.70%, 5/1/48 | 10,000 | 13 |
| Norfolk Southern, 5.59%, 5/17/25 | 15,000 | 17 |
| Transurban Finance, 2.45%, 3/16/31 (1) | 30,000 | 30 |
| Transurban Finance, 4.125%, 2/2/26 (1) | 15,000 | 16 |
| | | 140 |
| Total Industrial | | 5,065 |
| UTILITY 2.0% | | |
| Electric 1.6% | | |
| Berkshire Hathaway Energy, 6.125%, 4/1/36 | 25,000 | 34 |
T. ROWE PRICE QM U.S. BOND ETF
| | Par/Shares | $ Value |
| (Amounts in 000s, except Par/Shares) | | |
| Exelon, 3.40%, 4/15/26 | 15,000 | 16 |
| Metropolitan Edison, 4.30%, 1/15/29 (1) | 75,000 | 84 |
| Mid-Atlantic Interstate Transmission, 4.10%, 5/15/28 (1) | 15,000 | 17 |
| Pacific Gas & Electric, 2.10%, 8/1/27 | 55,000 | 53 |
| Southern, 4.40%, 7/1/46 | 50,000 | 59 |
| Virginia Electric & Power, Series A, 2.875%, 7/15/29 | 75,000 | 79 |
| Vistra Operations, 3.55%, 7/15/24 (1) | 110,000 | 114 |
| | | 456 |
| Natural Gas 0.4% | | |
| APT Pipelines, 4.25%, 7/15/27 (1) | 10,000 | 11 |
| NiSource, 1.70%, 2/15/31 | 45,000 | 42 |
| NiSource, 3.95%, 3/30/48 | 45,000 | 52 |
| | | 105 |
| Total Utility | | 561 |
Total Corporate Bonds
(Cost $9,191) | | 9,164 |
| FOREIGN GOVERNMENT OBLIGATIONS & MUNICIPALITIES 0.2% |
| Sovereign 0.2% | | |
| United Mexican States, 4.75%, 3/8/44 | 50,000 | 55 |
| | | 55 |
Total Foreign Government Obligations & Municipalities
(Cost $54) | | 55 |
| MUNICIPAL SECURITIES 2.5% |
| California 0.7% | | |
| Bay Area Toll Auth., Build America, 2.574%, 4/1/31 | 50,000 | 52 |
| California State University, 6.484%, 11/1/41 | 50,000 | 72 |
| Univ. of California Regents, Build America, 5.77%, 5/15/43 | 50,000 | 70 |
| | | 194 |
T. ROWE PRICE QM U.S. BOND ETF
| | Par/Shares | $ Value |
| (Amounts in 000s, except Par/Shares) | | |
| Georgia 0.2% | | |
| Municipal Electric Auth. of Georgia, Build America, Vogtle Units, 6.637%, 4/1/57 | 40,000 | 62 |
| | | 62 |
| Illinois 0.4% | | |
| Chicago O'Hare Int'l Airport, Build America, Series B, 6.395%, 1/1/40 | 50,000 | 76 |
| Cook County, Series B, 6.36%, 11/15/33 | 25,000 | 34 |
| | | 110 |
| Maryland 0.2% | | |
| Maryland Health & Higher Educational Facilities Auth., Series B, 4.815%, 7/1/43 | 40,000 | 52 |
| | | 52 |
| Tennessee 0.3% | | |
| Metropolitan Government of Nashville & Davidson County, Series B, 3.235%, 7/1/52 | 75,000 | 76 |
| | | 76 |
| Texas 0.5% | | |
| Central Texas Regional Mobility Auth., Series E, 3.167%, 1/1/41 | 25,000 | 25 |
| Dallas/Fort Worth Int'l Airport, Series C, 2.843%, 11/1/46 | 65,000 | 65 |
| Texas Private Activity Bond Surface Transportation, North Tarrant, Express, Series B, 3.922%, 12/31/49 | 30,000 | 34 |
| | | 124 |
| Virginia 0.2% | | |
| Virginia Commonwealth Transportation Board, Build America, 5.35%, 5/15/35 | 50,000 | 61 |
| | | 61 |
Total Municipal Securities
(Cost $676) | | 679 |
T. ROWE PRICE QM U.S. BOND ETF
| | Par/Shares | $ Value |
| (Amounts in 000s, except Par/Shares) | | |
| NON-U.S. GOVERNMENT MORTGAGE-BACKED SECURITIES 7.2% |
| Collateralized Mortgage Obligations 3.7% | | |
| Angel Oak Mortgage Trust, Series 2019-5, Class A1, CMO, ARM, 2.593%, 10/25/49 (1) | 87,065 | 87 |
| Angel Oak Mortgage Trust, Series 2021-6, Class A3, CMO, ARM, 1.714%, 9/25/66 (1) | 98,618 | 98 |
| Bayview MSR Opportunity Master Fund Trust, Series 2021-5, Class A20, CMO, ARM, 2.50%, 11/25/51 (1) | 135,000 | 134 |
| BRAVO Residential Funding Trust, Series 2021-NQM3, Class A1, CMO, ARM, 1.699%, 4/26/60 (1) | 100,000 | 100 |
| Ellington Financial Mortgage Trust, Series 2021-3, Class M1, CMO, ARM, 2.53%, 9/25/66 (1) | 100,000 | 99 |
| Freddie Mac STACR REMIC Trust, Series 2021-HQA3, Class M1, CMO, ARM, SOFR30A +0.85%, 0.899%, 9/25/41 (1) | 100,000 | 100 |
| Freddie Mac STACR REMIC Trust, Series 2021-DNA6, Class M2, CMO, ARM, SOFR30A +1.50%, 1.547%, 10/25/41 (1) | 100,000 | 100 |
| GCAT, Series 2021-NQM5, Class A1, CMO, ARM, 1.262%, 7/25/66 (1) | 99,304 | 99 |
| Verus Securitization Trust, Series 2019-INV3, Class A1, CMO, ARM, 2.692%, 11/25/59 (1) | 186,766 | 190 |
| | | 1,007 |
| Commercial Mortgage-Backed Securities 3.5% | | |
| BX Trust, Series 2021-ARIA, Class B, FRN, 1M USD LIBOR + 1.30%, 1.377%, 10/15/36 (1) | 105,000 | 105 |
| CGCMT, Series 2017-C4, Class AS, 3.764%, 10/12/50 | 185,000 | 200 |
| JPMBB Commercial Mortgage Securities Trust, Series 2015-C31, Class A3, 3.801%, 8/15/48 | 184,235 | 198 |
| Med Trust, Series 2021-MDLN, Class A, 1.05%, 11/15/26 (1) | 105,000 | 105 |
| Morgan Stanley Capital I Trust, Series 2018-H4, Class A4, 4.31%, 12/15/51 | 175,000 | 200 |
| Wells Fargo Commercial Mortgage Trust, Series 2019-JWDR, Class A, 2.501%, 9/15/31 (1) | 100,000 | 100 |
T. ROWE PRICE QM U.S. BOND ETF
| | Par/Shares | $ Value |
| (Amounts in 000s, except Par/Shares) | | |
| WFRBS Commercial Mortgage Trust, Series 2013-C11, Class A5, 3.071%, 3/15/45 | 56,400 | 57 |
| | | 965 |
Total Non-U.S. Government Mortgage-Backed Securities
(Cost $1,978) | | 1,972 |
| U.S. GOVERNMENT & AGENCY MORTGAGE-BACKED SECURITIES 28.7% |
| U.S. Government Agency Obligations 20.9% | | |
| Federal National Mortgage Assn. | | |
| 2.00%, 2/1/36 | 113,343 | 117 |
| 2.50%, 5/1/32 - 10/1/51 | 560,524 | 580 |
| 3.00%, 1/1/33 - 12/1/49 | 913,746 | 970 |
| 3.50%, 12/1/33 - 2/1/50 | 595,538 | 638 |
| 4.00%, 4/1/47 - 7/1/50 | 313,932 | 338 |
| 4.50%, 4/1/48 - 9/1/49 | 208,319 | 227 |
| 5.00%, 7/1/47 | 107,386 | 123 |
| UMBS, TBA | | |
| 2.00%, 11/15/36 - 12/15/51 (3) | 1,285,000 | 1,283 |
| 2.50%, 12/15/51 (3) | 690,000 | 707 |
| 3.00%, 12/15/51 (3) | 245,000 | 255 |
| 4.00%, 12/15/51 (3) | 258,000 | 276 |
| 4.50%, 12/15/51 (3) | 215,000 | 232 |
| | | 5,746 |
| U.S. Government Obligations 7.8% | | |
| Government National Mortgage Assn. | | |
| 2.50%, 8/20/51 - 10/20/51 | 455,742 | 469 |
| 3.00%, 6/20/45 - 7/20/51 | 421,751 | 439 |
| 3.50%, 10/20/47 - 8/20/51 | 269,473 | 286 |
| 4.00%, 2/20/48 - 3/20/50 | 172,653 | 184 |
| 4.50%, 10/20/47 - 11/20/47 | 91,512 | 99 |
| 5.00%, 8/20/47 | 107,704 | 119 |
| Government National Mortgage Assn., TBA | | |
| 2.00%, 11/18/51 (3) | 265,000 | 268 |
T. ROWE PRICE QM U.S. BOND ETF
| | Par/Shares | $ Value |
| (Amounts in 000s, except Par/Shares) | | |
| 2.50%, 11/18/51 (3) | 55,000 | 56 |
| 3.00%, 11/18/51 (3) | 145,000 | 150 |
| 3.50%, 11/19/50 (3) | 60,000 | 63 |
| | | 2,133 |
Total U.S. Government & Agency Mortgage-Backed Securities
(Cost $7,890) | | 7,879 |
| U.S. GOVERNMENT AGENCY OBLIGATIONS (EXCLUDING MORTGAGE-BACKED) 23.6% |
| U.S.Treasury Obligations 23.6% | | |
| U. S. Treasury Bonds, 1.75%, 8/15/41 | 1,075,000 | 1,035 |
| U. S. Treasury Bonds, 2.00%, 8/15/51 | 1,285,000 | 1,303 |
| U. S. Treasury Notes, 0.125%, 8/31/23 | 1,495,000 | 1,486 |
| U. S. Treasury Notes, 0.75%, 8/31/26 (4) | 2,300,000 | 2,254 |
| U. S. Treasury Notes, 1.25%, 8/15/31 | 425,000 | 413 |
| | | 6,491 |
Total U.S. Government Agency Obligations (Excluding Mortgage-Backed)
(Cost $6,450) | | 6,491 |
| SHORT-TERM INVESTMENTS 18.0% |
| Money Market Funds 18.0% | | |
| T. Rowe Price Government Reserve Fund, 0.06% (5)(6) | 4,953,957 | 4,954 |
Total Short-Term Investments
(Cost $4,954) | | 4,954 |
Total Investments
117.5% of Net Assets (Cost $32,299) | | $32,296 |
| ‡ | Par/Shares and Notional Amount are denominated in U.S. dollars unless otherwise noted. |
| (1) | Security was purchased pursuant to Rule 144A under the Securities Act of 1933 and may be resold in transactions exempt from registration only to qualified institutional buyers. Total value of such securities at period-end amounts to $3,144 and represents 11.4% of net assets. |
T. ROWE PRICE QM U.S. BOND ETF
| (2) | Security is a fix-to-float security, which carries a fixed coupon until a certain date, upon which it switches to a floating rate. Reference rate and spread are provided if the rate is currently floating. |
| (3) | To-Be-Announced purchase commitment. Total value of such securities at period-end amounts to $3,290 and represents 12.0% of net assets. See Note 4. |
| (4) | At October 31, 2021, all or a portion of this security is pledged as collateral and/or margin deposit to cover future funding obligations. |
| (5) | Seven-day yield |
| (6) | Affiliated Companies |
| 1M USD LIBOR | One month USD LIBOR (London interbank offered rate) |
| 3M USD LIBOR | Three month USD LIBOR (London interbank offered rate) |
| ARM | Adjustable Rate Mortgage (ARM); rate shown is effective rate at period-end. The rates for certain ARMs are not based on a published reference rate and spread but may be determined using a formula based on the rates of the underlying loans. |
| CLO | Collateralized Loan Obligation |
| CMO | Collateralized Mortgage Obligation |
| FRN | Floating Rate Note |
| PTT | Pass-Through Trust |
| SOFR30A | 30-day Average SOFR (Secured Overnight Financing Rate) |
| TBA | To-Be-Announced |
| UMBS | Uniform Mortgage-Backed Securities |
| USD | U.S. Dollar |
| VR | Variable Rate; rate shown is eff ective rate at period-end. The rates for certain variable rate securities are not based on a published reference rate and spread but are determined by the issuer or agent and based on current market conditions. |
T. ROWE PRICE QM U.S. BOND ETF
| Description | Notional
Amount | $ Value | Initial
$ Value | Unrealized
$ Gain/(Loss) |
| CENTRALLY CLEARED SWAPS 0.1% |
| Credit Default Swaps, Protection Sold 0.1% |
| Protection Sold (Relevant Credit: Markit CDX.NA.IG-S37, 5 Year Index), Receive 1.00% Quarterly, Pay upon credit default, 12/20/26 | 800 | 19 | 19 | — |
| Total Centrally Cleared Credit Default Swaps, Protection Sold | | | — |
| Net payments (receipts) of variation margin to date | $ — |
| Variation margin receivable (payable) on centrally cleared swaps | $ — |
T. ROWE PRICE QM U.S. BOND ETF
| | Expiration
Date | Notional
Amount | Value and
Unrealized
Gain (Loss) |
| Long, 2 U.S. Treasury Notes two year contracts | 12/21 | 439 | $— |
| Net payments (receipts) of variation margin to date | (5) |
| Variation margin receivable (payable) on open futures contracts | $(5) |
The accompanying notes are an integral part of these financial statements.
T. ROWE PRICE QM U.S. BOND ETF
AFFILIATED COMPANIES
($000s)
The fund may invest in certain securities that are considered affiliated companies. As defined by the 1940 Act, an affiliated company is one in which the fund owns 5% or more of the outstanding voting securities, or a company that is under common ownership or control. The following securities were considered affiliated companies for all or some portion of the period ended October 31, 2021. Net realized gain (loss), investment income, change in net unrealized gain/loss, and purchase and sales cost reflect all activity for the period then ended.
| Affiliate | Net Realized Gain
(Loss) | Changes in Net
Unrealized
Gain/Loss | Investment
Income |
| T. Rowe Price Government Reserve Fund | $—# | $— | $— |
| Supplementary Investment Schedule |
| Affiliate | Value
10/31/20 | Purchase
Cost | Sales
Cost | Value
10/31/21 |
| T. Rowe Price Government Reserve Fund | $— | ¤ | ¤ | $4,954^ |
| # | Capital gain distributions from mutual funds represented $0 of the net realized gain (loss). |
| ¤ | Purchase and sale information not shown for cash management funds. |
| ^ | The cost basis of investments in affiliated companies was $4,954. |
The accompanying notes are an integral part of these financial statements.
T. ROWE PRICE QM U.S. BOND ETF
October 31, 2021
STATEMENT OF ASSETS AND LIABILITIES
($000s, except shares and per share amounts)
| Assets | |
| Investments in securities, at value (cost $32,299) | $32,296 |
| Cash deposits on futures contracts | 5 |
| Receivable for investment securities sold | 4,030 |
| Interest receivable | 114 |
| Total assets | 36,445 |
| Liabilities | |
| Payable for investment securities purchased | 8,961 |
| Investment management and administrative fees payable | 2 |
| Variation margin payable on futures contracts | 5 |
| Total liabilities | 8,968 |
| NET ASSETS | $27,477 |
| Net assets consists of: | |
| Total distributable earnings (loss) | 9 |
Paid-in capital applicable to 550,000 shares of $0.0001 par value
capital stock outstanding; 4,000,000,000 shares authorized | 27,468 |
| NET ASSETS | $27,477 |
| NET ASSET VALUE PER SHARE | $49.96 |
The accompanying notes are an integral part of these financial statements.
T. ROWE PRICE QM U.S. BOND ETF
STATEMENT OF OPERATIONS
($000s)
| | 9/28/21
Through
10/31/21 |
| Investment Income (Loss) | |
| Interest income | $29 |
| Investment management and administrative expense | 2 |
| Net investment income | 27 |
| Realized and Unrealized Gain / Loss | |
| Net realized gain on securities | 1 |
| Change in net unrealized gain / loss on securities | (3) |
| Net realized and unrealized gain / loss | (2) |
| INCREASE IN NET ASSETS FROM OPERATIONS | $25 |
The accompanying notes are an integral part of these financial statements.
T. ROWE PRICE QM U.S. BOND ETF
STATEMENT OF CHANGES IN NET ASSETS
($000s)
| | 9/28/21
Through
10/31/21 |
| Increase (Decrease) in Net Assets | |
| Operations | |
| Net investment income | $27 |
| Net realized gain | 1 |
| Change in net unrealized gain / loss | (3) |
| Increase in net assets from operations | 25 |
| Distributions to shareholders | |
| Net earnings | (16) |
| Capital share transactions* | |
| Shares sold | 27,468 |
| Increase in net assets from capital share transactions | 27,468 |
| Net Assets | |
| Increase during period | 27,477 |
| Beginning of period | - |
| End of period | $27,477 |
| *Share information | |
| Shares sold | 550 |
| Increase in shares outstanding | 550 |
The accompanying notes are an integral part of these financial statements.
T. ROWE PRICE QM U.S. BOND ETF
Unaudited
NOTES TO FINANCIAL STATEMENTS
T. Rowe Price Exchange-Traded Funds, Inc. (the corporation) is registered under the Investment Company Act of 1940 (the 1940 Act). The QM U.S. Bond ETF (the fund) is a diversified, open-end management investment company established by the corporation. The fund incepted on September 28, 2021. The fund seeks to provide a total return that exceeds the performance of the U.S. investment-grade bond market.
NOTE 1 – SIGNIFICANT ACCOUNTING POLICIES
Basis of Preparation
The fund is an investment company and follows accounting and reporting guidance in the Financial Accounting Standards Board (FASB) Accounting Standards Codification Topic 946 (ASC 946). The accompanying financial statements were prepared in accordance with accounting principles generally accepted in the United States of America (GAAP), including, but not limited to, ASC 946. GAAP requires the use of estimates made by management. Management believes that estimates and valuations are appropriate; however, actual results may differ from those estimates, and the valuations reflected in the accompanying financial statements may differ from the value ultimately realized upon sale or maturity.
Investment Transactions, Investment Income, and Distributions
Investment transactions are accounted for on the trade date basis. Income and expenses are recorded on the accrual basis. Realized gains and losses are reported on the identified cost basis. Premiums and discounts on debt securities are amortized for financial reporting purposes. Paydown gains and losses are recorded as an adjustment to interest income. Income tax-related interest and penalties, if incurred, are recorded as income tax expense. Dividends received from other investment companies are reflected as dividend income; capital gain distributions are reflected as realized gain/loss. Dividend income and capital gain distributions are recorded on the ex-dividend date. Non-cash dividends, if any, are recorded at the fair market value of the asset received. Distributions to shareholders are recorded on the ex-dividend date. Income distributions are declared and paid monthly. A capital gain distribution may also be declared and paid by the fund annually. Dividends and distributions cannot be automatically reinvested in additional shares of the fund.
Capital Share Transactions
The fund issues and redeems shares at its net asset value (NAV) only with Authorized Participants and only in large blocks of 25,000 shares (each, a “Creation Unit”). The fund’s NAV per share is computed at the close of the New York Stock Exchange (NYSE).
T. ROWE PRICE QM U.S. BOND ETF
However, the NAV per share may be calculated at a time other than the normal close of the NYSE if trading on the NYSE is restricted, if the NYSE closes earlier, or as may be permitted by the SEC. Individual fund shares may not be purchased or redeemed directly with the fund. An Authorized Participant may purchase or redeem a Creation Unit of the fund each business day that the fund is open in exchange for the delivery of a designated portfolio of in-kind securities and/or cash. When purchasing or redeeming Creation Units, Authorized Participants are also required to pay a fixed and/or variable purchase or redemption transaction fee as well as any applicable additional variable charge to defray the transaction cost to a fund.
Individual fund shares may be purchased and sold only on a national securities exchange through brokers. Shares are listed for trading on NYSE Arca, Inc. (NYSE Arca) and because the shares will trade at market prices rather than NAV, shares may trade at prices greater than NAV (at a premium), at NAV, or less than NAV (at a discount). The fund’s shares are ordinarily valued as of the close of regular trading (normally 4:00 p.m. Eastern time) on each day that the NYSE Arca is open.
Indemnification
In the normal course of business, the fund may provide indemnification in connection with its officers and directors, service providers, and/or private company investments. The fund’s maximum exposure under these arrangements is unknown; however, the risk of material loss is currently considered to be remote.
NOTE 2 – VALUATION
Security Valuation
The fund’s financial instruments are reported at fair value, which GAAP defines as the price that would be received to sell an asset or paid to transfer a liability in an orderly transaction between market participants at the measurement date. The T. Rowe Price Valuation Committee (the Valuation Committee) is an internal committee that has been delegated certain responsibilities by the fund’s Board of Directors (the Board) to ensure that financial instruments are appropriately priced at fair value in accordance with GAAP and the 1940 Act. Subject to oversight by the Board, the Valuation Committee develops and oversees pricing-related policies and procedures and approves all fair value determinations. Specifically, the Valuation Committee establishes policies and procedures used in valuing financial instruments, including those which cannot be valued in accordance with normal procedures or using pricing vendors; determines pricing techniques, sources, and persons eligible to effect fair value pricing actions; evaluates the services and performance of the pricing vendors; oversees the pricing process to ensure
T. ROWE PRICE QM U.S. BOND ETF
policies and procedures are being followed; and provides guidance on internal controls and valuation-related matters. The Valuation Committee provides periodic reporting to the Board on valuation matters.
Various valuation techniques and inputs are used to determine the fair value of financial instruments. GAAP establishes the following fair value hierarchy that categorizes the inputs used to measure fair value:
Level 1 – quoted prices (unadjusted) in active markets for identical financial instruments that the fund can access at the reporting date
Level 2 – inputs other than Level 1 quoted prices that are observable, either directly or indirectly (including, but not limited to, quoted prices for similar financial instruments in active markets, quoted prices for identical or similar financial instruments in inactive markets, interest rates and yield curves, implied volatilities, and credit spreads)
Level 3 – unobservable inputs (including the fund’s own assumptions in determining fair value)
Observable inputs are developed using market data, such as publicly available information about actual events or transactions, and reflect the assumptions that market participants would use to price the financial instrument. Unobservable inputs are those for which market data are not available and are developed using the best information available about the assumptions that market participants would use to price the financial instrument. GAAP requires valuation techniques to maximize the use of relevant observable inputs and minimize the use of unobservable inputs. When multiple inputs are used to derive fair value, the financial instrument is assigned to the level within the fair value hierarchy based on the lowest-level input that is significant to the fair value of the financial instrument. Input levels are not necessarily an indication of the risk or liquidity associated with financial instruments at that level but rather the degree of judgment used in determining those values.
Valuation Techniques
Debt securities generally are traded in the OTC market. Securities with remaining maturities of one year or more at the time of acquisition are valued at prices furnished by independent pricing services or broker dealers who make markets in such securities. When valuing securities, the independent pricing services consider the yield or price of bonds of comparable quality, coupon, maturity, and type, as well as prices quoted by dealers who make markets in such securities. Debt securities with remaining maturities of less than one year at the time of acquisition generally use amortized cost in local currency to approximate fair value. However, if amortized cost is deemed not to reflect fair value or the
T. ROWE PRICE QM U.S. BOND ETF
fund holds a significant amount of such securities with remaining maturities of more than 60 days, the securities are valued at prices furnished by dealers who make markets in such securities or by an independent pricing service.
Investments in mutual funds are valued at the mutual fund’s closing NAV per share on the day of valuation. Swaps are valued at prices furnished by an independent pricing service or independent swap dealers. Futures contracts are valued at closing settlement prices. Assets and liabilities other than financial instruments, including short-term receivables and payables, are carried at cost, or estimated realizable value, if less, which approximates fair value.
Investments for which market quotations or market-based valuations are not readily available or deemed unreliable are valued at fair value as determined in good faith by the Valuation Committee, in accordance with fair valuation policies and procedures. The objective of any fair value pricing determination is to arrive at a price that could reasonably be expected from a current sale. Financial instruments fair valued by the Valuation Committee are primarily private placements, restricted securities, warrants, rights, and other securities that are not publicly traded. Factors used in determining fair value vary by type of investment and may include market or investment specific considerations. The Valuation Committee typically will afford greatest weight to actual prices in arm’s length transactions, to the extent they represent orderly transactions between market participants, transaction information can be reliably obtained, and prices are deemed representative of fair value. However, the Valuation Committee may also consider other valuation methods such as market-based valuation multiples; a discount or premium from market value of a similar, freely traded security of the same issuer; discounted cash flows; yield to maturity; or some combination. Fair value determinations are reviewed on a regular basis and updated as information becomes available, including actual purchase and sale transactions of the investment. Because any fair value determination involves a significant amount of judgment, there is a degree of subjectivity inherent in such pricing decisions, and fair value prices determined by the Valuation Committee could differ from those of other market participants.
Valuation Inputs
The following table summarizes the fund’s financial instruments, based on the inputs used to determine their fair values on October 31, 2021 (for further detail by category, please refer to the accompanying Portfolio of Investments):
T. ROWE PRICE QM U.S. BOND ETF
| ($000s) | Level 1 | Level 2 | Level 3 | Total Value |
| Assets | | | | |
| Fixed Income Securities1 | $— | $27,342 | $— | $27,342 |
| Short-Term Investments | 4,954 | — | — | 4,954 |
| Total | 4,954 | 27,342 | — | 32,296 |
| 1 | Includes Asset-Backed Securities, Corporate Bonds, Foreign Government Obligations & Municipalities, Municipal Securities, Non-U.S. Government Mortgage-Backed Securities, U.S. Government & Agency Mortgage-Backed Securities and U.S. Government Agency Obligations (Excluding Mortgage-Backed). |
NOTE 3 – DERIVATIVE INSTRUMENTS
During the period ended October 31, 2021, the fund invested in derivative instruments. As defined by GAAP, a derivative is a financial instrument whose value is derived from an underlying security price, foreign exchange rate, interest rate, index of prices or rates, or other variable; it requires little or no initial investment and permits or requires net settlement. The fund invests in derivatives only if the expected risks and rewards are consistent with its investment objectives, policies, and overall risk profile, as described in its prospectus and Statement of Additional Information. The fund may use derivatives for a variety of purposes, and may use them to establish both long and short positions within the fund’s portfolio. Potential uses include to hedge against declines in principal value, increase yield, invest in an asset with greater efficiency and at a lower cost than is possible through direct investment, to enhance return, or to adjust portfolio duration and credit exposure. The risks associated with the use of derivatives are different from, and potentially much greater than, the risks associated with investing directly in the instruments on which the derivatives are based. The fund at all times maintains sufficient cash reserves, liquid assets, or other SEC-permitted asset types to cover its settlement obligations under open derivative contracts.
The fund values its derivatives at fair value and recognizes changes in fair value currently in its results of operations. Accordingly, the fund does not follow hedge accounting, even for derivatives employed as economic hedges. Generally, the fund accounts for its derivatives on a gross basis. It does not offset the fair value of derivative liabilities against the fair value of derivative assets on its financial statements, nor does it offset the fair value of derivative instruments against the right to reclaim or obligation to return collateral.
As of October 31, 2021, the fund held interest and credit derivatives with a fair value of less than $1,000.
T. ROWE PRICE QM U.S. BOND ETF
During the period ended October 31, 2021, the fund recognized no gains or losses on derivative instruments.
Counterparty Risk and Collateral
The fund invests in exchange-traded or centrally cleared derivative contracts, such as futures, exchange-traded options, and centrally cleared swaps. Counterparty risk on such derivatives is minimal because the clearinghouse provides protection against counterparty defaults. For futures, the fund is required to deposit collateral in an amount specified by the clearinghouse and the clearing firm (margin requirement), and the margin requirement must be maintained over the life of the contract. Each clearinghouse and clearing firm, in its sole discretion, may adjust the margin requirements applicable to the fund.
Collateral may be in the form of cash or debt securities issued by the U.S. government or related agencies. Cash posted by the fund is reflected as cash deposits in the accompanying financial statements and generally is restricted from withdrawal by the fund; securities posted by the fund are so noted in the accompanying Portfolio of Investments; both remain in the fund’s assets. While typically not sold in the same manner as equity or fixed income securities, exchange-traded derivatives may be closed out only on the exchange where the contracts were cleared. This ability is subject to the liquidity of underlying positions. As of October 31, 2021, securities valued at $25,000 had been posted by the fund for exchange-traded derivatives.
Futures Contracts
The fund is subject to interest rate risk in the normal course of pursuing its investment objectives and uses futures contracts to help manage such risk. The fund may enter into futures contracts to manage exposure to interest rate and yield curve movements, security prices, foreign currencies, credit quality, and mortgage prepayments; as an efficient means of adjusting exposure to all or part of a target market; to enhance income; as a cash management tool; or to adjust portfolio duration and credit exposure. A futures contract provides for the future sale by one party and purchase by another of a specified amount of a specific underlying financial instrument at an agreed-upon price, date, time, and place. The fund currently invests only in exchange-traded futures, which generally are standardized as to maturity date, underlying financial instrument, and other contract terms. Payments are made or received by the fund each day to settle daily fluctuations in the value of the contract (variation margin), which reflect changes in the value of the underlying financial instrument. Variation margin is recorded as unrealized gain or loss until the contract is closed. The value of a futures contract included in net assets is the amount of unsettled variation margin; net variation margin receivable is reflected as an asset and net variation margin payable is reflected as a liability on the accompanying Statement of Assets and Liabilities. Risks related to the use of futures contracts include possible illiquidity of the futures markets, contract prices that can be highly volatile and
T. ROWE PRICE QM U.S. BOND ETF
imperfectly correlated to movements in hedged security values and/or interest rates, and potential losses in excess of the fund’s initial investment. During the period ended October 31, 2021, the volume of the fund’s activity in futures, based on underlying notional amounts, was generally between 0% and 2% of net assets.
Swaps
The fund is subject to credit risk in the normal course of pursuing its investment objectives and uses swap contracts to help manage such risk. The fund may use swaps in an effort to manage both long and short exposure to changes in interest rates, inflation rates, and credit quality; to adjust overall exposure to certain markets; to enhance total return or protect the value of portfolio securities; to serve as a cash management tool; or to adjust portfolio duration and credit exposure. Swap agreements can be settled either directly with the counterparty (bilateral swap) or through a central clearinghouse (centrally cleared swap). Fluctuations in the fair value of a contract are reflected in unrealized gain or loss and are reclassified to realized gain or loss upon contract termination or cash settlement. Net periodic receipts or payments required by a contract increase or decrease, respectively, the value of the contract until the contractual payment date, at which time such amounts are reclassified from unrealized to realized gain or loss. For bilateral swaps, cash payments are made or received by the fund on a periodic basis in accordance with contract terms; unrealized gain on contracts and premiums paid are reflected as assets and unrealized loss on contracts and premiums received are reflected as liabilities on the accompanying Statement of Assets and Liabilities. For bilateral swaps, premiums paid or received are amortized over the life of the swap and are recognized as realized gain or loss in the Statement of Operations. For centrally cleared swaps, payments are made or received by the fund each day to settle the daily fluctuation in the value of the contract (variation margin). Accordingly, the value of a centrally cleared swap included in net assets is the unsettled variation margin; net variation margin receivable is reflected as an asset and net variation margin payable is reflected as a liability on the accompanying Statement of Assets and Liabilities.
Credit default swaps are agreements where one party (the protection buyer) agrees to make periodic payments to another party (the protection seller) in exchange for protection against specified credit events, such as certain defaults and bankruptcies related to an underlying credit instrument, or issuer or index of such instruments. Upon occurrence of a specified credit event, the protection seller is required to pay the buyer the difference between the notional amount of the swap and the value of the underlying credit, either in the form of a net cash settlement or by paying the gross notional amount and accepting delivery of the relevant underlying credit. For credit default swaps where the underlying credit is an index, a specified credit event may affect all or individual underlying securities included in the index and will be settled based upon the relative weighting of the affected underlying security(ies) within the index. Generally, the payment risk for the seller of
T. ROWE PRICE QM U.S. BOND ETF
protection is inversely related to the current market price or credit rating of the underlying credit or the market value of the contract relative to the notional amount, which are indicators of the markets’ valuation of credit quality. As of October 31, 2021, the notional amount of protection sold by the fund totaled $800,000 (2.9% of net assets), which reflects the maximum potential amount the fund could be required to pay under such contracts. Risks related to the use of credit default swaps include the possible inability of the fund to accurately assess the current and future creditworthiness of underlying issuers, the possible failure of a counterparty to perform in accordance with the terms of the swap agreements, potential government regulation that could adversely affect the fund’s swap investments, and potential losses in excess of the fund’s initial investment.
During the period ended October 31, 2021, the volume of the fund’s activity in swaps, based on underlying notional amounts, was generally between 0% and 3% of net assets.
NOTE 4 – OTHER INVESTMENT TRANSACTIONS
Consistent with its investment objective, the fund engages in the following practices to manage exposure to certain risks and/or to enhance performance. The investment objective, policies, program, and risk factors of the fund are described more fully in the fund’s prospectus and Statement of Additional Information.
Restricted Securities
The fund invests in securities that are subject to legal or contractual restrictions on resale. Prompt sale of such securities at an acceptable price may be difficult and may involve substantial delays and additional costs.
Collateralized Loan Obligations
The fund invests in collateralized loan obligations (CLOs) which are entities backed by a diversified pool of syndicated bank loans. The cash flows of the CLO can be split into multiple segments, called “tranches” or “classes”, which will vary in risk profile and yield. The riskiest segments, which are the subordinate or “equity” tranches, bear the greatest risk of loss from defaults in the underlying assets of the CLO and serve to protect the other, more senior, tranches. Senior tranches will typically have higher credit ratings and lower yields than the securities underlying the CLO. Despite the protection from the more junior tranches, senior tranches can experience substantial losses.
Mortgage-Backed Securities
The fund invests in mortgage-backed securities (MBS or pass-through certificates) that represent an interest in a pool of specific underlying mortgage loans and entitle the fund to the periodic payments of principal and interest from those mortgages. MBS may be issued
T. ROWE PRICE QM U.S. BOND ETF
by government agencies or corporations, or private issuers. Most MBS issued by government agencies are guaranteed; however, the degree of protection differs based on the issuer. MBS are sensitive to changes in economic conditions that affect the rate of prepayments and defaults on the underlying mortgages; accordingly, the value, income, and related cash flows from MBS may be more volatile than other debt instruments.
TBA Purchase, Sale Commitments and Forward Settling Mortgage Obligations
The fund enters into to-be-announced (TBA) purchase or sale commitments (collectively, TBA transactions), pursuant to which it agrees to purchase or sell, respectively, mortgage-backed securities for a fixed unit price, with payment and delivery at a scheduled future date beyond the customary settlement period for such securities. With TBA transactions, the particular securities to be received or delivered by the fund are not identified at the trade date; however, the securities must meet specified terms, including rate and mortgage term, and be within industry-accepted “good delivery” standards. The fund may enter into TBA transactions with the intention of taking possession of or relinquishing the underlying securities, may elect to extend the settlement by “rolling” the transaction, and/or may use TBA transactions to gain or reduce interim exposure to underlying securities. Until settlement, the fund maintains liquid assets sufficient to settle its commitment to purchase a TBA or, in the case of a sale commitment, the fund maintains an entitlement to the security to be sold.
To mitigate counterparty risk, the fund has entered into Master Securities Forward Transaction Agreements (MSFTA) with counterparties that provide for collateral and the right to offset amounts due to or from those counterparties under specified conditions. Subject to minimum transfer amounts, collateral requirements are determined and transfers made based on the net aggregate unrealized gain or loss on all TBA commitments and other forward settling mortgage obligations with a particular counterparty (collectively, MSFTA Transactions). At any time, the fund’s risk of loss from a particular counterparty related to its MSFTA Transactions is the aggregate unrealized gain on appreciated MSFTA Transactions in excess of unrealized loss on depreciated MSFTA Transactions and collateral received, if any, from such counterparty. As of October 31, 2021, no collateral was pledged by the fund or counterparties for MSFTA Transactions.
Dollar Rolls
The fund enters into dollar roll transactions, pursuant to which it sells a mortgage-backed TBA or security and simultaneously agrees to purchase a similar, but not identical, TBA with the same issuer, rate, and terms on a later date at a set price from the same counterparty. The fund may execute a “roll” to obtain better underlying mortgage securities or to enhance returns. While the fund may enter into dollar roll transactions with the intention of taking possession of the underlying mortgage securities, it may also close a contract prior to settlement or “roll” settlement to a later date if deemed to be in the
T. ROWE PRICE QM U.S. BOND ETF
best interest of shareholders. Actual mortgages received by the fund may be less favorable than those anticipated. The fund accounts for dollar roll transactions as purchases and sales, which has the effect of increasing its portfolio turnover rate.
LIBOR Transition
The fund may invest in instruments that are tied to reference rates, including the London Interbank Offered Rate (LIBOR). On March 5, 2021, the ICE Benchmark Administration Limited, the administrator of LIBOR, announced its intention to cease publishing a majority of the USD LIBOR settings immediately after publication on June 30, 2023, with the remaining USD LIBOR settings to end immediately after publication on December 31, 2021. There remains uncertainty regarding the future utilization of LIBOR and the nature of any replacement rate. Any potential effects of the transition away from LIBOR on the fund, or on certain instruments in which the fund invests, cannot yet be determined. The transition process may result in, among other things, an increase in volatility or illiquidity of markets for instruments that currently rely on LIBOR, a reduction in the value of certain instruments held by the fund, or a reduction in the effectiveness of related fund transactions such as hedges. Any such effects could have an adverse impact on the fund’s performance.
Other
Purchases and sales of portfolio securities excluding in-kind transactions and short-term and U.S. government securities aggregated $13,312,000 and $488,000, respectively, for the period ended October 31, 2021. Purchases and sales of U.S. government securities aggregated $26,093,000 and $11,554,000, respectively, for the period ended October 31, 2021.
NOTE 5 – FEDERAL INCOME TAXES
No provision for federal income taxes is required since the fund intends to qualify as a regulated investment company under Subchapter M of the Internal Revenue Code and distribute to shareholders all of its taxable income and gains. Distributions determined in accordance with federal income tax regulations may differ in amount or character from net investment income and realized gains for financial reporting purposes.
The fund files U.S. federal, state, and local tax returns as required. The fund’s tax returns are subject to examination by the relevant tax authorities until expiration of the applicable statute of limitations, which is generally three years after the filing of the tax return but which can be extended to six years in certain circumstances.
T. ROWE PRICE QM U.S. BOND ETF
Financial reporting records are adjusted for permanent book/tax differences to reflect tax character but are not adjusted for temporary differences. The permanent book/tax adjustments have no impact on results of operations or net assets and relate primarily to character of income on swaps.
Distributions during the period ended October 31, 2021, totaled $16,000, and were characterized as ordinary income for tax purposes. At October 31, 2021, the tax-basis cost of investments and components of net assets were as follows:
| ($000s) | |
| Cost of investments | $32,323 |
| Unrealized appreciation | $91 |
| Unrealized depreciation | (99) |
| Net unrealized appreciation (depreciation) | (8) |
| Undistributed ordinary income | 17 |
| Paid-in capital | 27,468 |
| Net assets | $27,477 |
The difference between book-basis and tax-basis net unrealized appreciation (depreciation) is attributable to the deferral of losses from wash sales for tax purposes.
NOTE 6 – RELATED PARTY TRANSACTIONS
The fund is managed by T. Rowe Price Associates, Inc. (Price Associates), a wholly owned subsidiary of T. Rowe Price Group, Inc. (Price Group). The investment management and administrative agreement between the fund and Price Associates provides for an all-inclusive annual fee equal to 0.08% of the fund’s average daily net assets. The fee is computed daily and paid monthly. The all-inclusive fee covers investment management services and ordinary, recurring operating expenses, but does not cover interest and borrowing expenses; taxes; brokerage commissions and other transaction costs; fund proxy expenses; and nonrecurring expenses. All costs related to organization and offering of the fund are borne by Price Associates.
The fund may invest its cash reserves in certain open-end management investment companies managed by Price Associates and considered affiliates of the fund: the T. Rowe Price Government Reserve Fund or the T. Rowe Price Treasury Reserve Fund, organized as money market funds, or the T. Rowe Price Short-Term Fund, a short-term bond fund
T. ROWE PRICE QM U.S. BOND ETF
(collectively, the Price Reserve Funds). The Price Reserve Funds are offered as short-term investment options to mutual funds, trusts, and other accounts managed by Price Associates or its affiliates and are not available for direct purchase by members of the public.
As of October 31, 2021, T. Rowe Price Group, Inc., or its wholly owned subsidiaries, owned 400,000 shares of the fund, representing 73% of the fund’s net assets.
The fund may participate in securities purchase and sale transactions with other funds or accounts advised by Price Associates (cross trades), in accordance with procedures adopted by the fund’s Board and Securities and Exchange Commission rules, which require, among other things, that such purchase and sale cross trades be effected at the independent current market price of the security. During the period ended October 31, 2021, the fund had no purchases or sales cross trades with other funds or accounts advised by Price Associates.
NOTE 7 – OTHER MATTERS
Unpredictable events such as environmental or natural disasters, war, terrorism, pandemics, outbreaks of infectious diseases, and similar public health threats may significantly affect the economy and the markets and issuers in which a fund invests. Certain events may cause instability across global markets, including reduced liquidity and disruptions in trading markets, while some events may affect certain geographic regions, countries, sectors, and industries more significantly than others, and exacerbate other pre-existing political, social, and economic risks. The fund’s performance could be negatively impacted if the value of a portfolio holding were harmed by such events. Since 2020, a novel strain of coronavirus (COVID-19) has resulted in disruptions to global business activity and caused significant volatility and declines in global financial markets. The duration of this outbreak or others and their effects cannot be determined with certainty.
T. ROWE PRICE QM U.S. BOND ETF
REPORT OF INDEPENDENT REGISTERED PUBLIC ACCOUNTING FIRM
To the Board of Directors of T. Rowe Price Exchange-Traded Funds, Inc. and Shareholders of T. Rowe Price QM U.S. Bond ETF
Opinion on the Financial Statements
We have audited the accompanying statement of assets and liabilities, including the portfolio of investments, of T. Rowe Price QM U.S. Bond ETF (one of the funds constituting T. Rowe Price Exchange-Traded Funds, Inc., referred to hereafter as the "Fund") as of October 31, 2021, and the related statements of operations and changes in net assets, including the related notes, and the financial highlights for the period September 28, 2021 (Inception) through October 31, 2021 (collectively referred to as the “financial statements”). In our opinion, the financial statements present fairly, in all material respects, the financial position of the Fund as of October 31, 2021, and the results of its operations, changes in its net assets, and the financial highlights for the period September 28, 2021 (Inception) through October 31, 2021 in conformity with accounting principles generally accepted in the United States of America.
Basis for Opinion
These financial statements are the responsibility of the Fund’s management. Our responsibility is to express an opinion on the Fund’s financial statements based on our audit. We are a public accounting firm registered with the Public Company Accounting Oversight Board (United States) (PCAOB) and are required to be independent with respect to the Fund in accordance with the U.S. federal securities laws and the applicable rules and regulations of the Securities and Exchange Commission and the PCAOB.
We conducted our audit of these financial statements in accordance with the standards of the PCAOB. Those standards require that we plan and perform the audit to obtain reasonable assurance about whether the financial statements are free of material misstatement, whether due to error or fraud.
T. ROWE PRICE QM U.S. BOND ETF
REPORT OF INDEPENDENT REGISTERED PUBLIC ACCOUNTING FIRM
(CONTINUED)
Our audit included performing procedures to assess the risks of material misstatement of the financial statements, whether due to error or fraud, and performing procedures that respond to those risks. Such procedures included examining, on a test basis, evidence regarding the amounts and disclosures in the financial statements. Our audit also included evaluating the accounting principles used and significant estimates made by management, as well as evaluating the overall presentation of the financial statements. Our procedures included confirmation of securities owned as of October 31, 2021 by correspondence with the custodian, transfer agent and brokers; when replies were not received from brokers, we performed other auditing procedures. We believe that our audit provides a reasonable basis for our opinion.
PricewaterhouseCoopers LLP
Baltimore, Maryland
December 17, 2021
We have served as the auditor of one or more investment companies in the T. Rowe Price group of investment companies since 1973.
T. ROWE PRICE QM U.S. BOND ETF
TAX INFORMATION (UNAUDITED) FOR THE TAX YEAR ENDED 10/31/21
We are providing this information as required by the Internal Revenue Code. The amounts shown may differ from those elsewhere in this report because of differences between tax and financial reporting requirements.
For nonresident alien shareholders, $27,000 of income dividends are interest-related dividends.
INFORMATION ON PROXY VOTING POLICIES, PROCEDURES, AND RECORDS
A description of the policies and procedures used by T. Rowe Price funds and portfolios to determine how to vote proxies relating to portfolio securities is available in each fund’s Statement of Additional Information. You may request this document by calling 1-800-638-5660 or by accessing the SEC’s website, sec.gov.
The description of our proxy voting policies and procedures is also available on our corporate website. To access it, please visit the following Web page:
https://www.troweprice.com/corporate/en/utility/policies.html
Scroll down to the section near the bottom of the page that says, “Proxy Voting Policies.” Click on the Proxy Voting Policies link in the shaded box.
Each fund’s most recent annual proxy voting record is available on our website and through the SEC’s website. To access it through T. Rowe Price, visit the website location shown above, and scroll down to the section near the bottom of the page that says, “Proxy Voting Records.” Click on the Proxy Voting Records link in the shaded box.
HOW TO OBTAIN QUARTERLY PORTFOLIO HOLDINGS
The fund files a complete schedule of portfolio holdings with the Securities and Exchange Commission (SEC) for the first and third quarters of each fiscal year as an exhibit to its reports on Form N-PORT. The fund’s Form N-PORT is available electronically on the SEC’s website (sec.gov).
T. ROWE PRICE QM U.S. BOND ETF
ABOUT THE FUND’S DIRECTORS AND OFFICERS
Your fund is overseen by a Board of Directors (Board) that meets regularly to review a wide variety of matters affecting or potentially affecting the fund, including performance, investment programs, compliance matters, advisory fees and expenses, service providers, and business and regulatory affairs. The Board elects the fund’s officers, who are listed in the final table. At least 75% of the Board’s members are considered to be independent, i.e., not “interested persons” as defined in Section 2(a)(19) of the 1940 Act, of the Boards of T. Rowe Price Associates, Inc. (T. Rowe Price), and its affiliates; “interested” directors and officers are employees of T. Rowe Price. The business address of each director and officer is 100 East Pratt Street, Baltimore, Maryland 21202. The Statement of Additional Information includes additional information about the fund directors and is available without charge by calling a T. Rowe Price representative at 1-800-638-5660.
INDEPENDENT DIRECTORS(a)
Name
(Year of Birth)
Year Elected
[Number of T. Rowe Price
Portfolios Overseen] | Principal Occupation(s) and Directorships of Public Companies and
Other Investment Companies During the Past Five Years |
Teresa Bryce Bazemore
(1959)
2020
[204] | President and Chief Executive Officer, Federal Home Loan
Bank of San Francisco (2021 to present); President, Radian Guaranty (2008 to 2017); Chief Executive Officer, Bazemore Consulting LLC (2018 to 2021); Director, Chimera Investment Corporation (2017 to 2021); Director, First Industrial Realty Trust (2020 to present); Director, Federal Home Loan Bank of Pittsburgh (2017 to 2019) |
Ronald J. Daniels
(1959)
2018
[204] | President, The Johns Hopkins University(b) and Professor, Political Science Department, The Johns Hopkins University (2009 to present); Director, Lyndhurst Holdings (2015 to present); Director, BridgeBio Pharma, Inc. (2020 to present) |
Bruce W. Duncan
(1951)
2020
[204] | President, Chief Executive Officer, and Director, CyrusOne, Inc. (2020 to 2021 present); Chief Executive Officer and Director (2009 to 2016), Chair of the Board (2016 to 2020), and President (2009 to 2016), First Industrial Realty Trust, owner and operator of industrial properties; Chair of the Board (2005 to 2016) and Director (1999 to 2016), Starwood Hotels & Resorts, a hotel and leisure company; Member, Investment Company Institute Board of Governors (2017 to 2019); Member, Independent Directors Council Governing Board (2017 to 2019); Senior Advisor, KKR (2018 to present); Director, Boston Properties (2016 to present); Director, Marriott International, Inc. (2016 to 2020) |
Robert J. Gerrard, Jr.
(1952)
2020
[204] | Advisory Board Member, Pipeline Crisis/Winning Strategies, a
collaborative working to improve opportunities for young African
Americans (1997 to 2016); Chair of the Board, Price Mutual Funds
(July 2018 to present), and Price Funds (July 2019 to present) |
T. ROWE PRICE QM U.S. BOND ETF
INDEPENDENT DIRECTORS(a) (continued)
Name
(Year of Birth)
Year Elected
[Number of T. Rowe Price
Portfolios Overseen] | Principal Occupation(s) and Directorships of Public Companies and
Other Investment Companies During the Past Five Years |
Paul F. McBride
(1956)
2020
[204] | Advisory Board Member, Vizzia Technologies (2015 to present); Board
Member, Dunbar Armored (2012 to 2018) |
John G. Schreiber
(1946)
2020
[204] | Owner/President, Centaur Capital Partners, Inc., a real estate investment company (1991 to present); Cofounder, Partner, and Cochairman of the Investment Committee, Blackstone Real Estate Advisors, L.P. (1992 to 2015); Director, Blackstone Mortgage Trust, a real estate finance company (2012 to 2016); Director and Chairman of the Board, Brixmor Property Group, Inc. (2013 to present); Director, Hilton Worldwide (2007 to present); Director, Hudson Pacific Properties (2014 to 2016); Director, Invitation Homes (2014 to 2017); Director, JMB Realty Corporation (1980 to present) |
(a)All information about the independent directors was current as of December 31, 2020, unless otherwise indicated, except for the number of portfolios overseen, which is current as of the date of this report.
(b)William J. Stromberg, chair of the Board, director, and chief executive officer of T. Rowe Price Group, Inc., the parent company of the Price Funds’ investment advisor, has served on the Board of Trustees of Johns Hopkins University since 2014.
T. ROWE PRICE QM U.S. BOND ETF
INTERESTED DIRECTORS(a)
Name
(Year of Birth)
Year Elected
[Number of T. Rowe Price
Portfolios Overseen] | Principal Occupation(s) and Directorships of Public Companies and
Other Investment Companies During the Past Five Years |
David Oestreicher
(1967)
2020
[204] | General Counsel, Vice President, and Secretary, T. Rowe Price Group, Inc.; Chair of the Board, Chief Executive Officer, President, and Secretary, T. Rowe Price Trust Company; Director, Vice President, and Secretary, T. Rowe Price, T. Rowe Price Investment Services, Inc.; T. Rowe Price Retirement Plan Services, Inc., and T. Rowe Price Services, Inc.; Director and Secretary, T. Rowe Price Investment Management, Inc.; Vice President and Secretary, T. Rowe Price International (Price International); Vice President, T. Rowe Price Hong Kong (Price Hong Kong), T. Rowe Price Japan (Price Japan) and T. Rowe Price Singapore (Price Singapore); Principal Executive Officer and Executive Vice President, all funds |
Robert W. Sharps, CFA, CPA
(1971)
2020
[204] | Director and Vice President, T. Rowe Price; President, T. Rowe
Price Group, Inc.; Director, T. Rowe Price Investment Management, Inc.;
Vice President, T. Rowe Price Trust Company; President,
Exchange-Traded Funds, Inc. |
(a)All information about the interested directors was current as of December 31, 2020, unless otherwise indicated, except for the number of portfolios overseen, which is current as of the date of this report.
OFFICERS
Name (Year of Birth)
Position Held With QM U.S.
Bond Index ETF | Principal Occupation(s) |
Timothy Coyne (1967)
Executive Vice President | Vice President, T. Rowe Price and T. Rowe Price Group, Inc. |
Alan S. Dupski, CPA (1982)
Principal Financial Officer, Vice
President, and Treasurer | Vice President, T. Rowe Price, T. Rowe Price Group, Inc., and T. Rowe Price Trust Company |
Joseph B. Fath, CPA (1971)
Executive Vice President | Vice President, T. Rowe Price, T. Rowe Price Group, Inc., and T. Rowe Price Trust Company |
John R. Gilner (1961)
Chief Compliance Officer | Chief Compliance Officer and Vice President, T. Rowe Price; Vice President, T. Rowe Price Group, Inc., and T. Rowe Price Investment Services, Inc. |
Gary J. Greb (1961)
Vice President | Vice President, T. Rowe Price, Price International, and T. Rowe Price Trust Company |
Unless otherwise noted, officers have been employees of T. Rowe Price or T. Rowe Price International for at least 5 years.
T. ROWE PRICE QM U.S. BOND ETF
OFFICERS (continued)
Name (Year of Birth)
Position Held With QM U.S.
Bond Index ETF | Principal Occupation(s) |
Ann M. Holcomb, CFA (1972)
Executive Vice President | Vice President, T. Rowe Price, T. Rowe Price Group, Inc., and T. Rowe Price Trust Company |
Thomas J. Huber, CFA (1966)
Executive Vice President | Vice President, T. Rowe Price, T. Rowe Price Group, Inc., and T. Rowe Price Trust Company |
Paul J. Krug, CPA (1964)
Vice President | Vice President, T. Rowe Price, T. Rowe Price Group, Inc., and T. Rowe Price Trust Company |
John D. Linehan, CFA (1965)
Executive Vice President | Vice President, T. Rowe Price, T. Rowe Price Group, Inc., and T. Rowe Price Trust Company |
Joshua Nelson (1977)
Executive Vice President | Vice President, T. Rowe Price, T. Rowe Price Group, Inc., Price International, and T. Rowe Price Trust Company |
Fran M. Pollack-Matz (1961)
Vice President and Secretary | Vice President, T. Rowe Price, T. Rowe Price Group, Inc., T. Rowe Price Investment Services, Inc., and T. Rowe Price Services, Inc. |
Jason Benjamin Polun, CFA (1974)
Executive Vice President | Vice President, T. Rowe Price, T. Rowe Price Group, Inc., and T. Rowe Price Trust Company |
Larry J. Puglia, CFA, CPA (1960)
Executive Vice President | Vice President, T. Rowe Price, T. Rowe Price Group, Inc., and T. Rowe Price Trust Company |
Shannon H. Rauser (1987)
Assistant Secretary | Assistant Vice President, T. Rowe Price |
Megan Warren (1968)
Vice President | Vice President, T. Rowe Price, T. Rowe Price Group, Inc., T. Rowe Price Retirement Plan Services, Inc., T. Rowe Price Services, Inc., and T. Rowe Price Trust Company; formerly, Executive Director, JPMorgan Chase (to 2017) |
Thomas H. Watson (1977)
Executive Vice President | Director and Vice President, T. Rowe Price Trust Company; Vice President, T. Rowe Price and T. Rowe Price Group, Inc. |
Unless otherwise noted, officers have been employees of T. Rowe Price or T. Rowe Price International for at least 5 years.
This page intentionally left blank.
100 East Pratt Street
Baltimore, MD 21202
Call 1-800-638-5660 to request a prospectus or summary prospectus; each includes investment objectives, risks, fees, expenses, and other information that you should read and consider carefully before investing.
T. Rowe Price Investment Services, Inc.
Item 1. (b) Notice pursuant to Rule 30e-3.
Not applicable.
Item 2. Code of Ethics.
The registrant has adopted a code of ethics, as defined in Item 2 of Form N-CSR, applicable to its principal executive officer, principal financial officer, principal accounting officer or controller, or persons performing similar functions. A copy of this code of ethics is filed as an exhibit to this Form N-CSR. No substantive amendments were approved or waivers were granted to this code of ethics during the period covered by this report.
Item 3. Audit Committee Financial Expert.
The registrant’s Board of Directors/Trustees has determined that Ms. Teresa Bryce Bazemore qualifies as an audit committee financial expert, as defined in Item 3 of Form N-CSR. Ms. Bazemore is considered independent for purposes of Item 3 of Form N-CSR.
Item 4. Principal Accountant Fees and Services.
(a) – (d) Aggregate fees billed for the last two fiscal years for professional services rendered to, or on behalf of, the registrant by the registrant’s principal accountant were as follows:
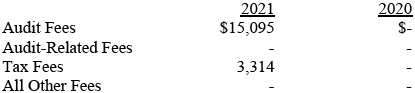
Audit fees include amounts related to the audit of the registrant’s annual financial statements and services normally provided by the accountant in connection with statutory and regulatory filings. Audit-related fees include amounts reasonably related to the performance of the audit of the registrant’s financial statements and specifically include the issuance of a report on internal controls and, if applicable, agreed-upon procedures related to fund acquisitions. Tax fees include amounts related to services for tax compliance, tax planning, and tax advice. The nature of these services specifically includes the review of distribution calculations and the preparation of Federal, state, and excise tax returns. All other fees include the registrant’s pro-rata share of amounts for agreed-upon procedures in conjunction with service contract approvals by the registrant’s Board of Directors/Trustees.
(e)(1) The registrant’s audit committee has adopted a policy whereby audit and non-audit services performed by the registrant’s principal accountant for the registrant, its investment adviser, and any entity controlling, controlled by, or under common control with the investment adviser that provides ongoing services to the registrant require pre-approval in advance at regularly scheduled audit committee meetings. If such a service is required between regularly scheduled audit committee meetings, pre-approval may be authorized by one audit committee member with ratification at the next scheduled audit committee meeting. Waiver of pre-approval for audit or non-audit services requiring fees of a de minimis amount is not permitted.
(2) No services included in (b) – (d) above were approved pursuant to paragraph (c)(7)(i)(C) of Rule 2-01 of Regulation S-X.
(f) Less than 50 percent of the hours expended on the principal accountant’s engagement to audit the registrant’s financial statements for the most recent fiscal year were attributed to work performed by persons other than the principal accountant’s full-time, permanent employees.
(g) The aggregate fees billed for the most recent fiscal year and the preceding fiscal year by the registrant’s principal accountant for non-audit services rendered to the registrant, its investment adviser, and any entity controlling, controlled by, or under common control with the investment adviser that provides ongoing services to the registrant were $3,600,000 and $3,627,000, respectively.
(h) All non-audit services rendered in (g) above were pre-approved by the registrant’s audit committee. Accordingly, these services were considered by the registrant’s audit committee in maintaining the principal accountant’s independence.
Item 5. Audit Committee of Listed Registrants.
Not applicable.
Item 6. Investments.
(a) Not applicable. The complete schedule of investments is included in Item 1 of this Form N-CSR.
(b) Not applicable.
Item 7. Disclosure of Proxy Voting Policies and Procedures for Closed-End Management Investment Companies.
Not applicable.
Item 8. Portfolio Managers of Closed-End Management Investment Companies.
Not applicable.
Item 9. Purchases of Equity Securities by Closed-End Management Investment Company and Affiliated Purchasers.
Not applicable.
Item 10. Submission of Matters to a Vote of Security Holders.
There has been no change to the procedures by which shareholders may recommend nominees to the registrant’s board of directors.
Item 11. Controls and Procedures.
(a) The registrant’s principal executive officer and principal financial officer have evaluated the registrant’s disclosure controls and procedures within 90 days of this filing and have concluded that the registrant’s disclosure controls and procedures were effective, as of that date, in ensuring that information required to be disclosed by the registrant in this Form N-CSR was recorded, processed, summarized, and reported timely.
(b) The registrant’s principal executive officer and principal financial officer are aware of no change in the registrant’s internal control over financial reporting that occurred during the period covered by this report that has materially affected, or is reasonably likely to materially affect, the registrant’s internal control over financial reporting.
Item 12. Disclosure of Securities Lending Activities for Closed-End Management Investment Companies.
Not applicable.
Item 13. Exhibits.
(a)(1) The registrant’s code of ethics pursuant to Item 2 of Form N-CSR is attached.
(2) Separate certifications by the registrant's principal executive officer and principal financial officer, pursuant to Section 302 of the Sarbanes-Oxley Act of 2002 and required by Rule 30a-2(a) under the Investment Company Act of 1940, are attached.
(3) Written solicitation to repurchase securities issued by closed-end companies: not applicable.
(b) A certification by the registrant's principal executive officer and principal financial officer, pursuant to Section 906 of the Sarbanes-Oxley Act of 2002 and required by Rule 30a-2(b) under the Investment Company Act of 1940, is attached.
SIGNATURES
Pursuant to the requirements of the Securities Exchange Act of 1934 and the Investment Company Act of 1940, the registrant has duly caused this report to be signed on its behalf by the undersigned, thereunto duly authorized.
T. Rowe Price Exchange-Traded Funds, Inc.
| By | | /s/ David Oestreicher |
| | | David Oestreicher |
| | | Principal Executive Officer |
| |
| Date | | December 17, 2021 | | | | |
Pursuant to the requirements of the Securities Exchange Act of 1934 and the Investment Company Act of 1940, this report has been signed below by the following persons on behalf of the registrant and in the capacities and on the dates indicated.
| By | | /s/ David Oestreicher |
| | | David Oestreicher |
| | | Principal Executive Officer |
| |
| Date | | December 17, 2021 | | | | |
| |
| |
| By | | /s/ Alan S. Dupski |
| | | Alan S. Dupski |
| | | Principal Financial Officer |
| |
| Date | | December 17, 2021 | | | | |