UNITED STATES
SECURITIES AND EXCHANGE COMMISSION
Washington, D.C. 20549
FORM N-CSR
CERTIFIED SHAREHOLDER REPORT OF REGISTERED
MANAGEMENT INVESTMENT COMPANIES
Investment Company Act File Number: 811-23494
| T. Rowe Price Exchange-Traded Funds, Inc. |
|
| (Exact name of registrant as specified in charter) |
| |
| 100 East Pratt Street, Baltimore, MD 21202 |
|
| (Address of principal executive offices) |
| |
| David Oestreicher |
| 100 East Pratt Street, Baltimore, MD 21202 |
|
| (Name and address of agent for service) |
Registrant’s telephone number, including area code: (410) 345-2000
Date of fiscal year end: December 31
Date of reporting period: December 31, 2021
Item 1. Reports to Shareholders
(a) Report pursuant to Rule 30e-1.
ANNUAL REPORT
December 31, 2021
| | T. ROWE PRICE |
| TSPA | U.S. Equity Research ETF |
| | For more insights from T. Rowe Price investment professionals, go to troweprice.com. |
T. ROWE PRICE U.S. EQUITY RESEARCH ETF
HIGHLIGHTS
| ■ | The U.S. Equity Research ETF performed in line with the S&P 500 Index (based on net asset value and market price) from its inception, on June 8, 2021, through December 31, 2021. |
| ■ | Stock selection in six of 11 sectors contributed to relative returns during the reporting period. |
| ■ | Information technology, health care, consumer discretionary, and financials were the fund’s largest sector allocations in absolute terms. |
| ■ | After back-to-back years of remarkable gains, we think equity markets face more uncertain prospects in 2022. Higher inflation and a shift toward monetary tightening pose potential challenges for economic growth and earnings—at a time when valuations appear elevated across many asset categories. |
Sign up for e-delivery of your statements, confirmations, and prospectuses or shareholder reports.
If you invest directly with T. Rowe Price, go to troweprice.com/paperless.
If you invest through an investment advisor, a bank, or a brokerage firm, please contact that organization and ask if it can provide electronic documentation.
It’s fast—receive your statements and
confirmations faster than U.S. mail.
It’s convenient—access your important account documents whenever you need them.
It’s secure—we protect your online accounts using “True Identity” to confirm new accounts and make verification faster and more secure.
It can save you money—where applicable,
T. Rowe Price passes on the cost savings to
fund holders.*
Log in to your account at troweprice.com for more information.
*Certain mutual fund accounts that are assessed an annual account service fee can also save money by switching to e-delivery.
T. ROWE PRICE U.S. EQUITY RESEARCH ETF
Market Commentary
Dear Shareholders
Major stock and bond indexes produced mixed results during 2021 as strong corporate earnings growth and a recovering economy contended with worries about inflation, new coronavirus variants, and less accommodative central banks. Most developed market stock benchmarks finished the year with positive returns, although gains slowed in the second half of the year, while fixed income returns faced headwinds from rising interest rates.
Large-cap U.S. growth stocks delivered the strongest returns, but solid results were common in many developed markets. However, emerging markets stock benchmarks struggled amid a significant equity market downturn in China.
The large-cap S&P 500 Index returned almost 29%, marking its third straight year of positive returns. Robust results were widespread across the benchmark—according to Bloomberg data, 2021 marked the first year that all of the S&P 500 sectors recorded double-digit gains. The energy sector, which was the worst performer in 2020, was the leader in 2021 amid a sharp increase in oil prices, and real estate stocks also rebounded from a down year as strong demand led to rising rents. Financial and information technology stocks also produced excellent returns and outperformed the broad market.
In the fixed income market, rising Treasury yields weighed on performance, but below investment-grade corporate bonds delivered solid results as they benefited from improving fundamentals and investor demand for higher-yielding securities. (Bond prices and yields move in opposite directions.)
A robust increase in corporate earnings growth appeared to be a significant performance driver during the year. According to FactSet, overall earnings for the S&P 500 rose 89% in the second quarter of 2021 versus the year before, the fastest pace since 2009, and while third-quarter earnings slowed, they continued to beat expectations at an impressive pace. Despite the significant rally in the S&P 500 during 2021, the index’s price/earnings ratio actually fell over that period as earnings rose faster than stock prices. Although economic growth showed signs of slowing at times, data remained generally positive through the end of the period. The unemployment rate, which started the year at 6.7%, fell to 3.9% by December, and job openings reached a record high.
However, optimism surrounding strong earnings and employment gains was tempered by inflation concerns. Prices surged as the release of pent-up demand and supply chain disruptions contributed to higher inflation around the globe.
T. ROWE PRICE U.S. EQUITY RESEARCH ETF
In the U.S., the 6.8% increase in the consumer price index for the 12-month period ended in November was the highest level since 1982, a factor that may have contributed to a decline in consumer sentiment late in the year.
Meanwhile, central banks began to move away from the extremely accommodative policies they instituted in response to the initial wave of the coronavirus. The Federal Reserve began trimming its purchases of Treasuries and agency mortgage-backed securities in November, and policymakers indicated that they could soon start raising short-term interest rates.
How markets respond to the normalization of monetary policy is an open question. While fading stimulus might pose some challenges for investors, I believe it could contribute to a return of price sensitivity in global markets, which bodes well for selective investors focused on fundamentals.
Elevated valuations, higher inflation, and the continuing struggle to control the pandemic also pose potential challenges for financial markets in 2022. However, on the positive side, household wealth gains, pent-up consumer demand, and a potential boom in capital expenditures could sustain growth even as monetary policy turns less supportive. In this environment, our investment teams will remain focused on using fundamental research to identify companies that can add value to your portfolio over the long term.
Thank you for your continued confidence in T. Rowe Price.
Sincerely,
Robert Sharps
President and CEO
T. ROWE PRICE U.S. EQUITY RESEARCH ETF
Management’s Discussion of Fund Performance
INVESTMENT OBJECTIVE
The fund seeks to provide long-term capital growth.
FUND COMMENTARY
How did the fund perform since inception?
The U.S. Equity Research ETF returned 13.51% (based on net asset value) and 13.59% (at market price) from its inception on June 8, 2021, through December 31, 2021. The fund performed in line with its benchmark, the S&P 500 Index, and outperformed its Lipper peer group. (Past performance cannot guarantee future results.)
What factors influenced the fund’s performance?
The fund’s objective is to outperform the S&P 500 by investing in our research analysts’ highest-conviction stocks while keeping sector and industry allocations close to their weightings in the index. Stock selection in six of 11 sectors
PERFORMANCE COMPARISON
| | Total Return |
| Periods Ended 12/31/21 | 6 Months | Since
Inception
6/8/21 |
| | | |
| U.S. Equity Research ETF (Based on Net Asset Value) | 11.68% | 13.51% |
| U.S. Equity Research ETF (At Market Price)* | 11.67 | 13.59 |
| S&P 500 Index | 11.67 | 13.61 |
| Lipper Large-Cap Core Funds Index | 9.69 | 10.92 |
*Market returns are based on the midpoint of the bid/ask spread at market close (typically, 4 p.m. ET) and do not represent returns an investor would have received if shares were traded at other times.
T. ROWE PRICE U.S. EQUITY RESEARCH ETF
contributed to relative performance during the since-inception period. The industrials and business services, consumer discretionary, and information technology sectors detracted the most from relative performance; while the financials, materials, and energy sectors were the largest contributors on a relative basis.
Stock selection in the industrials and business services sector was the largest detractor from the fund’s relative performance versus the S&P 500 Index. An overweight position in industrial conglomerate GE weighed on relative results. While investors initially applauded the company’s plan to split into three separate companies, shares sharply declined in the following days. Shares were further hampered on concerns that the omicron variant of the coronavirus would weigh on the company’s aviation business. We feel optimistic about the stock’s idiosyncratic growth potential as the company’s end markets continue to improve and management’s cost-cutting actions take hold. We believe the company’s plan to split will be beneficial for shareholders. (Please refer to the fund’s portfolio of investments for a complete list of holdings and the amount each represents in the portfolio.)
An underweight position in automaker Tesla detracted from relative gains in the consumer discretionary sector. Shares advanced on the back of strong automotive gross margins, deliveries, and average selling price. Later in the period, the stock further benefited from news that rental car company Hertz Global Holdings had placed an order for 100,000 vehicles with Tesla. We appreciate the automaker’s high level of differentiated innovation in electric vehicles and autonomous driving software and the long-term growth potential associated with these technologies. While we added to our position during the period, we remain underweight due to valuation concerns.
A nonindex position in Zoom Video Communications also weighed on relative results in the information technology sector as the stock declined during much of the year. While the company reported a string of better-than-expected quarterly earnings, shares were pressured by investor and analyst concerns about the company’s slowing growth. We have tempered our expectations; however, we think Zoom’s valuation is well supported by strength in its non-small business segments. Furthermore, we believe Zoom’s global product, viral adoption model, and ecosystem strategy will allow it to maintain its leadership in converting users to paid customers.
Conversely, stock selection in the financials sector contributed, led by an overweight position in Signature Bank. Shares of the New York metro bank benefited from strong annualized loan growth and even stronger annualized deposit growth, driven in part by Signet, its real-time digital payments platform.
T. ROWE PRICE U.S. EQUITY RESEARCH ETF
We have a positive view of the company’s growth-oriented focus and unique culture. A renewed emphasis on commercial and industrial loans and an extension to the West Coast support longer-term growth prospects.
An overweight position in paint and coatings manufacturer Sherwin-Williams added value in the materials sector. During the period, the company benefited from strong demand in its professional architectural and industrial end markets despite raw material supply chain headwinds. We value Sherwin-Williams for its high free cash flow that generates solid returns on invested capital, its strong balance sheet, and, in our view, the best management team in the chemicals space.
Within the energy sector, stock selection helped relative results. An overweight position in ConocoPhillips, a global exploration and production company, contributed to relative gains as investors also applauded the company’s announcement in September that it would acquire Shell’s oil and gas assets in the Permian Basin. Later in the period, the company reported better-than-expected earnings from its recent quarter, driven by rising oil prices as well as progress in integrating recent acquisition Concho Resources. We appreciate the company’s solid management team, strong balance sheet, business model, and capital discipline approach.
How is the fund positioned?
Similar to the S&P 500 Index, information technology, health care, consumer discretionary, and financials were the fund’s largest sector positions in absolute terms and represented more than 60% of the fund’s net assets at the end of the period.
Banking company Wells Fargo, IT services firm Fiserv, and global search leader Alphabet represented the fund’s largest overweight stocks versus the benchmark. We believe Wells Fargo has efficiency opportunities across its four segments that should drive incremental earnings growth. We also have a favorable view of the bank’s interest rate sensitivity. We believe that Fiserv is well positioned to enjoy a multiyear period of above-average organic growth as the penetration rate of mobile banking continues to increase. We like Fiserv’s combination of stable earnings growth, a defensive earnings profile, and attractive free cash flow yield. We like that the desktop-to-mobile transition has only further entrenched Alphabet’s search market share dominance with the benefit of Android OS distribution leverage and Chrome mobile browser ubiquity. The company continues to dial up monetization on established properties like Google Maps while prioritizing engagement over ad load for promising new surfaces like Google Discover.
T. ROWE PRICE U.S. EQUITY RESEARCH ETF
Notable additions to the portfolio during the period included semiconductor company KLA Corporation, pharmaceuticals company Pfizer, and large U.S. money center bank Citigroup.
What is portfolio management’s outlook?
After back-to-back years of strong performance across most equity sectors, markets face more uncertain prospects in 2022. Investors will need to use greater selectivity to identify potential opportunities. Higher inflation, a shift toward monetary tightening, and new coronavirus variants all pose potential challenges for economic growth and earnings—at a time when valuations appear elevated across many asset categories.
SECTOR DIVERSIFICATION
| | Percentage of
Net Assets |
| | 12/31/21 |
| Information Technology | 29.1% |
| Health Care | 12.5 |
| Consumer Discretionary | 12.5 |
| Financials | 11.6 |
| Communication Services | 10.9 |
| Industrials and Business Services | 6.7 |
| Consumer Staples | 5.6 |
| Utilities | 2.9 |
| Materials | 2.9 |
| Real Estate | 2.3 |
| Energy | 2.3 |
| Other and Reserves | 0.7 |
| Total | 100.0% |
Historical weightings reflect current industry/sector classifications.
T. ROWE PRICE U.S. EQUITY RESEARCH ETF
Many believe that, as governments and central banks withdraw the massive stimulus applied during the pandemic, economic growth inevitably will slow sharply. But slower growth doesn’t necessarily mean low growth. A number of tailwinds should sustain the recovery in 2022, including strong consumer and corporate balance sheets. In terms of equity valuations, much will depend on the strength of earnings growth in an environment where the spread of coronavirus variants and the potential for rising interest rates both pose significant—if contrary—risks to the global economic recovery.
Regardless of the stock market’s day-to-day performance, our investment strategy remains the same—rely on the insights of our research analysts to identify favorable long-term investment opportunities in each sector of the S&P 500 Index while keeping sector weights close to those of the benchmark.
The views expressed reflect the opinions of T. Rowe Price as of the date of this report and are subject to change based on changes in market, economic, or other conditions. These views are not intended to be a forecast of future events and are no guarantee of future results.
T. ROWE PRICE U.S. EQUITY RESEARCH ETF
RISKS OF STOCK INVESTING
As with all stock mutual funds, the fund’s share price can fall because of weakness in the stock market, a particular industry, or specific holdings. Stock markets can decline for many reasons, including adverse political or economic developments, changes in investor psychology, or heavy institutional selling. The prospects for an industry or company may deteriorate because of a variety of factors, including disappointing earnings or changes in the competitive environment. In addition, the investment manager’s assessment of companies held in a fund may prove incorrect, resulting in losses or poor performance even in rising markets.
BENCHMARK INFORMATION
Note: Lipper, a Thomson Reuters Company, is the source for all Lipper content reflected in these materials. Copyright 2022 © Refinitiv.All rights reserved. Any copying, republication or redistribution of Lipper content is expressly prohibited without the prior written consent of Lipper. Lipper shall not be liable for any errors or delays in the content, or for any actions taken in reliance thereon.
Note: ©2022, S&P Global Market Intelligence. Reproduction of any information, data or material, including ratings (Content) in any form is prohibited except with the prior written permission of the relevant party. Such party, its affiliates and suppliers (Content Providers) do not guarantee the accuracy, adequacy, completeness, timeliness or availability of any Content and are not responsible for any errors or omissions (negligent or otherwise), regardless of the cause, or for the results obtained from the use of such Content. In no event shall Content Providers be liable for any damages, costs, expenses, legal fees, or losses (including lost income or lost profit and opportunity costs) in connection with any use of the Content.
T. ROWE PRICE U.S. EQUITY RESEARCH ETF
PORTFOLIO HIGHLIGHTS
TWENTY-FIVE LARGEST HOLDINGS
| | Percent of
Net Assets |
| | 12/31/21 |
| Apple | 7.0% |
| Microsoft | 6.5 |
| Alphabet | 4.8 |
| Amazon.com | 3.8 |
| Meta Platforms | 2.4 |
| NVIDIA | 1.9 |
| Wells Fargo | 1.3 |
| UnitedHealth Group | 1.3 |
| Tesla | 1.3 |
| Home Depot | 1.2 |
| Visa | 1.2 |
| Berkshire Hathaway | 1.1 |
| AbbVie | 1.1 |
| Salesforce.com | 1.1 |
| Eli Lilly and Co. | 1.1 |
| Broadcom | 0.9 |
| Bank of America | 0.9 |
| Comcast | 0.9 |
| Fiserv | 0.9 |
| Procter & Gamble | 0.8 |
| Netflix | 0.8 |
| Intuitive Surgical | 0.8 |
| Thermo Fisher Scientific | 0.8 |
| GE | 0.8 |
| Accenture | 0.8 |
| Total | 45.5% |
Note: The information shown does not reflect any exchange-traded funds (ETFs), cash reserves, or collateral for securities lending that may be held in the portfolio.
T. ROWE PRICE U.S. EQUITY RESEARCH ETF
AVERAGE ANNUAL COMPOUND TOTAL RETURN
| Period Ended 12/31/21 | Since
Inception
6/8/21 |
| U.S. Equity Research ETF (Based on Net Asset Value) | 13.51%* |
| U.S. Equity Research ETF (At Market Price) | 13.59* |
The fund’s performance information represents only past performance and is not necessarily an indication of future results. Current performance may be lower or higher than the performance data cited. Share price, principal value, and return will vary, and you may have a gain or loss when you sell your shares. For the most recent month-end performance, please visit our website (troweprice.com).
This table shows how the fund would have performed each year if its actual (or cumulative) returns for the periods shown had been earned at a constant rate. Average annual total return figures include changes in principal value, reinvested dividends, and capital gain distributions. Returns do not reflect taxes that the shareholder may pay on fund distributions or the redemption of fund shares. When assessing performance, investors should consider both short- and long-term returns.
*Returns for periods of less than one year are not annualized.
PREMIUM/DISCOUNT INFORMATION
The frequency at which the daily market prices were at a discount or premium to the fund’s net asset value is available on the fund’s website (troweprice.com).
EXPENSE RATIO
| U.S. Equity Research ETF | 0.34% |
The expense ratio shown is as of the fund’s most recent prospectus. This number may vary from the expense ratio shown elsewhere in this report because it is based on a different time period and, if applicable, includes acquired fund fees and expenses but does not include fee or expense waivers.
T. ROWE PRICE U.S. EQUITY RESEARCH ETF
FUND EXPENSE EXAMPLE
As a shareholder, you may incur two types of costs: (1) transaction costs, such as brokerage commissions on purchases and sales, and (2) ongoing costs, including management fees and other fund expenses. The following example is intended to help you understand your ongoing costs (in dollars) of investing in the fund and to compare these costs with the ongoing costs of investing in other funds. The example is based on an investment of $1,000 invested at the beginning of the most recent six-month period and held for the entire period.
Actual Expenses
The first line of the following table (Actual) provides information about actual account values and expenses based on the fund’s actual returns. You may use the information on this line, together with your account balance, to estimate the expenses that you paid over the period. Simply divide your account value by $1,000 (for example, an $8,600 account value divided by $1,000 = 8.6), then multiply the result by the number on the first line under the heading “Expenses Paid During Period” to estimate the expenses you paid on your account during this period.
Hypothetical Example for Comparison Purposes
The information on the second line of the table (Hypothetical) is based on hypothetical account values and expenses derived from the fund’s actual expense ratio and an assumed 5% per year rate of return before expenses (not the fund’s actual return). You may compare the ongoing costs of investing in the fund with other funds by contrasting this 5% hypothetical example and the 5% hypothetical examples that appear in the shareholder reports of the other funds. The hypothetical account values and expenses may not be used to estimate the actual ending account balance or expenses you paid for the period.
You should also be aware that the expenses shown in the table highlight only your ongoing costs and do not reflect any transaction costs, such as brokerage commissions paid on purchases and sales of shares. Therefore, the second line of the table is useful in comparing ongoing costs only and will not help you determine the relative total costs of owning different funds. To the extent a fund charges transaction costs, however, the total cost of owning that fund is higher.
T. ROWE PRICE U.S. EQUITY RESEARCH ETF
FUND EXPENSE EXAMPLE (continued)
T. Rowe Price U.S. Equity Research ETF
| | Beginning
Account Value
7/1/21 | Ending
Account Value
12/31/21 | Expenses Paid
During Period*
7/1/21 to 12/31/21 |
| Actual | $1,000.00 | $1,116.80 | $1.81 |
| Hypothetical (assumes 5% return before expenses) | 1,000.00 | 1,023.49 | 1.73 |
| * | Expenses are equal to the fund’s annualized expense ratio for the 6-month period (0.34%), multiplied by the average account value over the period, multiplied by the number of days in the most recent fiscal half year (184), and divided by the days in the year (365) to reflect the half-year period. |
T. ROWE PRICE U.S. EQUITY RESEARCH ETF
For a share outstanding throughout the period
| | 6/8/21(1)
Through |
| | 12/31/21 |
| NET ASSET VALUE | |
| Beginning of period | $ 25.00 |
| Investment activities | |
| Net investment income(2) (3) | 0.14 |
| Net realized and unrealized gain/loss | 3.23 |
| Total from investment activities | 3.37 |
| Distributions | |
| Net investment income | (0.12) |
| NET ASSET VALUE | |
| End of period | $ 28.25 |
| Ratios/Supplemental Data |
| Total return, based on NAV(3) (4) | 13.51% |
Ratios to average net
assets:(3) | |
Gross expenses before
waivers/payments by
Price Associates | 0.34%(5) |
Net expenses after
waivers/payments by
Price Associates | 0.34%(5) |
| Net investment income | 0.92%(5) |
| Portfolio turnover rate(6) | 13.0% |
Net assets, end of period
(in thousands) | $ 23,165 |
| (1) | Inception date |
| (2) | Per share amounts calculated using average shares outstanding method. |
| (3) | See Note 5 for details to expense-related arrangements with Price Associates. |
| (4) | Total return reflects the rate that an investor would have earned on an investment in the fund during the period, assuming reinvestment of all distributions. Total return is not annualized for periods less than one year. |
| (5) | Annualized |
| (6) | Portfolio turnover excludes securities received or delivered through in-kind share transactions. |
The accompanying notes are an integral part of these financial statements.
T. ROWE PRICE U.S. EQUITY RESEARCH ETF
December 31, 2021
| PORTFOLIO OF INVESTMENTS‡ | Shares | $ Value |
| (Cost and value in $000s) | | |
| COMMON STOCKS 99.4% |
| COMMUNICATION SERVICES 10.9% |
| Diversified Telecommunication Services 0.6% | | |
| AT&T | 3,127 | 77 |
| Verizon Communications | 1,283 | 67 |
| | | 144 |
| Entertainment 1.5% | | |
| Electronic Arts | 261 | 34 |
| Netflix (1) | 320 | 193 |
| Playtika Holding (1) | 964 | 17 |
| Walt Disney (1) | 671 | 104 |
| | | 348 |
| Interactive Media & Services 7.2% | | |
| Alphabet, Class A (1) | 142 | 411 |
| Alphabet, Class C (1) | 236 | 683 |
| Meta Platforms, Class A (1) | 1,667 | 561 |
| | | 1,655 |
| Media 1.4% | | |
| Charter Communications, Class A (1) | 116 | 76 |
| Comcast, Class A | 3,941 | 198 |
| DISH Network, Class A (1) | 127 | 4 |
| Liberty Broadband, Class C (1) | 349 | 56 |
| | | 334 |
| Wireless Telecommunication Services 0.2% | | |
| T-Mobile US (1) | 447 | 52 |
| | | 52 |
| Total Communication Services | | 2,533 |
T. ROWE PRICE U.S. EQUITY RESEARCH ETF
| | Shares | $ Value |
| (Cost and value in $000s) | | |
| CONSUMER DISCRETIONARY 12.5% |
| Auto Components 0.3% | | |
| Aptiv (1) | 258 | 42 |
| Magna International | 382 | 31 |
| | | 73 |
| Automobiles 1.9% | | |
| Ferrari NV | 128 | 33 |
| General Motors (1) | 536 | 31 |
| Rivian Automotive, Class A (1) | 848 | 88 |
| Tesla (1) | 274 | 290 |
| | | 442 |
| Hotels Restaurants & Leisure 2.2% | | |
| Airbnb, Class A (1) | 30 | 5 |
| Booking Holdings (1) | 30 | 72 |
| Chipotle Mexican Grill (1) | 33 | 58 |
| Hilton Worldwide Holdings (1) | 358 | 56 |
| Las Vegas Sands (1) | 358 | 13 |
| Marriott International, Class A (1) | 374 | 62 |
| McDonald's | 347 | 93 |
| MGM Resorts International | 758 | 34 |
| Starbucks | 913 | 107 |
| Wynn Resorts (1) | 171 | 14 |
| | | 514 |
| Household Durables 0.2% | | |
| NVR (1) | 6 | 35 |
| | | 35 |
| Internet & Direct Marketing Retail 3.8% | | |
| Amazon.com (1) | 264 | 880 |
| DoorDash, Class A (1) | 49 | 8 |
| | | 888 |
T. ROWE PRICE U.S. EQUITY RESEARCH ETF
| | Shares | $ Value |
| (Cost and value in $000s) | | |
| Multiline Retail 0.4% | | |
| Dollar General | 205 | 48 |
| Dollar Tree (1) | 211 | 30 |
| | | 78 |
| Specialty Retail 2.9% | | |
| AutoZone (1) | 19 | 40 |
| Burlington Stores (1) | 162 | 47 |
| CarMax (1) | 112 | 15 |
| Home Depot | 672 | 279 |
| Lowe's | 339 | 88 |
| O'Reilly Automotive (1) | 95 | 67 |
| Ross Stores | 532 | 61 |
| TJX | 545 | 41 |
| Ulta Beauty (1) | 66 | 27 |
| | | 665 |
| Textiles, Apparel & Luxury Goods 0.8% | | |
| Lululemon Athletica (1) | 79 | 31 |
| NIKE, Class B | 889 | 148 |
| VF | 176 | 13 |
| | | 192 |
| Total Consumer Discretionary | | 2,887 |
| CONSUMER STAPLES 5.6% |
| Beverages 2.0% | | |
| Coca-Cola | 2,859 | 169 |
| Constellation Brands, Class A | 280 | 70 |
| Keurig Dr Pepper | 1,434 | 53 |
| Monster Beverage (1) | 504 | 49 |
| PepsiCo | 670 | 116 |
| | | 457 |
T. ROWE PRICE U.S. EQUITY RESEARCH ETF
| | Shares | $ Value |
| (Cost and value in $000s) | | |
| Food & Staples Retailing 0.9% | | |
| Costco Wholesale | 274 | 156 |
| Walmart | 390 | 56 |
| | | 212 |
| Food Products 0.7% | | |
| Conagra Brands | 523 | 18 |
| Darling Ingredients (1) | 118 | 8 |
| Mondelez International | 1,512 | 100 |
| Tyson Foods, Class A | 439 | 39 |
| | | 165 |
| Household Products 1.1% | | |
| Colgate-Palmolive | 58 | 5 |
| Kimberly-Clark | 326 | 47 |
| Procter & Gamble | 1,198 | 196 |
| | | 248 |
| Personal Products 0.2% | | |
| Estee Lauder, Class A | 166 | 61 |
| | | 61 |
| Tobacco 0.7% | | |
| Altria Group | 1,147 | 54 |
| Philip Morris International | 1,135 | 108 |
| | | 162 |
| Total Consumer Staples | | 1,305 |
| ENERGY 2.3% |
| Energy Equipment & Services 0.3% | | |
| Halliburton | 2,735 | 63 |
| | | 63 |
| Oil, Gas & Consumable Fuels 2.0% | | |
| Chevron | 668 | 78 |
T. ROWE PRICE U.S. EQUITY RESEARCH ETF
| | Shares | $ Value |
| (Cost and value in $000s) | | |
| ConocoPhillips | 1,922 | 139 |
| Devon Energy | 78 | 3 |
| EOG Resources | 647 | 57 |
| Exxon Mobil | 1,170 | 72 |
| Marathon Petroleum | 499 | 32 |
| Pioneer Natural Resources | 120 | 22 |
| TotalEnergies, ADR | 1,187 | 59 |
| | | 462 |
| Total Energy | | 525 |
| FINANCIALS 11.6% |
| Banks 4.8% | | |
| Bank of America | 4,698 | 209 |
| Citigroup | 1,401 | 85 |
| Citizens Financial Group | 1,169 | 55 |
| Fifth Third Bancorp | 3,050 | 133 |
| Huntington Bancshares | 6,877 | 106 |
| JPMorgan Chase & Co. | 463 | 73 |
| PNC Financial Services Group | 451 | 91 |
| Signature Bank | 179 | 58 |
| Wells Fargo & Co. | 6,344 | 304 |
| | | 1,114 |
| Capital Markets 3.1% | | |
| Apollo Global Management, Class A | 229 | 17 |
| Bank of New York Mellon | 476 | 28 |
| Cboe Global Markets | 287 | 38 |
| Charles Schwab | 1,417 | 119 |
| CME Group | 465 | 106 |
| Goldman Sachs Group | 330 | 126 |
| Intercontinental Exchange | 617 | 84 |
| Invesco | 576 | 13 |
| KKR & Co. | 599 | 45 |
| MarketAxess Holdings | 35 | 14 |
T. ROWE PRICE U.S. EQUITY RESEARCH ETF
| | Shares | $ Value |
| (Cost and value in $000s) | | |
| Morgan Stanley | 767 | 75 |
| S&P Global | 24 | 11 |
| State Street | 457 | 43 |
| Tradeweb Markets, Class A | 132 | 13 |
| | | 732 |
| Diversified Financial Services 1.6% | | |
| Berkshire Hathaway, Class B (1) | 882 | 264 |
| Equitable Holdings | 1,661 | 55 |
| Voya Financial | 652 | 43 |
| | | 362 |
| Insurance 2.1% | | |
| American International Group | 2,001 | 114 |
| Assurant | 241 | 37 |
| Chubb | 526 | 102 |
| Hartford Financial Services Group | 994 | 69 |
| Marsh & McLennan | 264 | 46 |
| MetLife | 842 | 52 |
| Progressive | 37 | 4 |
| RenaissanceRe Holdings | 357 | 60 |
| | | 484 |
| Total Financials | | 2,692 |
| HEALTH CARE 12.5% |
| Biotechnology 2.0% | | |
| AbbVie | 1,886 | 255 |
| Amgen | 376 | 85 |
| Biogen (1) | 55 | 13 |
| Incyte (1) | 43 | 3 |
| Moderna (1) | 152 | 39 |
| Regeneron Pharmaceuticals (1) | 40 | 25 |
| Seagen (1) | 19 | 3 |
T. ROWE PRICE U.S. EQUITY RESEARCH ETF
| | Shares | $ Value |
| (Cost and value in $000s) | | |
| Vertex Pharmaceuticals (1) | 151 | 33 |
| | | 456 |
| Health Care Equipment & Supplies 2.4% | | |
| Abbott Laboratories | 646 | 91 |
| Becton Dickinson & Co. | 505 | 127 |
| Cooper | 19 | 8 |
| Hologic (1) | 472 | 36 |
| Intuitive Surgical (1) | 528 | 190 |
| Medtronic | 223 | 23 |
| Stryker | 316 | 84 |
| | | 559 |
| Health Care Providers & Services 2.8% | | |
| Anthem | 187 | 86 |
| Centene (1) | 640 | 53 |
| Cigna | 160 | 37 |
| CVS Health | 556 | 57 |
| HCA Healthcare | 188 | 48 |
| Humana | 144 | 67 |
| McKesson | 40 | 10 |
| UnitedHealth Group | 601 | 302 |
| | | 660 |
| Life Sciences Tools & Services 1.7% | | |
| Agilent Technologies | 510 | 81 |
| Danaher | 383 | 126 |
| Thermo Fisher Scientific | 284 | 190 |
| | | 397 |
| Pharmaceuticals 3.6% | | |
| AstraZeneca, ADR | 1,959 | 114 |
| Bristol-Myers Squibb | 45 | 3 |
| Elanco Animal Health (1) | 2,136 | 61 |
| Eli Lilly & Co. | 884 | 244 |
T. ROWE PRICE U.S. EQUITY RESEARCH ETF
| | Shares | $ Value |
| (Cost and value in $000s) | | |
| Johnson & Johnson | 710 | 121 |
| Merck & Co. | 284 | 22 |
| Pfizer | 2,060 | 122 |
| Sanofi, ADR | 1,242 | 62 |
| Zoetis | 322 | 79 |
| | | 828 |
| Total Health Care | | 2,900 |
| INDUSTRIALS & BUSINESS SERVICES 6.7% |
| Aerospace & Defense 1.0% | | |
| Boeing (1) | 355 | 71 |
| L3Harris Technologies | 275 | 59 |
| Raytheon Technologies | 182 | 16 |
| Textron | 907 | 70 |
| TransDigm Group (1) | 18 | 11 |
| | | 227 |
| Air Freight & Logistics 1.0% | | |
| FedEx | 327 | 85 |
| United Parcel Service, Class B | 692 | 148 |
| | | 233 |
| Airlines 0.2% | | |
| Southwest Airlines (1) | 645 | 28 |
| United Airlines Holdings (1) | 445 | 19 |
| | | 47 |
| Commercial Services & Supplies 0.3% | | |
| Waste Connections | 476 | 65 |
| | | 65 |
| Industrial Conglomerates 1.5% | | |
| 3M | 46 | 8 |
| General Electric | 1,978 | 187 |
| Honeywell International | 327 | 68 |
T. ROWE PRICE U.S. EQUITY RESEARCH ETF
| | Shares | $ Value |
| (Cost and value in $000s) | | |
| Roper Technologies | 174 | 86 |
| | | 349 |
| Machinery 1.7% | | |
| Cummins | 370 | 81 |
| Flowserve | 473 | 14 |
| Fortive | 668 | 51 |
| Ingersoll Rand | 773 | 48 |
| Otis Worldwide | 778 | 68 |
| PACCAR | 987 | 87 |
| Parker-Hannifin | 148 | 47 |
| | | 396 |
| Professional Services 0.3% | | |
| Clarivate (1) | 625 | 15 |
| CoStar Group (1) | 34 | 2 |
| Equifax | 38 | 11 |
| Leidos Holdings | 350 | 31 |
| TransUnion | 32 | 4 |
| | | 63 |
| Road & Rail 0.7% | | |
| Canadian Pacific Railway | 324 | 23 |
| CSX | 1,884 | 71 |
| Norfolk Southern | 211 | 63 |
| | | 157 |
| Trading Companies & Distributors 0.0% | | |
| United Rentals (1) | 20 | 7 |
| | | 7 |
| Total Industrials & Business Services | | 1,544 |
| INFORMATION TECHNOLOGY 29.1% |
| Communications Equipment 0.9% | | |
| Cisco Systems | 2,426 | 154 |
T. ROWE PRICE U.S. EQUITY RESEARCH ETF
| | Shares | $ Value |
| (Cost and value in $000s) | | |
| Motorola Solutions | 211 | 57 |
| | | 211 |
| Electronic Equipment, Instruments & Components 0.8% | | |
| Amphenol, Class A | 889 | 78 |
| CDW | 144 | 29 |
| Keysight Technologies (1) | 53 | 11 |
| Teledyne Technologies (1) | 132 | 58 |
| Trimble (1) | 26 | 2 |
| | | 178 |
| IT Services 5.3% | | |
| Accenture, Class A | 447 | 186 |
| Cognizant Technology Solutions, Class A | 834 | 74 |
| Fidelity National Information Services | 798 | 87 |
| Fiserv (1) | 1,895 | 197 |
| FleetCor Technologies (1) | 379 | 85 |
| Global Payments | 690 | 93 |
| Mastercard, Class A | 499 | 179 |
| VeriSign (1) | 206 | 52 |
| Visa, Class A | 1,242 | 269 |
| | | 1,222 |
| Semiconductors & Semiconductor Equipment 5.5% | | |
| Advanced Micro Devices (1) | 1,015 | 146 |
| Analog Devices | 23 | 4 |
| Applied Materials | 26 | 4 |
| Broadcom | 318 | 212 |
| KLA | 334 | 144 |
| Marvell Technology | 21 | 2 |
| Microchip Technology | 83 | 7 |
| Monolithic Power Systems | 66 | 32 |
| NVIDIA | 1,500 | 441 |
| QUALCOMM | 979 | 179 |
T. ROWE PRICE U.S. EQUITY RESEARCH ETF
| | Shares | $ Value |
| (Cost and value in $000s) | | |
| Texas Instruments | 88 | 17 |
| Xilinx | 429 | 91 |
| | | 1,279 |
| Software 9.6% | | |
| Cadence Design Systems Inc (1) | 352 | 66 |
| Citrix Systems | 575 | 54 |
| Fortinet (1) | 46 | 17 |
| HashiCorp, Class A (1) | 35 | 3 |
| Intuit | 115 | 74 |
| Microsoft | 4,505 | 1,515 |
| NortonLifeLock | 2,307 | 60 |
| salesforce.com (1) | 969 | 246 |
| Synopsys (1) | 183 | 68 |
| Workday (1) | 166 | 45 |
| Zoom Video Communications, Class A (1) | 410 | 75 |
| | | 2,223 |
| Technology Hardware, Storage & Peripherals 7.0% | | |
| Apple | 9,187 | 1,631 |
| | | 1,631 |
| Total Information Technology | | 6,744 |
| MATERIALS 2.9% |
| Chemicals 1.9% | | |
| Air Products & Chemicals | 270 | 82 |
| Albemarle | 56 | 13 |
| CF Industries Holdings | 163 | 11 |
| International Flavors & Fragrances | 212 | 32 |
| Linde | 422 | 146 |
| RPM International | 276 | 28 |
| Sherwin-Williams | 331 | 117 |
| | | 429 |
T. ROWE PRICE U.S. EQUITY RESEARCH ETF
| | Shares | $ Value |
| (Cost and value in $000s) | | |
| Construction Materials 0.2% | | |
| Vulcan Materials | 203 | 42 |
| | | 42 |
| Containers & Packaging 0.8% | | |
| Ball | 679 | 65 |
| International Paper | 471 | 22 |
| Packaging of America | 185 | 25 |
| Sealed Air | 914 | 62 |
| WestRock | 302 | 14 |
| | | 188 |
| Paper & Forest Products 0.0% | | |
| West Fraser Timber | 80 | 8 |
| | | 8 |
| Total Materials | | 667 |
| REAL ESTATE 2.4% |
| Equity Real Estate Investment Trusts 2.3% | | |
| Alexandria Real Estate Equities, REIT | 114 | 25 |
| American Tower, REIT | 316 | 92 |
| AvalonBay Communities, REIT | 166 | 42 |
| Camden Property Trust, REIT | 179 | 32 |
| Equinix, REIT | 74 | 63 |
| Equity LifeStyle Properties, REIT | 135 | 12 |
| Equity Residential, REIT | 301 | 27 |
| Essex Property Trust, REIT | 60 | 21 |
| Prologis, REIT | 686 | 116 |
| Public Storage, REIT | 20 | 7 |
| SBA Communications, REIT | 14 | 5 |
| Simon Property Group, REIT | 122 | 20 |
| Sun Communities, REIT | 40 | 8 |
| Welltower, REIT | 638 | 55 |
T. ROWE PRICE U.S. EQUITY RESEARCH ETF
| | Shares | $ Value |
| (Cost and value in $000s) | | |
| Weyerhaeuser, REIT | 171 | 7 |
| | | 532 |
| Real Estate Management & Development 0.1% | | |
| Opendoor Technologies, Class A (1) | 675 | 10 |
| | | 10 |
| Total Real Estate | | 542 |
| UTILITIES 2.9% |
| Electric Utilities 1.5% | | |
| Eversource Energy | 558 | 51 |
| NextEra Energy | 1,512 | 141 |
| Southern | 1,442 | 99 |
| Xcel Energy | 812 | 55 |
| | | 346 |
| Gas Utilities 0.0% | | |
| Atmos Energy | 100 | 10 |
| | | 10 |
| Multi-Utilities 1.4% | | |
| Ameren | 781 | 70 |
| CMS Energy | 548 | 36 |
| Dominion Energy | 1,148 | 90 |
| Public Service Enterprise Group | 213 | 14 |
| Sempra Energy | 544 | 72 |
| WEC Energy Group | 375 | 36 |
| | | 318 |
| Total Utilities | | 674 |
| Total Common Stocks (Cost $20,721) | | 23,013 |
T. ROWE PRICE U.S. EQUITY RESEARCH ETF
| | Shares | $ Value |
| (Cost and value in $000s) | | |
| SHORT-TERM INVESTMENTS 0.6% |
| Money Market Funds 0.6% | | |
| State Street Institutional U.S. Government Money Market Fund, 0.03% (2) | 141,579 | 142 |
| Total Short-Term Investments (Cost $141) | | 142 |
Total Investments in Securities
100.0% of Net Assets (Cost $20,862) | | $23,155 |
| ‡ | Shares are denominated in U.S. dollars unless otherwise noted. |
| (1) | Non-income producing. |
| (2) | Seven-day yield |
| ADR | American Depositary Receipts |
| REIT | A domestic Real Estate Investment Trust whose distributions pass-through with original tax character to the shareholder |
The accompanying notes are an integral part of these financial statements.
T. ROWE PRICE U.S. EQUITY RESEARCH ETF
December 31, 2021
STATEMENT OF ASSETS AND LIABILITIES
($000s, except shares and per share amounts)
| Assets | |
| Investments in securities, at value (cost $20,862) | $23,155 |
| Dividends receivable | 16 |
| Total assets | 23,171 |
| Liabilities | |
| Investment management and administrative fees payable | 6 |
| Total liabilities | 6 |
| NET ASSETS | $23,165 |
| Net assets consists of: | |
| Total distributable earnings (loss) | $2,315 |
Paid-in capital applicable to 820,000 shares of $0.0001 par value
capital stock outstanding; 4,000,000,000 shares authorized | 20,850 |
| NET ASSETS | $23,165 |
| NET ASSET VALUE PER SHARE | $28.25 |
The accompanying notes are an integral part of these financial statements.
T. ROWE PRICE U.S. EQUITY RESEARCH ETF
STATEMENT OF OPERATIONS
($000s)
| | 6/8/21
Through
12/31/21 |
| Investment Income (Loss) | |
| Dividend income | $137 |
| Investment management and administrative expense | 37 |
| Net investment income | 100 |
| Realized and Unrealized Gain / Loss | |
| Net realized gain on securities | 20 |
| Change in net unrealized gain / loss on securities | 2,293 |
| Net realized and unrealized gain / loss | 2,313 |
| INCREASE IN NET ASSETS FROM OPERATIONS | $2,413 |
The accompanying notes are an integral part of these financial statements.
T. ROWE PRICE U.S. EQUITY RESEARCH ETF
STATEMENT OF CHANGES IN NET ASSETS
($000s)
| | 6/8/21
Through
12/31/21 |
| Increase (Decrease) in Net Assets | |
| Operations | |
| Net investment income | $100 |
| Net realized gain | 20 |
| Change in net unrealized gain / loss | 2,293 |
| Increase in net assets from operations | 2,413 |
| Distributions to shareholders | |
| Net earnings | (98) |
| Capital share transactions* | |
| Shares sold | 20,850 |
| Increase in net assets from capital share transactions | 20,850 |
| Net Assets | |
| Increase during period | 23,165 |
| Beginning of period | - |
| End of period | $23,165 |
| *Share information | |
| Shares sold | 820 |
| Increase in shares outstanding | 820 |
The accompanying notes are an integral part of these financial statements.
T. ROWE PRICE U.S. EQUITY RESEARCH ETF
NOTES TO FINANCIAL STATEMENTS
T. Rowe Price Exchange-Traded Funds, Inc. (the corporation) is registered under the Investment Company Act of 1940 (the 1940 Act). The U.S. Equity Research ETF (the fund) is a non-diversified, open-end management investment company established by the corporation. The fund incepted on June 8, 2021. The fund seeks to provide long-term capital growth.
The fund is considered an actively-managed exchange-traded fund (ETF) that does not disclose its portfolio holdings daily, which is different from a traditional ETF and may create additional risks. In order to provide market participants with information on the fund’s investments, the fund publishes a “Proxy Portfolio” on its website daily. A Proxy Portfolio is a basket of securities that is designed to closely track the daily performance of the fund’s portfolio holdings. While the Proxy Portfolio includes some of the fund’s holdings, it is not the fund’s actual portfolio. The fund does disclose its full portfolio holdings on a quarterly basis, similar to mutual funds.
NOTE 1 – SIGNIFICANT ACCOUNTING POLICIES
Basis of Preparation
The fund is an investment company and follows accounting and reporting guidance in the Financial Accounting Standards Board (FASB) Accounting Standards Codification Topic 946 (ASC 946). The accompanying financial statements were prepared in accordance with accounting principles generally accepted in the United States of America (GAAP), including, but not limited to, ASC 946. GAAP requires the use of estimates made by management. Management believes that estimates and valuations are appropriate; however, actual results may differ from those estimates, and the valuations reflected in the accompanying financial statements may differ from the value ultimately realized upon sale or maturity.
Investment Transactions, Investment Income, and Distributions
Investment transactions are accounted for on the trade date basis. Income and expenses are recorded on the accrual basis. Realized gains and losses are reported on the identified cost basis. Income tax-related interest and penalties, if incurred, are recorded as income tax expense. Dividends received from other investment companies are reflected as dividend income; capital gain distributions are reflected as realized gain/loss. Dividend income and capital gain distributions are recorded on the ex-dividend date. Distributions from REITs are initially recorded as dividend income and, to the extent such represent a return of capital or capital gain for tax purposes, are reclassified when such information becomes
T. ROWE PRICE U.S. EQUITY RESEARCH ETF
available. Non-cash dividends, if any, are recorded at the fair market value of the asset received. Distributions to shareholders are recorded on the ex-dividend date. Income distributions, if any, are declared and paid annually. A capital gain distribution may also be declared and paid by the fund annually. Dividends and distributions cannot be automatically reinvested in additional shares of the fund.
Capital Share Transactions
The fund issues and redeems shares at its net asset value (NAV) only with Authorized Participants and only in large blocks of 5,000 shares (each, a “Creation Unit”). The fund’s NAV per share is computed at the close of the New York Stock Exchange (NYSE). However, the NAV per share may be calculated at a time other than the normal close of the NYSE if trading on the NYSE is restricted, if the NYSE closes earlier, or as may be permitted by the SEC. Individual fund shares may not be purchased or redeemed directly with the fund. An Authorized Participant may purchase or redeem a Creation Unit of the fund each business day that the fund is open in exchange for the delivery of a designated portfolio of in-kind securities and/or cash. When purchasing or redeeming Creation Units, Authorized Participants are also required to pay a fixed and/or variable purchase or redemption transaction fee as well as any applicable additional variable charge to defray the transaction cost to a fund.
Individual fund shares may be purchased and sold only on a national securities exchange through brokers. Shares are listed for trading on NYSE Arca, Inc. (NYSE Arca) and because the shares will trade at market prices rather than NAV, shares may trade at prices greater than NAV (at a premium), at NAV, or less than NAV (at a discount). The fund’s shares are ordinarily valued as of the close of regular trading (normally 4:00 p.m. Eastern time) on each day that the NYSE Arca is open.
Indemnification
In the normal course of business, the fund may provide indemnification in connection with its officers and directors, service providers, and/or private company investments. The fund’s maximum exposure under these arrangements is unknown; however, the risk of material loss is currently considered to be remote.
NOTE 2 – VALUATION
Security Valuation
The fund’s financial instruments are valued at the close of the NYSE and are reported at fair value, which GAAP defines as the price that would be received to sell an asset or paid to transfer a liability in an orderly transaction between market participants at the measurement date. The T. Rowe Price Valuation Committee (the Valuation Committee) is
T. ROWE PRICE U.S. EQUITY RESEARCH ETF
an internal committee that has been delegated certain responsibilities by the fund’s Board of Directors (the Board) to ensure that financial instruments are appropriately priced at fair value in accordance with GAAP and the 1940 Act. Subject to oversight by the Board, the Valuation Committee develops and oversees pricing-related policies and procedures and approves all fair value determinations. Specifically, the Valuation Committee establishes policies and procedures used in valuing financial instruments, including those which cannot be valued in accordance with normal procedures or using pricing vendors; determines pricing techniques, sources, and persons eligible to effect fair value pricing actions; evaluates the services and performance of the pricing vendors; oversees the pricing process to ensure policies and procedures are being followed; and provides guidance on internal controls and valuation-related matters. The Valuation Committee provides periodic reporting to the Board on valuation matters.
Various valuation techniques and inputs are used to determine the fair value of financial instruments. GAAP establishes the following fair value hierarchy that categorizes the inputs used to measure fair value:
Level 1 – quoted prices (unadjusted) in active markets for identical financial instruments that the fund can access at the reporting date
Level 2 – inputs other than Level 1 quoted prices that are observable, either directly or indirectly (including, but not limited to, quoted prices for similar financial instruments in active markets, quoted prices for identical or similar financial instruments in inactive markets, interest rates and yield curves, implied volatilities, and credit spreads)
Level 3 – unobservable inputs (including the fund’s own assumptions in determining fair value)
Observable inputs are developed using market data, such as publicly available information about actual events or transactions, and reflect the assumptions that market participants would use to price the financial instrument. Unobservable inputs are those for which market data are not available and are developed using the best information available about the assumptions that market participants would use to price the financial instrument. GAAP requires valuation techniques to maximize the use of relevant observable inputs and minimize the use of unobservable inputs. When multiple inputs are used to derive fair value, the financial instrument is assigned to the level within the fair value hierarchy based on the lowest-level input that is significant to the fair value of the financial instrument. Input levels are not necessarily an indication of the risk or liquidity associated with financial instruments at that level but rather the degree of judgment used in determining those values.
T. ROWE PRICE U.S. EQUITY RESEARCH ETF
Valuation Techniques
Equity securities, including exchange-traded funds, listed or regularly traded on a securities exchange or in the over-the-counter (OTC) market are valued at the last quoted sale price or, for certain markets, the official closing price at the time the valuations are made. OTC Bulletin Board securities are valued at the mean of the closing bid and asked prices. A security that is listed or traded on more than one exchange is valued at the quotation on the exchange determined to be the primary market for such security. Listed securities not traded on a particular day are valued at the mean of the closing bid and asked prices for domestic securities.
Investments in mutual funds are valued at the mutual fund’s closing NAV per share on the day of valuation. Assets and liabilities other than financial instruments, including short-term receivables and payables, are carried at cost, or estimated realizable value, if less, which approximates fair value.
Investments for which market quotations or market-based valuations are not readily available or deemed unreliable are valued at fair value as determined in good faith by the Valuation Committee, in accordance with fair valuation policies and procedures. The objective of any fair value pricing determination is to arrive at a price that could reasonably be expected from a current sale. Financial instruments fair valued by the Valuation Committee are primarily private placements, restricted securities, warrants, rights, and other securities that are not publicly traded. Factors used in determining fair value vary by type of investment and may include market or investment specific considerations. The Valuation Committee typically will afford greatest weight to actual prices in arm’s length transactions, to the extent they represent orderly transactions between market participants, transaction information can be reliably obtained, and prices are deemed representative of fair value. However, the Valuation Committee may also consider other valuation methods such as market-based valuation multiples; a discount or premium from market value of a similar, freely traded security of the same issuer; discounted cash flows; yield to maturity; or some combination. Fair value determinations are reviewed on a regular basis and updated as information becomes available, including actual purchase and sale transactions of the investment. Because any fair value determination involves a significant amount of judgment, there is a degree of subjectivity inherent in such pricing decisions, and fair value prices determined by the Valuation Committee could differ from those of other market participants.
Valuation Inputs
On December 31, 2021, all of the fund’s financial instruments were classified as Level 1, based on the inputs used to determine their fair values.
T. ROWE PRICE U.S. EQUITY RESEARCH ETF
NOTE 3 – OTHER INVESTMENT TRANSACTIONS
Purchases and sales of portfolio securities excluding in-kind transactions and short-term securities aggregated $17,426,000 and $2,525,000, respectively, for the period ended December 31, 2021. Portfolio securities received or delivered through in-kind transactions aggregated $5,799,000 and $0, respectively, for the period ended December 31, 2021.
NOTE 4 – FEDERAL INCOME TAXES
No provision for federal income taxes is required since the fund intends to qualify as a regulated investment company under Subchapter M of the Internal Revenue Code and distribute to shareholders all of its taxable income and gains. Distributions determined in accordance with federal income tax regulations may differ in amount or character from net investment income and realized gains for financial reporting purposes.
The fund files U.S. federal, state, and local tax returns as required. The fund’s tax returns are subject to examination by the relevant tax authorities until expiration of the applicable statute of limitations, which is generally three years after the filing of the tax return but which can be extended to six years in certain circumstances.
Financial reporting records are adjusted for permanent book/tax differences to reflect tax character but are not adjusted for temporary differences.
Distributions during the period ended December 31, 2021, totaled $98,000, and were characterized as ordinary income for tax purposes. At December 31, 2021, the tax-basis cost of investments and components of net assets were as follows:
| ($000s) | |
| Cost of investments | $20,875 |
| Unrealized appreciation | $2,730 |
| Unrealized depreciation | (450) |
| Net unrealized appreciation (depreciation) | 2,280 |
| Undistributed ordinary income | 35 |
| Paid-in capital | 20,850 |
| Net assets | $23,165 |
The difference between book-basis and tax-basis net unrealized appreciation (depreciation) is attributable to the deferral of losses from wash sales for tax purposes.
T. ROWE PRICE U.S. EQUITY RESEARCH ETF
NOTE 5 – RELATED PARTY TRANSACTIONS
The fund is managed by T. Rowe Price Associates, Inc. (Price Associates), a wholly owned subsidiary of T. Rowe Price Group, Inc. (Price Group). The investment management and administrative agreement between the fund and Price Associates provides for an all-inclusive annual fee equal to 0.34% of the fund’s average daily net assets. The fee is computed daily and paid monthly. The all-inclusive fee covers investment management services and ordinary, recurring operating expenses, but does not cover interest and borrowing expenses; taxes; brokerage commissions and other transaction costs; fund proxy expenses; and nonrecurring expenses. All costs related to organization and offering of the fund are borne by Price Associates.
As of December 31, 2021, T. Rowe Price Group, Inc., or its wholly owned subsidiaries, owned 600,000 shares of the fund, representing 73% of the fund’s net assets.
The fund may participate in securities purchase and sale transactions with other funds or accounts advised by Price Associates (cross trades), in accordance with procedures adopted by the fund’s Board and Securities and Exchange Commission rules, which require, among other things, that such purchase and sale cross trades be effected at the independent current market price of the security. During the period ended December 31, 2021, the fund had no purchases or sales cross trades with other funds or accounts advised by Price Associates.
Price Associates has voluntarily agreed to reimburse the fund from its own resources on a monthly basis for the cost of investment research embedded in the cost of the fund’s securities trades. This agreement may be rescinded at any time. For the period ended December 31, 2021, this reimbursement amounted to less than $1,000.
NOTE 6 – OTHER MATTERS
Unpredictable events such as environmental or natural disasters, war, terrorism, pandemics, outbreaks of infectious diseases, and similar public health threats may significantly affect the economy and the markets and issuers in which a fund invests. Certain events may cause instability across global markets, including reduced liquidity and disruptions in trading markets, while some events may affect certain geographic regions, countries, sectors, and industries more significantly than others, and exacerbate other pre-existing political, social, and economic risks. The fund’s performance could be negatively impacted if the value of a portfolio holding were harmed by such events. Since
T. ROWE PRICE U.S. EQUITY RESEARCH ETF
2020, a novel strain of coronavirus (COVID-19) has resulted in disruptions to global business activity and caused significant volatility and declines in global financial markets. The duration of this outbreak or others and their effects cannot be determined with certainty.
T. ROWE PRICE U.S. EQUITY RESEARCH ETF
REPORT OF INDEPENDENT REGISTERED PUBLIC ACCOUNTING FIRM
To the Board of Directors of T. Rowe Price Exchange-Traded Funds, Inc. and Shareholders of T. Rowe Price U.S. Equity Research ETF
Opinion on the Financial Statements
We have audited the accompanying statement of assets and liabilities, including the portfolio of investments, of T. Rowe Price U.S. Equity Research ETF (one of the funds constituting T. Rowe Price Exchange-Traded Funds, Inc., referred to hereafter as the "Fund") as of December 31, 2021, and the related statements of operations and changes in net assets, including the related notes, and the financial highlights for the period June 8, 2021 (Inception) through December 31, 2021 (collectively referred to as the “financial statements”). In our opinion, the financial statements present fairly, in all material respects, the financial position of the Fund as of December 31, 2021, and the results of its operations, changes in its net assets, and the financial highlights for the period June 8, 2021 (Inception) through December 31, 2021 in conformity with accounting principles generally accepted in the United States of America.
Basis for Opinion
These financial statements are the responsibility of the Fund’s management. Our responsibility is to express an opinion on the Fund’s financial statements based on our audit. We are a public accounting firm registered with the Public Company Accounting Oversight Board (United States) (PCAOB) and are required to be independent with respect to the Fund in accordance with the U.S. federal securities laws and the applicable rules and regulations of the Securities and Exchange Commission and the PCAOB.
We conducted our audit of these financial statements in accordance with the standards of the PCAOB. Those standards require that we plan and perform the audit to obtain reasonable assurance about whether the financial statements are free of material misstatement, whether due to error or fraud.
Our audit included performing procedures to assess the risks of material misstatement of the financial statements, whether due to error or fraud, and performing procedures that respond to those risks. Such procedures included examining, on a test basis, evidence regarding the amounts and disclosures in the financial statements. Our audit also included evaluating the accounting principles used and significant estimates made by management, as well as evaluating the overall presentation of the financial statements. Our procedures included confirmation of securities owned as of December 31, 2021 by correspondence
T. ROWE PRICE U.S. EQUITY RESEARCH ETF
REPORT OF INDEPENDENT REGISTERED PUBLIC ACCOUNTING FIRM
(CONTINUED)
with the custodian and brokers; when replies were not received from brokers, we performed other auditing procedures. We believe that our audit provides a reasonable basis for our opinion.
PricewaterhouseCoopers LLP
Baltimore, Maryland
February 17, 2022
We have served as the auditor of one or more investment companies in the T. Rowe Price group of investment companies since 1973.
T. ROWE PRICE U.S. EQUITY RESEARCH ETF
TAX INFORMATION (UNAUDITED) FOR THE TAX YEAR ENDED 12/31/21
We are providing this information as required by the Internal Revenue Code. The amounts shown may differ from those elsewhere in this report because of differences between tax and financial reporting requirements. The fund’s distributions to shareholders included:
For taxable non-corporate shareholders, $130,000 of the fund’s income represents qualified dividend income subject to a long-term capital gains tax rate of not greater than 20%.
For corporate shareholders, $123,000 of the fund’s income qualifies for the dividends received deduction.
INFORMATION ON PROXY VOTING POLICIES, PROCEDURES, AND RECORDS
A description of the policies and procedures used by T. Rowe Price funds to determine how to vote proxies relating to portfolio securities is available in each fund’s Statement of Additional Information. You may request this document by calling 1-800-638-5660 or by accessing the SEC’s website, sec.gov.
The description of our proxy voting policies and procedures is also available on our corporate website. To access it, please visit the following Web page:
https://www.troweprice.com/corporate/en/utility/policies.html
Scroll down to the section near the bottom of the page that says, “Proxy Voting Policies.” Click on the Proxy Voting Policies link in the shaded box.
Each fund’s most recent annual proxy voting record is available on our website and through the SEC’s website. To access it through T. Rowe Price, visit the website location shown above, and scroll down to the section near the bottom of the page that says, “Proxy Voting Records.” Click on the Proxy Voting Records link in the shaded box.
HOW TO OBTAIN QUARTERLY PORTFOLIO HOLDINGS
The fund files a complete schedule of portfolio holdings with the Securities and Exchange Commission (SEC) for the first and third quarters of each fiscal year as an exhibit to its reports on Form N-PORT. The fund’s Form N-PORT is available electronically on the SEC’s website (sec.gov).
T. ROWE PRICE U.S. EQUITY RESEARCH ETF
ABOUT THE FUND’S DIRECTORS AND OFFICERS
Your fund is overseen by a Board of Directors (Board) that meets regularly to review a wide variety of matters affecting or potentially affecting the fund, including performance, investment programs, compliance matters, advisory fees and expenses, service providers, and business and regulatory affairs. The Board elects the fund’s officers, who are listed in the final table. At least 75% of the Board’s members are considered to be independent, i.e., not “interested persons” as defined in Section 2(a)(19) of the 1940 Act, of the Boards of T. Rowe Price Associates, Inc. (T. Rowe Price), and its affiliates; “interested” directors and officers are employees of T. Rowe Price. The business address of each director and officer is 100 East Pratt Street, Baltimore, Maryland 21202. The Statement of Additional Information includes additional information about the fund directors and is available without charge by calling a T. Rowe Price representative at 1-800-638-5660.
INDEPENDENT DIRECTORS(a)
Name
(Year of Birth)
Year Elected
[Number of T. Rowe Price
Portfolios Overseen] | Principal Occupation(s) and Directorships of Public Companies and
Other Investment Companies During the Past Five Years |
Teresa Bryce Bazemore
(1959)
2020
[204] | President and Chief Executive Officer, Federal Home Loan Bank of San Francisco (2021 to present); President, Radian Guaranty (2008 to 2017); Chief Executive Officer, Bazemore Consulting LLC (2018 to 2021); Director, Chimera Investment Corporation (2017 to 2021); Director, First Industrial Realty Trust (2020 to present); Director, Federal Home Loan Bank of Pittsburgh (2017 to 2019) |
Ronald J. Daniels
(1959)
2020
[204] | President, The Johns Hopkins University(b) and Professor, Political Science Department, The Johns Hopkins University (2009 to present); Director, Lyndhurst Holdings (2015 to present); Director, BridgeBio Pharma, Inc. (2020 to present) |
Bruce W. Duncan
(1951)
2020
[204] | President, Chief Executive Officer, and Director, CyrusOne, Inc. (2020 to 2021); Chief Executive Officer and Director (2009 to 2016), Chair of the Board (2016 to 2020), and President (2009 to 2016), First Industrial Realty Trust, owner and operator of industrial properties; Chair of the Board (2005 to 2016) and Director (1999 to 2016), Starwood Hotels & Resorts, a hotel and leisure company; Member, Investment Company Institute Board of Governors (2017 to 2019); Member, Independent Directors Council Governing Board (2017 to 2019); Senior Advisor, KKR (2018 to present); Director, Boston Properties (2016 to present); Director, Marriott International, Inc. (2016 to 2020) |
Robert J. Gerrard, Jr.
(1952)
2020
[204] | Advisory Board Member, Pipeline Crisis/Winning Strategies, a
collaborative working to improve opportunities for young African
Americans (1997 to 2016); Chair of the Board, all funds
(July 2018 to present) |
T. ROWE PRICE U.S. EQUITY RESEARCH ETF
INDEPENDENT DIRECTORS(a) (continued)
Name
(Year of Birth)
Year Elected
[Number of T. Rowe Price
Portfolios Overseen] | Principal Occupation(s) and Directorships of Public Companies and
Other Investment Companies During the Past Five Years |
Paul F. McBride
(1956)
2020
[204] | Advisory Board Member, Vizzia Technologies (2015 to present); Board
Member, Dunbar Armored (2012 to 2018) |
Cecilia E. Rouse, Ph.D.(c)
(1963)
2020
[0] | Dean, Princeton School of Public and International Affairs (2012 to present); Professor and Researcher, Princeton University (1992 to present); Director of Education Studies Committee, MDRC, a nonprofit education and social policy research organization (2011 to 2020); Member, National Academy of Education (2010 to present); Board Member, National Bureau of Economic Research (2011 to present); Board Member of the Council on Foreign Relations (2018 to present); Board Member, The Pennington School (2017 to present); Board Member, the University of Rhode Island (2020 to present); Chair of Committee on the Status of Minority Groups in the Economic Profession of the American Economic Association (2012 to 2018); Vice President (2015 to 2016) and Board Member (2018 to present), American Economic Association |
John G. Schreiber(d)
(1946)
2020
[0] | Owner/President, Centaur Capital Partners, Inc., a real estate investment company (1991 to present); Cofounder, Partner, and Cochair of the Investment Committee, Blackstone Real Estate Advisors, L.P. (1992 to 2015); Director, Blackstone Mortgage Trust, a real estate finance company (2012 to 2016); Director and Chair of the Board, Brixmor Property Group, Inc. (2013 to present); Director, Hilton Worldwide (2007 to present); Director, Hudson Pacific Properties (2014 to 2016); Director, Invitation Homes (2014 to 2017); Director, JMB Realty Corporation (1980 to present) |
T. ROWE PRICE U.S. EQUITY RESEARCH ETF
INDEPENDENT DIRECTORS(a) (continued)
Name
(Year of Birth)
Year Elected
[Number of T. Rowe Price
Portfolios Overseen] | Principal Occupation(s) and Directorships of Public Companies and
Other Investment Companies During the Past Five Years |
Kellye Walker(e)
(1966)
2021
[204] | Executive Vice President and Chief Legal Officer, Eastman Chemical
Company (April 2020 to present); Executive Vice President and Chief
Legal Officer, Huntington Ingalls Industries, Inc. (NYSE: HIl) (January
2015 to March 2020); Director, Lincoln Electric Company (October 2020
to present) |
(a)All information about the independent directors was current as of December 31, 2020, unless otherwise indicated, except for the number of portfolios overseen, which is current as of the date of this report.
(b)William J. Stromberg, chair of the Board, director, and chief executive officer of T. Rowe Price Group, Inc., the parent company of the Price Funds’ investment advisor, has served on the Board of Trustees of Johns Hopkins University since 2014.
(c)Effective March 4, 2021, Dr. Rouse resigned from her role as independent director of the Price Funds.
(d)Effective December 31, 2021, Mr. Schreiber resigned from his role as independent director of the Price Funds.
(e)Effective November 8, 2021, Ms. Walker was elected as independent director of the Price Funds.
INTERESTED DIRECTORS(a)
Name
(Year of Birth)
Year Elected
[Number of T. Rowe Price
Portfolios Overseen] | Principal Occupation(s) and Directorships of Public Companies and
Other Investment Companies During the Past Five Years |
David Oestreicher
(1967)
2020
[204] | General Counsel, Vice President, and Secretary, T. Rowe Price Group, Inc.; Chair of the Board, Chief Executive Officer, President, and Secretary, T. Rowe Price Trust Company; Director, Vice President, and Secretary, T. Rowe Price, T. Rowe Price Investment Services, Inc.; T. Rowe Price Retirement Plan Services, Inc., and T. Rowe Price Services, Inc.; Director and Secretary, T. Rowe Price Investment Management, Inc. (Price Investment Management); Vice President and Secretary, T. Rowe Price International (Price International); Vice President, T. Rowe Price Hong Kong (Price Hong Kong), T. Rowe Price Japan (Price Japan) and T. Rowe Price Singapore (Price Singapore); Principal Executive Officer and Executive Vice President, all funds |
T. ROWE PRICE U.S. EQUITY RESEARCH ETF
INTERESTED DIRECTORS(a) (continued)
Name
(Year of Birth)
Year Elected
[Number of T. Rowe Price
Portfolios Overseen] | Principal Occupation(s) and Directorships of Public Companies and
Other Investment Companies During the Past Five Years |
Robert W. Sharps, CFA, CPA
(1971)
2020
[204] | Director and Vice President, T. Rowe Price; President, T. Rowe Price
Group, Inc.; Director, Price Investment Management; Vice President,
T. Rowe Price Trust Company; Director and President, Exchange-Traded Funds, Inc. |
(a)All information about the interested directors was current as of December 31, 2020, unless otherwise indicated, except for the number of portfolios overseen, which is current as of the date of this report.
OFFICERS
Name (Year of Birth)
Position Held With Exchange-Traded
Funds, Inc. | Principal Occupation(s) |
Timothy Coyne (1967)
Executive Vice President | Vice President, T. Rowe Price and T. Rowe Price Group, Inc. |
Alan S. Dupski, CPA (1982)
Principal Financial Officer, Vice
President, and Treasurer | Vice President, T. Rowe Price, T. Rowe Price Group, Inc., and T. Rowe Price Trust Company |
Joseph B. Fath, CPA (1971)
Executive Vice President | Vice President, T. Rowe Price, T. Rowe Price Group, Inc., and T. Rowe Price Trust Company |
John R. Gilner (1961)
Chief Compliance Officer | Chief Compliance Officer and Vice President, T. Rowe Price; Vice President, T. Rowe Price Group, Inc., and T. Rowe Price Investment Services, Inc. |
Gary J. Greb (1961)
Vice President | Vice President, T. Rowe Price, Price International, and T. Rowe Price Trust Company |
Paul Greene II (1978)
Executive Vice President | Vice President, T. Rowe Price and T. Rowe Price Group, Inc. |
Ann M. Holcomb, CFA (1972)
Executive Vice President | Vice President, T. Rowe Price, T. Rowe Price Group, Inc., and T. Rowe Price Trust Company |
Thomas J. Huber, CFA (1966)
Executive Vice President | Vice President, T. Rowe Price, T. Rowe Price Group, Inc., and T. Rowe Price Trust Company |
Paul J. Krug, CPA (1964)
Vice President | Vice President, T. Rowe Price, T. Rowe Price Group, Inc., and T. Rowe Price Trust Company |
John D. Linehan, CFA (1965)
Executive Vice President | Vice President, T. Rowe Price, T. Rowe Price Group, Inc., and T. Rowe Price Trust Company |
Unless otherwise noted, officers have been employees of T. Rowe Price or T. Rowe Price International for at least 5 years.
T. ROWE PRICE U.S. EQUITY RESEARCH ETF
OFFICERS (continued)
Name (Year of Birth)
Position Held With Exchange-Traded
Funds, Inc. | Principal Occupation(s) |
Jason Nogueira, CFA (1974)
Executive Vice President | Vice President, T. Rowe Price and T. Rowe Price Group, Inc. |
Fran M. Pollack-Matz (1961)
Vice President and Secretary | Vice President, T. Rowe Price, T. Rowe Price Group, Inc., T. Rowe Price Investment Services, Inc., and T. Rowe Price Services, Inc. |
Jason Benjamin Polun, CFA (1974)
Executive Vice President | Vice President, T. Rowe Price, T. Rowe Price Group, Inc., and T. Rowe Price Trust Company |
Shannon H. Rauser (1987)
Assistant Secretary | Assistant Vice President, T. Rowe Price |
Megan Warren (1968)
Vice President | Vice President, T. Rowe Price, T. Rowe Price Group, Inc., T. Rowe Price Retirement Plan Services, Inc., T. Rowe Price Services, Inc., and T. Rowe Price Trust Company; formerly, Executive Director, JPMorgan Chase (to 2017) |
Thomas H. Watson (1977)
Executive Vice President | Director and Vice President, T. Rowe Price Trust Company; Vice President, T. Rowe Price and T. Rowe Price Group,Inc. |
Unless otherwise noted, officers have been employees of T. Rowe Price or T. Rowe Price International for at least 5 years.
100 East Pratt Street
Baltimore, MD 21202
Call 1-800-638-5660 to request a prospectus or summary prospectus; each includes investment objectives, risks, fees, expenses, and other information that you should read and consider carefully before investing.
T. Rowe Price Investment Services, Inc.
Item 1. (b) Notice pursuant to Rule 30e-3.
Not applicable.
Item 2. Code of Ethics.
The registrant has adopted a code of ethics, as defined in Item 2 of Form N-CSR, applicable to its principal executive officer, principal financial officer, principal accounting officer or controller, or persons performing similar functions. A copy of this code of ethics is filed as an exhibit to this Form N-CSR. No substantive amendments were approved or waivers were granted to this code of ethics during the period covered by this report.
Item 3. Audit Committee Financial Expert.
The registrant’s Board of Directors has determined that Ms. Teresa Bryce Bazemore qualifies as an audit committee financial expert, as defined in Item 3 of Form N-CSR. Ms. Bazemore is considered independent for purposes of Item 3 of Form N-CSR.
Item 4. Principal Accountant Fees and Services.
(a) – (d) Aggregate fees billed for the last two fiscal years for professional services rendered to, or on behalf of, the registrant by the registrant’s principal accountant were as follows:
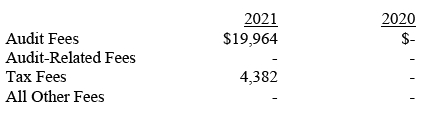
Audit fees include amounts related to the audit of the registrant’s annual financial statements and services normally provided by the accountant in connection with statutory and regulatory filings. Audit-related fees include amounts reasonably related to the performance of the audit of the registrant’s financial statements and specifically include the issuance of a report on internal controls and, if applicable, agreed-upon procedures related to fund acquisitions. Tax fees include amounts related to services for tax compliance, tax planning, and tax advice. The nature of these services specifically includes the review of distribution calculations and the preparation of Federal, state, and excise tax returns. All other fees include the registrant’s pro-rata share of amounts for agreed-upon procedures in conjunction with service contract approvals by the registrant’s Board of Directors/Trustees.
(e)(1) The registrant’s audit committee has adopted a policy whereby audit and non-audit services performed by the registrant’s principal accountant for the registrant, its investment adviser, and any entity controlling, controlled by, or under common control with the investment adviser that provides ongoing services to the registrant require pre-approval in advance at regularly scheduled audit committee meetings. If such a service is required between regularly scheduled audit committee meetings, pre-approval may be authorized by one audit committee member with ratification at the next scheduled audit committee meeting. Waiver of pre-approval for audit or non-audit services requiring fees of a de minimis amount is not permitted.
(2) No services included in (b) – (d) above were approved pursuant to paragraph (c)(7)(i)(C) of Rule 2-01 of Regulation S-X.
(f) Less than 50 percent of the hours expended on the principal accountant’s engagement to audit the registrant’s financial statements for the most recent fiscal year were attributed to work performed by persons other than the principal accountant’s full-time, permanent employees.
(g) The aggregate fees billed for the most recent fiscal year and the preceding fiscal year by the registrant’s principal accountant for non-audit services rendered to the registrant, its investment adviser, and any entity controlling, controlled by, or under common control with the investment adviser that provides ongoing services to the registrant were $3,732,000 and $3,781,000, respectively.
(h) All non-audit services rendered in (g) above were pre-approved by the registrant’s audit committee. Accordingly, these services were considered by the registrant’s audit committee in maintaining the principal accountant’s independence.
Item 5. Audit Committee of Listed Registrants.
Not applicable.
Item 6. Investments.
(a) Not applicable. The complete schedule of investments is included in Item 1 of this Form N-CSR.
(b) Not applicable.
Item 7. Disclosure of Proxy Voting Policies and Procedures for Closed-End Management Investment Companies.
Not applicable.
Item 8. Portfolio Managers of Closed-End Management Investment Companies.
Not applicable.
Item 9. Purchases of Equity Securities by Closed-End Management Investment Company and Affiliated Purchasers.
Not applicable.
Item 10. Submission of Matters to a Vote of Security Holders.
There has been no change to the procedures by which shareholders may recommend nominees to the registrant's board of directors.
Item 11. Controls and Procedures.
(a) The registrant’s principal executive officer and principal financial officer have evaluated the registrant’s disclosure controls and procedures within 90 days of this filing and have concluded that the registrant’s disclosure controls and procedures were effective, as of that date, in ensuring that information required to be disclosed by the registrant in this Form N-CSR was recorded, processed, summarized, and reported timely.
(b) The registrant’s principal executive officer and principal financial officer are aware of no change in the registrant’s internal control over financial reporting that occurred during the period covered by this report that has materially affected, or is reasonably likely to materially affect, the registrant’s internal control over financial reporting.
Item 12. Disclosure of Securities Lending Activities for Closed-End Management Investment Companies.
Not applicable.
Item 13. Exhibits.
(a)(1) The registrant’s code of ethics pursuant to Item 2 of Form N-CSR is attached.
(2) Separate certifications by the registrant's principal executive officer and principal financial officer, pursuant to Section 302 of the Sarbanes-Oxley Act of 2002 and required by Rule 30a-2(a) under the Investment (Company Act of 1940, are attached.
(3) Written solicitation to repurchase securities issued by closed-end companies: not applicable.
(b) A certification by the registrant’s principal executive officer and principal financial officer, pursuant to Section 906 of the Sarbanes-Oxley Act of 2002 and required by Rule 30a-2(b) under the Investment Company Act of 1940, is attached.
SIGNATURES
Pursuant to the requirements of the Securities Exchange Act of 1934 and the Investment Company Act of 1940, the registrant has duly caused this report to be signed on its behalf by the undersigned, thereunto duly authorized.
T. Rowe Price Exchange-Traded Funds, Inc.
| By | | /s/ David Oestreicher |
| | | David Oestreicher |
| | | Principal Executive Officer |
| |
| Date | | February 17, 2022 | | | | |
Pursuant to the requirements of the Securities Exchange Act of 1934 and the Investment Company Act of 1940, this report has been signed below by the following persons on behalf of the registrant and in the capacities and on the dates indicated.
| By | | /s/ David Oestreicher |
| | | David Oestreicher |
| | | Principal Executive Officer |
| |
| Date | | February 17, 2022 | | | | |
| |
| |
| By | | /s/ Alan S. Dupski |
| | | Alan S. Dupski |
| | | Principal Financial Officer |
| |
| Date | | February 17, 2022 | | | | |