UNITED STATES
SECURITIES AND EXCHANGE COMMISSION
Washington, D.C. 20549
FORM N-CSR
CERTIFIED SHAREHOLDER REPORT OF REGISTERED
MANAGEMENT INVESTMENT COMPANIES
Investment Company Act File Number: 811-23494
| T. Rowe Price Exchange-Traded Funds, Inc. |
|
| (Exact name of registrant as specified in charter) |
| |
| 100 East Pratt Street, Baltimore, MD 21202 |
|
| (Address of principal executive offices) |
| |
| David Oestreicher |
| 100 East Pratt Street, Baltimore, MD 21202 |
|
| (Name and address of agent for service) |
Registrant’s telephone number, including area code: (410) 345-2000
Date of fiscal year end: December 31
Date of reporting period: December 31, 2021
Item 1. Reports to Shareholders
(a) Report pursuant to Rule 30e-1.
ANNUAL REPORT
December 31, 2021
| | T. ROWE PRICE |
| TDVG | Dividend Growth ETF |
| | For more insights from T. Rowe Price investment professionals, go to troweprice.com. |
T. ROWE PRICE DIVIDEND GROWTH ETF
HIGHLIGHTS
| ■ | The Dividend Growth ETF posted a strong return but lagged the S&P 500 Index for the 12 months ended December 31, 2021. |
| ■ | An underweight allocation and stock selection in the information technology sector hurt relative returns, as did an overweight to the industrials and business services sector. |
| ■ | The fund’s largest sector allocations are in information technology, health care, and financials, where we continue to find compelling risk/reward opportunities. |
| ■ | Going forward, we expect growth to normalize and equity markets to generate more modest returns, driven by earnings growth and dividends, with valuation a potential headwind. |
| ■ | We continue to seek out attractively valued companies that are well positioned to emerge from the pandemic with lasting competitive advantages, while avoiding firms that face secular challenges. |
Sign up for e-delivery of your statements, confirmations, and prospectuses or shareholder reports.
If you invest directly with T. Rowe Price, go to troweprice.com/paperless.
If you invest through an investment advisor, a bank, or a brokerage firm, please contact that organization and ask if it can provide electronic documentation.
It’s fast—receive your statements and
confirmations faster than U.S. mail.
It’s convenient—access your important account documents whenever you need them.
It’s secure—we protect your online accounts using “True Identity” to confirm new accounts and make verification faster and more secure.
It can save you money—where applicable,
T. Rowe Price passes on the cost savings to
fund holders.*
Log in to your account at troweprice.com for more information.
*Certain mutual fund accounts that are assessed an annual account service fee can also save money by switching to e-delivery.
T. ROWE PRICE DIVIDEND GROWTH ETF
Market Commentary
Dear Shareholders
Major stock and bond indexes produced mixed results during 2021 as strong corporate earnings growth and a recovering economy contended with worries about inflation, new coronavirus variants, and less accommodative central banks. Most developed market stock benchmarks finished the year with positive returns, although gains slowed in the second half of the year, while fixed income returns faced headwinds from rising interest rates.
Large-cap U.S. growth stocks delivered the strongest returns, but solid results were common in many developed markets. However, emerging markets stock benchmarks struggled amid a significant equity market downturn in China.
The large-cap S&P 500 Index returned almost 29%, marking its third straight year of positive returns. Robust results were widespread across the benchmark—according to Bloomberg data, 2021 marked the first year that all of the S&P 500 sectors recorded double-digit gains. The energy sector, which was the worst performer in 2020, was the leader in 2021 amid a sharp increase in oil prices, and real estate stocks also rebounded from a down year as strong demand led to rising rents. Financial and information technology stocks also produced excellent returns and outperformed the broad market.
In the fixed income market, rising Treasury yields weighed on performance, but below investment-grade corporate bonds delivered solid results as they benefited from improving fundamentals and investor demand for higher-yielding securities. (Bond prices and yields move in opposite directions.)
A robust increase in corporate earnings growth appeared to be a significant performance driver during the year. According to FactSet, overall earnings for the S&P 500 rose 89% in the second quarter of 2021 versus the year before, the fastest pace since 2009, and while third-quarter earnings slowed, they continued to beat expectations at an impressive pace. Despite the significant rally in the S&P 500 during 2021, the index’s price/earnings ratio actually fell over that period as earnings rose faster than stock prices. Although economic growth showed signs of slowing at times, data remained generally positive through the end of the period. The unemployment rate, which started the year at 6.7%, fell to 3.9% by December, and job openings reached a record high.
However, optimism surrounding strong earnings and employment gains was tempered by inflation concerns. Prices surged as the release of pent-up demand and supply chain disruptions contributed to higher inflation around the globe.
T. ROWE PRICE DIVIDEND GROWTH ETF
In the U.S., the 6.8% increase in the consumer price index for the 12-month period ended in November was the highest level since 1982, a factor that may have contributed to a decline in consumer sentiment late in the year.
Meanwhile, central banks began to move away from the extremely accommodative policies they instituted in response to the initial wave of the coronavirus. The Federal Reserve began trimming its purchases of Treasuries and agency mortgage-backed securities in November, and policymakers indicated that they could soon start raising short-term interest rates.
How markets respond to the normalization of monetary policy is an open question. While fading stimulus might pose some challenges for investors, I believe it could contribute to a return of price sensitivity in global markets, which bodes well for selective investors focused on fundamentals.
Elevated valuations, higher inflation, and the continuing struggle to control the pandemic also pose potential challenges for financial markets in 2022. However, on the positive side, household wealth gains, pent-up consumer demand, and a potential boom in capital expenditures could sustain growth even as monetary policy turns less supportive. In this environment, our investment teams will remain focused on using fundamental research to identify companies that can add value to your portfolio over the long term.
Thank you for your continued confidence in T. Rowe Price.
Sincerely,
Robert Sharps
President and CEO
T. ROWE PRICE DIVIDEND GROWTH ETF
Management’s Discussion of Fund Performance
INVESTMENT OBJECTIVE
The fund seeks dividend income and long-term capital growth.
FUND COMMENTARY
How did the fund perform in the past 12 months?
The Dividend Growth ETF’s market price and net asset value returned 26.20% and 26.09%, respectively, for the 12-month period ended December 31, 2021. The portfolio underperformed its primary benchmark, the S&P 500 Index, but performed in line with its peer group, the Lipper Large-Cap Core Funds Index. The fund outperformed its style-specific, dividend-growth-focused benchmark, the NASDAQ US Broad Dividend Achievers Index. (Past performance cannot guarantee future results.)
What factors influenced the fund’s performance?
Stocks posted robust gains through 2021, with the broad market, as measured by the S&P 500 Index, recording a 28.71% 12-month return, while the NASDAQ US Broad Dividend Achievers Index, the fund’s style-specific benchmark, gained
PERFORMANCE COMPARISON
| | Total Return |
| Periods Ended 12/31/21 | 6 Months | 12 Months |
| | | |
| Dividend Growth ETF (Based on Net Asset Value) | 12.04% | 26.09% |
| Dividend Growth ETF (At Market Price)* | 12.06 | 26.20 |
| S&P 500 Index | 11.67 | 28.71 |
| Lipper Large-Cap Core Funds Index | 9.69 | 26.04 |
*Market returns are based on the midpoint of the bid/ask spread at market close (typically, 4 p.m. ET) and do not represent returns an investor would have received if shares were traded at other times.
T. ROWE PRICE DIVIDEND GROWTH ETF
23.84%. The fund delivered strong absolute performance, but our risk-aware focus on high-quality dividend growers lagged as the broader market withstood periodic volatility and major indexes posted record highs throughout the year. Against a backdrop of a broad rally across market segments, our preference for dividend-paying stocks, which tend to be inherently less volatile, contributed to short-term underperformance, particularly in the information technology and communication services sectors, where non-dividend-paying companies led gains.
Information technology sector holdings hurt our relative performance due to a combination of our underweight allocation and stock selection. Our position in Fidelity National Information Services weighed on returns for the year as the shares declined on concerns over increased competition from fast-growing competitors. In our view, these headwinds appear overstated, and we took advantage of this recent weakness to build our position. We remain constructive on the company for its industry-leading position and defensive earnings growth profile, which stands to benefit from executing deal-related synergies. (Please refer to the fund’s portfolio of investments for a complete list of our holdings and the amount each represents in the portfolio.)
An overweight allocation to the industrials and business services sector also had a modest negative impact. Despite generating strong double-digit returns, the sector lagged in a market that heavily favored sectors more closely levered to the economic recovery such as energy, real estate, and financials.
Stock selection in the communication services sector weighed on relative performance, although this impact was largely offset by our favorable underweight allocation. Several of the benchmark’s top-performing stocks in the communication services sector are names that do not pay dividends and do not intend to initiate them. Not owning Alphabet, the parent company of Google, hurt our relative performance. Shares of the company surged over the year driven by impressive revenue from its advertising business. We don’t own the stock because it does not fit our dividend mandate.
Comcast posted a modest negative return and underperformed sector peers for the year. Shares turned lower late in the period after the company’s CEO indicated expectations for slightly slower growth in the broadband segment. In part, this deceleration is a result of growth in internet services during the prior year when the impact of the pandemic was most pronounced. We continue to like Comcast for the strength in its cable division, consistent cash flow growth, and relatively modest valuation.
The financials sector continues to be one of our largest absolute sector weights, and our choice of stocks in the space added value. Our top holding in the sector is Marsh & McLennan, the world’s largest property and casualty insurance
T. ROWE PRICE DIVIDEND GROWTH ETF
broker and a leading consultant. The company has benefited throughout the year from momentum in the insurance rate cycle, which has pushed premiums higher and contributed to revenue growth. Shares advanced in the fourth quarter on the heels of particularly strong earnings highlighted by robust organic revenue growth. We also hold a notable position in discount brokerage firm Charles Schwab. Shares of the company delivered robust gains and outpaced sector peers, particularly late in the period, due to strong earnings and revenue growth driven by elevated trading activity.
Stock selection drove strong relative returns in the health care sector. Our position in Danaher was the top contributor in the sector. Danaher designs, manufactures, and markets professional, medical, industrial, and commercial products and services worldwide. Shares continued their recent run of strength and outpaced sector peers as revenue tailwinds from COVID-related demand have proven durable. While we pared our position on strength during the year, we continue to like the company for its highly diversified business model, broad exposure to end markets with secular growth or low cyclicality, and strong management team.
How is the fund positioned?
As shown in the Sector Diversification table, the fund’s largest allocations at the end of the period were in information technology, health care, and financials, which represent a little more than half of the portfolio’s net assets. These are sectors where we believe we can find high-quality companies with sustainable competitive advantages, durable business models, attractive valuations, and potential for strong dividend growth.
The information technology sector is our largest allocation but remains a significant underweight relative to the S&P 500 Index. We reduced our weighting during the period, taking profits from several of our strongest-performing holdings and reallocating the proceeds where we saw better long-term opportunities. Shares of Apple posted strong double-digit growth over the year, and we pared our position on strength. We also trimmed our position in Visa, a global leader in the payments industry. We still like its exposure to the ongoing economic recovery, secular growth prospects in electronic payments, and high margins. While we also value Visa for its pricing power and capacity to generate free cash flow, market concerns over competition, shifting consumer trends, and an above-average valuation contributed to our decision to pare the position size.
In the financials sector, we look to own high-quality companies that have strong balance sheets, diversified revenue streams, and leading industry positions. In the first half of the year, we initiated a position in Bank of America, which is one of the four largest U.S. money center banks. We continued to build this position
T. ROWE PRICE DIVIDEND GROWTH ETF
over the year, and our purchases here represent the largest for the portfolio over the period. The bank is a major player in U.S. retail financial services with a large proportion of its business generated from consumer banking, trading, and global banking. We believe the company’s solid fundamentals and steady revenue generation offer downside protection, while its well-balanced business model can produce steady above-average growth. We also like that Bank of America is heavily exposed to the U.S. consumer, where prospects for economic growth remain above average. The bank appears well positioned to benefit from a rising interest rate environment.
Concurrently, we trimmed our position in JPMorgan Chase. Recent strength created an opportunity to take profits, although our position in the company remains among our largest in the sector. We also exited our position in PNC Financial Services. The stock generated strong longer-term performance for the portfolio, and we reallocated proceeds to other opportunities in the financials sector that offer a more compelling risk/reward opportunity.
The health care sector continues to play a significant role in the portfolio, as we
SECTOR DIVERSIFICATION
| | Percent of Net Assets |
| | 6/30/21 | 12/31/21 |
| Information Technology | 21.8% | 22.2% |
| Health Care | 16.4 | 16.6 |
| Financials | 14.0 | 13.7 |
| Industrials and Business Services | 13.0 | 12.4 |
| Consumer Discretionary | 7.9 | 8.1 |
| Consumer Staples | 6.8 | 7.0 |
| Materials | 5.5 | 5.7 |
| Utilities | 3.9 | 4.1 |
| Real Estate | 3.4 | 3.4 |
| Communication Services | 3.0 | 2.2 |
| Energy | 1.2 | 1.2 |
| Other and Reserves | 3.1 | 3.4 |
| Total | 100.0% | 100.0% |
Historical weightings reflect current industry/sector classifications.
T. ROWE PRICE DIVIDEND GROWTH ETF
believe certain industries offer compelling, relatively stable growth potential. Early in the year we initiated a position in AstraZeneca, a global biopharmaceutical company. The firm had continued a run of strong execution, delivering on margin expansion, improving free cash flow, and investing heavily in its research and development pipeline, and we identified compelling opportunities to add to our position throughout the year. The company is also in the early stages of a new product cycle, which we believe can generate above-average growth for several years.
What is portfolio management’s outlook?
The U.S. economy is on solid footing and has been supported by a largely successful COVID-19 vaccine distribution combined with unprecedented monetary and fiscal support. The economic recovery has proven to be resilient, withstanding pressure from inflation, coronavirus variants, and the prospect for higher interest rates as monetary policy tightens. After back-to-back years of remarkable gains, equity markets face more uncertain prospects in 2022.
A protracted period of strong returns has left valuations extended across most market segments, with attractive opportunities harder to come by. Earnings growth appears to have peaked, and we expect growth to normalize, particularly as the tailwind from fiscal stimulus fades. Looking ahead, we would not be surprised to see a choppier environment in the coming quarters with more modest market returns.
We are also closely watching inflation, which seems to be persisting at a relatively high level, despite consensus expectations earlier in the year that it would recede. While debate continues over whether this uptick in inflation is transitory or more durable, we believe it poses a real headwind for companies and consumers alike in the current market. We are spending time with all the companies we own on this topic to better understand their ability to protect income streams through pricing power. Should inflation prove to be a longer-term issue, dividend growth stocks remain an attractive hedge for investors.
As always, our focus is on buying and holding high-quality companies that are expected to grow their dividends. We will continue to look for companies that can control costs effectively but also enjoy solid revenue growth. Stock selection is expected to be our primary relative performance driver over the long term, and we are confident that our in-depth independent research and collaborative investment approach can add value. The Dividend Growth ETF will continue to reflect a collection of high-quality, larger-cap, primarily U.S.-based companies with strong earnings and cash flows that offer a combination of capital appreciation and income growth for our shareholders.
T. ROWE PRICE DIVIDEND GROWTH ETF
RISKS OF STOCK INVESTING
A fund’s share price can fall because of weakness in the stock or bond markets, a particular industry, or specific holdings. Stock markets can decline for many reasons, including adverse political or economic developments, changes in investor psychology, or heavy institutional selling. The prospects for an industry or company may deteriorate because of a variety of factors, including disappointing earnings or changes in the competitive environment. In addition, the investment manager’s assessment of companies held in a fund may prove incorrect, resulting in losses or poor performance even in rising markets. Funds investing in stocks with a dividend orientation may have somewhat lower potential for price appreciation than those concentrating on rapidly growing firms. Also, a company may reduce or eliminate its dividend.
BENCHMARK INFORMATION
Note: Lipper, a Thomson Reuters Company, is the source for all Lipper content reflected in these materials. Copyright 2022 © Refinitiv. All rights reserved. Any copying, republication or redistribution of Lipper content is expressly prohibited without the prior written consent of Lipper. Lipper shall not be liable for any errors or delays in the content, or for any actions taken in reliance thereon.
Note: The NASDAQ US Broad Dividend Achievers Index is composed of U.S. accepted securities with at least 10 consecutive years of increasing annual regular dividend payments.
Note: ©2022, S&P Global Market Intelligence. Reproduction of any information, data or material, including ratings (Content) in any form is prohibited except with the prior written permission of the relevant party. Such party, its affiliates and suppliers (Content Providers) do not guarantee the accuracy, adequacy, completeness, timeliness or availability of any Content and are not responsible for any errors or omissions (negligent or otherwise), regardless of the cause, or for the results obtained from the use of such Content. In no event shall Content Providers be liable for any damages, costs, expenses, legal fees, or losses (including lost income or lost profit and opportunity costs) in connection with any use of the Content.
The views expressed reflect the opinions of T. Rowe Price as of the date of this report and are subject to change based on changes in market, economic, or other conditions. These views are not intended to be a forecast of future events and are no guarantee of future results.
T. ROWE PRICE DIVIDEND GROWTH ETF
PORTFOLIO HIGHLIGHTS
TWENTY-FIVE LARGEST HOLDINGS
| | Percent of
Net Assets |
| | 12/31/21 |
| Microsoft | 6.5% |
| Apple | 4.1 |
| Danaher | 2.6 |
| UnitedHealth Group | 2.5 |
| Accenture | 2.3 |
| Thermo Fisher Scientific | 1.9 |
| Marsh & McLennan | 1.8 |
| Visa | 1.8 |
| JPMorgan Chase | 1.8 |
| Mondelez International | 1.6 |
| Chubb | 1.4 |
| Roper Technologies | 1.4 |
| Home Depot | 1.4 |
| Equity Residential | 1.4 |
| PepsiCo | 1.3 |
| Charles Schwab | 1.3 |
| AbbVie | 1.3 |
| GE | 1.3 |
| Union Pacific | 1.3 |
| Dollar General | 1.3 |
| Texas Instruments | 1.3 |
| Wells Fargo | 1.3 |
| American Tower | 1.3 |
| Morgan Stanley | 1.3 |
| Zoetis | 1.3 |
| Total | 46.8% |
Note: The information shown does not reflect any exchange-traded funds (ETFs), cash reserves, or collateral for securities lending that may be held in the portfolio.
T. ROWE PRICE DIVIDEND GROWTH ETF
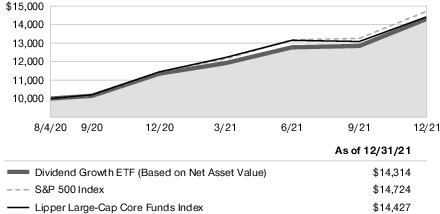
GROWTH OF $10,000
This chart shows the value of a hypothetical $10,000 investment in the fund over the past 10 fiscal year periods or since inception (for funds lacking 10-year records). The result is compared with benchmarks, which include a broad-based market index and may also include a peer group average or index. Market indexes do not include expenses, which are deducted from fund returns as well as mutual fund averages and indexes.
Dividend Growth ETF
T. ROWE PRICE DIVIDEND GROWTH ETF
AVERAGE ANNUAL COMPOUND TOTAL RETURN
| Periods Ended 12/31/21 | One Year | Since
Inception
8/4/20 |
| Dividend Growth ETF (Based on Net Asset Value) | 26.09% | 29.03% |
| Dividend Growth ETF (At Market Price) | 26.20 | 29.11 |
The fund’s performance information represents only past performance and is not necessarily an indication of future results. Current performance may be lower or higher than the performance data cited. Share price, principal value, and return will vary, and you may have a gain or loss when you sell your shares. Market returns are based on the midpoint of the bid/ask spread at market close (typically, 4 p.m. ET) and do not represent returns an investor would have received if shares were traded at other times. For the most recent month-end performance, please visit our website (troweprice.com).
This table shows how the fund would have performed each year if its actual (or cumulative) returns had been earned at a constant rate. Average annual total return figures include changes in principal value, reinvested dividends, and capital gain distributions. Returns do not reflect taxes that the shareholder may pay on fund distributions or the redemption of fund shares. When assessing performance, investors should consider both short- and long-term returns.
PREMIUM/DISCOUNT INFORMATION
The frequency at which the daily market prices were at a discount or premium to the fund’s net asset value is available on the fund’s website (troweprice.com).
EXPENSE RATIO
The expense ratio shown is as of the fund’s most recent prospectus. This number may vary from the expense ratio shown elsewhere in this report because it is based on a different time period and, if applicable, includes acquired fund fees and expenses but does not include fee or expense waivers.
T. ROWE PRICE DIVIDEND GROWTH ETF
FUND EXPENSE EXAMPLE
As a shareholder, you may incur two types of costs: (1) transaction costs, such as brokerage commissions on purchases and sales, and (2) ongoing costs, including management fees and other fund expenses. The following example is intended to help you understand your ongoing costs (in dollars) of investing in the fund and to compare these costs with the ongoing costs of investing in other funds. The example is based on an investment of $1,000 invested at the beginning of the most recent six-month period and held for the entire period.
Actual Expenses
The first line of the following table (Actual) provides information about actual account values and expenses based on the fund’s actual returns. You may use the information on this line, together with your account balance, to estimate the expenses that you paid over the period. Simply divide your account value by $1,000 (for example, an $8,600 account value divided by $1,000 = 8.6), then multiply the result by the number on the first line under the heading “Expenses Paid During Period” to estimate the expenses you paid on your account during this period.
Hypothetical Example for Comparison Purposes
The information on the second line of the table (Hypothetical) is based on hypothetical account values and expenses derived from the fund’s actual expense ratio and an assumed 5% per year rate of return before expenses (not the fund’s actual return). You may compare the ongoing costs of investing in the fund with other funds by contrasting this 5% hypothetical example and the 5% hypothetical examples that appear in the shareholder reports of the other funds. The hypothetical account values and expenses may not be used to estimate the actual ending account balance or expenses you paid for the period.
You should also be aware that the expenses shown in the table highlight only your ongoing costs and do not reflect any transaction costs, such as brokerage commissions paid on purchases and sales of shares. Therefore, the second line of the table is useful in comparing ongoing costs only and will not help you determine the relative total costs of owning different funds. To the extent a fund charges transaction costs, however, the total cost of owning that fund is higher.
T. ROWE PRICE DIVIDEND GROWTH ETF
FUND EXPENSE EXAMPLE (continued)
T. Rowe Price Dividend Growth ETF
| | Beginning
Account Value
7/1/21 | Ending
Account Value
12/31/21 | Expenses Paid
During Period*
7/1/21 to 12/31/21 |
| Actual | $1,000.00 | $1,120.40 | $2.67 |
| Hypothetical (assumes 5% return before expenses) | 1,000.00 | 1,022.68 | 2.55 |
| * | Expenses are equal to the fund’s annualized expense ratio for the 6-month period (0.50%), multiplied by the average account value over the period, multiplied by the number of days in the most recent fiscal half year (184), and divided by the days in the year (365) to reflect the half-year period. |
T. ROWE PRICE DIVIDEND GROWTH ETF
For a share outstanding throughout each period
| | Year
Ended | 8/4/20(1)
Through |
| | 12/31/21 | 12/31/20 |
| NET ASSET VALUE | | |
| Beginning of period | $ 28.26 | $ 25.00 |
| Investment activities | | |
| Net investment income(2) (3) | 0.33 | 0.14 |
| Net realized and unrealized gain/loss | 7.01 | 3.24 |
| Total from investment activities | 7.34 | 3.38 |
| Distributions | | |
| Net investment income | (0.28) | (0.12) |
| NET ASSET VALUE | | |
| End of period | $ 35.32 | $ 28.26 |
| Ratios/Supplemental Data |
| Total return, based on NAV(3) (4) | 26.09% | 13.52% |
Ratios to average net
assets:(3) | | |
Gross expenses before
waivers/payments by
Price Associates | 0.50% | 0.50%(5) |
Net expenses after
waivers/payments by
Price Associates | 0.50% | 0.50%(5) |
| Net investment income | 1.01% | 1.31%(5) |
| Portfolio turnover rate(6) | 12.1% | 6.7% |
Net assets, end of period
(in thousands) | $ 126,811 | $ 37,020 |
| (1) | Inception date |
| (2) | Per share amounts calculated using average shares outstanding method. |
| (3) | See Note 5 for details to expense-related arrangements with Price Associates. |
| (4) | Total return reflects the rate that an investor would have earned on an investment in the fund during each period, assuming reinvestment of all distributions. Total return is not annualized for periods less than one year. |
| (5) | Annualized |
| (6) | Portfolio turnover excludes securities received or delivered through in-kind share transactions. |
The accompanying notes are an integral part of these financial statements.
T. ROWE PRICE DIVIDEND GROWTH ETF
December 31, 2021
| PORTFOLIO OF INVESTMENTS‡ | Shares | $ Value |
| (Cost and value in $000s) | | |
| COMMON STOCKS 96.6% |
| COMMUNICATION SERVICES 2.2% |
| Entertainment 0.9% | | |
| Walt Disney (1) | 7,430 | 1,151 |
| | | 1,151 |
| Media 1.3% | | |
| Comcast, Class A | 31,625 | 1,591 |
| | | 1,591 |
| Total Communication Services | | 2,742 |
| CONSUMER DISCRETIONARY 8.1% |
| Hotels Restaurants & Leisure 3.3% | | |
| Hilton Worldwide Holdings (1) | 8,203 | 1,280 |
| Las Vegas Sands (1) | 9,363 | 352 |
| Marriott International, Class A (1) | 3,327 | 550 |
| McDonald's | 4,876 | 1,307 |
| Yum! Brands | 5,376 | 746 |
| | | 4,235 |
| Multiline Retail 1.3% | | |
| Dollar General | 6,910 | 1,630 |
| | | 1,630 |
| Specialty Retail 3.0% | | |
| Home Depot | 4,284 | 1,778 |
| Ross Stores | 12,932 | 1,478 |
| Tractor Supply | 2,125 | 507 |
| | | 3,763 |
T. ROWE PRICE DIVIDEND GROWTH ETF
| | Shares | $ Value |
| (Cost and value in $000s) | | |
| Textiles, Apparel & Luxury Goods 0.5% | | |
| NIKE, Class B | 3,840 | 640 |
| | | 640 |
| Total Consumer Discretionary | | 10,268 |
| CONSUMER STAPLES 7.0% |
| Beverages 2.7% | | |
| Coca-Cola | 23,930 | 1,417 |
| Diageo, ADR | 1,691 | 372 |
| PepsiCo | 9,779 | 1,699 |
| | | 3,488 |
| Food & Staples Retailing 0.7% | | |
| Costco Wholesale | 1,661 | 943 |
| | | 943 |
| Food Products 2.3% | | |
| McCormick | 8,728 | 843 |
| Mondelez International | 30,320 | 2,011 |
| | | 2,854 |
| Household Products 0.8% | | |
| Colgate-Palmolive | 4,473 | 382 |
| Kimberly-Clark | 4,628 | 661 |
| | | 1,043 |
| Tobacco 0.5% | | |
| Philip Morris International | 6,066 | 576 |
| | | 576 |
| Total Consumer Staples | | 8,904 |
| ENERGY 1.2% |
| Oil, Gas & Consumable Fuels 1.2% | | |
| EOG Resources | 9,158 | 813 |
T. ROWE PRICE DIVIDEND GROWTH ETF
| | Shares | $ Value |
| (Cost and value in $000s) | | |
| TotalEnergies, ADR | 13,779 | 682 |
| Total Energy | | 1,495 |
| FINANCIALS 13.7% |
| Banks 4.1% | | |
| Bank of America | 30,294 | 1,348 |
| JPMorgan Chase & Co. | 14,366 | 2,275 |
| PNC Financial Services Group | 128 | 26 |
| Wells Fargo & Co. | 33,545 | 1,609 |
| | | 5,258 |
| Capital Markets 4.3% | | |
| Charles Schwab | 20,150 | 1,695 |
| CME Group | 2,737 | 625 |
| Goldman Sachs Group | 1,604 | 614 |
| Morgan Stanley | 16,264 | 1,596 |
| S&P Global | 1,815 | 857 |
| | | 5,387 |
| Consumer Finance 0.4% | | |
| American Express | 3,371 | 551 |
| | | 551 |
| Insurance 4.9% | | |
| Aon, Class A | 3,701 | 1,112 |
| Chubb | 9,362 | 1,810 |
| Marsh & McLennan | 13,514 | 2,349 |
| Progressive | 4,471 | 459 |
| Willis Towers Watson | 1,992 | 473 |
| | | 6,203 |
| Total Financials | | 17,399 |
T. ROWE PRICE DIVIDEND GROWTH ETF
| | Shares | $ Value |
| (Cost and value in $000s) | | |
| HEALTH CARE 16.6% |
| Biotechnology 1.3% | | |
| AbbVie | 12,351 | 1,672 |
| | | 1,672 |
| Health Care Equipment & Supplies 2.7% | | |
| Becton Dickinson & Co. | 4,528 | 1,139 |
| Medtronic | 9,209 | 953 |
| Stryker | 5,114 | 1,367 |
| | | 3,459 |
| Health Care Providers & Services 3.2% | | |
| Cigna | 4,132 | 949 |
| UnitedHealth Group | 6,240 | 3,133 |
| | | 4,082 |
| Life Sciences Tools & Services 5.6% | | |
| Agilent Technologies | 8,642 | 1,380 |
| Danaher | 10,209 | 3,359 |
| Thermo Fisher Scientific | 3,558 | 2,374 |
| | | 7,113 |
| Pharmaceuticals 3.8% | | |
| AstraZeneca, ADR | 12,956 | 755 |
| Eli Lilly & Co. | 4,378 | 1,209 |
| Johnson & Johnson | 7,163 | 1,225 |
| Zoetis | 6,530 | 1,594 |
| | | 4,783 |
| Total Health Care | | 21,109 |
| INDUSTRIALS & BUSINESS SERVICES 12.4% |
| Aerospace & Defense 1.0% | | |
| Howmet Aerospace | 13,645 | 434 |
T. ROWE PRICE DIVIDEND GROWTH ETF
| | Shares | $ Value |
| (Cost and value in $000s) | | |
| Northrop Grumman | 2,293 | 888 |
| | | 1,322 |
| Air Freight & Logistics 1.1% | | |
| United Parcel Service, Class B | 6,502 | 1,394 |
| | | 1,394 |
| Commercial Services & Supplies 1.4% | | |
| Cintas | 766 | 339 |
| Waste Connections | 10,853 | 1,479 |
| | | 1,818 |
| Electrical Equipment 0.4% | | |
| Rockwell Automation | 1,362 | 475 |
| | | 475 |
| Industrial Conglomerates 3.9% | | |
| General Electric | 17,608 | 1,663 |
| Honeywell International | 7,172 | 1,496 |
| Roper Technologies | 3,623 | 1,782 |
| | | 4,941 |
| Machinery 2.2% | | |
| Caterpillar | 117 | 24 |
| Cummins | 2,168 | 473 |
| Deere | 797 | 274 |
| Fortive | 7,998 | 610 |
| Illinois Tool Works | 4,081 | 1,007 |
| Otis Worldwide | 4,100 | 357 |
| | | 2,745 |
| Professional Services 0.5% | | |
| Equifax | 2,332 | 683 |
| | | 683 |
T. ROWE PRICE DIVIDEND GROWTH ETF
| | Shares | $ Value |
| (Cost and value in $000s) | | |
| Road & Rail 1.9% | | |
| JB Hunt Transport Services | 3,673 | 751 |
| Union Pacific | 6,516 | 1,641 |
| | | 2,392 |
| Total Industrials & Business Services | | 15,770 |
| INFORMATION TECHNOLOGY 22.2% |
| Electronic Equipment, Instruments & Components 1.5% | | |
| Amphenol, Class A | 11,260 | 985 |
| TE Connectivity | 5,978 | 964 |
| | | 1,949 |
| IT Services 6.6% | | |
| Accenture, Class A | 7,043 | 2,920 |
| Automatic Data Processing | 3,577 | 882 |
| Broadridge Financial Solutions | 6,131 | 1,121 |
| Fidelity National Information Services | 10,226 | 1,116 |
| Visa, Class A | 10,518 | 2,279 |
| | | 8,318 |
| Semiconductors & Semiconductor Equipment 3.5% | | |
| Applied Materials | 7,797 | 1,227 |
| Microchip Technology | 9,344 | 813 |
| QUALCOMM | 3,941 | 721 |
| Texas Instruments | 8,642 | 1,629 |
| | | 4,390 |
| Software 6.5% | | |
| Microsoft | 24,606 | 8,276 |
| | | 8,276 |
T. ROWE PRICE DIVIDEND GROWTH ETF
| | Shares | $ Value |
| (Cost and value in $000s) | | |
| Technology Hardware, Storage & Peripherals 4.1% | | |
| Apple | 29,292 | 5,201 |
| | | 5,201 |
| Total Information Technology | | 28,134 |
| MATERIALS 5.7% |
| Chemicals 3.0% | | |
| Air Products & Chemicals | 2,111 | 642 |
| Ecolab | 529 | 124 |
| Linde | 3,535 | 1,225 |
| RPM International | 6,866 | 693 |
| Sherwin-Williams | 3,177 | 1,119 |
| | | 3,803 |
| Containers & Packaging 2.7% | | |
| Avery Dennison | 5,104 | 1,105 |
| Ball | 14,974 | 1,442 |
| Sealed Air | 12,057 | 814 |
| | | 3,361 |
| Total Materials | | 7,164 |
| REAL ESTATE 3.4% |
| Equity Real Estate Investment Trusts 3.4% | | |
| American Tower, REIT | 5,459 | 1,597 |
| Crown Castle International, REIT | 4,798 | 1,001 |
| Equity Residential, REIT | 19,381 | 1,754 |
| Total Real Estate | | 4,352 |
| UTILITIES 4.1% |
| Electric Utilities 1.6% | | |
| Eversource Energy | 6,680 | 608 |
| NextEra Energy | 15,512 | 1,448 |
| | | 2,056 |
T. ROWE PRICE DIVIDEND GROWTH ETF
| | Shares | $ Value |
| (Cost and value in $000s) | | |
| Gas Utilities 0.5% | | |
| Atmos Energy | 5,897 | 618 |
| | | 618 |
| Multi-Utilities 1.6% | | |
| Ameren | 8,885 | 791 |
| CMS Energy | 10,822 | 704 |
| Sempra Energy | 3,400 | 450 |
| | | 1,945 |
| Water Utilities 0.4% | | |
| American Water Works | 2,903 | 548 |
| | | 548 |
| Total Utilities | | 5,167 |
| Total Common Stocks (Cost $102,305) | | 122,504 |
| SHORT-TERM INVESTMENTS 3.3% |
| Money Market Funds 3.3% | | |
| State Street Institutional U.S. Government Money Market Fund, 0.03% (2) | 4,199,359 | 4,199 |
| Total Short-Term Investments (Cost $4,199) | | 4,199 |
Total Investments in Securities
99.9% of Net Assets (Cost $106,504) | | $126,703 |
| ‡ | Shares are denominated in U.S. dollars unless otherwise noted. |
| (1) | Non-income producing. |
| (2) | Seven-day yield |
| ADR | American Depositary Receipts |
| REIT | A domestic Real Estate Investment Trust whose distributions pass-through with original tax character to the shareholder |
The accompanying notes are an integral part of these financial statements.
T. ROWE PRICE DIVIDEND GROWTH ETF
December 31, 2021
STATEMENT OF ASSETS AND LIABILITIES
($000s, except shares and per share amounts)
| Assets | |
| Investments in securities, at value (cost $106,504) | $126,703 |
| Receivable for shares sold | 1,236 |
| Dividends receivable | 118 |
| Other assets | 2 |
| Total assets | 128,059 |
| Liabilities | |
| Payable for investment securities purchased | 1,196 |
| Investment management and administrative fees payable | 50 |
| Other liabilities | 2 |
| Total liabilities | 1,248 |
| NET ASSETS | $126,811 |
| Net assets consists of: | |
| Total distributable earnings (loss) | $20,046 |
Paid-in capital applicable to 3,590,000 shares of $0.0001 par value
capital stock outstanding; 4,000,000,000 shares authorized | 106,765 |
| NET ASSETS | $126,811 |
| NET ASSET VALUE PER SHARE | $35.32 |
The accompanying notes are an integral part of these financial statements.
T. ROWE PRICE DIVIDEND GROWTH ETF
STATEMENT OF OPERATIONS
($000s)
| | Year
Ended
12/31/21 |
| Investment Income (Loss) | |
| Dividend income (net of foreign withholding taxes $6) | $1,158 |
| Investment management and administrative expense | 382 |
| Net investment income | 776 |
| Realized and Unrealized Gain / Loss | |
| Net realized gain (loss) | |
| Securities | (81) |
| In-kind redemptions | 210 |
| Net realized gain | 129 |
| Change in net unrealized gain / loss on securities | 16,996 |
| Net realized and unrealized gain / loss | 17,125 |
| INCREASE IN NET ASSETS FROM OPERATIONS | $17,901 |
The accompanying notes are an integral part of these financial statements.
T. ROWE PRICE DIVIDEND GROWTH ETF
STATEMENT OF CHANGES IN NET ASSETS
($000s)
| | Year
Ended
12/31/21 | | 8/4/20
Through
12/31/20 |
| Increase (Decrease) in Net Assets | | | |
| Operations | | | |
| Net investment income | $776 | | $122 |
| Net realized gain (loss) | 129 | | (90) |
| Change in net unrealized gain / loss | 16,996 | | 3,203 |
| Increase in net assets from operations | 17,901 | | 3,235 |
| Distributions to shareholders | | | |
| Net earnings | (762) | | (118) |
| Capital share transactions* | | | |
| Shares sold | 73,341 | | 33,903 |
| Shares redeemed | (689) | | — |
| Increase in net assets from capital share transactions | 72,652 | | 33,903 |
| Net Assets | | | |
| Increase during period | 89,791 | | 37,020 |
| Beginning of period | 37,020 | | - |
| End of period | $126,811 | | $37,020 |
| *Share information | | | |
| Shares sold | 2,300 | | 1,310 |
| Shares redeemed | (20) | | — |
| Increase in shares outstanding | 2,280 | | 1,310 |
The accompanying notes are an integral part of these financial statements.
T. ROWE PRICE DIVIDEND GROWTH ETF
NOTES TO FINANCIAL STATEMENTS
T. Rowe Price Exchange-Traded Funds, Inc. (the corporation) is registered under the Investment Company Act of 1940 (the 1940 Act). The Dividend Growth ETF (the fund) is a diversified, open-end management investment company established by the corporation. The fund incepted on August 4, 2020. The fund seeks dividend income and long-term capital growth.
The fund is considered an actively-managed exchange-traded fund (ETF) that does not disclose its portfolio holdings daily, which is different from a traditional ETF and may create additional risks. In order to provide market participants with information on the fund’s investments, the fund publishes a “Proxy Portfolio” on its website daily. A Proxy Portfolio is a basket of securities that is designed to closely track the daily performance of the fund’s portfolio holdings. While the Proxy Portfolio includes some of the fund’s holdings, it is not the fund’s actual portfolio. The fund does disclose its full portfolio holdings on a quarterly basis, similar to mutual funds.
NOTE 1 – SIGNIFICANT ACCOUNTING POLICIES
Basis of Preparation
The fund is an investment company and follows accounting and reporting guidance in the Financial Accounting Standards Board (FASB) Accounting Standards Codification Topic 946 (ASC 946). The accompanying financial statements were prepared in accordance with accounting principles generally accepted in the United States of America (GAAP), including, but not limited to, ASC 946. GAAP requires the use of estimates made by management. Management believes that estimates and valuations are appropriate; however, actual results may differ from those estimates, and the valuations reflected in the accompanying financial statements may differ from the value ultimately realized upon sale or maturity.
Investment Transactions, Investment Income, and Distributions
Investment transactions are accounted for on the trade date basis. Income and expenses are recorded on the accrual basis. Realized gains and losses are reported on the identified cost basis. Income tax-related interest and penalties, if incurred, are recorded as income tax expense. Dividends received from other investment companies are reflected as dividend income; capital gain distributions are reflected as realized gain/loss. Dividend income and capital gain distributions are recorded on the ex-dividend date. Distributions from REITs are initially recorded as dividend income and, to the extent such represent a return of capital or capital gain for tax purposes, are reclassified when such information becomes
T. ROWE PRICE DIVIDEND GROWTH ETF
available. Non-cash dividends, if any, are recorded at the fair market value of the asset received. Distributions to shareholders are recorded on the ex-dividend date. Income distributions, if any, are declared and paid quarterly. A capital gain distribution may also be declared and paid by the fund annually. Dividends and distributions cannot be automatically reinvested in additional shares of the fund.
Capital Share Transactions
The fund issues and redeems shares at its net asset value (NAV) only with Authorized Participants and only in large blocks of 5,000 shares (each, a “Creation Unit”). The fund’s NAV per share is computed at the close of the New York Stock Exchange (NYSE). However, the NAV per share may be calculated at a time other than the normal close of the NYSE if trading on the NYSE is restricted, if the NYSE closes earlier, or as may be permitted by the SEC. Individual fund shares may not be purchased or redeemed directly with the fund. An Authorized Participant may purchase or redeem a Creation Unit of the fund each business day that the fund is open in exchange for the delivery of a designated portfolio of in-kind securities and/or cash. When purchasing or redeeming Creation Units, Authorized Participants are also required to pay a fixed and/or variable purchase or redemption transaction fee as well as any applicable additional variable charge to defray the transaction cost to a fund.
Individual fund shares may be purchased and sold only on a national securities exchange through brokers. Shares are listed for trading on NYSE Arca, Inc. (NYSE Arca) and because the shares will trade at market prices rather than NAV, shares may trade at prices greater than NAV (at a premium), at NAV, or less than NAV (at a discount). The fund’s shares are ordinarily valued as of the close of regular trading (normally 4:00 p.m. Eastern time) on each day that the NYSE Arca is open.
Indemnification
In the normal course of business, the fund may provide indemnification in connection with its officers and directors, service providers, and/or private company investments. The fund’s maximum exposure under these arrangements is unknown; however, the risk of material loss is currently considered to be remote.
NOTE 2 – VALUATION
Security Valuation
The fund’s financial instruments are valued at the close of the NYSE and are reported at fair value, which GAAP defines as the price that would be received to sell an asset or paid to transfer a liability in an orderly transaction between market participants at the measurement date. The T. Rowe Price Valuation Committee (the Valuation Committee) is
T. ROWE PRICE DIVIDEND GROWTH ETF
an internal committee that has been delegated certain responsibilities by the fund’s Board of Directors (the Board) to ensure that financial instruments are appropriately priced at fair value in accordance with GAAP and the 1940 Act. Subject to oversight by the Board, the Valuation Committee develops and oversees pricing-related policies and procedures and approves all fair value determinations. Specifically, the Valuation Committee establishes policies and procedures used in valuing financial instruments, including those which cannot be valued in accordance with normal procedures or using pricing vendors; determines pricing techniques, sources, and persons eligible to effect fair value pricing actions; evaluates the services and performance of the pricing vendors; oversees the pricing process to ensure policies and procedures are being followed; and provides guidance on internal controls and valuation-related matters. The Valuation Committee provides periodic reporting to the Board on valuation matters.
Various valuation techniques and inputs are used to determine the fair value of financial instruments. GAAP establishes the following fair value hierarchy that categorizes the inputs used to measure fair value:
Level 1 – quoted prices (unadjusted) in active markets for identical financial instruments that the fund can access at the reporting date
Level 2 – inputs other than Level 1 quoted prices that are observable, either directly or indirectly (including, but not limited to, quoted prices for similar financial instruments in active markets, quoted prices for identical or similar financial instruments in inactive markets, interest rates and yield curves, implied volatilities, and credit spreads)
Level 3 – unobservable inputs (including the fund’s own assumptions in determining fair value)
Observable inputs are developed using market data, such as publicly available information about actual events or transactions, and reflect the assumptions that market participants would use to price the financial instrument. Unobservable inputs are those for which market data are not available and are developed using the best information available about the assumptions that market participants would use to price the financial instrument. GAAP requires valuation techniques to maximize the use of relevant observable inputs and minimize the use of unobservable inputs. When multiple inputs are used to derive fair value, the financial instrument is assigned to the level within the fair value hierarchy based on the lowest-level input that is significant to the fair value of the financial instrument. Input levels are not necessarily an indication of the risk or liquidity associated with financial instruments at that level but rather the degree of judgment used in determining those values.
T. ROWE PRICE DIVIDEND GROWTH ETF
Valuation Techniques
Equity securities, including exchange-traded funds, listed or regularly traded on a securities exchange or in the over-the-counter (OTC) market are valued at the last quoted sale price or, for certain markets, the official closing price at the time the valuations are made. OTC Bulletin Board securities are valued at the mean of the closing bid and asked prices. A security that is listed or traded on more than one exchange is valued at the quotation on the exchange determined to be the primary market for such security. Listed securities not traded on a particular day are valued at the mean of the closing bid and asked prices for domestic securities.
Investments in mutual funds are valued at the mutual fund’s closing NAV per share on the day of valuation. Assets and liabilities other than financial instruments, including short-term receivables and payables, are carried at cost, or estimated realizable value, if less, which approximates fair value.
Investments for which market quotations or market-based valuations are not readily available or deemed unreliable are valued at fair value as determined in good faith by the Valuation Committee, in accordance with fair valuation policies and procedures. The objective of any fair value pricing determination is to arrive at a price that could reasonably be expected from a current sale. Financial instruments fair valued by the Valuation Committee are primarily private placements, restricted securities, warrants, rights, and other securities that are not publicly traded. Factors used in determining fair value vary by type of investment and may include market or investment specific considerations. The Valuation Committee typically will afford greatest weight to actual prices in arm’s length transactions, to the extent they represent orderly transactions between market participants, transaction information can be reliably obtained, and prices are deemed representative of fair value. However, the Valuation Committee may also consider other valuation methods such as market-based valuation multiples; a discount or premium from market value of a similar, freely traded security of the same issuer; discounted cash flows; yield to maturity; or some combination. Fair value determinations are reviewed on a regular basis and updated as information becomes available, including actual purchase and sale transactions of the investment. Because any fair value determination involves a significant amount of judgment, there is a degree of subjectivity inherent in such pricing decisions, and fair value prices determined by the Valuation Committee could differ from those of other market participants.
Valuation Inputs
On December 31, 2021, all of the fund’s financial instruments were classified as Level 1, based on the inputs used to determine their fair values.
T. ROWE PRICE DIVIDEND GROWTH ETF
NOTE 3 – OTHER INVESTMENT TRANSACTIONS
Purchases and sales of portfolio securities excluding in-kind transactions and short-term securities aggregated $8,994,000 and $9,595,000, respectively, for the year ended December 31, 2021. Portfolio securities received or delivered through in-kind transactions aggregated $70,865,000 and $665,000, respectively, for the year ended December 31, 2021.
NOTE 4 – FEDERAL INCOME TAXES
No provision for federal income taxes is required since the fund intends to continue to qualify as a regulated investment company under Subchapter M of the Internal Revenue Code and distribute to shareholders all of its taxable income and gains. Distributions determined in accordance with federal income tax regulations may differ in amount or character from net investment income and realized gains for financial reporting purposes.
The fund files U.S. federal, state, and local tax returns as required. The fund’s tax returns are subject to examination by the relevant tax authorities until expiration of the applicable statute of limitations, which is generally three years after the filing of the tax return but which can be extended to six years in certain circumstances. Tax returns for open years have incorporated no uncertain tax positions that require a provision for income taxes.
Financial reporting records are adjusted for permanent book/tax differences to reflect tax character but are not adjusted for temporary differences. The permanent book/tax adjustments have no impact on results of operations or net assets and relate primarily to redemptions in kind and the character of dividends received from real estate investment trusts (REITs). For the year ended December 31, 2021, the following reclassification was recorded:
| ($000s) | |
| Total distributable earnings (loss) | $(209) |
| Paid-in capital | 209 |
Distributions during the year and period ended December 31, 2021 and December 31, 2020, totaled $762,000 and $118,000, respectively, and were characterized as ordinary income for tax purposes. At December 31, 2021, the tax-basis cost of investments and components of net assets were as follows:
T. ROWE PRICE DIVIDEND GROWTH ETF
| ($000s) | |
| Cost of investments | $106,561 |
| Unrealized appreciation | $20,849 |
| Unrealized depreciation | (707) |
| Net unrealized appreciation (depreciation) | 20,142 |
| Undistributed ordinary income | 18 |
| Capital loss carryforwards | (114) |
| Paid-in capital | 106,765 |
| Net assets | $126,811 |
The difference between book-basis and tax-basis net unrealized appreciation (depreciation) is attributable to the deferral of losses from wash sales and/or treatment of non-taxable distributions from REITs for tax purposes. The fund intends to retain realized gains to the extent of available capital loss carryforwards. Net realized capital losses may be carried forward indefinitely to offset future realized capital gains.
NOTE 5 – RELATED PARTY TRANSACTIONS
The fund is managed by T. Rowe Price Associates, Inc. (Price Associates), a wholly owned subsidiary of T. Rowe Price Group, Inc. (Price Group). The investment management and administrative agreement between the fund and Price Associates provides for an all-inclusive annual fee equal to 0.50% of the fund’s average daily net assets. The fee is computed daily and paid monthly. The all-inclusive fee covers investment management services and ordinary, recurring operating expenses, but does not cover interest and borrowing expenses; taxes; brokerage commissions and other transaction costs; fund proxy expenses; and nonrecurring expenses.
As of December 31, 2021, T. Rowe Price Group, Inc., or its wholly owned subsidiaries, owned 600,000 shares of the fund, representing 17% of the fund’s net assets.
The fund may participate in securities purchase and sale transactions with other funds or accounts advised by Price Associates (cross trades), in accordance with procedures adopted by the fund’s Board and Securities and Exchange Commission rules, which require, among other things, that such purchase and sale cross trades be effected at the independent current market price of the security. During the year ended December 31, 2021, fund had no purchases or sales cross trades with other funds or accounts advised by Price Associates.
T. ROWE PRICE DIVIDEND GROWTH ETF
Price Associates has voluntarily agreed to reimburse the fund from its own resources on a monthly basis for the cost of investment research embedded in the cost of the fund’s securities trades. This agreement may be rescinded at any time. For the year ended December 31, 2021, this reimbursement amounted to less than $1,000.
NOTE 6 – OTHER MATTERS
Unpredictable events such as environmental or natural disasters, war, terrorism, pandemics, outbreaks of infectious diseases, and similar public health threats may significantly affect the economy and the markets and issuers in which a fund invests. Certain events may cause instability across global markets, including reduced liquidity and disruptions in trading markets, while some events may affect certain geographic regions, countries, sectors, and industries more significantly than others, and exacerbate other pre-existing political, social, and economic risks. The fund’s performance could be negatively impacted if the value of a portfolio holding were harmed by such events. Since 2020, a novel strain of coronavirus (COVID-19) has resulted in disruptions to global business activity and caused significant volatility and declines in global financial markets. The duration of this outbreak or others and their effects cannot be determined with certainty.
T. ROWE PRICE DIVIDEND GROWTH ETF
REPORT OF INDEPENDENT REGISTERED PUBLIC ACCOUNTING FIRM
To the Board of Directors of T. Rowe Price Exchange-Traded Funds, Inc. and Shareholders of T. Rowe Price Dividend Growth ETF
Opinion on the Financial Statements
We have audited the accompanying statement of assets and liabilities, including the portfolio of investments, of T. Rowe Price Dividend Growth ETF (one of the funds constituting T. Rowe Price Exchange-Traded Funds, Inc., referred to hereafter as the "Fund") as of December 31, 2021, the related statement of operations for the year ended December 31, 2021 and the statement of changes in net assets and the financial highlights for the year ended December 31, 2021 and for the period August 4, 2020 (Inception) through December 31, 2020, including the related notes (collectively referred to as the “financial statements”). In our opinion, the financial statements present fairly, in all material respects, the financial position of the Fund as of December 31, 2021, the results of its operations for the year ended December 31, 2021, and the changes in its net assets and the financial highlights for the year ended December 31, 2021 and for the period August 4, 2020 (Inception) through December 31, 2020 in conformity with accounting principles generally accepted in the United States of America.
Basis for Opinion
These financial statements are the responsibility of the Fund’s management. Our responsibility is to express an opinion on the Fund’s financial statements based on our audits. We are a public accounting firm registered with the Public Company Accounting Oversight Board (United States) (PCAOB) and are required to be independent with respect to the Fund in accordance with the U.S. federal securities laws and the applicable rules and regulations of the Securities and Exchange Commission and the PCAOB.
We conducted our audits of these financial statements in accordance with the standards of the PCAOB. Those standards require that we plan and perform the audit to obtain reasonable assurance about whether the financial statements are free of material misstatement, whether due to error or fraud.
T. ROWE PRICE DIVIDEND GROWTH ETF
REPORT OF INDEPENDENT REGISTERED PUBLIC ACCOUNTING FIRM
(CONTINUED)
Our audits included performing procedures to assess the risks of material misstatement of the financial statements, whether due to error or fraud, and performing procedures that respond to those risks. Such procedures included examining, on a test basis, evidence regarding the amounts and disclosures in the financial statements. Our audits also included evaluating the accounting principles used and significant estimates made by management, as well as evaluating the overall presentation of the financial statements. Our procedures included confirmation of securities owned as of December 31, 2021 by correspondence with the custodian and brokers; when replies were not received from brokers, we performed other auditing procedures. We believe that our audits provide a reasonable basis for our opinion.
PricewaterhouseCoopers LLP
Baltimore, Maryland
February 17, 2022
We have served as the auditor of one or more investment companies in the T. Rowe Price group of investment companies since 1973.
T. ROWE PRICE DIVIDEND GROWTH ETF
TAX INFORMATION (UNAUDITED) FOR THE TAX YEAR ENDED 12/31/21
We are providing this information as required by the Internal Revenue Code. The amounts shown may differ from those elsewhere in this report because of differences between tax and financial reporting requirements. The fund’s distributions to shareholders included:
For taxable non-corporate shareholders, $1,083,000 of the fund’s income represents qualified dividend income subject to a long-term capital gains tax rate of not greater than 20%.
For corporate shareholders, $956,000 of the fund’s income qualifies for the dividends received deduction.
INFORMATION ON PROXY VOTING POLICIES, PROCEDURES, AND RECORDS
A description of the policies and procedures used by T. Rowe Price funds and portfolios to determine how to vote proxies relating to portfolio securities is available in each fund’s Statement of Additional Information. You may request this document by calling 1-800-638-5660 or by accessing the SEC’s website, sec.gov.
The description of our proxy voting policies and procedures is also available on our corporate website. To access it, please visit the following Web page:
https://www.troweprice.com/corporate/en/utility/policies.html
Scroll down to the section near the bottom of the page that says, “Proxy Voting Policies.” Click on the Proxy Voting Policies link in the shaded box.
Each fund’s most recent annual proxy voting record is available on our website and through the SEC’s website. To access it through T. Rowe Price, visit the website location shown above, and scroll down to the section near the bottom of the page that says, “Proxy Voting Records.” Click on the Proxy Voting Records link in the shaded box.
HOW TO OBTAIN QUARTERLY PORTFOLIO HOLDINGS
The fund files a complete schedule of portfolio holdings with the Securities and Exchange Commission (SEC) for the first and third quarters of each fiscal year as an exhibit to its reports on Form N-PORT. The fund’s Form N-PORT is available electronically on the SEC’s website (sec.gov).
T. ROWE PRICE DIVIDEND GROWTH ETF
LIQUIDITY RISK MANAGEMENT PROGRAM
In accordance with Rule 22e-4 (Liquidity Rule) under the Investment Company Act of 1940, as amended, the fund has established a liquidity risk management program (Liquidity Program) reasonably designed to assess and manage the fund’s liquidity risk, which generally represents the risk that the fund would not be able to meet redemption requests without significant dilution of remaining investors’ interests in the fund. The fund’s Board of Directors (Board) has appointed the fund’s investment advisor, T. Rowe Price Associates, Inc. (Price Associates), as the administrator of the Liquidity Program. As administrator, Price Associates is responsible for overseeing the day-to-day operations of the Liquidity Program and, among other things, is responsible for assessing, managing, and reviewing with the Board at least annually the liquidity risk of each T. Rowe Price fund. Price Associates has delegated oversight of the Liquidity Program to a Liquidity Risk Committee (LRC), which is a cross-functional committee composed of personnel from multiple departments within Price Associates.
The Liquidity Program’s principal objectives include supporting the T. Rowe Price funds’ compliance with limits on investments in illiquid assets and mitigating the risk that the fund will be unable to timely meet its redemption obligations. The Liquidity Program also includes a number of elements that support the management and assessment of liquidity risk, including an annual assessment of factors that influence the fund’s liquidity and the periodic classification and reclassification of a fund’s investments into categories that reflect the LRC’s assessment of their relative liquidity under current market conditions. Under the Liquidity Program, every investment held by the fund is classified at least monthly into one of four liquidity categories based on estimations of the investment’s ability to be sold during designated time frames in current market conditions without significantly changing the investment’s market value.
As required by the Liquidity Rule, at a meeting held on July 27, 2021, the Board was presented with an annual assessment prepared by the LRC, on behalf of Price Associates, that addressed the operation of the Liquidity Program and assessed its adequacy and effectiveness of implementation, including any material changes to the Liquidity Program and the determination of each fund’s Highly Liquid Investment Minimum (HLIM). The annual assessment included consideration of the following factors, as applicable: the fund’s investment strategy and liquidity of portfolio investments during normal and reasonably foreseeable stressed conditions, including whether the investment strategy is appropriate for an open-end fund, the extent to which the strategy involves a relatively concentrated portfolio or large positions in particular issuers, and the use of borrowings for investment purposes and derivatives; short-term and long-term cash flow projections covering both normal and reasonably foreseeable stressed conditions; and holdings of cash and cash equivalents, as well as available borrowing arrangements.
For the fund and other T. Rowe Price funds, the annual assessment incorporated a report related to a fund’s holdings, shareholder and portfolio concentration, any borrowings during the period, cash flow projections, and other relevant data for the period of April 1, 2020, through March 31, 2021. The report described the methodology for classifying a
T. ROWE PRICE DIVIDEND GROWTH ETF
LIQUIDITY RISK MANAGEMENT PROGRAM (continued)
fund’s investments (including derivative transactions) into one of four liquidity categories, as well as the percentage of a fund’s investments assigned to each category. It also explained the methodology for establishing a fund’s HLIM and noted that the LRC reviews the HLIM assigned to each fund no less frequently than annually.
During the period covered by the annual assessment, the LRC has concluded, and reported to the Board, that the Liquidity Program continues to operate adequately and effectively and is reasonably designed to assess and manage the fund’s liquidity risk.
T. ROWE PRICE DIVIDEND GROWTH ETF
ABOUT THE FUND’S DIRECTORS AND OFFICERS
Your fund is overseen by a Board of Directors (Board) that meets regularly to review a wide variety of matters affecting or potentially affecting the fund, including performance, investment programs, compliance matters, advisory fees and expenses, service providers, and business and regulatory affairs. The Board elects the fund’s officers, who are listed in the final table. At least 75% of the Board’s members are considered to be independent, i.e., not “interested persons” as defined in Section 2(a)(19) of the 1940 Act, of the Boards of T. Rowe Price Associates, Inc. (T. Rowe Price), and its affiliates; “interested” directors and officers are employees of T. Rowe Price. The business address of each director and officer is 100 East Pratt Street, Baltimore, Maryland 21202. The Statement of Additional Information includes additional information about the fund directors and is available without charge by calling a T. Rowe Price representative at 1-800-638-5660.
INDEPENDENT DIRECTORS(a)
Name
(Year of Birth)
Year Elected
[Number of T. Rowe Price
Portfolios Overseen] | Principal Occupation(s) and Directorships of Public Companies and
Other Investment Companies During the Past Five Years |
Teresa Bryce Bazemore
(1959)
2020
[204] | President and Chief Executive Officer, Federal Home Loan Bank of San Francisco (2021 to present); President, Radian Guaranty (2008 to 2017); Chief Executive Officer, Bazemore Consulting LLC (2018 to 2021); Director, Chimera Investment Corporation (2017 to 2021); Director, First Industrial Realty Trust (2020 to present); Director, Federal Home Loan Bank of Pittsburgh (2017 to 2019) |
Ronald J. Daniels
(1959)
2020
[204] | President, The Johns Hopkins University(b) and Professor, Political Science Department, The Johns Hopkins University (2009 to present); Director, Lyndhurst Holdings (2015 to present); Director, BridgeBio Pharma, Inc. (2020 to present) |
Bruce W. Duncan
(1951)
2020
[204] | President, Chief Executive Officer, and Director, CyrusOne, Inc. (2020 to 2021); Chief Executive Officer and Director (2009 to 2016), Chair of the Board (2016 to 2020), and President (2009 to 2016), First Industrial Realty Trust, owner and operator of industrial properties; Chair of the Board (2005 to 2016) and Director (1999 to 2016), Starwood Hotels & Resorts, a hotel and leisure company; Member, Investment Company Institute Board of Governors (2017 to 2019); Member, Independent Directors Council Governing Board (2017 to 2019); Senior Advisor, KKR (2018 to present); Director, Boston Properties (2016 to present); Director, Marriott International, Inc. (2016 to 2020) |
Robert J. Gerrard, Jr.
(1952)
2020
[204] | Advisory Board Member, Pipeline Crisis/Winning Strategies, a
collaborative working to improve opportunities for young African
Americans (1997 to 2016); Chair of the Board, all funds
(July 2018 to present) |
T. ROWE PRICE DIVIDEND GROWTH ETF
INDEPENDENT DIRECTORS(a) (continued)
Name
(Year of Birth)
Year Elected
[Number of T. Rowe Price
Portfolios Overseen] | Principal Occupation(s) and Directorships of Public Companies and
Other Investment Companies During the Past Five Years |
Paul F. McBride
(1956)
2020
[204] | Advisory Board Member, Vizzia Technologies (2015 to present); Board
Member, Dunbar Armored (2012 to 2018) |
Cecilia E. Rouse, Ph.D.(c)
(1963)
2020
[0] | Dean, Princeton School of Public and International Affairs (2012 to present); Professor and Researcher, Princeton University (1992 to present); Director of Education Studies Committee, MDRC, a nonprofit education and social policy research organization (2011 to 2020); Member, National Academy of Education (2010 to present); Board Member, National Bureau of Economic Research (2011 to present); Board Member of the Council on Foreign Relations (2018 to present); Board Member, The Pennington School (2017 to present); Board Member, the University of Rhode Island (2020 to present); Chair of Committee on the Status of Minority Groups in the Economic Profession of the American Economic Association (2012 to 2018); Vice President (2015 to 2016) and Board Member (2018 to present), American Economic Association |
John G. Schreiber(d)
(1946)
2020
[0] | Owner/President, Centaur Capital Partners, Inc., a real estate investment company (1991 to present); Cofounder, Partner, and Cochair of the Investment Committee, Blackstone Real Estate Advisors, L.P. (1992 to 2015); Director, Blackstone Mortgage Trust, a real estate finance company (2012 to 2016); Director and Chair of the Board, Brixmor Property Group, Inc. (2013 to present); Director, Hilton Worldwide (2007 to present); Director, Hudson Pacific Properties (2014 to 2016); Director, Invitation Homes (2014 to 2017); Director, JMB Realty Corporation (1980 to present) |
T. ROWE PRICE DIVIDEND GROWTH ETF
INDEPENDENT DIRECTORS(a) (continued)
Name
(Year of Birth)
Year Elected
[Number of T. Rowe Price
Portfolios Overseen] | Principal Occupation(s) and Directorships of Public Companies and
Other Investment Companies During the Past Five Years |
Kellye Walker(e)
(1966)
2021
[204] | Executive Vice President and Chief Legal Officer, Eastman Chemical
Company (April 2020 to present); Executive Vice President and Chief
Legal Officer, Huntington Ingalls Industries, Inc. (NYSE: HIl) (January
2015 to March 2020); Director, Lincoln Electric Company (October 2020
to present) |
(a)All information about the independent directors was current as of December 31, 2020, unless otherwise indicated, except for the number of portfolios overseen, which is current as of the date of this report.
(b)William J. Stromberg, chair of the Board, director, and chief executive officer of T. Rowe Price Group, Inc., the parent company of the Price Funds’ investment advisor, has served on the Board of Trustees of Johns Hopkins University since 2014.
(c)Effective March 4, 2021, Dr. Rouse resigned from her role as independent director of the Price Funds.
(d)Effective December 31, 2021, Mr. Schreiber resigned from his role as independent director of the Price Funds.
(e)Effective November 8, 2021, Ms. Walker was elected as independent director of the Price Funds.
INTERESTED DIRECTORS(a)
Name
(Year of Birth)
Year Elected
[Number of T. Rowe Price
Portfolios Overseen] | Principal Occupation(s) and Directorships of Public Companies and
Other Investment Companies During the Past Five Years |
David Oestreicher
(1967)
2020
[204] | General Counsel, Vice President, and Secretary, T. Rowe Price Group, Inc.; Chair of the Board, Chief Executive Officer, President, and Secretary, T. Rowe Price Trust Company; Director, Vice President, and Secretary, T. Rowe Price, T. Rowe Price Investment Services, Inc.; T. Rowe Price Retirement Plan Services, Inc., and T. Rowe Price Services, Inc.; Director and Secretary, T. Rowe Price Investment Management, Inc. (Price Investment Management); Vice President and Secretary, T. Rowe Price International (Price International); Vice President, T. Rowe Price Hong Kong (Price Hong Kong), T. Rowe Price Japan (Price Japan) and T. Rowe Price Singapore (Price Singapore); Principal Executive Officer and Executive Vice President, all funds |
T. ROWE PRICE DIVIDEND GROWTH ETF
INTERESTED DIRECTORS(a) (continued)
Name
(Year of Birth)
Year Elected
[Number of T. Rowe Price
Portfolios Overseen] | Principal Occupation(s) and Directorships of Public Companies and
Other Investment Companies During the Past Five Years |
Robert W. Sharps, CFA, CPA
(1971)
2020
[204] | Director and Vice President, T. Rowe Price; President, T. Rowe Price
Group, Inc.; Director, Price Investment Management; Vice President,
T. Rowe Price Trust Company; Director and President, Exchange-Traded Funds, Inc. |
(a)All information about the interested directors was current as of December 31, 2020, unless otherwise indicated, except for the number of portfolios overseen, which is current as of the date of this report.
OFFICERS
Name (Year of Birth)
Position Held With Exchange-Traded
Funds, Inc. | Principal Occupation(s) |
Timothy Coyne (1967)
Executive Vice President | Vice President, T. Rowe Price and T. Rowe Price Group, Inc. |
Alan S. Dupski, CPA (1982)
Principal Financial Officer, Vice
President, and Treasurer | Vice President, T. Rowe Price, T. Rowe Price Group, Inc., and T. Rowe Price Trust Company |
Joseph B. Fath, CPA (1971)
Executive Vice President | Vice President, T. Rowe Price, T. Rowe Price Group, Inc., and T. Rowe Price Trust Company |
John R. Gilner (1961)
Chief Compliance Officer | Chief Compliance Officer and Vice President, T. Rowe Price; Vice President, T. Rowe Price Group, Inc., and T. Rowe Price Investment Services, Inc. |
Gary J. Greb (1961)
Vice President | Vice President, T. Rowe Price, Price International, and T. Rowe Price Trust Company |
Paul Greene II (1978)
Executive Vice President | Vice President, T. Rowe Price and T. Rowe Price Group, Inc. |
Ann M. Holcomb, CFA (1972)
Executive Vice President | Vice President, T. Rowe Price, T. Rowe Price Group, Inc., and T. Rowe Price Trust Company |
Thomas J. Huber, CFA (1966)
Executive Vice President | Vice President, T. Rowe Price, T. Rowe Price Group, Inc., and T. Rowe Price Trust Company |
Paul J. Krug, CPA (1964)
Vice President | Vice President, T. Rowe Price, T. Rowe Price Group, Inc., and T. Rowe Price Trust Company |
John D. Linehan, CFA (1965)
Executive Vice President | Vice President, T. Rowe Price, T. Rowe Price Group, Inc., and T. Rowe Price Trust Company |
Unless otherwise noted, officers have been employees of T. Rowe Price or T. Rowe Price International for at least 5 years.
T. ROWE PRICE DIVIDEND GROWTH ETF
OFFICERS (continued)
Name (Year of Birth)
Position Held With Exchange-Traded
Funds, Inc. | Principal Occupation(s) |
Jason Nogueira, CFA (1974)
Executive Vice President | Vice President, T. Rowe Price and T. Rowe Price Group, Inc. |
Fran M. Pollack-Matz (1961)
Vice President and Secretary | Vice President, T. Rowe Price, T. Rowe Price Group, Inc., T. Rowe Price Investment Services, Inc., and T. Rowe Price Services, Inc. |
Jason Benjamin Polun, CFA (1974)
Executive Vice President | Vice President, T. Rowe Price, T. Rowe Price Group, Inc., and T. Rowe Price Trust Company |
Shannon H. Rauser (1987)
Assistant Secretary | Assistant Vice President, T. Rowe Price |
Megan Warren (1968)
Vice President | Vice President, T. Rowe Price, T. Rowe Price Group, Inc., T. Rowe Price Retirement Plan Services, Inc., T. Rowe Price Services, Inc., and T. Rowe Price Trust Company; formerly, Executive Director, JPMorgan Chase (to 2017) |
Thomas H. Watson (1977)
Executive Vice President | Director and Vice President, T. Rowe Price Trust Company; Vice President, T. Rowe Price and T. Rowe Price Group,Inc. |
Unless otherwise noted, officers have been employees of T. Rowe Price or T. Rowe Price International for at least 5 years.
This page intentionally left blank.
This page intentionally left blank.
This page intentionally left blank.
100 East Pratt Street
Baltimore, MD 21202
Call 1-800-638-5660 to request a prospectus or summary prospectus; each includes investment objectives, risks, fees, expenses, and other information that you should read and consider carefully before investing.
T. Rowe Price Investment Services, Inc.
Item 1. (b) Notice pursuant to Rule 30e-3.
Not applicable.
Item 2. Code of Ethics.
The registrant has adopted a code of ethics, as defined in Item 2 of Form N-CSR, applicable to its principal executive officer, principal financial officer, principal accounting officer or controller, or persons performing similar functions. A copy of this code of ethics is filed as an exhibit to this Form N-CSR. No substantive amendments were approved or waivers were granted to this code of ethics during the period covered by this report.
Item 3. Audit Committee Financial Expert.
The registrant’s Board of Directors has determined that Ms. Teresa Bryce Bazemore qualifies as an audit committee financial expert, as defined in Item 3 of Form N-CSR. Ms. Bazemore is considered independent for purposes of Item 3 of Form N-CSR.
Item 4. Principal Accountant Fees and Services.
(a) – (d) Aggregate fees billed for the last two fiscal years for professional services rendered to, or on behalf of, the registrant by the registrant’s principal accountant were as follows:
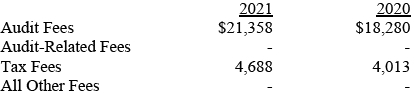
Audit fees include amounts related to the audit of the registrant’s annual financial statements and services normally provided by the accountant in connection with statutory and regulatory filings. Audit-related fees include amounts reasonably related to the performance of the audit of the registrant’s financial statements and specifically include the issuance of a report on internal controls and, if applicable, agreed-upon procedures related to fund acquisitions. Tax fees include amounts related to services for tax compliance, tax planning, and tax advice. The nature of these services specifically includes the review of distribution calculations and the preparation of Federal, state, and excise tax returns. All other fees include the registrant’s pro-rata share of amounts for agreed-upon procedures in conjunction with service contract approvals by the registrant’s Board of Directors/Trustees.
(e)(1) The registrant’s audit committee has adopted a policy whereby audit and non-audit services performed by the registrant’s principal accountant for the registrant, its investment adviser, and any entity controlling, controlled by, or under common control with the investment adviser that provides ongoing services to the registrant require pre-approval in advance at regularly scheduled audit committee meetings. If such a service is required between regularly scheduled audit committee meetings, pre-approval may be authorized by one audit committee member with ratification at the next scheduled audit committee meeting. Waiver of pre-approval for audit or non-audit services requiring fees of a de minimis amount is not permitted.
(2) No services included in (b) – (d) above were approved pursuant to paragraph (c)(7)(i)(C) of Rule 2-01 of Regulation S-X.
(f) Less than 50 percent of the hours expended on the principal accountant’s engagement to audit the registrant’s financial statements for the most recent fiscal year were attributed to work performed by persons other than the principal accountant’s full-time, permanent employees.
(g) The aggregate fees billed for the most recent fiscal year and the preceding fiscal year by the registrant’s principal accountant for non-audit services rendered to the registrant, its investment adviser, and any entity controlling, controlled by, or under common control with the investment adviser that provides ongoing services to the registrant were $3,732,000 and $3,781,000, respectively.
(h) All non-audit services rendered in (g) above were pre-approved by the registrant’s audit committee. Accordingly, these services were considered by the registrant’s audit committee in maintaining the principal accountant’s independence.
Item 5. Audit Committee of Listed Registrants.
Not applicable.
Item 6. Investments.
(a) Not applicable. The complete schedule of investments is included in Item 1 of this Form N-CSR.
(b) Not applicable.
Item 7. Disclosure of Proxy Voting Policies and Procedures for Closed-End Management Investment Companies.
Not applicable.
Item 8. Portfolio Managers of Closed-End Management Investment Companies.
Not applicable.
Item 9. Purchases of Equity Securities by Closed-End Management Investment Company and Affiliated Purchasers.
Not applicable.
Item 10. Submission of Matters to a Vote of Security Holders.
There has been no change to the procedures by which shareholders may recommend nominees to the registrant’s board of directors.
Item 11. Controls and Procedures.
(a) The registrant’s principal executive officer and principal financial officer have evaluated the registrant’s disclosure controls and procedures within 90 days of this filing and have concluded that the registrant’s disclosure controls and procedures were effective, as of that date, in ensuring that information required to be disclosed by the registrant in this Form N-CSR was recorded, processed, summarized, and reported timely.
(b) The registrant’s principal executive officer and principal financial officer are aware of no change in the registrant’s internal control over financial reporting that occurred during the period covered by this report that has materially affected, or is reasonably likely to materially affect, the registrant’s internal control over financial reporting.
Item 12. Disclosure of Securities Lending Activities for Closed-End Management Investment Companies.
Not applicable.
Item 13. Exhibits.
(a)(1) The registrant’s code of ethics pursuant to Item 2 of Form N-CSR is attached.
(2) Separate certifications by the registrant's principal executive officer and principal financial officer, pursuant to Section 302 of the Sarbanes-Oxley Act of 2002 and required by Rule 30a-2(a) under the Investment Company Act of 1940, are attached.
(3) Written solicitation to repurchase securities issued by closed-end companies: not applicable.
(b) A certification by the registrant’s principal executive officer and principal financial officer, pursuant to Section 906 of the Sarbanes-Oxley Act of 2002 and required by Rule 30a-2(b) under the Investment Company Act of 1940, is attached.
SIGNATURES
Pursuant to the requirements of the Securities Exchange Act of 1934 and the Investment Company Act of 1940, the registrant has duly caused this report to be signed on its behalf by the undersigned, thereunto duly authorized.
T. Rowe Price Exchange-Traded Funds, Inc.
| By | | /s/ David Oestreicher |
| | | David Oestreicher |
| | | Principal Executive Officer |
| |
| Date | | February 17, 2022 | | | | |
Pursuant to the requirements of the Securities Exchange Act of 1934 and the Investment Company Act of 1940, this report has been signed below by the following persons on behalf of the registrant and in the capacities and on the dates indicated.
| By | | /s/ David Oestreicher |
| | | David Oestreicher |
| | | Principal Executive Officer |
| |
| Date | | February 17, 2022 | | | | |
| |
| |
| By | | /s/ Alan S. Dupski |
| | | Alan S. Dupski |
| | | Principal Financial Officer |
| |
| Date | | February 17, 2022 | | | | |