UNITED STATES
SECURITIES AND EXCHANGE COMMISSION
Washington, D.C. 20549
FORM N-CSR
CERTIFIED SHAREHOLDER REPORT OF REGISTERED
MANAGEMENT INVESTMENT COMPANIES
Investment Company Act file number 811-23499
Goldman Sachs Real Estate Diversified Income Fund
(Exact name of registrant as specified in charter)
200 West Street, New York, New York 10282
(Address of principal executive offices) (Zip code)
| Caroline Kraus, Esq. | Copies to: | |
| Goldman Sachs & Co. LLC | Stephen H. Bier, Esq. | |
| 200 West Street | William J. Bielefeld, Esq. | |
| New York, New York 10282 | Dechert LLP | |
1095 Avenue of the Americas | ||
New York, NY 10036 |
(Name and address of agents for service)
Registrant’s telephone number, including area code: (212) 902-1000
Date of fiscal year end: September 30
Date of reporting period: September 30, 2020
| ITEM 1. | REPORTS TO STOCKHOLDERS. |
The Annual Report to Shareholders is filed herewith. |
Goldman Sachs Interval Fund

| Annual Report | September 30, 2020 | |||
Real Estate Diversified Income Fund | ||||
It is our intention that beginning on January 1, 2021, paper copies of the Fund’s annual and semi-annual shareholder reports will no longer be sent by mail, unless you specifically request paper copies of the reports from the Fund or from your financial intermediary. Instead, the reports will be made available on a website, and you will be notified by mail each time a report is posted and provided with a website link to access the report.
If you already elected to receive shareholder reports electronically, you will not be affected by this change and you need not take any action. At any time, you may elect to receive reports and certain communications from the Fund electronically by calling the applicable toll-free number below or by contacting your financial intermediary.
You may elect to receive all future shareholder reports in paper free of charge. If you hold shares of the Fund directly with the Fund’s transfer agent, you can inform the transfer agent that you wish to receive paper copies of reports by calling toll-free 800-526-7384. If you hold shares of the Fund through a financial intermediary, please contact your financial intermediary to make this election. Your election to receive reports in paper will apply to all Goldman Sachs Funds held in your account if you invest through your financial intermediary or all Goldman Sachs Funds held with the Fund’s transfer agent if you invest directly with the transfer agent.

Goldman Sachs Real Estate Diversified Income Fund
| 1 | ||||
| 9 | ||||
| 12 | ||||
| 16 | ||||
| 21 | ||||
| 35 | ||||
| 36 | ||||
| NOT FDIC-INSURED | May Lose Value | No Bank Guarantee | ||
PORTFOLIO RESULTS
Goldman Sachs Real Estate Diversified Income Fund
Investment Objective
The Fund seeks to produce income and achieve capital appreciation with low to moderate volatility and low to moderate correlation to the broader equity markets.
Portfolio Management Discussion and Analysis
After the close of business on May 15, 2020, Resource Real Estate Diversified Income Fund (the “Predecessor Fund”) was reorganized with and into the Goldman Sachs Real Estate Diversified Income Fund (the “Fund”). The Fund has assumed the Predecessor Fund’s historical performance. Therefore, the performance information reported below for the Fund is the combined performance of the Fund and the Predecessor Fund, which was managed by another investment adviser. The performance information shown in this report for periods through May 15, 2020 reflects the performance of the Predecessor Fund. Below, the Goldman Sachs Real Estate Securities Investment Team provides an overview of the U.S. real estate securities market for the 12 months ended September 30, 2020 and discusses the Fund’s performance and positioning for the period from May 18, 2020 through September 30, 2020 (the “GSAM Managed Reporting Period”).
| Q | How did the Fund perform during the 12 months ended September 30, 2020? |
| A | During the 12 months ended September 30, 2020, the Fund’s Class A, Class C, Class I, Class L and Class W Shares generated average annual total returns, without sales charges, of -5.20%, -5.94%, -5.05%, -5.46% and -5.31%, respectively. |
| During the period from October 1, 2019 through May 15, 2020, the Fund’s Class A, Class C, Class I Class L and Class W Shares generated cumulative total returns, without sales charges, of -6.88%, -7.33%, -6.79%, -7.09%, and -7.00%, and respectively. |
| During the GSAM Managed Reporting Period, i.e. since Goldman Sachs assumed management of the Fund through September 30, 2020, the Fund’s Class A, Class C, Class I, Class L and Class W Shares generated cumulative total returns, without sales charges, of 1.79%, 1.48%, 1.85%, 1.73% and 1.80%, respectively. |
| As of September 30, 2020, the Fund’s net asset value (“NAV”) for Class A, Class C, Class I, Class L and Class W Shares was $9.38, $9.38, $9.78, $9.39 and $9.52, respectively. |
| Q | What distributions did the Fund make during the 12 months ended September 30, 2020? |
| A | The Fund’s Class A Shares declared dividends totaling $0.71 per unit. The 12-Month Distribution Yield for Class A Shares was 6.40%. The Fund’s Class C Shares declared dividends totaling $0.63 per unit. The 12-Month Distribution Yield for Class C Shares was 5.59%. The Fund’s Class I Shares declared dividends totaling $0.75 per unit. The 12-Month Distribution Yield for Class I Shares was 6.53%. The Fund’s Class L Shares declared dividends totaling $0.68 per unit. The 12-Month Distribution Yield for Class L Shares was 6.09%. The Fund’s Class W Shares declared dividends totaling $0.72 per unit. The 12-Month Distribution Yield for Class W Shares was 6.38%. |
| Q | What economic and market factors most influenced the U.S. real estate securities market as a whole during the 12 months ended September 30, 2020? |
| A | The fourth calendar quarter of 2019 was characterized by the U.S. real estate securities market underperforming the broader U.S. equity market, following significant outperformance in the prior quarter. As the broad U.S. equity market surged, the real estate sector was negatively affected by rising yields, with the bellwether 10-year U.S. Treasury yield increasing approximately 24 basis points during the quarter to end December 2019 at 1.92%. (A basis point is 1/100th of a percentage point.) Also, growth expectations improving in more economically sensitive, cyclical sectors, combined with real estate securities generally trading at a slight premium to the value of the underlying property portfolios at the start of the fourth quarter, may have negatively impacted returns for the sector. Investors moved away from traditionally defensive and yield-oriented sectors, such as real estate, during these months. |
For the remainder of the 12 months ended September 30, 2020, the primary factor influencing the U.S. real estate securities market was the global COVID-19 pandemic that plagued the world and fundamentally altered the way we go about our daily lives. Most notably within the real estate market, small retail businesses and restaurants were shuttered and larger |
1
PORTFOLIO RESULTS
corporations who occupied office buildings across the U.S. pivoted to a nearly complete work-from-home dynamic. Additionally, there was a rapid acceleration in the adoption of online retail as families isolated from the world and remained indoors. Near-term uncertainty heightened around large segments of the commercial and residential real estate tenant base being able to pay rent as the spread of the COVID-19 crisis shut down the economy. Longer-term uncertainty arose around both the depth and duration of the economic downturn and the demand for space in what might be called the “new normal.” That said, the massive stimulus injected by both the U.S. Federal Reserve (the “Fed”) and the U.S. government in an attempt to cushion the economic impact of the pandemic did create liquidity in the economy and capital markets during the second and third quarters of 2020, which benefited the U.S. real estate securities market as a whole. |
| Still, there was significant performance divergence among different property types, depending on how they were impacted by the effects of the pandemic. Overall, underlying real estate fundamentals softened. More specifically, the closure of brick-and-mortar stores and restaurants severely hurt the retail subsector, with businesses of all sizes facing bankruptcy as expenses piled up and little, if any, revenue came in—and with only minimal support from the federal and local governments. Hotels were also among the worst performing subsectors within the U.S. real estate market during the 12 months ended September 30, 2020. Due to the pandemic, global travel of all kinds, including business and leisure, came to a near halt. This, in turn, caused hotel revenues to drop nearly 90%, with some properties having to shut down completely on a temporary basis. Providing significant headwinds to the multi-family/apartment subsector were both tenants losing the income needed to afford their monthly rent payments and the trend seen during the GSAM Managed Reporting Period of city-dwellers seeking to move away from the density and constrained space of apartments to more suburban settings. On the surface, the office subsector was also negatively impacted by the pandemic. As companies were forced to operate with their workforce at home, many found they were functioning well despite the virtual environment and thus began to reevaluate their needs for expensive office space. On the other hand, some companies that do want or need to maintain office space began looking to expand their footprint to provide additional space per person for better distancing between employees, a sharp reversal of the office densification we have seen over the last decade. |
| Conversely, the industrials subsector performed well, as the rapid acceleration of online shopping has meant online retailers need more warehouse space for increased inventory and larger logistical operations. Similarly, data centers were among the best performing subsectors of the U.S. real estate market during the 12 months ended September 30, 2020. Data centers benefited from increased demand, as work-from-home conditions and online classrooms became more ubiquitous, thereby exponentially increasing demand for bandwidth. Other aspects of life, such as shopping, social events, conferences and even family “get-togethers,” have also moved online, increasing the need for the data infrastructure to move and store the amount of data being generated. |
| The other major factor affecting the U.S. real estate securities market during the 12 months ended September 30, 2020 was interest rates. Following the outbreak of COVID-19, capital markets spiraling downward drove the Fed to step in to provide monetary policy support. Among other initiatives, the Fed lowered the targeted federal funds rate to near zero, similar to the action it took amid the 2008-2009 financial crisis. Historically, with interest rates lower, financing becomes less expensive and therefore more heavily accessed, which should, in theory, stimulate transaction volumes. However, this interest rate cut by the Fed in March 2020 coincided with a severely weakening economic backdrop and increased uncertainty around both commercial and residential tenants’ ability to pay rents, thereby introducing significant hesitancy around acquisitions for the near term. |
| Commercial mortgage-backed securities posted mixed performance during the 12 months ended September 30, 2020, with bonds linked to retail and hotels generally weaker and bonds linked to office and multi-family properties generally stronger. |
| Real estate preferred stocks came under pressure during the worst of the pandemic in the spring of 2020 but rebounded meaningfully since, as the strength of real estate investment trust (“REIT”) balance sheets became more apparent and as liquidity returned to the capital markets. |
| Q | What key factors were responsible for the Fund’s performance during the GSAM Managed Reporting Period? |
| A | Public credit investments contributed most positively to the Fund’s performance during the GSAM Managed Reporting Period. The Fund’s allocation to public credit consists of preferred stock investments and mortgage REITs. While struggling early in 2020, they rebounded along with the broader U.S. equity markets in the second and third quarters of 2020 as it became increasingly clear the U.S. government was going to provide substantial relief from the threat of bankruptcy. Credit investments also provided diversification within the asset allocation of the Fund. When the potential for tenants not to make rent payments was still unclear, the Fund’s credit investments, which are placed in a more senior position in the capital stack, were not at the same level of potential risk as their equity counterparts. (The “capital stack” refers to the legal |
2
PORTFOLIO RESULTS
organization of all of the capital placed into a company or secured by an asset through investment or borrowing. The capital stack determines who has legal rights to certain assets and income, who receives priority of payment in the event of an uncured default, and in which order each party may be repaid or given authority to take over or liquidate assets in the event of a bankruptcy. The more senior one is in the capital stack, i.e., the more secure, the better.) Therefore, public credit investments played an important role in reducing the overall risk of the Fund’s portfolio during the GSAM Managed Reporting Period. |
| Private equity contributed least to the Fund’s performance during the GSAM Managed Reporting Period, not unexpected given the lag in pricing experienced in the private markets. The publicly traded markets reprice daily on the exchanges and therefore can reflect real-time changing investor sentiment, which rapidly evolved during the 12 months ended September 30, 2020. For example, during the first quarter of 2020, the macroeconomic backdrop deteriorated substantially and then saw rapid recovery in select segments of the economy during the second and third quarters of 2020. Public investments had already taken part in and reflected both the decline and subsequent rebound, while the private markets were still experiencing the early effects of the pandemic. That said, despite their lag in pricing, the private equity investments worked to dampen volatility in the Fund, as they did not experience price movements during the GSAM Managed Reporting Period as severe as public equity investments did in March 2020. |
| Q | What were some of the Fund’s best-performing individual holdings during the GSAM Managed Reporting Period? |
| A | The top contributors to the Fund’s performance during the GSAM Managed Reporting Period were Starwood Property Trust, ARES Commercial Real Estate Corporation and MFA Financial, Inc. Preferred. |
| Starwood Property Trust is the largest commercial mortgage REIT in the U.S. Ares Commercial Real Estate Corporation, a specialty finance company, originates and invests in commercial real estate loans and related investments in the U.S. In each case, the stock rebounded strongly during the GSAM Managed Reporting Period along with the broad U.S. equity market and as the liquidity situation for each improved. MFA Financial, Inc. operates as a REIT primarily engaged in the business of investing, on a leveraged basis, in residential mortgage assets, including residential mortgage-backed securities and residential whole loans. Generally, residential credit-focused assets rebounded strongly during the GSAM Managed Reporting Period as strength in the housing market grew. Also, MFA Financial, Inc. as a company was recapitalized in a manner particularly beneficial to investors in its preferred stock. |
| Q | Which positions detracted significantly from the Fund’s performance during the GSAM Managed Reporting Period? |
| A | The positions that detracted most from the Fund’s performance during the GSAM Managed Reporting Period were Harrison Street Core Property Fund, LP; Clarion Lion Properties Fund, LP; and Broadstone Net Lease Inc. |
| Harrison Street Core Property Fund, LP was created to provide investment in stabilized, cash flow-producing real estate with demographic-driven demand. The fund invests in student housing, both on and off campus, and other education-related real estate investments; senior housing, including independent living, assisted living and memory care communities; medical office buildings and other health care-related real estate investments; life science buildings and storage properties. During the GSAM Managed Reporting Period, it experienced weakness due primarily to its exposure to health care and senior living properties, two areas of the real estate market impacted especially heavily by COVID-19 but also property types where we have conviction around values over the longer term. |
| Clarion Lion Properties Fund, LP is a diversified core real estate fund with a portfolio of primarily institutional quality real estate assets located throughout the U.S. The fund is focused on maintaining diversification across four core property types—office, retail, industrial and multi-family residential. The portfolio is actively managed through a continuous evaluation of the 50 largest metropolitan statistical areas with respect to each major property type to identify relative sectors of value and does tilt toward the largest and most liquid markets. (Metropolitan statistical areas are delineated by the U.S. Office of Management and Budget as having at least one urbanized area with a minimum population of 50,000.) During the GSAM Managed Reporting Period, the fund’s exposure to the retail subsector drove its performance weakness most. |
Broadstone Net Lease Inc. is a REIT that acquires, owns and manages primarily single-tenant commercial real estate properties that are net leased on a long-term basis to a diversified group of tenants. (Commonly used in commercial real estate, the term net lease refers to a contractual agreement where a lessee pays a portion or all of the taxes, insurance fees and maintenance costs for a property in addition to rent. In the purest form of a net lease, the tenant is expected to pay for all the costs related to a piece of property |
3
PORTFOLIO RESULTS
as if the tenant were the actual owner. A net lease is the opposite of a gross lease, where the tenant pays a flat rental fee while the landlord is responsible for the other costs.) Approximately 15% of Broadstone Net Lease’s portfolio is in restaurants, which experienced extreme pressure amidst the COVID-19 pandemic, leading to the REIT’s performance weakness during the GSAM Managed Reporting Period. |
| Q | How did the Fund use derivatives and similar instruments during the GSAM Managed Reporting Period? |
| A | The Fund did not use derivatives during the GSAM Managed Reporting Period. |
| Q | Did the Fund make any significant purchases or sales during the GSAM Managed Reporting Period? |
| A | During the GSAM Managed Reporting Period, we established Fund positions in self-storage REITs Life Storage and CubeSmart because we believed their stocks were trading at a significant discount to their respective NAVs and felt the self-storage subsector’s fundamentals were poised to improve. These purchases proved prudent, as the self-storage subsector benefited from increased demand amidst pandemic-driven secular trends developing during the GSAM Managed Reporting Period. For example, the subsector saw an acceleration in demand from a robust residential real estate market, wherein more urban dwellers sought to move away from cities to the suburbs and needed storage for their belongings during the gap time between the two. Demand was also boosted by college students and younger workers who chose to live at home rather than in dorms or their own apartments, thus creating less turnover and higher occupancies for self-storage units. |
| We initiated a Fund position in PennyMac Mortgage Investment Trust, a specialty finance company, during the GSAM Managed Reporting Period, as we viewed its risk/reward profile and valuation as attractive when its stock was at 80% of book value. We subsequently sold the position when its corporate earnings results came in as the market expected, and its stock was re-rated. (When the market changes its view of a company sufficiently to make calculation ratios, such as price/earnings ratios, substantially higher or lower, this a re-rating.) |
| We sold a number of Fund positions in preferred stock investments to reallocate the proceeds to public common equity positions. |
| Q | Were there any changes made in the Fund’s investment strategy during the GSAM Managed Reporting Period? |
| A | Since acquiring and assuming management of the Fund in mid-May 2020, we made no material changes to the Fund’s investment strategy. However, we opportunistically increased the Fund’s exposure to more secular growth-oriented property types, such as self-storage, and to the multi-family subsector, all in the public equity markets given what we saw as their compelling, attractive valuations. We also added to the self-storage subsector based on our view of its improving fundamentals, as discussed earlier. We reduced exposure to preferred securities, such as certain office and hotel preferred stocks, as we felt we could find more attractive risk/reward profiles elsewhere, and used the proceeds to fund the aforementioned common equity purchases. |
| Q | How was the Fund positioned at the end of the GSAM Managed Reporting Period? |
| A | At the end of the GSAM Managed Reporting Period, the Fund was invested with approximately 44% of its total net assets in private equity, approximately 29% of its total net assets in private credit, approximately 13% of its total net assets in public equity, approximately 10% of its total net assets in public credit, and approximately 4% of its total net assets in cash and cash equivalents. |
Within the Fund’s overall net equity, approximately 36% of assets were invested in higher growth property types benefiting from near-term secular trends, including industrials, towers/digital storage, life science-focused offices, single-family housing, manufactured housing and self-storage. Approximately 30% of assets within the Fund’s overall net equity was invested in multi-family properties, where we believe valuations, long-term demand, demographics and necessity are favoring the property type over the longer term. For example, at the end of the GSAM Managed Reporting Period, about 52% of 18 to 29 year olds, a key demographic for multi-family rentals, were living with their parents, the highest level on record since the Great Depression. We believe this is poised to reverse and may well be met with more muted new construction/supply, translating to improved occupancy and rents when conditions allow. The Fund’s positioning within the multi-family subsector was focused at the end of the GSAM Managed Reporting Period on the suburbs and lower tax states, which we believe could see greater demand than cities in high tax states. Approximately 19% of the Fund’s overall net equity was invested in office properties at the end of the GSAM Managed Reporting Period. Despite facing headwinds from |
4
PORTFOLIO RESULTS
telecommuting trends, we believe there is good value and select pockets of opportunity located in “innovation cities” or low tax states where job growth is and will likely remain, in our view, higher. Additionally, the Fund’s exposure to this subsector at the end of the GSAM Managed Reporting Period had limited near-term maturities. (An “innovation city” is one where leading-edge anchor institutions and companies cluster and connect with start-ups, business incubators and accelerators.) At the end of the GSAM Managed Reporting Period, approximately 12% of the Fund’s overall net equity were invested in health care properties that, in our view, offer higher predictability of cash flows due to inelastic yet growing demand drivers, such as aging demographics, and longer lease terms. Approximately 3% of the Fund’s overall net equity were invested in retail properties at the end of the GSAM Managed Reporting Period, focused on those with necessity-based tenants, such as grocery-anchored centers, which we find better insulated from obsolescence. There were no holdings within the public equity sleeve in hotel properties at the end of the GSAM Managed Reporting Period. |
| At the end of the GSAM Managed Reporting Period, the Fund’s positioning within the public credit sleeve was broadly diversified across numerous property types that we believed would provide attractive yield, low volatility and equity-like returns. |
| Q | What is the Fund’s tactical view and strategy for the months ahead? |
| A | By the end of the GSAM Managed Reporting Period, it had become clear to us that some real estate property types had been struggling pre-pandemic due to the disruptive impact of technology, and the pandemic served to accelerate that disruption. For example, online and other e-commerce spending trends translated to less demand for brick-and-mortar retail, requiring an even more vigilant view toward retail than was the case before the COVID-19 outbreak. Other real estate property types were affected directly by the COVID-19 crisis and must be managed carefully. Due to greater efficiency of space usage plus increased telecommuting trends, for instance, there is now less demand for commodity office buildings. (A commodity office building is a standard, “run of the mill” office building, as opposed to a specialty office building.) Also, due to reduced business travel and increased remote work driven by concerns around COVID-19, corporate/group-oriented hotels have struggled. |
| Conversely, some property types have either benefited from changes in behavior or can grow despite it, in our view. At the end of the GSAM Managed Reporting Period, we were focused on areas like industrial and logistics real estate, towers, digital storage, self-storage, single-family housing and manufactured housing. Some of these property types have secular demand drivers tied to powerful innovation trends. The proliferation of data and an increased need to store it has buoyed digital storage properties. Similarly, the proliferation of data and an increased need to transport it has boosted towers. Biotechnology innovation-driven demand has made life-sciences offices an attractive area of the market, in our opinion. Online spending trends translating to increased demand for logistics to get the box from the warehouse to the end consumer has supported the industrial property subsector. The “content gold rush” in southern California and the growth of the information technology sector, especially on the west coast of the U.S., has created demand for technology-driven office space. |
| Other property types have secular demand drivers tied to powerful demographic trends. For health care properties, we look at aging demographics as a demand driver. Leisure, hotels and gaming properties benefited prior to the pandemic from an increased desire for experience over things, partially driven by the millenial generation, a trend we believe will resume in a post-pandemic scenario. Manufactured housing may be driven by aging demographics and a push toward affordable housing post COVID-19. Multi-family housing properties, in our view, may well be supported going forward by population growth and an increased demand for renting over buying, especially pronounced in low tax states. Similarly, single-family rentals’ performance may be driven by strong household formation and increased desire to rent as well as by a move toward the suburbs amidst stay-at-home conditions. As discussed earlier, self-storage, we believe, should continue to perform well due to increased life changes, including job loss, job change, divorce, remote learning, adult children living with parents and more. |
| In short, we believe it will be increasingly critical in the months ahead to distinguish between property types that have had a temporary cyclical impact from the pandemic, either positive or negative, and those that have more secular and/or long-term headwinds and tailwinds. As we move forward, we intend to maintain our approach that aims to balance the need for attractive income and capital appreciation with low to moderate volatility relative to equity and public real estate markets by investing primarily in income-producing real estate equity and debt securities. Through this actively managed closed-end interval fund, we will continue seeking to provide access to both private and public real estate diversified across property types, geography and asset class (equity and debt). |
5
PORTFOLIO RESULTS
| Q | How did the Fund use leverage during the GSAM Managed Reporting Period? |
| A | The line of credit established by the Fund under GSAM’s management is a bilateral, fully committed, revolving credit facility. (A revolving credit facility is a line of credit arranged between a bank and a business. It comes with an established maximum amount, and the business can access the funds at any time when needed.) The Fund, while under the management of Resource, had access to financing via its prime brokerage agreement, which was accompanied by certain risks that are now mitigated by our establishment of a fully committed credit facility. |
| Sector, subsector and property type designations throughout this shareholder report are defined by GSAM. |
6
FUND BASICS
Real Estate Diversified Income Fund
as of September 30, 2020
| TOP TEN HOLDINGS AS OF 9/30/201 | ||||||||
| Holding | % of Net Assets | Asset Class | ||||||
| Heitman Core Real Estate Debt Income Trust, LP | 8.6 | % | Private REITs & Private Investment Funds | |||||
| Carlyle Property Investors, LP | 5.8 | Private REITs & Private Investment Funds | ||||||
| Menlo Equities Absolute Return Fund, LP | 5.1 | Private REITs & Private Investment Funds | ||||||
| Harrison Street Core Property Fund, LP | 4.9 | Private REITs & Private Investment Funds | ||||||
| Clarion Ventures 4, LP | 4.9 | Private REITs & Private Investment Funds | ||||||
| Brookfield Premier Real Estate Partners, LP | 4.7 | Private REITs & Private Investment Funds | ||||||
| Clarion Lion Properties Fund, LP | 4.1 | Private REITs & Private Investment Funds | ||||||
| ACRES Capital Debt Opportunity Fund, LP | 4.1 | Private REITs & Private Investment Funds | ||||||
| Brookfield Real Estate Finance Fund V, LP | 3.9 | Private REITs & Private Investment Funds | ||||||
| Prologis Targeted U.S. Logistics Holdings II, LP | 3.5 | Private REITs & Private Investment Funds | ||||||
| 1 | The top 10 holdings may not be representative of the Fund’s future investments. |
| ASSET CLASS ALLOCATION2 |
| As of September 30, 2020 |
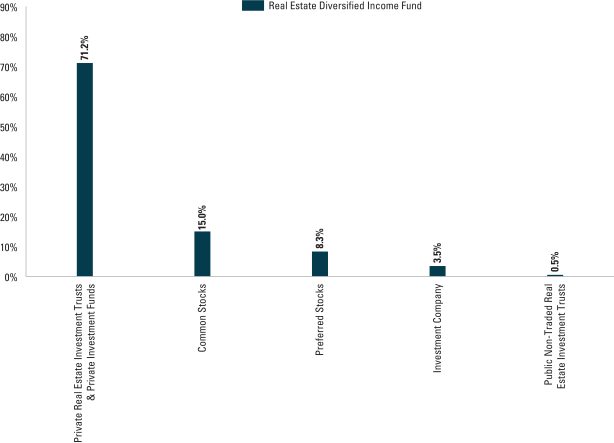
| 2 | The Fund is actively managed and, as such, its composition may differ over time. Consequently, the Fund’s overall allocations may differ from percentages contained in the graph above. Figures in the above graph may not sum to 100% due to the exclusion of other assets and liabilities. |
For more information about your Fund, please refer to www.GSAMFUNDS.com. There, you can learn more about your Fund’s investment strategies, holdings, and performance.
7
GOLDMAN SACHS REAL ESTATE DIVERSIFIED INCOME FUND
Performance Summary
September 30, 2020
Performance reflects applicable fee waivers and/or expense limitations in effect during the periods shown and in their absence, performance would be reduced. Returns do not reflect the deduction of taxes that a shareholder would pay on Fund distributions or the redemption of Fund shares. The returns set forth below represent past performance. Past performance does not guarantee future results. The Fund’s investment return and principal value will fluctuate so that an investor’s shares, when repurchased, may be worth more or less than their original cost. Current performance may be lower or higher than the performance quoted below. Please visit our web site at www.GSAMFUNDS.com to obtain the most recent month-end returns.
| Average Annual Total Return through September 30, 2020*,** | One Year | Five Years | Since Inception | |||||||
Class A (Commenced March 12, 2013) | ||||||||||
Excluding sales charges | -5.20% | 5.56% | 5.41% | |||||||
Including sales charges | -11.09% | 4.31% | 4.59% | |||||||
| ||||||||||
Class C (Commenced August 1, 2014) | ||||||||||
Excluding sales charges | -5.94% | 4.76% | 4.47% | |||||||
Including sales charges | -6.87% | 4.76% | 4.47% | |||||||
| ||||||||||
Class l (Commenced August 1, 2014) | -5.05% | 5.47% | 5.10% | |||||||
| ||||||||||
Class L (Commenced July 10, 2017) | ||||||||||
Excluding sales charges | -5.46% | N/A | 3.49% | |||||||
Including sales charges | -9.45% | N/A | 2.11% | |||||||
| ||||||||||
Class W (Commenced November 21, 2014) | -5.31% | 5.41% | 4.86% | |||||||
| ||||||||||
| * | These returns assume reinvestment of all distributions at NAV and reflect a maximum initial sales charge of 5.75% for Class A and 4.25% for Class L and the assumed contingent deferred sales charge for Class A and C Shares (0.5% and 1%, respectively, if repurchased within 12 months of purchase). Because Class W and Class I Shares do not involve a sales charge, such a charge is not applied to their Average Annual Total Return. |
| ** | After the close of business on May 15, 2020, the Predecessor Fund was reorganized into the Fund. The Fund has assumed the historical performance of the Predecessor Fund, which was managed by another investment adviser. Therefore, the performance information reported above for the Fund is the combined performance of the Fund and the Predecessor Fund. The performance information shown in this report for periods through May 15, 2020 reflects the performance of the Predecessor Fund. As a result, the Fund’s performance may differ substantially from what is shown for periods through May 15, 2020. |
For more information about the Fund, please refer to www.GSAMFUNDS.com. There, you can learn more about the Fund’s investment strategies, holdings, and performance.
8
GOLDMAN SACHS REAL ESTATE DIVERSIFIED INCOME FUND
Consolidated Schedule of Investments
September 30, 2020
| Description | Value | |||||||
| Private Real Estate Investment Trusts & Private Investment Funds – 71.2%(a) | ||||||||
| ACRES Capital Debt Opportunity Fund, LP | $ | 11,851,758 | ||||||
| Ares Real Estate Enhanced Income Fund, LP | 9,047,907 | |||||||
| Ares US Real Estate Fund IX, LP | 9,180,578 | |||||||
| Bain Capital Real Estate Fund I-B, LP | 4,097,922 | |||||||
| Brookfield Premier Real Estate Partners, LP | 13,602,734 | |||||||
| Brookfield Real Estate Finance Fund V, LP | 11,322,188 | |||||||
| Carlyle Property Investors, LP | 16,642,543 | |||||||
| Clarion Lion Industrial Trust | 8,819,105 | |||||||
| Clarion Lion Properties Fund, LP | 11,891,253 | |||||||
| Clarion Partners Debt Investment Fund, LP | 6,857,669 | |||||||
| Clarion Ventures 4, LP | 13,989,773 | |||||||
| Harrison Street Core Property Fund, LP | 13,993,270 | |||||||
| Heitman Core Real Estate Debt Income Trust, LP | 24,640,132 | |||||||
| Menlo Equities Absolute Return Fund, LP | 14,792,882 | |||||||
| Nuveen U.S. Core-Plus Real Estate Debt Fund, LP | 4,652,191 | |||||||
| Prologis Targeted U.S. Logistics Holdings II, LP | 10,051,704 | |||||||
| Sculptor Real Estate Credit Fund, LP | 7,018,765 | |||||||
| The Trumbull Property Fund, LP | 6,524,018 | |||||||
| Truman 2016 SC5, LLC | 643,197 | |||||||
| Voya Commercial Mortgage Lending Fund, LP | 5,379,264 | |||||||
|
| |||||||
TOTAL PRIVATE REAL ESTATE INVESTMENT TRUSTS & PRIVATE INVESTMENT FUNDS |
| |||||||
| (Cost $199,179,535) | $ | 204,998,853 | ||||||
|
| |||||||
| Shares | Description | Value | ||||||
| Common Stocks – 15.0% | ||||||||
| Equity Real Estate Investment Trusts (REITs) – 13.0% | ||||||||
| 10,079 | Alexandria Real Estate Equities, Inc. REIT | $ | 1,612,640 | |||||
| 6,219 | American Tower Corp. REIT | 1,503,319 | ||||||
| 94,117 | Broadstone Net Lease, Inc.(a) | 1,277,111 | ||||||
| 57,212 | Camden Property Trust REIT | 5,090,724 | ||||||
| 161,170 | CubeSmart REIT | 5,207,403 | ||||||
| 21,137 | CyrusOne, Inc. REIT | 1,480,224 | ||||||
| 79,322 | Duke Realty Corp. REIT | 2,926,982 | ||||||
| 36,413 | Equity LifeStyle Properties, Inc. REIT | 2,232,117 | ||||||
| 19,880 | Essex Property Trust, Inc. REIT | 3,991,705 | ||||||
| 83,456 | Invitation Homes, Inc. REIT | 2,335,933 | ||||||
| 46,049 | Life Storage, Inc. REIT | 4,847,578 | ||||||
| 26,400 | MGM Growth Properties LLC, Class A REIT | 738,672 | ||||||
| 24,120 | Prologis, Inc. REIT | 2,426,954 | ||||||
| 30,280 | Terreno Realty Corp. REIT | 1,658,133 | ||||||
|
| |||||||
| 37,329,495 | ||||||||
|
| |||||||
| Mortgage Real Estate Investment Trusts (REITs) – 2.0% | ||||||||
| 235,775 | Ares Commercial Real Estate Corp. REIT | 2,154,983 | ||||||
| 140,573 | Starwood Property Trust, Inc. REIT | 2,121,247 | ||||||
| 165,000 | TPG RE Finance Trust, Inc. REIT | 1,395,900 | ||||||
|
| |||||||
| 5,672,130 | ||||||||
|
| |||||||
| TOTAL COMMON STOCKS | ||||||||
| (Cost $45,244,457) | $ | 43,001,625 | ||||||
|
| |||||||
| Shares | Description | Dividend Rate | Value | |||||||||
| Preferred Stocks – 8.3% | ||||||||||||
| Equity Real Estate Investment Trusts (REITs) – 3.7% | ||||||||||||
| 59,203 | Global Net Lease, Inc., Series A | 7.25 | % | $ | 1,521,517 | |||||||
| 110,690 | SL Green Realty Corp., Series I | 6.50 | % | 2,780,533 | ||||||||
| 112,800 | Sunstone Hotel Investors, Inc., Series E | 6.95 | % | 2,809,848 | ||||||||
| 137,946 | UMH Properties, Inc., Series C | 6.75 | % | 3,472,101 | ||||||||
|
| |||||||||||
| 10,583,999 | ||||||||||||
|
| |||||||||||
| Mortgage Real Estate Investment Trusts (REITs) – 4.6% | ||||||||||||
| 102,679 | AGNC Investment Corp., Series E | 6.50 | % | 2,339,028 | ||||||||
| 105,601 | Annaly Capital Management, Inc., Series F | 6.95 | % | 2,378,134 | ||||||||
| 113,473 | MFA Financial, Inc., Series C | 6.50 | % | 2,085,634 | ||||||||
| 75,401 | New Residential Investment Corp., Series A | 7.50 | % | 1,661,838 | ||||||||
| 66,009 | PennyMac Mortgage Investment Trust, Series A | 8.13 | % | 1,520,187 | ||||||||
| 150,000 | Two Harbors Investment Corp., Series A | 8.13 | % | 3,300,000 | ||||||||
|
| |||||||||||
| 13,284,821 | ||||||||||||
|
| |||||||||||
| TOTAL PREFERRED STOCKS | ||||||||||||
| (Cost $25,765,061) | $ | 23,868,820 | ||||||||||
|
| |||||||||||
| Public Non-Traded Real Estate Investment Trusts – 0.5%(a)(b) | ||||||||||||
| 446,837 | InvenTrust Properties Corp. | $ | 897,685 | |||||||||
| 168,566 | NorthStar Healthcare Income, Inc. | 623,831 | ||||||||||
|
| |||||||||||
| | TOTAL PUBLIC NON-TRADED REAL ESTATE INVESTMENT TRUSTS | | ||||||||||
| (Cost $3,021,726) | $ | 1,521,516 | ||||||||||
|
| |||||||||||
| Shares | Dividend Rate | Value | ||||||
| Investment Company – 3.5%(c) | ||||||||
Goldman Sachs Financial Square Government Fund – Institutional Shares |
| |||||||
| 9,993,327 | 0.027 | % | $ | 9,993,327 | ||||
| (Cost $9,993,327) |
| |||||||
| ||||||||
| TOTAL INVESTMENTS – 98.5% |
| |||||||
| (Cost $283,204,106) |
| $ | 283,384,141 | |||||
| ||||||||
OTHER ASSETS IN EXCESS OF LIABILITIES – 1.5% |
| 4,428,670 | ||||||
| ||||||||
| NET ASSETS – 100.0% |
| $ | 287,812,811 | |||||
| ||||||||
| The percentage shown for each investment category reflects the value of investments in that category as a percentage of net assets. | ||
| The accompanying notes are an integral part of these consolidated financial statements. | 9 |
GOLDMAN SACHS REAL ESTATE DIVERSIFIED INCOME FUND
Consolidated Schedule of Investments (continued)
September 30, 2020
(a) | Restricted securities are not registered under the Securities Act of 1933 and are subject to legal restrictions on sale. These securities generally may be resold in transactions exempt from registration or to the public if the securities are subsequently registered and the registration statement is effective. Disposal of these securities may involve time consuming negotiations and prompt sale at an acceptable price may be difficult. Total market value of restricted securities amounts to $207,797,480, which represents approximately 72.2% of net assets as of September 30, 2020. See additional details below: | |
| Security | Date(s) of Purchase | Cost | ||||||||
ACRES Capital Debt Opportunity Fund, LP | 08/16/18-7/11/19 | $ | 12,000,000 | |||||||
Ares Real Estate Enhanced Income Fund, LP | 10/31/19-08/20/20 | 9,092,877 | ||||||||
Ares US Real Estate Fund IX, LP | 09/19/19-09/23/20 | 9,438,728 | ||||||||
Bain Capital Real Estate Fund I-B, LP | 12/18/19-09/23/20 | 3,968,771 | ||||||||
Broadstone Net Lease, Inc. | 12/30/16 | 1,811,764 | ||||||||
Brookfield Premier Real Estate Partners, LP | 10/01/19-12/30/19 | 14,000,000 | ||||||||
Brookfield Real Estate Finance Fund V, LP | 10/03/19-01/17/20 | 11,730,013 | ||||||||
Carlyle Property Investors, LP | 10/01/19-04/01/20 | 16,987,157 | ||||||||
Clarion Lion Industrial Trust | 12/30/19-04/01/20 | 5,485,051 | ||||||||
Clarion Lion Properties Fund, LP | 01/01/14-05/31/19 | 9,496,610 | ||||||||
Clarion Partners Debt Investment Fund, LP | 02/14/17-05/21/19 | 6,906,873 | ||||||||
Clarion Ventures 4, LP | 07/01/16-07/10/19 | 9,793,571 | ||||||||
Harrison Street Core Property Fund, LP | 07/03/19-10/03/19 | 14,157,423 | ||||||||
Heitman Core Real Estate Debt Income Trust, LP | 07/27/17-11/13/17 | 25,000,000 | ||||||||
InvenTrust Properties Corp. | 02/06/15 | 1,429,240 | ||||||||
Menlo Equities Absolute Return Fund, LP | 06/28/19 | 16,000,000 | ||||||||
NorthStar Healthcare Income, Inc. | 11/27/13-03/12/15 | 1,592,486 | ||||||||
Nuveen U.S. Core-Plus Real Estate Debt Fund, LP | 10/01/19-02/28/20 | 4,792,480 | ||||||||
Prologis Targeted U.S. Logistics Holdings II, LP | 01/03/20-07/15/20 | 10,096,699 | ||||||||
Sculptor Real Estate Credit Fund, LP | 01/21/20-05/12/20 | 7,635,204 | ||||||||
The Trumbull Property Fund, LP | 01/04/16-10/01/18 | 7,101,855 | ||||||||
Truman 2016 SC5, LLC | 10/21/19 | 97,429 | ||||||||
Voya Commercial Mortgage Lending Fund, LP | 10/11/19-12/30/19 | 5,398,794 | ||||||||
| Total | $ | 204,013,025 | ||||||||
(b) | Significant unobservable inputs were used in the valuation of this portfolio security; i.e. Level 3. | |
(c) | Represents an affiliated issuer. | |
| ||
Investment Abbreviations: | ||
LP | —Limited Partnership | |
REIT | —Real Estate Investment Trust | |
| ||
| 10 | The accompanying notes are an integral part of these consolidated financial statements. |
GOLDMAN SACHS REAL ESTATE DIVERSIFIED INCOME FUND
Consolidated Schedule of Investments (continued)
September 30, 2020
| ADDITIONAL INVESTMENT INFORMATION |
Additional information on investments in private real estate investment funds:
| Security | Value | Redemption Frequency | Redemption Notice (Days) | Unfunded Commitments as of September 30, 2020 | ||||||||||||
ACRES Capital Debt Opportunity Fund, LP | $ | 11,851,758 | N/A | N/A | $ | — | ||||||||||
Ares Real Estate Enhanced Income Fund, LP(a) | 9,047,907 | Quarterly | 90 | 4,907,123 | ||||||||||||
Ares US Real Estate Fund IX, LP | 9,180,578 | N/A | N/A | 3,061,272 | ||||||||||||
Bain Capital Real Estate Fund I-B, LP | 4,097,922 | N/A | N/A | 6,217,735 | ||||||||||||
Brookfield Premier Real Estate Partners, LP(b) | 13,602,734 | Quarterly | 90 | — | ||||||||||||
Brookfield Real Estate Finance Fund V, LP | 11,322,188 | N/A | N/A | 12,752,267 | ||||||||||||
Carlyle Property Investors, LP(c) | 16,642,543 | Quarterly | 90 | — | ||||||||||||
Clarion Lion Industrial Trust | 8,819,105 | Quarterly | 90 | — | ||||||||||||
Clarion Lion Properties Fund, LP | 11,891,253 | Quarterly | 90 | — | ||||||||||||
Clarion Partners Debt Investment Fund, LP | 6,857,669 | N/A | N/A | 5,158,972 | ||||||||||||
Clarion Ventures 4, LP | 13,989,773 | N/A | N/A | 963,242 | ||||||||||||
Harrison Street Core Property Fund, LP | 13,993,270 | Quarterly | 45 | — | ||||||||||||
Heitman Core Real Estate Debt Income Trust, LP(d) | 24,640,132 | Quarterly | 90 | — | ||||||||||||
Menlo Equities Absolute Return Fund, LP(e) | 14,792,882 | Annually | 30 | — | ||||||||||||
Nuveen U.S. Core-Plus Real Estate Debt Fund, LP(f) | 4,652,191 | Quarterly | 45 | 5,207,520 | ||||||||||||
Prologis Targeted U.S. Logistics Holdings II, LP | 10,051,704 | Quarterly | 90 | — | ||||||||||||
Sculptor Real Estate Credit Fund, LP | 7,018,765 | N/A | N/A | 14,449,083 | ||||||||||||
The Trumbull Property Fund, LP | 6,524,018 | Quarterly | 60 | — | ||||||||||||
Truman 2016 SC5, LLC | 643,197 | N/A | N/A | — | ||||||||||||
Voya Commercial Mortgage Lending Fund, LP | 5,379,264 | Quarterly | 90 | — | ||||||||||||
| (a) | Redemptions are subject to a two-year holding period from the underlying fund’s initial capital call on February 22, 2019. |
| (b) | Redemptions are subject to a two-year holding period from the initial capital call on October 1, 2019. |
| (c) | Redemptions are subject to a two-year holding period from the underlying fund’s initial capital call on July 1, 2019. |
| (d) | Redemptions of certain tranches are subject to a three-year holding period from the underlying fund’s latest capital call on November 13, 2017. |
| (e) | Redemptions are subject to a two-year holding period from the underlying fund’s initial capital call on June 28, 2019. |
| (f) | Redemptions are subject to a two-year holding period from the underlying fund’s initial capital call on May 31, 2019. |
| The accompanying notes are an integral part of these consolidated financial statements. | 11 |
GOLDMAN SACHS REAL ESTATE DIVERSIFIED INCOME FUND
Consolidated Statement of Assets and Liabilities(a)
September 30, 2020
| ||||||
| Assets: |
| |||||
Investments in unaffiliated issuers, at value (cost $273,210,779) | $ | 273,390,814 | ||||
Investments in affiliated issuers, at value (cost $9,993,327) | 9,993,327 | |||||
Cash | 388,460 | |||||
Receivables: | ||||||
Dividends | 4,763,889 | |||||
Fund shares sold | 75,828 | |||||
Investments sold | 45,804 | |||||
Other assets | 3,662 | |||||
| Total assets | 288,661,784 | |||||
| Liabilities: | ||||||
Payables: | ||||||
Management fees | 366,378 | |||||
Distribution and Service fees and Transfer Agency fees | 171,810 | |||||
Interest on borrowings | 17,139 | |||||
Accrued expenses | 293,646 | |||||
| Total liabilities | 848,973 | |||||
| Net Assets: | ||||||
Paid-in capital | 291,013,535 | |||||
Total distributable earnings (loss) | (3,200,724 | ) | ||||
| NET ASSETS | $ | 287,812,811 | ||||
Net Assets: | ||||||
Class A | $ | 87,520,363 | ||||
Class C | 72,825,564 | |||||
Class I | 74,219,760 | |||||
Class L | 5,538,228 | |||||
Class W | 47,708,896 | |||||
Total Net Assets | $ | 287,812,811 | ||||
Shares Outstanding $0.001 par value (unlimited number of shares authorized): | ||||||
Class A | 9,330,754 | |||||
Class C | 7,763,854 | |||||
Class I | 7,586,565 | |||||
Class L | 590,101 | |||||
Class W | 5,009,338 | |||||
Net asset value and offering price per share:(b) | ||||||
Class A | $9.38 | |||||
Class C | 9.38 | |||||
Class I | 9.78 | |||||
Class L | 9.39 | |||||
Class W | 9.52 | |||||
| (a) | Statement of Assets and Liabilities for the Fund is consolidated and includes the balances of wholly owned subsidiaries DIF Investments LLC and DIF Investments II LLC. Accordingly, all interfund balances and transactions have been eliminated. |
| (b) | Maximum public offering price per share for Class A Shares is $9.95 and for Class L is $9.81. Upon repurchase, Class C Shares may be subject to a contingent deferred sales charge, assessed on the amount equal to the lesser of the current net asset value (“NAV”) or the original purchase price of the shares. |
| 12 | The accompanying notes are an integral part of these consolidated financial statements. |
GOLDMAN SACHS REAL ESTATE DIVERSIFIED INCOME FUND
Consolidated Statement of Operations(a)
For the Fiscal Year Ended September 30, 2020
| ||||||
| Investment income: |
| |||||
Dividends — unaffiliated issuers (net of foreign withholding taxes of $2,887) | $ | 16,522,346 | ||||
Interest — unaffiliated issuers | 34,148 | |||||
Dividends — affiliated issuers | 4,809 | |||||
| Total investment income | 16,561,303 | |||||
| Expenses: |
| |||||
Management fees | 4,067,224 | |||||
Distribution Service fees(b) | 804,674 | |||||
Interest on borrowing | 637,973 | |||||
Custody, accounting and administrative services | 406,599 | |||||
Transfer Agency fees | 524,541 | |||||
Shareholder Services fees(b) | 413,466 | |||||
Professional fees | 283,026 | |||||
Printing and mailing costs | 200,213 | |||||
Compliance fees | 132,927 | |||||
Registration fees | 109,993 | |||||
Trustee fees | 99,349 | |||||
Other | 131,647 | |||||
| Total expenses | 7,811,632 | |||||
Less — expense reductions | (6,892 | ) | ||||
Less — fees waived by investment adviser | (300,041 | ) | ||||
Recoupment of previously waived fees | 40,517 | |||||
| Net expenses | 7,545,216 | |||||
| NET INVESTMENT INCOME | 9,016,087 | |||||
| Realized and unrealized gain (loss): |
| |||||
Net realized gain (loss) from: | ||||||
Investments — unaffiliated issuers | 44,679 | |||||
Purchased options | (2,083,273 | ) | ||||
Written options | (325,501 | ) | ||||
Net change in unrealized gain (loss) on: | ||||||
Investments — unaffiliated issuers | (27,659,390 | ) | ||||
Purchased options | 136,900 | |||||
Written options | 247,584 | |||||
| Net realized and unrealized loss | (29,639,001 | ) | ||||
| NET DECREASE IN NET ASSETS RESULTING FROM OPERATIONS | $ | (20,622,914 | ) | |||
| (a) | Statement of Operations for the Fund is consolidated and includes the balances of wholly owned subsidiaries DIF Investments LLC and DIF Investments II LLC. Accordingly, all interfund balances and transactions have been eliminated. |
| (b) | Class specific Distribution Service and Shareholder Services fees were as follows: |
| Distribution Service Fees | Shareholder Services fees | |||||||||||||||||||||||||||||||||||||||||||||||||
Class A | Class C | Class W | Class L | Class T | Class D | Class A | Class C | Class W | Class L | Class T | Class U | Class D | ||||||||||||||||||||||||||||||||||||||
| $ | 119,137 | $ | 578,113 | $ | 72,716 | $ | 17,306 | $ | 10,949 | $ | 6,453 | $ | 119,137 | $ | 192,704 | $ | 72,716 | $ | 17,306 | $ | 3,650 | $ | 4,726 | $ | 3,227 | |||||||||||||||||||||||||
| The accompanying notes are an integral part of these consolidated financial statements. | 13 |
GOLDMAN SACHS REAL ESTATE DIVERSIFIED INCOME FUND
Consolidated Statements of Changes in Net Assets(a)
| For the Fiscal Year Ended September 30, 2020 | For the Fiscal Year Ended September 30, 2019 | |||||||||
| From operations: |
| |||||||||
Net investment income | $ | 9,016,087 | $ | 11,154,521 | ||||||
Net realized gain (loss) | (2,364,095 | ) | 7,880,053 | |||||||
Net change in unrealized gain (loss) | (27,274,906 | ) | 5,488,048 | |||||||
| Net increase (decrease) in net assets resulting from operations | (20,622,914 | ) | 24,522,622 | |||||||
| Distributions to shareholders: | ||||||||||
Total distributable earnings: | ||||||||||
Class A Shares | (5,429,382 | ) | (3,994,204 | ) | ||||||
Class C Shares | (3,663,199 | ) | (2,618,689 | ) | ||||||
Class I Shares | (4,472,302 | ) | (1,835,557 | ) | ||||||
Class L Shares | (283,683 | ) | (330,150 | ) | ||||||
Class W Shares | (3,165,247 | ) | (3,730,424 | ) | ||||||
Class U Shares(b) | (62 | ) | (445,458 | ) | ||||||
Class T Shares(c) | (327 | ) | (248,861 | ) | ||||||
Class D Shares(c) | (787 | ) | (255,121 | ) | ||||||
From return of capital: | ||||||||||
Class A Shares | (1,741,207 | ) | (1,153,777 | ) | ||||||
Class C Shares | (1,378,419 | ) | (747,260 | ) | ||||||
Class I Shares | (1,278,114 | ) | (519,261 | ) | ||||||
Class L Shares | (122,826 | ) | (93,724 | ) | ||||||
Class W Shares | (1,167,461 | ) | (1,104,767 | ) | ||||||
Class U Shares(b) | — | (133,691 | ) | |||||||
Class T Shares(c) | — | (78,236 | ) | |||||||
Class D Shares(c) | — | (73,525 | ) | |||||||
| Total distributions to shareholders | (22,703,016 | ) | (17,362,705 | ) | ||||||
| From share transactions: | ||||||||||
Proceeds from sales of shares | 96,310,426 | 87,178,408 | ||||||||
Reinvestment of distributions | 10,456,342 | 9,167,702 | ||||||||
Cost of shares repurchased | (126,528,978 | ) | (22,395,901 | ) | ||||||
Net transferred between share classes | — | * | 482,114 | |||||||
| Net increase (decrease) in net assets resulting from share transactions | (19,762,210 | ) | 74,432,323 | |||||||
| TOTAL INCREASE (DECREASE) | (63,088,140 | ) | 81,592,240 | |||||||
| Net assets: | ||||||||||
Beginning of year | 350,900,951 | 269,308,711 | ||||||||
End of year | $ | 287,812,811 | $ | 350,900,951 | ||||||
| (a) | Statements of Changes in Net Assets for the Fund is consolidated and includes the balances of wholly owned subsidiaries DIF Investments LLC and DIF Investments II LLC. Accordingly, all interfund balances and transactions have been eliminated. |
| (b) | Effective as of January 15, 2020, the Fund terminated operations of its Class U Shares. |
| (c) | Effective as of February 3, 2020, the Fund terminated operations of its Class D and Class T shares. |
| * | For the fiscal year ended September 30, 2020, the fund recognized transfers between share classes as shares sold and shares repurchased. |
| 14 | The accompanying notes are an integral part of these consolidated financial statements. |
GOLDMAN SACHS REAL ESTATE DIVERSIFIED INCOME FUND
Consolidated Statement of Cash Flows(a)
For the Fiscal Year Ended September 30, 2020
| ||||||
Increase/(Decrease) in cash – Cash flows provided by operating activities:(b) | ||||||
Net decrease in net assets resulting from operations | $ | (20,622,914 | ) | |||
Adjustments to reconcile net increase in net assets from operations to net cash provided by/(used in) operating activities: | ||||||
Payments for purchases of investments | (188,610,161 | ) | ||||
Proceeds from sales of investments | 284,889,906 | |||||
Payment for purchases of option contracts | (972,335 | ) | ||||
Proceeds from sale of option contracts | 107,722 | |||||
Premiums received from written options transactions | 936,738 | |||||
Premiums paid from closing written options transactions | (2,878,406 | ) | ||||
Net (purchase) proceeds from short-term investment securities | (7,777,999 | ) | ||||
Accretion of discount on investments | 26 | |||||
(Increase) Decrease in Assets: | ||||||
Receivable for dividends | (1,240,716 | ) | ||||
Other assets | 25,985 | |||||
Increase (Decrease) in Liabilities: | ||||||
Interest on borrowings | (143,036 | ) | ||||
Management fees | 25,917 | |||||
Distribution and Service fees and Transfer Agency fees | 2,936 | |||||
Accrued expenses | 13,718 | |||||
Net realized (gain) loss on: | ||||||
Investments | (44,679 | ) | ||||
Purchased options | 2,083,273 | |||||
Written options | 325,501 | |||||
Net change in unrealized (gain) loss on: | ||||||
Investments | 27,659,390 | |||||
Purchased options | (136,900 | ) | ||||
Written options | (247,584 | ) | ||||
| Net cash provided by operating activities | 93,396,382 | |||||
| Cash flows provided by financing activities: | ||||||
Repayment of borrowing facility | (43,482,332 | ) | ||||
Proceeds from sale of shares | 36,241,192 | |||||
Cost of shares repurchased | (72,077,693 | ) | ||||
Decrease in payable to custodian | (1,555,642 | ) | ||||
Distributions paid | (12,246,674 | ) | ||||
| Net cash used in financing activities | (93,121,149 | ) | ||||
| NET INCREASE IN CASH | $ | 275,233 | ||||
| Cash (restricted and unrestricted): | ||||||
Beginning of year | $ | 113,227 | ||||
End of year | $ | 388,460 | ||||
Supplemental disclosure: | ||||||
Cash paid for interest and related fees | 732,273 | |||||
Transfers of shares in from other share classes | 54,451,285 | |||||
Transfers of shares out of other share classes | (54,451,285 | ) | ||||
Reinvestment of distributions | 10,456,342 | |||||
| (a) | Statement of Cash Flows for the Fund is consolidated and includes the balances of wholly owned subsidiaries DIF Investments LLC and DIF Investments II LLC. Accordingly, all interfund balances and transactions have been eliminated. |
| (b) | Certain line items in the Increase/Decrease in operating assets and liabilities section of the consolidated statement of cash flows are presented based on the classifications in the September 30, 2020 consolidated statement of assets and liabilities which have been updated from the September 30, 2019 presentation. The classification changes had no impact on total assets, total liabilities, or net assets. |
| The accompanying notes are an integral part of these consolidated financial statements. | 15 |
GOLDMAN SACHS REAL ESTATE DIVERSIFIED INCOME FUND
Consolidated Financial Highlights
Selected Share Data for a Share Outstanding Throughout Each Year
| Goldman Sachs Real Estate Diversified Income Fund | ||||||||||||||||||||||
| Class A Shares | ||||||||||||||||||||||
| Year Ended September 30, | ||||||||||||||||||||||
| 2020 | 2019 | 2018 | 2017 | 2016 | ||||||||||||||||||
| Per Share Data | ||||||||||||||||||||||
Net asset value, beginning of year | $ | 10.69 | $ | 10.47 | $ | 10.19 | $ | 10.26 | $ | 9.81 | ||||||||||||
Net investment income(a) | 0.29 | 0.40 | 0.30 | 0.39 | 0.34 | |||||||||||||||||
Net realized and unrealized gain (loss) | (0.89 | ) | 0.42 | 0.58 | 0.17 | 0.71 | ||||||||||||||||
Total from investment operations | (0.60 | ) | 0.82 | 0.88 | 0.56 | 1.05 | ||||||||||||||||
Distributions to shareholders from net investment income | (0.23 | ) | (0.26 | ) | (0.24 | ) | (0.31 | ) | (0.32 | ) | ||||||||||||
Distributions to shareholders from net realized gains | (0.30 | ) | (0.21 | ) | (0.15 | ) | (0.12 | ) | — | |||||||||||||
Distributions to shareholders from return of capital | (0.18 | ) | (0.13 | ) | (0.21 | ) | (0.20 | ) | (0.28 | ) | ||||||||||||
Total distributions | (0.71 | ) | (0.60 | ) | (0.60 | ) | (0.63 | ) | (0.60 | ) | ||||||||||||
Net asset value, end of year | $ | 9.38 | $ | 10.69 | $ | 10.47 | $ | 10.19 | $ | 10.26 | ||||||||||||
| Total Return(b) | (5.20 | )% | 8.17 | % | 9.00 | % | 5.67 | % | 11.09 | % | ||||||||||||
Net assets, end of year (in 000’s) | $ | 87,520 | $ | 96,114 | $ | 86,965 | $ | 84,231 | $ | 61,470 | ||||||||||||
Ratio of net expenses to average net assets before interest expense | 1.99 | % | 1.99 | % | 1.99 | % | 1.99 | % | 1.99 | % | ||||||||||||
Ratio of net expenses to average net assets after interest expense | 2.19 | % | 2.83 | % | 2.76 | % | 2.69 | % | 2.39 | % | ||||||||||||
Ratio of total expenses to average net assets after interest expense | 2.28 | % | 2.90 | % | 2.97 | % | 2.90 | % | 2.78 | % | ||||||||||||
Ratio of net investment income to average net assets | 2.88 | % | 3.83 | % | 2.97 | % | 3.81 | % | 3.47 | % | ||||||||||||
Portfolio turnover rate(c) | 53 | % | 65 | % | 78 | % | 11 | % | 21 | % | ||||||||||||
| (a) | Calculated based on the average shares outstanding methodology. |
| (b) | Assumes investment at the NAV at the beginning of the year, reinvestment of all dividends and distributions, a complete repurchase of the investment at the NAV at the end of the year and no sales or repurchase charges (if any). Total returns would be reduced if a sales or repurchase charge was taken into account. Returns do not reflect the impact of taxes to shareholders relating to Fund distributions or the repurchase of Fund shares. |
| (c) | The Fund’s portfolio turnover rate is calculated in accordance with regulatory requirements, without regard to transactions involving short term investments. If such transactions were included, the Fund’s portfolio turnover rate may be higher. |
| 16 | The accompanying notes are an integral part of these consolidated financial statements. |
GOLDMAN SACHS REAL ESTATE DIVERSIFIED INCOME FUND
Consolidated Financial Highlights (continued)
Selected Share Data for a Share Outstanding Throughout Each Year
| Goldman Sachs Real Estate Diversified Income Fund | ||||||||||||||||||||||
| Class C Shares | ||||||||||||||||||||||
| Year Ended September 30, | ||||||||||||||||||||||
| 2020 | 2019 | 2018 | 2017 | 2016 | ||||||||||||||||||
| Per Share Data | ||||||||||||||||||||||
Net asset value, beginning of year | $ | 10.68 | $ | 10.47 | $ | 10.19 | $ | 10.25 | $ | 9.81 | ||||||||||||
Net investment income(a) | 0.20 | 0.32 | 0.23 | 0.32 | 0.28 | |||||||||||||||||
Net realized and unrealized gain (loss) | (0.87 | ) | 0.41 | 0.57 | 0.18 | 0.68 | ||||||||||||||||
Total from investment operations | (0.67 | ) | 0.73 | 0.80 | 0.50 | 0.96 | ||||||||||||||||
Distributions to shareholders from net investment income | (0.16 | ) | (0.22 | ) | (0.20 | ) | (0.27 | ) | (0.27 | ) | ||||||||||||
Distributions to shareholders from net realized gains | (0.29 | ) | (0.18 | ) | (0.14 | ) | (0.12 | ) | — | |||||||||||||
Distributions to shareholders from return of capital | (0.18 | ) | (0.12 | ) | (0.18 | ) | (0.17 | ) | (0.25 | ) | ||||||||||||
Total distributions | (0.63 | ) | (0.52 | ) | (0.52 | ) | (0.56 | ) | (0.52 | ) | ||||||||||||
Net asset value, end of year | $ | 9.38 | $ | 10.68 | $ | 10.47 | $ | 10.19 | $ | 10.25 | ||||||||||||
| Total Return(b) | (5.94 | )% | 7.24 | % | 8.17 | % | 4.97 | % | 10.15 | % | ||||||||||||
Net assets, end of year (in 000’s) | $ | 72,826 | $ | 74,609 | $ | 62,367 | $ | 57,559 | $ | 33,114 | ||||||||||||
Ratio of net expenses to average net assets before interest expense | 2.74 | % | 2.74 | % | 2.74 | % | 2.74 | % | 2.74 | % | ||||||||||||
Ratio of net expenses to average net assets after interest expense | 2.94 | % | 3.58 | % | 3.51 | % | 3.47 | % | 3.14 | % | ||||||||||||
Ratio of total expenses to average net assets after interest expense | 3.04 | % | 3.64 | % | 3.73 | % | 3.71 | % | 3.53 | % | ||||||||||||
Ratio of net investment income to average net assets | 2.04 | % | 3.08 | % | 2.24 | % | 3.11 | % | 2.87 | % | ||||||||||||
Portfolio turnover rate(c) | 53 | % | 65 | % | 78 | % | 11 | % | 21 | % | ||||||||||||
| (a) | Calculated based on the average shares outstanding methodology. |
| (b) | Assumes investment at the NAV at the beginning of the year, reinvestment of all dividends and distributions, a complete repurchase of the investment at the NAV at the end of the year and no sales or repurchase charges (if any). Total returns would be reduced if a sales or repurchase charge was taken into account. Returns do not reflect the impact of taxes to shareholders relating to Fund distributions or the repurchase of Fund shares. |
| (c) | The Fund’s portfolio turnover rate is calculated in accordance with regulatory requirements, without regard to transactions involving short term investments. If such transactions were included, the Fund’s portfolio turnover rate may be higher. |
| The accompanying notes are an integral part of these consolidated financial statements. | 17 |
GOLDMAN SACHS REAL ESTATE DIVERSIFIED INCOME FUND
Consolidated Financial Highlights (continued)
Selected Share Data for a Share Outstanding Throughout Each Year
| Goldman Sachs Real Estate Diversified Income Fund | ||||||||||||||||||||||
| Class I Shares | ||||||||||||||||||||||
| Year Ended September 30, | ||||||||||||||||||||||
| 2020 | 2019 | 2018 | 2017 | 2016 | ||||||||||||||||||
| Per Share Data | ||||||||||||||||||||||
Net asset value, beginning of year | $ | 11.13 | $ | 10.91 | $ | 10.62 | $ | 10.74 | $ | 10.36 | ||||||||||||
Net investment income(a) | 0.33 | 0.45 | 0.36 | 0.48 | 0.04 | |||||||||||||||||
Net realized and unrealized gain (loss) | (0.93 | ) | 0.42 | 0.59 | 0.09 | 0.97 | ||||||||||||||||
Total from investment operations | (0.60 | ) | 0.87 | 0.95 | 0.57 | 1.01 | ||||||||||||||||
Distributions to shareholders from net investment income | (0.26 | ) | (0.27 | ) | (0.26 | ) | (0.34 | ) | (0.33 | ) | ||||||||||||
Distributions to shareholders from net realized gains | (0.31 | ) | (0.23 | ) | (0.16 | ) | (0.12 | ) | — | |||||||||||||
Distributions to shareholders from return of capital | (0.18 | ) | (0.15 | ) | (0.24 | ) | (0.23 | ) | (0.30 | ) | ||||||||||||
Total distributions | (0.75 | ) | (0.65 | ) | (0.66 | ) | (0.69 | ) | (0.63 | ) | ||||||||||||
Net asset value, end of year | $ | 9.78 | $ | 11.13 | $ | 10.91 | $ | 10.62 | $ | 10.74 | ||||||||||||
| Total Return(b) | (5.05 | )% | 8.35 | % | 9.25 | % | 5.45 | % | 10.12 | % | ||||||||||||
Net assets, end of year (in 000’s) | $ | 74,220 | $ | 55,138 | $ | 22,273 | $ | 8,385 | $ | 0 | (c) | |||||||||||
Ratio of net expenses to average net assets before interest expense | 1.74 | % | 1.74 | % | 1.74 | % | 1.74 | % | 1.74 | % | ||||||||||||
Ratio of net expenses to average net assets after interest expense | 1.94 | % | 2.63 | % | 2.49 | % | 2.56 | % | 2.14 | % | ||||||||||||
Ratio of total expenses to average net assets after interest expense | 2.03 | % | 2.68 | % | 2.75 | % | 3.23 | % | 2.49 | % | ||||||||||||
Ratio of net investment income to average net assets | 3.16 | % | 4.10 | % | 3.35 | % | 4.48 | % | 0.36 | % | ||||||||||||
Portfolio turnover rate(d) | 53 | % | 65 | % | 78 | % | 11 | % | 21 | % | ||||||||||||
| (a) | Calculated based on the average shares outstanding methodology. |
| (b) | Assumes investment at the NAV at the beginning of the year, reinvestment of all dividends and distributions, a complete repurchase of the investment at the NAV at the end of the year and no sales or repurchase charges (if any). Total returns would be reduced if a sales or repurchase charge was taken into account. Returns do not reflect the impact of taxes to shareholders relating to Fund distributions or the repurchase of Fund shares. |
| (c) | Amount less than $500. |
| (d) | The Fund’s portfolio turnover rate is calculated in accordance with regulatory requirements, without regard to transactions involving short term investments. If such transactions were included, the Fund’s portfolio turnover rate may be higher. |
| 18 | The accompanying notes are an integral part of these consolidated financial statements. |
GOLDMAN SACHS REAL ESTATE DIVERSIFIED INCOME FUND
Consolidated Financial Highlights (continued)
Selected Share Data for a Share Outstanding Throughout Each Year
| Goldman Sachs Real Estate Diversified Income Fund | ||||||||||||||||||
| Class L Shares | ||||||||||||||||||
| Year Ended September 30, | Period Ended September 30, 2017(a) | |||||||||||||||||
| 2020 | 2019 | 2018 | ||||||||||||||||
| Per Share Data | ||||||||||||||||||
Net asset value, beginning of period | $ | 10.69 | $ | 10.48 | $ | 10.20 | $ | 10.22 | ||||||||||
Net investment income(b) | 0.27 | 0.38 | 0.30 | 0.26 | ||||||||||||||
Net realized and unrealized gain (loss) | (0.89 | ) | 0.40 | 0.55 | (0.14 | )(c) | ||||||||||||
Total from investment operations | (0.62 | ) | 0.78 | 0.85 | 0.12 | |||||||||||||
Distributions to shareholders from net investment income | (0.20 | ) | (0.24 | ) | (0.22 | ) | (0.05 | ) | ||||||||||
Distributions to shareholders from net realized gains | (0.30 | ) | (0.20 | ) | (0.15 | ) | (0.02 | ) | ||||||||||
Distributions to shareholders from return of capital | (0.18 | ) | (0.13 | ) | (0.20 | ) | (0.07 | ) | ||||||||||
Total distributions | (0.68 | ) | (0.57 | ) | (0.57 | ) | (0.14 | ) | ||||||||||
Net asset value, end of period | $ | 9.39 | $ | 10.69 | $ | 10.48 | $ | 10.20 | ||||||||||
| Total Return(d) | (5.46 | )% | 7.79 | % | 8.72 | % | 1.22 | % | ||||||||||
Net assets, end of period (in 000’s) | $ | 5,538 | $ | 10,402 | $ | 4,613 | $ | 836 | ||||||||||
Ratio of net expenses to average net assets before interest expense | 2.24 | % | 2.24 | % | 2.24 | % | 2.24 | %(e) | ||||||||||
Ratio of net expenses to average net assets after interest expense | 2.44 | % | 3.13 | % | 2.99 | % | 3.07 | %(e) | ||||||||||
Ratio of total expenses to average net assets after interest expense | 2.54 | % | 3.17 | % | 3.22 | % | 3.83 | %(e) | ||||||||||
Ratio of net investment income to average net assets | 2.71 | % | 3.60 | % | 2.91 | % | 11.62 | %(e) | ||||||||||
Portfolio turnover rate(f) | 53 | % | 65 | % | 78 | % | 11 | % | ||||||||||
| (a) | The Fund’s Class L Shares commenced operations on July 10, 2017. |
| (b) | Calculated based on the average shares outstanding methodology. |
| (c) | Realized and unrealized losses per share do not correlate to the aggregate of the net realized and unrealized gains on the Statement of Operations for the period ended September 30, 2017, primarily due to the timing of sales and repurchases of the Fund’s shares in relation to fluctuating market values for the Fund’s portfolio. |
| (d) | Assumes investment at the NAV at the beginning of the period, reinvestment of all dividends and distributions, a complete repurchase of the investment at the NAV at the end of the period and no sales or repurchase charges (if any). Total returns would be reduced if a sales or repurchase charge was taken into account. Returns do not reflect the impact of taxes to shareholders relating to Fund distributions or the repurchase of Fund shares. Total returns for periods less than one full year are not annualized. |
| (e) | Annualized. |
| (f) | The Fund’s portfolio turnover rate is calculated in accordance with regulatory requirements, without regard to transactions involving short term investments. If such transactions were included, the Fund’s portfolio turnover rate may be higher. |
| The accompanying notes are an integral part of these consolidated financial statements. | 19 |
GOLDMAN SACHS REAL ESTATE DIVERSIFIED INCOME FUND
Consolidated Financial Highlights (continued)
Selected Share Data for a Share Outstanding Throughout Each Year
| Goldman Sachs Real Estate Diversified Income Fund | ||||||||||||||||||||||
| Class W Shares | ||||||||||||||||||||||
| Year Ended September 30, | ||||||||||||||||||||||
| 2020 | 2019 | 2018 | 2017 | 2016 | ||||||||||||||||||
| Per Share Data | ||||||||||||||||||||||
Net asset value, beginning of year | $ | 10.85 | $ | 10.63 | $ | 10.35 | $ | 10.41 | $ | 9.96 | ||||||||||||
Net investment income(a) | 0.31 | 0.41 | 0.31 | 0.39 | 0.32 | |||||||||||||||||
Net realized and unrealized gain (loss) | (0.92 | ) | 0.42 | 0.58 | 0.17 | 0.69 | ||||||||||||||||
Total from investment operations | (0.61 | ) | 0.83 | 0.89 | 0.56 | 1.01 | ||||||||||||||||
Distributions to shareholders from net investment income | (0.24 | ) | (0.26 | ) | (0.23 | ) | (0.30 | ) | (0.30 | ) | ||||||||||||
Distributions to shareholders from net realized gains | (0.30 | ) | (0.21 | ) | (0.16 | ) | (0.12 | ) | — | |||||||||||||
Distributions to shareholders from return of capital | (0.18 | ) | (0.14 | ) | (0.22 | ) | (0.20 | ) | (0.26 | ) | ||||||||||||
Total distributions | (0.72 | ) | (0.61 | ) | (0.61 | ) | (0.62 | ) | (0.56 | ) | ||||||||||||
Net asset value, end of year | $ | 9.52 | $ | 10.85 | $ | 10.63 | $ | 10.35 | $ | 10.41 | ||||||||||||
| Total Return(b) | (5.31 | )% | 8.13 | % | 8.95 | % | 5.64 | % | 10.46 | % | ||||||||||||
Net assets, end of year (in 000’s) | $ | 47,709 | $ | 92,006 | $ | 69,400 | $ | 56,427 | $ | 31,076 | ||||||||||||
Ratio of net expenses to average net assets before interest expense | 1.99 | % | 1.99 | % | 1.99 | % | 2.09 | %(c) | 2.49 | % | ||||||||||||
Ratio of net expenses to average net assets after interest expense | 2.19 | % | 2.84 | % | 2.76 | % | 2.83 | % | 2.89 | % | ||||||||||||
Ratio of total expenses to average net assets after interest expense | 2.23 | % | 2.88 | % | 2.96 | % | 3.06 | % | 3.30 | % | ||||||||||||
Ratio of net investment income to average net assets | 2.99 | % | 3.85 | % | 3.01 | % | 3.79 | % | 3.17 | % | ||||||||||||
Portfolio turnover rate(d) | 53 | % | 65 | % | 78 | % | 11 | % | 21 | % | ||||||||||||
| (a) | Calculated based on the average shares outstanding methodology. |
| (b) | Assumes investment at the NAV at the beginning of the year, reinvestment of all dividends and distributions, a complete repurchase of the investment at the NAV at the end of the year and no sales or repurchase charges (if any). Total returns would be reduced if a sales or repurchase charge was taken into account. Returns do not reflect the impact of taxes to shareholders relating to Fund distributions or the repurchase of Fund shares. |
| (c) | Effective January 5, 2017, the annual expense limitation changed from 2.49% to 1.99%. |
| (d) | The Fund’s portfolio turnover rate is calculated in accordance with regulatory requirements, without regard to transactions involving short term investments. If such transactions were included, the Fund’s portfolio turnover rate may be higher. |
| 20 | The accompanying notes are an integral part of these consolidated financial statements. |
GOLDMAN SACHS REAL ESTATE DIVERSIFIED INCOME FUND
Consolidated Notes to Financial Statements
September 30, 2020
| 1 . ORGANIZATION |
Goldman Sachs Real Estate Diversified Income Fund (the “Fund”), is a Delaware statutory trust registered under the Investment Company Act of 1940 (the “Act”), as amended, as a diversified, closed-end management investment company and is structured as an “interval fund,” a type of fund which, in order to provide some liquidity to shareholders, makes quarterly offers to repurchase a percentage of its outstanding shares at NAV, pursuant to Rule 23c-3 under the Act. The Fund was organized as a Delaware statutory trust on December 2, 2019. The Fund offers five classes of shares: Class A, Class C, Class I, Class L, and Class W.
Class A and Class L Shares are sold with front-end sales charges of up to 5.75% and 4.25%, respectively. Class A and Class C Shares are sold with contingent deferred sales charges (“CDSC”) of 0.50% and 1.00%, respectively, which are imposed on repurchases made within 12 months of purchase. Class I and Class W Shares are not subject to a sales charge.
Goldman Sachs Asset Management, L.P. (“GSAM”), an affiliate of Goldman Sachs & Co. LLC, serves as investment adviser to the Fund pursuant to a management agreement (the “Agreement”) with the Fund.
Pursuant to an Agreement and Plan of Reorganization (the “Reorganization Agreement”) approved by the Fund’s Board of Trustees, all of the assets of the Resource Real Estate Diversified Income Fund (“Predecessor Fund”) were transferred to the Fund in exchange for the assumption of the Predecessor Fund’s stated liabilities by the Fund and shares of beneficial interest of the Fund as of the close of business on May 15, 2020 (the “Reorganization”). Holders of Class A, Class C, Class I, Class L, and Class W Shares of the Predecessor Fund received Class A, Class C, Class I, Class L, and Class W Shares of the Fund. The exchange was a tax-free event to shareholders. The Predecessor Fund was the accounting survivor in the Reorganization, and, as such, the financial statements and financial highlights reflect the financial information of the Predecessor Fund through May 15, 2020. Class D, Class T and Class U Shares of the Predecessor Fund were liquidated prior to the Reorganization.
| 2. SIGNIFICANT ACCOUNTING POLICIES |
The financial statements have been prepared in accordance with accounting principles generally accepted in the United States of America (“GAAP”) and require management to make estimates and assumptions that may affect the reported amounts and disclosures. Actual results may differ from those estimates and assumptions. The Fund is an investment company under GAAP and follows the accounting and reporting guidance applicable to investment companies.
A. Basis of Consolidation for the Fund — DIF Investments LLC and DIF Investments II LLC (each a “Subsidiary” and collectively, the “Subsidiaries”), limited liability companies, were incorporated on February 3, 2020 and March 12, 2020, respectively, and are currently wholly-owned subsidiaries of the Fund. The Subsidiaries act as investment vehicles for the Fund to enable the Fund to gain exposure to certain types of private real estate investments. Under the Amended and Restated Limited Liability Company Agreement of each Subsidiary, shares issued by a Subsidiary confer upon its member the right to participate in the profits or assets of the Subsidiary. All inter-fund balances and transactions have been eliminated in consolidation. As of September 30, 2020, the Fund’s net assets were $287,812,811, of which, $104,480,022, or 36%, are represented by DIF Investments LLC’s net assets and $106,293,675, or 37%, are represented by DIF Investments II LLC’s net assets.
B. Investment Valuation — The Fund’s valuation policy is to value investments at fair value.
C. Investment Income and Investments — Investment income includes interest income, dividend income, net of any foreign withholding taxes, and less any amounts reclaimable. Interest income is accrued daily and adjusted for amortization of premiums and accretion of discounts. Dividend income is recognized on ex-dividend date or, for certain foreign securities, as soon as such information is obtained subsequent to the ex-dividend date. Non-cash dividends, if any, are recorded at the fair market value of the securities received. Investment transactions are reflected on trade date with the exception of capital calls, which are recorded on due date. Realized gains and losses are calculated using identified cost. Investment transactions are recorded on the following business day for daily net asset value (“NAV”) calculations. Distributions received from the Fund’s investments in U.S. real estate investment trusts (“REITs”) may be characterized as ordinary income, net capital gain and/or a return of capital. A return of capital is recorded by the Fund as a reduction to the cost basis of the REIT.
D. Class Allocations and Expenses — Expenses incurred by the Fund, which may not specifically relate to the Fund, may be shared with other registered investment companies having management agreements with GSAM or its affiliates, as appropriate.
21
GOLDMAN SACHS REAL ESTATE DIVERSIFIED INCOME FUND
Consolidated Notes to Financial Statements (continued)
September 30, 2020
| 2. SIGNIFICANT ACCOUNTING POLICIES (continued) |
These expenses are allocated to the Fund on a straight-line and/or pro-rata basis depending upon the nature of the expenses and are accrued daily. Class specific expenses, where applicable, are borne by the respective share classes and include Distribution Service and Shareholder Services fees.
E. Federal Taxes and Distributions to Shareholders — It is the Fund’s policy to comply with the requirements of the Internal Revenue Code of 1986, as amended (the “Code”), applicable to regulated investment companies and to distribute each year substantially all of its investment company taxable income and capital gains to its shareholders. Accordingly, the Fund is not required to make any provisions for the payment of federal income tax. Distributions to shareholders are recorded on the ex-dividend date. The Fund currently intends to make regular quarterly cash distributions of all or a portion of its net investment income to shareholders. The Fund will pay shareholders at least annually all or substantially all of its net investment income after the payment of interest, fees or dividends, if any, owed with respect to any forms of leverage used by the Fund. The Fund intends to pay any capital gains distributions at least annually. In order to permit the Fund to maintain more stable quarterly distributions, the distributions paid by the Fund may be more or less than the amount of net distributable earnings actually earned by the Fund. These distributions could include a return of a shareholder’s invested capital which would reduce the Fund’s NAV. The Fund estimates that only a portion of the distributions paid to shareholders will be treated as dividend income. The remaining portion of the Fund’s distribution, which may be significant, is expected to be a return of capital. These estimates are based on the Fund’s operating results during the period, and their final federal income tax characterization that may differ. The characterization of distributions to shareholders for financial reporting purposes is determined in accordance with federal income tax rules, which may differ from GAAP.
| 3. INVESTMENTS AND FAIR VALUE MEASUREMENTS |
U.S. GAAP defines the fair value of a financial instrument as the amount that would be received to sell an asset or paid to transfer a liability in an orderly transaction between market participants at the measurement date (i.e., the exit price); the Fund’s policy is to use the market approach. GAAP establishes a fair value hierarchy that prioritizes the inputs to valuation techniques used to measure fair value. The hierarchy gives the highest priority to unadjusted quoted prices in active markets for identical assets or liabilities (Level 1 measurements) and the lowest priority to unobservable inputs (Level 3 measurements). The level in the fair value hierarchy within which the fair value measurement in its entirety falls shall be determined based on the lowest level input that is significant to the fair value measurement in its entirety. The levels used for classifying investments are not necessarily an indication of the risk associated with investing in these investments. The three levels of the fair value hierarchy are described below:
Level 1 — Unadjusted quoted prices in active markets that are accessible at the measurement date for identical, unrestricted assets or liabilities;
Level 2 — Quoted prices in markets that are not active or financial instruments for which significant inputs are observable (including, but not limited to, quoted prices for similar investments, interest rates, foreign exchange rates, volatility and credit spreads), either directly or indirectly;
Level 3 — Prices or valuations that require significant unobservable inputs (including GSAM’s assumptions in determining fair value measurement).
The Board of Trustees (“Trustees”) has approved Valuation Procedures that govern the valuation of the portfolio investments held by the Fund, including investments for which market quotations are not readily available. The Trustees have delegated to GSAM day-to-day responsibility for implementing and maintaining internal controls and procedures related to the valuation of the Fund’s investments. To assess the continuing appropriateness of pricing sources and methodologies, GSAM regularly performs price verification procedures and issues challenges as necessary to third party pricing vendors or brokers, and any differences are reviewed in accordance with the Valuation Procedures.
A. Level 1 and Level 2 Fair Value Investments — The valuation techniques and significant inputs used in determining the fair values for investments classified as Level 1 and Level 2 are as follows:
Equity Securities — Equity securities traded on a United States (“U.S.”) securities exchange or the NASDAQ system, or those located on certain foreign exchanges, including but not limited to the Americas, are valued daily at their last sale price or official
22
GOLDMAN SACHS REAL ESTATE DIVERSIFIED INCOME FUND
| 3. INVESTMENTS AND FAIR VALUE MEASUREMENTS (continued) |
closing price on the principal exchange or system on which they are traded. If there is no sale or official closing price or such price is believed by GSAM to not represent fair value, equity securities may be valued at the closing bid price for long positions and at the closing ask price for short positions. To the extent these investments are actively traded, they are classified as Level 1 of the fair value hierarchy, otherwise they are generally classified as Level 2. Certain equity securities containing unique attributes may be classified as Level 2.
Unlisted equity securities for which market quotations are available are valued at the last sale price on the valuation date, or if no sale occurs, at the last bid price for long positions or the last ask price for short positions, and are generally classified as Level 2.
Money Market Funds — Investments in the Goldman Sachs Financial Square Government Fund (“Underlying Fund”) are valued at the NAV on the day of valuation. These investments are generally classified as Level 1 of the fair value hierarchy. Prior to the Reorganization, the Fund invested in the Dreyfus Treasury Cash Management Fund. For information regarding an Underlying Fund’s accounting policies and investment holdings, please see the Underlying Fund’s shareholder report.
Derivative Contracts — A derivative is an instrument whose value is derived from underlying assets, indices, reference rates or a combination of these factors. The Fund enters into derivative transactions to hedge against changes in interest rates, securities prices, and/or currency exchange rates, to increase total return, or to gain access to certain markets or attain exposure to other underliers. For financial reporting purposes, cash collateral that has been pledged to cover obligations of the Fund and cash collateral received, if any, is reported separately on the Statement(s) of Assets and Liabilities as receivables/payables for collateral on certain derivatives contracts. Non-cash collateral pledged by a (the) Fund, if any, is noted in the Consolidated Schedule of Investments.
Exchange-traded derivatives, including futures and options contracts, are valued at the last sale or settlement price on the exchange where they are principally traded. Exchange-traded options without settlement prices are generally valued at the midpoint of the bid and ask prices on the exchange where they are principally traded (or, in the absence of two-way trading, at the last bid price for long positions and the last ask price for short positions). Exchange-traded derivatives typically fall within Level 1 of the fair value hierarchy.
i. Options Contracts — When the Fund writes call or put options contracts, an amount equal to the premium received is recorded as a liability and is subsequently marked-to-market to reflect the current value of the option written. Swaptions are options on certain swap contracts.
Upon the purchase of a call or put option by the Fund, the premium paid is recorded as an investment and subsequently marked-to-market to reflect the current value of the option. Certain options may be purchased with premiums to be determined on a future date. The premiums for these options are based upon implied volatility parameters at specified terms.
B. Level 3 Fair Value Investments — To the extent that significant inputs to valuation models and other alternative pricing sources are unobservable, or if quotations are not readily available, or if GSAM believes that such quotations do not accurately reflect fair value, the fair value of the Fund’s investments may be determined under Valuation Procedures approved by the Trustees. GSAM, consistent with its procedures and applicable regulatory guidance, may make an adjustment to the most recent valuation prices of either domestic or foreign securities in light of significant events to reflect what it believes to be the fair value of the securities at the time of determining the Fund’s NAV. To the extent investments are valued using single source broker quotations obtained directly from the broker or passed through from third party pricing vendors, such investments are classified as Level 3 investments. The valuation techniques and significant inputs used in determining the fair values for investments classified as Level 3 are as follows:
Public Non-Traded REITs — Public Non-Traded Real Estate Investment Trusts (“Public Non-Traded REITs”) do not report NAVs on a timely basis and therefore cannot be valued using the practical expedient methodology. GSAM determines the fair value of Public Non-Traded REITs by adjusting the most recent NAV for each Public Non-Traded REIT, as necessary, by the change in a relevant proxy that the Valuation Committee has deemed to be representative of the market.
C. Other Fair Valuation Investments — Prices or valuations that require significant unobservable inputs (including assumptions in determining fair value measurement).
The fair valuation technique depends on the investment characteristics and the availability of observable inputs. Investments are classified within the level of the lowest significant input considered in determining fair value. GSAM uses NAV as its measure of fair values for investments in LP/LLC interests when (i) the investment does not have a readily determinable fair value and
23
GOLDMAN SACHS REAL ESTATE DIVERSIFIED INCOME FUND
Consolidated Notes to Financial Statements (continued)
September 30, 2020
| 3. INVESTMENTS AND FAIR VALUE MEASUREMENTS (continued) |
(ii) the NAV of the investment is calculated in a manner consistent with the measurement principles of investment company accounting, including measurement of the underlying investments at fair value. In evaluating the level at which the investments have been classified, GSAM has assessed factors including, but not limited to, price transparency. An investment in LP/LLC interests using NAV as its measure of fair value is excluded from the fair value hierarchy.
The fair value technique and type of valuation input varies by investment type as follows:
Private REITs — Private Real Estate Investment Trusts (“Private REITs”) report their investment assets at fair value, and typically report a NAV on a calendar quarter basis. In accordance with Accounting Standards Codification (“ASC”) 820-10, the Fund has elected to apply the practical expedient methodology and to value its investments in Private REITs at their respective NAVs typically at each quarter. For non-calendar quarter days, GSAM estimates the fair value of each Private REIT by adjusting the most recent NAV for each Private REIT, as necessary, by the change in a relevant proxy that the Valuation Committee has deemed to be representative of the market.
Private Investment Funds — Private investment funds (“Private Investment Funds”) measure their investment assets at fair value, and typically report a NAV per share on a calendar quarterly basis. In accordance with ASC 820-10, the Fund has elected to apply the practical expedient methodology and to value its investments in Private Investment Funds at their respective NAVs typically at each quarter. For non-calendar quarter days, GSAM determines the fair value of each Private Investment Fund by adjusting the most recent NAV for each Private Investment Fund, as necessary, by the change in a relevant proxy that the Valuation Committee has deemed to be representative of the market.
D. Fair Value Hierarchy — The following is a summary of the Fund’s investments classified in the fair value hierarchy as of September 30, 2020:
| REAL ESTATE DIVERSIFIED INCOME FUND |
| |||||||||||||||
| Investment Type | Level 1 | Level 2 | Level 3 | Total | ||||||||||||
| Assets | ||||||||||||||||
Common Stock and/or Other Equity Investments(a) | ||||||||||||||||
North America | $ | 41,724,514 | $ | 25,145,931 | $ | 1,521,516 | $ | 68,391,961 | ||||||||
Investment Company | 9,993,327 | — | — | 9,993,327 | ||||||||||||
| Subtotal | $ | 51,717,841 | $ | 25,145,931 | $ | 1,521,516 | $ | 78,385,288 | ||||||||
Investments measured at NAV | 204,998,853 | |||||||||||||||
| Total | $ | 283,384,141 | ||||||||||||||
| (a) | Amounts are disclosed by continent to highlight the impact of time zone differences between local market close and the calculation of net asset value. Security valuations are based on the principal exchange or system on which they are traded, which may differ from country of domicile. |
The following is a reconciliation of Level 3 investments for the fiscal year ended September 30, 2020:
| Public Non-Traded Real Estate Investment Trusts | ||||
Beginning Balance as of October 1, 2019 | $ | 2,742,036 | ||
Realized gain (loss) | 10,377 | |||
Net change in unrealized gain (loss) relating to instruments still held at reporting date | (1,129,791 | ) | ||
Purchases | — | |||
Sales | (101,106 | ) | ||
Transfers in (out) of Level 3 | — | |||
| Ending Balance as of September 30, 2020 | $ | 1,521,516 | ||
24
GOLDMAN SACHS REAL ESTATE DIVERSIFIED INCOME FUND
| 3. INVESTMENTS AND FAIR VALUE MEASUREMENTS (continued) |
Significant unobservable valuation inputs for material Level 3 investments as of September 30, 2020 are as follows:
| Fair Value at 9/30/2020 | Valuation Techniques | Unobservable Input | Range | |||||||||||||
Public Non-Traded Real Estate Investment Trusts | $ | 1,521,516 | Net Asset Value | Proprietary Benchmark | 106.48-130.48 | |||||||||||
A change to the unobservable input may result in a significant change to the value of the investments as follows:
| Unobservable Input | Impact to Value if Input Increases | Impact to Value if Input Decreases | ||
Proprietary Benchmark | Increase | Decrease | ||
Proprietary benchmarks are comprised of comparable real estate investments. For further information regarding security characteristics, see the Consolidated Schedule of Investments.
| 4. INVESTMENTS IN DERIVATIVES |
The following tables set forth, by certain risk types, the Fund’s gains (losses) related to these derivatives and their indicative volumes for the fiscal year ended September 30, 2020. These gains (losses) should be considered in the context that these derivative contracts may have been executed to create investment opportunities and/or economically hedge certain investments, and accordingly, certain gains (losses) on such derivative contracts may offset certain (losses) gains attributable to investments. These gains (losses) are included in “Net realized gain (loss)” or “Net change in unrealized gain (loss)” on the Consolidated Statement of Operations:
| Risk | Consolidated Statement of Operations | Net Realized Gain (Loss) | Net Change in Unrealized Gain (Loss) | Average Volume of Contracts(a) | ||||||||||
| Equity | Net realized gain (loss) from purchased options/ Net change in unrealized gain (loss) on purchased options | $ | (2,083,273 | ) | $ | 136,900 | 3,158 | |||||||
| Net realized gain (loss) from written options/ Net change in unrealized gain (loss) on written options | $ | (325,501 | ) | $ | 247,584 | 5,958 | ||||||||
| (a) | Average number of contracts is based on the month end balances for the fiscal year ended September 30, 2020. |
| 5. AGREEMENTS AND AFFILIATED TRANSACTIONS |
A. Management Agreement — Under the Agreement, GSAM manages the Fund, subject to the general supervision of the Trustees.
As compensation for the services rendered pursuant to the Agreement, the assumption of the expenses related thereto and administration of the Fund’s business affairs, including providing facilities, GSAM is entitled to a management fee, accrued daily and paid monthly, equal to an annual percentage rate of 1.25% of the Fund’s average daily net assets for the fiscal year ended September 30, 2020.
Prior to the Reorganization, Resource Real Estate, LLC (“Resource Adviser”) served as investment adviser to the Predecessor Fund pursuant to an investment advisory agreement with the Predecessor Fund. Under that agreement, the Resource Adviser was entitled to a monthly management fee computed at the annual rate of 1.25% of the daily net assets of the Predecessor Fund.
The Fund invests in Institutional Shares of the Goldman Sachs Financial Square Government Fund, which is an affiliated Underlying Fund. GSAM has agreed to waive a portion of its management fee payable by the Fund in an amount equal to the management fee it earns as an investment adviser to the affiliated Underlying Fund in which the Fund invests. For the fiscal year ended September 30, 2020, GSAM waived $6,892 of the Fund’s management fee.
B. Compliance Services — Prior to the Reorganization and pursuant to a Compliance Services Agreement between the Predecessor Fund and Resource America, Inc. (acting together with the Resource Adviser and certain other affiliates (collectively, “Resource”)), dated March 1, 2018 (the “CSA”), Resource provided compliance services to the Predecessor Fund. The services under the CSA were designed to ensure compliance by the Predecessor Fund with its investment objectives, policies and restrictions.
25
GOLDMAN SACHS REAL ESTATE DIVERSIFIED INCOME FUND
Consolidated Notes to Financial Statements (continued)
September 30, 2020
| 5. AGREEMENTS AND AFFILIATED TRANSACTIONS (continued) |
The CSA also covered, among other items, services associated with monitoring the Predecessor Fund’s compliance with its policies and procedures and applicable federal, state and foreign securities laws and the rules and regulations thereunder. The CSA was terminated as part of the Reorganization Agreement and GSAM assumed all compliance services responsibilities for which a separate fee is not charged to the Predecessor Fund.
In return for the services previously provided under the CSA, the Predecessor Fund paid Resource a flat, annual fee of $200,000, payable monthly in twelve (12) equal installments (the “Flat Fee”), provided that each such monthly installment of the Flat Fee did not exceed a monthly fee calculated at an annual rate of 0.10% of the Predecessor Fund’s average daily net assets.
C. Distribution and/or Service (12b-1) Plans — Prior to the Reorganization, the prior Board of Trustees adopted, on behalf of the Predecessor Fund, a shareholder servicing plan under which the Predecessor Fund may compensate financial industry professionals for providing ongoing services in respect of clients with whom they have distributed shares of the Predecessor Fund. Under the shareholder servicing plan, the Predecessor Fund’s Class A, Class C, Class W, Class U, Class T, Class D and Class L shares were subject to a shareholder servicing fee at an annual rate of 0.25% of the average daily net assets attributable to that share class. The Class C, Class T and Class L shares also paid to the prior distributor (ALPS Distributors, Inc.) a distribution fee, payable under a distribution plan adopted by the prior Board of Trustees, that accrued at an annual rate equal to 0.75%, 0.75% and 0.25%, respectively, of the Predecessor Fund’s average daily net assets attributable to Class C, Class T and Class L shares, respectively, and was payable on a quarterly basis. In addition, Class D shares paid to Resource Securities LLC (the “Dealer Manager”), an affiliate of the Resource Adviser, a dealer manager fee, payable under a distribution plan adopted by the Board, that accrued at an annual rate equal to 0.50% of the Fund’s average daily net assets attributable to Class D shares and was payable on a quarterly basis.
The Fund, on behalf of its Class A, Class C, Class L and Class W Shares of the Fund, has adopted a Distribution and Service Plan subject to Rule 12b-1 under the Act. Under the Distribution and Service Plan, Goldman Sachs & Co. LLC, which serves as distributor (the “Distributor”), is entitled to a fee accrued daily and paid monthly, for distribution services and personal and account maintenance services, which may then be paid by the Distributor to authorized dealers. These fees are equal to an annual percentage rate of the average daily net assets attributable to Class A, Class C, Class L and Class W Shares of the Fund, as applicable, and were equal to an annual percentage rate of the average daily net assets attributable to Class D, Class T, and Class U Shares as set forth below:
| Share Class | Distribution Services | Shareholder Services | Maximum Distribution- Related and Shareholder Services | |||||||||||
Class A | 0.25 | % | 0.25 | % | 0.25 | % | ||||||||
Class C | 0.75 | % | 0.25 | % | 1.00 | % | ||||||||
Class D* | 0.50 | % | 0.25 | % | 0.75 | % | ||||||||
Class L | 0.25 | % | 0.25 | % | 0.50 | % | ||||||||
Class T* | 0.75 | % | 0.25 | % | 1.00 | % | ||||||||
Class U* | — | 0.25 | % | 0.25 | % | |||||||||
Class W | 0.25 | % | 0.25 | % | 0.25 | % | ||||||||
| * | Class D, Class T and Class U Shares of the Predecessor Fund liquidated prior to the Reorganization. |
D. Distribution Agreement — Goldman Sachs, as Distributor of the shares of the Fund pursuant to a Distribution Agreement, may retain a portion of the Class A and Class L Shares’ front end sales charge and Class A and Class C Shares’ CDSC. During the fiscal year ended September 30, 2020, Goldman Sachs retained $588 for Class A Shares and did not retain any portion of the CDSC for Class C Shares for this Fund.
Prior to the Reorganization, ALPS Distributors, Inc., as distributor of the shares of the Predecessor Fund, was authorized to retain a portion of the Class A and Class L Shares’ front end sales charge and Class A and Class C Shares’ CDSC. During the fiscal year ended September 30, 2020, no fees were retained by ALPS Distributors, Inc.
E. Transfer Agency Agreement — Goldman Sachs also serves as the transfer agent of the Fund for a fee pursuant to the Transfer Agency Agreement. The fees charged for such transfer agency and dividend disbursing services are accrued daily and
26
GOLDMAN SACHS REAL ESTATE DIVERSIFIED INCOME FUND
| 5. AGREEMENTS AND AFFILIATED TRANSACTIONS (continued) |
paid monthly at an annual rate of 0.14% of the Fund’s average daily net assets. Prior to the Reorganization, DST Systems, Inc. served as the transfer agent for the Predecessor Fund.
F. Other Expense Agreements and Affiliated Transactions — GSAM has agreed to reduce or limit certain “Other Expenses” of the Fund (excluding acquired fund fees and expenses, transfer agency fees and expenses, distribution and service fees, as applicable, taxes, interest, credit facility commitment fees, brokerage fees, expenses of shareholder meetings, litigation and indemnification and extraordinary expenses) to the extent such expenses exceed, on an annual basis, a percentage rate of the average daily net assets of the Fund. Such Other Expense reimbursements, if any, are accrued daily and paid monthly. In addition, the Fund is not obligated to reimburse GSAM for prior fiscal year expense reimbursements, if any. The Other Expense limitations as an annual percentage rate of average daily net assets for the Fund is 0.354%. These Other Expense limitations will remain in place through at least May 18, 2021, and prior to such date GSAM may not terminate the arrangements without the approval of the Trustees. In addition, the Fund has entered into certain offset arrangements with the transfer agent, which may result in a reduction of the Fund’s expenses and are received irrespective of the application of the “Other Expense” limitations described above. Such Other Expense reimbursements, if any, are accrued daily and paid monthly and are disclosed in the Consolidated Statement of Operations for the fiscal year ended September 30, 2020.
Prior to the Reorganization, the Resource Adviser had contractually agreed to waive all or part of its advisory fees and/or make payments to limit the Predecessor Fund’s expenses (excluding interest, dividend expense, amortization/accretion on securities sold short, brokerage commissions, acquired fund fees and expenses and extraordinary expenses) at least until January 31, 2021, such that the total annual operating expenses of the Predecessor Fund did not exceed 1.99% per annum of Class A shares’ average daily net assets, 2.74% per annum of Class C shares’ average daily net assets, 1.99% per annum of Class W shares’ average daily net assets, 1.74% per annum of Class I shares’ average daily net assets, 1.99% per annum of Class U shares’ average daily net assets, 2.74% per annum of Class T shares’ average daily net assets, 2.49% per annum of Class D shares’ average daily net assets and 2.24% per annum of Class L shares’ average daily net assets. Fee waivers and expense payments were formerly available to be recouped by the Resource Adviser from the Predecessor Fund within three years of when the amounts were waived or reimbursed, to the extent that overall expenses fell below the expense limitation. During the year ended September 30, 2020, the Resource Adviser waived fees and reimbursed expenses of $300,041 and recouped $40,517 of expenses pursuant to its contractual agreement. As part of the Reorganization Agreement, the above expense limitation agreements with the Resource Adviser were terminated and replaced with an Other Expense arrangement with GSAM, as described above.
G. Other Transactions with Affiliates — For the fiscal year ended September 30, 2020, Goldman Sachs did not earn any brokerage commissions from portfolio transactions on behalf of the Fund.
H. Financing Agreement — The Fund has entered into secured revolving bank line of credit facilities (each a “Credit Facility” and collectively the “Credit Facilities”) with major U.S. financial institutions for the purpose of investment purchases subject to the limitations of the Act for borrowings. The current Credit Facility provides for borrowings in an aggregate amount up to $35,000,000 for the Fund. Borrowings under the Credit Facilities, which are secured by certain assets of the Fund, bear interest. The interest rates are based on variable rates (i.e., LIBOR) plus market spreads. The Fund currently pays an unused commitment fee of 0.20% per annum. Interest is accrued daily and paid quarterly. Prior to the Reorganization, the Predecessor Fund had entered into a Credit Facility with a major U.S. financial institution for the purpose of investment purchases subject to the limitations of the Act for borrowings which was terminated in conjunction with the Reorganization.
The Fund had an average outstanding balance and weighted average annual interest rate for the period of $34,865,657 and 2.58%, respectively. As of September 30, 2020, there were no outstanding borrowings under the Credit Facility.
| 6. PORTFOLIO SECURITIES TRANSACTIONS AND UNFUNDED COMMITMENTS |
The cost of purchases and proceeds from sales and maturities of long-term securities for the fiscal year ended September 30, 2020, were $178,781,032 and $261,230,031.
27
GOLDMAN SACHS REAL ESTATE DIVERSIFIED INCOME FUND
Consolidated Notes to Financial Statements (continued)
September 30, 2020
| 6. PORTFOLIO SECURITIES TRANSACTIONS AND UNFUNDED COMMITMENTS (continued) |
As of September 30, 2020, the unfunded commitments for investments currently held as of the reporting date are disclosed in the Consolidated Schedule of Investments footnote disclosures. The Fund had no unfunded commitments relating to potential future investments not currently held as of the reporting date. The value of unfunded commitments for investments currently held as of September 30, 2020 approximates fair value.
| 7. TAX INFORMATION |
The tax character of distributions paid during the fiscal years ended September 30, 2020 and 2019 was as follows:
| 2020 | 2019 | |||||||
Distribution paid from: | ||||||||
Ordinary income | $ | 7,555,464 | $ | 8,732,190 | ||||
Net long-term capital gains | 9,459,525 | 4,726,274 | ||||||
Total taxable distributions | $ | 17,014,989 | $ | 13,458,464 | ||||
Tax return of capital | $ | 5,688,027 | $ | 3,904,241 | ||||
As of September 30, 2020, the components of accumulated earnings (losses) on a tax-basis were as follows:
| Real Estate Diversified Income Fund | ||||
Timing differences: | ||||
Late Year Ordinary Loss Deferral | $ | (2,869,672 | ) | |
Post October Capital Loss Deferral | (8,417,956 | ) | ||
Unrealized gains (losses) — net | 8,086,904 | |||
Total accumulated earnings (losses) net | $ | (3,200,724 | ) | |
As of September 30, 2020, the Fund’s aggregate security unrealized gains and losses based on cost for U.S. federal income tax purposes were as follows:
Tax Cost | $ | 277,244,042 | ||
Gross unrealized gain | 22,067,629 | |||
Gross unrealized loss | (13,980,725 | ) | ||
Net unrealized gains (losses) on securities | $ | 8,086,904 |
The difference between GAAP-basis and tax basis unrealized gains (losses) is attributable primarily to wash sales and differences in the tax treatment of partnership investments.
GSAM has reviewed the Fund’s tax positions for all open tax years (the current and prior three years, as applicable) and has concluded that no provision for income tax is required in the Fund’s financial statements. Such open tax years remain subject to examination and adjustment by tax authorities.
| 8. REPURCHASE OFFERS |
The Fund has adopted the following fundamental policies, which cannot be changed without the vote of a majority of Fund shareholders, in order to repurchase its shares:
| ∎ | On a quarterly basis, in the months of March, June, September and December, the Fund will make an offer to repurchase a designated percentage of the outstanding shares from shareholders (a “Repurchase Offer”), pursuant to Rule 23c-3 under the Act, as it may be amended from time to time. |
28
GOLDMAN SACHS REAL ESTATE DIVERSIFIED INCOME FUND
| 8. REPURCHASE OFFERS (continued) |
| ∎ | The Fund will repurchase only shares that are tendered by the deadline for such repurchase request (“Repurchase Request Deadline”). The Board will establish the Repurchase Request Deadline for each Repurchase Offer, but such date may be revised by the Fund’s officers, in their sole discretion, based on factors such as market conditions, the level of the Fund’s assets and shareholder servicing considerations provided that the Board is notified of this change and the reasons for it. |
| ∎ | There will be a maximum 14 calendar day period (or the next business day if the 14th calendar day is not a business day) between the Repurchase Request Deadline and the day on which shares eligible for repurchase are priced. |
The Fund may also make discretionary repurchase offers in addition to the quarterly Repurchase Offer period once every two years.
Repurchase Offer Amounts. Each quarter, the Fund’s Board, in its sole discretion, will determine the number of shares that the Fund will offer to repurchase (the “Repurchase Offer Amount”) for a particular Repurchase Offer. The Repurchase Offer Amount will be at least 5% but not more than 25% of the total number of shares outstanding on the Repurchase Request Deadline. In connection with any given Repurchase Offer, it is possible that the Fund may offer to repurchase only the minimum amount of 5% of its outstanding Shares on the Repurchase Request Deadline. If shareholders tender more than the Repurchase Offer Amount for a particular Repurchase Offer, the Board may determine to increase the Repurchase Offer Amount by up to an additional 2% of the Shares outstanding on the Repurchase Request Deadline.
During the year ended September 30, 2020, the Fund completed four quarterly repurchase offers. In these offers, the Fund offered to repurchase up to 5% of the number of its outstanding shares (up to 7% at the discretion of the officers of the Fund) as of the Repurchase Pricing Dates. The shareholder repurchase requests received by the Fund in good order by the January 15, 2020, April 15, 2020 and July 15, 2020 Repurchase Request Deadlines exceeded the number of shares of the Fund subject to the repurchase offer and as such, the Fund determined to repurchase shares on a pro rata basis. Accordingly, the Fund repurchased approximately 64%, 90% and 60%, respectively, of the total number of shares tendered for repurchase. The result of those repurchase offers were as follows:
| Repurchase Offer #1 | Repurchase Offer #2 | Repurchase Offer #3 | Repurchase Offer #4 | |||||||||||||
Commencement Date | September 16, 2019 | December 16, 2019 | March 16, 2020 | June 15, 2020 | ||||||||||||
Repurchase Request Deadline | October 16, 2019 | January 15, 2020 | April 15, 2020 | July 15, 2020 | ||||||||||||
Repurchase Pricing Date | October 16, 2019 | January 15, 2020 | April 15, 2020 | July 15, 2020 | ||||||||||||
Shares Tendered for Repurchase | 770,059 | 2,707,670 | 2,611,520 | 2,659,084 | ||||||||||||
Shares Repurchased | 770,059 | 1,729,727 | 2,358,967 | 1,597,045 | ||||||||||||
| 9. OTHER RISKS |
The Fund’s risks include, but are not limited to, the following:
Derivatives Risk — The Fund’s use of derivatives may result in loss. Derivative instruments, which may pose risks in addition to and greater than those associated with investing directly in securities, currencies or other instruments, may be illiquid or less liquid, volatile, difficult to price and leveraged so that small changes in the value of the underlying instruments may produce disproportionate losses to the Fund. Derivatives are also subject to counterparty risk, which is the risk that the other party in the transaction will not fulfill its contractual obligation. The use of derivatives is a highly specialized activity that involves investment techniques and risks different from those associated with investments in more traditional securities and instruments. Losses from derivatives can also result from a lack of correlation between changes in the value of derivative instruments and the portfolio assets (if any) being hedged.
29
GOLDMAN SACHS REAL ESTATE DIVERSIFIED INCOME FUND
Consolidated Notes to Financial Statements (continued)
September 30, 2020
| 9. OTHER RISKS (continued) |
Industry Concentration Risk — The Fund concentrates its investments in the real estate industry, which has historically experienced substantial price volatility. Concentrating Fund investments in a limited number of issuers conducting business in the same industry will subject the Fund to a greater risk of loss as a result of adverse economic, business, political, environmental or other developments than if their investments were diversified across different industries. The value of companies engaged in the real estate industry is affected by (i) changes in general economic and market conditions; (ii) changes in the value of real estate properties; (iii) risks related to local economic conditions, overbuilding and increased competition; (iv) increases in property taxes and operating expenses; (v) changes in zoning laws; (vi) casualty and condemnation losses; (vii) variations in rental income, neighborhood values or the appeal of property to tenants; (viii) the availability of financing and (ix) changes in interest rates and leverage. There are also special risks associated with particular subindustries, or real estate operations generally.
Investments in Other Investment Companies Risk — As a shareholder of another investment company, the Fund will indirectly bear its proportionate share of any net management fees and other expenses paid by such other investment companies, in addition to the fees and expenses regularly borne by the Fund.
Leverage Risk — The Fund may use leverage to seek to achieve its investment objectives. The use of leverage creates an opportunity for increased net investment income dividends, but also creates risks for the investors. There is no assurance that the Fund’s intended leveraging strategy will be successful. Leverage involves risks and special considerations, including the likelihood of greater volatility of NAV, market price and dividend rate than a comparable portfolio without leverage; the risk that fluctuations in interest rates on borrowings and short-term debt or in the interest or dividend rates on any leverage that the Fund must pay will reduce the Fund’s return; the effect of leverage in a declining market, which is likely to cause a greater decline in the NAV than if the Fund were not leveraged, which may result in a greater decline in the market price; and that leverage may increase operating costs, which may reduce total return.
Liquidity Risk — The Fund may make investments that are illiquid or that may become less liquid in response to market developments or adverse investor perceptions. Illiquid investments may be more difficult to value.
Market and Credit Risks — In the normal course of business, the Fund trades financial instruments and enters into financial transactions where risk of potential loss exists due to changes in the market (market risk). The value of the securities in which the Fund invests may go up or down in response to the prospectus of individual companies, particular sectors or governments and/or general economic conditions throughout the world due to increasingly interconnected global economies and financial markets. Events such as war, acts of terrorism, social unrest, natural disasters, the spread of infectious illness or other public health threats could also significantly impact the Fund and its investments. The Fund may utilize leverage, which magnifies the market risk. Additionally, the Fund may also be exposed to credit risk in the event that an issuer or guarantor fails to perform or that an institution or entity with which the Fund has unsettled or open transactions defaults.
Private Real Estate Investment Funds Risk — The Fund’s performance depends in part upon the performance of the applicable private real estate investment fund managers and selected strategies, the adherence by such private real estate investment fund managers to such selected strategies, the instruments used by such private real estate investment fund managers and the Investment Adviser’s ability to select private real estate investment fund managers and strategies and effectively allocate Fund assets among them. Fund shareholders will bear two layers of fees and expenses: asset-based fees and expenses at the Fund level, and asset-based fees, incentive allocations or fees and expenses at the private real estate investment fund level.
The Fund’s investments in certain private real estate investment funds may be subject to lock-up periods, during which the Fund may not withdraw its investment. Many of the Fund’s assets will be priced in the absence of a readily available market and may be priced based on determinations of fair value, which may prove to be inaccurate. The Fund, upon its redemption of all or a portion of its interest in a private real estate investment fund, may receive an in-kind distribution of securities that are illiquid or difficult to value and difficult to dispose of. Private real estate investment funds are not publicly traded and therefore are not liquid investments. Private real estate investment funds may make significant use of leverage, which has the potential to magnify losses versus funds that do not employ leverage.
30
GOLDMAN SACHS REAL ESTATE DIVERSIFIED INCOME FUND
| 9. OTHER RISKS (continued) |
Private REIT Risk — In addition to the risks described in “Private Real Estate Investment Fund Risk” and “REIT Risk,” Private REITs are typically smaller and financially less stable than Public REITs. Private REITs are unlisted, making them hard to value and trade. Moreover, private REITs generally are exempt from Securities Act registration and, as such, are not subject to the same disclosure requirements as Public REITs, which makes private REITs more difficult to evaluate from an investment perspective.
REIT Risk — Investing in REITs involves certain unique risks in addition to those risks associated with investing in the real estate industry in general. REITs whose underlying properties are concentrated in a particular industry or geographic region are also subject to risks affecting such industries and regions. The securities of REITs involve greater risks than those associated with larger, more established companies and may be subject to more abrupt or erratic price movements because of interest rate changes, economic conditions and other factors. REITs may also fail to qualify for tax free pass- through of income or may fail to maintain their exemptions from investment company registration. Securities of such issuers may lack sufficient market liquidity to enable the Fund to effect sales at an advantageous time or without a substantial drop in price.
Repurchase Offers Risk — The Fund operates as an “interval fund,” and, in order to provide some liquidity to shareholders, will make quarterly offers to repurchase a percentage of its outstanding shares at NAV, pursuant to Rule 23c-3 under the Act. The repurchase of shares by the Fund would decrease the assets of the Fund and, therefore, may have the effect of increasing the Fund’s expense ratio. Repurchase offers and the need to fund repurchase obligations may also affect the ability of the Fund to be fully invested or force the Fund to maintain a higher percentage of its assets in liquid investments, which may harm the Fund’s investment performance. In addition, the Fund may be required to sell portfolio securities (including at inopportune times) to satisfy repurchase requests, resulting in increased transaction costs that must be borne by the Fund and its shareholders. This may result in higher short-term capital gains for taxable shareholders.
If a repurchase offer is oversubscribed and the Fund determines not to repurchase additional shares beyond the repurchase offer amount, or if shareholders tender an amount of shares greater than that which the Fund is entitled to purchase, the Fund will repurchase the shares tendered on a pro rata basis, and shareholders will have to wait until the next repurchase offer to make another repurchase request. Shareholders will be subject to the risk of NAV fluctuations during that period. Thus, there is also a risk that some shareholders, in anticipation of proration, may tender more shares than they wish to have repurchased in a particular quarter, thereby increasing the likelihood that proration will occur.
| 10. INDEMNIFICATIONS |
Under the Fund’s organizational documents, its Trustees, officers, employees and agents are indemnified, to the extent permitted by the Act and state law, against certain liabilities that may arise out of performance of their duties to the Fund. Additionally, in the course of business, the Fund enters into contracts that contain a variety of indemnification clauses. The Fund’s maximum exposure under these arrangements is unknown, as this would involve future claims that may be made against the Fund that have not yet occurred. However, GSAM believes the risk of loss under these arrangements to be remote.
31
GOLDMAN SACHS REAL ESTATE DIVERSIFIED INCOME FUND
Consolidated Notes to Financial Statements (continued)
September 30, 2020
| 11. SUMMARY OF SHARE TRANSACTIONS |
Share activity is as follows:
| For the Fiscal Year Ended September 30, 2020 | For the Fiscal Year Ended September 30, 2019 | |||||||||||||||
| Shares | Dollars | Shares | Dollars | |||||||||||||
|
| |||||||||||||||
| Class A Shares | ||||||||||||||||
Shares sold | 1,998,339 | $ | 21,191,071 | 1,248,889 | $ | 13,039,162 | ||||||||||
Reinvestment of distributions | 308,912 | 3,000,565 | 243,649 | 2,516,605 | ||||||||||||
Shares repurchased | (1,971,176 | ) | (19,394,216 | ) | (780,112 | ) | (8,132,489 | ) | ||||||||
Net transferred in/(out)* | — | — | (21,132 | ) | (218,915 | ) | ||||||||||
| 336,075 | 4,797,420 | 691,294 | 7,204,363 | |||||||||||||
| Class C Shares | ||||||||||||||||
Shares sold | 1,464,768 | 15,464,687 | 1,404,406 | 14,689,128 | ||||||||||||
Reinvestment of distributions | 280,963 | 2,731,301 | 197,254 | 2,037,232 | ||||||||||||
Shares repurchased | (965,849 | ) | (9,498,393 | ) | (406,869 | ) | (4,235,609 | ) | ||||||||
Net transferred in/(out)* | — | — | (168,104 | ) | (1,764,422 | ) | ||||||||||
| 779,882 | 8,697,595 | 1,026,687 | 10,726,329 | |||||||||||||
| Class W Shares | ||||||||||||||||
Shares sold | 543,209 | 5,807,103 | 2,609,999 | 27,638,555 | ||||||||||||
Reinvestment of distributions | 249,890 | 2,471,792 | 283,477 | 2,974,798 | ||||||||||||
Shares repurchased | (4,264,877 | ) | (44,544,454 | ) | (500,980 | ) | (5,313,340 | ) | ||||||||
Net transferred in/(out)* | — | — | (438,774 | ) | (4,687,265 | ) | ||||||||||
| (3,471,778 | ) | (36,265,559 | ) | 1,953,722 | 20,612,748 | |||||||||||
| Class I Shares | ||||||||||||||||
Shares sold | 4,808,202 | 52,340,446 | 2,390,258 | 26,092,038 | ||||||||||||
Reinvestment of distributions | 201,852 | 2,055,770 | 133,482 | 1,443,152 | ||||||||||||
Shares repurchased | (2,375,599 | ) | (24,677,952 | ) | (181,120 | ) | (1,965,835 | ) | ||||||||
Net transferred in/(out)* | — | — | 568,635 | 6,223,099 | ||||||||||||
| 2,634,455 | 29,718,264 | 2,911,255 | 31,792,454 | |||||||||||||
| Class U Shares(a) | ||||||||||||||||
Reinvestment of distributions | 79 | 842 | 18,718 | 193,216 | ||||||||||||
Shares repurchased | (876,681 | ) | (9,379,989 | ) | (172,998 | ) | (1,808,920 | ) | ||||||||
Net transferred in/(out)* | — | — | (58,972 | ) | (618,052 | ) | ||||||||||
| (876,602 | ) | (9,379,147 | ) | (213,252 | ) | (2,233,756 | ) | |||||||||
| Class T Shares(b) | ||||||||||||||||
Reinvestment of distributions | 92 | 976 | 17,735 | 183,528 | ||||||||||||
Shares repurchased | (663,839 | ) | (7,076,446 | ) | (32,736 | ) | (341,048 | ) | ||||||||
Net transferred in/(out)* | — | — | 148,576 | 1,556,738 | ||||||||||||
| (663,747 | ) | (7,075,470 | ) | 133,575 | 1,399,218 | |||||||||||
32
GOLDMAN SACHS REAL ESTATE DIVERSIFIED INCOME FUND
| 11. SUMMARY OF SHARE TRANSACTIONS (continued) |
| For the Fiscal Year Ended September 30, 2020 | For the Fiscal Year Ended September 30, 2019 | |||||||||||||||
| Shares | Dollars | Shares | Dollars | |||||||||||||
|
| |||||||||||||||
| Class D Shares(b) | ||||||||||||||||
Reinvestment of distributions | — | $ | — | 17,828 | $ | 186,784 | ||||||||||
Shares repurchased | (569,179 | ) | (6,175,406 | ) | (35,293 | ) | (374,820 | ) | ||||||||
Net transferred in/(out)* | — | — | (45,610 | ) | (482,114 | ) | ||||||||||
| (569,179 | ) | (6,175,406 | ) | (63,075 | ) | (670,150 | ) | |||||||||
| Class L Shares | ||||||||||||||||
Shares sold | 141,148 | 1,506,835 | 526,390 | 5,532,741 | ||||||||||||
Reinvestment of distributions | 20,074 | 195,096 | 18,625 | 193,991 | ||||||||||||
Shares repurchased | (544,494 | ) | (5,782,122 | ) | (11,167 | ) | (116,546 | ) | ||||||||
Net transferred in/(out)* | — | — | (875 | ) | (9,069 | ) | ||||||||||
| (383,272 | ) | (4,080,191 | ) | 532,973 | 5,601,117 | |||||||||||
NET INCREASE (DECREASE) | (2,214,166 | ) | $ | (19,762,494 | ) | 6,973,179 | $ | 74,432,323 | ||||||||
| (a) | Effective as of January 15, 2020, the Fund terminated operations of its Class U Shares. |
| (b) | Effective as of February 3, 2020, the Fund terminated operations of its Class D and Class T shares. |
| * | For the fiscal year ended September 30, 2020, the Fund recognized transfers between share classes as shares sold and shares repurchased. |
| 12. OTHER MATTERS |
Pursuant to the Reorganization Agreement, the assets of the Predecessor Fund were transferred to the Fund in exchange for the assumption of the Predecessor Fund’s stated liabilities by the Fund and shares of beneficial interest of the Fund on May 18, 2020, as of the close of business on May 15, 2020. Such shares were then redistributed to the Predecessor Fund’s shareholders, in a tax-free exchange as follows:
| Predecessor Fund*/The Fund | Exchanged Shares of Survivor Issued | Value of Exchanged Shares | Acquired Fund’s Shares Outstanding as of May 18, 2020 | |||||||||
Resource Real Estate Diversified Income Fund, Class A / Goldman Sachs Real Estate Diversified Income Fund, Class A | 9,839,008 | $ | 93,539,337 | 9,839,008 | ||||||||
Resource Real Estate Diversified Income Fund, Class C / Goldman Sachs Real Estate Diversified Income Fund, Class C | 7,892,439 | 74,946,120 | 7,892,439 | |||||||||
Resource Real Estate Diversified Income Fund, Class I / Goldman Sachs Real Estate Diversified Income Fund, Class I | 7,026,178 | 69,614,596 | 7,026,178 | |||||||||
Resource Real Estate Diversified Income Fund, Class L / Goldman Sachs Real Estate Diversified Income Fund, Class L | 581,295 | 5,526,080 | 581,295 | |||||||||
Resource Real Estate Diversified Income Fund, Class W / Goldman Sachs Real Estate Diversified Income Fund, Class W | 5,901,459 | 56,960,112 | 5,901,459 | |||||||||
| * | Represents the accounting survivor. |
33
GOLDMAN SACHS REAL ESTATE DIVERSIFIED INCOME FUND
Consolidated Notes to Financial Statements (continued)
September 30, 2020
| 12. OTHER MATTERS (continued) |
Pursuant to the Reorganization Agreement, the assets of the Predecessor Fund were transferred to the Fund in exchange for the assumption of the Predecessor Fund’s stated liabilities by the Fund and shares of beneficial interest of the Fund, in a tax-free exchange as follows:
| Predecessor Fund*/The Fund | The Fund’s Aggregate Net Assets before the Reorganization | The Predecessor Fund’s Aggregate Net Assets before the Reorganization | The Predecessor Fund’s Unrealized Depreciation | The Fund’s Aggregate Net Assets Immediately after the | ||||||||||||
Resource Real Estate Diversified Income Fund, Class A / Goldman Sachs Real Estate Diversified Income Fund, Class A | $ | — | $ | 93,539,337 | $ | (3,176,194 | ) | $ | 93,539,337 | |||||||
Resource Real Estate Diversified Income Fund, Class C / Goldman Sachs Real Estate Diversified Income Fund, Class C | — | 74,946,120 | (3,681,851 | ) | 74,946,120 | |||||||||||
Resource Real Estate Diversified Income Fund, Class I / Goldman Sachs Real Estate Diversified Income Fund, Class I | 100,000 | 69,614,596 | (6,935,810 | ) | 69,714,596 | |||||||||||
Resource Real Estate Diversified Income Fund, Class L / Goldman Sachs Real Estate Diversified Income Fund, Class L | — | 5,526,080 | (297,461 | ) | 5,526,080 | |||||||||||
Resource Real Estate Diversified Income Fund, Class W / Goldman Sachs Real Estate Diversified Income Fund, Class W | — | 56,960,112 | (1,120,513 | ) | 56,960,112 | |||||||||||
| * | Represents the accounting survivor. |
On October 22, 2020, Goldman Sachs announced a settlement of matters involving 1Malaysia Development Bhd. (1MDB), a Malaysian sovereign wealth fund, with the United States Department of Justice as well as criminal and civil authorities in the UK, Singapore and Hong Kong. Further information regarding the 1MDB settlement can be found at https://www.goldmansachs.com/media-relations/press-releases/current/goldman-sachs-2020-10-22.html. The 1MDB settlement will not materially adversely affect GSAM’s ability to serve as investment manager.
| 13. CHANGE IN INDEPENDENT REGISTERED PUBLIC ACCOUNTING FIRM |
On June 9, 2020, the Trustees of the Fund, upon the recommendation of the Board’s audit committee, approved PricewaterhouseCoopers LLP (“PwC”) as the Fund’s independent registered public accounting firm. For the years ended September 30, 2016 through September 30, 2019, (the “Covered Period”), BBD LLP served as the Predecessor Fund’s independent registered public accounting firm, and BBD LLP’s audit reports contained no adverse opinion or disclaimer of opinion; nor were their reports qualified or modified as to the uncertainty, audit scope, or accounting principles; nor were there any “reportable events” of the kind described in Item 304(a)(1)(v) of Regulation S-K under the Securities Exchange Act of 1934, as amended. Further, there were no disagreements between the Fund and BBD LLP on accounting principles or practices, financial statement disclosure, or audit scope or procedures, which, if not resolved to the satisfaction of BBD LLP, would have caused them to make reference to the disagreement in their reports.
The selection of PwC does not reflect any disagreements with or dissatisfaction by the Fund or the Trustees with the performance of the Predecessor Fund’s prior independent registered public accounting firm, BBD LLP. During the Covered Period, neither the Fund, nor anyone on its behalf, consulted with PwC on items which: (i) concerned the application of accounting principles to a specified transaction, either completed or proposed, or the type of audit opinion that might be rendered on the Fund’s financial statements; or (ii) concerned the subject of a disagreement (as defined in paragraph (a)(1)(iv) of Item 304 of Regulation S-K) or reportable events (as described in paragraph (a)(1)(v) of Item 304 of Regulation S-K).
| 14. SUBSEQUENT EVENTS |
The Fund completed a quarterly repurchase offer on October 15, 2020, which resulted in 1,514,470 Fund shares being repurchased for $14,627,473.
Additional subsequent events after the Consolidated Statement of Assets and Liabilities date have been evaluated, and GSAM has concluded that there is no impact requiring additional adjustment or disclosure in the financial statements.
34
Report of Independent Registered Public
Accounting Firm
To the Board of Trustees and Shareholders of Goldman Sachs Real Estate Diversified Income Fund
Opinion on the Financial Statements
We have audited the accompanying consolidated statement of assets and liabilities, including the consolidated schedule of investments, of Goldman Sachs Real Estate Diversified Income Fund (the “Fund”) as of September 30, 2020, the related consolidated statements of operations, cash flows, and changes in net assets for the year ended September 30, 2020, including the related notes, and the financial highlights for the year ended September 30, 2020 (collectively referred to as the “consolidated financial statements”). In our opinion, the consolidated financial statements present fairly, in all material respects, the financial position of the Fund as of September 30, 2020, the results of its operations, its cash flows, the changes in its net assets, and the financial highlights for the year then ended in conformity with accounting principles generally accepted in the United States of America.
The consolidated financial statements of the Fund as of and for the year ended September 30, 2019 and the financial highlights for each of the periods ended on or prior to September 30, 2019 (not presented herein, other than the statement of changes in net assets and the financial highlights) were audited by other auditors whose report dated November 29, 2019 expressed an unqualified opinion on those consolidated financial statements and financial highlights.
Basis for Opinion
These consolidated financial statements are the responsibility of the Fund’s management. Our responsibility is to express an opinion on the Fund’s consolidated financial statements based on our audit. We are a public accounting firm registered with the Public Company Accounting Oversight Board (United States) (PCAOB) and are required to be independent with respect to the Fund in accordance with the U.S. federal securities laws and the applicable rules and regulations of the Securities and Exchange Commission and the PCAOB.
We conducted our audit of these consolidated financial statements in accordance with the standards of the PCAOB. Those standards require that we plan and perform the audit to obtain reasonable assurance about whether the consolidated financial statements are free of material misstatement, whether due to error or fraud.
Our audit included performing procedures to assess the risks of material misstatement of the consolidated financial statements, whether due to error or fraud, and performing procedures that respond to those risks. Such procedures included examining, on a test basis, evidence regarding the amounts and disclosures in the consolidated financial statements. Our audit also included evaluating the accounting principles used and significant estimates made by management, as well as evaluating the overall presentation of the consolidated financial statements. Our procedures included confirmation of securities owned as of September 30, 2020 by correspondence with the custodian, transfer agent, broker, real estate investment trusts, and private investment funds; when replies were not received, we performed other auditing procedures. We believe that our audit provides a reasonable basis for our opinion.
/s/ PricewaterhouseCoopers LLP
Boston, Massachusetts
November 27, 2020
We have served as the auditor of one or more investment companies in the Goldman Sachs fund complex since 2000.
35
GOLDMAN SACHS REAL ESTATE DIVERSIFIED INCOME FUND
Voting Results of Special Meeting of Shareholders (Unaudited)
A Special Meeting (the “Meeting”) of the Resource Real Estate Diversified Income Fund (the “Acquired Fund”) was held on May 1, 2020 to consider and act upon the proposal below.
At the Meeting, the shareholders of the Acquired Fund approved an Agreement and Plan of Reorganization. The Acquired Fund’s shareholders voted as follows:
Proposal 1. To approve the Agreement and Plan of Reorganization | For | Against | Abstained | Broker Non-Votes | ||||||||||||
Real Estate Diversified Income Fund | 11,076,902 | 454,260 | 887,296 | 0 | ||||||||||||
36
GOLDMAN SACHS REAL ESTATE DIVERSIFIED INCOME FUND
Statement Regarding Basis for Approval of Management Agreement (Unaudited)
Background
The Goldman Sachs Real Estate Diversified Income Fund (the “Fund”) is a newly organized closed end interval fund that commenced operations on May 15, 2020. The Fund is a successor fund to the Resource Real Estate Diversified Income Fund (the “Predecessor Fund”) which was managed by Resource Real Estate, LLC and had an investment objective and strategy similar to that of the Fund. The Predecessor Fund was reorganized into the Fund as of May 15, 2020.
At a meeting held on December 2, 2019 (the “Meeting”) in connection with the Fund’s organization, the Trustees, including all of the Trustees present who are not parties to the Fund’s investment management agreement (the “Management Agreement”) or “interested persons” (as defined in the Investment Company Act of 1940, as amended) of any party thereto (the “Independent Trustees”) approved the Management Agreement with Goldman Sachs Asset Management, L.P. (the “Investment Adviser”).
At the Meeting the Trustees reviewed the Management Agreement, including information regarding the terms of the Management Agreement; the nature, extent and quality of the Investment Adviser’s anticipated services; the fees and expenses to be paid by the Fund; a comparison of the Fund’s proposed management fees and anticipated expenses with those paid by other similar closed-end interval funds; and potential benefits to be derived by the Investment Adviser and its affiliates from their relationships with the Fund.
In evaluating the Management Agreement at the Meeting, the Trustees relied upon their knowledge, resulting from their meetings and other interactions throughout the year, of the Investment Adviser, its affiliates, their services and the Fund (the Trustees also oversee other funds in the Goldman Sachs fund complex). In conjunction with these meetings, the Trustees received written materials and oral presentations on the topics covered, and were advised by their independent legal counsel regarding their responsibilities and other regulatory requirements related to the approval of registered fund investment management agreements under applicable law. In addition, the Investment Adviser and its affiliates provided the Independent Trustees with a written response to a formal request for information sent on behalf of the Independent Trustees by their independent legal counsel. During the course of their deliberations, the Independent Trustees met in executive sessions with their independent legal counsel, without representatives of the Investment Adviser or its affiliates present. The Independent Trustees also discussed the broad range of other investment choices that are available to Fund investors, including the availability of comparable funds managed by other advisers.
Nature, Extent and Quality of the Services to be Provided Under the Management Agreement and Investment Performance
As part of their review, the Trustees considered the nature, extent and quality of the services to be provided by the Investment Adviser on behalf of the Fund. In this regard, the Trustees considered both the investment advisory services and non-advisory services that would be provided to the Fund by the Investment Adviser and its affiliates. The Trustees also considered information about the Fund’s structure, its investment objective, strategies, and other characteristics. In particular, the Trustees considered the operational complexities associated with continuously offered closed-end interval funds in comparison to other structures. The Trustees also noted the experience and capabilities of the investment teams that would be responsible for managing the Fund. The Trustees concluded that the Investment Adviser would be able to commit substantial financial and other resources to the Fund.
In this regard, the Trustees noted that, although the Fund was new, the Investment Adviser had experience managing other funds and accounts that employ similar investment strategies. The Trustees concluded that the Investment Adviser’s management of the Fund likely would benefit the Fund and its respective shareholders.
Costs of Services to be Provided and Profitability
The Trustees considered the contractual terms of the proposed Management Agreement for the Fund and the fee rate payable thereunder. In this regard, the Trustees considered information on the services to be rendered by the Investment Adviser to the Fund, which included both advisory and administrative services that were directed to the needs and operations of the Fund. The Trustees reviewed information on the proposed management fees and the Fund’s projected total operating expense ratios (both gross and net of expense limitations). This was compared to similar information for the Predecessor Fund, as well as other comparable interval funds advised by unaffiliated investment management firms. The Trustees considered that the proposed management fee for the Fund would be the same as that of the Predecessor Fund. The Trustees believed that the information presented was useful in evaluating the reasonableness of the proposed management fees and total expenses expected to be paid by the Fund.
The Trustees recognized that there was not yet profitability data to evaluate for the Fund, but considered the Investment Adviser’s representation that such data would be provided after the Fund commenced operations.
Economies of Scale
The Trustees noted that the proposed management fee rate for the Fund would not be subject to breakpoints at higher asset levels. The Trustees considered the Fund’s projected asset levels and information comparing the contractual management fee rate
37
GOLDMAN SACHS REAL ESTATE DIVERSIFIED INCOME FUND
Statement Regarding Basis for Approval of Management Agreement (Unaudited) (continued)
charged by the Investment Adviser with fee rates charged to the Predecessor Fund and other interval funds in the peer group. They considered the Investment Adviser’s undertaking to limit certain expenses of the Fund that exceed a specified level of the Fund’s net assets.
Other Benefits to the Investment Adviser and Its Affiliates
The Trustees also considered the other benefits expected to be derived by the Investment Adviser and its affiliates from their relationship with the Fund, including: (a) transfer agency fees received by Goldman Sachs & Co. LLC (“Goldman Sachs”); (b) brokerage and futures commissions earned by Goldman Sachs for executing securities and futures transactions on behalf of the Fund; (c) trading efficiencies resulting from aggregation of orders of the Fund with those for other funds or accounts managed by the Investment Adviser; (d) the Investment Adviser’s ability to leverage the infrastructure designed to service the Fund on behalf of its other clients; (e) the Investment Adviser’s ability to cross-market other products and services to Fund shareholders; (f) Goldman Sachs’ retention of certain fees as Fund Distributor; (g) the Investment Adviser’s ability to negotiate better pricing with custodians on behalf of its other clients, as a result of the relationship with the Fund; and (h) the possibility that the working relationship between the Investment Adviser and the Fund’s third-party service providers may cause those service providers to be open to doing business with other areas of Goldman Sachs.
Conclusion
In connection with their consideration of the Management Agreement for the Fund at the meeting, the Trustees gave weight to various factors, but did not identify any particular factor as controlling their decision. After deliberation and consideration of the information provided, including the factors described above, the Trustees concluded, in the exercise of their business judgment, that the management fee that would be payable by the Fund was reasonable in light of the services to be provided to it by the Investment Adviser, the Investment Adviser’s anticipated costs and the Fund’s reasonably anticipated asset levels. The Trustees unanimously concluded that the Investment Adviser’s management likely would benefit the Fund and its shareholders and that the Management Agreement proposed with respect to the Fund should be approved.
38
GOLDMAN SACHS REAL ESTATE DIVERSIFIED INCOME FUND
Trustees and Officers (Unaudited) Independent Trustees
| Name, Address and Age1 | Position(s) Held with the Fund | Term of Office and Length of Time Served2 | Principal Occupation(s) During Past 5 Years | Number of Portfolios in Fund Complex Overseen by Trustee3 | Other Directorships Held by Trustee4 | |||||
Lawrence W. Stranghoener Age: 66 | Chairman of the Board of Trustees | Trustee and Chairman Since 2019 | Mr. Stranghoener is retired. He is Director, Kennametal, Inc. (a global manufacturer and distributor of tooling and industrial materials) (2003-Present); and was formerly Director, Aleris Corporation and Aleris International, Inc. (a producer of aluminum rolled products) (2011-2020); Interim Chief Executive Officer (2014); and Executive Vice President and Chief Financial Officer (2004-2014), Mosaic Company (a fertilizer manufacturing company).
Chairman of the Board of Trustees — Goldman Sachs ETF Trust; Goldman Sachs MLP and Energy Renaissance Fund; Goldman Sachs Credit Income Fund; and Goldman Sachs Real Estate Diversified Income Fund. | 46 | Kennametal Inc. (a global manufacturer and distributor of tooling and industrial materials) | |||||
Caroline Dorsa Age: 61 | Trustee | Since 2019 | Ms. Dorsa is retired. She is Director, Biogen Inc. (a biotechnology company) (2010-Present); Director, Intellia Therapeutics Inc. (a gene- editing company) (2015-Present); and Director, Illumina, Inc. (a life sciences company) (2017- Present). She was formerly Executive Vice President and Chief Financial Officer, Public Service Enterprise Group, Inc. (a generation and energy services company) (2009-2015); Senior Vice President, Merck & Co, Inc. (a pharmaceutical company) (2008-2009 and 1987- 2007); Senior Vice President and Chief Financial Officer, Gilead Sciences, Inc. (a pharmaceutical company) (2007-2008); and Senior Vice President and Chief Financial Officer, Avaya, Inc. (a technology company) (2007).
Trustee — Goldman Sachs ETF Trust; Goldman Sachs MLP and Energy Renaissance Fund; Goldman Sachs Credit Income Fund; and Goldman Sachs Real Estate Diversified Income Fund. | 46 | Biogen Inc. (a biotechnology company); Intellia Therapeutics Inc. (a gene-editing company); Illumina, Inc. (a life sciences company) | |||||
Linda A. Lang Age: 62 | Trustee | Since 2019 | Ms. Lang is retired. She was formerly Chair of the Board of Directors (2016-2019), and Member of the Board of Directors, WD-40 Company (2004-Present); Chairman and Chief Executive Officer (2005-2014); and Director, President and Chief Operating Officer, Jack in the Box, Inc. (a restaurant company) (2003-2005). Previously, Ms. Lang served as an Advisory Board Member of Goldman Sachs MLP Income Opportunities Fund and Goldman Sachs MLP and Energy Renaissance Fund (February 2016-March 2016).
Trustee — Goldman Sachs ETF Trust; Goldman Sachs MLP and Energy Renaissance Fund; Goldman Sachs Credit Income Fund; and Goldman Sachs Real Estate Diversified Income Fund. | 46 | None | |||||
Michael Latham Age: 54 | Trustee | Since 2019 | Mr. Latham is retired. Formerly, he held senior management positions with the iShares exchange-traded fund business, including Chairman (2011-2014); Global Head (2010-2011); U.S. Head (2007-2010); and Chief Operating Officer (2003-2007).
Trustee — Goldman Sachs ETF Trust; Goldman Sachs MLP and Energy Renaissance Fund; Goldman Sachs Credit Income Fund; and Goldman Sachs Real Estate Diversified Income Fund. | 46 | None | |||||
39
GOLDMAN SACHS REAL ESTATE DIVERSIFIED INCOME FUND
Trustees and Officers (Unaudited) (continued)
Interested Trustee*
| Name, Address and Age1 | Position(s) Held with the Fund | Term of Office and Length of Time Served2 | Principal Occupation(s) During Past 5 Years | Number of Portfolios in Fund Complex Overseen by Trustee3 | Other Directorships Held by Trustee4 | |||||
James A. McNamara Age: 57 | Trustee and President | Since 2019 | Advisory Director, Goldman Sachs (January 2018-Present); Managing Director, Goldman Sachs (January 2000-December 2017); Director of Institutional Fund Sales, GSAM (April 1998-December 2000); and Senior Vice President and Manager, Dreyfus Institutional Service Corporation (January 1993-April 1998).
President and Trustee — Goldman Sachs ETF Trust; Goldman Sachs Trust; Goldman Sachs Variable Insurance Trust; Goldman Sachs Trust II; Goldman Sachs MLP and Energy Renaissance Fund; Goldman Sachs Credit Income Fund; and Goldman Sachs Real Estate Diversified Income Fund. | 168 | None | |||||
| * | This person is considered to be an “Interested Trustee” because he holds a position with Goldman Sachs and own securities issued by The Goldman Sachs Group, Inc. The Interested Trustee holds comparable positions with certain other companies of which Goldman Sachs, GSAM or an affiliate thereof is the investment adviser, administrator and/or distributor. |
| 1 | Each Trustee may be contacted by writing to the Trustee, c/o Goldman Sachs, 200 West Street, New York, New York, 10282, Attn: Caroline L. Kraus. Information is provided as of September 30, 2020. |
| 2 | Each Trustee holds office for an indefinite term until the earliest of: (a) the election of his or her successor; (b) the date the Trustee resigns, retires or is removed by the Board of Trustees or shareholders, in accordance with the Trust’s Declaration of Trust; or (c) the termination of the Trust. |
| 3 | The Goldman Sachs Fund Complex includes certain other companies listed above for each respective Trustee. As of September 30, 2020, Goldman Sachs ETF Trust consisted of 42 portfolios (23 of which offered shares to the public); Goldman Sachs Trust consisted of 90 portfolios (89 of which offered shares to the public); Goldman Sachs Variable Insurance Trust consisted of 13 portfolios; Goldman Sachs Trust II consisted of 19 portfolios (17 of which offered shares to the public); and Goldman Sachs MLP and Energy Renaissance Fund, Goldman Sachs Credit Income Fund and Goldman Sachs Real Estate Diversified Income Fund each consisted of one portfolio. Goldman Sachs Credit Income Fund did not offer shares to the public. |
| 4 | This column includes only directorships of companies required to report to the Securities and Exchange Commission under the Securities Exchange Act of 1934 (i.e., “public companies”) or other investment companies registered under the Act. |
Additional information about the Trustees is available in the Fund’s Statement of Additional Information, which can be obtained from Goldman Sachs free of charge by calling this toll-free number (in the United States of America): 1-800-526-7384.
40
GOLDMAN SACHS REAL ESTATE DIVERSIFIED INCOME FUND
Trustees and Officers (Unaudited) (continued)
Interested Trustee*
| Name, Address and Age1 | Positions Held with the Fund | Term of Office and Length of Time Served2 | Principal Occupation(s) During Past 5 Years | |||
James A. McNamara 200 West Street New York, NY 10282 Age: 57 | Trustee and President | Since 2019 | Advisory Director, Goldman Sachs (January 2018-Present); Managing Director, Goldman Sachs (January 2000-December 2017); Director of Institutional Fund Sales, GSAM (April 1998-December 2000); and Senior Vice President and Manager, Dreyfus Institutional Service Corporation (January 1993-April 1998).
President and Trustee — Goldman Sachs ETF Trust; Goldman Sachs Trust; Goldman Sachs Variable Insurance Trust; Goldman Sachs Trust II; Goldman Sachs MLP and Energy Renaissance Fund; Goldman Sachs Credit Income Fund; and Goldman Sachs Real Estate Diversified Income Fund. | |||
Caroline L. Kraus 200 West Street New York, NY 10282 Age: 43 | Secretary | Since 2019 | Managing Director, Goldman Sachs (January 2016-Present); Vice President, Goldman Sachs (August 2006-December 2015); Senior Counsel, Goldman Sachs (January 2020–Present); Associate General Counsel, Goldman Sachs (2012-December 2019); Assistant General Counsel, Goldman Sachs (August 2006-December 2011); and Associate, Weil, Gotshal & Manges, LLP (2002-2006).
Secretary — Goldman Sachs ETF Trust; Goldman Sachs Trust (previously Assistant Secretary (2012)); Goldman Sachs Variable Insurance Trust (previously Assistant Secretary (2012)); Goldman Sachs Trust II; Goldman Sachs BDC, Inc.; Goldman Sachs Private Middle Market Credit LLC; Goldman Sachs Private Middle Market Credit II LLC; Goldman Sachs Private Middle Market Credit II LLC; Goldman Sachs Middle Market Lending Corp.; Goldman Sachs MLP and Energy Renaissance Fund; Goldman Sachs Credit Income Fund; and Goldman Sachs Real Estate Diversified Income Fund. | |||
Joseph F. DiMaria 30 Hudson Street Jersey City, NJ 07302 Age: 52 | Treasurer, Principal Financial Officer and Principal Accounting Officer | Since 2019 | Managing Director, Goldman Sachs (November 2015-Present) and Vice President — Mutual Fund Administration, Columbia Management Investment Advisers, LLC (May 2010- October 2015).
Treasurer, Principal Financial Officer and Principal Accounting Officer—Goldman Sachs Trust (previously Assistant Treasurer (2016)); Goldman Sachs Variable Insurance Trust (previously Assistant Treasurer (2016)); Goldman Sachs Trust II (previously Assistant Treasurer (2017)); Goldman Sachs MLP and Energy Renaissance Fund (previously Assistant Treasurer (2017)); Goldman Sachs ETF Trust (previously Assistant Treasurer (2017)); Goldman Sachs Credit Income Fund; and Goldman Sachs Real Estate Diversified Income Fund. | |||
| * | Represents a partial list of officers of the Trust. Additional information about all the officers is available in the Fund’s Statement of Additional Information, which can be obtained from Goldman Sachs free of charge by calling this toll-free number (in the United States): 1-800-526-7384. |
| 1 | Information is provided as of September 30, 2020. |
| 2 | Officers hold office at the pleasure of the Board of Trustees or until their successors are duly elected and qualified. Each officer holds comparable positions with certain other companies of which Goldman Sachs, GSAM or an affiliate thereof is the investment adviser, administrator and/or distributor. |
Goldman Sachs Real Estate Diversified Income Fund – Tax Information (Unaudited)
For the fiscal year ended September 30, 2020, 50.71% of the dividends paid from net investment company taxable income by the Real Estate Diversified Income Fund qualify as section 199A dividends.
Pursuant to Section 852 of the Internal Revenue Code, the Real Estate Diversified Income Fund designates $9,459,525, or, if different, the maximum amount allowable, as capital gain dividends paid during the fiscal year ended September 30, 2020.
41
FUNDS PROFILE
Goldman Sachs Funds
Goldman Sachs is a premier financial services firm, known since 1869 for creating thoughtful and customized investment solutions in complex global markets.
Today, the Consumer and Investment Management Division of Goldman Sachs serves a diverse set of clients worldwide, including private institutions, public entities and individuals. With approximately $1.86 trillion in assets under supervision as of September 30, 2020, Goldman Sachs Asset Management (“GSAM”) has portfolio management teams located around the world and our investment professionals bring firsthand knowledge of local markets to every investment decision. Assets under supervision includes assets under management and other client assets for which Goldman Sachs does not have full discretion. GSAM leverages the resources of Goldman Sachs & Co. LLC subject to legal, internal and regulatory restrictions.
Money Market
Financial Square FundsSM
| ∎ | Financial Square Treasury Solutions Fund1 |
| ∎ | Financial Square Government Fund1 |
| ∎ | Financial Square Money Market Fund2 |
| ∎ | Financial Square Prime Obligations Fund2 |
| ∎ | Financial Square Treasury Instruments Fund1 |
| ∎ | Financial Square Treasury Obligations Fund1 |
| ∎ | Financial Square Federal Instruments Fund1 |
Investor FundsSM
| ∎ | Investor Money Market Fund3 |
| ∎ | Investor Tax-Exempt Money Market Fund3 |
Fixed Income
Short Duration and Government
| ∎ | Enhanced Income Fund |
| ∎ | High Quality Floating Rate Fund |
| ∎ | Short-Term Conservative Income Fund |
| ∎ | Short Duration Government Fund |
| ∎ | Short Duration Income Fund |
| ∎ | Government Income Fund |
| ∎ | Inflation Protected Securities Fund |
Multi-Sector
| ∎ | Bond Fund |
| ∎ | Core Fixed Income Fund |
| ∎ | Global Core Fixed Income Fund4 |
| ∎ | Strategic Income Fund |
| ∎ | Income Fund |
Municipal and Tax-Free
| ∎ | High Yield Municipal Fund |
| ∎ | Dynamic Municipal Income Fund |
| ∎ | Short Duration Tax-Free Fund |
| ∎ | Municipal Income Completion Fund |
Single Sector
| ∎ | Investment Grade Credit Fund |
| ∎ | U.S. Mortgages Fund |
| ∎ | High Yield Fund |
| ∎ | High Yield Floating Rate Fund |
| ∎ | Emerging Markets Debt Fund |
| ∎ | Local Emerging Markets Debt Fund |
Fixed Income Alternatives
| ∎ | Long Short Credit Strategies Fund |
Fundamental Equity
| ∎ | Equity Income Fund |
| ∎ | Small Cap Growth Fund |
| ∎ | Small Cap Value Fund |
| ∎ | Small/Mid Cap Value Fund |
| ∎ | Mid Cap Value Fund |
| ∎ | Large Cap Value Fund |
| ∎ | Focused Value Fund |
| ∎ | Capital Growth Fund |
| ∎ | Strategic Growth Fund |
| ∎ | Small/Mid Cap Growth Fund |
| ∎ | Flexible Cap Fund |
| ∎ | Concentrated Growth Fund |
| ∎ | Technology Opportunities Fund |
| ∎ | Growth Opportunities Fund |
| ∎ | Rising Dividend Growth Fund |
| ∎ | U.S. Equity ESG Fund5 |
| ∎ | Income Builder Fund |
Tax-Advantaged Equity
| ∎ | U.S. Tax-Managed Equity Fund |
| ∎ | International Tax-Managed Equity Fund |
| ∎ | U.S. Equity Dividend and Premium Fund |
| ∎ | International Equity Dividend and Premium Fund |
Equity Insights
| ∎ | Small Cap Equity Insights Fund |
| ∎ | U.S. Equity Insights Fund |
| ∎ | Small Cap Growth Insights Fund |
| ∎ | Large Cap Growth Insights Fund |
| ∎ | Large Cap Value Insights Fund |
| ∎ | Small Cap Value Insights Fund |
| ∎ | International Small Cap Insights Fund |
| ∎ | International Equity Insights Fund |
| ∎ | Emerging Markets Equity Insights Fund |
Fundamental Equity International
| ∎ | International Equity Income Fund |
| ∎ | International Equity ESG Fund |
| ∎ | China Equity Fund6 |
| ∎ | Emerging Markets Equity Fund |
| ∎ | Imprint Emerging Markets Opportunities Fund |
| ∎ | ESG Emerging Markets Equity Fund |
Alternative
| ∎ | Real Estate Securities Fund |
| ∎ | International Real Estate Securities Fund |
| ∎ | Commodity Strategy Fund |
| ∎ | Global Real Estate Securities Fund |
| ∎ | Alternative Premia Fund |
| ∎ | Absolute Return Tracker Fund |
| ∎ | Managed Futures Strategy Fund |
| ∎ | MLP Energy Infrastructure Fund |
| ∎ | MLP & Energy Fund |
| ∎ | Multi-Manager Alternatives Fund |
| ∎ | Absolute Return Multi-Asset Fund |
| ∎ | Global Infrastructure Fund |
Total Portfolio Solutions
| ∎ | Global Managed Beta Fund |
| ∎ | Multi-Manager Non-Core Fixed Income Fund |
| ∎ | Multi-Manager U.S. Dynamic Equity Fund |
| ∎ | Multi-Manager Global Equity Fund |
| ∎ | Multi-Manager International Equity Fund |
| ∎ | Tactical Tilt Overlay Fund |
| ∎ | Balanced Strategy Portfolio |
| ∎ | Multi-Manager U.S. Small Cap Equity Fund |
| ∎ | Multi-Manager Real Assets Strategy Fund |
| ∎ | Growth and Income Strategy Portfolio |
| ∎ | Growth Strategy Portfolio |
| ∎ | Dynamic Global Equity Fund |
| ∎ | Satellite Strategies Portfolio |
| ∎ | Enhanced Dividend Global Equity Portfolio |
| ∎ | Tax-Advantaged Global Equity Portfolio |
| ∎ | Strategic Factor Allocation Fund |
| ∎ | Target Date Retirement Portfolio7 |
| ∎ | Target Date 2025 Portfolio |
| ∎ | Target Date 2030 Portfolio |
| ∎ | Target Date 2035 Portfolio |
| ∎ | Target Date 2040 Portfolio |
| ∎ | Target Date 2045 Portfolio |
| ∎ | Target Date 2050 Portfolio |
| ∎ | Target Date 2055 Portfolio |
| ∎ | Target Date 2060 Portfolio |
| ∎ | GQG Partners International Opportunities Fund |
| 1 | You could lose money by investing in the Fund. Although the Fund seeks to preserve the value of your investment at $1.00 per share, it cannot guarantee it will do so. An investment in the Fund is not a deposit of a bank and is not insured or guaranteed by the Federal Deposit Insurance Corporation or any other government agency. The Fund’s sponsor has no legal obligation to provide financial support to the Fund, and you should not expect that the sponsor will provide financial support to the Fund at any time. |
| 2 | You could lose money by investing in the Fund. Because the share price of the Fund will fluctuate, when you sell your shares they may be worth more or less than what you originally paid for them. The Fund may impose a fee upon sale of your shares or may temporarily suspend your ability to sell shares if the Fund’s liquidity falls below required minimums because of market conditions or other factors. An investment in the Fund is not a deposit of a bank and is not insured or guaranteed by the Federal Deposit Insurance Corporation or any other government agency. The Fund’s sponsor has no legal obligation to provide financial support to the Fund, and you should not expect that the sponsor will provide financial support to the Fund at any time. |
| 3 | You could lose money by investing in the Fund. Although the Fund seeks to preserve the value of your investment at $1.00 per share, it cannot guarantee it will do so. The Fund may impose a fee upon sale of your shares or may temporarily suspend your ability to sell shares if the Fund’s liquidity falls below required minimums because of market conditions or other factors. An investment in the Fund is not a deposit of a bank and is not insured or guaranteed by the Federal Deposit Insurance Corporation or any other government agency. The Fund’s sponsor has no legal obligation to provide financial support to the Fund, and you should not expect that the sponsor will provide financial support to the Fund at any time. |
| 4 | Effective after the close of business on April 30, 2020, the Goldman Sachs Global Income Fund was renamed the Goldman Sachs Global Core Fixed Income Fund. |
| 5 | Effective after the close of business on August 30, 2020, the Goldman Sachs Blue Chip Fund was renamed the Goldman Sachs U.S. Equity ESG Fund. |
| 6Effective | after the close of business of November 20, 2019, the Goldman Sachs Asia Equity Fund was renamed the Goldman Sachs China Equity Fund. |
| 7 | Effective December 27, 2019, the Goldman Sachs Target Date 2020 Portfolio was renamed to the Goldman Sachs Target Date Retirement Portfolio. |
| Financial Square FundsSM and Investor FundsSM are registered service marks of Goldman Sachs & Co. LLC. |
| * | This list covers open-end funds only. Please visit our website at www.GSAMFUNDS.com to learn about our closed-end funds and exchange-traded funds. |
TRUSTEES Lawrence W. Stranghoener, Chairman Caroline Dorsa Linda A. Lang Michael Latham James A. McNamara | OFFICERS James A. McNamara, President Joseph F. DiMaria, Principal Financial Officer, Caroline L. Kraus, Secretary | |
GOLDMAN SACHS & CO. LLC Distributor and Transfer Agent | GOLDMAN SACHS ASSET MANAGEMENT, L.P. Investment Adviser | |
Visit our web site at www.GSAMFUNDS.com to obtain the most recent month-end returns.
Goldman Sachs Asset Management, L.P. 200 West Street, New York, New York 10282
Economic and market forecasts presented herein reflect our judgment as of the date of this presentation and are subject to change without notice. These forecasts do not take into account the specific investment objectives, restrictions, tax and financial situation or other needs of any specific client. Actual data will vary and may not be reflected here. These forecasts are subject to high levels of uncertainty that may affect actual performance. Accordingly, these forecasts should be viewed as merely representative of a broad range of possible outcomes. These forecasts are estimated, based on assumptions, and are subject to significant revision and may change materially as economic and market conditions change. Goldman Sachs has no obligation to provide updates or changes to these forecasts. Case studies and examples are for illustrative purposes only.
The portfolio risk management process includes an effort to monitor and manage risk, but does not imply low risk.
The reports concerning the Funds included in this shareholder report may contain certain forward-looking statements about the factors that may affect the performance of the Funds in the future. These statements are based on Fund management’s predictions and expectations concerning certain future events and their expected impact on the Funds, such as performance of the economy as a whole and of specific industry sectors, changes in the levels of interest rates, the impact of developing world events, and other factors that may influence the future performance of the Funds. Management believes these forward-looking statements to be reasonable, although they are inherently uncertain and difficult to predict. Actual events may cause adjustments in portfolio management strategies from those currently expected to be employed.
A description of the policies and procedures that the Funds use to determine how to vote proxies relating to portfolio securities and information regarding how a Fund voted proxies relating to portfolio securities during the most recent 12-month period ended June 30 is available (i) without charge, upon request by calling 1-800-526-7384 (for Retail Shareholders) or 1-800-621-2550 (for Institutional Shareholders); and (ii) on the Securities and Exchange Commission (“SEC”) web site at http://www.sec.gov.
The Global Industry Classification Standard (GICS) was developed by and is the exclusive property and a service mark of Morgan Stanley Capital International Inc. (MSCI) and Standard & Poor’s, a division of The McGraw-Hill Companies, Inc. (S&P) and is licensed for use by Goldman Sachs. Neither MSCI, S&P nor any other party involved in making or compiling the GICS or any GICS classifications makes any express or implied warranties or representations with respect to such standard or classification (or the results to be obtained by the use thereof), and all such parties hereby expressly disclaim all warranties of originality, accuracy, completeness, merchantability or fitness for a particular purpose with respect to any of such standard or classification. Without limiting any of the foregoing, in no event shall MSCI, S&P, any of their affiliates or any third party involved in making or compiling the GICS or any GICS classifications have any liability for any direct, indirect, special, punitive, consequential or any other damages (including lost profits) even if notified of the possibility of such damages.
The Funds will file portfolio holdings information for each month in a fiscal quarter within 60 days after the end of the relevant fiscal quarter on Form N-PORT. Portfolio holdings information for the third month of each fiscal quarter will be made available on the SEC’s web site at http://www.sec.gov. Portfolio holdings information may be obtained upon request and without charge by calling 1-800-526-7384 (for Retail Shareholders) or 1-800-621-2550 (for Institutional Shareholders).
Holdings and allocations shown are as of September 30, 2020 and may not be representative of future investments. Fund holdings should not be relied on in making investment decisions and should not be construed as research or investment advice regarding particular securities. Current and future holdings are subject to risk.
This material is not authorized for distribution to prospective investors unless preceded or accompanied by a current prospectus or summary prospectus, if applicable. Investors should consider a Fund’s objective, risks, and charges and expenses, and read the summary prospectus, if available, and/or the prospectus carefully before investing or sending money. The summary prospectus, if available, and the prospectus contain this and other information about a Fund and may be obtained from your authorized dealer or from Goldman Sachs & Co. LLC by calling (retail – 1-800-526-7384) (institutional – 1-800-621-2550).
© 2020 Goldman Sachs. All rights reserved. 221937-OTU-1301882 RLDVINCAR-20
| ITEM 2. | CODE OF ETHICS. |
(a) As of the end of the period covered by this report, the registrant has adopted a code of ethics that applies to the registrant’s principal executive officer, principal financial officer, principal accounting officer or controller, or persons performing similar functions, regardless of whether these individuals are employed by the registrant or a third party (the “Code of Ethics”).
(b) Not applicable.
(c) During the period covered by this report, no amendments were made to the provisions of the Code of Ethics.
(d) During the period covered by this report, the registrant did not grant any waivers, including an implicit waiver, from any provision of the Code of Ethics.
(e) Not applicable.
(f) A copy of the Code of Ethics is available as provided in Item 13(a)(1) of this report.
| ITEM 3. | AUDIT COMMITTEE FINANCIAL EXPERT. |
The registrant’s board of trustees has determined that the registrant has at least one “audit committee financial expert” (as defined in Item 3 of Form N-CSR) serving on its audit committee. Caroline Dorsa is the “audit committee financial expert” and is “independent” (as each term is defined in Item 3 of Form N-CSR).
| ITEM 4. | PRINCIPAL ACCOUNTANT FEES AND SERVICES. |
Table 1 — Items 4(a) - 4(d). The accountant fees below reflect the aggregate fees billed by the Goldman Sachs Real Estate Diversified Income Fund
| 2020 | 2019 | Description of Services Rendered | ||||||||
Audit Fees: | ||||||||||
| • PricewaterhouseCoopers LLP (“PwC”) for fiscal year 2020; BBD, LLP for fiscal year 2019 | $155,000 | $ | 25,000 | Financial Statement audits. | ||||||
Audit-Related Fees: | ||||||||||
• PwC for fiscal year 2020; BBD, LLP for fiscal year 2019 | $20,000 | $ | 0 | Other attest services. | ||||||
Tax Fees: | ||||||||||
• PwC for fiscal year 2020; BBD, LLP for fiscal year 2019 | $0 | $ | 3,000 | Tax compliance services provided in connection with the preparation and review of registrant’s tax returns. | ||||||
Table 2 — Items 4(b)(c) & (d). Non-Audit Services to the Goldman Sachs Real Estate Diversified Income Fund’s service affiliates * that were pre-approved by the Audit Committee of the Goldman Sachs Real Estate Diversified Income Fund pursuant to Rule 2-01(c)(7)(ii) of Regulation S-X.
| 2020 | 2019 | Description of Services Rendered | ||||||||
Audit-Related Fees: | ||||||||||
• PwC for fiscal year 2020; BBD, LLP for fiscal year 2019 | $1,561,351 | $ | 0 | Internal control review performed in accordance with Statement on Standards for Attestation Engagements No. 16 and Semi-Annual Updates related to withholding tax accrual for non-US Jurisdictions. These fees are borne by the Fund’s Adviser. | ||||||
| * | These include the advisor (excluding sub-advisors) and any entity controlling, controlled by or under common control with the advisor that provides ongoing services to the registrant (hereinafter referred to as “service affiliates”). |
Item 4(e)(1) — Audit Committee Pre-Approval Policies and Procedures
Pre-Approval of Audit and Non-Audit Services Provided to the Funds of the Goldman Sachs Real Estate Diversified Income Fund. The Audit and Non-Audit Services Pre-Approval Policy (the “Policy”) adopted by the Audit Committee of Goldman Sachs Real Estate Diversified Income Fund (the “Fund”) sets forth the procedures and the conditions pursuant to which services performed by an independent auditor for the Fund may be pre-approved. Services may be pre-approved specifically by the Audit Committee as a whole or, in certain circumstances, by the Audit Committee Chairman or the person designated as the Audit Committee Financial Expert. In addition, subject to specified cost limitations, certain services may be pre-approved under the provisions of the Policy. The Policy provides that the Audit Committee will consider whether the services provided by an independent auditor are consistent with the Securities and Exchange Commission’s rules on auditor independence. The Policy provides for periodic review and pre-approval by the Audit Committee of the services that may be provided by the independent auditor.
De Minimis Waiver. The pre-approval requirements of the Policy may be waived with respect to the provision of non-audit services that are permissible for an independent auditor to perform, provided (1) the aggregate amount of all such services provided constitutes no more than five percent of the total amount of revenues subject to pre-approval that was paid to the independent auditors during the fiscal year in which the services are provided; (2) such services were not recognized by the Fund at the time of the engagement to be non-audit services; and (3) such services are promptly brought to the attention of the Audit Committee and approved prior to the completion of the audit by the Audit Committee or by one or more members of the Audit Committee to whom authority to grant such approvals has been delegated by the Audit Committee, pursuant to the pre-approval provisions of the Policy.
Pre-Approval of Non-Audit Services Provided to the Fund’s Investment Advisers. The Policy provides that, in addition to requiring pre-approval of audit and non-audit services provided to the Fund, the Audit Committee will pre-approve those non-audit services provided to the Fund’s investment advisers (and entities controlling, controlled by or under common control with the investment advisers that provide ongoing services to the Fund) where the engagement relates directly to the operations or financial reporting of the Fund.
Item 4(e)(2) – 0% of the audit-related fees, tax fees and other fees listed in Table 1 were approved by the Fund’s Audit Committee pursuant to the “de minimis” exception of Rule 2-01(c)(7)(i)(C) of Regulation S-X. In addition, 0% of the non-audit services to the Fund’s service affiliates listed in Table 2 were approved by the Fund’s Audit Committee pursuant to the “de minimis” exception of Rule 2-01(c)(7)(i)(C) of Regulation S-X.
Item 4(f) – Not applicable.
Item 4(g) Aggregate Non-Audit Fees Disclosure
The aggregate non-audit fees billed to the Fund by PwC for the twelve months ended September 30, 2020 were approximately $20,000, and by BBD for the twelve months ended September 30, 2019 were approximately $0. The aggregate non-audit fees billed to the Fund’s adviser and service affiliates by PwC for non-audit services for the twelve months ended December 31, 2019 were approximately $14.7 million, and by BBD for the twelve months ended September 30, 2019 were approximately $0. With regard to the aggregate non-audit fees billed to the Fund’s adviser and service affiliates, the 2020 and 2019 amounts include fees for non-audit services required to be pre-approved [see Table 2] and fees for non-audit services that did not require pre-approval since they did not directly relate to the Fund’s operations or financial reporting.
Item 4(h) — The Fund’s Audit Committee has considered whether the provision of non-audit services to the Fund’s investment adviser and service affiliates that did not require pre-approval pursuant to paragraph (c)(7)(ii) of Rule 2-01 of Regulation S-X is compatible with maintaining the auditors’ independence.
| ITEM 5. | AUDIT COMMITTEE OF LISTED REGISTRANTS. |
Not applicable. |
| ITEM 6. | SCHEDULE OF INVESTMENTS. |
Schedule of Investments is included as part of the Report to Shareholders filed under Item 1. |
| ITEM 7. | DISCLOSURE OF PROXY VOTING POLICIES AND PROCEDURES FOR CLOSED-END MANAGEMENT INVESTMENT COMPANIES. |
The Fund has delegated the voting of portfolio securities to Goldman Sachs Asset Management L.P. (the “Investment Adviser”). For client accounts for which the Investment Adviser has voting discretion, the Investment Adviser has adopted policies and procedures (the “Proxy Voting Policy”) for the voting of proxies. Under the Proxy Voting Policy, the Investment Adviser’s guiding principles in performing proxy voting are to make decisions that favor proposals that in the Investment Adviser’s view tend to maximize a company’s shareholder value and are not influenced by conflicts of interest. To implement these guiding principles for investments in publicly-traded equities, the Investment Adviser has developed customized proxy voting guidelines (the “Guidelines”) that it generally applies when voting on behalf of client accounts. These Guidelines address a wide variety of individual topics, including, among other matters, shareholder voting rights, anti-takeover defenses, board structures, the election of directors, executive and director compensation, reorganizations, mergers, issues of corporate social responsibility and various shareholder proposals. The Guidelines embody the positions and factors the Investment Adviser generally considers important in casting proxy votes.
The Proxy Voting Policy, including the Guidelines, is reviewed periodically to ensure that it continues to be consistent with the Investment Adviser’s guiding principles.
The Investment Adviser has retained a third-party proxy voting service (“Proxy Service”), currently Institutional Shareholder Services, to assist in the implementation and administration of certain proxy voting-related functions, including, without limitation, operational, recordkeeping and reporting services. The Proxy Service also prepares a written analysis and recommendation (a “Recommendation”) of each proxy vote that reflects the Proxy Service’s application of the Guidelines to particular proxy issues. While it is the Investment Adviser’s policy generally to follow the Guidelines and Recommendations from the Proxy Service, the Investment Adviser’s portfolio management teams (“Portfolio Management Teams”) may on certain proxy votes seek approval to diverge from the Guidelines or a Recommendation by following an “override” process. Such decisions are subject to a review and approval process, including a determination that the decision is not influenced by any conflict of interest. A Portfolio Management Team that receives approval through the override process to cast a proxy vote that diverges from the Guidelines and/or a Recommendation may vote differently than other Portfolio Management Teams that did not seek to override that vote. In forming their views on particular matters, the Portfolio Management Teams are also permitted to consider applicable regional rules and practices, including codes of conduct and other guides, regarding proxy voting, in addition to the Guidelines and Recommendations. The Investment Adviser may hire other service providers to replace or supplement the Proxy Service with respect to any of the services the Investment Adviser currently receives from the Proxy Service.
The Investment Adviser conducts periodic due diligence meetings with the Proxy Service which include, but are not limited to, a review of the Proxy Service’s general organizational structure, new developments with respect to research and technology, work flow improvements and internal due diligence with respect to conflicts of interest.
From time to time, the Investment Adviser may face regulatory, compliance, legal or logistical limits with respect to voting securities that it may purchase or hold for client accounts, which can affect the Investment Adviser’s ability to vote such proxies, as well as the desirability of voting such proxies. Among other limits, federal, state and foreign regulatory restrictions or company specific ownership limits, as well as legal matters related to consolidated groups, may restrict the total percentage of an issuer’s voting securities that the Investment Adviser can hold for clients and the nature of the Investment Adviser’s voting in such securities. The Investment Adviser’s ability to vote proxies may also be affected by, among other things: (i) late receipt of meeting notices; (ii) requirements to vote proxies in person: (iii) restrictions on a foreigner’s ability to exercise votes; (iv) potential difficulties in translating the proxy; (v) requirements to provide local agents with unrestricted powers of attorney to facilitate voting instructions; and (vi) requirements that investors who exercise their voting rights surrender the right to dispose of their holdings for some specified period in proximity to the shareholder meeting.
The Investment Adviser has adopted policies and procedures designed to prevent conflicts of interest from influencing its proxy voting decisions that the Investment Adviser makes on behalf of a client account. These policies and procedures include the Investment Adviser’s use of the Guidelines and Recommendations from the Proxy Service, the override approval process previously discussed, and the establishment of information barriers between the Investment Adviser and other businesses within The Goldman Sachs Group, Inc. Notwithstanding such proxy voting policies and procedures, actual proxy voting decisions of the Investment Adviser may have the effect of benefitting the interests of other clients or businesses of other divisions or units of GS&Co. and/or its affiliates.
Voting decisions with respect to fixed income securities and the securities of privately held issuers generally will be made by the Fund’s portfolio managers based on their assessment of the particular transactions or other matters at issue.
Information regarding how the Fund voted proxies relating to portfolio securities during the most recent 12-month period ended June 30, 2020 will be available on or through the Fund’s website at https://www.gsam.com/content/gsam/us/en/advisors/resources/client-service/proxy-voting.html without charge and on the SEC’s website at www.sec.gov.
| ITEM 8. | PORTFOLIO MANAGERS OF CLOSED-END MANAGEMENT INVESTMENT COMPANIES. |
Item 8(a)(1)
Name | Title | Length of Time Served | Principal Occupation(s) During Past 5 Years | |||
| Nora Creedon | Managing Director | Since 2020 | Ms. Creedon joined the Investment Adviser in 2010. | |||
| Timothy Ryan, CFA | Managing Director | Since 2020 | Mr. Ryan joined the Investment Adviser in 2010. | |||
| Sean Brenan | Managing Director | Since 2020 | Mr. Brenan joined the Investment Adviser in 2010. | |||
| Collin Bell | Managing Director | Since 2020 | Mr. Bell joined the Investment Adviser in 1997. | |||
Item 8(a)(2)
The following tables disclose other accounts within each type of category listed below for which the portfolio managers are jointly and primarily responsible for day to day portfolio management, as of September 30, 2020, unless otherwise noted.
| Number of Other Accounts Managed and Total Assets by Account Type | Number of Accounts and Total Assets for Which Advisory Fee is Performance Based | |||||||||||||||||||||||||||||||||||||||||||||||
Name of Portfolio Manager | Registered Investment Companies | Other Pooled Investment Vehicles | Other Accounts | Registered Investment Companies | Other Pooled Investment Vehicles | Other Accounts | ||||||||||||||||||||||||||||||||||||||||||
| Number of Accounts | Assets Managed (mm) | Number of Accounts | Assets Managed (mm) | Number of Accounts | Assets Managed (mm) | Number of Accounts | Assets Managed (mm) | Number of Accounts | Assets Managed (mm) | Number of Accounts | Assets Managed (mm) | |||||||||||||||||||||||||||||||||||||
Nora Creedon | 2 | $ | 588.40 | 8 | $ | 1,052.90 | 18 | $ | 321.80 | 0 | $ | 0.00 | 0 | $ | 0.00 | 0 | $ | 0.00 | ||||||||||||||||||||||||||||||
Timothy Ryan, CFA | 1 | $ | 116.36 | 1 | $ | 818.87 | 10 | $ | 229.59 | 0 | $ | 0.00 | 0 | $ | 0.00 | 0 | $ | 0.00 | ||||||||||||||||||||||||||||||
Sean Brenan | 0 | $ | 0.00 | 18 | $ | 6.18 | 1 | $ | 1.81 | 0 | $ | 0.00 | 13 | $ | 5.28 | 0 | $ | 0.00 | ||||||||||||||||||||||||||||||
Collin Bell | 1 | $ | 1,747.52 | 0 | $ | 0.00 | 1 | $ | 47.33 | 0 | $ | 0.00 | 0 | $ | 0.00 | 0 | $ | 0.00 | ||||||||||||||||||||||||||||||
Item 8(a)(3) —
Compensation for portfolio managers of the Investment Adviser is comprised of a base salary and year-end discretionary variable compensation. The base salary is fixed from year to year. Year-end discretionary variable compensation is primarily a function of each portfolio manager’s individual performance and his or her contribution to overall team performance; the performance of GSAM and Goldman Sachs; the team’s net revenues for the past year which is primarily derived from advisory fees; and anticipated compensation levels among competitor firms. Portfolio managers are rewarded, in part, for their delivery of investment performance, which is reasonably expected to meet or exceed the expectations of clients and fund shareholders in terms of: excess return over an applicable benchmark, peer group ranking, risk management and factors specific to the funds such as yield or regional focus. Performance is judged over 1-, 3- and 5-year time horizons.
The discretionary variable compensation for portfolio managers is also significantly influenced by various factors, including: (1) effective participation in team discussions and process; and (2) management of risk in alignment with the targeted risk parameters and investment objective of the Fund. Other factors may also be considered including: (1) general client/investor orientation and (2) teamwork and leadership.
As part of their year-end discretionary variable compensation and subject to certain eligibility requirements, portfolio managers may receive deferred equity-based and similar awards, in the form of: (1) shares of The Goldman Sachs Group, Inc. (restricted stock units); and, (2) for certain portfolio managers, performance-tracking (or “phantom”) shares of the Fund or multiple funds. Performance-tracking shares are designed to provide a rate of return (net of fees) equal to that of the Fund(s) that a portfolio manager manages, or one or more other eligible funds, as determined by senior management, thereby aligning portfolio manager compensation with fund shareholder interests. The awards are subject to vesting requirements, deferred payment and clawback and forfeiture provisions. GSAM, Goldman Sachs or their affiliates expect, but are not required to, hedge the exposure of the performance-tracking shares of a Fund by, among other things, purchasing shares of the relevant Fund(s).
Other Compensation — In addition to base salary and year-end discretionary variable compensation, the Investment Adviser has a number of additional benefits in place including (1) a 401(k) program that enables employees to direct a percentage of their base salary and bonus income into a tax-qualified retirement plan; and (2) investment opportunity programs in which certain professionals may participate subject to certain eligibility requirements.
Item 8(a)(4)
The following table shows the portfolio managers’ ownership of securities, including those beneficially owned as well as those owned pursuant to the deferred compensation plan discussed above, in the Fund as of September 30, 2020, unless otherwise noted:
Name of Portfolio Manager | Name of Portfolio Manager | |||
Nora Creedon | $ | 0 | ||
Timothy Ryan, CFA | $ | 0 | ||
Sean Brenan | $ | 0 | ||
Collin Bell | $ | 0 | ||
| ITEM 9. | PURCHASES OF EQUITY SECURITIES BY CLOSED-END MANAGEMENT INVESTMENT COMPANY AND AFFILIATED PURCHASERS. |
Not applicable. |
| ITEM 10. | SUBMISSION OF MATTERS TO A VOTE OF SECURITY HOLDERS. |
There have been no material changes to the procedures by which shareholders may recommend nominees to the registrant’s board of trustees. |
| ITEM 11. | CONTROLS AND PROCEDURES. |
| (a) | The registrant’s principal executive and principal financial officers, or persons performing similar functions have concluded that the registrant’s disclosure controls and procedures (as defined in Rule 30a-3(c) under the Investment Company Act of 1940, as amended (the “1940 Act”)) are effective as of a date within 90 days of the filing of this report that includes the disclosure required by this paragraph, based on the evaluation of these controls and procedures required by Rule 30a-3(b) under the 1940 Act and 15d-15(b) under the Securities Exchange Act of 1934, as amended. |
| (b) | There were no changes in the registrant’s internal control over financial reporting (as defined in Rule 30a-3(d) under the 1940 Act) that occurred during the period covered by this report that have materially affected, or are reasonably likely to materially affect, the registrant’s internal control over financial reporting. |
| ITEM 12. | DISCLOSURE OF SECURITIES LENDING ACTIVITIES FOR CLOSED-END MANAGEMENT INVESTMENT COMPANIES |
The registrant did not engage in securities lending activities during the fiscal period reported on this Form N-CSR. |
| ITEM 13. | EXHIBITS. |
| (a)(1) | Goldman Sachs Real Estate Diversified Income Fund’s Code of Ethics for Principal Executive and Senior Financial Officers is filed herewith. | |||
| (a)(2) | Exhibit 99.CERT | Certifications pursuant to Section 302 of the Sarbanes-Oxley Act of 2002 filed herewith. | ||
| (a)(3) | None | |||
| (a)(4)(i) | ||||
| (a)(4)(ii) | ||||
| (b) | Exhibit 99.906CERT | Certifications pursuant to Section 906 of the Sarbanes-Oxley Act of 2002 filed herewith. | ||
SIGNATURES
Pursuant to the requirements of the Securities Exchange Act of 1934 and the Investment Company Act of 1940, the registrant has duly caused this report to be signed on its behalf by the undersigned, thereunto duly authorized.
| Goldman Sachs Real Estate Diversified Income Fund | ||
| By: | /s/ James A. McNamara | |
| James A. McNamara | ||
| President/Chief Executive Officer | ||
| Goldman Sachs Real Estate Diversified Income Fund | ||
| Date: | December 7, 2020 | |
Pursuant to the requirements of the Securities Exchange Act of 1934 and the Investment Company Act of 1940, this report has been signed below by the following persons on behalf of the registrant and in the capacities and on the dates indicated.
| By: | /s/ James A. McNamara | |
| James A. McNamara | ||
| President/Chief Executive Officer | ||
| Goldman Sachs Real Estate Diversified Income Fund | ||
| Date: | December 7, 2020 | |
| By: | /s/ Joseph F. DiMaria | |
| Joseph F. DiMaria | ||
| Principal Financial Officer | ||
| Goldman Sachs Real Estate Diversified Income Fund | ||
| Date: | December 7, 2020 | |