UNITED STATES
SECURITIES AND EXCHANGE COMMISSION
Washington, D.C. 20549
FORM N-CSR
CERTIFIED SHAREHOLDER REPORT OF REGISTERED
MANAGEMENT INVESTMENT COMPANIES
Investment Company Act file number 811-23499
Goldman Sachs Real Estate Diversified Income Fund
(Exact name of registrant as specified in charter)
200 West Street,
New York, New York 10282
(Address of principal executive offices) (Zip code)
Copies to:
| | |
Robert Griffith, Esq. Goldman Sachs & Co. LLC 200 West Street New York, NY 10282 | | Stephen H. Bier, Esq. William J. Bielefeld, Esq. Dechert LLP 1095 Avenue of the Americas New York, NY 10036 |
(Name and address of agents for service)
Registrant’s telephone number, including area code: (212) 902-1000
Date of fiscal year end: September 30
Date of reporting period: September 30, 2024
| ITEM 1. | REPORTS TO STOCKHOLDERS. |
The Annual Report to Shareholders is filed herewith.
Goldman Sachs Interval Fund Annual Report September 30, 2024 Real Estate Diversified Income Fund
Goldman Sachs Real Estate Diversified Income Fund
| | | | | | |
| | | | |
| NOT FDIC-INSURED | | May Lose Value | | No Bank Guarantee | | |
PORTFOLIO RESULTS
Goldman Sachs Real Estate Diversified Income Fund
Investment Objective
The Fund seeks to produce income and achieve capital appreciation with low to moderate volatility and low to moderate correlation to the broader equity markets.
Portfolio Management Discussion and Analysis
Below, the Goldman Sachs Real Estate Securities Investment Team discusses the Goldman Sachs Real Estate Diversified Income Fund’s (the “Fund”) performance and positioning for the 12-month period ended September 30, 2024 (the “Reporting Period”).
| Q | How did the Fund perform during the Reporting Period? |
| A | During the Reporting Period, the Fund’s Class A, Class C, Class I, Class L, Class W, and Class P Shares generated average annual total returns, without sales charges, of 1.97%, 1.23%, 2.22%, 1.72%, 1.93% and 2.22%, respectively. |
| A | As of September 30, 2024, the Fund’s net asset value (“NAV”) for Class A, Class C, Class I, Class L Class W and Class P Shares was $8.36, $8.36, $8.84, $8.37, $8.53 and $8.84, respectively. |
| Q | What distributions did the Fund make during the Reporting Period? |
| A | The Fund’s Class A Shares distributed $0.60 per unit. The Fund’s Class C Shares distributed $0.54 per unit. The Fund’s Class I Shares distributed $0.62 per unit. The Fund’s Class L Shares distributed $0.58 per unit. The Fund’s Class W Shares distributed $0.60 per unit. The Fund’s Class P Shares distributed $0.62 per unit. |
| Q | What economic and market factors most influenced the U.S. real estate securities market as a whole during the Reporting Period? |
| A | For the Reporting Period overall, the U.S. real estate securities market posted positive returns that only modestly underperformed the broader U.S. equity market and significantly outpaced the U.S. fixed income market. The slightly weaker performance of the U.S. real estate securities market compared to the broad U.S. equity market was driven primarily by concerns around when the Federal Reserve (“Fed”) would begin to cut interest rates, refinancing worries within the commercial real estate market, and transaction volumes, which remained subdued but were picking up across the commercial real estate market. These concerns were, however, partially offset with a more optimistic view that the Fed rate hike cycle had concluded, which drove the public real estate securities market to rebound in the last months of the Reporting Period. These factors, combined, also revealed the |
disparities across real estate sectors and property types and highlighted the importance of identifying companies with strong underlying fundamentals, attractive growth prospects and healthy balance sheets.
As the Reporting Period began in the fourth quarter of 2023, the U.S. real estate securities market performed well and outperformed the broader U.S. equity market. Equities began the quarter with negative momentum, as investors digested a more resilient U.S. economy than consensus expected and a higher-for-longer Fed interest rate regime. Momentum then shifted in November and December to end the calendar year with positive performance. November 2023 saw the most significant easing in financial conditions of any month in more than four decades. Market sentiment also took a positive turn on the back of an overall shift in tonality from Fed officials signaling potential easing of monetary policy in the new year due to broader disinflation traction themes, with a gradual cooldown in economic activity while the labor market remained resilient. This produced a rally across U.S. real estate investment trusts (“REITs”) that marked one of the best monthly performances on record in November, all driven by renewed optimism about a soft economic landing and the end of interest rate hikes.
During the first quarter of 2024, the U.S. real estate securities market was generally flat and underperformed the broader U.S. equity market. The U.S. real estate securities market reacted early in the quarter to the news that property charge-offs could potentially be higher in 2024, which was negative but anticipated, specifically in the office sector. (A property charge-off is when a lender or creditor has written off a property loan as a loss and closed the account to future charges.) This led to almost all real estate sub-sectors posting negative returns early in the quarter and only a few posting positive returns at the end of the quarter. In addition, renewed concerns about potential spillover effects to commercial
PORTFOLIO RESULTS
real estate from the individual regional bank struggles had a compounding effect on the already negative sentiment. That said, while financing remained limited and expensive across the real estate sector, transaction markets started to show further re-opening, with the general consensus being that commercial real estate was nearing a bottom.
During the second quarter of 2024, the U.S. real estate securities market underperformed the broader U.S. equity market. Weak performance was driven by still-elevated interest rates, which made borrowing expensive for companies and, as a result, reduced profitability and lowered overall property demand. Market consensus was then predicting only one or two interest rate cuts in 2024, which was notably lower than anticipated when entering the calendar year. Consequently, the real estate securities market showed hesitation to rebound, as higher rates had led to a slower transaction market in commercial real estate and higher mortgages for consumers.
During the third quarter of 2024, the U.S. real estate securities market rebounded and outperformed the broader U.S. equity market by a wide margin. Following data releases in July, which indicated a cooling of inflation, real estate securities generally rebounded on the back of optimism the Fed would begin to cut interest rates at its September meeting. The U.S. real estate securities market also stood out as a comparatively defensive sector given lease-based revenues and a defensive cash flow base. The real estate securities market had come under pressure when interest rates were first hiked approximately two years earlier and then due to the uncertainty that dominated around the timing for the Fed’s first rate cut. In our view, the 50 basis point Fed rate cut that materialized in September 2024 showed promising signs for a recovery in the real estate market with the sector widely expected to deliver positive returns as interest rates started to move down. (A basis point is 1/100th of a percentage point.)
For the Reporting Period overall, all property types in the listed real estate securities market generated positive returns. Health care was the best performing property type, with senior housing REITs performing especially well on the back of strong trends, with increases in both occupancy and market rents. Senior housing also performed well relative to other forms of health care real estate as the aging population drove increased demand. Triple net was the property type that contributed least during the Reporting Period. The triple net sub-sector performed more weakly as the market took a more positive outlook for a soft landing and gravitated to more cyclical areas of the market. Historically, the triple net sub-sector has been viewed as the most defensive within the real estate sector, and thus it underperformed.
| Q | What key factors were responsible for the Fund’s performance during the Reporting Period? |
| A | The listed, or public, equity sleeve of the Fund, which accounted for approximately 32% of the Fund’s net assets across both equity and credit at the end of the Reporting Period, contributed positively to the Fund’s performance. The optimism that surrounded the potential for and actual interest rate cuts in the fourth quarter of 2023 and third quarter of 2024, respectively, helped buoy listed real estate securities’ performance. Conversely, private equity investments, which accounted for approximately 68% of the Fund’s net assets at the end of the Reporting Period, detracted the most from the Fund’s performance, as the private market continued to reprice as transaction markets picked up. |
Preferred REIT stocks overall performed roughly in line with the broader REIT market during the Reporting Period, reacting similarly to the optimism facing interest rate cuts. Preferred stocks continued to play an important role in the Fund’s portfolio, with the goal of providing investors with a level of comparatively higher investment stability and yield sustainability, and thus helping us deliver on the Fund’s investment objective.
| Q | What were some of the Fund’s best-performing individual holdings during the Reporting Period? |
| A | The top individual contributors to the Fund’s performance during the Reporting Period were each in the listed, or public, equity space—Extra Space Storage, Inc. (“Extra Space Storage”), American Tower Corp. (“American Tower”) and AvalonBay Communities, Inc. (“AvalonBay Communities”). |
Extra Space Storage is in the self-storage sub-sector, providing storage and reinsurance services to tenants. During the Reporting Period, the REIT was a beneficiary of declining mortgage rates improving housing velocity, which is a key driver of storage demand. (Housing velocity is a term used to describe the rate at which homes are sold or rental units are leased in a real estate market.) With an improving supply backdrop, the second derivative improved after a multi-year correction in rates from COVID-era highs. (In real estate, a second derivative is a concept used to analyze the acceleration or deceleration of a business’s revenue growth.) At the end of the Reporting Period, we continued to like the sub-sector long term given what we saw as its attractive, longer-term fundamentals and limited capital expenditure requirements.
American Tower is one of the world’s leading telecommunication infrastructure providers. It owns and operates cellphone towers across several regions. The REIT performed well during the Reporting Period given that towers are considered critical infrastructure and because the company benefited from long lease terms with contractual uplifts that
PORTFOLIO RESULTS
drive income growth. These attributes were further supported by new investment by telecommunications providers to keep up with mobile traffic growth. At the end of the Reporting Period, we believed American Tower should be able to drive compelling earnings growth with limited capital investment required, generating attractive returns on capital.
AvalonBay Communities is an apartment REIT with a coastal focus. The company tends to concentrate more in first ring suburbs of major metropolitan areas versus downtown areas. (A first ring suburb, also known as an inner suburb, is a densely populated community that is located near the center of a metropolitan area.) During the Reporting Period, AvalonBay Communities performed well, delivering superior operating results compared to its peers, benefiting from favorable supply-constrained coastal exposure and a sub-sector-leading development pipeline. At the end of the Reporting Period, we continued to favor AvalonBay Communities over other U.S. apartment REITs given its mix of both high quality urban and suburban assets and given its development pipeline that will, in our view, augment its growth as it comes online.
| Q | Which positions detracted significantly from the Fund’s performance during the Reporting Period? |
| A | The positions that detracted most from the Fund’s performance during the Reporting Period were Oaktree Real Estate Income Fund; TA Realty Core Property Fund, LP; and Manulife US REIT. |
Oaktree Real Estate Income Fund is a private real estate investment fund that invests primarily in multi-family and industrial properties. The fund’s investments detracted from its return in the second quarter of 2024—and during the Reporting Period overall—largely driven by appraisers adjusting values lower due to a) the impact of higher interest rates; b) decreases in market rents and net operating income; c) elevated new supply across select multi-family and industrial markets; and d) limited transaction activity. This caused exit cap and discount rate assumptions across multi-family, industrial and office properties to remain flat or slightly increase during the Reporting Period. (In real estate, the exit cap rate is the anticipated rate of return on an investment property at the time of sale. In real estate, the discount rate is the annual rate of return an investor expects to earn on an investment.) While real estate values were impacted by higher operating expenses, these expenses came in below budget year-to-date through September 2024 due to cost savings across property insurance, taxes and labor.
TA Realty Core Property Fund, LP is a private real estate investment fund that invests in industrial, multi-family, retail and office properties. Its negative appreciation since the second quarter of 2022 continued during the Reporting Period,
driven by increases in valuation metrics used to value core real estate, such as discount rates and exit cap rates, which lower the value of properties. At the end of the Reporting Period, our long-term view was that the fund’s portfolio weightings and its respective emphasis on industrial and multi-family properties and lower allocations to office properties continued to position it well for relative performance going forward.
Manulife US REIT is a private REIT that invests across the core real estate sub-sectors, with approximately 80% of its portfolio in industrial and multi-family properties. It weakened during the Reporting Period driven by uncertainty and rising costs in the capital markets, expanding exit cap and discount rates, softening asset-level fundamentals in the office sub-sector, and, to a lesser extent, poor market selection for industrial and multi-family properties.
| Q | How did the Fund use derivatives and similar instruments during the Reporting Period? |
| A | During the Reporting Period, the Fund did not use any derivatives or similar instruments. |
| Q | Did the Fund make any significant purchases or sales during the Reporting Period? |
| A | During the Reporting Period, we re-initiated a Fund position in Public Storage, a self-storage operator, as we liked what we saw as its long-term demand dynamics and attractive valuation. |
Conversely, we sold the Fund’s position in CubeSmart, another self-storage REIT. We sold the position, as we believed it faces pressure on ongoing concerns around housing turnover and higher supply that would impact it more so than its storage peers. We decided to take advantage of other investment opportunities within the sub-sector that we saw as more attractive.
| Q | Were there any changes made in the Fund’s investment strategy during the Reporting Period? |
| A | Early in the Reporting Period, we trimmed some of the Fund’s higher beta, or more volatile, positions after they had performed well and also received proceeds from redemptions of underlying private funds. Additionally, we funded a modest amount of capital calls. (A capital call is a legal right of an investment firm to demand a portion of the money promised to it by an investor. A capital call fund would be the money that had been committed to the fund. Capital calls are often used to secure short-term funding on projects within private equity funds in order to cover the time between the financing agreement and the money received.) |
During the first quarter of 2024, we placed redemption requests in select private funds and invested capital in public real estate securities where we saw compelling valuations.
PORTFOLIO RESULTS
During the second quarter of 2024, we focused on liquidity to meet upcoming capital calls and redemption requests. In the third quarter of 2024, the Fund had limited activity in both its private and public portfolios.
Overall, during the Reporting Period, we increased the Fund’s allocation to private equity funds and modestly decreased its exposures to equity REITs, private credit funds, mortgage REITs and preferred securities.
| Q | Were there any changes to the Fund’s portfolio management team during the Reporting Period? |
| A | Portfolio manager Timothy Ryan left Goldman Sachs Asset Management at the end of July 2024 to pursue another opportunity. Tim’s portfolio management responsibilities for the Fund were assumed by Kristin Kuney and Abhinav Zutshi, who continue to work closely with existing portfolio managers Sean Brenan and John Papadoulias. With these portfolio management team changes, there were no changes to the Fund’s investment philosophy, objective or strategy. |
| Q | How was the Fund positioned at the end of the Reporting Period? |
| A | At the end of the Reporting Period, the Fund was invested with approximately 62% of its total net assets in private equity, approximately 24% of its total net assets in public equity, approximately 6% of its total net assets in private credit, approximately 3% of its total net assets in public credit, approximately 2% of its total net assets in preferred securities and approximately 2% of its total net assets in cash and cash equivalents. |
Approximately 89% of Fund assets was invested in equities representing property types that we believe benefit from strong demographic tailwinds or revenues protected by long-term lease obligations. Approximately 12% of assets was invested in credit instruments diversified across property types and focused on seeking relatively consistent and reliable streams of cash flows and low loan-to-value ratios. (Loan-to-value (“LTV”) ratio equals the loan amount divided by the purchase price or appraised property value. The LTV ratio is one way lenders and financial institutions can assess lending risk before approving a mortgage. Generally, loans that have high LTV ratios are considered more risky and as a result carry higher interest rates—and vice versa.) Even though higher on the capital structure, we believed the Fund’s credit sleeve could generate equity-like returns with lower volatility. The private portion of the Fund was diversified at the end of the Reporting Period across institutional General Partners and strategies.
Within the Fund’s equity sleeve, approximately 30% of assets was invested in the industrial sub-sector, 20% in the multi-family sub-sector, 6% in the student housing sub-sector, 5%
in the lab office sub-sector, 5% in the single family rental sub-sector, 4% in the self-storage sub-sector, 4% in the towers sub-sector, 4% in the senior housing sub-sector, 3% in the lodging sub-sector, 3% in the manufactured housing sub-sector, 2% in the office sub-sector and the remainder across the retail, medical office buildings, data centers and mixed use sub-sectors.
| Q | How did the Fund use leverage during the Reporting Period? |
| A | The lines of credit established by the Fund under our management are bilateral, fully committed, revolving credit facilities. The Fund used leverage intermittently during the Reporting Period as a short-term cash flow management tool. More specifically, the credit agreements maintained by the Fund were typically utilized during quarterly repurchase periods and to dynamically allocate between private and public securities when other sources of capital were not immediately available. Using leverage in this way enables quick market entry to ensure those opportunities were not otherwise missed. The Fund did not use leverage habitually during the Reporting Period, meaning the Fund did not maintain a balance on any credit facility on a recurring basis. |
| Q | What is the Fund’s tactical view and strategy for the months ahead? |
| A | At the end of the Reporting Period, we believed there remained ample opportunity to leverage the differences between private and public real estate to create a complementary value above the sum of the parts. We also believed our ability to arbitrage between the two has helped the Fund’s performance and highlighted the strengths of each—the diversification, liquidity, transparency and market-driven valuations of the public market with the lower volatility and higher income stream the private market can provide. |
Further, at the end of the Reporting Period, we viewed real estate as increasingly attractive based on the sector historically offering strong performance after a period of interest rate hikes. We believed REITs were well positioned to benefit from a normalization of the interest rate environment. The vast majority of public REITs had, in our view, robust balance sheets at the end of the third quarter of 2024, which can be deployed for additional growth. We believed the valuation discount between public and private real estate, while being tighter than it was six and 12 months prior, should normalize further (historically, the public market has traded at a slight premium to the private market) and may provide additional potential upside for public real estate.
More specifically for the Fund, we believed several factors may contribute positively to its performance going forward. First, the Fund may potentially benefit from private and credit exposure. Public markets demonstrated strong performance
PORTFOLIO RESULTS
during the third quarter of 2024, with the FTSE NAREIT All Equity REIT Index up approximately 16% for the quarter, a trend we expect may accrue to private markets in the coming quarters. We have historically observed that private pricing lags public markets by 12 to 18 months. We also highlight that the Fund’s actively managed private/public exposure positions, in our view, should continue to offer potential additional upside.
Second, the Fund may benefit from valuation arbitrage in the months to come. While at the industry level, private and public valuations were relatively in line at the end of the third calendar quarter, there were dispersions at the sub-sector level, providing potential opportunities for the Fund to take advantage of pricing discrepancies across public and private markets. For example, we observed public markets trading at a discount to private in residential real estate, including apartments and single-family rentals.
Third, the Fund may benefit going forward from an interest rate tailwind. Lower interest rates will likely benefit, in our view, the entire real estate industry, but we believe there could be a more acute uplift in private markets and in real estate credit. In our view, private market valuations were bottoming at the end of the Reporting Period and did not yet reflect the upside from lower interest rates and stabilizing fundamentals. As we enter the last quarter of 2024, we believe this stabilization in interest rates may well continue to be a catalyst for a re-rating of real estate and for a recovery in equity prices.
We are watching to see the magnitude of demand increases due to artificial intelligence developments, which could positively impact communication infrastructure. We are also watching the impact global elections may have on both supply-chain reconfiguration and near-shoring. Additionally, we are watching the substantial fiscal stimulus from the Inflation Reduction Act and the Infrastructure and Chips Act may have on certain regions and metropolitan areas in the U.S. Lastly, we are watching the effects the Fed’s easing cycle may have on real assets equities and how it may impact the financing environment. As it stood at the end of the Reporting Period, the financing market remained selectively available for high quality assets and strong sponsors, but the marginal cost of funding remained relatively expensive compared to the average cost of in-place debt, creating some headwinds to overall cash flows. As rates have come down—and may further decline, the potential refinancing headwinds should lessen, in our opinion.
As we move forward, we intend to maintain our active and integrated approach that aims to balance the need for attractive income and capital appreciation, with low to
moderate volatility relative to equity and public real estate markets, by investing primarily in income-producing real estate equity and debt securities. Through this actively managed, closed-end interval Fund, we will continue seeking to provide access to both private and public real estate diversified across property types, geography and asset class (equity and debt).
Sector, sub-sector and property type designations throughout this shareholder report are defined by Goldman Sachs Asset Management.
FUND BASICS
Real Estate Diversified Income Fund
as of September 30, 2024
|
|
TOP TEN HOLDINGS AS OF 9/30/241 |
| | | | |
| | |
Holding | | % of Net
Assets | | Asset Class |
| | |
Oaktree Global Credito FIC FIM | | 9.4% | | Private REIT & Private Investment Funds |
| | |
TA Realty Core Property Fund, LP | | 7.6 | | Private REIT & Private Investment Funds |
| | |
RealTerm Logistics Income Fund | | 5.7 | | Private REIT & Private Investment Funds |
| | |
CBRE U.S. Core Partners, LP | | 5.4 | | Private REIT & Private Investment Funds |
| | |
Wheelock Street Real Estate Long Term Value Fund | | 5.0 | | Private REIT & Private Investment Funds |
| | |
Greystar Student Housing Growth and Income Fund | | 4.9 | | Private REIT & Private Investment Funds |
| | |
Ares Industrial Real Estate Fund, LP | | 4.5 | | Private REIT & Private Investment Funds |
| | |
Harrison Street Core Property Fund, LP | | 4.0 | | Private REIT & Private Investment Funds |
| | |
Sentinel Real Estate Fund | | 3.9 | | Private REIT & Private Investment Funds |
| | |
AvalonBay Communities, Inc. REIT | | 3.2 | | Real Estate Investment Trust (REIT) |
| | 1 | The top 10 holdings may not be representative of the Fund’s future investments. |
Percentage of Net Assets
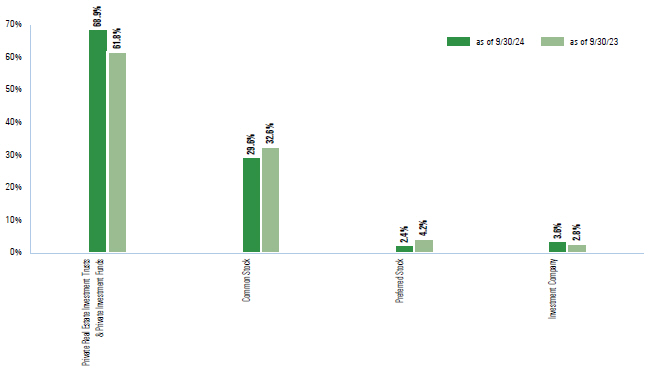
| | 2 | The Fund is actively managed and, as such, its composition may differ over time. Consequently, the Fund’s overall allocations may differ from percentages contained in the graph above. Figures in the above graph may not sum to 100% due to the exclusion of other assets and liabilities. |
For more information about the Fund, please refer to am.gs.com. There, you can learn more about the Fund’s investment strategies, holdings, and performance.
GOLDMAN SACHS REAL ESTATE DIVERSIFIED INCOME FUND
Performance Summary
September 30, 2024
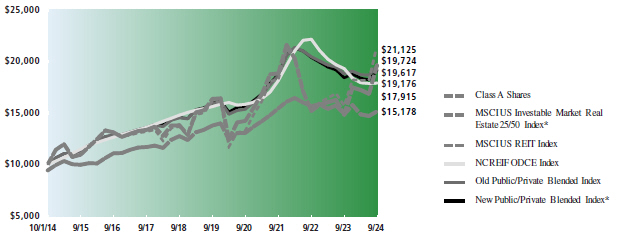
The following graph shows the value, as of September 30, 2024, of a $10,000 investment made on October 1, 2014 in Class A Shares at NAV (with a maximum sales charge of 5.75%). For comparative purposes, the performance of a private/public blended index (70% NCREIF ODCE Index & 30% MSCI US Investable Market Real Estate 25/50 Index, with dividends reinvested) (“New Public/Private Blended Index”), is shown. Prior to April 1, 2024, the performance of a private/public blended index (70% NCREIF ODCE Index & 30% MSCI US REIT Index, with dividends reinvested) (“Old Public/Private Blended Index”), was leveraged for comparison. The Investment Adviser believes that the New Public/Private Blended Index is an appropriate index against which to measure performance in light of the Fund’s investment strategy. Performance reflects applicable fee waivers and/or expense limitations in effect during the periods shown and in their absence, performance would be reduced. Returns do not reflect the deduction of taxes that a shareholder would pay on Fund distributions or the repurchase of Fund shares. The returns set forth below represent past performance. Past performance does not guarantee future results. The Fund’s investment return and principal value will fluctuate so that an investor’s shares, when repurchased, may be worth more or less than their original cost. Current performance may be lower or higher than the performance quoted below. Please visit our web site at am.gs.com to obtain the most recent month-end returns.
|
|
Real Estate Diversified Income Fund’s 10 Year Performance |
Performance of a $10,000 Investment, including any applicable sales charges, with distributions reinvested, from October 1, 2014 through September 30, 2024.
| | | | | | | | | | | | | | | | | | | | | | |
| | | | | |
| | | Average Annual Total Returns through September 30, 2024 **, *** | | One Year | | Five Years | | Ten Years | | Since Inception |
| | | | | |
| | Class A | | | | | | | | | | | | | | | | | | | | |
| | | | | |
| | Excluding sales charges | | | | 1.97 | % | | | | 1.93 | % | | | | 4.88 | % | | | | — | |
| | | | | |
| | | Including sales charges | | | | (4.41 | )% | | | | 0.73 | % | | | | 4.26 | % | | | | — | |
| | | | | |
| | Class C | | | | | | | | | | | | | | | | | | | | |
| | | | | |
| | Excluding contingent deferred sales charges | | | | 1.23 | % | | | | 1.17 | % | | | | 4.10 | % | | | | — | |
| | | | | |
| | | Including contingent deferred sales charges | | | | 0.22 | % | | | | 1.17 | % | | | | 4.10 | % | | | | — | |
| | | | | |
| | | Class I | | | | 2.22 | % | | | | 2.19 | % | | | | 4.90 | % | | | | — | |
| | | | | |
| | Class L (Commenced on July 10, 2017) | | | | | | | | | | | | | | | | | | | | |
| | | | | |
| | Excluding sales charges | | | | 1.72 | % | | | | 1.67 | % | | | | — | | | | | 3.52 | % |
| | | | | |
| | | Including sales charges | | | | (2.59 | )% | | | | 0.80 | % | | | | — | | | | | 2.90 | % |
| | | | | |
| | | Class W (Commenced on November 21, 2014) | | | | 1.93 | % | | | | 1.92 | % | | | | — | | | | | 4.44 | % |
| | | | | |
| | | Class P (Commenced on June 29, 2021) | | | | 2.22 | % | | | | — | | | | | — | | | | | 0.99 | % |
| * | The MSCI US Investable Market Real Estate 25/50 Index was incepted on September 1, 2016 and therefore no performance information is available prior to this date. For the period between October 1, 2014 and September 1, 2016, the performance of the Old Public/Private Blended Index is shown for the New Public/Private Blended Index. |
GOLDMAN SACHS REAL ESTATE DIVERSIFIED INCOME FUND
| ** | These returns assume reinvestment of all distributions at NAV and reflect a maximum initial sales charge of 5.75% for Class A, 4.25% for Class L, and the assumed contingent deferred sales charge of 1% for Class A and C Shares, if repurchased within 18 months and 12 months of purchase, respectively. Because Class P, Class I and Class W Shares do not involve sales charge, such a charge is not applied to their Average Annual Total Returns. |
| *** | After the close of business on May 15, 2020, the Resource Real Estate Diversified Income Fund (the “Predecessor Fund”) was reorganized into the Fund. The Fund has assumed the historical performance of the Predecessor Fund, which was managed by another investment adviser. Therefore, the performance information reported above for the Fund is the combined performance of the Fund and the Predecessor Fund. The performance information shown in this report for periods through May 15, 2020 reflects the performance of the Predecessor Fund. As a result, the Fund’s performance may differ substantially from what is shown for periods through May 15, 2020. |
For more information about the Fund, please refer to am.gs.com. There, you can learn more about the Fund’s investment strategies, holdings, and performance.
GOLDMAN SACHS REAL ESTATE DIVERSIFIED INCOME FUND
|
Consolidated Schedule of Investments September 30, 2024 |
| | | | | | |
| | | Description | | Value | |
| |
| | Private Real Estate Investment Trusts & Private Investment Funds – 68.9%(a) | |
| | |
| | Ares Industrial Real Estate Fund, LP | | | $ 17,610,790 | |
| | Ares US Real Estate Fund IX, LP | | | 5,682,906 | |
| | Bain Capital Real Estate Fund I-B, LP | | | 8,526,144 | |
| | Brookfield Premier Real Estate Partners, LP | | | 1,456,427 | |
| | Brookfield Real Estate Finance Fund V, LP | | | 6,185,079 | |
| | Carlyle Property Investors, LP | | | 9,479,841 | |
| | CBRE U.S. Core Partners, LP | | | 21,140,397 | |
| | Clarion Partners Debt Investment Fund, LP | | | 3,043,644 | |
| | Clarion Ventures 4, LP | | | 2,646,288 | |
| | Greystar Student Housing Growth and Income Fund | | | 19,387,006 | |
| | Harrison Street Core Property Fund, LP | | | 15,891,479 | |
| | Heitman Core Real Estate Debt Income Trust, LP | | | 5,226,497 | |
| | Manulife US REIT | | | 8,421,015 | |
| | Nuveen U.S. Core-Plus Real Estate Debt Fund, LP | | | 7,835,822 | |
| | Oaktree Global Credito FIC FIM | | | 36,872,427 | |
| | Prologis Targeted U.S. Logistics Holdings II, LP | | | 9,293,925 | |
| | RealTerm Logistics Income Fund | | | 22,448,379 | |
| | Sculptor Real Estate Credit Fund, LP | | | 733,768 | |
| | Sentinel Real Estate Fund | | | 15,383,244 | |
| | TA Realty Core Property Fund, LP | | | 30,006,756 | |
| | The Trumbull Property Fund, LP | | | 3,743,635 | |
| | Wheelock Street Real Estate Long Term Value Fund | | | 19,794,738 | |
| | | |
| | TOTAL PRIVATE REAL ESTATE INVESTMENT TRUSTS & PRIVATE INVESTMENT FUNDS | |
| | (Cost $311,045,522) | | | 270,810,207 | |
| | | |
| | | | | | | | |
| | Shares | | | | | | |
| |
| | Common Stocks – 29.6% | |
| |
| | Health Care REITs – 1.3% | |
| | 42,621 | | Alexandria Real Estate Equities, Inc. REIT | | | 5,061,244 | |
| | | |
| |
| | Industrial REITs – 4.7% | |
| | 344,064 | | Americold Realty Trust, Inc. REIT | | | 9,726,689 | |
| | 69,504 | | Prologis, Inc. REIT | | | 8,776,965 | |
| | | | | | | | |
| | | | | | | 18,503,654 | |
| | | |
| |
| | Mortgage Real Estate Investment Trusts (REITs) – 3.6% | |
| | 817,708 | | Ladder Capital Corp. REIT | | | 9,485,413 | |
| | 559,472 | | TPG RE Finance Trust, Inc. REIT | | | 4,772,296 | |
| | | | | | | | |
| | | | | | | 14,257,709 | |
| | | |
| |
| | Residential REITs – 9.5% | |
| | 115,842 | | American Homes 4 Rent, Class A REIT | | | 4,447,174 | |
| | 56,304 | | AvalonBay Communities, Inc. REIT | | | 12,682,476 | |
| | 140,899 | | Equity LifeStyle Properties, Inc. REIT | | | 10,051,735 | |
| | 285,131 | | Invitation Homes, Inc. REIT | | | 10,053,719 | |
| | | | | | | | |
| | | | | | | 37,235,104 | |
| | | |
| | | | | | | | | | |
| | | Shares | | Description | | Value | |
| |
| | Common Stocks – (continued) | |
| |
| | Specialized REITs – 10.5% | |
| | 30,676 | | American Tower Corp. REIT | | | $ 7,134,011 | |
| | 4,849 | | Equinix, Inc. REIT | | | 4,304,118 | |
| | 31,674 | | Extra Space Storage, Inc. REIT | | | 5,707,338 | |
| | 15,688 | | Public Storage REIT | | | 5,708,392 | |
| | 33,884 | | SBA Communications Corp. REIT | | | 8,155,879 | |
| | 308,285 | | VICI Properties, Inc. REIT | | | 10,268,973 | |
| | | | | | | | | | |
| | | | | | | 41,278,711 | |
| | | |
| | TOTAL COMMON STOCKS (Cost $100,188,467) | | | 116,336,422 | |
| | | |
| | | | |
| | | Shares | | Description | | Dividend Rate | | Value | |
| |
| | Preferred Stocks – 2.4% | |
| | |
| | Hotel & Resort REITs – 0.4% | | | | |
| | 66,218 | | Pebblebrook Hotel Trust, Series E | | 6.38% | | | 1,450,836 | |
| | | |
| |
| | Mortgage Real Estate Investment Trusts (REITs) – 2.0% | |
| | 77,545 | | MFA Financial, Inc., Series C | | 6.50% | | | 1,837,817 | |
| | 49,554 | | PennyMac Mortgage Investment Trust, Series B | | 8.00 | | | 1,227,948 | |
| | 73,559 | | Two Harbors Investment Corp., Series B | | 7.63 | | | 1,831,619 | |
| | 128,562 | | Two Harbors Investment Corp., Series A | | 8.13 | | | 3,196,051 | |
| | | | | | | | | | |
| | | | | | | | | 8,093,435 | |
| | | |
| | TOTAL PREFERRED STOCKS (Cost $9,659,717) | | | 9,544,271 | |
| | | |
| | | |
| | | Shares | | Dividend Rate | | Value | |
| |
| | Investment Company – 3.6%(b) | |
| | Goldman Sachs Financial Square Government Fund - Institutional Shares | |
| | 14,195,121 | | 4.854% | | | 14,195,121 | |
| | (Cost $14,195,121) | | | | |
| | TOTAL INVESTMENTS – 104.5% (Cost $435,088,827) | | | $ 410,886,021 | |
| | LIABILITIES IN EXCESS OF OTHER ASSETS – (4.5)% | | | (17,524,452 | ) |
| | NET ASSETS – 100.0% | | | $ 393,361,569 | |
The percentage shown for each investment category reflects the value of investments in that category as a percentage of net assets.
| | |
| The accompanying notes are an integral part of these consolidated financial statements. | | 11 |
GOLDMAN SACHS REAL ESTATE DIVERSIFIED INCOME FUND
|
Consolidated Schedule of Investments (continued) September 30, 2024 |
| (a) | Restricted securities are not registered under the Securities Act of 1933 and are subject to legal restrictions on sale. These securities generally may be resold in transactions exempt from registration or to the public if the securities are subsequently registered and the registration statement is effective. Disposal of these securities may involve time consuming negotiations and prompt sale at an acceptable price may be difficult. Total market value of restricted securities amounts to $270,810,207, which represents approximately 68.9% of net assets as of September 30, 2024. See additional details below: |
| | | | | | | | |
| Security | |
| Date(s) of
Purchase |
| | | Cost | |
Ares Industrial Real Estate Fund, LP | | | 12/21/22-01/19/23 | | | | $19,512,709 | |
Ares US Real Estate Fund IX, LP | | | 09/19/19-09/12/24 | | | | 6,379,662 | |
Bain Capital Real Estate Fund I-B, LP | | | 12/18/19-08/12/24 | | | | 6,222,362 | |
Brookfield Premier Real Estate Partners, LP | | | 10/01/19-12/20/21 | | | | 1,615,754 | |
Brookfield Real Estate Finance Fund V, LP | | | 10/03/19-09/12/24 | | | | 10,001,159 | |
Carlyle Property Investors, LP | | | 10/01/19-03/28/24 | | | | 10,052,448 | |
CBRE U.S. Core Partners, LP | | | 03/30/22-01/19/24 | | | | 26,489,411 | |
Clarion Partners Debt Investment Fund, LP | | | 02/14/17-08/01/22 | | | | 2,531,142 | |
Clarion Ventures 4, LP | | | 07/01/16-07/10/19 | | | | 6,923,743 | |
Greystar Student Housing Growth and Income Fund | | | 01/04/22-10/24/23 | | | | 20,921,738 | |
Harrison Street Core Property Fund, LP | | | 09/15/21-10/26/23 | | | | 18,051,478 | |
Heitman Core Real Estate Debt Income Trust, LP | | | 07/27/17-01/26/23 | | | | 6,465,322 | |
Manulife US REIT | | | 04/08/22-07/23/24 | | | | 13,044,354 | |
Nuveen U.S. Core-Plus Real Estate Debt Fund, LP | | | 10/01/19-10/31/23 | | | | 11,213,608 | |
Oaktree Global Credito FIC FIM | | | 10/07/21-12/27/23 | | | | 41,194,702 | |
Prologis Targeted U.S. Logistics Holdings II, LP | | | 01/03/20-06/20/23 | | | | 7,938,955 | |
RealTerm Logistics Income Fund | | | 04/18/22-11/06/23 | | | | 25,534,303 | |
Sculptor Real Estate Credit Fund, LP | | | 01/21/20-09/25/24 | | | | 1,588,330 | |
Sentinel Real Estate Fund | | | 05/04/22-01/16/24 | | | | 18,375,953 | |
TA Realty Core Property Fund, LP | | | 01/04/22-11/07/23 | | | | 32,522,875 | |
The Trumbull Property Fund, LP | | | 01/04/16-10/01/18 | | | | 4,629,525 | |
Wheelock Street Real Estate Long Term Value Fund | | | 04/23/24-09/10/24 | | | | 19,835,989 | |
Total | | | | | | | $311,045,522 | |
| (b) | Represents an affiliated issuer. |
| | |
| Investment Abbreviations: |
| LP | | —Limited Partnership |
| REIT | | —Real Estate Investment Trust |
|
|
ADDITIONAL INVESTMENT INFORMATION |
Additional information on investments in private real estate investment funds:
| | | | | | | | | | | | | | | | |
| Security | | Value | | | Redemption Frequency | | | Redemption Notice (Days) | | | Unfunded Commitments as of September 30, 2024 | |
|
| |
| | | | |
Ares Industrial Real Estate Fund, LP | | $ | 17,610,790 | | | | Quarterly | | | | 90 | | | | $ – | |
|
| |
| | | | |
Ares US Real Estate Fund IX, LP | | | 5,682,906 | | | | N/R | | | | N/R | | | | 846,045 | |
|
| |
| | | | |
Bain Capital Real Estate Fund I-B, LP | | | 8,526,144 | | | | N/R | | | | N/R | | | | 2,263,827 | |
|
| |
| | |
| 12 | | The accompanying notes are an integral part of these consolidated financial statements. |
GOLDMAN SACHS REAL ESTATE DIVERSIFIED INCOME FUND
| | | | | | | | | | | | | | | | |
| | | | |
Brookfield Premier Real Estate Partners, LP | | $ | 1,456,427 | | | | Quarterly | | | | 90 | | | | $ – | |
|
| |
| | | | |
Brookfield Real Estate Finance Fund V, LP | | | 6,185,079 | | | | N/R | | | | N/R | | | | 8,012,495 | |
|
| |
| | | | |
Carlyle Property Investors, LP | | | 9,479,841 | | | | Quarterly | | | | 90 | | | | – | |
|
| |
| | | | |
CBRE U.S. Core Partners, LP | | | 21,140,397 | | | | Quarterly | | | | 60 | | | | – | |
|
| |
| | | | |
Clarion Partners Debt Investment Fund, LP | | | 3,043,644 | | | | N/R | | | | N/R | | | | 4,652,799 | |
|
| |
| | | | |
Clarion Ventures 4, LP | | | 2,646,288 | | | | N/R | | | | N/R | | | | 963,242 | |
|
| |
| | | | |
Greystar Student Housing Growth and Income Fund | | | 19,387,006 | | | | Quarterly | | | | 90 | | | | – | |
|
| |
| | | | |
Harrison Street Core Property Fund, LP | | | 15,891,479 | | | | Quarterly | | | | 45 | | | | – | |
|
| |
| | | | |
Heitman Core Real Estate Debt Income Trust, LP | | | 5,226,497 | | | | Quarterly | | | | 90 | | | | – | |
|
| |
| | | | |
Manulife US REIT | | | 8,421,015 | | | | Quarterly | | | | 60 | | | | – | |
|
| |
| | | | |
Nuveen U.S. Core-Plus Real Estate Debt Fund, LP | | | 7,835,822 | | | | Quarterly | | | | 45 | | | | – | |
|
| |
| | | | |
Oaktree Global Credito FIC FIM | | | 36,872,427 | | | | N/R | | | | N/R | | | | – | |
|
| |
| | | | |
Prologis Targeted U.S. Logistics Holdings II, LP | | | 9,293,925 | | | | Quarterly | | | | 90 | | | | – | |
|
| |
| | | | |
RealTerm Logistics Income Fund | | | 22,448,379 | | | | Quarterly | | | | 90 | | | | – | |
|
| |
| | | | |
Sculptor Real Estate Credit Fund, LP | | | 733,768 | | | | N/R | | | | N/R | | | | 3,306,250 | |
|
| |
| | | | |
Sentinel Real Estate Fund | | | 15,383,244 | | | | Quarterly | | | | 90 | | | | – | |
|
| |
| | | | |
TA Realty Core Property Fund, LP | | | 30,006,756 | | | | Quarterly | | | | 45 | | | | – | |
|
| |
| | | | |
The Trumbull Property Fund, LP | | | 3,743,635 | | | | Quarterly | | | | 60 | | | | – | |
|
| |
| | | | |
Wheelock Street Real Estate Long Term Value Fund | | | 19,794,738 | | | | Annually | | | | 90 | | | | 5,164,011 | |
|
| |
N/R - Not Redeemable
| | |
| The accompanying notes are an integral part of these consolidated financial statements. | | 13 |
GOLDMAN SACHS REAL ESTATE DIVERSIFIED INCOME FUND
|
Consolidated Statement of Assets and Liabilities September 30, 2024 |
| | | | | | | | |
| | | | | Real Estate Diversified Income Fund(a) | | |
| | | |
| | | Assets: | | | | | | |
| | | |
| | Investments in unaffiliated issuers, at value (cost $420,893,706) | | $ | 396,690,900 | | | |
| | Investments in affiliated issuers, at value (cost $14,195,121) | | | 14,195,121 | | | |
| | Receivables: | | | | | | |
| | Dividends | | | 1,998,480 | | | |
| | Fund shares sold | | | 492,564 | | | |
| | Reimbursement from investment adviser | | | 48,166 | | | |
| | Other assets | | | 260,000 | | | |
| | Total assets | | | 413,685,231 | | | |
| | | |
| | Liabilities: | | | | | | |
| | | |
| | Payables: | | | | | | |
| | Investments purchased | | | 18,406,947 | | | |
| | Due to custodian | | | 1,360,073 | | | |
| | Management fees | | | 203,906 | | | |
| | Distribution and Service fees and Transfer Agency fees | | | 40,649 | | | |
| | Accrued expenses | | | 312,087 | | | |
| | Total liabilities | | | 20,323,662 | | | |
| | Commitments and contingencies | | | | | | |
| | | |
| | Net Assets: | | | | | | |
| | | |
| | Paid-in capital | | | 407,637,421 | | | |
| | Total distributable loss | | | (14,275,852 | ) | | |
| | NET ASSETS | | $ | 393,361,569 | | | |
| | | | | | | | |
| | | Net Assets: | | | | | | |
| | | Class A | | $ | 61,073,121 | | | |
| | | Class C | | | 19,905,607 | | | |
| | | Class I | | | 93,750,471 | | | |
| | | Class L | | | 3,792,801 | | | |
| | | Class W | | | 20,742,463 | | | |
| | | Class P | | | 194,097,106 | | | |
| | | Total Net Assets | | $ | 393,361,569 | | | |
| | | Shares Outstanding $0.001 par value (unlimited number of shares authorized): | | | | | | |
| | | Class A | | | 7,305,485 | | | |
| | | Class C | | | 2,381,098 | | | |
| | | Class I | | | 10,610,434 | | | |
| | | Class L | | | 453,207 | | | |
| | | Class W | | | 2,432,310 | | | |
| | | Class P | | | 21,946,133 | | | |
| | | Net asset value, offering and repurchase price per share:(b) | | | | | | |
| | | Class A | | $ | 8.36 | | | |
| | | Class C | | | 8.36 | | | |
| | | Class I | | | 8.84 | | | |
| | | Class L | | | 8.37 | | | |
| | | Class W | | | 8.53 | | | |
| | | Class P | | | 8.84 | | | |
| (a) | Statement of Assets and Liabilities for the Fund is consolidated and includes the balances of wholly owned subsidiaries DIF Investments LLC, DIF Investments II LLC, and DIF Investments III LLC. Accordingly, all interfund balances and transactions have been eliminated. |
| (b) | Maximum public offering price per share for Class A is $8.87 and Class L is $8.74. Upon repurchase, Class C Shares may be subject to a contingent deferred sales charge, assessed on the amount equal to the lesser of the current net asset value (“NAV”) or the original purchase price of the shares. |
| | |
| 14 | | The accompanying notes are an integral part of these consolidated financial statements. |
GOLDMAN SACHS REAL ESTATE DIVERSIFIED INCOME FUND
|
Consolidated Statement of Operations For the Fiscal Year Ended September 30, 2024 |
| | | | | | | | |
| | | | | Real Estate
Diversified Income
Fund(a) | | | |
| | | |
| | | Investment income: | | | | | | |
| | | |
| | Dividends — unaffiliated issuers | | $ | 11,994,909 | | | |
| | | |
| | Dividends — affiliated issuers | | | 595,074 | | | |
| | |
| | Total Investment Income | | | 12,589,983 | | | |
| | |
| | | | | | | | |
| | | |
| | Expenses: | | | | | | |
| | | |
| | Management fees | | | 5,320,143 | | | |
| | | |
| | Professional fees | | | 879,912 | | | |
| | | |
| | Transfer Agency fees | | | 595,856 | | | |
| | | |
| | Distribution and/or Service (12b-1) fees(b) | | | 443,035 | | | |
| | | |
| | Interest on borrowing | | | 404,523 | | | |
| | | |
| | Custody, accounting and administrative services | | | 302,874 | | | |
| | | |
| | Printing and mailing costs | | | 196,383 | | | |
| | | |
| | Registration fees | | | 131,773 | | | |
| | | |
| | Shareholder Service fees(b) | | | 82,169 | | | |
| | | |
| | Trustee fees | | | 32,412 | | | |
| | | |
| | Other | | | 120,044 | | | |
| | |
| | Total expenses | | | 8,509,124 | | | |
| | |
| | Less — expense reductions | | | (175,517 | ) | | |
| | |
| | Net expenses | | | 8,333,607 | | | |
| | |
| | NET INVESTMENT INCOME | | | 4,256,376 | | | |
| | |
| | | | | | | | |
| | | |
| | Realized and Unrealized gain (loss): | | | | | | |
| | | |
| | Net realized gain (loss) from: | | | | | | |
| | | |
| | Investments — unaffiliated issuers | | | (9,494,048 | ) | | |
| | | |
| | Net change in unrealized gain (loss) on: | | | | | | |
| | | |
| | Investments — unaffiliated issuers | | | 13,461,813 | | | |
| | |
| | Net realized and unrealized gain | | | 3,967,765 | | | |
| | |
| | NET INCREASE IN NET ASSETS RESULTING FROM OPERATIONS | | $ | 8,224,141 | | | |
| | |
| | (a) | Statement of Operations for the Fund is consolidated and includes the balances of wholly owned subsidiaries DIF Investments LLC, DIF Investments II LLC, and DIF Investments III LLC. Accordingly, all interfund balances and transactions have been eliminated. |
| | (b) | Class specific Distribution and/or Service and Shareholder Service fees were as follows: |
| | | | | | | | | | | | | | | | | | | | |
| Distribution and/or Service (12b-1) Fees | | Shareholder Service Fees |
| | | Class A | | Class C | | Class L | | Class W | | | | | | Class C | | | | Class L | | |
| | $157,974 | | $215,384 | | $10,373 | | $59,304 | | | | | | $71,796 | | | | $10,373 | | |
| | |
| The accompanying notes are an integral part of these consolidated financial statements. | | 15 |
GOLDMAN SACHS REAL ESTATE DIVERSIFIED INCOME FUND
|
Consolidated Statements of Changes in Net Assets |
| | | | | | | | | | | | |
| | | | | Real Estate Diversified Income Fund(a) | | | |
| | | | | For the Fiscal Year Ended
September 30, 2024 | | | For the Fiscal Year Ended
September 30, 2023 | | | |
| | | | |
| | | From operations: | | | | | | | | | | |
| | | | |
| | Net investment income | | $ | 4,256,376 | | | $ | 8,383,466 | | | |
| | | | |
| | Net realized loss | | | (9,494,048 | ) | | | (2,225,711 | ) | | |
| | | | |
| | Net change in unrealized gain (loss) | | | 13,461,813 | | | | (31,441,684 | ) | | |
| | |
| | Net increase (decrease) in net assets resulting from operations | | | 8,224,141 | | | | (25,283,929 | ) | | |
| | |
| | | | | | | | | | | | |
| | | | |
| | Distributions to shareholders: | | | | | | | | | | |
| | | | |
| | From distributable earnings: | | | | | | | | | | |
| | | | |
| | Class A Shares | | | (114,477 | ) | | | (1,293,136 | ) | | |
| | | | |
| | Class C Shares | | | (41,719 | ) | | | (661,185 | ) | | |
| | | | |
| | Class I Shares | | | (172,534 | ) | | | (2,053,655 | ) | | |
| | | | |
| | Class L Shares | | | (7,078 | ) | | | (79,939 | ) | | |
| | | | |
| | Class W Shares | | | (40,771 | ) | | | (588,504 | ) | | |
| | | | |
| | Class P Shares | | | (360,104 | ) | | | (4,180,466 | ) | | |
| | | | |
| | From return of capital: | | | | | | | | | | |
| | | | |
| | Class A Shares | | | (4,353,499 | ) | | | (4,004,725 | ) | | |
| | | | |
| | Class C Shares | | | (1,586,568 | ) | | | (2,047,630 | ) | | |
| | | | |
| | Class I Shares | | | (6,561,415 | ) | | | (6,359,977 | ) | | |
| | | | |
| | Class L Shares | | | (269,175 | ) | | | (247,564 | ) | | |
| | | | |
| | Class W Shares | | | (1,550,521 | ) | | | (1,822,544 | ) | | |
| | | | |
| | Class P Shares | | | (13,694,601 | ) | | | (12,946,520 | ) | | |
| | |
| | Total distributions to shareholders | | | (28,752,462 | ) | | | (36,285,845 | ) | | |
| | |
| | | | | | | | | | | | |
| | | | |
| | From share transactions: | | | | | | | | | | |
| | | | |
| | Proceeds from sales of shares | | | 32,578,542 | | | | 73,256,595 | | | |
| | | | |
| | Reinvestment of distributions | | | 14,309,375 | | | | 20,210,490 | | | |
| | | | |
| | Cost of shares repurchased | | | (119,383,121 | ) | | | (124,541,428 | ) | | |
| | |
| | Net decrease in net assets resulting from share transactions | | | (72,495,204 | ) | | | (31,074,343 | ) | | |
| | |
| | TOTAL DECREASE | | | (93,023,525 | ) | | | (92,644,117 | ) | | |
| | |
| | | | | | | | | | | | |
| | | | |
| | Net Assets: | | | | | | | | | | |
| | Beginning of year | | $ | 486,385,094 | | | $ | 579,029,211 | | | |
| | |
| | End of year | | $ | 393,361,569 | | | $ | 486,385,094 | | | |
| | |
| | (a) | The Statements of Changes in Net Assets for the Fund is consolidated and includes the balances of wholly owned subsidiaries DIF Investments LLC, DIF Investments II LLC, and DIF Investments III LLC. Accordingly, all interfund balances and transactions have been eliminated. |
| | |
| 16 | | The accompanying notes are an integral part of these consolidated financial statements. |
GOLDMAN SACHS REAL ESTATE DIVERSIFIED INCOME FUND
|
Consolidated Statement of Cash Flows(a) For the Fiscal Year Ended September 30, 2024 |
| | | | | | | | |
| | | |
| | | Increase (Decrease) in cash – Cash flows provided by operating activities: | | | | | | |
| | | |
| | Net increase in net assets from operations | | $ | 8,224,141 | | | |
| | | |
| | Adjustments to reconcile net increase in net assets from operations to net cash provided by (used in) operating activities: | | | | | | |
| | | |
| | Payments for purchases of investments | | | (61,641,144 | ) | | |
| | | |
| | Proceeds from sales of investments | | | 156,943,367 | | | |
| | | |
| | Net (payments for purchase) proceeds from sales of short-term investment securities | | | (788,286 | ) | | |
| | | |
| | (Increase) Decrease in assets: | | | | | | |
| | | |
| | Receivable for dividends | | | 1,010,410 | | | |
| | | |
| | Collateral for credit facility | | | 46,148 | | | |
| | | |
| | Reimbursement from investment adviser | | | 182,075 | | | |
| | | |
| | Other assets | | | (13,397 | ) | | |
| | | |
| | Increase (Decrease) in liabilities: | | | | | | |
| | | |
| | Distribution and Service fees and Transfer Agency fees | | | (161,595 | ) | | |
| | | |
| | Management fees | | | (313,671 | ) | | |
| | | |
| | Accrued expenses | | | (290,857 | ) | | |
| | | |
| | Net realized (gain) loss on: | | | | | | |
| | | |
| | Investments | | | 9,494,048 | | | |
| | | |
| | Net change in unrealized (gain) loss on: | | | | | | |
| | | |
| | Investments | | | (13,461,813 | ) | | |
| | |
| | Net cash provided by operating activities | | | 99,229,426 | | | |
| | |
| | | | | | | | |
| | | |
| | Cash flows used in financing activities: | | | | | | |
| | | |
| | Proceeds from sale of shares | | | 32,947,814 | | | |
| | | |
| | Cost of shares repurchased | | | (119,383,121 | ) | | |
| | | |
| | Increase in payable to custodian | | | 1,360,073 | | | |
| | | |
| | Distributions paid | | | (14,443,087 | ) | | |
| | | |
| | Drawdowns from line of credit | | | 35,000,000 | | | |
| | | |
| | Repayment of line of credit | | | (35,000,000 | ) | | |
| | |
| | Net cash used in financing activities | | | (99,518,321 | ) | | |
| | |
| | | | | | | | |
| | |
| | NET DECREASE IN CASH | | $ | (288,895 | ) | | |
| | |
| | | | | | | | |
| | | |
| | Cash (restricted and unrestricted): | | | | | | |
| | Beginning of year | | $ | 288,895 | | | |
| | |
| | End of year | | $ | — | | | |
| | |
| | | |
| | Supplemental disclosure: | | | | | | |
| | | |
| | Cash paid for interest and related fees | | | 404,523 | | | |
| | | |
| | Reinvestment of distributions | | | 14,309,375 | | | |
| | |
(a) Statement of Cash Flows for the Fund is consolidated and includes the balances of wholly owned subsidiaries DIF Investments LLC, DIF Investments II LLC, and DIF Investments III LLC. Accordingly, all interfund balances and transactions have been eliminated.
| | |
| The accompanying notes are an integral part of these consolidated financial statements. | | 17 |
GOLDMAN SACHS REAL ESTATE DIVERSIFIED INCOME FUND
|
Consolidated Financial Highlights Selected Data for a Share Outstanding Throughout Each Year |
| | | | | | | | | | | | | | | | | | | | | | | | | | | | | |
| | | | | Real Estate Diversified Income Fund | | |
| | | |
| | | | | Class A Shares | | |
| | | |
| | | | | Year Ended September 30, | | |
| | | | | | | |
| | | | | 2024 | | 2023 | | 2022 | | 2021 | | 2020 | | |
| | | | | | | |
| | Per Share Data | | | | | | | | | | | | | | | | | | | | | | | | | | | |
| | | | | | | |
| | Net asset value, beginning of year | | | $ | 8.79 | | | | $ | 9.91 | | | | $ | 10.45 | | | | $ | 9.38 | | | | $ | 10.69 | | | |
| | |
| | | | | | | |
| | Net investment income(a) | | | | 0.08 | | | | | 0.14 | | | | | 0.21 | | | | | 0.20 | | | | | 0.29 | | | |
| | | | | | | |
| | Net realized and unrealized gain (loss) | | | | 0.09 | | | | | (0.61 | ) | | | | (0.04 | ) | | | | 1.47 | | | | | (0.89 | ) | | |
| | |
| | | | | | | |
| | Total from investment operations | | | | 0.17 | | | | | (0.47 | ) | | | | 0.17 | | | | | 1.67 | | | | | (0.60 | ) | | |
| | |
| | | | | | | |
| | Distributions to shareholders from net investment income | | | | (0.01 | ) | | | | – | | | | | (0.19 | ) | | | | (0.34 | ) | | | | (0.23 | ) | | |
| | | | | | | |
| | Distributions to shareholders from net realized gains | | | | – | | | | | (0.15 | ) | | | | (0.11 | ) | | | | (0.26 | ) | | | | (0.30 | ) | | |
| | | | | | | |
| | Distributions to shareholders from return of capital | | | | (0.59 | ) | | | | (0.50 | ) | | | | (0.41 | ) | | | | – | | | | | (0.18 | ) | | |
| | |
| | | | | | | |
| | Total distributions | | | | (0.60 | ) | | | | (0.65 | ) | | | | (0.71 | ) | | | | (0.60 | ) | | | | (0.71 | ) | | |
| | |
| | | | | | | |
| | Net asset value, end of year | | | $ | 8.36 | | | | $ | 8.79 | | | | $ | 9.91 | | | | $ | 10.45 | | | | $ | 9.38 | | | |
| | |
| | | | | | | |
| | Total Return(b) | | | | 1.97 | % | | | | (5.05 | )% | | | | 1.43 | % | | | | 18.24 | % | | | | (5.20 | )% | | |
| | |
| | | | | | | |
| | Net assets, end of year (in 000’s) | | | $ | 61,073 | | | | $ | 69,953 | | | | $ | 80,263 | | | | $ | 83,054 | | | | $ | 87,520 | | | |
| | | | | | | |
| | Ratio of net expense to average net assets after interest expenses | | | | 2.09 | % | | | | 2.17 | % | | | | 2.05 | % | | | | 2.10 | % | | | | 2.19 | % | | |
| | | | | | | |
| | Ratio of net investment income to average net assets | | | | 0.89 | % | | | | 1.42 | % | | | | 1.97 | % | | | | 2.02 | % | | | | 2.88 | % | | |
| | | | | | | |
| | Ratio of net expense to average net assets before interest expenses | | | | 1.99 | % | | | | 1.99 | % | | | | 1.98 | % | | | | 1.99 | % | | | | 1.99 | % | | |
| | | | | | | |
| | Ratio of total expense to average net assets after interest expenses | | | | 2.13 | % | | | | 2.22 | % | | | | 2.06 | % | | | | 2.34 | % | | | | 2.28 | % | | |
| | | | | | | |
| | Portfolio turnover rate(c) | | | | 17 | % | | | | 46 | % | | | | 56 | % | | | | 73 | % | | | | 53 | % | | |
| | |
| | (a) | Calculated based on the average shares outstanding methodology. |
| | (b) | Assumes investment at the NAV at the beginning of the year, reinvestment of all dividends and distributions, a complete repurchase of the investment at the NAV at the end of the year and no sales or repurchase charges (if any). Total returns would be reduced if a sales or repurchase charge was taken into account. Returns do not reflect the impact of taxes to shareholders relating to Fund distributions or the repurchase of Fund shares. |
| | (c) | The Fund’s portfolio turnover rate is calculated in accordance with regulatory requirements, without regard to transactions involving short term investments and certain derivatives. If such transactions were included, the Fund’s portfolio turnover rate may be higher. |
| | |
| 18 | | The accompanying notes are an integral part of these consolidated financial statements. |
GOLDMAN SACHS REAL ESTATE DIVERSIFIED INCOME FUND
|
Consolidated Financial Highlights (continued) Selected Data for a Share Outstanding Throughout Each Year |
| | | | | | | | | | | | | | | | | | | | | | | | | | | | | |
| | | | | Real Estate Diversified Income Fund | | |
| | | |
| | | | | Class C Shares | | |
| | | |
| | | | | Year Ended September 30, | | |
| | | | | | | |
| | | | | 2024 | | 2023 | | 2022 | | 2021 | | 2020 | | |
| | | | | | | |
| | Per Share Data | | | | | | | | | | | | | | | | | | | | | | | | | | | |
| | | | | | | |
| | Net asset value, beginning of year | | | $ | 8.79 | | | | $ | 9.91 | | | | $ | 10.45 | | | | $ | 9.38 | | | | $ | 10.68 | | | |
| | |
| | | | | | | |
| | Net investment income(a) | | | | 0.01 | | | | | 0.06 | | | | | 0.12 | | | | | 0.13 | | | | | 0.20 | | | |
| | | | | | | |
| | Net realized and unrealized gain (loss) | | | | 0.10 | | | | | (0.60 | ) | | | | (0.03 | ) | | | | 1.46 | | | | | (0.87 | ) | | |
| | |
| | | | | | | |
| | Total from investment operations | | | | 0.11 | | | | | (0.54 | ) | | | | 0.09 | | | | | 1.59 | | | | | (0.67 | ) | | |
| | |
| | | | | | | |
| | Distributions to shareholders from net investment income | | | | (0.06 | ) | | | | – | | | | | (0.16 | ) | | | | (0.26 | ) | | | | (0.16 | ) | | |
| | | | | | | |
| | Distributions to shareholders from net realized gains | | | | – | | | | | (0.16 | ) | | | | (0.11 | ) | | | | (0.26 | ) | | | | (0.29 | ) | | |
| | | | | | | |
| | Distributions to shareholders from return of capital | | | | (0.48 | ) | | | | (0.42 | ) | | | | (0.36 | ) | | | | – | | | | | (0.18 | ) | | |
| | |
| | | | | | | |
| | Total distributions | | | | (0.54 | ) | | | | (0.58 | ) | | | | (0.63 | ) | | | | (0.52 | ) | | | | (0.63 | ) | | |
| | |
| | | | | | | |
| | Net asset value, end of year | | | $ | 8.36 | | | | $ | 8.79 | | | | $ | 9.91 | | | | $ | 10.45 | | | | $ | 9.38 | | | |
| | |
| | | | | | | |
| | Total Return(b) | | | | 1.23 | % | | | | (5.77 | )% | | | | 0.67 | % | | | | 17.37 | % | | | | (5.94 | )% | | |
| | |
| | | | | | | |
| | Net assets, end of year (in 000’s) | | | $ | 19,906 | | | | $ | 37,064 | | | | $ | 54,094 | | | | $ | 69,360 | | | | $ | 72,826 | | | |
| | | | | | | |
| | Ratio of net expense to average net assets after interest expenses | | | | 2.83 | % | | | | 2.91 | % | | | | 2.81 | % | | | | 2.84 | % | | | | 2.94 | % | | |
| | | | | | | |
| | Ratio of net investment income to average net assets | | | | 0.07 | % | | | | 0.63 | % | | | | 1.18 | % | | | | 1.27 | % | | | | 2.04 | % | | |
| | | | | | | |
| | Ratio of net expense to average net assets before interest expenses | | | | 2.74 | % | | | | 2.73 | % | | | | 2.74 | % | | | | 2.74 | % | | | | 2.74 | % | | |
| | | | | | | |
| | Ratio of total expense to average net assets after interest expenses | | | | 2.87 | % | | | | 2.95 | % | | | | 2.82 | % | | | | 3.09 | % | | | | 3.04 | % | | |
| | | | | | | |
| | Portfolio turnover rate(c) | | | | 17 | % | | | | 46 | % | | | | 56 | % | | | | 73 | % | | | | 53 | % | | |
| | |
| | (a) | Calculated based on the average shares outstanding methodology. |
| | (b) | Assumes investment at the NAV at the beginning of the year, reinvestment of all dividends and distributions, a complete repurchase of the investment at the NAV at the end of the year and no sales or repurchase charges (if any). Total returns would be reduced if a sales or repurchase charge was taken into account. Returns do not reflect the impact of taxes to shareholders relating to Fund distributions or the repurchase of Fund shares. |
| | (c) | The Fund’s portfolio turnover rate is calculated in accordance with regulatory requirements, without regard to transactions involving short term investments and certain derivatives. If such transactions were included, the Fund’s portfolio turnover rate may be higher. |
| | |
| The accompanying notes are an integral part of these consolidated financial statements. | | 19 |
GOLDMAN SACHS REAL ESTATE DIVERSIFIED INCOME FUND
|
Consolidated Financial Highlights (continued) Selected Data for a Share Outstanding Throughout Each Year |
| | | | | | | | | | | | | | | | | | | | | | | | | | | | | |
| | | | | Real Estate Diversified Income Fund | | |
| | | |
| | | | | Class I Shares | | |
| | | |
| | | | | Year Ended September 30, | | |
| | | | | | | |
| | | | | 2024 | | 2023 | | 2022 | | 2021 | | 2020 | | |
| | | | | | | |
| | Per Share Data | | | | | | | | | | | | | | | | | | | | | | | | | | | |
| | | | | | | |
| | Net asset value, beginning of year | | | $ | 9.26 | | | | $ | 10.40 | | | | $ | 10.93 | | | | $ | 9.78 | | | | $ | 11.13 | | | |
| | |
| | | | | | | |
| | Net investment income(a) | | | | 0.10 | | | | | 0.17 | | | | | 0.26 | | | | | 0.24 | | | | | 0.33 | | | |
| | | | | | | |
| | Net realized and unrealized gain (loss) | | | | 0.10 | | | | | (0.64 | ) | | | | (0.05 | ) | | | | 1.54 | | | | | (0.93 | ) | | |
| | |
| | | | | | | |
| | Total from investment operations | | | | 0.20 | | | | | (0.47 | ) | | | | 0.21 | | | | | 1.78 | | | | | (0.60 | ) | | |
| | |
| | | | | | | |
| | Distributions to shareholders from net investment income | | | | (0.02 | ) | | | | – | | | | | (0.19 | ) | | | | (0.37 | ) | | | | (0.26 | ) | | |
| | | | | | | |
| | Distributions to shareholders from net realized gains | | | | – | | | | | (0.16 | ) | | | | (0.11 | ) | | | | (0.26 | ) | | | | (0.31 | ) | | |
| | | | | | | |
| | Distributions to shareholders from return of capital | | | | (0.60 | ) | | | | (0.51 | ) | | | | (0.44 | ) | | | | – | | | | | (0.18 | ) | | |
| | |
| | | | | | | |
| | Total distributions | | | | (0.62 | ) | | | | (0.67 | ) | | | | (0.74 | ) | | | | (0.63 | ) | | | | (0.75 | ) | | |
| | |
| | | | | | | |
| | Net asset value, end of year | | | $ | 8.84 | | | | $ | 9.26 | | | | $ | 10.40 | | | | $ | 10.93 | | | | $ | 9.78 | | | |
| | |
| | | | | | | |
| | Total Return(b) | | | | 2.22 | % | | | | (4.77 | )% | | | | 1.70 | % | | | | 18.59 | % | | | | (5.05 | )% | | |
| | |
| | | | | | | |
| | Net assets, end of year (in 000’s) | | | $ | 93,750 | | | | $ | 114,738 | | | | $ | 145,519 | | | | $ | 98,018 | | | | $ | 74,220 | | | |
| | | | | | | |
| | Ratio of net expense to average net assets after interest expenses | | | | 1.84 | % | | | | 1.92 | % | | | | 1.76 | % | | | | 1.84 | % | | | | 1.94 | % | | |
| | | | | | | |
| | Ratio of net investment income to average net assets | | | | 1.13 | % | | | | 1.66 | % | | | | 2.31 | % | | | | 2.33 | % | | | | 3.16 | % | | |
| | | | | | | |
| | Ratio of net expense to average net assets before interest expenses | | | | 1.74 | % | | | | 1.74 | % | | | | 1.70 | % | | | | 1.74 | % | | | | 1.74 | % | | |
| | | | | | | |
| | Ratio of total expense to average net assets after interest expenses | | | | 1.88 | % | | | | 1.96 | % | | | | 1.77 | % | | | | 2.12 | % | | | | 2.03 | % | | |
| | | | | | | |
| | Portfolio turnover rate(c) | | | | 17 | % | | | | 46 | % | | | | 56 | % | | | | 73 | % | | | | 53 | % | | |
| | |
| | (a) | Calculated based on the average shares outstanding methodology. |
| | (b) | Assumes investment at the NAV at the beginning of the year, reinvestment of all dividends and distributions, a complete repurchase of the investment at the NAV at the end of the year and no sales or repurchase charges (if any). Total returns would be reduced if a sales or repurchase charge was taken into account. Returns do not reflect the impact of taxes to shareholders relating to Fund distributions or the repurchase of Fund shares. |
| | (c) | The Fund’s portfolio turnover rate is calculated in accordance with regulatory requirements, without regard to transactions involving short term investments and certain derivatives. If such transactions were included, the Fund’s portfolio turnover rate may be higher. |
| | |
| 20 | | The accompanying notes are an integral part of these consolidated financial statements. |
GOLDMAN SACHS REAL ESTATE DIVERSIFIED INCOME FUND
|
Consolidated Financial Highlights (continued) Selected Data for a Share Outstanding Throughout Each Year |
| | | | | | | | | | | | | | | | | | | | | | | | | | | | | |
| | | | | Real Estate Diversified Income Fund | | |
| | | |
| | | | | Class L Shares | | |
| | | |
| | | | | Year Ended September 30, | | |
| | | | | | | |
| | | | | 2024 | | 2023 | | 2022 | | 2021 | | 2020 | | |
| | | | | | | |
| | Per Share Data | | | | | | | | | | | | | | | | | | | | | | | | | | | |
| | | | | | | |
| | Net asset value, beginning of year | | | $ | 8.80 | | | | $ | 9.92 | | | | $ | 10.46 | | | | $ | 9.39 | | | | $ | 10.69 | | | |
| | |
| | | | | | | |
| | Net investment income(a) | | | | 0.05 | | | | | 0.11 | | | | | 0.18 | | | | | 0.18 | | | | | 0.27 | | | |
| | | | | | | |
| | Net realized and unrealized gain (loss) | | | | 0.10 | | | | | (0.61 | ) | | | | (0.04 | ) | | | | 1.46 | | | | | (0.89 | ) | | |
| | |
| | | | | | | |
| | Total from investment operations | | | | 0.15 | | | | | (0.50 | ) | | | | 0.14 | | | | | 1.64 | | | | | (0.62 | ) | | |
| | |
| | | | | | | |
| | Distributions to shareholders from net investment income | | | | (0.02 | ) | | | | – | | | | | (0.18 | ) | | | | (0.31 | ) | | | | (0.20 | ) | | |
| | | | | | | |
| | Distributions to shareholders from net realized gains | | | | – | | | | | (0.15 | ) | | | | (0.11 | ) | | | | (0.26 | ) | | | | (0.30 | ) | | |
| | | | | | | |
| | Distributions to shareholders from return of capital | | | | (0.56 | ) | | | | (0.47 | ) | | | | (0.39 | ) | | | | – | | | | | (0.18 | ) | | |
| | |
| | | | | | | |
| | Total distributions | | | | (0.58 | ) | | | | (0.62 | ) | | | | (0.68 | ) | | | | (0.57 | ) | | | | (0.68 | ) | | |
| | |
| | | | | | | |
| | Net asset value, end of year | | | $ | 8.37 | | | | $ | 8.80 | | | | $ | 9.92 | | | | $ | 10.46 | | | | $ | 9.39 | | | |
| | |
| | | | | | | |
| | Total Return(b) | | | | 1.72 | % | | | | (5.28 | )% | | | | 1.17 | % | | | | 17.93 | % | | | | (5.46 | )% | | |
| | |
| | | | | | | |
| | Net assets, end of year (in 000’s) | | | $ | 3,793 | | | | $ | 4,569 | | | | $ | 5,323 | | | | $ | 5,919 | | | | $ | 5,538 | | | |
| | | | | | | |
| | Ratio of net expense to average net assets after interest expenses | | | | 2.34 | % | | | | 2.42 | % | | | | 2.30 | % | | | | 2.34 | % | | | | 2.44 | % | | |
| | | | | | | |
| | Ratio of net investment income to average net assets | | | | 0.62 | % | | | | 1.15 | % | | | | 1.70 | % | | | | 1.76 | % | | | | 2.71 | % | | |
| | | | | | | |
| | Ratio of net expense to average net assets before interest expenses | | | | 2.24 | % | | | | 2.24 | % | | | | 2.23 | % | | | | 2.24 | % | | | | 2.24 | % | | |
| | | | | | | |
| | Ratio of total expense to average net assets after interest expenses | | | | 2.38 | % | | | | 2.46 | % | | | | 2.31 | % | | | | 2.59 | % | | | | 2.54 | % | | |
| | | | | | | |
| | Portfolio turnover rate(c) | | | | 17 | % | | | | 46 | % | | | | 56 | % | | | | 73 | % | | | | 53 | % | | |
| | |
| | (a) | Calculated based on the average shares outstanding methodology. |
| | (b) | Assumes investment at the NAV at the beginning of the year, reinvestment of all dividends and distributions, a complete repurchase of the investment at the NAV at the end of the year and no sales or repurchase charges (if any). Total returns would be reduced if a sales or repurchase charge was taken into account. Returns do not reflect the impact of taxes to shareholders relating to Fund distributions or the repurchase of Fund shares. |
| | (c) | The Fund’s portfolio turnover rate is calculated in accordance with regulatory requirements, without regard to transactions involving short term investments and certain derivatives. If such transactions were included, the Fund’s portfolio turnover rate may be higher. |
| | |
| The accompanying notes are an integral part of these consolidated financial statements. | | 21 |
GOLDMAN SACHS REAL ESTATE DIVERSIFIED INCOME FUND
|
Consolidated Financial Highlights (continued) Selected Data for a Share Outstanding Throughout Each Year |
| | | | | | | | | | | | | | | | | | | | | | | | | | | | | |
| | | | | Real Estate Diversified Income Fund | | |
| | | |
| | | | | Class W Shares | | |
| | | |
| | | | | Year Ended September 30, | | |
| | | | | | | |
| | | | | 2024 | | 2023 | | 2022 | | 2021 | | 2020 | | |
| | | | | | | |
| | Per Share Data | | | | | | | | | | | | | | | | | | | | | | | | | | | |
| | | | | | | |
| | Net asset value, beginning of year | | | $ | 8.96 | | | | $ | 10.08 | | | | $ | 10.62 | | | | $ | 9.52 | | | | $ | 10.85 | | | |
| | |
| | | | | | | |
| | Net investment income(a) | | | | 0.08 | | | | | 0.14 | | | | | 0.21 | | | | | 0.21 | | | | | 0.31 | | | |
| | | | | | | |
| | Net realized and unrealized gain (loss) | | | | 0.09 | | | | | (0.61 | ) | | | | (0.04 | ) | | | | 1.49 | | | | | (0.92 | ) | | |
| | |
| | | | | | | |
| | Total from investment operations | | | | 0.17 | | | | | (0.47 | ) | | | | 0.17 | | | | | 1.70 | | | | | (0.61 | ) | | |
| | |
| | | | | | | |
| | Distributions to shareholders from net investment income | | | | (0.03 | ) | | | | – | | | | | (0.18 | ) | | | | (0.34 | ) | | | | (0.24 | ) | | |
| | | | | | | |
| | Distributions to shareholders from net realized gains | | | | – | | | | | (0.16 | ) | | | | (0.11 | ) | | | | (0.26 | ) | | | | (0.30 | ) | | |
| | | | | | | |
| | Distributions to shareholders from return of capital | | | | (0.57 | ) | | | | (0.49 | ) | | | | (0.42 | ) | | | | – | | | | | (0.18 | ) | | |
| | |
| | | | | | | |
| | Total distributions | | | | (0.60 | ) | | | | (0.65 | ) | | | | (0.71 | ) | | | | (0.60 | ) | | | | (0.72 | ) | | |
| | |
| | | | | | | |
| | Net asset value, end of year | | | $ | 8.53 | | | | $ | 8.96 | | | | $ | 10.08 | | | | $ | 10.62 | | | | $ | 9.52 | | | |
| | |
| | | | | | | |
| | Total Return(b) | | | | 1.93 | % | | | | (4.96 | )% | | | | 1.40 | % | | | | 18.28 | % | | | | (5.31 | )% | | |
| | |
| | | | | | | |
| | Net assets, end of year (in 000’s) | | | $ | 20,742 | | | | $ | 29,307 | | | | $ | 39,873 | | | | $ | 40,617 | | | | $ | 47,709 | | | |
| | | | | | | |
| | Ratio of net expense to average net assets after interest expenses | | | | 2.08 | % | | | | 2.16 | % | | | | 2.04 | % | | | | 2.10 | % | | | | 2.19 | % | | |
| | | | | | | |
| | Ratio of net investment income to average net assets | | | | 0.88 | % | | | | 1.42 | % | | | | 1.98 | % | | | | 2.02 | % | | | | 2.99 | % | | |
| | | | | | | |
| | Ratio of net expense to average net assets before interest expenses | | | | 1.99 | % | | | | 1.98 | % | | | | 1.98 | % | | | | 1.99 | % | | | | 1.99 | % | | |
| | | | | | | |
| | Ratio of total expense to average net assets after interest expenses | | | | 2.12 | % | | | | 2.20 | % | | | | 2.05 | % | | | | 2.33 | % | | | | 2.23 | % | | |
| | | | | | | |
| | Portfolio turnover rate(c) | | | | 17 | % | | | | 46 | % | | | | 56 | % | | | | 73 | % | | | | 53 | % | | |
| | |
| | (a) | Calculated based on the average shares outstanding methodology. |
| | (b) | Assumes investment at the NAV at the beginning of the year, reinvestment of all dividends and distributions, a complete repurchase of the investment at the NAV at the end of the year and no sales or repurchase charges (if any). Total returns would be reduced if a sales or repurchase charge was taken into account. Returns do not reflect the impact of taxes to shareholders relating to Fund distributions or the repurchase of Fund shares. |
| | (c) | The Fund’s portfolio turnover rate is calculated in accordance with regulatory requirements, without regard to transactions involving short term investments and certain derivatives. If such transactions were included, the Fund’s portfolio turnover rate may be higher. |
| | |
| 22 | | The accompanying notes are an integral part of these consolidated financial statements. |
GOLDMAN SACHS REAL ESTATE DIVERSIFIED INCOME FUND
|
Consolidated Financial Highlights (continued) Selected Data for a Share Outstanding Throughout Each Period |
| | | | | | | | | | | | | | | | | | | | | | | | |
| | | | | Real Estate Diversified Income Fund | | |
| | | |
| | | | | Class P Shares | | |
| | | | | Year Ended September 30, | | Period Ended September 30, 2021(a) | | |
| | | | | 2024 | | 2023 | | 2022 | | |
| | | | | | |
| | Per Share Data | | | | | | | | | | | | | | | | | | | | | | |
| | | | | | |
| | Net asset value, beginning of period | | | $ | 9.26 | | | | $ | 10.41 | | | | $ | 10.93 | | | | $ | 10.63 | | | |
| | |
| | | | | | |
| | Net investment income(b) | | | | 0.10 | | | | | 0.17 | | | | | 0.28 | | | | | 0.05 | | | |
| | | | | | |
| | Net realized and unrealized gain (loss) | | | | 0.10 | | | | | (0.65 | ) | | | | (0.06 | ) | | | | 0.41 | | | |
| | |
| | | | | | |
| | Total from investment operations | | | | 0.20 | | | | | (0.48 | ) | | | | 0.22 | | | | | 0.46 | | | |
| | |
| | | | | | |
| | Distributions to shareholders from net investment income | | | | (0.02 | ) | | | | – | | | | | (0.18 | ) | | | | (0.09 | ) | | |
| | | | | | |
| | Distributions to shareholders from net realized gains | | | | – | | | | | (0.16 | ) | | | | (0.11 | ) | | | | (0.07 | ) | | |
| | | | | | |
| | Distributions to shareholders from return of capital | | | | (0.60 | ) | | | | (0.51 | ) | | | | (0.45 | ) | | | | – | | | |
| | |
| | | | | | |
| | Total distributions | | | | (0.62 | ) | | | | (0.67 | ) | | | | (0.74 | ) | | | | (0.16 | ) | | |
| | |
| | | | | | |
| | Net asset value, end of period | | | $ | 8.84 | | | | $ | 9.26 | | | | $ | 10.41 | | | | $ | 10.93 | | | |
| | |
| | | | | | |
| | Total Return(c) | | | | 2.22 | % | | | | (4.87 | )% | | | | 1.79 | % | | | | 4.31 | % | | |
| | |
| | | | | | |
| | Net assets, end of period (in 000’s) | | | $ | 194,097 | | | | $ | 230,754 | | | | $ | 253,957 | | | | $ | 54,212 | | | |
| | | | | | |
| | Ratio of net expense to average net assets after interest expenses | | | | 1.84 | % | | | | 1.92 | % | | | | 1.70 | % | | | | 1.81 | %(d) | | |
| | | | | | |
| | Ratio of net investment income to average net assets | | | | 1.12 | % | | | | 1.67 | % | | | | 2.49 | % | | | | 1.81 | %(d) | | |
| | | | | | |
| | Ratio of net expense to average net assets before interest expenses | | | | 1.74 | % | | | | 1.74 | % | | | | 1.63 | % | | | | 1.74 | %(d) | | |
| | | | | | |
| | Ratio of total expense to average net assets after interest expenses | | | | 1.88 | % | | | | 1.97 | % | | | | 1.71 | % | | | | 2.61 | %(d) | | |
| | | | | | |
| | Portfolio turnover rate(e) | | | | 17 | % | | | | 46 | % | | | | 56 | % | | | | 73 | % | | |
| | |
| | (a) | Commenced operations on June 29, 2021. |
| | (b) | Calculated based on the average shares outstanding methodology. |
| | (c) | Assumes investment at the NAV at the beginning of the year, reinvestment of all dividends and distributions, a complete repurchase of the investment at the NAV at the end of the year and no sales or repurchase charges (if any). Total returns would be reduced if a sales or repurchase charge was taken into account. Returns do not reflect the impact of taxes to shareholders relating to Fund distributions or the repurchase of Fund shares. |
| | (e) | The Fund’s portfolio turnover rate is calculated in accordance with regulatory requirements, without regard to transactions involving short term investments and certain derivatives. If such transactions were included, the Fund’s portfolio turnover rate may be higher. |
| | |
| The accompanying notes are an integral part of these consolidated financial statements. | | 23 |
GOLDMAN SACHS REAL ESTATE DIVERSIFIED INCOME FUND
|
Consolidated Notes to Financial Statements September 30, 2024 |
Goldman Sachs Real Estate Diversified Income Fund (the “Fund”), is a Delaware statutory trust registered under the Investment Company Act of 1940 (the “Act”), as amended, as a diversified, closed-end management investment company and is structured as an “interval fund,” a type of fund which, in order to provide some liquidity to shareholders, makes quarterly offers to repurchase a percentage of its outstanding shares at NAV, pursuant to Rule 23c-3 under the Act. The Fund was organized as a Delaware statutory trust on December 2, 2019. The Fund offers six classes of shares: Class A, Class C, Class I, Class L, Class W, and Class P Shares.
Class A and Class L Shares are sold with front-end sales charges of up to 5.75% and 4.25%, respectively. Class C Shares are sold with a contingent deferred sales charge (“CDSC”) of 1.00% which is imposed on repurchases made within 12 months of purchase. In addition, purchases of Class A Shares of $1 million or more may be subject to a maximum CDSC of 1.00% which is imposed on repurchases made within 18 months of purchase. Class I, Class W, and Class P Shares are not subject to a sales charge.
Goldman Sachs Asset Management, L.P. (“GSAM”), an affiliate of Goldman Sachs & Co. LLC, serves as investment adviser to the Fund pursuant to a management agreement (the “Agreement”) with the Fund.
|
|
2. SIGNIFICANT ACCOUNTING POLICIES |
The consolidated financial statements have been prepared in accordance with accounting principles generally accepted in the United States of America (“GAAP”) and require management to make estimates and assumptions that may affect the reported amounts and disclosures. Actual results may differ from those estimates and assumptions. The Fund is an investment company under GAAP and follows the accounting and reporting guidance applicable to investment companies.
A. Basis of Consolidation for the Fund — DIF Investments LLC, DIF Investments II LLC, and DIF Investments III LLC (each a “Subsidiary” and collectively, the “Subsidiaries”), limited liability companies, were incorporated on February 3, 2020, March 12, 2020, and June 30, 2021, respectively, and are currently wholly-owned subsidiaries of the Fund. The Subsidiaries act as investment vehicles for the Fund to enable the Fund to gain exposure to certain types of private real estate investments. Under the Amended and Restated Limited Liability Company Agreement of each Subsidiary, shares issued by the Subsidiary confer upon its member the right to participate in the profits or assets of the Subsidiary. All inter-fund balances and transactions have been eliminated in consolidation. As of September 30, 2024, the Fund’s net assets were $393,361,569, of which, $123,935,095, or 32%, are represented by DIF Investments LLC’s net assets; $145,371,306, or 37%, are represented by DIF Investments II LLC’s net assets; and $2,646,288, or 1%, are represented by DIF Investments III LLC’s net assets.
B. Investment Valuation — The Fund’s valuation policy is to value investments at fair value.
C. Investment Income and Investments — Investment income includes interest income, dividend income, and securities
lending income, if any. Interest income is accrued daily and adjusted for amortization of premiums and accretion of discounts. Dividend income is recognized on ex-dividend date or, for certain foreign securities, as soon as such information is obtained subsequent to the ex-dividend date. Non-cash dividends, if any, are recorded at the fair market value of the securities received. Investment transactions are reflected on trade date with the exception of capital calls, which are recorded on due date. Realized gains and losses are calculated using identified cost. Investment transactions are recorded on the following business day for daily net asset value (“NAV”) calculations. Distributions received from the Fund’s investments in United States (“U.S.”) real estate investment trusts (“REITs”) may be characterized as ordinary income, net capital gain and/or a return of capital. A return of capital is recorded by the Fund as a reduction to the cost basis of the REIT.
D. Class Allocations and Expenses — Investment income, realized and unrealized gain (loss), if any, and non-class specific expenses of the Fund are allocated daily based upon the proportion of net assets of each class. Non-class specific expenses directly incurred by the Fund are charged to the Fund. Expenses which may not specifically relate to the Fund, may be shared with other registered investment companies having management agreements with GSAM or its affiliates, as appropriate. These expenses are allocated to the Fund on a straight-line and/or pro-rata basis depending upon the nature of the expenses and are accrued daily. Class specific expenses, where applicable, are borne by the respective share classes and include Distribution, Service and Transfer Agency fees.
E. Federal Taxes and Distributions to Shareholders — It is the Fund’s policy to comply with the requirements of the Internal Revenue Code of 1986, as amended (the “Code”), applicable to regulated investment companies and to distribute each year substantially all of its investment company taxable income and capital gains to its shareholders. Accordingly, the Fund is not required to make any provisions for the payment of federal income tax. Distributions to shareholders are recorded on the ex-dividend date.
GOLDMAN SACHS REAL ESTATE DIVERSIFIED INCOME FUND
|
|
2. SIGNIFICANT ACCOUNTING POLICIES (continued) |
The Fund currently intends to make regular quarterly cash distributions of all or a portion of its net investment income to shareholders. The Fund will pay shareholders at least annually all or substantially all of its net investment income after the payment of interest, fees or dividends, if any, owed with respect to any forms of leverage used by the Fund. The Fund intends to pay any capital gains distributions at least annually. In order to permit the Fund to maintain more stable quarterly distributions, the distributions paid by the Fund may be more or less than the amount of net distributable earnings actually earned by the Fund. These distributions could include a return of a shareholder’s invested capital which would reduce the Fund’s NAV. The Fund estimates that only a portion of the distributions paid to shareholders will be treated as dividend income. The remaining portion of the Fund’s distribution, which may be significant, is expected to be a return of capital. These estimates are based on the Fund’s operating results during the period, and their final federal income tax characterization that may differ. The characterization of distributions to shareholders for financial reporting purposes is determined in accordance with federal income tax rules, which may differ from GAAP. The source of the Fund’s distributions may be shown in the accompanying consolidated financial statements as either from distributable earnings or capital.
|
|
3. INVESTMENTS AND FAIR VALUE MEASUREMENTS |
U.S. GAAP defines the fair value of a financial instrument as the amount that would be received to sell an asset or paid to transfer a liability in an orderly transaction between market participants at the measurement date (i.e., the exit price); the Fund’s policy is to use the market approach. GAAP establishes a fair value hierarchy that prioritizes the inputs to valuation techniques used to measure fair value. The hierarchy gives the highest priority to unadjusted quoted prices in active markets for identical assets or liabilities (Level 1 measurements) and the lowest priority to unobservable inputs (Level 3 measurements). The level in the fair value hierarchy within which the fair value measurement in its entirety falls shall be determined based on the lowest level input that is significant to the fair value measurement in its entirety. The levels used for classifying investments are not necessarily an indication of the risk associated with investing in these investments. The three levels of the fair value hierarchy are described below:
Level 1 — Unadjusted quoted prices in active markets that are accessible at the measurement date for identical, unrestricted assets or liabilities;
Level 2 — Quoted prices in markets that are not active or financial instruments for which significant inputs are observable (including, but not limited to, quoted prices for similar investments, interest rates, foreign exchange rates, volatility and credit spreads), either directly or indirectly;
Level 3 — Prices or valuations that require significant unobservable inputs (including GSAM’s assumptions in determining fair value measurement).
The Board of Trustees (“Trustees”) has approved Valuation Procedures that govern the valuation of the portfolio investments held by the Fund, including investments for which market quotations are not readily available. With respect to the Fund’s investments that do not have readily available market quotations, the Trustees have designated GSAM as the valuation designee to perform fair valuations pursuant to Rule 2a-5 under the Investment Company Act of 1940 (the “Valuation Designee”). GSAM has day-to-day responsibility for implementing and maintaining internal controls and procedures related to the valuation of the Fund’s investments. To assess the continuing appropriateness of pricing sources and methodologies, GSAM regularly performs price verification procedures and issues challenges as necessary to third party pricing vendors or brokers, and any differences are reviewed in accordance with the Valuation Procedures.
A. Level 1 and Level 2 Fair Value Investments — The valuation techniques and significant inputs used in determining the fair values for investments classified as Level 1 and Level 2 are as follows:
Equity Securities — Equity securities traded on a United States (“U.S.”) securities exchange or the NASDAQ system, or those located on certain foreign exchanges, including but not limited to the Americas, are valued daily at their last sale price or official closing price on the principal exchange or system on which they are traded. If there is no sale or official closing price or such price is believed by GSAM to not represent fair value, equity securities will be valued at the valid closing bid price for long positions and at the valid closing ask price for short positions (i.e. where there is sufficient volume, during normal exchange trading hours). If no valid bid/ask price is available, the equity security will be valued pursuant to the Valuation Procedures and consistent with applicable
GOLDMAN SACHS REAL ESTATE DIVERSIFIED INCOME FUND
|
Consolidated Notes to Financial Statements (continued) September 30, 2024 |
|
|
3. INVESTMENTS AND FAIR VALUE MEASUREMENTS (continued) |
regulatory guidance. To the extent these investments are actively traded, they are classified as Level 1 of the fair value hierarchy, otherwise they are generally classified as Level 2. Certain equity securities containing unique attributes may be classified as Level 2.
Unlisted equity securities for which market quotations are available are valued at the last sale price on the valuation date, or if no sale occurs, at the last bid price for long positions or the last ask price for short positions, and are generally classified as Level 2.
Money Market Funds — Investments in the Goldman Sachs Financial Square Government Fund (“Underlying Money Market Fund”) are valued at the NAV per share on the day of valuation. These investments are generally classified as Level 1 of the fair value hierarchy. For information regarding an Underlying Money Market Fund’s accounting policies and investment holdings, please see the Underlying Money Market Fund’s shareholder report.
B. Level 3 Fair Value Investments — To the extent that significant inputs to valuation models and other alternative pricing sources are unobservable, or if quotations are not readily available, or if GSAM believes that such quotations do not accurately reflect fair value, the fair value of the Fund’s investments may be determined under the Valuation Procedures. GSAM, consistent with its procedures and applicable regulatory guidance, may make an adjustment to the most recent valuation prices of either domestic or foreign securities in light of significant events to reflect what it believes to be the fair value of the securities at the time of determining the Fund’s NAV. To the extent investments are valued using single source broker quotations obtained directly from the broker or passed through from third party pricing vendors, such investments are classified as Level 3 investments.
C. Other Fair Valuation Investments — Prices or valuations that require significant unobservable inputs (including assumptions in determining fair value measurement).
The fair valuation technique depends on the investment characteristics and the availability of observable inputs. Investments are classified within the level of the lowest significant input considered in determining fair value. GSAM uses NAV as its measure of fair values for investments in LP/LLC interests when (i) the investment does not have a readily determinable fair value and (ii) the NAV of the investment is calculated in a manner consistent with the measurement principles of investment company accounting, including measurement of the underlying investments at fair value. In evaluating the level at which the investments have been classified, GSAM has assessed factors including, but not limited to, price transparency. An investment in LP/LLC interests using NAV as its measure of fair value is excluded from the fair value hierarchy.
The fair value technique and type of valuation input varies by investment type as follows:
Private REITs — Private Real Estate Investment Trusts (“Private REITs”) report their investment assets at fair value, and typically report a NAV per share on a calendar quarter basis. In accordance with Accounting Standards Codification (“ASC”) 820-10, the Fund has elected to apply the practical expedient methodology and to value its investments in Private REITs at their respective NAVs typically at each quarter. To determine the NAV of the Fund with respect to investments in Private REITs, GSAM relies on information that it receives periodically from the Private REITs, adjusted on a daily basis, based on a change in a relevant proxy that GSAM has deemed to be representative of the market.
Private Investment Funds — Private investment funds (“Private Investment Funds”) measure their investment assets at fair value, and typically report a NAV per share on a calendar quarterly basis. In accordance with ASC 820-10, the Fund has elected to apply the practical expedient methodology and to value its investments in Private Investment Funds at their respective NAVs typically at each quarter. To determine the NAV of the Fund with respect to investments in Private Investment Funds, GSAM relies on information that it receives periodically from the Private Investment Funds, adjusted on a daily basis, based on a change in a relevant proxy that GSAM has deemed to be representative of the market.
GOLDMAN SACHS REAL ESTATE DIVERSIFIED INCOME FUND
|
|
3. INVESTMENTS AND FAIR VALUE MEASUREMENTS (continued) |
D. Fair Value Hierarchy — The following is a summary of the Fund’s investments classified in the fair value hierarchy as of September 30, 2024:
| | | | | | | | | | | | | | | | |
| REAL ESTATE DIVERSIFIED INCOME FUND | | | | | | | | | | | | | | | | |
| | | | |
| Investment Type | | Level 1 | | | Level 2 | | | Level 3 | | | Total |
| |
| | | | |
Assets | | | | | | | | | | | | | | | | |
| | | | |
Common Stock and/or Other Equity Investments(a) | | | | | | | | | | | | | | | | |
North America | | $ | 116,336,422 | | | $ | 9,544,271 | | | $ | — | | | $ | 125,880,693 | |
Investment Company | | | 14,195,121 | | | | — | | | | — | | | | 14,195,121 | |
| |
Subtotal | | $ | 130,531,543 | | | $ | 9,544,271 | | | $ | — | | | $ | 140,075,814 | |
| |
Investments measured at NAV | | | | | | | | | | | | | | | 270,810,207 | |
| |
Total | | | | | | | | | | | | | | $ | 410,886,021 | |
| |
| | (a) | Amounts are disclosed by continent to highlight the impact of time zone differences between local market close and the calculation of NAV. Security valuations are based on the principal exchange or system on which they are traded, which may differ from country of domicile noted in table. |
|
|
4. AGREEMENTS AND AFFILIATED TRANSACTIONS |
A. Management Agreement — Under the Agreement, GSAM manages the Fund, subject to the general supervision of the Trustees.
As compensation for the services rendered pursuant to the Agreement, the assumption of the expenses related thereto and administration of the Fund’s business affairs, including providing facilities, GSAM is entitled to a management fee, accrued daily and paid monthly, equal to an annual percentage rate of 1.25% of the Fund’s average daily net assets. For the fiscal year ended September 30, 2024, the effective net management rate was 1.25% of the Fund’s average daily net assets.
The Fund invests in Institutional Shares of the Underlying Money Market Fund, which is an affiliated underlying fund. GSAM has agreed to waive a portion of its management fee payable by the Fund in an amount equal to the management fee it earns as an investment adviser to the affiliated underlying fund in which the Fund invests. For the fiscal year ended September 30, 2024, GSAM waived $18,857 of the Fund’s management fee.
B. Distribution and Service (12b-1) Plan — The Fund, on behalf of its Class A, Class C, Class L and Class W Shares of the Fund, has adopted a Distribution and Service Plan subject to Rule 12b-1 under the Act. Under the Distribution and Service Plan, Goldman Sachs & Co. LLC, which serves as distributor (the “Distributor”), is entitled to a fee accrued daily and paid monthly, for distribution services and personal and account maintenance services, which may then be paid by the Distributor to authorized dealers. These fees are equal to an annual percentage rate of the average daily net assets attributable to Class A, Class C, Class L and Class W Shares of the Fund, as set forth below:
| | | | | | | | | | | | |
| Share Class | | Distribution
Services | | | Shareholder
Services | | | Maximum
Distribution- Related and
Shareholder Services | |
|
| |
| | | |
Class A | | | 0.25% | | | | 0.25% | | | | 0.25% | |
| | | |
Class C | | | 0.75% | | | | 0.25% | | | | 1.00% | |
| | | |
Class L | | | 0.25% | | | | 0.25% | | | | 0.50% | |
| | | |
Class W | | | 0.25% | | | | 0.25% | | | | 0.25% | |
|
| |
C. Distribution Agreement — Goldman Sachs, as Distributor of the shares of the Fund pursuant to a Distribution Agreement, may retain a portion of the Class A and Class L Shares’ front end sales charge and Class A and Class C Shares’ CDSC. During the fiscal year ended September 30, 2024, Goldman Sachs retained $1,894 and $0 for Class A and Class L Shares, respectively, and did not retain any portion of the CDSC for Class A or Class C Shares.
GOLDMAN SACHS REAL ESTATE DIVERSIFIED INCOME FUND
|
Consolidated Notes to Financial Statements (continued) September 30, 2024 |
|
|
4. AGREEMENTS AND AFFILIATED TRANSACTIONS (continued) |
D. Transfer Agency Agreement — Goldman Sachs also serves as the transfer agent of the Fund for a fee pursuant to the Transfer Agency Agreement. The fees charged for such transfer agency and dividend disbursing services are accrued daily and paid monthly at an annual rate of 0.14% of the Fund’s average daily net assets.
E. Other Expense Agreements and Affiliated Transactions — GSAM has agreed to reduce or limit certain “Other Expenses” of the Fund (excluding acquired fund fees and expenses, transfer agency fees and expenses, distribution and service fees, as applicable, taxes, interest, credit facility commitment fees, brokerage fees, expenses of shareholder meetings, litigation and indemnification and extraordinary expenses) to the extent such expenses exceed, on an annual basis, a percentage rate of the average daily net assets of the Fund. Such Other Expense reimbursements, if any, are accrued daily and paid monthly. In addition, the Fund is not obligated to reimburse GSAM for prior fiscal year expense reimbursements, if any. The Other Expense limitation as an annual percentage rate of average daily net assets for the Fund is 0.354%. This Other Expense limitation will remain in place through at least January 26, 2025, and prior to such date GSAM may not terminate the arrangement without the approval of the Trustees. In addition, the Fund has entered into certain offset arrangements with the transfer agent, which may result in a reduction of the Fund’s expenses and are received irrespective of the application of the “Other Expense” limitation described above. Such Other Expense reimbursements, if any, are accrued daily and paid monthly and are disclosed in the Consolidated Statement of Operations.
Goldman Sachs may voluntarily waive a portion of any payments under the Fund’s Distribution and Service Plan and Transfer Agency Agreement, and these waivers are in addition to what is stipulated in any contractual fee waiver arrangements (as applicable). These temporary waivers may be modified or terminated at any time at the option of Goldman Sachs without shareholder approval.
For the fiscal year ended September 30, 2024, these expense reductions, including any fee waivers and Other Expense reimbursements, were as follows:
| | | | | | |
| Fund | | Management
Fee Waiver | | Other Expense
Reimbursements | | Total Expense
Reductions |
|
|
| | | |
Real Estate Diversified Income Fund | | $ 18,857 | | $ 156,660 | | $ 175,517 |
|
F. Other Transactions with Affiliates — For the fiscal year ended September 30, 2024, Goldman Sachs earned $3,800 brokerage commissions from portfolio transactions, on behalf of the Fund.
The following table provides information about the Fund’s investments in the Underlying Fund as of and for the fiscal year ended September 30, 2024:
| | | | | | | | | | | | | | | | | | | | | | | | |
| Underlying Fund | | Beginning value as of September 30, 2023 | | | Purchases at Cost | | | Proceeds from Sales | | | Ending value as of
September 30, 2024 | | | Shares as of
September 30, 2024 | | | Dividend Income | |
| |
| | | |
Goldman Sachs Financial Square Government Fund – Institutional Shares | | | | | | | | | | | | | |
| | | | | | |
| | $ | 13,406,835 | | | $ | 156,634,777 | | | $ | (155,846,491 | ) | | $ | 14,195,121 | | | | 14,195,121 | | | $ | 595,074 | |
| |
G. Financing Agreements — The Fund has entered into secured revolving bank line of credit facilities (each a “Credit Facility” and collectively the “Credit Facilities”) with major U.S. financial institutions for the purpose of investment purchases subject to the limitations of the Act for borrowings. The current Credit Facilities provide for borrowings in an aggregate amount up to $95,000,000 for the Fund. Borrowings under the Credit Facilities, which are secured by certain assets of the Fund, bear interest. The interest rates are based on variable rates (i.e., the Secured Overnight Financing Rate (“SOFR”)) plus market spreads. The Fund currently pays unused commitment fees of 0.20%—0.75% per annum. Interest is accrued daily and paid quarterly. The Fund had an average outstanding balance and weighted average annual interest rate for the period of $30,500,000 and 6.30%, respectively. As of September 30, 2024, there were no outstanding borrowings under the Credit Facilities.
|
|
5. PORTFOLIO SECURITIES TRANSACTIONS |
The cost of purchases and proceeds from sales and maturities of long-term securities for the fiscal year ended September 30, 2024, were $70,048,091 and $142,800,620, respectively.
GOLDMAN SACHS REAL ESTATE DIVERSIFIED INCOME FUND
The tax character of distributions paid during the fiscal year ended September 30, 2024 was as follows:
| | | | |
| | | Real Estate
Diversified Income Fund | |
| |
| |
Distributions paid from: | | | | |
| |
Ordinary Income | | $ | 736,683 | |
|
| |
| |
Total taxable distributions | | $ | 736,683 | |
|
| |
| |
Return of Capital | | $ | 28,015,779 | |
| |
The tax character of distributions paid during the fiscal year ended September 30, 2023 was as follows:
| | | | |
| | | Real Estate
Diversified
Income Fund | |
| |
| |
Distributions paid from: | | | | |
| |
Ordinary Income | | $ | — | |
| |
Net long-term capital gains | | | 8,856,885 | |
|
| |
| |
Total taxable distributions | | $ | 8,856,885 | |
|
| |
| |
Return of Capital | | $ | 27,428,960 | |
| |
As of September 30, 2024 the components of accumulated earnings (losses) on a tax-basis were as follows:
| | | | |
| | | Real Estate
Diversified
Income Fund | |
| |
| |
Capital loss carryforwards: | | | | |
| |
Perpetual Short-Term | | $ | (3,683,070) | |
| |
Perpetual Long-Term | | | (482,137) | |
|
| |
| |
Total capital loss carryforwards | | | (4,165,207) | |
|
| |
| |
Timing differences — (Late Year Ordinary Loss Deferral/Post October Capital Loss Deferral) | | | (3,114,544) | |
| |
Unrealized gains (losses) — net | | | (6,996,101) | |
|
| |
| |
Total accumulated earnings (losses) — net | | $ | (14,275,852) | |
| |
As of September 30, 2024, the Fund’s aggregate security unrealized gains and losses based on cost for U.S. federal income tax purposes were as follows:
| | | | |
| | | Real Estate Diversified Income Fund | |
|
| |
| |
Tax Cost | | $ | 418,128,443 | |
|
| |
| |
Gross unrealized gain | | | 15,790,848 | |
| |
Gross unrealized loss | | | (22,786,949) | |
|
| |
| |
Net unrealized gain (loss) | | $ | (6,996,101) | |
| |
The difference between GAAP-basis and tax basis unrealized gains (losses) is attributable primarily to wash sales and differences in the tax treatment of partnership investments.
GOLDMAN SACHS REAL ESTATE DIVERSIFIED INCOME FUND
|
Consolidated Notes to Financial Statements (continued) September 30, 2024 |
|
|
6. TAX INFORMATION (continued) |
The Fund reclassed $2,339,529 from paid in capital to distributable earnings for the fiscal year ended September 30, 2024. In order to present certain components of the Fund’s capital accounts on a tax-basis, certain reclassifications have been recorded to the Fund’s accounts. These reclassifications have no impact on the net asset value of the Fund and result primarily from differences in the tax treatment of partnership investments and underlying fund investments.
GSAM has reviewed the Fund’s tax positions for all open tax years (the current and prior three years, as applicable) and has concluded that no provision for income tax is required in the Fund’s consolidated financial statements other than for DIF Investments III LLC. Such open tax years remain subject to examination and adjustment by tax authorities.
The Fund has adopted the following fundamental policies, which cannot be changed without the vote of a majority of Fund shareholders, in order to repurchase its Shares:
| | ● | | On a quarterly basis, in the months of March, June, September and December, the Fund will make an offer to repurchase a designated percentage of the outstanding shares from shareholders (a “Repurchase Offer”), pursuant to Rule 23c-3 under the Act, as it may be amended from time to time. |
| | ● | | The Fund will repurchase only shares that are tendered by the deadline for such repurchase request (“Repurchase Request Deadline”). The Board will establish the Repurchase Request Deadline for each Repurchase Offer, but such date may be revised by the Fund’s officers, in their sole discretion, based on factors such as market conditions, the level of the Fund’s assets and shareholder servicing considerations provided that the Board is notified of this change and the reasons for it. |
| | ● | | There will be a maximum 14 calendar day period (or the next business day if the 14th calendar day is not a business day) between the Repurchase Request Deadline and the day on which shares eligible for repurchase are priced. |
The Fund may also make discretionary repurchase offers in addition to the quarterly Repurchase Offer period once every two years.
Repurchase Offer Amounts. Each quarter, the Fund’s Board, in its sole discretion, will determine the number of shares that the Fund will offer to repurchase (the “Repurchase Offer Amount”) for a particular Repurchase Offer. The Repurchase Offer Amount will be at least 5% but not more than 25% of the total number of shares outstanding on the Repurchase Request Deadline. In connection with any given Repurchase Offer, it is possible that the Fund may offer to repurchase only the minimum amount of 5% of its outstanding Shares on the Repurchase Request Deadline. If shareholders tender more than the Repurchase Offer Amount for a particular Repurchase Offer, the Board may determine to increase the Repurchase Offer Amount by up to an additional 2% of the Shares outstanding on the Repurchase Request Deadline.
During the fiscal year ended September 30, 2024, the Fund completed four quarterly repurchase offers. In these offers, the Fund offered to repurchase up to 5% of the number of its outstanding shares (up to 7% at the discretion of the officers of the Fund) for the repurchase offers commencing on September 20, 2023, December 20, 2023, March 20, 2024, and June 20, 2024, each as of the Repurchase Pricing Dates. The result of those repurchase offers were as follows:
| | | | | | | | | | | | | | | | |
| | | Repurchase Offer #1 | | | Repurchase Offer #2 | | | Repurchase Offer #3 | | | Repurchase Offer #4 | |
| | | | |
Commencement Date | | | September 20, 2023 | | | | December 20, 2023 | | | | March 20, 2024 | | | | June 20, 2024 | |
| | | | |
Repurchase Request Deadline | | | October 18, 2023 | | | | January 17, 2024 | | | | April 17, 2024 | | | | July 17, 2024 | |
| | | | |
Repurchase Pricing Date | | | October 18, 2023 | | | | January 17, 2024 | | | | April 17, 2024 | | | | July 17, 2024 | |
| | | | |
Shares Tendered for Repurchase | | | 3,586,144 | | | | 4,515,076 | | | | 4,606,143 | | | | 5,996,545 | |
| | | | |
Shares Repurchased | | | 3,586.144 | | | | 3,552,934 | | | | 2,408,350 | | | | 2,337,430 | |
As of September 30, 2024, the Fund had no unfunded commitments other than the unfunded commitments for investments currently held as of the reporting date that are disclosed in the Consolidated Schedule of Investments footnote disclosures.
GOLDMAN SACHS REAL ESTATE DIVERSIFIED INCOME FUND
The Fund’s risks include, but are not limited to, the following:
Dividend-Paying Investments Risk — The Fund’s investments in dividend-paying securities could cause the Fund to underperform other funds. Securities that pay dividends, as a group, can fall out of favor with the market, causing such securities to underperform securities that do not pay dividends. Depending upon market conditions and political and legislative responses to such conditions, dividend-paying securities that meet the Fund’s investment criteria may not be widely available and/or may be highly concentrated in only a few market sectors. In addition, issuers that have paid regular dividends or distributions to shareholders may not continue to do so at the same level or at all in the future. This may limit the ability of the Fund to produce current income.
Industry Concentration Risk — The Fund concentrates its investments in the real estate industry, which has historically experienced substantial price volatility. Concentrating Fund investments in a limited number of issuers conducting business in the same industry or group of industries will subject the Fund to a greater risk of loss as a result of adverse economic, business, political, environmental or other developments than if their investments were diversified across different industries. The value of companies engaged in the real estate industry is affected by, among others, (i) changes in general economic and market conditions; (ii) changes in the value of (or income generated by) real estate properties; (iii) risks related to local economic conditions, overbuilding and increased competition; (iv) increases in property taxes and operating expenses; (v) changes in zoning laws; (vi) casualty and condemnation losses; (vii) variations in rental income, neighborhood values or the appeal of property to tenants; (viii) changes in the availability or terms of mortgages and other financing that may render the sale or refinancing of properties difficult or unattractive; (ix) fluctuations in occupancy levels and demand for properties or real estate-related services; and (x) changes in interest rates and leverage. There are also special risks associated with particular sub-industries, or real estate operations generally.
Investments in Other Investment Companies Risk — As a shareholder of another investment company, the Fund will indirectly bear its proportionate share of any net management fees and other expenses paid by such other investment companies, in addition to the fees and expenses regularly borne by the Fund.
Leverage Risk —The Fund may use leverage to seek to achieve its investment objectives. The use of leverage creates an opportunity for increased net investment income dividends, but also creates risks for the investors. There is no assurance that the Fund’s intended leveraging strategy will be successful. Leverage involves risks and special considerations, including the likelihood of greater volatility of NAV, market price and dividend rate than a comparable portfolio without leverage; the risk that fluctuations in interest rates on borrowings and short-term debt or in the interest or dividend rates on any leverage that the Fund must pay will reduce the Fund’s return; the effect of leverage in a declining market, which is likely to cause a greater decline in the NAV than if the Fund were not leveraged, which may result in a greater decline in the market price; and that leverage may increase operating costs, which may reduce total return.
Liquidity Risk — The Fund may make investments that are illiquid or that may become less liquid in response to market developments or adverse investor perceptions. Illiquid investments may be more difficult to value.
Market and Credit Risks — In the normal course of business, the Fund trades financial instruments and enters into financial transactions where risk of potential loss exists due to changes in the market (market risk). The value of the securities in which the Fund invests may go up or down in response to the prospects of individual companies, particular sectors or governments and/ or general economic conditions throughout the world due to increasingly interconnected global economies and financial markets. Events such as war, military conflict, acts of terrorism, social unrest, natural disasters, recessions, inflation, rapid interest rate changes, supply chain disruptions, sanctions, the spread of infectious illness or other public health threats could also significantly impact the Fund and its investments. The Fund may utilize leverage, which magnifies the market risk.
Additionally, the Fund may also be exposed to credit risk in the event that an issuer or guarantor fails to perform or that an institution or entity with which the Fund has unsettled or open transactions defaults.
Private Real Estate Investment Funds Risk — The Fund’s performance depends in part upon the performance of the applicable private real estate investment fund managers and selected strategies, the adherence by such private real estate investment fund managers to such selected strategies, the instruments used by such private real estate investment fund managers and GSAM’s ability to select private real estate investment fund managers and strategies and effectively allocate Fund assets among them. Fund shareholders will bear two layers of fees and expenses: asset-based fees and expenses at the Fund level, and asset-based fees, incentive allocations or fees and expenses at the private real estate investment fund level.
The Fund’s investments in certain private real estate investment funds may be subject to lock-up periods, during which the Fund may not withdraw its investment. Many of the Fund’s assets will be priced in the absence of a readily available market and may be priced based on determinations of fair value, which may prove to be inaccurate. The Fund, upon its redemption of all or a portion of its interest in a private real estate investment fund, may receive an in-kind distribution of securities that are illiquid or difficult to
GOLDMAN SACHS REAL ESTATE DIVERSIFIED INCOME FUND
|
Consolidated Notes to Financial Statements (continued) September 30, 2024 |
|
|
9. OTHER RISKS (continued) |
value and difficult to dispose of. Private real estate investment funds are not publicly traded and therefore are not liquid investments. Private real estate investment funds may make significant use of leverage, which has the potential to magnify losses versus funds that do not employ leverage.
Private REIT Risk — In addition to the risks described in “Private Real Estate Investment Fund Risk” and “REIT Risk,” Private REITs are typically smaller and financially less stable than Public REITs. Private REITs are unlisted, making them hard to value and trade. Moreover, private REITs generally are exempt from Securities Act registration and, as such, are not subject to the same disclosure requirements as Public REITs, which makes private REITs more difficult to evaluate from an investment perspective.
REIT Risk — Investing in REITs involves certain unique risks in addition to those risks associated with investing in the real estate industry in general. REITs whose underlying properties are concentrated in a particular industry or geographic region are also subject to risks affecting such industries and regions. The securities of REITs involve greater risks than those associated with larger, more established companies and may be subject to more abrupt or erratic price movements because of interest rate changes, economic conditions and other factors. For example, the value of these securities may decline when interest rates rise and will also be affected by the real estate market and by the management or development of the underlying properties. The underlying properties may be subject to mortgage loans, which may also be subject to the risks of default. REITs may also fail to qualify for tax free pass-through of income or may fail to maintain their exemptions from investment company registration. Securities of such issuers may lack sufficient market liquidity to enable the Fund to effect sales at an advantageous time or without a substantial drop in price.
Repurchase Offers Risk — The Fund operates as an “interval fund,” and, in order to provide some liquidity to shareholders, will make quarterly offers to repurchase a percentage of its outstanding shares at NAV, pursuant to Rule 23c-3 under the Act. The repurchase of shares by the Fund would decrease the assets of the Fund and, therefore, may have the effect of increasing the Fund’s expense ratio. Repurchase offers and the need to fund repurchase obligations may also affect the ability of the Fund to be fully invested or force the Fund to maintain a higher percentage of its assets in liquid investments, which may harm the Fund’s investment performance. In addition, the Fund may be required to sell portfolio securities (including at inopportune times) to satisfy repurchase requests, resulting in increased transaction costs that must be borne by the Fund and its shareholders. This may result in higher short-term capital gains for taxable shareholders.
If a repurchase offer is oversubscribed and the Fund determines not to repurchase additional shares beyond the repurchase offer amount, or if shareholders tender an amount of shares greater than that which the Fund is entitled to purchase, the Fund will repurchase the shares tendered on a pro rata basis, and shareholders will have to wait until the next repurchase offer to make another repurchase request. Shareholders will be subject to the risk of NAV fluctuations during that period. Thus, there is also a risk that some shareholders, in anticipation of proration, may tender more shares than they wish to have repurchased in a particular quarter, thereby increasing the likelihood that proration will occur.
Under the Fund’s organizational documents, its Trustees, officers, employees and agents are indemnified, to the extent permitted by the Act and state law, against certain liabilities that may arise out of performance of their duties to the Fund. Additionally, in the course of business, the Fund enters into contracts that contain a variety of indemnification clauses. The Fund’s maximum exposure under these arrangements is unknown, as this would involve future claims that may be made against the Fund that have not yet occurred. However, GSAM believes the risk of loss under these arrangements to be remote.
GOLDMAN SACHS REAL ESTATE DIVERSIFIED INCOME FUND
|
|
11. SUMMARY OF SHARE TRANSACTIONS |
Share activity is as follows:
| | | | | | | | | | | | | | | | |
| | | Real Estate Diversified Income Fund | |
| | |
| | | For the Fiscal Year Ended
September 30, 2024 | | | For the Fiscal Year Ended
September 30, 2023 | |
| |
| | | | |
| | | | |
| | | Shares | | | Dollars | | | Shares | | | Dollars | |
| |
| | | | |
| | | | |
Class A Shares | | | | | | | | | | | | | | | | |
| | | | |
Shares sold | | | 1,119,593 | | | $ | 9,796,005 | | | | 965,709 | | | $ | 9,313,200 | |
| | | | |
Reinvestment of distributions | | | 180,603 | | | | 1,545,026 | | | | 228,766 | | | | 2,164,197 | |
| | | | |
Shares repurchased | | | (1,951,005 | ) | | | (16,815,967 | ) | | | (1,336,872 | ) | | | (12,837,279) | |
| |
| | | (650,809 | ) | | | (5,474,936 | ) | | | (142,397 | ) | | | (1,359,882) | |
| |
Class C Shares | | | | | | | | | | | | | | | | |
| | | | |
Shares sold | | | 81,189 | | | | 696,936 | | | | 66,008 | | | | 633,133 | |
| | | | |
Reinvestment of distributions | | | 67,775 | | | | 579,554 | | | | 112,901 | | | | 1,071,723 | |
| | | | |
Shares repurchased | | | (1,984,103 | ) | | | (17,237,504 | ) | | | (1,422,426 | ) | | | (13,751,114) | |
| |
| | | (1,835,139 | ) | | | (15,961,014 | ) | | | (1,243,517 | ) | | | (12,046,258) | |
| |
Class I Shares | | | | | | | | | | | | | | | | |
| | | | |
Shares sold | | | 1,621,879 | | | | 14,639,495 | | | | 1,802,446 | | | | 18,535,356 | |
| | | | |
Reinvestment of distributions | | | 151,115 | | | | 1,365,294 | | | | 228,032 | | | | 2,272,651 | |
| | | | |
Shares repurchased | | | (3,556,082 | ) | | | (32,225,659 | ) | | | (3,627,803 | ) | | | (37,476,894) | |
| |
| | | (1,783,088 | ) | | | (16,220,870 | ) | | | (1,597,325 | ) | | | (16,668,887) | |
| |
Class L Shares | | | | | | | | | | | | | | | | |
| | | | |
Shares sold | | | 3,565 | | | | 30,573 | | | | 3,534 | | | | 33,303 | |
| | | | |
Reinvestment of distributions | | | 13,291 | | | | 113,685 | | | | 15,852 | | | | 150,198 | |
| | | | |
Shares repurchased | | | (82,763 | ) | | | (706,027 | ) | | | (36,880 | ) | | | (359,025) | |
| |
| | | (65,907 | ) | | | (561,769 | ) | | | (17,494 | ) | | | (175,524) | |
| |
Class W Shares | | | | | | | | | | | | | | | | |
| | | | |
Shares sold | | | 34,270 | | | | 299,229 | | | | 179,216 | | | | 1,809,368 | |
| | | | |
Reinvestment of distributions | | | 84,804 | | | | 738,624 | | | | 136,826 | | | | 1,322,498 | |
| | | | |
Shares repurchased | | | (959,333 | ) | | | (8,389,743 | ) | | | (997,906 | ) | | | (9,760,552) | |
| |
| | | (840,259 | ) | | | (7,351,890 | ) | | | (681,864 | ) | | | (6,628,686) | |
| |
Class P Shares | | | | | | | | | | | | | | | | |
| | | | |
Shares sold | | | 778,936 | | | | 7,116,304 | | | | 4,156,046 | | | | 42,932,235 | |
| | | | |
Reinvestment of distributions | | | 1,103,111 | | | | 9,967,192 | | | | 1,329,124 | | | | 13,229,223 | |
| | | | |
Shares repurchased | | | (4,842,080 | ) | | | (44,008,221 | ) | | | (4,978,798 | ) | | | (50,356,564) | |
| |
| | | (2,960,033 | ) | | | (26,924,725 | ) | | | 506,372 | | | | 5,804,894 | |
| |
| | | | |
NET DECREASE IN SHARES | | | (8,135,235 | ) | | $ | (72,495,204 | ) | | | (3,176,225 | ) | | $ | (31,074,343) | |
|
| |
The Fund completed a quarterly repurchase offer on October 16, 2024, which resulted in 2,259,718 Fund Shares being repurchased for $19,775,172. There were 5,397,748 Fund Shares tendered for repurchase for this repurchase offer. Accordingly, the Fund repurchased 42% of the total number of shares tendered for repurchase.
Other than noted above, subsequent events after the Consolidated Statement of Assets and Liabilities date have been evaluated, and GSAM has concluded that there is no impact requiring adjustment or disclosure in the consolidated financial statements.
Report of Independent Registered Public Accounting Firm
To the Board of Trustees and Shareholders of Goldman Sachs Real Estate Diversified Income Fund
Opinion on the Financial Statements
We have audited the accompanying consolidated statement of assets and liabilities, including the consolidated schedule of investments, of Goldman Sachs Real Estate Diversified Income Fund (the “Fund”) as of September 30, 2024, the related consolidated statements of operations and cash flows for the year ended September 30, 2024, the consolidated statement of changes in net assets for each of the two years in the period end September 30, 2024, including the related notes, and the consolidated financial highlights for each of the periods indicated therein (collectively referred to as the “consolidated financial statements”). In our opinion, the consolidated financial statements present fairly, in all material respects, the financial position of the Fund as of September 30, 2024, the results of its operations and its cash flows for the year then ended, the changes in its net assets for each of the two years in the period ended September 30, 2024 and the financial highlights for each of the periods indicated therein in conformity with accounting principles generally accepted in the United States of America.
Basis for Opinion
These consolidated financial statements are the responsibility of the Fund’s management. Our responsibility is to express an opinion on the Fund’s consolidated financial statements based on our audits. We are a public accounting firm registered with the Public Company Accounting Oversight Board (United States) (PCAOB) and are required to be independent with respect to the Fund in accordance with the U.S. federal securities laws and the applicable rules and regulations of the Securities and Exchange Commission and the PCAOB.
We conducted our audits of these consolidated financial statements in accordance with the standards of the PCAOB. Those standards require that we plan and perform the audit to obtain reasonable assurance about whether the consolidated financial statements are free of material misstatement, whether due to error or fraud.
Our audits included performing procedures to assess the risks of material misstatement of the consolidated financial statements, whether due to error or fraud, and performing procedures that respond to those risks. Such procedures included examining, on a test basis, evidence regarding the amounts and disclosures in the consolidated financial statements. Our audits also included evaluating the accounting principles used and significant estimates made by management, as well as evaluating the overall presentation of the consolidated financial statements. Our procedures included confirmation of securities owned as of September 30, 2024 by correspondence with the custodian, transfer agent, real estate investment trusts, and private investment funds; when replies were not received, we performed other auditing procedures. We believe that our audits provide a reasonable basis for our opinion.
/s/ PricewaterhouseCoopers LLP
Boston, Massachusetts
November 25, 2024
We have served as the auditor of one or more investment companies in the Goldman Sachs fund complex since 2000.
GOLDMAN SACHS REAL ESTATE DIVERSIFIED INCOME FUND
Statement Regarding Basis for Approval of Management Agreement (Unaudited)
Background
The Goldman Sachs Real Estate Diversified Income Fund (the “Fund”) is a closed-end interval fund that commenced investment operations on May 15, 2020. The Board of Trustees oversees the management of the Fund and reviews the investment performance and expenses of the Fund at regularly scheduled meetings held throughout the year. In addition, the Board of Trustees determines annually whether to approve the continuance of the Fund’s investment management agreement (the “Management Agreement”) with Goldman Sachs Asset Management, L.P. (the “Investment Adviser”) on behalf of the Fund.
The Management Agreement was most recently approved for continuation until June 30, 2025 by the Board of Trustees, including those Trustees who are not parties to the Management Agreement or “interested persons” (as defined in the Investment Company Act of 1940, as amended) of any party thereto (the “Independent Trustees”), at a meeting held on June 11-12, 2024 (the “Annual Meeting”).
The review process undertaken by the Trustees spans the course of the year and culminates with the Annual Meeting. To assist the Trustees in their deliberations, the Trustees have established a Contract Review Committee (the “Committee”), comprised of the Independent Trustees. The Committee held five meetings over the course of the year since the Management Agreement was last approved. At those Committee meetings, regularly scheduled Board or other committee meetings, and/or the Annual Meeting, matters relevant to the renewal of the Management Agreement were considered by the Board, or the Independent Trustees, as applicable. With respect to the Fund, such matters included:
| | (a) | the nature and quality of the advisory, administrative, and other services provided to the Fund by the Investment Adviser and its affiliates, including information about: |
| | (i) | the structure, staff, and capabilities of the Investment Adviser and its portfolio management teams; |
| | (ii) | the groups within the Investment Adviser and its affiliates that support the portfolio management teams or provide other types of necessary services, including fund services groups (e.g., accounting and financial reporting, tax, shareholder services, and operations); controls and risk management groups (e.g., legal, compliance, valuation oversight, credit risk management, internal audit, compliance testing, market risk analysis, finance, and central funding); sales and distribution support groups, and others (e.g., information technology and training); |
| | (iii) | trends in employee headcount; |
| | (iv) | the Investment Adviser’s financial resources and ability to hire and retain talented personnel and strengthen its operations; and |
| | (v) | the parent company’s support of the Investment Adviser and its registered fund business, as expressed by the firm’s senior management; |
| | (b) | information on the investment performance of the Fund, including comparisons to the performance of similar closed-end interval real estate funds, as provided by a third-party fund data provider engaged as part of the contract review process (the “Outside Data Provider”), and a benchmark performance index; and information on general investment outlooks in the markets in which the Fund invests; |
| | (c) | the terms of the Management Agreement and other agreements with affiliated service providers entered into by the Fund; |
| | (d) | fee and expense information for the Fund, including: |
| | (i) | the relative management fee and expense levels of the Fund as compared to those of comparable funds managed by other advisers, as provided by the Outside Data Provider; and |
| | (ii) | the Fund’s expense trends over time; |
| | (e) | with respect to the extensive investment performance and expense comparison data provided by the Outside Data Provider, its processes in producing that data for the Fund; |
| | (f) | the undertaking of the Investment Adviser and its affiliates to implement an expense limitation; |
| | (g) | information relating to the profitability of the Management Agreement and the transfer agency and distribution and service arrangements of the Fund to the Investment Adviser and its affiliates; |
| | (h) | whether the Fund’s existing management fee schedule adequately addressed any economies of scale; |
| | (i) | a summary of the “fall-out” benefits derived by the Investment Adviser and its affiliates from their relationships with the Fund, including the fees received by the Investment Adviser’s affiliates from the Fund for transfer agency, portfolio trading, distribution and other services; |
| | (j) | a summary of potential benefits derived by the Fund as a result of its relationship with the Investment Adviser; |
| | (k) | information regarding commissions paid by the Fund and broker oversight, an update on the Investment Adviser’s soft dollars practices, other information regarding portfolio trading, and how the Investment Adviser carries out its duty to seek best execution; |
| | (l) | portfolio manager ownership of Fund shares; the manner in which portfolio manager compensation is determined; and the number and types of accounts managed by the portfolio managers; |
GOLDMAN SACHS REAL ESTATE DIVERSIFIED INCOME FUND
Statement Regarding Basis for Approval of Management Agreement (Unaudited) (continued)
| | (m) | the nature and quality of the services provided to the Fund by its unaffiliated service providers, and the Investment Adviser’s general oversight and evaluation (including reports on due diligence) of those service providers as part of the administrative services provided under the Management Agreement; and |
| | (n) | the Investment Adviser’s processes and policies addressing various types of potential conflicts of interest; its approach to risk management; the annual review of the effectiveness of the Fund’s compliance program; and periodic compliance reports. |
The Trustees also received an overview of the Fund’s distribution arrangements. They received information regarding the Fund’s assets, share purchase and repurchase activity, and payment of distribution and service fees. Information was also provided to the Trustees relating to revenue sharing payments made by and services provided by the Investment Adviser and its affiliates to intermediaries that promote the sale, distribution, and/or servicing of Fund shares. The Independent Trustees also discussed the broad range of other investment choices that are available to Fund investors, including the availability of comparable funds managed by other advisers.
The presentations made at the Board and Committee meetings and at the Annual Meeting encompassed the Fund and other funds for which the Board of Trustees has responsibility. In evaluating the Management Agreement at the Annual Meeting, the Trustees relied upon their knowledge, resulting from their meetings and other interactions throughout the year, of the Investment Adviser and its affiliates, their services, and the Fund. In conjunction with these meetings, the Trustees received written materials and oral presentations on the topics covered, and the Investment Adviser addressed the questions and concerns of the Trustees, including concerns regarding the investment performance of certain of the funds they oversee. The Independent Trustees were advised by their independent legal counsel regarding their responsibilities and other regulatory requirements related to the approval and continuation of registered fund investment management agreements under applicable law. In addition, the Investment Adviser and its affiliates provided the Independent Trustees with a written response to a formal request for information sent on behalf of the Independent Trustees by their independent legal counsel. During the course of their deliberations, the Independent Trustees met in executive sessions with their independent legal counsel, without representatives of the Investment Adviser or its affiliates present.
Nature, Extent, and Quality of the Services Provided Under the Management Agreement
As part of their review, the Trustees considered the nature, extent, and quality of the services provided to the Fund by the Investment Adviser. In this regard, the Trustees considered both the investment advisory services and non-advisory services that are provided by the Investment Adviser and its affiliates. The Trustees noted the Investment Adviser’s commitment to maintaining high quality systems and expending substantial resources to respond to ongoing changes to the market, regulatory and control environment in which the Fund and its service providers operate, including developments associated with geopolitical events, and economic sanctions, as well as the efforts of the Investment Adviser and its affiliates to combat cyber security risks. They also noted the transition in the leadership and changes in personnel of various of the Investment Adviser’s portfolio management teams that had occurred in recent periods, and the ongoing recruitment efforts aimed at bringing high quality investment talent to the Investment Adviser. They also considered information regarding the Investment Adviser’s efforts relating to business continuity planning. The Trustees concluded that the Investment Adviser continued to commit substantial financial and operational resources to the Fund and expressed confidence that the Investment Adviser would continue to do so in the future. The Trustees also recognized that the Investment Adviser had made significant commitments to address regulatory compliance requirements applicable to the Fund and the Investment Adviser and its affiliates.
Investment Performance
The Trustees also considered the investment performance of the Fund. In this regard, they compared the investment performance of the Fund to its peers using rankings compiled by the Outside Data Provider as of December 31, 2023, and updated performance information prepared by the Investment Adviser using the peer group identified by the Outside Data Provider as of March 31, 2024. The information on the Fund’s investment performance was provided for the one-, three-, and five-year periods ending on the applicable dates. The Trustees also reviewed each Fund’s investment performance relative to its performance benchmark. As part of this review, they considered the investment performance trends of the Fund over time, and reviewed the investment performance of the Fund in light of its investment objective and policies and market conditions.
In addition, the Trustees considered materials prepared and presentations made by the Investment Adviser’s senior management and portfolio management personnel in which Fund performance was assessed. The Trustees also considered the Investment Adviser’s periodic reports with respect to the Fund’s risk profile, and how the Investment Adviser’s approach to risk monitoring and management influences portfolio management.
The Trustees observed that the Fund’s Class I Shares had placed in the top half of the Fund’s peer group for the one-year period, in the third quartile for the five-year period, and in the fourth quartile for the three-year period ended December 31, 2023, and had underperformed the Fund’s benchmark index for the one-, three-, and five-year periods ended March 31, 2024. They also noted that the Fund’s investment performance was consistent with the investment objective of seeking to produce income and achieve
GOLDMAN SACHS REAL ESTATE DIVERSIFIED INCOME FUND
Statement Regarding Basis for Approval of Management Agreement (Unaudited) (continued)
capital appreciation with low to moderate volatility and low to moderate correlation to the broader equity markets. The Trustees also recalled that the Fund’s predecessor had commenced operations in 2013 and had been reorganized into the Fund in May 2020, prior to which it was managed by a different investment adviser.
Costs of Services Provided and Competitive Information
The Trustees considered the contractual terms of the Management Agreement and the fee rate payable by the Fund thereunder. In this regard, the Trustees considered information on the services rendered by the Investment Adviser to the Fund, which included both advisory and administrative services that were directed to the needs and operations of the Fund as a closed-end interval fund.
In particular, the Trustees reviewed analyses prepared by the Outside Data Provider regarding the expense rankings of the Fund. The analyses provided a comparison of the Fund’s management fee to those of a relevant peer group and category universe; an expense analysis which compared the Fund’s overall net expenses to a peer group and a category universe; and data comparing the Fund’s net expenses to the peer and category medians. The Trustees concluded that the comparisons provided by the Outside Data Provider were useful in evaluating the reasonableness of the management fees and total expenses paid by the Fund. In addition, the Trustees also considered the Investment Adviser’s undertaking to implement an expense limitation.
Profitability
The Trustees reviewed the Fund’s contribution to the Investment Adviser’s revenues and pre-tax profit margins. In this regard the Trustees noted that they had received, among other things, profitability analyses and summaries, revenue and expense schedules for the Fund by function (i.e., investment management, transfer agency and distribution and service), and information on the Investment Adviser’s expense allocation methodology. They observed that the profitability and expense figures are substantially similar to those used by the Investment Adviser for many internal purposes, including compensation decisions among various business groups, and are thus subject to a vigorous internal debate about how certain revenue and expenses should be allocated. The Trustees also noted that the internal audit group within the Goldman Sachs & Co. LLC (“Goldman Sachs”) organization periodically audits the expense allocation methodology and that the internal audit group was satisfied with the reasonableness, consistency, and accuracy of the Investment Adviser’s expense allocation methodology and profitability analysis calculations. Profitability data for the Fund was provided for 2023 and 2022. The Trustees considered this information in relation to the Investment Adviser’s overall profitability.
Economies of Scale
The Trustees noted that the Fund does not have management fee breakpoints. They considered the asset levels in the Fund; the Fund’s recent share repurchase activity; the information provided by the Investment Adviser relating to the costs of the services provided by the Investment Adviser and its affiliates and their realized profits; information comparing the contractual management fee rate charged by other advisers to other funds in the peer group. They recognized that if the assets of the Fund increase over time, the Fund and its shareholders could realize economies of scale as certain Fund expenses become a smaller percentage of overall assets. The Trustees further noted the Investment Adviser’s assertion that future economies of scale (among several factors) had been taken into consideration in determining the Fund’s contractual management fee rate. They also considered the Investment Adviser’s undertaking to limit certain expenses of the Fund that exceed a specified level of the Fund’s net assets.
Other Benefits to the Investment Adviser and Its Affiliates
The Trustees also considered the other benefits derived by the Investment Adviser and its affiliates from their relationships with the Fund as stated above, including: (a) transfer agency fees received by Goldman Sachs; (b) brokerage and futures commissions earned by Goldman Sachs for executing securities and futures transactions on behalf of the Fund; (c) research received by the Investment Adviser from broker-dealers in exchange for executing certain transactions on behalf of the Fund; (d) trading efficiencies resulting from aggregation of orders of the Fund with those for other funds or accounts managed by the Investment Adviser; (e) the Investment Adviser’s ability to leverage the infrastructure designed to service the Fund on behalf of its other clients; (f) the Investment Adviser’s ability to cross-market other products and services to Fund shareholders; (g) Goldman Sachs’ retention of certain fees as Fund Distributor; (h) the Investment Adviser’s ability to negotiate better pricing with custodians on behalf of its other clients, as a result of the relationship with the Fund; and (i) the possibility that the working relationship between the Investment Adviser and the Fund’s third-party service providers may cause those service providers to be more likely to do business with other areas of Goldman Sachs. In the course of considering the foregoing, the Independent Trustees requested and received further information quantifying certain of these fall-out benefits.
GOLDMAN SACHS REAL ESTATE DIVERSIFIED INCOME FUND
Statement Regarding Basis for Approval of Management Agreement (Unaudited) (continued)
Other Benefits to the Fund and Its Shareholders
The Trustees also noted that the Fund receives certain other potential benefits as a result of its relationship with the Investment Adviser, including: (a) trading efficiencies resulting from aggregation of orders of the Fund with those of other funds or accounts managed by the Investment Adviser; (b) enhanced servicing from vendors due to the volume of business generated by the Investment Adviser and its affiliates; (c) enhanced servicing from broker-dealers due to the volume of business generated by the Investment Adviser and its affiliates; (d) the Investment Adviser’s ability to negotiate favorable terms with derivatives counterparties on behalf of the Fund as a result of the size and reputation of the Goldman Sachs organization; (e) the advantages received from the Investment Adviser’s knowledge and experience gained from managing other accounts and products; (f) the Investment Adviser’s ability to hire and retain qualified personnel to provide services to the Fund because of the reputation of the Goldman Sachs organization; (g) the Fund’s access, through the Investment Adviser, to certain firm-wide resources (e.g., proprietary risk management systems and databases), subject to certain restrictions; and (h) the Fund’s access to certain affiliated distribution channels. In addition, the Trustees noted the competitive nature of the closed-end interval fund marketplace and considered that many of the Fund’s shareholders invested in the Fund in part because of the Fund’s relationship with the Investment Adviser and that those shareholders have a general expectation that the relationship will continue.
Conclusion
In connection with their consideration of the Management Agreement, the Trustees gave weight to each of the factors described above, but did not identify any particular factor as controlling their decision. After deliberation and consideration of all of the information provided, including the factors described above, the Trustees concluded, in the exercise of their business judgment, that the management fees paid by the Fund were reasonable in light of the services provided to it by the Investment Adviser, the Investment Adviser’s costs and the Fund’s current and reasonably foreseeable asset levels. The Trustees unanimously concluded that the Investment Adviser’s continued management likely would benefit the Fund and its shareholders and that the Management Agreement should be approved and continued with respect to the Fund until June 30, 2025.
GOLDMAN SACHS REAL ESTATE DIVERSIFIED INCOME FUND
Trustees and Officers (Unaudited)
Independent Trustees
| | | | | | | | | | |
Name, Address and Age1 | | Position(s) Held with the Trust | | Term of Office and Length of Time Served2 | | Principal Occupations During Past 5 Years | | Number of Portfolios in Fund Complex Overseen by Trustee3 | | Other Directorships Held by Trustee4 |
| | | | | | |
Gregory G. Weaver Age: 72 | | Chair of the Board of Trustees | | Since 2024 | | Mr. Weaver is retired. Formerly, he was Director, Verizon Communications Inc. (2015-Present); Chairman and Chief Executive Officer, Deloitte & Touche LLP (a professional services firm) (2001- 2005 and 2012-2014); and Member of the Board of Directors, Deloitte & Touche LLP (2006-2012). Chair of the Board of Trustees— Goldman Sachs Real Estate Diversified Income Fund; Goldman Sachs Trust; Goldman Sachs Variable Insurance Trust; Goldman Sachs Trust II; Goldman Sachs ETF Trust; and Goldman Sachs ETF Trust II. | | 179 | | |
| | | | | | |
Cheryl K. Beebe Age: 68 | | Trustee | | Since 2021 | | Ms. Beebe is retired. She is Director, Packaging Corporation of America (2008–Present); Director, The Mosaic Company (2019–Present); and was formerly Director, HanesBrands Inc. (a multinational clothing company) (2020-2023); Director, Convergys Corporation (a global leader in customer experience outsourcing) (2015–2018); and formerly held the position of Executive Vice President, (2010–2014); and Chief Financial Officer, Ingredion, Inc. (a leading global ingredient solutions company) (2004–2014). Trustee—Goldman Sachs Real Estate Diversified Income Fund; Goldman Sachs Trust; Goldman Sachs Variable Insurance Trust; Goldman Sachs Trust II; Goldman Sachs ETF Trust; and Goldman Sachs ETF Trust II. | | 179 | | Packaging Corporation of America (producer of container board); The Mosaic Company (producer of phosphate and potash fertilizer) |
| | | | | | |
Dwight L. Bush Age: 67 | | Trustee | | Since 2024 | | The Honorable Dwight Bush is President and CEO of D.L. Bush & Associates (a financial advisory and private investment firm) (2002-2014 and 2017-Present); Director of MoneyLion, Inc. (an operator of a data-driven, digital financial platform) (2021-Present); and was formerly U.S. Ambassador to the Kingdom of Morocco (2014- 2017) and a Member of the Board of Directors of Santander Bank, N.A. (2018-2019). Previously, he served as an dvisory Board Member of Goldman Sachs Trust and Goldman Sachs Variable Insurance Trust (October 2019-January 2020). Trustee—Goldman Sachs Real Estate Diversified Income Fund; Goldman Sachs Trust; Goldman Sachs Variable Insurance Trust; Goldman Sachs Trust II; Goldman Sachs ETF Trust; and Goldman Sachs ETF Trust II. | | 179 | | MoneyLion, Inc. (an operator of a data-driven, digital financial platform) |
| | | | | | |
Kathryn A. Cassidy Age: 70 | | Trustee | | Since 2024 | | Ms. Cassidy is retired. She is Director, Vertical Aerospace Ltd. (an aerospace and technology company) (2021–Present). Formerly, Ms. Cassidy was Advisor to the Chairman (May 2014– December 2014); and Senior Vice President and Treasurer (2008–2014), General Electric Company & General Electric Capital Corporation (technology and financial services companies). Trustee—Goldman Sachs Real Estate Diversified Income Fund; Goldman Sachs Trust; Goldman Sachs Variable Insurance Trust; Goldman Sachs Trust II; Goldman Sachs ETF Trust; and Goldman Sachs ETF Trust II. | | 179 | | Vertical Aerospace Ltd. (an aerospace and technology company) |
GOLDMAN SACHS REAL ESTATE DIVERSIFIED INCOME FUND
Trustees and Officers (Unaudited) (continued)
Independent Trustees
| | | | | | | | | | |
Name, Address and Age1 | | Position(s) Held with the Trust | | Term of Office and Length of Time Served2 | | Principal Occupations During Past 5 Years | | Number of Portfolios in Fund Complex Overseen by Trustee3 | | Other Directorships Held by Trustee4 |
| | | | | | |
John G. Chou Age: 67 | | Trustee | | Since 2024 | | Mr. Chou is retired. Formerly, he was Executive Vice President and Special Advisor to the Chairman and CEO (2021-2022); Executive Vice President and Chief Legal Officer (2019-2021); Executive Vice President and Chief Legal & Business Officer (2017-2019); and Executive Vice President and General Counsel (2011-2017) of Cencora, Inc. (a pharmaceutical and healthcare company.) | | 179 | | None |
| | | | | | Trustee—Goldman Sachs Real Estate Diversified Income Fund; Goldman Sachs Trust; Goldman Sachs Variable Insurance Trust; Goldman Sachs Trust II; Goldman Sachs ETF Trust; and Goldman Sachs ETF Trust II. | | | | |
| | | | | | |
Joaquin Delgado Age: 64 | | Trustee | | Since 2024 | | Dr. Delgado is retired. He is Director, Stepan Company (a specialty chemical manufacturer) (2011-Present); and was formerly Director, Hexion Inc. (a specialty chemical manufacturer) (2019-2022); Executive Vice President, Consumer Business Group of 3M Company (July 2016-July 2019); and Executive Vice President, Health Care Business Group of 3M Company (October 2012-July 2016). Previously, Dr. Delgado served as an Advisory Board Member of Goldman Sachs Trust and Goldman Sachs Variable Insurance Trust (October 2019-January 2020). | | 179 | | Stepan Company (a specialty chemical manufacturer) |
| | | | | | Trustee—Goldman Sachs Real Estate Diversified Income Fund; Goldman Sachs Trust; Goldman Sachs Variable Insurance Trust; Goldman Sachs Trust II; Goldman Sachs ETF Trust; and Goldman Sachs ETF Trust II. | | | | |
| | | | | | |
| | | | | | | | | | |
GOLDMAN SACHS REAL ESTATE DIVERSIFIED INCOME FUND
Trustees and Officers (Unaudited) (continued)
Independent Trustees
| | | | | | | | | | |
Name, Address and Age1 | | Position(s) Held with the Trust | | Term of Office and Length of Time Served2 | | Principal Occupations During Past 5 Years | | Number of Portfolios in Fund Complex Overseen by Trustee3 | | Other Directorships Held by Trustee4 |
| | | | | | |
Eileen H. Dowling Age: 61 | | Trustee | | Since 2024 | | Ms. Dowling is retired. Formerly, she was Senior Advisor (April 2021-September 2021); and Managing Director (2013-2021), BlackRock, Inc. (a financial services firm). As Managing Director, she held senior management positions, including Global Head of Global Consultant Relations (2017-2021), Multinational Corporations (2019-2021), the Institutional Product Group (2015-2019) and Institutional Marketing (2013- 2016). Ms. Dowling was a member of the Global Operating Committee and Product Executive Committee of BlackRock. | | 179 | | None |
| | | | | | Trustee—Goldman Sachs Real Estate Diversified Income Fund; Goldman Sachs Trust; Goldman Sachs Variable Insurance Trust; Goldman Sachs Trust II; Goldman Sachs ETF Trust; and Goldman Sachs ETF Trust II. | | | | |
| | | | | | |
Lawrence Hughes Age: 65 | | Trustee | | Since 2021 | | Mr. Hughes is retired. Formerly, he held senior management positions with BNY Mellon Wealth Management, a division of The Bank of New York Mellon Corporation (a financial services company) (1991–2015), most recently as Chief Executive Officer (2010–2015). Previously, Mr. Hughes served as an Advisory Board Member of Goldman Sachs Trust II (February 2016 – April 2016). | | 179 | | None |
| | | | | | Trustee—Goldman Sachs Real Estate Diversified Income Fund; Goldman Sachs Trust; Goldman Sachs Variable Insurance Trust; Goldman Sachs Trust II; Goldman Sachs ETF Trust; and Goldman Sachs ETF Trust II. | | | | |
| | | | | | |
John F. Killian Age: 69 | | Trustee | | Since 2021 | | Mr. Killian is retired. He is Director, Consolidated Edison, Inc. (2007–Present); and was formerly Director, Houghton Mifflin Harcourt Publishing Company (2011–2022). Previously, he held senior management positions with Verizon Communications, Inc., including Executive Vice President and Chief Financial Officer (2009–2010); and President, Verizon Business, Verizon Communications, Inc. (2005–2009). | | 179 | | Consolidated Edison, Inc. (a utility holding company) |
| | | | | | Trustee—Goldman Sachs Real Estate Diversified Income Fund; Goldman Sachs Trust; Goldman Sachs Variable Insurance Trust; Goldman Sachs Trust II; Goldman Sachs ETF Trust; and Goldman Sachs ETF Trust II. | | | | |
| | | | | | |
Steven D. Krichmar Age: 65 | | Trustee | | Since 2021 | | Mr. Krichmar is retired. Formerly, he held senior management and governance positions with Putnam Investments, LLC, a financial services company (2001–2016). He was most recently Chief of Operations and a member of the Operating Committee of Putnam Investments, LLC and Principal Financial Officer of The Putnam Funds. Previously, Mr. Krichmar served as an Audit Partner with PricewaterhouseCoopers LLP and its predecessor company (1990 – 2001). | | 179 | | None |
| | | | | | Trustee—Goldman Sachs Real Estate Diversified Income Fund; Goldman Sachs Trust; Goldman Sachs Variable Insurance Trust; Goldman Sachs Trust II; Goldman Sachs ETF Trust; and Goldman Sachs ETF Trust II. | | | | |
GOLDMAN SACHS REAL ESTATE DIVERSIFIED INCOME FUND
Trustees and Officers (Unaudited) (continued)
Independent Trustees
| | | | | | | | | | |
Name, Address and Age1 | | Position(s) Held with the Trust | | Term of Office and Length of Time Served2 | | Principal Occupations During Past 5 Years | | Number of Portfolios in Fund Complex Overseen by Trustee3 | | Other Directorships Held by Trustee4 |
| | | | | | |
Michael Latham Age: 58 | | Trustee | | Since inception | | Mr. Latham is retired. Formerly, he held senior management positions with the iShares exchange-traded fund business owned by BlackRock, Inc., including Chairman (2011–2014); Global Head (2010–2011); U.S. Head (2007–2010); and Chief Operating Officer (2003–2007). | | 179 | | None |
| | | | | | Trustee—Goldman Sachs Real Estate Diversified Income Fund; Goldman Sachs Trust; Goldman Sachs Variable Insurance Trust; Goldman Sachs Trust II; Goldman Sachs ETF Trust; and Goldman Sachs ETF Trust II. | | | | |
| | | | | | |
Lawrence W. Stranghoener Age: 69 | | Trustee | | Since inception | | Mr. Stranghoener is retired. Formerly, he was Chairman, Kennametal, Inc. (a global manufacturer and distributor of tooling and industrial materials) (2003–Present); Director, Aleris Corporation and Aleris International, Inc. (a producer of aluminum rolled products) (2011–2020); Interim Chief Executive Officer (2014) and Executive Vice President and Chief Financial Officer (2004–2014), Mosaic Company (a fertilizer manufacturing company). | | 179 | | None |
| | | | | | Trustee—Goldman Sachs Real Estate Diversified Income Fund; Goldman Sachs Trust; Goldman Sachs Variable Insurance Trust; Goldman Sachs Trust II; Goldman Sachs ETF Trust; and Goldman Sachs ETF Trust II. | | | | |
| | | | | | |
Paul C. Wirth Age: 66 | | Trustee | | Since 2024 | | Mr. Wirth is retired. He is Executive Advisor, My Next Season LLC (a career transition advisory firm) (2023 – Present) Formerly, he was Deputy Chief Financial Officer and Principal Accounting Officer (2011-2020); Finance Director and Principal Accounting Officer (2010-2011); and Managing Director, Global Controller, and Chief Accounting Officer (2005-2010) of Morgan Stanley. | | 179 | | None |
| | | | | | Trustee—Goldman Sachs Real Estate Diversified Income Fund; Goldman Sachs Trust; Goldman Sachs Variable Insurance Trust; Goldman Sachs Trust II; Goldman Sachs ETF Trust; and Goldman Sachs ETF Trust II. | | | | |
| | | | | | |
| | | | | | | | | | |
GOLDMAN SACHS REAL ESTATE DIVERSIFIED INCOME FUND
Trustees and Officers (Unaudited) (continued)
Interested Trustee*
| | | | | | | | | | |
Name, Address and Age1 | | Position(s) Held with the Trust | | Term of Office and Length of Time Served2 | | Principal Occupations During Past 5 Years | | Number of Portfolios in Fund Complex Overseen by Trustee3 | | Other Directorships Held by Trustee4 |
| | | | | | |
James A. McNamara* Age: 61 | | President and Trustee | | Since inception | | Advisory Director, Goldman Sachs (January 2018-Present); Managing Director, Goldman Sachs (January 2000-December 2017); Director of Institutional Fund Sales, GSAM (April 1998- December 2000); and Senior Vice President and Manager, Dreyfus Institutional Service Corporation (a financial services firm) (January 1993-April 1998). | | 179 | | None |
| | | | | | President and Trustee—Goldman Sachs Real Estate Diversified Income Fund; Goldman Sachs Trust; Goldman Sachs Variable Insurance Trust; Goldman Sachs Trust II; Goldman Sachs ETF Trust; and Goldman Sachs ETF Trust II. | | | | |
| | | | | | |
| | | | | | | | | | |
| * | Mr. McNamara is considered to be an “Interested Trustee” of the Trust because he holds positions with Goldman Sachs and owns securities issued by The Goldman Sachs Group, Inc. Mr. McNamara holds comparable positions with certain other companies of which Goldman Sachs, GSAM or an affiliate thereof is the investment adviser, administrator and/or distributor. |
| 1 | Each Trustee may be contacted by writing to the Trustee, c/o Goldman Sachs, 200 West Street, New York, New York, 10282, Attn: Robert Griffith. Information is provided as of September 30, 2024. |
| 2 | Subject to such policies as may be adopted by the Board from time-to-time, each Trustee holds office for an indefinite term, until the earliest of: (a) the election of his or her successor; (b) the date the Trustee resigns or is removed by the Board or shareholders, in accordance with the Trust’s Declaration of Trust; or (c) the termination of the Trust. The Board has adopted policies which provide that each Independent Trustee shall retire as of June 30th following (a) his or her 75th birthday or (b) the 15th anniversary of the date he or she became a Trustee, whichever is earlier, unless a waiver of such requirements shall have been adopted by a majority of the other Trustees. These policies may be changed by the Trustees without shareholder vote. |
| 3 | The Goldman Sachs Fund Complex includes certain other companies listed above for each respective Trustee. As of September 30, 2024, Goldman Sachs Real Estate Diversified Income Fund consisted of one portfolio; Goldman Sachs Trust consisted of 88 portfolios (83 of which offered shares to the public); Goldman Sachs Variable Insurance Trust consisted of 15 portfolios (11 of which offered shares to the public); Goldman Sachs Trust II consisted of 7 portfolios; Goldman Sachs ETF Trust consisted of 66 portfolios (40 of which offered shares to the public); and Goldman Sachs ETF Trust II consisted of 2 portfolios. |
| 4 | This column includes only directorships of companies required to report to the Securities and Exchange Commission under the Securities Exchange Act of 1934 (i.e., “public companies”) or other investment companies registered under the Act. |
Additional information about the Trustees is available in the Funds’ Statement of Additional Information, which can be obtained from Goldman Sachs free of charge by calling this toll-free number (in the United States of America): 1-800-526-7384.
GOLDMAN SACHS REAL ESTATE DIVERSIFIED INCOME FUND
Trustees and Officers (Unaudited) (continued)
Officers of the Trust*
| | | | | | |
Name, Address and Age1 | | Position(s) Held with the Trust | | Term of Office and Length of Time Served2 | | Principal Occupations During Past 5 Years |
| | | | |
James A. McNamara 200 West Street New York, NY 10282 Age: 61 | | Trustee and President | | Since inception | | Advisory Director, Goldman Sachs (January 2018-Present); Managing Director, Goldman Sachs (January 2000-December 2017); Director of Institutional Fund Sales, GSAM (April 1998-December 2000); and Senior Vice President and Manager, Dreyfus Institutional Service Corporation (a financial services firm) (January 1993-April 1998). President and Trustee—Goldman Sachs Real Estate Diversified Income Fund; Goldman Sachs Trust; Goldman Sachs Variable Insurance Trust; Goldman Sachs Trust II; Goldman Sachs ETF Trust; and Goldman Sachs ETF Trust II. |
| | | | |
Joseph F. DiMaria 30 Hudson Street Jersey City, NJ 07302 Age: 56 | | Treasurer, Principal Financial Officer and Principal Accounting Officer | | Since inception | | Managing Director, Goldman Sachs (November 2015-Present) and Vice President — Mutual Fund Administration, Columbia Management Investment Advisers, LLC (May 2010- October 2015). Treasurer, Principal Financial Officer and Principal Accounting Officer —Goldman Sachs Real Estate Diversified Income Fund; Goldman Sachs Trust (previously Assistant Treasurer (2016)); Goldman Sachs Variable Insurance Trust (previously Assistant Treasurer (2016)); Goldman Sachs Trust II (previously Assistant Treasurer (2017)); Goldman Sachs ETF Trust (previously Assistant Treasurer (2017)); and Goldman Sachs ETF Trust II. |
| | | | |
Robert Griffith 200 West Street New York, NY 10282 Age: 49 | | Secretary | | Since 2022 | | Managing Director, Goldman Sachs (September 2022 – Present); General Counsel, Exchange Traded Concepts, LLC (October 2021 – September 2022); Vice President, Goldman Sachs (August 2011 – October 2021); Associate General Counsel, Goldman Sachs (December 2014 – Present); Assistant General Counsel, Goldman Sachs (August 2011 – December 2014); Vice President and Counsel, Nomura Holding America, Inc. (2010 – 2011); and Associate, Simpson Thacher & Bartlett LLP (2005 – 2010). Secretary—Goldman Sachs Real Estate Diversified Income Fund (previously Assistant Secretary (2022)); Goldman Sachs Trust (previously Assistant Secretary (2022)); Goldman Sachs Variable Insurance Trust (previously Assistant Secretary (2022)); Goldman Sachs Trust II (previously Assistant Secretary (2022)); Goldman Sachs ETF Trust (previously Assistant Secretary (2022)); and Goldman Sachs ETF Trust II (previously Assistant Secretary (2022)). |
| * | Represents a partial list of officers of the Trust. Additional information about all the officers is available in the Funds’ Statement of Additional Information, which can be obtained from Goldman Sachs free of charge by calling this toll-free number (in the United States): 1-800-526-7384. |
| 1 | Information is provided as of September 30, 2024. |
| 2 | Officers hold office at the pleasure of the Board of Trustees or until their successors are duly elected and qualified. Each officer holds comparable positions with certain other companies of which Goldman Sachs, GSAM or an affiliate thereof is the investment adviser, administrator and/or distributor. |
Goldman Sachs Real Estate Diversified Income Fund — Tax Information (Unaudited)
For the fiscal year ended September 30, 2024, 67.45% of the dividends paid from net investment company taxable income by the Goldman Sachs Real Estate Diversified Income Fund qualify as section 199A dividends.
(This page intentionally left blank)
(This page intentionally left blank)
(This page intentionally left blank)
TRUSTEES TRUSTEES (continued) Gregory G. Weaver, Chair James A. McNamara Cheryl K. Beebe Lawrence W. Stranghoener Dwight L. Bush Paul C. Wirth Kathryn A. Cassidy John G. Chou Joaquin Delgado OFFICERS Eileen H. Dowling James A. McNamara, President Lawrence Hughes Joseph F. DiMaria, Principal Financial Officer, John F. Killian Principal Accounting Officer and Treasurer Steven D. Krichmar Robert Griffith, Secretary Michael Latham GOLDMAN SACHS & CO. LLC GOLDMAN SACHS ASSET MANAGEMENT, L.P. Distributor and Transfer Agent Investment Adviser Visit our website at am.gs.com to obtain the most recent month end returns. Goldman Sachs Asset Management, L.P., 200 West Street, New York, New York 10282 Economic and market forecasts presented herein reflect our judgment as of the date of this presentation and are subject to change without notice. These forecasts do not take into account the specific investment objectives, restrictions, tax and financial situation or other needs of any specific client. Actual data will vary and may not be reflected here. These forecasts are subject to high levels of uncertainty that may affect actual performance. Accordingly, these forecasts should be viewed as merely representative of a broad range of possible outcomes. These forecasts are estimated, based on assumptions, and are subject to significant revision and may change materially as economic and market conditions change. Goldman Sachs has no obligation to provide updates or changes to these forecasts. Case studies and examples are for illustrative purposes only. The portfolio risk management process includes an effort to monitor and manage risk, but does not imply low risk. The report concerning the Fund included in this shareholder report may contain certain forward-looking statements about the factors that may affect the performance of the Fund in the future. These statements are based on Fund management’s predictions and expectations concerning certain future events and their expected impact on the Fund, such as performance of the economy as a whole and of specific industry sectors, changes in the levels of interest rates, the impact of developing world events, and other factors that may influence the future performance of the Fund. Management believes these forward-looking statements to be reasonable, although they are inherently uncertain and difficult to predict. Actual events may cause adjustments in portfolio management strategies from those currently expected to be employed. A description of the policies and procedures that the Fund uses to determine how to vote proxies relating to portfolio securities and information regarding how the Fund voted proxies relating to portfolio securities during the most recent 12-month period ended June 30 is available (i) without charge, upon request by calling 1-800-526-7384 (for Retail Shareholders) or 1-800-621-2550 (for Institutional Shareholders); (ii) on the Fund’s website at dfinview.com/GoldmanSachs; and (iii) on the Securities and Exchange Commission (“SEC”) web site at http://www.sec.gov. The Global Industry Classification Standard (GICS) was developed by and is the exclusive property and a service mark of Morgan Stanley Capital International Inc. (MSCI) and Standard & Poor’s, a division of The McGraw-Hill Companies, Inc. (S&P) and is licensed for use by Goldman Sachs. Neither MSCI, S&P nor any other party involved in making or compiling the GICS or any GICS classifications makes any express or implied warranties or representations with respect to such standard or classification (or the results to be obtained by the use thereof), and all such parties hereby expressly disclaim all warranties of originality, accuracy, completeness, merchantability or fitness for a particular purpose with respect to any of such standard or classification. Without limiting any of the foregoing, in no event shall MSCI, S&P, any of their affiliates or any third party involved in making or compiling the GICS or any GICS classifications have any liability for any direct, indirect, special, punitive, consequential or any other damages (including lost profits) even if notified of the possibility of such damages. The Fund will file portfolio holdings information for each month in a fiscal quarter within 60 days after the end of the relevant fiscal quarter on Form N-PORT. Portfolio holdings information for the third month of each fiscal quarter will be made available on the SEC’s web site at http://www.sec.gov. Portfolio holdings information may be obtained upon request and without charge by calling 1-800-526-7384 (for Retail Shareholders) or 1-800-621-2550 (for Institutional Shareholders). Holdings and allocations shown are as of September 30, 2024 and may not be representative of future investments. Fund holdings should not be relied on in making investment decisions and should not be construed as research or investment advice regarding particular securities. Current and future holdings are subject to risk. This material is not authorized for distribution to prospective investors unless preceded or accompanied by a current prospectus or summary prospectus, if applicable. Investors should consider the Fund’s objective, risks, and charges and expenses, and read the summary prospectus, if available, and/or the prospectus carefully before investing or sending money. The summary prospectus, if available, and the prospectus contain this and other information about the Fund and may be obtained from your authorized dealer or from Goldman Sachs & Co. LLC by calling (retail – 1-800-526-7384) (institutional – 1-800-621-2550). © 2024 Goldman Sachs. All rights reserved. 398539-OTU-2150485 RLDVINCAR-24
| | (a) | As of the end of the period covered by this report, the registrant has adopted a code of ethics that applies to the registrant’s principal executive officer, principal financial officer, principal accounting officer or controller, or persons performing similar functions, regardless of whether these individuals are employed by the registrant or a third party (the “Code of Ethics”). |
| | (c) | During the period covered by this report, no amendments were made to the provisions of the Code of Ethics. |
| | (d) | During the period covered by this report, the registrant did not grant any waivers, including an implicit waiver, from any provision of the Code of Ethics. |
| | (f) | A copy of the Code of Ethics is available as provided in Item 19(a)(1) of this report. |
| ITEM 3. | AUDIT COMMITTEE FINANCIAL EXPERT. |
The registrant’s board of trustees has determined that the registrant has at least one “audit committee financial expert” (as defined in Item 3 of Form N-CSR) serving on its audit committee. Kathryn A. Cassidy and Michael Latham are each an “audit committee financial expert” and “independent” (as each term is defined in Item 3 of Form N-CSR).
| ITEM 4. | PRINCIPAL ACCOUNTANT FEES AND SERVICES. |
Table 1 — Items 4(a) - 4(d). The accountant fees below reflect the aggregate fees billed by the Goldman Sachs Real Estate Diversified Income Fund
| | | | | | | | | | |
| | | 2024 | | | 2023 | | | Description of Services Rendered |
Audit Fees: | | | | | | | | | | |
| | | |
• PricewaterhouseCoopers LLP
(“PwC”) | | | $128,666 | | | | $125,000 | | | Financial Statement audits. |
| | | |
Audit-Related Fees: | | | | | | | | | | |
| | | |
• PwC | | | $6,300 | | | | $3,121 | | | Other attest services. |
| | | |
Tax Fees: | | | | | | | | | | |
| | | |
• PwC | | | $ — | | | | $ — | | | |
Table 2 — Items 4(b)(c) & (d). Non-Audit Services to the Goldman Sachs Real Estate Diversified Income Fund’s service affiliates* that were pre-approved by the Audit Committee of the Goldman Sachs Real Estate Diversified Income Fund pursuant to Rule 2-01(c)(7)(ii) of Regulation S-X.
| | | | | | | | | | |
| | | 2024 | | | 2023 | | | Description of Services Rendered |
Audit-Related Fees: | | | | | | | | | | |
| | | |
• PwC | | | $2,122,312 | | | | $2,026,919 | | | Internal control review performed in accordance with Statement on Standards for Attestation Engagements No. 16 and semi-annual updates related to withholding tax accrual for non-US jurisdictions. These fees are borne by the Fund’s Adviser. |
| * | These include the advisor (excluding sub-advisors) and any entity controlling, controlled by or under common control with the advisor that provides ongoing services to the registrant (hereinafter referred to as “service affiliates”). |
Item 4(e)(1) — Audit Committee Pre-Approval Policies and Procedures
Pre-Approval of Audit and Non-Audit Services Provided to the Funds of the Goldman Sachs Real Estate Diversified Income Fund. The Audit and Non-Audit Services Pre-Approval Policy (the “Policy”) adopted by the Audit Committee of Goldman Sachs Real Estate Diversified Income Fund (the “Fund”) sets forth the procedures and the conditions pursuant to which services performed by an independent auditor for the Fund may be pre-approved. Services may be pre-approved specifically by the Audit Committee as a whole or, in certain circumstances, by the Audit Committee Chairman or the person designated as the Audit Committee Financial Expert. In addition, subject to specified cost limitations, certain services may be pre-approved under the provisions of the Policy. The Policy provides that the Audit Committee will consider whether the services provided by an independent auditor are consistent with the Securities and Exchange Commission’s rules on auditor independence. The Policy provides for periodic review and pre-approval by the Audit Committee of the services that may be provided by the independent auditor.
De Minimis Waiver. The pre-approval requirements of the Policy may be waived with respect to the provision of non-audit services that are permissible for an independent auditor to perform, provided (1) the aggregate amount of all such services provided constitutes no more than five percent of the total amount of revenues subject to pre-approval that was paid to the independent auditors during the fiscal year in which the services are provided; (2) such services were not recognized by the Fund at the time of the engagement to be non-audit services; and (3) such services are promptly brought to the attention of the Audit Committee and approved prior to the completion of the audit by the Audit Committee or by one or more members of the Audit Committee to whom authority to grant such approvals has been delegated by the Audit Committee, pursuant to the pre-approval provisions of the Policy.
Pre-Approval of Non-Audit Services Provided to the Fund’s Investment Advisers. The Policy provides that, in addition to requiring pre-approval of audit and non-audit services provided to the Fund, the Audit Committee will pre-approve those non-audit services provided to the Fund’s investment advisers (and entities controlling, controlled by or under common control with the investment advisers that provide ongoing services to the Fund) where the engagement relates directly to the operations or financial reporting of the Fund.
Item 4(e)(2) – 0% of the audit-related fees, tax fees and other fees listed in Table 1 were approved by the Fund’s Audit Committee pursuant to the “de minimis” exception of Rule 2-01(c)(7)(i)(C) of Regulation S-X. In addition, 0% of the non-audit services to the Fund’s service affiliates listed in Table 2 were approved by the Fund’s Audit Committee pursuant to the “de minimis” exception of Rule 2-01(c)(7)(i)(C) of Regulation S-X.
Item 4(f) – Not applicable.
Item 4(g) Aggregate Non-Audit Fees Disclosure
The aggregate non-audit fees billed to the Fund by PwC for the twelve months ended September 30, 2024 and September 30, 2023 were approximately $6,300 and $3,121, respectively. The aggregate non-audit fees billed to the Fund’s adviser and service affiliates by PwC for non-audit services for the twelve months ended December 31, 2023 and December 31, 2022 were approximately $18.0 million and $17.1 million, respectively. With regard to the aggregate non-audit fees billed to the Fund’s adviser and service affiliates, the 2023 and 2022 amounts include fees for non-audit services required to be pre-approved [see Table 2] and fees for non-audit services that did not require pre-approval since they did not directly relate to the Fund’s operations or financial reporting.
Item 4(h) — The Fund’s Audit Committee has considered whether the provision of non-audit services to the Fund’s investment adviser and service affiliates that did not require pre-approval pursuant to paragraph (c)(7)(ii) of Rule 2-01 of Regulation S-X is compatible with maintaining the auditors’ independence.
Item 4(i) – Not applicable.
Item 4(j) – Not applicable.
| ITEM 5. | AUDIT COMMITTEE OF LISTED REGISTRANTS. |
Not applicable.
Schedule of Investments is included in Item 1 of this report.
| ITEM 7. | FINANCIAL STATEMENTS AND FINANCIAL HIGHLIGHTS FOR OPEN-END MANAGEMENT INVESTMENT COMPANIES. |
Not applicable.
| ITEM 8. | CHANGES IN AND DISAGREEMENTS WITH ACCOUNTANTS FOR OPEN-END MANAGEMENT INVESTMENT COMPANIES. |
Not applicable.
| ITEM 9. | PROXY DISCLOSURES FOR OPEN-END MANAGEMENT INVESTMENT COMPANIES. |
Not applicable.
| ITEM 10. | REMUNERATION PAID TO DIRECTORS, OFFICERS, AND OTHERS OF OPEN-END MANAGEMENT INVESTMENT COMPANIES. |
Not applicable.
| ITEM 11. | STATEMENT REGARDING BASIS FOR APPROVAL OF INVESTMENT ADVISORY CONTRACT. |
The Fund’s statement regarding the basis for approval of its investment advisory contract is included in Item 1 of this report.
| ITEM 12. | DISCLOSURE OF PROXY VOTING POLICIES AND PROCEDURES FOR CLOSED-END MANAGEMENT INVESTMENT COMPANIES. |
The Fund has delegated the voting of portfolio securities to Goldman Sachs Asset Management L.P. (the “Investment Adviser”). For client accounts for which the Investment Adviser has voting discretion, the Investment Adviser has adopted policies and procedures (the “Proxy Voting Policy”) for the voting of proxies. Under the Proxy Voting Policy, the Investment Adviser’s guiding principles in performing proxy voting are to make decisions that favor proposals that in the Investment Adviser’s view tend to maximize a company’s shareholder value and are not influenced by conflicts of interest. To implement these guiding principles for investments in publicly-traded equities, the Investment Adviser has developed customized proxy voting guidelines (the “Guidelines”) that it generally applies when voting on behalf of client accounts. These Guidelines address a wide variety of individual topics, including, among other matters, shareholder voting rights, anti-takeover defenses, board structures, the election of directors, executive and director compensation, reorganizations, mergers, issues of corporate social responsibility and various shareholder proposals. The Guidelines embody the positions and factors the Investment Adviser generally considers important in casting proxy votes.
The Proxy Voting Policy, including the Guidelines, is reviewed periodically to ensure that it continues to be consistent with the Investment Adviser’s guiding principles.
The Investment Adviser has retained a third-party proxy voting service (“Proxy Service”), currently Institutional Shareholder Services, to assist in the implementation and administration of certain proxy voting-related functions, including, without limitation, operational, recordkeeping and reporting services. The Proxy Service also prepares a written analysis and recommendation (a “Recommendation”) of each proxy vote that reflects the Proxy Service’s application of the Guidelines to particular proxy issues. While it is the Investment Adviser’s policy generally to follow the Guidelines and Recommendations from the Proxy Service, the Investment Adviser’s portfolio management teams (“Portfolio Management Teams”) may on certain proxy votes seek approval to diverge from the Guidelines or a Recommendation by following an “override” process. Such decisions are subject to a review and approval process, including a determination that the decision is not influenced by any conflict of interest. A Portfolio Management Team that receives approval through the override process to cast a proxy vote that diverges from the Guidelines and/or a Recommendation may vote differently than other Portfolio Management Teams that did not seek to override that vote. In forming their views on particular matters, the Portfolio Management Teams are also permitted to consider applicable regional rules and practices, including codes of conduct and other guides, regarding proxy voting, in addition to the Guidelines and Recommendations. The Investment Adviser may hire other service providers to replace or supplement the Proxy Service with respect to any of the services the Investment Adviser currently receives from the Proxy Service.
The Investment Adviser conducts periodic due diligence meetings with the Proxy Service which include, but are not limited to, a review of the Proxy Service’s general organizational structure, new developments with respect to research and technology, work flow improvements and internal due diligence with respect to conflicts of interest.
From time to time, the Investment Adviser may face regulatory, compliance, legal or logistical limits with respect to voting securities that it may purchase or hold for client accounts, which can affect the Investment Adviser’s ability to vote such proxies, as well as the desirability of voting such proxies. Among other limits, federal, state and foreign regulatory restrictions or company specific ownership limits, as well as legal matters related to consolidated groups, may restrict the total percentage of an issuer’s voting securities that the Investment Adviser can hold for clients and the nature of the Investment Adviser’s voting in such securities. The Investment Adviser’s ability to vote proxies may also be affected by, among other things: (i) late receipt of meeting notices; (ii) requirements to vote proxies in person: (iii) restrictions on a foreigner’s ability to exercise votes; (iv) potential difficulties in translating the proxy; (v) requirements to provide local agents with unrestricted powers of attorney to facilitate voting instructions; and (vi) requirements that investors who exercise their voting rights surrender the right to dispose of their holdings for some specified period in proximity to the shareholder meeting.
The Investment Adviser has adopted policies and procedures designed to prevent conflicts of interest from influencing its proxy voting decisions that the Investment Adviser makes on behalf of a client account. These policies and procedures include the Investment Adviser’s use of the Guidelines and Recommendations from the Proxy Service, the override approval process previously discussed, and the establishment of information barriers between the Investment Adviser and other businesses within The Goldman Sachs Group, Inc. Notwithstanding such proxy voting policies and procedures, actual proxy voting decisions of the Investment Adviser may have the effect of benefitting the interests of other clients or businesses of other divisions or units of GS&Co. and/or its affiliates.
Voting decisions with respect to fixed income securities and the securities of privately held issuers generally will be made by the Fund’s portfolio managers based on their assessment of the particular transactions or other matters at issue.
Information regarding how the Fund voted proxies relating to portfolio securities during the most recent 12-month period ended June 30, 2024 is available without charge on the Fund’s website at dfinview.com/GoldmanSachs and on the SEC’s website at www.sec.gov.
| ITEM 13. | PORTFOLIO MANAGERS OF CLOSED-END MANAGEMENT INVESTMENT COMPANIES. |
Item 13(a)(1)
| | | | | | |
Name | | Title | | Length of Time Served | | Principal Occupation(s) During Past 5 Years |
| Kristin Kuney, CFA | | Managing Director | | Since 2021 | | Ms. Kuney joined the Investment Adviser in 2000. She is a member of the Fundamental Equity and Real Estate Securities Teams. |
| | | |
| Sean Brenan | | Managing Director | | Since 2020 | | Mr. Brenan joined the Investment Adviser in 2010. He is a member of the XIG Group. |
| | | |
| John Papadoulias | | Vice President | | Since 2022 | | Mr. Papadoulias joined the Investment Adviser in April 2019. Prior to joining the Investment Adviser, Mr. Papadoulias was a partner at Rocaton Investment Advisors. Mr. Papadoulias is a member of the XIG Group. |
| | | |
| Abhinav Zutshi, CFA | | Vice President | | Since 2022 | | Mr. Zutshi joined the Investment Adviser in April 2009. He is a member of the Fundamental Equity and Real Estate Securities Teams. |
Item 13(a)(2)
The following table discloses accounts within each type of category listed below for which the portfolio managers are jointly and primarily responsible for day to day portfolio management as of September 30, 2024, unless otherwise indicated.
For each portfolio manager listed below, the total number of accounts managed is a reflection of accounts within the strategy they oversee or manage, as well as accounts which participate in the sector in which they manage. There are multiple portfolio managers involved with each account.
| | | | | | | | | | | | | | | | | | | | | | | | | | | | | | | | | | | | | | | | | | | | | | | | |
| | | Number of Other Accounts Managed and Total Assets
by Account Type* | | | Number of Accounts and Total Assets for
Which Advisory Fee is Performance Based* | |
Name of Portfolio Manager | | Registered
Investment
Companies | | | Other Pooled
Investment
Vehicles | | | Other
Accounts | | | Registered
Investment
Companies | | | Other Pooled
Investment
Vehicles | | | Other
Accounts | |
| | | Number
of
Accounts* | | | Assets
Managed | | | Number
of
Accounts | | | Assets
Managed | | | Number
of
Accounts | | | Assets
Managed | | | Number
of
Accounts | | | Assets
Managed | | | Number
of
Accounts | | | Assets
Managed | | | Number
of
Accounts | | | Assets
Managed | |
Kristin Kuney, CFA | | | 10 | | | $ | 6,979 | | | | 7 | | | $ | 394 | | | | 10 | | | $ | 2,315 | | | | — | | | | — | | | | — | | | | — | | | | — | | | | — | |
Sean Brenan | | | 1 | | | $ | 100 | | | | 33 | | | $ | 10,300 | | | | 2 | | | $ | 7,260 | | | | — | | | | — | | | | 23 | | | $ | 9,040 | | | | — | | | | — | |
John Papadoulias | | | 1 | | | $ | 100 | | | | 14 | | | $ | 3,870 | | | | 2 | | | $ | 7,260 | | | | — | | | | — | | | | 6 | | | $ | 2,770 | | | | — | | | | — | |
Abhinav Zutshi, CFA | | | 9 | | | $ | 5,924 | | | | 6 | | | $ | 393 | | | | 4 | | | $ | 332 | | | | — | | | | — | | | | — | | | | — | | | | — | | | | — | |
| 1. | Asset information is in USD millions unless otherwise specified. |
| 2. | “Other Pooled Investment Vehicles” includes private investment funds and SICAVs. |
| 3. | “Other Accounts” includes a separately managed account platform, advisory mutual fund platform, advisory relationships and others. For purposes of the above, a platform is included as a single account. |
Item 13(a)(3) —
Compensation for portfolio managers of the Investment Adviser is comprised of a base salary and year-end discretionary variable compensation. The base salary is fixed from year to year. Year-end discretionary variable compensation is primarily a function of each portfolio manager’s individual performance and his or her contribution to overall team performance; the performance of GSAM and Goldman Sachs; the team’s net revenues for the past year which is primarily derived from advisory fees; and anticipated compensation levels among competitor firms. Portfolio managers are rewarded, in part, for their delivery of investment performance, which is reasonably expected to meet or exceed the expectations of clients and fund shareholders in terms of: excess return over an applicable benchmark, peer group ranking, risk management and factors specific to the funds such as yield or regional focus. Performance is judged over 1-, 3- and 5-year time horizons.
The discretionary variable compensation for portfolio managers is also significantly influenced by various factors, including: (1) effective participation in team discussions and process; and (2) management of risk in alignment with the targeted risk parameters and investment objective of the Fund. Other factors may also be considered including: (1) general client/investor orientation and (2) teamwork and leadership.
As part of their year-end discretionary variable compensation and subject to certain eligibility requirements, portfolio managers may receive deferred equity-based and similar awards, in the form of: (1) shares of The Goldman Sachs Group, Inc. (restricted stock units); and, (2) for certain portfolio managers, performance-tracking (or “phantom”) shares of the Fund or multiple funds. Performance-tracking shares are designed to provide a rate of return (net of fees) equal to that of the Fund(s) that a portfolio manager manages, or one or more other eligible funds, as determined by senior management, thereby aligning portfolio manager compensation with fund shareholder interests. The awards are subject to vesting requirements, deferred payment and clawback and forfeiture provisions. GSAM, Goldman Sachs or their affiliates expect, but are not required to, hedge the exposure of the performance-tracking shares of a Fund by, among other things, purchasing shares of the relevant Fund(s).
Other Compensation — In addition to base salary and year-end discretionary variable compensation, the Investment Adviser has a number of additional benefits in place including (1) a 401(k) program that enables employees to direct a percentage of their base salary and bonus income into a tax-qualified retirement plan; and (2) investment opportunity programs in which certain professionals may participate subject to certain eligibility requirements.
Item 13(a)(4)
The following table shows the portfolio managers’ ownership of securities, including those beneficially owned as well as those owned pursuant to the deferred compensation plan discussed above, in the Fund as of September 30, 2024, unless otherwise noted:
| | |
Name of Portfolio Manager | | Dollar Range of
Equity Securities
Beneficially Owned by
Portfolio Manager |
Kristin Kuney, CFA | | $100,001-$500,000 |
Sean Brenan | | None |
John Papadoulias | | None |
| Abhinav Zutshi, CFA | | None |
| ITEM 14. | PURCHASES OF EQUITY SECURITIES BY CLOSED-END MANAGEMENT INVESTMENT COMPANY AND AFFILIATED PURCHASERS. |
Not applicable.
| ITEM 15. | SUBMISSION OF MATTERS TO A VOTE OF SECURITY HOLDERS. |
There have been no material changes to the procedures by which shareholders may recommend nominees to the registrant’s board of trustees.
| ITEM 16. | CONTROLS AND PROCEDURES. |
| | (a) | The registrant’s principal executive and principal financial officers, or persons performing similar functions, have concluded that the registrant’s disclosure controls and procedures (as defined in Rule 30a-3(c) under the Investment Company Act of 1940, as amended (the “1940 Act”)) are effective as of a date within 90 days of the filing of this report that includes the disclosure required by this paragraph, based on the evaluation of these controls and procedures required by Rule 30a-3(b) under the 1940 Act and 15d-15(b) under the Securities Exchange Act of 1934, as amended. |
| | (b) | There were no changes in the registrant’s internal control over financial reporting (as defined in Rule 30a-3(d) under the 1940 Act) that occurred during the period covered by this report that have materially affected, or are reasonably likely to materially affect, the registrant’s internal control over financial reporting. |
| ITEM 17. | DISCLOSURE OF SECURITIES LENDING ACTIVITIES FOR CLOSED-END MANAGEMENT INVESTMENT COMPANIES. |
The registrant did not engage in securities lending activities during the fiscal period reported on this Form N-CSR.
| ITEM 18. | RECOVERY OF ERRONEOUSLY AWARDED COMPENSATION. |
SIGNATURES
Pursuant to the requirements of the Securities Exchange Act of 1934 and the Investment Company Act of 1940, the registrant has duly caused this report to be signed on its behalf by the undersigned, thereunto duly authorized.
| | | | |
| | | | Goldman Sachs Real Estate Diversified Income Fund |
| | |
| By: | | | | /s/ James A. McNamara |
| | |
| | | | James A. McNamara |
| | | | President/Chief Executive Officer |
| | | | Goldman Sachs Real Estate Diversified Income Fund |
| | |
| Date: | | | | December 6, 2024 |
Pursuant to the requirements of the Securities Exchange Act of 1934 and the Investment Company Act of 1940, this report has been signed below by the following persons on behalf of the registrant and in the capacities and on the dates indicated.
| | | | |
| | |
| By: | | | | /s/ James A. McNamara |
| | |
| | | | James A. McNamara |
| | | | President/Chief Executive Officer |
| | | | Goldman Sachs Real Estate Diversified Income Fund |
| | |
| Date: | | | | December 6, 2024 |
| | |
| By: | | | | /s/ Joseph F. DiMaria |
| | |
| | | | Joseph F. DiMaria |
| | | | Principal Financial Officer |
| | | | Goldman Sachs Real Estate Diversified Income Fund |
| | |
| Date: | | | | December 6, 2024 |