Skillz Q4 2021 Stockholder Letter
February 23, 2022
Fellow Stockholders,
As we wrap Q4 2021, we could not be more excited about the long-term opportunity to connect the world through competition. Our mission is to bring fair competition to all forms of the digital experience, and we have set out to accomplish that by building the competition layer of the Internet. That is a truly massive undertaking—the digital equivalent of housing every sport, from baseball to soccer, at every level from recreational leagues to the pros, all under one roof. We are up to that challenge: competition is universally loved across humanity; the best competitions are life-defining. We are pioneering an emerging segment of the mobile gaming market, which has been and continues to be the fastest-growing segment of the global gaming market, at nearly three billion gamers worldwide and growing. Mobile gaming is expected to be a $160 billion market by 2025. We have come a long way since our inception in 2012, and are still in the very early innings of realizing our mission.
Against that backdrop, in 2021 we set out to achieve the twin goals of rapidly growing revenue while building the critical infrastructure for future growth. We invested heavily in marketing to acquire and engage users, and more than doubled our headcount to build out many functions required for long-term growth. Driving high revenue growth while scaling the organization at the same time came at a significant cost to profitability. So while we achieved many of our goals, we did not achieve all of them. In particular, we fell 1% short of our full-year revenue guidance of $389 million, and ended Q4 with a $(78) million Adjusted EBITDA.
That said, our investments generated strong growth in users and engagement with the platform. For Q4 2021, Skillz posted revenue of $109 million, representing 61% year-over-year growth, driven by 56% year-over-year growth in Paying Monthly Active Users (PMAU). For the full year 2021, revenue totaled $384 million, representing 67% year-over-year growth. We hit record transaction volumes for the year, processing over 730 million paid tournament entries representing over $2.4 billion in Gross Marketplace Volume across the platform.
2021 was a building year. For the first time in the company’s history, we were able to put the infrastructure in place for long-term success. Now that we have built a strong foundation of people, technology, and users, we plan to focus on driving efficiency in 2022 so we can drive more efficient growth in 2023 and beyond. As part of that plan, we will discuss in more detail below how we will eliminate low-return engagement marketing programs and the associated bonus cash used by end-users to enter into paid entry fee
contests. In order to enable investors to better measure the progress on optimizing engagement marketing and the core growth rate of our business, we will begin reporting a new non-GAAP metric called Revenue after Engagement Marketing (RAEM). While this is not a substitute for the GAAP metric of Revenue, we believe RAEM will provide useful information to investors.
Now let’s take a look back at 2021, before turning our attention to our plans for 2022.
2021 Year in Review
Growing Revenue by Increasing Our User Base
As we mentioned above, the global gaming market is close to three billion players strong and growing each year. Our runway continues to be long.
To that end, Q4 saw another record quarter for Paying Monthly Active Users. We reached 0.61 million PMAU, up 56% year-over-year, an increase driven by scaling our user acquisition (UA) spend across more networks and geographies. On a full year basis in 2021, we grew PMAU by 59% compared with 2020.
Due to rising digital media advertising costs, we experienced substantial increases in our user acquisition costs over the course of the year. To address this—and to increase our ability to acquire users more effectively over time—we acquired Aarki, a growing demand-side platform (DSP) with a focus in mobile gaming that reaches an audience of more than 465 million monthly consumers. We expect that migrating more spend to Aarki this year will result in significant efficiencies in our user acquisition marketing spend going forward; in the long term, Aarki provides us with a broader product offering, including media buying capabilities, to better serve game developers. In addition, we have several other initiatives to mitigate rising user acquisition costs, including increasing our organic traffic, tapping new distribution channels, and applying more data science technology to our media buying.
Growing Revenue by Expanding the Range of Content on Platform
| | | | | |
We continued to increase the range of games offered on our platform. One of our most notable launches in 2021 was Big Buck Hunter: Marksman, our very first game in the first-person shooter category. In Q4, we continued to iterate on this title, launching new hunting content featuring two new animals — Elk and Zombie Deer, the latter for Halloween. We remain excited about the potential for this game, though it is still too soon to know if it will become a top game on the platform.
| |
We had several other exciting games soft launch in 2021. The soft launch phase of game development is when the game is live and the developer uses data signals from user behavior to optimize performance for retention, engagement, and monetization. One of them was Trivia Crack Payday, the latest installment of the world-renowned franchise, currently available in 34 languages across more than 180 countries, with over 45 million monthly active users (MAU). In Q4, we continued to work with our developer partner to refine this game, including by introducing a new synchronous game mode. | |
In Q4, we continued to advance the NFL & Skillz Game Developer Challenge, and we remain on track to launch the winning game(s) prior to the 2022 NFL season. Developers have completed their game submissions, and the finalists will be selected and announced in Q1 2022. | |
In 2021, we also announced our strategic partnership with Exit Games, owner of the Photon Engine, the world’s most advanced synchronous multiplayer gaming technology. Photon allows developers to create and host real-time, multiplayer games. In Q3, we completed initial development to support Photon games, and in Q4, game developers began using this technology by taking their existing Photon project and adding the Skillz SDK to it, or in other cases starting a fresh game using both platforms simultaneously. Through this new partnership, we have drastically accelerated our timeline to support multiplayer synchronous content on our platform, such as popular racing, fighting, and shooting games.
It is impossible to predict when we will have a blockbuster game on Skillz. But we believe our talented and innovative developer community will eventually create the next big hit.
Growing Revenue by Laying the Groundwork for New Business Opportunities
As a pioneer carving out a new market in mobile gaming, we have many exciting opportunities for future growth. With so many opportunities, remaining focused and maintaining discipline is key to success. The international gaming market is four times
larger than that of North America, so international expansion was one key initiative for us last year. We delivered almost $2 billion in prizes in 2021, so partnering with brands to sponsor prizes was another key initiative for us. These partnerships also provide a new avenue for fans to interact with their favorite brands via skill-based mobile competition, attracting more users to the Skillz platform.
We have talked previously about our future plans to expand globally, and in Q4, Skillz launched a live pilot in India.
| | | | | |
| Our planned launch in India has several phases. The initial phase is building the infrastructure that enables local currency and payments, followed by supporting developers creating localized content and signing localized distribution partnerships to scale. We successfully launched a pilot product in Diamond Strike, our owned-and-operated game, which we use as our testing ground. We will continue refining our infrastructure around local payments and currency before releasing this product to our developer partners. At the same time, we will use our learnings regarding user behavior and acquisition cost in India in the first half of this year to inform our marketing strategy going forward. As we weighed our growth opportunities during the 2022 planning process, we decided to take a more careful approach to this opportunity in order to prioritize other initiatives. As a result, we are not planning to invest in the India product or content localization for at least the first half of 2022. To that end, we have not assumed any material contribution from India in our 2022 revenue guidance. | |
Launching in India remains an important initial step in Skillz’s longer-term journey to capture the international revenue opportunity. We continue to believe that India and the other international markets represent a significant long-term opportunity for us.
| | | | | |
Brand partnerships provide us with a native approach to introduce the Skillz platform to fans of some of the world’s most popular brands. We made progress on our path to brand-sponsored prized tournaments by continuing to pilot programs for how brands can work with our platform to create unique experiences for their fans. In Q4, Skillz announced a partnership with the Drone Racing League (DRL), one of the world’s fastest-growing sports leagues and its premier professional drone racing property. In December, Skillz hosted Drone Racing Arcade tournaments with exclusive branded prizes for DRL’s tens of millions of fans worldwide.
| |
Building Critical Infrastructure for Future Growth
In 2021, it was mission critical for us to continue upleveling our leadership team and scaling our organization. During the year, we hired leaders for several key roles to position us for long-term growth. In addition, we more than doubled our headcount, adding more than 370 people across the organization, including 170 people from around the world who joined us from our acquisition of Aarki. As of year end, we had over 650 employees located in 15 countries worldwide.
Some of our notable leadership hires included: Chief Product Officer, Vatsal Bhardwaj; Chief Financial Officer, Ian Lee; Head of Marketing, David Eisenberg; and Head of People, Doris Fritz-Bianchi.
Operational Overview
In Q4, Skillz grew revenue 61% year-over-year, primarily driven by growth in Paying MAU, which grew by 56% year-over-year, due largely to scaling UA investment. Monthly Average Revenue Per Paying User (ARPPU) was up 3% year-over-year, driven by higher monetization.
We achieved a lot, but we did not accomplish all the aggressive goals we had set for 2021. Most notably, revenue for the full year fell short of our guidance. Revenue of $384.1 million was $4.9 million, or 1%, below our full year guidance of $389 million. Revenue was negatively impacted by $2.5 million due to outages that included the AWS outage, which impacted many internet companies. Additionally, Aarki’s revenue contribution was $1.1 million lower than expected due to one-time budget reallocations by some advertisers after the changes to IDFA, so we do not expect this to impact performance going forward.
Adjusted EBITDA declined from $(41.7) million in Q3 2021 to $(77.9) million in Q4 2021, or (72)% of revenue, as we increased marketing investment in the quarter. UA Marketing grew by 55% from Q3 to Q4. During the quarter we decided to increase UA Marketing spend in new international markets and new mobile advertising networks. While the overall cost of acquiring users increased from Q3, we did find areas with attractive returns. Our user cohorts are long-lived, so having multiple months of realized LTV data is important before committing to invest aggressively in any new market. All of this additional data from these new geographies, as well as from new networks, positions us to better drive UA efficiency in 2022. Engagement marketing rose from 49% of revenue in Q3 to 52% of revenue in Q4 as we scaled those programs. The learnings we have gained from using and experimenting with engagement marketing over the past several years positions us to intelligently optimize the investment in the programs that are most effective in increasing user engagement and monetization.
Financial Results
Revenue
Q4 2021 Revenue was $108.8 million, up 61% over the prior year period. This was driven by 56% growth in PMAU over the prior year period. Our payor conversion rate was 16%, flat versus the prior year period, and down sequentially from 17% in the prior
quarter. The increase in UA marketing from $55.2 million in Q3 to $85.6 million in Q4 was the primary driver of paying user growth.
2021 Revenue was $384.1 million, up 67% over the prior year period. This was driven by 59% growth in PMAU and 5% growth in ARPPU over the prior period. The increase in PMAU was primarily driven by a 77% increase in UA marketing, and the increase in ARPPU was primarily driven by a 88% increase in engagement marketing, each over the prior year period. Revenue growth in 2021 also benefited from the acquisition of Aarki, which closed in July 2021 and contributed $11.9 million to consolidated 2021 revenue.
Gross Profit
Q4 2021 Gross Profit was $100.4 million, up 56% over the prior year period. This represented 92% of revenue, three percentage points lower than the prior year period due to the impact of consolidating Aarki, which has a lower gross margin than Skillz, and the impact of the amortization of developed technology.
Q4 2021 Research and Development was $15.4 million, up 55% over the prior year period. This amount includes $2.3 million of stock-based compensation and one-time nonrecurring expenses. On a non-GAAP basis, Research and Development was 12% of revenue, a five percentage point increase from 7% in the prior year period, driven by headcount costs to support both investments in new features and infrastructure to build foundations for long-term growth.
Sales and Marketing
We invested in Sales and Marketing to drive growth and scale. Q4 Sales and Marketing was $155.1 million, up 95% over the prior year period. This amount includes $2.9 million
of stock-based compensation and one-time nonrecurring expenses. On a non-GAAP basis, Sales and Marketing was 140% of revenue, a 27 percentage point increase from 113% in the prior year period. On a sequential basis, Sales and Marketing was 29 percentage points higher than 110% of revenue in the prior quarter.
Sales and Marketing is primarily composed of engagement marketing and UA marketing. Engagement marketing programs are designed to improve the engagement and monetization of existing users on the platform, and consist primarily of certain bonus cash programs and league payouts. UA programs are designed to bring new users to the platform, and consist primarily of media spend to acquire users from digital ad networks.
Engagement marketing was $56.7 million, up 74% over the prior year period. This was 52% of revenue, a 4 percentage point increase from 48% in the prior year period. On a sequential basis, engagement marketing was 3 percentage points higher than 49% of revenue in the prior quarter. This was driven by investment in marketing programs to increase user engagement and monetization.
UA marketing was $85.6 million, up 112% over the prior year period. This was 79% of revenue, a 19 percentage point increase from 60% in the prior year period, as we continue to increase the scale of our advertising campaigns. On a sequential basis, UA marketing was 25% percentage points higher than 54% of revenue in the prior quarter. We decided to increase spend during the quarter in new international markets, such as Europe, and in new mobile advertising networks. While the overall cost of acquiring users increased from Q3, we did find areas with attractive returns. This also enabled us to collect data on user behavior and acquisition costs that will help inform our marketing strategy going forward.
General and Administrative
Q4 2021 General and Administrative was $33.9 million, up 89% over the prior year period. This amount includes $15.9 million in stock-based compensation and one-time nonrecurring expenses. On a non-GAAP basis, General and Administrative was 17% of revenue, an six percentage point increase from 11% in the prior year period, driven by investment in headcount and consulting fees totaling $3.5 million.
Net Loss
Q4 2021 Net Loss increased to $99.0 million from $67.0 million in the prior year period. 2021 Net Loss increased to $181.4 million from $145.5 million in the prior year period.
Adjusted EBITDA
Q4 2021 Adjusted EBITDA was $(77.9) million, $54.1 million lower than the prior year period. This was primarily driven by our strategy to increase UA marketing investment in order to accelerate learnings across international markets and new networks, as well as an increase in end-user engagement marketing to raise engagement and monetization. Adjusted EBITDA excludes the impact of 3.3 million in other non-recurring items. In Q4 2021, UA marketing was $85.6 million, $45.2 million higher than the prior year period. Accordingly, our Adjusted EBITDA before UA marketing was $7.8 million, $8.9 million
lower than the prior year period. This was primarily driven by the increased investment in engagement marketing and headcount costs.
2021 Adjusted EBITDA was $(182.3) million, $116.2 million lower than the prior year period. This was primarily driven by the increase in UA marketing and engagement marketing investment to grow our user base and raise user engagement and monetization. Adjusted EBITDA excludes the impact of $33.3 million in other non-recurring items.
Balance Sheet
We ended the fourth quarter with $743 million of cash and marketable securities and $300 million of debt. In Q4 2021, we issued $300 million Senior Secured Notes to increase our flexibility to capitalize on M&A and investments. We are actively evaluating targets that would accelerate our strategy and having the capital on-hand positions us to move quickly as attractive opportunities arise.
Outlook/Guidance
Looking toward 2022, we plan to leverage the scale we built in 2021 to focus on driving efficiency and increasing profitable growth. We are now poised for more durable growth driven by both marketing investment and product improvements. By focusing on greater efficiency, even at the cost of near-term revenue growth, we will be positioned to drive growth into the massive mobile gaming market in 2023 and beyond. We will no longer be focused on revenue growth at all costs, and will place equal importance on Revenue after Engagement Marketing (RAEM) growth.
We are initiating our 2022 full-year revenue guidance at $400 million. Our guidance does not include the upside of any new content or new distribution channels, which are inherently unpredictable.
Our guidance is based on an estimated reduction in engagement marketing as a percentage of revenue of approximately 10 percentage points, when compared with engagement marketing as a percentage of revenue of 49% in 2021. This implies our RAEM will be $245 million, representing 24% year-over-year growth. We expect RAEM growth will broadly accelerate across the year due to several new product initiatives in the first half of 2021 that will be deployed to the largest games in Q3 and Q4. We expect to exit 2022 with a Q4 year-over-year RAEM growth rate above 30%.
Based on our revenue guidance, we expect to achieve an Adjusted EBITDA margin improvement of approximately 10 percentage points when compared with an Adjusted EBITDA margin of (47%) in 2021. We expect that margin will improve significantly from Q4 2021 to Q1 2022, and will continue to improve across the year. We expect to exit 2022 with a Q4 Adjusted EBITDA margin better than (30)%. We expect to reach Adjusted EBITDA break-even by the end of 2024.
Here is more color on where we will be focused in 2022:
•Improve Marketing Efficiency. We plan to focus on driving higher efficiency from our marketing investment in two ways.
First, by reducing low-return engagement marketing programs, which we expect will result in lowering engagement marketing as a percentage of revenue. We believe that engagement marketing can continue to be an effective method of enhancing the monetization of our existing users, but plan to focus our efforts on programs that we believe will be the most effective over time. We expect to use the learnings from our testing and experimentation in engagement marketing over the past year to inform our reductions.
Second, we will drive UA efficiency by optimizing spend across networks, driving higher organic traffic, and migrating more UA spend to Aarki. We expect this to result in reducing the total UA dollars spent relative to 2021 and at a much lower average user acquisition cost with shorter payback periods.
•Invest in Global Developer Ecosystem. We plan to invest in products and programs that strengthen our global developer ecosystem in order to grow the content on the platform. This will be a building year for our content organization. We will focus on standing up a Developer Marketing function and strengthening the leadership bench of that team before looking to scale further, to drive the business forward. We will continue to focus on helping our talented developer community create their best content. We will revamp and expand our educational resources to be even more helpful and actionable. Though we are continuing to be mindful of the ever-changing Covid environment, we are excited to supercharge the community through activations at key industry events such as the Game Developers Conference in March, our inaugural Skillz developer conference, and more.
•Launch Impactful Product Initiatives: We plan to roll out fewer but more impactful product initiatives. Our product roadmap in the near term will be focused on improving user experience through social features and greater personalization. Some examples of our initiatives include: Chat, which enables players to communicate on our platform; Personalized Leagues, which provide players with opportunities to compete within their relevant communities; and a Core Game Loop overhaul, which will refresh the interface for users.
We plan to focus on activating all the new Skillzians we hired last year, resulting in slower headcount growth in 2022.
We believe that these actions to optimize our marketing investment, in addition to activating our new Skillzians hired this year and building more product-driven growth capabilities, will set us up for a stronger path to profitability.
We could not be more excited about the long-term growth opportunities ahead. We are closely following several emerging trends that could factor into our growth plans beyond 2022, including:
•Development of the metaverse opportunity through more social features and multiplayer synchronous content.
•Application of crypto technologies to payments.
•Use of NFTs for prizing in games on our platform.
We look forward to discussing the 2022 plan in more detail at our inaugural Investor Day on March 15, 2022.
Closing
2021 was a critical set-up year for us. With this now complete, we have laid the foundation for durable growth and efficiency in the years ahead.
We continue to believe that a great company is built by great people. We are proud of our continued recognition as one of the “best places to work” for those who want to have their talent, passion, and ingenuity recognized and developed. As we continue on our mission to build the competitive layer of the Internet, we remain focused on pioneering the competitive mobile gaming experience and connecting players in fair, fun, and meaningful competition. And we will continue growing by investing in the technologies that excite our users and delight our developers.
Thank you for your support as we continue on this journey.
Game On!
Andrew Paradise
Founder & CEO
Use of Non-GAAP Financial Measures
In this letter, the Company includes Adjusted EBITDA, RAEM and Non-GAAP Operating Expenses, which are non-GAAP performance measures that the Company uses to supplement its results presented in accordance with U.S. GAAP. As required by the rules of the Securities and Exchange Commission (“SEC”), the Company has provided herein a reconciliation of the non-GAAP financial measures contained in this letter to the most directly comparable measures under GAAP. The Company’s management believes Adjusted EBITDA and Non-GAAP Operating Expenses are useful in evaluating its operating performance and are similar measures reported by publicly-listed U.S. competitors, and regularly used by securities analysts, institutional investors, and other interested parties in analyzing operating performance and prospects. By providing these non-GAAP measures, the Company’s management intends to provide investors with a meaningful, consistent comparison of the Company’s profitability for the periods presented. Further, the Company’s management believes that RAEM is a useful
measure to enable investors to better measure the Company’s progress in optimizing engagement marketing and the core growth rate of the Company’s business. Adjusted EBITDA is not intended to be a substitute for net income/loss or any U.S. GAAP financial measure and, as calculated, may not be comparable to other similarly titled measures of performance of other companies in other industries or within the same industry. RAEM is not intended to be a substitute for GAAP revenue or any U.S. GAAP financial measure and, as calculated, may not be comparable to other similarly titled measures of performance of other companies in other industries or within the same industry. Further, Non-GAAP Operating Expenses are not intended to be a substitute for GAAP Operating Expenses or any U.S. GAAP financial measure and, as calculated, may not be comparable to other similarly titled measures of performance of other companies in other industries or within the same industry.
The Company defines and calculates Adjusted EBITDA as net income (loss) before interest, other non-operating expense or income, (benefit) provision for income taxes, and depreciation and amortization, and further adjusted for stock-based compensation and other special items determined by management, including, but not limited to, fair value adjustments for certain financial liabilities (including derivatives) associated with debt and equity transactions, impairment charges, acquisition related expenses for transaction costs and certain loss contingency accruals, as they are not indicative of business operations. The Company defines and calculates RAEM as consolidated revenue less engagement marketing expenses included in sales and marketing expense. The Company defines and calculates Non-GAAP Operating Expenses as GAAP Operating Expenses adjusted for stock-based compensation, one-time transaction expenses and other special items determined by management, including, but not limited to impairment charges, acquisition related expenses for transactions costs and certain loss contingency accruals, as they are not indicative of business operations.
Forward-Looking Statements
This letter includes “forward-looking statements” within the meaning of the “safe harbor” provisions of the United States Private Securities Litigation Reform Act of 1995. The Company’s actual results may differ from its expectations, estimates, and projections and, consequently, you should not rely on these forward-looking statements as predictions of future events. Words such as “expect,” “estimate,” “project,” “budget,” “forecast,” “anticipate,” “intend,” “plan,” “may,” “will,” “could,” “should,” “believes,” “predicts,” “potential,” “continue,” and similar expressions (or the negative versions of such words or expressions) are intended to identify such forward-looking statements.
These forward-looking statements involve significant risks and uncertainties that could cause the Company’s actual results to differ materially from those discussed in the forward-looking statements. Most of these factors are outside of the Company’s control and are difficult to predict. Factors that may cause such differences include, but are not limited to, the ability of Skillz to: realize the benefits expected from the business combination; effectively compete in the global entertainment and gaming industries; attract and retain successful relationships with the third party developers that develop
and update all of the games hosted on Skillz’s platform; comply with laws and regulations applicable to its business; and as well as other risks and uncertainties indicated from time to time in the Company’s SEC filings, including those under “Risk Factors” therein, which are available on the SEC’s website at www.sec.gov. Additional
information will be made available in other filings that the Company makes from time to time with the SEC. In addition, any forward-looking statements contained in this letter are based on assumptions that the Company believes to be reasonable as of this date. The Company undertakes no obligation to update any forward-looking statements to reflect events or circumstances after the date of this letter or to reflect new information or the occurrence of unanticipated events, except as required by law.
Contacts:
Investors: ir@skillz.com
Skillz Inc.
Consolidated Statements of Operations and Comprehensive Loss
(in thousands, except for number of shares and per share amounts)
| | | | | | | | | | | | | | | | | | | | | | | | | | | | |
| Three Months Ended December 31, | | Twelve Months Ended December 31, | | |
| 2021 | | 2020 | | 2021 | | 2020 | | | | | |
| Revenue | $ | 108,849 | | | $ | 67,723 | | | $ | 384,089 | | | $ | 230,115 | | | | | | |
| Costs and expenses: | | | | | | | | | | | | |
| Cost of revenue | 8,422 | | | 3,475 | | | 24,711 | | | 12,281 | | | | | | |
| Research and development | 15,433 | | | 9,972 | | | 46,017 | | | 23,225 | | | | | | |
| Sales and marketing | 155,080 | | | 79,560 | | | 465,457 | | | 251,941 | | | | | | |
| General and administrative | 33,934 | | | 17,953 | | | 135,026 | | | 42,289 | | | | | | |
| Total costs and expenses | 212,869 | | | 110,960 | | | 671,211 | | | 329,736 | | | | | | |
| Loss from operations | (104,020) | | | (43,237) | | | (287,122) | | | (99,621) | | | | | | |
| Interest expense, net | (1,086) | | | (28) | | | (1,222) | | | (1,325) | | | | | | |
| Change in fair value of common stock warrant liabilities | 6,024 | | | (23,049) | | | 87,922 | | | (23,049) | | | | | | |
| Other income (expense), net | (59) | | | (651) | | | 49 | | | (21,400) | | | | | | |
| Loss before income taxes | (99,141) | | | (66,965) | | | (200,373) | | | (145,395) | | | | | | |
| (Benefit) provision for income taxes | (170) | | | 15 | | | (18,996) | | | 115 | | | | | | |
| Net loss | $ | (98,971) | | | $ | (66,980) | | | $ | (181,377) | | | $ | (145,510) | | | | | | |
| Net loss per share attributable to common stockholders – basic | $ | (0.25) | | | $ | (0.22) | | | $ | (0.47) | | | $ | (0.49) | | | | | | |
| Weighted average common shares outstanding – basic | 399,980,596 | | 311,259,678 | | 384,625,249 | | 294,549,146 | | | | | |
| | | | | | | | | | | | |
| Net loss attributable to common stockholders – diluted | $ | (98,971) | | | $ | (66,980) | | | $ | (269,299) | | | $ | (145,510) | | | | | | |
| Net loss per share attributable to common stockholders – diluted | $ | (0.25) | | | $ | (0.22) | | | $ | (0.69) | | | $ | (0.49) | | | | | | |
| Weighted average common shares outstanding – diluted | 399,980,596 | | 311,259,678 | | 388,549,673 | | 294,549,146 | | | | | |
| | | | | | | | | | | | |
| Other comprehensive loss: | | | | | | | | | | | | |
| Change in unrealized loss on available-for-sale investments, net of tax | (248) | | | — | | | (248) | | | — | | | | | | |
| Total other comprehensive loss: | (248) | | | — | | | (248) | | | — | | | | | | |
| Comprehensive loss: | $ | (99,219) | | | $ | (66,980) | | | $ | (181,625) | | | $ | (145,510) | | | | | | |
Skillz Inc.
Consolidated Balance Sheets
(in thousands, except for number of shares and par value per share amounts)
| | | | | | | | | | | |
| December 31, | | December 31, |
| 2021 | | 2020 |
| Assets | | | |
| Current assets: | | | |
| Cash and cash equivalents | $ | 241,332 | | | $ | 262,728 | |
| Marketable securities, current | 319,055 | | | — | |
| Accounts receivable, net | 13,497 | | | — | |
| Prepaid expenses and other current assets | 16,704 | | | 10,491 | |
| Total current assets | 590,588 | | | 273,219 | |
| Property and equipment, net | 9,988 | | | 5,292 | |
| Operating lease right-of-use assets, net | 14,511 | | | — | |
| Marketable securities, non-current | 182,629 | | | — | |
| Non-marketable equity securities | 55,649 | | | — | |
| Intangible assets, net | 79,137 | | | — | |
| Goodwill | 86,845 | | | — | |
| Other long-term assets | 3,478 | | | 3,910 | |
| Total assets | $ | 1,022,825 | | | $ | 282,421 | |
| Liabilities and stockholders’ equity | | | |
| Current liabilities: | | | |
| Accounts payable | $ | 19,753 | | | $ | 22,039 | |
| Accrued professional fees | 250 | | | 5,699 | |
| Operating lease liabilities, current | 2,110 | | | — | |
| Other current liabilities | 64,719 | | | 19,618 | |
| Total current liabilities | 86,832 | | | 47,356 | |
| Operating lease liabilities, non-current | 13,567 | | | — | |
| Long-term common stock warrant liabilities | 6,293 | | | 178,232 | |
| Long-term debt, non-current | 278,889 | | | — | |
| Other long-term liabilities | 13,544 | | | 46 | |
| Total liabilities | 399,125 | | | 225,634 | |
| Commitments and contingencies | | | |
| Stockholders’ equity: | | | |
| Preferred stock $0.0001 par value; 10 million shares authorized — 0 issued and outstanding as of December 31, 2021 and 2020 | — | | | — | |
Common stock $0.0001 par value; 625 million shares authorized; Class A common stock – 500 million shares authorized; 340 million and 292 million shares issued and outstanding as of December 31, 2021 and 2020, respectively; Class B common stock – 125 million shares authorized; 69 million and 78 million shares issued and outstanding as of December 31, 2021 and 2020, respectively | 40 | | | 37 | |
| Additional paid-in capital | 1,043,600 | | | 295,065 | |
| Accumulated other comprehensive loss | (248) | | | — | |
| Accumulated deficit | (419,692) | | | (238,315) | |
| Total stockholders’ equity | 623,700 | | | 56,787 | |
| Total liabilities and stockholders’ equity | $ | 1,022,825 | | | $ | 282,421 | |
| | | |
Skillz Inc.
Reconciliation of GAAP Net Loss to Adjusted EBITDA
(in thousands)
| | | | | | | | | | | | | | | | | | | | | | | | | | | | |
| Three Months Ended December 31, | | Twelve Months Ended December 31, | | | |
| 2021 | | 2020 | | 2021 | | 2020 | | | | | |
| Net loss | $ | (98,971) | | | $ | (66,980) | | | $ | (181,377) | | | $ | (145,510) | | | | | | |
| Interest expense, net | 1,086 | | | 28 | | | 1,222 | | | 1,325 | | | | | | |
| Stock-based compensation | 17,800 | | | 14,192 | | | 60,331 | | | 23,757 | | | | | | |
| Change in fair value of common stock warrant liabilities | (6,024) | | | 23,049 | | | (87,922) | | | 23,049 | | | | | | |
| (Benefit) provision for income taxes | (170) | | | 15 | | | (18,996) | | | 115 | | | | | | |
| Depreciation and amortization | 5,040 | | | 517 | | | 11,133 | | | 1,609 | | | | | | |
Other (income) expense, net(1) | 59 | | | 651 | | | (49) | | | 21,400 | | | | | | |
Impairment charge(2) | — | | | — | | | — | | | 3,395 | | | | | | |
Acquisition related expenses(3) | 1,113 | | | — | | | 7,152 | | | — | | | | | | |
Loss contingency accrual(4) | — | | | — | | | 11,557 | | | — | | | | | | |
One-time nonrecurring expenses(5) (6) | 2,196 | | | 4,747 | | | 14,630 | | | 4,747 | | | | | | |
| Adjusted EBITDA | $ | (77,871) | | | $ | (23,781) | | | $ | (182,319) | | | $ | (66,113) | | | | | | |
(1)For the year ended 2020, other non-operating costs (income) is primarily attributed to a $21.7 million adjustment to the fair value of the redeemable convertible Series E preferred stock forward contract liability.
(2)For the year ended 2020, this represents an impairment charge of a lease deposit and prepayment in connection with a lease agreement related to our new corporate facilities in San Francisco.
(3)For the year ended 2021, this represents acquisition related expenses for our Aarki acquisition.
(4)For the year ended 2021, this represents a loss contingency accrual related to a litigation matter relating to a former employee.
(5)For the year ended 2021, amounts represent one-time nonrecurring expenses related to the follow-on offering and executive severance expense.
(6)For the year ended 2020, amounts represent one-time transaction expenses related to the business combination with Flying Eagle Acquisition Corp.
Skillz Inc.
Reconciliation of GAAP to Non-GAAP Operating Expenses
(Unaudited, in thousands)
| | | | | | | | | | | | | | | | | | | | | | | |
| Three Months Ended December 31, | | Twelve Months Ended December 31, |
| 2021 | | 2020 | | 2021 | | 2020 |
| Research and development | $ | 15,433 | | | $ | 9,972 | | | $ | 46,017 | | | $ | 23,225 | |
| Less: stock-based compensation | (2,179) | | | (4,566) | | | (7,416) | | | (6,110) | |
| | | | | | | |
Less: one-time nonrecurring expenses(1) | (138) | | | (475) | | | (554) | | | (475) | |
| | | | | | | |
| Non-GAAP research and development | $ | 13,116 | | | $ | 4,931 | | | $ | 38,047 | | | $ | 16,640 | |
| | | | | | | |
| Sales and marketing | $ | 155,080 | | | $ | 79,560 | | | $ | 465,457 | | | $ | 251,941 | |
| Less: stock-based compensation | (2,745) | | | (2,963) | | | (8,770) | | | (4,505) | |
| | | | | | | |
Less: one-time nonrecurring expenses(1) | (130) | | | (237) | | | (525) | | | (237) | |
| Non-GAAP sales and marketing | $ | 152,205 | | | $ | 76,360 | | | $ | 456,162 | | | $ | 247,199 | |
| | | | | | | |
| General and administrative | $ | 33,934 | | | $ | 17,953 | | | $ | 135,026 | | | $ | 42,289 | |
| Less: stock-based compensation | (12,876) | | | (6,663) | | | (44,145) | | | (13,142) | |
Less: impairment charges (2) | — | | | — | | | — | | | (3,395) | |
Less: loss contingency accrual(4) | — | | | — | | | (11,557) | | | — | |
Less: acquisition related expenses(3) | (1,113) | | | — | | | (7,152) | | | — | |
Less: one-time nonrecurring expenses(1) | (1,928) | | | (4,035) | | | (13,551) | | | (4,035) | |
| Non-GAAP general and administrative | $ | 18,017 | | — | | $ | 7,255 | | | $ | 58,621 | | | $ | 21,717 | |
| | | | | | | |
| | | | | | | |
| | | | | | | |
| | | | | | | |
| | | | | | | |
| | | | | | | |
| | | | | | | |
| | | | | | | |
| | | | | | | |
| | | | | | | |
| | | | | | | |
| | | | | | | |
(1) For the year ended 2021, amounts represent one-time nonrecurring expenses related to the follow-on offering and executive severance expense.
(2) For the year ended 2020, amount represents an impairment charge of a lease deposit and prepayment in connection with a lease agreement related to our facilities in San Francisco.
(3) For the year ended 2021, amounts represent acquisition related expenses for our Aarki acquisition.
(4) For the year ended 2021, amounts represent a loss contingency accrual related to a litigation matter relating to a former employee.
Skillz Inc.
Reconciliation of GAAP to Non-GAAP Revenue
(in thousands)
| | | | | | | | | | | | | | | | | | | | | | | |
| Three Months Ended December 31, | | Twelve Months Ended December 31, |
| 2021 | | 2020 | | 2021 | | 2020 |
| Revenue | $ | 108,849 | | | $ | 67,723 | | | $ | 384,089 | | | $ | 230,115 | |
| Less: Sales and marketing - engagement marketing | 56,683 | | | 32,634 | | | 187,596 | | | $ | 99,814 | |
Revenue after engagement marketing(1) | $ | 52,166 | | | $ | 35,089 | | | $ | 196,493 | | | $ | 130,301 | |
| | | | | | | |
| | | | | | | |
| | | | | | | |
| | | | | | | |
| | | | | | | |
| | | | | | | |
| | | | | | | |
| | | | | | | |
| | | | | | | |
| | | | | | | |
| | | | | | | |
| | | | | | | |
(1) “Revenue After Engagement Marketing” or “RAEM” means the consolidated revenue less engagement marketing expenses included in sales and marketing expense.
Skillz Inc.
Supplemental Financial Information
(in millions, except ARPU and ARPPU)
| | | | | | | | | | | | | | | | | | | | | | | |
| Three Months Ended December 31, | | Twelve Months Ended December 31, |
| 2021 | | 2020 | | 2021 | | 2020 |
Monthly active users (“MAUs”)(1) | 3.7 | | 2.4 | | 3.0 | | 2.6 |
Average revenue per user (“ARPU”)(2) | $ | 9.80 | | | $ | 9.40 | | | 10.90 | | $ | 7.50 | |
Paying monthly active users (“PMAUs”)(3) | 0.61 | | 0.39 | | 0.51 | | 0.32 |
Average revenue per paying user (“ARPPU”)(4) | $ | 59.30 | | | $ | 57.80 | | | $ | 62.40 | | | $ | 59.20 | |
Gross marketplace volume (“GMV”)(5) | $ | 650 | | | $ | 463 | | | $ | 2,436 | | | $ | 1,592 | |
Revenue after engagement marketing (“RAEM”) (6) | $ | 52 | | | $ | 35 | | | $ | 196 | | | $ | 130 | |
(1) “Monthly Active Users” or “MAUs” means the number of end-users who entered into a paid or free contest hosted on Skillz’s platform at least once in a month, averaged over each month in the period.
(2) “Average Revenue Per Monthly Active User” or “ARPU” means the average revenue in a given month divided by MAUs in that month, averaged over the period.
(3) “Paying Monthly Active Users” or “PMAUs” means the number of end-users who entered into a paid contest hosted on Skillz’s platform at least once in a month, averaged over each month in the period.
(4) “Average Revenue Per Paying Monthly Active User” or “ARPPU” means the average revenue in a given month divided by PMAUs in that month, averaged over the period.
(5) “GMV” or “Gross Marketplace Volume” means the total entry fees paid by users for contests hosted on Skillz’s platform. Total entry fees include entry fees paid by end-users using cash deposits, prior cash winnings from end-users’ accounts that have not been withdrawn, and end-user incentives used to enter paid entry fee contests.
(6) “Revenue After Engagement Marketing” or “RAEM” means the consolidated revenue less engagement marketing expenses included in sales and marketing expense.
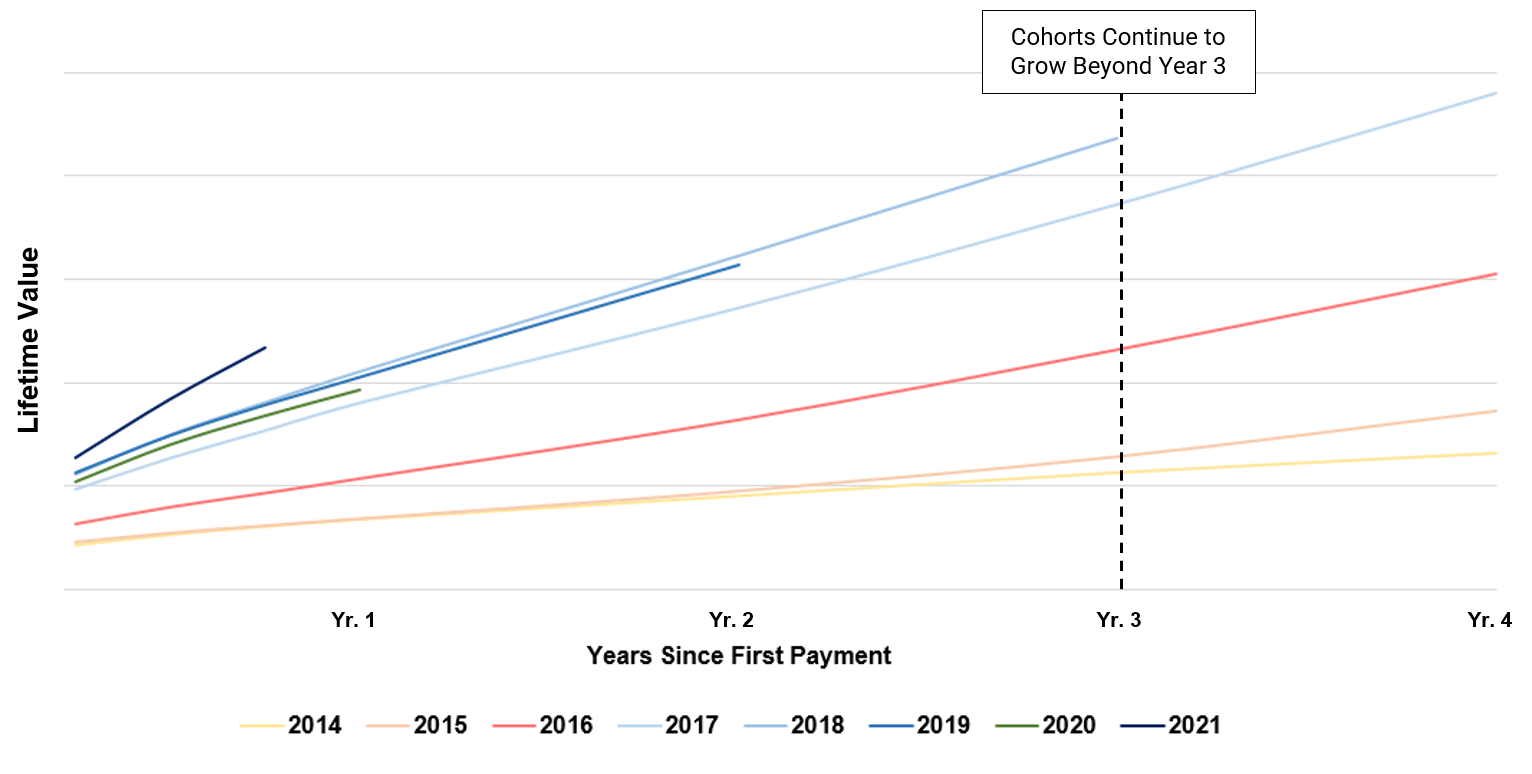
Skillz Inc.
Long Lived User Cohorts Build Long-Term Profitability
(Unaudited)
(1) Lifetime Value means the cumulative gross profit from a paying user over the period following the acquisition of that paying user.