Free signup for more
- Track your favorite companies
- Receive email alerts for new filings
- Personalized dashboard of news and more
- Access all data and search results
Filing tables
Filing exhibits
Associated filings
- 28 Apr 23 SC 13G Trean Insurance / Percy Rockdale ownership change
- 21 Apr 23 SC 13E3/A Going private transaction (amended)
- 12 Apr 23 SC 13E3/A Going private transaction (amended)
- 16 Mar 23 SC 13E3/A Going private transaction (amended)
- 14 Feb 23 SC 13G/A Trean Insurance / Baker Blake ownership change
- 13 Feb 23 SC 13G/A Trean Insurance / Altaris Partners ownership change
- 27 Jan 23 SC 13G/A Trean Insurance / ROYCE & ASSOCIATES ownership change
-
19 Jan 23 SC 13E3 Going private transaction
- 2 Feb 22 SC 13G/A Trean Insurance / Baker Blake ownership change
- 25 Jan 22 SC 13G Trean Insurance / ROYCE & ASSOCIATES ownership change
- 14 Jan 22 SC 13G/A Trean Insurance / Altaris Partners ownership change
- 24 Mar 21 SC 13G Trean Insurance / Baker Blake ownership change
- 14 Jan 21 SC 13G/A Trean Insurance / Altaris Partners ownership change
- 11 Aug 20 SC 13G Trean Insurance / Altaris Partners ownership change
TIG similar filings
Filing view
External links
Exhibit (c)(1)
Project Twins PRELIMINAR Y DISCUSSION MATERIAL S FOR THE SPECIAL COMMITTEE OF THE BOARD OF DIRECT ORS OCTOBER 28, 2022 | CONFIDENTIAL
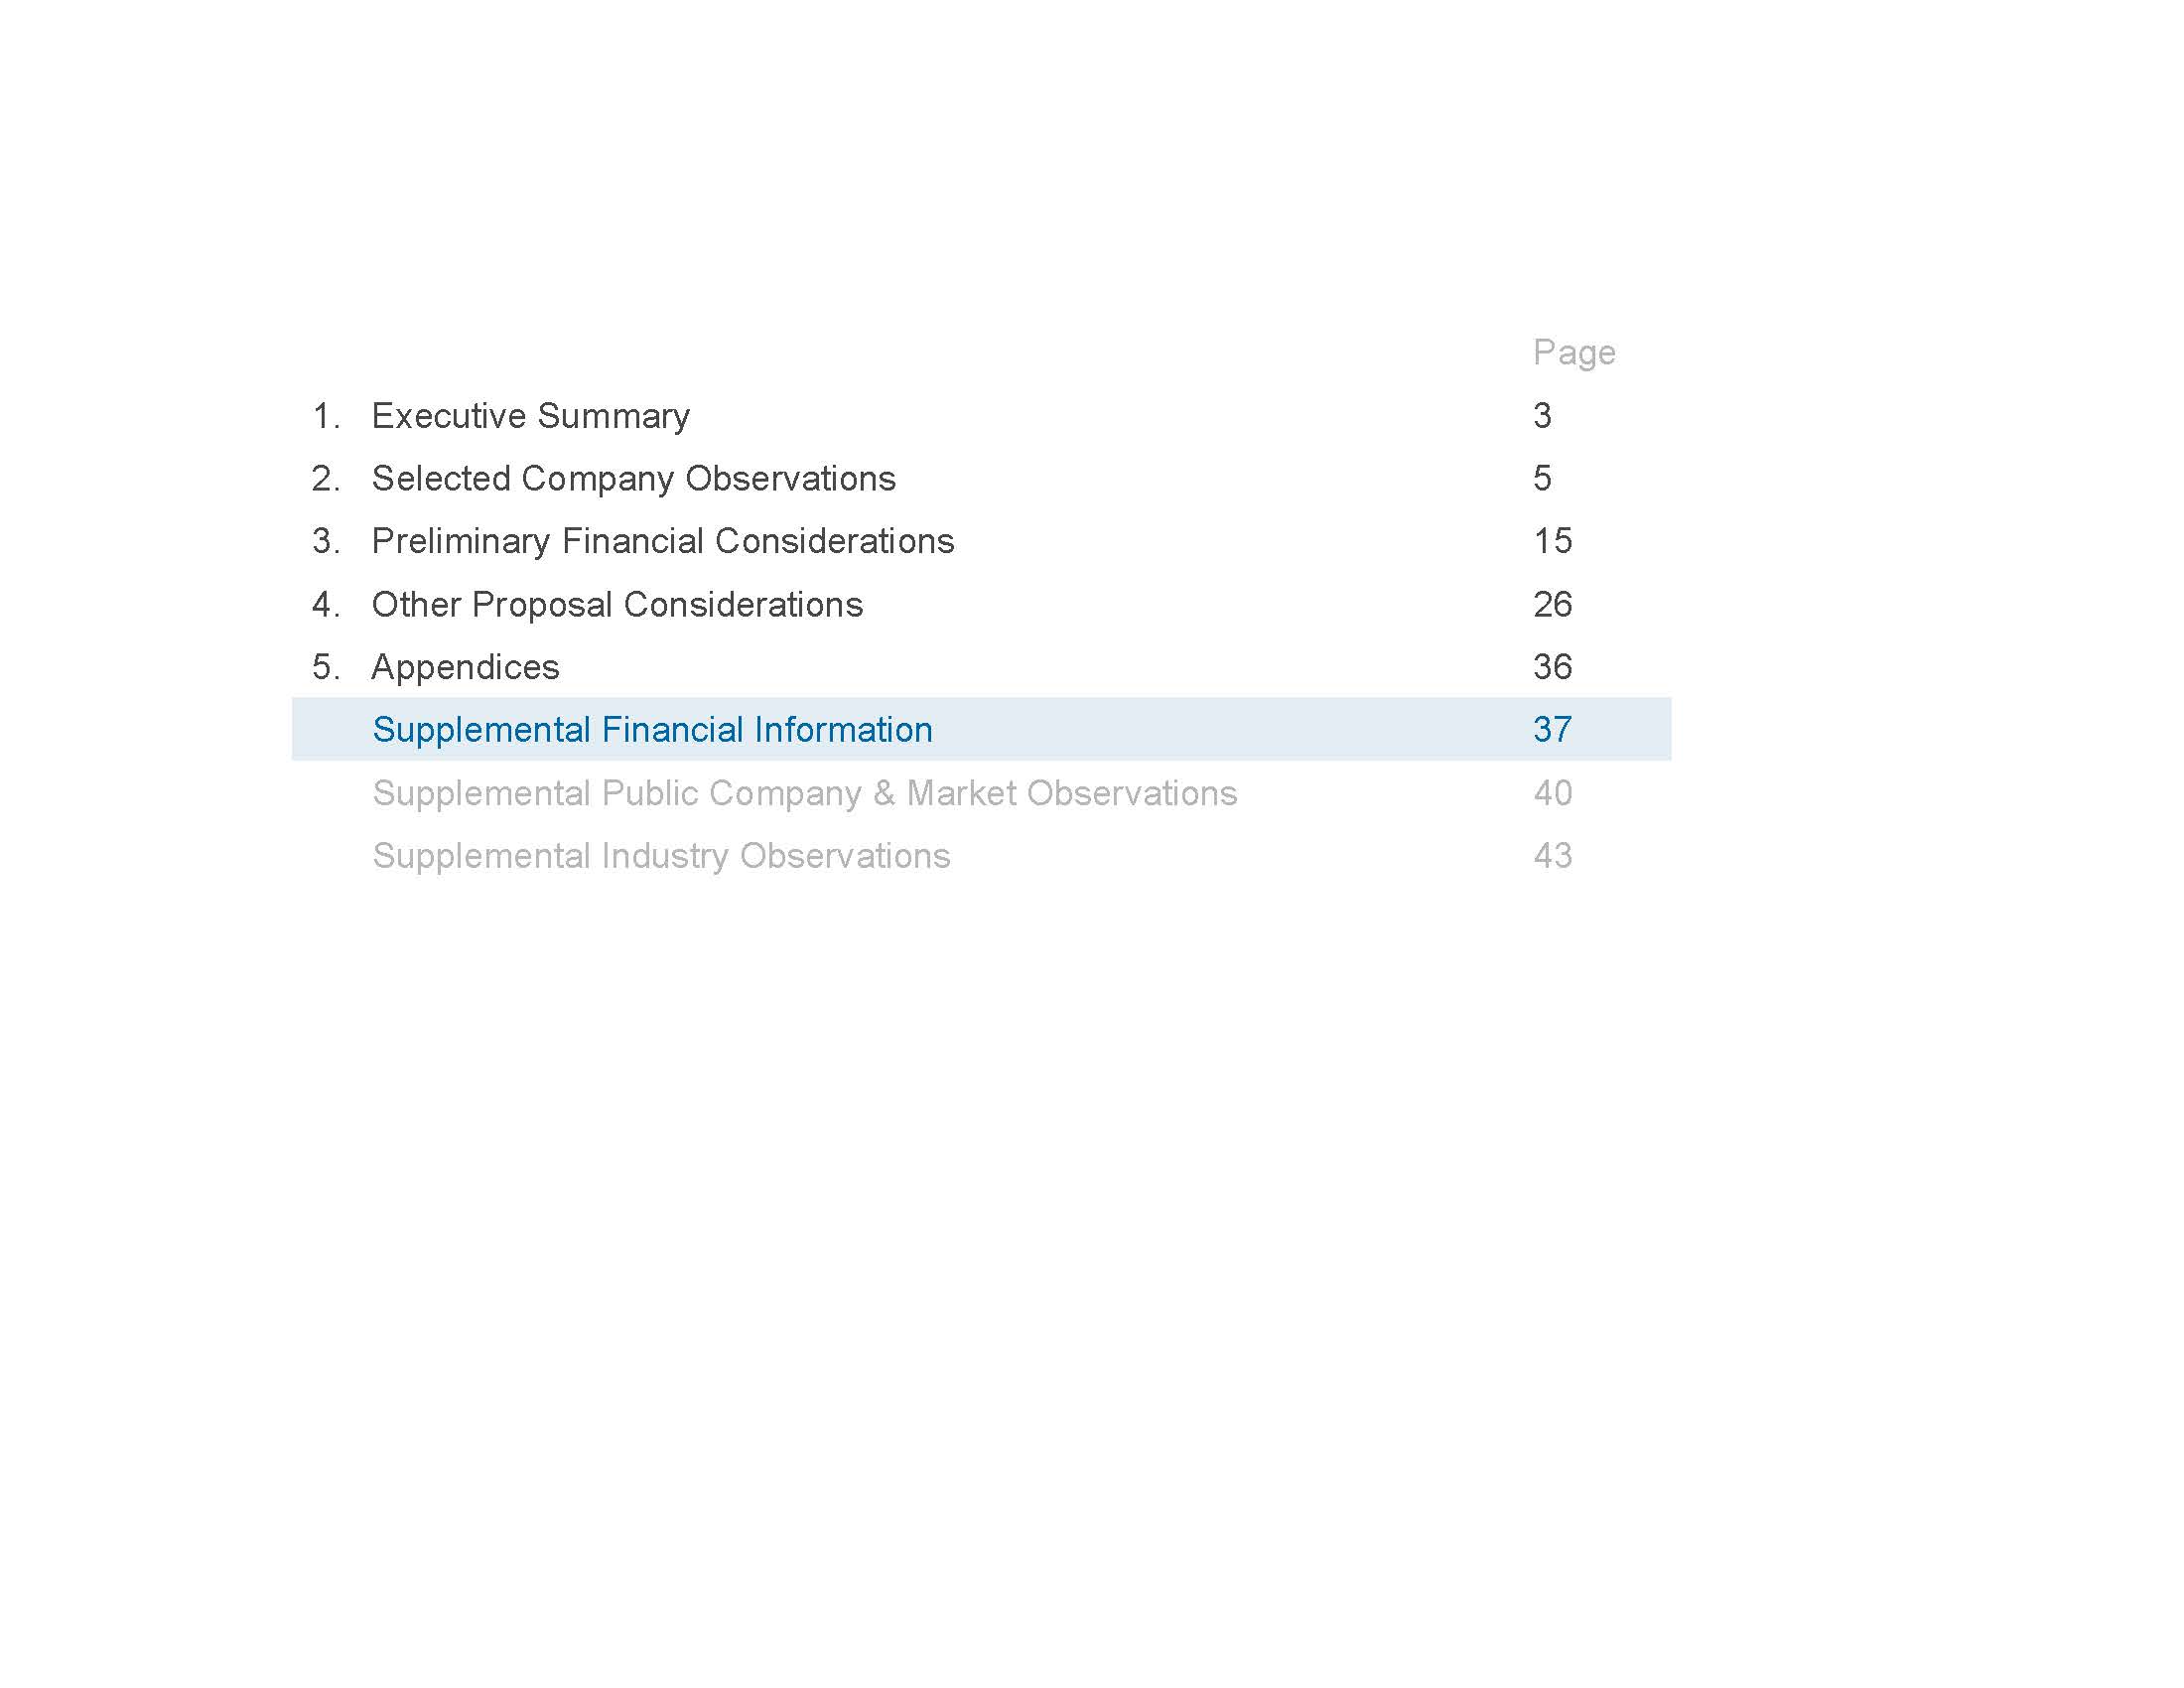
CONFIDENTIAL Table of Contents 2 Page 3 5 15 26 36 37 40 43 Executive Summary Selected Company Observations Preliminary Financial Considerations Other Proposal Considerations Appendices Supplemental Financial Information Supplemental Public Company & Market Observations Supplemental Industry Observations
Page 1. Executive Summary 3 Selected Company Observations Preliminary Financial Considerations Other Proposal Considerations Appendices 5 15 26 36
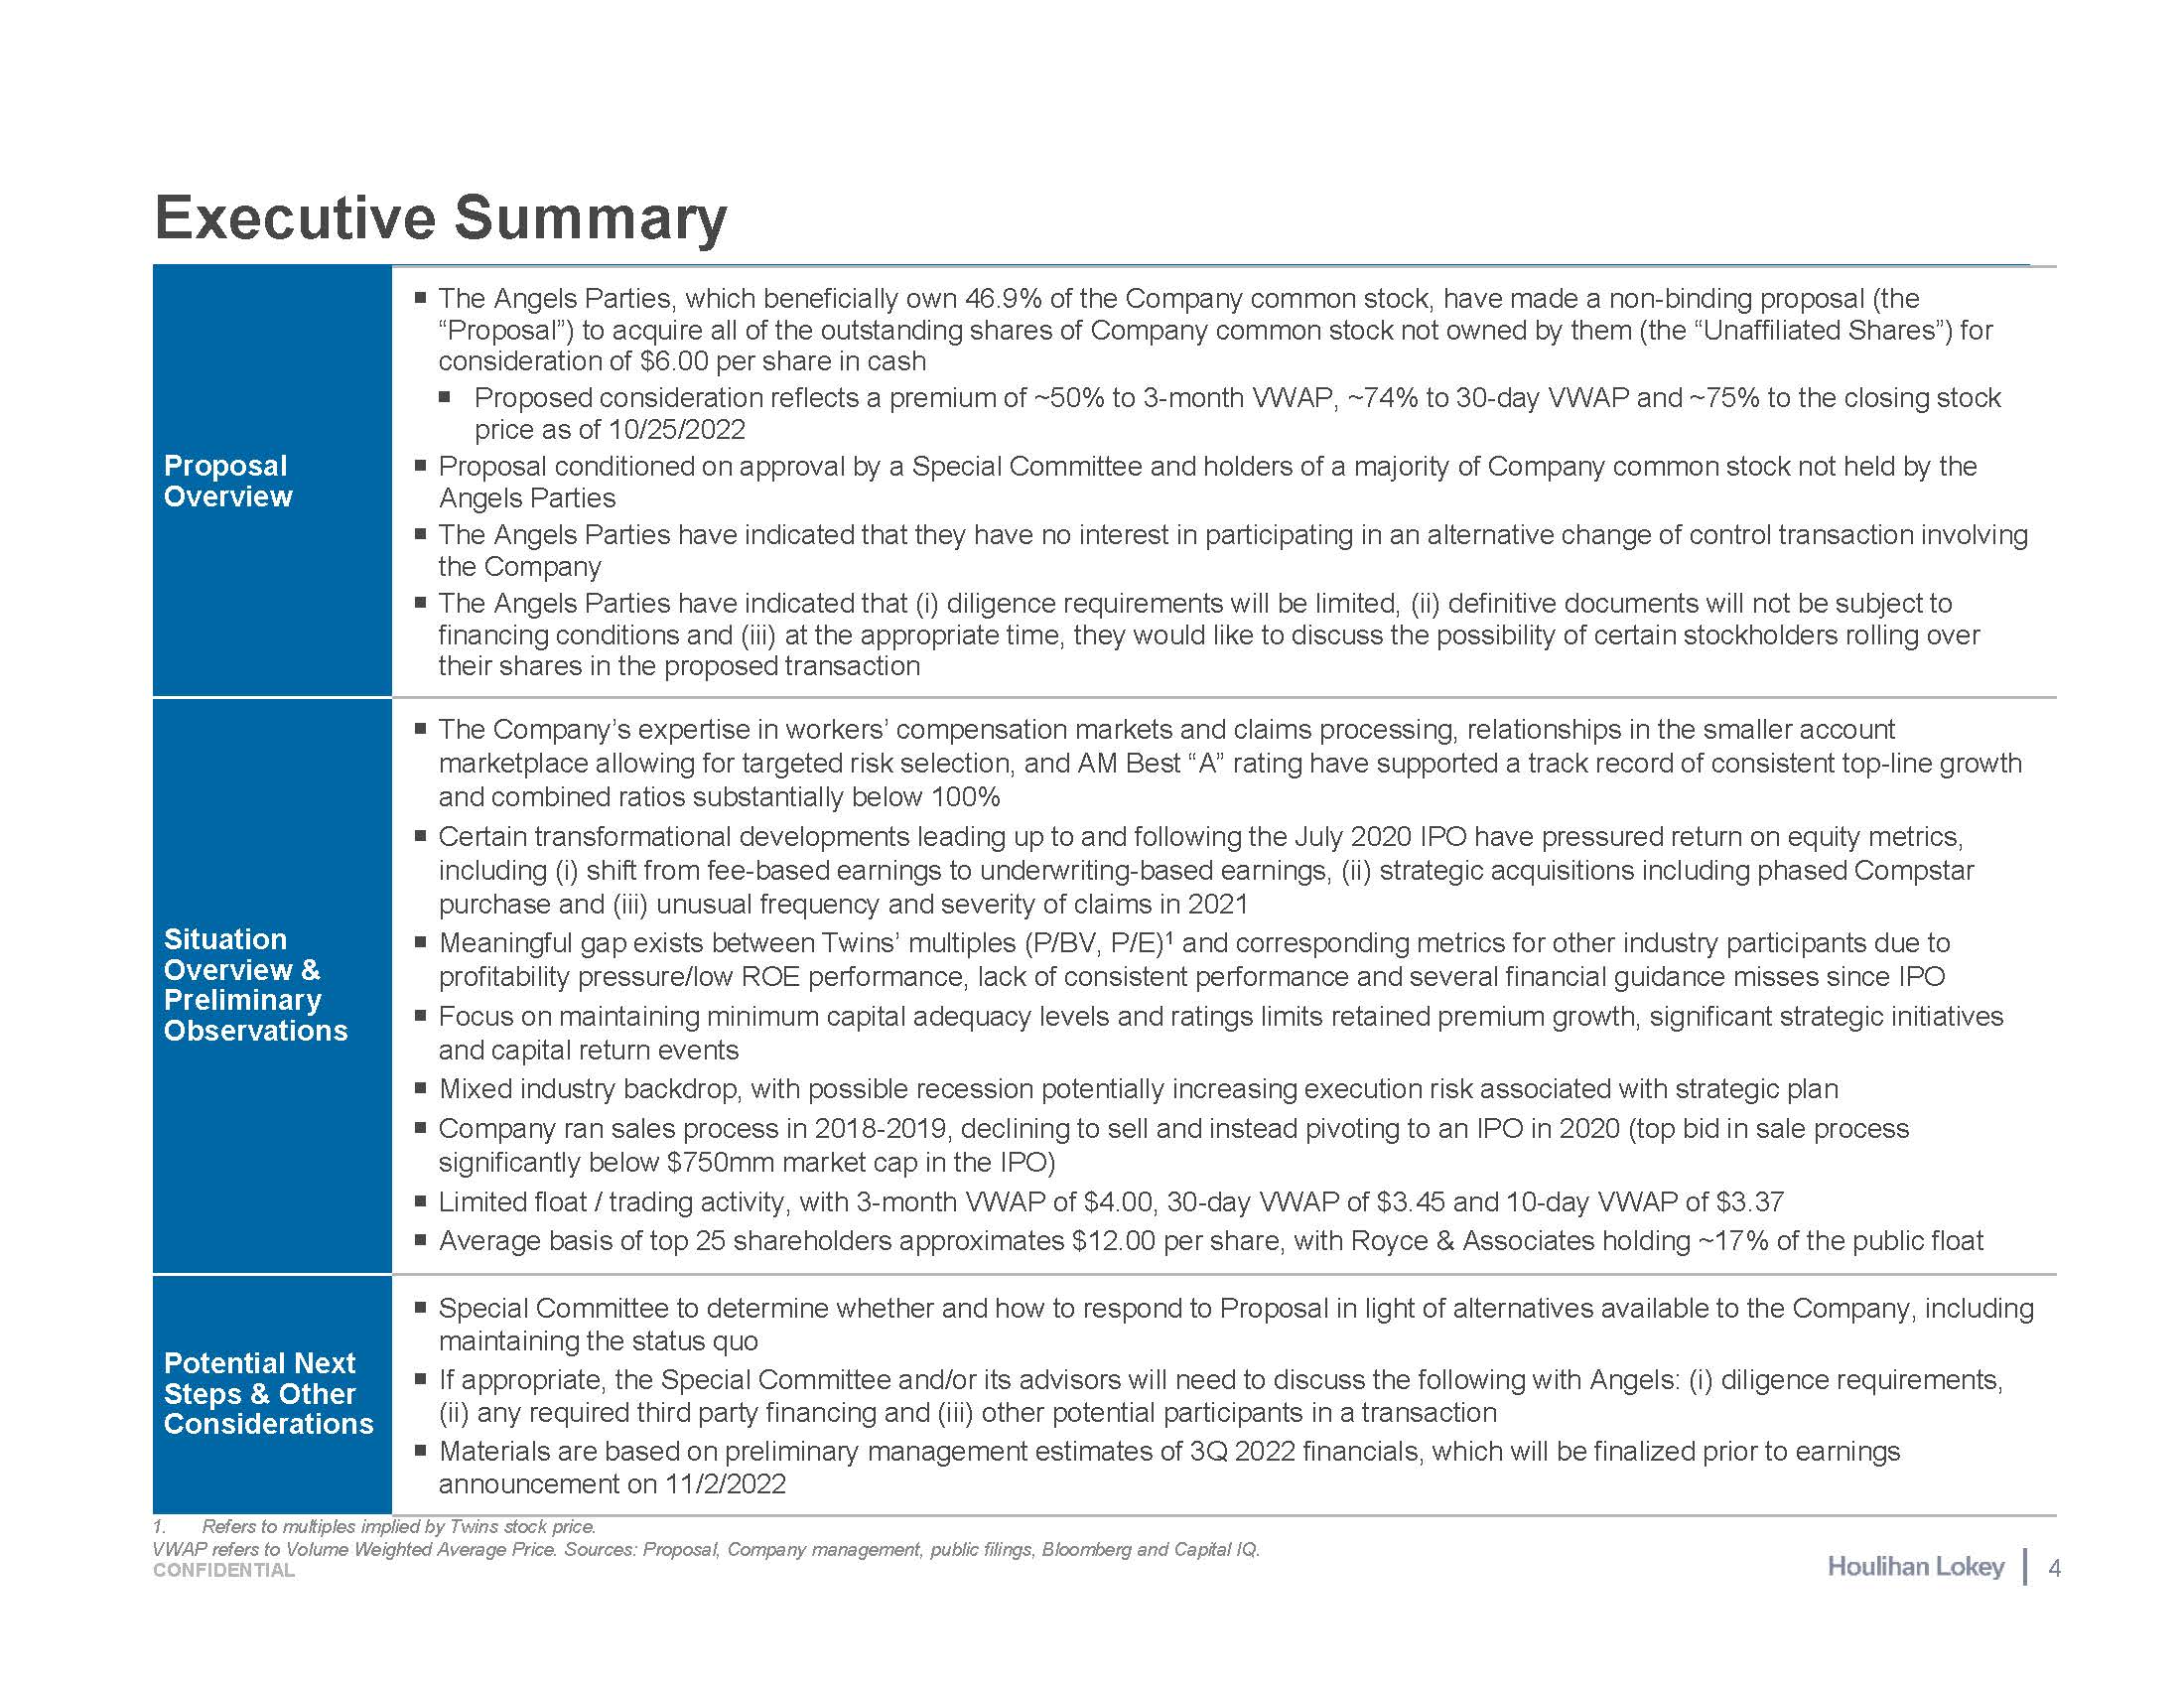
Proposal Overview The Angels Parties, which beneficially own 46.9% of the Company common stock, have made a non-binding proposal (the “Proposal”) to acquire all of the outstanding shares of Company common stock not owned by them (the “Unaffiliated Shares”) for consideration of $6.00 per share in cash Proposed consideration reflects a premium of ~50% to 3-month VWAP, ~74% to 30-day VWAP and ~75% to the closing stock price as of 10/25/2022 Proposal conditioned on approval by a Special Committee and holders of a majority of Company common stock not held by the Angels Parties The Angels Parties have indicated that they have no interest in participating in an alternative change of control transaction involving the Company The Angels Parties have indicated that (i) diligence requirements will be limited, (ii) definitive documents will not be subject to financing conditions and (iii) at the appropriate time, they would like to discuss the possibility of certain stockholders rolling over their shares in the proposed transaction Situation Overview & Preliminary Observations The Company’s expertise in workers’ compensation markets and claims processing, relationships in the smaller account marketplace allowing for targeted risk selection, and AM Best “A” rating have supported a track record of consistent top-line growth and combined ratios substantially below 100% Certain transformational developments leading up to and following the July 2020 IPO have pressured return on equity metrics, including (i) shift from fee-based earnings to underwriting-based earnings, (ii) strategic acquisitions including phased Compstar purchase and (iii) unusual frequency and severity of claims in 2021 Meaningful gap exists between Twins’ multiples (P/BV, P/E)1 and corresponding metrics for other industry participants due to profitability pressure/low ROE performance, lack of consistent performance and several financial guidance misses since IPO Focus on maintaining minimum capital adequacy levels and ratings limits retained premium growth, significant strategic initiatives and capital return events Mixed industry backdrop, with possible recession potentially increasing execution risk associated with strategic plan Company ran sales process in 2018-2019, declining to sell and instead pivoting to an IPO in 2020 (top bid in sale process significantly below $750mm market cap in the IPO) Limited float / trading activity, with 3-month VWAP of $4.00, 30-day VWAP of $3.45 and 10-day VWAP of $3.37 Average basis of top 25 shareholders approximates $12.00 per share, with Royce & Associates holding ~17% of the public float Potential Next Steps & Other Considerations Special Committee to determine whether and how to respond to Proposal in light of alternatives available to the Company, including maintaining the status quo If appropriate, the Special Committee and/or its advisors will need to discuss the following with Angels: (i) diligence requirements, (ii) any required third party financing and (iii) other potential participants in a transaction Materials are based on preliminary management estimates of 3Q 2022 financials, which will be finalized prior to earnings announcement on 11/2/2022 Executive Summary 4 CONFIDENTIAL 1. Refers to multiples implied by Twins stock price. VWAP refers to Volume Weighted Average Price. Sources: Proposal, Company management, public filings, Bloomberg and Capital IQ.
Page 3 1. Executive Summary 2. Selected Company Observations 5 Preliminary Financial Considerations Other Proposal Considerations Appendices 15 26 36
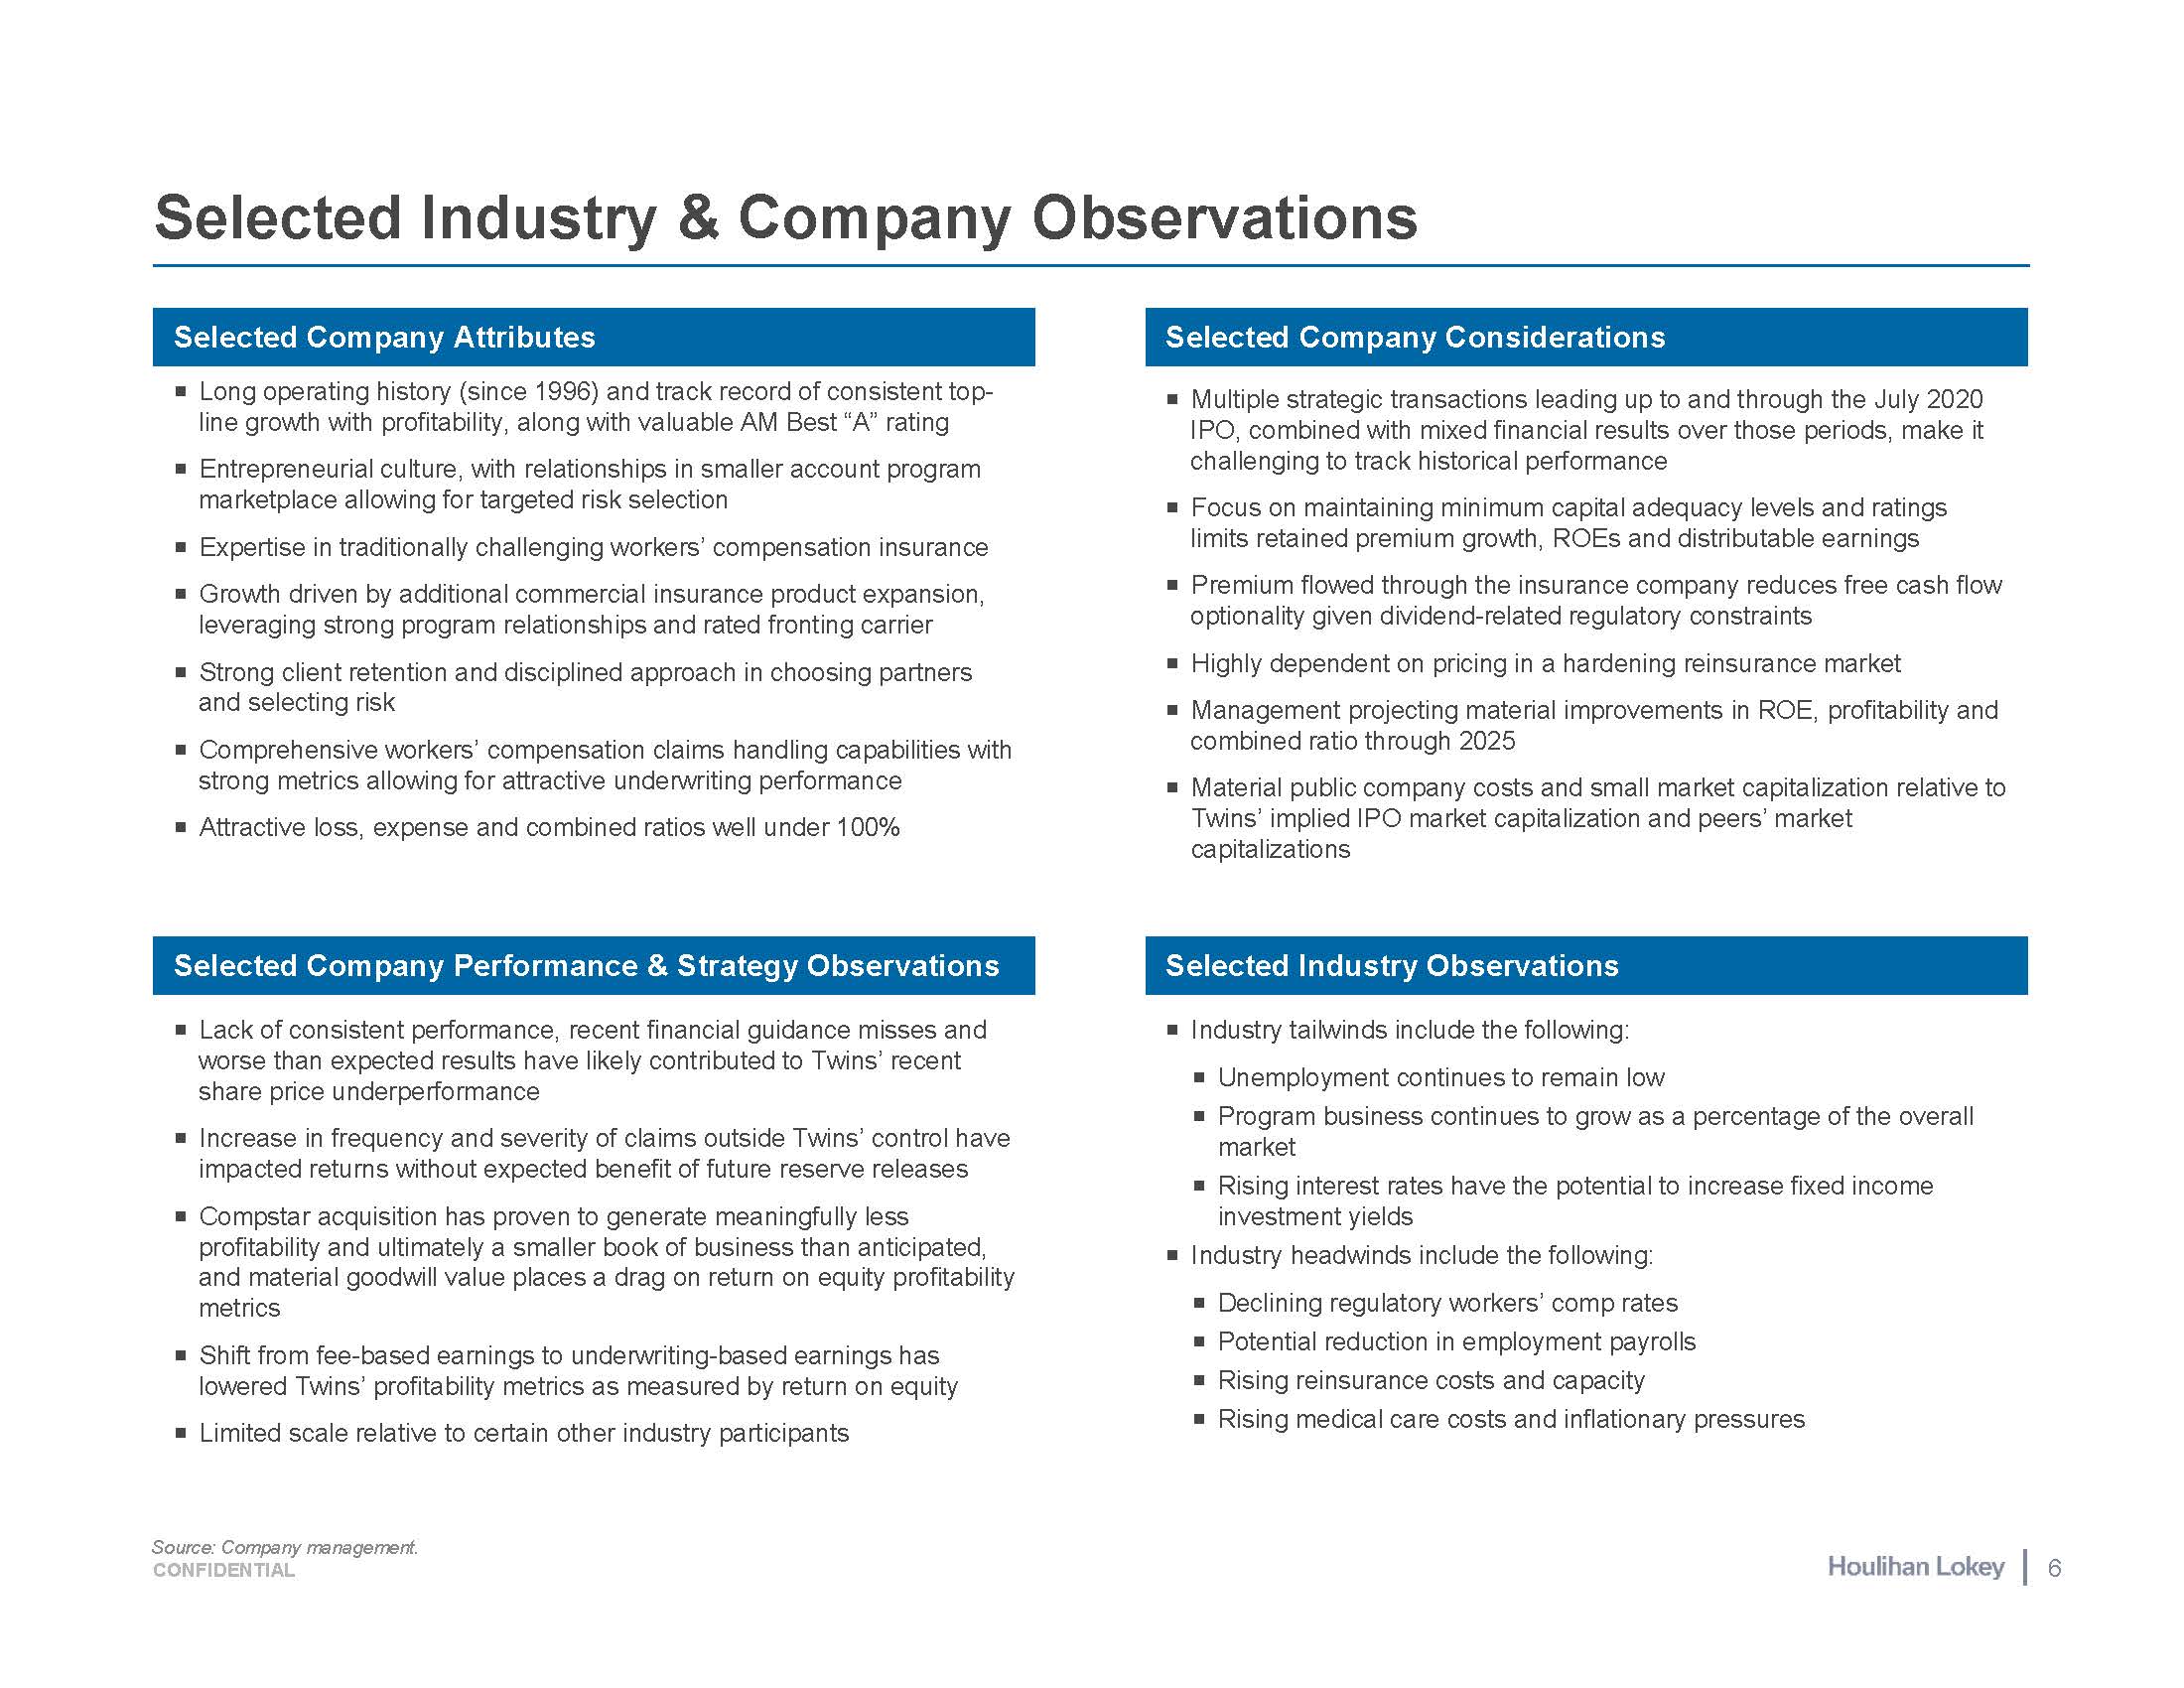
Selected Industry & Company Observations Source: Company management. CONFIDENTIAL 6 Multiple strategic transactions leading up to and through the July 2020 IPO, combined with mixed financial results over those periods, make it challenging to track historical performance Focus on maintaining minimum capital adequacy levels and ratings limits retained premium growth, ROEs and distributable earnings Premium flowed through the insurance company reduces free cash flow optionality given dividend-related regulatory constraints Highly dependent on pricing in a hardening reinsurance market Management projecting material improvements in ROE, profitability and combined ratio through 2025 Material public company costs and small market capitalization relative to Twins’ implied IPO market capitalization and peers’ market capitalizations Lack of consistent performance, recent financial guidance misses and worse than expected results have likely contributed to Twins’ recent share price underperformance Increase in frequency and severity of claims outside Twins’ control have impacted returns without expected benefit of future reserve releases Compstar acquisition has proven to generate meaningfully less profitability and ultimately a smaller book of business than anticipated, and material goodwill value places a drag on return on equity profitability metrics Shift from fee-based earnings to underwriting-based earnings has lowered Twins’ profitability metrics as measured by return on equity Limited scale relative to certain other industry participants Industry tailwinds include the following: Unemployment continues to remain low Program business continues to grow as a percentage of the overall market Rising interest rates have the potential to increase fixed income investment yields Industry headwinds include the following: Declining regulatory workers’ comp rates Potential reduction in employment payrolls Rising reinsurance costs and capacity Rising medical care costs and inflationary pressures Selected Company Attributes Selected Company Considerations Selected Company Performance & Strategy Observations Selected Industry Observations Long operating history (since 1996) and track record of consistent top- line growth with profitability, along with valuable AM Best “A” rating Entrepreneurial culture, with relationships in smaller account program marketplace allowing for targeted risk selection Expertise in traditionally challenging workers’ compensation insurance Growth driven by additional commercial insurance product expansion, leveraging strong program relationships and rated fronting carrier Strong client retention and disciplined approach in choosing partners and selecting risk Comprehensive workers’ compensation claims handling capabilities with strong metrics allowing for attractive underwriting performance Attractive loss, expense and combined ratios well under 100%
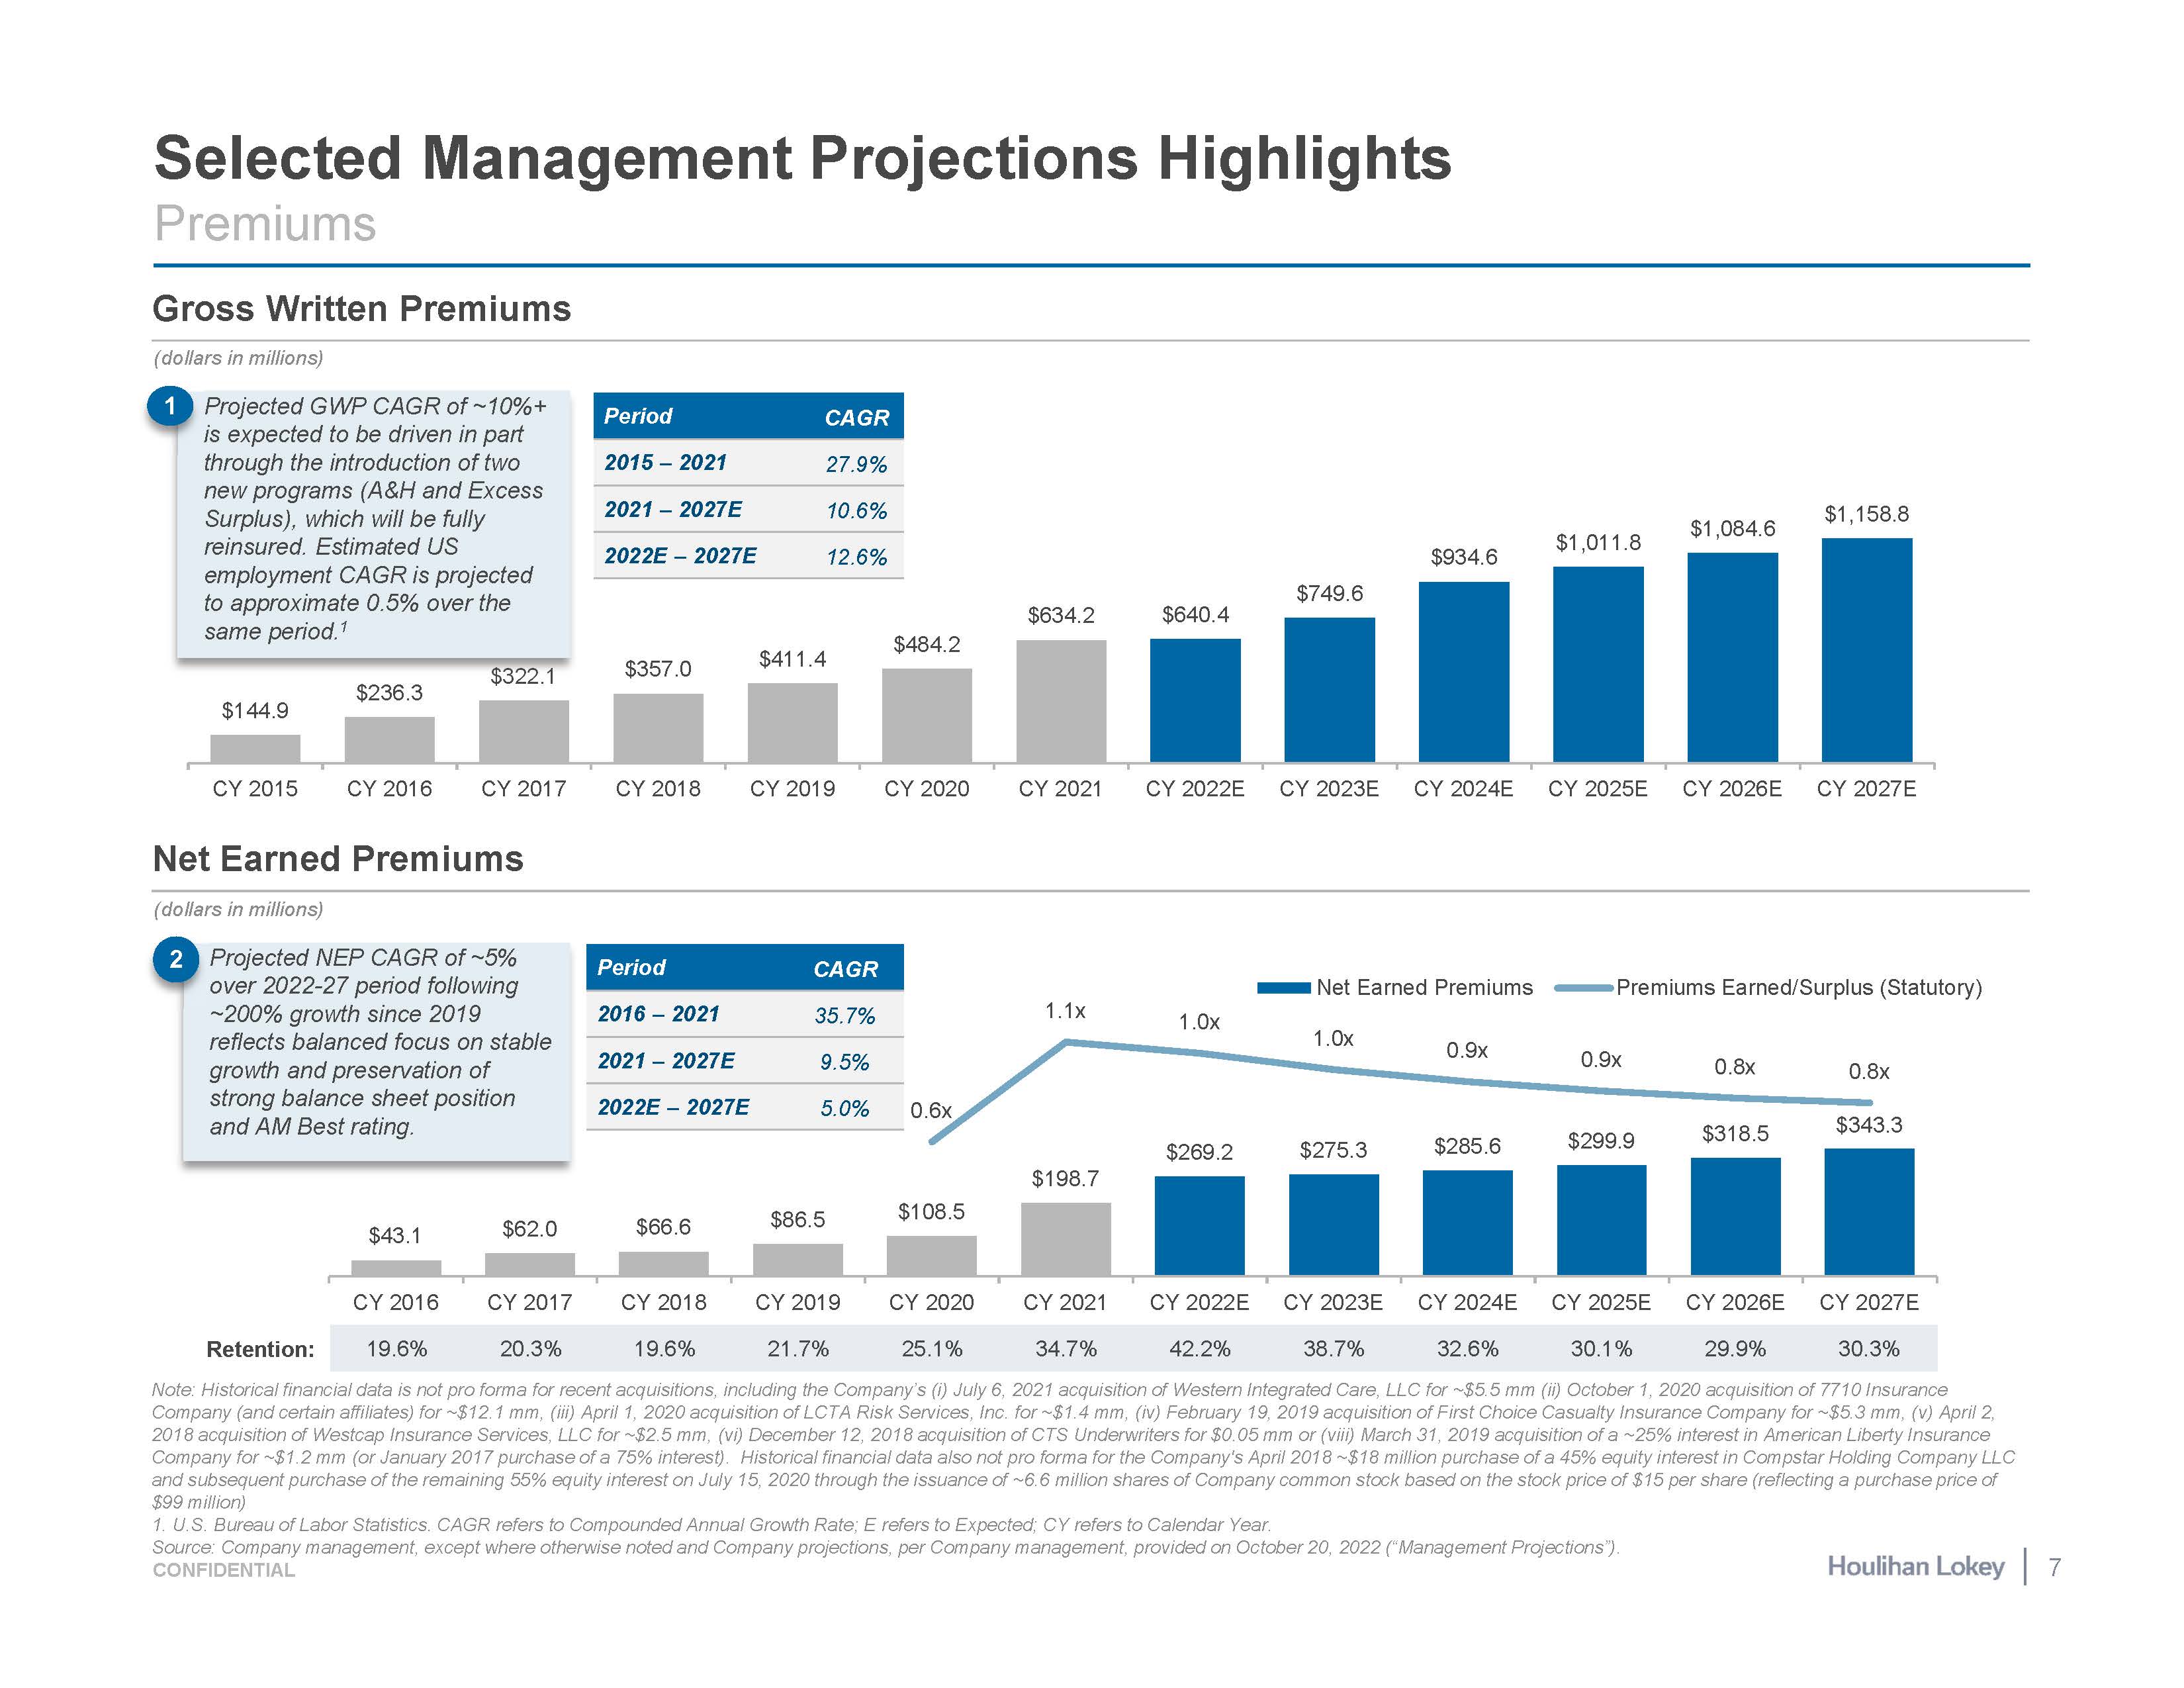
$43.1 $62.0 $66.6 $86.5 $108.5 $198.7 $269.2 $275.3 $285.6 $299.9 $318.5 $343.3 0.6x 1.1x 1.0x 1.0x 0.9x 0.9x 0.8x 0.8x CY 2016 CY 2017 CY 2018 CY 2019 CY 2020 CY 2021 CY 2022E CY 2023E CY 2024E CY 2025E CY 2026E CY 2027E Net Earned Premiums Premiums Earned/Surplus (Statutory) $144.9 $236.3 $322.1 $357.0 $411.4 $484.2 $634.2 $640.4 $749.6 $934.6 $1,011.8 $1,084.6 $1,158.8 CY 2015 CY 2016 CY 2017 Net Earned Premiums CY 2018 CY 2019 CY 2020 CY 2021 CY 2022E CY 2023E CY 2024E CY 2025E CY 2026E CY 2027E Selected Management Projections Highlights Premiums Gross Written Premiums (dollars in millions) (dollars in millions) 2 Projected NEP CAGR of ~5% over 2022-27 period following ~200% growth since 2019 reflects balanced focus on stable growth and preservation of strong balance sheet position and AM Best rating. Period CAGR 2015 – 2021 27.9% 2021 – 2027E 10.6% 2022E – 2027E 12.6% Period CAGR 2016 – 2021 35.7% 2021 – 2027E 9.5% 2022E – 2027E 5.0% Retention: 19.6% 20.3% 19.6% 21.7% 25.1% 34.7% 42.2% 38.7% 32.6% 30.1% 29.9% 30.3% Note: Historical financial data is not pro forma for recent acquisitions, including the Company’s (i) July 6, 2021 acquisition of Western Integrated Care, LLC for ~$5.5 mm (ii) October 1, 2020 acquisition of 7710 Insurance Company (and certain affiliates) for ~$12.1 mm, (iii) April 1, 2020 acquisition of LCTA Risk Services, Inc. for ~$1.4 mm, (iv) February 19, 2019 acquisition of First Choice Casualty Insurance Company for ~$5.3 mm, (v) April 2, 2018 acquisition of Westcap Insurance Services, LLC for ~$2.5 mm, (vi) December 12, 2018 acquisition of CTS Underwriters for $0.05 mm or (viii) March 31, 2019 acquisition of a ~25% interest in American Liberty Insurance Company for ~$1.2 mm (or January 2017 purchase of a 75% interest). Historical financial data also not pro forma for the Company's April 2018 ~$18 million purchase of a 45% equity interest in Compstar Holding Company LLC and subsequent purchase of the remaining 55% equity interest on July 15, 2020 through the issuance of ~6.6 million shares of Company common stock based on the stock price of $15 per share (reflecting a purchase price of $99 million) 1. U.S. Bureau of Labor Statistics. CAGR refers to Compounded Annual Growth Rate; E refers to Expected; CY refers to Calendar Year. Source: Company management, except where otherwise noted and Company projections, per Company management, provided on October 20, 2022 (“Management Projections”). employment CAGR is projected to approximate 0.5% over the same period.1 1 Projected GWP CAGR of ~10%+ is expected to be driven in part through the introduction of two new programs (A&H and Excess Surplus), which will be fully reinsured. Estimated US 7 CONFIDENTIAL
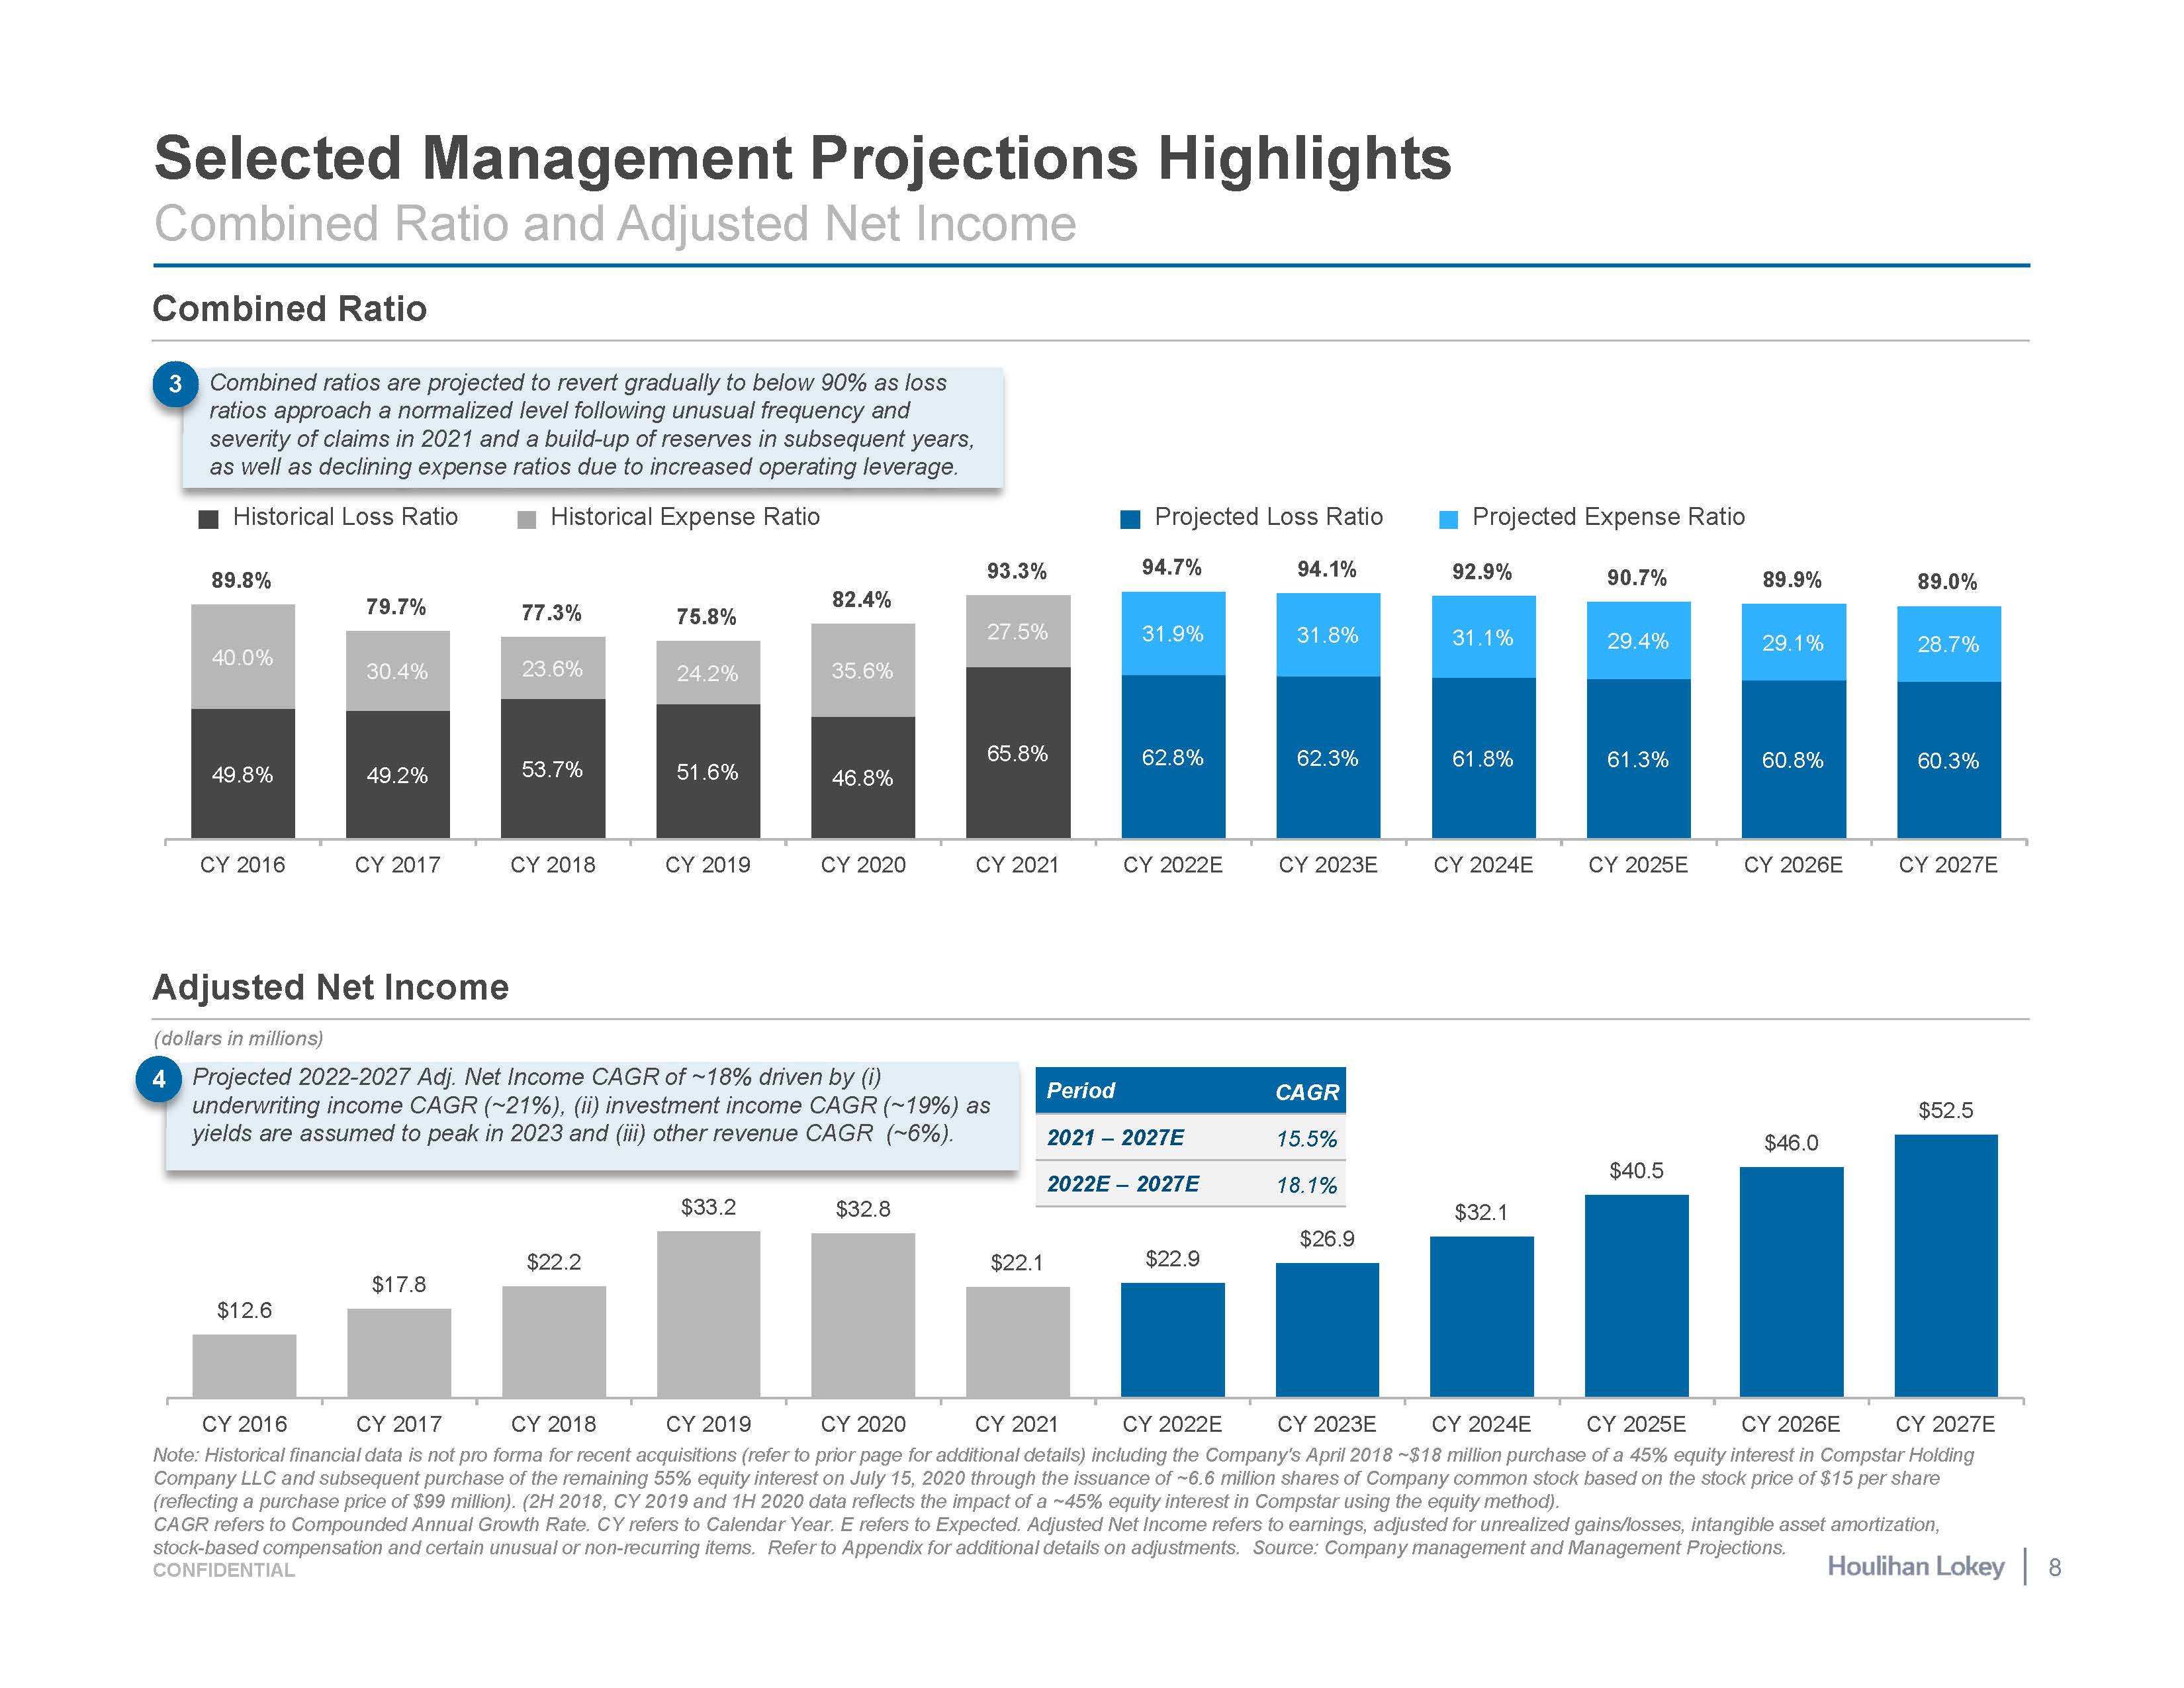
(dollars in millions) $17.8 $12.6 $22.2 $33.2 $32.8 $22.1 $22.9 $26.9 $32.1 $40.5 $46.0 $52.5 CY 2016 CY 2017 CY 2018 CY 2019 CY 2020 CY 2021 CY 2022E CY 2023E CY 2024E CY 2025E CY 2026E CY 2027E Note: Historical financial data is not pro forma for recent acquisitions (refer to prior page for additional details) including the Company's April 2018 ~$18 million purchase of a 45% equity interest in Compstar Holding Company LLC and subsequent purchase of the remaining 55% equity interest on July 15, 2020 through the issuance of ~6.6 million shares of Company common stock based on the stock price of $15 per share (reflecting a purchase price of $99 million). (2H 2018, CY 2019 and 1H 2020 data reflects the impact of a ~45% equity interest in Compstar using the equity method). CAGR refers to Compounded Annual Growth Rate. CY refers to Calendar Year. E refers to Expected. Adjusted Net Income refers to earnings, adjusted for unrealized gains/losses, intangible asset amortization, 49.8% 49.2% 53.7% 51.6% 46.8% 65.8% 62.8% 62.3% 61.8% 61.3% 60.8% 60.3% 40.0% 30.4% 23.6% 24.2% 35.6% 27.5% 31.1% 29.4% 29.1% 28.7% 89.8% 79.7% 77.3% 75.8% 82.4% 93.3% 92.9% 90.7% 89.9% 89.0% CY 2016 CY 2017 CY 2018 CY 2019 CY 2020 CY 2021 CY 2022E CY 2023E CY 2024E CY 2025E CY 2026E CY 2027E Selected Management Projections Highlights Combined Ratio and Adjusted Net Income Combined Ratio Adjusted Net Income Projected 2022-2027 Adj. Net Income CAGR of ~18% driven by (i) underwriting income CAGR (~21%), (ii) investment income CAGR (~19%) as yields are assumed to peak in 2023 and (iii) other revenue CAGR (~6%). 4 Period CAGR 2021 – 2027E 15.5% 2022E – 2027E 18.1% 3 Projected Loss Ratio 94.7% 94.1% 31.9% 31.8% Projected Expense Ratio Combined ratios are projected to revert gradually to below 90% as loss ratios approach a normalized level following unusual frequency and severity of claims in 2021 and a build-up of reserves in subsequent years, as well as declining expense ratios due to increased operating leverage. Historical Loss Ratio Historical Expense Ratio stock-based compensation and certain unusual or non-recurring items. Refer to Appendix for additional details on adjustments. Source: Company management and Management Projections. CONFIDENTIAL 8
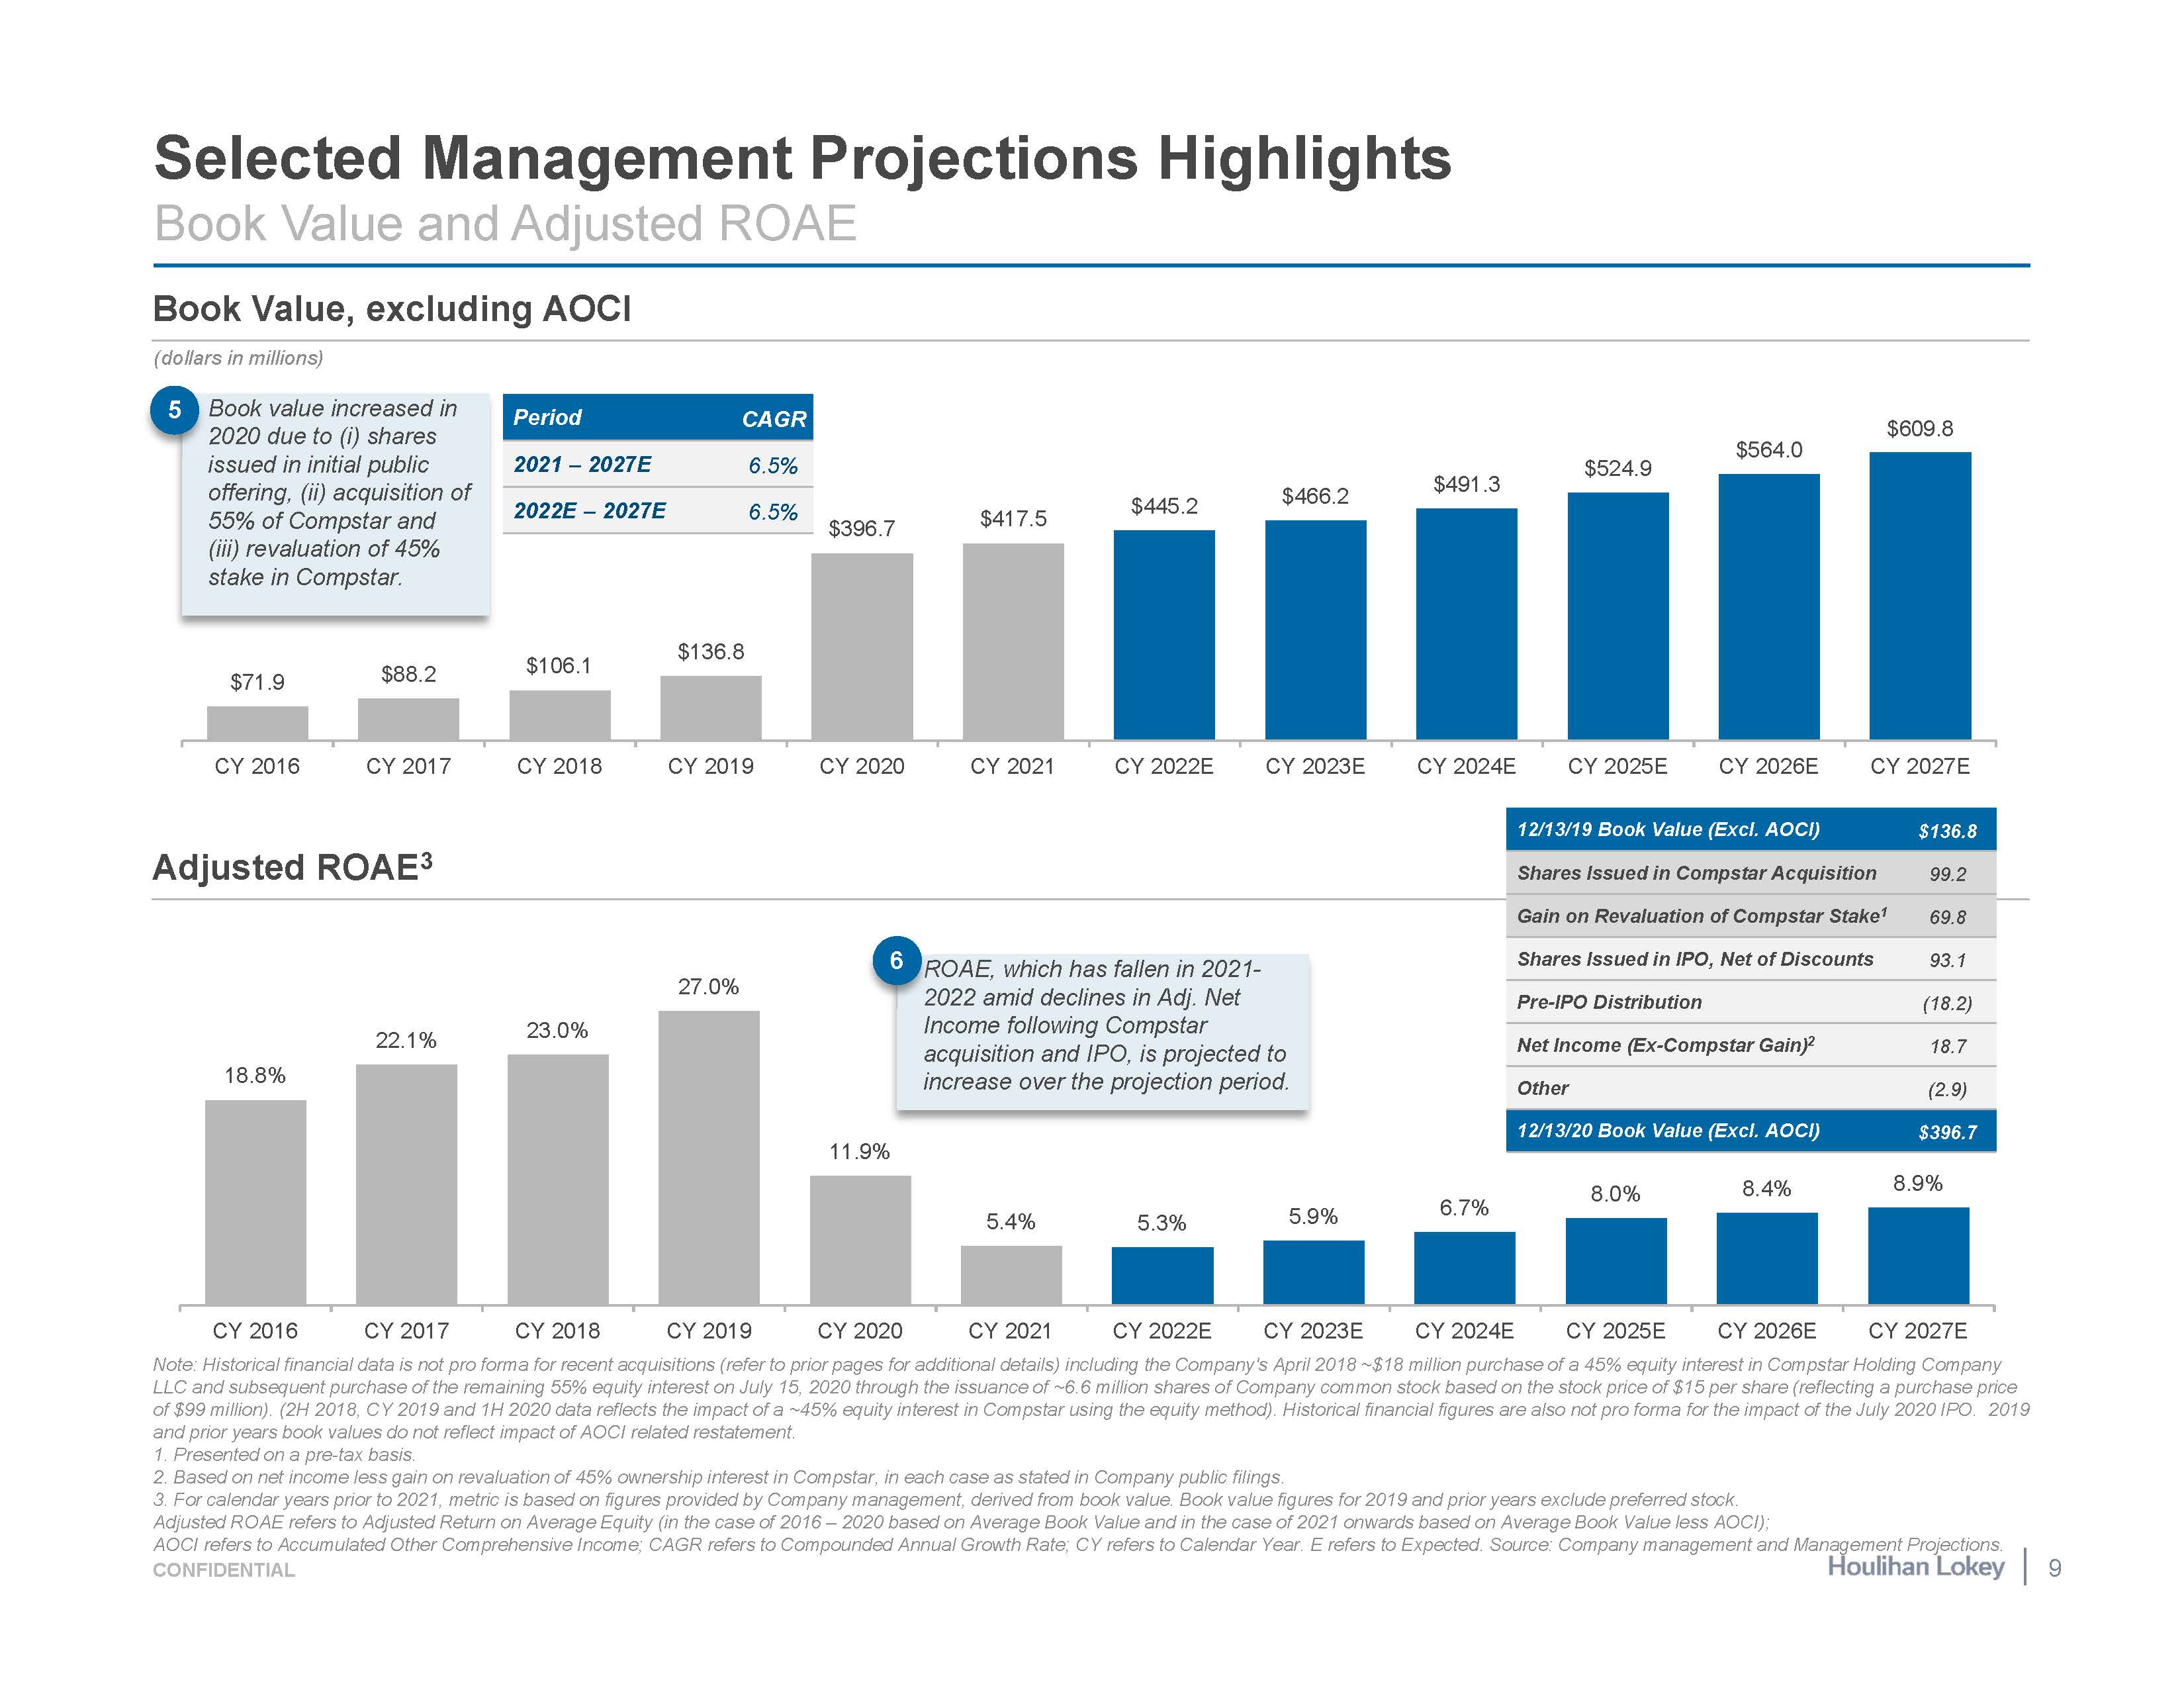
5.4% 5.3% 5.9% 6.7% 8.0% 8.4% 8.9% CY 2016 CY 2017 CY 2018 CY 2019 CY 2020 CY 2021 CY 2022E CY 2023E CY 2024E CY 2025E CY 2026E CY 2027E Note: Historical financial data is not pro forma for recent acquisitions (refer to prior pages for additional details) including the Company's April 2018 ~$18 million purchase of a 45% equity interest in Compstar Holding Company LLC and subsequent purchase of the remaining 55% equity interest on July 15, 2020 through the issuance of ~6.6 million shares of Company common stock based on the stock price of $15 per share (reflecting a purchase price of $99 million). (2H 2018, CY 2019 and 1H 2020 data reflects the impact of a ~45% equity interest in Compstar using the equity method). Historical financial figures are also not pro forma for the impact of the July 2020 IPO. 2019 and prior years book values do not reflect impact of AOCI related restatement. Presented on a pre-tax basis. Based on net income less gain on revaluation of 45% ownership interest in Compstar, in each case as stated in Company public filings. For calendar years prior to 2021, metric is based on figures provided by Company management, derived from book value. Book value figures for 2019 and prior years exclude preferred stock. Adjusted ROAE refers to Adjusted Return on Average Equity (in the case of 2016 – 2020 based on Average Book Value and in the case of 2021 onwards based on Average Book Value less AOCI); $71.9 $88.2 $106.1 $136.8 $396.7 $417.5 $445.2 $466.2 $491.3 $524.9 $564.0 $609.8 CY 2016 CY 2017 CY 2018 CY 2019 CY 2020 CY 2021 CY 2022E CY 2023E CY 2024E CY 2025E CY 2026E CY 2027E Selected Management Projections Highlights Book Value and Adjusted ROAE Book Value, excluding AOCI (dollars in millions) Period CAGR 2021 – 2027E 6.5% 2022E – 2027E 6.5% Book value increased in 2020 due to (i) shares issued in initial public offering, (ii) acquisition of 55% of Compstar and (iii) revaluation of 45% stake in Compstar. 5 R 2 Adjusted ROAE3 12/13/19 Book Value (Excl. AOCI) $136.8 Shares Issued in Compstar Acquisition 99.2 OAE, which has fallen in 2021- 022 amid declines in Adj. Net Income following Compstar acquisition and IPO, is projected to increase over the projection period. Gain on Revaluation of Compstar Stake1 69.8 18.8% 22.1% 23.0% 27.0% 6 Shares Issued in IPO, Net of Discounts 93.1 Pre-IPO Distribution (18.2) Net Income (Ex-Compstar Gain)2 18.7 Other (2.9) 11.9% 12/13/20 Book Value (Excl. AOCI) $396.7 AOCI refers to Accumulated Other Comprehensive Income; CAGR refers to Compounded Annual Growth Rate; CY refers to Calendar Year. E refers to Expected. Source: Company management and Management Projections. CONFIDENTIAL 9
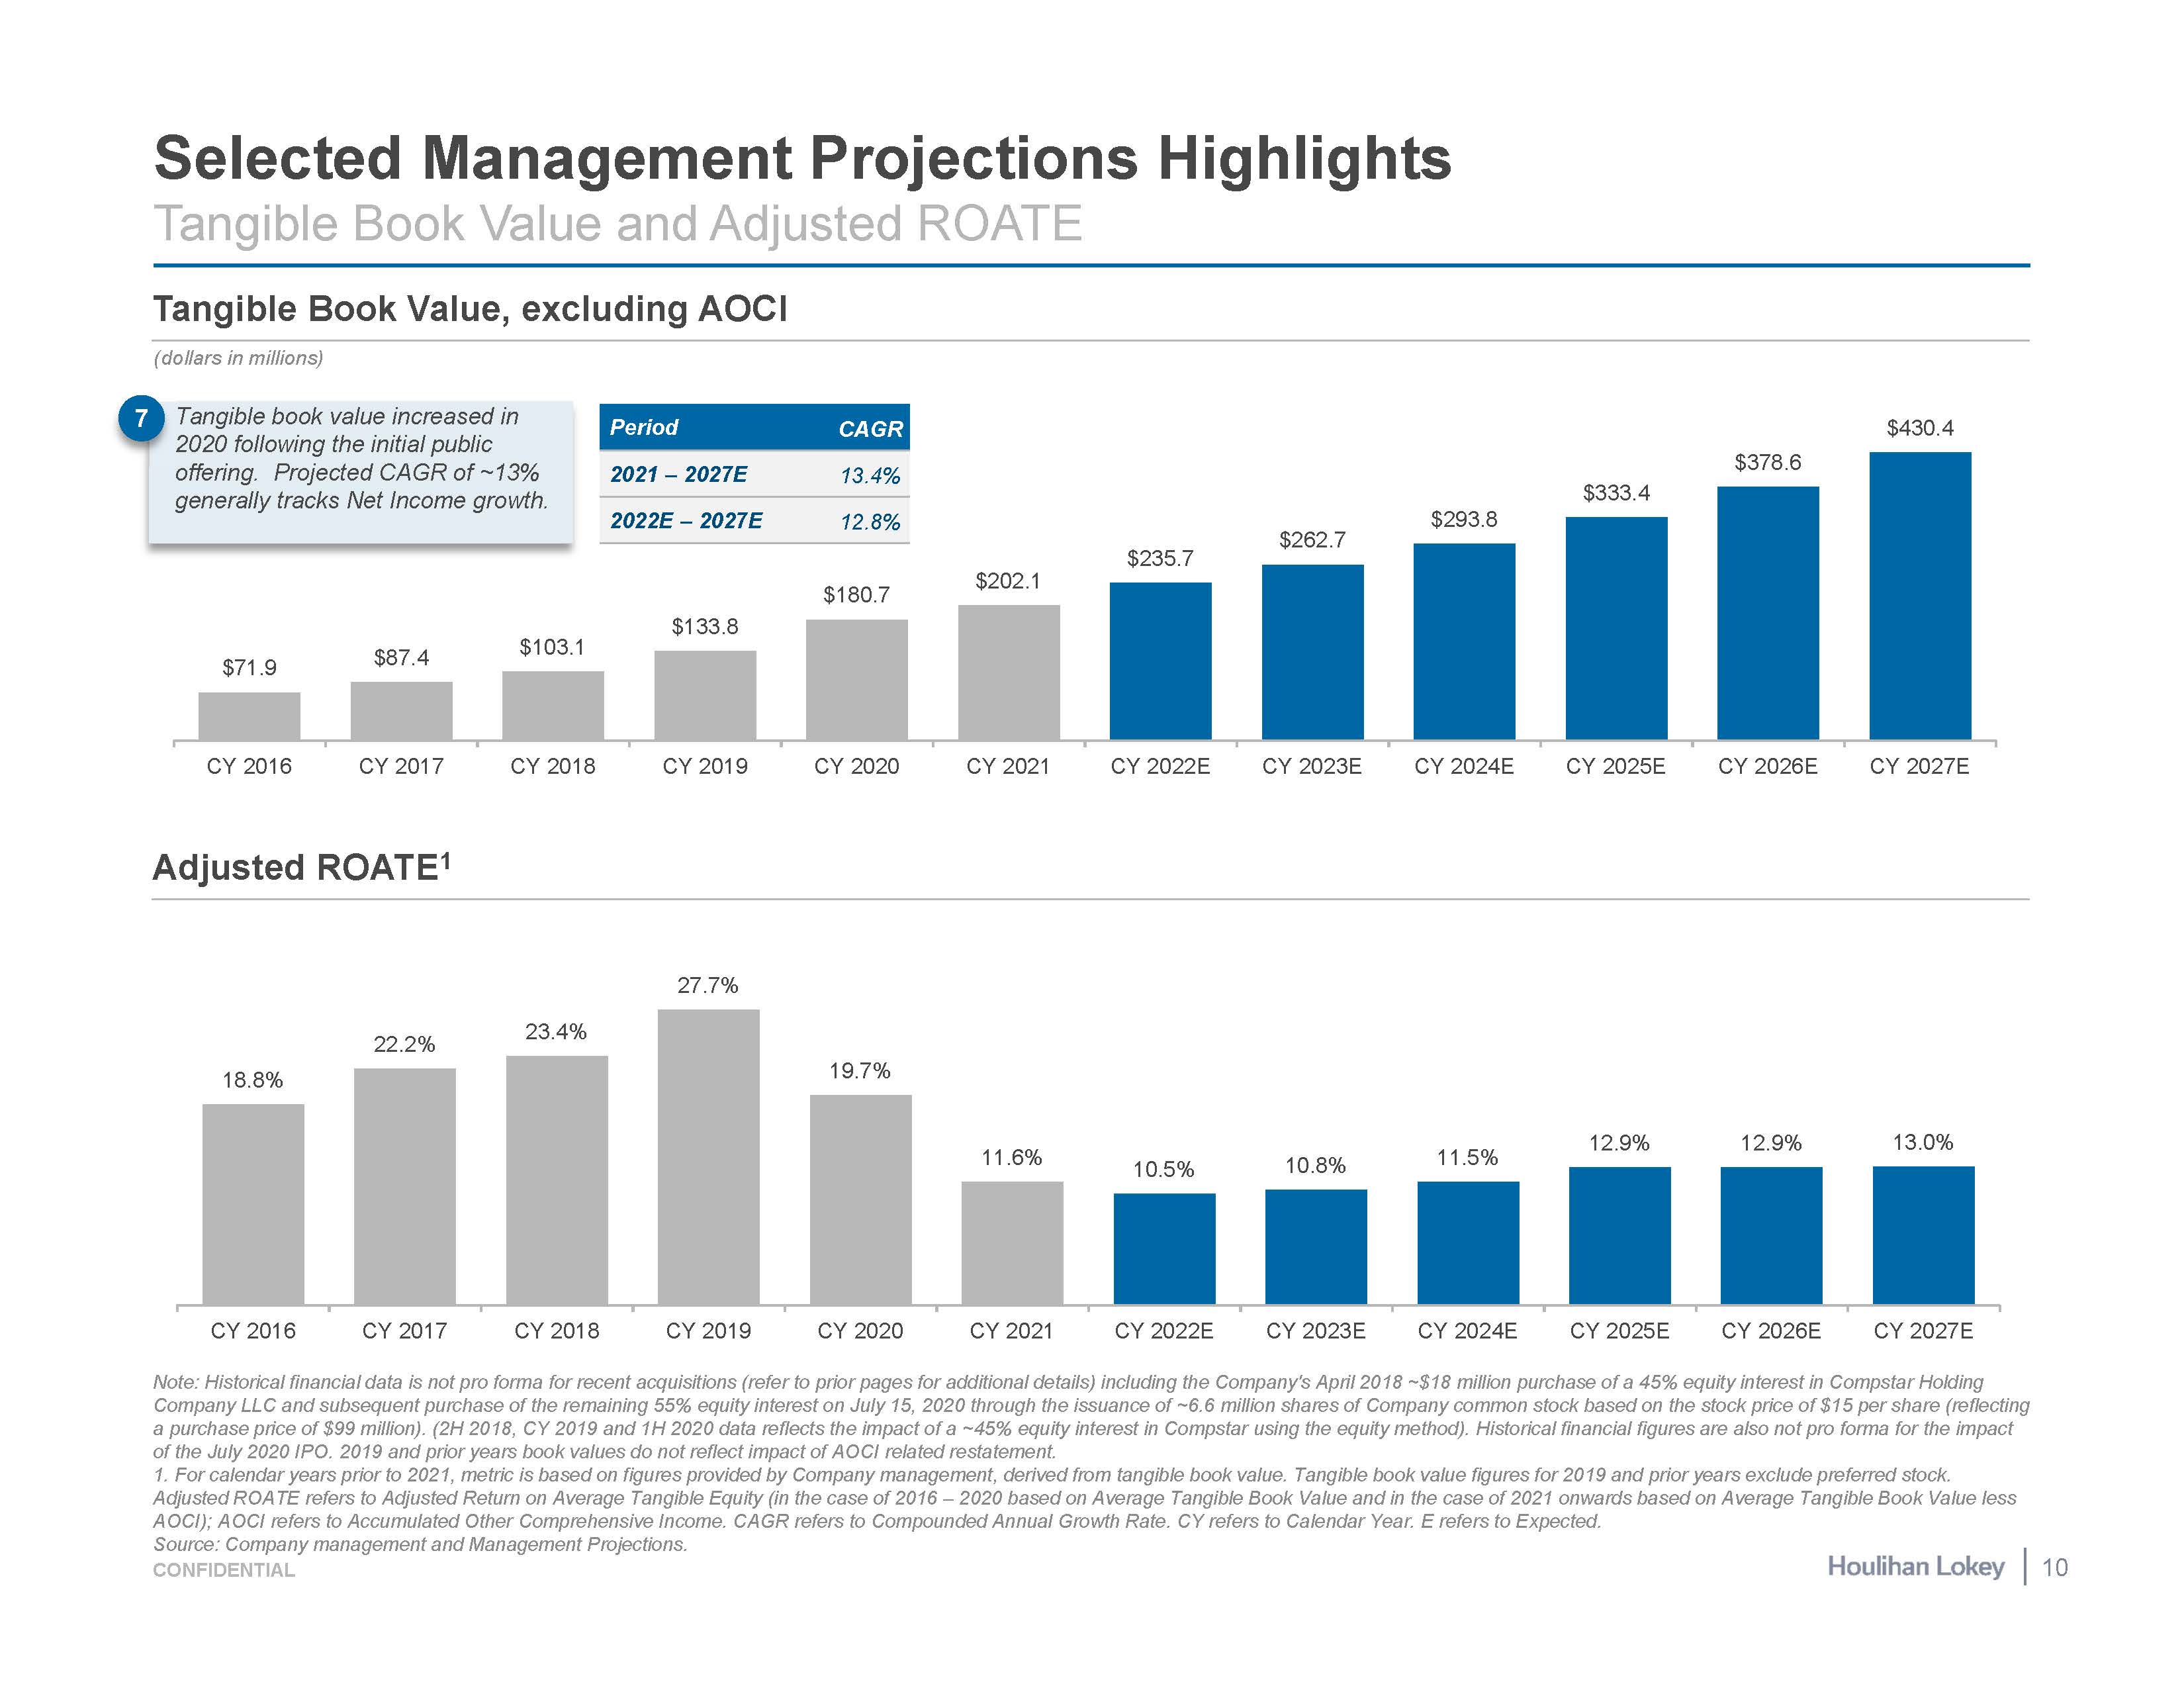
$71.9 $87.4 $103.1 $133.8 $180.7 $202.1 $235.7 $262.7 $293.8 $333.4 $378.6 $430.4 CY 2016 CY 2017 CY 2018 CY 2019 CY 2020 CY 2021 CY 2022E CY 2023E CY 2024E CY 2025E CY 2026E CY 2027E 18.8% 22.2% 23.4% 27.7% 19.7% 11.6% 10.5% 10.8% 11.5% 12.9% 12.9% 13.0% CY 2016 CY 2017 CY 2018 CY 2019 CY 2020 CY 2021 CY 2022E CY 2023E CY 2024E CY 2025E CY 2026E CY 2027E Note: Historical financial data is not pro forma for recent acquisitions (refer to prior pages for additional details) including the Company's April 2018 ~$18 million purchase of a 45% equity interest in Compstar Holding Company LLC and subsequent purchase of the remaining 55% equity interest on July 15, 2020 through the issuance of ~6.6 million shares of Company common stock based on the stock price of $15 per share (reflecting a purchase price of $99 million). (2H 2018, CY 2019 and 1H 2020 data reflects the impact of a ~45% equity interest in Compstar using the equity method). Historical financial figures are also not pro forma for the impact of the July 2020 IPO. 2019 and prior years book values do not reflect impact of AOCI related restatement. 1. For calendar years prior to 2021, metric is based on figures provided by Company management, derived from tangible book value. Tangible book value figures for 2019 and prior years exclude preferred stock. Adjusted ROATE refers to Adjusted Return on Average Tangible Equity (in the case of 2016 – 2020 based on Average Tangible Book Value and in the case of 2021 onwards based on Average Tangible Book Value less AOCI); AOCI refers to Accumulated Other Comprehensive Income. CAGR refers to Compounded Annual Growth Rate. CY refers to Calendar Year. E refers to Expected. Selected Management Projections Highlights Tangible Book Value and Adjusted ROATE Tangible Book Value, excluding AOCI Adjusted ROATE1 (dollars in millions) Period CAGR 2021 – 2027E 13.4% 2022E – 2027E 12.8% Tangible book value increased in 2020 following the initial public offering. Projected CAGR of ~13% generally tracks Net Income growth. 7 Source: Company management and Management Projections. CONFIDENTIAL 10
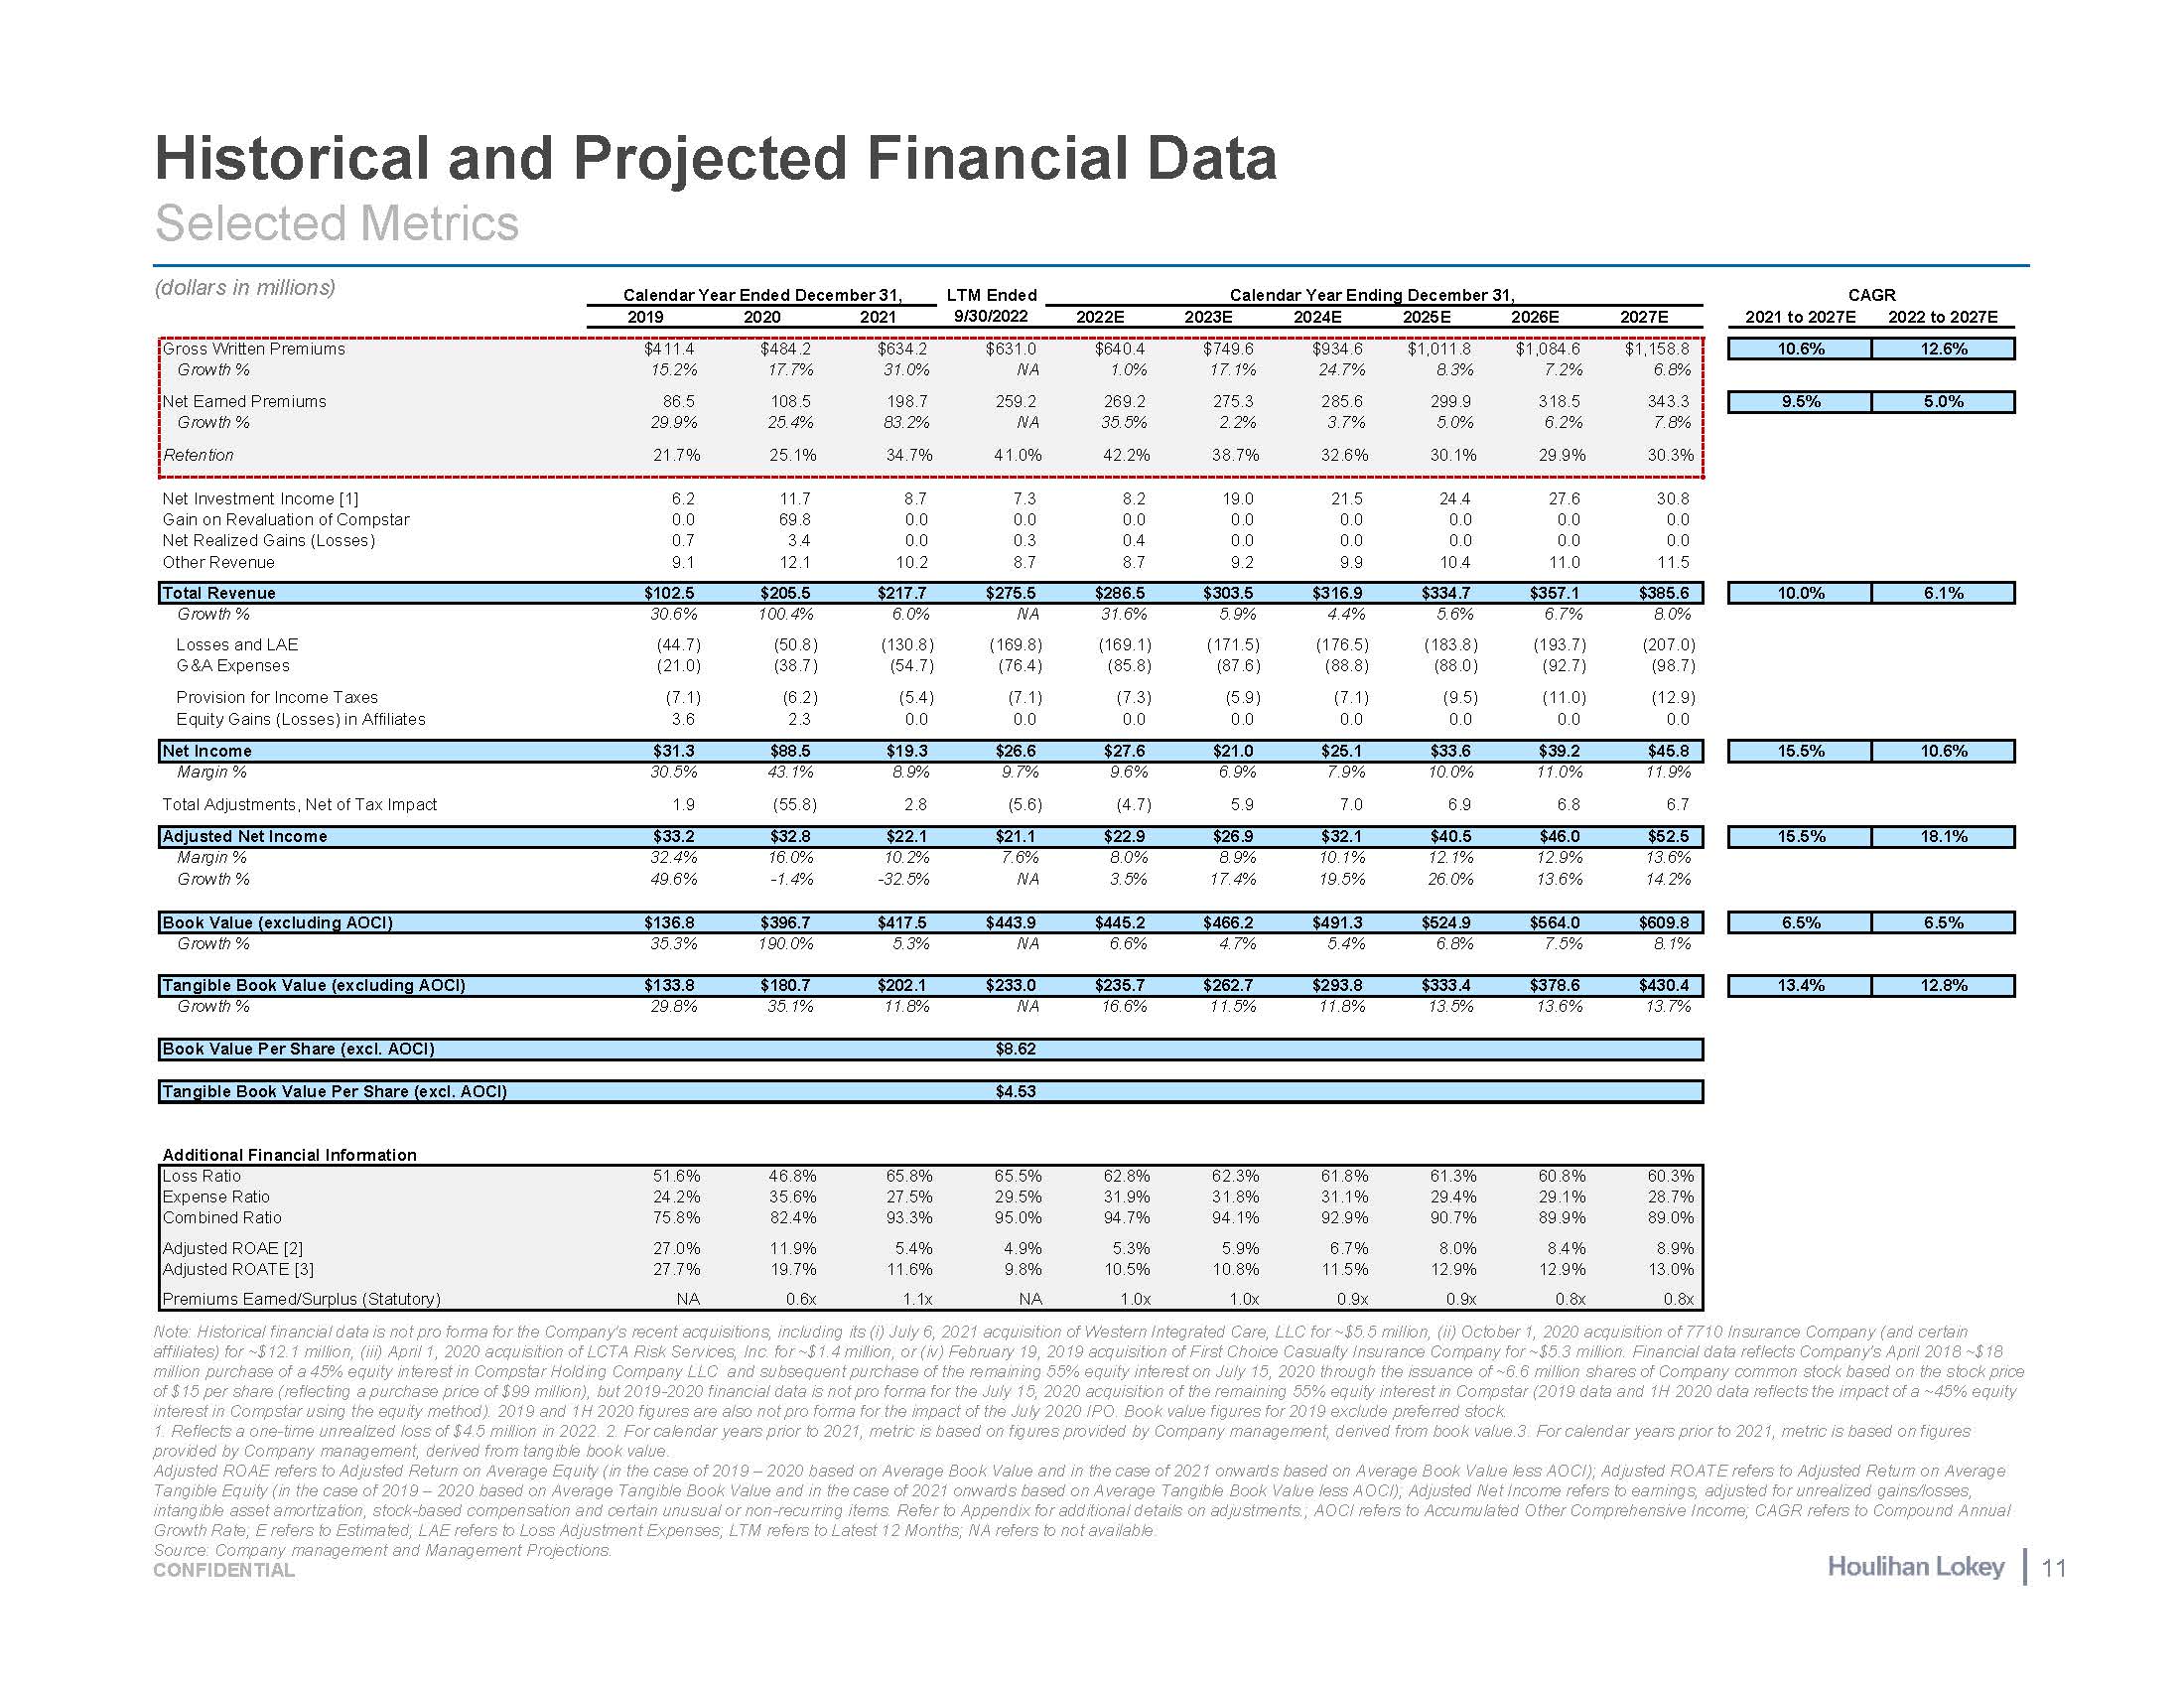
Historical and Projected Financial Data Selected Metrics Note: Historical financial data is not pro forma for the Company's recent acquisitions, including its (i) July 6, 2021 acquisition of Western Integrated Care, LLC for ~$5.5 million, (ii) October 1, 2020 acquisition of 7710 Insurance Company (and certain affiliates) for ~$12.1 million, (iii) April 1, 2020 acquisition of LCTA Risk Services, Inc. for ~$1.4 million, or (iv) February 19, 2019 acquisition of First Choice Casualty Insurance Company for ~$5.3 million. Financial data reflects Company's April 2018 ~$18 million purchase of a 45% equity interest in Compstar Holding Company LLC and subsequent purchase of the remaining 55% equity interest on July 15, 2020 through the issuance of ~6.6 million shares of Company common stock based on the stock price of $15 per share (reflecting a purchase price of $99 million), but 2019-2020 financial data is not pro forma for the July 15, 2020 acquisition of the remaining 55% equity interest in Compstar (2019 data and 1H 2020 data reflects the impact of a ~45% equity interest in Compstar using the equity method). 2019 and 1H 2020 figures are also not pro forma for the impact of the July 2020 IPO. Book value figures for 2019 exclude preferred stock. 1. Reflects a one-time unrealized loss of $4.5 million in 2022. 2. For calendar years prior to 2021, metric is based on figures provided by Company management, derived from book value.3. For calendar years prior to 2021, metric is based on figures provided by Company management, derived from tangible book value. Adjusted ROAE refers to Adjusted Return on Average Equity (in the case of 2019 – 2020 based on Average Book Value and in the case of 2021 onwards based on Average Book Value less AOCI); Adjusted ROATE refers to Adjusted Return on Average Tangible Equity (in the case of 2019 – 2020 based on Average Tangible Book Value and in the case of 2021 onwards based on Average Tangible Book Value less AOCI); Adjusted Net Income refers to earnings, adjusted for unrealized gains/losses, intangible asset amortization, stock-based compensation and certain unusual or non-recurring items. Refer to Appendix for additional details on adjustments.; AOCI refers to Accumulated Other Comprehensive Income; CAGR refers to Compound Annual Growth Rate; E refers to Estimated; LAE refers to Loss Adjustment Expenses; LTM refers to Latest 12 Months; NA refers to not available. (dollars in millions) Calendar Year Ended December 31, LTM Ended Calendar Year Ending December 31, 2019 2020 2021 9/30/2022 2022E 2023E 2024E 2025E 2026E 2027E CAGR 2021 to 2027E 2022 to 2027E Gross Written Premiums $411.4 $484.2 $634.2 $631.0 $640.4 $749.6 $934.6 $1,011.8 $1,084.6 $1,158.8 10.6% 12.6% Growth % 15.2% 17.7% 31.0% NA 1.0% 17.1% 24.7% 8.3% 7.2% 6.8% Net Earned Premiums 86.5 108.5 198.7 259.2 269.2 275.3 285.6 299.9 318.5 343.3 9.5% 5.0% Growth % 29.9% 25.4% 83.2% NA 35.5% 2.2% 3.7% 5.0% 6.2% 7.8% Retention 21.7% 25.1% 34.7% 41.0% 42.2% 38.7% 32.6% 30.1% 29.9% 30.3% Net Investment Income [1] 6.2 11.7 8.7 7.3 8.2 19.0 21.5 24.4 27.6 30.8 Gain on Revaluation of Compstar 0.0 69.8 0.0 0.0 0.0 0.0 0.0 0.0 0.0 0.0 Net Realized Gains (Losses) 0.7 3.4 0.0 0.3 0.4 0.0 0.0 0.0 0.0 0.0 Other Revenue 9.1 12.1 10.2 8.7 8.7 9.2 9.9 10.4 11.0 11.5 Total Revenue $102.5 $205.5 $217.7 $275.5 $286.5 $303.5 $316.9 $334.7 $357.1 $385.6 10.0% 6.1% Growth % 30.6% 100.4% 6.0% NA 31.6% 5.9% 4.4% 5.6% 6.7% 8.0% Losses and LAE (44.7) (50.8) (130.8) (169.8) (169.1) (171.5) (176.5) (183.8) (193.7) (207.0) G&A Expenses (21.0) (38.7) (54.7) (76.4) (85.8) (87.6) (88.8) (88.0) (92.7) (98.7) Provision for Income Taxes (7.1) (6.2) (5.4) (7.1) (7.3) (5.9) (7.1) (9.5) (11.0) (12.9) Equity Gains (Losses) in Affiliates 3.6 2.3 0.0 0.0 0.0 0.0 0.0 0.0 0.0 0.0 Net Income $31.3 $88.5 $19.3 $26.6 $27.6 $21.0 $25.1 $33.6 $39.2 $45.8 15.5% 10.6% Margin % 30.5% 43.1% 8.9% 9.7% 9.6% 6.9% 7.9% 10.0% 11.0% 11.9% Total Adjustments, Net of Tax Impact 1.9 (55.8) 2.8 (5.6) (4.7) 5.9 7.0 6.9 6.8 6.7 Adjusted Net Income $33.2 $32.8 $22.1 $21.1 $22.9 $26.9 $32.1 $40.5 $46.0 $52.5 15.5% 18.1% Margin % 32.4% 16.0% 10.2% 7.6% 8.0% 8.9% 10.1% 12.1% 12.9% 13.6% Growth % 49.6% -1.4% -32.5% NA 3.5% 17.4% 19.5% 26.0% 13.6% 14.2% Book Value (excluding AOCI) $136.8 $396.7 $417.5 $443.9 $445.2 $466.2 $491.3 $524.9 $564.0 $609.8 6.5% 6.5% Growth % 35.3% 190.0% 5.3% NA 6.6% 4.7% 5.4% 6.8% 7.5% 8.1% Tangible Book Value (excluding AOCI) $133.8 $180.7 $202.1 $233.0 $235.7 $262.7 $293.8 $333.4 $378.6 $430.4 13.4% 12.8% Growth % 29.8% 35.1% 11.8% NA 16.6% 11.5% 11.8% 13.5% 13.6% 13.7% Book Value Per Share (excl. AOCI) $8.62 Tangible Book Value Per Share (excl. AOCI) $4.53 Additional Financial Information Loss Ratio 51.6% 46.8% 65.8% 65.5% 62.8% 62.3% 61.8% 61.3% 60.8% 60.3% Expense Ratio 24.2% 35.6% 27.5% 29.5% 31.9% 31.8% 31.1% 29.4% 29.1% 28.7% Combined Ratio 75.8% 82.4% 93.3% 95.0% 94.7% 94.1% 92.9% 90.7% 89.9% 89.0% Adjusted ROAE [2] 27.0% 11.9% 5.4% 4.9% 5.3% 5.9% 6.7% 8.0% 8.4% 8.9% Adjusted ROATE [3] 27.7% 19.7% 11.6% 9.8% 10.5% 10.8% 11.5% 12.9% 12.9% 13.0% Premiums Earned/Surplus (Statutory) NA 0.6x 1.1x NA 1.0x 1.0x 0.9x 0.9x 0.8x 0.8x Source: Company management and Management Projections. CONFIDENTIAL 11
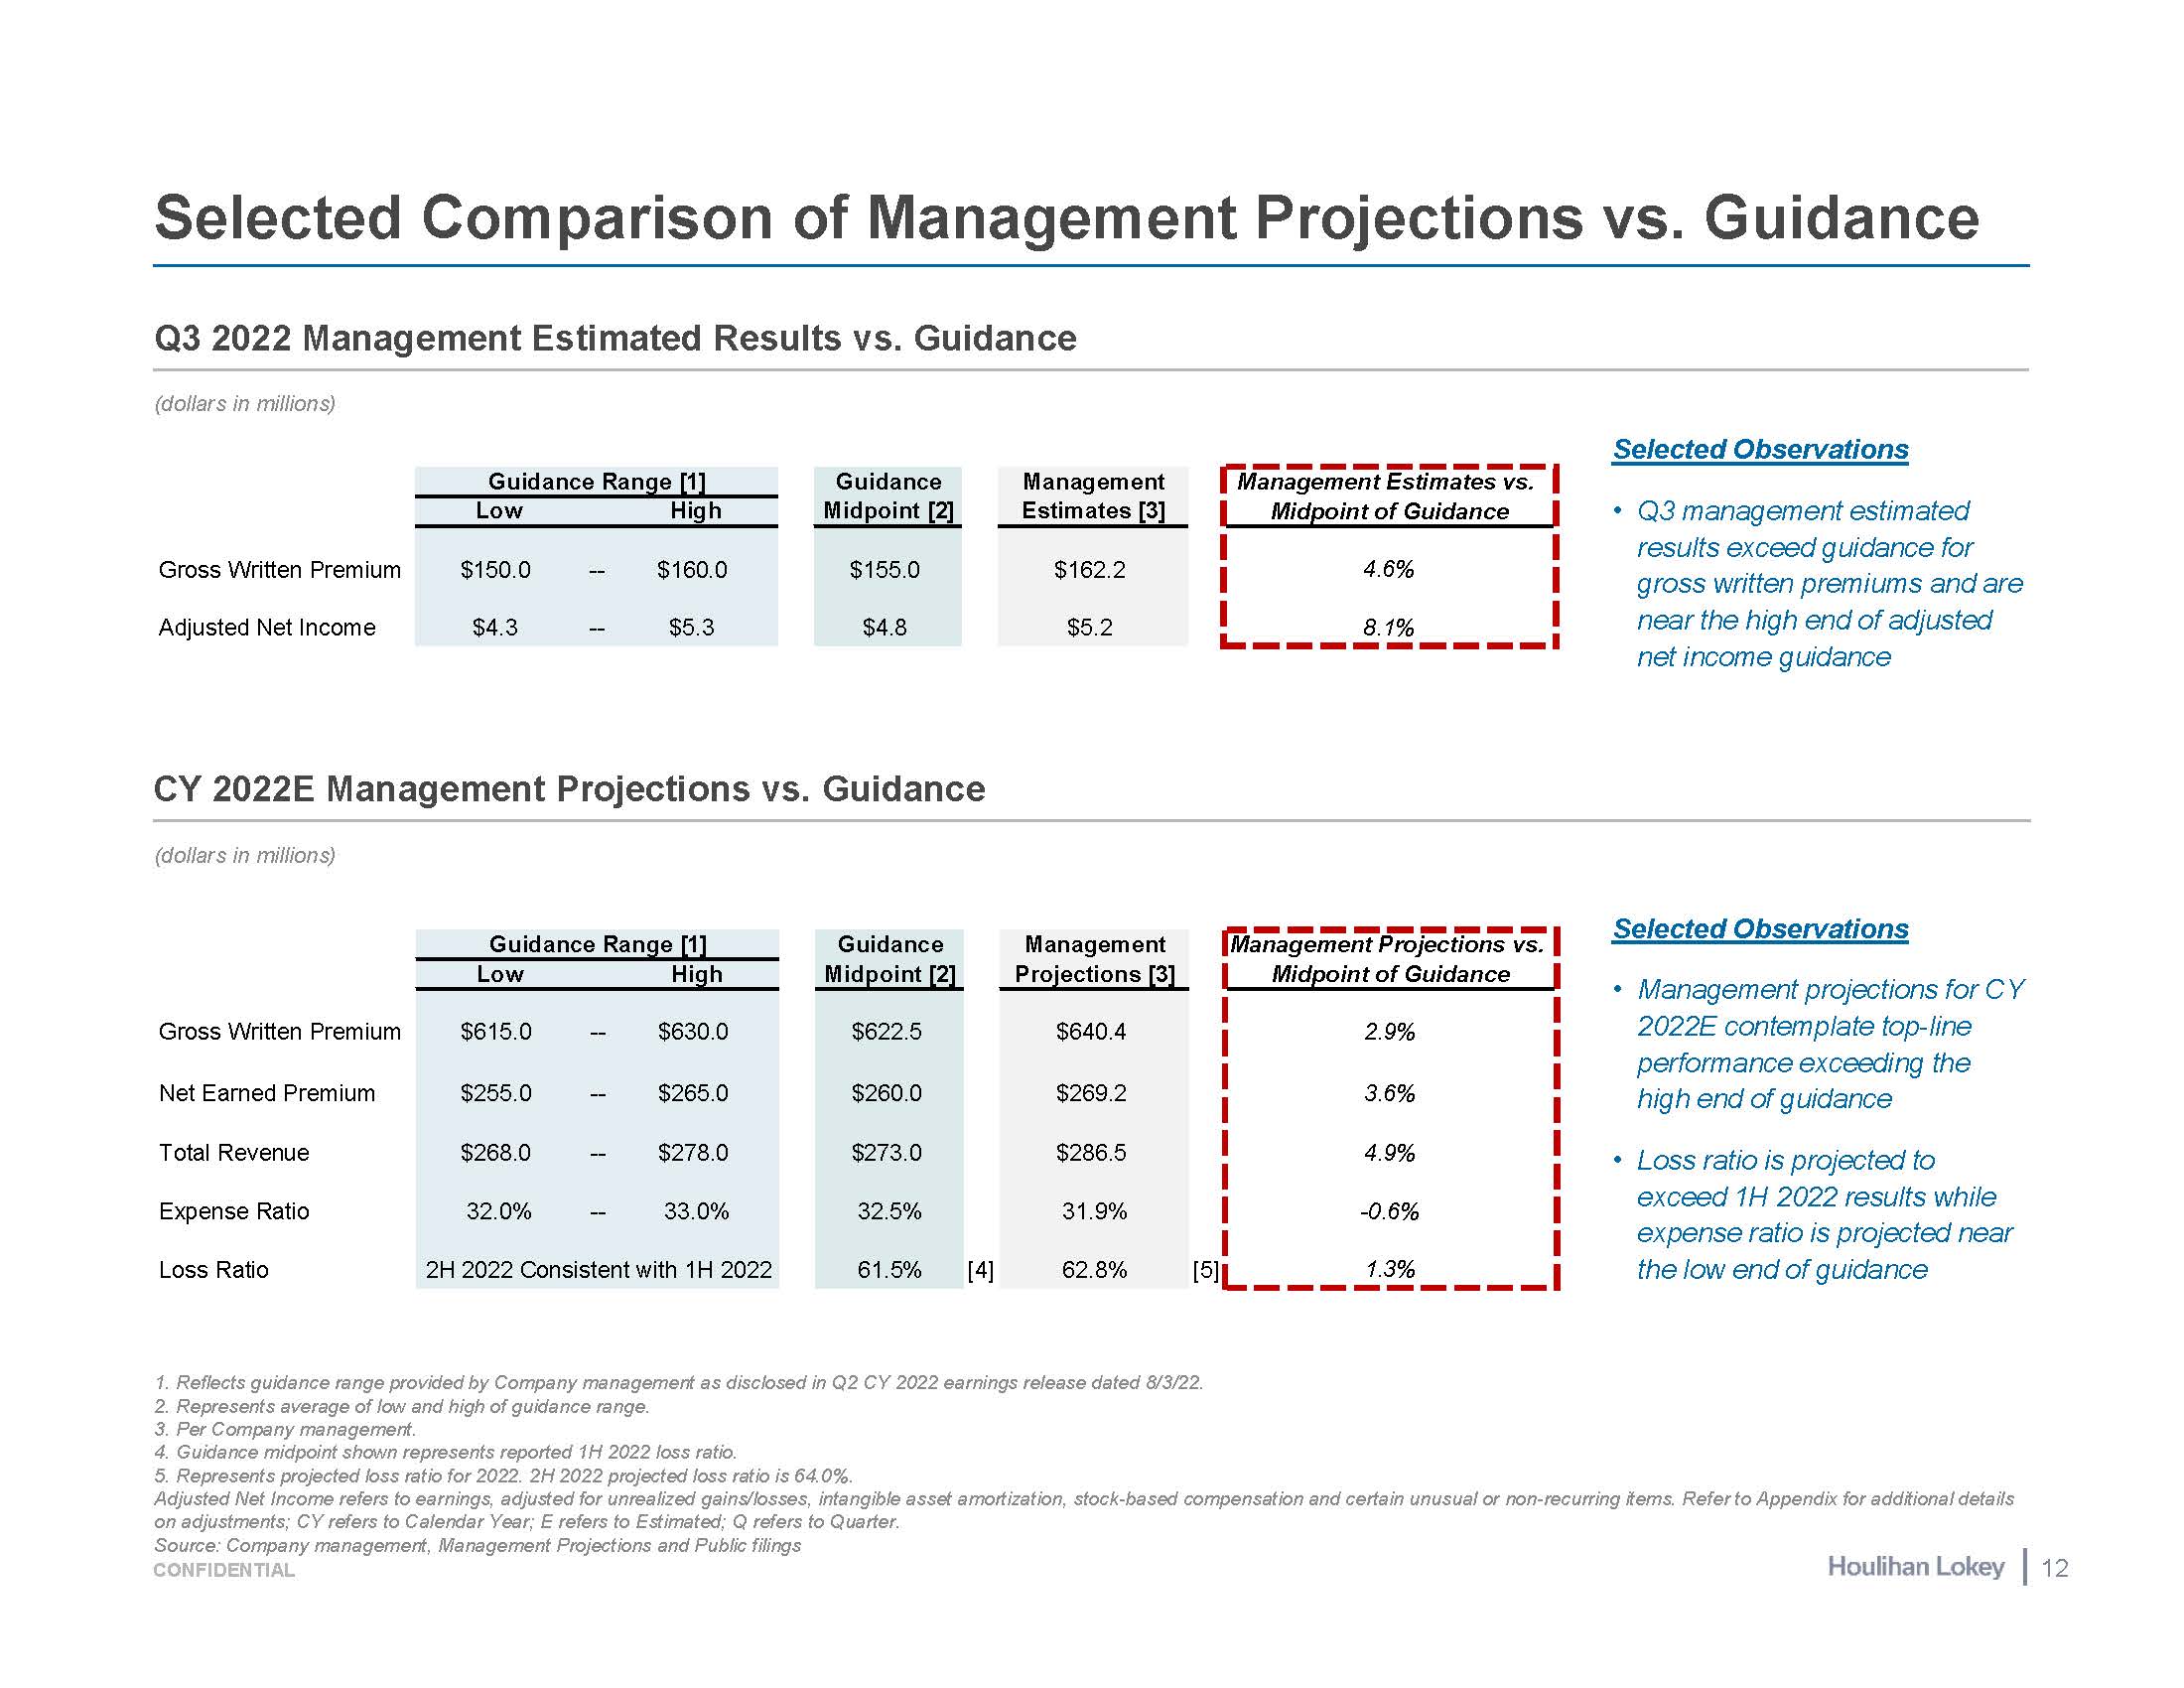
Selected Comparison of Management Projections vs. Guidance Selected Observations Q3 management estimated results exceed guidance for gross written premiums and are near the high end of adjusted net income guidance Reflects guidance range provided by Company management as disclosed in Q2 CY 2022 earnings release dated 8/3/22. Represents average of low and high of guidance range. Per Company management. Guidance midpoint shown represents reported 1H 2022 loss ratio. Represents projected loss ratio for 2022. 2H 2022 projected loss ratio is 64.0%. Adjusted Net Income refers to earnings, adjusted for unrealized gains/losses, intangible asset amortization, stock-based compensation and certain unusual or non-recurring items. Refer to Appendix for additional details on adjustments; CY refers to Calendar Year; E refers to Estimated; Q refers to Quarter. (dollars in millions) Q3 2022 Management Estimated Results vs. Guidance CY 2022E Management Projections vs. Guidance (dollars in millions) Selected Observations Management projections for CY 2022E contemplate top-line performance exceeding the high end of guidance Loss ratio is projected to exceed 1H 2022 results while expense ratio is projected near the low end of guidance Guidance Range [1] Low High $615.0 -- $630.0 $255.0 -- $265.0 $268.0 -- $278.0 32.0% -- 33.0% 2H 2022 Consistent with 1H 2022 Guidance Midpoint [2] $622.5 $260.0 $273.0 32.5% 61.5% Management Projections [3] $640.4 $269.2 $286.5 31.9% 62.8% Management Projections vs. Midpoint of Guidance Gross Written Premium 2.9% 3.6% 4.9% -0.6% 1.3% Net Earned Premium Total Revenue Expense Ratio Loss Ratio [4] [5] Guidance Range [1] Low High $150.0 -- $160.0 $4.3 -- $5.3 Guidance Midpoint [2] $155.0 $4.8 Management Estimates [3] $162.2 $5.2 Management Estimates vs. Midpoint of Guidance Gross Written Premium 4.6% 8.1% Adjusted Net Income Source: Company management, Management Projections and Public filings CONFIDENTIAL 12
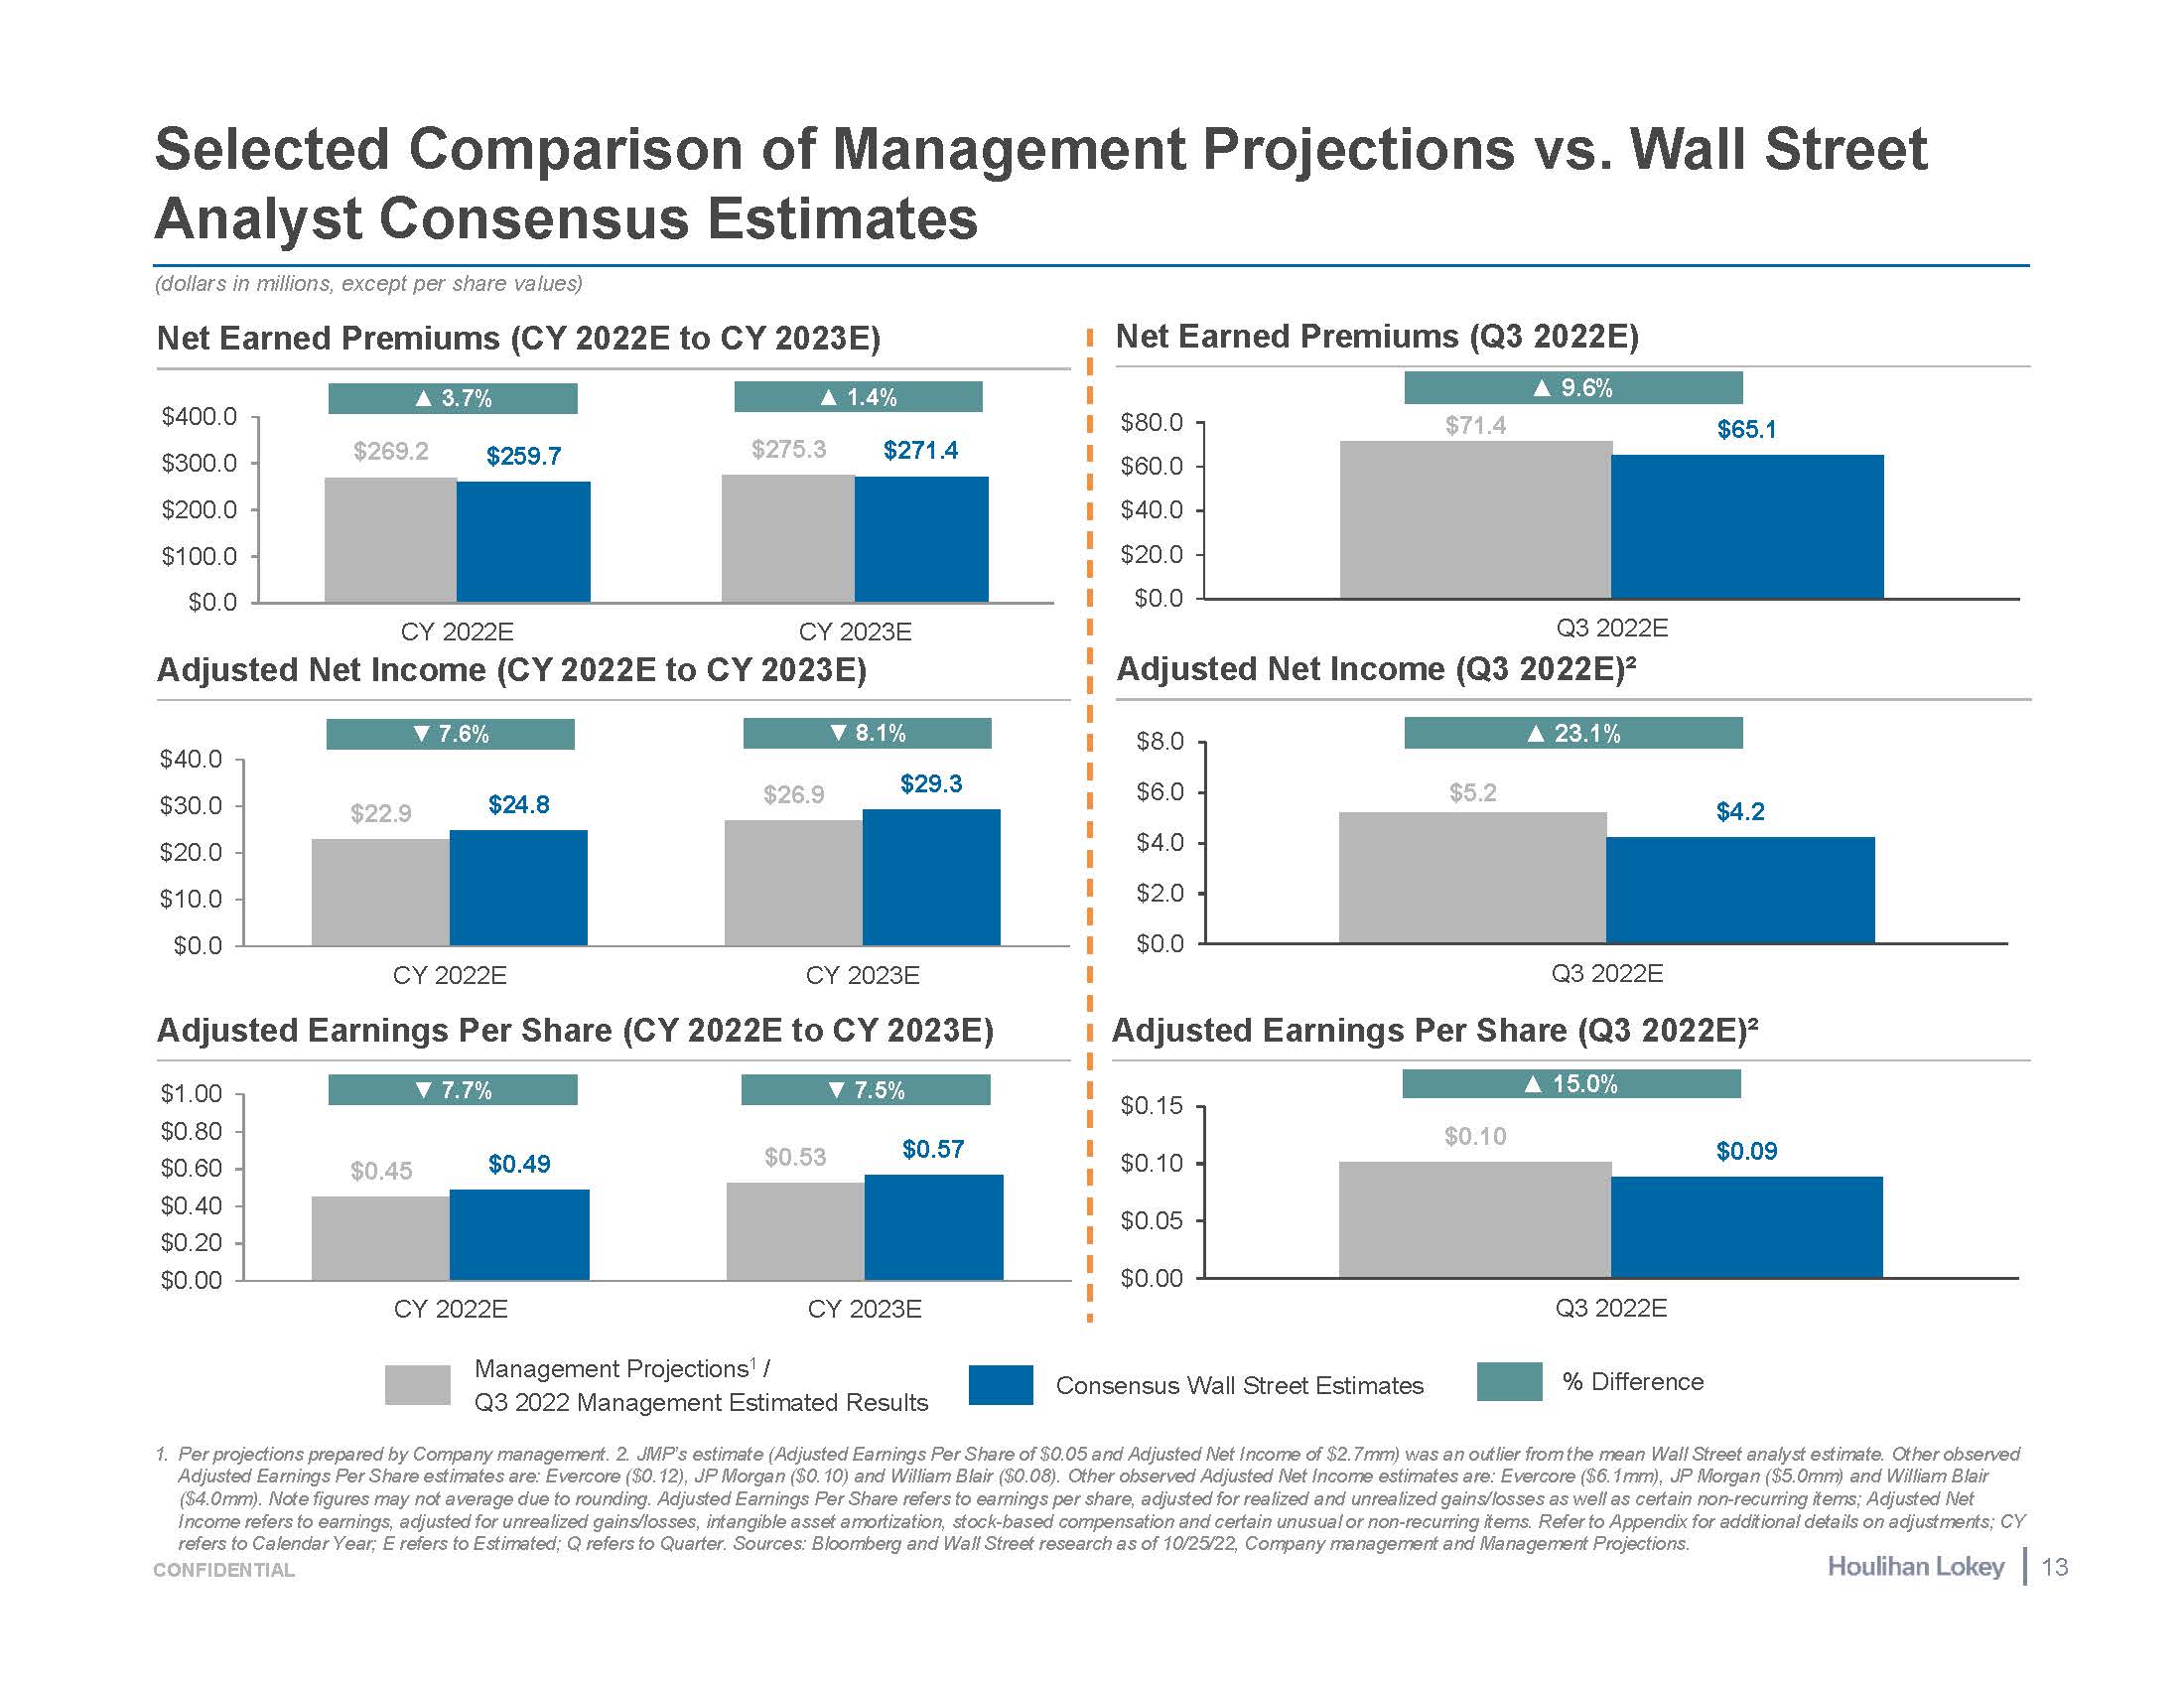
$0.45 $0.53 $0.49 $0.57 $1.00 $0.80 $0.60 $0.40 $0.20 $0.00 $22.9 $26.9 $24.8 $29.3 $40.0 $30.0 $20.0 $10.0 $0.0 CY 2022E CY 2023E $269.2 $259.7 $275.3 $271.4 $400.0 $300.0 $200.0 $100.0 $0.0 CY 2022E CY 2023E Selected Comparison of Management Projections vs. Wall Street Analyst Consensus Estimates Net Earned Premiums (CY 2022E to CY 2023E) Adjusted Net Income (CY 2022E to CY 2023E) (dollars in millions, except per share values) Adjusted Earnings Per Share (CY 2022E to CY 2023E) ▲ 3.7% ▲ 1.4% ▼ 7.6% ▼ 8.1% ▼ 7.7% ▼ 7.5% CY 2022E CY 2023E Management Projections1 / Q3 2022 Management Estimated Results Consensus Wall Street Estimates % Difference Net Earned Premiums (Q3 2022E) Adjusted Net Income (Q3 2022E)² Adjusted Earnings Per Share (Q3 2022E)² $71.4 $65.1 $80.0 $60.0 $40.0 $20.0 $0.0 Q3 2022E ▲ 9.6% $5.2 $4.2 $8.0 $6.0 $4.0 $2.0 $0.0 Q3 2022E ▲ 23.1% $0.10 refers to Calendar Year; E refers to Estimated; Q refers to Quarter. Sources: Bloomberg and Wall Street research as of 10/25/22, Company management and Management Projections. CONFIDENTIAL 13 $0.09 $0.00 $0.05 $0.10 $0.15 Q3 2022E ▲ 15.0% 1. Per projections prepared by Company management. 2. JMP’s estimate (Adjusted Earnings Per Share of $0.05 and Adjusted Net Income of $2.7mm) was an outlier from the mean Wall Street analyst estimate. Other observed Adjusted Earnings Per Share estimates are: Evercore ($0.12), JP Morgan ($0.10) and William Blair ($0.08). Other observed Adjusted Net Income estimates are: Evercore ($6.1mm), JP Morgan ($5.0mm) and William Blair ($4.0mm). Note figures may not average due to rounding. Adjusted Earnings Per Share refers to earnings per share, adjusted for realized and unrealized gains/losses as well as certain non-recurring items; Adjusted Net Income refers to earnings, adjusted for unrealized gains/losses, intangible asset amortization, stock-based compensation and certain unusual or non-recurring items. Refer to Appendix for additional details on adjustments; CY
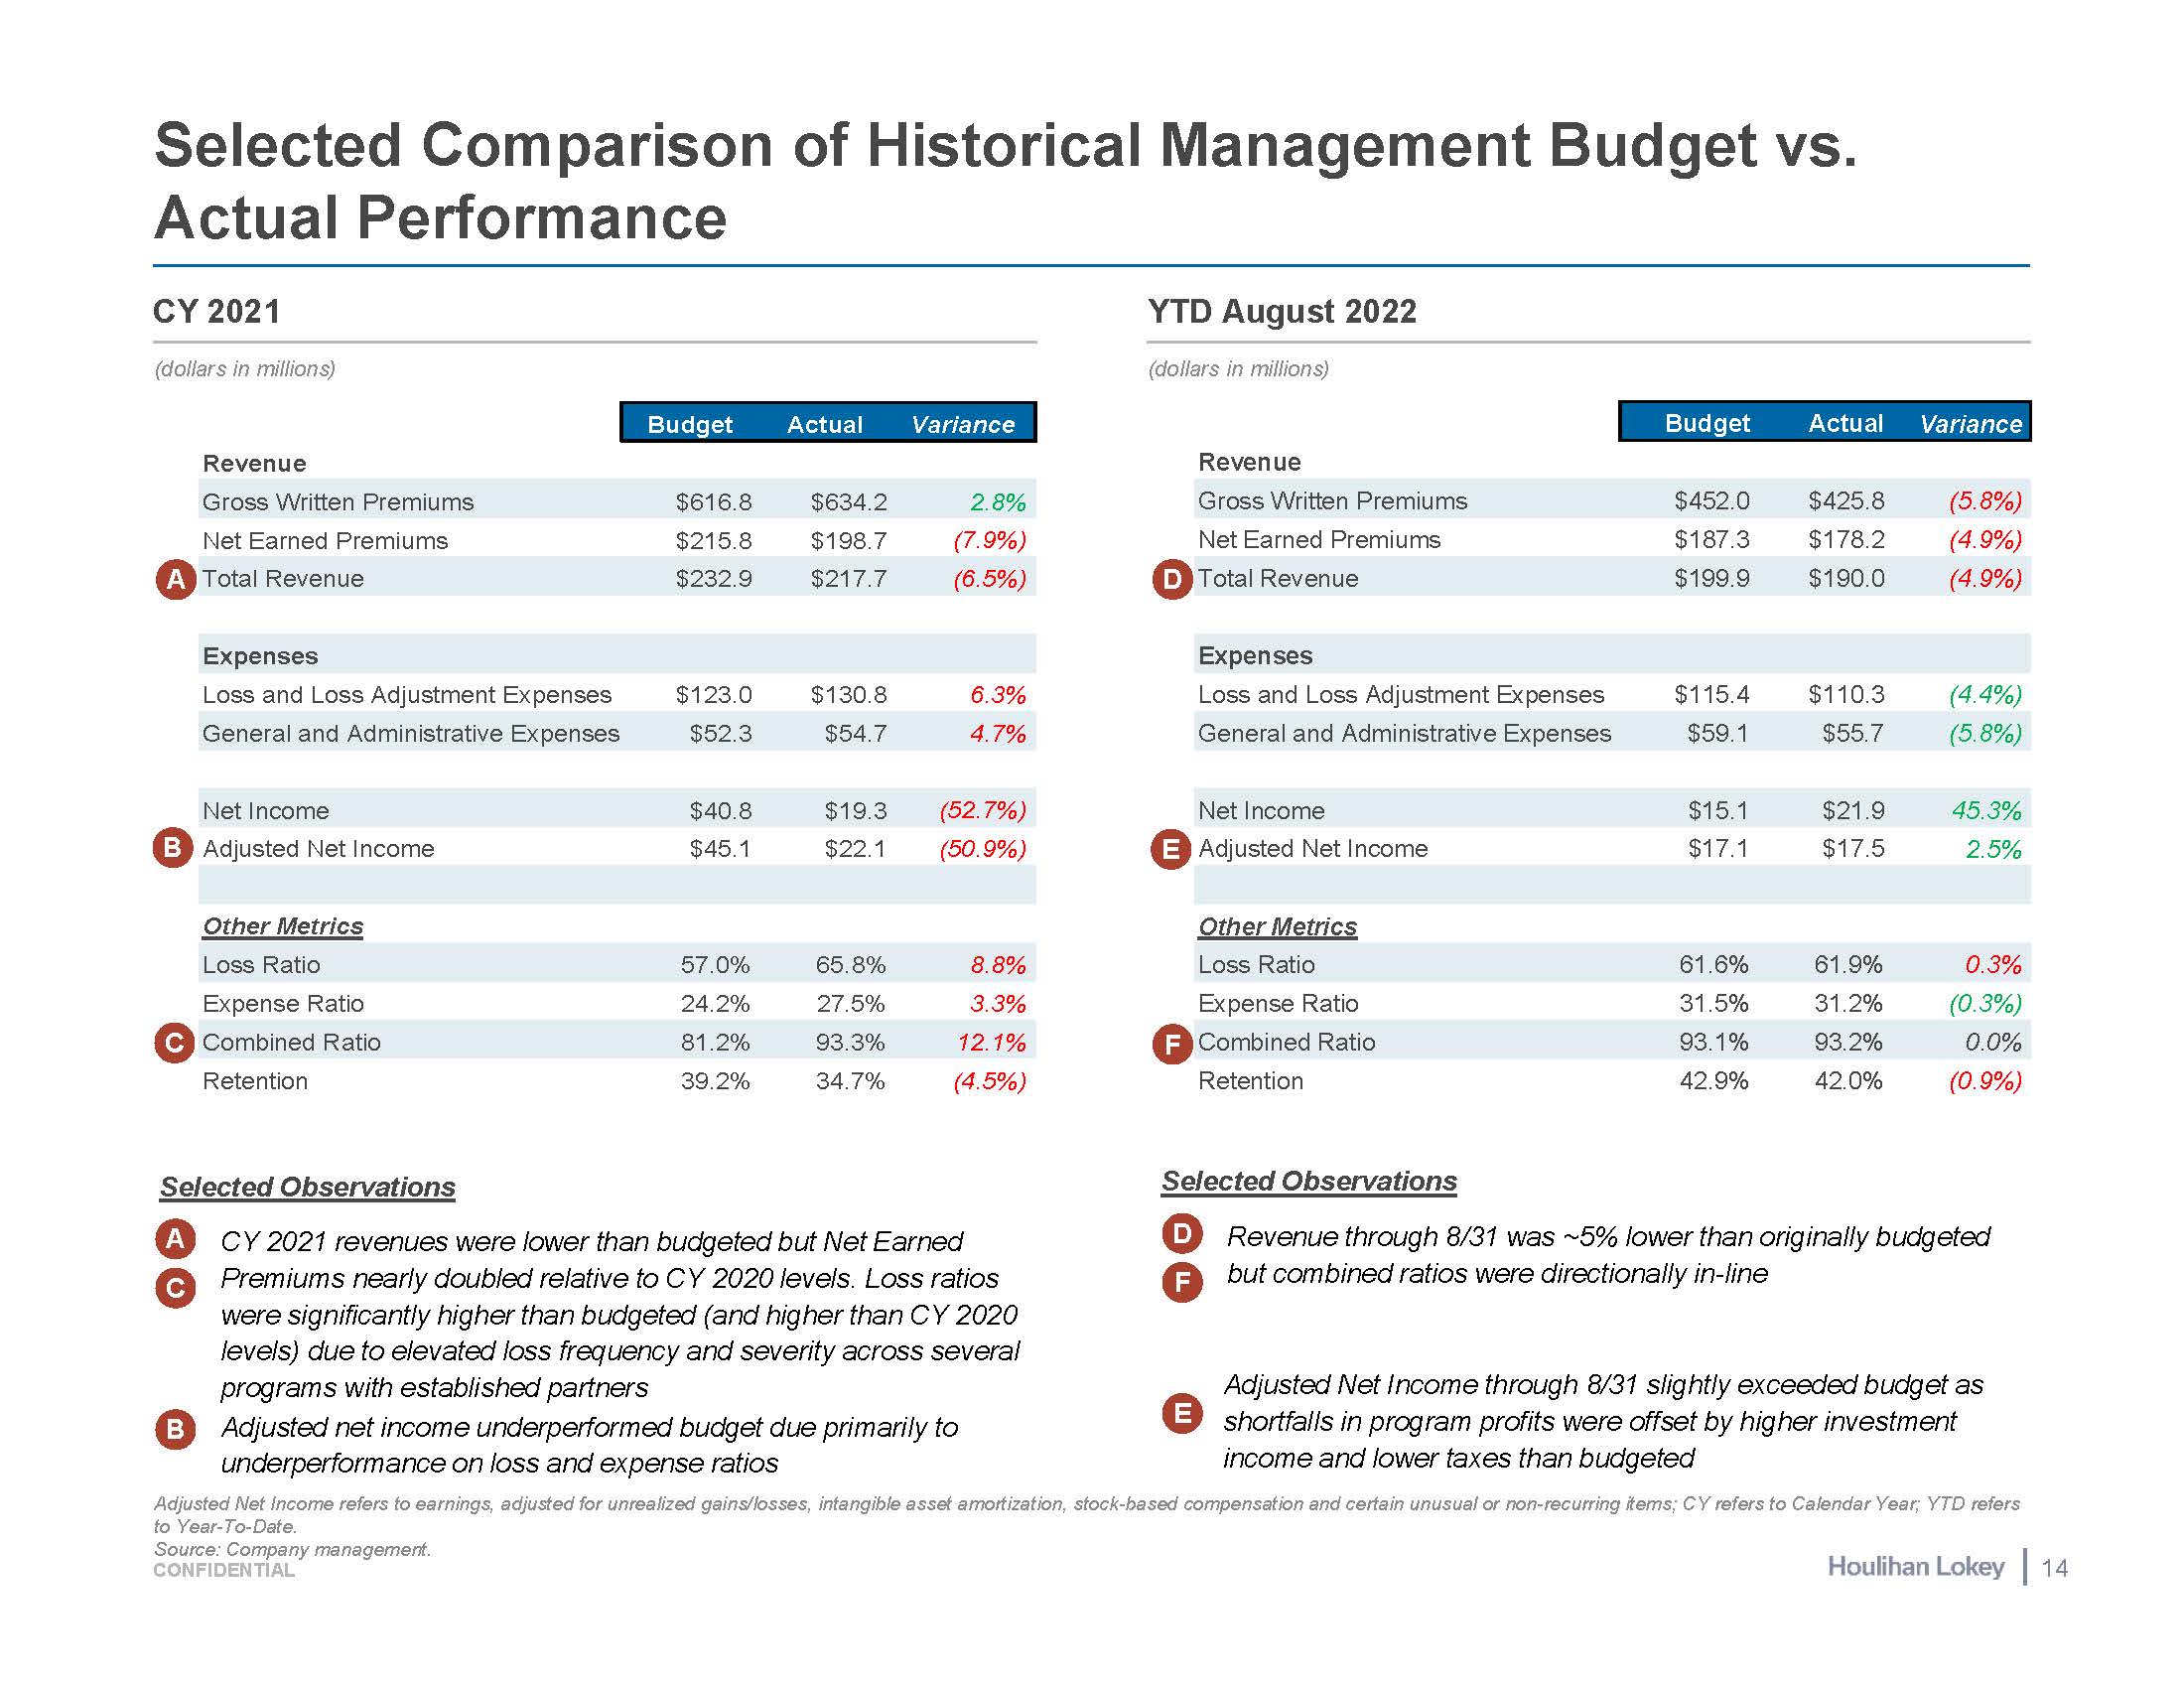
Selected Comparison of Historical Management Budget vs. Actual Performance Selected Observations Adjusted Net Income refers to earnings, adjusted for unrealized gains/losses, intangible asset amortization, stock-based compensation and certain unusual or non-recurring items; CY refers to Calendar Year; YTD refers to Year-To-Date. CY 2021 YTD August 2022 (dollars in millions) (dollars in millions) Selected Observations A B Adjusted Net Income $45.1 $22.1 (50.9%) C D E Adjusted Net Income F Revenue through 8/31 was ~5% lower than originally budgeted but combined ratios were directionally in-line D F E Adjusted Net Income through 8/31 slightly exceeded budget as shortfalls in program profits were offset by higher investment income and lower taxes than budgeted A C B Source: Company management. CONFIDENTIAL 14 CY 2021 revenues were lower than budgeted but Net Earned Premiums nearly doubled relative to CY 2020 levels. Loss ratios were significantly higher than budgeted (and higher than CY 2020 levels) due to elevated loss frequency and severity across several programs with established partners Adjusted net income underperformed budget due primarily to underperformance on loss and expense ratios Budget Actual Variance Revenue Gross Written Premiums $452.0 $425.8 (5.8%) Net Earned Premiums $187.3 $178.2 (4.9%) Total Revenue $199.9 $190.0 (4.9%) Expenses Loss and Loss Adjustment Expenses $115.4 $110.3 (4.4%) General and Administrative Expenses $59.1 $55.7 (5.8%) Net Income $15.1 $21.9 45.3% $17.1 $17.5 2.5% Other Metrics Loss Ratio 61.6% 61.9% 0.3% Expense Ratio 31.5% 31.2% (0.3%) Combined Ratio 93.1% 93.2% 0.0% Retention 42.9% 42.0% (0.9%) Budget Actual Variance Revenue Gross Written Premiums $616.8 $634.2 2.8% Net Earned Premiums $215.8 $198.7 (7.9%) Total Revenue $232.9 $217.7 (6.5%) Expenses Loss and Loss Adjustment Expenses $123.0 $130.8 6.3% General and Administrative Expenses $52.3 $54.7 4.7% Net Income $40.8 $19.3 (52.7%) Other Metrics Loss Ratio 57.0% 65.8% 8.8% Expense Ratio 24.2% 27.5% 3.3% Combined Ratio 81.2% 93.3% 12.1% Retention 39.2% 34.7% (4.5%)
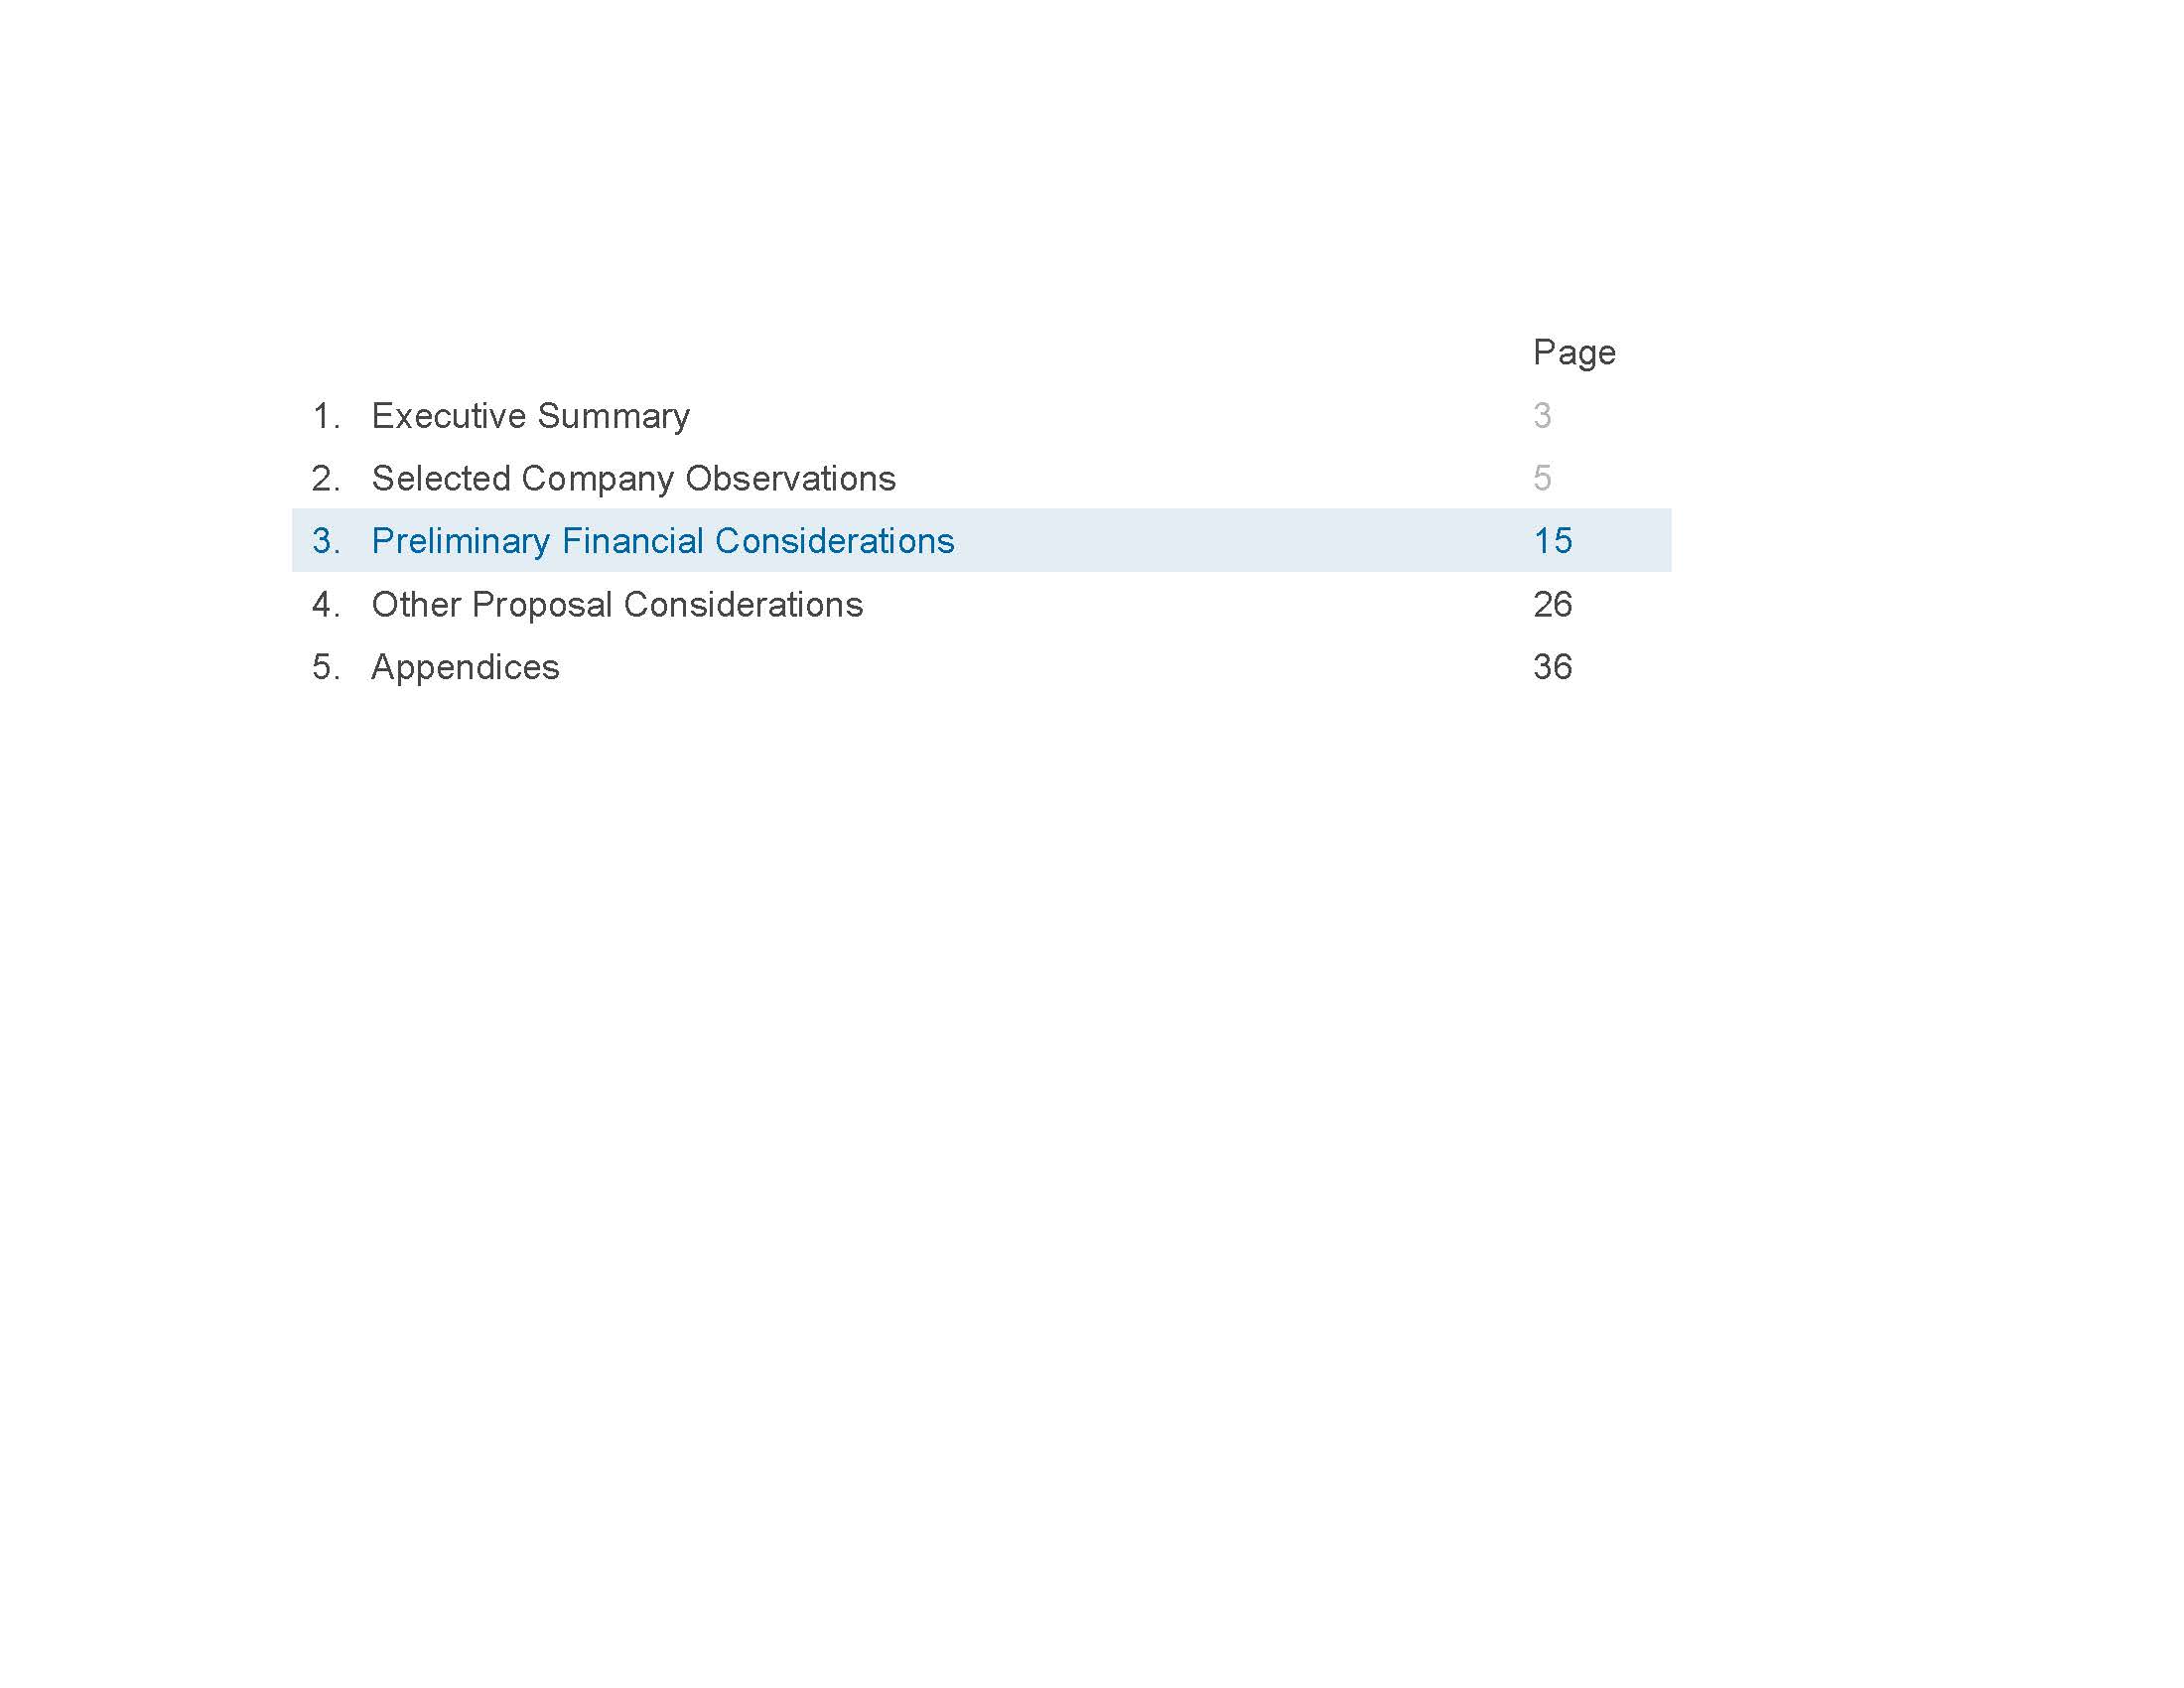
Page 3 5 Executive Summary Selected Company Observations 3. Preliminary Financial Considerations 15 Other Proposal Considerations Appendices 26 36
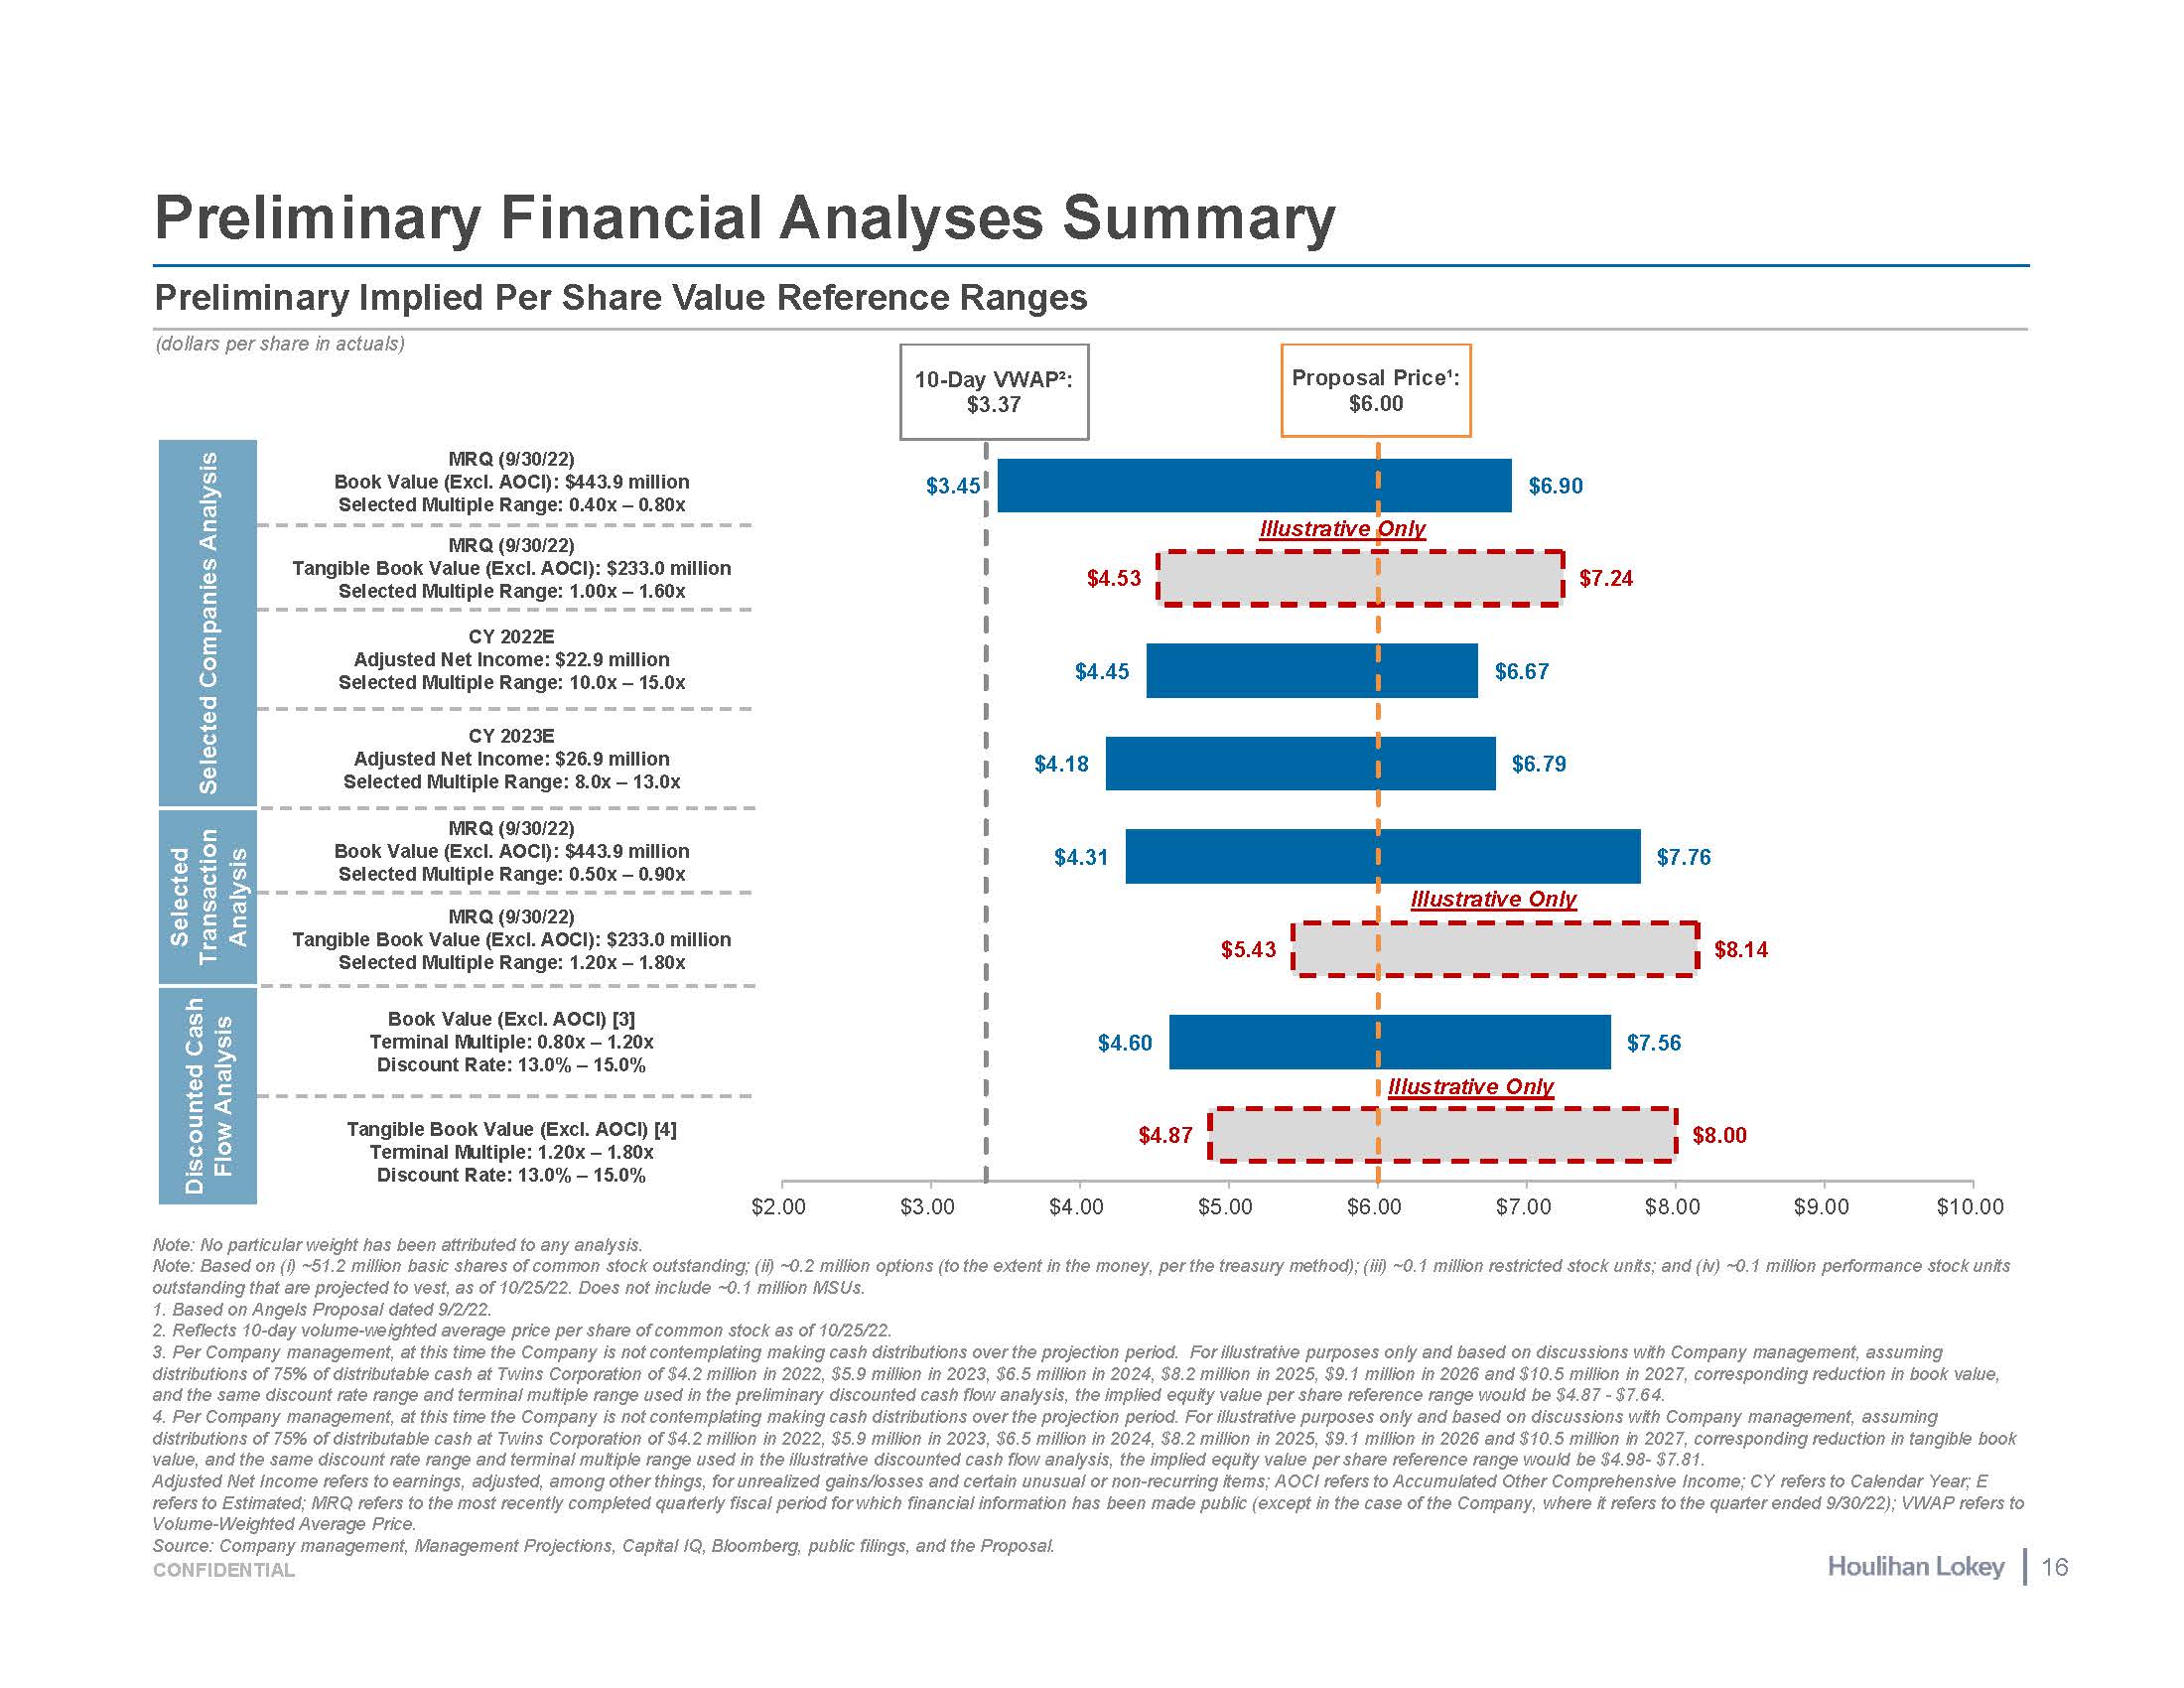
Flow Analysis Selected Companies Analysis MRQ (9/30/22) Book Value (Excl. AOCI): $443.9 million Selected Multiple Range: 0.40x – 0.80x MRQ (9/30/22) Tangible Book Value (Excl. AOCI): $233.0 million Selected Multiple Range: 1.00x – 1.60x CY 2022E Adjusted Net Income: $22.9 million Selected Multiple Range: 10.0x – 15.0x CY 2023E Adjusted Net Income: $26.9 million Selected Multiple Range: 8.0x – 13.0x Selected Transaction Analysis MRQ (9/30/22) Book Value (Excl. AOCI): $443.9 million Selected Multiple Range: 0.50x – 0.90x MRQ (9/30/22) Tangible Book Value (Excl. AOCI): $233.0 million Selected Multiple Range: 1.20x – 1.80x Discounted Cash Book Value (Excl. AOCI) [3] Terminal Multiple: 0.80x – 1.20x Discount Rate: 13.0% – 15.0% Tangible Book Value (Excl. AOCI) [4] Terminal Multiple: 1.20x – 1.80x Discount Rate: 13.0% – 15.0% $2 Preliminary Financial Analyses Summary Preliminary Implied Per Share Value Reference Ranges (dollars per share in actuals) .00 $3.00 $4.00 $5.00 $6.00 $7.00 $8.00 $9.00 $10.00 Note: No particular weight has been attributed to any analysis. Note: Based on (i) ~51.2 million basic shares of common stock outstanding; (ii) ~0.2 million options (to the extent in the money, per the treasury method); (iii) ~0.1 million restricted stock units; and (iv) ~0.1 million performance stock units outstanding that are projected to vest, as of 10/25/22. Does not include ~0.1 million MSUs. Based on Angels Proposal dated 9/2/22. Reflects 10-day volume-weighted average price per share of common stock as of 10/25/22. Per Company management, at this time the Company is not contemplating making cash distributions over the projection period. For illustrative purposes only and based on discussions with Company management, assuming distributions of 75% of distributable cash at Twins Corporation of $4.2 million in 2022, $5.9 million in 2023, $6.5 million in 2024, $8.2 million in 2025, $9.1 million in 2026 and $10.5 million in 2027, corresponding reduction in book value, and the same discount rate range and terminal multiple range used in the preliminary discounted cash flow analysis, the implied equity value per share reference range would be $4.87 - $7.64. Per Company management, at this time the Company is not contemplating making cash distributions over the projection period. For illustrative purposes only and based on discussions with Company management, assuming distributions of 75% of distributable cash at Twins Corporation of $4.2 million in 2022, $5.9 million in 2023, $6.5 million in 2024, $8.2 million in 2025, $9.1 million in 2026 and $10.5 million in 2027, corresponding reduction in tangible book value, and the same discount rate range and terminal multiple range used in the illustrative discounted cash flow analysis, the implied equity value per share reference range would be $4.98- $7.81. Adjusted Net Income refers to earnings, adjusted, among other things, for unrealized gains/losses and certain unusual or non-recurring items; AOCI refers to Accumulated Other Comprehensive Income; CY refers to Calendar Year; E refers to Estimated; MRQ refers to the most recently completed quarterly fiscal period for which financial information has been made public (except in the case of the Company, where it refers to the quarter ended 9/30/22); VWAP refers to Volume-Weighted Average Price. Source: Company management, Management Projections, Capital IQ, Bloomberg, public filings, and the Proposal. $4.87 $4.60 $5.43 $4.31 $4.18 $4.45 $4.53 $3.45 $8.00 $7.56 $8.14 $7.76 $6.79 $6.67 $7.24 $6.90 Proposal Price¹: $6.00 10-Day VWAP²: $3.37 17 CONFIDENTIAL lllustrative Only lllustrative Only lllustrative Only
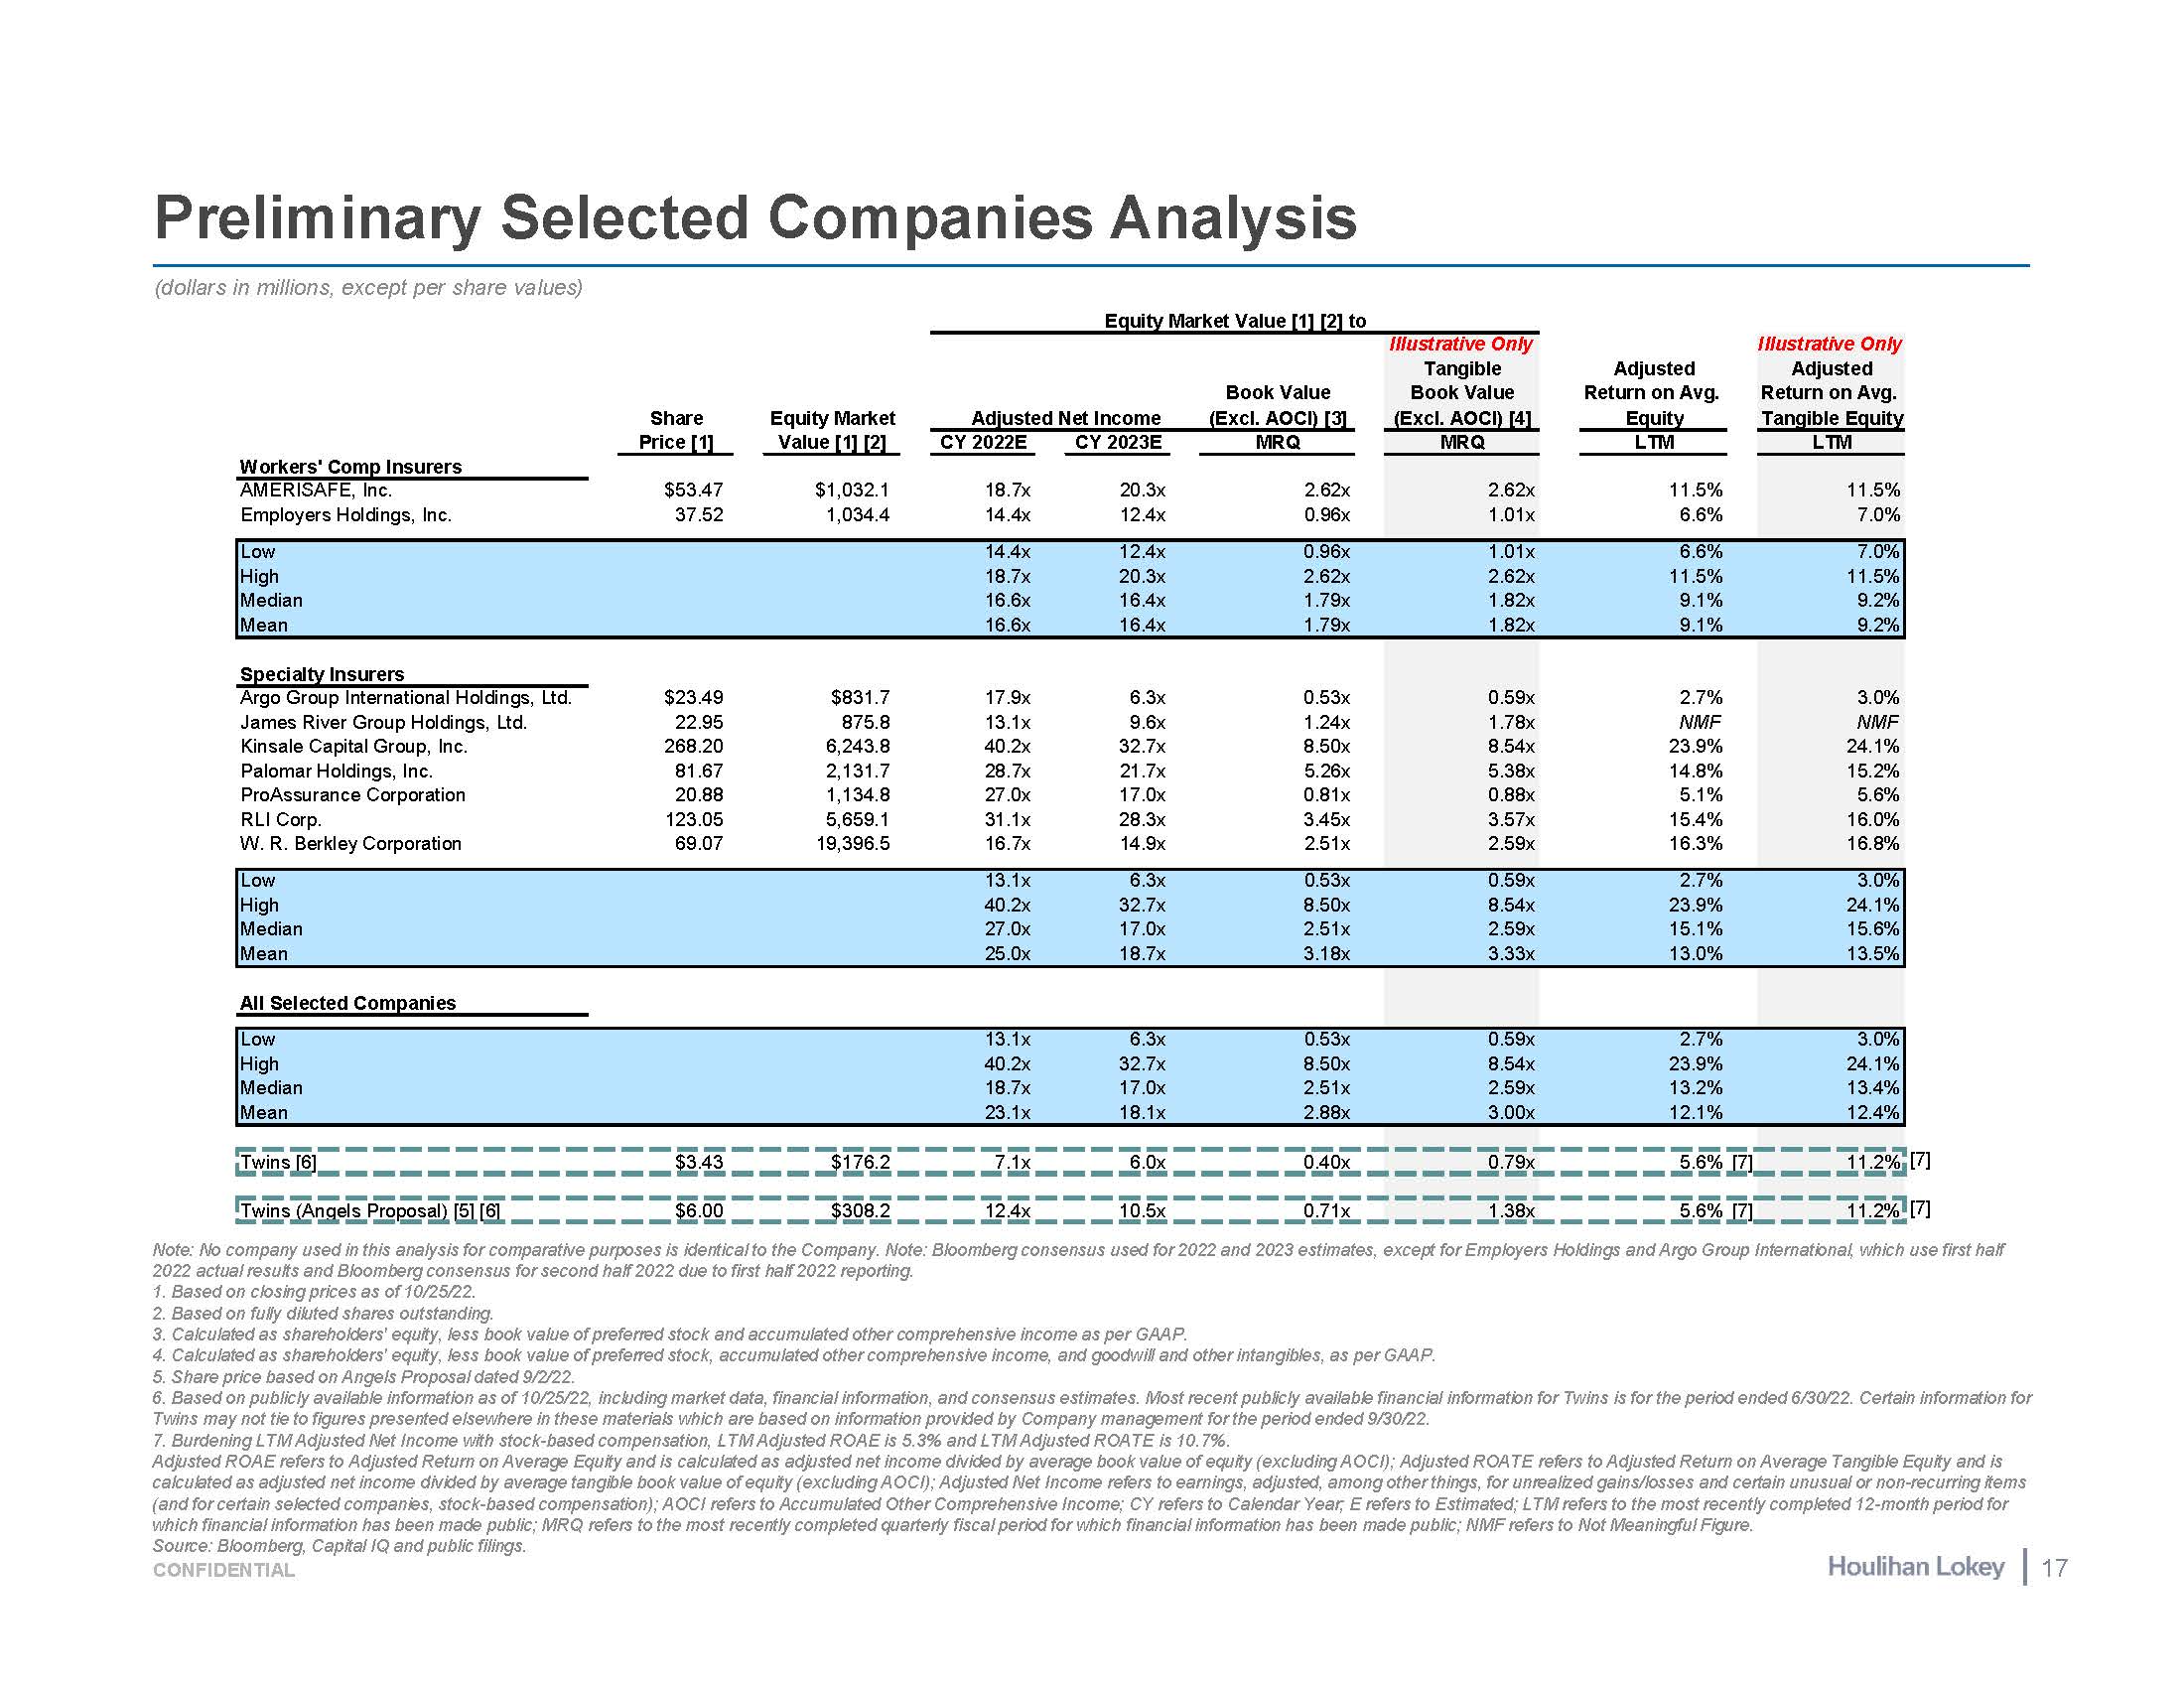
Preliminary Selected Companies Analysis 17 CONFIDENTIAL (dollars in millions, except per share values) Equity Market Value [1] [2] to N Workers' Comp Insurers AMERISAFE, Inc. Employers Holdings, Inc. Share Price [1] $53.47 37.52 Equity Market Value [1] [2] $1,032.1 1,034.4 Adjusted CY 2022E 18.7x 14.4x Net Income CY 2023E 20.3x 12.4x Book Value (Excl. AOCI) [3] MRQ 2.62x 0.96x Illustrative Only Tangible Book Value (Excl. AOCI) [4] MRQ 2.62x 1.01x Adjusted Return on Avg. Equity LTM 11.5% 6.6% Illustrative Only Adjusted Return on Avg. Tangible Equity LTM 11.5% 7.0% Low 14.4x 12.4x 0.96x 1.01x 6.6% 7.0% High 18.7x 20.3x 2.62x 2.62x 11.5% 11.5% Median 16.6x 16.4x 1.79x 1.82x 9.1% 9.2% Mean 16.6x 16.4x 1.79x 1.82x 9.1% 9.2% Specialty Insurers Argo Group International Holdings, Ltd. $23.49 $831.7 17.9x 6.3x 0.53x 0.59x 2.7% 3.0% James River Group Holdings, Ltd. 22.95 875.8 13.1x 9.6x 1.24x 1.78x NMF NMF Kinsale Capital Group, Inc. 268.20 6,243.8 40.2x 32.7x 8.50x 8.54x 23.9% 24.1% Palomar Holdings, Inc. 81.67 2,131.7 28.7x 21.7x 5.26x 5.38x 14.8% 15.2% ProAssurance Corporation 20.88 1,134.8 27.0x 17.0x 0.81x 0.88x 5.1% 5.6% RLI Corp. 123.05 5,659.1 31.1x 28.3x 3.45x 3.57x 15.4% 16.0% W. R. Berkley Corporation 69.07 19,396.5 16.7x 14.9x 2.51x 2.59x 16.3% 16.8% Low 13.1x 6.3x 0.53x 0.59x 2.7% 3.0% High 40.2x 32.7x 8.50x 8.54x 23.9% 24.1% Median 27.0x 17.0x 2.51x 2.59x 15.1% 15.6% Mean 25.0x 18.7x 3.18x 3.33x 13.0% 13.5% All Selected Companies Low 13.1x 6.3x 0.53x 0.59x 2.7% 3.0% High 40.2x 32.7x 8.50x 8.54x 23.9% 24.1% Median 18.7x 17.0x 2.51x 2.59x 13.2% 13.4% Mean 23.1x 18.1x 2.88x 3.00x 12.1% 12.4% Twins [6] $3.43 $176.2 7.1x 6.0x 0.40x 0.79x 5.6% [7] 11.2% Twins (Angels Proposal) [5] [6] $6.00 $308.2 12.4x 10.5x 0.71x 1.38x 5.6% [7] 11.2% [7] [7] Note: No company used in this analysis for comparative purposes is identical to the Company. Note: Bloomberg consensus used for 2022 and 2023 estimates, except for Employers Holdings and Argo Group International, which use first half 2022 actual results and Bloomberg consensus for second half 2022 due to first half 2022 reporting. Based on closing prices as of 10/25/22. Based on fully diluted shares outstanding. Calculated as shareholders' equity, less book value of preferred stock and accumulated other comprehensive income as per GAAP. Calculated as shareholders' equity, less book value of preferred stock, accumulated other comprehensive income, and goodwill and other intangibles, as per GAAP. Share price based on Angels Proposal dated 9/2/22. Based on publicly available information as of 10/25/22, including market data, financial information, and consensus estimates. Most recent publicly available financial information for Twins is for the period ended 6/30/22. Certain information for Twins may not tie to figures presented elsewhere in these materials which are based on information provided by Company management for the period ended 9/30/22. Burdening LTM Adjusted Net Income with stock-based compensation, LTM Adjusted ROAE is 5.3% and LTM Adjusted ROATE is 10.7%. Adjusted ROAE refers to Adjusted Return on Average Equity and is calculated as adjusted net income divided by average book value of equity (excluding AOCI); Adjusted ROATE refers to Adjusted Return on Average Tangible Equity and is calculated as adjusted net income divided by average tangible book value of equity (excluding AOCI); Adjusted Net Income refers to earnings, adjusted, among other things, for unrealized gains/losses and certain unusual or non-recurring items (and for certain selected companies, stock-based compensation); AOCI refers to Accumulated Other Comprehensive Income; CY refers to Calendar Year; E refers to Estimated; LTM refers to the most recently completed 12-month period for which financial information has been made public; MRQ refers to the most recently completed quarterly fiscal period for which financial information has been made public; NMF refers to Not Meaningful Figure. Source: Bloomberg, Capital IQ and public filings.
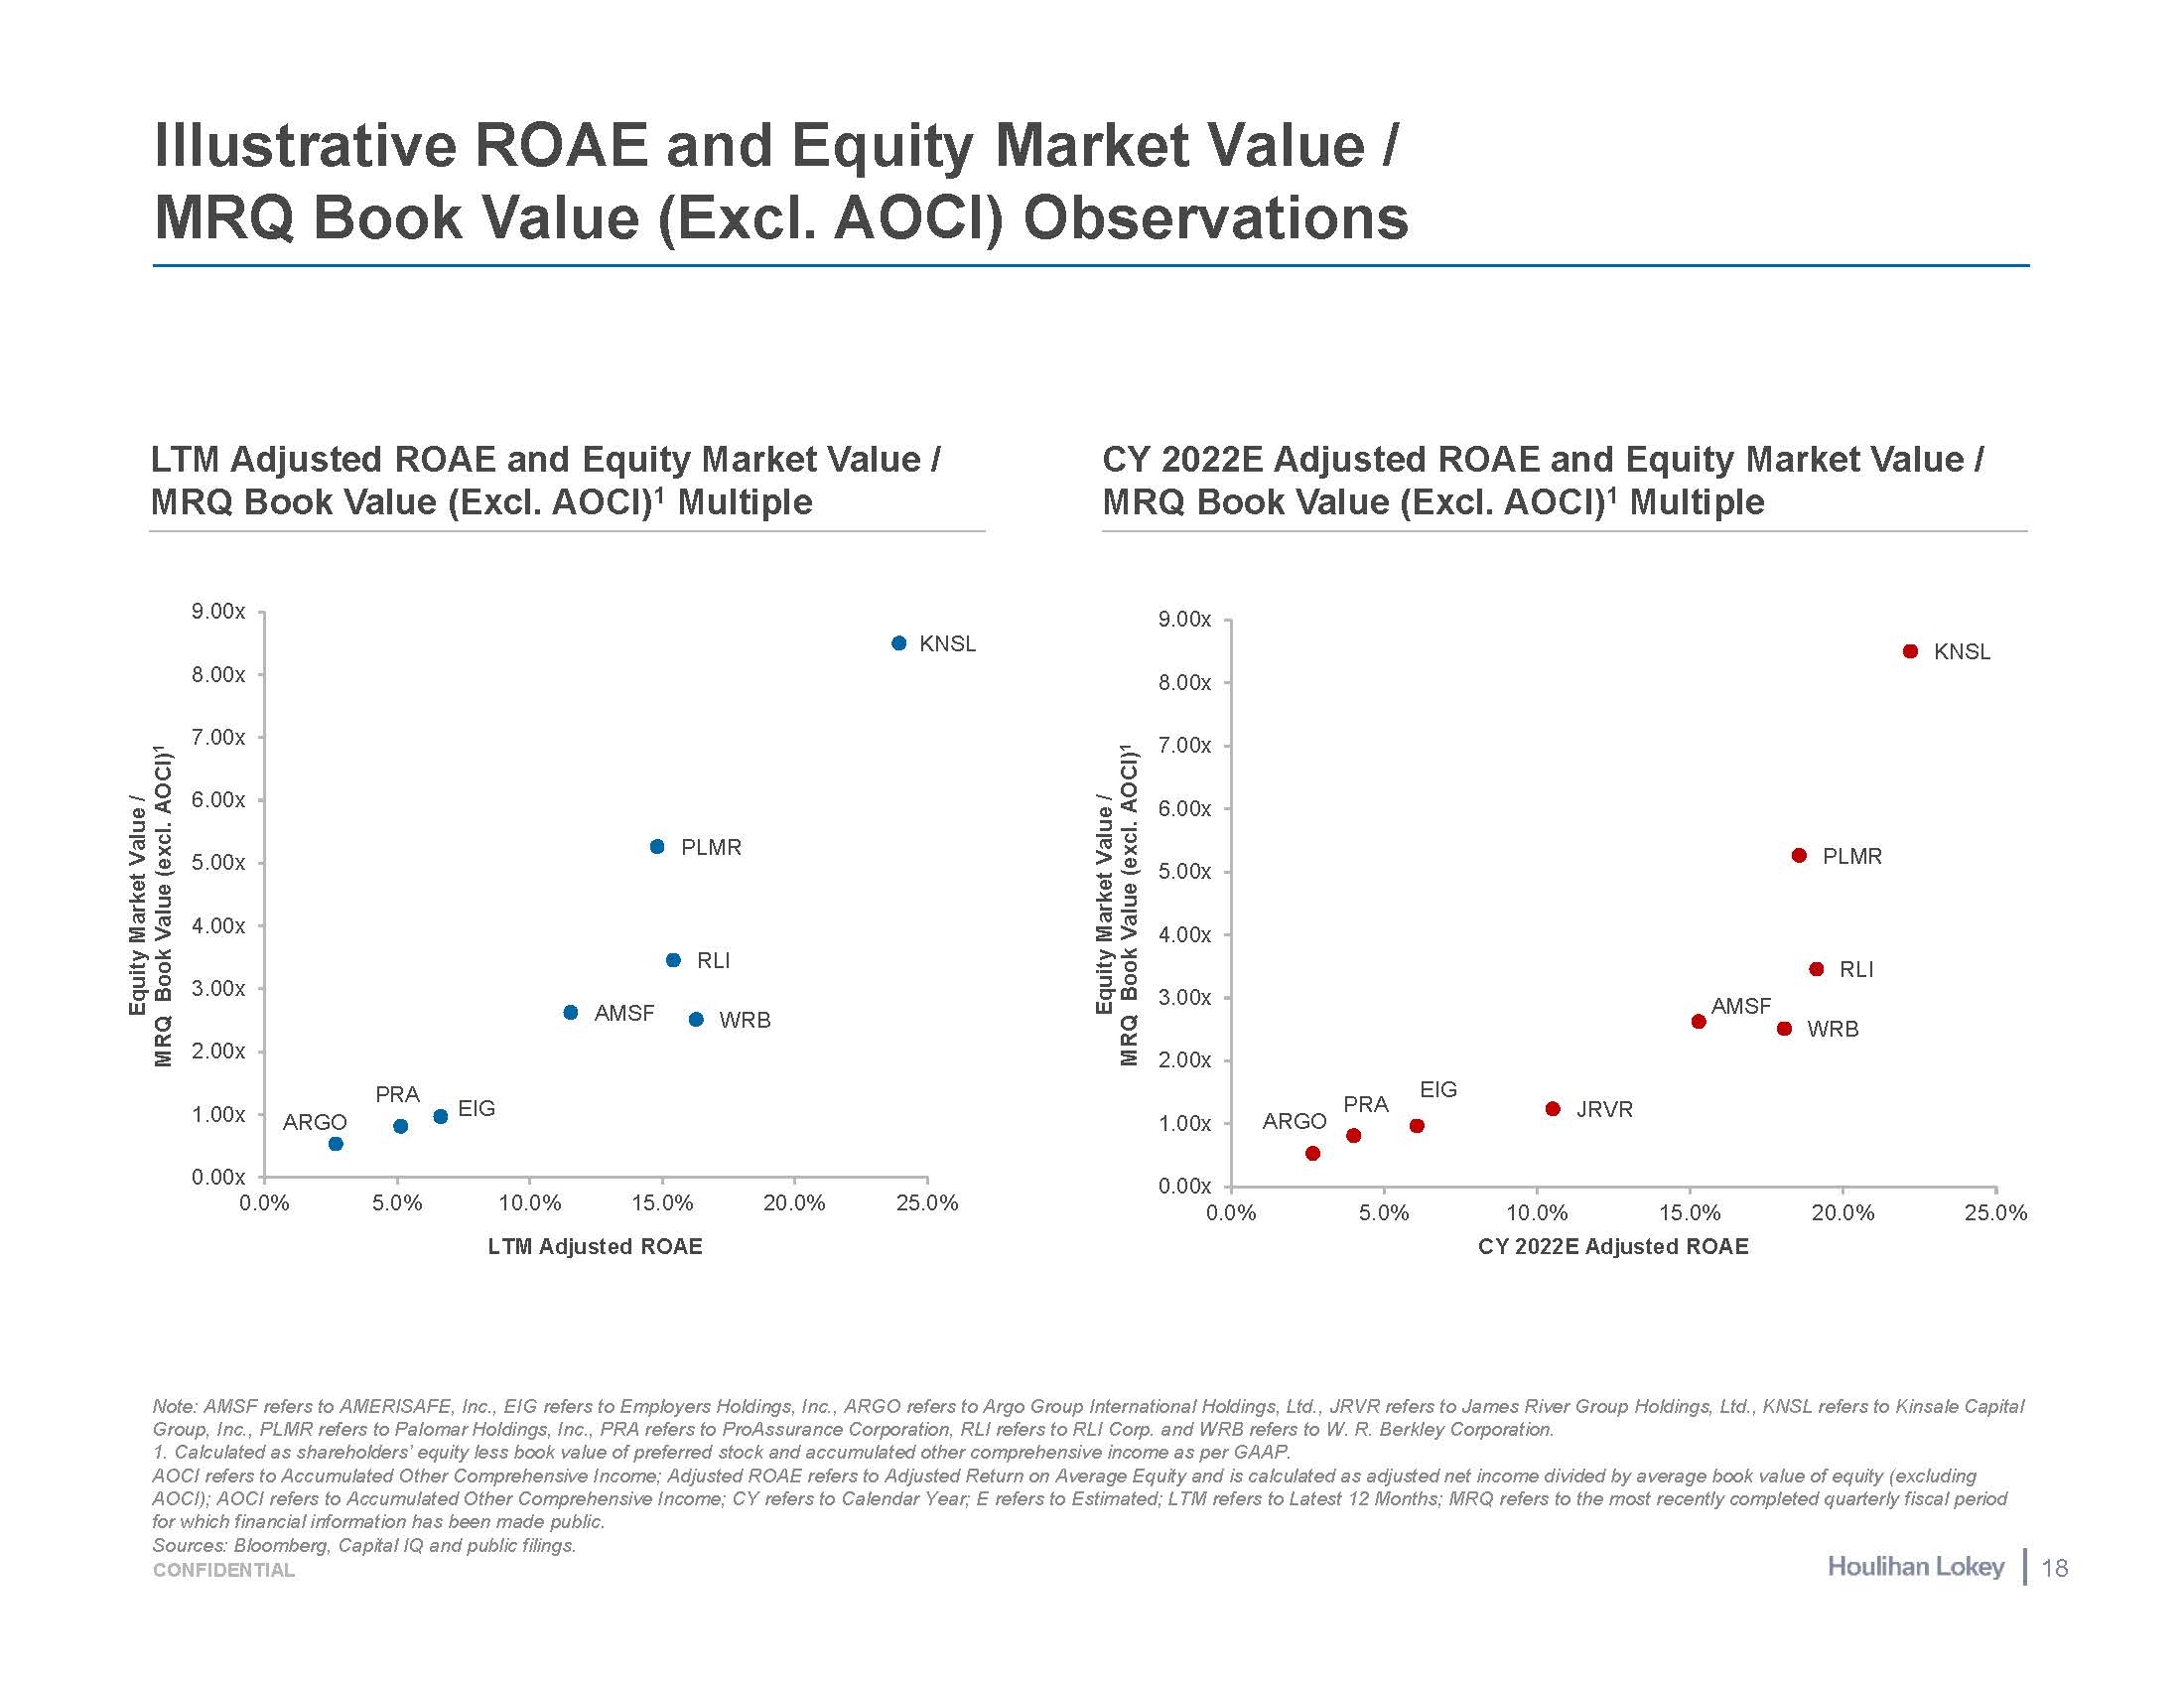
Note: AMSF refers to AMERISAFE, Inc., EIG refers to Employers Holdings, Inc., ARGO refers to Argo Group International Holdings, Ltd., JRVR refers to James River Group Holdings, Ltd., KNSL refers to Kinsale Capital Group, Inc., PLMR refers to Palomar Holdings, Inc., PRA refers to ProAssurance Corporation, RLI refers to RLI Corp. and WRB refers to W. R. Berkley Corporation. 1. Calculated as shareholders’ equity less book value of preferred stock and accumulated other comprehensive income as per GAAP. AOCI refers to Accumulated Other Comprehensive Income; Adjusted ROAE refers to Adjusted Return on Average Equity and is calculated as adjusted net income divided by average book value of equity (excluding AOCI); AOCI refers to Accumulated Other Comprehensive Income; CY refers to Calendar Year; E refers to Estimated; LTM refers to Latest 12 Months; MRQ refers to the most recently completed quarterly fiscal period for which financial information has been made public. Illustrative ROAE and Equity Market Value / MRQ Book Value (Excl. AOCI) Observations LTM Adjusted ROAE and Equity Market Value / MRQ Book Value (Excl. AOCI)1 Multiple AMSF EIG ARGO KNSL PLMR PRA RLI WRB 0.00x 1.00x 2.00x 3.00x 4.00x 5.00x 6.00x 7.00x 8.00x 9.00x 0.0% 5.0% 10.0% 15.0% LTM Adjusted ROAE 20.0% 25.0% Equity Market Value / MRQ Book Value (excl. AOCI)1 CY 2022E Adjusted ROAE and Equity Market Value / MRQ Book Value (Excl. AOCI)1 Multiple AMSF Sources: Bloomberg, Capital IQ and public filings. CONFIDENTIAL 18 EIG JRVR KNSL PLMR PRA ARGO RLI WRB 0.00x 1.00x 2.00x 3.00x 4.00x 5.00x 6.00x 7.00x 8.00x 9.00x 0.0% 5.0% 10.0% 15.0% CY 2022E Adjusted ROAE 20.0% 25.0% Equity Market Value / MRQ Book Value (excl. AOCI)1

Historical Trading Multiples Market Capitalization/MRQ Book Value Lookback Note: Market Capitalization/Book Value multiples less than or equal to 0.0x and greater than 10.0x deemed to be not meaningful and excluded from the displayed data. Note: For purposes of the above chart, Book Value is on an unadjusted basis and does not exclude accumulated other comprehensive income. As such, Book Value multiples shown above may differ from multiples shown elsewhere in the materials. Twins Market Capitalization/Book Value multiples shown and calculated since July 16, 2020. Assumed Book Values from July 16, 2020 to November 11, 2020 reflect Twins’ March 31, 2020 Total stockholders’ / members’ equity on an adjusted basis after giving effect to the reorganization transactions and issuance and sale of shares in its IPO per Twins’ 424B4 filing dated July 17, 2020. Calculated since July 16, 2020, Twins’ IPO date. Selected Workers’ Comp Insurers comprise AMERISAFE, Inc. and Employers Holdings, Inc. Data reflects median multiple. Selected Specialty Insurers comprise Argo Group International Holdings, Ltd., James River Group Holdings, Ltd., Kinsale Capital Group, Inc., Palomar Holdings, Inc., ProAssurance Corporation, RLI Corp., and W. R. Berkley Corporation. Data reflects median multiple. Reflects 10-year average. Reflects average since July 16, 2020, Twins’ IPO date. One-Year Average Since Twins IPO [2] 3-Year Average 5-Year Average 10-Year Average Twins [1] Selected Workers' Comp Insurers [3] Selected Specialty Insurers [4] 0.8x 1.3x NA NA NA 1.7x 1.7x 1.7x 1.9x 1.7x 2.5x 2.2x 2.2x 2.0x 1.7x 1.3x 6 1.7x 5 1.7x 5 1.0x 0.8x 0.5x 0.3x 0.0x Oct-12 Apr-13 Oct-13 Apr-14 Oct-14 Apr-15 Oct-15 Apr-16 Oct-16 Apr-17 Oct-17 Apr-18 Oct-18 Apr-19 Oct-19 Apr-20 Oct-20 Apr-21 Oct-21 Apr-22 Oct-22 1.3x 1.5x 1.8x 2.5x 2.3x 2.0x 2.8x 3.0x 3.3x Twins [1] Selected Workers' Comp Insurers [3] Selected Specialty Insurers [4] Twins Average [1] Selected Workers' Comp Insurers Average [3] Selected Specialty Insurers Average [4] NA refers to Not Available. MRQ refers to Most Recent Quarter. Source: S&P Capital IQ as of October 25, 2022. (Multiples shown above are sourced from S&P Capital IQ; as such, certain multiples may differ slightly from the figures shown on other pages.) CONFIDENTIAL 19
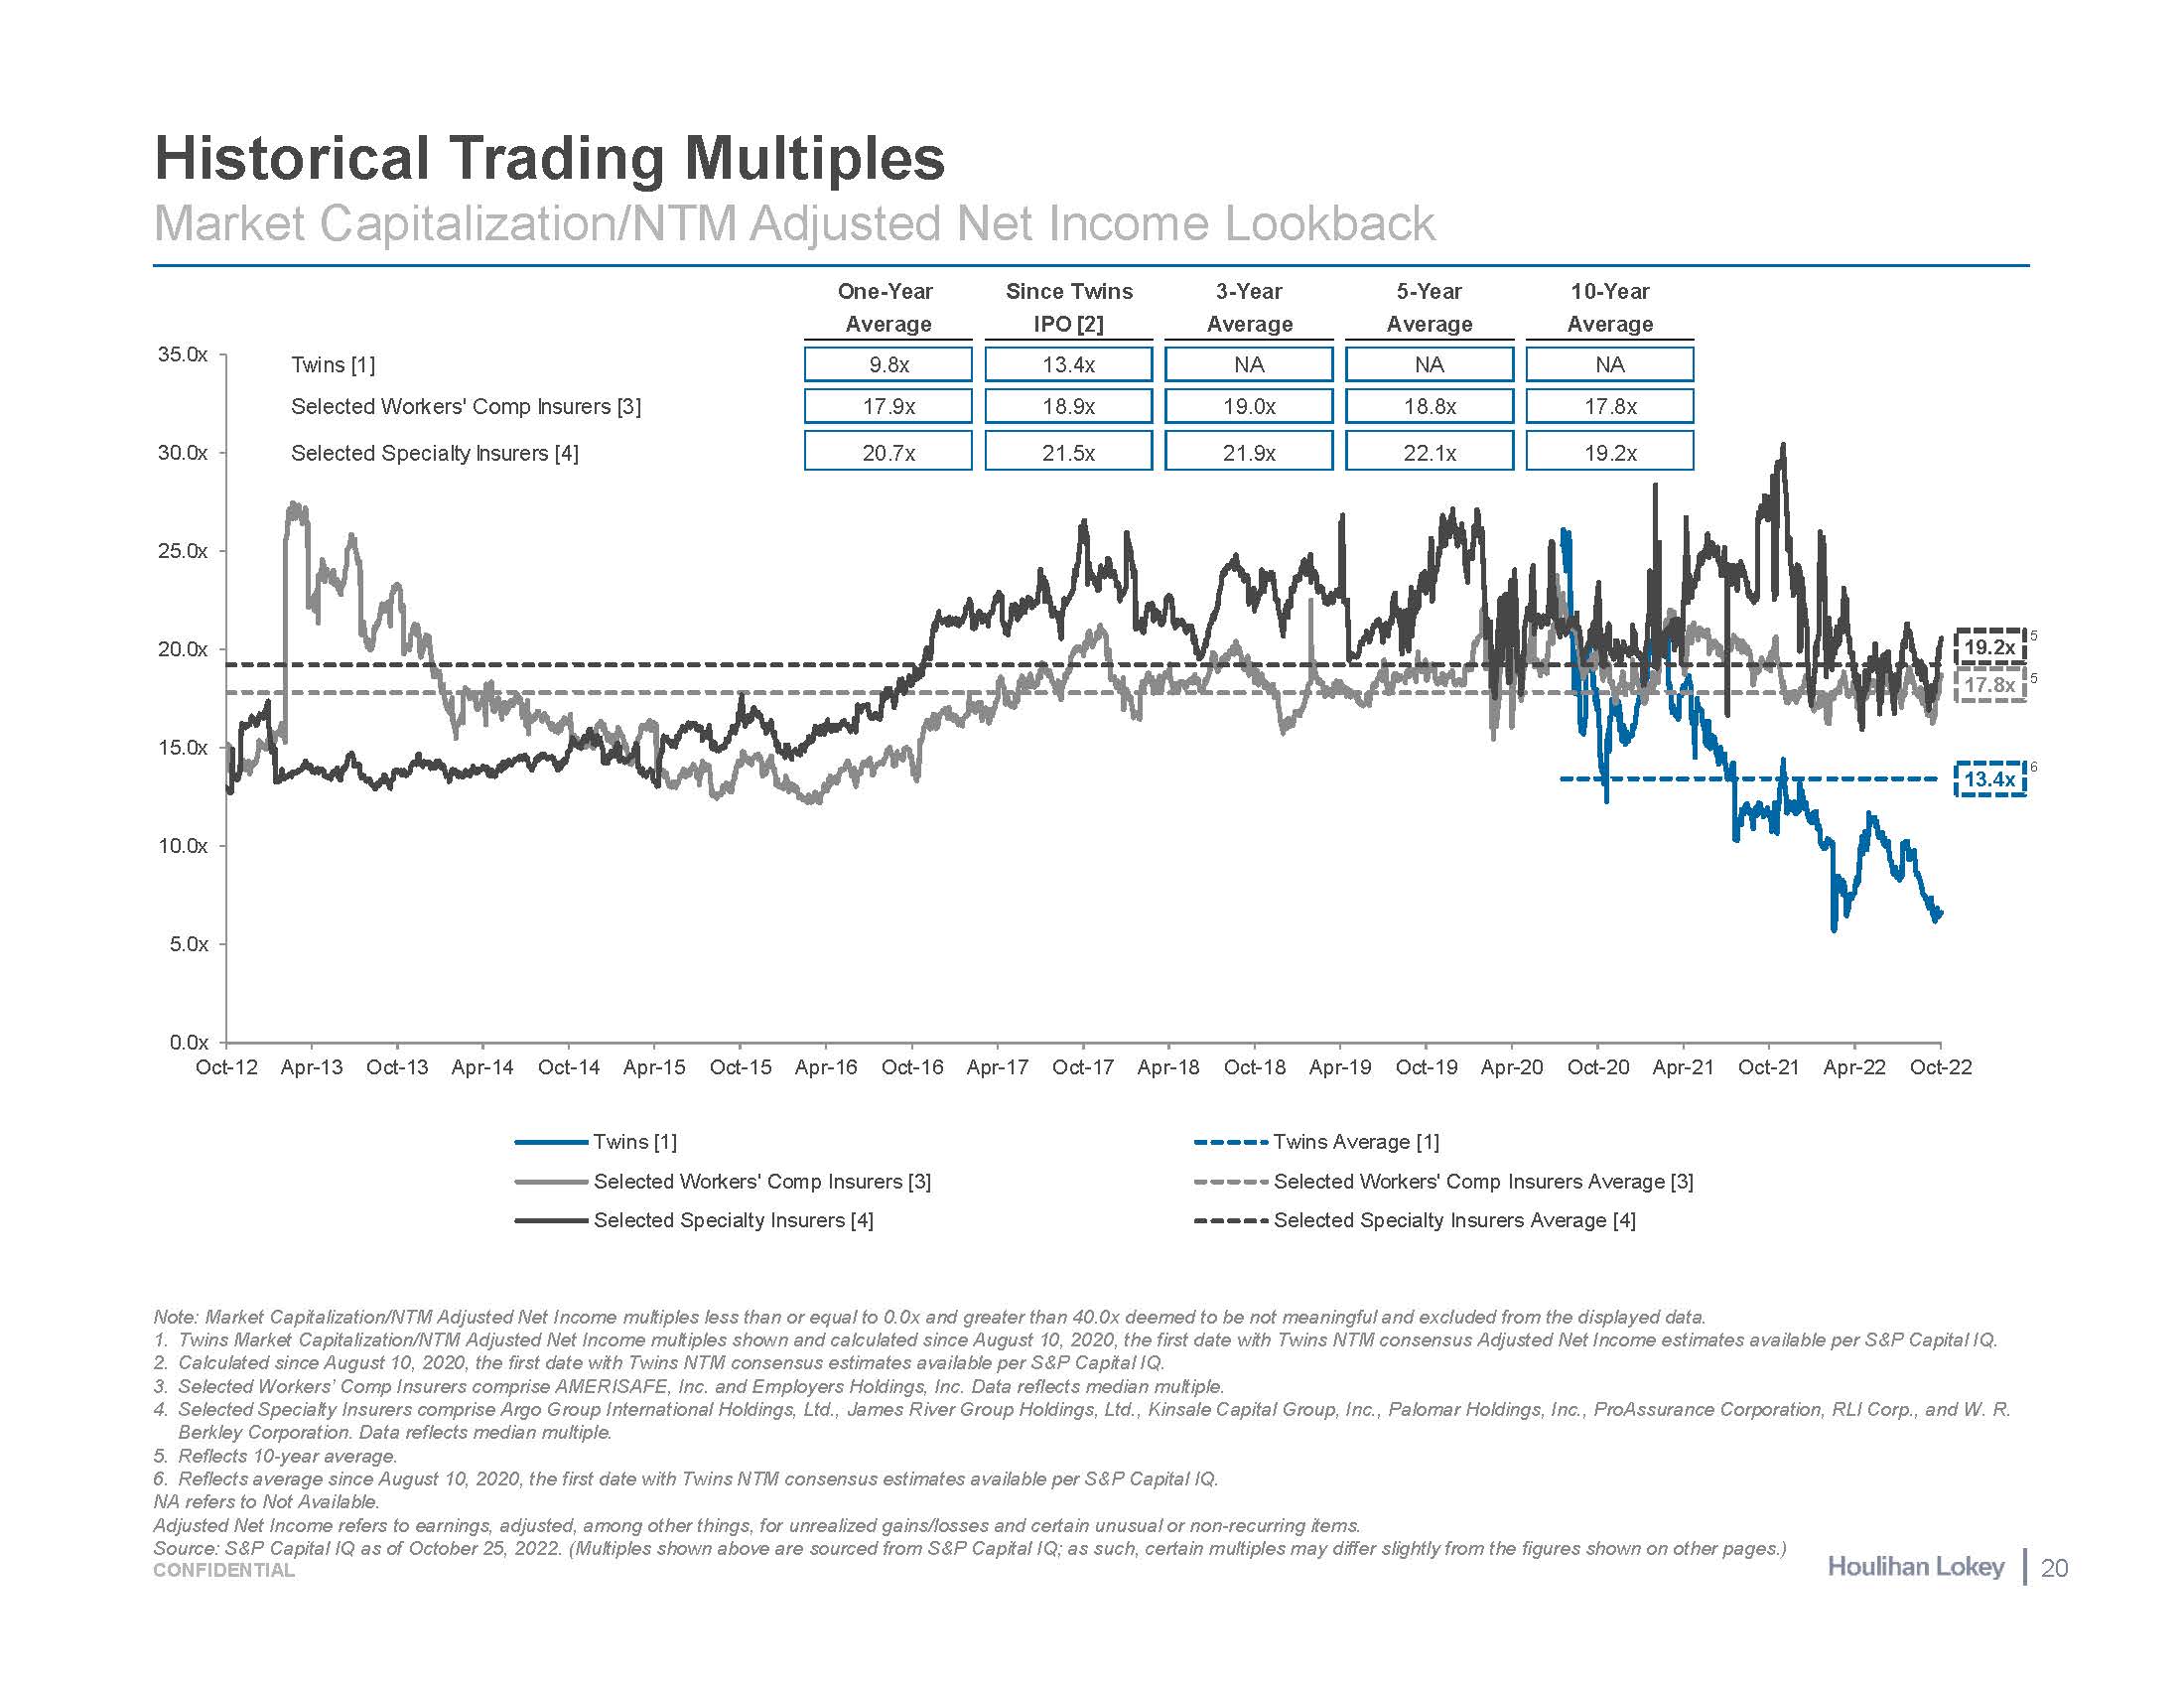
Historical Trading Multiples Market Capitalization/NTM Adjusted Net Income Lookback Note: Market Capitalization/NTM Adjusted Net Income multiples less than or equal to 0.0x and greater than 40.0x deemed to be not meaningful and excluded from the displayed data. Twins Market Capitalization/NTM Adjusted Net Income multiples shown and calculated since August 10, 2020, the first date with Twins NTM consensus Adjusted Net Income estimates available per S&P Capital IQ. Calculated since August 10, 2020, the first date with Twins NTM consensus estimates available per S&P Capital IQ. Selected Workers’ Comp Insurers comprise AMERISAFE, Inc. and Employers Holdings, Inc. Data reflects median multiple. Selected Specialty Insurers comprise Argo Group International Holdings, Ltd., James River Group Holdings, Ltd., Kinsale Capital Group, Inc., Palomar Holdings, Inc., ProAssurance Corporation, RLI Corp., and W. R. Berkley Corporation. Data reflects median multiple. Reflects 10-year average. Reflects average since August 10, 2020, the first date with Twins NTM consensus estimates available per S&P Capital IQ. One-Year Average Since Twins IPO [2] 3-Year Average 5-Year Average 10-Year Average Twins [1] Selected Workers' Comp Insurers [3] Selected Specialty Insurers [4] 9.8x 13.4x NA NA NA 17.9x 18.9x 19.0x 18.8x 17.8x 20.7x 21.5x 21.9x 22.1x 19.2x 6 13.4x 19.2x 5 17.8x 5 0.0x Oct-12 Apr-13 Oct-13 Apr-14 Oct-14 Apr-15 Oct-15 Apr-16 Oct-16 Apr-17 Oct-17 Apr-18 Oct-18 Apr-19 Oct-19 Apr-20 Oct-20 Apr-21 Oct-21 Apr-22 Oct-22 5.0x 10.0x 15.0x 20.0x 25.0x 30.0x 35.0x Twins [1] Selected Workers' Comp Insurers [3] Selected Specialty Insurers [4] Twins Average [1] Selected Workers' Comp Insurers Average [3] Selected Specialty Insurers Average [4] NA refers to Not Available. Adjusted Net Income refers to earnings, adjusted, among other things, for unrealized gains/losses and certain unusual or non-recurring items. Source: S&P Capital IQ as of October 25, 2022. (Multiples shown above are sourced from S&P Capital IQ; as such, certain multiples may differ slightly from the figures shown on other pages.) CONFIDENTIAL 20
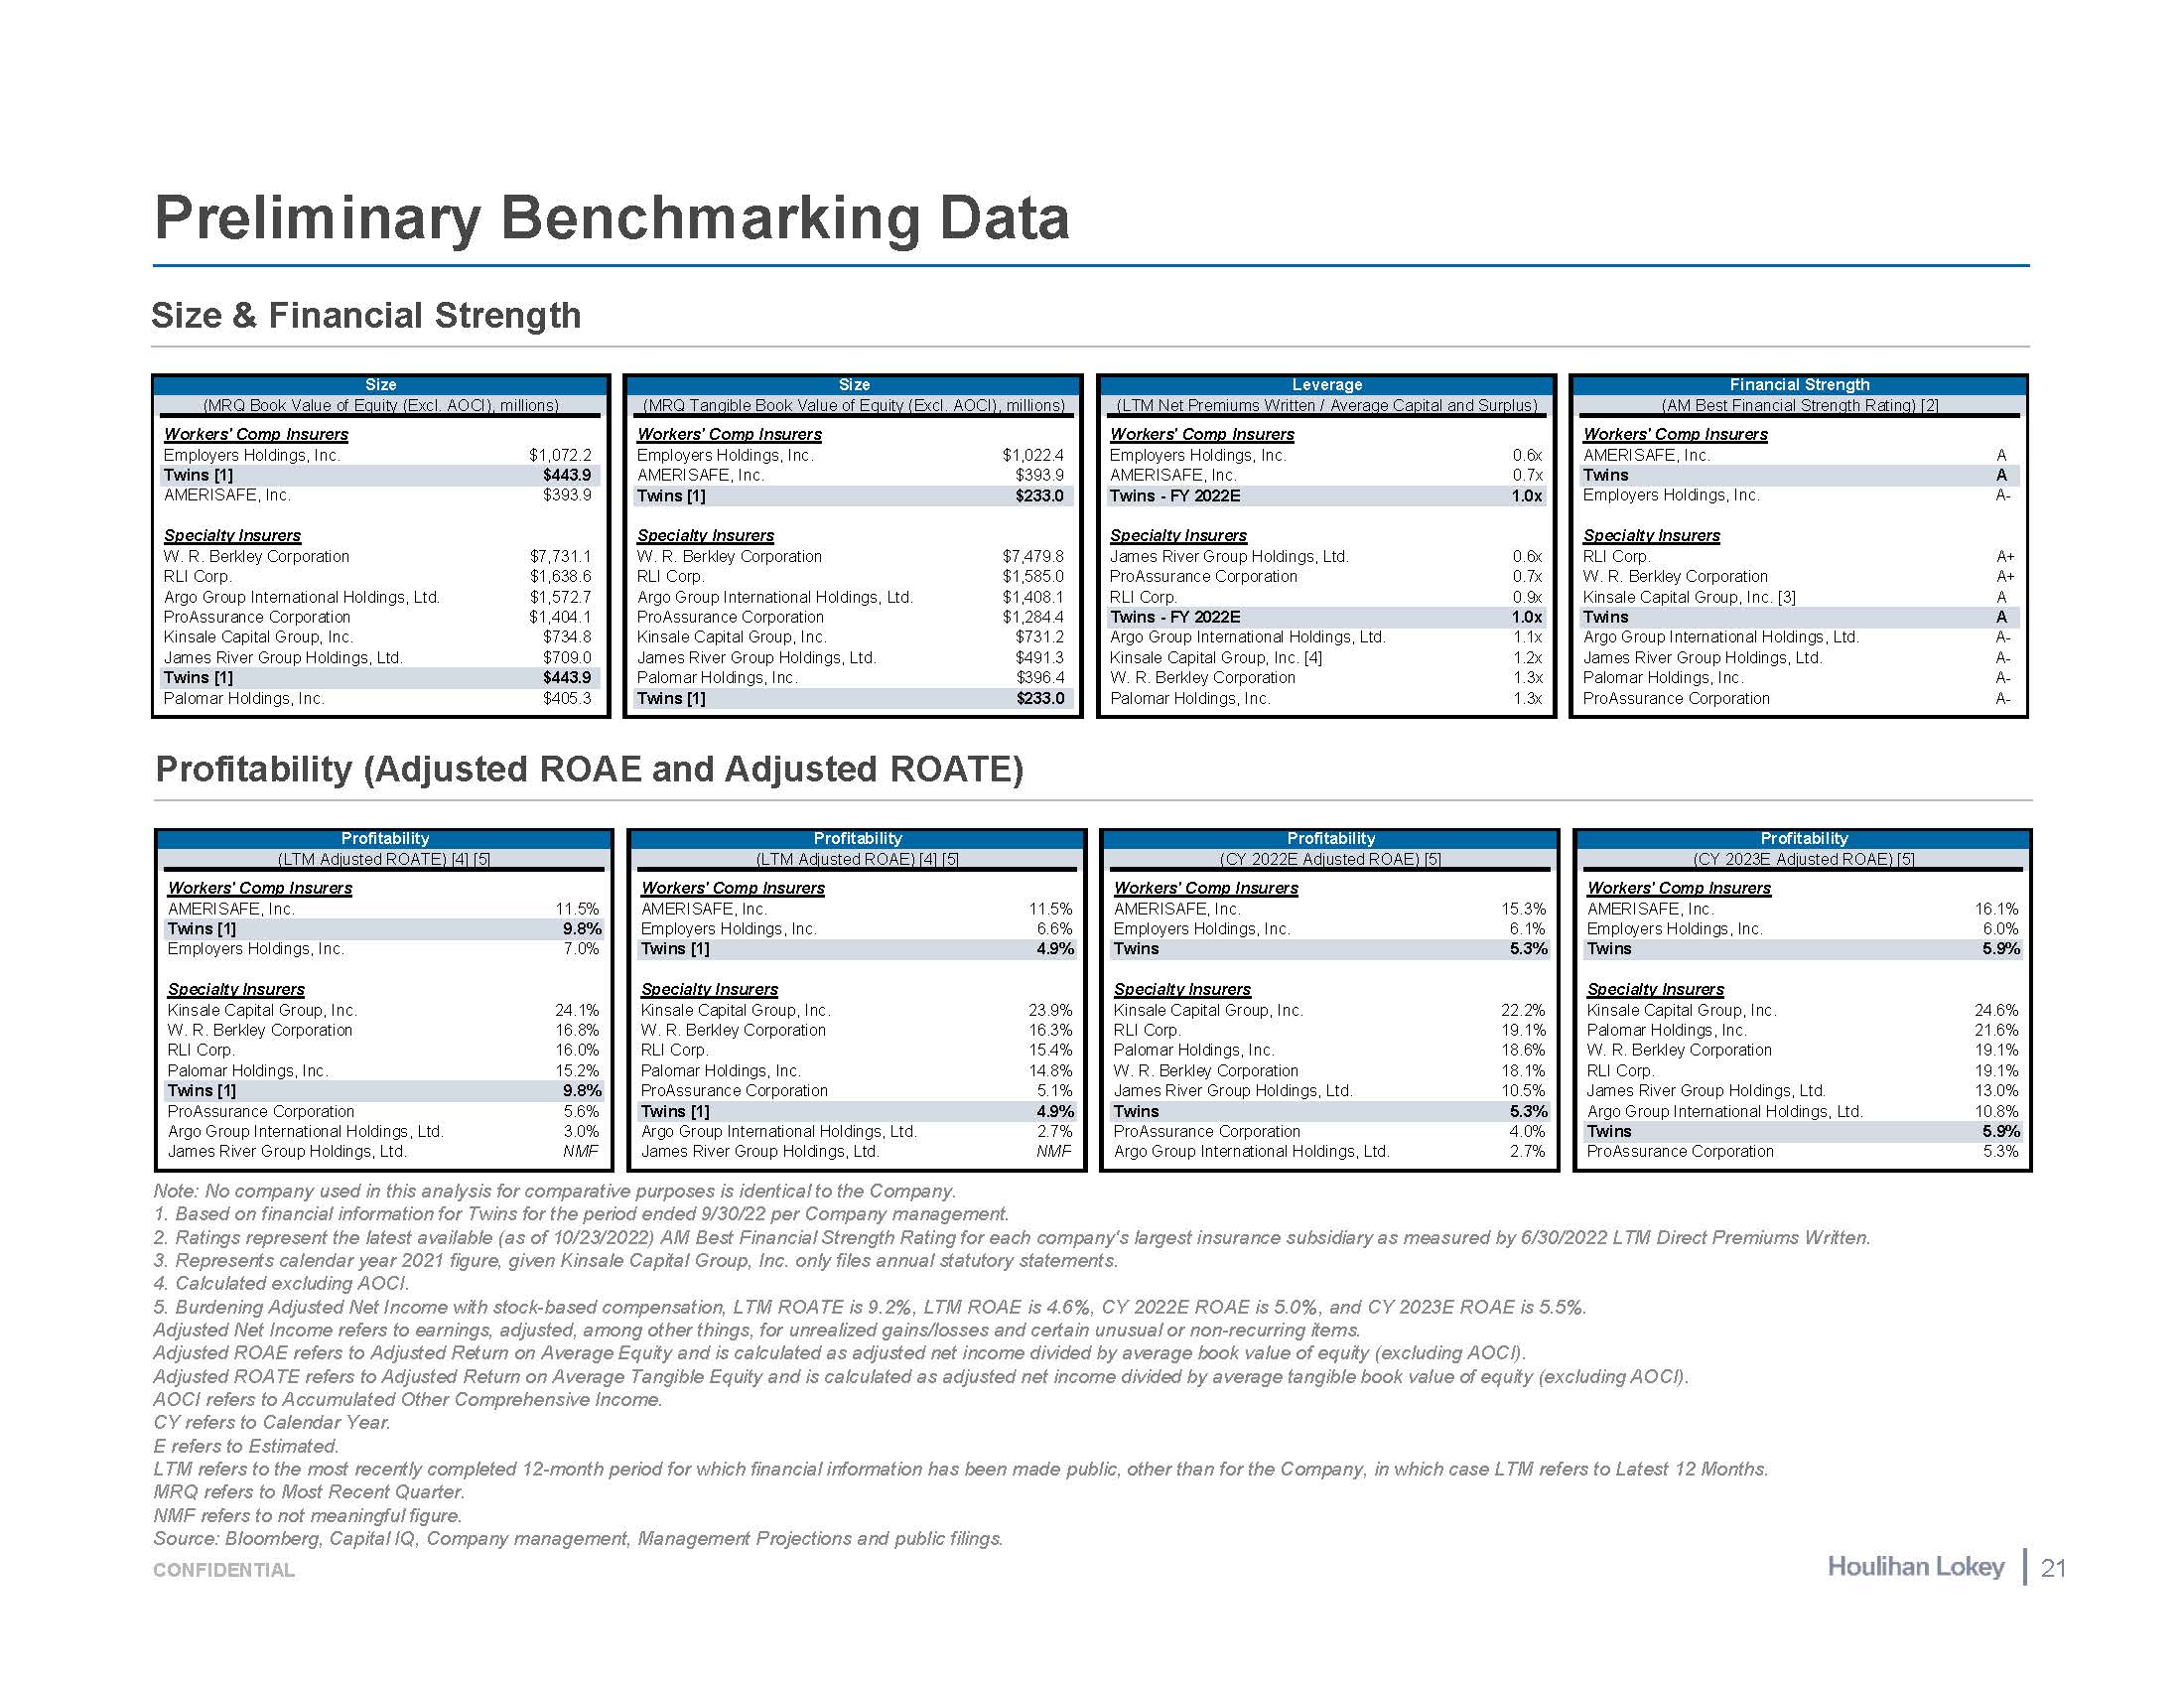
Preliminary Benchmarking Data Note: No company used in this analysis for comparative purposes is identical to the Company. Based on financial information for Twins for the period ended 9/30/22 per Company management. Ratings represent the latest available (as of 10/23/2022) AM Best Financial Strength Rating for each company's largest insurance subsidiary as measured by 6/30/2022 LTM Direct Premiums Written. Represents calendar year 2021 figure, given Kinsale Capital Group, Inc. only files annual statutory statements. Calculated excluding AOCI. Burdening Adjusted Net Income with stock-based compensation, LTM ROATE is 9.2%, LTM ROAE is 4.6%, CY 2022E ROAE is 5.0%, and CY 2023E ROAE is 5.5%. Adjusted Net Income refers to earnings, adjusted, among other things, for unrealized gains/losses and certain unusual or non-recurring items. Adjusted ROAE refers to Adjusted Return on Average Equity and is calculated as adjusted net income divided by average book value of equity (excluding AOCI). Adjusted ROATE refers to Adjusted Return on Average Tangible Equity and is calculated as adjusted net income divided by average tangible book value of equity (excluding AOCI). AOCI refers to Accumulated Other Comprehensive Income. CY refers to Calendar Year. E refers to Estimated. LTM refers to the most recently completed 12-month period for which financial information has been made public, other than for the Company, in which case LTM refers to Latest 12 Months. MRQ refers to Most Recent Quarter. Size & Financial Strength Leverage (LTM Net Premiums Written / Average Capital and Surplus) Workers' Comp Insurers Employers Holdings, Inc. 0.6x AMERISAFE, Inc. 0.7x Twins - FY 2022E 1.0x Specialty Insurers James River Group Holdings, Ltd. 0.6x ProAssurance Corporation 0.7x RLI Corp. 0.9x Twins - FY 2022E 1.0x Argo Group International Holdings, Ltd. 1.1x Kinsale Capital Group, Inc. [4] 1.2x W. R. Berkley Corporation 1.3x Palomar Holdings, Inc. 1.3x Financial Strength (AM Best Financial Strength Rating) [2] Workers' Comp Insurers AMERISAFE, Inc. A Twins A Employers Holdings, Inc. A- Specialty Insurers RLI Corp. A+ W. R. Berkley Corporation A+ Kinsale Capital Group, Inc. [3] A Twins A Argo Group International Holdings, Ltd. A- James River Group Holdings, Ltd. A- Palomar Holdings, Inc. A- ProAssurance Corporation A- Size (MRQ Book Value of Equity (Excl. AOCI), millions) Workers' Comp Insurers Employers Holdings, Inc. $1,072.2 Twins [1] $443.9 AMERISAFE, Inc. $393.9 Specialty Insurers W. R. Berkley Corporation $7,731.1 RLI Corp. $1,638.6 Argo Group International Holdings, Ltd. $1,572.7 ProAssurance Corporation $1,404.1 Kinsale Capital Group, Inc. $734.8 James River Group Holdings, Ltd. $709.0 Twins [1] $443.9 Palomar Holdings, Inc. $405.3 Size (MRQ Tangible Book Value of Equity (Excl. AOCI), millions) Workers' Comp Insurers Employers Holdings, Inc. $1,022.4 AMERISAFE, Inc. $393.9 Twins [1] $233.0 Specialty Insurers W. R. Berkley Corporation $7,479.8 RLI Corp. $1,585.0 Argo Group International Holdings, Ltd. $1,408.1 ProAssurance Corporation $1,284.4 Kinsale Capital Group, Inc. $731.2 James River Group Holdings, Ltd. $491.3 Palomar Holdings, Inc. $396.4 Twins [1] $233.0 Profitability (Adjusted ROAE and Adjusted ROATE) Profitability (LTM Adjusted ROATE) [4] [5] Workers' Comp Insurers AMERISAFE, Inc. 11.5% Twins [1] 9.8% Employers Holdings, Inc. 7.0% Specialty Insurers Kinsale Capital Group, Inc. 24.1% W. R. Berkley Corporation 16.8% RLI Corp. 16.0% Palomar Holdings, Inc. 15.2% Twins [1] 9.8% ProAssurance Corporation 5.6% Argo Group International Holdings, Ltd. 3.0% James River Group Holdings, Ltd. NMF Profitability (LTM Adjusted ROAE) [4] [5] Workers' Comp Insurers AMERISAFE, Inc. 11.5% Employers Holdings, Inc. 6.6% Twins [1] 4.9% Specialty Insurers Kinsale Capital Group, Inc. 23.9% W. R. Berkley Corporation 16.3% RLI Corp. 15.4% Palomar Holdings, Inc. 14.8% ProAssurance Corporation 5.1% Twins [1] 4.9% Argo Group International Holdings, Ltd. 2.7% James River Group Holdings, Ltd. NMF Profitability (CY 2022E Adjusted ROAE) [5] Workers' Comp Insurers AMERISAFE, Inc. 15.3% Employers Holdings, Inc. 6.1% Twins 5.3% Specialty Insurers Kinsale Capital Group, Inc. 22.2% RLI Corp. 19.1% Palomar Holdings, Inc. 18.6% W. R. Berkley Corporation 18.1% James River Group Holdings, Ltd. 10.5% Twins 5.3% ProAssurance Corporation 4.0% Argo Group International Holdings, Ltd. 2.7% Profitability (CY 2023E Adjusted ROAE) [5] Workers' Comp Insurers AMERISAFE, Inc. 16.1% Employers Holdings, Inc. 6.0% Twins 5.9% Specialty Insurers Kinsale Capital Group, Inc. 24.6% Palomar Holdings, Inc. 21.6% W. R. Berkley Corporation 19.1% RLI Corp. 19.1% James River Group Holdings, Ltd. 13.0% Argo Group International Holdings, Ltd. 10.8% Twins 5.9% ProAssurance Corporation 5.3% NMF refers to not meaningful figure. Source: Bloomberg, Capital IQ, Company management, Management Projections and public filings. CONFIDENTIAL 21
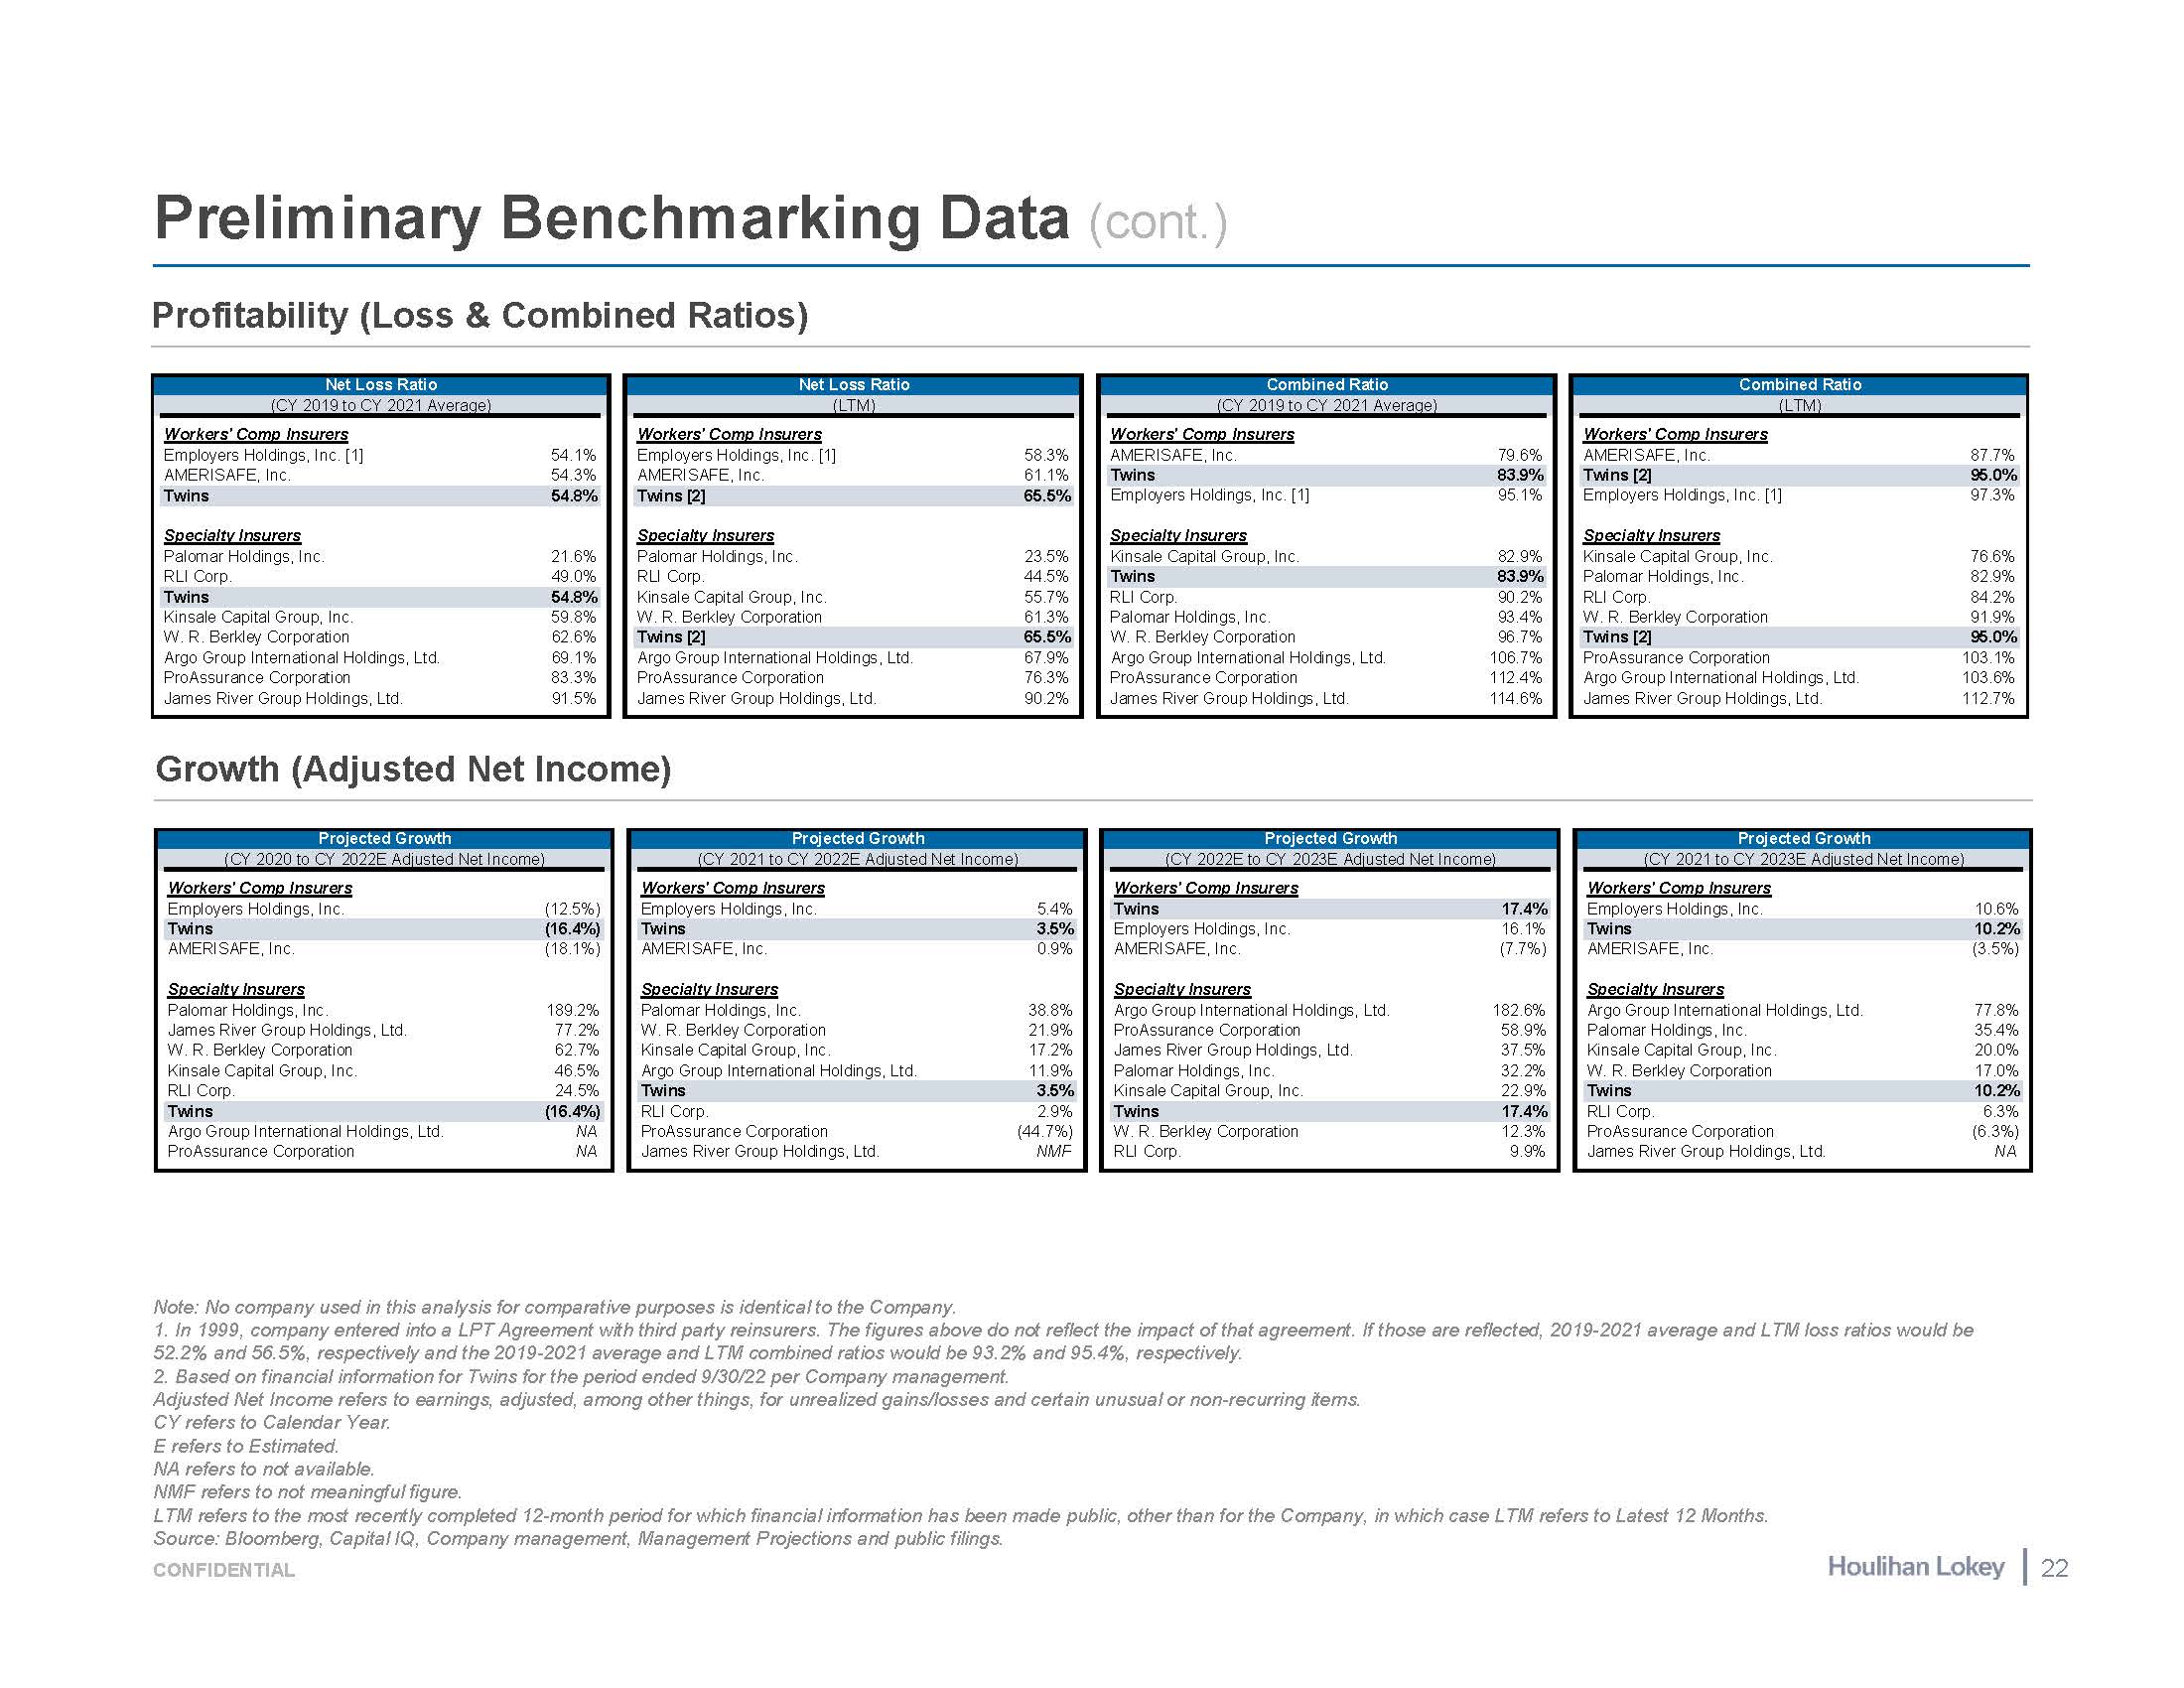
Preliminary Benchmarking Data (cont.) Note: No company used in this analysis for comparative purposes is identical to the Company. 1. In 1999, company entered into a LPT Agreement with third party reinsurers. The figures above do not reflect the impact of that agreement. If those are reflected, 2019-2021 average and LTM loss ratios would be 52.2% and 56.5%, respectively and the 2019-2021 average and LTM combined ratios would be 93.2% and 95.4%, respectively. 2. Based on financial information for Twins for the period ended 9/30/22 per Company management. Adjusted Net Income refers to earnings, adjusted, among other things, for unrealized gains/losses and certain unusual or non-recurring items. CY refers to Calendar Year. E refers to Estimated. NA refers to not available. NMF refers to not meaningful figure. Profitability (Loss & Combined Ratios) Growth (Adjusted Net Income) Combined Ratio (CY 2019 to CY 2021 Average) Workers' Comp Insurers AMERISAFE, Inc. 79.6% Twins 83.9% Employers Holdings, Inc. [1] 95.1% Specialty Insurers Kinsale Capital Group, Inc. 82.9% Twins 83.9% RLI Corp. 90.2% Palomar Holdings, Inc. 93.4% W. R. Berkley Corporation 96.7% Argo Group International Holdings, Ltd. 106.7% ProAssurance Corporation 112.4% James River Group Holdings, Ltd. 114.6% Net Loss Ratio (CY 2019 to CY 2021 Average) Workers' Comp Insurers Employers Holdings, Inc. [1] 54.1% AMERISAFE, Inc. 54.3% Twins 54.8% Specialty Insurers Palomar Holdings, Inc. 21.6% RLI Corp. 49.0% Twins 54.8% Kinsale Capital Group, Inc. 59.8% W. R. Berkley Corporation 62.6% Argo Group International Holdings, Ltd. 69.1% ProAssurance Corporation 83.3% James River Group Holdings, Ltd. 91.5% Net Loss Ratio (LTM) Workers' Comp Insurers Employers Holdings, Inc. [1] 58.3% AMERISAFE, Inc. 61.1% Twins [2] 65.5% Specialty Insurers Palomar Holdings, Inc. 23.5% RLI Corp. 44.5% Kinsale Capital Group, Inc. 55.7% W. R. Berkley Corporation 61.3% Twins [2] 65.5% Argo Group International Holdings, Ltd. 67.9% ProAssurance Corporation 76.3% James River Group Holdings, Ltd. 90.2% Combined Ratio (LTM) Workers' Comp Insurers AMERISAFE, Inc. 87.7% Twins [2] 95.0% Employers Holdings, Inc. [1] 97.3% Specialty Insurers Kinsale Capital Group, Inc. 76.6% Palomar Holdings, Inc. 82.9% RLI Corp. 84.2% W. R. Berkley Corporation 91.9% Twins [2] 95.0% ProAssurance Corporation 103.1% Argo Group International Holdings, Ltd. 103.6% James River Group Holdings, Ltd. 112.7% Projected Growth (CY 2021 to CY 2022E Adjusted Net Income) Workers' Comp Insurers Employers Holdings, Inc. 5.4% Twins 3.5% AMERISAFE, Inc. 0.9% Specialty Insurers Palomar Holdings, Inc. 38.8% W. R. Berkley Corporation 21.9% Kinsale Capital Group, Inc. 17.2% Argo Group International Holdings, Ltd. 11.9% Twins 3.5% RLI Corp. 2.9% ProAssurance Corporation (44.7%) James River Group Holdings, Ltd. NMF Projected Growth (CY 2021 to CY 2023E Adjusted Net Income) Workers' Comp Insurers Employers Holdings, Inc. 10.6% Twins 10.2% AMERISAFE, Inc. (3.5%) Specialty Insurers Argo Group International Holdings, Ltd. 77.8% Palomar Holdings, Inc. 35.4% Kinsale Capital Group, Inc. 20.0% W. R. Berkley Corporation 17.0% Twins 10.2% RLI Corp. 6.3% ProAssurance Corporation (6.3%) James River Group Holdings, Ltd. NA Projected Growth (CY 2020 to CY 2022E Adjusted Net Income) Workers' Comp Insurers Employers Holdings, Inc. (12.5%) Twins (16.4%) AMERISAFE, Inc. (18.1%) Specialty Insurers Palomar Holdings, Inc. 189.2% James River Group Holdings, Ltd. 77.2% W. R. Berkley Corporation 62.7% Kinsale Capital Group, Inc. 46.5% RLI Corp. 24.5% Twins (16.4%) Argo Group International Holdings, Ltd. NA ProAssurance Corporation NA Projected Growth (CY 2022E to CY 2023E Adjusted Net Income) Workers' Comp Insurers Twins 17.4% Employers Holdings, Inc. 16.1% AMERISAFE, Inc. (7.7%) Specialty Insurers Argo Group International Holdings, Ltd. 182.6% ProAssurance Corporation 58.9% James River Group Holdings, Ltd. 37.5% Palomar Holdings, Inc. 32.2% Kinsale Capital Group, Inc. 22.9% Twins 17.4% W. R. Berkley Corporation 12.3% RLI Corp. 9.9% LTM refers to the most recently completed 12-month period for which financial information has been made public, other than for the Company, in which case LTM refers to Latest 12 Months. Source: Bloomberg, Capital IQ, Company management, Management Projections and public filings. CONFIDENTIAL 22
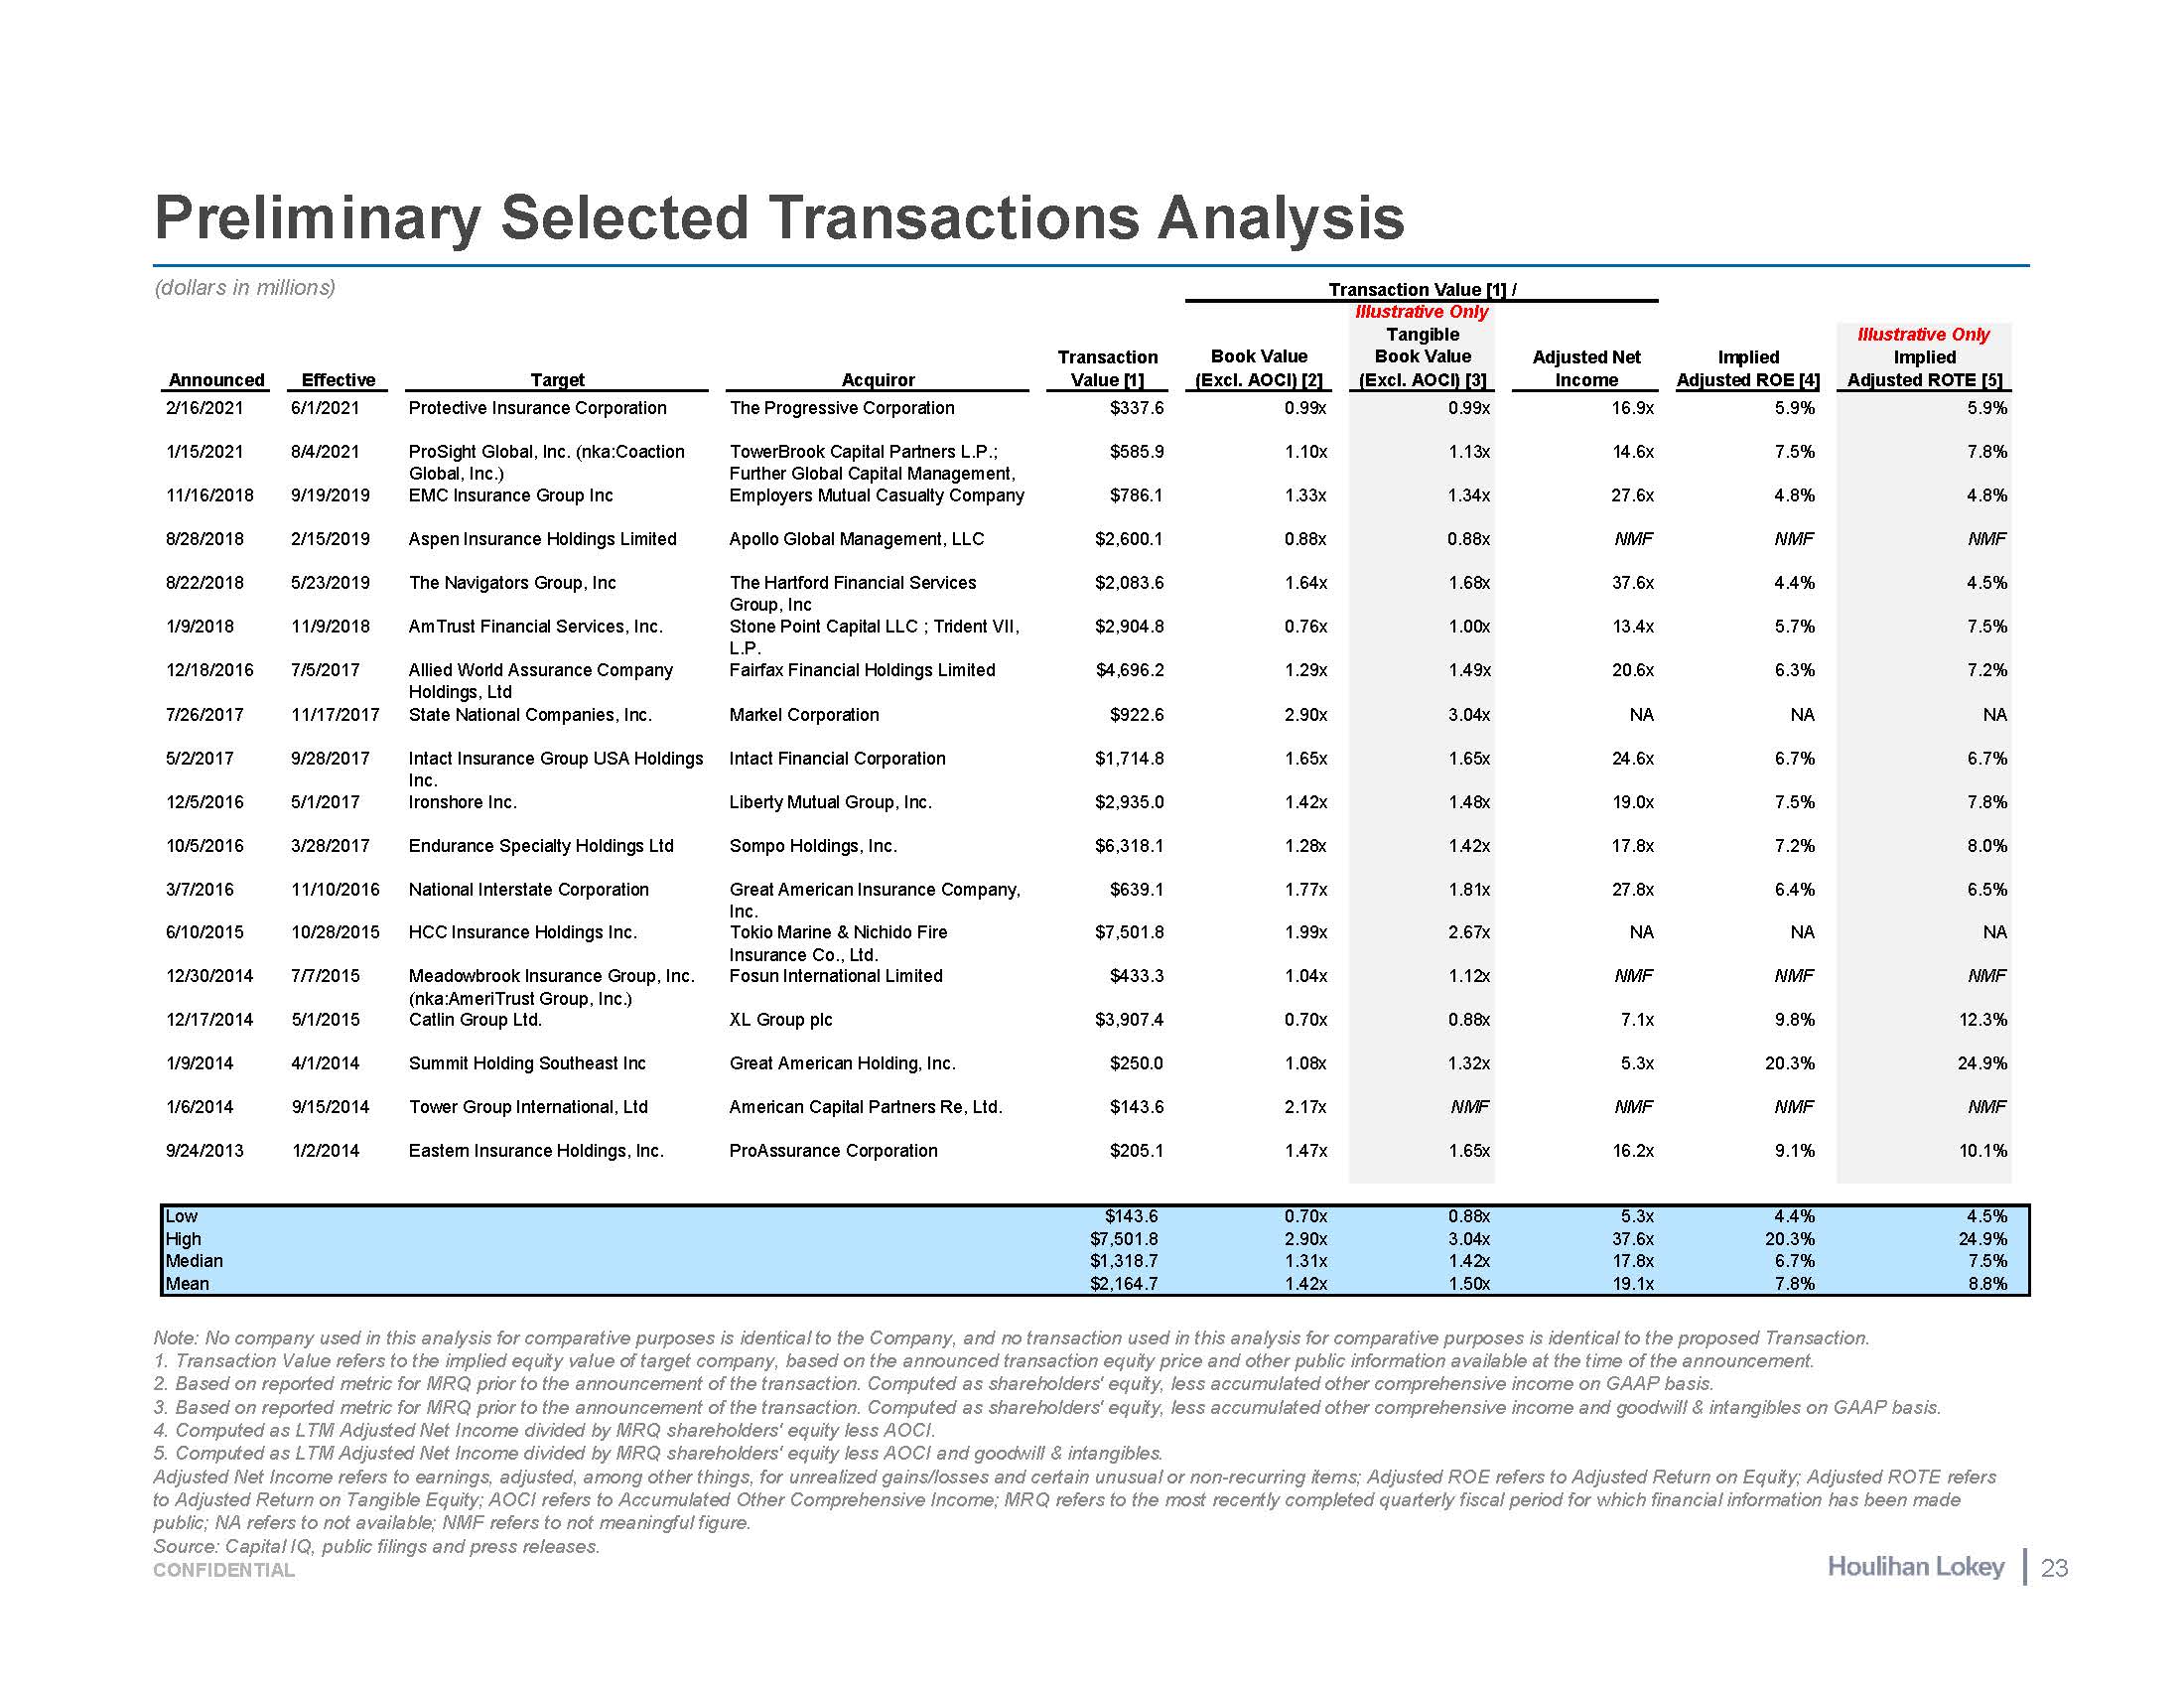
Preliminary Selected Transactions Analysis Note: No company used in this analysis for comparative purposes is identical to the Company, and no transaction used in this analysis for comparative purposes is identical to the proposed Transaction. Transaction Value refers to the implied equity value of target company, based on the announced transaction equity price and other public information available at the time of the announcement. Based on reported metric for MRQ prior to the announcement of the transaction. Computed as shareholders' equity, less accumulated other comprehensive income on GAAP basis. Based on reported metric for MRQ prior to the announcement of the transaction. Computed as shareholders' equity, less accumulated other comprehensive income and goodwill & intangibles on GAAP basis. Computed as LTM Adjusted Net Income divided by MRQ shareholders' equity less AOCI. Computed as LTM Adjusted Net Income divided by MRQ shareholders' equity less AOCI and goodwill & intangibles. Adjusted Net Income refers to earnings, adjusted, among other things, for unrealized gains/losses and certain unusual or non-recurring items; Adjusted ROE refers to Adjusted Return on Equity; Adjusted ROTE refers to Adjusted Return on Tangible Equity; AOCI refers to Accumulated Other Comprehensive Income; MRQ refers to the most recently completed quarterly fiscal period for which financial information has been made public; NA refers to not available; NMF refers to not meaningful figure. (dollars in millions) Transaction Value [1] / Illustrative Only Transaction Book Value Tangible Book Value Adjusted Net Implied Illustrative Only Implied Announced Effective Target Acquiror Value [1] (Excl. AOCI) [2] (Excl. AOCI) [3] Income Adjusted ROE [4] Adjusted ROTE [5] 2/16/2021 6/1/2021 Protective Insurance Corporation The Progressive Corporation $337.6 0.99x 0.99x 16.9x 5.9% 5.9% 1/15/2021 8/4/2021 ProSight Global, Inc. (nka:Coaction TowerBrook Capital Partners L.P.; $585.9 1.10x 1.13x 14.6x 7.5% 7.8% 11/16/2018 9/19/2019 Global, Inc.) Further Global Capital Management, EMC Insurance Group Inc Employers Mutual Casualty Company $786.1 1.33x 1.34x 27.6x 4.8% 4.8% 8/28/2018 2/15/2019 Aspen Insurance Holdings Limited Apollo Global Management, LLC $2,600.1 0.88x 0.88x NMF NMF NMF 8/22/2018 5/23/2019 The Navigators Group, Inc The Hartford Financial Services $2,083.6 1.64x 1.68x 37.6x 4.4% 4.5% 1/9/2018 11/9/2018 Group, Inc AmTrust Financial Services, Inc. Stone Point Capital LLC ; Trident VII, $2,904.8 0.76x 1.00x 13.4x 5.7% 7.5% 12/18/2016 7/5/2017 L.P. Allied World Assurance Company Fairfax Financial Holdings Limited $4,696.2 1.29x 1.49x 20.6x 6.3% 7.2% Holdings, Ltd 7/26/2017 11/17/2017 State National Companies, Inc. Markel Corporation $922.6 2.90x 3.04x NA NA NA 5/2/2017 9/28/2017 Intact Insurance Group USA Holdings Intact Financial Corporation $1,714.8 1.65x 1.65x 24.6x 6.7% 6.7% 12/5/2016 5/1/2017 Inc. Ironshore Inc. Liberty Mutual Group, Inc. $2,935.0 1.42x 1.48x 19.0x 7.5% 7.8% 10/5/2016 3/28/2017 Endurance Specialty Holdings Ltd Sompo Holdings, Inc. $6,318.1 1.28x 1.42x 17.8x 7.2% 8.0% 3/7/2016 11/10/2016 National Interstate Corporation Great American Insurance Company, $639.1 1.77x 1.81x 27.8x 6.4% 6.5% 6/10/2015 10/28/2015 Inc. HCC Insurance Holdings Inc. Tokio Marine & Nichido Fire $7,501.8 1.99x 2.67x NA NA NA 12/30/2014 7/7/2015 Insurance Co., Ltd. Meadowbrook Insurance Group, Inc. Fosun International Limited $433.3 1.04x 1.12x NMF NMF NMF 12/17/2014 5/1/2015 (nka:AmeriTrust Group, Inc.) Catlin Group Ltd. XL Group plc $3,907.4 0.70x 0.88x 7.1x 9.8% 12.3% 1/9/2014 4/1/2014 Summit Holding Southeast Inc Great American Holding, Inc. $250.0 1.08x 1.32x 5.3x 20.3% 24.9% 1/6/2014 9/15/2014 Tower Group International, Ltd American Capital Partners Re, Ltd. $143.6 2.17x NMF NMF NMF NMF 9/24/2013 1/2/2014 Eastern Insurance Holdings, Inc. ProAssurance Corporation $205.1 1.47x 1.65x 16.2x 9.1% 10.1% Low $143.6 0.70x 0.88x 5.3x 4.4% 4.5% High $7,501.8 2.90x 3.04x 37.6x 20.3% 24.9% Median $1,318.7 1.31x 1.42x 17.8x 6.7% 7.5% Mean $2,164.7 1.42x 1.50x 19.1x 7.8% 8.8% Source: Capital IQ, public filings and press releases. CONFIDENTIAL 23
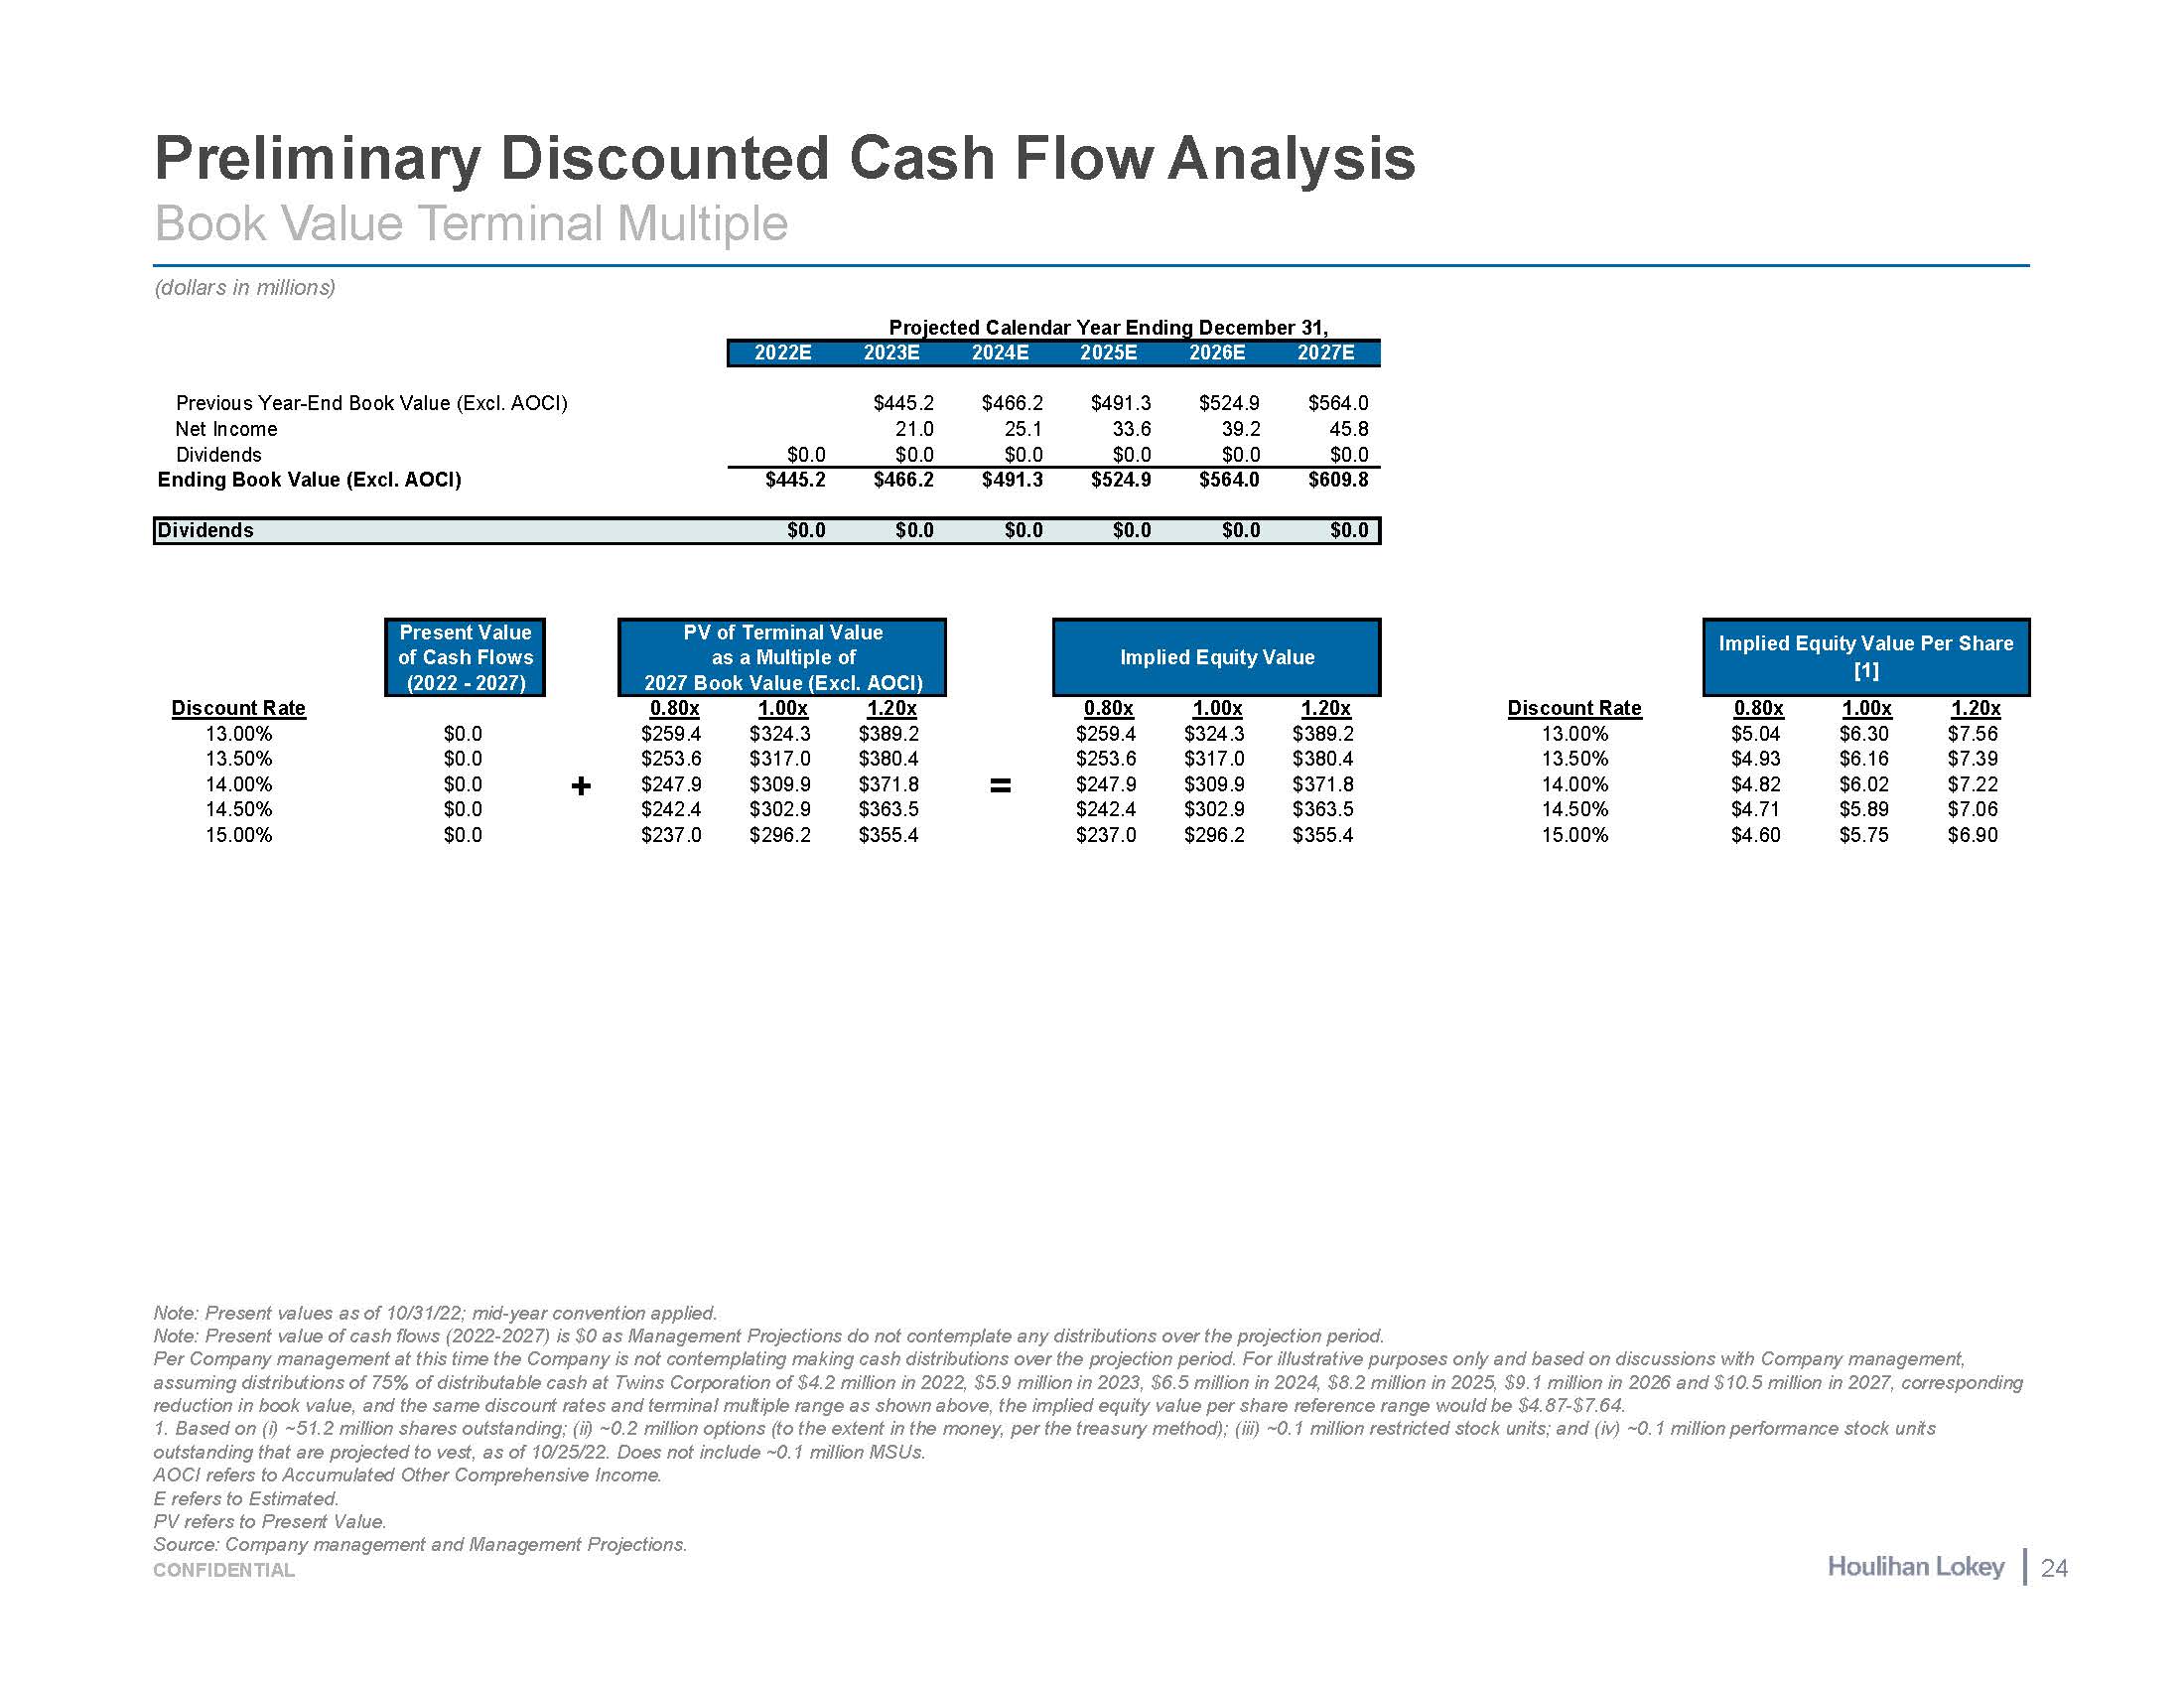
Preliminary Discounted Cash Flow Analysis Book Value Terminal Multiple (dollars in millions) Previous Year-End Book Value (Excl. AOCI) $445.2 $466.2 $491.3 $524.9 $564.0 Net Income 21.0 25.1 33.6 39.2 45.8 Dividends $0.0 $0.0 $0.0 $0.0 $0.0 $0.0 Ending Book Value (Excl. AOCI) $445.2 $466.2 $491.3 $524.9 $564.0 $609.8 Dividends $0.0 $0.0 $0.0 $0.0 $0.0 $0.0 Present Value of Cash Flows (2022 - 2027) Projected Calendar Year Ending December 31, 2022E 2023E 2024E 2025E 2026E 2027E PV of Terminal Value as a Multiple of 2027 Book Value (Excl. AOCI) Discount Rate 13.00% 13.50% $0.0 $0.0 0.80x $259.4 $253.6 1.00x $324.3 $317.0 1.20x $389.2 $380.4 14.00% $0.0 + $247.9 $309.9 $371.8 = $247.9 $309.9 $371.8 14.00% $4.82 $6.02 $7.22 14.50% $0.0 $242.4 $302.9 $363.5 $242.4 $302.9 $363.5 14.50% $4.71 $5.89 $7.06 15.00% $0.0 $237.0 $296.2 $355.4 $237.0 $296.2 $355.4 15.00% $4.60 $5.75 $6.90 Impli ed Equity Value Implied Equity Value [1] Per Share 0.80x 1.00x 1.20x Discount Rate 0.80x 1.00x 1.20x $259.4 $324.3 $389.2 13.00% $5.04 $6.30 $7.56 $253.6 $317.0 $380.4 13.50% $4.93 $6.16 $7.39 Note: Present values as of 10/31/22; mid-year convention applied. Note: Present value of cash flows (2022-2027) is $0 as Management Projections do not contemplate any distributions over the projection period. Per Company management at this time the Company is not contemplating making cash distributions over the projection period. For illustrative purposes only and based on discussions with Company management, assuming distributions of 75% of distributable cash at Twins Corporation of $4.2 million in 2022, $5.9 million in 2023, $6.5 million in 2024, $8.2 million in 2025, $9.1 million in 2026 and $10.5 million in 2027, corresponding reduction in book value, and the same discount rates and terminal multiple range as shown above, the implied equity value per share reference range would be $4.87-$7.64. 1. Based on (i) ~51.2 million shares outstanding; (ii) ~0.2 million options (to the extent in the money, per the treasury method); (iii) ~0.1 million restricted stock units; and (iv) ~0.1 million performance stock units outstanding that are projected to vest, as of 10/25/22. Does not include ~0.1 million MSUs. AOCI refers to Accumulated Other Comprehensive Income. E refers to Estimated. PV refers to Present Value. Source: Company management and Management Projections. CONFIDENTIAL 24
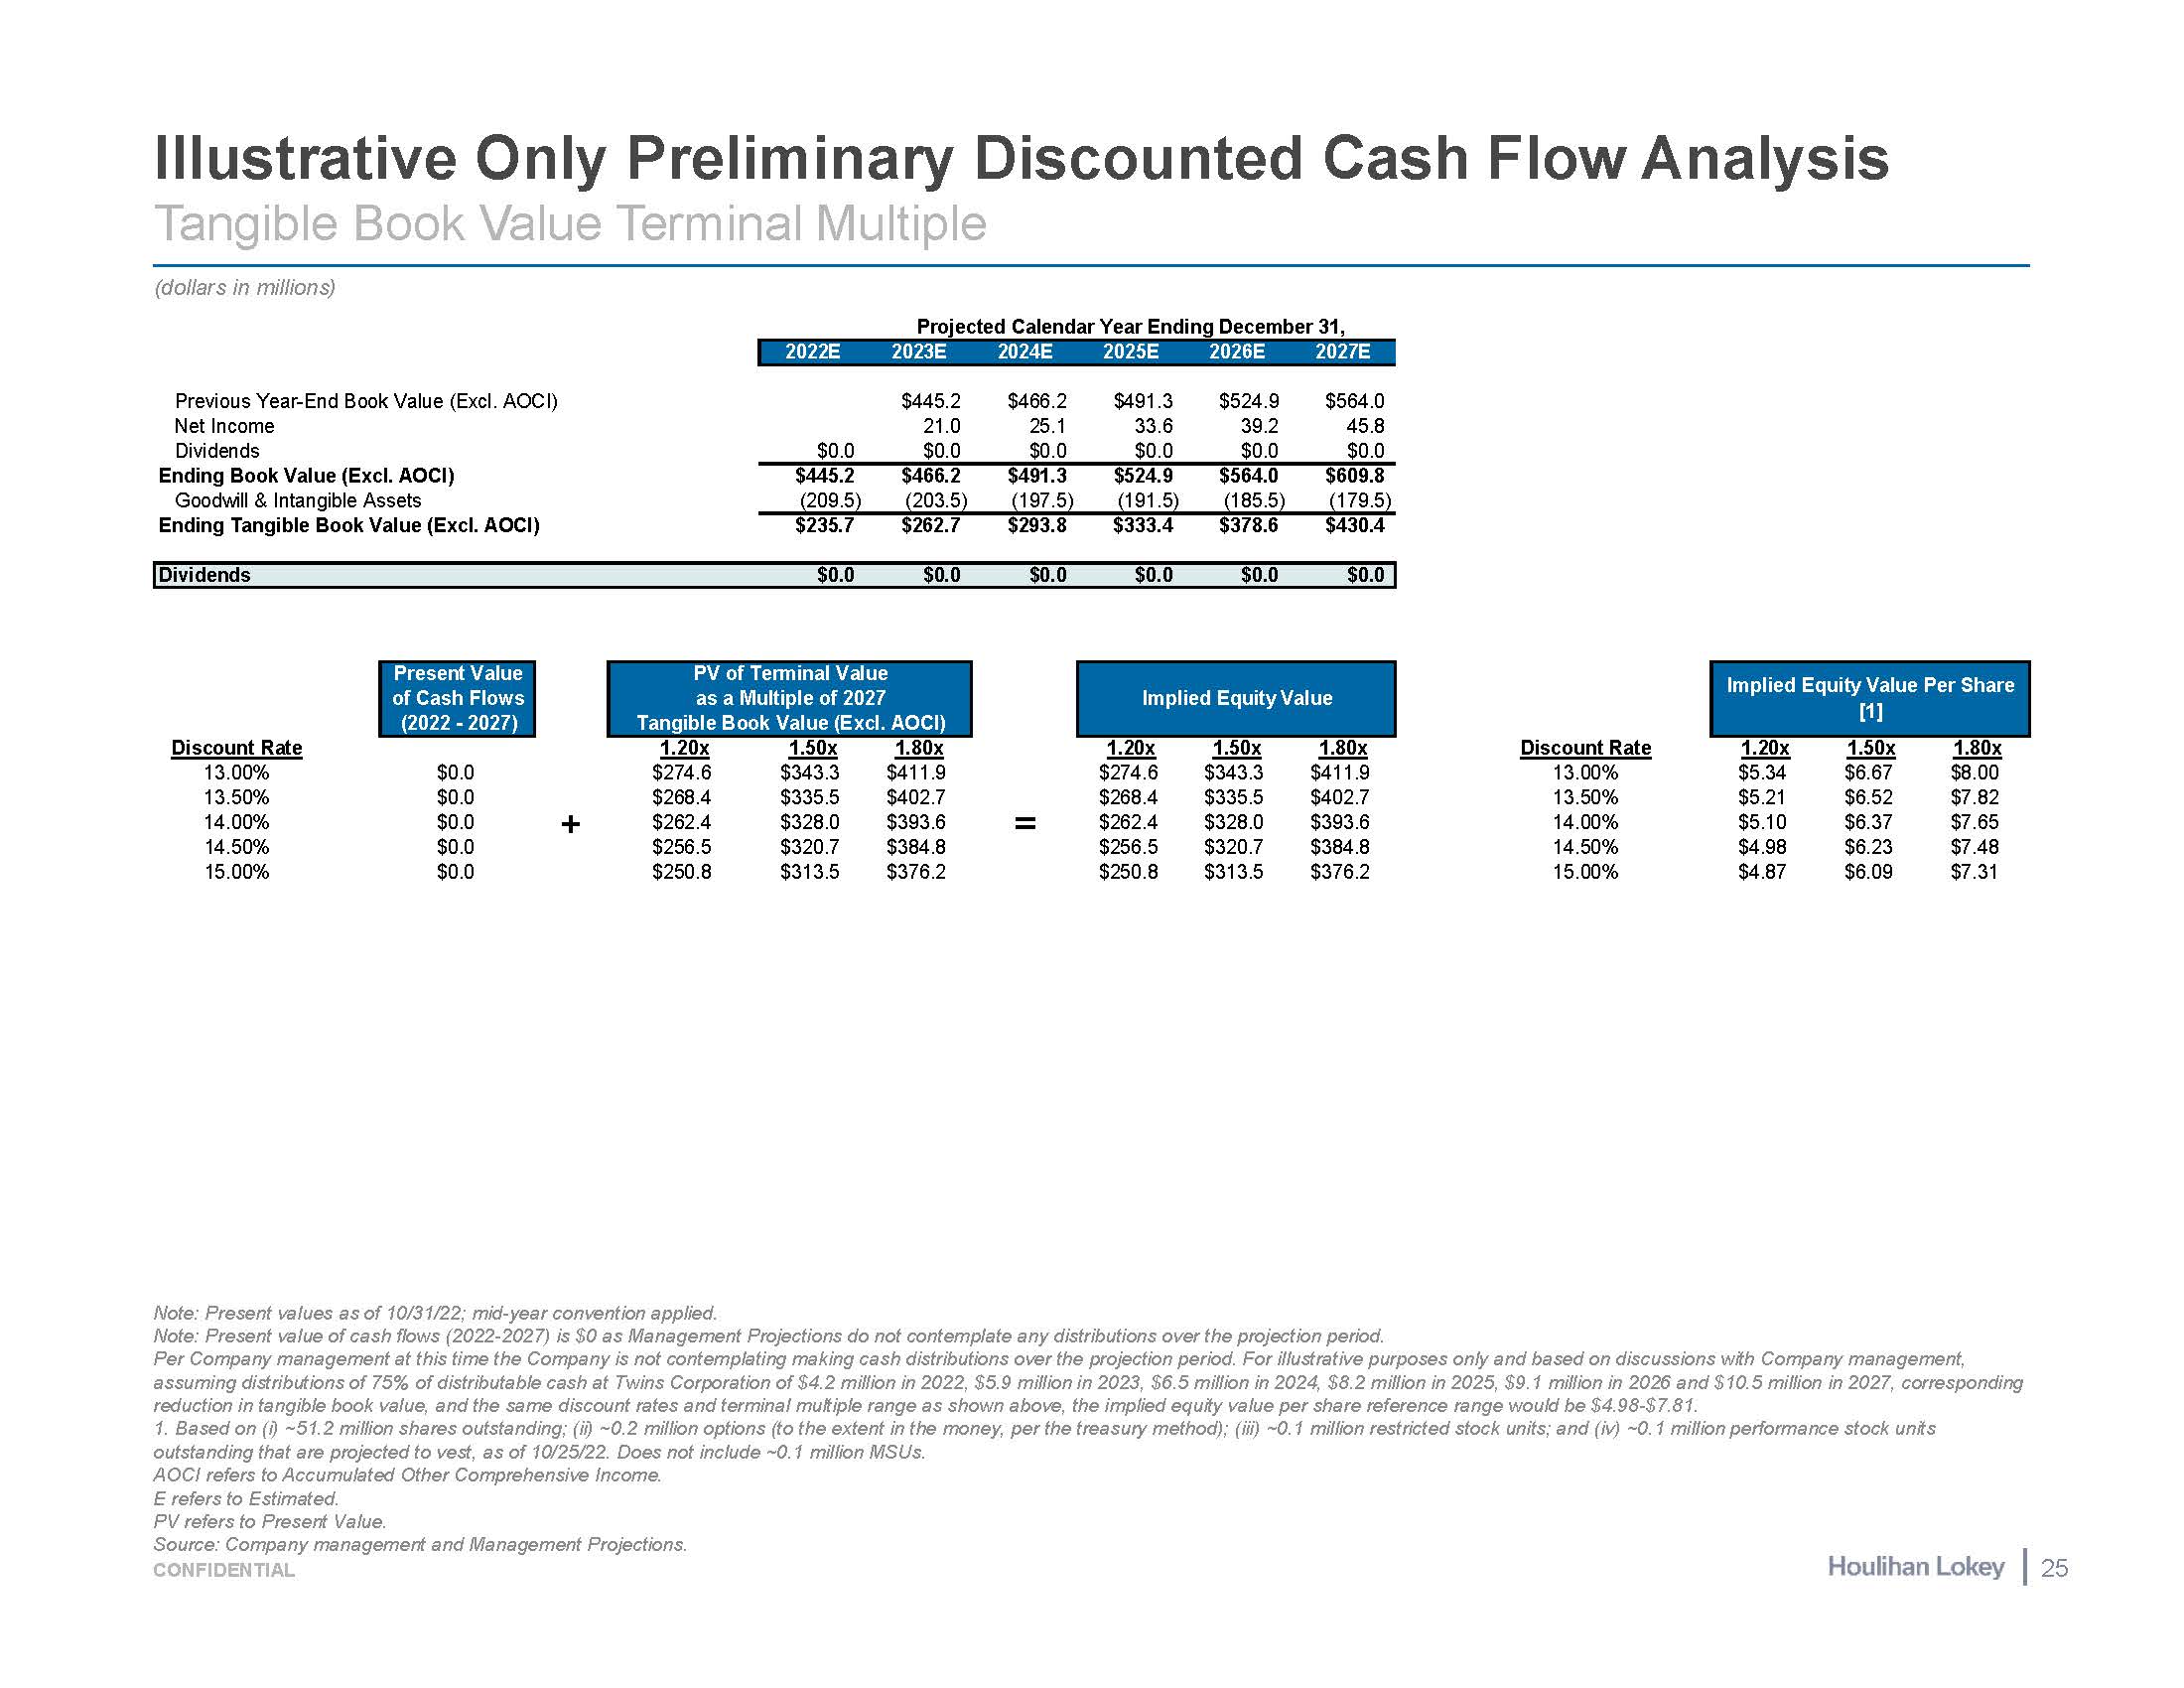
Illustrative Only Preliminary Discounted Cash Flow Analysis Tangible Book Value Terminal Multiple (dollars in millions) Previous Year-End Book Value (Excl. AOCI) $445.2 $466.2 $491.3 $524.9 $564.0 Net Income 21.0 25.1 33.6 39.2 45.8 Dividends $0.0 $0.0 $0.0 $0.0 $0.0 $0.0 Ending Book Value (Excl. AOCI) $445.2 $466.2 $491.3 $524.9 $564.0 $609.8 Goodwill & Intangible Assets (209.5) (203.5) (197.5) (191.5) (185.5) (179.5) Ending Tangible Book Value (Excl. AOCI) $235.7 $262.7 $293.8 $333.4 $378.6 $430.4 Dividends $0.0 $0.0 $0.0 $0.0 $0.0 $0.0 Present Value of Cash Flows (2022 - 2027) Projected Calendar Year Ending December 31, 2022E 2023E 2024E 2025E 2026E 2027E PV of Terminal Value as a Multiple of 2027 Tangible Book Value (Excl. AOCI) Discount Rate 13.00% 13.50% $0.0 $0.0 1.20x $274.6 $268.4 1.50x $343.3 $335.5 1.80x $411.9 $402.7 14.00% $0.0 + $262.4 $328.0 $393.6 = $262.4 $328.0 $393.6 14.00% $5.10 $6.37 $7.65 14.50% $0.0 $256.5 $320.7 $384.8 $256.5 $320.7 $384.8 14.50% $4.98 $6.23 $7.48 15.00% $0.0 $250.8 $313.5 $376.2 $250.8 $313.5 $376.2 15.00% $4.87 $6.09 $7.31 Impl ied Equity Value Implied Equity Value [1] Per Share 1.20x 1.50x 1.80x Discount Rate 1.20x 1.50x 1.80x $274.6 $343.3 $411.9 13.00% $5.34 $6.67 $8.00 $268.4 $335.5 $402.7 13.50% $5.21 $6.52 $7.82 Note: Present values as of 10/31/22; mid-year convention applied. Note: Present value of cash flows (2022-2027) is $0 as Management Projections do not contemplate any distributions over the projection period. Per Company management at this time the Company is not contemplating making cash distributions over the projection period. For illustrative purposes only and based on discussions with Company management, assuming distributions of 75% of distributable cash at Twins Corporation of $4.2 million in 2022, $5.9 million in 2023, $6.5 million in 2024, $8.2 million in 2025, $9.1 million in 2026 and $10.5 million in 2027, corresponding reduction in tangible book value, and the same discount rates and terminal multiple range as shown above, the implied equity value per share reference range would be $4.98-$7.81. 1. Based on (i) ~51.2 million shares outstanding; (ii) ~0.2 million options (to the extent in the money, per the treasury method); (iii) ~0.1 million restricted stock units; and (iv) ~0.1 million performance stock units outstanding that are projected to vest, as of 10/25/22. Does not include ~0.1 million MSUs. AOCI refers to Accumulated Other Comprehensive Income. E refers to Estimated. PV refers to Present Value. Source: Company management and Management Projections. CONFIDENTIAL 25
Page 3 5 15 Executive Summary Selected Company Observations Preliminary Financial Considerations 4. Other Proposal Considerations 26 5. Appendices 36
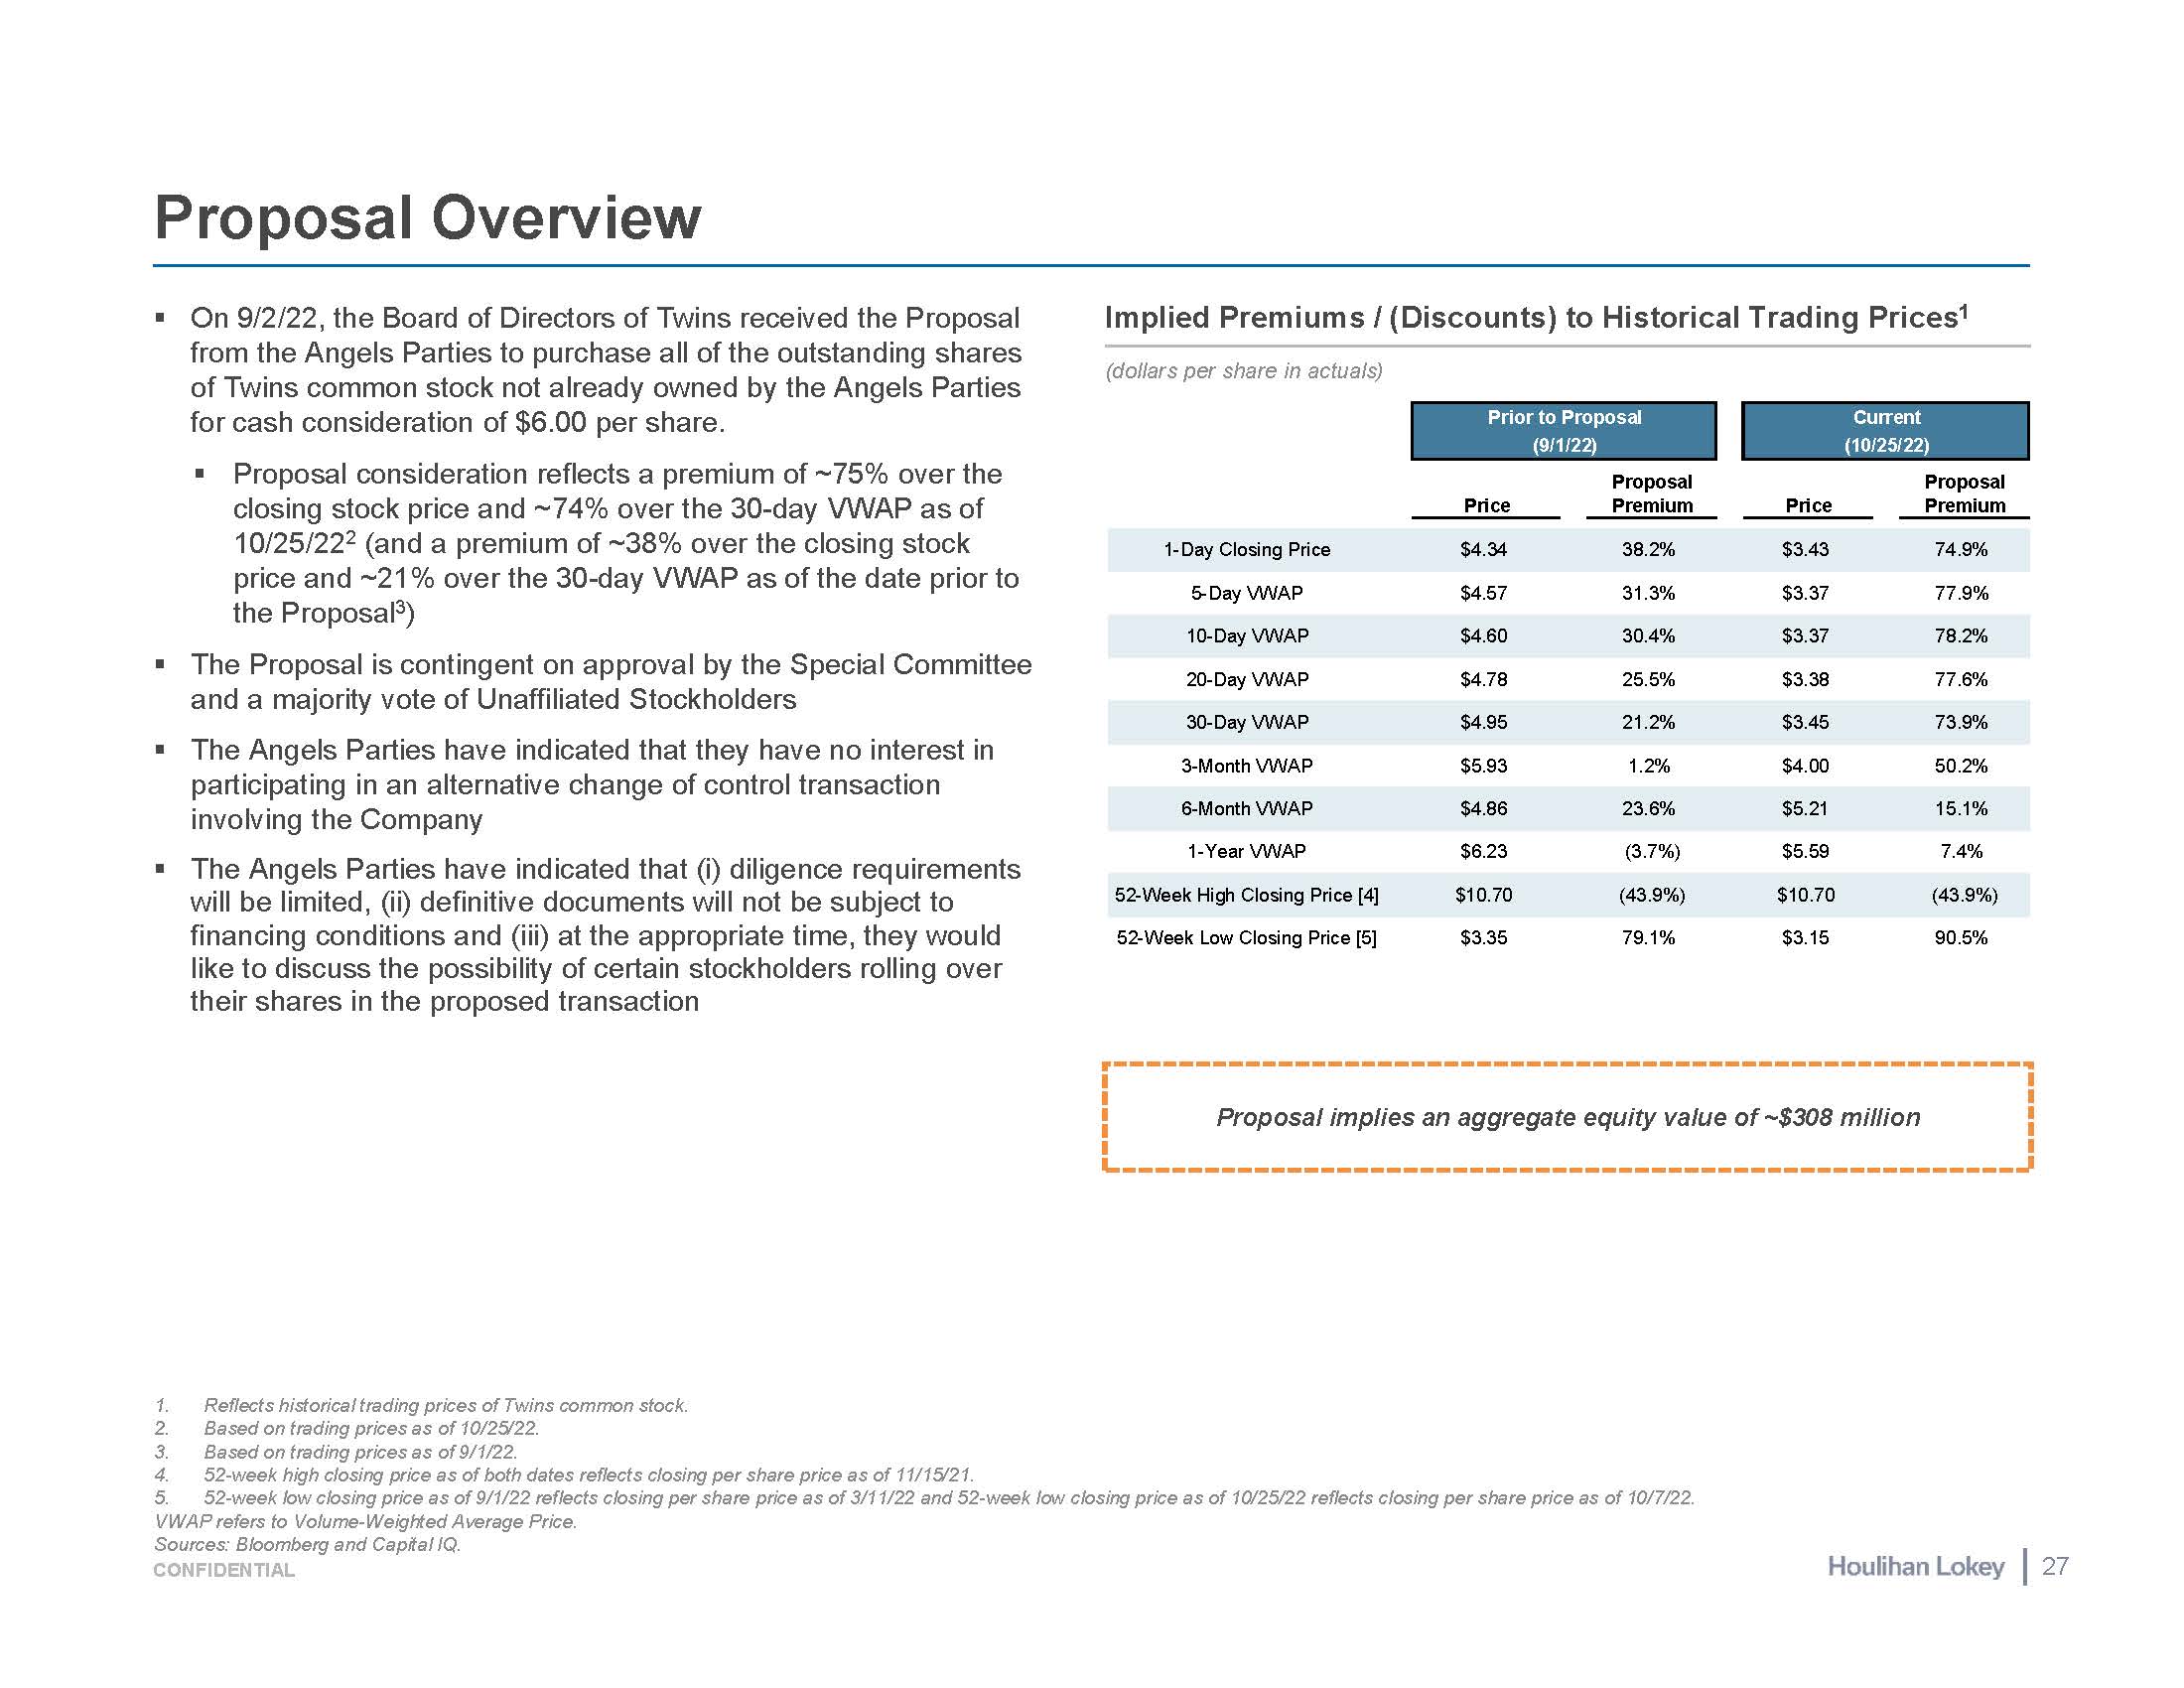
Proposal Overview Reflects historical trading prices of Twins common stock. Based on trading prices as of 10/25/22. Based on trading prices as of 9/1/22. 52-week high closing price as of both dates reflects closing per share price as of 11/15/21. 52-week low closing price as of 9/1/22 reflects closing per share price as of 3/11/22 and 52-week low closing price as of 10/25/22 reflects closing per share price as of 10/7/22. VWAP refers to Volume-Weighted Average Price. Sources: Bloomberg and Capital IQ. On 9/2/22, the Board of Directors of Twins received the Proposal from the Angels Parties to purchase all of the outstanding shares of Twins common stock not already owned by the Angels Parties for cash consideration of $6.00 per share. Proposal consideration reflects a premium of ~75% over the closing stock price and ~74% over the 30-day VWAP as of 10/25/222 (and a premium of ~38% over the closing stock price and ~21% over the 30-day VWAP as of the date prior to the Proposal3) The Proposal is contingent on approval by the Special Committee and a majority vote of Unaffiliated Stockholders The Angels Parties have indicated that they have no interest in participating in an alternative change of control transaction involving the Company The Angels Parties have indicated that (i) diligence requirements will be limited, (ii) definitive documents will not be subject to financing conditions and (iii) at the appropriate time, they would like to discuss the possibility of certain stockholders rolling over their shares in the proposed transaction Proposal implies an aggregate equity value of ~$308 million (dollars per share in actuals) Implied Premiums / (Discounts) to Historical Trading Prices1 27 CONFIDENTIAL Price Proposal Premium Price Proposal Premium 1-Day Closing Price $4.34 38.2% $3.43 74.9% 5-Day VWAP $4.57 31.3% $3.37 77.9% 10-Day VWAP $4.60 30.4% $3.37 78.2% 20-Day VWAP $4.78 25.5% $3.38 77.6% 30-Day VWAP $4.95 21.2% $3.45 73.9% 3-Month VWAP $5.93 1.2% $4.00 50.2% 6-Month VWAP $4.86 23.6% $5.21 15.1% 1-Year VWAP $6.23 (3.7%) $5.59 7.4% 52-Week High Closing Price [4] $10.70 (43.9%) $10.70 (43.9%) 52-Week Low Closing Price [5] $3.35 79.1% $3.15 90.5% Prior to Proposal (9/1/22) Current (10/25/22)
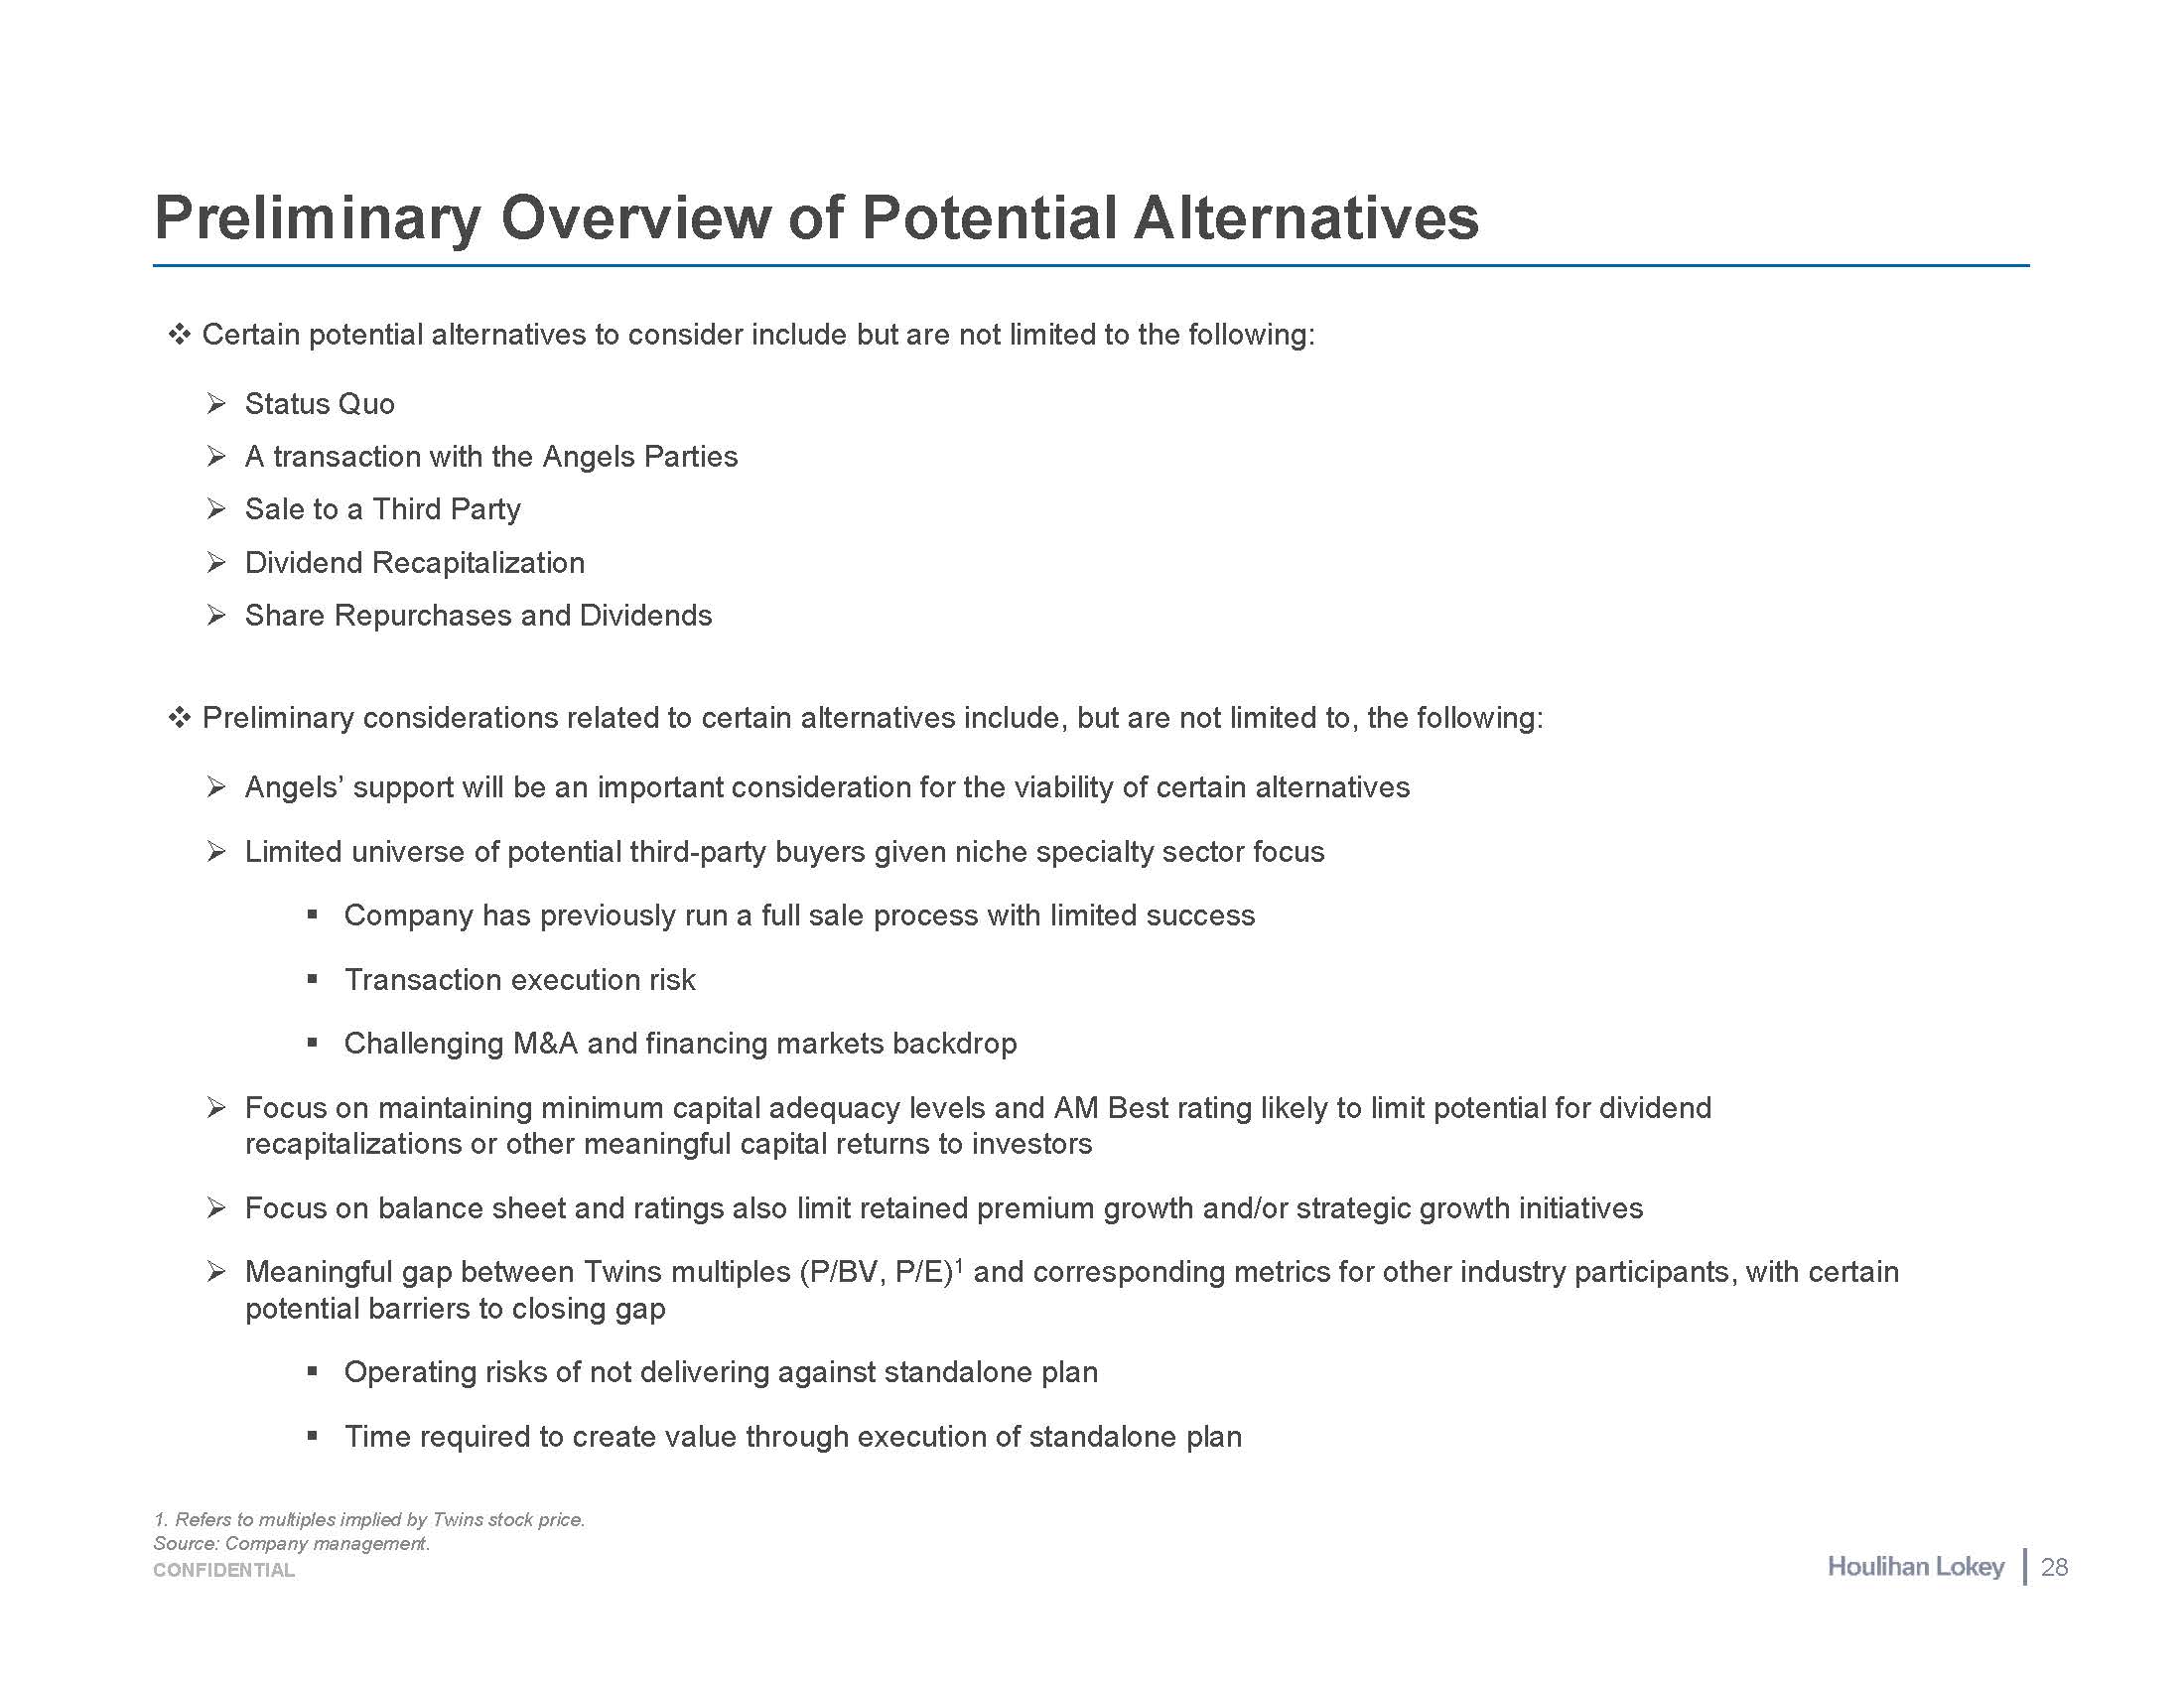
Preliminary Overview of Potential Alternatives 27 CONFIDENTIAL Certain potential alternatives to consider include but are not limited to the following: Status Quo A transaction with the Angels Parties Sale to a Third Party Dividend Recapitalization Share Repurchases and Dividends Preliminary considerations related to certain alternatives include, but are not limited to, the following: Angels’ support will be an important consideration for the viability of certain alternatives Limited universe of potential third-party buyers given niche specialty sector focus Company has previously run a full sale process with limited success Transaction execution risk Challenging M&A and financing markets backdrop Focus on maintaining minimum capital adequacy levels and AM Best rating likely to limit potential for dividend recapitalizations or other meaningful capital returns to investors Focus on balance sheet and ratings also limit retained premium growth and/or strategic growth initiatives Meaningful gap between Twins multiples (P/BV, P/E)1 and corresponding metrics for other industry participants, with certain potential barriers to closing gap Operating risks of not delivering against standalone plan Time required to create value through execution of standalone plan 1. Refers to multiples implied by Twins stock price. Source: Company management.
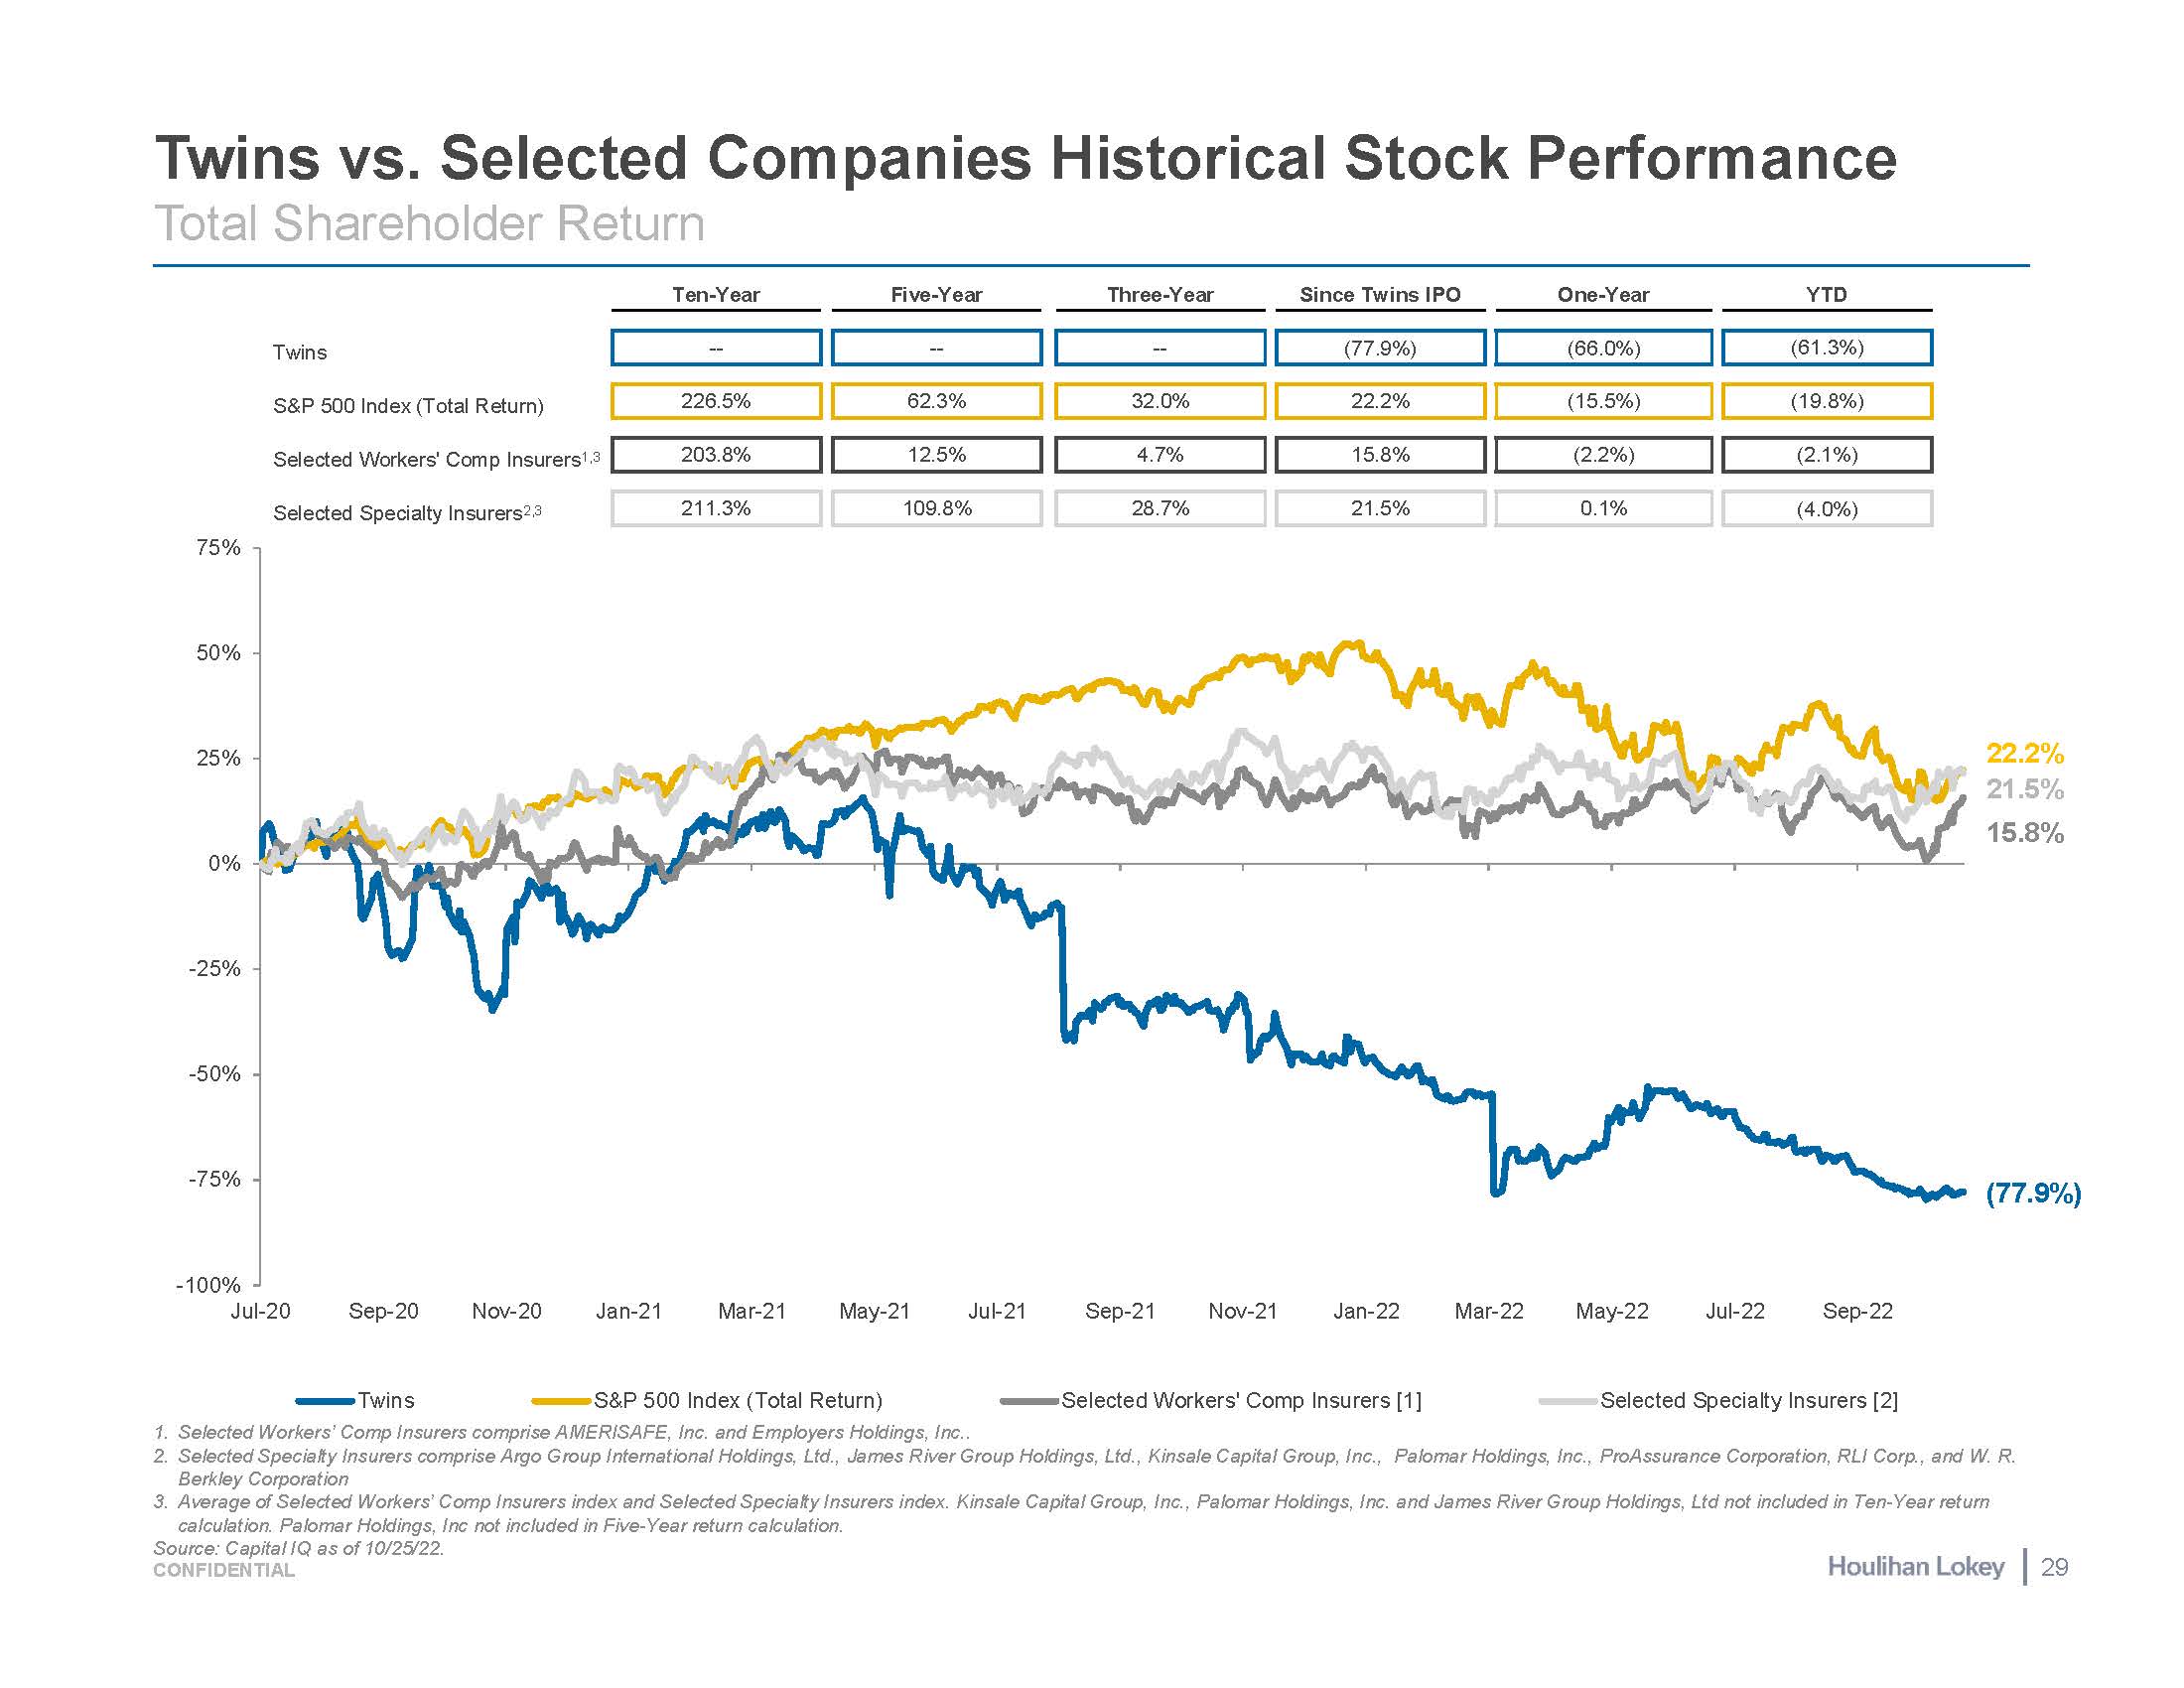
Twins vs. Selected Companies Historical Stock Performance 22.2% 21.5% 15.8% (77.9%) -- -- -- (77.9%) (66.0%) (61.3%) 226.5% 62.3% 32.0% 22.2% (15.5%) (19.8%) 203.8% 12.5% 4.7% 15.8% (2.2%) (2.1%) 211.3% 109.8% 28.7% 21.5% 0.1% (4.0%) Total Shareholder Return Ten-Year Five-Year Three-Year Since Twins IPO One-Year YTD Twins S&P 500 Index (Total Return) Selected Workers' Comp Insurers1,3 Selected Specialty Insurers2,3 75% -100% -75% -50% -25% 0% 25% 50% Jul-20 Sep-20 Nov-20 Jan-21 Mar-21 May-21 Jul-21 Sep-21 Nov-21 Jan-22 Mar-22 May-22 Jul-22 Sep-22 Twins S&P 500 Index (Total Return) Selected Workers' Comp Insurers [1] Selected Specialty Insurers [2] Selected Workers’ Comp Insurers comprise AMERISAFE, Inc. and Employers Holdings, Inc.. Selected Specialty Insurers comprise Argo Group International Holdings, Ltd., James River Group Holdings, Ltd., Kinsale Capital Group, Inc., Palomar Holdings, Inc., ProAssurance Corporation, RLI Corp., and W. R. Berkley Corporation Average of Selected Workers’ Comp Insurers index and Selected Specialty Insurers index. Kinsale Capital Group, Inc., Palomar Holdings, Inc. and James River Group Holdings, Ltd not included in Ten-Year return calculation. Palomar Holdings, Inc not included in Five-Year return calculation. Source: Capital IQ as of 10/25/22. CONFIDENTIAL 29
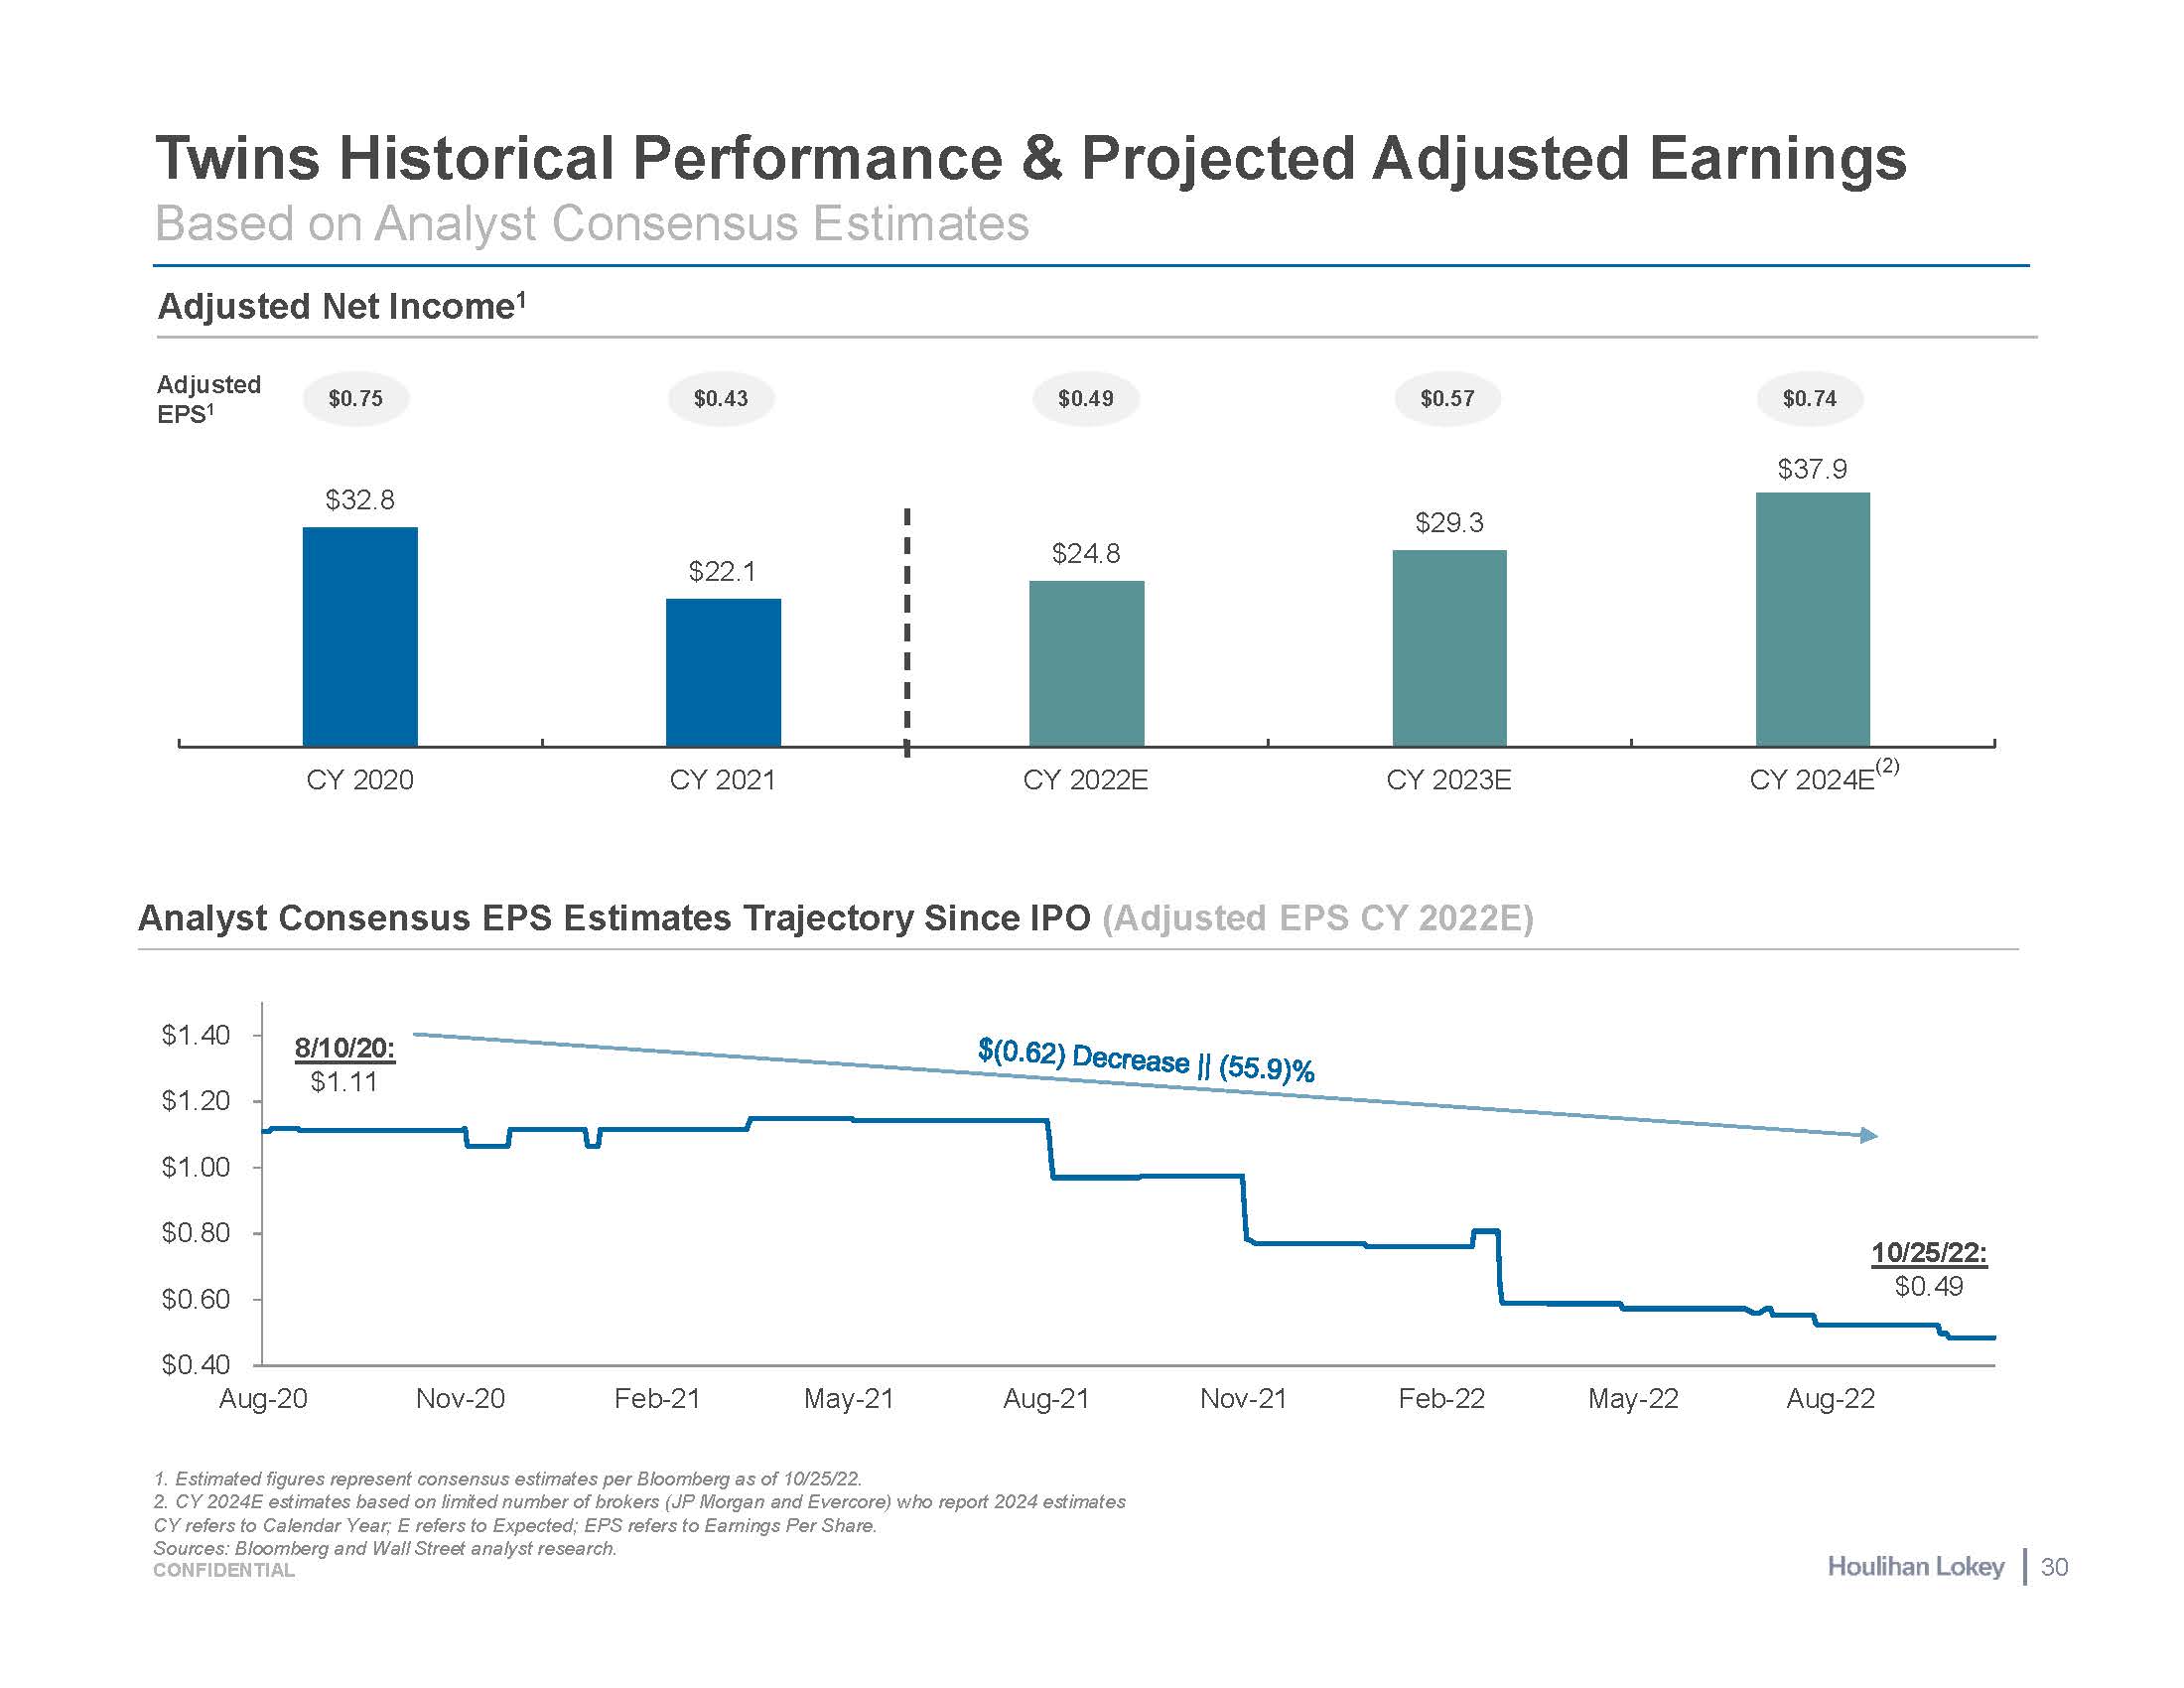
$0.40 $0.60 $0.80 $1.00 $1.20 $1.40 Aug-20 Nov-20 Feb-21 May-21 Aug-21 Nov-21 Feb-22 May-22 Aug-22 $32.8 $22.1 $24.8 $29.3 $37.9 CY 2020 CY 2021 CY 2022E CY 2023E CY 2024E(2) Analyst Consensus EPS Estimates Trajectory Since IPO (Adjusted EPS CY 2022E) Estimated figures represent consensus estimates per Bloomberg as of 10/25/22. CY 2024E estimates based on limited number of brokers (JP Morgan and Evercore) who report 2024 estimates CY refers to Calendar Year; E refers to Expected; EPS refers to Earnings Per Share. Adjusted Net Income1 8/10/20: $1.11 10/25/22: $0.49 Twins Historical Performance & Projected Adjusted Earnings Based on Analyst Consensus Estimates $0.75 Adjusted EPS1 $0.43 $0.49 $0.57 $0.74 Sources: Bloomberg and Wall Street analyst research. CONFIDENTIAL 30
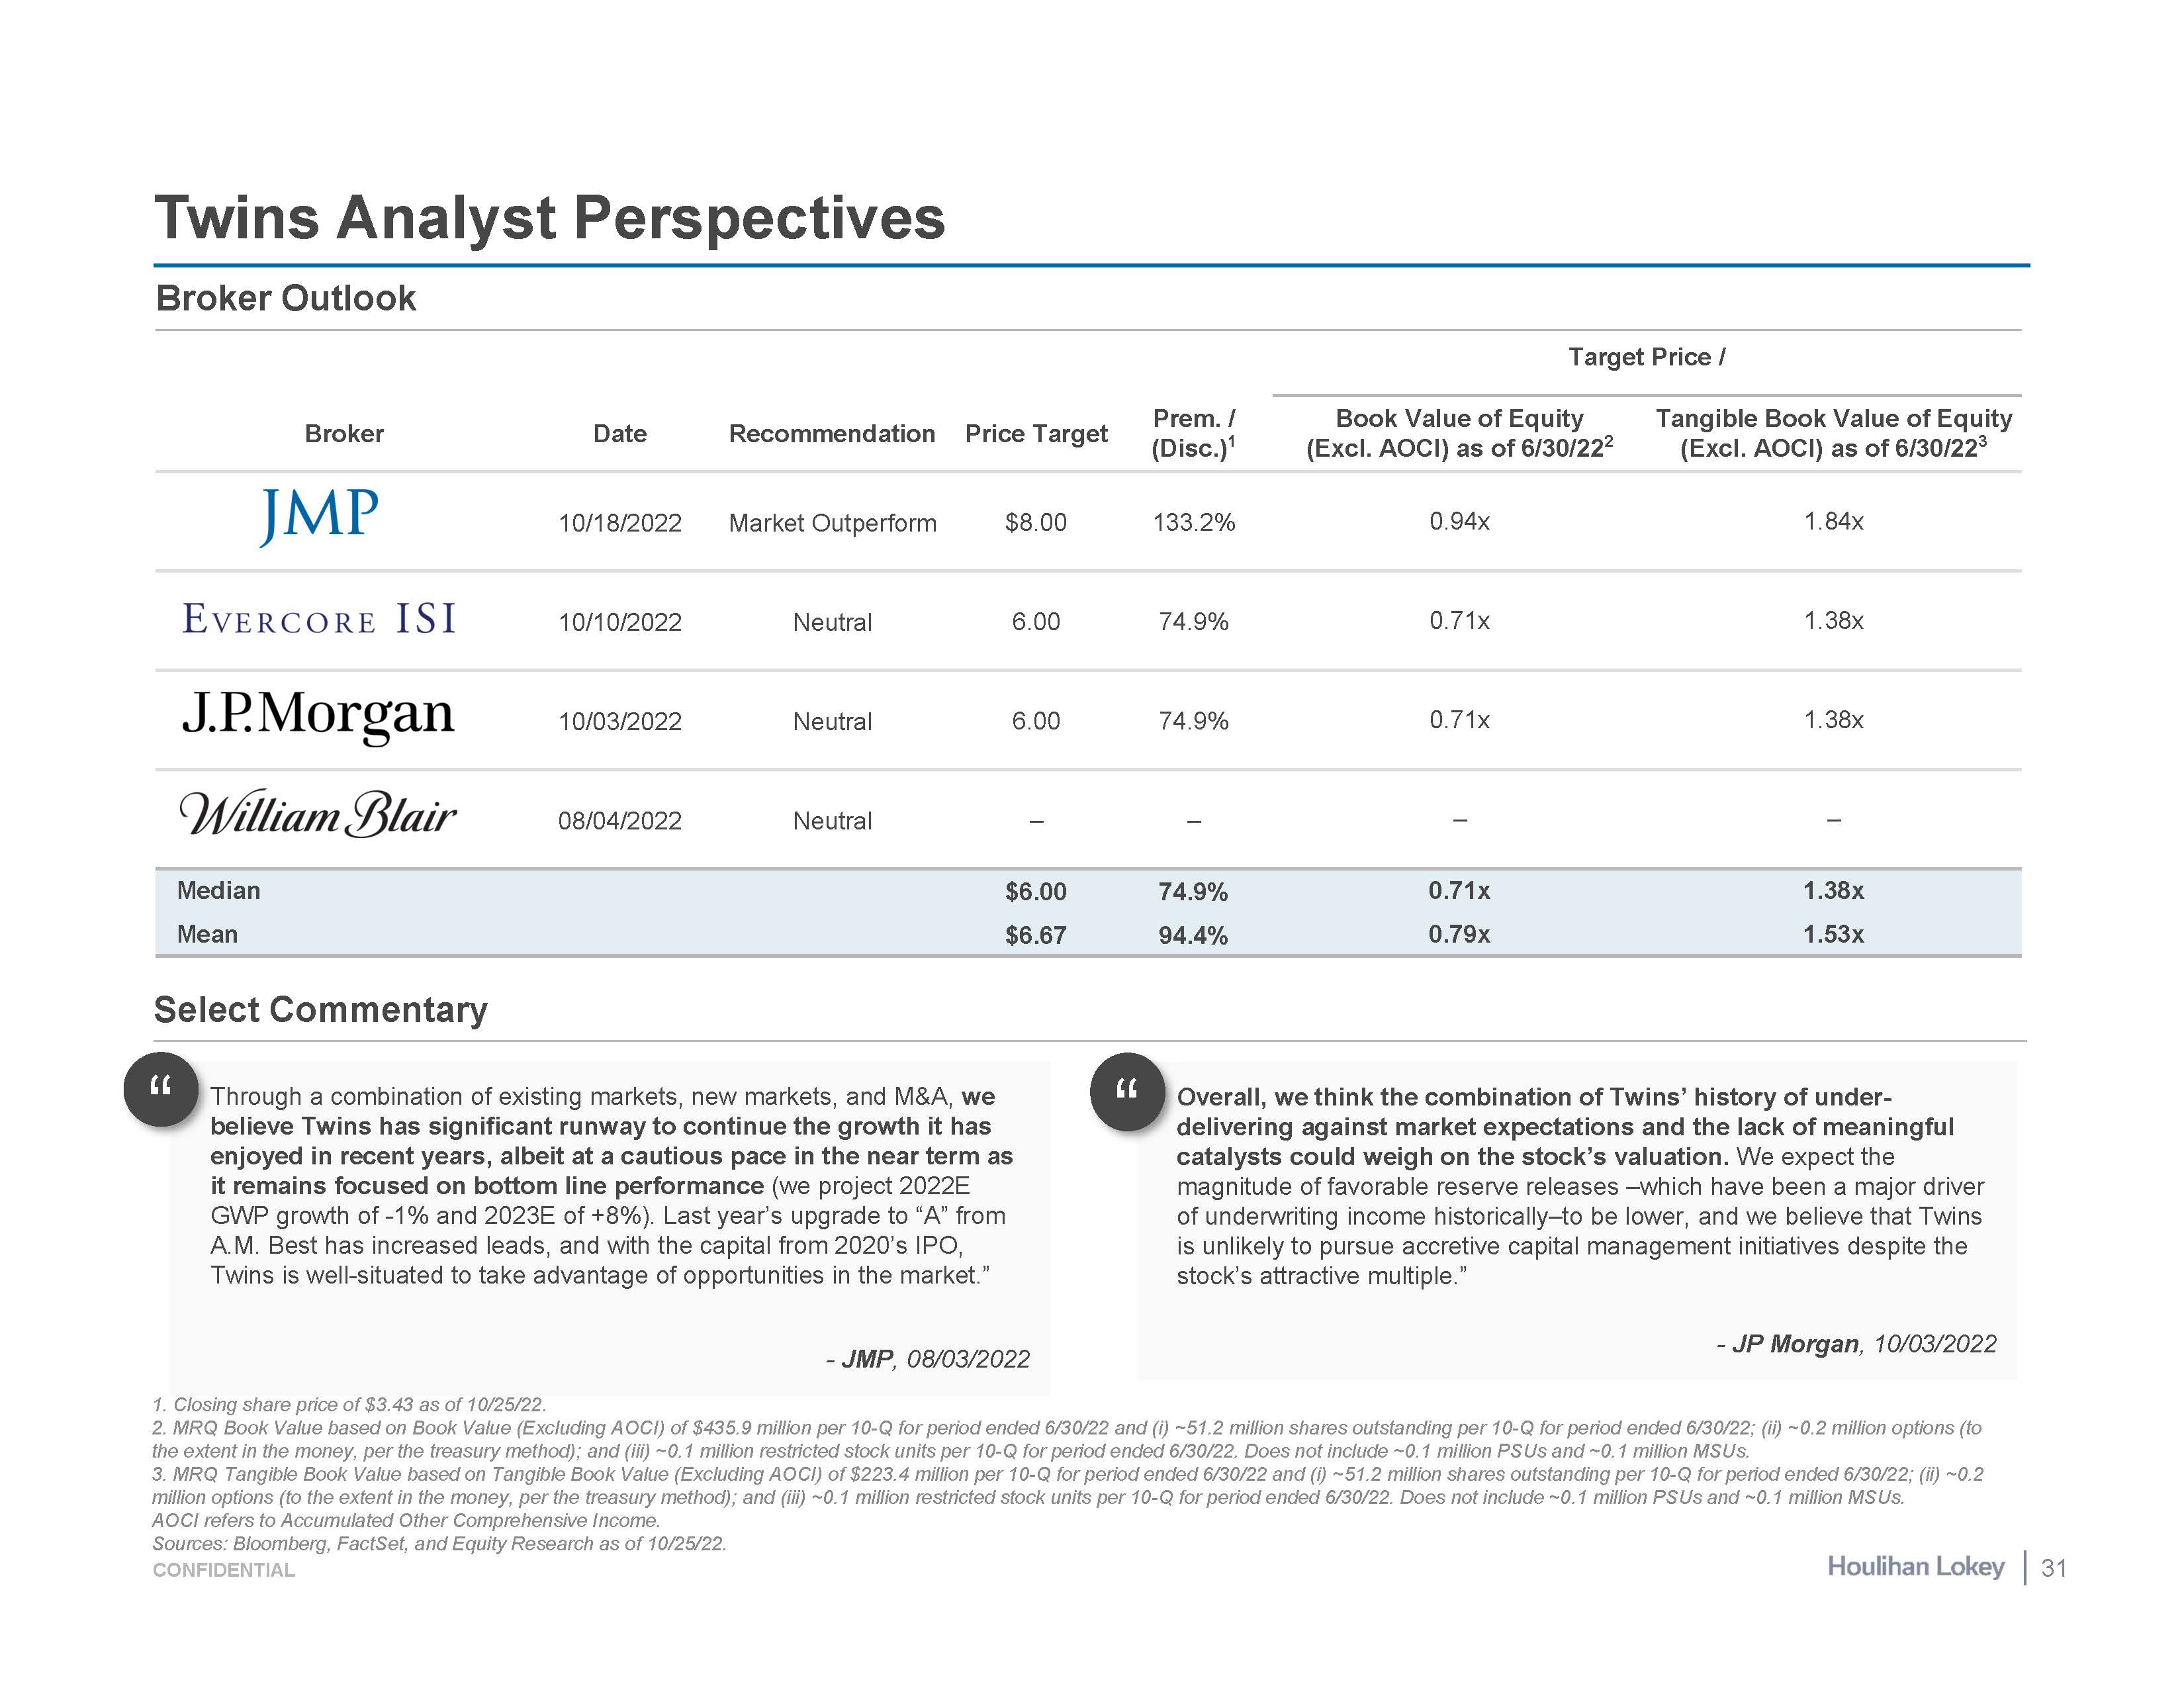
Twins Analyst Perspectives O verall, we think the combination of Twins’ history of under- delivering against market expectations and the lack of meaningful catalysts could weigh on the stock’s valuation. We expect the magnitude of favorable reserve releases –which have been a major driver of underwriting income historically–to be lower, and we believe that Twins is unlikely to pursue accretive capital management initiatives despite the stock’s attractive multiple.” - JP Morgan, 10/03/2022 “ Broker Date Recommendation Price Target Prem. / (Disc.)1 Book Value of Equity (Excl. AOCI) as of 6/30/222 Tangible Book Value of Equity (Excl. AOCI) as of 6/30/223 10/18/2022 Market Outperform $8.00 133.2% 0.94x 1.84x 10/10/2022 Neutral 6.00 74.9% 0.71x 1.38x 10/03/2022 Neutral 6.00 74.9% 0.71x 1.38x 08/04/2022 Neutral – – – – Median $6.00 74.9% 0.71x 1.38x Mean $6.67 94.4% 0.79x 1.53x Target Price / Closing share price of $3.43 as of 10/25/22. MRQ Book Value based on Book Value (Excluding AOCI) of $435.9 million per 10-Q for period ended 6/30/22 and (i) ~51.2 million shares outstanding per 10-Q for period ended 6/30/22; (ii) ~0.2 million options (to the extent in the money, per the treasury method); and (iii) ~0.1 million restricted stock units per 10-Q for period ended 6/30/22. Does not include ~0.1 million PSUs and ~0.1 million MSUs. MRQ Tangible Book Value based on Tangible Book Value (Excluding AOCI) of $223.4 million per 10-Q for period ended 6/30/22 and (i) ~51.2 million shares outstanding per 10-Q for period ended 6/30/22; (ii) ~0.2 million options (to the extent in the money, per the treasury method); and (iii) ~0.1 million restricted stock units per 10-Q for period ended 6/30/22. Does not include ~0.1 million PSUs and ~0.1 million MSUs. AOCI refers to Accumulated Other Comprehensive Income. Select Commentary Broker Outlook b - JMP, 08/03/2022 “ Through a combination of existing markets, new markets, and M&A, we elieve Twins has significant runway to continue the growth it has enjoyed in recent years, albeit at a cautious pace in the near term as it remains focused on bottom line performance (we project 2022E GWP growth of -1% and 2023E of +8%). Last year’s upgrade to “A” from A.M. Best has increased leads, and with the capital from 2020’s IPO, Twins is well-situated to take advantage of opportunities in the market.” Sources: Bloomberg, FactSet, and Equity Research as of 10/25/22. CONFIDENTIAL 31
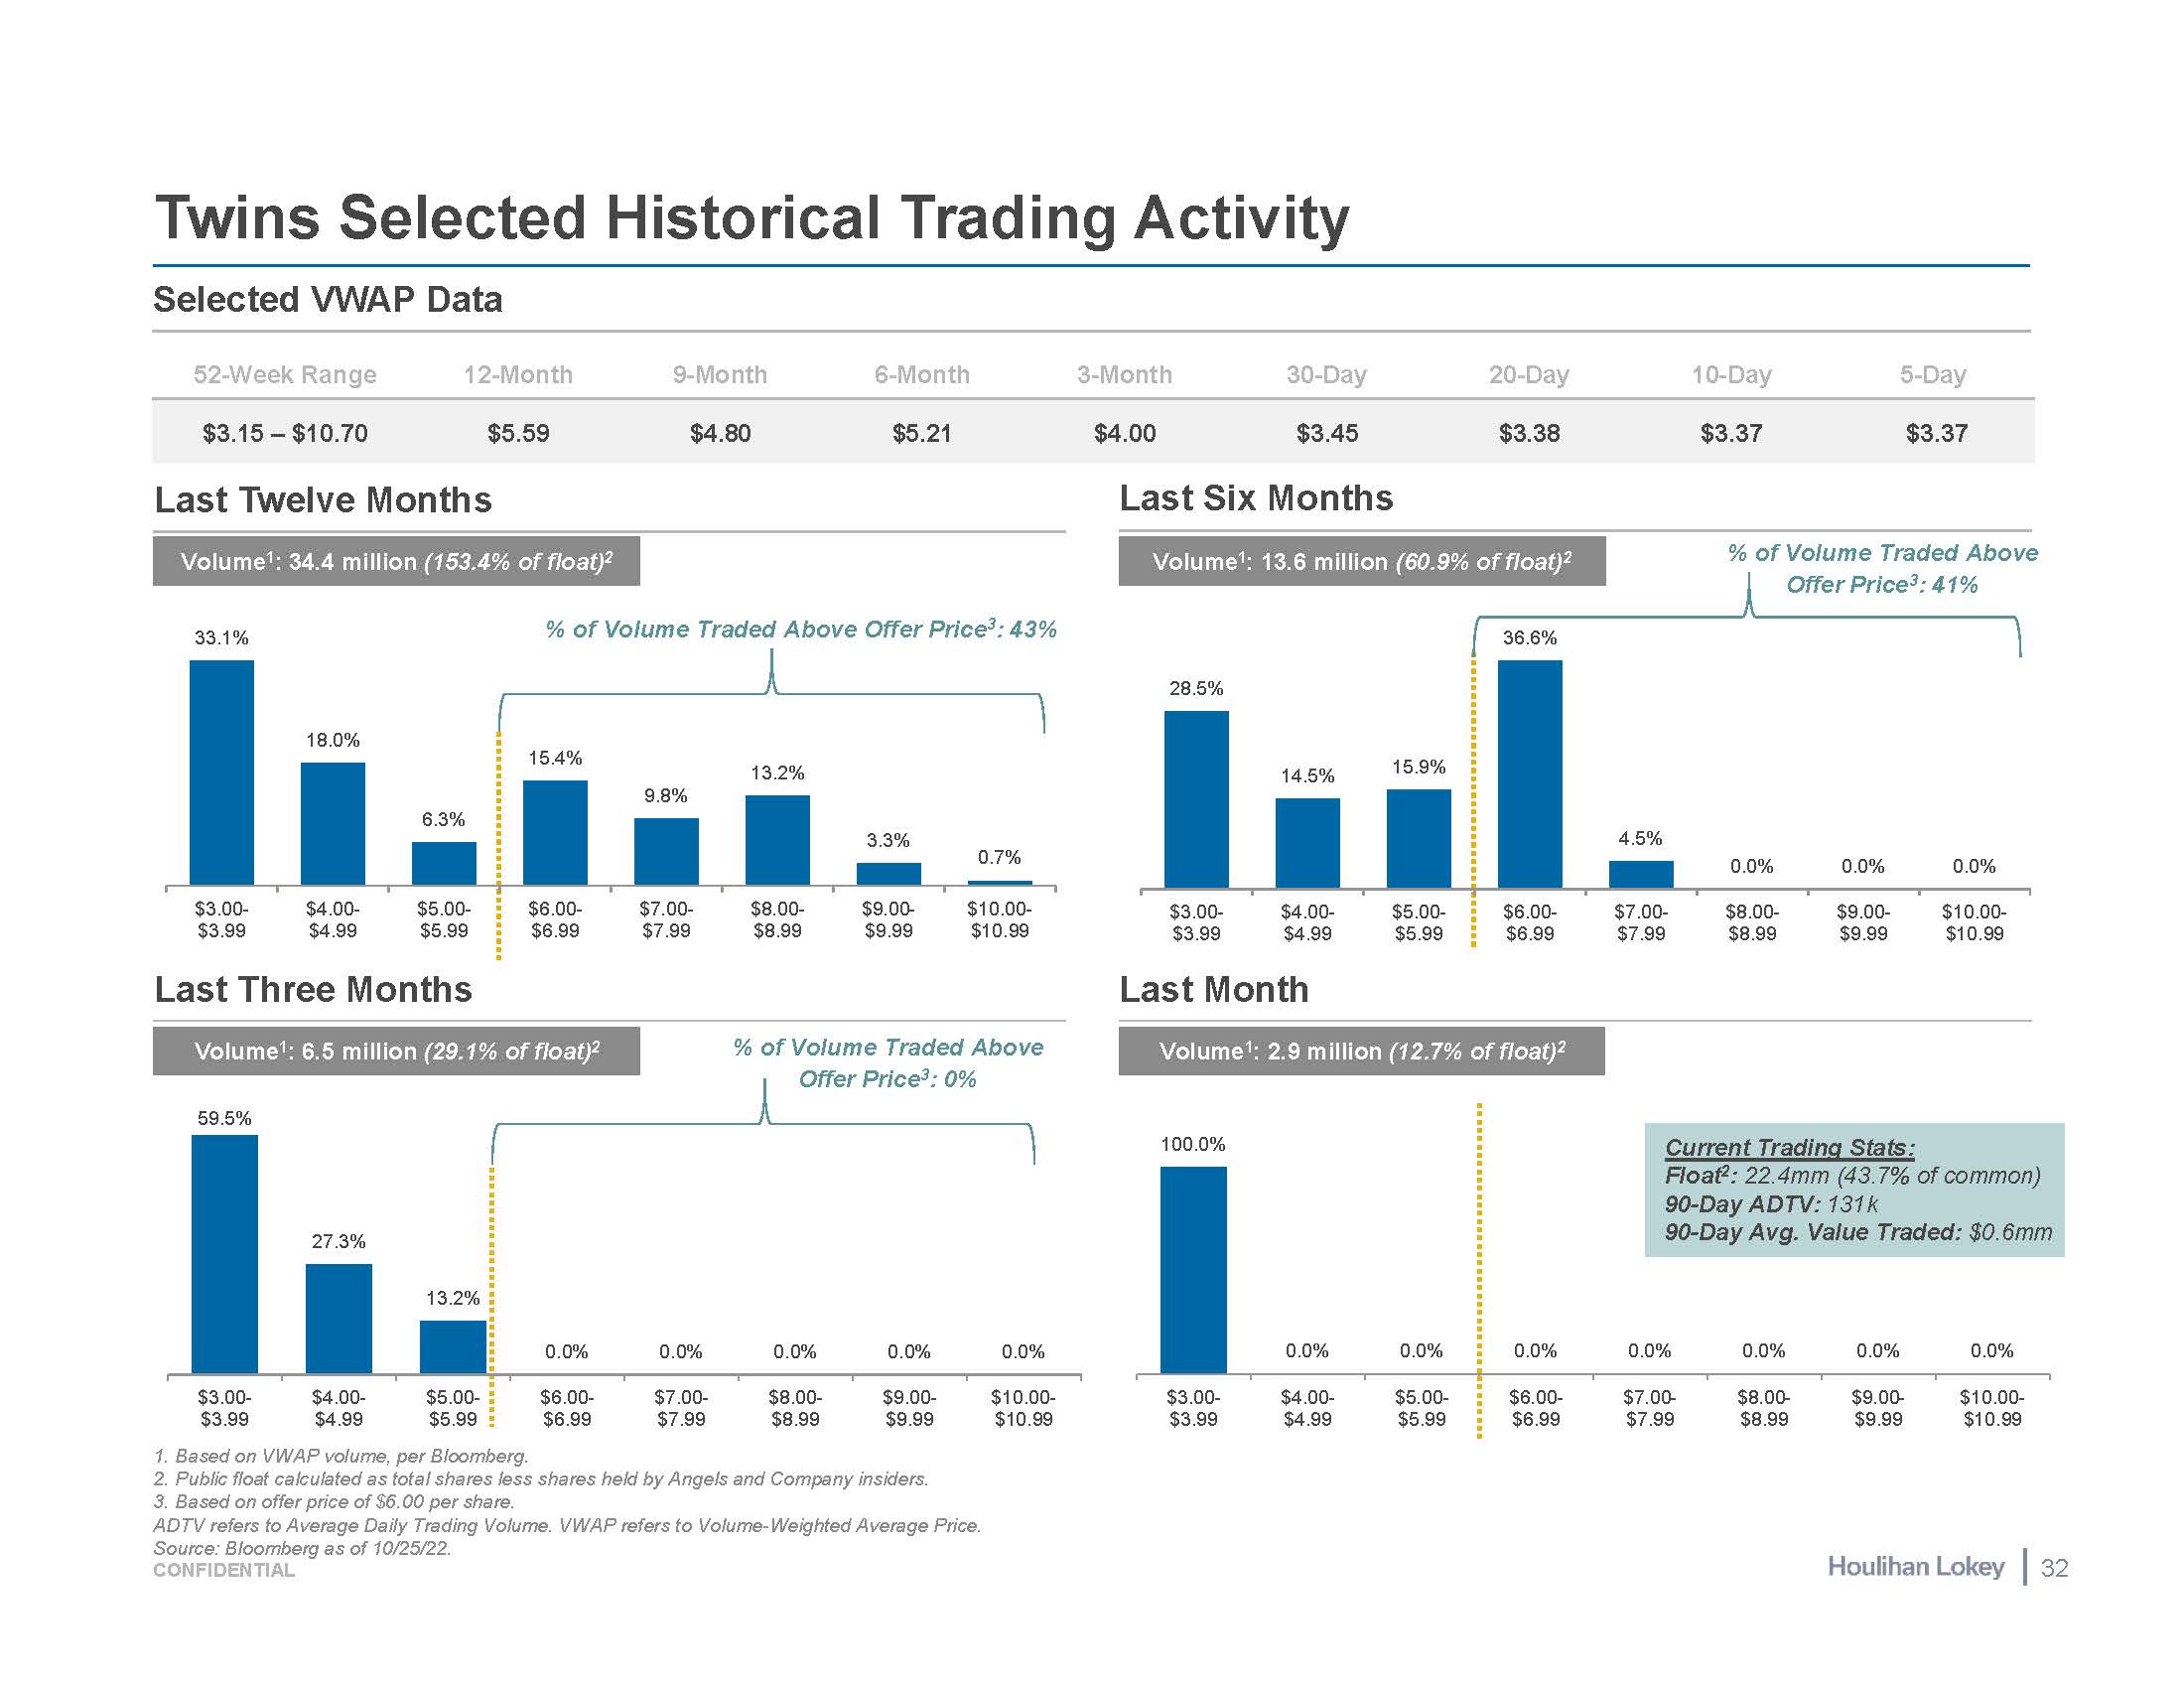
100.0% 0.0% 0.0% 0.0% 0.0% 0.0% 0.0% 0.0% $3.00- $3.99 $4.00- $4.99 $5.00- $5.99 $6.00- $6.99 $7.00- $7.99 $8.00- $8.99 $9.00- $9.99 $10.00- $10.99 Last Twelve Months Last Six Months Last Three Months Last Month Volume1: 13.6 million (60.9% of float)2 Twins Selected Historical Trading Activity Volume1: 6.5 million (29.1% of float)2 Volume1: 34.4 million (153.4% of float)2 Volume1: 2.9 million (12.7% of float)2 Based on VWAP volume, per Bloomberg. Public float calculated as total shares less shares held by Angels and Company insiders. Based on offer price of $6.00 per share. ADTV refers to Average Daily Trading Volume. VWAP refers to Volume-Weighted Average Price. Selected VWAP Data 52-Week Range 12-Month 9-Month 6-Month 3-Month 30-Day 20-Day 10-Day 5-Day $3.15 – $10.70 $5.59 $4.80 $5.21 $4.00 $3.45 $3.38 $3.37 $3.37 Current Trading Stats: Float2: 22.4mm (43.7% of common) 90-Day ADTV: 131k 90-Day Avg. Value Traded: $0.6mm % of Volume Traded Above Offer Price3: 43% % of Volume Traded Above Offer Price3: 0% % of Volume Traded Above Offer Price3: 41% 33.1% Source: Bloomberg as of 10/25/22. CONFIDENTIAL 32 18.0% 6.3% 15.4% 9.8% 13.2% 3.3% 0.7% $3.00- $3.99 $4.00- $4.99 $5.00- $5.99 $6.00- $6.99 $7.00- $7.99 $8.00- $8.99 $9.00- $9.99 $10.00- $10.99 28.5% 14.5% 15.9% 36.6% 4.5% 0.0% 0.0% 0.0% $3.00- $3.99 $4.00- $4.99 $5.00- $5.99 $6.00- $6.99 $7.00- $7.99 $8.00- $8.99 $9.00- $9.99 $10.00- $10.99 59.5% 27.3% 13.2% 0.0% 0.0% 0.0% 0.0% 0.0% $3.00- $3.99 $4.00- $4.99 $5.00- $5.99 $6.00- $6.99 $7.00- $7.99 $8.00- $8.99 $9.00- $9.99 $10.00- $10.99

Twins Ownership Summary Sources: Bloomberg, press releases and public filings. CONFIDENTIAL 33 (shares in millions) Reflects basic shares of common stock outstanding of 51,202,136 as of 8/4/22 per the Company’s Form 10-Q for the period ended 6/30/22. Public float calculated as total shares less primarily shares held by Angels and Company insiders. Holder Shares % Outstanding Voting Interests Public Float2 Angels 24.0 46.9% -- -- Baker, Blake A. 4.3 8.5% 16.0% 19.4% Royce & Associates, LP 3.9 7.6% 14.2% 17.3% O'Brien, Andrew Michael (Executive Chairman of the Board) 3.5 6.9% 12.9% NA Vaughan Nelson Investment Management, L.P. 1.4 2.7% 5.1% 6.2% Janus Henderson Group plc 1.3 2.5% 4.8% 5.8% BlackRock, Inc. 1.2 2.3% 4.4% 5.3% Lee, Steven Barry (Senior VP & Director) 1.1 2.1% 3.9% NA The Vanguard Group, Inc. 0.9 1.7% 3.2% 3.9% William Blair Investment Management, LLC 0.7 1.3% 2.4% 3.0% Brandywine Global Investment Management, LLC 0.6 1.1% 2.2% 2.6% GW&K Investment Management, LLC 0.5 1.0% 1.9% 2.3% Other Current / Former Directors and Executive Officers 0.2 0.4% 0.7% NA Other 7.7 15.0% 28.2% 34.3% Total1 51.2 100.0% 100.0% 100.0% Voting Interest % of Non-Angels % of

Estimated Twins Shareholder Cost Basis Current Share Price: $3.43 1. Cost basis average, per Capital IQ, based on volume weighted average price during the quarterly periods in which shares were purchased or sold Ownership 46.9% 8.5% 7.6% 6.9% 2.7% 2.5% 2.3% 2.1% 1.7% 1.3% 1.1% 1.0% 0.8% 0.8% 0.7% 0.7% 0.6% 0.6% 0.4% 0.4% 0.4% 0.4% 0.3% 0.3% 0.3% Cumulative Ownership 46.9% 55.4% 63.0% 69.8% 72.5% 75.1% 77.4% 79.5% 81.2% 82.5% 83.6% 84.6% 85.4% 86.2% 86.9% 87.6% 88.2% 88.7% 89.2% 89.6% 90.0% 90.4% 90.7% 91.0% 91.3% Ownership of Non-Angels Shares NA 16.0% 14.2% 12.9% 5.1% 4.8% 4.4% 3.9% 3.2% 2.4% 2.2% 1.9% 1.5% 1.5% 1.4% 1.3% 1.0% 1.0% 0.8% 0.8% 0.8% 0.7% 0.6% 0.6% 0.5% Average Cost Basis: $11.88 Top 25 Shareholders1 NA Source: Capital IQ as of 10/25/22 CONFIDENTIAL 34 NA $15.04 NA $16.32 $15.96 $14.31 NA $15.26 $14.70 $11.82 $5.91 $15.24 $8.59 $13.83 $6.80 $13.60 $14.93 $6.56 $13.38 $6.61 $15.02 $7.46 $7.07 $10.97 Angels Baker, Blake A. Royce & Associates, LP O'Brien, Andrew Michael Vaughan Nelson Investment Management Janus Henderson Group plc BlackRock, Inc. Lee, Steven Barry The Vanguard Group, Inc. William Blair Investment Management, LLC Brandywine Global Investment Management GW&K Investment Management, LLC Thompson, Siegel & Walmsley LLC Hotchkis and Wiley Capital Management Hotchkis and Wiley Capital Management, LLC Geode Capital Management, LLC Eaton Vance Management State Street Global Advisors, Inc. Millennium Management LLC Natixis Advisors, LLC Two Sigma Advisers, LP Northern Trust Global Investments MBA Advisors LLC Two Sigma Investments, LP Citadel Advisors LLC

Twins Recent Shareholder Movements Top Shareholders (1%+ Ownership) (shares in millions and dollars in actuals) O'Brien, Andrew Michael 3.509 12.9% NA 0.000 0.000 (0.616) 0.000 0.025 0.000 0.000 % of Holdings Traded 0.0% 0.0% (15.0%) 0.0% 0.7% 0.0% 0.0% Vaughan Nelson Investment Management, L.P. 1.384 5.1% 6.2% 0.000 0.000 1.529 (0.028) 0.044 (0.050) (0.110) % of Holdings Traded 0.0% 0.0% New Position (1.8%) 2.9% (3.3%) (7.4%) Janus Henderson Group plc 1.301 4.8% 5.8% 0.000 0.000 1.197 0.744 0.083 (0.251) (0.471) % of Holdings Traded 0.0% 0.0% New Position 62.2% 4.3% (12.4%) (26.6%) BlackRock, Inc. 1.184 4.4% 5.3% 0.071 0.069 0.335 (0.008) 0.078 (0.016) 0.123 % of Holdings Traded 13.3% 11.5% 49.9% (0.8%) 7.8% (1.4%) 11.6% Lee, Steven Barry 1.069 3.9% NA 0.000 0.000 (0.115) 0.000 0.014 0.008 0.011 % of Holdings Traded 0.0% 0.0% (10.0%) 0.0% 1.4% 0.7% 1.1% The Vanguard Group, Inc. 0.870 3.2% 3.9% 0.155 0.181 0.187 0.005 0.014 (0.153) 0.196 % of Holdings Traded 54.3% 41.0% 30.2% 0.6% 1.7% (18.5%) 29.2% William Blair Investment Management, LLC 0.662 2.4% 3.0% 0.158 0.680 0.131 (0.234) (0.068) 0.038 (0.100) % of Holdings Traded 272.5% 315.0% 14.6% (22.8%) (8.6%) 5.3% (13.1%) Brandywine Global Investment Management, LLC 0.586 2.2% 2.6% 0.000 0.000 0.000 0.562 0.115 0.000 (0.091) % of Holdings Traded 0.0% 0.0% 0.0% New Position 20.5% 0.0% (13.4%) GW&K Investment Management, LLC 0.522 1.9% 2.3% 0.000 0.000 0.000 0.000 0.000 0.000 0.522 % of Holdings Traded 0.0% 0.0% 0.0% 0.0% 0.0% 0.0% New Position VWAP During Quarter $13.21 $16.08 $15.94 $10.00 $8.95 $4.61 $6.02 High Closing Stock Price During Quarter $15.45 $17.50 $17.95 $15.28 $10.70 $8.86 $7.30 Low Closing Stock Price During Quarter $10.11 $13.10 $14.34 $9.00 $8.08 $3.35 $4.03 VWAP refers to Volume-Weighted Average Price. t Latest % of % of Net Shares Added / (Deduct ed) by Quar er Holder Shareholdings Non-Angels Public Float Q4 2020 Q1 2021 Q2 2021 Q3 2021 Q4 2021 Q1 2022 Q2 2022 Angels 24.024 0.000 0.000 (4.250) 0.000 0.000 0.000 0.000 % of Holdings Traded 0.0% 0.0% (15.0%) 0.0% 0.0% 0.0% 0.0% Baker, Blake A. 4.341 16.0% 19.4% 0.000 0.000 (0.668) 0.000 (0.100) 0.000 0.000 % of Holdings Traded 0.0% 0.0% (13.1%) 0.0% (2.3%) 0.0% 0.0% Royce & Associates, LP 3.868 14.2% 17.3% 0.000 0.238 2.525 1.681 (0.379) 0.695 (0.892) % of Holdings Traded 0.0% New Position 1062.9% 60.9% (8.5%) 17.1% (18.7%) Sources: Bloomberg, Capital IQ and public filings. CONFIDENTIAL 35

Page 3 5 15 26 Executive Summary Selected Company Observations Preliminary Financial Considerations Other Proposal Considerations 5. Appendices 36 Supplemental Financial Information Supplemental Public Company & Market Observations Supplemental Industry Observations 37 40 43
Page 3 5 15 26 36 Executive Summary Selected Company Observations Preliminary Financial Considerations Other Proposal Considerations Appendices Supplemental Financial Information 37 Supplemental Public Company & Market Observations Supplemental Industry Observations 40 43
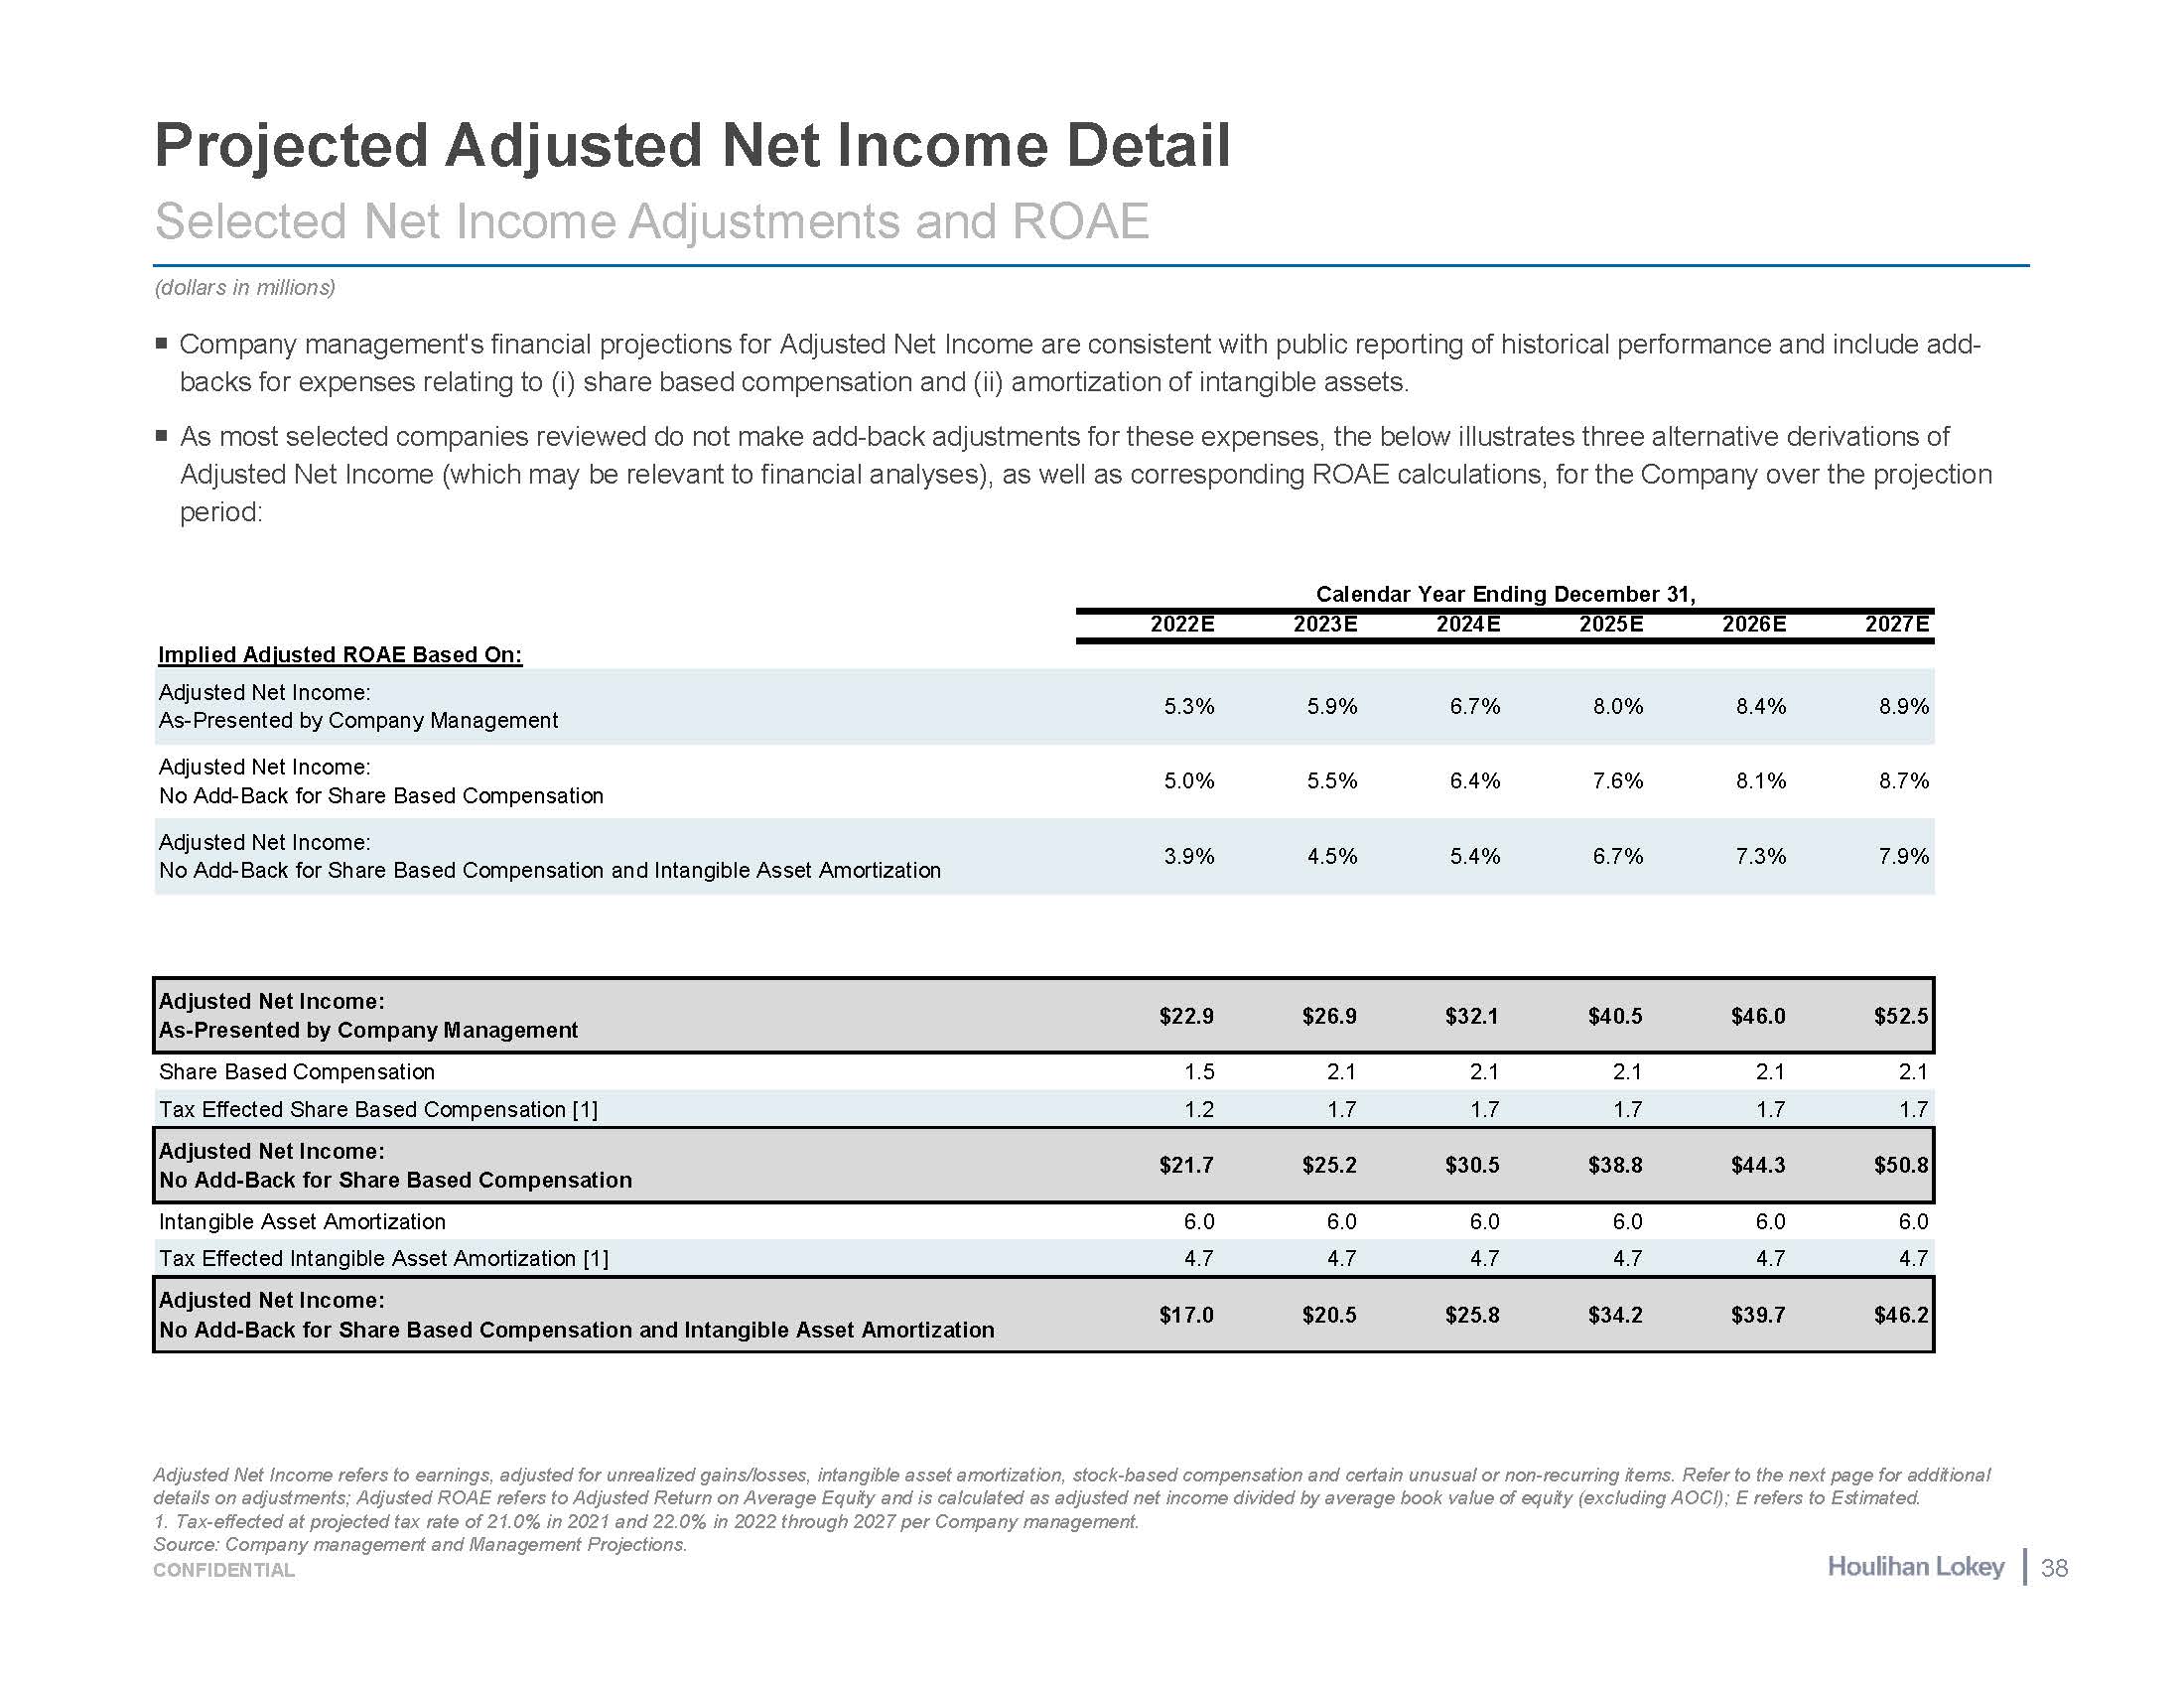
Projected Adjusted Net Income Detail Selected Net Income Adjustments and ROAE Adjusted Net Income refers to earnings, adjusted for unrealized gains/losses, intangible asset amortization, stock-based compensation and certain unusual or non-recurring items. Refer to the next page for additional details on adjustments; Adjusted ROAE refers to Adjusted Return on Average Equity and is calculated as adjusted net income divided by average book value of equity (excluding AOCI); E refers to Estimated. 1. Tax-effected at projected tax rate of 21.0% in 2021 and 22.0% in 2022 through 2027 per Company management. (dollars in millions) Company management's financial projections for Adjusted Net Income are consistent with public reporting of historical performance and include add- backs for expenses relating to (i) share based compensation and (ii) amortization of intangible assets. As most selected companies reviewed do not make add-back adjustments for these expenses, the below illustrates three alternative derivations of Adjusted Net Income (which may be relevant to financial analyses), as well as corresponding ROAE calculations, for the Company over the projection period: Tax Effected Share Based Compensation [1] 1.2 1.7 1.7 1.7 1.7 1.7 Adjusted Net Income: No Add-Back for Share Based Compensation $21.7 $25.2 $30.5 $38.8 $44.3 $50.8 Tax Effected Intangible Asset Amortization [1] 4.7 4.7 4.7 4.7 4.7 4.7 Adjusted Net Income: No Add-Back for Share Based Compensation and Intangible Asset Amortization $17.0 $20.5 $25.8 $34.2 $39.7 $46.2 As-Presented by Company Management No Add-Back for Share Based Compensation No Add-Back for Share Based Compensation and Intangible Asset Amortization Calendar Year Ending December 31, 2022E 2023E 2024E 2025E 2026E 2027E Implied Adjusted ROAE Based On: Adjusted Net Income: 5.3% 5.9% 6.7% 8.0% 8.4% 8.9% Adjusted Net Income: 5.0% 5.5% 6.4% 7.6% 8.1% 8.7% Adjusted Net Income: 3.9% 4.5% 5.4% 6.7% 7.3% 7.9% Adjusted Net Income: $22.9 $26.9 $32.1 $40.5 $46.0 $52.5 As-Presented by Company Management Share Based Compensation 1.5 2.1 2.1 2.1 2.1 2.1 Intangible Asset Amortization 6.0 6.0 6.0 6.0 6.0 6.0 Source: Company management and Management Projections. CONFIDENTIAL 38
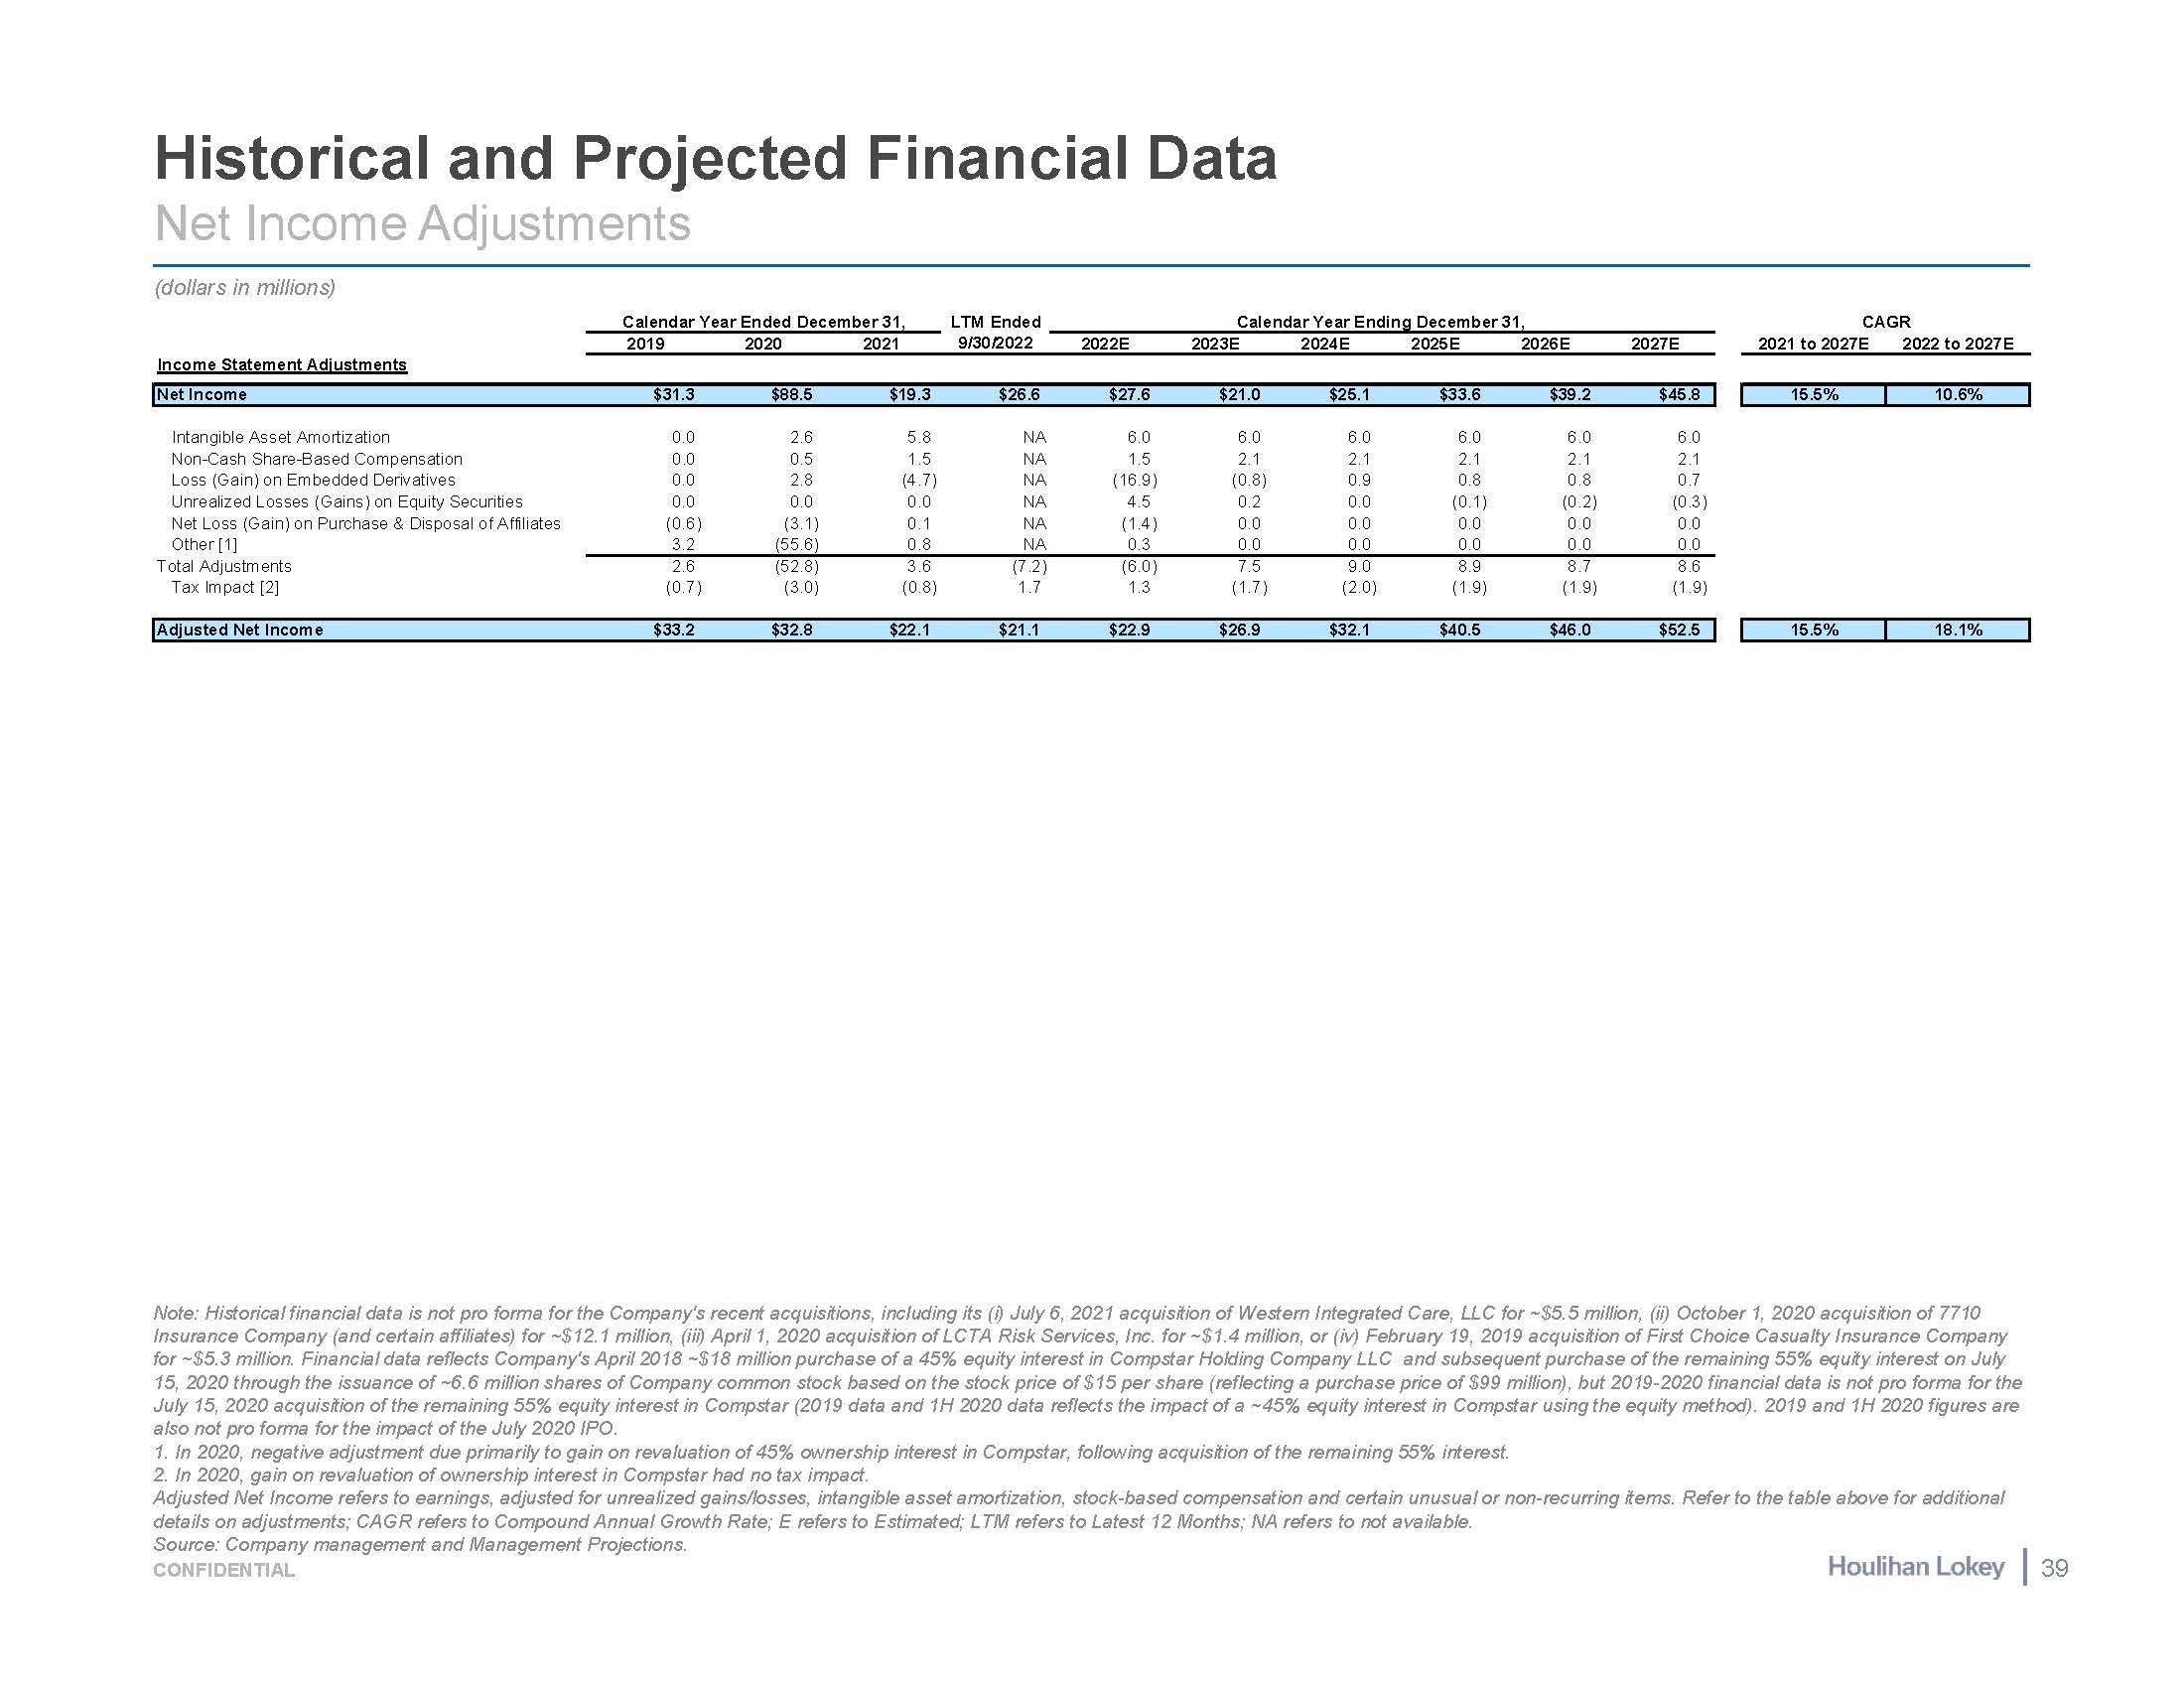
Historical and Projected Financial Data Net Income Adjustments Note: Historical financial data is not pro forma for the Company's recent acquisitions, including its (i) July 6, 2021 acquisition of Western Integrated Care, LLC for ~$5.5 million, (ii) October 1, 2020 acquisition of 7710 Insurance Company (and certain affiliates) for ~$12.1 million, (iii) April 1, 2020 acquisition of LCTA Risk Services, Inc. for ~$1.4 million, or (iv) February 19, 2019 acquisition of First Choice Casualty Insurance Company for ~$5.3 million. Financial data reflects Company's April 2018 ~$18 million purchase of a 45% equity interest in Compstar Holding Company LLC and subsequent purchase of the remaining 55% equity interest on July 15, 2020 through the issuance of ~6.6 million shares of Company common stock based on the stock price of $15 per share (reflecting a purchase price of $99 million), but 2019-2020 financial data is not pro forma for the July 15, 2020 acquisition of the remaining 55% equity interest in Compstar (2019 data and 1H 2020 data reflects the impact of a ~45% equity interest in Compstar using the equity method). 2019 and 1H 2020 figures are also not pro forma for the impact of the July 2020 IPO. In 2020, negative adjustment due primarily to gain on revaluation of 45% ownership interest in Compstar, following acquisition of the remaining 55% interest. In 2020, gain on revaluation of ownership interest in Compstar had no tax impact. Adjusted Net Income refers to earnings, adjusted for unrealized gains/losses, intangible asset amortization, stock-based compensation and certain unusual or non-recurring items. Refer to the table above for additional details on adjustments; CAGR refers to Compound Annual Growth Rate; E refers to Estimated; LTM refers to Latest 12 Months; NA refers to not available. (dollars in millions) Calendar Year Ended December 31, LTM Ended Calendar Year Ending December 31, 2019 2020 2021 9/30/2022 2022E 2023E 2024E 2025E 2026E 2027E CAGR 2021 to 2027E 2022 to 2027E Income Statement Adjustments Net Income $31.3 $88.5 $19.3 $26.6 $27.6 $21.0 $25.1 $33.6 $39.2 $45.8 15.5% 10.6% Intangible Asset Amortization 0.0 2.6 5.8 NA 6.0 6.0 6.0 6.0 6.0 6.0 Non-Cash Share-Based Compensation 0.0 0.5 1.5 NA 1.5 2.1 2.1 2.1 2.1 2.1 Loss (Gain) on Embedded Derivatives 0.0 2.8 (4.7) NA (16.9) (0.8) 0.9 0.8 0.8 0.7 Unrealized Losses (Gains) on Equity Securities 0.0 0.0 0.0 NA 4.5 0.2 0.0 (0.1) (0.2) (0.3) Net Loss (Gain) on Purchase & Disposal of Affiliates (0.6) (3.1) 0.1 NA (1.4) 0.0 0.0 0.0 0.0 0.0 Other [1] 3.2 (55.6) 0.8 NA 0.3 0.0 0.0 0.0 0.0 0.0 Total Adjustments 2.6 (52.8) 3.6 (7.2) (6.0) 7.5 9.0 8.9 8.7 8.6 Tax Impact [2] (0.7) (3.0) (0.8) 1.7 1.3 (1.7) (2.0) (1.9) (1.9) (1.9) Adjusted Net Income $33.2 $32.8 $22.1 $21.1 $22.9 $26.9 $32.1 $40.5 $46.0 $52.5 15.5% 18.1% Source: Company management and Management Projections. CONFIDENTIAL 38
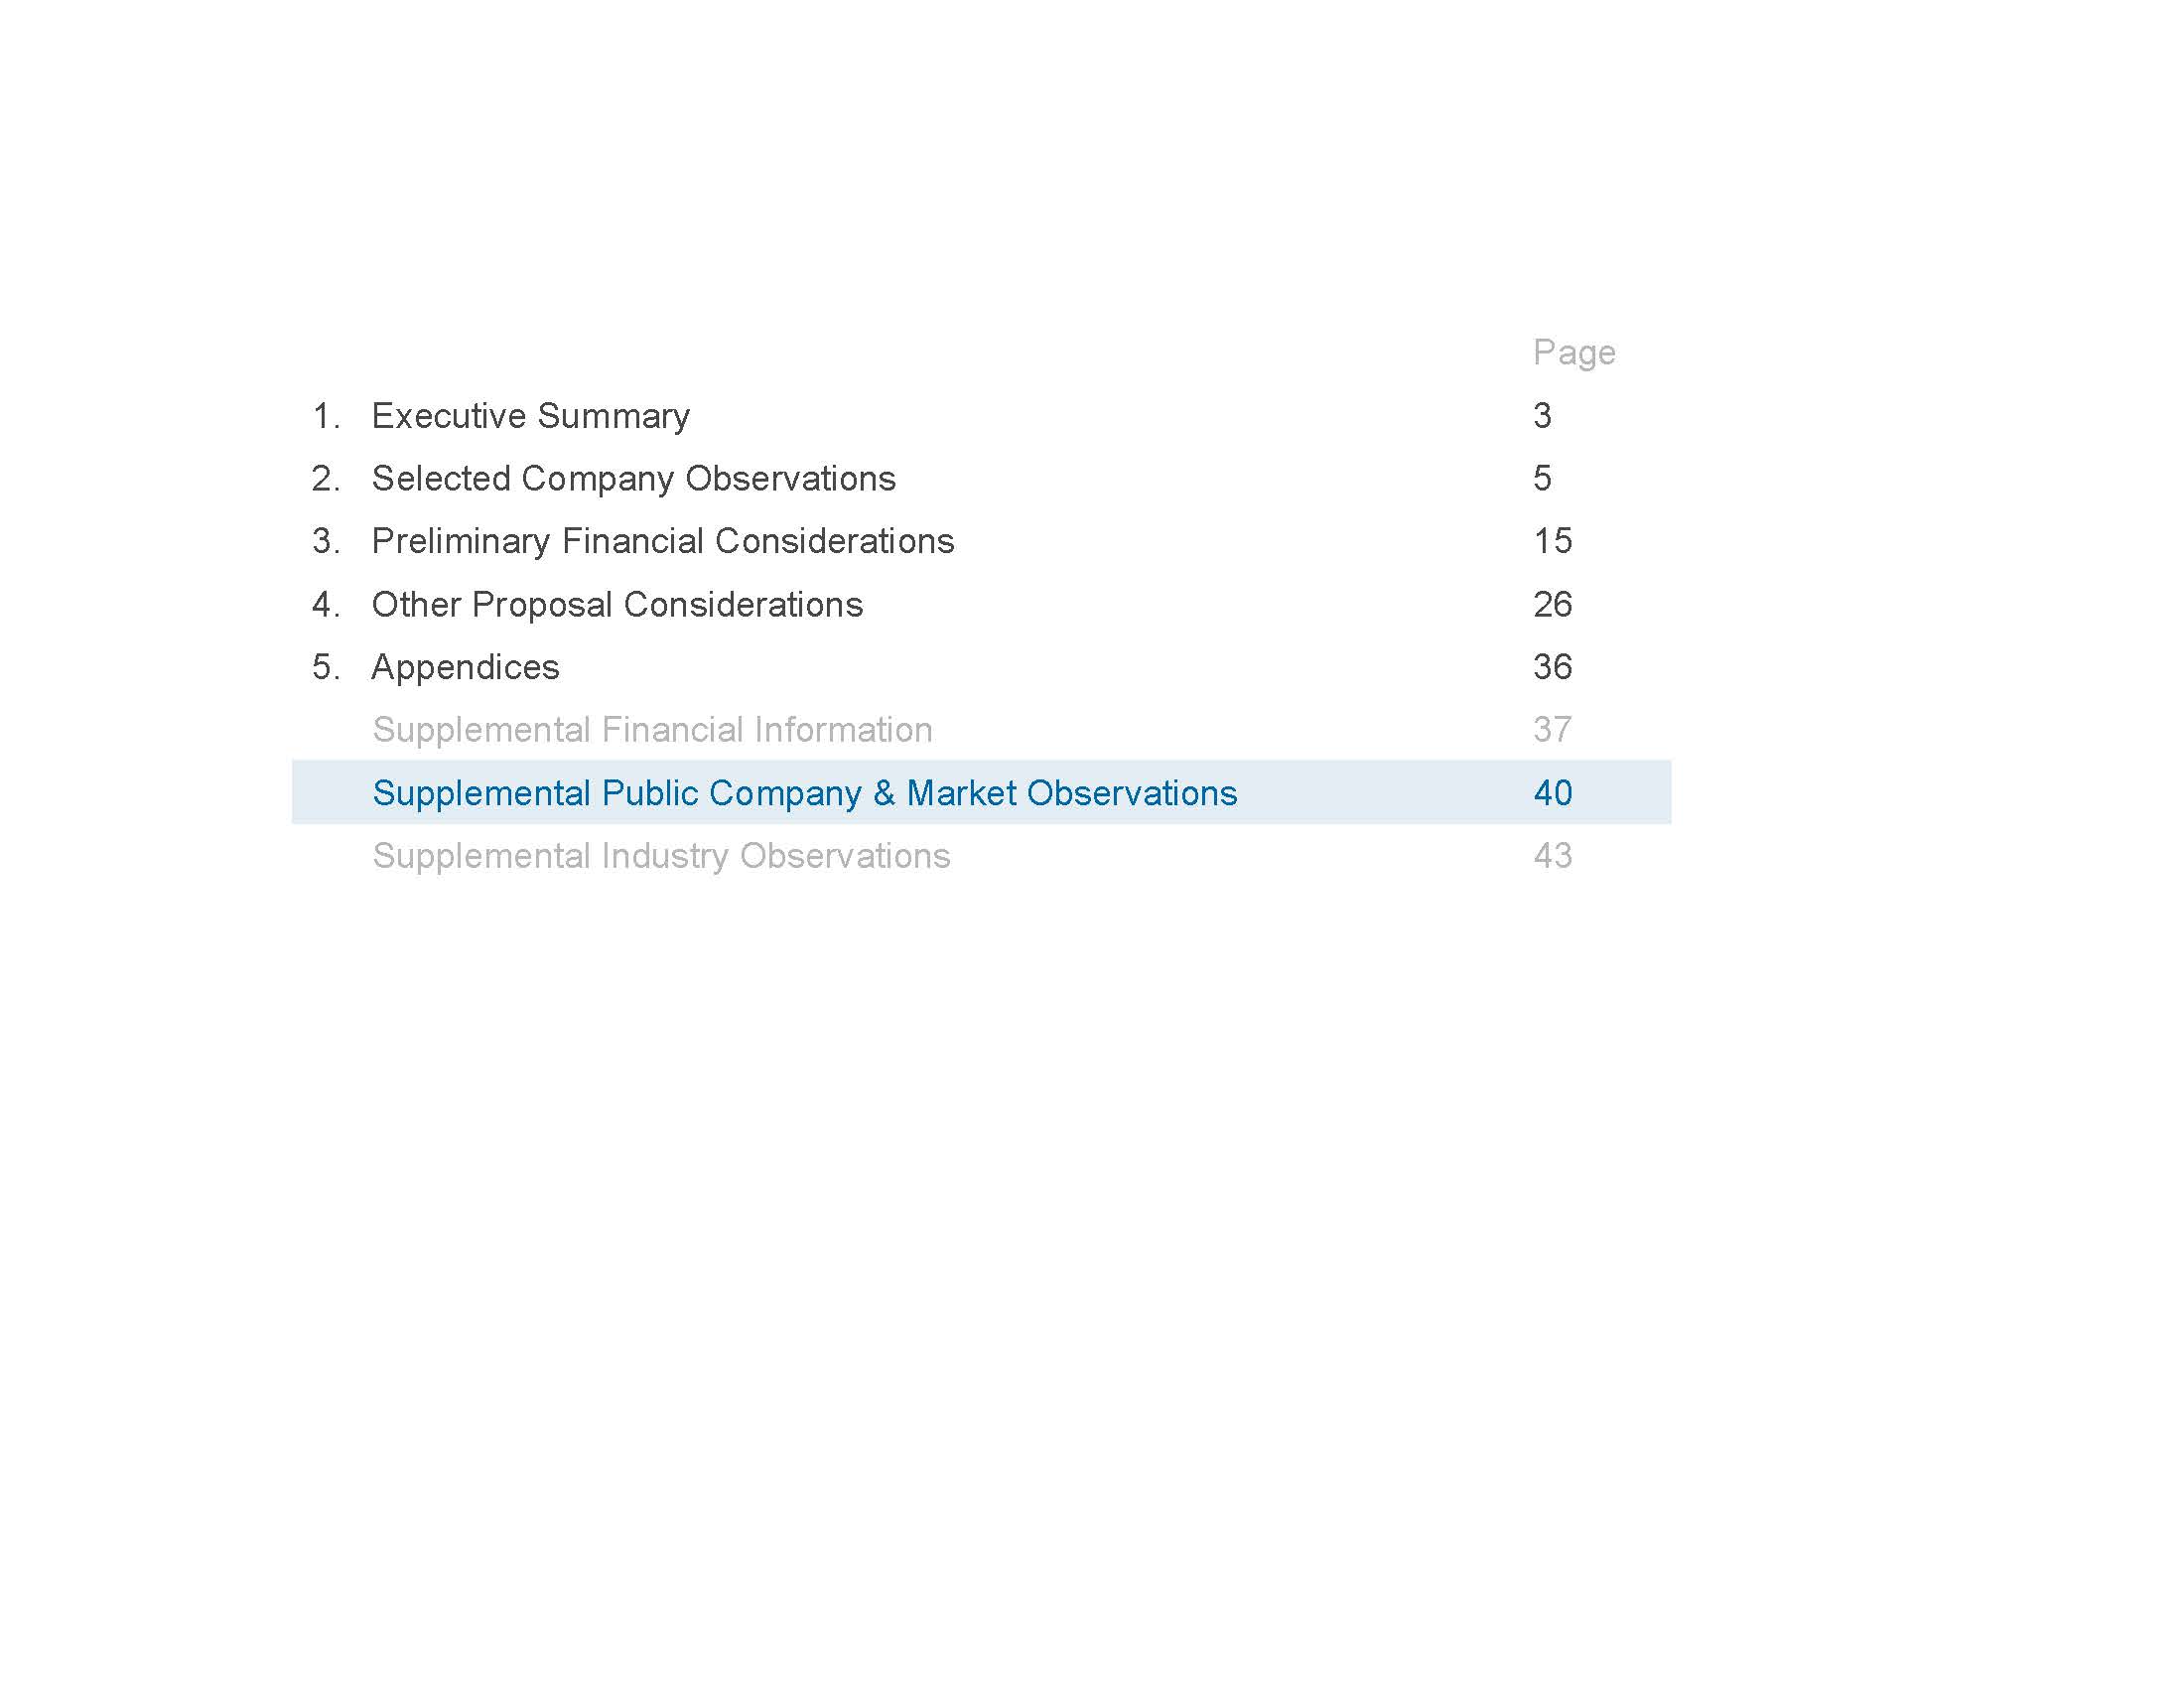
Page 3 5 15 26 36 37 Executive Summary Selected Company Observations Preliminary Financial Considerations Other Proposal Considerations Appendices Supplemental Financial Information Supplemental Public Company & Market Observations 40 Supplemental Industry Observations 43
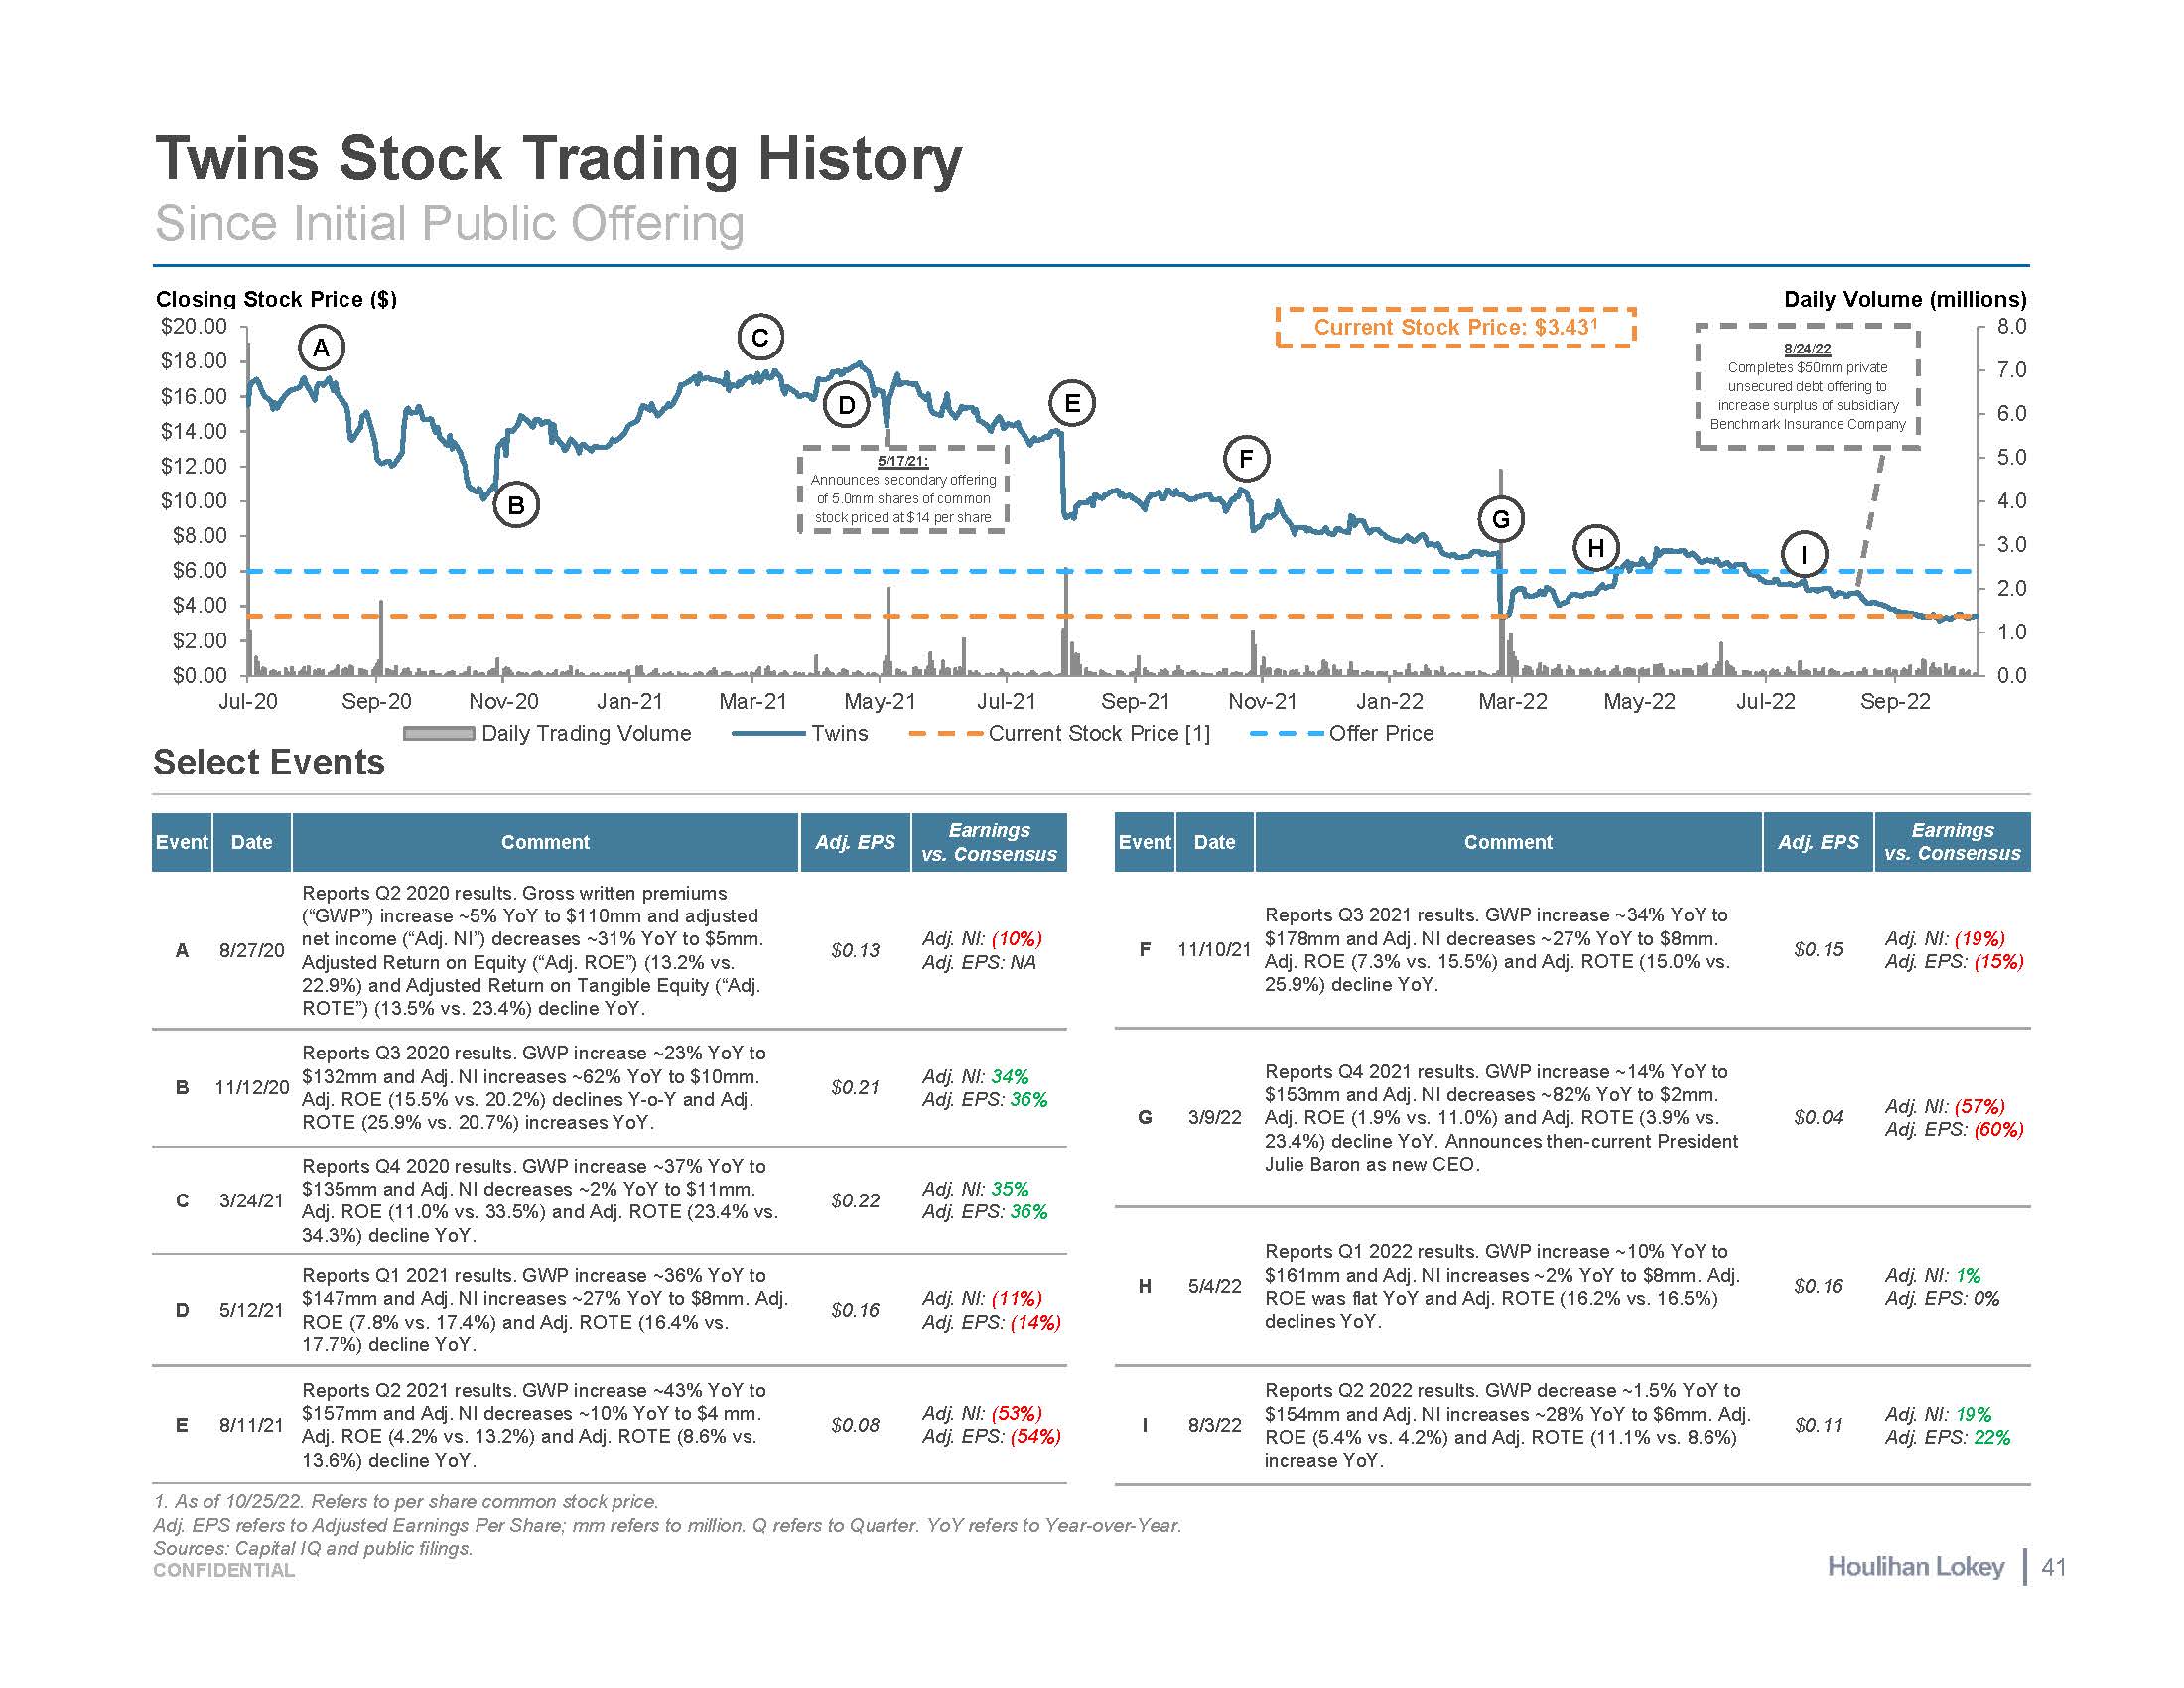
8.0 7.0 6.0 5.0 4.0 3.0 2.0 1.0 0.0 $20.00 $18.00 $16.00 $14.00 $12.00 $10.00 $8.00 $6.00 $4.00 $2.00 $0.00 Jul-20 Sep-20 Nov-21 Mar-22 May-22 Jul-22 Sep-22 Nov-20 Jan-21 Mar-21 Daily Trading Volume May-21 Twins Jul-21 Sep-21 Current Stock Price [1] Jan-22 Offer Price Closing Stock Price ($) Daily Volume (millions) Twins Stock Trading History Since Initial Public Offering Select Events 1. As of 10/25/22. Refers to per share common stock price. Adj. EPS refers to Adjusted Earnings Per Share; mm refers to million. Q refers to Quarter. YoY refers to Year-over-Year. Sources: Capital IQ and public filings. Event Date Comment Adj. EPS Earnings vs. Consensus A Reports Q2 2020 results. Gross written premiums (“GWP”) increase ~5% YoY to $110mm and adjusted 8/27/20 net income (“Adj. NI”) decreases ~31% YoY to $5mm. Adjusted Return on Equity (“Adj. ROE”) (13.2% vs. 22.9%) and Adjusted Return on Tangible Equity (“Adj. ROTE”) (13.5% vs. 23.4%) decline YoY. $0.13 Adj. NI: (10%) Adj. EPS: NA B Reports Q3 2020 results. GWP increase ~23% YoY to 11/12/20 $132mm and Adj. NI increases ~62% YoY to $10mm. Adj. ROE (15.5% vs. 20.2%) declines Y-o-Y and Adj. ROTE (25.9% vs. 20.7%) increases YoY. $0.21 Adj. NI: 34% Adj. EPS: 36% C Reports Q4 2020 results. GWP increase ~37% YoY to 3/24/21 $135mm and Adj. NI decreases ~2% YoY to $11mm. Adj. ROE (11.0% vs. 33.5%) and Adj. ROTE (23.4% vs. 34.3%) decline YoY. $0.22 Adj. NI: 35% Adj. EPS: 36% D Reports Q1 2021 results. GWP increase ~36% YoY to 5/12/21 $147mm and Adj. NI increases ~27% YoY to $8mm. Adj. ROE (7.8% vs. 17.4%) and Adj. ROTE (16.4% vs. 17.7%) decline YoY. $0.16 Adj. NI: (11%) Adj. EPS: (14%) E Reports Q2 2021 results. GWP increase ~43% YoY to 8/11/21 $157mm and Adj. NI decreases ~10% YoY to $4 mm. Adj. ROE (4.2% vs. 13.2%) and Adj. ROTE (8.6% vs. 13.6%) decline YoY. $0.08 Adj. NI: (53%) Adj. EPS: (54%) Event Date Comment Adj. EPS Earnings vs. Consensus F Reports Q3 2021 results. GWP increase ~34% YoY to 11/10/21 $178mm and Adj. NI decreases ~27% YoY to $8mm. Adj. ROE (7.3% vs. 15.5%) and Adj. ROTE (15.0% vs. 25.9%) decline YoY. $0.15 Adj. NI: (19%) Adj. EPS: (15%) G 3/9/22 Reports Q4 2021 results. GWP increase ~14% YoY to $153mm and Adj. NI decreases ~82% YoY to $2mm. Adj. ROE (1.9% vs. 11.0%) and Adj. ROTE (3.9% vs. 23.4%) decline YoY. Announces then-current President Julie Baron as new CEO. $0.04 Adj. NI: (57%) Adj. EPS: (60%) H 5/4/22 Reports Q1 2022 results. GWP increase ~10% YoY to $161mm and Adj. NI increases ~2% YoY to $8mm. Adj. ROE was flat YoY and Adj. ROTE (16.2% vs. 16.5%) declines YoY. $0.16 Adj. NI: 1% Adj. EPS: 0% I 8/3/22 Reports Q2 2022 results. GWP decrease ~1.5% YoY to $154mm and Adj. NI increases ~28% YoY to $6mm. Adj. ROE (5.4% vs. 4.2%) and Adj. ROTE (11.1% vs. 8.6%) increase YoY. $0.11 Adj. NI: 19% Adj. EPS: 22% Current Stock Price: $3.431 A B C D F G H E 5/17/21: Announces secondary offering of 5.0mm shares of common stock priced at $14 per share 8/24/22 Completes $50mm private unsecured debt offering to increase surplus of subsidiary Benchmark Insurance Company I 41 CONFIDENTIAL
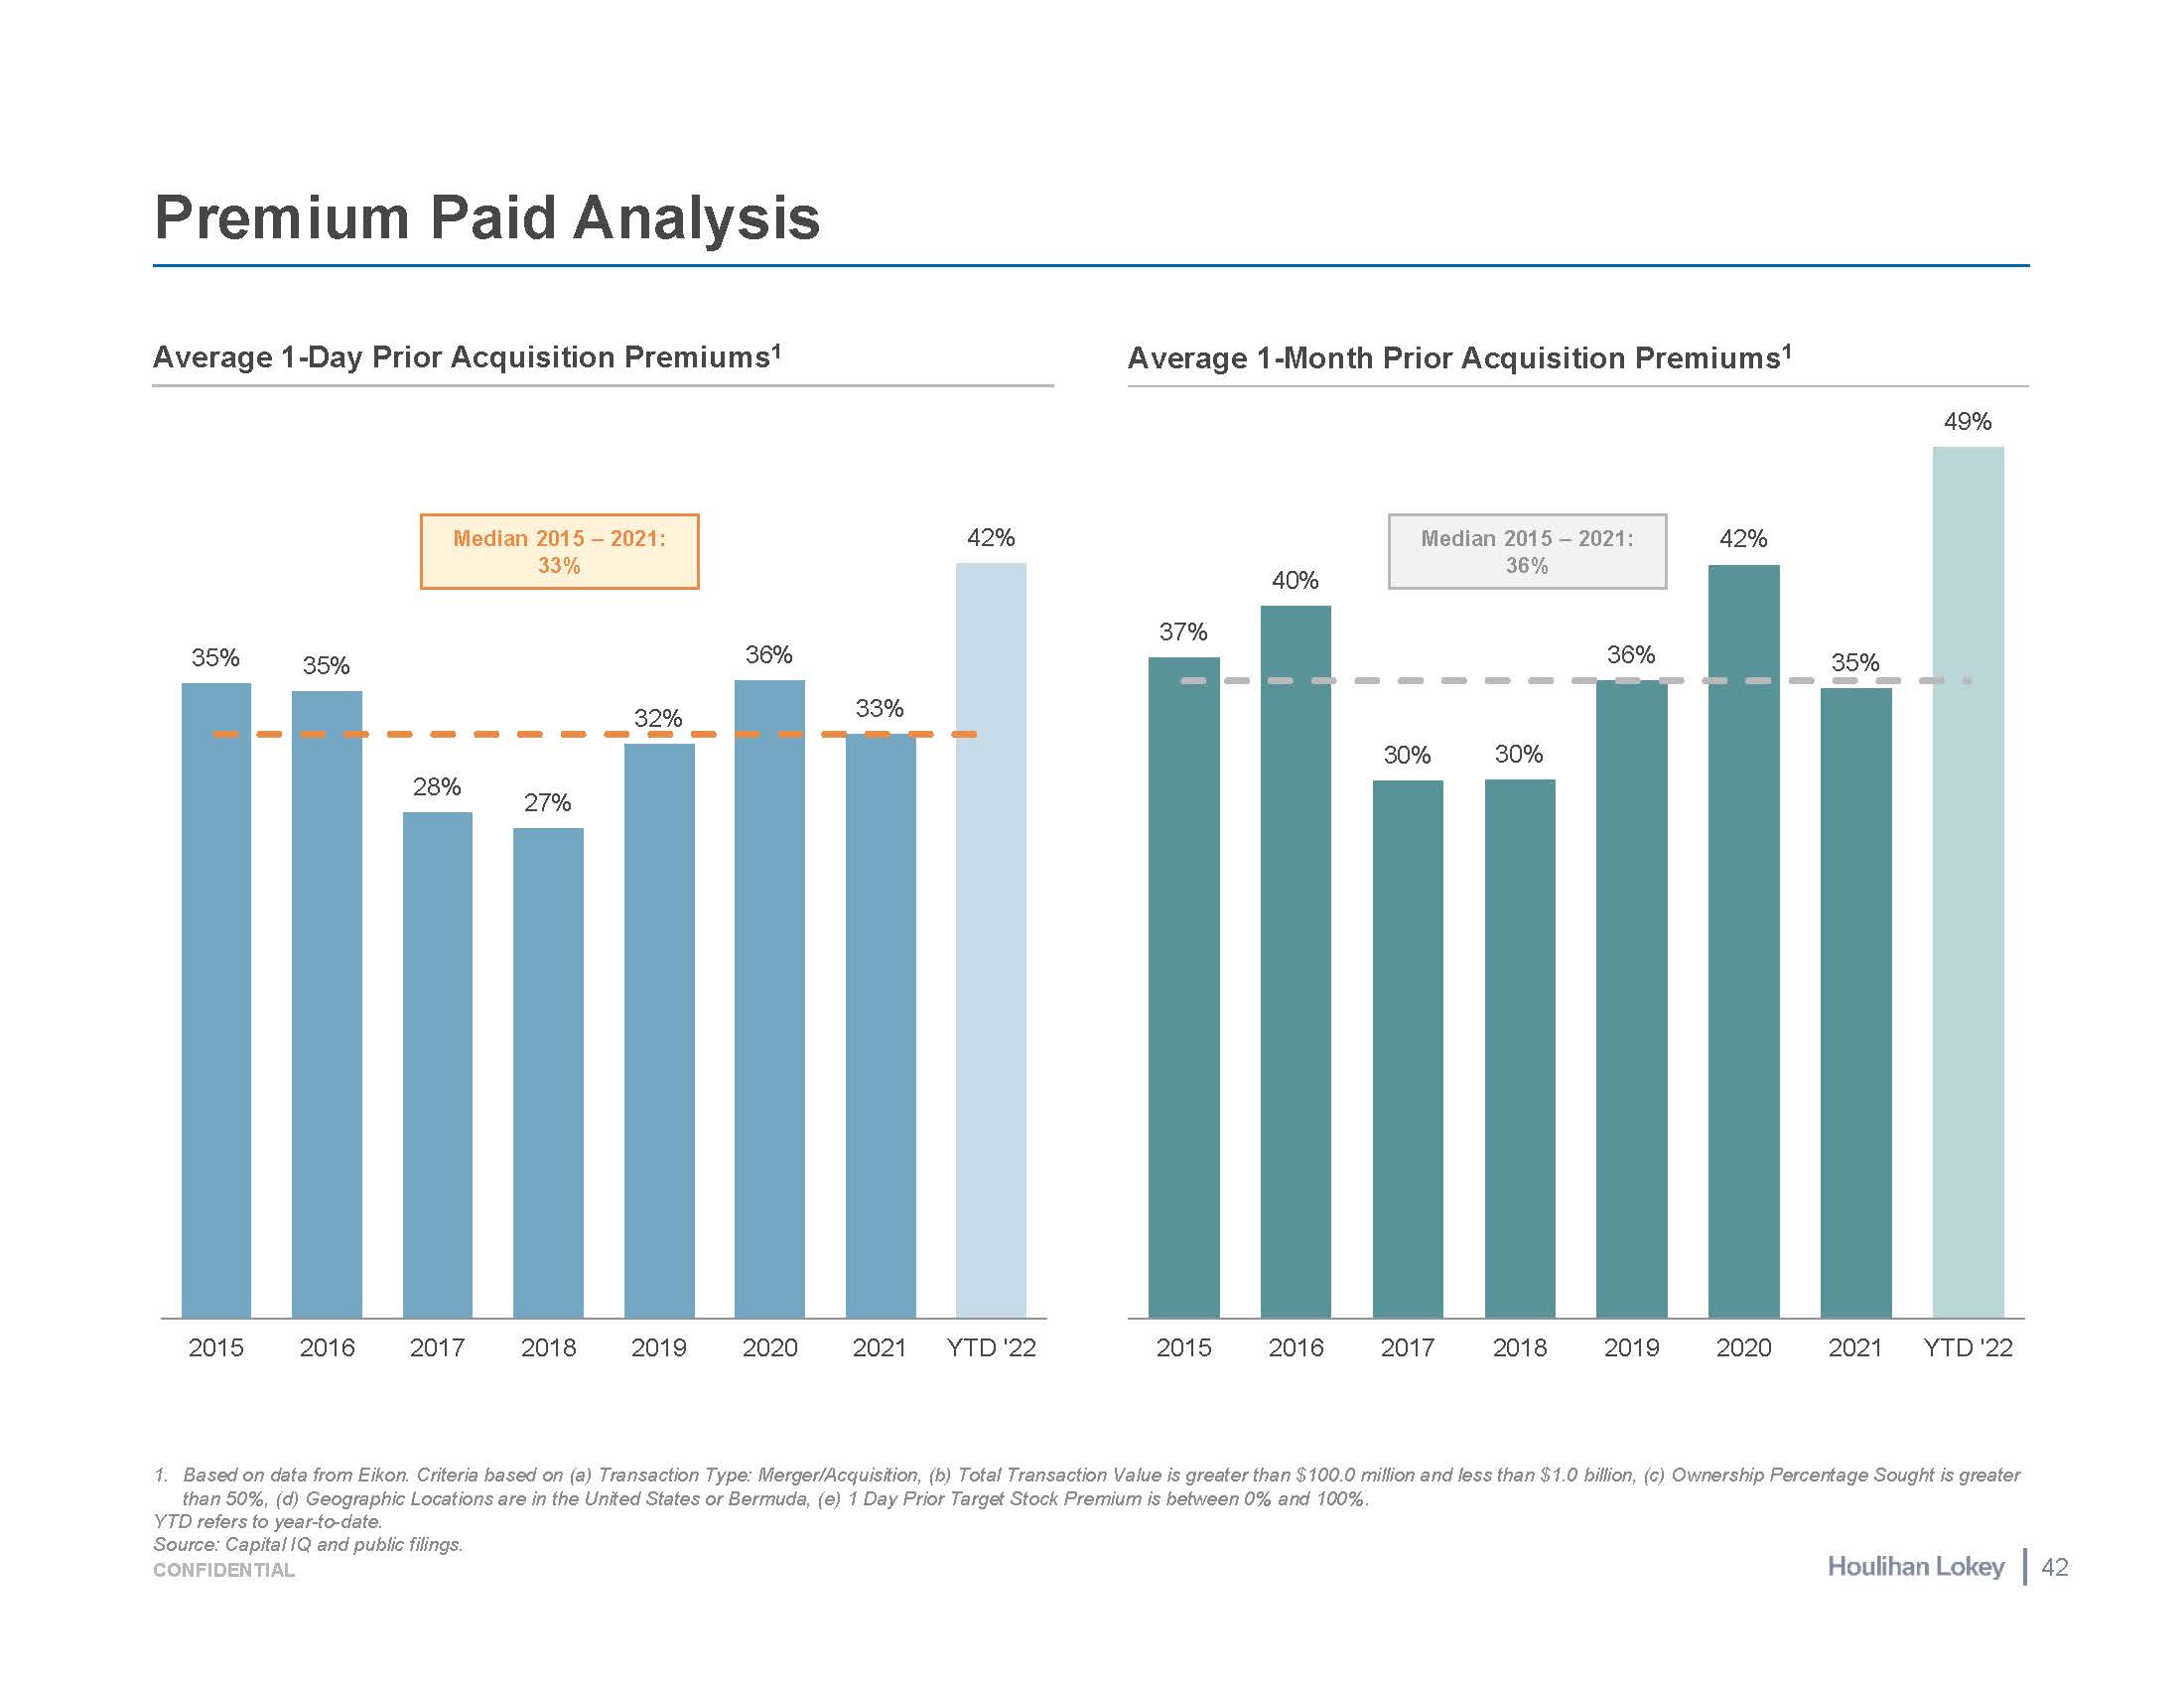
35% 35% 28% 27% 32% 36% 33% 42% 2015 2016 2017 2018 2019 2020 2021 YTD '22 Premium Paid Analysis 1. Based on data from Eikon. Criteria based on (a) Transaction Type: Merger/Acquisition, (b) Total Transaction Value is greater than $100.0 million and less than $1.0 billion, (c) Ownership Percentage Sought is greater than 50%, (d) Geographic Locations are in the United States or Bermuda, (e) 1 Day Prior Target Stock Premium is between 0% and 100%. YTD refers to year-to-date. Source: Capital IQ and public filings. Average 1-Day Prior Acquisition Premiums1 Average 1-Month Prior Acquisition Premiums1 Median 2015 – 2021: 33% 37% 40% 30% 30% 36% 42% 35% 49% 2015 2016 2017 2018 2019 2020 2021 YTD '22 Median 2015 – 2021: 36% 41 CONFIDENTIAL
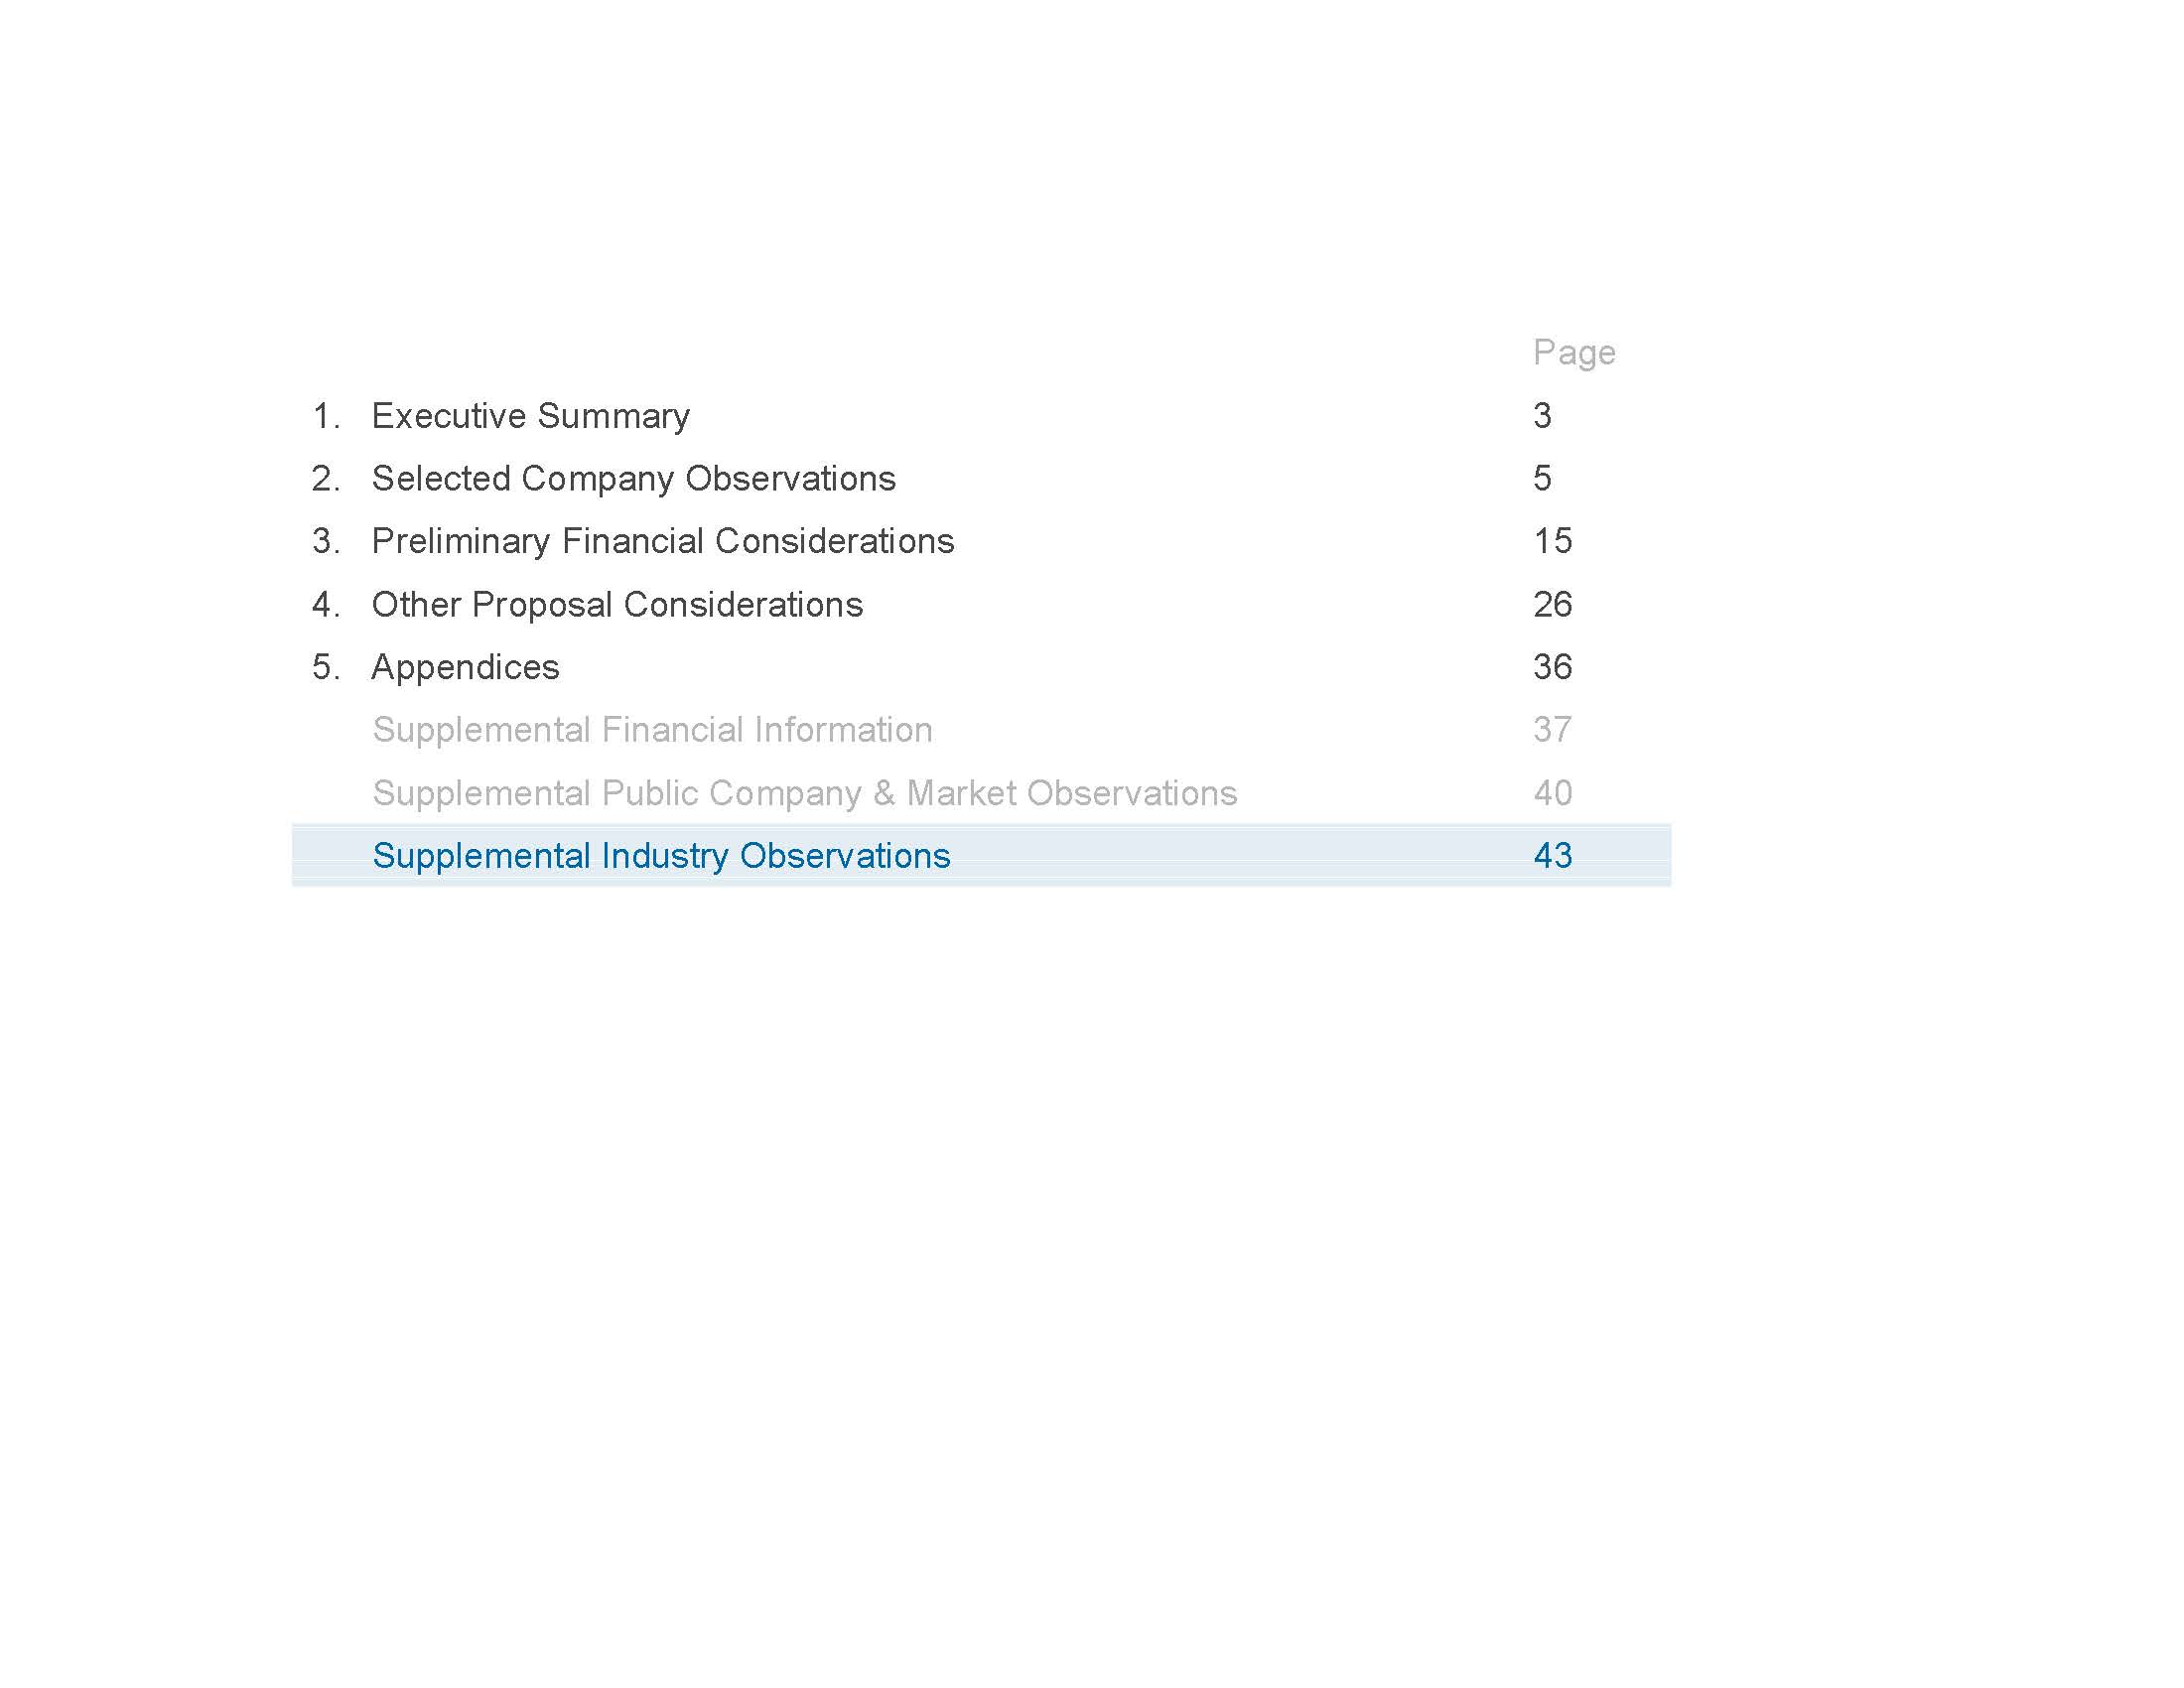
Page 3 5 15 26 36 37 40 Executive Summary Selected Company Observations Preliminary Financial Considerations Other Proposal Considerations Appendices Supplemental Financial Information Supplemental Public Company & Market Observations Supplemental Industry Observations 43
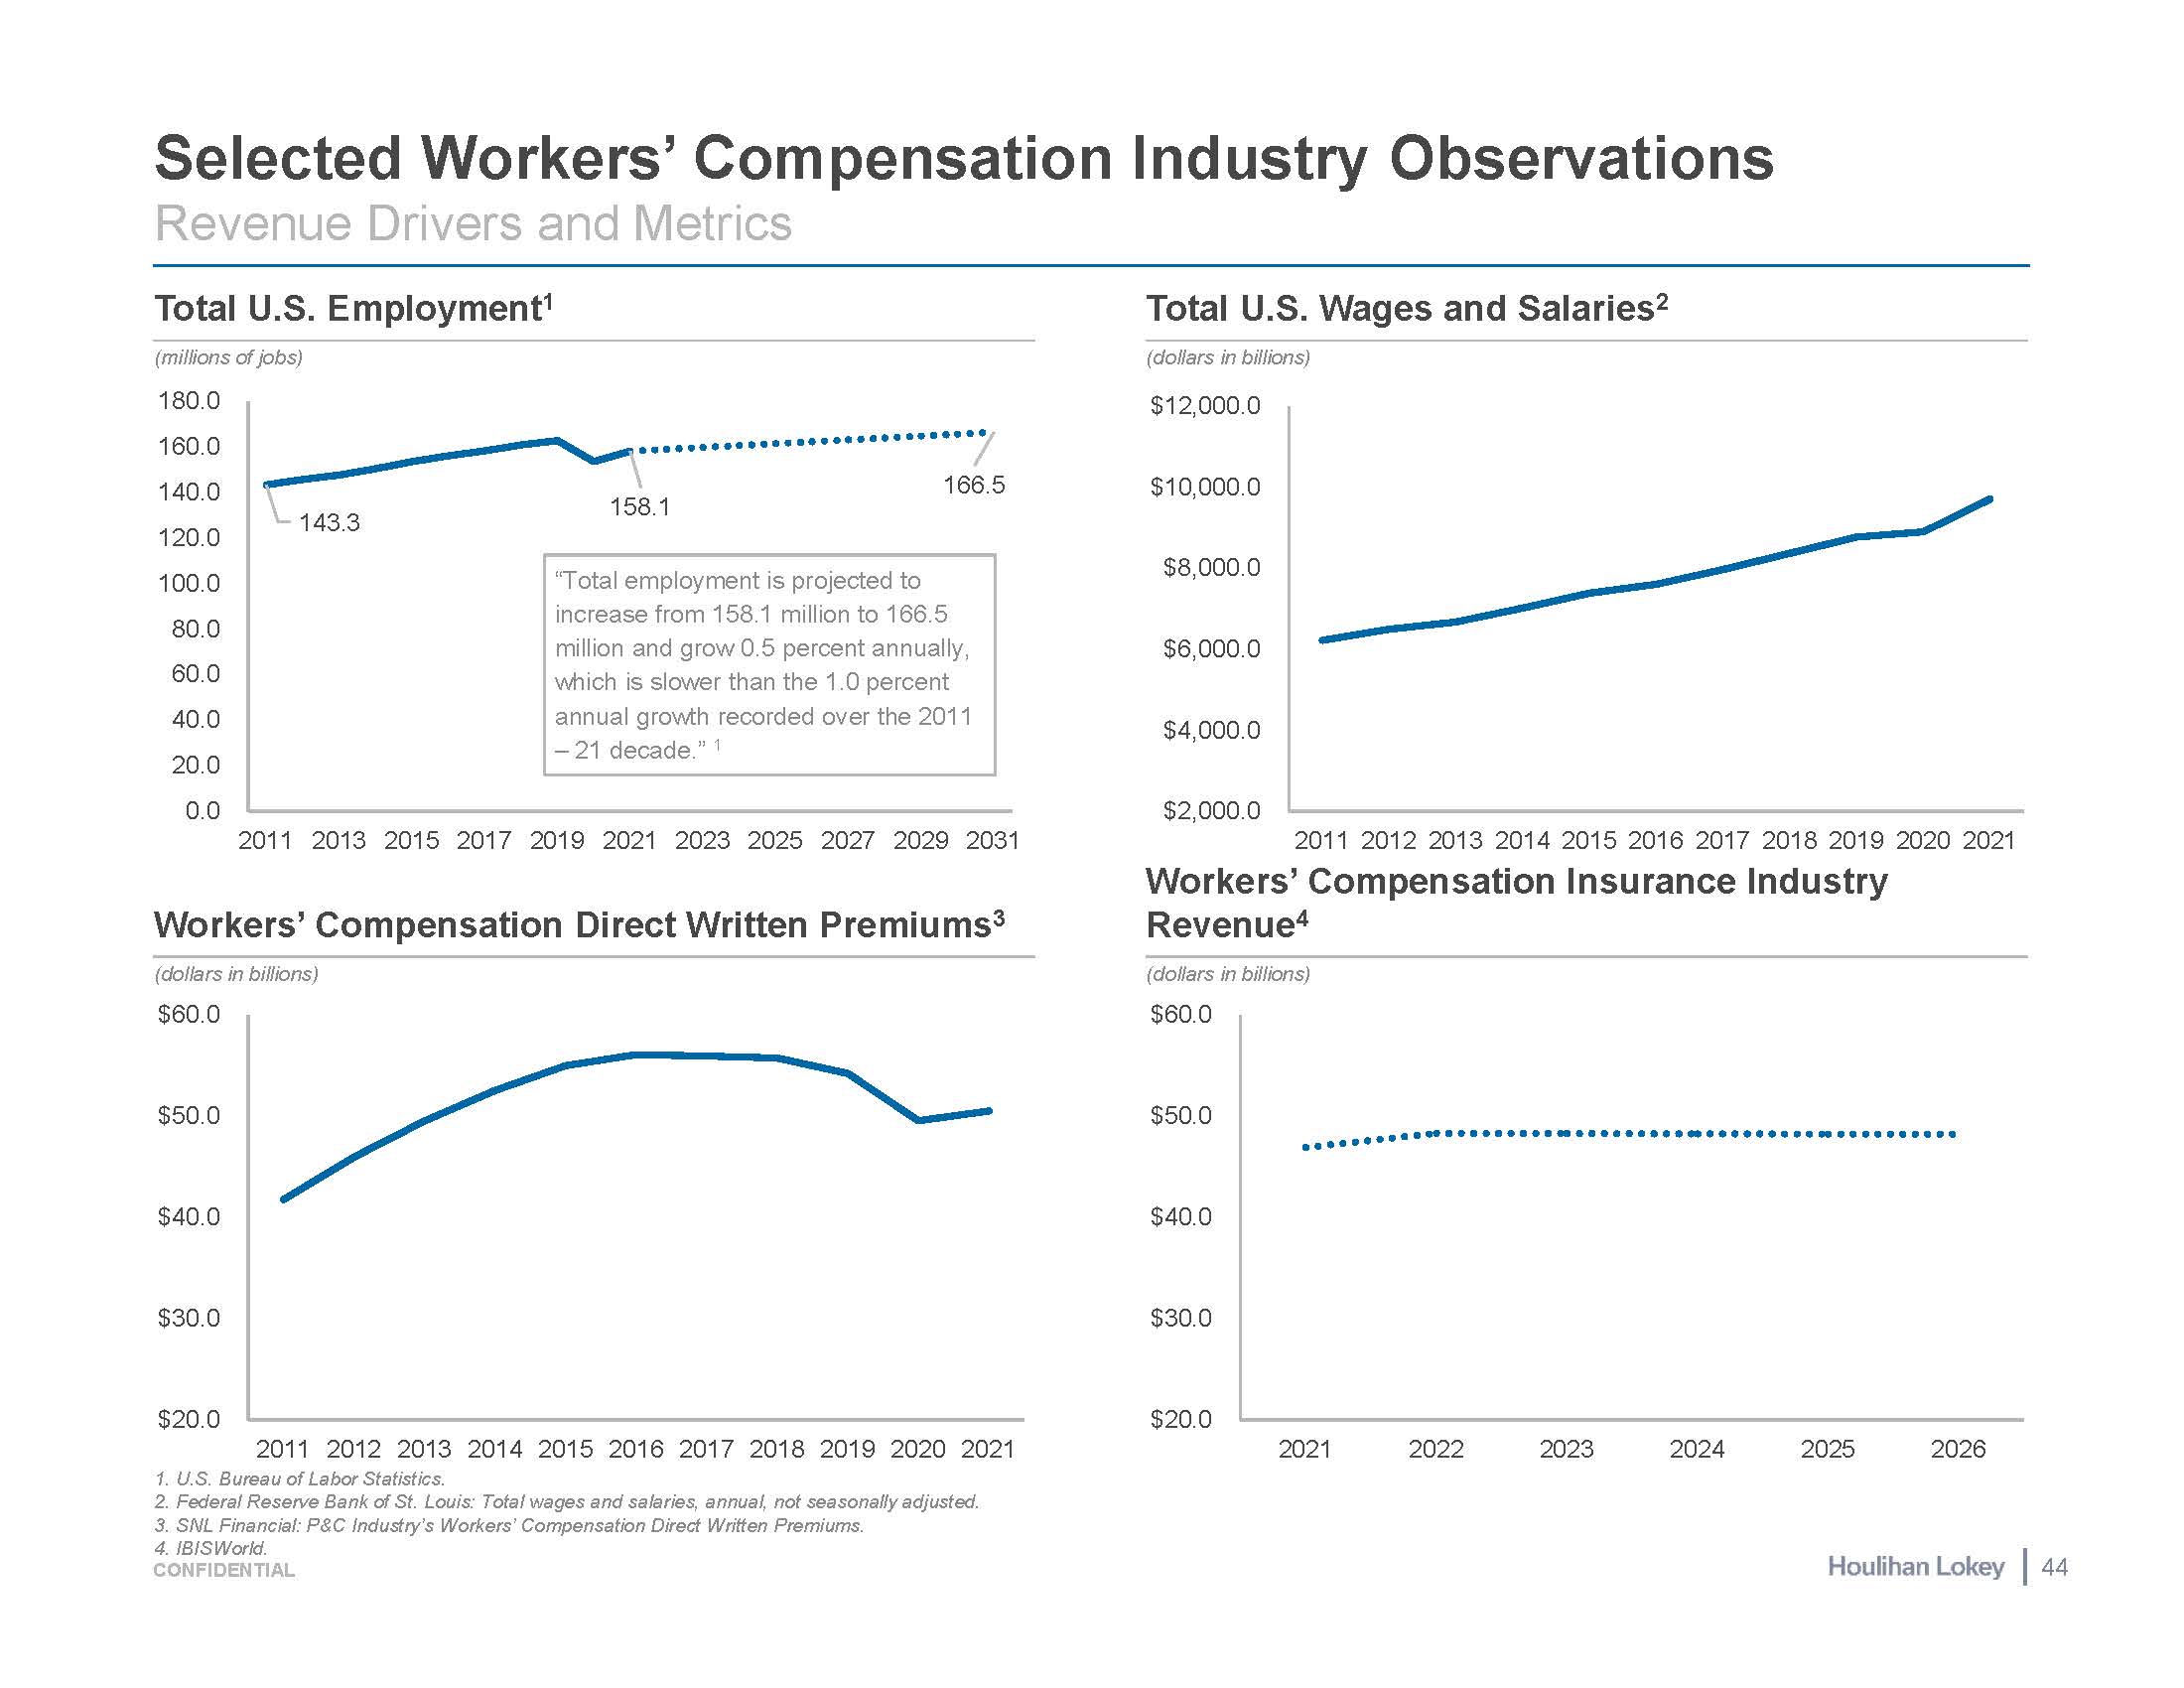
Selected Workers’ Compensation Industry Observations Workers’ Compensation Direct Written Premiums3 Workers’ Compensation Insurance Industry Revenue4 143.3 158.1 166.5 180.0 160.0 140.0 120.0 100.0 80.0 60.0 40.0 20.0 0.0 Revenue Drivers and Metrics Total U.S. Employment1 Total U.S. Wages and Salaries2 (millions of jobs) (dollars in billions) 2011 2013 2015 2017 2019 2021 2023 2025 2027 2029 2031 U.S. Bureau of Labor Statistics. Federal Reserve Bank of St. Louis: Total wages and salaries, annual, not seasonally adjusted. SNL Financial: P&C Industry’s Workers’ Compensation Direct Written Premiums. IBISWorld. $2,000.0 $4,000.0 $6,000.0 $8,000.0 $10,000.0 $12,000.0 2011 2012 2013 2014 2015 2016 2017 2018 2019 2020 2021 $20.0 $30.0 $40.0 $50.0 $60.0 2011 2012 2013 2014 2015 2016 2017 2018 2019 2020 2021 (dollars in billions) $20.0 $30.0 $40.0 $50.0 $60.0 2021 2022 2023 2024 2025 2026 (dollars in billions) “Total employment is projected to increase from 158.1 million to 166.5 million and grow 0.5 percent annually, which is slower than the 1.0 percent annual growth recorded over the 2011 – 21 decade.” 1 44 CONFIDENTIAL
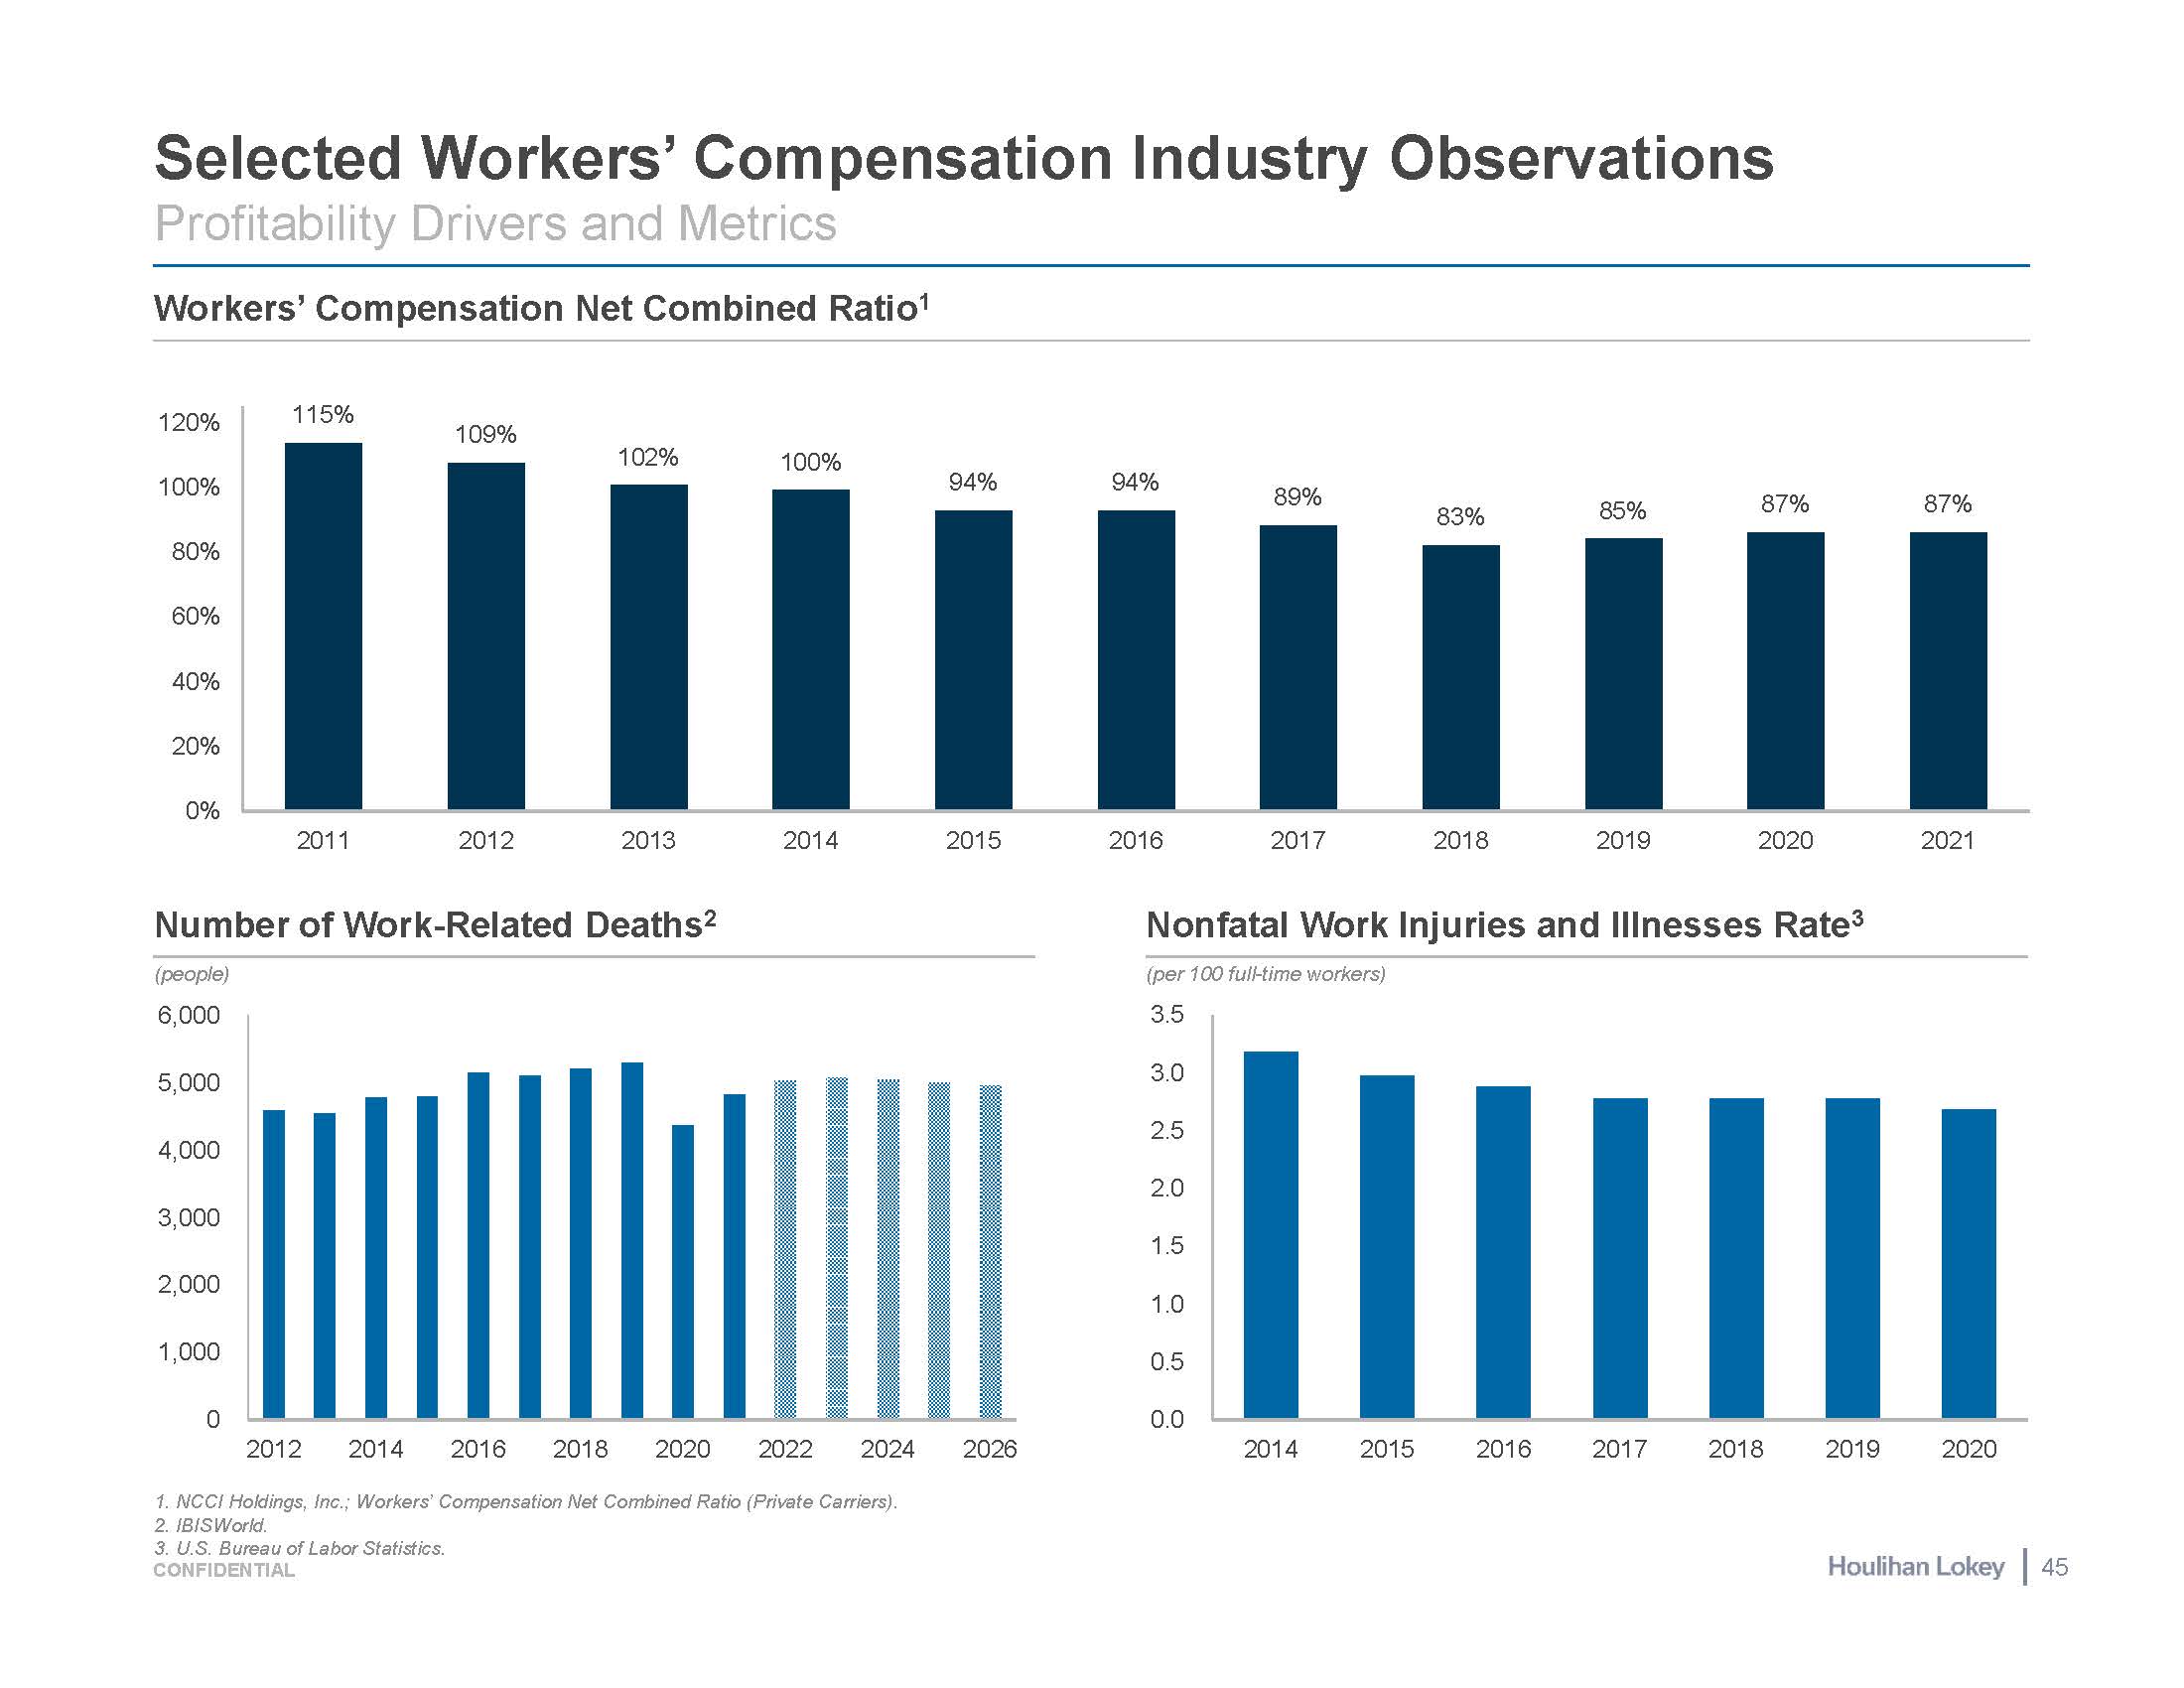
Selected Workers’ Compensation Industry Observations Profitability Drivers and Metrics Workers’ Compensation Net Combined Ratio1 Nonfatal Work Injuries and Illnesses Rate3 Number of Work-Related Deaths2 NCCI Holdings, Inc.; Workers’ Compensation Net Combined Ratio (Private Carriers). IBISWorld. U.S. Bureau of Labor Statistics. (per 100 full-time workers) (people) 6,000 115% 109% 102% 100% 94% 94% 89% 83% 85% 87% 87% 80% 60% 40% 20% 0% 100% 120% 2011 2012 2013 2014 2015 2016 2017 2018 2019 2020 2021 0.0 0.5 1.0 1.5 2.0 2.5 3.0 3.5 2014 2015 2016 2017 2018 2019 2020 0 44 CONFIDENTIAL 1,000 2,000 3,000 4,000 5,000 2012 2014 2016 2018 2020 2022 2024 2026
This presentation, and any supplemental information (written or oral) or other documents provided in connection therewith (collectively, the “materials”), are provided solely for the information of the Special Committee (the “Committee”) of the Board of Directors (the “Board”) of Twins (the “Company”) by Houlihan Lokey in connection with the Committee’s consideration of a potential transaction (the “Transaction”) involving the Company. This presentation is incomplete without reference to, and should be considered in conjunction with, any supplemental information provided by and discussions with Houlihan Lokey in connection therewith. Any defined terms used herein shall have the meanings set forth herein, even if such defined terms have been given different meanings elsewhere in the materials. The materials are for discussion purposes only. Houlihan Lokey expressly disclaims any and all liability, whether direct or indirect, in contract or tort or otherwise, to any person in connection with the materials. The materials were prepared for specific persons familiar with the business and affairs of the Company for use in a specific context and were not prepared with a view to public disclosure or to conform with any disclosure standards under any state, federal or international securities laws or other laws, rules or regulations, and none of the Committee, the Company or Houlihan Lokey takes any responsibility for the use of the materials by persons other than the Committee. The materials are provided on a confidential basis solely for the information of the Committee and may not be disclosed, summarized, reproduced, disseminated or quoted or otherwise referred to, in whole or in part, without Houlihan Lokey’s express prior written consent. Notwithstanding any other provision herein, the Company (and each employee, representative or other agent of the Company) may disclose to any and all persons without limitation of any kind, the tax treatment and tax structure of any transaction and all materials of any kind (including opinions or other tax analyses, if any) that are provided to the Company relating to such tax treatment and structure. However, any information relating to the tax treatment and tax structure shall remain confidential (and the foregoing sentence shall not apply) to the extent necessary to enable any person to comply with securities laws. For this purpose, the tax treatment of a transaction is the purported or claimed U.S. income or franchise tax treatment of the transaction and the tax structure of a transaction is any fact that may be relevant to understanding the purported or claimed U.S. income or franchise tax treatment of the transaction. If the Company plans to disclose information pursuant to the first sentence of this paragraph, the Company shall inform those to whom it discloses any such information that they may not rely upon such information for any purpose without Houlihan Lokey’s prior written consent. Houlihan Lokey is not an expert on, and nothing contained in the materials should be construed as advice with regard to, legal, accounting, regulatory, insurance, tax or other specialist matters. Houlihan Lokey’s role in reviewing any information was limited solely to performing such a review as it deemed necessary to support its own advice and analysis and was not on behalf of the Committee. The materials necessarily are based on financial, economic, market and other conditions as in effect on, and the information available to Houlihan Lokey as of, the date of the materials. Although subsequent developments may affect the contents of the materials, Houlihan Lokey has not undertaken, and is under no obligation, to update, revise or reaffirm the materials, except as may be expressly contemplated by Houlihan Lokey’s engagement letter. The materials are not intended to provide the sole basis for evaluation of the Transaction and do not purport to contain all information that may be required. The materials do not address the underlying business decision of the Company or any other party to proceed with or effect the Transaction, or the relative merits of the Transaction as compared to any alternative business strategies or transactions that might be available for the Company or any other party. The materials do not constitute any opinion, nor do the materials constitute a recommendation to the Board, the Committee, the Company, any security holder of the Company or any other party as to how to vote or act with respect to any matter relating to the Transaction or otherwise or whether to buy or sell any assets or securities of any company. Houlihan Lokey’s only opinion is the opinion, if any, that is actually delivered to the Committee. In preparing the materials Houlihan Lokey has acted as an independent contractor and nothing in the materials is intended to create or shall be construed as creating a fiduciary or other relationship between Houlihan Lokey and any party. The materials may not reflect information known to other professionals in other business areas of Houlihan Lokey and its affiliates. The preparation of the materials was a complex process involving quantitative and qualitative judgments and determinations with respect to the financial, comparative and other analytic methods employed and the adaption and application of these methods to the unique facts and circumstances presented and, therefore, is not readily susceptible to partial analysis or summary description. Furthermore, Houlihan Lokey did not attribute any particular weight to any analysis or factor considered by it, but rather made qualitative judgments as to the significance and relevance of each analysis and factor. Each analytical technique has inherent strengths and weaknesses, and the nature of the available information may further affect the value of particular techniques. Accordingly, the analyses contained in the materials must be considered as a whole. Selecting portions of the analyses, analytic methods and factors without considering all analyses and factors could create a misleading or incomplete view. The materials reflect judgments and assumptions with regard to industry performance, general business, economic, regulatory, market and financial conditions and other matters, many of which are beyond the control of the participants in the Transaction. Any estimates of value contained in the materials are not necessarily indicative of actual value or predictive of future results or values, which may be significantly more or less favorable. Any analyses relating to the value of assets, businesses or securities do not purport to be appraisals or to reflect the prices at which any assets, businesses or securities may actually be sold. The materials do not constitute a valuation opinion or credit rating. The materials do not address the consideration to be paid or received in, the terms of any arrangements, understandings, agreements or documents related to, or the form, structure or any other portion or aspect of, the Transaction or otherwise. Furthermore, the materials do not address the fairness of any portion or aspect of the Transaction to any party. In preparing the materials, Houlihan Lokey has not conducted any physical inspection or independent appraisal or evaluation of any of the assets, properties or liabilities (contingent or otherwise) of the Company or any other party and has no obligation to evaluate the solvency of the Company or any other party under any law. 44 CONFIDENTIAL Disclaimer
All budgets, projections, estimates, financial analyses, reports and other information with respect to operations (including, without limitation, estimates of potential cost savings and synergies) reflected in the materials have been prepared by management of the relevant party or are derived from such budgets, projections, estimates, financial analyses, reports and other information or from other sources, which involve numerous and significant subjective determinations made by management of the relevant party and/or which such management has reviewed and found reasonable. The budgets, projections and estimates (including, without limitation, estimates of potential cost savings and synergies) contained in the materials may or may not be achieved and differences between projected results and those actually achieved may be material. Houlihan Lokey has relied upon representations made by management of the Company and other participants in the Transaction that such budgets, projections and estimates have been reasonably prepared in good faith on bases reflecting the best currently available estimates and judgments of such management (or, with respect to information obtained from public sources, represent reasonable estimates), and Houlihan Lokey expresses no opinion with respect to such budgets, projections or estimates or the assumptions on which they are based. Houlihan Lokey has discussed the Company’s business with the Company and Houlihan Lokey does not make any representation, express or implied, as to the sufficiency or adequacy of its financial analysis or the scope thereof for any particular purpose. Houlihan Lokey has assumed and relied upon the accuracy and completeness of the financial and other information provided to, discussed with or reviewed by it without (and without assuming responsibility for) independent verification of such information, makes no representation or warranty (express or implied) in respect of the accuracy or completeness of such information and has further relied upon the assurances of the Company and other participants in the Transaction that they are not aware of any facts or circumstances that would make such information inaccurate or misleading. In addition, Houlihan Lokey has relied upon and assumed, without independent verification, that there has been no change in the business, assets, liabilities, financial condition, results of operations, cash flows or prospects of the Company or any other participant in the Transaction since the respective dates of the most recent financial statements and other information, financial or otherwise, provided to, discussed with or reviewed by Houlihan Lokey that would be material to its analyses, and that the final forms of any draft documents reviewed by Houlihan Lokey will not differ in any material respect from such draft documents. The materials are not an offer to sell or a solicitation of an indication of interest to purchase any security, option, commodity, future, loan or currency. The materials do not constitute a commitment by Houlihan Lokey or any of its affiliates to underwrite, subscribe for or place any securities, to extend or arrange credit, or to provide any other services. In the ordinary course of business, certain of Houlihan Lokey’s affiliates and employees, as well as investment funds in which they may have financial interests or with which they may co-invest, may acquire, hold or sell, long or short positions, or trade or otherwise effect transactions, in debt, equity, and other securities and financial instruments (including loans and other obligations) of, or investments in, the Company, any Transaction counterparty, any other Transaction participant, any other financially interested party with respect to any transaction, other entities or parties that are mentioned in the materials, or any of the foregoing entities’ or parties’ respective affiliates, subsidiaries, investment funds, portfolio companies and representatives (collectively, the “Interested Parties”), or any currency or commodity that may be involved in the Transaction. Houlihan Lokey provides mergers and acquisitions, restructuring and other advisory and consulting services to clients, which may have in the past included, or may currently or in the future include, one or more Interested Parties, for which services Houlihan Lokey has received, and may receive, compensation. Although Houlihan Lokey in the course of such activities and relationships or otherwise may have acquired, or may in the future acquire, information about one or more Interested Parties or the Transaction, or that otherwise may be of interest to the Board, the Committee, or the Company, Houlihan Lokey shall have no obligation to, and may not be contractually permitted to, disclose such information, or the fact that Houlihan Lokey is in possession of such information, to the Board, the Committee, or the Company or to use such information on behalf of the Board, the Committee, or the Company. Houlihan Lokey’s personnel may make statements or provide advice that is contrary to information contained in the materials. 44 CONFIDENTIAL Disclaimer (cont.)
CONFIDENTIAL 48 CORPORATE FINANCE FINANCIAL RESTRUCTURING FINANCIAL AND VALUATION ADVISORY HL.com