UNITED STATES
SECURITIES AND EXCHANGE COMMISSION
Washington, D.C. 20549
FORM N-CSR
CERTIFIED SHAREHOLDER REPORT OF REGISTERED MANAGEMENT INVESTMENT COMPANIES
Investment Company Act file number:
Name of Fund:
| BlackRock ETF Trust II |
| BlackRock AAA CLO ETF |
| Blackrock Flexible Income ETF |
| BlackRock Floating Rate Loan ETF |
| BlackRock High Yield Muni Income Bond ETF |
| BlackRock Intermediate Muni Income Bond ETF |
| BlackRock Short-Term California Muni Bond ETF |
| BlackRock Total Return ETF |
Fund Address: 100 Bellevue Parkway, Wilmington, DE 19809
Name and address of agent for service: John M. Perlowski, Chief Executive Officer, BlackRock ETF Trust II, 50 Hudson Yards, New York, NY 10001
Registrant's telephone number, including area code:
Date of reporting period:
Item 1 — Report to Stockholders
(a) The Report to Shareholders is attached herewith
BlackRock AAA CLO ETF
CLOA | NASDAQ
Annual Shareholder Report — July 31, 2024
This annual shareholder report contains important information about BlackRock AAA CLO ETF (the “Fund”) for the period of August 1, 2023 to July 31, 2024. You can find additional information about the Fund at blackrock.com/fundreports. You can also request this information by contacting us at (1‑800‑474‑2737).
This report describes changes to the Fund that occurred during the reporting period.
What were the Fund costs for the last year?
(based on a hypothetical $10,000 investment)
| Fund name | Costs of a $10,000
investment | Costs paid as a percentage of a
$10,000 investment |
| BlackRock AAA CLO ETF | $21 | 0.20% |
How did the Fund perform last year?
The U.S. Federal Reserve (“Fed”) held the federal funds rate steady throughout the 12-month period at a target range of 5.25% to 5.50%, citing the improving inflation outlook, supporting attractive all-in CLO yields.
CLO demand outpaced CLO supply given a muted supply of new bank loans. As a result, prices were driven above par for the majority of secondary market CLOs, even for deals with a high probability of getting called and leaving investors to be paid back at par.
Credit spread tightening in the first quarter of 2024 contributed to CLO market returns as well.
What contributed to performance?
The Fund actively purchased bonds from top-tier managers with established track records of managing credit through multiple economic cycles as such deals are generally higher quality and more liquid. This focus contributed to performance as there was meaningful dispersion in returns between cleaner, higher quality bonds from top-tier managers versus bonds from less established, lower-tier managers. Allocations to AAA CLO bonds from preferred managers led contributions to performance from a carry perspective. In addition, allocations to AA and single A CLO bonds held prior to the spread tightening seen in early 2024 contributed to performance based on a combination of higher income and price strength.
What detracted from performance?
There were no material detractors from performance.
The views expressed reflect the opinions of BlackRock as of the date of this report and are subject to change based on changes in market, economic or other conditions. These views are not intended to be a forecast of future events and are no guarantee of future results.
Fund performance
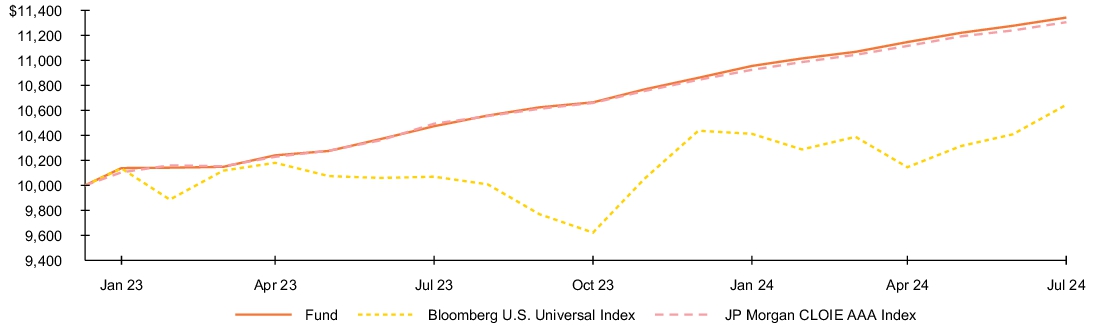
Cumulative performance: January 10, 2023 through July 31, 2024
Initial investment of $10,000
See “Average annual total returns” for additional information on fund performance.
| Average annual total returns | | | | |
| 1 Year | | Since Fund
Inception | |
| Fund NAV | 8.29 | % | 8.43 | % |
| Fund Market | 8.06 | | 8.54 | |
| Bloomberg U.S. Universal Index | 5.72 | | 4.09 | |
| JP Morgan CLOIE AAA Index | 7.74 | | 8.21 | |
| Key Fund statistics | |
| Net Assets | $399,571,057% |
| Number of Portfolio Holdings | $177% |
| Net Investment Advisory Fees | $261,676% |
| Portfolio Turnover Rate | $33% |
The Fund has added the Bloomberg U.S. Universal Index in response to new regulatory requirements.
The inception date of the Fund was January 10, 2023. The first day of secondary market trading was January 12, 2023.
Past performance is not an indication of future results. Performance results do not reflect the deduction of taxes that a shareholder would pay on fund distributions or on the redemption or sale of fund shares. Visit blackrock.com for more recent performance information.
What did the Fund invest in?
(as of July 31, 2024)
| Maturity | Percent of
Total Investments (a) | |
| 5-10 Years | 28.8 | % |
| 10-15 Years | 71.2 | % |
| Security | Percent of
Total Investments(a) | |
| RR 8 Ltd., 6.67%, 07/15/37 | 1.3 | % |
| Flatiron CLO 21 Ltd., Series 2021 1A, Class A1, 6.65%, 07/19/34 | 1.3 | % |
| Apidos CLO XXXIII, Series 2020 33A, Class AR, 6.70%, 10/24/34 | 1.3 | % |
| OHA Loan Funding Ltd., 6.69%, 01/19/37 | 1.3 | % |
| Golub Capital Partners CLO 58B Ltd., 6.73%, 01/25/35 | 1.3 | % |
| OHA Credit Funding 2 Ltd., 6.69%, 04/21/34 | 1.3 | % |
| Golub Capital Partners CLO 41B-R Ltd., 6.86%, 01/20/34 | 1.3 | % |
| Whitebox CLO III Ltd., 6.78%, 10/15/34 | 1.3 | % |
| Apidos CLO XXXVII, 6.67%, 10/22/34 | 1.2 | % |
| Whitebox CLO I Ltd., 6.66%, 07/24/36 | 1.2 | % |
(a) | Excludes money market funds. |
Material Fund changes
This is a summary of certain changes to the Fund since July 31, 2023. For more complete information, you may review the Fund’s next prospectus, which we expect to be available approximately 120 days after July 31, 2024 at blackrock.com/fundreports or upon request by contacting us at (1-800-474-2737).
On July 30, 2024, the Fund’s Board approved a proposal to change the name of the Fund from BlackRock AAA CLO ETF to iShares AAA CLO Active ETF. This change is expected to become effective on or about October 10, 2024.
Additional information
If you wish to view additional information about the Fund, including but not limited to financial statements, the Fund’s prospectus, and proxy voting policies and procedures, please visit blackrock.com/fundreports. For proxy voting records, visit blackrock.com/proxyrecords.
Householding
The Fund will mail only one copy of shareholder documents, including prospectuses, annual and semi-annual reports and proxy statements, to shareholders with multiple accounts at the same address. This practice is commonly called “householding” and is intended to reduce expenses and eliminate duplicate mailings of shareholder documents. Mailings of your shareholder documents may be householded indefinitely unless you instruct us otherwise. If you do not want the mailing of these documents to be combined with those for other members of your household, please call the Fund at (1-800-474-2737).
The Fund is not sponsored, endorsed, issued, sold, or promoted by Bloomberg Index Services Limited or JPMorgan Chase & Co., nor do these companies make any representation regarding the advisability of investing in the Fund. BlackRock is not affiliated with the companies listed above.
©2024 BlackRock, Inc. or its affiliates. All rights reserved. BLACKROCK is a registered trademark of BlackRock, Inc. or its affiliates. All other trademarks are those of their respective owners.
BlackRock AAA CLO ETF
Annual Shareholder Report — July 31, 2024
CLOA-07/24-AR
BlackRock Flexible Income ETF
BINC | NYSE Arca
Annual Shareholder Report — July 31, 2024
This annual shareholder report contains important information about BlackRock Flexible Income ETF (the “Fund”) for the period of August 1, 2023 to July 31, 2024. You can find additional information about the Fund at blackrock.com/fundreports. You can also request this information by contacting us at (1‑800‑474‑2737).
This report describes changes to the Fund that occurred during the reporting period.
What were the Fund costs for the last year?
(based on a hypothetical $10,000 investment)
| Fund name | Costs of a $10,000
investment | Costs paid as a percentage of a
$10,000 investment |
| BlackRock Flexible Income ETF | $40 | 0.38% |
How did the Fund perform last year?
The U.S. Federal Reserve (“Fed”) held the federal funds rate steady throughout the 12-month period at a target range of 5.25% to 5.50%, citing the improving inflation outlook.
Short-term interest rates generally finished the period lower as the market anticipated that the Fed would soon begin to lower its benchmark overnight lending rate, while longer-term rates ended the period moderately higher.
Within the benchmark, credit-sensitive sectors outperformed as risk sentiment was bolstered by the anticipation of a soft landing for the economy.
What contributed to performance?
Over the period, economic growth generally surprised to the upside and spread sectors across fixed income continued to perform well despite elevated interest rate volatility. Given those dynamics, the most notable contributions to performance included the Fund’s allocation to securitized assets where holdings favored select top-of-the-capital structure segments within commercial mortgage-backed securities, higher-quality collateralized loan obligations. Allocations to non-U.S. corporate bonds and U.S. high yield corporate bonds also contributed as non-US credit remains appealing due to the diversified yield pickup.
What detracted from performance?
The Fund’s emerging markets debt position detracted from performance.
The views expressed reflect the opinions of BlackRock as of the date of this report and are subject to change based on changes in market, economic or other conditions. These views are not intended to be a forecast of future events and are no guarantee of future results.
Fund performance
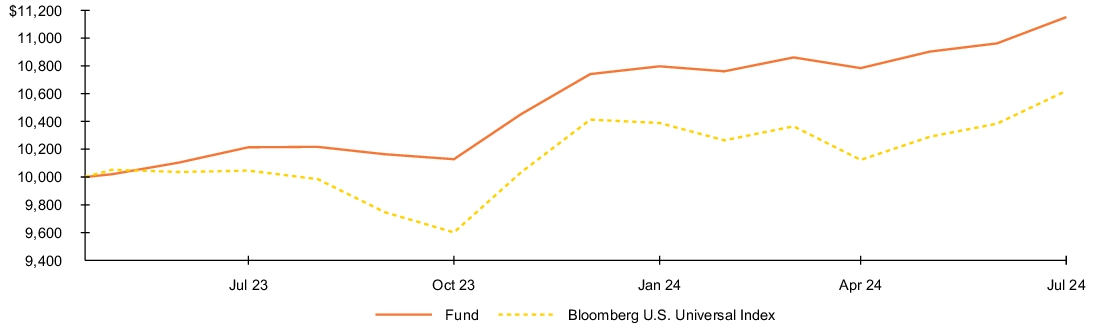
Cumulative performance: May 19, 2023 through July 31, 2024
Initial investment of $10,000
See “Average annual total returns” for additional information on fund performance.
| Average annual total returns | | | | |
| 1 Year | | Since Fund
Inception | |
| Fund NAV | 9.17 | % | 9.48 | % |
| Fund Market | 9.00 | | 9.75 | |
| Bloomberg U.S. Universal Index | 5.72 | | 5.15 | |
| Key Fund statistics | |
| Net Assets | $3,623,012,344% |
| Number of Portfolio Holdings | $2,537% |
| Net Investment Advisory Fees | $5,663,858% |
| Portfolio Turnover Rate | $200% |
The inception date of the Fund was May 19, 2023. The first day of secondary market trading was May 23, 2023.
Past performance is not an indication of future results. Performance results do not reflect the deduction of taxes that a shareholder would pay on fund distributions or on the redemption or sale of fund shares. Visit blackrock.com for more recent performance information.
What did the Fund invest in?
(as of July 31, 2024)
| Investment Type | Percent of
Total Investments(a) | |
| Corporate Bonds & Notes | 45.0 | % |
| Asset-Backed Securities | 16.9 | % |
| Collaterized Mortgage Obligations | 13.9 | % |
| U.S. Government & Agency Obligations | 10.4 | % |
| Foreign Government Obligations | 5.7 | % |
| Investment Companies | 4.3 | % |
| Floating Rate Loan Interests | 3.2 | % |
| Convertible Bonds | 0.5 | % |
| Municipal Debt Obligations | 0.1 | % |
Credit quality allocation
| Credit Rating* | Percent of
Total Investments(a) | |
| AAA/Aaa(d) | 27.7 | % |
| AA/Aa | 3.8 | % |
| A | 6.2 | % |
| BBB/Baa | 10.6 | % |
| BB/Ba | 22.9 | % |
| B | 12.8 | % |
| CCC/Caa | 0.7 | % |
| D | — | % (b) |
| N/R(c) | 15.3 | % |
(a) | Excludes money market funds. |
(b) | Rounds to less than 0.1%. |
(c) | The investment adviser evaluates the credit quality of unrated investments based upon certain factors including, but not limited to, credit ratings for similar investments and financial analysis of sectors and individual investments. Using this approach, the investment adviser has deemed certain of these unrated securities as investment grade quality. As of July 31, 2024, the market value of unrated securities deemed by the investment adviser to be investment grade represents less than 1.0% of total investments. |
(d) | Includes U.S. Government Sponsored Agency Securities which are deemed AAA/Aaa by the investment adviser. |
* | For purposes of this report, credit quality ratings shown above reflect the highest rating assigned by either S&P Global Ratings or Moody’s Investors Service, Inc. if ratings differ. These rating agencies are independent, nationally recognized statistical rating organizations and are widely used. Investment grade ratings are credit ratings of BBB/Baa or higher. Below investment grade ratings are credit ratings of BB/Ba or lower. Investments designated N/R are not rated by either rating agency. Unrated investments do not necessarily indicate low credit quality. Credit quality ratings are subject to change. |
Material Fund changes
This is a summary of certain changes to the Fund since July 31, 2023. For more complete information, you may review the Fund’s next prospectus, which we expect to be available approximately 120 days after July 31, 2024 at blackrock.com/fundreports or upon request by contacting us at (1-800-474-2737).
On July 30, 2024, the Fund’s Board approved a proposal to change the name of the Fund from BlackRock Flexible Income ETF to iShares Flexible Income Active ETF. This change is expected to become effective on or about October 10, 2024.
Additional information
If you wish to view additional information about the Fund, including but not limited to financial statements, the Fund’s prospectus, and proxy voting policies and procedures, please visit blackrock.com/fundreports. For proxy voting records, visit blackrock.com/proxyrecords.
Householding
The Fund will mail only one copy of shareholder documents, including prospectuses, annual and semi-annual reports and proxy statements, to shareholders with multiple accounts at the same address. This practice is commonly called “householding” and is intended to reduce expenses and eliminate duplicate mailings of shareholder documents. Mailings of your shareholder documents may be householded indefinitely unless you instruct us otherwise. If you do not want the mailing of these documents to be combined with those for other members of your household, please call the Fund at (1-800-474-2737).
The Fund is not sponsored, endorsed, issued, sold, or promoted by Bloomberg Index Services Limited, nor does this company make any representation regarding the advisability of investing in the Fund. BlackRock is not affiliated with the company listed above.
©2024 BlackRock, Inc. or its affiliates. All rights reserved. BLACKROCK is a registered trademark of BlackRock, Inc. or its affiliates. All other trademarks are those of their respective owners.
BlackRock Flexible Income ETF
Annual Shareholder Report — July 31, 2024
BINC-07/24-AR
BlackRock Floating Rate Loan ETF
BRLN | Cboe BZX
Annual Shareholder Report — July 31, 2024
This annual shareholder report contains important information about BlackRock Floating Rate Loan ETF (the “Fund”) for the period of August 1, 2023 to July 31, 2024. You can find additional information about the Fund at blackrock.com/fundreports. You can also request this information by contacting us at (1‑800‑474‑2737).
This report describes changes to the Fund that occurred during the reporting period.
What were the Fund costs for the last year?
(based on a hypothetical $10,000 investment)
| Fund name | Costs of a $10,000
investment | Costs paid as a percentage of a
$10,000 investment |
| BlackRock Floating Rate Loan ETF | $56 | 0.53% |
How did the Fund perform last year?
Loans and high yield bonds gained ground in the annual period. Both categories benefited from the combination of declining spreads and their above-average income.
Bank loans have demonstrated resilience in an environment of interest-rate volatility and speculation around central bank policy. Additionally, total measurable demand for loans reached record levels in the first half of 2024.
The Fund produced a strong absolute return but underperformed its benchmark, the Morningstar LSTA Leveraged Loan Index.
What contributed to performance?
The Fund’s tactical allocation to high yield bonds, which was achieved in part through the use of liquid products, contributed positively. From a sector perspective, overweights in the brokerage/asset managers/exchanges, diversified manufacturing, and insurance sectors were the largest contributors.
What detracted from performance?
Ratings positioning detracted, with underweights and selection in B2/B3 issues having the largest adverse effect. At the sector level, underweights in healthcare, technology, and chemicals detracted.
The views expressed reflect the opinions of BlackRock as of the date of this report and are subject to change based on changes in market, economic or other conditions. These views are not intended to be a forecast of future events and are no guarantee of future results.
Fund performance
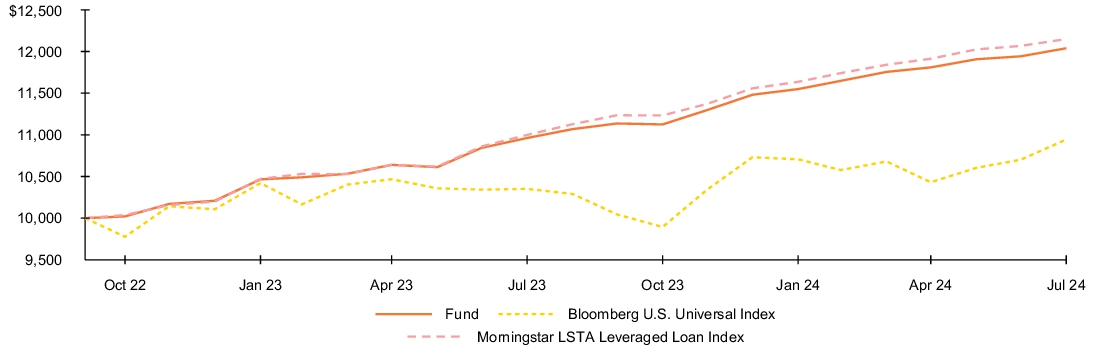
Cumulative performance: October 4, 2022 through July 31, 2024
Initial investment of $10,000
See “Average annual total returns” for additional information on fund performance.
| Average annual total returns | | | | |
| 1 Year | | Since Fund
Inception | |
| Fund NAV | 9.82 | % | 10.70 | % |
| Fund Market | 8.99 | | 10.79 | |
| Bloomberg U.S. Universal Index | 5.72 | | 5.08 | |
| Morningstar LSTA Leveraged Loan Index | 10.45 | | 11.27 | |
| Key Fund statistics | |
| Net Assets | $49,811,298% |
| Number of Portfolio Holdings | $431% |
| Net Investment Advisory Fees | $158,934% |
| Portfolio Turnover Rate | $33% |
The Fund has added the Bloomberg U.S. Universal Index in response to new regulatory requirements.
The inception date of the Fund was October 4, 2022. The first day of secondary market trading was October 6, 2022.
Past performance is not an indication of future results. Performance results do not reflect the deduction of taxes that a shareholder would pay on fund distributions or on the redemption or sale of fund shares. Visit blackrock.com for more recent performance information.
What did the Fund invest in?
(as of July 31, 2024)
Credit quality allocation
| Credit Rating* | Percent of
Total Investments(a) | |
| A | — | % (b) |
| BBB/Baa | 4.4 | % |
| BB/Ba | 25.3 | % |
| B | 59.2 | % |
| CCC/Caa | 4.2 | % |
| N/R | 6.9 | % |
| Maturity | Percent of
Total Investments (a) | |
| 0-1 Year | 1.2 | % |
| 1-5 Years | 53.0 | % |
| 5-10 Years | 45.8 | % |
(a) | Excludes money market funds. |
(b) | Rounds to less than 0.1%. |
* | For purposes of this report, credit quality ratings shown above reflect the highest rating assigned by either S&P Global Ratings or Moody’s Investors Service, Inc. if ratings differ. These rating agencies are independent, nationally recognized statistical rating organizations and are widely used. Investment grade ratings are credit ratings of BBB/Baa or higher. Below investment grade ratings are credit ratings of BB/Ba or lower. Investments designated N/R are not rated by either rating agency. Unrated investments do not necessarily indicate low credit quality. Credit quality ratings are subject to change. |
Material Fund changes
This is a summary of certain changes to the Fund since July 31, 2023. For more complete information, you may review the Fund’s next prospectus, which we expect to be available approximately 120 days after July 31, 2024 at blackrock.com/fundreports or upon request by contacting us at (1-800-474-2737).
On July 30, 2024, the Fund’s Board approved a proposal to change the name of the Fund from BlackRock Floating Rate Loan ETF to iShares Floating Rate Loan Active ETF. This change is expected to become effective on or about October 10, 2024.
Additional information
If you wish to view additional information about the Fund, including but not limited to financial statements, the Fund’s prospectus, and proxy voting policies and procedures, please visit blackrock.com/fundreports. For proxy voting records, visit blackrock.com/proxyrecords.
Householding
The Fund will mail only one copy of shareholder documents, including prospectuses, annual and semi-annual reports and proxy statements, to shareholders with multiple accounts at the same address. This practice is commonly called “householding” and is intended to reduce expenses and eliminate duplicate mailings of shareholder documents. Mailings of your shareholder documents may be householded indefinitely unless you instruct us otherwise. If you do not want the mailing of these documents to be combined with those for other members of your household, please call the Fund at (1-800-474-2737).
The Fund is not sponsored, endorsed, issued, sold, or promoted by Bloomberg Index Services Limited or Morningstar, Inc., nor do these companies make any representation regarding the advisability of investing in the Fund. BlackRock is not affiliated with the companies listed above.
©2024 BlackRock, Inc. or its affiliates. All rights reserved. BLACKROCK is a registered trademark of BlackRock, Inc. or its affiliates. All other trademarks are those of their respective owners.
BlackRock Floating Rate Loan ETF
Annual Shareholder Report — July 31, 2024
BRLN-07/24-AR
BlackRock High Yield Muni Income Bond ETF
HYMU | Cboe BZX
Annual Shareholder Report — July 31, 2024
This annual shareholder report contains important information about BlackRock High Yield Muni Income Bond ETF (the “Fund”) for the period of August 1, 2023 to July 31, 2024. You can find additional information about the Fund at blackrock.com/fundreports. You can also request this information by contacting us at (1‑800‑474‑2737).
This report describes changes to the Fund that occurred during the reporting period.
What were the Fund costs for the last year?
(based on a hypothetical $10,000 investment)
| Fund name | Costs of a $10,000
investment | Costs paid as a percentage of a
$10,000 investment |
| BlackRock High Yield Muni Income Bond ETF | $36 | 0.34% |
How did the Fund perform last year?
High-yield municipal bonds delivered strong returns in the annual period, with rising prices augmenting the benefit of income.
Declining inflation fueled expectations that the U.S. Federal Reserve was set to begin cutting interest rates later in 2024, benefiting the broader fixed-income market.
Municipal bonds were well supported by positive economic growth, strong issuer fundamentals, and favorable supply-and-demand trends.
What contributed to performance?
An overweight in below investment-grade bonds contributed to the Fund’s outperformance, as did a long duration and long yield curve positioning. (Duration is a measure of interest rate sensitivity.) At the sector level, the largest contributions came from the corporate-backed sector, which includes metals, prepaid gas, and airline issues. The other industries that contributed to performance include development district issues, and tax-backed states primarily being Puerto Rico debt.
What detracted from performance?
At a time of strong returns for the broader asset class, there were no meaningful detractors from Fund performance.
The views expressed reflect the opinions of BlackRock as of the date of this report and are subject to change based on changes in market, economic or other conditions. These views are not intended to be a forecast of future events and are no guarantee of future results.
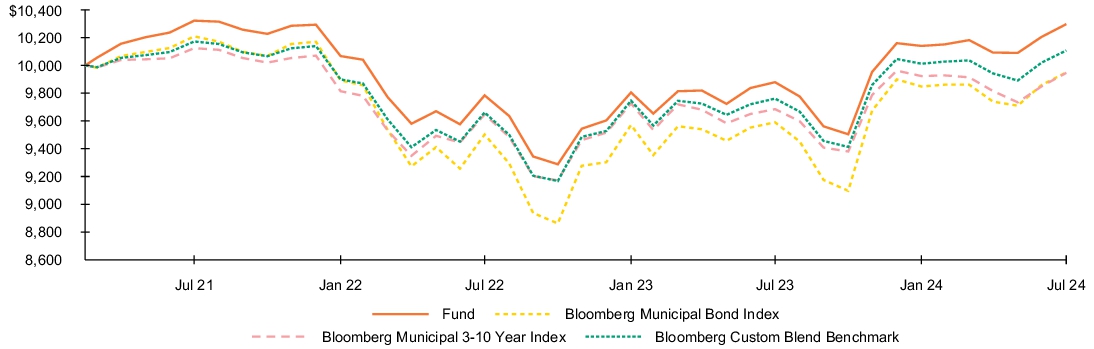
Fund performance
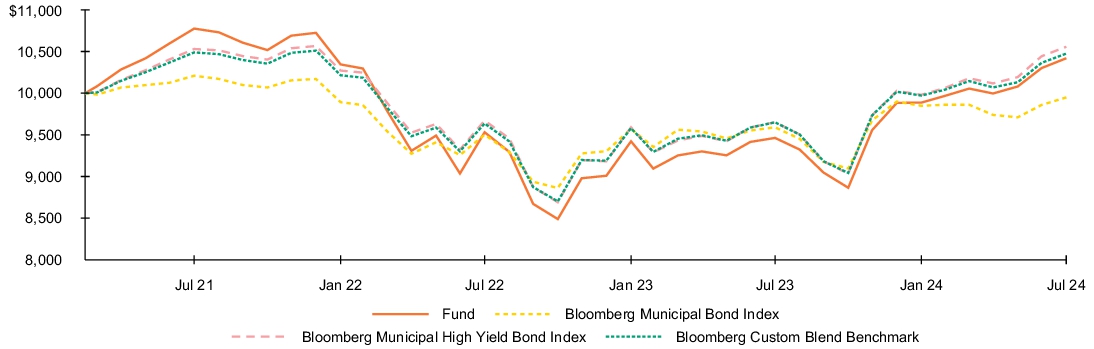
Cumulative performance: March 16, 2021 through July 31, 2024
Initial investment of $10,000
See “Average annual total returns” for additional information on fund performance.
| Average annual total returns | | | | |
| 1 Year | | Since Fund
Inception | |
| Fund NAV | 10.10 | % | 1.22 | % |
| Fund Market | 10.89 | | 1.53 | |
| Bloomberg Municipal Bond Index | 3.74 | | (0.15 | ) |
| Bloomberg Municipal High Yield Bond Index | 9.38 | | 1.62 | |
| Bloomberg Custom Blend Benchmark | 8.55 | | 1.39 | |
| Key Fund statistics | |
| Net Assets | $147,876,692% |
| Number of Portfolio Holdings | $271% |
| Net Investment Advisory Fees | $270,038% |
| Portfolio Turnover Rate | $46% |
The Fund has added the Bloomberg Municipal Bond Index in response to new regulatory requirements.
The inception date of the Fund was March 16, 2021. The first day of secondary market trading was March 18, 2021.
The Bloomberg Custom Blend Benchmark is comprised of the Bloomberg Municipal High Yield Index (80%), the Bloomberg BBB Index (10%) and the Bloomberg Single A Index (10%).
Past performance is not an indication of future results. Performance results do not reflect the deduction of taxes that a shareholder would pay on fund distributions or on the redemption or sale of fund shares. Visit blackrock.com for more recent performance information.
What did the Fund invest in?
(as of July 31, 2024)
Credit quality allocation
| Credit Rating* | Percent of
Total Investments(a) | |
| AAA/Aaa | 1.5 | % |
| AA/Aa | 3.9 | % |
| A | 6.3 | % |
| BBB/Baa | 15.8 | % |
| BB/Ba | 13.1 | % |
| B | 2.1 | % |
| N/R(b) | 57.3 | % |
| Security | Percent of
Total Investments(a) | |
| Puerto Rico Sales Tax Financing Corp. Sales Tax Revenue RB, 5.00%, 07/01/58 | 3.5 | % |
| New York Transportation Development Corp RB AMT, 5.38%, 06/30/60 | 2.8 | % |
| Hoover Industrial Development Board RB AMT, 5.75%, 10/01/49 | 2.3 | % |
| Tobacco Settlement Financing Corp. RB, 5.00%, 06/01/46 | 2.0 | % |
| Commonwealth of Puerto Rico GO, 4.00%, 07/01/37 | 1.9 | % |
(a) | Excludes money market funds. |
(b) | The investment adviser evaluates the credit quality of unrated investments based upon certain factors including, but not limited to, credit ratings for similar investments and financial analysis of sectors and individual investments. Using this approach, the investment adviser has deemed certain of these unrated securities as investment grade quality. As of July 31, 2024, the market value of unrated securities deemed by the investment adviser to be investment grade represents less than 1.0% of total investments. |
* | For purposes of this report, credit quality ratings shown above reflect the highest rating assigned by either S&P Global Ratings or Moody’s Investors Service, Inc. if ratings differ. These rating agencies are independent, nationally recognized statistical rating organizations and are widely used. Investment grade ratings are credit ratings of BBB/Baa or higher. Below investment grade ratings are credit ratings of BB/Ba or lower. Investments designated N/R are not rated by either rating agency. Unrated investments do not necessarily indicate low credit quality. Credit quality ratings are subject to change. |
Material Fund changes
This is a summary of certain changes to the Fund since July 31, 2023. For more complete information, you may review the Fund’s next prospectus, which we expect to be available approximately 120 days after July 31, 2024 at blackrock.com/fundreports or upon request by contacting us at (1-800-474-2737).
On July 30, 2024, the Fund’s Board approved a proposal to change the name of the Fund from BlackRock High Yield Muni Income ETF to iShares High Yield Muni Income Active ETF. This change is expected to become effective on or about October 10, 2024.
Additional information
If you wish to view additional information about the Fund, including but not limited to financial statements, the Fund’s prospectus, and proxy voting policies and procedures, please visit blackrock.com/fundreports. For proxy voting records, visit blackrock.com/proxyrecords.
Householding
The Fund will mail only one copy of shareholder documents, including prospectuses, annual and semi-annual reports and proxy statements, to shareholders with multiple accounts at the same address. This practice is commonly called “householding” and is intended to reduce expenses and eliminate duplicate mailings of shareholder documents. Mailings of your shareholder documents may be householded indefinitely unless you instruct us otherwise. If you do not want the mailing of these documents to be combined with those for other members of your household, please call the Fund at (1-800-474-2737).
The Fund is not sponsored, endorsed, issued, sold, or promoted by Bloomberg Index Services Limited, nor does this company make any representation regarding the advisability of investing in the Fund. BlackRock is not affiliated with the company listed above.
©2024 BlackRock, Inc. or its affiliates. All rights reserved. BLACKROCK is a registered trademark of BlackRock, Inc. or its affiliates. All other trademarks are those of their respective owners.
BlackRock High Yield Muni Income Bond ETF
Annual Shareholder Report — July 31, 2024
HYMU-07/24-AR
BlackRock Intermediate Muni Income Bond ETF
INMU | NYSE Arca
Annual Shareholder Report — July 31, 2024
This annual shareholder report contains important information about BlackRock Intermediate Muni Income Bond ETF (the “Fund”) for the period of August 1, 2023 to July 31, 2024. You can find additional information about the Fund at blackrock.com/fundreports. You can also request this information by contacting us at (1‑800‑474‑2737).
This report describes changes to the Fund that occurred during the reporting period.
What were the Fund costs for the last year?
(based on a hypothetical $10,000 investment)
| Fund name | Costs of a $10,000
investment | Costs paid as a percentage of a
$10,000 investment |
| BlackRock Intermediate Muni Income Bond ETF | $32 | 0.31% |
How did the Fund perform last year?
The municipal bond market gained ground in the reporting period, with income playing the largest role in total returns.
Declining inflation fueled expectations that the U.S. Federal Reserve was set to begin cutting interest rates later in 2024, benefiting the broader fixed-income market.
Municipal bonds were well supported by positive economic growth, strong issuer fundamentals, and favorable supply-and-demand trends.
What contributed to performance?
The Fund benefited from both sector allocations and security selection in high yield (below investment-grade) bonds. The Fund’s positioning on the investment-grade side, which tilted in favor of A and BBB rated securities, also made a positive contribution. Most of the outperformance was driven by an overweight in the corporate-backed sector in general and prepaid gas issues in particular. Underweights in the tax-backed and utilities sectors contributed, as well. An overweight on the steepest parts of the yield curve further contributed.
What detracted from performance?
The Fund’s positioning with respect to duration (interest rate sensitivity) detracted. While the Fund’s positioning shifted over the course of the period, it began with its duration shorter than the benchmark and subsequently moved to a longer duration by the end of July 2024.
The views expressed reflect the opinions of BlackRock as of the date of this report and are subject to change based on changes in market, economic or other conditions. These views are not intended to be a forecast of future events and are no guarantee of future results.
Fund performance
Cumulative performance: March 16, 2021 through July 31, 2024
Initial investment of $10,000
See “Average annual total returns” for additional information on fund performance.
| Average annual total returns | | | | |
| 1 Year | | Since Fund
Inception | |
| Fund NAV | 4.23 | % | 0.87 | % |
| Fund Market | 5.19 | | 1.04 | |
| Bloomberg Municipal Bond Index | 3.74 | | (0.15 | ) |
| Bloomberg Municipal 3-10 Year Index | 2.70 | | (0.16 | ) |
| Bloomberg Custom Blend Benchmark | 3.54 | | 0.32 | |
| Key Fund statistics | |
| Net Assets | $21,325,335% |
| Number of Portfolio Holdings | $73% |
| Net Investment Advisory Fees | $66,024% |
| Portfolio Turnover Rate | $58% |
The Fund has added the Bloomberg Municipal Bond Index in response to new regulatory requirements.
The inception date of the Fund was March 16, 2021. The first day of secondary market trading was March 18, 2021.
The Bloomberg Custom Blend Benchmark is comprised of the Bloomberg 1-15 Year Municipal Bond Index (90%) and the Bloomberg Municipal High Yield 1-15 Year Index (10%).
Past performance is not an indication of future results. Performance results do not reflect the deduction of taxes that a shareholder would pay on fund distributions or on the redemption or sale of fund shares. Visit blackrock.com for more recent performance information.
What did the Fund invest in?
(as of July 31, 2024)
Credit quality allocation
| Credit Rating* | Percent of
Total Investments(a) | |
| AAA/Aaa | 1.9 | % |
| AA/Aa | 23.6 | % |
| A | 42.8 | % |
| BBB/Baa | 19.2 | % |
| BB/Ba | 1.1 | % |
| B | 1.3 | % |
| N/R | 10.1 | % |
| Security | Percent of
Total Investments(a) | |
| County of Jefferson Alabama Sewer Revenue RB, 5.25%, 10/01/44 | 5.3 | % |
| Tennergy Corp./Tennessee RB, 5.50%, 10/01/53 | 3.9 | % |
| Kansas City Industrial Development Authority RB AMT, 5.00%, 03/01/34 | 3.8 | % |
| California Community Choice Financing Authority RB, 5.54%, 12/01/53 | 3.7 | % |
| New Hope Cultural Education Facilities Finance Corp. RB, 4.00%, 08/15/34 | 3.7 | % |
(a) | Excludes money market funds. |
* | For purposes of this report, credit quality ratings shown above reflect the highest rating assigned by either S&P Global Ratings or Moody’s Investors Service, Inc. if ratings differ. These rating agencies are independent, nationally recognized statistical rating organizations and are widely used. Investment grade ratings are credit ratings of BBB/Baa or higher. Below investment grade ratings are credit ratings of BB/Ba or lower. Investments designated N/R are not rated by either rating agency. Unrated investments do not necessarily indicate low credit quality. Credit quality ratings are subject to change. |
Material Fund changes
This is a summary of certain changes to the Fund since July 31, 2023. For more complete information, you may review the Fund’s next prospectus, which we expect to be available approximately 120 days after July 31, 2024 at blackrock.com/fundreports or upon request by contacting us at (1-800-474-2737).
On July 30, 2024, the Fund’s Board approved a proposal to change the name of the Fund from BlackRock Intermediate Muni Income Bond ETF to iShares Intermediate Muni Income Active ETF. This change is expected to become effective on or about October 10, 2024.
Additional information
If you wish to view additional information about the Fund, including but not limited to financial statements, the Fund’s prospectus, and proxy voting policies and procedures, please visit blackrock.com/fundreports. For proxy voting records, visit blackrock.com/proxyrecords.
Householding
The Fund will mail only one copy of shareholder documents, including prospectuses, annual and semi-annual reports and proxy statements, to shareholders with multiple accounts at the same address. This practice is commonly called “householding” and is intended to reduce expenses and eliminate duplicate mailings of shareholder documents. Mailings of your shareholder documents may be householded indefinitely unless you instruct us otherwise. If you do not want the mailing of these documents to be combined with those for other members of your household, please call the Fund at (1-800-474-2737).
The Fund is not sponsored, endorsed, issued, sold, or promoted by Bloomberg Index Services Limited, nor does this company make any representation regarding the advisability of investing in the Fund. BlackRock is not affiliated with the company listed above.
©2024 BlackRock, Inc. or its affiliates. All rights reserved. BLACKROCK is a registered trademark of BlackRock, Inc. or its affiliates. All other trademarks are those of their respective owners.
BlackRock Intermediate Muni Income Bond ETF
Annual Shareholder Report — July 31, 2024
INMU-07/24-AR
BlackRock Short-Term California Muni Bond ETF
CALY | NASDAQ
Annual Shareholder Report — July 31, 2024
This annual shareholder report contains important information about BlackRock Short-Term California Muni Bond ETF (the “Fund”) for the period of August 1, 2023 to July 31, 2024. You can find additional information about the Fund at blackrock.com/fundreports. You can also request this information by contacting us at (1‑800‑474‑2737).
This report describes changes to the Fund that occurred during the reporting period.
What were the Fund costs for the last year?
(based on a hypothetical $10,000 investment)
| Fund name | Costs of a $10,000
investment | Costs paid as a percentage of a
$10,000 investment |
| BlackRock Short-Term California Muni Bond ETF | $21 | 0.21% |
How did the Fund perform last year?
The municipal bond market gained ground in the reporting period, with income playing the largest role in total returns.
Declining inflation fueled expectations that the U.S. Federal Reserve was set to begin cutting interest rates in 2024, benefiting the broader fixed-income market.
Municipal bonds were well supported by positive economic growth, strong issuer fundamentals, and favorable supply-and-demand trends.
What contributed to performance?
The Fund maintained a longer duration (interest rate sensitivity) than its benchmark while also focusing on variable rate demand notes (VRDNs) and tender option bond floaters (TOBs) as core holdings which offered both attractive yields and price stability. Given the inverted yield curve, this approach contributed to performance. (An inverted yield curve occurs when yields on longer-term debt are below those on shorter-term issues). The Fund was underweight in AAA and AA rated bonds and overweight in those rated A, which further contributed to the Fund’s performance. At the sector level, overweights in tax-backed local, corporate-backed, and transportation issues were additive.
What detracted from performance?
The Fund was hurt by being underweight in pre-refunded/escrow bonds, as well as underweight in the tax-backed states and utilities sectors.
The views expressed reflect the opinions of BlackRock as of the date of this report and are subject to change based on changes in market, economic or other conditions. These views are not intended to be a forecast of future events and are no guarantee of future results.
Fund performance
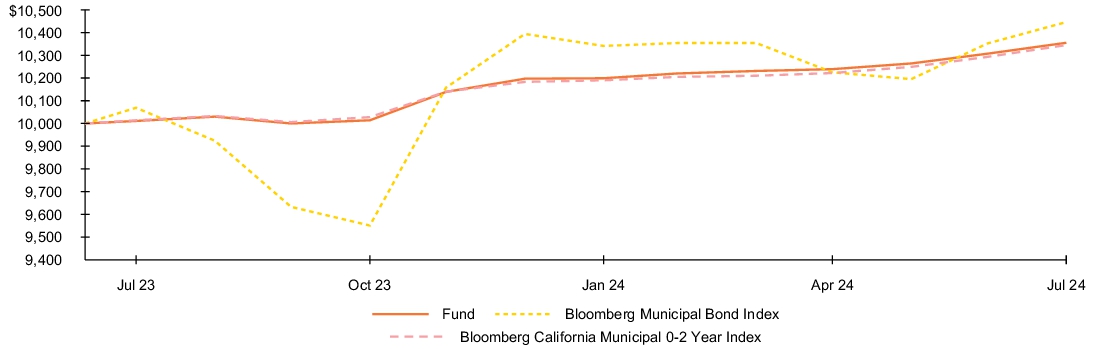
Cumulative performance: July 11, 2023 through July 31, 2024
Initial investment of $10,000
See “Average annual total returns” for additional information on fund performance.
| Average annual total returns | | | | |
| 1 Year | | Since Fund
Inception | |
| Fund NAV | 3.43 | % | 3.35 | % |
| Fund Market | 3.61 | | 3.51 | |
| Bloomberg Municipal Bond Index | 3.74 | | 4.23 | |
| Bloomberg California Municipal 0-2 Year Index | 3.31 | | 3.28 | |
| Key Fund statistics | |
| Net Assets | $32,667,565% |
| Number of Portfolio Holdings | $78% |
| Net Investment Advisory Fees | $43,061% |
| Portfolio Turnover Rate | $175% |
The Fund has added the Bloomberg Municipal Bond Index in response to new regulatory requirements.
The inception date of the Fund was July 11, 2023. The first day of secondary market trading was July 13, 2023.
Past performance is not an indication of future results. Performance results do not reflect the deduction of taxes that a shareholder would pay on fund distributions or on the redemption or sale of fund shares. Visit blackrock.com for more recent performance information.
What did the Fund invest in?
(as of July 31, 2024)
Credit quality allocation
| Credit Rating* | Percent of
Total Investments(a) | |
| AAA/Aaa | 6.2 | % |
| AA/Aa | 65.7 | % |
| A | 23.2 | % |
| BBB/Baa | 3.0 | % |
| N/R | 1.9 | % |
| Security | Percent of
Total Investments(a) | |
| City of Modesto California Water Revenue COP, 3.20%, 08/07/24 | 3.9 | % |
| City of Los Angeles California Revenue Notes, 5.00%, 06/26/25 | 2.4 | % |
| California Community Choice Financing Authority RB, 5.00%, 10/01/28 | 2.4 | % |
| California State Public Works Board RB, Series A, 5.00%, 09/01/27 | 2.4 | % |
| Long Beach Unified School District GO, 3.64%, 08/07/24 | 2.4 | % |
(a) | Excludes money market funds. |
* | For purposes of this report, credit quality ratings shown above reflect the highest rating assigned by either S&P Global Ratings or Moody’s Investors Service, Inc. if ratings differ. These rating agencies are independent, nationally recognized statistical rating organizations and are widely used. Investment grade ratings are credit ratings of BBB/Baa or higher. Below investment grade ratings are credit ratings of BB/Ba or lower. Investments designated N/R are not rated by either rating agency. Unrated investments do not necessarily indicate low credit quality. Credit quality ratings are subject to change. |
Material Fund changes
This is a summary of certain changes to the Fund since July 31, 2023. For more complete information, you may review the Fund’s next prospectus, which we expect to be available approximately 120 days after July 31, 2024 at blackrock.com/fundreports or upon request by contacting us at (1-800-474-2737).
On July 30, 2024, the Fund’s Board approved a proposal to change the name of the Fund from BlackRock Short-Term California Muni Bond ETF to iShares Short-Term California Muni Active ETF . The Fund's ticker will also be changed from CALY to CALI. These changes are expected to become effective on or about October 10, 2024.
Additional information
If you wish to view additional information about the Fund, including but not limited to financial statements, the Fund’s prospectus, and proxy voting policies and procedures, please visit blackrock.com/fundreports. For proxy voting records, visit blackrock.com/proxyrecords.
Householding
The Fund will mail only one copy of shareholder documents, including prospectuses, annual and semi-annual reports and proxy statements, to shareholders with multiple accounts at the same address. This practice is commonly called “householding” and is intended to reduce expenses and eliminate duplicate mailings of shareholder documents. Mailings of your shareholder documents may be householded indefinitely unless you instruct us otherwise. If you do not want the mailing of these documents to be combined with those for other members of your household, please call the Fund at (1-800-474-2737).
The Fund is not sponsored, endorsed, issued, sold, or promoted by Bloomberg Index Services Limited, nor does this company make any representation regarding the advisability of investing in the Fund. BlackRock is not affiliated with the company listed above.
©2024 BlackRock, Inc. or its affiliates. All rights reserved. BLACKROCK is a registered trademark of BlackRock, Inc. or its affiliates. All other trademarks are those of their respective owners.
BlackRock Short-Term California Muni Bond ETF
Annual Shareholder Report — July 31, 2024
CALY-07/24-AR
BlackRock Total Return ETF
BRTR | NASDAQ
Annual Shareholder Report — July 31, 2024
This annual shareholder report contains important information about BlackRock Total Return ETF (the “Fund”) for the period of December 12, 2023 to July 31, 2024. You can find additional information about the Fund at blackrock.com/fundreports. You can also request this information by contacting us at (1‑800‑474‑2737).
This report describes changes to the Fund that occurred during the reporting period.
What were the Fund costs for the period?
(based on a hypothetical $10,000 investment)
| Fund name | Costs of a $10,000
investment | Costs paid as a percentage of a
$10,000 investment |
| BlackRock Total Return ETF | $24(a) | 0.37%(b) |
(a) | The Fund commenced operations during the reporting period. Expenses for a full reporting period would be higher than the amount shown. |
(b) | Annualized. |
How did the Fund perform during the period?
The U.S. Federal Reserve (“Fed”) held the federal funds rate steady throughout the 12-month period at a target range of 5.25% to 5.50%, citing the improving inflation outlook.
Short-term interest rates generally finished the period lower as the market anticipated that the Fed would soon begin to lower its benchmark overnight lending rate, while longer-term rates ended the period moderately higher.
Within the benchmark, credit-sensitive sectors outperformed as risk sentiment was bolstered by the anticipation of a soft landing for the economy.
What contributed to performance?
Over the period, economic growth generally surprised to the upside and spread sectors across fixed income continued to perform well despite elevated interest rate volatility. Given those dynamics, the most notable contributions to performance came from within the Fund’s allocation to securitized assets where holdings favored select top-of-the-capital structure segments within commercial mortgage-backed securities, higher-quality collateralized loan obligations with structural protections, and shorter-maturity senior issues within asset-backed securities, while limiting exposure to non-agency residential mortgage-backed securities. Positioning with respect to U.S. interest rates and credit selection within investment grade corporate bonds also contributed to performance.
What detracted from performance?
An overweight to emerging market debt detracted from performance as local rate holdings, mainly in select Latin American countries, sold-off in April as markets priced in the possibility of higher-for-longer U.S. interest rates.
The views expressed reflect the opinions of BlackRock as of the date of this report and are subject to change based on changes in market, economic or other conditions. These views are not intended to be a forecast of future events and are no guarantee of future results.
Fund performance
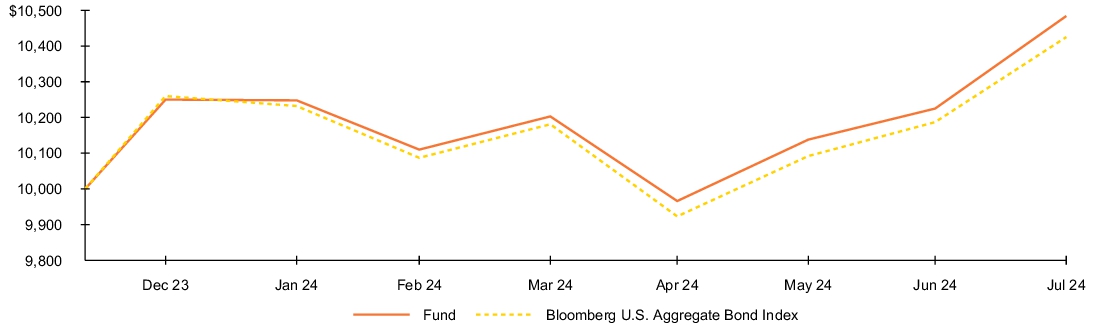
Cumulative performance: December 12, 2023 through July 31, 2024
Initial investment of $10,000
See “Average annual total returns” for additional information on fund performance.
Average annual total returns
As of the date of this report, the Fund does not have a full fiscal year of performance information to report.
| Key Fund statistics | |
| Net Assets | $91,909,615% |
| Number of Portfolio Holdings | $1,000% |
| Net Investment Advisory Fees | $193,222% |
| Portfolio Turnover Rate | $379% |
The inception date of the Fund was December 12, 2023. The first day of secondary market trading was December 14, 2023.
Past performance is not an indication of future results. Performance results do not reflect the deduction of taxes that a shareholder would pay on fund distributions or on the redemption or sale of fund shares. Visit blackrock.com for more recent performance information.
What did the Fund invest in?
(as of July 31, 2024)
Credit quality allocation
| Credit Rating* | Percent of
Total Investments(a) | |
| AAA/Aaa(b) | 62.0 | % |
| AA/Aa | 3.8 | % |
| A | 8.0 | % |
| BBB/Baa | 14.4 | % |
| BB/Ba | 1.9 | % |
| B | 0.7 | % |
| CCC/Caa | 0.2 | % |
| C | 1.8 | % |
| D | 0.1 | % |
| N/R(c) | 7.1 | % |
| Maturity | Percent of
Total Investments (a) | |
| 0-1 Year | 2.4 | % |
| 1-5 Years | 20.9 | % |
| 5-10 Years | 20.7 | % |
| 10-15 Years | 12.0 | % |
| 15-20 Years | 10.0 | % |
| More than 20 Years | 34.0 | % |
(a) | Excludes money market funds, short investments and options, if any. |
(b) | Includes U.S. Government Sponsored Agency Securities which are deemed AAA/Aaa by the investment adviser. |
(c) | The investment adviser evaluates the credit quality of unrated investments based upon certain factors including, but not limited to, credit ratings for similar investments and financial analysis of sectors and individual investments. Using this approach, the investment adviser has deemed certain of these unrated securities as investment grade quality. As of July 31, 2024, the market value of unrated securities deemed by the investment adviser to be investment grade represents less than 1.0% of total investments. |
* | For purposes of this report, credit quality ratings shown above reflect the highest rating assigned by either S&P Global Ratings or Moody’s Investors Service, Inc. if ratings differ. These rating agencies are independent, nationally recognized statistical rating organizations and are widely used. Investment grade ratings are credit ratings of BBB/Baa or higher. Below investment grade ratings are credit ratings of BB/Ba or lower. Investments designated N/R are not rated by either rating agency. Unrated investments do not necessarily indicate low credit quality. Credit quality ratings are subject to change. |
Material Fund changes
This is a summary of certain changes to the Fund since December 12, 2023. For more complete information, you may review the Fund’s next prospectus, which we expect to be available approximately 120 days after July 31, 2024 at blackrock.com/fundreports or upon request by contacting us at (1-800-474-2737).
On July 30, 2024, the Fund’s Board approved a proposal to change the name of the Fund from BlackRock Total Return ETF to iShares Total Return Active ETF. This change is expected to become effective on or about October 10, 2024.
Additional information
If you wish to view additional information about the Fund, including but not limited to financial statements, the Fund’s prospectus, and proxy voting policies and procedures, please visit blackrock.com/fundreports. For proxy voting records, visit blackrock.com/proxyrecords.
Householding
The Fund will mail only one copy of shareholder documents, including prospectuses, annual and semi-annual reports and proxy statements, to shareholders with multiple accounts at the same address. This practice is commonly called “householding” and is intended to reduce expenses and eliminate duplicate mailings of shareholder documents. Mailings of your shareholder documents may be householded indefinitely unless you instruct us otherwise. If you do not want the mailing of these documents to be combined with those for other members of your household, please call the Fund at (1-800-474-2737).
The Fund is not sponsored, endorsed, issued, sold, or promoted by Bloomberg Index Services Limited and its affiliates, nor does this company make any representation regarding the advisability of investing in the Fund. BlackRock is not affiliated with the company listed above.
©2024 BlackRock, Inc. or its affiliates. All rights reserved. BLACKROCK is a registered trademark of BlackRock, Inc. or its affiliates. All other trademarks are those of their respective owners.
BlackRock Total Return ETF
Annual Shareholder Report — July 31, 2024
BRTR-07/24-AR
(b) Not Applicable
| Item 2 – | Code of Ethics – The registrant (or the “Fund”) has adopted a code of ethics, as of the end of the period covered by this report, applicable to the registrant’s principal executive officer, principal financial officer, principal accounting officer or controller, or persons performing similar functions. During the period covered by this report, the code of ethics was amended to update certain information and to make other non-material changes. During the period covered by this report, there have been no waivers granted under the code of ethics. The registrant undertakes to provide a copy of the code of ethics to any person upon request, without charge, who calls 1-800-441-7762. |
| Item 3 – | Audit Committee Financial Expert – The registrant’s board of trustees (the “board of trustees”), has determined that (i) the registrant has the following audit committee financial experts serving on its audit committee and (ii) each audit committee financial expert is independent: |
Lorenzo A. Flores
Catherine A. Lynch
Arthur P. Steinmetz
Under applicable securities laws, a person determined to be an audit committee financial expert will not be deemed an “expert” for any purpose, including without limitation for the purposes of Section 11 of the Securities Act of 1933, as a result of being designated or identified as an audit committee financial expert. The designation or identification of a person as an audit committee financial expert does not impose on such person any duties, obligations, or liabilities greater than the duties, obligations, and liabilities imposed on such person as a member of the audit committee and board of trustees in the absence of such designation or identification. The designation or identification of a person as an audit committee financial expert does not affect the duties, obligations, or liability of any other member of the audit committee or board of trustees.
| Item 4 – | Principal Accountant Fees and Services |
The following table presents fees billed by Pricewaterhouse Coopers LLP (“PwC”) in each of the last two fiscal years for the services rendered to the Fund:
| | | | | | | | | | | | | | | | | | | | | | | | | | | | | | | | |
| | | (a) Audit Fees | | | (b) Audit-Related Fees1 | | | (c) Tax Fees2 | | | (d) All Other Fees | |
| Entity Name | | Current
Fiscal Year End | | | Previous Fiscal Year End | | | Current Fiscal Year End | | | Previous Fiscal Year End | | | Current Fiscal Year End | | | Previous Fiscal Year End | | | Current Fiscal Year End | | | Previous Fiscal Year End | |
BlackRock AAA CLO ETF | | | $13,989 | | | | $12,423 | | | | $0 | | | | $0 | | | | $9,700 | | | | $7,760 | | | | $0 | | | | $0 | |
BlackRock Flexible Income ETF | | | $16,564 | | | | $13,850 | | | | $0 | | | | $0 | | | | $9,700 | | | | $9,700 | | | | $0 | | | | $0 | |
BlackRock Floating Rate Loan ETF | | | $16,564 | | | | $14,746 | | | | $0 | | | | $0 | | | | $9,700 | | | | $9,700 | | | | $0 | | | | $0 | |
BlackRock High Yield Muni Income Bond ETF | | | $13,989 | | | | $13,736 | | | | $0 | | | | $0 | | | | $9,700 | | | | $9,700 | | | | $0 | | | | $0 | |
BlackRock Intermediate Muni Income Bond ETF | | | $13,989 | | | | $13,736 | | | | $0 | | | | $0 | | | | $9,700 | | | | $9,700 | | | | $0 | | | | $0 | |
BlackRock Short-Term California Muni Bond ETF | | | $13,989 | | | | $13,600 | | | | $0 | | | | $0 | | | | $9,700 | | | | $9,700 | | | | $0 | | | | $0 | |
BlackRock Total Return ETF | | | $12,500 | | | | $0 | | | | $0 | | | | $0 | | | | $9,700 | | | | $4,850 | | | | $0 | | | | $0 | |
| | | | | | | | | | | | | | | | | | | | | | | | | | | | | | | | |
The following table presents fees billed by PwC that were required to be approved by the registrant’s audit committee (the “Committee”) for services that relate directly to the operations or financial reporting of the Fund and that are rendered on behalf of BlackRock Advisors, LLC (the “Investment Adviser” or “BlackRock”) and entities controlling, controlled by, or under common control with BlackRock (not including any sub-adviser whose role is primarily portfolio management and is subcontracted with or overseen by another investment adviser) that provide ongoing services to the Fund (“Affiliated Service Providers”):
| | | | | | | | |
| | | | Current Fiscal Year End | | | | Previous Fiscal Year End | |
(b) Audit-Related Fees1 | | | $0 | | | | $0 | |
(c) Tax Fees2 | | | $0 | | | | $0 | |
(d) All Other Fees3 | | | $0 | | | | $0 | |
1 The nature of the services includes assurance and related services reasonably related to the performance of the audit or review of financial statements not included in Audit Fees, including accounting consultations, agreed-upon procedure reports, attestation reports, comfort letters, out-of-pocket expenses and internal control reviews not required by regulators.
2 The nature of the services includes tax compliance and/or tax preparation, including services relating to the filing or amendment of federal, state or local income tax returns, regulated investment company qualification reviews, taxable income and tax distribution calculations.
(e)(1) Audit Committee Pre-Approval Policies and Procedures:
The Committee has adopted policies and procedures with regard to the pre-approval of services. Audit, audit-related and tax compliance services provided to the registrant on an annual basis require specific pre-approval by the Committee. The Committee also must approve other non-audit services provided to the registrant and those non-audit services provided to the Investment Adviser and Affiliated Service Providers that relate directly to the operations and the financial reporting of the registrant. Certain of these non-audit services that the Committee believes are (a) consistent with the SEC’s auditor independence rules and (b) routine and recurring services that will not impair the independence of the independent accountants may be approved by the Committee without consideration on a specific case-by-case basis (“general pre-approval”). The term of any general pre-approval is 12 months from the date of the pre-approval, unless the Committee provides for a different period. Tax or other non-audit services provided to the registrant which have a direct impact on the operations or financial reporting of the registrant will only be deemed pre-approved provided that any individual project does not exceed $10,000 attributable to the registrant or $50,000 per project. For this purpose, multiple projects will be aggregated to determine if they exceed the previously mentioned cost levels.
Any proposed services exceeding the pre-approved cost levels will require specific pre-approval by the Committee, as will any other services not subject to general pre-approval (e.g., unanticipated but permissible services). The Committee is informed of each service approved subject to general pre-approval at the next regularly scheduled in-person board meeting. At this meeting, an analysis of such services is presented to the Committee for ratification. The Committee may delegate to the Committee Chairman the authority to approve the provision of and fees for any specific engagement of permitted non-audit services, including services exceeding pre-approved cost levels.
(e)(2) None of the services described in each of Items 4(b) through (d) were approved by the Committee pursuant to the de minimis exception in paragraph (c)(7)(i)(C) of Rule 2-01 of Regulation S-X.
(f) Not Applicable
(g) The aggregate non-audit fees, defined as the sum of the fees shown under “Audit-Related Fees,” “Tax Fees” and “All Other Fees,” paid to the accountant for services rendered by the accountant to the registrant, the Investment Adviser and the Affiliated Service Providers were:
| | | | |
| Entity Name | | Current Fiscal Year End | | Previous Fiscal Year End |
BlackRock AAA CLO ETF | | $9,700 | | $7,760 |
BlackRock Flexible Income ETF | | $9,700 | | $9,700 |
BlackRock Floating Rate Loan ETF | | $9,700 | | $9,700 |
BlackRock High Yield Muni Income Bond ETF | | $9,700 | | $9,700 |
BlackRock Intermediate Muni Income Bond ETF | | $9,700 | | $9,700 |
BlackRock Short-Term California Muni Bond ETF | | $9,700 | | $9,700 |
BlackRock Total Return ETF | | $9,700 | | $4,850 |
(h) The Committee has considered and determined that the provision of non-audit services that were rendered to the Investment Adviser and the Affiliated Service Providers that were not pre-approved pursuant to paragraph (c)(7)(ii) of Rule 2-01 of Regulation S-X is compatible with maintaining the principal accountant’s independence.
(i) Not Applicable
(j) Not Applicable
| Item 5 – | Audit Committee of Listed Registrant |
(a) The following individuals are members of the registrant’s separately designated standing audit committee established in accordance with Section 3(a)(58)(A) of the Securities Exchange Act of 1934 (15 U.S.C. 78c(a)(58)(A)):
Lorenzo A. Flores
J. Phillip Holloman
Catherine A. Lynch
Arthur P. Steinmetz
(b) Not Applicable
(a) The registrant’s Schedule of Investments is included as part of the Financial Statements and Financial Highlights for Open-End Management Investment Companies filed under Item 7 of this Form.
(b) Not Applicable due to no such divestments during the semi-annual period covered since the previous Form N-CSR filing.
| Item 7 – | Financial Statements and Financial Highlights for Open-End Management Investment Companies |
(a) The registrant’s Financial Statements are attached herewith.
(b) The registrant’s Financial Highlights are attached herewith.
2024 Annual Financial Statements |
|
• BlackRock AAA CLO ETF | CLOA | NASDAQ |
• BlackRock Flexible Income ETF | BINC | NYSE Arca |
• BlackRock Floating Rate Loan ETF | BRLN | Cboe BZX |
• BlackRock High Yield Muni Income Bond ETF | HYMU | Cboe BZX |
• BlackRock Intermediate Muni Income Bond ETF | INMU | NYSE Arca |
• BlackRock Short-Term California Muni Bond ETF | CALY | NASDAQ |
• BlackRock Total Return ETF | BRTR | NASDAQ |
|
Not FDIC Insured • May Lose Value • No Bank Guarantee |
Schedule of InvestmentsJuly 31, 2024
BlackRock AAA CLO ETF(Percentages shown are based on Net Assets)
| | |
|
1988 CLO 5 Ltd., 6.87%, 07/15/37, (3-mo. SOFR + 1.540%)(a)(b) | | |
37 Capital CLO 1 Ltd., 6.76%, 10/15/34, (3-mo. SOFR + 1.462%)(a)(b) | | |
37 Capital CLO II, 7.30%, 07/15/34, (3-mo. SOFR + 2.000%)(a)(b) | | |
522 Funding CLO Ltd., 6.63%, 04/15/35, (3-mo. SOFR + 1.330%)(a)(b) | | |
720 East CLO IV Ltd., 6.89%, 04/15/37, (3-mo. SOFR + 1.600%)(a)(b) | | |
720 East CLO Ltd., 7.40%, 04/15/36, (3-mo. SOFR + 2.100%)(a)(b) | | |
AB BSL CLO 3 Ltd., 6.73%, 10/20/34, (3-mo. SOFR + 1.452%)(a)(b) | | |
| | |
7.78%, 04/20/36, (3-mo. SOFR + 2.500%)(a)(b) | | |
7.28%, 04/20/36, (3-mo. SOFR + 2.000%)(a)(b) | | |
AGL CLO 12 Ltd., 6.70%, 07/20/34, (3-mo. SOFR + 1.422%)(a)(b) | | |
AGL CLO 29 Ltd., 6.85%, 04/21/37, (3-mo. SOFR + 1.570%)(a)(b) | | |
AGL CLO 3 Ltd., 6.86%, 01/15/33, (3-mo. SOFR + 1.562%)(a)(b) | | |
AGL CLO 5 Ltd. Series 2020 5A, Class A1R, 6.70%, 07/20/34, (3-mo. SOFR + 1.422%)(a)(b) | | |
AGL CLO 7 Ltd., 6.76%, 07/15/34, (3-mo. SOFR + 1.461%)(a)(b) | | |
AGL Core CLO 15 Ltd., 6.69%, 01/20/35, (3-mo. SOFR + 1.412%)(a)(b) | | |
AGL Core CLO 2 Ltd., 6.79%, 07/20/37, (3-mo. SOFR + 1.460%)(a)(b) | | |
Aimco CLO 11 Ltd., 6.68%, 10/17/34, (3-mo. SOFR + 1.392%)(a)(b) | | |
Aimco CLO 14 Ltd., 6.89%, 04/20/34, (3-mo. SOFR + 1.612%)(a)(b) | | |
Aimco CLO 20 Ltd., 7.49%, 10/16/36, (3-mo. SOFR + 2.200%)(a)(b) | | |
Apidos CLO XXXIII Series 2020 33A, Class AR, 6.70%, 10/24/34, (3-mo. SOFR +1.411%)(a)(b) | | |
Apidos CLO XXXIV, 6.69%, 01/20/35, (3-mo. SOFR + 1.412%)(a)(b) | | |
Apidos CLO XXXVII, 6.67%, 10/22/34, (3-mo. SOFR + 1.392%)(a)(b) | | |
Ares Loan Funding IV Ltd., 7.05%, 10/15/36, (3-mo. SOFR + 1.750%)(a)(b) | | |
Ares LV CLO Ltd., 6.69%, 07/15/34, (3-mo. SOFR + 1.392%)(a)(b) | | |
Ares LVI CLO Ltd., 6.71%, 10/25/34, (3-mo. SOFR + 1.422%)(a)(b) | | |
Bain Capital Credit CLO Ltd., 7.08%, 07/24/36, (3-mo. SOFR + 1.800%)(a)(b) | | |
Ballyrock CLO 14 Ltd., 7.00%, 07/20/37, (3-mo. SOFR + 1.700%)(a)(b) | | |
Ballyrock CLO 15 Ltd., 6.62%, 04/15/34, (3-mo. SOFR + 1.322%)(a)(b) | | |
Ballyrock CLO 16 Ltd., 6.67%, 07/20/34, (3-mo. SOFR +1.391%)(a)(b) | | |
Ballyrock CLO 19 Ltd., 6.61%, 04/20/35, (3-mo. SOFR + 1.330%)(a)(b) | | |
| | |
Ballyrock CLO 2 Ltd., 6.72%, 02/20/36, (3-mo. SOFR + 1.400%)(a)(b) | | |
| | |
7.26%, 04/25/36, (3-mo. SOFR + 1.980%)(a)(b) | | |
8.48%, 04/25/36, (3-mo. SOFR + 3.200%)(a)(b) | | |
Ballyrock CLO Ltd., 7.09%, 10/20/31, (3-mo. SOFR + 1.812%)(a)(b) | | |
Battery Park CLO II Ltd., 7.49%, 10/20/35, (3-mo. SOFR + 2.210%)(a)(b) | | |
Beechwood Park CLO Ltd., 6.59%, 01/17/35, (3-mo. SOFR + 1.300%)(a)(b) | | |
Benefit Street Partners CLO Ltd., 6.73%, 07/20/34, (3-mo. SOFR + 1.452%)(a)(b) | | |
Benefit Street Partners CLO XVII Ltd. Series 2019 17A, Class AR, 6.64%, 07/15/32, (3-mo. SOFR + 1.322%)(a)(b) | | |
Benefit Street Partners CLO XXI Ltd. Series 2020 21A, Class A1R, 6.73%, 10/15/34, (3-mo. SOFR +1.431%)(a)(b) | | |
Benefit Street Partners CLO XXII Ltd., 6.63%, 04/20/35, (3-mo. SOFR + 1.350%)(a)(b) | | |
Benefit Street Partners CLO XXIV Ltd., 6.71%, 10/20/34, (3-mo. SOFR + 1.432%)(a)(b) | | |
Benefit Street Partners CLO XXVII Ltd., 7.08%, 07/20/35, (3-mo. SOFR + 1.800%)(a)(b) | | |
Birch Grove CLO 5 Ltd., 7.48%, 04/20/35, (3-mo. SOFR + 2.200%)(a)(b) | | |
Birch Grove CLO 8 Ltd., 6.93%, 04/20/37, (3-mo. SOFR + 1.630%)(a)(b) | | |
| | |
6.93%, 04/15/37, (3-mo. SOFR + 1.620%)(a)(b) | | |
7.33%, 10/18/36, (3-mo. SOFR + 2.050%)(a)(b) | | |
6.90%, 05/15/37, (3-mo. SOFR + 1.570%)(a)(b) | | |
Canyon Capital CLO Ltd., 6.74%, 07/15/34, (3-mo. SOFR + 1.442%)(a)(b) | | |
Canyon CLO Ltd., 6.73%, 10/15/34, (3-mo. SOFR + 1.431%)(a)(b) | | |
| | |
6.70%, 04/15/34, (3-mo. SOFR + 1.402%)(a)(b) | | |
Series 2021 5A, Class A1, 6.66%, 07/20/34, (3-mo. SOFR + 1.382%)(a)(b) | | |
| | |
6.96%, 04/20/37, (3-mo. SOFR + 1.680%)(a)(b) | | |
7.38%, 04/20/37, (3-mo. SOFR + 2.100%)(a)(b) | | |
CarVal CLO VC Ltd., 6.76%, 10/15/34, (3-mo. SOFR + 1.461%)(a)(b) | | |
Carval CLO VIII-C Ltd., 7.58%, 10/22/35, (3-mo. SOFR + 2.300%)(a)(b) | | |
Cedar Funding VIII CLO Ltd., 6.70%, 10/17/34, (3-mo. SOFR + 1.412%)(a)(b) | | |
Cedar Funding XV CLO Ltd., 6.60%, 04/20/35, (3-mo. SOFR + 1.320%)(a)(b) | | |
CIFC Funding 2019-I Ltd., 7.09%, 04/20/32, (3-mo. SOFR + 1.811%)(a)(b) | | |
CIFC Funding 2020-IV Ltd., 6.88%, 01/15/34, (3-mo. SOFR + 1.581%)(a)(b) | | |
| | |
6.61%, 07/15/33, (3-mo. SOFR + 1.312%)(a)(b) | | |
6.71%, 10/20/34, (3-mo. SOFR + 1.432%)(a)(b) | | |
6.61%, 04/20/34, (3-mo. SOFR + 1.331%)(a)(b) | | |
6.70%, 07/15/34, (3-mo. SOFR + 1.402%)(a)(b) | | |
6.71%, 07/15/36, (3-mo. SOFR + 1.412%)(a)(b) | | |
32024 BlackRock Annual Financial Statements
Schedule of Investments (continued)July 31, 2024
BlackRock AAA CLO ETF(Percentages shown are based on Net Assets)
| | |
Series 2021 6A, Class A, 6.70%, 10/15/34, (3-mo. SOFR + 1.402%)(a)(b) | | |
| | |
6.64%, 04/22/34, (3-mo. SOFR + 1.362%)(a)(b) | | |
Series 2021 3A, Class A, 6.71%, 01/25/35, (3-mo. SOFR +1.421%)(a)(b) | | |
Crown Point CLO 9 Ltd., 6.75%, 07/14/34, (3-mo. SOFR + 1.452%)(a)(b) | | |
Diameter Capital CLO 1 Ltd., 6.80%, 07/15/36, (3-mo. SOFR + 1502%)(a)(b) | | |
Diameter Capital CLO 7 Ltd., 6.81%, 07/20/37, (3-mo. SOFR + 1.480%)(a)(b) | | |
Eaton Vance CLO Ltd., 6.71%, 01/15/35, (3-mo. SOFR + 1.412%)(a)(b) | | |
Elmwood CLO 15 Ltd., 6.62%, 04/22/35, (3-mo. SOFR + 1.340%)(a)(b) | | |
Elmwood CLO 18 Ltd., 8.04%, 07/17/33, (3-mo. SOFR + 2.750%)(a)(b) | | |
Elmwood CLO 19 Ltd., 7.69%, 10/17/36, (3-mo. SOFR + 2.400%)(a)(b) | | |
Elmwood CLO 21 Ltd., 6.93%, 10/20/36, (3-mo. SOFR + 1.65%)(a)(b) | | |
Elmwood CLO 22 Ltd., 7.09%, 04/17/36, (3-mo. SOFR + 1.800%)(a)(b) | | |
Elmwood CLO 23 Ltd., 7.09%, 04/16/36, (3-mo. SOFR + 1.800%)(a)(b) | | |
Elmwood CLO IX Ltd., 6.67%, 07/20/34, (3-mo. SOFR + 1.392%)(a)(b) | | |
Elmwood CLO VIII Ltd., 6.83%, 04/20/37, (3-mo. SOFR + 1.550%)(a)(b) | | |
Flatiron CLO 19 Ltd., 6.67%, 11/16/34, (3-mo. SOFR + 1.342%)(a)(b) | | |
Flatiron CLO 21 Ltd. Series 2021 1A, Class A1, 6.65%, 07/19/34, (3-mo. SOFR +1.371%)(a)(b) | | |
Flatiron CLO 23 LLC, 7.09%, 04/17/36, (3-mo. SOFR + 1.800%)(a)(b) | | |
Fort Washington CLO Ltd., 6.76%, 10/20/34, (3-mo. SOFR + 1.482%)(a)(b) | | |
Generate CLO 15 Ltd., 6.87%, 07/20/37, (3-mo. SOFR + 1.570%)(a)(b) | | |
Generate CLO 6 Ltd., 6.74%, 01/22/35, (3-mo. SOFR + 1.462%)(a)(b) | | |
Generate CLO 9 Ltd., 7.29%, 10/20/34, (3-mo. SOFR + 2.012%)(a)(b) | | |
GoldenTree Loan Management U.S. CLO 1 Ltd., 6.67%, 10/20/34, (3-mo. SOFR + 1.392%)(a)(b) | | |
GoldenTree Loan Management U.S. CLO 16 Ltd., 6.95%, 01/20/34, (3-mo. SOFR + 1.670%)(a)(b) | | |
GoldenTree Loan Management U.S. CLO 8 Ltd., 6.69%, 10/20/34, (3-mo. SOFR + 1.412%)(a)(b) | | |
GoldentTree Loan Management U.S. CLO 1 Ltd., 6.78%, 04/20/37, (3-mo. SOFR + 1.500%)(a)(b) | | |
Golub Capital Partners 48 LP, 6.86%, 04/17/33, (3-mo. SOFR + 1.572%)(a)(b) | | |
Golub Capital Partners CLO 41B-R Ltd., 6.86%, 01/20/34, (3-mo. SOFR +1.581%)(a)(b) | | |
Golub Capital Partners CLO 55B Ltd., 6.74%, 07/20/34, (3-mo. SOFR +1.461%)(a)(b) | | |
Golub Capital Partners CLO 58B Ltd., 6.73%, 01/25/35, (3-mo. SOFR + 1.441%)(a)(b) | | |
HalseyPoint CLO 4 Ltd., 6.76%, 04/20/34, (3-mo. SOFR + 1.482%)(a)(b) | | |
| | |
HalseyPoint CLO 6 Ltd., 7.73%, 10/20/34, (3-mo. SOFR + 2.450%)(a)(b) | | |
Halseypoint CLO 7 Ltd., 7.53%, 07/20/36, (3-mo. SOFR + 2.250%)(a)(b) | | |
Invesco CLO Ltd. Series 2021 3A, Class A, 6.67%, 10/22/34, (3-mo. SOFR + 1.392%)(a)(b) | | |
Kings Park CLO Ltd., 6.67%, 01/21/35, (3-mo. SOFR + 1.392%)(a)(b) | | |
Madison Park Funding LIV Ltd., 8.13%, 10/21/34, (3-mo. SOFR + 2.850%)(a)(b) | | |
Madison Park Funding LIX Ltd., 6.78%, 04/18/37, (3-mo. SOFR + 1.500%)(a)(b) | | |
Madison Park Funding LXI Ltd., 7.01%, 01/20/37, (3-mo. SOFR + 1.730%)(a)(b) | | |
Madison Park Funding LXII Ltd., 7.14%, 07/17/36, (3-mo. SOFR + 1.850%)(a)(b) | | |
Madison Park Funding LXVII Ltd., 6.80%, 04/25/37, (3-mo. SOFR + 1.510%)(a)(b) | | |
Madison Park Funding XLV Ltd., 6.68%, 07/15/34, (3-mo. SOFR + 1.382%)(a)(b) | | |
Madison Park Funding XXII Ltd., 6.82%, 01/15/33, (3-mo. SOFR + 1.522%)(a)(b) | | |
Madison Park Funding XXXIV Ltd., 7.70%, 04/25/32, (3-mo. SOFR + 2.411%)(a)(b) | | |
Neuberger Berman Loan Advisers CLO 33 Ltd. Series 2019 33A, Class AR, 6.63%, 10/16/33, (3-mo. SOFR + 1.342%)(a)(b) | | |
New Mountain CLO 1 Ltd., 6.76%, 10/15/34, (3-mo. SOFR + 1.462%)(a)(b) | | |
New Mountain CLO 3 Ltd., 7.24%, 10/20/34, (3-mo. SOFR + 1.962%)(a)(b) | | |
| | |
6.85%, 04/20/37, (3-mo. SOFR + 1.550%)(a)(b) | | |
6.71%, 07/15/34, (3-mo. SOFR + 1.412%)(a)(b) | | |
7.31%, 01/15/35, (3-mo. SOFR + 2.012%)(a)(b) | | |
7.29%, 10/20/34, (3-mo. SOFR + 2.012%)(a)(b) | | |
6.72%, 07/15/34, (3-mo. SOFR + 1.422%)(a)(b) | | |
| | |
6.63%, 07/20/32, (3-mo. SOFR + 1.352%)(a)(b) | | |
7.84%, 04/17/36, (3-mo. SOFR + 2.550%)(a)(b) | | |
6.81%, 04/18/37, (3-mo. SOFR + 1.530%)(a)(b) | | |
6.77%, 01/17/32, (3-mo. SOFR + 1.482%)(a)(b) | | |
6.92%, 04/20/37, (3-mo. SOFR + 1.630%)(a)(b) | | |
6.70%, 04/26/36, (3-mo. SOFR + 1.420%)(a)(b) | | |
Octagon 66 Ltd., 7.08%, 11/16/36, (3-mo. SOFR + 1.750%)(a)(b) | | |
OHA Credit Funding 17 Ltd., 6.79%, 04/20/37, (3-mo. SOFR + 1.480%)(a)(b) | | |
OHA Credit Funding 2 Ltd., 6.69%, 04/21/34, (3-mo. SOFR + 1.412%)(a)(b) | | |
OHA Credit Funding 3 Ltd. Series 2019 3A, Class AR, 6.68%, 07/02/35, (3-mo. SOFR +1.401%)(a)(b) | | |
OHA Credit Funding 4 Ltd., 6.69%, 10/22/36, (3-mo. SOFR + 1.412%)(a)(b) | | |
OHA Credit Funding 6 Ltd., 6.68%, 07/20/34, (3-mo. SOFR + 1.402%)(a)(b) | | |
OHA Credit Partners XVI, 6.69%, 10/18/34, (3-mo. SOFR + 1.412%)(a)(b) | | |
| | |
6.69%, 01/19/37, (3-mo. SOFR + 1.412%)(a)(b) | | |
7.04%, 07/20/37, (3-mo. SOFR + 1.700%)(a)(b) | | |
Schedule of Investments (continued)July 31, 2024
BlackRock AAA CLO ETF(Percentages shown are based on Net Assets)
| | |
| | |
6.73%, 11/14/34, (3-mo. SOFR + 1.412%)(a)(b) | | |
6.97%, 11/15/36, (3-mo. SOFR + 1.65%)(a)(b) | | |
7.28%, 11/14/34, (3-mo. SOFR + 1.962%)(a)(b) | | |
7.97%, 11/15/36, (3-mo. SOFR + 2.650%)(a)(b) | | |
Series 2015 1A, Class A4, 6.72%, 05/21/34, (3-mo. SOFR +1.391%)(a)(b) | | |
Series 2021 4A, Class A, 6.73%, 10/15/34, (3-mo. SOFR + 1.432%)(a)(b) | | |
Pikes Peak CLO 6, 6.76%, 05/18/34, (3-mo. SOFR +1.431%)(a)(b) | | |
Pikes Peak CLO 8, 7.29%, 07/20/34, (3-mo. SOFR + 2.012%)(a)(b) | | |
Post CLO Ltd., 6.87%, 04/20/37, (3-mo. SOFR + 1.600%)(a)(b) | | |
Rad CLO 18 Ltd., 7.25%, 04/15/36, (3-mo. SOFR + 1.950%)(a)(b) | | |
Rad CLO 22 Ltd., 7.11%, 01/20/37, (3-mo. SOFR +1.830%)(a)(b) | | |
Reese Park CLO Ltd., 6.69%, 10/15/34, (3-mo. SOFR + 1.392%)(a)(b) | | |
Regatta VI Funding Ltd., 7.24%, 04/20/34, (3-mo. SOFR + 1.961%)(a)(b) | | |
Regatta XVIII Funding Ltd. | | |
7.01%, 01/15/34, (3-mo. SOFR + 1.712%)(a)(b) | | |
6.66%, 01/15/34, (3-mo. SOFR + 1.392%)(a)(b) | | |
Regatta XXII Funding Ltd., 6.82%, 07/20/35, (3-mo. SOFR + 1.540%)(a)(b) | | |
Regatta XXIII Funding Ltd., 6.69%, 01/20/35, (3-mo. SOFR + 1.412%)(a)(b) | | |
Regatta XXIV Funding Ltd., 6.69%, 01/20/35, (3-mo. SOFR +1.411%)(a)(b) | | |
Regatta XXVII Funding Ltd., 6.83%, 04/26/37, (3-mo. SOFR + 1.530%)(a)(b) | | |
Regatta XXVIII Funding Ltd., 6.83%, 04/25/37, (3-mo. SOFR + 1.550%)(a)(b) | | |
Rockland Park CLO Ltd. Series 2021 1A, Class A, 6.66%, 04/20/34, (3-mo. SOFR + 1.382%)(a)(b) | | |
| | |
6.67%, 07/15/37, (3-mo. SOFR + 1.50%)(a)(b) | | |
7.02%, 07/15/37, (3-mo. SOFR + 1.700%)(a)(b) | | |
RRX 4 Ltd. Series 2021 4A, Class A1, 6.76%, 07/15/34, (3-mo. SOFR +1.461%)(a)(b) | | |
RRX 7 Ltd., 6.66%, 07/15/35, (3-mo. SOFR + 1.360%)(a)(b) | | |
Sixth Street CLO XIX Ltd., 7.24%, 07/20/34, (3-mo. SOFR + 1.961%)(a)(b) | | |
Sixth Street CLO XVII Ltd., 6.78%, 01/20/34, (3-mo. SOFR + 1502%)(a)(b) | | |
Sixth Street CLO XX Ltd. Series 2021 20A, Class A1, 6.70%, 10/20/34, (3-mo. SOFR + 1.422%)(a)(b) | | |
Sycamore Tree CLO Ltd., 6.93%, 04/20/37, (3-mo. SOFR + 1.650%)(a)(b) | | |
Symphony CLO 35 Ltd., 6.98%, 10/24/36, (3-mo. SOFR + 1.700%)(a)(b) | | |
Symphony CLO XXVIII Ltd., 6.68%, 10/23/34, (3-mo. SOFR + 1.402%)(a)(b) | | |
| | |
TCW CLO Ltd., 6.70%, 04/20/34, (3-mo. SOFR + 1.422%)(a)(b) | | |
Texas Debt Capital CLO Ltd., 8.28%, 04/20/36, (3-mo. SOFR + 3.000%)(a)(b) | | |
Trestles CLO IV Ltd., 6.71%, 07/21/34, (3-mo. SOFR + 1.432%)(a)(b) | | |
Trinitas CLO XXIII Ltd., 7.08%, 10/20/36, (3-mo. SOFR + 1.800%)(a)(b) | | |
Trinitas CLO XXV Ltd., 7.13%, 01/23/37, (3-mo. SOFR + 1.850%)(a)(b) | | |
Trinitas CLO XXVI Ltd., 6.97%, 01/20/35, (3-mo. SOFR + 1.690%)(a)(b) | | |
Valley Stream Park CLO Ltd., 6.91%, 10/20/34, (3-mo. SOFR + 1.630%)(a)(b) | | |
Voya CLO Ltd., 6.70%, 07/16/34, (3-mo. SOFR + 1.412%)(a)(b) | | |
Warwick Capital CLO 1 Ltd., 8.08%, 10/20/36, (3-mo. SOFR + 2.800%)(a)(b) | | |
Wellington Management CLO 1 Ltd., 7.08%, 10/20/36, (3-mo. SOFR + 1.800%)(a)(b) | | |
Wellman Park CLO Ltd., 7.16%, 07/15/34, (3-mo. SOFR +1.861%)(a)(b) | | |
| | |
6.66%, 07/24/36, (3-mo. SOFR + 1.320%)(a)(b) | | |
7.09%, 07/24/36, (3-mo. SOFR + 1.750%)(a)(b) | | |
Whitebox CLO III Ltd., 6.78%, 10/15/34, (3-mo. SOFR + 1.482%)(a)(b) | | |
Whitebox CLO IV Ltd., 7.88%, 04/20/36, (3-mo. SOFR + 2.600%)(a)(b) | | |
Total Long-Term Investments — 98.0%
(Cost: $390,926,715) | |
| | |
|
Money Market Funds — 2.6% |
BlackRock Cash Funds: Treasury, SL Agency Shares, 5.29%(c)(d) | | |
Total Short-Term Securities — 2.6%
(Cost: $10,430,000) | |
Total Investments — 100.6%
(Cost: $401,356,715) | |
Liabilities in Excess of Other Assets — (0.6)% | |
| |
| Security exempt from registration pursuant to Rule 144A under the Securities Act of 1933, as amended. These securities may be resold in transactions exempt from registration to qualified institutional investors. |
| Variable rate security. Interest rate resets periodically. The rate shown is the effective interest rate as of period end. Security description also includes the reference rate and spread if published and available. |
| |
| Annualized 7-day yield as of period end. |
52024 BlackRock Annual Financial Statements
Schedule of Investments (continued)July 31, 2024
Affiliates
Investments in issuers considered to be affiliate(s) of the Fund during the year ended July 31, 2024 for purposes of Section 2(a)(3) of the Investment Company Act of 1940, as amended, were as follows:
| | | | | Change in
Unrealized
Appreciation
(Depreciation) | | | | Capital
Gain
Distributions
from
Underlying
Funds |
BlackRock Cash Funds: Treasury, SL Agency Shares | | | | | | | | | |
| Represents net amount purchased (sold). |
Fair Value Hierarchy as of Period End
Various inputs are used in determining the fair value of financial instruments. For a description of the input levels and information about the Fund’s policy regarding valuation of financial instruments, refer to the Notes to Financial Statements.
The following table summarizes the Fund’s financial instruments categorized in the fair value hierarchy. The breakdown of the Fund’s financial instruments into major categories is disclosed in the Schedule of Investments above.
See notes to financial statements.
Schedule of InvestmentsJuly 31, 2024
BlackRock Flexible Income ETF(Percentages shown are based on Net Assets)
| | |
|
| | |
6.63%, 04/15/35, (3-mo. SOFR + 1.330%)(a)(b) | | |
7.59%, 10/20/31, (3-mo. SOFR + 2.312%)(a)(b) | | |
AB Carval Euro CLO II-C DAC, 1.00%, 02/15/37, (3-mo. EURIBOR + 3.750%)(b)(c) | | |
Affirm Asset Securitization Trust, 5.61%, 02/15/29(a) | | |
AGL CLO 12 Ltd., 6.70%, 07/20/34, (3-mo. SOFR + 1.422%)(a)(b) | | |
AGL CLO 19 Ltd., 6.88%, 07/21/35, (3-mo. SOFR + 1.600%)(a)(b) | | |
AGL CLO 28 Ltd., 6.98%, 01/21/37, (3-mo. SOFR + 1.700%)(a)(b) | | |
AGL CLO 5 Ltd., 7.24%, 07/20/34, (3-mo. SOFR + 1.962%)(a)(b) | | |
| | |
6.74%, 07/20/34, (3-mo. SOFR + 1.462%)(a)(b) | | |
7.24%, 07/20/34, (3-mo. SOFR + 1.961%)(a)(b) | | |
AGL CLO 9 Ltd., 7.28%, 04/20/37, (3-mo. SOFR + 2.000%)(a)(b) | | |
| | |
7.15%, 10/17/34, (3-mo. SOFR + 1.861%)(a)(b) | | |
7.29%, 04/16/37, (3-mo. SOFR + 2.000%)(a)(b) | | |
Aimco CLO 11 Ltd., 7.15%, 10/17/34, (3-mo. SOFR + 1.861%)(a)(b) | | |
Aimco CLO 12 Ltd., 6.46%, 01/17/32, (3-mo. SOFR + 1.170%)(a)(b) | | |
AMMC CLO 15 Ltd., 6.68%, 01/15/32, (3-mo. SOFR + 1.382%)(a)(b) | | |
| | |
6.53%, 04/30/31, (3-mo. SOFR + 1.272%)(a)(b) | | |
7.12%, 04/30/31, (3-mo. SOFR + 1.861%)(a)(b) | | |
Anchorage Capital CLO 6 Ltd., 6.76%, 04/22/34, (3-mo. SOFR + 1.440%)(a)(b) | | |
Apidos CLO XL Ltd., 7.10%, 07/15/35, (3-mo. SOFR + 1.800%)(a)(b) | | |
Apidos CLO XLIII Ltd., 13.03%, 04/25/35(a) | | |
Apidos CLO XV, 6.55%, 04/20/31, (3-mo. SOFR + 1.272%)(a)(b) | | |
Apidos CLO XXIV, 6.89%, 10/20/30, (3-mo. SOFR + 1.612%)(a)(b) | | |
Apidos CLO XXV, 6.43%, 10/20/31, (3-mo. SOFR + 1.150%)(a)(b) | | |
Apidos CLO XXVI, 7.04%, 07/18/29, (3-mo. SOFR + 1.762%)(a)(b) | | |
Apidos CLO XXX, 6.68%, 10/18/31, (3-mo. SOFR + 1.402%)(a)(b) | | |
| | |
6.38%, 01/20/33, (3-mo. SOFR + 1.100%)(a)(b) | | |
6.78%, 01/20/33, (3-mo. SOFR + 1.500%)(a)(b) | | |
| | |
Apidos CLO XXXIII Series 2020 33A, Class AR, 6.70%, 10/24/34, (3-mo. SOFR +1.411%)(a)(b) | | |
Apidos CLO XXXV, 6.59%, 04/20/34, (3-mo. SOFR + 1.312%)(a)(b) | | |
Apidos CLO XXXVII, 6.67%, 10/22/34, (3-mo. SOFR + 1.392%)(a)(b) | | |
Apidos Loan Fund Ltd., 6.59%, 04/25/35, (3-mo. SOFR + 1.270%)(a)(b) | | |
Arbour Clo XI DAC, 7.58%, 05/15/38, (3-mo. EURIBOR + 3.800%)(b)(c) | | |
AREIT LLC , 7.45%, 08/17/41, (1-mo. CME Term SOFR + 2.112%)(a)(b) | | |
AREIT Ltd., 7.02%, 05/17/41, (1-mo. CME Term SOFR + 1.686%)(a)(b) | | |
Ares LXVI CLO Ltd., 7.78%, 07/25/36, (3-mo. SOFR + 2.500%)(a)(b) | | |
Ares XL CLO Ltd., 7.36%, 01/15/29, (3-mo. SOFR + 2.062%)(a)(b) | | |
ARES XLVIII CLO Ltd., 7.12%, 07/20/30, (3-mo. SOFR + 1.841%)(a)(b) | | |
| | |
| | |
| | |
| | |
| | |
| | |
| | |
| | |
| | |
| | |
Arini European CLO II DAC, 8.06%, 04/15/38, (3-mo. EURIBOR + 4.200%)(b)(c) | | |
| | |
6.20%, 09/16/31, (1-day SONIA + 1.000%)(b)(c) | | |
6.55%, 09/16/31, (1-day SONIA + 1.350%)(b)(c) | | |
Assurant CLO II Ltd. Series 2018-2A, Class A, 6.58%, 04/20/31, (3-mo. SOFR + 1.302%)(a)(b) | | |
Atrium XIII, 6.43%, 11/21/30, (3-mo. SOFR + 1.150%)(a)(b) | | |
Atrium XIV LLC, 7.25%, 08/23/30, (3-mo. SOFR + 1.962%)(a)(b) | | |
Atrium XV, 6.73%, 07/16/36, (3-mo. SOFR + 2.832%)(a)(b) | | |
Aurium CLO VIII DAC, 6.70%, 06/23/34, (3-mo. EURIBOR + 3.000%)(b)(c) | | |
Auto ABS Italian Stella Loans SRL | | |
4.84%, 12/29/36, (1-mo. EURIBOR + 1.200%)(b)(c) | | |
4.37%, 12/29/36, (1-mo. EURIBOR + 0.730%)(b)(c) | | |
5.34%, 12/29/36, (1-mo. EURIBOR + 1.700%)(b)(c) | | |
5.94%, 12/29/36, (1-mo. EURIBOR + 2.300%)(b)(c) | | |
Auto1 Car Funding SARL, 4.30%, 12/15/33(c) | | |
Bain Capital Credit CLO, 6.36%, 07/19/31, (3-mo. SOFR + 1.080%)(a)(b) | | |
72024 BlackRock Annual Financial Statements
Schedule of Investments (continued)July 31, 2024
BlackRock Flexible Income ETF(Percentages shown are based on Net Assets)
| | |
Bain Capital Credit CLO Ltd., 6.62%, 07/19/31, (3-mo. SOFR + 1.342%)(a)(b) | | |
Ballyrock CLO 1 Ltd., 6.54%, 04/20/31, (3-mo. SOFR + 1.262%)(a)(b) | | |
Ballyrock CLO 14 Ltd., 7.00%, 07/20/37, (3-mo. SOFR + 1.700%)(a)(b) | | |
Ballyrock CLO 15 Ltd., 6.62%, 04/15/34, (3-mo. SOFR + 1.322%)(a)(b) | | |
Ballyrock CLO 16 Ltd., 6.67%, 07/20/34, (3-mo. SOFR +1.391%)(a)(b) | | |
Ballyrock CLO 18 Ltd., 6.71%, 01/15/35, (3-mo. SOFR + 1.412%)(a)(b) | | |
Ballyrock CLO 19 Ltd., 6.61%, 04/20/35, (3-mo. SOFR + 1.330%)(a)(b) | | |
Ballyrock CLO 2 Ltd., 6.72%, 02/20/36, (3-mo. SOFR + 1.400%)(a)(b) | | |
| | |
6.86%, 04/15/37, (3-mo. SOFR + 1.540%)(a)(b) | | |
7.27%, 04/15/37, (3-mo. SOFR + 1.950%)(a)(b) | | |
| | |
6.61%, 04/20/31, (3-mo. SOFR + 1.332%)(a)(b) | | |
8.08%, 10/20/35, (3-mo. SOFR + 2.800%)(a)(b) | | |
7.14%, 04/20/31, (3-mo. SOFR + 1.861%)(a)(b) | | |
6.53%, 01/20/31, (3-mo. SOFR + 1.252%)(a)(b) | | |
7.11%, 04/15/30, (3-mo. SOFR + 1.812%)(a)(b) | | |
6.61%, 01/20/32, (3-mo. SOFR + 1.332%)(a)(b) | | |
6.51%, 04/15/31, (3-mo. SOFR + 1.212%)(a)(b) | | |
Bavarian Sky U.K. 6 PLC, 5.76%, 06/21/32, (1-day SONIA + 0.550%)(b)(c) | | |
| | |
11.29%, 04/20/31, (3-mo. SOFR + 6.012%)(a)(b) | | |
6.99%, 04/20/31, (3-mo. SOFR + 1.712%)(a)(b) | | |
Benefit Street Partners CLO V-B Ltd., 6.86%, 07/20/37, (3-mo. SOFR + 1.530%)(a)(b) | | |
Benefit Street Partners CLO VIII Ltd., 6.99%, 01/20/31, (3-mo. SOFR + 1.712%)(a)(b) | | |
Benefit Street Partners CLO XII Ltd., 6.51%, 10/15/30, (3-mo. SOFR + 1.212%)(a)(b) | | |
Benefit Street Partners CLO XIV Ltd., 6.99%, 04/20/31, (3-mo. SOFR + 1.712%)(a)(b) | | |
Benefit Street Partners CLO XIX Ltd. | | |
6.48%, 01/15/33, (3-mo. SOFR + 1.180%)(a)(b) | | |
6.90%, 01/15/33, (3-mo. SOFR + 1.600%)(a)(b) | | |
Benefit Street Partners CLO XVI Ltd. | | |
6.58%, 01/17/32, (3-mo. SOFR + 1.292%)(a)(b) | | |
7.10%, 01/17/32, (3-mo. SOFR + 1.812%)(a)(b) | | |
| | |
8.55%, 01/17/32, (3-mo. SOFR + 3.262%)(a)(b) | | |
Benefit Street Partners CLO XX Ltd. | | |
6.73%, 07/15/34, (3-mo. SOFR + 1.432%)(a)(b) | | |
7.26%, 07/15/34, (3-mo. SOFR + 1.962%)(a)(b) | | |
Benefit Street Partners CLO XXI Ltd. Series 2020 21A, Class A1R, 6.73%, 10/15/34, (3-mo. SOFR +1.431%)(a)(b) | | |
Benefit Street Partners CLO XXIII Ltd., 6.63%, 04/25/34, (3-mo. SOFR + 1.341%)(a)(b) | | |
Benefit Street Partners CLO XXIV Ltd., 6.71%, 10/20/34, (3-mo. SOFR + 1.432%)(a)(b) | | |
Benefit Street Partners CLO XXV Ltd., 7.26%, 01/15/35, (3-mo. SOFR + 1.962%)(a)(b) | | |
Benefit Street Partners CLO XXXV Ltd., 8.63%, 04/25/37, (3-mo. SOFR + 3.300%)(a)(b) | | |
Betony CLO 2 Ltd., 6.60%, 04/30/31, (3-mo. SOFR + 1.342%)(a)(b) | | |
Blueberry Park CLO Ltd., 1.00%, 10/20/37, (3-mo. SOFR + 5.350%)(a)(b) | | |
| | |
6.72%, 10/22/30, (3-mo. SOFR + 1.442%)(a)(b) | | |
6.54%, 04/20/31, (3-mo. SOFR + 1.262%)(a)(b) | | |
7.28%, 08/15/31, (3-mo. SOFR + 1.962%)(a)(b) | | |
6.47%, 10/25/30, (3-mo. SOFR + 1.190%)(a)(b) | | |
7.13%, 10/25/30, (3-mo. SOFR + 1.850%)(a)(b) | | |
6.52%, 11/15/30, (3-mo. SOFR + 1.200%)(a)(b) | | |
7.02%, 11/15/30, (3-mo. SOFR + 1.700%)(a)(b) | | |
BlueMountain CLO XXII Ltd. | | |
7.06%, 07/15/31, (3-mo. SOFR + 1.761%)(a)(b) | | |
6.64%, 07/15/31, (3-mo. SOFR + 1.342%)(a)(b) | | |
BlueMountain CLO XXIV Ltd., 7.14%, 04/20/34, (3-mo. SOFR + 1.861%)(a)(b) | | |
BlueMountain CLO XXV Ltd., 7.26%, 07/15/36, (3-mo. SOFR + 1.962%)(a)(b) | | |
BlueMountain Fuji U.S. CLO I Ltd., 6.52%, 07/20/29, (3-mo. SOFR + 1.242%)(a)(b) | | |
BlueMountain Fuji U.S. CLO II Ltd., 6.54%, 10/20/30, (3-mo. SOFR + 1.262%)(a)(b) | | |
Brex Commercial Charge Card Master Trust, 6.05%, 07/15/27(a) | | |
| | |
4.41%, 02/24/42, (1-mo. EURIBOR + 0.780%)(b)(c) | | |
4.83%, 02/24/42, (1-mo. EURIBOR + 1.200%)(b)(c) | | |
7.63%, 02/24/42, (1-mo. EURIBOR + 4.000%)(b)(c) | | |
Bristol Park CLO Ltd., 6.55%, 04/15/29, (3-mo. SOFR + 1.252%)(a)(b) | | |
Schedule of Investments (continued)July 31, 2024
BlackRock Flexible Income ETF(Percentages shown are based on Net Assets)
| | |
Bryant Park Funding Ltd., 9.20%, 04/15/36, (3-mo. SOFR + 3.900%)(a)(b) | | |
Cabinteely Park CLO DAC, 7.18%, 08/15/34, (3-mo. EURIBOR + 3.350%)(b)(c) | | |
Canyon Capital CLO Ltd., 7.31%, 04/15/34, (3-mo. SOFR + 2.011%)(a)(b) | | |
Capital One Multi-Asset Execution Trust, 6.11%, 05/15/28, (3-mo. SOFR + 0.812%)(b) | | |
Carbone CLO Ltd., 6.68%, 01/20/31, (3-mo. SOFR + 1.402%)(a)(b) | | |
Carlyle Global Market Strategies CLO Ltd. | | |
6.52%, 07/20/31, (3-mo. SOFR + 1.242%)(a)(b) | | |
6.62%, 04/22/32, (3-mo. SOFR + 1.342%)(a)(b) | | |
6.66%, 10/15/30, (3-mo. SOFR + 1.362%)(a)(b) | | |
6.63%, 05/15/31, (3-mo. SOFR + 1.312%)(a)(b) | | |
6.58%, 07/27/31, (3-mo. SOFR + 1.312%)(a)(b) | | |
6.95%, 04/17/31, (3-mo. SOFR + 1.662%)(a)(b) | | |
6.50%, 07/20/32, (3-mo. SOFR + 1.220%)(a)(b) | | |
Series 2014-1A, Class A1R2, 6.52%, 04/17/31, (3-mo. SOFR + 1.232%)(a)(b) | | |
| | |
7.34%, 01/20/31, (3-mo. SOFR + 2.062%)(a)(b) | | |
6.72%, 07/15/34, (3-mo. SOFR + 1.422%)(a)(b) | | |
6.44%, 07/20/29, (3-mo. SOFR + 1.162%)(a)(b) | | |
6.62%, 04/20/31, (3-mo. SOFR + 1.342%)(a)(b) | | |
8.40%, 10/15/35, (3-mo. SOFR + 3.100%)(a)(b) | | |
6.97%, 07/20/29, (3-mo. SOFR + 1.692%)(a)(b) | | |
6.54%, 04/20/31, (3-mo. SOFR + 1.262%)(a)(b) | | |
6.69%, 01/25/35, (3-mo. SOFR + 1.402%)(a)(b) | | |
7.19%, 04/20/34, (3-mo. SOFR + 1.912%)(a)(b) | | |
6.45%, 10/15/31, (3-mo. SOFR + 1.150%)(a)(b) | | |
Cedar Funding V CLO Ltd., 6.65%, 07/17/31, (3-mo. SOFR + 1.362%)(a)(b) | | |
Cedar Funding VII CLO Ltd., 6.54%, 01/20/31, (3-mo. SOFR + 1.262%)(a)(b) | | |
Cedar Funding VIII CLO Ltd., 7.20%, 10/17/34, (3-mo. SOFR + 1.912%)(a)(b) | | |
Cedar Funding X CLO Ltd., 7.14%, 10/20/32, (3-mo. SOFR + 1.861%)(a)(b) | | |
Cedar Funding XII CLO Ltd., 7.15%, 10/25/34, (3-mo. SOFR + 1.861%)(a)(b) | | |
Cedar Funding XIV CLO Ltd. | | |
7.16%, 07/15/33, (3-mo. SOFR + 1.861%)(a)(b) | | |
| | |
6.66%, 07/15/33, (3-mo. SOFR + 1.361%)(a)(b) | | |
Cedar Funding XV CLO Ltd., 6.60%, 04/20/35, (3-mo. SOFR + 1.320%)(a)(b) | | |
Chase Issuance Trust, 5.08%, 09/15/30 | | |
Chesapeake Funding II LLC | | |
| | |
| | |
CIFC Funding 2017-II Ltd., 7.04%, 04/20/30, (3-mo. SOFR + 1.761%)(a)(b) | | |
CIFC Funding 2020-IV Ltd., 6.88%, 01/15/34, (3-mo. SOFR + 1.581%)(a)(b) | | |
CIFC Funding 2022-VI Ltd., 8.39%, 07/16/35, (3-mo. SOFR + 3.100%)(a)(b) | | |
| | |
7.30%, 07/16/30, (3-mo. SOFR + 2.012%)(a)(b) | | |
6.61%, 07/15/33, (3-mo. SOFR + 1.312%)(a)(b) | | |
7.14%, 04/20/31, (3-mo. SOFR + 1.861%)(a)(b) | | |
6.71%, 10/20/34, (3-mo. SOFR + 1.432%)(a)(b) | | |
6.50%, 10/24/30, (3-mo. SOFR + 1.212%)(a)(b) | | |
6.59%, 04/27/31, (3-mo. SOFR + 1.322%)(a)(b) | | |
6.54%, 10/18/30, (3-mo. SOFR + 1.262%)(a)(b) | | |
7.14%, 07/18/31, (3-mo. SOFR + 1.861%)(a)(b) | | |
6.60%, 04/19/35, (3-mo. SOFR + 1.320%)(a)(b) | | |
8.46%, 07/15/33, (3-mo. SOFR + 3.162%)(a)(b) | | |
6.94%, 01/18/31, (3-mo. SOFR + 1.662%)(a)(b) | | |
6.64%, 07/18/31, (3-mo. SOFR + 1.362%)(a)(b) | | |
6.70%, 07/15/36, (3-mo. SOFR + 1.402%)(a)(b) | | |
6.74%, 07/17/37, (3-mo. SOFR + 1.410%)(a)(b) | | |
8.38%, 07/17/37, (3-mo. SOFR + 3.050%)(a)(b) | | |
7.09%, 07/25/37, (3-mo. SOFR + 1.750%)(a)(b) | | |
1.00%, 07/23/37, (3-mo. SOFR + 1.360%)(a)(b) | | |
1.00%, 07/23/37, (3-mo. SOFR + 2.950%)(a)(b) | | |
Series 2014-2RA, Class A1, 6.60%, 04/24/30, (3-mo. SOFR + 1.312%)(a)(b) | | |
Series 2018-1A, Class A, 6.54%, 04/18/31, (3-mo. SOFR + 1.262%)(a)(b) | | |
Series 2018-2A, Class A1, 6.58%, 04/20/31, (3-mo. SOFR + 1.302%)(a)(b) | | |
Series 2020 3A, Class A1R, 6.67%, 10/20/34, (3-mo. SOFR + 1.392%)(a)(b) | | |
Citibank Credit Card Issuance Trust, 6.21%, 05/14/29, (1-mo. CME Term SOFR + 0.884%)(b) | | |
92024 BlackRock Annual Financial Statements
Schedule of Investments (continued)July 31, 2024
BlackRock Flexible Income ETF(Percentages shown are based on Net Assets)
| | |
Clear Creek CLO Ltd., 6.74%, 10/20/30, (3-mo. SOFR + 1.462%)(a)(b) | | |
Clover CLO LLC, 6.71%, 07/20/34, (3-mo. SOFR + 1.432%)(a)(b) | | |
Clover CLO Ltd. Series 2019 2A, Class AR, 6.65%, 10/25/33, (3-mo. SOFR + 1.362%)(a)(b) | | |
College Ave Student Loans LLC | | |
| | |
6.26%, 06/25/52, (1-mo. CME Term SOFR + 0.914%)(a)(b) | | |
| | |
| | |
College Avenue Student Loans LLC, 6.36%, 07/26/55, (1-mo. CME Term SOFR + 1.014%)(a)(b) | | |
Cumulus Static CLO DAC, 7.53%, 11/15/33, (3-mo. EURIBOR + 3.700%)(b)(c) | | |
CVC Cordatus Loan Fund XXX DAC, 7.87%, 05/15/37, (3-mo. EURIBOR + 4.000%)(b)(c) | | |
CVC Cordatus Opportunity Loan Fund DAC, 7.91%, 08/15/33, (3-mo. EURIBOR + 4.000%)(b)(c) | | |
Dilosk Rmbs No. 9 Dac, 4.47%, 01/25/63, (3-mo. EURIBOR + 0.680%)(b)(c) | | |
Dryden 36 Senior Loan Fund, 7.01%, 04/15/29, (3-mo. SOFR + 1.712%)(a)(b) | | |
Dryden 40 Senior Loan Fund, 6.47%, 08/15/31, (3-mo. SOFR + 1.150%)(a)(b) | | |
Dryden 50 Senior Loan Fund, 6.56%, 07/15/30, (3-mo. SOFR + 1.262%)(a)(b) | | |
Dryden 53 CLO Ltd., 6.68%, 01/15/31, (3-mo. SOFR + 1.382%)(a)(b) | | |
Dryden 55 CLO Ltd., 6.58%, 04/15/31, (3-mo. SOFR + 1.282%)(a)(b) | | |
Dryden 60 CLO Ltd., 6.61%, 07/15/31, (3-mo. SOFR + 1.312%)(a)(b) | | |
Dryden 61 CLO Ltd., 6.54%, 01/17/32, (3-mo. SOFR + 1.252%)(a)(b) | | |
Dryden 68 CLO Ltd., 7.26%, 07/15/35, (3-mo. SOFR + 1.962%)(a)(b) | | |
Dryden 70 CLO Ltd., 6.72%, 01/16/32, (3-mo. SOFR + 1.432%)(a)(b) | | |
Dryden 77 CLO Ltd., 6.71%, 05/20/34, (3-mo. SOFR + 1.382%)(a)(b) | | |
Dryden Senior Loan Fund, 6.54%, 04/15/28, (3-mo. SOFR + 1.242%)(a)(b) | | |
Dryden XXVI Senior Loan Fund Series 2013-26A, Class AR, 6.46%, 04/15/29, (3-mo. SOFR + 1.162%)(a)(b) | | |
Edenbrook Mortgage Funding PLC | | |
7.15%, 03/22/57, (1-day SONIA + 1.950%)(b)(c) | | |
7.75%, 03/22/57, (1-day SONIA + 2.550%)(b)(c) | | |
EDvestinU Private Education Loan Issue No. 1 LLC, 3.58%, 11/25/38(a) | | |
ELFI Graduate Loan Program LLC | | |
| | |
| | |
| | |
| | |
Elmwood CLO 14 Ltd., 6.60%, 04/20/35, (3-mo. SOFR + 1.320%)(a)(b) | | |
Elmwood CLO 19 Ltd., 12.29%, 10/17/36, (3-mo. SOFR + 7.000%)(a)(b) | | |
Elmwood CLO 22 Ltd., 7.49%, 04/17/36, (3-mo. SOFR +2.200%)(a)(b) | | |
Elmwood CLO 29 Ltd., 6.84%, 04/20/37, (3-mo. SOFR + 1.520%)(a)(b) | | |
Elmwood CLO II Ltd., 6.69%, 04/20/34, (3-mo. SOFR + 1.412%)(a)(b) | | |
Elmwood CLO IV Ltd., 7.17%, 04/18/37, (3-mo. SOFR + 1.850%)(a)(b) | | |
Elmwood CLO IX Ltd., 6.67%, 07/20/34, (3-mo. SOFR + 1.392%)(a)(b) | | |
Elmwood CLO V Ltd., 6.69%, 10/20/34, (3-mo. SOFR + 1.412%)(a)(b) | | |
Elmwood CLO XI Ltd., 7.14%, 10/20/34, (3-mo. SOFR + 1.861%)(a)(b) | | |
Enterprise Fleet Financing LLC | | |
| | |
| | |
| | |
| | |
| | |
| | |
| | |
| | |
| | |
| | |
| | |
Fair Oaks Loan Funding III DAC, 6.69%, 10/15/34, (3-mo. EURIBOR + 3.000%)(b)(c) | | |
Fidelity Grand Harbour CLO DAC | | |
7.29%, 10/15/34, (3-mo. EURIBOR + 3.600%)(b)(c) | | |
8.02%, 04/15/38, (3-mo. EURIBOR + 4.100%)(b)(c) | | |
FirstKey Homes Trust, 5.00%, 05/19/39(a) | | |
Flatiron CLO 17 Ltd., 7.03%, 05/15/30, (3-mo. SOFR + 1.712%)(a)(b) | | |
Flatiron CLO 18 Ltd., 6.50%, 04/17/31, (3-mo. SOFR + 1.212%)(a)(b) | | |
Flatiron CLO 19 Ltd., 6.67%, 11/16/34, (3-mo. SOFR + 1.342%)(a)(b) | | |
Flatiron CLO 21 Ltd. Series 2021 1A, Class A1, 6.65%, 07/19/34, (3-mo. SOFR +1.371%)(a)(b) | | |
Flatiron CLO 28 Ltd., 6.59%, 07/15/36, (3-mo. SOFR + 1.320%)(a)(b) | | |
Flatiron RR CLO 22 LLC, 7.16%, 10/15/34, (3-mo. SOFR + 1.861%)(a)(b) | | |
Ford Credit Auto Owner Trust | | |
| | |
| | |
| | |
Ford Credit Floorplan Master Owner Trust A, 2.64%, 09/15/26 | | |
| | |
| | |
| | |
Schedule of Investments10
Schedule of Investments (continued)July 31, 2024
BlackRock Flexible Income ETF(Percentages shown are based on Net Assets)
| | |
| | |
6.50%, 07/24/30, (3-mo. SOFR + 1.212%)(a)(b) | | |
6.95%, 07/24/30, (3-mo. SOFR + 1.662%)(a)(b) | | |
| | |
7.01%, 10/15/30, (3-mo. SOFR + 1.711%)(a)(b) | | |
Series 2013-15A, Class ARR, 6.53%, 10/15/30, (3-mo. SOFR + 1.232%)(a)(b) | | |
Galaxy XX CLO Ltd., 6.54%, 04/20/31, (3-mo. SOFR + 1.262%)(a)(b) | | |
Galaxy XXI CLO Ltd., 6.56%, 04/20/31, (3-mo. SOFR + 1.282%)(a)(b) | | |
Galaxy XXV CLO Ltd., 7.28%, 04/25/36, (3-mo. SOFR + 2.000%)(a)(b) | | |
Galaxy XXVII CLO Ltd., 6.61%, 05/16/31, (3-mo. SOFR + 1.282%)(a)(b) | | |
| | |
6.66%, 07/15/31, (3-mo. SOFR + 1.362%)(a)(b) | | |
7.16%, 07/15/31, (3-mo. SOFR + 1.861%)(a)(b) | | |
Generate CLO 2 Ltd., 6.69%, 01/22/31, (3-mo. SOFR + 1.412%)(a)(b) | | |
Generate CLO 4 Ltd., 6.71%, 07/20/37, (3-mo. SOFR + 1.430%)(a)(b) | | |
Generate CLO 7 Ltd., 6.90%, 04/22/37, (3-mo. SOFR + 1.620%)(a)(b) | | |
Generate CLO 8 Ltd., 6.74%, 10/20/34, (3-mo. SOFR + 1.461%)(a)(b) | | |
GMF Floorplan Owner Revolving Trust | | |
6.49%, 06/15/28, (30-day Avg SOFR + 1.150%)(a)(b) | | |
| | |
6.09%, 03/15/29, (30-day Avg SOFR + 0.750%)(a)(b) | | |
GoldenTree Loan Management U.S. CLO 12 Ltd., 7.23%, 04/20/34, (3-mo. SOFR + 1.950%)(a)(b) | | |
Goldentree Loan Management U.S. Clo 15 Ltd., 7.68%, 10/20/36, (3-mo. SOFR + 2.400%)(a)(b) | | |
GoldenTree Loan Management U.S. CLO 6 Ltd., 6.60%, 04/20/35, (3-mo. SOFR + 1.320%)(a)(b) | | |
GoldenTree Loan Management U.S. CLO 8 Ltd., 6.69%, 10/20/34, (3-mo. SOFR + 1.412%)(a)(b) | | |
GoldentTree Loan Management U.S. CLO 1 Ltd., 7.68%, 04/20/37, (3-mo. SOFR + 2.400%)(a)(b) | | |
Golub Capital Partners 48 LP, 6.86%, 04/17/33, (3-mo. SOFR + 1.572%)(a)(b) | | |
Golub Capital Partners CLO 41B-R Ltd., 6.86%, 01/20/34, (3-mo. SOFR +1.581%)(a)(b) | | |
Golub Capital Partners CLO 55B Ltd., 6.74%, 07/20/34, (3-mo. SOFR +1.461%)(a)(b) | | |
Golub Capital Partners CLO 58B Ltd., 6.73%, 01/25/35, (3-mo. SOFR + 1.441%)(a)(b) | | |
Golub Capital Partners CLO 64B Ltd., 10.78%, 10/25/35, (3-mo. SOFR + 5.500%)(a)(b) | | |
| | |
Golub Capital Partners CLO 66B Ltd., 10.78%, 04/25/36, (3-mo. SOFR + 5.500%)(a)(b) | | |
Golub Capital Partners CLO 74 B Ltd., 7.16%, 07/25/37, (3-mo. SOFR + 1.850%)(a)(b) | | |
GoodLeap Sustainable Home Solutions Trust, 4.95%, 07/20/49(a) | | |
Gracie Point International Funding, 8.45%, 09/01/26, (90-day Avg SOFR + 3.100%)(a)(b) | | |
Gracie Point International Funding LLC | | |
7.60%, 03/01/27, (90-day Avg SOFR + 2.250%)(a)(b) | | |
7.30%, 09/01/26, (90-day Avg SOFR + 1.950%)(a)(b) | | |
7.05%, 03/01/28, (90-day Avg SOFR + 1.700%)(a)(b) | | |
GreenSky Home Improvement Trust | | |
| | |
| | |
Greenwood Park CLO Ltd., 6.57%, 04/15/31, (3-mo. SOFR + 1.272%)(a)(b) | | |
HalseyPoint CLO 6 Ltd., 7.73%, 10/20/34, (3-mo. SOFR + 2.450%)(a)(b) | | |
Harvest CLO XXXII DAC, 7.30%, 07/25/37, (3-mo. EURIBOR + 3.600%)(b)(c) | | |
Henley CLO IV DAC, 6.69%, 04/25/34, (3-mo. EURIBOR + 3.000%)(b)(c) | | |
Henley CLO X DAC, 7.49%, 07/20/37, (3-mo. EURIBOR + 3.750%)(b)(c) | | |
| | |
6.45%, 04/21/33, (1-day SONIA + 1.250%)(b)(c) | | |
6.10%, 04/21/33, (1-day SONIA + 0.900%)(b)(c) | | |
9.10%, 04/21/33, (1-day SONIA + 3.900%)(b)(c) | | |
7.55%, 04/21/33, (1-day SONIA + 2.350%)(b)(c) | | |
6.80%, 04/21/33, (1-day SONIA + 1.600%)(b)(c) | | |
Huntington Bank Auto Credit-Linked Notes Series, 6.74%, 05/20/32, (30-day Avg SOFR + 1.400%)(a)(b) | | |
Invesco CLO Ltd., 7.08%, 04/20/35, (3-mo. SOFR + 1.800%)(a)(b) | | |
KKR Financial CLO Ltd., 6.75%, 04/15/29, (3-mo. SOFR + 1.450%)(a)(b) | | |
| | |
| | |
| | |
| | |
| | |
| | |
| | |
| | |
| | |
Liberty Series, 5.54%, 05/25/32, (1-month BB Swap + 1.200%)(b) | | |
Logan CLO II Ltd., 7.24%, 01/20/35, (3-mo. SOFR + 1.962%)(a)(b) | | |
Madison Park Funding LIX Ltd., 6.78%, 04/18/37, (3-mo. SOFR + 1.500%)(a)(b) | | |
112024 BlackRock Annual Financial Statements
Schedule of Investments (continued)July 31, 2024
BlackRock Flexible Income ETF(Percentages shown are based on Net Assets)
| | |
Madison Park Funding XLV Ltd., 7.26%, 07/15/34, (3-mo. SOFR +1.961%)(a)(b) | | |
Madison Park Funding XVII Ltd. Series 2015-17A, Class AR2, 6.54%, 07/21/30, (3-mo. SOFR + 1.262%)(a)(b) | | |
Madison Park Funding XXIII Ltd. Series 2017-23A, Class AR, 6.50%, 07/27/31, (3-mo. SOFR + 1.232%)(a)(b) | | |
Madison Park Funding XXXI Ltd., 7.14%, 07/23/37, (3-mo. SOFR + 1.800%)(a)(b) | | |
Madison Park Funding XXXII Ltd. | | |
6.54%, 01/22/31, (3-mo. SOFR + 1.262%)(a)(b) | | |
6.94%, 01/22/31, (3-mo. SOFR + 1.662%)(a)(b) | | |
Madison Park Funding XXXIII Ltd., 7.10%, 10/15/32, (3-mo. SOFR + 1.800%)(a)(b) | | |
Madison Park Funding XXXIV Ltd., 6.67%, 04/25/32, (3-mo. SOFR + 1.382%)(a)(b) | | |
Madison Park Funding XXXVI Ltd., 6.65%, 04/15/35, (3-mo. SOFR +1.350%)(a)(b) | | |
Mariner Finance Issuance Trust | | |
| | |
| | |
| | |
| | |
| | |
| | |
| | |
| | |
| | |
| | |
| | |
| | |
Mercedes-Benz Auto Receivables Trust, 5.09%, 01/15/26 | | |
MF1 LLC, 7.08%, 03/19/39, (1-mo. CME Term SOFR + 1.737%)(a)(b) | | |
MidOcean Credit CLO XII Ltd., 6.62%, 04/18/36, (3-mo. SOFR + 1.34%)(a)(b) | | |
| | |
| | |
4.55%, 09/16/41, (1-mo. EURIBOR + 0.950%)(b)(c) | | |
Milos CLO Ltd., 6.61%, 10/20/30, (3-mo. SOFR + 1.332%)(a)(b) | | |
MMAF Equipment Finance LLC, 5.10%, 07/13/49(a) | | |
| | |
| | |
| | |
| | |
| | |
Navient Private Education Loan Trust | | |
7.04%, 10/15/31, (1-mo. CME Term SOFR + 1.714%)(a)(b) | | |
| | |
6.89%, 07/16/40, (1-mo. CME Term SOFR + 1.564%)(a)(b) | | |
Navient Private Education Refi Loan Trust | | |
| | |
| | |
| | |
| | |
7.04%, 11/15/68, (1-mo. CME Term SOFR + 1.714%)(a)(b) | | |
6.34%, 01/15/43, (1-mo. CME Term SOFR + 1.014%)(a)(b) | | |
6.49%, 12/15/59, (1-mo. CME Term SOFR + 1.164%)(a)(b) | | |
| | |
| | |
Series 2020-IA, Class A1B, 6.44%, 04/15/69, (1-mo. CME Term SOFR + 1.114%)(a)(b) | | |
Series 2021-DA, Class A, 6.51%, 04/15/60, (PRIME - 1.990%)(a)(b) | | |
Navient Student Loan Trust, 7.04%, 03/15/72, (30-day Avg SOFR + 1.700%)(a)(b) | | |
Nelnet Student Loan Trust | | |
6.49%, 04/20/62, (1-mo. CME Term SOFR + 1.144%)(a)(b) | | |
| | |
6.20%, 04/20/62, (1-mo. CME Term SOFR + 0.854%)(a)(b) | | |
| | |
6.15%, 04/20/62, (1-mo. CME Term SOFR + 0.804%)(a)(b) | | |
| | |
7.60%, 11/25/53, (30-day Avg SOFR + 2.250%)(a)(b) | | |
| | |
| | |
Series 2021-A, Class A1, 6.26%, 04/20/62, (1-mo. CME Term SOFR + 0.914%)(a)(b) | | |
Series 2021-BA, Class AFL, 6.24%, 04/20/62, (1-mo. CME Term SOFR + 0.894%)(a)(b) | | |
Neuberger Berman CLO XIV Ltd. Series 2013-14A, Class AR2, 6.56%, 01/28/30, (3-mo. SOFR + 1.292%)(a)(b) | | |
| | |
6.48%, 10/15/29, (3-mo. SOFR + 1.182%)(a)(b) | | |
6.91%, 10/15/29, (3-mo. SOFR + 1.612%)(a)(b) | | |
Neuberger Berman CLO XX Ltd., 6.72%, 07/15/34, (3-mo. SOFR + 1.422%)(a)(b) | | |
Neuberger Berman Loan Advisers CLO 26 Ltd., 6.46%, 10/18/30, (3-mo. SOFR + 1.182%)(a)(b) | | |
Neuberger Berman Loan Advisers CLO 31 Ltd., 6.58%, 04/20/31, (3-mo. SOFR + 1.302%)(a)(b) | | |
Neuberger Berman Loan Advisers CLO 32 Ltd. | | |
6.94%, 01/20/32, (3-mo. SOFR + 1.662%)(a)(b) | | |
6.53%, 01/20/32, (3-mo. SOFR + 1.252%)(a)(b) | | |
Neuberger Berman Loan Advisers CLO 34 Ltd., 6.52%, 01/20/35, (3-mo. SOFR + 1.240%)(a)(b) | | |
Neuberger Berman Loan Advisers CLO 37 Ltd., 6.51%, 07/20/31, (3-mo. SOFR + 1.232%)(a)(b) | | |
Schedule of Investments12
Schedule of Investments (continued)July 31, 2024
BlackRock Flexible Income ETF(Percentages shown are based on Net Assets)
| | |
Neuberger Berman Loan Advisers CLO 40 Ltd., 6.61%, 04/16/33, (3-mo. SOFR + 1.322%)(a)(b) | | |
Neuberger Berman Loan Advisers CLO 45 Ltd., 6.69%, 10/14/35, (3-mo. SOFR + 2.832%)(a)(b) | | |
Neuberger Berman Loan Advisers Euro Clo 6 DAC, 7.49%, 07/15/37, (3-mo. EURIBOR + 3.750%)(b)(c) | | |
New Mountain CLO 4 Ltd., 7.23%, 04/20/36, (3-mo. SOFR + 1.950%)(a)(b) | | |
Newday Funding Master Issuer PLC - Series | | |
6.11%, 07/15/32, (1-day SONIA + 0.900%)(b)(c) | | |
7.86%, 07/15/32, (1-day SONIA + 2.650%)(b)(c) | | |
7.11%, 07/15/32, (1-day SONIA + 1.900%)(b)(c) | | |
6.61%, 07/15/32, (1-day SONIA + 1.400%)(b)(c) | | |
| | |
4.55%, 02/25/43, (1-mo. EURIBOR + 0.950%)(b) | | |
4.85%, 02/25/43, (1-mo. EURIBOR + 1.250%)(b) | | |
5.25%, 02/25/43, (1-mo. EURIBOR + 1.650%)(b) | | |
7.15%, 02/25/43, (1-mo. EURIBOR + 3.550%)(b) | | |
NYACK Park CLO Ltd., 6.66%, 10/20/34, (3-mo. SOFR +1.381%)(a)(b) | | |
NYMT Trust, 7.38%, 05/25/64(a)(d) | | |
Oaktree CLO Ltd., 6.85%, 07/15/33, (3-mo. SOFR + 1.550%)(a)(b) | | |
| | |
6.57%, 04/10/33, (3-mo. SOFR + 1.262%)(a)(b) | | |
7.09%, 11/20/30, (3-mo. SOFR + 1.761%)(a)(b) | | |
6.55%, 01/15/33, (3-mo. SOFR + 1.250%)(a)(b) | | |
6.62%, 04/26/31, (3-mo. SOFR + 1.342%)(a)(b) | | |
7.24%, 07/20/34, (3-mo. SOFR + 1.962%)(a)(b) | | |
6.66%, 07/20/29, (3-mo. SOFR + 2.832%)(a)(b) | | |
7.84%, 04/17/36, (3-mo. SOFR + 2.550%)(a)(b) | | |
6.77%, 01/17/32, (3-mo. SOFR + 1.482%)(a)(b) | | |
6.70%, 07/20/37, (3-mo. SOFR + 1.400%)(a)(b) | | |
0.01%, 07/20/37, (3-mo. SOFR + 1.700%)(a)(b) | | |
1.00%, 07/20/37, (3-mo. SOFR + 3.100%)(a)(b) | | |
12.09%, 04/23/37, (3-mo. SOFR + 6.760%)(a)(b) | | |
Series 2017-13A, 6.52%, 07/15/30, (3-mo. SOFR + 1.222%)(a)(b) | | |
| | |
Octagon Investment Partners 18-R Ltd., 6.51%, 04/16/31, (3-mo. SOFR + 1.222%)(a)(b) | | |
Octagon Investment Partners 32 Ltd. | | |
6.51%, 07/15/29, (3-mo. SOFR + 1.212%)(a)(b) | | |
7.14%, 07/15/29, (3-mo. SOFR + 1.842%)(a)(b) | | |
Octagon Investment Partners 35 Ltd., 6.60%, 01/20/31, (3-mo. SOFR + 1.322%)(a)(b) | | |
Octagon Investment Partners 36 Ltd., 6.53%, 04/15/31, (3-mo. SOFR + 1.232%)(a)(b) | | |
Octagon Investment Partners 48 Ltd., 6.69%, 10/20/34, (3-mo. SOFR + 1.412%)(a)(b) | | |
Octagon Investment Partners XVI Ltd., 6.57%, 07/17/30, (3-mo. SOFR + 1.282%)(a)(b) | | |
Octagon Investment Partners XVII Ltd. Series 2013-1A, Class A1R2, 6.55%, 01/25/31, (3-mo. SOFR + 1.262%)(a)(b) | | |
Octagon Investment Partners XXI Ltd., 6.58%, 02/14/31, (3-mo. SOFR + 1.262%)(a)(b) | | |
OHA Credit Funding 10 Ltd., 6.67%, 01/18/36, (3-mo. SOFR + 1.392%)(a)(b) | | |
OHA Credit Funding 2 Ltd., 6.69%, 04/21/34, (3-mo. SOFR + 1.412%)(a)(b) | | |
OHA Credit Funding 3 Ltd. Series 2019 3A, Class AR, 6.68%, 07/02/35, (3-mo. SOFR +1.401%)(a)(b) | | |
OHA Credit Funding 6 Ltd., 8.69%, 07/20/34, (3-mo. SOFR + 3.412%)(a)(b) | | |
OHA Credit Funding 9 Ltd., 7.24%, 07/19/35, (3-mo. SOFR + 1.962%)(a)(b) | | |
OHA Credit Partners XIV Ltd., 7.04%, 01/21/30, (3-mo. SOFR + 1.761%)(a)(b) | | |
OHA Credit Partners XVI, 6.69%, 10/18/34, (3-mo. SOFR + 1.412%)(a)(b) | | |
| | |
6.69%, 01/19/37, (3-mo. SOFR + 1.412%)(a)(b) | | |
7.24%, 01/19/37, (3-mo. SOFR + 1.961%)(a)(b) | | |
6.80%, 07/20/37, (3-mo. SOFR + 1.460%)(a)(b) | | |
OneMain Direct Auto Receivables Trust | | |
6.94%, 03/14/29, (30-day Avg SOFR + 1.600%)(a)(b) | | |
| | |
Onemain Financial Issuance Trust, 5.79%, 05/14/41(a) | | |
OneMain Financial Issuance Trust | | |
| | |
| | |
| | |
| | |
| | |
| | |
| | |
| | |
| | |
6.84%, 09/15/36, (30-day Avg SOFR + 1.500%)(a)(b) | | |
| | |
| | |
132024 BlackRock Annual Financial Statements
Schedule of Investments (continued)July 31, 2024
BlackRock Flexible Income ETF(Percentages shown are based on Net Assets)
| | |
| | |
| | |
| | |
| | |
OZLM VI Ltd., 6.15%, 04/17/31, (3-mo. SOFR + 0.868%)(a)(b) | | |
| | |
6.58%, 04/15/31, (3-mo. SOFR + 1.282%)(a)(b) | | |
7.11%, 04/15/31, (3-mo. SOFR + 1.812%)(a)(b) | | |
| | |
8.29%, 07/20/30, (3-mo. SOFR + 3.012%)(a)(b) | | |
6.55%, 10/17/31, (3-mo. SOFR + 1.262%)(a)(b) | | |
6.71%, 07/15/34, (3-mo. SOFR + 1.412%)(a)(b) | | |
7.08%, 07/20/35, (3-mo. SOFR +1.800%)(a)(b) | | |
6.73%, 11/14/34, (3-mo. SOFR + 1.412%)(a)(b) | | |
7.88%, 01/20/36, (3-mo. SOFR + 2.600%)(a)(b) | | |
7.21%, 01/15/35, (3-mo. SOFR + 1.912%)(a)(b) | | |
7.43%, 10/20/33, (3-mo. SOFR + 2.150%)(a)(b) | | |
7.09%, 07/20/30, (3-mo. SOFR + 1.812%)(a)(b) | | |
Series 2015-2, 6.64%, 07/20/30, (3-mo. SOFR + 1.362%)(a)(b) | | |
Series 2021-3A, Class A1, 6.71%, 01/15/35, (3-mo. SOFR + 1.412%)(a)(b) | | |
Palmer Square European CLO DAC, 7.69%, 01/15/38, (3-mo. EURIBOR + 4.000%)(b)(c) | | |
Palmer Square European Loan Funding DAC, 1.00%, 05/15/34, (3-mo. EURIBOR + 3.150%)(b)(c) | | |
Palmer Square Loan Funding Ltd. | | |
6.34%, 07/20/29, (3-mo. SOFR + 1.062%)(a)(b) | | |
6.35%, 04/15/30, (3-mo. SOFR + 1.050%)(a)(b) | | |
6.84%, 05/20/29, (3-mo. SOFR + 1.512%)(a)(b) | | |
6.94%, 07/20/29, (3-mo. SOFR + 1.662%)(a)(b) | | |
6.90%, 04/15/31, (3-mo. SOFR + 1.600%)(a)(b) | | |
6.40%, 04/15/31, (3-mo. SOFR + 1.100%)(a)(b) | | |
6.57%, 10/15/30, (3-mo. SOFR + 1.270%)(a)(b) | | |
6.79%, 04/20/29, (3-mo. SOFR + 1.512%)(a)(b) | | |
7.34%, 04/20/29, (3-mo. SOFR + 2.062%)(a)(b) | | |
6.73%, 01/25/32, (3-mo. SOFR + 1.450%)(a)(b) | | |
6.42%, 08/08/32, (3-mo. SOFR + 1.08%)(a)(b) | | |
| | |
6.99%, 08/08/32, (3-mo. SOFR + 1.65%)(a)(b) | | |
7.24%, 08/08/32, (3-mo. SOFR + 1.900%)(a)(b) | | |
8.29%, 08/08/32, (3-mo. SOFR + 2.950%)(a)(b) | | |
Park Blue CLO Ltd., 6.80%, 07/25/37, (3-mo. SOFR + 1.480%)(a)(b) | | |
| | |
6.11%, 07/16/29, (1-day SONIA + 0.900%)(b)(c) | | |
6.51%, 07/16/29, (1-day SONIA + 1.300%)(b)(c) | | |
Peace Park CLO Ltd. Series 2021 1A, Class A, 6.67%, 10/20/34, (3-mo. SOFR + 1.392%)(a)(b) | | |
Penta CLO 17 DAC, 1.00%, 08/15/38, (3-mo. EURIBOR + 3.250%)(b)(c) | | |
| | |
| | |
6.64%, 01/15/28, (30-day Avg SOFR + 1.300%)(a)(b) | | |
| | |
| | |
6.71%, 07/20/34, (3-mo. SOFR + 1.432%)(a)(b) | | |
7.29%, 07/20/34, (3-mo. SOFR + 2.012%)(a)(b) | | |
Pony SA Compartment German Auto Loans | | |
4.47%, 01/14/33, (1-mo. EURIBOR + 0.850%)(b)(c) | | |
4.14%, 01/14/33, (1-mo. EURIBOR + 0.520%)(b)(c) | | |
4.82%, 01/14/33, (1-mo. EURIBOR + 1.200%)(b)(c) | | |
Post CLO Ltd., 7.31%, 10/15/34, (3-mo. SOFR + 2.012%)(a)(b) | | |
PRET LLC, 7.00%, 07/25/54(a)(d) | | |
Progress Residential Trust, 3.40%, 04/17/41(a)(b) | | |
Providus Clo VI DAC, 7.03%, 05/20/34, (3-mo. EURIBOR + 3.200%)(b)(c) | | |
| | |
5.30%, 06/15/41, (3-mo. EURIBOR + 1.600%)(b)(c) | | |
4.49%, 06/15/41, (3-mo. EURIBOR + 0.790%)(b)(c) | | |
6.00%, 06/15/41, (3-mo. EURIBOR + 2.300%)(b)(c) | | |
Rad CLO 10 Ltd., 6.94%, 04/23/34, (3-mo. SOFR + 1.661%)(a)(b) | | |
Rad CLO 18 Ltd., 7.25%, 04/15/36, (3-mo. SOFR + 1.950%)(a)(b) | | |
Rad CLO 24 Ltd., 2.05%, 07/20/37, (3-mo. SOFR + 2.000%)(a)(b) | | |
Rad CLO 5 Ltd., 6.67%, 07/24/32, (3-mo. SOFR + 1.382%)(a)(b) | | |
Rad CLO 7 Ltd., 6.64%, 04/17/36, (3-mo. SOFR + 1.350%)(a)(b) | | |
Recette CLO Ltd., 6.62%, 04/20/34, (3-mo. SOFR + 1.342%)(a)(b) | | |
Schedule of Investments14
Schedule of Investments (continued)July 31, 2024
BlackRock Flexible Income ETF(Percentages shown are based on Net Assets)
| | |
Regatta VI Funding Ltd., 6.70%, 04/20/34, (3-mo. SOFR + 1.422%)(a)(b) | | |
Regatta XII Funding Ltd., 6.66%, 10/15/32, (3-mo. SOFR + 2.832%)(a)(b) | | |
| | |
6.48%, 10/25/31, (3-mo. SOFR + 1.200%)(a)(b) | | |
6.83%, 10/25/31, (3-mo. SOFR + 1.550%)(a)(b) | | |
Regatta XVIII Funding Ltd. | | |
7.01%, 01/15/34, (3-mo. SOFR + 1.712%)(a)(b) | | |
6.66%, 01/15/34, (3-mo. SOFR + 1.392%)(a)(b) | | |
Regatta XX Funding Ltd., 6.72%, 10/15/34, (3-mo. SOFR + 1.422%)(a)(b) | | |
Regatta XXIV Funding Ltd., 6.69%, 01/20/35, (3-mo. SOFR +1.411%)(a)(b) | | |
Regatta XXVIII Funding Ltd., 6.83%, 04/25/37, (3-mo. SOFR + 1.550%)(a)(b) | | |
Regional Management Issuance Trust | | |
| | |
| | |
| | |
| | |
| | |
| | |
| | |
| | |
| | |
Republic Finance Issuance Trust | | |
| | |
| | |
Rockford Tower CLO Ltd., 6.73%, 10/20/30, (3-mo. SOFR + 1.452%)(a)(b) | | |
| | |
6.71%, 07/15/35, (3-mo. SOFR + 1.412%)(a)(b) | | |
7.16%, 07/15/35, (3-mo. SOFR + 1.861%)(a)(b) | | |
RR 16 Ltd., 6.67%, 07/15/36, (3-mo. SOFR + 1.372%)(a)(b) | | |
RR 18 Ltd., 7.16%, 10/15/34, (3-mo. SOFR + 1.861%)(a)(b) | | |
RR 19 Ltd., 6.70%, 10/15/35, (3-mo. SOFR + 1.402%)(a)(b) | | |
RR 3 Ltd. Series 2018-3A, Class A1R2, 6.65%, 01/15/30, (3-mo. SOFR + 1.362%)(a)(b) | | |
RR 4 Ltd., 7.11%, 04/15/30, (3-mo. SOFR + 1.812%)(a)(b) | | |
RR 8 Ltd., 6.67%, 07/15/37, (3-mo. SOFR + 1.50%)(a)(b) | | |
RR15 Ltd., 7.01%, 04/15/36, (3-mo. SOFR + 1.711%)(a)(b) | | |
RRX 4 Ltd. Series 2021 4A, Class A1, 6.76%, 07/15/34, (3-mo. SOFR +1.461%)(a)(b) | | |
RRX 5 Ltd., 7.36%, 07/15/34, (3-mo. SOFR + 2.062%)(a)(b) | | |
Sandstone Peak Ltd., 7.36%, 10/15/34, (3-mo. SOFR + 2.062%)(a)(b) | | |
| | |
SCF Rahoituspalvelut XIII DAC | | |
4.36%, 06/25/34, (1-mo. EURIBOR + 0.580%)(b)(c) | | |
4.78%, 06/25/34, (1-mo. EURIBOR + 1.000%)(b)(c) | | |
5.18%, 06/25/34, (1-mo. EURIBOR + 1.400%)(b)(c) | | |
Service Experts Issuer LLC | | |
| | |
| | |
Signal Peak CLO 8 Ltd., 6.81%, 04/20/33, (3-mo. SOFR + 1.532%)(a)(b) | | |
Sixth Street CLO XIX Ltd., 7.24%, 07/20/34, (3-mo. SOFR + 1.961%)(a)(b) | | |
Sixth Street CLO XX Ltd., 7.19%, 10/20/34, (3-mo. SOFR + 1.912%)(a)(b) | | |
SLM Private Credit Student Loan Trust | | |
5.84%, 12/16/41, (3-mo. SOFR + 0.502%)(b) | | |
6.03%, 09/15/33, (3-mo. SOFR + 0.692%)(b) | | |
Series 2004-A, Class A3, 6.00%, 06/15/33, (3-mo. SOFR + 0.662%)(b) | | |
Series 2005-A, Class A4, 5.91%, 12/15/38, (3-mo. SOFR + 0.572%)(b) | | |
Series 2006-A, Class A5, 5.89%, 06/15/39, (3-mo. SOFR + 0.552%)(b) | | |
SLM Private Education Loan Trust, 10.19%, 10/15/41, (1-mo. CME Term SOFR + 4.864%)(a)(b) | | |
SMB Private Education Loan Trust | | |
| | |
| | |
| | |
6.24%, 01/15/53, (1-mo. CME Term SOFR + 0.914%)(a)(b) | | |
| | |
6.79%, 02/16/55, (30-day Avg SOFR + 1.450%)(a)(b) | | |
6.44%, 06/15/37, (1-mo. CME Term SOFR + 1.114%)(a)(b) | | |
| | |
| | |
7.14%, 10/16/56, (30-day Avg SOFR + 1.800%)(a)(b) | | |
| | |
| | |
| | |
6.19%, 10/15/35, (1-mo. CME Term SOFR + 0.864%)(a)(b) | | |
| | |
6.89%, 11/15/52, (30-day Avg SOFR + 1.550%)(a)(b) | | |
6.27%, 09/15/37, (1-mo. CME Term SOFR + 0.945%)(a)(b) | | |
6.16%, 01/15/37, (1-mo. CME Term SOFR + 0.834%)(a)(b) | | |
| | |
| | |
6.17%, 01/15/53, (1-mo. CME Term SOFR + 0.844%)(a)(b) | | |
6.54%, 09/15/34, (1-mo. CME Term SOFR + 1.214%)(a)(b) | | |
| | |
152024 BlackRock Annual Financial Statements
Schedule of Investments (continued)July 31, 2024
BlackRock Flexible Income ETF(Percentages shown are based on Net Assets)
| | |
6.31%, 07/15/36, (1-mo. CME Term SOFR + 0.984%)(a)(b) | | |
6.31%, 09/15/54, (1-mo. CME Term SOFR + 0.964%)(a)(b) | | |
| | |
6.84%, 01/15/53, (30-day Avg SOFR + 1.500%)(a)(b) | | |
| | |
6.54%, 07/15/53, (1-mo. CME Term SOFR + 1.214%)(a)(b) | | |
6.79%, 03/15/56, (30-day Avg SOFR + 1.450%)(a)(b) | | |
| | |
6.31%, 09/15/54, (1-mo. CME Term SOFR + 0.964%)(a)(b) | | |
6.24%, 02/15/36, (1-mo. CME Term SOFR + 0.914%)(a)(b) | | |
| | |
| | |
| | |
6.44%, 06/17/52, (30-day Avg SOFR + 1.100%)(a)(b) | | |
| | |
Series 2017-A, Class A2B, 6.34%, 09/15/34, (1-mo. CME Term SOFR + 1.014%)(a)(b) | | |
| | |
| | |
| | |
SoFi Professional Loan Program LLC | | |
| | |
| | |
| | |
Sound Point CLO XXXII Ltd., 6.70%, 10/25/34, (3-mo. SOFR + 1.412%)(a)(b) | | |
Subway Funding LLC, 6.03%, 07/30/54(a) | | |
| | |
6.74%, 04/20/36, (3-mo. SOFR + 1.420%)(a)(b) | | |
6.93%, 04/20/37, (3-mo. SOFR + 1.650%)(a)(b) | | |
7.43%, 04/20/37, (3-mo. SOFR + 2.150%)(a)(b) | | |
| | |
8.18%, 04/24/36, (3-mo. SOFR + 2.900%)(a)(b) | | |
| | |
Symphony CLO 44 Ltd., 11.48%, 07/14/37, (3-mo. SOFR + 6.150%)(a)(b) | | |
Symphony CLO Ltd., 7.53%, 04/24/36, (3-mo. SOFR + 2.250%)(a)(b) | | |
Symphony CLO XIX Ltd., 6.51%, 04/16/31, (3-mo. SOFR + 1.222%)(a)(b) | | |
Symphony CLO XX Ltd., 6.84%, 01/16/32, (3-mo. SOFR + 1.550%)(a)(b) | | |
Symphony CLO XXII Ltd., 7.24%, 04/18/33, (3-mo. SOFR + 1.962%)(a)(b) | | |
| | |
6.39%, 01/17/32, (3-mo. SOFR + 1.100%)(a)(b) | | |
6.55%, 11/18/30, (3-mo. SOFR + 1.222%)(a)(b) | | |
| | |
| | |
6.58%, 10/13/32, (3-mo. SOFR + 1.282%)(a)(b) | | |
6.49%, 07/15/30, (3-mo. SOFR + 1.192%)(a)(b) | | |
Texas Debt Capital Euro CLO DAC, 7.30%, 07/16/38, (3-mo. EURIBOR + 3.600%)(b)(c) | | |
TICP CLO VI Ltd., 6.68%, 01/15/34, (3-mo. SOFR + 1.382%)(a)(b) | | |
TICP CLO VII Ltd., 7.20%, 04/15/33, (3-mo. SOFR + 1.900%)(a)(b) | | |
TICP CLO VIII Ltd., 7.24%, 10/20/34, (3-mo. SOFR + 1.962%)(a)(b) | | |
TICP CLO XII Ltd., 6.73%, 07/15/34, (3-mo. SOFR + 1.432%)(a)(b) | | |
TICP CLO XIV Ltd., 7.19%, 10/20/32, (3-mo. SOFR + 1.912%)(a)(b) | | |
Tikehau CLO VI DAC, 7.29%, 01/15/35, (3-mo. EURIBOR + 3.600%)(b)(c) | | |
Tikehau CLO XII DAC, 1.00%, 10/20/38, (3-mo. EURIBOR + 3.250%)(b)(c) | | |
Trestles CLO II Ltd., 6.89%, 07/25/37, (3-mo. SOFR + 1.570%)(a)(b) | | |
Trestles CLO III Ltd., 6.87%, 01/20/33, (3-mo. SOFR + 1.592%)(a)(b) | | |
Trestles CLO V Ltd., 6.71%, 10/20/34, (3-mo. SOFR + 1.432%)(a)(b) | | |
TREVA Equipment Finance SA - Compartment | | |
4.53%, 01/20/35, (1-mo. EURIBOR + 0.900%)(b)(c) | | |
4.27%, 01/20/35, (1-mo. EURIBOR + 0.640%)(b)(c) | | |
| | |
| | |
| | |
Trimaran CAVU Ltd., 11.11%, 10/22/35, (3-mo. SOFR + 5.830%)(a)(b) | | |
Trinitas CLO XIV Ltd., 6.62%, 01/25/34, (3-mo. SOFR + 1.34%)(a)(b) | | |
Vantage Data Centers Jersey Borrower Spv Ltd., 6.17%, 05/28/39(c) | | |
Verizon Master Trust, 4.83%, 12/22/31(a) | | |
Vista Point Securitization Trust, 6.68%, 05/25/54(a)(d) | | |
| | |
7.20%, 10/17/32, (3-mo. SOFR + 1.912%)(a)(b) | | |
6.62%, 04/15/31, (3-mo. SOFR + 1.322%)(a)(b) | | |
6.57%, 04/17/30, (3-mo. SOFR + 1.282%)(a)(b) | | |
7.43%, 10/20/36, (3-mo. SOFR + 2.150%)(a)(b) | | |
6.56%, 07/15/31, (3-mo. SOFR + 1.262%)(a)(b) | | |
6.50%, 10/15/31, (3-mo. SOFR + 1.200%)(a)(b) | | |
6.48%, 07/20/32, (3-mo. SOFR + 1.200%)(a)(b) | | |
6.43%, 10/20/31, (3-mo. SOFR + 1.150%)(a)(b) | | |
Schedule of Investments16
Schedule of Investments (continued)July 31, 2024
BlackRock Flexible Income ETF(Percentages shown are based on Net Assets)
| | |
6.43%, 10/18/31, (3-mo. SOFR + 1.150%)(a)(b) | | |
6.53%, 04/18/31, (3-mo. SOFR + 1.252%)(a)(b) | | |
6.84%, 04/19/31, (3-mo. SOFR + 1.562%)(a)(b) | | |
Voya Euro CLO IV DAC, 6.79%, 10/15/34, (3-mo. EURIBOR + 3.100%)(b)(c) | | |
Voya Ltd. Series 2012-4, 6.56%, 10/15/30, (3-mo. SOFR + 1.262%)(a)(b) | | |
| | |
6.77%, 10/24/34, (3-mo. SOFR + 1.482%)(a)(b) | | |
7.30%, 10/24/34, (3-mo. SOFR + 2.012%)(a)(b) | | |
Whitebox CLO IV Ltd., 7.88%, 04/20/36, (3-mo. SOFR + 2.600%)(a)(b) | | |
Total Asset-Backed Securities — 17.8%
(Cost: $639,783,065) | |
Collaterized Mortgage Obligations |
Asset-Backed Securities — 0.6% |
Bayview MSR Opportunity Master Fund Trust, 3.00%, 10/25/51(a)(b) | | |
BINOM Securitization Trust, 2.03%, 06/25/56(a)(b) | | |
CSMC Trust, 4.82%, 06/25/67(a)(d) | | |
Edenbrook Mortgage Funding PLC, 6.07%, 03/22/57, (1-day SONIA + 0.870%)(b)(c) | | |
EFMT, 6.65%, 03/25/69(a)(d) | | |
| | |
| | |
| | |
| | |
| | |
| | |
| | |
| | |
| | |
| | |
RCKT Mortgage Trust, 6.59%, 05/25/44(a)(b) | | |
TRK Trust, 4.36%, 06/25/57(a)(d) | | |
Verus Securitization Trust, 6.12%, 03/25/69(a)(d) | | |
| | |
Mortgage-Backed Securities — 14.0% |
A&D Mortgage Trust, 6.20%, 02/25/69(a)(d) | | |
| | |
| | |
| | |
| | |
| | |
| | |
| | |
| | |
| | |
AOMT, 4.65%, 11/25/67(a)(d) | | |
Arbor Multifamily Mortgage Securities Trust, 1.75%, 05/15/53(a) | | |
| | |
Mortgage-Backed Securities (continued) |
ARES Commercial Mortgage Trust, 7.02%, 07/15/41, (1-mo. CME Term SOFR + 1.692%)(a)(b) | | |
Arroyo Mortgage Trust, 4.95%, 07/25/57(a)(d) | | |
ARZ Trust, 5.77%, 06/11/29(a) | | |
| | |
| | |
6.52%, 09/20/61, (1-day SONIA + 1.300%)(b)(c) | | |
6.77%, 09/20/61, (1-day SONIA + 1.550%)(b)(c) | | |
BAMLL Commercial Mortgage Securities Trust, 7.34%, 03/15/37, (1-mo. CME Term SOFR + 2.014%)(a)(b) | | |
Bank of America Merrill Lynch Commercial Mortgage Trust, 3.75%, 02/15/50 | | |
Bank5 Trust, 6.23%, 05/15/57 | | |
BBCMS Mortgage Trust, Series 2018-TALL, Class A, 6.25%, 03/15/37, (1-mo. CME Term SOFR + 0.919%)(a)(b) | | |
| | |
6.19%, 04/15/36, (1-mo. CME Term SOFR + 0.864%)(a)(b) | | |
7.54%, 04/15/36, (1-mo. CME Term SOFR + 2.214%)(a)(b) | | |
Benchmark Mortgage Trust, 0.81%, 07/15/56(b) | | |
BFLD Mortgage Trust, 7.19%, 07/15/41, (1-mo. CME Term SOFR + 1.890%)(a)(b) | | |
| | |
6.88%, 07/15/35, (1-mo. CME Term SOFR + 1.547%)(a)(b) | | |
7.13%, 07/15/35, (1-mo. CME Term SOFR + 1.797%)(a)(b) | | |
BLP Commercial Mortgage Trust, 6.67%, 03/15/41, (1-mo. CME Term SOFR + 1.342%)(a)(b) | | |
BPR Trust, 6.49%, 09/15/38, (1-mo. CME Term SOFR + 1.164%)(a)(b) | | |
BRAVO Residential Funding Trust | | |
| | |
| | |
| | |
| | |
BWAY Mortgage Trust, 2.81%, 03/10/33(a) | | |
BX Commercial Mortgage Trust | | |
6.10%, 05/15/38, (1-mo. CME Term SOFR + 0.767%)(a)(b) | | |
6.11%, 06/15/38, (1-mo. CME Term SOFR + 0.784%)(a)(b) | | |
6.34%, 02/15/39, (1-mo. CME Term SOFR + 1.012%)(a)(b) | | |
6.37%, 10/15/37, (1-mo. CME Term SOFR + 1.044%)(a)(b) | | |
6.72%, 03/15/41, (1-mo. CME Term SOFR + 1.392%)(a)(b) | | |
6.77%, 02/15/39, (1-mo. CME Term SOFR + 1.442%)(a)(b) | | |
6.77%, 02/15/39, (1-mo. CME Term SOFR + 1.442%)(a)(b) | | |
6.87%, 05/15/34, (1-mo. CME Term SOFR + 1.541%)(a)(b) | | |
172024 BlackRock Annual Financial Statements
Schedule of Investments (continued)July 31, 2024
BlackRock Flexible Income ETF(Percentages shown are based on Net Assets)
| | |
Mortgage-Backed Securities (continued) |
6.97%, 05/15/41, (1-mo. CME Term SOFR + 1.641%)(a)(b) | | |
6.99%, 08/15/39, (1-mo. CME Term SOFR + 1.691%)(a)(b) | | |
7.09%, 12/09/40, (1-mo. CME Term SOFR + 1.761%)(a)(b) | | |
7.14%, 10/15/37, (1-mo. CME Term SOFR + 1.814%)(a)(b) | | |
8.02%, 03/15/41, (1-mo. CME Term SOFR + 2.690%)(a)(b) | | |
8.47%, 06/15/27, (1-mo. CME Term SOFR + 3.141%)(a)(b) | | |
8.47%, 02/15/39, (1-mo. CME Term SOFR + 3.140%)(a)(b) | | |
9.07%, 02/15/39, (1-mo. CME Term SOFR + 3.738%)(a)(b) | | |
9.22%, 06/15/27, (1-mo. CME Term SOFR + 3.889%)(a)(b) | | |
| | |
6.14%, 01/15/34, (1-mo. CME Term SOFR + 0.814%)(a)(b) | | |
6.18%, 01/15/39, (1-mo. CME Term SOFR + 0.850%)(a)(b) | | |
6.24%, 02/15/36, (1-mo. CME Term SOFR + 0.914%)(a)(b) | | |
6.33%, 01/15/39, (1-mo. CME Term SOFR + 1.000%)(a)(b) | | |
6.43%, 05/15/35, (1-mo. CME Term SOFR + 1.097%)(a)(b) | | |
6.64%, 01/15/34, (1-mo. CME Term SOFR + 1.314%)(a)(b) | | |
6.77%, 04/15/41, (1-mo. CME Term SOFR + 1.442%)(a)(b) | | |
6.79%, 02/15/36, (1-mo. CME Term SOFR + 1.464%)(a)(b) | | |
6.82%, 07/15/29, (1-mo. CME Term SOFR + 1.491%)(a)(b) | | |
6.82%, 04/15/37, (1-mo. CME Term SOFR + 1.491%)(a)(b) | | |
6.85%, 05/15/35, (1-mo. CME Term SOFR + 1.517%)(a)(b) | | |
6.87%, 06/15/37, (1-mo. CME Term SOFR + 1.541%)(a)(b) | | |
6.91%, 01/15/39, (1-mo. CME Term SOFR + 1.580%)(a)(b) | | |
7.09%, 10/15/36, (1-mo. CME Term SOFR + 1.760%)(a)(b) | | |
7.42%, 03/15/41, (1-mo. CME Term SOFR + 2.090%)(a)(b) | | |
7.49%, 08/15/39, (1-mo. CME Term SOFR + 2.165%)(a)(b) | | |
7.99%, 08/15/41, (1-mo. CME Term SOFR + 2.664%)(a)(b) | | |
8.02%, 05/15/38, (1-mo. CME Term SOFR + 2.690%)(a)(b) | | |
8.02%, 04/15/41, (1-mo. CME Term SOFR + 2.690%)(a)(b) | | |
8.67%, 05/15/38, (1-mo. CME Term SOFR + 3.339%)(a)(b) | | |
9.39%, 08/15/43, (1-mo. CME Term SOFR + 4.061%)(a)(b) | | |
| | |
Mortgage-Backed Securities (continued) |
Cali, 7.22%, 07/15/41, (1-mo. CME Term SOFR + 1.891%)(a)(b) | | |
CD Mortgage Trust, 4.51%, 08/15/51(b) | | |
CEDR Commercial Mortgage Trust, 6.32%, 02/15/39, (1-mo. CME Term SOFR + 0.988%)(a)(b) | | |
CENT Trust, 7.95%, 09/15/38, (1-mo. CME Term SOFR + 2.620%)(a)(b) | | |
CFCRE Commercial Mortgage Trust, 3.69%, 05/10/58 | | |
CFK Trust, 2.39%, 03/15/39(a) | | |
Chase Home Lending Mortgage Trust | | |
| | |
| | |
| | |
CHNGE Mortgage Trust, 3.01%, 01/25/67(a)(b) | | |
CIM Trust, 1.43%, 07/25/61(a)(b) | | |
Citigroup Commercial Mortgage Trust | | |
| | |
| | |
| | |
| | |
| | |
COAST Commercial Mortgage Trust, 7.92%, 08/15/36, (1-mo. CME Term SOFR + 2.591%)(a)(b) | | |
| | |
8.94%, 11/15/37, (1-mo. CME Term SOFR + 3.607%)(a)(b) | | |
Series 2020-ICE5, Class A, 6.34%, 11/15/37, (1-mo. CME Term SOFR + 1.014%)(a)(b) | | |
| | |
| | |
| | |
| | |
| | |
| | |
Commission Mortgage Trust | | |
| | |
| | |
| | |
7.17%, 06/15/41, (1-mo. CME Term SOFR + 1.841%)(a)(b) | | |
Series 2015-CR22, Class AM, 3.60%, 03/10/48(b) | | |
Series 2015-CR24, Class A5, 3.70%, 08/10/48 | | |
| | |
6.94%, 08/15/26, (1-mo. CME Term SOFR + 1.642%)(a)(b) | | |
9.19%, 08/15/26, (1-mo. CME Term SOFR + 3.888%)(a)(b) | | |
| | |
| | |
| | |
| | |
| | |
CSAIL Commercial Mortgage Trust | | |
| | |
| | |
| | |
Schedule of Investments18
Schedule of Investments (continued)July 31, 2024
BlackRock Flexible Income ETF(Percentages shown are based on Net Assets)
| | |
Mortgage-Backed Securities (continued) |
| | |
| | |
| | |
| | |
| | |
| | |
| | |
8.47%, 09/09/24, (1-mo. CME Term SOFR + 3.143%)(a)(b) | | |
DBGS, 7.20%, 08/15/39, (1-mo. CME Term SOFR + 1.882%)(a)(b) | | |
DBGS Mortgage Trust, 6.93%, 05/15/35, (1-mo. CME Term SOFR + 1.596%)(a)(b) | | |
DBJPM Mortgage Trust, 3.56%, 06/10/50(b) | | |
DBWF Mortgage Trust, 7.07%, 04/15/37, (1-mo. CME Term SOFR + 1.741%)(a)(b) | | |
DC Trust, 5.73%, 04/13/28(a)(b) | | |
Deephaven Residential Mortgage Trust, 1.19%, 08/25/66(a)(b) | | |
DK Trust, 6.83%, 03/15/34, (1-mo. CME Term SOFR + 1.500%)(a)(b) | | |
| | |
| | |
| | |
EQT Trust, 5.33%, 07/05/41(a)(b) | | |
EverBank Mortgage Loan Trust, 2.50%, 03/25/43(a)(b) | | |
| | |
6.10%, 03/25/94, (1-day SONIA + 0.880%)(b)(c) | | |
6.72%, 03/25/94, (1-day SONIA + 1.500%)(b)(c) | | |
7.12%, 03/25/94, (1-day SONIA + 1.900%)(b)(c) | | |
Extended Stay America Trust, Series 2021-ESH, Class A, 6.52%, 07/15/38, (1-mo. CME Term SOFR + 1.194%)(a)(b) | | |
Federal Home Loan Mortgage Corp. Multifamily Structured Pass-Through Certificates | | |
| | |
| | |
Federal Home Loan Mortgage Corp. REMICS | | |
6.55%, 06/25/54, (30-day Avg SOFR + 1.200%)(b) | | |
6.55%, 06/25/54, (30-day Avg SOFR + 1.200%)(b) | | |
6.60%, 03/25/54, (30-day Avg SOFR + 1.250%)(b) | | |
Federal Home Loan Mortgage Corp. STRIPS, 6.55%, 05/25/54, (30-day Avg SOFR + 1.200%)(b) | | |
Federal National Mortgage Association REMICS | | |
6.40%, 06/25/54, (30-day Avg SOFR + 1.050%)(b) | | |
6.40%, 06/25/54, (30-day Avg SOFR + 1.050%)(b) | | |
6.44%, 08/25/54, (30-day Avg SOFR + 1.100%)(b) | | |
| | |
| | |
| | |
Mortgage-Backed Securities (continued) |
| | |
| | |
| | |
| | |
| | |
| | |
| | |
| | |
Great Wolf Trust, 6.87%, 03/15/39, (1-mo. CME Term SOFR + 1.542%)(a)(b) | | |
GS Mortgage Securities Corp. Trust | | |
6.33%, 11/15/36, (1-mo. CME Term SOFR + 0.999%)(a)(b) | | |
6.84%, 12/15/36, (1-mo. CME Term SOFR + 1.514%)(a)(b) | | |
7.42%, 03/15/28, (1-mo. CME Term SOFR + 2.091%)(a)(b) | | |
| | |
7.52%, 08/15/39, (1-mo. CME Term SOFR + 2.195%)(a)(b) | | |
8.12%, 03/15/28, (1-mo. CME Term SOFR + 2.790%)(a)(b) | | |
GS Mortgage Securities Corportation Trust | | |
6.39%, 10/15/36, (1-mo. CME Term SOFR + 1.064%)(a)(b) | | |
6.59%, 10/15/36, (1-mo. CME Term SOFR + 1.264%)(a)(b) | | |
GS Mortgage Securities Trust, Series 2015-GC32, Class C, 4.40%, 07/10/48(b) | | |
GS Mortgage-Backed Securities Trust, 3.75%, 07/25/61(a)(b) | | |
GWT, 7.02%, 05/15/41, (1-mo. CME Term SOFR + 1.691%)(a)(b) | | |
Hawaii Hotel Trust, 6.78%, 05/15/38, (1-mo. CME Term SOFR + 1.447%)(a)(b) | | |
Hilton USA Trust, 3.72%, 11/05/38(a) | | |
HLTN Commercial Mortgage Trust, 6.87%, 05/15/37, (1-mo. CME Term SOFR + 1.541%)(a)(b) | | |
HOMES Trust, 6.18%, 01/25/68(a)(d) | | |
HONO Mortgage Trust, 6.59%, 10/15/36, (1-mo. CME Term SOFR + 1.264%)(a)(b) | | |
HTL Commercial Mortgage Trust, 5.88%, 05/10/39(a)(b) | | |
Hudson Yards Mortgage Trust, 2.94%, 12/10/41(a)(b) | | |
INTOWN Mortgage Trust, 7.82%, 08/15/39, (1-mo. CME Term SOFR + 2.489%)(a)(b) | | |
JP Morgan Chase Commercial Mortgage Securities Trust | | |
| | |
6.49%, 04/15/38, (1-mo. CME Term SOFR + 1.164%)(a)(b) | | |
| | |
0.00%, 08/25/50, (1-mo. CME Term SOFR + 3.886%)(a)(b) | | |
| | |
| | |
| | |
5.50%, 05/25/49, (1-mo. CME Term SOFR + 1.064%)(a)(b) | | |
192024 BlackRock Annual Financial Statements
Schedule of Investments (continued)July 31, 2024
BlackRock Flexible Income ETF(Percentages shown are based on Net Assets)
| | |
Mortgage-Backed Securities (continued) |
6.00%, 08/25/50, (1-mo. CME Term SOFR + 2.114%)(a)(b) | | |
| | |
JP Morgan Trust, 6.79%, 05/25/45(a)(b) | | |
JPMBB Commercial Mortgage Securities Trust, 3.97%, 03/17/49 | | |
JW Commercial Mortgage Trust, 6.95%, 06/15/39, (1-mo. CME Term SOFR + 1.621%)(a)(b) | | |
KKR Industrial Portfolio Trust, 9.19%, 12/15/37, (1-mo. CME Term SOFR + 3.864%)(a)(b) | | |
KSL Commercial Mortgage Trust | | |
| | |
7.62%, 12/15/36, (1-mo. CME Term SOFR + 2.290%)(a)(b) | | |
9.62%, 12/15/36, (1-mo. CME Term SOFR + 4.287%)(a)(b) | | |
LBA Trust, 6.92%, 06/15/26, (1-mo. CME Term SOFR + 1.591%)(a)(b) | | |
Life Mortgage Trust, 6.14%, 03/15/38, (1-mo. CME Term SOFR + 0.814%)(a)(b) | | |
LUX, 8.02%, 08/15/40, (1-mo. CME Term SOFR + 2.690%)(a)(b) | | |
LUXE Trust, 6.84%, 10/15/38, (1-mo. CME Term SOFR + 1.514%)(a)(b) | | |
| | |
| | |
7.09%, 02/15/37, (1-mo. CME Term SOFR + 1.758%)(a)(b) | | |
9.23%, 02/15/37, (1-mo. CME Term SOFR + 3.905%)(a)(b) | | |
Mello Mortgage Capital Acceptance, 2.50%, 04/25/51(a)(b) | | |
| | |
6.40%, 12/15/34, (1-mo. CME Term SOFR + 1.070%)(a)(b) | | |
6.70%, 12/15/34, (1-mo. CME Term SOFR + 1.370%)(a)(b) | | |
| | |
| | |
| | |
| | |
| | |
| | |
MHC Commercial Mortgage Trust, 6.24%, 04/15/38, (1-mo. CME Term SOFR + 0.915%)(a)(b) | | |
| | |
6.14%, 01/15/27, (1-mo. CME Term SOFR + 0.815%)(a)(b) | | |
6.14%, 07/15/38, (1-mo. CME Term SOFR + 0.814%)(a)(b) | | |
6.34%, 07/15/38, (1-mo. CME Term SOFR + 1.014%)(a)(b) | | |
6.49%, 07/15/38, (1-mo. CME Term SOFR + 1.164%)(a)(b) | | |
6.79%, 07/15/38, (1-mo. CME Term SOFR + 1.464%)(a)(b) | | |
7.19%, 07/15/38, (1-mo. CME Term SOFR + 1.864%)(a)(b) | | |
| | |
Mortgage-Backed Securities (continued) |
Miltonia Mortgage Finance SRL, 4.99%, 04/28/62, (3-mo. EURIBOR + 1.300%)(b)(c) | | |
MIRA Trust, 6.75%, 06/10/38(a) | | |
Morgan Stanley Bank of America Merrill Lynch Trust, 4.52%, 10/15/48(b) | | |
Morgan Stanley Capital I Trust | | |
| | |
| | |
| | |
| | |
| | |
6.88%, 11/15/34, (1-mo. CME Term SOFR + 1.547%)(a)(b) | | |
Morgan Stanley Residential Mortgage Loan Trust | | |
| | |
| | |
New Residential Mortgage Loan Trust | | |
| | |
| | |
| | |
| | |
| | |
| | |
| | |
| | |
NYC Trust, 7.32%, 08/15/29, (1-mo. CME Term SOFR + 1.991%)(a)(b) | | |
| | |
| | |
| | |
| | |
| | |
| | |
| | |
| | |
| | |
ONE Mortgage Trust, 6.14%, 03/15/36, (1-mo. CME Term SOFR + 0.814%)(a)(b) | | |
| | |
6.39%, 01/15/36, (1-mo. CME Term SOFR + 1.064%)(a)(b) | | |
6.69%, 01/15/36, (1-mo. CME Term SOFR + 1.364%)(a)(b) | | |
6.94%, 01/15/36, (1-mo. CME Term SOFR + 1.614%)(a)(b) | | |
ONNI Commerical Mortgage Trust, 5.75%, 07/15/39(a)(b) | | |
OPEN Trust, 8.42%, 10/15/28, (1-mo. CME Term SOFR + 3.0891%)(a)(b) | | |
ORL Trust, 7.68%, 10/19/36, (1-mo. CME Term SOFR + 2.350%)(a)(b) | | |
PGA Trust, 7.22%, 06/15/39, (1-mo. CME Term SOFR + 1.891%)(a)(b) | | |
| | |
| | |
| | |
| | |
| | |
| | |
| | |
Schedule of Investments20
Schedule of Investments (continued)July 31, 2024
BlackRock Flexible Income ETF(Percentages shown are based on Net Assets)
| | |
Mortgage-Backed Securities (continued) |
| | |
| | |
| | |
PRPM LLC, 4.00%, 07/25/54(a)(d)(e) | | |
| | |
| | |
| | |
Radian Mortgage Capital Trust LLC, 6.00%, 11/25/54(a)(b) | | |
RCO Mortgage LLC, 7.02%, 01/25/29(a)(d) | | |
RUN Trust, 4.00%, 03/25/67(a) | | |
SCG Mortgage Trust, 7.07%, 04/15/41, (1-mo. CME Term SOFR + 1.741%)(a)(b) | | |
SG Residential Mortgage Trust, 5.35%, 08/25/62(a)(d) | | |
SHER Trust, 6.97%, 04/15/37, (1-mo. CME Term SOFR + 1.641%)(a)(b) | | |
SMRT Commercial Mortgage Trust, 6.33%, 01/15/39, (1-mo. CME Term SOFR + 1.000%)(a)(b) | | |
| | |
6.17%, 11/15/38, (1-mo. CME Term SOFR + 0.845%)(a)(b) | | |
6.27%, 11/15/36, (1-mo. CME Term SOFR + 0.936%)(a)(b) | | |
6.81%, 11/15/36, (1-mo. CME Term SOFR + 1.485%)(a)(b) | | |
Stratton Mortgage Funding PLC | | |
6.19%, 06/25/49, (1-day SONIA + 0.975%)(b)(c) | | |
6.57%, 06/25/49, (1-day SONIA + 1.350%)(b)(c) | | |
STWD Trust, 6.02%, 07/15/36, (1-mo. CME Term SOFR + 0.691%)(a)(b) | | |
Taubman Centers Commercial Mortgage Trust, 7.51%, 05/15/37, (1-mo. CME Term SOFR + 2.186%)(a)(b) | | |
Towd Point Mortgage Trust | | |
| | |
| | |
| | |
| | |
| | |
TPGI Trust, 7.79%, 06/15/26, (1-mo. CME Term SOFR + 2.464%)(a)(b) | | |
| | |
6.29%, 03/15/38, (1-mo. CME Term SOFR + 0.964%)(a)(b) | | |
6.79%, 03/15/38, (1-mo. CME Term SOFR + 1.464%)(a)(b) | | |
TYSN Mortgage Trust, 6.58%, 12/10/33(a)(b) | | |
U.K. Logistics DAC, 6.88%, 05/17/34, (1-day SONIA + 1.650%)(b)(c) | | |
UBS Commercial Mortgage Trust, 3.84%, 10/15/50(b) | | |
Velocity Commercial Capital Loan Trust | | |
| | |
| | |
Verus Securitization Trust | | |
| | |
| | |
| | |
Mortgage-Backed Securities (continued) |
| | |
Wells Fargo Commercial Mortgage Trust | | |
| | |
| | |
| | |
| | |
| | |
| | |
Series 2015-C26, Class AS, 3.58%, 02/15/48 | | |
Series 2015-C28, Class AS, 3.87%, 05/15/48(b) | | |
Series 2015-C31, Class B, 4.48%, 11/15/48(b) | | |
Series 2015-LC20, Class B, 3.72%, 04/15/50 | | |
Series 2018-C46, Class AS, 4.38%, 08/15/51 | | |
Series 2019-C50, Class AS, 4.02%, 05/15/52 | | |
Wells Fargo Mortgage Backed Securities Trust, 2.50%, 12/25/50(a)(b) | | |
Wells Fargo Mortgage-Backed Securities Trust, 3.50%, 07/25/47(a)(b) | | |
WinWater Mortgage Loan Trust | | |
| | |
| | |
| | |
| | |
| | |
Total Collaterized Mortgage Obligations — 14.6%
(Cost: $527,204,184) | |
|
|
Davide Campari-Milano NV, 2.38%, 01/17/29(c) | | |
Commercial Services — 0.3% |
Nexi SpA, Series ., 0.00% 02/24/28(c)(f) | | |
| | |
| | |
| | |
| | |
|
Atos SE, 0.00% 11/06/24(c) | | |
Engineering & Construction — 0.1% |
Cellnex Telecom SA, 2.13%, 08/11/30(c) | | |
Salini SpA, 4.00%, 05/30/28(c) | | |
| | |
|
| | |
Series ., 2.13%, 11/03/27(c) | | |
Series AMS, 0.00%, 03/05/25(c)(f) | | |
| | |
Total Convertible Bonds — 0.5%
(Cost: $18,643,671) | |
212024 BlackRock Annual Financial Statements
Schedule of Investments (continued)July 31, 2024
BlackRock Flexible Income ETF(Percentages shown are based on Net Assets)
| | |
|
|
Clear Channel Outdoor Holdings Inc. | | |
| | |
| | |
| | |
| | |
| | |
| | |
| | |
Outfront Media Capital LLC/Outfront Media Capital Corp. | | |
| | |
| | |
| | |
Summer BC Holdco B SARL, 5.75%, 10/31/26(c) | | |
| | |
Aerospace & Defense — 0.7% |
| | |
| | |
| | |
| | |
| | |
| | |
Embraer Netherlands Finance BV, 7.00%, 07/28/30(a) | | |
L3Harris Technologies Inc., 5.05%, 06/01/29 | | |
| | |
| | |
| | |
RTX Corp., 2.15%, 05/18/30 | | |
Spirit AeroSystems Inc., 9.75%, 11/15/30(a) | | |
| | |
| | |
| | |
| | |
| | |
| | |
| | |
| | |
| | |
| | |
|
Darling Ingredients Inc., 5.25%, 04/15/27(a) | | |
Tereos Finance Groupe I SA | | |
| | |
| | |
| | |
|
Air Baltic Corp. AS, 14.50%, 08/14/29(a) | | |
Air Canada, 3.88%, 08/15/26(a) | | |
Air France-KLM, 4.63%, 05/23/29(c) | | |
| | |
| | |
| | |
American Airlines Inc./AAdvantage Loyalty IP Ltd. | | |
| | |
| | |
| | |
|
Azul Secured Finance LLP, 11.93%, 08/28/28(a) | | |
| | |
| | |
| | |
Finnair OYJ, 4.75%, 05/24/29(c) | | |
| | |
| | |
| | |
United Airlines Pass Through Trust, Series 2013-1, Class A, 4.30%, 02/15/27 | | |
VistaJet Malta Finance PLC/Vista Management Holding Inc. | | |
| | |
| | |
| | |
| | |
|
| | |
| | |
| | |
PrestigeBidCo GmbH, 7.46%, 07/01/29, (3-mo. EURIBOR + 3.750%)(b)(c) | | |
VF Corp., 2.40%, 04/23/25 | | |
| | |
Auto Manufacturers — 1.4% |
Allison Transmission Inc. | | |
| | |
| | |
Aston Martin Capital Holdings Ltd. | | |
| | |
| | |
Daimler Truck Finance Canada Inc., 4.22%, 03/18/25, (3-mo. EURIBOR + 0.500%)(b)(c) | | |
Ford Motor Co., 6.10%, 08/19/32 | | |
Ford Motor Credit Co. LLC | | |
| | |
| | |
| | |
| | |
| | |
General Motors Financial Co. Inc., 5.80%, 01/07/29 | | |
Jaguar Land Rover Automotive PLC | | |
| | |
| | |
| | |
2.63%, 02/18/30, (5-year EUR Swap + 2.850%)(b)(c) | | |
5.50%, 10/09/34, (5-year EURIBOR ICE Swap + 2.750%)(b)(c) | | |
Toyota Motor Finance Netherlands BV, 4.06%, 04/30/26, (3-mo. EURIBOR + 0.400%)(b)(c) | | |
Traton Finance Luxembourg SA, 4.69%, 01/21/26, (3-mo. EURIBOR + 1.000%)(b)(c) | | |
Volkswagen International Finance NV | | |
3.75%, (5-year EUR Swap + 2.924%)(b)(c)(h) | | |
3.88%, (9-year EUR Swap + 3.958%)(b)(c)(h) | | |
4.35%, 03/27/26, (3-mo. EURIBOR + 0.650%)(b)(c) | | |
Schedule of Investments22
Schedule of Investments (continued)July 31, 2024
BlackRock Flexible Income ETF(Percentages shown are based on Net Assets)
| | |
Auto Manufacturers (continued) |
Series PNC5, 7.50%, (5-year EUR Swap + 4.292%)(b)(c)(h) | | |
Volkswagen Leasing GmbH, 4.75%, 09/25/31(c) | | |
Volvo Treasury AB, 4.20%, 05/22/26, (3-mo. EURIBOR + 0.380%)(b)(c) | | |
| | |
Auto Parts & Equipment — 1.3% |
Adient Global Holdings Ltd. | | |
| | |
| | |
American Axle & Manufacturing Inc. | | |
| | |
| | |
Clarios Global LP, 6.75%, 05/15/25(a) | | |
Clarios Global LP/Clarios U.S. Finance Co. | | |
| | |
| | |
Dana Financing Luxembourg SARL | | |
| | |
| | |
| | |
| | |
| | |
| | |
| | |
| | |
| | |
| | |
Goodyear Europe BV, 2.75%, 08/15/28(c) | | |
Goodyear Tire & Rubber Co. (The) | | |
| | |
| | |
| | |
| | |
| | |
| | |
3.75%, 09/15/26, (4.50% PIK)(c)(i) | | |
6.00%, 05/15/27, (6.00% Cash and 6.75% PIK)(a)(i) | | |
8.75%, 05/15/28, (8.75% Cash and 9.50% PIK)(c)(i) | | |
| | |
| | |
| | |
Tenneco Inc., 8.00%, 11/17/28(a) | | |
| | |
| | |
| | |
| | |
| | |
| | |
| | |
| | |
| | |
ZF North America Capital Inc., 6.88%, 04/14/28(a) | | |
| | |
| | |
|
| | |
4.29%, 01/15/27, (3-mo. EURIBOR + 0.600%)(b)(c) | | |
6.88%, (5-year EUR Swap + 4.239%)(b)(c)(h) | | |
Abu Dhabi Commercial Bank PJSC, 8.00%, (5-year CMT + 3.524%)(b)(c)(h) | | |
AIB Group PLC, 6.25%, (5-year EUR Swap + 6.629%)(b)(c)(h) | | |
Alpha Bank SA, 5.00%, 05/12/30, (1-year EUR Swap + 2.432%)(b)(c) | | |
Australia & New Zealand Banking Group Ltd., 4.23%, 05/21/27, (3-mo. EURIBOR + 0.400%)(b)(c) | | |
Banca Monte dei Paschi di Siena SpA | | |
4.75%, 03/15/29, (3-mo. EURIBOR + 2.047%)(b)(c) | | |
7.71%, 01/18/28, (5-year EURIBOR ICE Swap + 5.005%)(b)(c) | | |
Banco Bilbao Vizcaya Argentaria SA | | |
8.38%, (5-year EURIBOR ICE Swap + 5.544%)(b)(c)(h) | | |
Series ., 6.00%, (5-year EUR Swap + 6.456%)(b)(c)(h) | | |
| | |
2.88%, 06/29/31, (5-year EUR Swap + 3.170%)(b)(c) | | |
3.25%, 01/14/31, (5-year EUR Swap + 3.800%)(b)(c) | | |
3.38%, 01/19/32, (5-year EUR Swap + 3.400%)(b)(c) | | |
4.25%, 10/01/29, (5-year EUR Swap + 4.672%)(b)(c) | | |
5.00%, 06/18/34, (5-year EUR Swap + 2.450%)(b)(c) | | |
Banco de Credito e Inversiones SA, 8.75%, (5-year CMT + 4.944%)(a)(b)(h) | | |
Banco de Credito Social Cooperativo SA | | |
1.75%, 03/09/28, (1-year EUR Swap + 2.150%)(b)(c) | | |
7.50%, 09/14/29, (1-year EURIBOR ICE Swap + 4.269%)(b)(c) | | |
| | |
4.00%, 01/15/30, (1-year EUR Swap + 1.600%)(b)(c) | | |
5.13%, 11/10/28, (1-year EUR Swap + 2.250%)(b)(c) | | |
5.75%, (5-year EUR Swap + 6.198%)(b)(c)(h) | | |
6.00%, 08/16/33, (5-year EUR Swap + 3.150%)(b)(c) | | |
Banco del Estado de Chile, 2.70%, 01/09/25(c) | | |
Banco Mercantil del Norte SA/Grand Cayman, 5.88%, (5-year CMT + 4.643%)(a)(b)(h) | | |
| | |
3.50%, 01/09/30, (1-year EUR Swap + 1.150%)(b)(c) | | |
| | |
Banco Votorantim SA, 4.50%, 09/24/24(c) | | |
| | |
4.63%, 12/18/29, (5-year CMT + 2.944%)(b) | | |
8.63%, 12/24/34, (5-year CMT + 4.320%)(b) | | |
232024 BlackRock Annual Financial Statements
Schedule of Investments (continued)July 31, 2024
BlackRock Flexible Income ETF(Percentages shown are based on Net Assets)
| | |
|
Bangkok Bank PCL/Hong Kong | | |
| | |
| | |
| | |
0.58%, 08/08/29, (3-mo. EURIBOR + 0.730%)(b)(c) | | |
0.69%, 03/22/31, (3-mo. EURIBOR + 0.790%)(b)(c) | | |
1.38%, 05/09/30, (3-mo. EURIBOR + 0.910%)(b)(c) | | |
1.73%, 07/22/27, (1-day SOFR + 0.960%)(b) | | |
3.19%, 07/23/30, (3-mo. SOFR + 1.442%)(b) | | |
3.37%, 01/23/26, (3-mo. SOFR + 1.072%)(b) | | |
3.38%, 04/02/26, (1-day SOFR + 1.330%)(b) | | |
3.65%, 03/31/29, (3-mo. EURIBOR + 3.670%)(b)(c) | | |
3.97%, 02/07/30, (3-mo. SOFR + 1.472%)(b) | | |
4.70%, 09/22/26, (3-mo. EURIBOR + 1.000%)(b)(c) | | |
| | |
2.50%, 06/24/27, (1-year EUR Swap + 2.785%)(b)(c) | | |
5.00%, 05/02/29, (3-mo. EURIBOR + 1.971%)(b)(c) | | |
7.38%, 07/25/28, (3-mo. EURIBOR + 4.095%)(b)(c) | | |
Bank of Ireland Group PLC | | |
6.00%, (5-year EUR Swap + 6.434%)(b)(c)(h) | | |
6.25%, 09/16/26, (1-year CMT + 2.650%)(a)(b) | | |
7.50%, (5-year EUR Swap + 7.924%)(b)(c)(h) | | |
Bankinter SA, 6.25%, (5-year EUR Swap + 6.714%)(b)(c)(h) | | |
Banque Federative du Credit Mutuel SA | | |
| | |
| | |
| | |
| | |
| | |
4.42%, 03/05/27, (3-mo. EURIBOR + 0.640%)(b)(c) | | |
| | |
| | |
2.89%, 01/31/27, (1-year EURIBOR ICE Swap + 1.680%)(b)(c) | | |
4.62%, 05/08/28, (3-mo. EURIBOR + 0.800%)(b)(c) | | |
4.92%, 08/08/30, (1-year EUR Swap + 1.750%)(b)(c) | | |
6.13%, (5-year CMT + 5.867%)(b)(h) | | |
7.09%, 11/06/29, (1-year GBP Swap + 2.553%)(b)(c) | | |
7.13%, (5-year GUK + 6.579%)(b)(h) | | |
9.25%, (5-year GBP Swap + 5.639%)(b)(h) | | |
Series ., 4.81%, 05/12/26, (3-mo. EURIBOR + 1.000%)(b)(c) | | |
BNP Paribas SA, 6.88%, (5-year EUR Swap + 4.645%)(b)(c)(h) | | |
| | |
4.16%, 03/06/26, (3-mo. EURIBOR + 0.390%)(b)(c) | | |
| | |
|
4.37%, 03/08/27, (3-mo. EURIBOR + 0.610%)(b)(c) | | |
| | |
| | |
5.25%, (5-year EUR Swap + 4.504%)(b)(c)(h) | | |
7.50%, (5-year EURIBOR ICE Swap + 5.295%)(b)(c)(h) | | |
Series ., 5.88%, (5-year EUR Swap + 6.346%)(b)(c)(h) | | |
Citigroup Inc., 3.11%, 04/08/26, (1-day SOFR + 2.842%)(b) | | |
| | |
4.25%, (5-year EUR Swap + 4.387%)(b)(c)(h) | | |
4.44%, 03/12/27, (3-mo. EURIBOR + 0.700%)(b)(c) | | |
6.13%, (5-year EUR Swap + 6.363%)(b)(c)(h) | | |
6.50%, (5-year EUR Swap + 6.743%)(b)(c)(h) | | |
8.63%, 02/28/33, (5-year U.K. Government Bond + 5.251%)(b)(c) | | |
| | |
4.23%, 04/25/29, (3-mo. EURIBOR + 1.150%)(b)(c) | | |
4.38%, (5-year EUR Swap + 4.679%)(b)(c)(h) | | |
Corp. Financiera de Desarrollo SA, 4.75%, 07/15/25(c) | | |
| | |
| | |
| | |
| | |
6.50%, (5-year EURIBOR ICE Swap + 4.207%)(b)(c)(h) | | |
7.25%, (5-year EURIBOR ICE Swap + 4.441%)(b)(c)(h) | | |
| | |
4.13%, 01/10/31, (1-year EUR Swap + 1.250%)(b)(c) | | |
4.35%, 04/10/27, (3-mo. EURIBOR + 0.650%)(b)(c) | | |
| | |
4.50%, (5-year EURIBOR ICE Swap + 4.552%)(b)(c)(h) | | |
4.63%, (5-year EURIBOR ICE Swap + 4.747%)(b)(c)(h) | | |
4.79%, (5-year USD ICE Swap + 4.358%)(b)(c)(h) | | |
8.13%, (5-year EURIBOR ICE Swap + 5.261%)(b)(c)(h) | | |
Eurobank SA, 4.88%, 04/30/31, (5-year EURIBOR ICE Swap + 2.165%)(b)(c) | | |
| | |
| | |
| | |
| | |
| | |
Goldman Sachs Group Inc. (The) | | |
| | |
1.09%, 12/09/26, (1-day SOFR + 0.789%)(b) | | |
| | |
| | |
1.95%, 10/21/27, (1-day SOFR + 0.913%)(b) | | |
3.62%, 03/15/28, (1-day SOFR + 1.846%)(b) | | |
Schedule of Investments24
Schedule of Investments (continued)July 31, 2024
BlackRock Flexible Income ETF(Percentages shown are based on Net Assets)
| | |
|
3.63%, 10/29/29, (1-year GUK + 1.950%)(b)(c) | | |
| | |
5.73%, 04/25/30, (1-day SOFR +1.265%)(b) | | |
| | |
| | |
1.65%, 04/18/26, (1-day SOFR + 1.538%)(b) | | |
1.75%, 07/24/27, (1-day SONIA + 1.307%)(b) | | |
2.26%, 11/13/26, (1-year GBP Swap + 1.316%)(b)(c) | | |
2.63%, 11/07/25, (3-mo. SOFR + 1.401%)(b) | | |
4.75%, (5-year EUR Swap + 3.844%)(b)(c)(h) | | |
6.80%, 09/14/31, (1-day SONIA + 2.124%)(b) | | |
Series ., 4.70%, 09/24/26, (3-mo. EURIBOR + 1.000%)(b)(c) | | |
ING Bank NV, 4.37%, 10/02/26, (3-mo. EURIBOR + 0.660%)(b)(c) | | |
| | |
3.88%, (5-year CMT + 2.862%)(b)(h) | | |
4.50%, 05/23/29, (3-mo. EURIBOR + 1.600%)(b)(c) | | |
5.75%, (5-year CMT + 4.342%)(b)(h) | | |
8.00%, (5-year USD ICE Swap + 4.360%)(b)(c)(h) | | |
Intercorp Peru Ltd., 3.88%, 08/15/29(a)(g) | | |
| | |
4.20%, 06/01/32, (1-year CMT + 2.600%)(a)(b) | | |
| | |
5.50%, (5-year EUR Swap + 5.848%)(b)(c)(h) | | |
| | |
5.88%, (5-year EUR Swap + 6.066%)(b)(c)(h) | | |
| | |
| | |
0.77%, 08/09/25, (1-day SOFR + 0.490%)(b) | | |
1.96%, 03/23/30, (3-mo. EURIBOR + 1.130%)(b)(c) | | |
3.76%, 03/21/34, (3-mo. EURIBOR + 0.980%)(b)(c) | | |
4.20%, 07/23/29, (3-mo. SOFR + 1.522%)(b) | | |
4.46%, 11/13/31, (3-mo. EURIBOR + 1.280%)(b)(c) | | |
5.04%, 01/23/28, (1-day SOFR + 1.190%)(b) | | |
| | |
4.25%, 11/28/29, (3-mo. EURIBOR + 1.300%)(b)(c) | | |
8.00%, (5-year EURIBOR ICE Swap + 4.928%)(b)(c)(h) | | |
| | |
4.95%, (5-year EURIBOR ICE Swap + 5.290%)(b)(c)(h) | | |
8.50%, (5-year GUK + 5.883%)(b)(h) | | |
Mitsubishi UFJ Financial Group Inc., 0.96%, 10/11/25, (1-year CMT + 0.450%)(b) | | |
| | |
1.16%, 10/21/25, (1-day SOFR + 0.560%)(b) | | |
1.59%, 05/04/27, (1-day SOFR + 0.879%)(b) | | |
| | |
| | |
|
4.37%, 03/19/27, (3-mo. EURIBOR + 0.650%)(b) | | |
4.66%, 03/02/29, (3-mo. EURIBOR + 1.304%)(b) | | |
5.65%, 04/13/28, (1-day SOFR +1.010%)(b) | | |
Series I, 0.86%, 10/21/25, (1-day SOFR + 0.745%)(b) | | |
National Bank of Greece SA, 5.88%, 06/28/35, (5-year EURIBOR ICE Swap + 3.154%)(b)(c) | | |
| | |
4.18%, 01/19/26, (3-mo. EURIBOR + 0.500%)(b)(c) | | |
9.38%, (5-year CMT + 5.385%)(a)(b)(h) | | |
Standard Chartered PLC, 0.90%, 07/02/27, (1-year EURIBOR ICE Swap + 1.000%)(b)(c) | | |
Svenska Handelsbanken AB, 4.21%, 03/08/27, (3-mo. EURIBOR + 0.450%)(b)(c) | | |
U.S. Bancorp, 4.63%, 05/21/28, (3-mo. EURIBOR + 0.800%)(b) | | |
UBS AG/London, 4.05%, 04/12/26, (3-mo. EURIBOR + 0.350%)(b)(c) | | |
| | |
2.19%, 06/05/26, (1-day SOFR + 2.044%)(a)(b) | | |
2.59%, 09/11/25, (1-day SOFR + 1.560%)(a)(b) | | |
| | |
4.49%, 05/12/26, (1-year CMT + 1.550%)(a)(b) | | |
4.88%, (5-year CMT + 3.404%)(a)(b)(h) | | |
5.13%, (5-year CMT + 4.855%)(b)(c)(h) | | |
6.88%, (5-year CMT + 4.616%)(b)(c)(h) | | |
7.00%, (5-year USD Swap +4.866%)(b)(c)(h) | | |
| | |
2.00%, 09/23/29, (5-year EUR Swap + 2.400%)(b)(c) | | |
2.73%, 01/15/32, (5-year EUR Swap + 2.800%)(b)(c) | | |
5.46%, 06/30/35, (5-year CMT + 4.750%)(a)(b) | | |
5.86%, 06/19/32, (5-year USD ICE Swap + 3.703%)(a)(b) | | |
7.30%, 04/02/34, (5-year USD ICE Swap + 4.914%)(a)(b) | | |
| | |
| | |
| | |
| | |
2.39%, 06/02/28, (1-day SOFR + 2.100%)(b) | | |
3.91%, 04/25/26, (1-day SOFR + 1.320%)(b) | | |
5.20%, 01/23/30, (1-day SOFR + 1.500%)(b) | | |
| | |
|
JDE Peet's NV, 4.50%, 01/23/34(c) | | |
|
| | |
| | |
| | |
Gilead Sciences Inc., 2.60%, 10/01/40 | | |
| | |
252024 BlackRock Annual Financial Statements
Schedule of Investments (continued)July 31, 2024
BlackRock Flexible Income ETF(Percentages shown are based on Net Assets)
| | |
Building Materials — 0.4% |
Builders FirstSource Inc. | | |
| | |
| | |
| | |
| | |
| | |
| | |
| | |
EMRLD Borrower LP/Emerald Co-Issuer Inc., 6.38%, 12/15/30(c) | | |
HT Troplast GmbH, 9.38%, 07/15/28(c) | | |
PCF GmbH, 4.75%, 04/15/26(c) | | |
| | |
| | |
| | |
Smyrna Ready Mix Concrete LLC, 8.88%, 11/15/31(a) | | |
Standard Industries Inc./NJ | | |
| | |
| | |
| | |
| | |
Summit Materials LLC/Summit Materials Finance Corp., 7.25%, 01/15/31(a) | | |
| | |
|
Avient Corp., 5.75%, 05/15/25(a) | | |
Braskem Idesa SAPI, 6.99%, 02/20/32(a) | | |
Braskem Netherlands Finance BV, 8.50%, 01/23/81, (5-year CMT + 8.220%)(a)(b) | | |
| | |
| | |
| | |
| | |
| | |
FIS Fabbrica Italiana Sintetici SpA, 5.63%, 08/01/27(c) | | |
INEOS Finance PLC, 6.38%, 04/15/29(c) | | |
INEOS Quattro Finance 2 PLC, 8.50%, 03/15/29(c) | | |
Kronos International Inc., 9.50%, 03/15/29(c) | | |
| | |
| | |
| | |
| | |
| | |
| | |
Monitchem HoldCo 3 SA, 8.75%, 05/01/28(c) | | |
Nobian Finance BV, 3.63%, 07/15/26(c) | | |
NOVA Chemicals Corp., 4.25%, 05/15/29(a)(g) | | |
| | |
| | |
| | |
| | |
| | |
| | |
| | |
| | |
Olympus Water U.S. Holding Corp. | | |
| | |
| | |
| | |
|
| | |
| | |
| | |
| | |
SCIL IV LLC/SCIL USA Holdings LLC | | |
| | |
| | |
| | |
Commercial Services — 1.8% |
ADT Security Corp. (The), 4.13%, 08/01/29(a)(g) | | |
Allied Universal Holdco LLC, 7.88%, 02/15/31(a) | | |
Allied Universal Holdco LLC/Allied Universal Finance Corp., 6.63%, 07/15/26(a) | | |
Allied Universal Holdco LLC/Allied Universal Finance Corp./Atlas Luxco 4 SARL | | |
| | |
| | |
Amber Finco PLC, 6.63%, 07/15/29(c) | | |
ASTM SpA, 1.50%, 01/25/30(c) | | |
Avis Budget Car Rental LLC/Avis Budget Finance Inc. | | |
| | |
| | |
| | |
| | |
BCP V Modular Services Finance II PLC | | |
| | |
| | |
| | |
| | |
| | |
| | |
| | |
| | |
Boost Newco Borrower LLC, 7.50%, 01/15/31(a) | | |
DP World Salaam, 6.00%, (5-year CMT + 5.750%)(b)(c)(h) | | |
| | |
| | |
| | |
La Financiere Atalian SASU, 8.50%, 06/30/28 | | |
| | |
| | |
| | |
Moody's Corp., 0.95%, 02/25/30 | | |
Motability Operations Group PLC, 4.25%, 06/17/35(c) | | |
Nexi SpA, 2.13%, 04/30/29(c) | | |
| | |
| | |
8.07%, 05/17/31, (3-mo. EURIBOR + 4.250%)(b)(c) | | |
Prime Security Services Borrower LLC/Prime Finance Inc. | | |
| | |
| | |
| | |
| | |
| | |
Schedule of Investments26
Schedule of Investments (continued)July 31, 2024
BlackRock Flexible Income ETF(Percentages shown are based on Net Assets)
| | |
Commercial Services (continued) |
| | |
| | |
Rekeep SpA, 7.25%, 02/01/26(c) | | |
Service Corp. International/U.S. | | |
| | |
| | |
| | |
| | |
United Rentals North America Inc. | | |
| | |
| | |
| | |
| | |
| | |
| | |
| | |
| | |
| | |
Wand NewCo 3 Inc., 7.63%, 01/30/32(a) | | |
| | |
|
NCR Atleos Corp., 9.50%, 04/01/29(a) | | |
| | |
| | |
| | |
| | |
| | |
| | |
| | |
| | |
Western Digital Corp., 4.75%, 02/15/26 | | |
| | |
Cosmetics & Personal Care — 0.1% |
Coty Inc., 5.00%, 04/15/26(a) | | |
Coty Inc./HFC Prestige Products Inc./HFC Prestige International U.S. LLC | | |
| | |
| | |
Edgewell Personal Care Co. | | |
| | |
| | |
| | |
Distribution & Wholesale — 0.2% |
H&E Equipment Services Inc., 3.88%, 12/15/28(a) | | |
| | |
| | |
| | |
| | |
Diversified Financial Services — 0.8% |
Ally Financial Inc., 5.75%, 11/20/25 | | |
ASG Finance Designated Activity Co., 9.75%, 05/15/29(a) | | |
Aviation Capital Group LLC, 1.95%, 09/20/26(a) | | |
Burford Capital Global Finance LLC, 9.25%, 07/01/31(a) | | |
Encore Capital Group Inc. | | |
| | |
| | |
| | |
Diversified Financial Services (continued) |
Freedom Mortgage Holdings LLC | | |
| | |
| | |
goeasy Ltd., 7.63%, 07/01/29(a) | | |
Intercontinental Exchange Inc., 3.63%, 09/01/28(a) | | |
| | |
| | |
| | |
Jefferies GmbH, 4.62%, 07/22/26(b)(c) | | |
| | |
4.88%, (5-year CMT + 4.616%)(b)(c)(h) | | |
6.63%, (5-year EUR Swap + 3.847%)(b)(c)(h) | | |
LPL Holdings Inc., 4.63%, 11/15/27(a) | | |
Muthoot Finance Ltd., 7.13%, 02/14/28(a) | | |
Nationstar Mortgage Holdings Inc. | | |
| | |
| | |
| | |
Opus-Chartered Issuances SA, 1.00%, 07/04/25(b)(e) | | |
PennyMac Financial Services Inc. | | |
| | |
| | |
| | |
| | |
Rocket Mortgage LLC/Rocket Mortgage Co-Issuer Inc. | | |
| | |
| | |
| | |
| | |
Turkiye Varlik Fonu Yonetimi AS, 8.25%, 02/14/29(c) | | |
United Wholesale Mortgage LLC | | |
| | |
| | |
| | |
| | |
|
A2A SpA, 5.00%, (5-year EURIBOR ICE Swap + 2.258%)(b)(c)(h) | | |
| | |
| | |
8.15%, 06/10/55, (5-year CMT + 3.835%)(a)(b) | | |
AES Corp. (The), 7.60%, 01/15/55, (5-year CMT + 3.201%)(b) | | |
AES Panama Generation Holdings SRL, 4.38%, 05/31/30(c) | | |
| | |
| | |
| | |
| | |
| | |
| | |
| | |
Consumers Energy Co., 4.20%, 09/01/52 | | |
Continuum Green Energy India Pvt./Co-Issuers, 7.50%, 06/26/33(a) | | |
Diamond II Ltd., 7.95%, 07/28/26(a) | | |
272024 BlackRock Annual Financial Statements
Schedule of Investments (continued)July 31, 2024
BlackRock Flexible Income ETF(Percentages shown are based on Net Assets)
| | |
|
| | |
| | |
| | |
| | |
| | |
| | |
| | |
Edison International, 8.13%, 06/15/53, (5-year CMT + 3.864%)(b) | | |
| | |
1.70%, 07/20/80, (5-year EUR Swap + 1.840%)(b)(c) | | |
1.88%, 08/02/81, (5-year EUR Swap + 2.380%)(b)(c) | | |
1.88%, 03/14/82, (5-year EUR Swap + 2.080%)(b)(c) | | |
4.75%, 05/29/54, (5-year EURIBOR ICE Swap + 2.052%)(b)(c) | | |
5.94%, 04/23/83, (5-year EUR Swap + 3.184%)(b)(c) | | |
| | |
2.88%, (5-year EURIBOR ICE Swap + 3.373%)(b)(c)(h) | | |
3.38%, (5-year EUR Swap + 3.970%)(b)(c)(h) | | |
5.38%, (12-year EUR Swap + 3.794%)(b)(c)(h) | | |
5.88%, (15-year GBP Swap + 3.322%)(b)(c)(h) | | |
6.00%, (13-year GBP Swap + 4.234%)(b)(c)(h) | | |
Emera Inc., Series 16-A, 6.75%, 06/15/76, (3-mo. LIBOR US + 5.440%)(b) | | |
EnBW Energie Baden-Wuerttemberg AG, 5.25%, 01/23/84, (5-year EURIBOR ICE Swap + 2.664%)(b)(c) | | |
EnBW International Finance BV, 4.30%, 05/23/34(c) | | |
Engie Energia Chile SA, 3.40%, 01/28/30(c) | | |
| | |
| | |
| | |
| | |
| | |
5.13%, (5-year EURIBOR ICE Swap + 2.367%)(b)(c)(h) | | |
| | |
| | |
Series B, 2.25%, 09/01/30 | | |
Series B, 3.90%, 07/15/27 | | |
Florida Power & Light Co., 5.30%, 04/01/53 | | |
MVM Energetika Zrt, 7.50%, 06/09/28(c) | | |
Naturgy Finance Iberia SA, 2.37%, (5-year EUR Swap + 2.437%)(b)(c)(h) | | |
| | |
| | |
| | |
| | |
| | |
Origin Energy Finance Ltd., 1.00%, 09/17/29(c) | | |
| | |
|
| | |
2.50%, (5-year U.K. Government Bond + 2.136%)(b)(c) | | |
5.13%, (5-year EURIBOR ICE Swap + 2.590%)(b)(c) | | |
Pacific Gas and Electric Co. | | |
| | |
| | |
PG&E Corp., 5.00%, 07/01/28 | | |
Sorik Marapi Geothermal Power PT, 7.75%, 08/05/31(a) | | |
Southern Co. (The), 1.88%, 09/15/81, (5-year EUR Swap + 2.108%)(b) | | |
Terna - Rete Elettrica Nazionale | | |
| | |
4.75%, (5-year EURIBOR ICE Swap + 2.142%)(b)(c)(h) | | |
Vistra Operations Co. LLC | | |
| | |
| | |
| | |
| | |
| | |
| | |
Electrical Components & Equipment — 0.1% |
| | |
| | |
| | |
| | |
| | |
| | |
Nexans SA, 4.25%, 03/11/30(c) | | |
| | |
|
EquipmentShare.com Inc., 8.63%, 05/15/32(a) | | |
Honeywell International Inc. | | |
| | |
| | |
Sensata Technologies BV, 4.00%, 04/15/29(a) | | |
Sensata Technologies Inc. | | |
| | |
| | |
| | |
Engineering & Construction — 0.6% |
| | |
| | |
| | |
Aeropuerto Internacional de Tocumen SA, 5.13%, 08/11/61(a) | | |
Azzurra Aeroporti SpA, 2.63%, 05/30/27(c) | | |
Cellnex Finance Co. SA, 2.00%, 02/15/33(c) | | |
Gatwick Airport Finance PLC, 4.38%, 04/07/26(c) | | |
| | |
| | |
| | |
| | |
| | |
IHS Holding Ltd., 6.25%, 11/29/28(a) | | |
Schedule of Investments28
Schedule of Investments (continued)July 31, 2024
BlackRock Flexible Income ETF(Percentages shown are based on Net Assets)
| | |
Engineering & Construction (continued) |
Infrastrutture Wireless Italiane SpA | | |
| | |
| | |
Kier Group PLC, 9.00%, 02/15/29(c) | | |
| | |
|
Allwyn Entertainment Financing U.K. PLC, 7.25%, 04/30/30(c) | | |
Banijay Entertainment SASU, 7.00%, 05/01/29(c) | | |
Caesars Entertainment Inc. | | |
| | |
| | |
| | |
| | |
Cedar Fair LP/Canada's Wonderland Co./Magnum Management Corp./Millennium Op | | |
| | |
| | |
| | |
| | |
| | |
| | |
| | |
Cirsa Finance International SARL | | |
| | |
8.14%, 07/31/28, (3-mo. EURIBOR + 4.500%)(b)(c) | | |
| | |
| | |
| | |
| | |
| | |
Inter Media & Communication SpA, 6.75%, 02/09/27(c) | | |
International Game Technology PLC | | |
| | |
| | |
Light & Wonder International Inc. | | |
| | |
| | |
| | |
Live Nation Entertainment Inc. | | |
| | |
| | |
| | |
| | |
| | |
7.05%, 06/01/31, (3-mo. EURIBOR + 3.250%)(b)(c) | | |
7.79%, 12/15/30, (3-mo. EURIBOR + 4.000%)(b)(c) | | |
Midwest Gaming Borrower LLC/Midwest Gaming Finance Corp., 4.88%, 05/01/29(a) | | |
Motion Finco SARL, 7.38%, 06/15/30(c) | | |
| | |
| | |
| | |
SeaWorld Parks & Entertainment Inc., 5.25%, 08/15/29(a) | | |
| | |
Entertainment (continued) |
Six Flags Entertainment Corp. | | |
| | |
| | |
Universal Music Group NV, 4.00%, 06/13/31(c) | | |
| | |
| | |
| | |
| | |
Wynn Resorts Finance LLC/Wynn Resorts Capital Corp. | | |
| | |
| | |
| | |
Environmental Control — 0.3% |
Clean Harbors Inc., 4.88%, 07/15/27(a) | | |
| | |
| | |
| | |
| | |
| | |
| | |
| | |
| | |
| | |
| | |
| | |
| | |
| | |
|
Albertsons Companies Inc./Safeway Inc./New Albertsons LP/Albertsons LLC | | |
| | |
| | |
| | |
| | |
| | |
| | |
| | |
Bellis Acquisition Co. PLC, 8.13%, 05/14/30(c) | | |
Boparan Finance PLC, 7.63%, 11/30/25(c) | | |
Food Service Project SA, 5.50%, 01/21/27(c) | | |
Lamb Weston Holdings Inc. | | |
| | |
| | |
| | |
Lion/Polaris Lux 4 SA, 7.33%, 07/01/29, (3-mo. EURIBOR + 3.625%)(b)(c) | | |
| | |
| | |
| | |
Nestle Finance International Ltd., 1.25%, 11/02/29(c) | | |
Performance Food Group Inc. | | |
| | |
| | |
Picard Groupe SAS, 6.38%, 07/01/29(c) | | |
| | |
| | |
| | |
| | |
292024 BlackRock Annual Financial Statements
Schedule of Investments (continued)July 31, 2024
BlackRock Flexible Income ETF(Percentages shown are based on Net Assets)
| | |
|
| | |
| | |
| | |
| | |
| | |
| | |
Premier Foods Finance PLC, 3.50%, 10/15/26(c) | | |
REWE International Finance BV, 4.88%, 09/13/30(c) | | |
| | |
| | |
| | |
| | |
| | |
|
Aramark Services Inc., 5.00%, 02/01/28(a) | | |
Elior Group SA, 3.75%, 07/15/26(c) | | |
| | |
Forest Products & Paper — 0.3% |
| | |
| | |
| | |
Mercer International Inc., 5.13%, 02/01/29(g) | | |
WEPA Hygieneprodukte GmbH | | |
| | |
| | |
| | |
|
AmeriGas Partners LP/AmeriGas Finance Corp. | | |
| | |
| | |
| | |
Centrica PLC, 6.50%, 05/21/55, (5-year U.K. Government Bond + 2.512%)(b)(c) | | |
UGI International LLC, 2.50%, 12/01/29(c) | | |
| | |
Hand & Machine Tools — 0.1% |
IMA Industria Macchine Automatiche SpA | | |
| | |
7.44%, 04/15/29, (3-mo. EURIBOR + 3.750%)(b)(c) | | |
| | |
Health Care - Products — 0.6% |
| | |
| | |
| | |
| | |
Bausch & Lomb Corp., 8.38%, 10/01/28(a)(g) | | |
| | |
| | |
| | |
| | |
| | |
| | |
Medline Borrower LP/Medline Co-Issuer Inc., 6.25%, 04/01/29(a) | | |
| | |
| | |
| | |
Health Care - Products (continued) |
| | |
Solventum Corp., 5.45%, 02/25/27(a) | | |
| | |
Health Care - Services — 1.0% |
Catalent Pharma Solutions Inc. | | |
| | |
| | |
| | |
| | |
Charles River Laboratories International Inc. | | |
| | |
| | |
| | |
Clariane SE, 13.17%, (5-year GUK + 9.079%)(b)(c)(h) | | |
| | |
| | |
| | |
| | |
Ephios Subco 3 SARL, 7.88%, 01/31/31(c) | | |
Fortrea Holdings Inc., 7.50%, 07/01/30(a)(g) | | |
HCA Inc., 5.63%, 09/01/28 | | |
| | |
| | |
| | |
| | |
| | |
| | |
| | |
| | |
| | |
| | |
| | |
| | |
| | |
| | |
| | |
UnitedHealth Group Inc., 4.95%, 05/15/62 | | |
| | |
Holding Companies - Diversified — 0.3% |
| | |
| | |
| | |
| | |
Blackstone Private Credit Fund, 7.05%, 09/29/25 | | |
Blackstone Secured Lending Fund, 5.88%, 11/15/27 | | |
MDGH GMTN RSC Ltd., 4.38%, 11/22/33(a) | | |
| | |
| | |
| | |
| | |
| | |
| | |
| | |
Schedule of Investments30
Schedule of Investments (continued)July 31, 2024
BlackRock Flexible Income ETF(Percentages shown are based on Net Assets)
| | |
|
Brookfield Residential Properties Inc./Brookfield Residential U.S. LLC | | |
| | |
| | |
Taylor Morrison Communities Inc. | | |
| | |
| | |
| | |
| | |
|
| | |
| | |
| | |
Tempur Sealy International Inc. | | |
| | |
| | |
| | |
|
| | |
| | |
| | |
| | |
| | |
Scotts Miracle-Gro Co. (The) | | |
| | |
| | |
| | |
| | |
|
Ardonagh Finco Ltd., 6.88%, 02/15/31(c) | | |
AXA SA, 6.38%, (5-year EURIBOR ICE Swap + 3.841%)(b)(c)(h) | | |
FWD Group Holdings Ltd., 8.40%, 04/05/29(c) | | |
Galaxy Bidco Ltd., 6.50%, 07/31/26(c) | | |
Intesa Sanpaolo Vita SpA, 2.38%, 12/22/30(c) | | |
Panther Escrow Issuer LLC, 7.13%, 06/01/31(a)(g) | | |
Phoenix Group Holdings PLC, 8.50%, (5-year CMT + 4.189%)(b)(c)(h) | | |
UnipolSai Assicurazioni SpA, 4.90%, 05/23/34(c) | | |
| | |
|
Engineering - Ingegneria Informatica - SpA, 11.13%, 05/15/28(c) | | |
| | |
| | |
| | |
Go Daddy Operating Co. LLC/GD Finance Co. Inc. | | |
| | |
| | |
| | |
| | |
| | |
| | |
Series ., 5.38%, 05/02/31(c) | | |
Match Group Holdings II LLC | | |
| | |
| | |
| | |
|
| | |
| | |
Rakuten Group Inc., 9.75%, 04/15/29(a) | | |
| | |
| | |
| | |
8.08%, 02/15/31, (3-mo. EURIBOR + 4.250%)(b)(c) | | |
| | |
|
ATI Inc., 7.25%, 08/15/30(g) | | |
| | |
| | |
| | |
| | |
Eregli Demir ve Celik Fabrikalari TAS, 8.38%, 07/23/29(a) | | |
| | |
| | |
| | |
| | |
| | |
| | |
| | |
| | |
Samarco Mineracao SA, 9.00%, 06/30/31, (9.00% PIK)(c)(i) | | |
Vale Overseas Ltd., 6.40%, 06/28/54 | | |
| | |
|
| | |
| | |
| | |
Carnival Holdings Bermuda Ltd., 10.38%, 05/01/28(a) | | |
Carnival PLC, 1.00%, 10/28/29 | | |
Dometic Group AB, 2.00%, 09/29/28(c) | | |
| | |
| | |
| | |
| | |
Pinnacle Bidco PLC, 10.00%, 10/11/28(c) | | |
TUI AG, 5.88%, 03/15/29(c) | | |
| | |
| | |
| | |
| | |
| | |
| | |
| | |
| | |
|
| | |
2.63%, (5-year EUR Swap + 3.252%)(b)(c)(h) | | |
7.25%, (5-year EUR Swap + 4.105%)(b)(c)(h) | | |
| | |
| | |
| | |
Hilton Domestic Operating Co. Inc. | | |
| | |
312024 BlackRock Annual Financial Statements
Schedule of Investments (continued)July 31, 2024
BlackRock Flexible Income ETF(Percentages shown are based on Net Assets)
| | |
|
| | |
| | |
| | |
| | |
Hilton Grand Vacations Borrower Escrow LLC/Hilton Grand Vacations Borrower Esc | | |
| | |
| | |
Hyatt Hotels Corp., 5.38%, 04/23/25 | | |
| | |
| | |
| | |
| | |
Melco Resorts Finance Ltd. | | |
| | |
| | |
| | |
| | |
| | |
MGM Resorts International | | |
| | |
| | |
| | |
| | |
| | |
| | |
| | |
| | |
| | |
| | |
| | |
| | |
| | |
| | |
| | |
| | |
| | |
TVL Finance PLC, 10.25%, 04/28/28(c) | | |
| | |
| | |
| | |
| | |
| | |
|
Chart Industries Inc., 7.50%, 01/01/30(a) | | |
John Deere Capital Corp., 3.45%, 07/16/32(c) | | |
Nova Alexandre III SAS, 8.91%, 07/15/29, (3-mo. EURIBOR + 5.250%)(b)(c) | | |
TK Elevator Holdco GmbH, 6.63%, 07/15/28(c) | | |
TK Elevator Midco GmbH, 4.38%, 07/15/27(c) | | |
| | |
|
Alstom SA, 5.87%, (5-year EURIBOR ICE Swap + 2.928%)(b)(c)(h) | | |
Hillenbrand Inc., 6.25%, 02/15/29 | | |
| | |
|
AMC Networks Inc., 4.25%, 02/15/29(g) | | |
| | |
|
CCO Holdings LLC/CCO Holdings Capital Corp. | | |
| | |
| | |
| | |
| | |
| | |
| | |
| | |
| | |
| | |
Charter Communications Operating LLC/Charter Communications Operating Capital, 4.91%, 07/23/25 | | |
Directv Financing LLC, 8.88%, 02/01/30(a) | | |
Directv Financing LLC/Directv Financing Co-Obligor Inc., 5.88%, 08/15/27(a) | | |
| | |
| | |
| | |
News Corp., 3.88%, 05/15/29(a) | | |
| | |
| | |
| | |
| | |
| | |
| | |
| | |
| | |
| | |
| | |
| | |
| | |
Summer BidCo BV, 10.00%, 02/15/29, (10.00% Cash and 10.75% PIK)(c)(i) | | |
Sunrise FinCo I BV, 4.88%, 07/15/31(a) | | |
| | |
| | |
| | |
| | |
Tele Columbus AG, 10.00%, 03/19/29, (10.00% PIK)(c)(i) | | |
Telenet Finance Luxembourg Notes SARL, 5.50%, 03/01/28(a) | | |
Univision Communications Inc. | | |
| | |
| | |
| | |
| | |
| | |
UPCB Finance VII Ltd., 3.63%, 06/15/29(c) | | |
Virgin Media Secured Finance PLC | | |
| | |
| | |
| | |
Virgin Media Vendor Financing Notes III DAC, 4.88%, 07/15/28(c) | | |
| | |
| | |
| | |
VZ Vendor Financing II BV, 2.88%, 01/15/29(c) | | |
Schedule of Investments32
Schedule of Investments (continued)July 31, 2024
BlackRock Flexible Income ETF(Percentages shown are based on Net Assets)
| | |
|
| | |
| | |
| | |
| | |
|
Alcoa Nederland Holding BV, 7.13%, 03/15/31(a) | | |
Anglo American Capital PLC, 4.13%, 03/15/32(c) | | |
AngloGold Ashanti Holdings PLC, 3.75%, 10/01/30 | | |
Arsenal AIC Parent LLC 2024 Term Loan B,0.00%, | | |
Constellium SE, 5.38%, 08/15/32(c) | | |
FMG Resources August 2006 Pty. Ltd. | | |
| | |
| | |
FMG Resources August Pty. Ltd. | | |
| | |
| | |
Freeport Indonesia PT, 4.76%, 04/14/27(c) | | |
| | |
| | |
| | |
| | |
Vedanta Resources Finance II PLC | | |
| | |
| | |
| | |
Office & Business Equipment — 0.1% |
| | |
| | |
| | |
| | |
| | |
|
3R Lux SARL, 9.75%, 02/05/31(a)(g) | | |
Ascent Resources Utica Holdings LLC/ARU Finance Corp. | | |
| | |
| | |
| | |
BG Energy Capital PLC, 2.25%, 11/21/29(c) | | |
| | |
| | |
| | |
BP Capital Markets PLC, 2.82%, 04/07/32(c) | | |
| | |
| | |
| | |
| | |
Civitas Resources Inc., 8.38%, 07/01/28(a) | | |
| | |
| | |
| | |
| | |
| | |
| | |
| | |
Cosan Luxembourg SA, 7.25%, 06/27/31(a) | | |
| | |
|
Crescent Energy Finance LLC, 9.25%, 02/15/28(a) | | |
CrownRock LP/CrownRock Finance Inc., 5.63%, 10/15/25(a) | | |
Diamondback Energy Inc., 3.50%, 12/01/29 | | |
| | |
| | |
| | |
Empresa Nacional del Petroleo | | |
| | |
| | |
| | |
| | |
| | |
EQT Corp., 3.13%, 05/15/26(a) | | |
Gran Tierra Energy Inc., 9.50%, 10/15/29(a) | | |
Hilcorp Energy I LP/Hilcorp Finance Co. | | |
| | |
| | |
| | |
| | |
| | |
Kosmos Energy Ltd., 7.50%, 03/01/28(c) | | |
MC Brazil Downstream Trading SARL, 7.25%, 06/30/31(c) | | |
Medco Maple Tree Pte Ltd., 8.96%, 04/27/29(a) | | |
Murphy Oil Corp., 5.88%, 12/01/27 | | |
Northern Oil & Gas Inc., 8.75%, 06/15/31(a) | | |
Occidental Petroleum Corp. | | |
| | |
| | |
| | |
| | |
| | |
| | |
PBF Holding Co. LLC/PBF Finance Corp. | | |
| | |
| | |
Permian Resources Operating LLC | | |
| | |
| | |
Pertamina Persero PT, 3.65%, 07/30/29(c) | | |
| | |
| | |
| | |
| | |
| | |
| | |
Pluspetrol Camisea SA/Pluspetrol Lote 56 SA, 6.24%, 07/03/36(a) | | |
| | |
| | |
| | |
| | |
| | |
| | |
SierraCol Energy Andina LLC, 6.00%, 06/15/28(c) | | |
| | |
| | |
| | |
332024 BlackRock Annual Financial Statements
Schedule of Investments (continued)July 31, 2024
BlackRock Flexible Income ETF(Percentages shown are based on Net Assets)
| | |
|
| | |
| | |
| | |
| | |
| | |
Sunoco LP/Sunoco Finance Corp. | | |
| | |
| | |
| | |
| | |
| | |
| | |
| | |
| | |
Transocean Inc., 8.75%, 02/15/30(a) | | |
Trident Energy Finance PLC, 12.50%, 11/30/29(c) | | |
Var Energi ASA, 7.86%, 11/15/83, (5-year EURIBOR ICE Swap + 4.765%)(b)(c) | | |
| | |
| | |
| | |
Wintershall Dea Finance BV | | |
| | |
| | |
| | |
Oil & Gas Services — 0.1% |
Archrock Partners LP/Archrock Partners Finance Corp. | | |
| | |
| | |
USA Compression Partners LP/USA Compression Finance Corp. | | |
| | |
| | |
| | |
Packaging & Containers — 1.0% |
Ardagh Metal Packaging Finance USA LLC/Ardagh Metal Packaging Finance PLC, 2.00%, 09/01/28(c) | | |
Ardagh Packaging Finance PLC/Ardagh Holdings USA Inc., 2.13%, 08/15/26(c) | | |
| | |
| | |
| | |
| | |
| | |
Crown Americas LLC/Crown Americas Capital Corp. V, 4.25%, 09/30/26 | | |
Crown Americas LLC/Crown Americas Capital Corp. VI, 4.75%, 02/01/26 | | |
Crown European Holdings SACA, 4.50%, 01/15/30(c) | | |
| | |
| | |
7.70%, 01/15/30, (3-mo. EURIBOR + 4.000%)(b)(c) | | |
Graphic Packaging International LLC | | |
| | |
| | |
| | |
Packaging & Containers (continued) |
Kleopatra Finco SARL, 4.25%, 03/01/26(c) | | |
LABL Inc., 5.88%, 11/01/28(a) | | |
Mauser Packaging Solutions Holding Co., 7.88%, 04/15/27(a) | | |
| | |
| | |
| | |
Owens-Brockway Glass Container Inc., 7.25%, 05/15/31(a)(g) | | |
Pactiv Evergreen Group Issuer Inc./Pactiv Evergreen Group Issuer LLC, 4.00%, 10/15/27(a)(g) | | |
Pactiv Evergreen Group Issuer LLC/Pactiv Evergreen Group Issuer Inc., 4.38%, 10/15/28(a) | | |
Sealed Air Corp., 4.00%, 12/01/27(a) | | |
Sealed Air Corp./Sealed Air Corp. U.S. | | |
| | |
| | |
Titan Holdings II BV, 5.13%, 07/15/29(c) | | |
Trivium Packaging Finance BV, 7.58%, 08/15/26, (3-mo. EURIBOR + 3.750%)(b)(c) | | |
| | |
|
| | |
| | |
5.38%, 03/25/82, (5-year EUR Swap + 4.458%)(b)(c) | | |
6.63%, 09/25/83, (5-year EUR Swap + 3.432%)(b)(c) | | |
7.00%, 09/25/83, (5-year EUR Swap + 3.896%)(b)(c) | | |
Series N5.5, 4.50%, 03/25/82, (5-year EUR Swap + 3.751%)(b)(c) | | |
Bayer Capital Corp. BV, 1.50%, 06/26/26(c) | | |
Bayer U.S. Finance II LLC, 4.25%, 12/15/25(a) | | |
Cheplapharm Arzneimittel GmbH | | |
| | |
| | |
| | |
| | |
| | |
| | |
Jazz Securities DAC, 4.38%, 01/15/29(a) | | |
Nidda Healthcare Holding GmbH | | |
| | |
| | |
Organon & Co./Organon Foreign Debt Co-Issuer BV | | |
| | |
| | |
| | |
Phoenix PIB Dutch Finance BV, 4.88%, 07/10/29(c) | | |
| | |
| | |
7.55%, 12/31/29, (3-mo. EURIBOR + 3.875%)(b)(c) | | |
Teva Pharmaceutical Finance Netherlands II BV | | |
| | |
Schedule of Investments34
Schedule of Investments (continued)July 31, 2024
BlackRock Flexible Income ETF(Percentages shown are based on Net Assets)
| | |
Pharmaceuticals (continued) |
| | |
| | |
| | |
Teva Pharmaceutical Finance Netherlands III BV | | |
| | |
| | |
| | |
|
Antero Midstream Partners LP/Antero Midstream Finance Corp. | | |
| | |
| | |
| | |
| | |
| | |
| | |
| | |
| | |
CQP Holdco LP/BIP-V Chinook Holdco LLC | | |
| | |
| | |
| | |
| | |
| | |
EIG Pearl Holdings SARL, 3.55%, 08/31/36(a) | | |
Enbridge Inc., 6.70%, 11/15/53 | | |
| | |
| | |
| | |
| | |
| | |
| | |
| | |
| | |
| | |
| | |
EnLink Midstream Partners LP | | |
| | |
| | |
Enterprise Products Operating LLC, 3.95%, 01/31/60 | | |
EQM Midstream Partners LP | | |
| | |
| | |
| | |
| | |
| | |
| | |
| | |
Hess Midstream Operations LP | | |
| | |
| | |
| | |
Kinetik Holdings LP, 5.88%, 06/15/30(a) | | |
NGL Energy Operating LLC/NGL Energy Finance Corp. | | |
| | |
| | |
| | |
| | |
| | |
|
| | |
| | |
Rockies Express Pipeline LLC | | |
| | |
| | |
Tallgrass Energy Partners LP/Tallgrass Energy Finance Corp. | | |
| | |
| | |
| | |
| | |
| | |
Venture Global Calcasieu Pass LLC | | |
| | |
| | |
| | |
| | |
| | |
| | |
| | |
| | |
|
ADLER Real Estate GmbH, 3.00%, 04/27/26(c) | | |
Agps Bondco PLC, 5.00%, 01/14/29(c)(j)(k) | | |
Aroundtown Finance SARL, 7.13%, (5-year EURIBOR ICE Swap + 4.508%)(b)(h) | | |
Balder Finland OYJ, 1.00%, 01/20/29(c) | | |
| | |
| | |
| | |
| | |
DEMIRE Deutsche Mittelstand Real Estate AG, 1.88%, 10/15/24(c) | | |
| | |
| | |
3.25%, (5-year EUR Swap + 3.667%)(b)(c)(h) | | |
Heimstaden Bostad Treasury BV | | |
| | |
| | |
Howard Hughes Corp. (The), 5.38%, 08/01/28(a) | | |
MAF Global Securities Ltd., 6.38%, (5-year CMT + 3.539%)(b)(c)(h) | | |
| | |
Real Estate Investment Trusts — 0.9% |
| | |
| | |
| | |
| | |
| | |
| | |
| | |
| | |
HAT Holdings I LLC/HAT Holdings II LLC, 3.38%, 06/15/26(a) | | |
| | |
| | |
| | |
| | |
| | |
352024 BlackRock Annual Financial Statements
Schedule of Investments (continued)July 31, 2024
BlackRock Flexible Income ETF(Percentages shown are based on Net Assets)
| | |
Real Estate Investment Trusts (continued) |
| | |
| | |
| | |
| | |
Iron Mountain Information Management Services Inc., 5.00%, 07/15/32(a) | | |
Iron Mountain U.K. PLC, 3.88%, 11/15/25(c) | | |
Park Intermediate Holdings LLC/PK Domestic Property LLC/PK Finance Co-Issuer | | |
| | |
| | |
RHP Hotel Properties LP/RHP Finance Corp. | | |
| | |
| | |
| | |
| | |
| | |
| | |
| | |
| | |
| | |
| | |
| | |
| | |
| | |
VICI Properties LP, 4.38%, 05/15/25 | | |
VICI Properties LP/VICI Note Co. Inc. | | |
| | |
| | |
| | |
| | |
| | |
| | |
|
1011778 BC ULC/New Red Finance Inc. | | |
| | |
| | |
| | |
| | |
| | |
Advance Auto Parts Inc., 3.90%, 04/15/30 | | |
Afflelou SAS, 6.00%, 07/25/29(c) | | |
Asbury Automotive Group Inc. | | |
| | |
| | |
| | |
| | |
| | |
| | |
| | |
| | |
Bertrand Franchise Finance SAS | | |
| | |
7.49%, 07/18/30, (3-mo. EURIBOR + 3.750%)(b)(c) | | |
CD&R Firefly Bidco PLC, 8.63%, 04/30/29(c) | | |
Constellation Automotive Financing PLC, 4.88%, 07/15/27(c) | | |
Dufry One BV, 4.75%, 04/18/31(c) | | |
Duomo Bidco SpA, 7.80%, 07/15/31, (3-mo. EURIBOR + 4.125%)(b)(c) | | |
| | |
|
Ferrellgas LP/Ferrellgas Finance Corp. | | |
| | |
| | |
| | |
| | |
7.63%, 02/01/30, (3-mo. EURIBOR + 4.000%)(b)(c) | | |
Home Depot Inc. (The), 3.63%, 04/15/52 | | |
Kohl's Corp., 4.63%, 05/01/31(g) | | |
| | |
| | |
| | |
| | |
Lowe's Companies Inc., 4.45%, 04/01/62 | | |
Macy's Retail Holdings LLC | | |
| | |
| | |
| | |
McDonald's Corp., 3.88%, 02/20/31(c) | | |
Murphy Oil USA Inc., 3.75%, 02/15/31(a) | | |
| | |
| | |
| | |
Staples Inc., 10.75%, 09/01/29(a) | | |
Stonegate Pub Co. Financing 2019 PLC | | |
| | |
9.58%, 07/31/25, (3-mo. EURIBOR + 5.750%)(b)(c) | | |
Walgreens Boots Alliance Inc. | | |
| | |
| | |
| | |
| | |
| | |
| | |
| | |
| | |
|
Nationwide Building Society, 5.75%, (5-year GUK + 5.625%)(b)(c)(h) | | |
|
ams-OSRAM AG, 10.50%, 03/30/29(c) | | |
| | |
| | |
| | |
Foundry JV Holdco LLC, 5.90%, 01/25/30(a) | | |
KLA Corp., 5.25%, 07/15/62 | | |
Lam Research Corp., 3.13%, 06/15/60 | | |
| | |
|
Cedacri Mergeco SpA, 9.33%, 05/15/28, (3-mo. EURIBOR + 5.500%)(b)(c) | | |
Central Parent Inc./CDK Global Inc., 7.25%, 06/15/29(a) | | |
Cloud Software Group Inc. | | |
| | |
| | |
Continuum Energy Pte Ltd., 5.00%, 09/13/27(e) | | |
| | |
| | |
Schedule of Investments36
Schedule of Investments (continued)July 31, 2024
BlackRock Flexible Income ETF(Percentages shown are based on Net Assets)
| | |
|
| | |
Helios Software Holdings Inc./ION Corporate Solutions Finance SARL, 7.88%, 05/01/29(c) | | |
| | |
| | |
| | |
| | |
| | |
| | |
| | |
| | |
| | |
TeamSystem SpA, 7.19%, 07/31/31, (3-mo. EURIBOR + 3.500%)(b)(c) | | |
UKG Inc., 6.88%, 02/01/31(a) | | |
VMware LLC, 3.90%, 08/21/27 | | |
| | |
Sovereign Debt Securities — 0.0% |
Nigeria Government International Bond, 8.38%, 03/24/29(a) | | |
Telecommunications — 3.5% |
| | |
| | |
| | |
| | |
| | |
Altice France SA, 5.13%, 07/15/29(a) | | |
| | |
| | |
| | |
| | |
| | |
| | |
| | |
British Telecommunications PLC, 8.38%, 12/20/83, (5-year U.K. Government Bond + 3.820%)(b)(c) | | |
C&W Senior Finance Ltd., 6.88%, 09/15/27(a) | | |
CK Hutchison Group Telecom Finance SA, 2.63%, 10/17/34(c) | | |
Connect Finco SARL/Connect U.S. Finco LLC, 6.75%, 10/01/26(a) | | |
Frontier Communications Holdings LLC | | |
| | |
| | |
| | |
Global Switch Finance BV, 1.38%, 10/07/30(c) | | |
| | |
| | |
| | |
| | |
| | |
| | |
Intelsat Jackson Holdings SA, 6.50%, 03/15/30(a) | | |
Kaixo Bondco Telecom SA, 5.13%, 09/30/29(c) | | |
Koninklijke KPN NV, 4.88%, (5-year EURIBOR ICE Swap + 1.972%)(b)(c)(h) | | |
Liberty Costa Rica Senior Secured Finance, 10.88%, 01/15/31(a) | | |
| | |
Telecommunications (continued) |
Lorca Telecom Bondco SA, 5.75%, 04/30/29(c) | | |
Millicom International Cellular SA, 7.38%, 04/02/32(a) | | |
Odido Group Holding BV, 5.50%, 01/15/30(c) | | |
| | |
| | |
| | |
| | |
Series 2033, 6.38%, 11/15/33(a) | | |
Series 2034, 6.00%, 09/30/34(a) | | |
Series 2036, 7.20%, 07/18/36(a) | | |
Series 2038, 7.72%, 06/04/38(a) | | |
Rogers Communications Inc., 5.25%, 03/15/82, (5-year CMT + 3.590%)(a)(b) | | |
| | |
| | |
| | |
| | |
| | |
| | |
| | |
Sprint Capital Corp., 6.88%, 11/15/28 | | |
Telecom Italia SpA/Milano, 2.75%, 04/15/25(c) | | |
| | |
3.88%, (8-year EUR Swap + 2.967%)(b)(c)(h) | | |
6.14%, (7-year EUR Swap + 3.347%)(b)(c)(h) | | |
7.13%, (6-year EUR Swap + 4.322%)(b)(c)(h) | | |
Series ., 5.75%, (8-year EURIBOR ICE Swap + 3.121%)(b)(c)(h) | | |
Series ., 6.75%, (8-year EUR Swap + 3.615%)(b)(c)(h) | | |
Verizon Communications Inc., 2.99%, 10/30/56 | | |
| | |
| | |
| | |
Vmed O2 U.K. Financing I PLC | | |
| | |
| | |
| | |
| | |
| | |
| | |
| | |
2.63%, 08/27/80, (5-year EUR Swap + 3.002%)(b)(c) | | |
3.00%, 08/27/80, (5-year EUR Swap + 3.477%)(b)(c) | | |
4.13%, 06/04/81, (5-year CMT + 2.767%)(b) | | |
4.88%, 10/03/78, (5-year GBP Swap + 3.267%)(b)(c) | | |
6.50%, 08/30/84, (5-year EUR Swap + 3.489%)(b)(c) | | |
7.00%, 04/04/79, (5-year USD Swap + 4.873%)(b) | | |
8.00%, 08/30/86, (5-year U.K. Government Bond + 3.837%)(b)(c) | | |
| | |
Toys, Games & Hobbies — 0.1% |
Mattel Inc., 3.38%, 04/01/26(a) | | |
372024 BlackRock Annual Financial Statements
Schedule of Investments (continued)July 31, 2024
BlackRock Flexible Income ETF(Percentages shown are based on Net Assets)
| | |
|
Brightline East LLC, 11.00%, 01/31/30(a)(g) | | |
Danaos Corp., 8.50%, 03/01/28(a) | | |
East Japan Railway Co., 4.39%, 09/05/43(c) | | |
| | |
4.25%, (5-year GUK + 4.135%)(b)(c)(h) | | |
| | |
Poste Italiane SpA, 2.63%, (5-year EURIBOR ICE Swap + 2.677%)(b)(c)(h) | | |
SGL Group ApS, 8.44%, 04/22/30, (3-mo. EURIBOR + 4.750%)(b) | | |
| | |
Trucking & Leasing — 0.0% |
DAE Funding LLC, 2.63%, 03/20/25(c) | | |
|
Thames Water Utilities Finance PLC | | |
| | |
| | |
| | |
Total Corporate Bonds & Notes — 47.4%
(Cost: $1,700,079,631) | |
Foreign Government Obligations |
|
Bahrain Government International Bond, 5.45%, 09/16/32(c) | | |
|
Benin Government International Bond, 7.96%, 02/13/38(a) | | |
|
Brazil Letras do Tesouro Nacional, 0.00% 10/01/24(f) | | |
Brazil Notas do Tesouro Nacional | | |
Series F, 10.00%, 01/01/25 | | |
Series F, 10.00%, 01/01/27 | | |
Brazilian Government International Bond, 7.13%, 05/13/54 | | |
| | |
Cameroon, United Republic of — 0.0% |
Republic of Cameroon International Bond, 9.50%, 07/31/31(c) | | |
|
Chile Government International Bond, 4.34%, 03/07/42 | | |
|
Colombia Government International Bond | | |
| | |
| | |
| | |
| | |
| | |
| | |
Series B, 5.75%, 11/03/27 | | |
Series B, 6.00%, 04/28/28 | | |
| | |
| | |
|
Costa Rica Government International Bond | | |
| | |
| | |
| | |
|
Czech Republic Government Bond, 5.00%, 09/30/30 | | |
Dominican Republic — 0.1% |
Dominican Republic International Bond | | |
| | |
| | |
| | |
| | |
Dominican Republic International Bonds, 7.05%, 02/03/31(a) | | |
| | |
|
Egypt Government International Bond | | |
| | |
| | |
| | |
| | |
| | |
|
Guatemala Government Bond | | |
| | |
| | |
| | |
| | |
|
Honduras Government International Bond, 5.63%, 06/24/30(a) | | |
|
Hungary Government Bond, 6.75%, 10/22/28 | | |
Hungary Government International Bond | | |
| | |
| | |
| | |
Magyar Export-Import Bank Zrt, 6.00%, 05/16/29(c) | | |
| | |
|
Indonesia Government International Bond, 4.10%, 04/24/28 | | |
| | |
| | |
| | |
| | |
Perusahaan Penerbit SBSN Indonesia III, 4.40%, 06/06/27(a) | | |
| | |
|
Ivory Coast Government International Bond | | |
| | |
| | |
| | |
| | |
Schedule of Investments38
Schedule of Investments (continued)July 31, 2024
BlackRock Flexible Income ETF(Percentages shown are based on Net Assets)
| | |
|
Jordan Government International Bond, 4.95%, 07/07/25(c) | | |
|
Republic of Kenya Government International Bond, 9.75%, 02/16/31(a) | | |
|
North Macedonia Government International Bond, 6.96%, 03/13/27(c) | | |
|
| | |
| | |
| | |
Series M, 5.75%, 03/05/26 | | |
Series M 20, 10.00%, 12/05/24 | | |
Series M 30, 8.50%, 11/18/38 | | |
Mexico Bonos, 7.00%, 09/03/26 | | |
| | |
| | |
| | |
Mexico Government International Bond | | |
| | |
| | |
| | |
| | |
| | |
|
Montenegro Government International Bond, 2.88%, 12/16/27(c) | | |
|
Morocco Government International Bond | | |
| | |
| | |
| | |
|
Nigeria Government International Bond, 7.63%, 11/28/47(c) | | |
|
Oman Government International Bond | | |
| | |
| | |
| | |
|
Panama Government International Bond | | |
| | |
| | |
| | |
| | |
|
Paraguay Government International Bond | | |
| | |
| | |
| | |
|
Peruvian Government International Bond | | |
| | |
| | |
| | |
|
| | |
| | |
|
Republic of Poland Government Bond | | |
| | |
| | |
| | |
| | |
| | |
Republic of Poland Government International Bond | | |
| | |
| | |
| | |
|
Romania Government International Bond | | |
| | |
| | |
Romanian Government International Bond, 5.25%, 11/25/27(a) | | |
| | |
|
Saudi Government International Bond | | |
| | |
| | |
| | |
|
Senegal Government International Bond, 6.25%, 05/23/33(c) | | |
|
Serbia International Bond, 6.00%, 06/12/34(a) | | |
|
Republic of South Africa Government Bond | | |
| | |
| | |
| | |
| | |
Republic of South Africa Government International Bond | | |
| | |
| | |
| | |
Trinidad and Tobago — 0.0% |
Trinidad & Tobago Government International Bond, 6.40%, 06/26/34(a) | | |
|
Uruguay Government International Bond, 5.75%, 10/28/34 | | |
Uruguay Government International Bonds, 9.75%, 07/20/33 | | |
| | |
392024 BlackRock Annual Financial Statements
Schedule of Investments (continued)July 31, 2024
BlackRock Flexible Income ETF(Percentages shown are based on Net Assets)
| | |
|
Republic of Uzbekistan International Bond | | |
| | |
| | |
| | |
Total Foreign Government Obligations — 6.0%
(Cost: $234,116,037) | |
Municipal Debt Obligations |
|
Florida Development Finance Corp. RB AMT, 12.00%, 07/15/32(a) | | |
|
Port of Beaumont Navigation District RB, 10.00%, 07/01/26(a) | | |
Total Municipal Debt Obligations — 0.1%
(Cost: $2,519,162) | |
U.S. Government Agency Obligations |
Mortgage-Backed Securities — 10.9% |
Uniform Mortgage-Backed Securities, 3.50%, 08/15/54(l) | | |
Total U.S. Government Agency Obligations — 10.9%
(Cost: $388,479,702) | |
Floating Rate Loan Interests |
|
Pegasus BidCo BV, 2024 EUR Term Loan, (3-mo. EURIBOR at 0.00% Floor + 3.75%), 7.58%, 07/12/29(b) | | |
|
Ineos Finance PLC, 2024 EUR Term Loan B, 02/07/31(b)(m) | | |
INEOS Quattro Holdings U.K. Ltd., 2023 EUR 1st Lien Term Loan B, 04/02/29(b)(m) | | |
Rain Carbon GmbH, 2023 EUR Term Loan B, 10/31/28(b)(e)(m) | | |
| | |
Commercial Services — 0.6% |
Allied Universal Holdco LLC, 2021 USD Incremental Term Loan B, 05/12/28(b)(m) | | |
Atlas Luxco 4 SARL, 2021 EUR Term Loan, 05/12/28(b)(m) | | |
Boost Newco Borrower LLC, 2024 USD Term Loan B, 01/31/31(m) | | |
Eagle Bidco Ltd., 2021 EUR Term Loan B, (1-mo. EURIBOR at 0.00% Floor + 3.75%), 7.35%, 03/20/28(b) | | |
Finco Utilitas SARL, EUR Term Loan B, (6-mo. EURIBOR at 0.00% Floor + 3.75%), 7.61%, 09/26/30(b) | | |
Galileo Global Education Operations, 2021 EUR Term Loan B, 07/14/28(b)(m) | | |
Garda World Security Corp., 2022 Term Loan B, 02/01/29(b)(m) | | |
| | |
Commercial Services (continued) |
Holding Socotec SAS, 2021 EUR Term Loan, (3-mo. EURIBOR at 0.00% Floor + 3.50%), 7.22%, 06/02/28(b) | | |
IFCO Management GmbH, 2024 EUR Term Loan B, 11/29/29(b)(m) | | |
Inspired FinCo Holdings Ltd., 2024 EUR Term Loan B, (1-mo. EURIBOR at 0.00% Floor + 4.00%), 7.60%, 02/28/31(b) | | |
Techem Verwaltungsgesellschaft 675 mbH, 2024 EUR Term Loan B, 07/15/29(b)(m) | | |
TMF Group Holding BV, 2024 EUR Term Loan B, (3-mo. EURIBOR at 0.00% Floor + 3.75%), 7.46%, 05/03/28(b) | | |
| | |
|
Amazon Holdco Inc., 2024 Term Loan B, 07/30/31(e)(m) | | |
Indy U.S. Holdco LLC, 2024 EUR Term Loan B, 03/06/28(m) | | |
| | |
Cosmetics & Personal Care — 0.1% |
Rainbow U.K. Bidco Ltd., EUR Term Loan B, (6-mo. EURIBOR at 0.00% Floor + 3.50%), 7.41%, 02/23/29(b) | | |
Distribution & Wholesale — 0.2% |
Ammega Group BV, 2023 EUR Term Loan B, (3-mo. EURIBOR at 0.00% Floor + 5.00%), 8.72%, 12/30/28(b) | | |
Barentz International BV, EUR Term Loan, 03/01/31(b)(m) | | |
Parts Europe SA, EUR Term Loan B, (3-mo. EURIBOR at 0.00% Floor + 3.75%), 7.44%, 02/03/31(b) | | |
Quimper AB, EUR Term Loan B1, (3-mo. EURIBOR at 0.00% Floor + 2.93%), 6.62%, 02/16/26(b) | | |
| | |
Engineering & Construction — 0.1% |
Circet Europe SASU, 2021 EUR Term Loan B, (3-mo. EURIBOR at 0.00% Floor + 3.25%), 6.97%, 10/13/28(b) | | |
Radar Bidco SARL, 2024 EUR Term Loan B, 04/04/31(b)(m) | | |
| | |
|
Bally's Corp., 2021 Term Loan B, 10/02/28(b)(m) | | |
Banijay Entertainment SASU, EUR Term Loan, (3-mo. EURIBOR at 0.00% Floor + 3.75%), 7.46%, 03/01/28(b) | | |
Caesars Entertainment Inc., 2024 Term Loan B1, 02/06/31(b)(m) | | |
Entain PLC, 2024 EUR Term Loan B, (6-mo. EURIBOR at 0.00% Floor + 3.25%), 6.92%, 06/30/28(b) | | |
Tackle SARL, 2021 EUR Term Loan B, (3-mo. EURIBOR at 0.00% Floor + 3.50%), 7.32%, 05/22/28(b) | | |
| | |
Schedule of Investments40
Schedule of Investments (continued)July 31, 2024
BlackRock Flexible Income ETF(Percentages shown are based on Net Assets)
| | |
|
Bellis Acquisition Co. PLC, 2024 EUR Term Loan B, (3-mo. EURIBOR at 0.00% Floor + 4.00%), 7.80%, 05/14/31(b) | | |
Froneri Lux FinCo SARL, 2020 EUR Term Loan B1, (6-mo. EURIBOR at 0.00% Floor + 2.13%), 5.72%, 01/29/27(b) | | |
Market Bidco Ltd., EUR Term Loan B1, 11/04/27(b)(m) | | |
ZF Invest SAS, 2021 EUR Term Loan B, (3-mo. EURIBOR at 0.00% Floor + 3.48%), 7.18%, 07/12/28(b) | | |
| | |
|
PAX Holdco Spain SL, 2024 EUR Term Loan B3, 12/31/29(b)(m) | | |
Forest Products & Paper — 0.1% |
SpA Holdings 3 Oy, EUR Term Loan B, 02/04/28(b)(m) | | |
Health Care - Products — 0.1% |
Bausch & Lomb Corp., Term Loan, 05/10/27(b)(m) | | |
Medline Borrower LP, 2024 Term Loan B, 10/23/28(b)(m) | | |
| | |
Health Care - Services — 0.1% |
Elsan SAS, 2021 EUR Term Loan B5, (3-mo. EURIBOR at 0.00% Floor + 3.10%), 6.82%, 06/16/28(b) | | |
Mehilainen Yhtiot OYJ, 2024 EUR Term Loan B, 08/09/28(b)(m) | | |
| | |
|
HNVR Holdco Ltd., 2024 EUR Term Loan D2, (6-mo. EURIBOR at 0.00% Floor + 4.25%), 8.09%, 09/12/27(b) | | |
|
Casper BidCo SAS, 2024 EUR Term Loan B, 03/21/31(b)(m) | | |
Fertitta Entertainment LLC, 2022 Term Loan B, 01/27/29(b)(m) | | |
Hilton Grand Vacations Borrower LLC, 2021 Term Loan B, 08/02/28(b)(m) | | |
Station Casinos LLC, 2024 Term Loan B, 03/14/31(b)(m) | | |
| | |
|
Ctec III GmbH, 2022 EUR Term Loan B, 03/16/29(b)(m) | | |
|
Vmed O2 U.K. Holdco 4 Ltd., 2020 EUR Term Loan R, (1-mo. EURIBOR at 0.00% Floor + 3.25%), 6.86%, 01/31/29(b) | | |
Ziggo BV, 2019 EUR Term Loan H, 01/31/29(b)(m) | | |
| | |
| | |
Municpal Debt Securities — 0.0% |
Cervantes Bidco SL, 2024 EUR 1st Lien Term Loan B, 06/13/31(m) | | |
Packaging & Containers — 0.1% |
Clydesdale Acquisition Holdings Inc, 2024 Term Loan B, 9.12%, 04/13/29(b) | | |
Clydesdale Acquisition Holdings Inc., 2024 1st Lien Term Loan, 04/13/29(m) | | |
| | |
|
AI Sirona Luxembourg Acquisition SARL, 2024 EUR Term Loan B, 09/30/28(b)(m) | | |
Ceva Sante Animale, 2024 EUR Term Loan B, 11/08/30(m) | | |
Nidda Healthcare Holding AG, 2020 EUR Term Loan F, 08/21/26(b)(m) | | |
| | |
|
Elvis U.K. Holdco Ltd., 2021 EUR Term Loan, 10/19/28(b)(m) | | |
Peer Holding III BV, 2019 EUR Term Loan B, 01/16/27(b)(m) | | |
| | |
|
Boxer Parent Co. Inc., 2024 EUR Term Loan B, 07/30/31(b)(m) | | |
Claudius Finance SARL, 2023 EUR Term Loan B, 07/10/28(b)(m) | | |
Cloud Software Group Inc. | | |
2024 USD Term Loan B, 03/30/29(b)(m) | | |
2024 EUR Term Loan B, 03/29/30(b)(m) | | |
Unit4 Group Holding BV, 2021 EUR Term Loan B, (3-mo. EURIBOR at 0.00% Floor + 3.50%), 7.22%, 06/29/28(b) | | |
| | |
Telecommunications — 0.2% |
Lorca Holdco Ltd., 2024 EUR Term Loan, 03/25/31(b)(m) | | |
Odido Holding BV, EUR Term Loan, (3-mo. EURIBOR at 0.00% Floor + 3.90%), 7.62%, 03/30/29(b) | | |
Telenet International Finance SARL, 2020 EUR Term Loan AQ, (1-mo. EURIBOR at 0.00% Floor + 2.25%), 5.86%, 04/30/29(b) | | |
| | |
Total Floating Rate Loan Interests — 3.4%
(Cost: $122,196,176) | |
| | |
|
Exchange Traded Funds — 4.6% |
iShares iBoxx $ High Yield Corporate Bond ETF(g)(n) | | |
412024 BlackRock Annual Financial Statements
Schedule of Investments (continued)July 31, 2024
BlackRock Flexible Income ETF(Percentages shown are based on Net Assets)
| | |
Exchange Traded Funds (continued) |
iShares iBoxx $ Investment Grade Corporate Bond ETF(g)(n) | | |
| | |
Total Investment Companies — 4.6%
(Cost $162,582,762) | |
Total Long-Term Investments — 105.3%
(Cost: $3,795,604,390) | |
|
Money Market Funds — 12.7% |
BlackRock Cash Funds: Institutional, SL Agency Shares, 5.45%(n)(o)(p) | | |
BlackRock Cash Funds: Treasury, SL Agency Shares, 5.29%(n)(o) | | |
Total Short-Term Securities — 12.7%
(Cost: $459,345,698) | |
Total Investments — 118.0%
(Cost: $4,254,950,088) | |
Liabilities in Excess of Other Assets — (18.0)% | |
| |
| Security exempt from registration pursuant to Rule 144A under the Securities Act of 1933, as amended. These securities may be resold in transactions exempt from registration to qualified institutional investors. |
| Variable rate security. Interest rate resets periodically. The rate shown is the effective interest rate as of period end. Security description also includes the reference rate and spread if published and available. |
| This security may be resold to qualified foreign investors and foreign institutional buyers under Regulation S of the Securities Act of 1933. |
| Step coupon security. Coupon rate will either increase (step-up bond) or decrease (step-down bond) at regular intervals until maturity. Interest rate shown reflects the rate currently in effect. |
| Security is valued using significant unobservable inputs and is classified as Level 3 in the fair value hierarchy. |
| |
| All or a portion of this security is on loan. |
| Perpetual security with no stated maturity date. |
| Payment-in-kind security which may pay interest/dividends in additional par/shares and/or in cash. Rates shown are the current rate and possible payment rates. |
| Issuer filed for bankruptcy and/or is in default. |
| Non-income producing security. |
| Represents or includes a TBA transaction. |
| Represents an unsettled loan commitment at period end. Certain details associated with this purchase are not known prior to the settlement date, including coupon rate. |
| |
| Annualized 7-day yield as of period end. |
| All or a portion of this security was purchased with the cash collateral from loaned securities. |
Affiliates
Investments in issuers considered to be affiliate(s) of the Fund during the year ended July 31, 2024 for purposes of Section 2(a)(3) of the Investment Company Act of 1940, as amended, were as follows:
| | | | | Change in
Unrealized
Appreciation
(Depreciation) | | | | Capital
Gain
Distributions
from
Underlying
Funds |
BlackRock Cash Funds: Institutional, SL Agency Shares | | | | | | | | | |
BlackRock Cash Funds: Treasury, SL Agency Shares | | | | | | | | | |
iShares iBoxx $ High Yield Corporate Bond ETF | | | | | | | | | |
iShares iBoxx $ Investment Grade Corporate Bond ETF | | | | | | | | | |
| | | | | | | | | |
| Represents net amount purchased (sold). |
| All or a portion represents securities lending income earned from the reinvestment of cash collateral from loaned securities, net of fees and collateral investment expenses, and other payments to and from borrowers of securities. |
Derivative Financial Instruments Outstanding as of Period End
| | | | Value/
Unrealized
Appreciation
(Depreciation) |
| | | | |
10-Year U.S. Treasury Note | | | | |
Schedule of Investments42
Schedule of Investments (continued)July 31, 2024
BlackRock Flexible Income ETF
Futures Contracts (continued)
| | | | Value/ Unrealized Appreciation (Depreciation) |
| | | | |
| | | | |
5-Year U.S. Treasury Note | | | | |
| | | | |
| | | | |
| | | | |
| | | | |
| | | | |
| | | | |
| | | | |
| | | | |
2-Year U.S. Treasury Note | | | | |
| | | | |
| | | | |
Forward Foreign Currency Exchange Contracts
| | | | Unrealized
Appreciation
(Depreciation) |
| | | | | | |
| | | | | | |
| | | | | | |
| | | | | | |
| | | | | | |
| | | | | | |
| | | | | | |
| | | | | | |
| | | | | | |
| | | | | | |
| | | | | | |
| | | | | | |
| | | | | | |
| | | | | | |
| | | | | | |
| | | | | | |
| | | | | | |
| | | | | | |
| | | | | | |
| | | | | | |
| | | | | | |
| | | | Morgan Stanley & Co. International PLC | | |
| | | | | | |
| | | | | | |
| | | | Morgan Stanley & Co. International PLC | | |
| | | | | | |
| | | | Morgan Stanley & Co. International PLC | | |
| | | | | | |
432024 BlackRock Annual Financial Statements
Schedule of Investments (continued)July 31, 2024
BlackRock Flexible Income ETF
Forward Foreign Currency Exchange Contracts (continued)
| | | | Unrealized Appreciation (Depreciation) |
| | | | Morgan Stanley & Co. International PLC | | |
| | | | Morgan Stanley & Co. International PLC | | |
| | | | | | |
| | | | | | |
| | | | Morgan Stanley & Co. International PLC | | |
| | | | | | |
| | | | | | |
| | | | | | |
| | | | | | |
| | | | | | |
| | | | Deutsche Bank Securities Inc. | | |
| | | | | | |
| | | | | | |
| | | | Deutsche Bank Securities Inc. | | |
| | | | | | |
| | | | Morgan Stanley & Co. International PLC | | |
| | | | | | |
| | | | Deutsche Bank Securities Inc. | | |
| | | | | | |
| | | | | | |
| | | | | | |
| | | | Morgan Stanley & Co. International PLC | | |
| | | | | | |
| | | | | | |
| | | | Morgan Stanley & Co. International PLC | | |
| | | | Morgan Stanley & Co. International PLC | | |
| | | | Morgan Stanley & Co. International PLC | | |
| | | | | | |
| | | | | | |
| | | | Deutsche Bank Securities Inc. | | |
| | | | | | |
| | | | | | |
| | | | | | |
| | | | | | |
| | | | | | |
| | | | | | |
| | | | | | |
| | | | | | |
| | | | | | |
| | | | Morgan Stanley & Co. International PLC | | |
| | | | | | |
Schedule of Investments44
Schedule of Investments (continued)July 31, 2024
BlackRock Flexible Income ETF
Forward Foreign Currency Exchange Contracts (continued)
| | | | Unrealized Appreciation (Depreciation) |
| | | | Morgan Stanley & Co. International PLC | | |
| | | | | | |
| | | | Morgan Stanley & Co. International PLC | | |
| | | | | | |
| | | | | | |
| | | | | | |
| | | | | | |
| | | | | | |
| | | | | | |
| | | | | | |
| | | | Morgan Stanley & Co. International PLC | | |
| | | | | | |
| | | | | | |
| | | | | | |
| | | | | | |
| | | | | | |
| | | | | | |
| | | | | | |
| | | | Deutsche Bank Securities Inc. | | |
| | | | Morgan Stanley & Co. International PLC | | |
| | | | | | |
| | | | | | |
| | | | | | |
| | | | | | |
| | | | | | |
| | | | | | |
| | | | Deutsche Bank Securities Inc. | | |
| | | | | | |
| | | | | | |
| | | | | | |
| | | | Deutsche Bank Securities Inc. | | |
| | | | | | |
| | | | | | |
| | | | Morgan Stanley & Co. International PLC | | |
| | | | | | |
| | | | | | |
| | | | Morgan Stanley & Co. International PLC | | |
| | | | | | |
| | | | | | |
| | | | | | |
| | | | | | |
| | | | | | |
| | | | | | |
| | | | | | |
452024 BlackRock Annual Financial Statements
Schedule of Investments (continued)July 31, 2024
BlackRock Flexible Income ETF
Forward Foreign Currency Exchange Contracts (continued)
| | | | Unrealized Appreciation (Depreciation) |
| | | | | | |
| | | | | | |
| | | | | | |
Centrally Cleared Interest Rate Swaps
| | | | | | | Upfront
Premium
Paid
(Received) | Unrealized
Appreciation
(Depreciation) |
| | | |
| | | | | | | | | | |
| | | | | | | | | | |
| | | | | | | | | | |
| | | | | | | | | | |
| | | | | | | | | | |
| | | | | | | | | | |
| | | | | | | | | | |
| | | | | | | | | | |
| | | | | | | | | | |
| | | | | | | | | | |
| | | | | | | | | | |
| | | | | | | | | | |
| | | | | | | | | | |
| | | | | | | | | | |
| | | | | | | | | | |
| | | | | | | | | | |
| | | | | | | | | | |
| | | | | | | | | | |
| | | | | | | | | | |
| | | | | | | | | | |
| | | | | | | | | | |
Schedule of Investments46
Schedule of Investments (continued)July 31, 2024
BlackRock Flexible Income ETF
OTC Interest Rate Swaps
| | | | | | | | Upfront
Premium
Paid
(Received) | Unrealized
Appreciation
(Depreciation) |
| | | |
| | | | | | | | | | | |
| | | | | | | | | | | |
| | | | | | | | | | | |
| | | | | | | | | | | |
| | | | Morgan Stanley & Co. International PLC | | | | | | | |
| | | | Morgan Stanley & Co. International PLC | | | | | | | |
| | | | | | | | | | | |
| | | | | | | | | | | |
| | | | | | | | | | | |
| | | | | | | | | | | |
| | | | | | | | | | | |
| | | | | | | | | | | |
| | | | | | | | | | | |
| | | | | | | | | | | |
1-Day CLP Interbank Rate, 24,217.30% | | | | | | | | | | | |
| | | | | | | | | | | |
| | | | | | | | | | | |
| | | | | | | | | | | |
| | | | | | | | | | | |
| | | | | | | | | | | |
472024 BlackRock Annual Financial Statements
Schedule of Investments (continued)July 31, 2024
BlackRock Flexible Income ETF
OTC Interest Rate Swaps (continued)
| | | | | | | | Upfront Premium Paid (Received) | Unrealized Appreciation (Depreciation) |
| | | |
| | | | | | | | | | | |
| | 1-Day CLP Interbank Rate, 24,217.30% | | | | | | | | | |
| | | | | | | | | | | |
| | | | | | | | | |
| | | | | | | | | Upfront
Premiums
Paid
(Received) | Unrealized
Appreciation
(Depreciation) |
| | Markit iBoxx USD Liquid Leveraged Loan Index | | Goldman Sachs International | | | | | | | |
Balances Reported in the Statements of Assets and Liabilities for Centrally Cleared Swaps and OTC Swaps
| | | | |
Centrally Cleared Swaps(a) | | | | |
| | | | |
| Includes cumulative appreciation (depreciation) on centrally cleared swaps, as reported in the Schedule of Investments. Only current day’s variation margin is reported within the Statements of Assets and Liabilities and is net of any previously paid (received) swap premium amounts. |
Derivative Financial Instruments Categorized by Risk Exposure
As of period end, the fair values of derivative financial instruments located in the Statements of Assets and Liabilities were as follows:
| | | | Foreign
Currency
Exchange
Contracts | | | |
Assets—Derivative Financial Instruments | | | | | | | |
| | | | | | | |
Unrealized appreciation on futures contracts(a) | | | | | | | |
Forward foreign currency exchange contracts | | | | | | | |
Unrealized appreciation on forward foreign currency exchange con- tracts | | | | | | | |
Swaps — centrally cleared | | | | | | | |
Unrealized appreciation on centrally cleared swaps(a) | | | | | | | |
| | | | | | | |
Unrealized appreciation on OTC swaps; Swap premiums paid | | | | | | | |
| | | | | | | |
Schedule of Investments48
Schedule of Investments (continued)July 31, 2024
BlackRock Flexible Income ETF
Derivative Financial Instruments Categorized by Risk Exposure (continued)
| | | | Foreign Currency Exchange Contracts | | | |
Liabilities—Derivative Financial Instruments | | | | | | | |
| | | | | | | |
Unrealized depreciation on futures contracts(a) | | | | | | | |
Forward foreign currency exchange contracts | | | | | | | |
Unrealized depreciation on forward foreign currency exchange con- tracts | | | | | | | |
Swaps — centrally cleared | | | | | | | |
Unrealized depreciation on centrally cleared swaps(a) | | | | | | | |
| | | | | | | |
Unrealized depreciation on OTC swaps; Swap premiums received | | | | | | | |
| | | | | | | |
| Net cumulative unrealized appreciation (depreciation) on futures contracts and centrally cleared swaps, if any, are reported in the Schedule of Investments. In the Statements of Assets and Liabilities, only current day's variation margin is reported in receivables or payables and the net cumulative unrealized appreciation (depreciation) is included in accumulated earnings (loss). |
For the period ended July 31, 2024, the effect of derivative financial instruments in the Statements of Operations was as follows:
| | | | Foreign
Currency
Exchange
Contracts | | | |
Net Realized Gain (Loss) from | | | | | | | |
| | | | | | | |
Forward foreign currency exchange contracts | | | | | | | |
| | | | | | | |
| | | | | | | |
| | | | | | | |
Net Change in Unrealized Appreciation (Depreciation) on | | | | | | | |
| | | | | | | |
Forward foreign currency exchange contracts | | | | | | | |
| | | | | | | |
| | | | | | | |
| Options purchased are included in net realized gain (loss) from investments — unaffiliated. |
Average Quarterly Balances of Outstanding Derivative Financial Instruments
| |
Average notional value of contracts — long | |
Average notional value of contracts — short | |
Forward foreign currency exchange contracts: | |
Average amounts purchased — in USD | |
Average amounts sold — in USD | |
| |
Average value of option contracts purchased | |
| |
Average notional value — pays fixed rate | |
Average notional value — receives fixed rate | |
| |
| |
| Derivative not held at quarter-end. The amounts shown in the Statement of Operations serve as an indicator of volume activity during the period. |
For more information about the Fund’s investment risks regarding derivative financial instruments, refer to the Notes to Financial Statements.
492024 BlackRock Annual Financial Statements
Schedule of Investments (continued)July 31, 2024
BlackRock Flexible Income ETF
Derivative Financial Instruments - Offsetting as of Period End
The Fund's derivative assets and liabilities (by type) were as follows:
| | |
Derivative Financial Instruments: | | |
| | |
Forward foreign currency exchange contracts | | |
Swaps - centrally cleared | | |
| | |
Total derivative assets and liabilities in the Statement of Assets and Liabilities | | |
Derivatives not subject to a Master Netting Agreement or similar agreement ("MNA") | | |
Total derivative assets and liabilities subject to an MNA | | |
| Includes unrealized appreciation (depreciation) on OTC swaps and swap premiums (paid/received) in the Statements of Assets and Liabilities. |
The following tables present the Fund’s derivative assets and liabilities by counterparty net of amounts available for offset under an MNA and net of the related collateral received and pledged by the Fund:
| Derivative
Assets
Subject to
an MNA by
Counterparty | | Non-Cash
Collateral
Received | | |
| | | | | |
| | | | | |
| | | | | |
| | | | | |
Deutsche Bank Securities Inc. | | | | | |
| | | | | |
Goldman Sachs International | | | | | |
Morgan Stanley & Co. International PLC | | | | | |
| | | | | |
| | | | | |
| Derivative
Liabilities
Subject to
an MNA by
Counterparty | | Non-Cash
Collateral
Pledged | | |
| | | | | |
| | | | | |
| | | | | |
| | | | | |
Deutsche Bank Securities Inc. | | | | | |
| | | | | |
Goldman Sachs International | | | | | |
Morgan Stanley & Co. International PLC | | | | | |
| | | | | |
| | | | | |
| The amount of derivatives available for offset is limited to the amount of derivative assets and/or liabilities that are subject to an MNA. |
| Excess of collateral received/pledged, if any, from the individual counterparty is not shown for financial reporting purposes. |
| Net amount represents the net amount receivable from the counterparty in the event of default. |
| Net amount may also include forward foreign currency exchange contracts that are not required to be collateralized. |
| Net amount represents the net amount payable due to the counterparty in the event of default. |
Schedule of Investments50
Schedule of Investments (continued)July 31, 2024
BlackRock Flexible Income ETF
Fair Value Hierarchy as of Period End
Various inputs are used in determining the fair value of financial instruments. For a description of the input levels and information about the Fund’s policy regarding valuation of financial instruments, refer to the Notes to Financial Statements.
The following table summarizes the Fund’s financial instruments categorized in the fair value hierarchy. The breakdown of the Fund’s financial instruments into major categories is disclosed in the Schedule of Investments above.
| | | | |
| | | | |
| | | | |
| | | | |
| | | | |
Collaterized Mortgage Obligations | | | | |
| | | | |
| | | | |
Floating Rate Loan Interests | | | | |
Foreign Government Obligations | | | | |
Municipal Debt Obligations | | | | |
U.S. Government Agency Obligations | | | | |
| | | | |
| | | | |
| | | | |
| | | | |
Derivative Financial Instruments(a) | | | | |
| | | | |
Foreign Currency Exchange Contracts | | | | |
| | | | |
| | | | |
Foreign Currency Exchange Contracts | | | | |
| | | | |
| | | | |
| Derivative financial instruments are swaps, futures contracts and forward foreign currency exchange contracts. Swaps, futures contracts and forward foreign currency exchange contracts are valued at the unrealized appreciation (depreciation) on the instrument. |
See notes to financial statements.
512024 BlackRock Annual Financial Statements
Schedule of InvestmentsJuly 31, 2024
BlackRock Floating Rate Loan ETF(Percentages shown are based on Net Assets)
| | |
|
Auto Parts & Equipment — 0.2% |
Clarios Global LP/Clarios U.S. Finance Co., 8.50%, 05/15/27(a) | | |
|
WR Grace Holdings LLC, 5.63%, 08/15/29(a) | | |
Commercial Services — 0.2% |
Allied Universal Holdco LLC, 7.88%, 02/15/31(a) | | |
Allied Universal Holdco LLC/Allied Universal Finance Corp., 6.63%, 07/15/26(a) | | |
Champions Financing Inc., 8.75%, 02/15/29(a) | | |
| | |
|
Amentum Escrow Corp., 7.25%, 08/01/32(a) | | |
Engineering & Construction — 0.2% |
Brand Industrial Services Inc., 10.38%, 08/01/30(a) | | |
|
Caesars Entertainment Inc., 4.63%, 10/15/29(a) | | |
Wynn Resorts Finance LLC/Wynn Resorts Capital Corp., 5.13%, 10/01/29(a) | | |
| | |
Environmental Control — 0.3% |
GFL Environmental Inc., 4.00%, 08/01/28(a) | | |
Madison IAQ LLC, 5.88%, 06/30/29(a) | | |
| | |
|
Chobani LLC/Chobani Finance Corp. Inc., 7.63%, 07/01/29(a) | | |
|
SWF Holdings I Corp., 6.50%, 10/01/29(a) | | |
|
Alliant Holdings Intermediate LLC/Alliant Holdings Co-Issuer, 6.75%, 10/15/27(a) | | |
AmWINS Group Inc., 4.88%, 06/30/29(a) | | |
| | |
|
Uber Technologies Inc., 4.50%, 08/15/29(a) | | |
|
Husky Injection Molding Systems Ltd./Titan Co-Borrower LLC, 9.00%, 02/15/29(a) | | |
Vertiv Group Corp., 4.13%, 11/15/28(a) | | |
| | |
Packaging & Containers — 0.1% |
Mauser Packaging Solutions Holding Co., 7.88%, 08/15/26(a) | | |
|
Anywhere Real Estate Group LLC/Realogy Co-Issuer Corp., 5.75%, 01/15/29(a) | | |
Real Estate Investment Trusts — 0.1% |
VICI Properties LP/VICI Note Co. Inc., 4.50%, 09/01/26(a) | | |
|
Fertitta Entertainment LLC/Fertitta Entertainment Finance Co. Inc., 6.75%, 01/15/30(a) | | |
| | |
|
IRB Holding Corp., 7.00%, 06/15/25(a) | | |
| | |
|
Entegris Inc., 4.75%, 04/15/29(a) | | |
|
AthenaHealth Group Inc., 6.50%, 02/15/30(a) | | |
Central Parent LLC/CDK Global II LLC/CDK Financing Co. Inc., 8.00%, 06/15/29(a) | | |
Cloud Software Group Inc. | | |
| | |
| | |
| | |
Telecommunications — 0.0% |
Level 3 Financing Inc., 11.00%, 11/15/29(a) | | |
Total Corporate Bonds & Notes — 3.3%
(Cost: $1,551,430) | |
Fixed Rate Loan Interests |
|
Cotiviti Inc., 2024 Fixed Term Loan B, 7.63%, 05/01/31 | | |
Total Fixed Rate Loan Interests — 0.1%
(Cost: $64,000) | |
Floating Rate Loan Interests |
|
Clear Channel Outdoor Holdings Inc., 2024 Term Loan, (1-mo. CME Term SOFR at 0.00% Floor + 4.11%), 9.46%, 08/23/28(b) | | |
Aerospace & Defense — 2.1% |
Barnes Group Inc., 2024 Term Loan, (1-mo. CME Term SOFR at 0.00% Floor + 2.50%), 7.84%, 09/03/30(b) | | |
Bleriot U.S. Bidco Inc., 2023 Term Loan B, (3-mo. CME Term SOFR at 0.00% Floor + 3.25%), 8.58%, 10/31/30(b) | | |
Cobham Ultra SeniorCo SARL, USD Term Loan B, (6-mo. CME Term SOFR at 0.50% Floor + 3.93%), 9.01%, 08/03/29(b) | | |
Dynasty Acquisition Co. Inc., 2024 Term Loan B1, (1-mo. CME Term SOFR at 0.00% Floor + 3.50%), 8.84%, 08/24/28(b) | | |
Kaman Corp., 2024 Term Loan, (3-mo. CME Term SOFR at 0.75% Floor + 3.50%), 8.83%, 04/21/31(b) | | |
Propulsion BC Newco LLC, Term Loan, 09/14/29(b)(c) | | |
Standard Aero Ltd., 2024 Term Loan B2, (1-mo. CME Term SOFR at 0.00% Floor + 3.50%), 8.84%, 08/24/28(b) | | |
| | |
2023 Term Loan J, (3-mo. CME Term SOFR at 1.00% Floor + 2.50%), 7.84%, 02/28/31(b) | | |
2024 Term Loan K, (3-mo. CME Term SOFR at 0.00% Floor + 2.75%), 8.08%, 03/22/30(b) | | |
| | |
|
AAdvantage Loyalty IP Ltd., 2021 Term Loan, (3-mo. CME Term SOFR at 0.75% Floor + 5.01%), 10.29%, 04/20/28(b) | | |
Schedule of Investments52
Schedule of Investments (continued)July 31, 2024
BlackRock Floating Rate Loan ETF(Percentages shown are based on Net Assets)
| | |
|
Air Canada, 2024 Term Loan B, (3-mo. CME Term SOFR at 0.00% Floor + 2.50%), 7.85%, 03/21/31(b) | | |
| | |
2017 1st Lien Term Loan, (3-mo. CME Term SOFR + 1.85%), 7.07%, 01/29/27(b) | | |
2023 1st Lien Term Loan, (3-mo. CME Term SOFR at 0.00% Floor + 2.50%), 7.77%, 06/04/29(b) | | |
2023 Term Loan B, (1-mo. CME Term SOFR at 0.00% Floor + 2.86%), 8.19%, 02/15/28(b) | | |
United Airlines Inc., 2024 Term Loan B, (3-mo. CME Term SOFR at 0.00% Floor + 2.75%), 8.03%, 02/22/31(b) | | |
| | |
|
ABG Intermediate Holdings 2 LLC, 2024 Term Loan B, (1-mo. CME Term SOFR at 0.00% Floor + 2.75%), 8.09%, 12/21/28 | | |
Fanatics Commerce Intermediate Holdco LLC, Term Loan B, (1-mo. CME Term SOFR + 3.36%), 8.71%, 11/24/28(b) | | |
Hanesbrands Inc., 2023 Term Loan B, (1-mo. CME Term SOFR at 0.50% Floor + 3.75%), 9.09%, 03/08/30(b) | | |
| | |
Auto Parts & Equipment — 0.6% |
Clarios Global LP, 2024 USD Term Loan B, (1-mo. CME Term SOFR at 0.00% Floor + 2.50%), 7.84%, 05/06/30 | | |
Tenneco Inc., 2022 Term Loan B, (3-mo. CME Term SOFR + 5.10%), 10.43%, 11/17/28(b) | | |
| | |
|
Ascensus Holdings Inc., Term Loan, (1-mo. CME Term SOFR at 0.50% Floor + 3.61%), 8.96%, 08/02/28(b) | | |
|
| | |
Term Loan, (3-mo. CME Term SOFR at 0.50% Floor + 3.35%), 8.68%, 01/24/29(b) | | |
2nd Lien Term Loan, (3-mo. CME Term SOFR + 6.10%), 11.43%, 01/24/30(b) | | |
Triton Water Holdings Inc., Term Loan, (3-mo. CME Term SOFR at 0.50% Floor + 3.51%), 8.85%, 03/31/28(b) | | |
| | |
Building Materials — 3.2% |
ACProducts Holdings Inc., 2021 Term Loan B, (3-mo. CME Term SOFR + 4.51%), 9.85%, 05/17/28(b) | | |
| | |
Term Loan B, (1-mo. CME Term SOFR + 3.35%), 8.69%, 11/03/28(b) | | |
2024 Incremental Term Loan B, (1-mo. CME Term SOFR + 3.50%), 8.84%, 11/03/28(b) | | |
CP Atlas Buyer Inc., 2021 Term Loan B, (1-mo. CME Term SOFR at 0.50% Floor + 3.85%), 9.19%, 11/23/27(b) | | |
CPG International LLC, 2022 Term Loan B, (1-mo. CME Term SOFR + 2.60%), 7.94%, 04/28/29(b) | | |
| | |
2024 Term Loan B, 08/04/31(c) | | |
Term Loan B, (1-mo. CME Term SOFR at 0.00% Floor + 2.50%), 7.84%, 05/31/30(b) | | |
| | |
Building Materials (continued) |
Gulfside Supply Inc., Term Loan B, (3-mo. CME Term SOFR at 0.00% Floor + 3.00%), 8.29%, 06/17/31(d) | | |
IPS Corp., 2021 Term Loan, (1-mo. CME Term SOFR + 3.50%), 8.84%, 10/02/28(b) | | |
Oscar AcquisitionCo. LLC, Term Loan B, (3-mo. CME Term SOFR + 4.25%), 9.58%, 04/29/29(b) | | |
Potters Borrower LP, 2024 Term Loan, (3-mo. CME Term SOFR at 0.75% Floor + 3.75%), 9.08%, 12/14/27(b) | | |
| | |
2024 Term Loan B1, (1-mo. CME Term SOFR + 2.25%), 7.59%, 03/19/29(b) | | |
2024 Term Loan B, (1-mo. CME Term SOFR + 2.50%), 7.84%, 04/14/31(b) | | |
Smyrna Ready Mix Concrete LLC, 2023 Term Loan, (1-mo. CME Term SOFR at 0.00% Floor + 3.50%), 8.85%, 04/02/29(b)(d) | | |
Standard Industries Inc./NJ, 2021 Term Loan B, (1-mo. CME Term SOFR at 0.50% Floor + 2.00%), 7.35%, 09/22/28(b) | | |
Summit Materials LLC, 2023 Incremental Term Loan B, (3-mo. CME Term SOFR at 0.00% Floor + 1.75%), 7.03%, 01/12/29(b) | | |
| | |
2024 Term Loan B, 07/25/31(c)(d) | | |
2021 Term Loan E, (3-mo. CME Term SOFR at 1.00% Floor + 3.35%), 8.68%, 12/31/26(b) | | |
Zurn LLC, 2021 Term Loan B, (1-mo. CME Term SOFR + 2.11%), 7.46%, 10/04/28(b) | | |
| | |
|
Arc Falcon I Inc., 2021 Term Loan, (1-mo. CME Term SOFR + 3.60%), 8.94%, 09/30/28(b) | | |
Aruba Investments Holdings LLC, 2020 USD Term Loan, (1-mo. CME Term SOFR + 4.10%), 9.44%, 11/24/27(b) | | |
Ascend Performance Materials Operations LLC, 2021 Term Loan B, (3-mo. CME Term SOFR + 4.85%), 10.07%, 08/27/26(b) | | |
Axalta Coating Systems U.S. Holdings Inc., 2024 Term Loan B6, (3-mo. CME Term SOFR at 0.50% Floor + 2.00%), 7.33%, 12/20/29(b) | | |
Chemours Co. (The), 2023 USD Term Loan B, (1-mo. CME Term SOFR + 3.50%), 8.84%, 08/18/28(b) | | |
Derby Buyer LLC, 2024 Term Loan B, (1-mo. CME Term SOFR at 0.50% Floor + 3.50%), 8.84%, 11/01/30(b) | | |
Discovery Purchaser Corp., Term Loan, 10/04/29(b)(c) | | |
ECO Services Operations Corp., 2024 Term Loan B, (3-mo. CME Term SOFR at 0.00% Floor + 2.25%), 7.50%, 06/12/31 | | |
Element Solutions Inc., 2023 Term Loan B, (1-mo. CME Term SOFR + 2.00%), 7.34%, 12/18/30(b) | | |
HB Fuller Co., 2024 Term Loan B, (1-mo. CME Term SOFR + 2.00%), 7.34%, 02/15/30(b) | | |
INEOS U.S. Finance LLC, 2023 USD Term Loan B, (1-mo. CME Term SOFR at 0.00% Floor + 3.25%), 8.59%, 02/18/30(b) | | |
Lonza Group AG, USD Term Loan B, (3-mo. CME Term SOFR + 4.03%), 9.36%, 07/03/28(b) | | |
LSF11 A5 Holdco LLC, 2024 Term Loan B, (1-mo. CME Term SOFR + 3.61%), 8.96%, 10/15/28 | | |
532024 BlackRock Annual Financial Statements
Schedule of Investments (continued)July 31, 2024
BlackRock Floating Rate Loan ETF(Percentages shown are based on Net Assets)
| | |
|
Momentive Performance Materials Inc., 2023 Term Loan, (1-mo. CME Term SOFR + 4.50%), 9.84%, 03/29/28(b) | | |
Nouryon USA LLC, 2024 USD Term Loan B, (3-mo. CME Term SOFR at 0.00% Floor + 3.50%), 8.83%, 04/03/28(b) | | |
Olympus Water U.S. Holding Corp., 2024 USD Term Loan B, (3-mo. CME Term SOFR at 0.50% Floor + 3.50%), 8.85%, 06/20/31 | | |
| | |
2017 USD Term Loan B2, (3-mo. CME Term SOFR at 0.00% Floor + 3.70%), 8.92%, 10/14/24(b) | | |
2024 Tranche B Term Loan, (1-mo. CME Term SOFR at 3.00% Floor + 8.00%), 13.35%, 06/22/25(d) | | |
SCIH Salt Holdings Inc., 2021 Incremental Term Loan B, (3-mo. CME Term SOFR + 3.50%), 8.76%, 03/16/27(b) | | |
Sparta U.S. HoldCo LLC, 2021 Term Loan, (1-mo. CME Term SOFR at 0.75% Floor + 3.25%), 8.59%, 08/02/30(b) | | |
WR Grace Holdings LLC, 2021 Term Loan B, (1-mo. CME Term SOFR + 3.25%), 8.59%, 09/22/28(b) | | |
| | |
Commercial Services — 7.6% |
Albion Financing 3 SARL, 2024 USD Term Loan B, (3-mo. CME Term SOFR at 0.50% Floor + 4.25%), 9.83%, 08/17/29 | | |
AlixPartners LLP, 2021 USD Term Loan B, (1-mo. CME Term SOFR at 0.50% Floor + 2.61%), 7.96%, 02/04/28(b) | | |
Allied Universal Holdco LLC, 2021 USD Incremental Term Loan B, (1-mo. CME Term SOFR at 0.50% Floor + 3.85%), 9.19%, 05/12/28(b) | | |
Anticimex Global AB, 2024 Term Loan B6, 11/16/28(b)(c) | | |
APi Group DE Inc., 2024 Term Loan B, 01/03/29(b)(c) | | |
Avis Budget Car Rental LLC, 2020 Term Loan B, (1-mo. CME Term SOFR + 1.86%), 7.21%, 08/06/27(b) | | |
AVSC Holding Corp., 2020 Term Loan B1, (1-mo. CME Term SOFR + 3.35%, 0.25% PIK), 8.94%, 03/03/25(b)(e) | | |
| | |
2023 USD Term Loan, (3-mo. CME Term SOFR + 2.26%), 7.51%, 04/13/28(b) | | |
2023 1st Lien Term Loan, (3-mo. CME Term SOFR + 2.35%), 7.63%, 04/18/29(b) | | |
Bright Horizons Family Solutions LLC, 2021 Term Loan B, (1-mo. CME Term SOFR at 0.50% Floor + 2.36%), 7.71%, 11/24/28(b) | | |
Camelot U.S. Acquisition LLC, 2024 Term Loan B, (1-mo. CME Term SOFR + 2.75%), 8.09%, 01/31/31(b) | | |
Champions Financing Inc., 2024 Term Loan B, (3-mo. CME Term SOFR at 0.00% Floor + 4.75%), 10.08%, 02/23/29(b) | | |
CHG Healthcare Services Inc., 2021 Term Loan, (1-mo. CME Term SOFR at 0.50% Floor + 3.36%), 8.71%, 09/29/28(b) | | |
Creative Artists Agency LLC, 2024 Term Loan B, (1-mo. CME Term SOFR at 0.00% Floor + 3.25%), 8.59%, 11/27/28(b) | | |
| | |
Commercial Services (continued) |
Element Materials Technology Group U.S. Holdings Inc., 2022 USD Term Loan, (3-mo. CME Term SOFR + 4.35%), 9.68%, 07/06/29(b) | | |
Ensemble RCM LLC, 2024 Term Loan B, (3-mo. CME Term SOFR at 0.00% Floor + 3.00%), 8.25%, 08/01/29(b) | | |
Galaxy U.S. Opco Inc., Term Loan, (3-mo. CME Term SOFR + 4.75%), 10.00%, 04/29/29(b) | | |
Garda World Security Corp. | | |
2022 Term Loan B, (3-mo. CME Term SOFR at 0.00% Floor + 4.25%), 9.59%, 02/01/29(b) | | |
2024 Term Loan B, 02/01/29(c) | | |
GTCR W Merger Sub LLC, USD Term Loan B, (3-mo. CME Term SOFR at 0.00% Floor + 3.00%), 8.33%, 01/31/31(b) | | |
| | |
2021 Term Loan B, (3-mo. CME Term SOFR + 3.51%), 8.86%, 06/30/28(b) | | |
2021 Term Loan C, (3-mo. CME Term SOFR + 3.51%), 8.86%, 06/30/28(b) | | |
KUEHG Corp., 2024 Term Loan B, (3-mo. CME Term SOFR at 0.50% Floor + 4.50%), 9.83%, 06/12/30(b) | | |
Learning Care Group U.S. No. 2 Inc., 2024 Term Loan B, (3-mo. CME Term SOFR at 0.50% Floor + 4.00%), 9.29%, 08/11/28(b) | | |
Mavis Tire Express Services Corp., 2024 Term Loan, 05/04/28(c) | | |
OMNIA Partners LLC, 2024 Term Loan B, (3-mo. CME Term SOFR at 0.00% Floor + 3.25%), 8.53%, 07/25/30(b) | | |
PECF USS Intermediate Holding III Corp., Term Loan B, (3-mo. CME Term SOFR at 0.50% Floor + 4.36%), 9.76%, 12/15/28(b) | | |
Prime Security Services Borrower LLC, 2024 Term Loan B, (1-mo. CME Term SOFR at 0.00% Floor + 2.25%), 7.58%, 10/13/30(b) | | |
Ryan LLC, Term Loan, (1-mo. CME Term SOFR at 0.50% Floor + 3.50%), 8.84%, 11/14/30(b) | | |
Sotheby's, 2021 Term Loan B, (3-mo. CME Term SOFR + 4.76%), 10.06%, 01/15/27(b) | | |
Spring Education Group Inc., Term Loan, (3-mo. CME Term SOFR at 0.00% Floor + 4.00%), 9.33%, 10/04/30(b) | | |
| | |
2024 Term Loan B8, (1-mo. CME Term SOFR at 0.00% Floor + 1.75%), 7.10%, 06/24/31 | | |
2024 Term Loan B7, (1-mo. CME Term SOFR at 0.50% Floor + 2.00%), 7.35%, 12/01/28(b) | | |
TruGreen LP, 2020 Term Loan, (1-mo. CME Term SOFR + 4.10%), 9.44%, 11/02/27(b) | | |
Vestis Corp., Term Loan, (3-mo. CME Term SOFR at 0.00% Floor + 2.25%), 7.58%, 02/22/31(b) | | |
Viad Corp., Initial Term Loan, (1-mo. CME Term SOFR + 4.25%), 9.59%, 07/30/28(b) | | |
Wand NewCo 3 Inc., 2024 1st Lien Term Loan B, (1-mo. CME Term SOFR at 0.00% Floor + 3.25%), 8.60%, 01/30/31 | | |
WEX Inc., 2024 Term Loan B, 03/31/28(b)(c) | | |
| | |
|
Amazon Holdco Inc., 2024 Term Loan B, 07/30/31(c)(d) | | |
Schedule of Investments54
Schedule of Investments (continued)July 31, 2024
BlackRock Floating Rate Loan ETF(Percentages shown are based on Net Assets)
| | |
|
Amentum Government Services Holdings LLC, 2022 Term Loan, (1-mo. CME Term SOFR + 4.00%), 9.35%, 02/15/29(b) | | |
Atlas CC Acquisition Corp. | | |
Term Loan C, (3-mo. CME Term SOFR at 0.75% Floor + 4.51%), 9.86%, 05/25/28(b) | | |
Term Loan B, (3-mo. CME Term SOFR at 0.75% Floor + 4.51%), 9.86%, 05/25/28(b) | | |
Fortress Intermediate 3 Inc., Term Loan B, (1-mo. CME Term SOFR at 0.00% Floor + 3.75%), 9.10%, 06/27/31(d) | | |
| | |
2021 USD 2nd Lien Term Loan, ((3-mo. CME Term SOFR at 0.75% Floor + 8.51%)), 13.76%, 07/27/29(b) | | |
2021 USD 1st Lien Term Loan, (3-mo. CME Term SOFR + 5.26%), 10.51%, 07/27/28(b) | | |
Maximus Inc., 2024 Term Loan B, (1-mo. CME Term SOFR + 2.00%), 7.34%, 05/30/31 | | |
McAfee Corp., 2024 USD Term Loan B, (1-mo. CME Term SOFR at 0.50% Floor + 3.25%), 8.59%, 07/27/29(b)(f)(g) | | |
| | |
Term Loan B, (1-mo. CME Term SOFR at 0.75% Floor + 3.85%), 9.19%, 02/01/28(b) | | |
2nd Lien Term Loan B1, (3-mo. CME Term SOFR + 7.85%), 13.18%, 02/01/29(b) | | |
Tempo Acquisition LLC, 2024 Term Loan B, (1-mo. CME Term SOFR + 2.25%), 7.59%, 08/31/28 | | |
| | |
Distribution & Wholesale — 1.2% |
American Builders & Contractors Supply Co. Inc., 2024 Term Loan B, (1-mo. CME Term SOFR at 0.00% Floor + 2.00%), 7.34%, 01/31/31(b) | | |
| | |
2024 Term Loan B, (3-mo. CME Term SOFR at 0.00% Floor + 2.00%), 7.34%, 07/27/28(b) | | |
2024 Incremental Term Loan B, (3-mo. CME Term SOFR at 0.00% Floor + 2.25%), 7.59%, 02/09/31(b) | | |
Dealer Tire Financial LLC, 2024 Term Loan B, (1-mo. CME Term SOFR at 0.00% Floor + 3.50%), 8.84%, 07/02/31 | | |
PAI Holdco Inc., 2020 Term Loan B, (3-mo. CME Term SOFR at 0.75% Floor + 4.01%), 9.26%, 10/28/27(b) | | |
| | |
Diversified Financial Services — 2.6% |
Aretec Group Inc., 2024 Term Loan B, (1-mo. CME Term SOFR at 0.00% Floor + 4.00%), 9.34%, 08/09/30(b) | | |
Castlelake Aviation Ltd., Term Loan B, (3-mo. CME Term SOFR at 0.00% Floor + 2.50%), 7.84%, 10/22/26(b) | | |
CPI Holdco B LLC, Term Loan, (1-mo. CME Term SOFR + 2.00%), 7.34%, 05/19/31(b) | | |
Deerfield Dakota Holding LLC | | |
2020 USD Term Loan B, (3-mo. CME Term SOFR at 1.00% Floor + 3.75%), 9.08%, 04/09/27(b) | | |
2021 USD 2nd Lien Term Loan, (3-mo. CME Term SOFR + 7.01%), 12.35%, 04/07/28(b) | | |
Edelman Financial Engines Center LLC (The), 2024 Term Loan B, 04/07/28(c) | | |
| | |
Diversified Financial Services (continued) |
Fleetcor Technologies Operating Co. LLC, 2021 Term Loan B4, (1-mo. CME Term SOFR at 0.00% Floor + 1.85%), 7.19%, 04/28/28(b) | | |
Focus Financial Partners LLC | | |
2021 Term Loan B4, (1-mo. CME Term SOFR at 0.50% Floor + 2.50%), 7.84%, 06/30/28(b) | | |
2024 Term Loan B7, (1-mo. CME Term SOFR at 0.50% Floor + 2.75%), 8.09%, 06/30/28(b) | | |
Grant Thornton Advisors LLC, Term Loan B, (3-mo. CME Term SOFR at 0.00% Floor + 3.25%), 8.60%, 06/02/31 | | |
Hamilton Projects Acquiror LLC, 2024 Term Loan B, (3-mo. CME Term SOFR at 0.50% Floor + 3.75%), 9.09%, 05/22/31 | | |
Osaic Holdings Inc., 2024 Term Loan, (1-mo. CME Term SOFR at 0.00% Floor + 4.00%), 9.34%, 08/17/28(b) | | |
Peer Holding III BV, 2024 USD Term Loan B5, 06/20/31(c) | | |
Setanta Aircraft Leasing DAC, 2024 Term Loan B, (3-mo. CME Term SOFR at 0.00% Floor + 1.75%), 7.08%, 11/05/28(b) | | |
| | |
|
Calpine Construction Finance Co. LP, 2023 Refinancing Term Loan B, (1-mo. CME Term SOFR at 0.00% Floor + 2.00%), 7.34%, 07/31/30(b) | | |
Calpine Corp., Term Loan B9, (1-mo. CME Term SOFR at 0.00% Floor + 2.00%), 7.34%, 01/31/31(b) | | |
ExGen Renewables IV LLC, 2020 Term Loan, (3-mo. CME Term SOFR + 2.76%), 8.11%, 12/15/27(b) | | |
NRG Energy Inc., 2024 Term Loan, (3-mo. CME Term SOFR at 0.00% Floor + 2.00%), 7.26%, 04/16/31(b) | | |
Pike Corp., 2021 Incremental Term Loan B, (1-mo. CME Term SOFR + 3.11%), 8.46%, 01/21/28(b) | | |
| | |
Electrical Components & Equipment — 0.2% |
Energizer Holdings Inc., 2024 Term Loan B, (1-mo. CME Term SOFR at 0.00% Floor + 2.00%), 7.35%, 12/22/27(b) | | |
Generac Power Systems Inc., 2024 Term Loan B, (3-mo. CME Term SOFR at 0.00% Floor + 1.75%), 7.08%, 06/12/31 | | |
| | |
|
Celestica Inc., 2024 Term Loan B, (1-mo. CME Term SOFR at 0.00% Floor + 1.75%), 7.10%, 06/20/31(d) | | |
Coherent Corp., 2024 Term Loan B, (1-mo. CME Term SOFR at 0.50% Floor + 2.50%), 7.84%, 07/02/29(b) | | |
MX Holdings U.S. Inc., 2023 USD Term Loan B1D, (1-mo. CME Term SOFR at 0.75% Floor + 2.86%), 8.21%, 07/31/28(b) | | |
Roper Industrial Products Investment Co. LLC, 2024 USD Term Loan B, (1-mo. CME Term SOFR at 0.50% Floor + 3.25%), 8.58%, 11/22/29 | | |
| | |
Engineering & Construction — 1.9% |
AECOM, 2024 Term Loan B, (1-mo. CME Term SOFR + 1.88%), 7.22%, 04/18/31(b) | | |
552024 BlackRock Annual Financial Statements
Schedule of Investments (continued)July 31, 2024
BlackRock Floating Rate Loan ETF(Percentages shown are based on Net Assets)
| | |
Engineering & Construction (continued) |
| | |
2022 Incremental Term Loan, (1-mo. CME Term SOFR at 0.50% Floor + 3.50%), 8.84%, 09/22/28(b) | | |
2021 Term Loan, (1-mo. CME Term SOFR + 2.86%), 8.21%, 09/22/28(b) | | |
Brand Industrial Services Inc., 2024 Term Loan B, (3-mo. CME Term SOFR at 0.50% Floor + 4.50%), 9.83%, 08/01/30(b) | | |
| | |
2022 Incremental Term Loan B2, 07/01/31(b)(c) | | |
Term Loan B, 07/01/31(b)(c) | | |
Legence Holdings LLC, 2021 Term Loan, (1-mo. CME Term SOFR at 0.75% Floor + 3.60%), 8.94%, 12/16/27(b) | | |
USIC Holdings Inc., 2021 Term Loan, (3-mo. CME Term SOFR + 3.76%), 9.09%, 05/12/28(b) | | |
| | |
|
Bally's Corp., 2021 Term Loan B, (3-mo. CME Term SOFR at 0.50% Floor + 3.51%), 8.79%, 10/02/28(b) | | |
Caesars Entertainment Inc. | | |
2024 Term Loan B1, (3-mo. CME Term SOFR at 0.50% Floor + 2.75%), 8.10%, 02/06/31(b) | | |
Term Loan B, (3-mo. CME Term SOFR at 0.50% Floor + 2.75%), 8.10%, 02/06/30(b) | | |
Churchill Downs Inc., 2021 Incremental Term Loan B1, (1-mo. CME Term SOFR at 0.00% Floor + 2.10%), 7.44%, 03/17/28(b) | | |
Delta 2 Lux SARL, 2022 Term Loan B, (3-mo. CME Term SOFR at 0.50% Floor + 2.25%), 7.58%, 01/15/30(b) | | |
ECL Entertainment LLC, 2024 Term Loan B, (1-mo. CME Term SOFR + 4.00%), 9.34%, 08/31/30(b) | | |
Flutter Financing BV, Term Loan B, (3-mo. CME Term SOFR + 2.25%), 7.58%, 11/29/30(b) | | |
Herschend Entertainment Co. LLC, 2021 Term Loan, (1-mo. CME Term SOFR + 3.00%), 8.34%, 08/27/28(b) | | |
Light & Wonder International Inc., 2024 Term Loan B2, (1-mo. CME Term SOFR at 0.50% Floor + 2.25%), 7.58%, 04/14/29(d) | | |
Lions Gate Capital Holdings LLC, 2018 Term Loan B, (1-mo. CME Term SOFR + 2.35%), 7.69%, 03/24/25(b) | | |
Live Nation Entertainment Inc., Term Loan B4, (1-mo. CME Term SOFR at 0.00% Floor + 1.85%), 7.20%, 10/19/26(b) | | |
Motion Finco SARL, 2024 USD Term Loan B, (3-mo. CME Term SOFR at 0.00% Floor + 3.50%), 8.83%, 11/12/29(b) | | |
OVG Business Services LLC, 2024 Term Loan B, (1-mo. CME Term SOFR + 3.00%), 8.34%, 06/25/31 | | |
Penn Entertainment Inc., 2022 Term Loan B, (1-mo. CME Term SOFR at 0.50% Floor + 2.85%), 8.19%, 05/03/29(b) | | |
Scientific Games Holdings LP, 2024 USD Term Loan B, (3-mo. CME Term SOFR at 0.50% Floor + 3.00%), 8.32%, 04/04/29 | | |
SeaWorld Parks & Entertainment Inc., 2024 Term Loan B, (1-mo. CME Term SOFR + 2.50%), 7.84%, 08/25/28(b) | | |
| | |
Entertainment (continued) |
Six Flags Entertainment Corp., 2024 Term Loan B, (1-mo. CME Term SOFR at 0.00% Floor + 2.00%), 7.34%, 05/01/31(b)(d) | | |
SMG U.S. Midco 2 Inc., 2020 Term Loan, (3-mo. CME Term SOFR at 0.00% Floor + 2.76%), 8.01%, 01/23/25(b) | | |
UFC Holdings LLC, 2021 Term Loan B, (3-mo. CME Term SOFR + 3.01%), 8.29%, 04/29/26(b) | | |
William Morris Endeavor Entertainment LLC, 2018 1st Lien Term Loan, (1-mo. CME Term SOFR + 2.86%), 8.21%, 05/18/25(b) | | |
WMG Acquisition Corp., 2024 Term Loan I, (1-mo. CME Term SOFR + 2.00%), 7.34%, 01/24/31(b) | | |
| | |
Environmental Control — 1.5% |
Clean Harbors Inc., 2023 Term Loan, (1-mo. CME Term SOFR + 1.86%), 7.21%, 10/08/28(b) | | |
| | |
2021 Term Loan B, (1-mo. CME Term SOFR at 0.50% Floor + 2.50%), 7.59%, 11/30/28(b) | | |
2021 Term Loan C, (6-mo. CME Term SOFR at 0.50% Floor + 2.50%), 7.59%, 11/30/28(b) | | |
2024 Term Loan B, (1-mo. CME Term SOFR at 0.50% Floor + 2.75%), 8.08%, 11/30/28(b) | | |
2024 Term Loan C, (1-mo. CME Term SOFR at 0.50% Floor + 2.75%), 8.08%, 11/30/28(b) | | |
Filtration Group Corp., 2021 Incremental Term Loan, (1-mo. CME Term SOFR at 0.50% Floor + 3.61%), 8.96%, 10/21/28(b) | | |
GFL Environmental Inc., 2024 Term Loan B, (3-mo. CME Term SOFR at 0.50% Floor + 2.00%), 7.32%, 06/27/31 | | |
JFL-Tiger Acquisition Co. Inc., Term Loan B, (3-mo. CME Term SOFR at 0.50% Floor + 4.50%), 9.83%, 10/17/30(b) | | |
Madison IAQ LLC, Term Loan, (6-mo. CME Term SOFR at 0.50% Floor + 2.75%), 7.89%, 06/21/28(b) | | |
Packers Holdings LLC, 2021 Term Loan, (1-mo. CME Term SOFR at 0.75% Floor + 3.35%), 8.70%, 03/09/28(b) | | |
The Action Environmental Group Inc. (The), 2023 Term Loan B, (3-mo. CME Term SOFR at 0.50% Floor + 4.50%), 9.33%, 10/24/30(b)(d) | | |
| | |
|
8th Avenue Food & Provisions Inc., 2018 1st Lien Term Loan, (1-mo. CME Term SOFR + 3.86%), 9.21%, 10/01/25(b) | | |
| | |
2023 Incremental Term Loan, (1-mo. CME Term SOFR at 0.00% Floor + 3.75%), 9.08%, 10/25/27(b) | | |
2020 Term Loan B, (1-mo. CME Term SOFR at 1.00% Floor + 3.36%), 8.71%, 10/25/27(b) | | |
Froneri International Ltd., 2020 USD Term Loan, (1-mo. CME Term SOFR at 0.00% Floor + 2.35%), 7.69%, 01/29/27(b) | | |
H-Food Holdings LLC, 2018 Term Loan B, (3-mo. CME Term SOFR + 3.95%), 9.30%, 05/23/25(b) | | |
Schedule of Investments56
Schedule of Investments (continued)July 31, 2024
BlackRock Floating Rate Loan ETF(Percentages shown are based on Net Assets)
| | |
|
Nomad Foods U.S. LLC, Term Loan B4, (3-mo. CME Term SOFR at 0.50% Floor + 2.50%), 7.81%, 11/12/29(b) | | |
| | |
2021 Term Loan B, (1-mo. CME Term SOFR + 2.00%), 7.34%, 11/22/28(b) | | |
2019 Term Loan B, (1-mo. CME Term SOFR at 0.00% Floor + 2.11%), 7.46%, 09/13/26(b) | | |
UTZ Quality Foods LLC, 2024 Term Loan B, (1-mo. CME Term SOFR + 2.75%), 8.09%, 01/20/28(b) | | |
| | |
|
| | |
2024 Term Loan B8, (1-mo. CME Term SOFR at 0.00% Floor + 2.00%), 7.34%, 06/22/30(b) | | |
2024 Term Loan B7, (1-mo. CME Term SOFR + 2.00%), 7.34%, 04/06/28(b) | | |
| | |
Forest Products & Paper — 0.2% |
Asplundh Tree Expert LLC, 2021 Term Loan B, (1-mo. CME Term SOFR at 0.00% Floor + 1.85%), 7.19%, 09/07/27(b) | | |
Health Care - Products — 2.5% |
Avantor Funding Inc., 2024 Term Loan, (1-mo. CME Term SOFR at 0.50% Floor + 2.10%), 7.44%, 11/08/27(b) | | |
| | |
Term Loan, (1-mo. CME Term SOFR at 0.50% Floor + 3.35%), 8.70%, 05/10/27(b) | | |
2023 Incremental Term Loan, (1-mo. CME Term SOFR at 0.00% Floor + 4.00%), 9.34%, 09/29/28(b) | | |
Insulet Corp., 2024 Term Loan B, (1-mo. CME Term SOFR + 3.00%), 8.34%, 05/04/28(b) | | |
Maravai Intermediate Holdings LLC, 2022 Term Loan B, (3-mo. CME Term SOFR at 0.50% Floor + 3.00%), 8.28%, 10/19/27(b) | | |
| | |
2024 Term Loan B, (1-mo. CME Term SOFR at 0.50% Floor + 2.50%), 8.09%, 10/23/28(b) | | |
2024 USD Add-on Term Loan B, (1-mo. CME Term SOFR at 0.50% Floor + 2.25%), 7.59%, 10/23/28 | | |
Reverb Buyer Inc., 2021 1st Lien Term Loan, (3-mo. CME Term SOFR at 0.50% Floor + 3.35%), 8.60%, 11/01/28(b) | | |
Sotera Health Holdings LLC, 2024 Term Loan B, (1-mo. CME Term SOFR at 0.00% Floor + 3.25%), 8.59%, 05/30/31 | | |
| | |
Health Care - Services — 2.1% |
Catalent Pharma Solutions Inc., 2021 Term Loan B3, (1-mo. CME Term SOFR + 2.11%), 7.46%, 02/22/28(b) | | |
Concentra Health Services Inc., Term Loan B, 07/28/31(c)(d) | | |
Examworks Bidco Inc., 2021 Term Loan, (1-mo. CME Term SOFR at 0.50% Floor + 3.11%), 8.46%, 11/01/28(b) | | |
| | |
Health Care - Services (continued) |
Fortrea Holdings Inc., Term Loan B, (1-mo. CME Term SOFR + 3.75%), 9.09%, 07/01/30(b) | | |
| | |
2024 LUX Term Loan B, (3-mo. CME Term SOFR at 0.50% Floor + 2.00%), 7.33%, 07/03/28(b) | | |
2024 US Term Loan B, (3-mo. CME Term SOFR at 0.50% Floor + 2.00%), 7.33%, 07/03/28(b) | | |
IQVIA Inc., 2023 USD Term Loan B4, (3-mo. CME Term SOFR at 0.00% Floor + 2.00%), 7.33%, 01/02/31(b) | | |
Parexel International Corp., 2024 Term Loan B, (1-mo. CME Term SOFR at 0.50% Floor + 3.00%), 8.34%, 11/15/28 | | |
Precision Medicine Group LLC, 2021 Term Loan, (3-mo. CME Term SOFR at 0.75% Floor + 3.10%), 8.43%, 11/18/27(b) | | |
Star Parent Inc., Term Loan B, (3-mo. CME Term SOFR at 0.00% Floor + 3.75%), 9.08%, 09/27/30(b) | | |
Surgery Center Holdings Inc., 2024 Term Loan B, (1-mo. CME Term SOFR at 0.00% Floor + 2.75%), 8.10%, 12/19/30 | | |
Vizient Inc., 2024 Term Loan B, 08/01/31(c)(d) | | |
WCG Intermediate Corp., 2024 Term Loan, (1-mo. CME Term SOFR + 3.50%), 8.84%, 01/08/27 | | |
| | |
Holding Companies - Diversified — 0.2% |
Wec U.S. Holdings Ltd., 2024 Term Loan, (1-mo. CME Term SOFR at 0.00% Floor + 2.75%), 8.09%, 01/27/31(b) | | |
|
AI Aqua Merger Sub Inc., 2021 1st Lien Term Loan B, (1-mo. CME Term SOFR at 0.50% Floor + 4.25%), 8.97%, 07/31/28(b) | | |
Weber-Stephen Products LLC, Term Loan B, (1-mo. CME Term SOFR at 0.75% Floor + 3.36%), 8.71%, 10/30/27(b) | | |
| | |
|
Hunter Douglas Inc., USD Term Loan B1, (3-mo. CME Term SOFR + 3.50%), 8.84%, 02/26/29(b) | | |
Restoration Hardware Inc. | | |
Term Loan B, (1-mo. CME Term SOFR at 0.50% Floor + 2.61%), 7.96%, 10/20/28(b) | | |
2022 Incremental Term Loan, (1-mo. CME Term SOFR at 0.50% Floor + 3.35%), 8.69%, 10/20/28(b) | | |
Springs Windows Fashions LLC, 2021 Term Loan B, (1-mo. CME Term SOFR at 0.75% Floor + 4.11%), 9.46%, 10/06/28(b) | | |
| | |
|
Alliant Holdings Intermediate LLC, 2023 Term Loan B6, (1-mo. CME Term SOFR at 0.50% Floor + 3.50%), 8.85%, 11/06/30(b) | | |
AmWINS Group Inc., 2021 Term Loan B, (1-mo. CME Term SOFR + 2.36%), 7.71%, 02/19/28(b) | | |
Amynta Agency Borrower Inc., 2024 Term Loan B, (3-mo. CME Term SOFR at 0.00% Floor + 3.75%), 9.00%, 02/28/28(b) | | |
572024 BlackRock Annual Financial Statements
Schedule of Investments (continued)July 31, 2024
BlackRock Floating Rate Loan ETF(Percentages shown are based on Net Assets)
| | |
|
AssuredPartners Inc., 2024 Incremental Term Loan B5, (1-mo. CME Term SOFR at 0.50% Floor + 3.50%), 8.84%, 02/14/31(b) | | |
| | |
2020 Term Loan B8, (1-mo. CME Term SOFR at 0.00% Floor + 3.36%), 8.71%, 12/23/26(b) | | |
2021 Term Loan B9, (1-mo. CME Term SOFR at 0.00% Floor + 3.36%), 8.71%, 07/31/27(b) | | |
2023 Term Loan B11, (1-mo. CME Term SOFR at 0.00% Floor + 4.35%), 9.59%, 08/19/28(b) | | |
2021 2nd Lien Term Loan B3, (1-mo. CME Term SOFR + 5.36%), 10.71%, 01/31/28(b) | | |
2021 Second Lien Term Loan B4, (1-mo. CME Term SOFR + 5.36%), 10.71%, 01/20/29(b) | | |
Baldwin Insurance Group Holdings LLC (The), 2024 Term Loan B, (1-mo. CME Term SOFR + 3.25%), 8.59%, 05/26/31(b)(d) | | |
HUB International Ltd., 2024 Term Loan B, (3-mo. CME Term SOFR at 0.75% Floor + 3.25%), 8.53%, 06/20/30(b) | | |
Hyperion Refinance SARL, 2024 USD Term Loan B, (1-mo. CME Term SOFR at 0.50% Floor + 3.50%), 8.84%, 02/15/31(b) | | |
Jones DesLauriers Insurance Management Inc., 2024 Term Loan B, (3-mo. CME Term SOFR + 3.50%), 8.75%, 03/15/30(b) | | |
Ryan Specialty Group LLC, Term Loan, (1-mo. CME Term SOFR at 0.75% Floor + 2.75%), 8.09%, 09/01/27(b) | | |
Sedgwick Claims Management Services Inc., 2023 Term Loan B, (3-mo. CME Term SOFR at 0.00% Floor + 3.00%), 8.25%, 07/31/31(b) | | |
Truist Insurance Holdings LLC | | |
1st Lien Term Loan, (3-mo. CME Term SOFR at 0.00% Floor + 3.25%), 8.58%, 05/06/31(b) | | |
2nd Lien Term Loan, (3-mo. CME Term SOFR at 0.00% Floor + 4.75%), 10.08%, 05/06/32 | | |
| | |
2024 Term Loan (2030), (3-mo. CME Term SOFR at 0.00% Floor + 2.75%), 8.08%, 09/27/30(b) | | |
2024 Term Loan (2029), (3-mo. CME Term SOFR at 0.00% Floor + 2.75%), 8.08%, 11/22/29(b) | | |
| | |
|
Barracuda Networks Inc., 2022 Term Loan, (3-mo. CME Term SOFR at 0.50% Floor + 4.50%), 9.81%, 08/15/29(b) | | |
CNT Holdings I Corp., 2020 Term Loan, (3-mo. CME Term SOFR + 3.50%), 8.75%, 11/08/27(b) | | |
Gen Digital Inc., 2024 Term Loan B, (1-mo. CME Term SOFR + 1.75%), 7.09%, 09/12/29 | | |
Go Daddy Operating Co. LLC | | |
2024 Term Loan B7, (1-mo. CME Term SOFR + 1.75%), 7.09%, 05/30/31(b) | | |
2024 Term Loan B6, (1-mo. CME Term SOFR at 0.00% Floor + 2.00%), 7.34%, 11/09/29(b) | | |
I-Logic Technologies Bidco Ltd., 2021 USD Term Loan B, (3-mo. CME Term SOFR + 4.15%), 9.48%, 02/16/28(b) | | |
| | |
|
ION Trading Finance Ltd., 2024 Term Loan, (3-mo. CME Term SOFR at 0.00% Floor + 4.00%), 9.35%, 04/01/28 | | |
| | |
2023 Term Loan, (1-mo. CME Term SOFR at 0.50% Floor + 4.25%), 9.59%, 05/03/28(b) | | |
2021 2nd Lien Term Loan, (3-mo. CME Term SOFR + 6.25%), 11.50%, 02/23/29(b) | | |
Proofpoint Inc., 2024 Term Loan, (1-mo. CME Term SOFR at 0.50% Floor + 3.00%), 8.34%, 08/31/28(b) | | |
StubHub Holdco Sub LLC, 2024 Extended Term Loan B, (1-mo. CME Term SOFR + 4.75%), 10.09%, 03/15/30(b) | | |
Uber Technologies Inc., 2023 Term Loan B, (3-mo. CME Term SOFR at 0.00% Floor + 2.75%), 8.09%, 03/03/30(b) | | |
Voyage Australia Pty. Ltd., USD Term Loan B, (3-mo. CME Term SOFR + 3.76%), 9.04%, 07/20/28(b) | | |
| | |
|
Alterra Mountain Co., 2024 Term Loan B5, (1-mo. CME Term SOFR + 3.50%), 8.84%, 05/31/30(b) | | |
Carnival Corp., 2024 Term Loan B2, (1-mo. CME Term SOFR at 0.75% Floor + 2.75%), 8.09%, 08/08/27(b) | | |
City Football Group Ltd., 2024 Term Loan, (3-mo. CME Term SOFR at 0.50% Floor + 3.11%), 8.46%, 07/22/30(d) | | |
Hayward Industries Inc., 2021 Term Loan, (1-mo. CME Term SOFR + 2.61%), 7.96%, 05/30/28(b) | | |
| | |
2021 Term Loan B2, (1-mo. CME Term SOFR at 0.50% Floor + 3.61%), 8.96%, 12/17/27(b) | | |
2021 Term Loan B1, (1-mo. CME Term SOFR at 0.50% Floor + 3.61%), 8.96%, 12/17/27(b) | | |
Whatabrands LLC, 2024 Term Loan B, (1-mo. CME Term SOFR at 0.50% Floor + 2.75%), 8.09%, 08/03/28(b) | | |
| | |
|
Aimbridge Acquisition Co. Inc., 2019 Term Loan B, (1-mo. CME Term SOFR at 0.00% Floor + 3.86%), 9.21%, 02/02/26(b) | | |
Fertitta Entertainment LLC, 2022 Term Loan B, (1-mo. CME Term SOFR + 3.75%), 9.08%, 01/27/29(b) | | |
Four Seasons Hotels Ltd., 2024 Term Loan B, (1-mo. CME Term SOFR at 0.50% Floor + 2.00%), 7.34%, 11/30/29(b) | | |
Hilton Domestic Operating Co. Inc., 2023 Term Loan B4, (1-mo. CME Term SOFR at 0.00% Floor + 1.75%), 7.10%, 11/08/30(b) | | |
Playa Resorts Holding BV, 2022 Term Loan B, (3-mo. CME Term SOFR at 0.50% Floor + 2.75%), 8.09%, 01/05/29(b) | | |
Station Casinos LLC, 2024 Term Loan B, (1-mo. CME Term SOFR at 0.00% Floor + 2.25%), 7.59%, 03/14/31(b) | | |
Wyndham Hotels & Resorts Inc., 2024 Term Loan, (1-mo. CME Term SOFR at 0.00% Floor + 1.75%), 7.09%, 05/24/30(b) | | |
| | |
Schedule of Investments58
Schedule of Investments (continued)July 31, 2024
BlackRock Floating Rate Loan ETF(Percentages shown are based on Net Assets)
| | |
|
Arcline FM Holdings LLC, 2021 1st Lien Term Loan, (3-mo. CME Term SOFR at 0.75% Floor + 4.75%), 10.35%, 06/23/28(b) | | |
Columbus McKinnon Corp., 2024 Term Loan, 05/14/28(b)(c) | | |
Titan Acquisition Ltd./Canada, 2024 Term Loan B, (6-mo. CME Term SOFR at 0.00% Floor + 5.00%), 10.33%, 02/15/29(b) | | |
TK Elevator U.S. Newco Inc., USD Term Loan B, (6-mo. CME Term SOFR at 0.50% Floor + 3.50%), 8.59%, 04/30/30(b) | | |
Vertiv Group Corp., 2024 Term Loan B2, (1-mo. CME Term SOFR at 0.00% Floor + 2.00%), 7.34%, 03/02/27 | | |
| | |
Machinery - Diversified — 0.4% |
Arcline FM Holdings LLC, 2024 Term Loan, 06/23/28(c) | | |
SPX FLOW Inc., 2024 Term Loan B, (1-mo. CME Term SOFR at 0.50% Floor + 3.50%), 8.84%, 04/05/29 | | |
| | |
Machinery- Construction & Mining — 0.0% |
Clark Equipment Co., 2024 Term Loan, (3-mo. CME Term SOFR at 0.00% Floor + 2.00%), 7.32%, 04/20/29 | | |
|
Gates Global LLC, 2024 Term Loan B5, 06/04/31(c) | | |
|
A-L Parent LLC, 2023 Take Back Term Loan, (1-mo. CME Term SOFR + 5.50%), 10.84%, 06/30/28(b) | | |
Altice Financing SA, USD 2017 1st Lien Term Loan, (3-mo. LIBOR US at 0.00% Floor + 2.75%), 8.31%, 01/31/26(b)(d) | | |
Charter Communications Operating LLC, 2023 Term Loan B4, (3-mo. CME Term SOFR at 0.00% Floor + 2.00%), 7.33%, 12/07/30(b) | | |
COGECO Financing 2 LP, 2023 Incremental Term Loan B, (1-mo. CME Term SOFR + 2.61%), 7.96%, 09/01/28(b) | | |
CSC Holdings LLC, 2019 Term Loan B5, (1-mo. LIBOR US at 0.00% Floor + 2.50%), 7.94%, 04/15/27(b) | | |
DirecTV Financing LLC, Term Loan, (1-mo. CME Term SOFR at 0.75% Floor + 5.11%), 10.46%, 08/02/27(b) | | |
Gray Television Inc., 2024 Term Loan B, (1-mo. CME Term SOFR at 0.00% Floor + 5.25%), 10.59%, 06/04/29 | | |
NEP Group Inc., 2023 Term Loan B, (1-mo. CME Term SOFR + 3.25%, 1.50% PIK), 10.21%, 08/19/26(b)(e) | | |
Radiate Holdco LLC, 2021 Term Loan B, (1-mo. CME Term SOFR at 0.75% Floor + 3.36%), 8.71%, 09/25/26(b) | | |
Sinclair Television Group Inc., 2022 Term Loan B4, (1-mo. CME Term SOFR + 3.85%), 9.19%, 04/21/29(b) | | |
Sunrise Financing Partnership, 2021 USD Term Loan AX, (1-mo. CME Term SOFR + 3.11%), 8.44%, 01/31/29(b) | | |
Virgin Media Bristol LLC, 2020 USD Term Loan Q, (1-mo. CME Term SOFR + 3.36%), 8.69%, 01/31/29(b) | | |
| | |
|
Ziggo Financing Partnership, USD Term Loan I, (1-mo. CME Term SOFR + 2.61%), 7.94%, 04/30/28(b) | | |
| | |
Metal Fabricate & Hardware — 0.0% |
AZZ Inc., Term Loan B, (1-mo. CME Term SOFR at 0.50% Floor + 3.25%), 8.59%, 05/13/29(b) | | |
|
NGP XI Midstream Holdings LLC, Term Loan B, 07/25/31(c)(d) | | |
Packaging & Containers — 0.9% |
Charter Next Generation Inc., 2024 Term Loan B, (1-mo. CME Term SOFR at 0.75% Floor + 3.25%), 8.60%, 12/01/27(b) | | |
LABL Inc., 2021 USD 1st Lien Term Loan, (1-mo. CME Term SOFR at 0.50% Floor + 5.10%), 10.45%, 10/29/28(b) | | |
Mauser Packaging Solutions Holding Co., 2024 Term Loan B, (1-mo. CME Term SOFR at 0.00% Floor + 3.50%), 8.84%, 04/15/27(b) | | |
Pregis TopCo Corp., 1st Lien Term Loan, (1-mo. CME Term SOFR at 0.00% Floor + 4.00%), 9.34%, 07/31/26(b)(h) | | |
Trident TPI Holdings Inc., 2024 Term Loan B6, (3-mo. CME Term SOFR at 0.50% Floor + 4.00%), 9.33%, 09/15/28(b) | | |
| | |
|
Amneal Pharmaceuticals LLC, 2023 Term Loan B, (1-mo. CME Term SOFR at 0.00% Floor + 5.50%), 10.84%, 05/04/28(b) | | |
Bausch Health Americas Inc., 2022 Term Loan B, (1-mo. CME Term SOFR + 5.35%), 10.69%, 02/01/27(b) | | |
Elanco Animal Health Inc., Term Loan B, (1-mo. CME Term SOFR + 1.85%), 7.19%, 08/01/27(b) | | |
Gainwell Acquisition Corp., Term Loan B, (3-mo. CME Term SOFR + 4.10%), 9.43%, 10/01/27(b)(d) | | |
Jazz Financing Lux SARL, 2024 1st Lien Term Loan B, (1-mo. CME Term SOFR at 0.50% Floor + 2.25%), 7.59%, 05/05/28 | | |
Option Care Health Inc., 2021 Term Loan B, (1-mo. CME Term SOFR + 2.25%), 7.59%, 10/27/28(b) | | |
Organon & Co., 2024 USD Term Loan B, (1-mo. CME Term SOFR at 0.50% Floor + 2.50%), 7.83%, 05/19/31(b) | | |
Perrigo Investments LLC, Term Loan B, (1-mo. CME Term SOFR at 0.50% Floor + 2.35%), 7.69%, 04/20/29(b)(d) | | |
| | |
|
Buckeye Partners LP, 2024 Term Loan B2, 11/22/30(b)(c) | | |
Freeport LNG Investments LLLP, Term Loan B, (3-mo. CME Term SOFR + 3.50%), 9.04%, 12/21/28(b) | | |
GIP Pilot Acquisition Partners LP, 2024 Term Loan B, (3-mo. CME Term SOFR at 0.00% Floor + 2.50%), 7.82%, 10/04/30(b) | | |
Medallion Midland Acquisition LLC, 2023 Term Loan, (3-mo. CME Term SOFR at 0.00% Floor + 3.50%), 8.84%, 10/18/28(b) | | |
592024 BlackRock Annual Financial Statements
Schedule of Investments (continued)July 31, 2024
BlackRock Floating Rate Loan ETF(Percentages shown are based on Net Assets)
| | |
|
New Fortress Energy Inc., Term Loan, (3-mo. CME Term SOFR at 0.75% Floor + 5.00%), 10.25%, 10/27/28(b) | | |
NGL Energy Partners LP, 2024 Term Loan B, 02/02/31(b)(c) | | |
Oryx Midstream Services Permian Basin LLC, 2024 Term Loan B, (1-mo. CME Term SOFR at 0.50% Floor + 3.11%), 8.44%, 10/05/28(b) | | |
| | |
|
CoreLogic Inc., Term Loan, (1-mo. CME Term SOFR at 0.50% Floor + 3.61%), 8.96%, 06/02/28(b) | | |
Cushman & Wakefield U.S. Borrower LLC | | |
2020 Term Loan B, (1-mo. CME Term SOFR at 0.00% Floor + 2.86%), 8.21%, 08/21/25(b) | | |
2024 Term Loan B, (1-mo. CME Term SOFR at 0.50% Floor + 3.00%), 8.34%, 01/31/30(d) | | |
2024 Term Loan, (1-mo. CME Term SOFR at 0.50% Floor + 3.75%), 9.09%, 01/31/30(b)(d) | | |
| | |
Real Estate Investment Trusts — 0.2% |
RHP Hotel Properties LP, 2024 Term Loan B, (1-mo. CME Term SOFR at 0.00% Floor + 2.25%), 7.59%, 05/18/30(b) | | |
|
1011778 BC Unlimited Liability Co., 2024 Term Loan B6, (1-mo. CME Term SOFR at 0.00% Floor + 1.75%), 7.09%, 09/20/30 | | |
Beacon Roofing Supply Inc., 2024 Term Loan B, (1-mo. CME Term SOFR at 0.00% Floor + 2.00%), 7.34%, 05/19/28(b) | | |
Foundation Building Materials Holding Co. LLC, 2024 Term Loan B2, (1-mo. CME Term SOFR at 0.00% Floor + 4.00%), 9.25%, 01/29/31(b) | | |
IRB Holding Corp., 2024 Term Loan B, (1-mo. CME Term SOFR at 0.75% Floor + 2.85%), 8.19%, 12/15/27(b) | | |
LBM Acquisition LLC, Term Loan B, (1-mo. CME Term SOFR + 3.85%), 9.19%, 12/17/27(b) | | |
Leslie's Poolmart Inc., 2021 Term Loan B, (1-mo. CME Term SOFR + 2.86%), 8.21%, 03/09/28(b) | | |
LS Group OpCo. Acquistion LLC, 2024 Term Loan B, (1-mo. CME Term SOFR at 0.00% Floor + 3.00%), 8.34%, 04/23/31(b) | | |
PetSmart LLC, 2021 Term Loan B, (1-mo. CME Term SOFR at 0.75% Floor + 3.85%), 9.19%, 02/11/28(b) | | |
White Cap Buyer LLC, 2024 Term Loan B, (1-mo. CME Term SOFR at 0.00% Floor + 3.25%), 8.59%, 10/19/29 | | |
| | |
|
Entegris Inc., 2023 Term Loan B, (3-mo. CME Term SOFR at 0.00% Floor + 1.75%), 7.08%, 07/06/29(b) | | |
MKS Instruments Inc., 2024 USD Term Loan B, (1-mo. CME Term SOFR at 0.50% Floor + 2.25%), 7.60%, 08/17/29 | | |
Synaptics Inc., Term Loan B, (3-mo. CME Term SOFR at 0.50% Floor + 2.51%), 7.85%, 12/02/28(b) | | |
| | |
| | |
|
Applied Systems Inc., 2024 1st Lien Term Loan, (3-mo. CME Term SOFR at 0.00% Floor + 3.50%), 8.83%, 02/24/31(b) | | |
Aristocrat Technologies Inc., 2022 Term Loan B, 05/24/29(b)(c) | | |
Ascend Learning LLC, 2021 Term Loan, (1-mo. CME Term SOFR at 0.50% Floor + 3.60%), 8.94%, 12/11/28(b) | | |
AthenaHealth Group Inc., 2022 Term Loan B, (1-mo. CME Term SOFR at 0.50% Floor + 3.25%), 8.59%, 02/15/29(b) | | |
Azalea Topco Inc., 2024 Term Loan B, (1-mo. CME Term SOFR at 0.00% Floor + 3.50%), 8.84%, 04/30/31(b) | | |
Capstone Borrower Inc., 2024 Term Loan B, 06/17/30(b)(c) | | |
CCC Intelligent Solutions Inc., Term Loan, (1-mo. CME Term SOFR + 2.36%), 7.71%, 09/21/28(b) | | |
Central Parent LLC, 2024 Term Loan B, (3-mo. CME Term SOFR at 0.00% Floor + 3.25%), 8.58%, 07/06/29(b) | | |
Cloud Software Group Inc. | | |
2024 Term Loan, (3-mo. CME Term SOFR at 0.50% Floor + 4.50%), 9.83%, 03/21/31(b) | | |
2024 USD Term Loan B, (3-mo. CME Term SOFR at 0.50% Floor + 4.00%), 9.33%, 03/30/29(b) | | |
| | |
2021 Term Loan, (1-mo. CME Term SOFR at 0.50% Floor + 3.85%), 9.19%, 10/08/28(b) | | |
2021 Second Lien Term Loan, (1-mo. CME Term SOFR at 0.50% Floor + 6.10%), 11.44%, 10/08/29(b) | | |
Cotiviti Corp., 2024 Term Loan, (1-mo. CME Term SOFR at 0.00% Floor + 3.25%), 8.59%, 05/01/31(b) | | |
Dayforce Inc., Term Loan B, (1-mo. CME Term SOFR at 0.00% Floor + 2.50%), 7.84%, 02/26/31(b)(d) | | |
DS Admiral Bidco LLC, 2024 Term Loan B, (3-mo. CME Term SOFR at 0.00% Floor + 4.25%), 9.59%, 06/26/31(d) | | |
Dun & Bradstreet Corp. (The), 2024 Term Loan B, (1-mo. CME Term SOFR at 0.00% Floor + 2.75%), 8.10%, 01/18/29(b) | | |
Ellucian Holdings Inc., 2024 Term Loan B, (1-mo. CME Term SOFR at 0.50% Floor + 3.60%), 8.94%, 10/09/29(b) | | |
Genesys Cloud Services Holdings II LLC | | |
Term Loan B, (1-mo. CME Term SOFR at 0.75% Floor + 3.86%), 9.21%, 12/01/27(b) | | |
First Lien Term Loan B, (1-mo. CME Term SOFR at 0.75% Floor + 3.50%), 8.84%, 12/01/27(b) | | |
Helios Software Holdings Inc., 2024 Term Loan, (3-mo. CME Term SOFR at 0.00% Floor + 3.75%), 9.08%, 07/18/30(b) | | |
Informatica LLC, 2024 Term Loan B, (1-mo. CME Term SOFR at 0.00% Floor + 2.25%), 7.59%, 10/27/28 | | |
Mitchell International Inc. | | |
2024 1st Lien Term Loan, (1-mo. CME Term SOFR + 3.25%), 8.59%, 06/17/31 | | |
2024 2nd Lien Term Loan, (1-mo. CME Term SOFR + 5.25%), 10.59%, 06/17/32 | | |
Modena Buyer LLC, Term Loan, (3-mo. CME Term SOFR at 0.00% Floor + 4.50%), 9.83%, 07/01/31 | | |
Schedule of Investments60
Schedule of Investments (continued)July 31, 2024
BlackRock Floating Rate Loan ETF(Percentages shown are based on Net Assets)
| | |
|
Neon Maple U.S. Debt Mergersub Inc., 2024 Term Loan B1, 07/18/31(c)(d) | | |
Planview Parent Inc., 2024 Term Loan, (3-mo. CME Term SOFR at 0.00% Floor + 3.75%), 9.08%, 12/17/27 | | |
Playtika Holding Corp., 2021 Term Loan B1, (1-mo. CME Term SOFR at 0.00% Floor + 2.86%), 8.21%, 03/13/28(b) | | |
PointClickCare Technologies Inc., 2024 Term Loan B, (3-mo. CME Term SOFR at 0.75% Floor + 3.00%), 8.33%, 12/29/27(b)(d) | | |
Polaris Newco LLC, USD Term Loan B, (3-mo. CME Term SOFR at 0.50% Floor + 4.26%), 9.51%, 06/02/28(b) | | |
Project Boost Purchaser LLC, 2024 Term Loan, (3-mo. CME Term SOFR at 0.00% Floor + 3.50%), 8.79%, 07/16/31 | | |
Quartz Acquireco LLC, 2024 Term Loan B, (3-mo. CME Term SOFR at 0.00% Floor + 2.75%), 8.08%, 06/28/30 | | |
RealPage Inc., 1st Lien Term Loan, (1-mo. CME Term SOFR + 3.11%), 8.46%, 04/24/28(b) | | |
Severin Acquisition LLC, 2018 Term Loan B, (3-mo. CME Term SOFR + 3.00%), 8.25%, 08/01/27(b) | | |
SS&C Technologies Inc., 2024 Term Loan B8, (1-mo. CME Term SOFR at 0.00% Floor + 2.00%), 7.34%, 05/09/31(b) | | |
UKG Inc., 2024 Term Loan B, (3-mo. CME Term SOFR at 0.00% Floor + 3.25%), 8.55%, 02/10/31(b) | | |
Veritas U.S. Inc., 2021 USD Term Loan B, (1-mo. CME Term SOFR + 5.11%), 10.46%, 09/01/25(b) | | |
VS Buyer LLC, 2024 Term Loan B, (1-mo. CME Term SOFR at 0.00% Floor + 3.25%), 8.58%, 04/11/31(b) | | |
Waystar Technologies Inc., 2024 USD Term Loan B, (1-mo. CME Term SOFR at 0.00% Floor + 2.75%), 8.09%, 10/22/29 | | |
Zelis Payments Buyer Inc., Term Loan B, (1-mo. CME Term SOFR + 2.75%), 8.09%, 09/28/29(b) | | |
| | |
Telecommunications — 1.8% |
Altice France SA, 2023 USD Term Loan B14, (3-mo. CME Term SOFR at 0.00% Floor + 5.50%), 10.80%, 08/15/28(b) | | |
Ciena Corp., 2020 Term Loan B, (1-mo. CME Term SOFR at 0.00% Floor + 2.00%), 7.35%, 10/24/30(b) | | |
| | |
2024 Non-Extended Term Loan B, (1-mo. CME Term SOFR at 0.50% Floor + 3.50%), 8.84%, 12/11/26(b) | | |
2024 Extended Term Loan B, (1-mo. CME Term SOFR at 0.50% Floor + 4.50%), 9.84%, 09/27/29(b) | | |
GOGO Intermediate Holdings LLC, Term Loan B, (1-mo. CME Term SOFR + 3.86%), 9.21%, 04/30/28(b) | | |
Iridium Satellite LLC, 2024 Term Loan B, (1-mo. CME Term SOFR at 0.75% Floor + 2.25%), 7.60%, 09/20/30 | | |
| | |
Telecommunications (continued) |
| | |
2024 Extended Term Loan B2, (1-mo. CME Term SOFR at 2.00% Floor + 6.56%), 11.91%, 04/15/30(b) | | |
2024 Extended Term Loan B1, (1-mo. CME Term SOFR at 2.00% Floor + 6.56%), 11.91%, 04/15/29(b) | | |
| | |
2024 Term Loan A, 06/01/28(b)(c) | | |
2024 Extended Term Loan B1, (1-mo. CME Term SOFR + 2.46%), 7.81%, 04/15/29(b) | | |
2024 Extended Term Loan B2, (1-mo. CME Term SOFR + 2.46%), 7.81%, 04/15/30(b) | | |
SBA Senior Finance II LLC, 2024 Term Loan B, (1-mo. CME Term SOFR at 0.00% Floor + 2.00%), 7.34%, 01/25/31(b) | | |
| | |
Term Loan, (1-mo. CME Term SOFR at 0.50% Floor + 4.50%), 9.84%, 03/02/29(b) | | |
2023 Term Loan, (1-mo. CME Term SOFR + 4.61%), 9.94%, 05/30/30(b) | | |
Zayo Group Holdings Inc., USD Term Loan, (1-mo. CME Term SOFR at 0.00% Floor + 3.11%), 8.46%, 03/09/27(b) | | |
| | |
|
Genesee & Wyoming Inc. (New), 2024 Term Loan B, (3-mo. CME Term SOFR at 0.00% Floor + 2.00%), 7.33%, 04/10/31(b) | | |
OLA Netherlands BV, Term Loan, (1-mo. CME Term SOFR + 6.35%), 11.69%, 12/15/26 | | |
Rand Parent LLC, 2023 Term Loan B, (3-mo. CME Term SOFR at 0.00% Floor + 3.75%), 9.07%, 03/17/30(b) | | |
| | |
Total Floating Rate Loan Interests — 82.4%
(Cost: $41,059,610) | |
| | |
|
Diversified Telecommunication Services — 0.0% |
Learfield Communications LLC, NVS, (Acquired 09/06/23, Cost $ 3,910)(d)(i) | | |
Total Common Stocks — 0.0%
(Cost $3,910) | |
|
Exchange Traded Funds — 6.3% |
iShares 0-5 Year High Yield Corporate Bond ETF(j) | | |
iShares Broad USD High Yield Corporate Bond ETF(j) | | |
iShares iBoxx $ High Yield Corporate Bond ETF(j) | | |
| | |
Total Investment Companies — 6.3%
(Cost $3,078,908) | |
Total Long-Term Investments — 92.1%
(Cost: $45,757,858) | |
612024 BlackRock Annual Financial Statements
Schedule of Investments (continued)July 31, 2024
BlackRock Floating Rate Loan ETF(Percentages shown are based on Net Assets)
| | |
|
Money Market Funds — 16.1% |
BlackRock Cash Funds: Treasury, SL Agency Shares, 5.29%(j)(k) | | |
Total Short-Term Securities — 16.1%
(Cost: $8,020,000) | |
Total Investments — 108.2%
(Cost: $53,777,858) | |
Liabilities in Excess of Other Assets — (8.2)% | |
| |
| Security exempt from registration pursuant to Rule 144A under the Securities Act of 1933, as amended. These securities may be resold in transactions exempt from registration to qualified institutional investors. |
| Variable rate security. Interest rate resets periodically. The rate shown is the effective interest rate as of period end. Security description also includes the reference rate and spread if published and available. |
| Represents an unsettled loan commitment at period end. Certain details associated with this purchase are not known prior to the settlement date, including coupon rate. |
| Security is valued using significant unobservable inputs and is classified as Level 3 in the fair value hierarchy. |
| Payment-in-kind security which may pay interest/dividends in additional par/shares and/or in cash. Rates shown are the current rate and possible payment rates. |
| Issuer filed for bankruptcy and/or is in default. |
| Non-income producing security. |
| This security may be resold to qualified foreign investors and foreign institutional buyers under Regulation S of the Securities Act of 1933. |
| Restricted security as to resale, excluding 144A securities. The Fund held restricted securities with a current value of $20,280, representing less than 0.05% of its net assets as of period end, and an original cost of $3,910. |
| |
| Annualized 7-day yield as of period end. |
Affiliates
Investments in issuers considered to be affiliate(s) of the Fund during the year ended July 31, 2024 for purposes of Section 2(a)(3) of the Investment Company Act of 1940, as amended, were as follows:
| | | | | Change in
Unrealized
Appreciation
(Depreciation) | | | | Capital
Gain
Distributions
from
Underlying
Funds |
BlackRock Cash Funds: Treasury, SL Agency Shares | | | | | | | | | |
iShares 0-5 Year High Yield Corporate Bond ETF | | | | | | | | | |
iShares Broad USD High Yield Corporate Bond ETF | | | | | | | | | |
iShares iBoxx $ High Yield Corporate Bond ETF | | | | | | | | | |
| | | | | | | | | |
| Represents net amount purchased (sold). |
Schedule of Investments62
Schedule of Investments (continued)July 31, 2024
BlackRock Floating Rate Loan ETF
Derivative Financial Instruments Outstanding as of Period End
| | | | | | | | | |
| | | | | | | | | Upfront
Premiums
Paid
(Received) | Unrealized
Appreciation
(Depreciation) |
| | Markit iBoxx USD Liquid Leveraged Loan Index | | Morgan Stanley & Co. International PLC | | | | | | | |
| | Markit iBoxx USD Liquid Leveraged Loan Index | | Morgan Stanley & Co. International PLC | | | | | | | |
| | Markit iBoxx USD Liquid Leveraged Loan Index | | Morgan Stanley & Co. International PLC | | | | | | | |
| | Markit iBoxx USD Liquid Leveraged Loan Index | | Morgan Stanley & Co. International PLC | | | | | | | |
| | Markit iBoxx USD Liquid Leveraged Loan Index | | Morgan Stanley & Co. International PLC | | | | | | | |
| | Markit iBoxx USD Liquid Leveraged Loan Index | | Morgan Stanley & Co. International PLC | | | | | | | |
| | | | | | | | | | | |
Balances Reported in the Statements of Assets and Liabilities for OTC Swaps
Derivative Financial Instruments Categorized by Risk Exposure
As of period end, the fair values of derivative financial instruments located in the Statements of Assets and Liabilities were as follows:
| | | | Foreign
Currency
Exchange
Contracts | | | |
Assets—Derivative Financial Instruments | | | | | | | |
| | | | | | | |
Unrealized appreciation on OTC swaps; Swap premiums paid | | | | | | | |
Liabilities—Derivative Financial Instruments | | | | | | | |
| | | | | | | |
Unrealized depreciation on OTC swaps; Swap premiums received | | | | | | | |
632024 BlackRock Annual Financial Statements
Schedule of Investments (continued)July 31, 2024
BlackRock Floating Rate Loan ETF
Derivative Financial Instruments Categorized by Risk Exposure (continued)
For the period ended July 31, 2024, the effect of derivative financial instruments in the Statements of Operations was as follows:
| | | | Foreign
Currency
Exchange
Contracts | | | |
Net Realized Gain (Loss) from | | | | | | | |
| | | | | | | |
Net Change in Unrealized Appreciation (Depreciation) on | | | | | | | |
| | | | | | | |
Average Quarterly Balances of Outstanding Derivative Financial Instruments
For more information about the Fund’s investment risks regarding derivative financial instruments, refer to the Notes to Financial Statements.
Derivative Financial Instruments - Offsetting as of Period End
The Fund's derivative assets and liabilities (by type) were as follows:
| | |
Derivative Financial Instruments: | | |
| | |
Total derivative assets and liabilities in the Statement of Assets and Liabilities | | |
Derivatives not subject to a Master Netting Agreement or similar agreement ("MNA") | | |
Total derivative assets and liabilities subject to an MNA | | |
| Includes unrealized appreciation (depreciation) on OTC swaps and swap premiums (paid/received) in the Statements of Assets and Liabilities. |
The following tables present the Fund’s derivative assets and liabilities by counterparty net of amounts available for offset under an MNA and net of the related collateral received and pledged by the Fund:
| Derivative
Assets
Subject to
an MNA by
Counterparty | | Non-Cash
Collateral
Received | | |
Morgan Stanley & Co. International PLC | | | | | |
| Derivative
Liabilities
Subject to
an MNA by
Counterparty | | Non-Cash
Collateral
Pledged | | |
Morgan Stanley & Co. International PLC | | | | | |
| The amount of derivatives available for offset is limited to the amount of derivative assets and/or liabilities that are subject to an MNA. |
| Net amount represents the net amount payable due to the counterparty in the event of default. |
Schedule of Investments64
Schedule of Investments (continued)July 31, 2024
BlackRock Floating Rate Loan ETF
Fair Value Hierarchy as of Period End
Various inputs are used in determining the fair value of financial instruments. For a description of the input levels and information about the Fund’s policy regarding valuation of financial instruments, refer to the Notes to Financial Statements.
The following table summarizes the Fund’s financial instruments categorized in the fair value hierarchy. The breakdown of the Fund’s financial instruments into major categories is disclosed in the Schedule of Investments above.
| | | | |
| | | | |
| | | | |
| | | | |
| | | | |
Fixed Rate Loan Interests | | | | |
Floating Rate Loan Interests | | | | |
| | | | |
| | | | |
| | | | |
| | | | |
Unfunded Floating Rate Loan Interests(a) | | | | |
| | | | |
Derivative Financial Instruments(b) | | | | |
| | | | |
| | | | |
| | | | |
| | | | |
| | | | |
| Unfunded floating rate loan interests are valued at the unrealized appreciation (depreciation) on the commitment. |
| Derivative financial instruments are swaps. Swaps are valued at the unrealized appreciation (depreciation) on the instrument. |
A reconciliation of Level 3 financial instruments is presented when the Fund had a significant amount of Level 3 investments and derivative financial instruments at the beginning and/or end of the year in relation to net assets. The following table is a reconciliation of Level 3 investments for which significant unobservable inputs were used in determining fair value:
| | Floating
Rate
Loan
Interests | Unfunded
Floating
Rate
Loan
Interests | |
| | | | |
Opening balance, as of July 31, 2023 | | | | |
| | | | |
| | | | |
Accrued discounts/premiums | | | | |
| | | | |
Net change in unrealized appreciation (depreciation)(a)(b) | | | | |
| | | | |
| | | | |
Closing balance, as of July 31, 2024 | | | | |
Net change in unrealized appreciation (depreciation) on investment still held at July 31, 2024(b) | | | | |
(a) Included in the related net change in unrealized appreciation (depreciation) in the Statement of Operations. |
(b) Any difference between net change in unrealized appreciation (depreciation) and net change in unrealized appreciation (depreciation) on investments still held at July 31, 2024 is generally due to investments no longer held or categorized as Level 3 at period end. |
| | | | |
The Fund's financial instruments that are categorized as Level 3 were valued utilizing third-party pricing information without adjustment. Such valuations are based on unobservable inputs. A significant change in third party information could result in a significantly lower or higher value of such Level 3 financial investments.
See notes to financial statements.
652024 BlackRock Annual Financial Statements
Schedule of InvestmentsJuly 31, 2024
BlackRock High Yield Muni Income Bond ETF(Percentages shown are based on Net Assets)
| | |
Municipal Debt Obligations |
|
Black Belt Energy Gas District RB | | |
| | |
| | |
Energy Southeast A Cooperative District RB, 5.25%, 07/01/54 | | |
Hoover Industrial Development Board RB AMT, 5.75%, 10/01/49 | | |
Mobile County Industrial Development Authority RB AMT, 5.00%, 06/01/54 | | |
Southeast Alabama Gas Supply District (The) RB, 5.00%, 08/01/54 | | |
Southeast Energy Authority A Cooperative District RB, 5.50%, 01/01/53 | | |
Tuscaloosa County Industrial Development Authority RB, 5.25%, 05/01/44(a) | | |
| | |
|
Arizona Industrial Development Authority RB, 5.25%, 07/01/37(a) | | |
Glendale Industrial Development Authority RB | | |
| | |
| | |
| | |
Industrial Development Authority of the City of Phoenix Arizona (The) RB, 5.00%, 07/01/46(a) | | |
Maricopa County Industrial Development Authority RB AMT, 4.00%, 10/15/47(a) | | |
Sierra Vista Industrial Development Authority RB | | |
| | |
| | |
| | |
|
Arkansas Development Finance Authority RB AMT | | |
| | |
| | |
| | |
| | |
County of Baxter Arkansas RB, 5.00%, 09/01/24 | | |
| | |
|
California County Tobacco Securitization Agency RB | | |
| | |
| | |
California Enterprise Development Authority RB, 5.00%, 07/01/50(a) | | |
California Infrastructure & Economic Development Bank RB AMT, 8.00%, 01/01/50(a) | | |
California Municipal Finance Authority RB | | |
| | |
| | |
California Municipal Finance Authority RB AMT, 4.00%, 07/15/29 | | |
California Municipal Finance Authority ST, 5.00%, 09/01/54 | | |
California Pollution Control Financing Authority RB, 5.00%, 07/01/39(a) | | |
California School Finance Authority RB, 5.00%, 06/01/44(a) | | |
| | |
|
California Statewide Communities Development Authority RB | | |
| | |
| | |
California Statewide Financing Authority RB, 0.00%, 06/01/55(a)(b) | | |
CSCDA Community Improvement Authority RB | | |
| | |
| | |
| | |
| | |
Golden State Tobacco Securitization Corp. RB | | |
| | |
| | |
Rancho Mirage Community Facilities District ST, 5.00%, 09/01/54 | | |
| | |
|
Colorado Educational & Cultural Facilities Authority RB | | |
| | |
| | |
Colorado Health Facilities Authority RB | | |
| | |
| | |
Four Corners Business Improvement District GOL, 6.00%, 12/01/52 | | |
Loretto Heights Community Authority RB, 4.88%, 12/01/51 | | |
North Range Metropolitan District No. 3 GOL, 5.25%, 12/01/50 | | |
Pueblo Urban Renewal Authority TA | | |
| | |
Series B, 0.00%, 12/01/25(a)(b) | | |
Riverpark Metropolitan District/Arapahoe County GOL, 6.38%, 12/01/54 | | |
| | |
|
Connecticut Housing Finance Authority RB, 4.65%, 11/15/51 (GNMA/FNMA/FHLMC) | | |
Connecticut State Health & Educational Facilities Authority RB | | |
| | |
| | |
Mohegan Tribal Finance Authority RB, 7.00%, 02/01/45(a) | | |
| | |
|
Affordable Housing Opportunities Trust RB, 6.88%, 05/01/39(a) | | |
Town of Bridgeville Delaware ST | | |
| | |
| | |
Town of Milton Delaware ST | | |
| | |
| | |
| | |
District of Columbia — 0.8% |
District of Columbia RB, 5.00%, 06/01/46 | | |
District of Columbia RB AMT, 5.50%, 02/28/37 | | |
Schedule of Investments66
Schedule of Investments (continued)July 31, 2024
BlackRock High Yield Muni Income Bond ETF(Percentages shown are based on Net Assets)
| | |
District of Columbia (continued) |
District of Columbia Tobacco Settlement Financing Corp. RB, Series C, 0.00%, 06/15/55(b) | | |
| | |
|
Antillia Community Development District Special Assessment, 5.88%, 05/01/54 | | |
Babcock Ranch Community Independent Special District Special Assessment | | |
| | |
| | |
Boggy Creek Improvement District Special Assessment, 5.13%, 05/01/43 | | |
Brevard County Health Facilities Authority RB, 4.00%, 11/15/32(a) | | |
Buckhead Trails Community Development District Special Assessment, 5.60%, 05/01/44 | | |
Cabot Citrus Farms Community Development District Special Assessment, 5.25%, 03/01/29 | | |
Capital Projects Finance Authority/Florida RB, 6.63%, 06/15/59(a) | | |
Capital Trust Agency Inc. RB | | |
| | |
| | |
| | |
| | |
Central Parc Community Development District Special Assessment, 6.00%, 05/01/54 | | |
Charlotte County Industrial Development Authority/Florida RB, 5.00%, 10/01/49(a) | | |
Charlotte County Industrial Development Authority/Florida RB AMT, 4.00%, 10/01/51(a) | | |
Coral Creek Community Development District Special Assessment, 5.75%, 05/01/54 | | |
County of Lake Florida RB | | |
| | |
| | |
Crossings Community Development District Special Assessment | | |
| | |
| | |
| | |
Crosswinds East Community Development District Special Assessment, 5.75%, 05/01/54 | | |
Darby Community Development District Special Assessment, 5.88%, 05/01/35 | | |
Escambia County Health Facilities Authority RB, 5.00%, 08/15/40 | | |
Florida Development Finance Corp. RB | | |
| | |
Series A, 5.13%, 06/15/55(a) | | |
Florida Development Finance Corp. RB AMT | | |
| | |
| | |
Gardens at Hammock Beach Community Development District Special Assessment, 5.88%, 05/01/55 | | |
Golden Gem Community Development District Special Assessment, 6.00%, 05/01/55 | | |
Hammock Oaks Community Development District Special Assessment, 5.85%, 05/01/44 | | |
Hobe-St Lucie Conservancy District Special Assessment, 5.88%, 05/01/55 | | |
| | |
|
Hyde Park Community Development District No. 1 Special Assessment, 5.25%, 05/01/34(a) | | |
Lakes of Sarasota Community Development District Special Assessment | | |
| | |
Series B-1, 4.30%, 05/01/51 | | |
Lakewood Ranch Stewardship District Special Assessment, 5.55%, 05/01/54 | | |
Lee County Industrial Development Authority/Florida RB, 4.75%, 11/15/29 | | |
LT Ranch Community Development District Special Assessment, 5.85%, 05/01/54 | | |
LTC Ranch West Residential Community Development District Special Assessment | | |
| | |
| | |
| | |
Marion Ranch Community Development District Special Assessment, 5.95%, 05/01/54 | | |
North AR-1 Pasco Community Development District Special Assessment | | |
| | |
| | |
Parrish Lakes Community Development District Special Assessment, 5.80%, 05/01/54 | | |
Parrish Plantation Community Development District Special Assessment, 5.63%, 05/01/44 | | |
Poitras East Community Development District Special Assessment, 5.25%, 05/01/52 | | |
Sawyers Landing Community Development District Special Assessment, 4.25%, 05/01/53 | | |
Shadowlawn Community Development District Special Assessment, 5.85%, 05/01/54 | | |
Somerset Bay Community Development District Special Assessment, 5.90%, 05/01/54(a) | | |
Two Rivers West Community Development District Special Assessment, 5.88%, 05/01/54(a) | | |
Viera Stewardship District, 5.50%, 05/01/54 | | |
Village Community Development District No. 14 Special Assessment | | |
| | |
| | |
Village Community Development District No. 15 Special Assessment, 5.25%, 05/01/54(a) | | |
West Villages Improvement District Special Assessment, 5.63%, 05/01/54 | | |
Westside Haines City Community Development District Special Assessment, 6.00%, 05/01/54 | | |
| | |
|
Atlanta Urban Redevelopment Agency RB, 3.88%, 07/01/51(a) | | |
Development Authority of Cobb County (The) RB, 5.70%, 06/15/38(a) | | |
Main Street Natural Gas Inc. RB, 5.00%, 12/01/52 | | |
| | |
|
Idaho Housing & Finance Association RB, 5.00%, 12/01/38(a) | | |
672024 BlackRock Annual Financial Statements
Schedule of Investments (continued)July 31, 2024
BlackRock High Yield Muni Income Bond ETF(Percentages shown are based on Net Assets)
| | |
|
Chicago Board of Education GO | | |
| | |
| | |
| | |
| | |
Chicago O'Hare International Airport RB, Series D, 5.00%, 01/01/46 | | |
Metropolitan Pier & Exposition Authority RB, 4.00%, 06/15/50 | | |
State of Illinois GO, 5.00%, 12/01/46 | | |
| | |
|
City of Valparaiso Indiana RB AMT, 4.50%, 01/01/34(a) | | |
Indiana Finance Authority RB | | |
| | |
| | |
| | |
|
City of Manhattan Kansas RB, 4.00%, 06/01/25 | | |
|
City of Henderson Kentucky RB AMT, 4.70%, 01/01/52(a) | | |
Kentucky Economic Development Finance Authority RB, 5.25%, 06/01/41 | | |
Kentucky Public Energy Authority RB, 4.00%, 02/01/50 | | |
| | |
|
Louisiana Public Facilities Authority RB, 6.50%, 06/01/62(a) | | |
|
Finance Authority of Maine RB AMT, 8.00%, 12/01/51(a) | | |
Maine Health & Higher Educational Facilities Authority RB, 4.00%, 07/01/37(a) | | |
| | |
|
City of Baltimore Maryland RB, 4.50%, 06/01/33 | | |
Maryland Economic Development Corp. RB AMT, 5.25%, 06/30/55 | | |
| | |
|
Massachusetts Development Finance Agency RB, 5.00%, 10/01/57(a) | | |
|
City of Detroit Michigan GOL, Series B-1, 4.00%, 04/01/44 | | |
Michigan Strategic Fund RB AMT, 4.00%, 10/01/61 | | |
| | |
|
City of Forest Lake Minnesota RB, 5.00%, 07/01/56 | | |
City of Minneapolis Minnesota RB, 5.75%, 07/01/55 | | |
| | |
|
Industrial Development Authority of the City of St Louis Missouri (The) RB, 5.75%, 06/15/54 | | |
| | |
|
St Louis County Industrial Development Authority RB, 5.25%, 09/01/53 | | |
| | |
|
Central Plains Energy Project RB, 5.00%, 05/01/53 | | |
|
City of Las Vegas Nevada Special Improvement District No. 613 Special Assessment, 5.50%, 12/01/53 | | |
State of Nevada Department of Business & Industry RB, 5.00%, 12/15/48(a) | | |
State of Nevada Department of Business & Industry RB AMT, 8.13%, 01/01/50 | | |
Tahoe-Douglas Visitors Authority, 5.00%, 07/01/51 | | |
| | |
|
New Hampshire Business Finance Authority RB, 3.63%, 07/01/43(a) | | |
|
New Jersey Transportation Trust Fund Authority RB, Series AA, 4.00%, 06/15/50 | | |
Tobacco Settlement Financing Corp. RB, 5.00%, 06/01/46 | | |
| | |
|
Build NYC Resource Corp. RB, 5.50%, 06/15/63(a) | | |
New York City Municipal Water Finance Authority RB, 5.25%, 06/15/54 | | |
New York Liberty Development Corp. RB | | |
| | |
| | |
New York State Environmental Facilities Corp. RB AMT, 5.13%, 09/01/50(a) | | |
New York Transportation Development Corp RB AMT, 5.38%, 06/30/60 | | |
New York Transportation Development Corp. RB, 5.00%, 12/01/38 | | |
New York Transportation Development Corp. RB AMT | | |
| | |
| | |
| | |
| | |
| | |
Suffolk Regional Off-Track Betting Co. RB | | |
| | |
| | |
| | |
| | |
|
North Carolina Medical Care Commission RB, 5.13%, 10/01/54 | | |
|
North Dakota Housing Finance Agency RB, 4.70%, 07/01/49 | | |
|
Buckeye Tobacco Settlement Financing Authority RB, Series B2, 5.00%, 06/01/55 | | |
County of Cuyahoga Ohio RB, 5.25%, 02/15/47 | | |
Schedule of Investments68
Schedule of Investments (continued)July 31, 2024
BlackRock High Yield Muni Income Bond ETF(Percentages shown are based on Net Assets)
| | |
|
County of Franklin Ohio RB, 4.00%, 07/01/45 | | |
Hickory Chase Community Authority RB, 5.00%, 12/01/40(a) | | |
Ohio Air Quality Development Authority RB AMT, 4.50%, 01/15/48(a) | | |
Port of Greater Cincinnati Development Authority RB | | |
| | |
| | |
| | |
|
Oklahoma Development Finance Authority RB | | |
| | |
Series A-2, 7.25%, 09/01/51(a) | | |
Tulsa Airports Improvement Trust RB AMT, 5.00%, 06/01/35 | | |
Tulsa Authority for Economic Opportunity TA, 4.38%, 12/01/41(a) | | |
Tulsa County Industrial Authority RB | | |
| | |
| | |
| | |
|
Clackamas County Hospital Facility Authority RB, 5.00%, 05/15/48 | | |
Yamhill County Hospital Authority RB, 5.00%, 11/15/51 | | |
| | |
|
Allentown Neighborhood Improvement Zone Development Authority RB | | |
| | |
| | |
Beaver County Industrial Development Authority RB, 3.75%, 10/01/47 | | |
Berks County Municipal Authority (The) RB, 5.00%, 10/01/39 | | |
Doylestown Hospital Authority RB | | |
| | |
| | |
Lancaster County Hospital Authority/Pennsylvania RB, 5.25%, 07/01/41 | | |
Pennsylvania Economic Development Financing Authority RB | | |
| | |
| | |
Pennsylvania Economic Development Financing Authority RB AMT | | |
| | |
| | |
Pennsylvania Higher Education Assistance Agency RB AMT, 5.00%, 06/01/51 | | |
| | |
|
Children's Trust Fund RB, Series A, 0.00%, 05/15/57(b) | | |
Commonwealth of Puerto Rico GO | | |
| | |
| | |
| | |
| | |
Commonwealth of Puerto Rico Notes | | |
| | |
| | |
|
| | |
Puerto Rico Commonwealth Aqueduct & Sewer Authority RB, 4.00%, 07/01/42(a) | | |
Puerto Rico Sales Tax Financing Corp. Sales Tax Revenue RB | | |
| | |
| | |
Series A-2, 4.78%, 07/01/58 | | |
| | |
|
Rhode Island Housing & Mortgage Finance Corp. RB, 4.75%, 10/01/54 (GNMA) | | |
Tobacco Settlement Financing Corp./Rhode Island RB, 5.00%, 06/01/50 | | |
| | |
|
City of Hardeeville South Carolina Special Assessment, 4.00%, 05/01/52(a) | | |
Patriots Energy Group Financing Agency RB, 5.25%, 10/01/54 | | |
South Carolina Jobs-Economic Development Authority RB | | |
| | |
| | |
| | |
|
Metropolitan Government Nashville & Davidson County Health & Educational Facs Bd RB, 5.00%, 10/01/37 | | |
Metropolitan Government Nashville & Davidson County Industrial Development Board Special Assessment, 0.00%, 06/01/43(a)(b) | | |
Metropolitan Nashville Airport Authority (The) RB AMT, 5.50%, 07/01/52 | | |
Tennergy Corp./Tennessee RB, 5.50%, 10/01/53 | | |
| | |
|
Angelina & Neches River Authority RB AMT, Series A, Class A,7.50%, 12/01/45(a) | | |
Arlington Higher Education Finance Corp. RB | | |
| | |
| | |
| | |
| | |
Bexar County Health Facilities Development Corp. RB, 4.00%, 07/15/45 | | |
City of Anna Texas Special Assessment, 5.75%, 09/15/54(a) | | |
City of Celina Texas Special Assessment, 5.50%, 09/01/53(a) | | |
City of Fate Texas Special Assessment, 5.75%, 08/15/54(a) | | |
City of Houston Texas Airport System Revenue RB AMT, 5.00%, 07/15/27 | | |
City of Mesquite Texas Special Assessment, 5.75%, 09/01/53(a) | | |
Mesquite Housing Finance Corp. (The) RB, 4.53%, 02/01/44 (FNMA) | | |
New Hope Cultural Education Facilities Finance Corp. RB | | |
| | |
692024 BlackRock Annual Financial Statements
Schedule of Investments (continued)July 31, 2024
BlackRock High Yield Muni Income Bond ETF(Percentages shown are based on Net Assets)
| | |
|
| | |
| | |
New Hope Higher Education Finance Corp. RB, Series A, 5.00%, 06/15/30(a) | | |
Port Beaumont Navigation District RB AMT, 4.00%, 01/01/50(a) | | |
Port of Beaumont Navigation District RB AMT | | |
| | |
| | |
| | |
| | |
|
Black Desert Public Infrastructure District Special Assessment, 5.63%, 12/01/53(a) | | |
Utah Charter School Finance Authority RB | | |
| | |
5.00%, 10/15/44 (UT CSCE) | | |
Wood Ranch Public Infrastructure District Special Assessment, 5.63%, 12/01/53(a) | | |
| | |
|
East Central Vermont Telecommunications District RB, 4.50%, 12/01/44(a) | | |
|
James City County Economic Development Authority RB, 5.25%, 12/01/27 | | |
Tobacco Settlement Financing Corp./Virginia RB, Series B1, 5.00%, 06/01/47 | | |
Virginia Beach Development Authority RB, 5.38%, 09/01/29 | | |
| | |
|
County of King Washington Sewer Revenue RB, 4.00%, 07/01/39 | | |
Washington State Housing Finance Commission RB | | |
| | |
| | |
| | |
| | |
|
Public Finance Authority, 7.75%, 07/01/43(a) | | |
| | |
|
Public Finance Authority RB | | |
| | |
| | |
| | |
| | |
| | |
| | |
| | |
| | |
| | |
| | |
Series A, 5.00%, 06/15/55(a) | | |
Public Finance Authority TA, 5.00%, 06/01/41(a) | | |
Wisconsin Health & Educational Facilities Authority RB, 5.75%, 08/15/54 | | |
| | |
Total Long-Term Investments — 101.6%
(Cost: $146,992,813) | |
| | |
|
Money Market Funds — 5.9% |
BlackRock Liquidity Funds: MuniCash, 3.47%(e)(f) | | |
Total Short-Term Securities — 5.9%
(Cost: $8,705,939) | |
Total Investments — 107.5%
(Cost: $155,698,752) | |
Liabilities in Excess of Other Assets — (7.5)% | |
| |
| Security exempt from registration pursuant to Rule 144A under the Securities Act of 1933, as amended. These securities may be resold in transactions exempt from registration to qualified institutional investors. |
| |
| Issuer filed for bankruptcy and/or is in default. |
| Non-income producing security. |
| |
| Annualized 7-day yield as of period end. |
Affiliates
Investments in issuers considered to be affiliate(s) of the Fund during the year ended July 31, 2024 for purposes of Section 2(a)(3) of the Investment Company Act of 1940, as amended, were as follows:
| | | | | Change in
Unrealized
Appreciation
(Depreciation) | | | | Capital
Gain
Distributions
from
Underlying
Funds |
BlackRock Liquidity Funds: MuniCash | | | | | | | | | |
| Represents net amount purchased (sold). |
Schedule of Investments70
Schedule of Investments (continued)July 31, 2024
BlackRock High Yield Muni Income Bond ETF
Fair Value Hierarchy as of Period End
Various inputs are used in determining the fair value of financial instruments. For a description of the input levels and information about the Fund’s policy regarding valuation of financial instruments, refer to the Notes to Financial Statements.
The following table summarizes the Fund’s financial instruments categorized in the fair value hierarchy. The breakdown of the Fund’s financial instruments into major categories is disclosed in the Schedule of Investments above.
| | | | |
| | | | |
| | | | |
| | | | |
Municipal Debt Obligations | | | | |
| | | | |
| | | | |
| | | | |
See notes to financial statements.
712024 BlackRock Annual Financial Statements
Schedule of InvestmentsJuly 31, 2024
BlackRock Intermediate Muni Income Bond ETF(Percentages shown are based on Net Assets)
| | |
Municipal Debt Obligations |
|
Black Belt Energy Gas District RB | | |
| | |
| | |
County of Jefferson Alabama Sewer Revenue RB | | |
| | |
| | |
Energy Southeast A Cooperative District RB, 5.75%, 04/01/54 | | |
Southeast Energy Authority A Cooperative District RB, 5.50%, 01/01/53 | | |
Tuscaloosa County Industrial Development Authority RB, 5.25%, 05/01/44(a) | | |
| | |
|
California Community Choice Financing Authority RB, 5.54%, 12/01/53(b) | | |
California Infrastructure & Economic Development Bank RB AMT, 8.00%, 01/01/50(a) | | |
San Diego Unified School District/California GO, 0.00%, 07/01/31(c) | | |
| | |
|
City & County of Denver Colorado Airport System Revenue RB AMT, 5.75%, 11/15/34 | | |
Colorado Health Facilities Authority RB, 4.00%, 08/01/39 | | |
Pueblo Urban Renewal Authority TA, Series B, 0.00%, 12/01/25(a)(c) | | |
| | |
|
Connecticut Housing Finance Authority RB, 1.85%, 05/15/38 | | |
State of Connecticut GO, 5.00%, 06/15/28 | | |
State of Connecticut Special Tax Revenue RB, 5.00%, 07/01/38 | | |
| | |
|
Delaware State Economic Development Authority RB, Class B,1.25%, 10/01/40 | | |
District of Columbia — 1.3% |
Metropolitan Washington Airports Authority Aviation Revenue RB AMT, 5.00%, 10/01/37 | | |
|
County of Miami-Dade Florida Aviation Revenue RB AMT, 5.00%, 10/01/30 | | |
Lakes of Sarasota Community Development District Special Assessment, 2.75%, 05/01/26 | | |
Miami-Dade County Expressway Authority RB, 5.00%, 07/01/30 | | |
Tohoqua Community Development District Special Assessment, 2.38%, 05/01/26 | | |
| | |
|
Development Authority of Cobb County (The) RB, 5.70%, 06/15/38(a) | | |
| | |
|
Chicago O'Hare International Airport RB, Series B, 5.00%, 01/01/37 | | |
Chicago O'Hare International Airport RB AMT, 5.00%, 01/01/27 | | |
City of Chicago Illinois GO | | |
| | |
| | |
Illinois Finance Authority RB, Class B,4.31%, 05/01/42, (SIFMA Municipal Swap Index)(b) | | |
Northern Illinois Municipal Power Agency RB, 4.00%, 12/01/36 | | |
| | |
| | |
| | |
| | |
| | |
|
City of Henderson KY RB AMT, 3.70%, 01/01/32(a) | | |
Kentucky Public Energy Authority RB, 5.00%, 01/01/55 | | |
Louisville/Jefferson County Metropolitan Government RB, 1.75%, 02/01/35 | | |
| | |
|
Louisiana Local Government Environmental Facilities & Community Development Authority RB, Class A,2.00%, 06/01/30 | | |
|
Michigan Finance Authority RB, 5.25%, 02/29/40 | | |
|
Kansas City Industrial Development Authority RB AMT, 5.00%, 03/01/34 | | |
|
New Jersey Economic Development Authority RB, 5.00%, 06/15/28 | | |
New Jersey Educational Facilities Authority RB, 5.00%, 09/01/38 | | |
New Jersey Transportation Trust Fund Authority RB | | |
| | |
Series C, 0.00%, 12/15/25 (AMBAC)(c) | | |
| | |
|
New York City Housing Development Corp. RB, 1.95%, 11/01/32 (FHA 542(C)) | | |
New York City Municipal Water Finance Authority RB, 5.25%, 06/15/48 | | |
New York Liberty Development Corp. RB, Class A, 2.50%, 11/15/36 | | |
New York State Dormitory Authority RB, 5.00%, 03/15/41 | | |
New York State Environmental Facilities Corp. RB AMT, 5.13%, 09/01/50(a) | | |
Triborough Bridge & Tunnel Authority RB, 5.00%, 11/15/38 | | |
| | |
|
North Carolina Turnpike Authority RB, 5.00%, 01/01/30 | | |
Schedule of Investments72
Schedule of Investments (continued)July 31, 2024
BlackRock Intermediate Muni Income Bond ETF(Percentages shown are based on Net Assets)
| | |
|
Ohio Air Quality Development Authority RB, 4.00%, 09/01/30 | | |
Port of Greater Cincinnati Development Authority RB, 3.75%, 12/01/31(a) | | |
| | |
|
Bethlehem Area School District Authority RB, Series B, 3.92%, 07/01/31(b) | | |
Pennsylvania Economic Development Financing Authority RB, 5.00%, 10/15/29 | | |
Pennsylvania Economic Development Financing Authority RB AMT, 5.50%, 06/30/42 (AGM) | | |
Pennsylvania Housing Finance Agency RB, 2.00%, 10/01/32 | | |
| | |
|
Puerto Rico Sales Tax Financing Corp. Sales Tax Revenue RB, 4.33%, 07/01/40 | | |
|
City of Hardeeville SC, 3.00%, 05/01/27(a) | | |
South Carolina Public Service Authority RB, 5.00%, 12/01/41 | | |
| | |
|
Tennergy Corp./Tennessee RB, 5.50%, 10/01/53 | | |
|
City of Beaumont Texas GOL, 4.00%, 03/01/33 | | |
City of Galveston Texas Wharves & Terminal Revenue RB AMT, 5.00%, 08/01/33 | | |
City of Houston Texas Airport System Revenue RB AMT | | |
| | |
| | |
Houston Higher Education Finance Corp. RB | | |
| | |
| | |
Matagorda County Navigation District No. 1 RB, 2.60%, 11/01/29 | | |
New Hope Cultural Education Facilities Finance Corp. RB, 4.00%, 08/15/34 | | |
New Hope Higher Education Finance Corp. RB, Series A, 5.00%, 06/15/30(a) | | |
| | |
| | |
|
Virginia Housing Development Authority RB, 2.05%, 12/01/33 | | |
|
Washington Health Care Facilities Authority RB, 5.00%, 08/01/30 | | |
|
City of Milwaukee Wisconsin Sewerage System Revenue RB, 4.00%, 06/01/31 | | |
Wisconsin Health & Educational Facilities Authority RB, 4.20%, 08/15/28 | | |
| | |
Total Long-Term Investments — 96.6%
(Cost: $20,457,746) | |
| | |
|
Money Market Funds — 6.6% |
BlackRock Liquidity Funds: MuniCash, 3.47%(d)(e) | | |
Total Short-Term Securities — 6.6%
(Cost: $1,416,733) | |
Total Investments — 103.2%
(Cost: $21,874,479) | |
Liabilities in Excess of Other Assets — (3.2)% | |
| |
| Security exempt from registration pursuant to Rule 144A under the Securities Act of 1933, as amended. These securities may be resold in transactions exempt from registration to qualified institutional investors. |
| Variable rate security. Interest rate resets periodically. The rate shown is the effective interest rate as of period end. Security description also includes the reference rate and spread if published and available. |
| |
| |
| Annualized 7-day yield as of period end. |
Affiliates
Investments in issuers considered to be affiliate(s) of the Fund during the year ended July 31, 2024 for purposes of Section 2(a)(3) of the Investment Company Act of 1940, as amended, were as follows:
| | | | | Change in
Unrealized
Appreciation
(Depreciation) | | | | Capital
Gain
Distributions
from
Underlying
Funds |
BlackRock Liquidity Funds: MuniCash | | | | | | | | | |
| Represents net amount purchased (sold). |
732024 BlackRock Annual Financial Statements
Schedule of Investments (continued)July 31, 2024
BlackRock Intermediate Muni Income Bond ETF
Fair Value Hierarchy as of Period End
Various inputs are used in determining the fair value of financial instruments. For a description of the input levels and information about the Fund’s policy regarding valuation of financial instruments, refer to the Notes to Financial Statements.
The following table summarizes the Fund’s financial instruments categorized in the fair value hierarchy. The breakdown of the Fund’s financial instruments into major categories is disclosed in the Schedule of Investments above.
| | | | |
| | | | |
| | | | |
| | | | |
Municipal Debt Obligations | | | | |
| | | | |
| | | | |
| | | | |
See notes to financial statements.
Schedule of Investments74
Schedule of InvestmentsJuly 31, 2024
BlackRock Short-Term California Muni Bond ETF(Percentages shown are based on Net Assets)
| | |
Municipal Debt Obligations |
|
Anaheim Housing & Public Improvements Authority, VRDN, 2.80%, 08/01/24(a) | | |
Atascadero Unified School District GO, 5.00%, 08/01/24 | | |
Bay Area Toll Authority RB, VRDN, 3.90%, 08/01/24(a) | | |
California Community Choice Financing Authority Clean Energy Project RB | | |
VRDN, 3.64%, 08/07/24(a)(b) | | |
VRDN, 3.64%, 08/07/24(a)(b) | | |
California Community Choice Financing Authority RB | | |
| | |
| | |
| | |
| | |
California County Tobacco Securitization Agency RB, 5.00%, 06/01/25 | | |
California Health Facilities Financing Authority RB, 4.00%, 03/01/28 | | |
California Municipal Finance Authority RB, 3.65%, 12/01/29 | | |
California Municipal Finance Authority RB AMT | | |
| | |
| | |
| | |
California Pollution Control Financing Authority RB, 3.70%, 08/01/24(b) | | |
California Pollution Control Financing Authority RB AMT, 4.25%, 12/01/27 | | |
California State Public Works Board RB | | |
| | |
Series A, 5.00%, 09/01/27 | | |
California Statewide Communities Development Authority RB, 5.00%, 11/01/28 | | |
Chino Valley Unified School District GO, VRDN, 3.62%, 08/07/24(a)(b) | | |
City of Burbank California Water Revenue RB, 5.00%, 06/01/25 | | |
City of Irvine California Special Assessment, 5.00%, 09/02/24 | | |
City of Long Beach California Harbor Revenue RB AMT, 5.00%, 05/15/29 | | |
City of Los Angeles California Revenue Notes, 5.00%, 06/26/25 | | |
City of Los Angeles California Wastewater System Revenue | | |
| | |
| | |
City of Los Angeles Department of Airports RB AMT | | |
| | |
| | |
| | |
City of Modesto California Water Revenue COP, VRDN, 3.20%, 08/07/24 (AGM)(a) | | |
Compton Community Redevelopment Agency Successor Agency TA, 5.00%, 08/01/26 (AGM) | | |
Compton Unified School District/California GO, 5.00%, 06/01/25 (BAM) | | |
Contra Costa Water District RB, 5.00%, 10/01/25 | | |
County of Los Angeles California Revenue Notes, 5.00%, 06/30/25 | | |
County of Riverside California Revenue Notes, 5.00%, 06/30/25 | | |
| | |
|
Desert Community College District GO, 5.00%, 08/01/24 | | |
El Rancho Unified School District GO | | |
| | |
| | |
Kern Community College District GO, 0.00%, 11/01/25 (AGM)(c) | | |
Long Beach Unified School District GO | | |
| | |
VRDN, 3.64%, 08/07/24(a)(b) | | |
Los Angeles County Capital Asset Leasing Corp., 3.50%, 08/15/24 | | |
Los Angeles Unified School District/California GO, 5.00%, 07/01/25 | | |
Madera Unified School District COP, 5.00%, 09/01/24 (AGM) | | |
Norman Y Mineta San Jose International Airport SJC RB AMT, 5.00%, 03/01/26 | | |
Northern California Energy Authority RB | | |
| | |
| | |
Northern California Transmission Agency RB, 5.00%, 05/01/27 | | |
Pajaro Valley Unified School District GO | | |
| | |
| | |
Port of Oakland RB AMT, 5.00%, 05/01/27 | | |
Poway Unified School District Public Financing Authority ST, 5.00%, 09/01/27 (BAM) | | |
Rancho Cucamonga Redevelopment Agency Successor Agency TA, 5.00%, 09/01/26 (AGM) | | |
Redding Joint Powers Financing Authority RB, 5.00%, 06/01/25 | | |
Sacramento City Unified School District/California GO, 8.00%, 08/01/25 (AGM) | | |
San Diego County Water Authority | | |
| | |
| | |
San Diego Public Facilities Financing Authority RB, VRDN, 3.63%, 08/07/24(a)(b) | | |
San Diego Unified School District/California Revenue Notes, 5.00%, 06/30/25 | | |
San Francisco City & County Airport Commission San Francisco International Airport RB AMT | | |
| | |
| | |
San Francisco City & County Public Utilities Commission Power Revenue, 3.58%, 08/07/24 | | |
San Leandro Unified School District GO, 5.00%, 08/01/25 | | |
San Mateo Union High School District GO | | |
VRDN, 3.90%, 08/01/24(a)(b) | | |
Series C, 0.00%, 09/01/27 (NPFGC)(c) | | |
Santa Clara County Financing Authority RB, 5.00%, 05/15/25 | | |
Santa Clara Valley Water District, 3.65%, 09/05/24 | | |
Southern California Public Power Authority RB | | |
| | |
| | |
State of California Department of Water Resources | | |
| | |
| | |
Stockton Public Financing Authority, 5.00%, 10/01/25 (BAM) | | |
University of California, 3.45%, 08/15/24 | | |
752024 BlackRock Annual Financial Statements
Schedule of Investments (continued)July 31, 2024
BlackRock Short-Term California Muni Bond ETF(Percentages shown are based on Net Assets)
| | |
|
University of California RB | | |
| | |
Series AL 4, VRDN, 3.85%, 08/01/24(a) | | |
Yucaipa Valley Water District Financing Authority RB, 5.00%, 06/01/26 | | |
| | |
Total Investments — 102.5%
(Cost: $33,420,865) | |
Liabilities in Excess of Other Assets — (2.5)% | |
| |
| Variable rate security. Rate as of period end and maturity is the date the principal owed can be recovered through demand. |
| Security exempt from registration pursuant to Rule 144A under the Securities Act of 1933, as amended. These securities may be resold in transactions exempt from registration to qualified institutional investors. |
| |
Affiliates
Investments in issuers considered to be affiliate(s) of the Fund during the year ended July 31, 2024 for purposes of Section 2(a)(3) of the Investment Company Act of 1940, as amended, were as follows:
| | | | | Change in
Unrealized
Appreciation
(Depreciation) | | | | Capital
Gain
Distributions
from
Underlying
Funds |
BlackRock Liquidity Funds California Money Fund Portfo- lio(a) | | | | | | | | | |
BlackRock Liquidity Funds: MuniCash(a) | | | | | | | | | |
| | | | | | | | | |
| As of period end, the entity is no longer held. |
| Represents net amount purchased (sold). |
Fair Value Hierarchy as of Period End
Various inputs are used in determining the fair value of financial instruments. For a description of the input levels and information about the Fund’s policy regarding valuation of financial instruments, refer to the Notes to Financial Statements.
The following table summarizes the Fund’s financial instruments categorized in the fair value hierarchy. The breakdown of the Fund’s financial instruments into major categories is disclosed in the Schedule of Investments above.
| | | | |
| | | | |
| | | | |
| | | | |
Municipal Debt Obligations | | | | |
See notes to financial statements.
Schedule of Investments76
Schedule of InvestmentsJuly 31, 2024
BlackRock Total Return ETF(Percentages shown are based on Net Assets)
| | |
|
AGL Core CLO 2 Ltd., 6.79%, 07/20/37, (3-mo. SOFR + 1.460%)(a)(b) | | |
Apidos CLO XXXIV, 6.69%, 01/20/35, (3-mo. SOFR + 1.412%)(a)(b) | | |
AREIT Ltd., 7.02%, 05/17/41, (1-mo. CME Term SOFR + 1.686%)(a)(b) | | |
Argent Securities Trust, 6.04%, 03/25/36, (1-mo. CME Term SOFR + 0.694%)(b) | | |
Bain Capital Credit CLO Ltd., 6.71%, 07/24/34, (3-mo. SOFR + 1.422%)(a)(b) | | |
Bear Stearns Structured Products Trust, 7.46%, 03/25/37, (1-mo. CME Term SOFR + 2.114%)(a)(b) | | |
Benefit Street Partners CLO IV Ltd., 7.22%, 04/20/34, (3-mo. SOFR + 1.900%)(a)(b) | | |
Buckhorn Park CLO Ltd., 7.19%, 07/18/34, (3-mo. SOFR + 1.911%)(a)(b) | | |
Carlyle Global Market Strategies CLO Ltd., 6.71%, 07/20/34, (3-mo. SOFR + 1.431%)(a)(b) | | |
| | |
8.39%, 07/18/31, (3-mo. SOFR + 3.112%)(a)(b) | | |
6.78%, 07/16/37, (3-mo. SOFR + 1.450%)(a)(b) | | |
Series 2014-2RA, Class A1, 6.60%, 04/24/30, (3-mo. SOFR + 1.312%)(a)(b) | | |
Citigroup Mortgage Loan Trust Inc., 9.21%, 07/25/37, (1-mo. CME Term SOFR + 3.864%)(b) | | |
College Ave Student Loans LLC | | |
| | |
| | |
CWABS Asset-Backed Certificates Trust | | |
| | |
5.88%, 04/25/46, (1-mo. CME Term SOFR + 0.534%)(b) | | |
| | |
| | |
| | |
Generate CLO 8 Ltd., 6.74%, 10/20/34, (3-mo. SOFR + 1.461%)(a)(b) | | |
GreenSky Home Improvement Trust, 5.67%, 07/25/59(a) | | |
JP Morgan Mortgage Acquisition Trust, 4.55%, 11/25/36(c) | | |
| | |
| | |
| | |
Madison Park Funding XXXIV Ltd., 6.67%, 04/25/32, (3-mo. SOFR + 1.382%)(a)(b) | | |
Morgan Stanley Mortgage Loan Trust, 6.51%, 10/25/36(c) | | |
Navient Private Education Loan Trust, 3.16%, 11/15/68(a) | | |
Navient Private Education Refi Loan Trust | | |
| | |
| | |
NYMT Trust, 7.38%, 05/25/64(a)(c) | | |
Octagon Investment Partners 20-R Ltd., 6.74%, 05/12/31, (3-mo. SOFR + 1.412%)(a)(b) | | |
Octagon Investment Partners 48 Ltd., 7.59%, 10/20/34, (3-mo. SOFR + 2.312%)(a)(b) | | |
| | |
OHA Credit Funding 6 Ltd., 6.68%, 07/20/34, (3-mo. SOFR + 1.402%)(a)(b) | | |
OHA Loan Funding Ltd., 6.80%, 07/20/37, (3-mo. SOFR + 1.460%)(a)(b) | | |
Onemain Financial Issuance Trust, 5.79%, 05/14/41(a) | | |
Palmer Square CLO Ltd., 6.73%, 11/14/34, (3-mo. SOFR + 1.412%)(a)(b) | | |
Palmer Square Loan Funding Ltd., 6.40%, 04/15/31, (3-mo. SOFR + 1.100%)(a)(b) | | |
Pikes Peak CLO 8, 7.29%, 07/20/34, (3-mo. SOFR + 2.012%)(a)(b) | | |
PRET LLC, 7.00%, 07/25/54(a)(c) | | |
Progress Residential Trust, 4.75%, 10/17/40(a) | | |
Regatta IX Funding Ltd., 7.32%, 04/17/37, (3-mo. SOFR + 2.000%)(a)(b) | | |
RR 16 Ltd., 7.21%, 07/15/36, (3-mo. SOFR + 1.911%)(a)(b) | | |
RR 18 Ltd., 7.16%, 10/15/34, (3-mo. SOFR + 1.861%)(a)(b) | | |
Saxon Asset Securities Trust, 3.12%, 08/25/35(c) | | |
SMB Private Education Loan Trust | | |
| | |
| | |
Sofi Professional Loan Program LLC, 3.09%, 08/17/48(a) | | |
SoFi Professional Loan Program LLC, 2.37%, 11/16/48(a) | | |
Soundview Home Loan Trust | | |
6.48%, 11/25/35, (1-mo. CME Term SOFR + 1.134%)(b) | | |
5.81%, 01/25/37, (1-mo. CME Term SOFR + 0.474%)(b) | | |
Subway Funding LLC, 6.27%, 07/30/54(a) | | |
TICP CLO VIII Ltd., 7.24%, 10/20/34, (3-mo. SOFR + 1.962%)(a)(b) | | |
Total Asset-Backed Securities — 9.7%
(Cost: $8,787,089) | |
Collaterized Mortgage Obligations |
Asset-Backed Securities — 0.3% |
CSMC Trust, 9.26%, 12/25/67(a)(b) | | |
TRK Trust, 4.10%, 11/25/56(a)(b) | | |
Visio Trust, 6.02%, 08/25/57(a)(b) | | |
| | |
Mortgage-Backed Securities — 10.4% |
| | |
5.92%, 11/25/36, (1-mo. CME Term SOFR + 0.574%)(b) | | |
5.92%, 05/20/46, (1-mo. CME Term SOFR + 0.574%)(b) | | |
5.96%, 07/25/46, (1-mo. CME Term SOFR + 0.614%)(b) | | |
6.12%, 11/20/35, (1-mo. CME Term SOFR + 0.774%)(b) | | |
American Home Mortgage Investment Trust, 7.08%, 05/25/36, (1-mo. CME Term SOFR + 1.739%)(b) | | |
Angel Oak Mortgage Trust, 5.21%, 08/25/68(a)(c) | | |
772024 BlackRock Annual Financial Statements
Schedule of Investments (continued)July 31, 2024
BlackRock Total Return ETF(Percentages shown are based on Net Assets)
| | |
Mortgage-Backed Securities (continued) |
Arbor Multifamily Mortgage Securities Trust, 3.29%, 02/15/55(a)(b) | | |
ARES Commercial Mortgage Trust, 7.02%, 07/15/41, (1-mo. CME Term SOFR + 1.692%)(a)(b) | | |
Banc of America Alternative Loan Trust | | |
| | |
| | |
Banc of America Funding Trust, 5.75%, 01/25/37 | | |
Bank of America Merrill Lynch Commercial Mortgage Trust, Series 2017-BNK33.88%, 02/15/50(b) | | |
Bank5 Trust, 6.23%, 05/15/57 | | |
Bear Stearns Asset Backed Securities I Trust | | |
5.81%, 03/25/36, (1-mo. CME Term SOFR + 0.464%)(b) | | |
6.02%, 04/25/36, (1-mo. CME Term SOFR + 0.674%)(b) | | |
Bear Stearns Mortgage Funding Trust, 5.80%, 03/25/37, (1-mo. CME Term SOFR + 0.454%)(b) | | |
BFLD Mortgage Trust, 7.19%, 07/15/41, (1-mo. CME Term SOFR + 1.890%)(a)(b) | | |
| | |
6.88%, 07/15/35, (1-mo. CME Term SOFR + 1.547%)(a)(b) | | |
7.13%, 07/15/35, (1-mo. CME Term SOFR + 1.797%)(a)(b) | | |
BMP, 8.72%, 06/15/41, (1-mo. CME Term SOFR + 3.389%)(a)(b) | | |
BX Commercial Mortgage Trust | | |
| | |
6.37%, 10/15/37, (1-mo. CME Term SOFR + 1.044%)(a)(b) | | |
6.87%, 05/15/34, (1-mo. CME Term SOFR + 1.541%)(a)(b) | | |
6.97%, 05/15/41, (1-mo. CME Term SOFR + 1.641%)(a)(b) | | |
6.99%, 08/15/39, (1-mo. CME Term SOFR + 1.691%)(a)(b) | | |
7.09%, 12/09/40, (1-mo. CME Term SOFR + 1.761%)(a)(b) | | |
8.47%, 06/15/27, (1-mo. CME Term SOFR + 3.141%)(a)(b) | | |
9.52%, 02/15/39, (1-mo. CME Term SOFR + 4.188%)(a)(b) | | |
| | |
6.18%, 01/15/39, (1-mo. CME Term SOFR + 0.850%)(a)(b) | | |
6.33%, 01/15/39, (1-mo. CME Term SOFR + 1.000%)(a)(b) | | |
6.34%, 10/15/36, (1-mo. CME Term SOFR + 1.0136%)(a)(b) | | |
6.82%, 07/15/29, (1-mo. CME Term SOFR + 1.491%)(a)(b) | | |
6.87%, 06/15/37, (1-mo. CME Term SOFR + 1.541%)(a)(b) | | |
7.42%, 03/15/41, (1-mo. CME Term SOFR + 2.090%)(a)(b) | | |
7.49%, 08/15/39, (1-mo. CME Term SOFR + 2.165%)(a)(b) | | |
| | |
Mortgage-Backed Securities (continued) |
8.02%, 04/15/41, (1-mo. CME Term SOFR + 2.690%)(a)(b) | | |
8.22%, 07/15/29, (1-mo. CME Term SOFR + 2.889%)(a)(b) | | |
8.54%, 08/15/42, (1-mo. CME Term SOFR + 3.213%)(a)(b) | | |
8.67%, 05/15/38, (1-mo. CME Term SOFR + 3.339%)(a)(b) | | |
9.02%, 04/15/41, (1-mo. CME Term SOFR + 3.689%)(a)(b) | | |
9.27%, 07/15/29, (1-mo. CME Term SOFR + 3.938%)(a)(b) | | |
9.37%, 06/15/36, (1-mo. CME Term SOFR + 4.044%)(a)(b) | | |
9.77%, 03/15/41, (1-mo. CME Term SOFR + 4.439%)(a)(b) | | |
10.72%, 03/15/41, (1-mo. CME Term SOFR + 5.389%)(a)(b) | | |
CFK Trust, 2.79%, 03/15/39(a) | | |
Chase Mortgage Finance Trust | | |
| | |
| | |
| | |
6.74%, 11/15/37, (1-mo. CME Term SOFR + 1.414%)(a)(b) | | |
8.94%, 11/15/37, (1-mo. CME Term SOFR + 3.607%)(a)(b) | | |
Series 2020-ICE5, Class A, 6.34%, 11/15/37, (1-mo. CME Term SOFR + 1.014%)(a)(b) | | |
Commission Mortgage Trust | | |
7.17%, 06/15/41, (1-mo. CME Term SOFR + 1.841%)(a)(b) | | |
7.92%, 06/15/41, (1-mo. CME Term SOFR + 2.590%)(a)(b) | | |
9.81%, 06/15/41, (1-mo. CME Term SOFR + 4.487%)(a)(b) | | |
| | |
6.94%, 08/15/26, (1-mo. CME Term SOFR + 1.642%)(a)(b) | | |
9.19%, 08/15/26, (1-mo. CME Term SOFR + 3.888%)(a)(b) | | |
Countrywide Alternative Loan Trust, 6.00%, 05/25/36 | | |
DBGS, 7.20%, 08/15/39, (1-mo. CME Term SOFR + 1.882%)(a)(b) | | |
DC Trust, 5.73%, 04/13/28(a)(b) | | |
| | |
6.83%, 03/15/34, (1-mo. CME Term SOFR + 1.500%)(a)(b) | | |
9.33%, 03/15/34, (1-mo. CME Term SOFR + 4.000%)(a)(b) | | |
| | |
| | |
| | |
| | |
EQT Trust, 5.33%, 07/05/41(a)(b) | | |
Extended Stay America Trust, 7.69%, 07/15/38, (1-mo. CME Term SOFR + 2.364%)(a)(b) | | |
First Horizon Alternative Mortgage Securities Trust, 5.44%, 01/25/37(b) | | |
FREMF Mortgage Trust, 4.23%, 08/25/50(a)(b) | | |
Schedule of Investments78
Schedule of Investments (continued)July 31, 2024
BlackRock Total Return ETF(Percentages shown are based on Net Assets)
| | |
Mortgage-Backed Securities (continued) |
| | |
| | |
| | |
| | |
Government National Mortgage Association | | |
| | |
| | |
GWT, 7.02%, 05/15/41, (1-mo. CME Term SOFR + 1.691%)(a)(b) | | |
HLTN Commercial Mortgage Trust, 6.97%, 06/15/41, (1-mo. CME Term SOFR + 1.642%)(a)(b) | | |
Homeward Opportunities Fund I Trust, 5.45%, 05/25/65(a)(b) | | |
HONO Mortgage Trust, 6.59%, 10/15/36, (1-mo. CME Term SOFR + 1.264%)(a)(b) | | |
JP Morgan Alternative Loan Trust, 4.96%, 03/25/36(b) | | |
JP Morgan Chase Commercial Mortgage Securities Trust | | |
| | |
7.51%, 09/15/39, (1-mo. CME Term SOFR + 2.179%)(a)(b) | | |
8.14%, 04/15/38, (1-mo. CME Term SOFR + 2.814%)(a)(b) | | |
JP Morgan Resecuritization Trust Series, 0.00% 05/27/36(a)(b) | | |
JW Commercial Mortgage Trust | | |
6.95%, 06/15/39, (1-mo. CME Term SOFR + 1.621%)(a)(b) | | |
8.52%, 06/15/39, (1-mo. CME Term SOFR + 3.189%)(a)(b) | | |
KSL Commercial Mortgage Trust, 9.62%, 12/15/36, (1-mo. CME Term SOFR + 4.287%)(a)(b) | | |
| | |
6.92%, 06/15/26, (1-mo. CME Term SOFR + 1.591%)(a)(b) | | |
9.77%, 06/15/26, (1-mo. CME Term SOFR + 4.437%)(a)(b) | | |
MASTR Reperforming Loan Trust, 7.00%, 08/25/34(a) | | |
| | |
| | |
| | |
8.44%, 02/15/37, (1-mo. CME Term SOFR + 3.107%)(a)(b) | | |
| | |
MFA Trust, 7.09%, 02/25/29(a)(c) | | |
Morgan Stanley Capital I Trust, 6.88%, 11/15/34, (1-mo. CME Term SOFR + 1.547%)(a)(b) | | |
MSWF Commercial Mortgage Trust, 6.01%, 12/15/56(b) | | |
MTN Commercial Mortgage Trust, 6.73%, 03/15/39, (1-mo. CME Term SOFR + 1.396%)(a)(b) | | |
One New York Plaza Trust, 6.39%, 01/15/36, (1-mo. CME Term SOFR + 1.064%)(a)(b) | | |
OPEN Trust, 8.42%, 10/15/28, (1-mo. CME Term SOFR + 3.0891%)(a)(b) | | |
| | |
Mortgage-Backed Securities (continued) |
ORL Trust, 7.68%, 10/19/36, (1-mo. CME Term SOFR + 2.350%)(a)(b) | | |
PGA Trust, 7.22%, 06/15/39, (1-mo. CME Term SOFR + 1.891%)(a)(b) | | |
| | |
| | |
| | |
PRKCM Trust, 4.10%, 04/25/57(a)(b) | | |
RALI Series Trust, 5.82%, 12/25/36, (1-mo. CME Term SOFR + 0.474%)(b) | | |
Saluda Grade Alternative Mortgage Trust | | |
| | |
| | |
SLG Office Trust, 2.59%, 07/15/41(a) | | |
Taubman Centers Commercial Mortgage Trust, 7.51%, 05/15/37, (1-mo. CME Term SOFR + 2.186%)(a)(b) | | |
TPGI Trust, 7.79%, 06/15/26, (1-mo. CME Term SOFR + 2.464%)(a)(b) | | |
TTAN, 6.79%, 03/15/38, (1-mo. CME Term SOFR + 1.464%)(a)(b) | | |
Velocity Commercial Capital Loan Trust | | |
| | |
| | |
Washington Mutual Mortgage Pass-Through Certificates WMALT Series Trust | | |
5.80%, 12/25/36, (1-mo. CME Term SOFR + 0.454%)(b) | | |
5.89%, 12/25/46, (12-mo. MTA + 0.720%)(b) | | |
Wells Fargo Commercial Mortgage Trust | | |
| | |
| | |
| | |
| | |
| | |
| | |
Series 2015-C31, Class B, 4.48%, 11/15/48(b) | | |
| | |
Total Collaterized Mortgage Obligations — 10.7%
(Cost: $9,759,424) | |
|
|
Clear Channel Outdoor Holdings Inc., 5.13%, 08/15/27(a) | | |
Aerospace & Defense — 1.1% |
| | |
| | |
| | |
L3Harris Technologies Inc. | | |
| | |
| | |
| | |
| | |
| | |
| | |
Series B, 6.15%, 09/01/36 | | |
| | |
| | |
792024 BlackRock Annual Financial Statements
Schedule of Investments (continued)July 31, 2024
BlackRock Total Return ETF(Percentages shown are based on Net Assets)
| | |
Aerospace & Defense (continued) |
| | |
| | |
| | |
| | |
| | |
| | |
TransDigm Inc., 4.63%, 01/15/29 | | |
| | |
|
| | |
| | |
| | |
| | |
| | |
| | |
| | |
| | |
| | |
| | |
| | |
Philip Morris International Inc. | | |
| | |
| | |
| | |
| | |
|
American Airlines Inc./AAdvantage Loyalty IP Ltd., 5.75%, 04/20/29(a) | | |
United Airlines Inc., 4.63%, 04/15/29(a) | | |
United Airlines Pass-Through Trust, Series 24-A, 5.88%, 08/15/38 | | |
| | |
|
Hanesbrands Inc., 9.00%, 02/15/31(a)(d) | | |
| | |
| | |
| | |
| | |
Auto Manufacturers — 0.2% |
General Motors Financial Co. Inc. | | |
| | |
| | |
| | |
Auto Parts & Equipment — 0.0% |
American Axle & Manufacturing Inc., 5.00%, 10/01/29 | | |
|
| | |
1.90%, 07/23/31, (1-day SOFR + 1.530%)(b) | | |
2.50%, 02/13/31, (3-mo. SOFR + 1.252%)(b) | | |
2.83%, 10/24/51, (1-day SOFR + 1.880%)(b) | | |
| | |
5.47%, 01/23/35, (1-day SOFR + 1.650%)(b) | | |
| | |
3.06%, 01/25/33, (1-day SOFR + 1.351%)(b) | | |
3.07%, 02/24/28, (1-day SOFR + 1.280%)(b) | | |
4.91%, 05/24/33, (1-day SOFR + 2.086%)(b) | | |
5.17%, 02/13/30, (1-day SOFR + 1.364%)(b) | | |
5.45%, 06/11/35, (1-day SOFR + 1.447%)(b) | | |
| | |
|
Goldman Sachs Group Inc. (The) | | |
1.43%, 03/09/27, (1-day SOFR + 0.798%)(b) | | |
1.54%, 09/10/27, (1-day SOFR + 0.818%)(b) | | |
1.95%, 10/21/27, (1-day SOFR + 0.913%)(b) | | |
1.99%, 01/27/32, (1-day SOFR + 1.090%)(b) | | |
| | |
2.62%, 04/22/32, (1-day SOFR + 1.281%)(b) | | |
2.65%, 10/21/32, (1-day SOFR + 1.264%)(b) | | |
2.91%, 07/21/42, (1-day SOFR + 1.472%)(b) | | |
3.21%, 04/22/42, (1-day SOFR + 1.513%)(b) | | |
3.69%, 06/05/28, (3-mo. SOFR + 1.772%)(b) | | |
| | |
5.05%, 07/23/30, (1-day SOFR + 1.210%)(b) | | |
5.33%, 07/23/35, (1-day SOFR + 1.550%)(b) | | |
5.73%, 04/25/30, (1-day SOFR +1.265%)(b) | | |
| | |
| | |
1.76%, 11/19/31, (3-mo. SOFR + 1.105%)(b) | | |
1.95%, 02/04/32, (1-day SOFR + 1.065%)(b) | | |
2.58%, 04/22/32, (3-mo. SOFR + 1.250%)(b) | | |
3.11%, 04/22/51, (1-day SOFR + 2.440%)(b) | | |
3.33%, 04/22/52, (1-day SOFR + 1.580%)(b) | | |
3.96%, 11/15/48, (3-mo. SOFR + 1.642%)(b) | | |
4.98%, 07/22/28, (1-day SOFR +0.930%)(b) | | |
5.00%, 07/22/30, (1-day SOFR +1.125%)(b) | | |
5.29%, 07/22/35, (1-day SOFR +1.460%)(b) | | |
5.57%, 04/22/28, (1-day SOFR +0.930%)(b) | | |
5.58%, 04/22/30, (1-day SOFR +1.160%)(b) | | |
5.77%, 04/22/35, (1-day SOFR +1.490%)(b) | | |
| | |
1.79%, 02/13/32, (1-day SOFR + 1.034%)(b) | | |
1.93%, 04/28/32, (1-day SOFR + 1.020%)(b) | | |
2.24%, 07/21/32, (1-day SOFR + 1.178%)(b) | | |
2.51%, 10/20/32, (1-day SOFR + 1.200%)(b) | | |
2.70%, 01/22/31, (1-day SOFR + 1.143%)(b) | | |
2.94%, 01/21/33, (1-day SOFR + 1.290%)(b) | | |
5.04%, 07/19/30, (1-day SOFR +1.215%)(b) | | |
5.32%, 07/19/35, (1-day SOFR +1.555%)(b) | | |
5.66%, 04/18/30, (1-day SOFR +1.260%)(b) | | |
5.83%, 04/19/35, (1-day SOFR +1.580%)(b) | | |
6.41%, 11/01/29, (1-day SOFR + 1.830%)(b) | | |
| | |
| | |
4.61%, 04/25/53, (1-day SOFR + 2.130%)(b) | | |
5.01%, 04/04/51, (3-mo. SOFR + 4.502%)(b) | | |
5.50%, 01/23/35, (1-day SOFR + 1.780%)(b) | | |
6.49%, 10/23/34, (1-day SOFR + 2.060%)(b) | | |
| | |
|
| | |
| | |
| | |
| | |
|
| | |
| | |
| | |
| | |
| | |
| | |
Schedule of Investments80
Schedule of Investments (continued)July 31, 2024
BlackRock Total Return ETF(Percentages shown are based on Net Assets)
| | |
Biotechnology (continued) |
| | |
| | |
| | |
| | |
|
Chemours Co. (The), 5.75%, 11/15/28(a) | | |
Ecolab Inc., 2.13%, 08/15/50(d) | | |
Olin Corp., 5.00%, 02/01/30 | | |
| | |
Commercial Services — 0.1% |
Allied Universal Holdco LLC, 7.88%, 02/15/31(a) | | |
| | |
| | |
| | |
Moody's Corp., 2.00%, 08/19/31 | | |
| | |
|
Dell International LLC/EMC Corp., 4.90%, 10/01/26 | | |
| | |
| | |
| | |
Hewlett Packard Enterprise Co., 5.25%, 07/01/28(d) | | |
| | |
Cosmetics & Personal Care — 0.0% |
Colgate-Palmolive Co., 3.70%, 08/01/47 | | |
Diversified Financial Services — 0.2% |
American Express Co., 5.04%, 07/26/28, (1-day SOFR + 0.930%)(b) | | |
| | |
| | |
| | |
| | |
Nationstar Mortgage Holdings Inc., 5.13%, 12/15/30(a) | | |
Navient Corp., 5.50%, 03/15/29 | | |
PennyMac Financial Services Inc., 5.38%, 10/15/25(a) | | |
Rocket Mortgage LLC/Rocket Mortgage Co-Issuer Inc., 2.88%, 10/15/26(a) | | |
Visa Inc., 2.00%, 08/15/50(d) | | |
| | |
|
| | |
| | |
Series G, 4.15%, 05/01/49 | | |
Series H, 3.45%, 01/15/50 | | |
| | |
| | |
| | |
| | |
| | |
Series M, 3.65%, 04/01/50 | | |
| | |
| | |
| | |
| | |
| | |
|
Algonquin Power & Utilities Corp., 5.37%, 06/15/26(c) | | |
Baltimore Gas & Electric Co. | | |
| | |
| | |
| | |
CenterPoint Energy Houston Electric LLC, Series AD, 2.90%, 07/01/50 | | |
Consumers Energy Co., 3.75%, 02/15/50 | | |
Dominion Energy South Carolina Inc., 6.25%, 10/15/53 | | |
Duke Energy Carolinas LLC | | |
| | |
| | |
| | |
| | |
| | |
| | |
| | |
Duke Energy Ohio Inc., 5.55%, 03/15/54 | | |
| | |
| | |
| | |
| | |
| | |
| | |
| | |
| | |
| | |
| | |
Series M, 3.30%, 01/15/28 | | |
Series O, 4.25%, 04/01/29 | | |
| | |
Series B, 3.90%, 07/15/27 | | |
Series C, 3.40%, 03/01/50 | | |
Series C, 4.85%, 07/15/47 | | |
FirstEnergy Transmission LLC, 4.55%, 04/01/49(a) | | |
Florida Power & Light Co. | | |
| | |
| | |
| | |
Georgia Power Co., 4.95%, 05/17/33 | | |
| | |
| | |
| | |
| | |
| | |
Northern States Power Co./MN | | |
| | |
| | |
NRG Energy Inc., 3.63%, 02/15/31(a) | | |
| | |
| | |
| | |
Series Q, 1.63%, 01/15/31 | | |
Pacific Gas and Electric Co. | | |
| | |
| | |
| | |
812024 BlackRock Annual Financial Statements
Schedule of Investments (continued)July 31, 2024
BlackRock Total Return ETF(Percentages shown are based on Net Assets)
| | |
|
| | |
| | |
| | |
Public Service Electric & Gas Co. | | |
| | |
| | |
San Diego Gas & Electric Co. | | |
Series RRR, 3.75%, 06/01/47 | | |
Series WWW, 2.95%, 08/15/51 | | |
Southern California Edison Co. | | |
| | |
| | |
| | |
| | |
| | |
| | |
Series G, 2.50%, 06/01/31 | | |
Vistra Operations Co. LLC | | |
| | |
| | |
| | |
| | |
Electrical Components & Equipment — 0.0% |
Energizer Holdings Inc., 4.38%, 03/31/29(a) | | |
|
Honeywell International Inc. | | |
| | |
| | |
| | |
| | |
|
Caesars Entertainment Inc. | | |
| | |
| | |
Churchill Downs Inc., 6.75%, 05/01/31(a) | | |
Premier Entertainment Sub LLC/Premier Entertainment Finance Corp., 5.63%, 09/01/29(a) | | |
Wynn Resorts Finance LLC/Wynn Resorts Capital Corp., 5.13%, 10/01/29(a) | | |
| | |
Environmental Control — 0.0% |
Reworld Holding Corp., 4.88%, 12/01/29(a) | | |
|
CenterPoint Energy Resources Corp. | | |
| | |
| | |
| | |
| | |
| | |
ONE Gas Inc., 5.10%, 04/01/29 | | |
Piedmont Natural Gas Co. Inc., 2.50%, 03/15/31 | | |
| | |
Health Care - Products — 0.2% |
Agilent Technologies Inc., 2.30%, 03/12/31 | | |
Bausch & Lomb Corp., 8.38%, 10/01/28(a) | | |
Medline Borrower LP, 3.88%, 04/01/29(a) | | |
| | |
Health Care - Products (continued) |
| | |
| | |
| | |
Thermo Fisher Scientific Inc. | | |
| | |
| | |
| | |
Health Care - Services — 1.1% |
CHS/Community Health Systems Inc., 5.63%, 03/15/27(a) | | |
| | |
| | |
| | |
| | |
Fortrea Holdings Inc., 7.50%, 07/01/30(a)(d) | | |
| | |
| | |
| | |
| | |
| | |
| | |
| | |
| | |
Molina Healthcare Inc., 4.38%, 06/15/28(a) | | |
Tenet Healthcare Corp., 4.63%, 06/15/28 | | |
| | |
| | |
| | |
| | |
| | |
| | |
| | |
| | |
| | |
| | |
| | |
Holding Companies - Diversified — 0.0% |
Blue Owl Credit Income Corp., 6.60%, 09/15/29(a) | | |
|
Taylor Morrison Communities Inc., 5.75%, 01/15/28(a) | | |
|
American International Group Inc., 4.38%, 06/30/50 | | |
Marsh & McLennan Companies Inc. | | |
| | |
| | |
| | |
| | |
| | |
|
| | |
| | |
| | |
| | |
Match Group Holdings II LLC, 4.63%, 06/01/28(a) | | |
Schedule of Investments82
Schedule of Investments (continued)July 31, 2024
BlackRock Total Return ETF(Percentages shown are based on Net Assets)
| | |
|
| | |
| | |
| | |
| | |
|
Cleveland-Cliffs Inc., 6.75%, 04/15/30(a) | | |
Mineral Resources Ltd., 9.25%, 10/01/28(a) | | |
| | |
|
NCL Corp. Ltd., 5.88%, 02/15/27(a) | | |
Viking Cruises Ltd., 7.00%, 02/15/29(a) | | |
| | |
|
Hilton Grand Vacations Borrower Escrow LLC/Hilton Grand Vacations Borrower Esc, 4.88%, 07/01/31(a) | | |
Las Vegas Sands Corp., 5.90%, 06/01/27 | | |
Marriott International Inc./MD | | |
| | |
Series II, 2.75%, 10/15/33 | | |
MGM Resorts International | | |
| | |
| | |
| | |
|
Caterpillar Inc., 3.25%, 09/19/49 | | |
CNH Industrial Capital LLC, 5.45%, 10/14/25 | | |
| | |
|
Textron Inc., 3.90%, 09/17/29 | | |
|
AMC Networks Inc., 4.25%, 02/15/29 | | |
CCO Holdings LLC/CCO Holdings Capital Corp. | | |
| | |
| | |
Charter Communications Operating LLC/Charter Communications Operating Capital | | |
| | |
| | |
| | |
| | |
| | |
| | |
| | |
| | |
| | |
Directv Financing LLC/Directv Financing Co-Obligor Inc., 5.88%, 08/15/27(a) | | |
FactSet Research Systems Inc., 3.45%, 03/01/32 | | |
Nexstar Media Inc., 4.75%, 11/01/28(a) | | |
| | |
| | |
| | |
| | |
| | |
| | |
6.38%, 03/30/62, (5-year CMT + 3.999%)(b) | | |
Sirius XM Radio Inc., 4.00%, 07/15/28(a) | | |
TEGNA Inc., 4.63%, 03/15/28 | | |
| | |
|
Univision Communications Inc., 7.38%, 06/30/30(a) | | |
| | |
|
FMG Resources August 2006 Pty. Ltd., 4.50%, 09/15/27(a) | | |
| | |
| | |
| | |
Newmont Corp., 2.25%, 10/01/30 | | |
| | |
|
Antero Resources Corp., 5.38%, 03/01/30(a) | | |
| | |
| | |
| | |
| | |
BP Capital Markets America Inc. | | |
| | |
| | |
| | |
Chevron USA Inc., 2.34%, 08/12/50 | | |
Civitas Resources Inc., 8.38%, 07/01/28(a) | | |
Comstock Resources Inc., 6.75%, 03/01/29(a) | | |
Crescent Energy Finance LLC, 9.25%, 02/15/28(a) | | |
Devon Energy Corp., 5.25%, 10/15/27 | | |
| | |
| | |
| | |
| | |
| | |
| | |
| | |
| | |
| | |
| | |
| | |
| | |
| | |
| | |
| | |
| | |
| | |
| | |
| | |
Hilcorp Energy I LP/Hilcorp Finance Co., 6.00%, 02/01/31(a) | | |
Occidental Petroleum Corp. | | |
| | |
| | |
| | |
Ovintiv Inc., 5.65%, 05/15/25 | | |
Permian Resources Operating LLC, 8.00%, 04/15/27(a) | | |
SM Energy Co., 6.63%, 01/15/27 | | |
Southwestern Energy Co., 5.38%, 03/15/30 | | |
| | |
Packaging & Containers — 0.1% |
Berry Global Inc., 1.65%, 01/15/27 | | |
832024 BlackRock Annual Financial Statements
Schedule of Investments (continued)July 31, 2024
BlackRock Total Return ETF(Percentages shown are based on Net Assets)
| | |
Packaging & Containers (continued) |
Mauser Packaging Solutions Holding Co., 7.88%, 04/15/27(a) | | |
Owens-Brockway Glass Container Inc., 7.25%, 05/15/31(a) | | |
| | |
|
AbbVie Inc., 5.05%, 03/15/34 | | |
| | |
| | |
| | |
| | |
| | |
| | |
CVS Health Corp., 4.25%, 04/01/50 | | |
Eli Lilly & Co., 2.25%, 05/15/50 | | |
| | |
| | |
| | |
Pfizer Investment Enterprises Pte Ltd., 5.30%, 05/19/53 | | |
| | |
|
| | |
| | |
| | |
Cheniere Corpus Christi Holdings LLC | | |
| | |
| | |
Cheniere Energy Inc., 5.65%, 04/15/34(a) | | |
Cheniere Energy Partners LP | | |
| | |
| | |
| | |
| | |
| | |
DT Midstream Inc., 4.13%, 06/15/29(a) | | |
Enbridge Inc., 2.50%, 08/01/33 | | |
| | |
| | |
| | |
| | |
| | |
| | |
| | |
| | |
| | |
EnLink Midstream Partners LP | | |
| | |
| | |
| | |
EQM Midstream Partners LP, 4.13%, 12/01/26 | | |
Kinder Morgan Energy Partners LP, 4.70%, 11/01/42 | | |
| | |
| | |
| | |
| | |
NGL Energy Operating LLC/NGL Energy Finance Corp., 8.38%, 02/15/32(a) | | |
| | |
|
| | |
| | |
| | |
| | |
Northwest Pipeline LLC, 4.00%, 04/01/27 | | |
Sabine Pass Liquefaction LLC | | |
| | |
| | |
| | |
| | |
| | |
Tallgrass Energy Partners LP/Tallgrass Energy Finance Corp., 6.00%, 03/01/27(a) | | |
Targa Resources Corp., 4.20%, 02/01/33 | | |
Targa Resources Partners LP/Targa Resources Partners Finance Corp. | | |
| | |
| | |
| | |
Texas Eastern Transmission LP, 7.00%, 07/15/32 | | |
Transcontinental Gas Pipe Line Co. LLC | | |
| | |
| | |
| | |
| | |
Venture Global Calcasieu Pass LLC, 3.88%, 08/15/29(a) | | |
Venture Global LNG Inc., 8.13%, 06/01/28(a) | | |
| | |
|
Howard Hughes Corp. (The), 5.38%, 08/01/28(a) | | |
Real Estate Investment Trusts — 2.1% |
| | |
| | |
| | |
| | |
| | |
| | |
| | |
| | |
| | |
| | |
| | |
| | |
| | |
| | |
| | |
Extra Space Storage LP, 2.35%, 03/15/32 | | |
GLP Capital LP / GLP Financing II Inc., 6.25%, 09/15/54 | | |
GLP Capital LP/GLP Financing II Inc. | | |
| | |
| | |
| | |
Iron Mountain Inc., 4.50%, 02/15/31(a) | | |
| | |
| | |
| | |
Schedule of Investments84
Schedule of Investments (continued)July 31, 2024
BlackRock Total Return ETF(Percentages shown are based on Net Assets)
| | |
Real Estate Investment Trusts (continued) |
| | |
| | |
| | |
| | |
| | |
| | |
| | |
VICI Properties LP/VICI Note Co. Inc. | | |
| | |
| | |
| | |
| | |
| | |
| | |
| | |
|
| | |
| | |
| | |
| | |
| | |
| | |
| | |
| | |
| | |
|
Advanced Micro Devices Inc., 4.39%, 06/01/52 | | |
| | |
| | |
| | |
| | |
| | |
| | |
| | |
| | |
| | |
| | |
| | |
Lam Research Corp., 3.13%, 06/15/60 | | |
NXP BV/NXP Funding LLC/NXP USA Inc. | | |
| | |
| | |
| | |
| | |
| | |
| | |
|
Cloud Software Group Inc., 6.50%, 03/31/29(a) | | |
MSCI Inc., 4.00%, 11/15/29(a) | | |
| | |
| | |
| | |
| | |
| | |
| | |
| | |
| | |
| | |
| | |
| | |
Telecommunications — 1.4% |
| | |
| | |
| | |
| | |
| | |
| | |
| | |
| | |
| | |
| | |
Frontier Communications Holdings LLC | | |
| | |
| | |
Motorola Solutions Inc., 5.60%, 06/01/32 | | |
Rogers Communications Inc., 5.30%, 02/15/34 | | |
| | |
| | |
| | |
Verizon Communications Inc. | | |
| | |
| | |
| | |
| | |
| | |
| | |
| | |
|
Burlington Northern Santa Fe LLC | | |
| | |
| | |
| | |
| | |
| | |
| | |
Norfolk Southern Corp., 3.16%, 05/15/55 | | |
| | |
| | |
| | |
| | |
| | |
| | |
Trucking & Leasing — 0.0% |
GATX Corp., 6.05%, 06/05/54 | | |
Total Corporate Bonds & Notes — 24.0%
(Cost: $21,707,866) | |
Foreign Government Obligations |
|
Kingdom of Belgium Government Bond, 3.30%, 06/22/54(a)(e) | | |
|
Brazil Notas do Tesouro Nacional | | |
| | |
| | |
Series F, 10.00%, 01/01/29 | | |
Brazilian Government International Bond, 6.13%, 03/15/34 | | |
| | |
852024 BlackRock Annual Financial Statements
Schedule of Investments (continued)July 31, 2024
BlackRock Total Return ETF(Percentages shown are based on Net Assets)
| | |
|
French Republic Government Bond OAT, 3.00%, 05/25/54(a)(e) | | |
|
European Union, 2.50%, 10/04/52(e) | | |
|
Indonesia Government International Bond, 2.85%, 02/14/30 | | |
|
Japan Government Thirty Year Bond, 1.80%, 03/20/54 | | |
|
| | |
| | |
Series M, 7.75%, 11/23/34 | | |
Series M 20, 8.50%, 05/31/29 | | |
Mexico Government International Bond | | |
| | |
| | |
| | |
|
Panama Government International Bond, 3.88%, 03/17/28 | | |
|
Peruvian Government International Bond, 3.55%, 03/10/51 | | |
|
Philippine Government International Bond, 3.00%, 02/01/28 | | |
|
European Union, 3.00%, 03/04/53(e) | | |
|
United Kingdom Gilt, 4.38%, 07/31/54(e) | | |
|
Uruguay Government International Bond, 5.10%, 06/18/50 | | |
Total Foreign Government Obligations — 4.7%
(Cost: $4,373,310) | |
Municipal Debt Obligations |
|
Bay Area Toll Authority RB BAB, Series S-1, 7.04%, 04/01/50 | | |
State of California GO, 4.60%, 04/01/38 | | |
University of California RB, Series AD, 4.86%, 05/15/12 | | |
| | |
|
State of Illinois GO, 5.10%, 06/01/33 | | |
|
Louisiana Local Government Environmental Facilities & Community Development Authority RB, 4.15%, 02/01/33 | | |
| | |
|
New Jersey State Turnpike Authority RB BAB, Series F, 7.41%, 01/01/40 | | |
|
Metropolitan Transportation Authority RB BAB, Series A, 5.87%, 11/15/39 | | |
New York City Municipal Water Finance Authority RB, 5.88%, 06/15/44 | | |
New York City Municipal Water Finance Authority RB BAB, 6.01%, 06/15/42 | | |
Port Authority of New York & New Jersey RB | | |
Series 168, 4.93%, 10/01/51 | | |
Series 181, 4.96%, 08/01/46 | | |
| | |
|
American Municipal Power Inc. RB, Series B, 8.08%, 02/15/50(d) | | |
|
City of San Antonio Texas Electric & Gas Systems Revenue RB BAB, 5.81%, 02/01/41 | | |
State of Texas GO BAB, 5.52%, 04/01/39 | | |
| | |
Total Municipal Debt Obligations — 0.6%
(Cost: $519,588) | |
U.S. Government & Agency Obligations |
Mortgage-Backed Securities — 33.2% |
Federal Home Loan Mortgage Corp., 4.50%, 07/01/47 | | |
Federal National Mortgage Association, 5.81%, 06/01/31 | | |
Government National Mortgage Association | | |
| | |
| | |
| | |
| | |
| | |
| | |
| | |
| | |
| | |
| | |
| | |
| | |
| | |
| | |
| | |
| | |
| | |
| | |
| | |
| | |
| | |
| | |
| | |
| | |
| | |
| | |
Schedule of Investments86
Schedule of Investments (continued)July 31, 2024
BlackRock Total Return ETF(Percentages shown are based on Net Assets)
| | |
Mortgage-Backed Securities (continued) |
Uniform Mortgage-Backed Securities | | |
| | |
| | |
| | |
| | |
| | |
| | |
| | |
| | |
| | |
| | |
| | |
| | |
| | |
| | |
| | |
| | |
| | |
| | |
| | |
| | |
| | |
| | |
| | |
| | |
| | |
| | |
| | |
| | |
| | |
| | |
| | |
| | |
| | |
| | |
| | |
| | |
| | |
| | |
| | |
| | |
| | |
| | |
| | |
| | |
| | |
| | |
| | |
| | |
| | |
| | |
| | |
| | |
| | |
| | |
| | |
| | |
| | |
| | |
| | |
| | |
| | |
Mortgage-Backed Securities (continued) |
| | |
| | |
| | |
| | |
| | |
| | |
| | |
| | |
| | |
| | |
| | |
| | |
| | |
| | |
| | |
| | |
| | |
| | |
| | |
| | |
| | |
| | |
| | |
| | |
| | |
| | |
| | |
| | |
| | |
| | |
| | |
| | |
| | |
| | |
| | |
| | |
| | |
U.S. Government Obligations — 29.4% |
| | |
| | |
| | |
| | |
| | |
| | |
| | |
| | |
| | |
| | |
| | |
| | |
| | |
| | |
| | |
| | |
| | |
| | |
| | |
| | |
| | |
| | |
| | |
872024 BlackRock Annual Financial Statements
Schedule of Investments (continued)July 31, 2024
BlackRock Total Return ETF(Percentages shown are based on Net Assets)
| | |
U.S. Government Obligations (continued) |
| | |
| | |
| | |
| | |
| | |
| | |
| | |
| | |
| | |
| | |
| | |
| | |
| | |
| | |
| | |
| | |
| | |
| | |
| | |
| | |
| | |
| | |
| | |
| | |
| | |
| | |
| | |
| | |
| | |
| | |
| | |
| | |
| | |
| | |
| | |
| | |
| | |
| | |
| | |
| | |
| | |
| | |
| | |
| | |
| | |
| | |
| | |
| | |
| | |
| | |
| | |
| | |
| | |
| | |
| | |
| | |
| | |
| | |
| | |
| | |
| | |
| | |
U.S. Government Obligations (continued) |
| | |
| | |
| | |
| | |
Total U.S. Government & Agency Obligations — 62.6%
(Cost: $57,180,572) | |
| | |
|
Mortgage Real Estate Investment — 0.1% |
Blackstone Mortgage Trust Inc., Class A | | |
|
| | |
Total Common Stocks — 0.1%
(Cost $63,394) | |
|
Exchange Traded Funds — 0.6% |
iShares J.P. Morgan USD Emerging Markets Bond ETF(g)(h) | | |
Total Investment Companies — 0.6%
(Cost $590,743) | |
Total Long-Term Investments — 113.0%
(Cost: $102,981,986) | |
|
Money Market Funds — 3.6% |
BlackRock Cash Funds: Institutional, SL Agency Shares, 5.45%(g)(i) | | |
BlackRock Cash Funds: Treasury, SL Agency Shares, 5.29%(g)(i)(j) | | |
Total Short-Term Securities — 3.6%
(Cost: $3,295,067) | |
Options Purchased — 0.0%
(Cost: $49,793) | |
Total Investments Before TBA Sales Commitments and Options Written — 116.6%
(Cost: $106,326,846) | |
| | |
|
Mortgage-Backed Securities — (5.6)% |
Government National Mortgage Association | | |
| | |
| | |
| | |
Uniform Mortgage-Backed Securities | | |
| | |
| | |
| | |
Schedule of Investments88
Schedule of Investments (continued)July 31, 2024
BlackRock Total Return ETF(Percentages shown are based on Net Assets)
| | |
Mortgage-Backed Securities (continued) |
| | |
| | |
| | |
| | |
| | |
| | |
Total TBA Sales Commitments — (5.6)%
(Proceeds: $(5,119,912)) | |
Options Written — (0.1%)
(Premiums Received: $(131,811)) | |
Total Investments, Net of TBA Sales Commitments and Options Written — 110.9%
(Cost: $101,075,123) | |
Liabilities in Excess of Other Assets — (10.9)% | |
| |
| Security exempt from registration pursuant to Rule 144A under the Securities Act of 1933, as amended. These securities may be resold in transactions exempt from registration to qualified institutional investors. |
| Variable rate security. Interest rate resets periodically. The rate shown is the effective interest rate as of period end. Security description also includes the reference rate and spread if published and available. |
| Step coupon security. Coupon rate will either increase (step-up bond) or decrease (step-down bond) at regular intervals until maturity. Interest rate shown reflects the rate currently in effect. |
| All or a portion of this security is on loan. |
| This security may be resold to qualified foreign investors and foreign institutional buyers under Regulation S of the Securities Act of 1933. |
| Represents or includes a TBA transaction. |
| |
| All or a portion of the security has been pledged as collateral in connection with outstanding TBA commitments. |
| Annualized 7-day yield as of period end. |
| All or a portion of this security was purchased with the cash collateral from loaned securities. |
Affiliates
Investments in issuers considered to be affiliate(s) of the Fund during the period ended July 31, 2024 for purposes of Section 2(a)(3) of the Investment Company Act of 1940, as amended, were as follows:
| | | | | Change in
Unrealized
Appreciation
(Depreciation) | | | | Capital
Gain
Distributions
from
Underlying
Funds |
BlackRock Cash Funds: Institutional, SL Agency Shares | | | | | | | | | |
BlackRock Cash Funds: Treasury, SL Agency Shares | | | | | | | | | |
iShares iBoxx $ High Yield Corporate Bond ETF(d) | | | | | | | | | |
iShares iBoxx $ Investment Grade Corporate Bond ETF(d) | | | | | | | | | |
iShares J.P. Morgan USD Emerging Markets Bond ETF | | | | | | | | | |
| | | | | | | | | |
| Commencement of operations. |
| Represents net amount purchased (sold). |
| All or a portion represents securities lending income earned from the reinvestment of cash collateral from loaned securities, net of fees and collateral investment expenses, and other payments to and from borrowers of securities. |
| As of period end, the entity is no longer held. |
Derivative Financial Instruments Outstanding as of Period End
| | | | Value/
Unrealized
Appreciation
(Depreciation) |
| | | | |
| | | | |
| | | | |
| | | | |
2-Year U.S. Treasury Note | | | | |
892024 BlackRock Annual Financial Statements
Schedule of Investments (continued)July 31, 2024
BlackRock Total Return ETF
Futures Contracts (continued)
| | | | Value/ Unrealized Appreciation (Depreciation) |
5-Year U.S. Treasury Note | | | | |
| | | | |
| | | | |
| | | | |
10-Year U.S. Treasury Note | | | | |
| | | | |
| | | | |
| | | | |
Forward Foreign Currency Exchange Contracts
| | | | Unrealized
Appreciation
(Depreciation) |
| | | | | | |
| | | | | | |
| | | | | | |
| | | | | | |
| | | | | | |
| | | | | | |
| | | | | | |
| | | | | | |
| | | | | | |
| | | | | | |
| | | | | | |
| | | | | | |
| | | | | | |
| | | | | | |
Exchange-Traded Options Purchased
| | | | | | |
| | | | | | | | |
InvesCo QQQ Trust, Series 1 | | | | | | | |
| | | | | | | |
| | | | | | | |
| | | | | | | |
| | | | | | | | |
OTC Interest Rate Swaptions Purchased
| | | | | | | | |
| | | | | | | | | |
| | | | | | | | | | |
30-Year Interest Rate Swap, 12/20/54 | | | | | | | | | | |
Schedule of Investments90
Schedule of Investments (continued)July 31, 2024
BlackRock Total Return ETF
Exchange-Traded Options Written
OTC Interest Rate Swaptions Written
| | | | | | | |
| | | | |
| | | | | | | | | | |
10-Year Interest Rate Swap, 09/14/34 | | | | | | | | | | |
10-Year Interest Rate Swap, 09/15/34 | | | | | | | | | | |
10-Year Interest Rate Swap, 09/19/34 | | | | | | | | | | |
10-Year Interest Rate Swap, 09/29/34 | | | | | Goldman Sachs Inter- national | | | | | |
10-Year Interest Rate Swap, 07/17/36 | | | | | | | | | | |
| | | | | | | | | | |
| | | | | | | | | | |
10-Year Interest Rate Swap, 09/14/34 | | | | | | | | | | |
10-Year Interest Rate Swap, 09/15/34 | | | | | | | | | | |
10-Year Interest Rate Swap, 09/19/34 | | | | | | | | | | |
30-Year Interest Rate Swap, 09/20/54 | | | | | | | | | | |
10-Year Interest Rate Swap, 09/29/34 | | | | | Goldman Sachs Inter- national | | | | | |
10-Year Interest Rate Swap, 07/17/36 | | | | | | | | | | |
| | | | | | | | | | |
| | | | | | | | | | |
Centrally Cleared Credit Default Swaps - Sell Protection
Reference Obligation/Index | Financing
Rate Received
by the Fund | | | | | | Upfront
Premium
Paid
(Received) | Unrealized
Appreciation
(Depreciation) |
| | | | | | | | | |
| Using the rating of the issuer or the underlying securities of the index, as applicable, provided by S&P Global Ratings. |
| The maximum potential amount the Fund may pay should a negative credit event take place as defined under the terms of the agreement. |
912024 BlackRock Annual Financial Statements
Schedule of Investments (continued)July 31, 2024
BlackRock Total Return ETF
Centrally Cleared Interest Rate Swaps
| | | | | | | Upfront
Premium
Paid
(Received) | Unrealized
Appreciation
(Depreciation) |
| | | |
| | | | | | | | | | |
| | | | | | | | | | |
| | | | | | | | | | |
| | | | | | | | | | |
| | | | | | | | | | |
| | | | | | | | | | |
| | | | | | | | | | |
| | | | | | | | | | |
| | | | | | | | | | |
| | | | | | | | | | |
| | | | | | | | | | |
| | | | | | | | | | |
| | | | | | | | | | |
| | | | | | | | | | |
| | | | | | | | | | |
| | | | | | | | | | |
| | | | | | | | | | |
| | | | | | | | | | |
| | | | | | | | | | |
| | | | | | | | | | |
| | | | | | | | | | |
| | | | | | | | | | |
| | | | | | | | | | |
| | | | | | | | | | |
| | | | | | | | | | |
| | | | | | | | | | |
| | | | | | | | | | |
| | | | | | | | | | |
| | | | | | | | | | |
Schedule of Investments92
Schedule of Investments (continued)July 31, 2024
BlackRock Total Return ETF
Centrally Cleared Interest Rate Swaps (continued)
| | | | | | | Upfront Premium Paid (Received) | Unrealized Appreciation (Depreciation) |
| | | |
| | | | | | | | | | |
| | | | | | | | | | |
| | | | | | | | | | |
| | | | | | | | | | |
| | | | | | | | | |
| | | | | | | | | Upfront
Premiums
Paid
(Received) | Unrealized
Appreciation
(Depreciation) |
| | Markit iBoxx $ Liquid High Yield Index | | Morgan Stanley & Co. International PLC | | | | | | | |
| | | | Goldman Sachs International | | | | | | | |
| | | | Goldman Sachs International | | | | | | | |
| | | | | | | | | | | |
Balances Reported in the Statements of Assets and Liabilities for Centrally Cleared Swaps, OTC Swaps and Options Written
| | | | | |
Centrally Cleared Swaps(a) | | | | | |
| | | | | |
| | | | | |
| Includes cumulative appreciation (depreciation) on centrally cleared swaps, as reported in the Schedule of Investments. Only current day’s variation margin is reported within the Statements of Assets and Liabilities and is net of any previously paid (received) swap premium amounts. |
932024 BlackRock Annual Financial Statements
Schedule of Investments (continued)July 31, 2024
BlackRock Total Return ETF
Derivative Financial Instruments Categorized by Risk Exposure
As of period end, the fair values of derivative financial instruments located in the Statements of Assets and Liabilities were as follows:
| | | | Foreign
Currency
Exchange
Contracts | | | |
Assets—Derivative Financial Instruments | | | | | | | |
| | | | | | | |
Unrealized appreciation on futures contracts(a) | | | | | | | |
Forward foreign currency exchange contracts | | | | | | | |
Unrealized appreciation on forward foreign currency exchange contracts | | | | | | | |
| | | | | | | |
Investments at value — unaffiliated(b) | | | | | | | |
Swaps — centrally cleared | | | | | | | |
Unrealized appreciation on centrally cleared swaps(a) | | | | | | | |
| | | | | | | |
Unrealized appreciation on OTC swaps; Swap premiums paid | | | | | | | |
| | | | | | | |
Liabilities—Derivative Financial Instruments | | | | | | | |
| | | | | | | |
Unrealized depreciation on futures contracts(a) | | | | | | | |
Forward foreign currency exchange contracts | | | | | | | |
Unrealized depreciation on forward foreign currency exchange contracts | | | | | | | |
| | | | | | | |
| | | | | | | |
Swaps — centrally cleared | | | | | | | |
Unrealized depreciation on centrally cleared swaps(a) | | | | | | | |
| | | | | | | |
Unrealized depreciation on OTC swaps; Swap premiums received | | | | | | | |
| | | | | | | |
| Net cumulative unrealized appreciation (depreciation) on futures contracts and centrally cleared swaps, if any, are reported in the Schedule of Investments. In the Statements of Assets and Liabilities, only current day's variation margin is reported in receivables or payables and the net cumulative unrealized appreciation (depreciation) is included in accumulated earnings (loss). |
| Includes options purchased at value as reported in the Schedule of Investments. |
For the period ended July 31, 2024, the effect of derivative financial instruments in the Statements of Operations was as follows:
| | | | Foreign
Currency
Exchange
Contracts | | | |
Net Realized Gain (Loss) from | | | | | | | |
| | | | | | | |
Forward foreign currency exchange contracts | | | | | | | |
| | | | | | | |
| | | | | | | |
| | | | | | | |
| | | | | | | |
Net Change in Unrealized Appreciation (Depreciation) on | | | | | | | |
| | | | | | | |
Forward foreign currency exchange contracts | | | | | | | |
| | | | | | | |
| | | | | | | |
| | | | | | | |
| | | | | | | |
| Options purchased are included in net realized gain (loss) from investments — unaffiliated. |
| Options purchased are included in net change in unrealized appreciation (depreciation) on investments — unaffiliated. |
Schedule of Investments94
Schedule of Investments (continued)July 31, 2024
BlackRock Total Return ETF
Average Quarterly Balances of Outstanding Derivative Financial Instruments
| |
Average notional value of contracts — long | |
Average notional value of contracts — short | |
Forward foreign currency exchange contracts: | |
Average amounts purchased — in USD | |
Average amounts sold — in USD | |
| |
Average value of option contracts purchased | |
Average value of option contracts written | |
Average notional value of swaption contracts purchased | |
Average notional value of swaption contracts written | |
| |
Average notional value — sell protection | |
| |
Average notional value — pays fixed rate | |
Average notional value — receives fixed rate | |
| |
| |
For more information about the Fund’s investment risks regarding derivative financial instruments, refer to the Notes to Financial Statements.
Derivative Financial Instruments - Offsetting as of Period End
The Fund's derivative assets and liabilities (by type) were as follows:
| | |
Derivative Financial Instruments: | | |
| | |
Forward foreign currency exchange contracts | | |
| | |
Swaps - centrally cleared | | |
| | |
Total derivative assets and liabilities in the Statement of Assets and Liabilities | | |
Derivatives not subject to a Master Netting Agreement or similar agreement ("MNA") | | |
Total derivative assets and liabilities subject to an MNA | | |
| Includes unrealized appreciation (depreciation) on OTC swaps and swap premiums (paid/received) in the Statements of Assets and Liabilities. |
The following tables present the Fund’s derivative assets and liabilities by counterparty net of amounts available for offset under an MNA and net of the related collateral received and pledged by the Fund:
| Derivative
Assets
Subject to
an MNA by
Counterparty | | Non-Cash
Collateral
Received | | |
| | | | | |
| | | | | |
Morgan Stanley & Co. International PLC | | | | | |
| | | | | |
| Derivative
Liabilities
Subject to
an MNA by
Counterparty | | Non-Cash
Collateral
Pledged | | |
| | | | | |
| | | | | |
| | | | | |
Goldman Sachs International | | | | | |
Morgan Stanley & Co. International PLC | | | | | |
952024 BlackRock Annual Financial Statements
Schedule of Investments (continued)July 31, 2024
BlackRock Total Return ETF
| Derivative Liabilities Subject to an MNA by Counterparty | Derivatives Available for Offset(a) | Non-Cash Collateral Pledged | | Net Amount of Derivative Liabilities(b)(c) |
| | | | | |
| | | | | |
| The amount of derivatives available for offset is limited to the amount of derivative assets and/or liabilities that are subject to an MNA. |
| Net amount represents the net amount receivable from the counterparty in the event of default. |
| Net amount may also include forward foreign currency exchange contracts that are not required to be collateralized. |
| Net amount represents the net amount payable due to the counterparty in the event of default. |
Fair Value Hierarchy as of Period End
Various inputs are used in determining the fair value of financial instruments. For a description of the input levels and information about the Fund’s policy regarding valuation of financial instruments, refer to the Notes to Financial Statements.
The following table summarizes the Fund’s financial instruments categorized in the fair value hierarchy. The breakdown of the Fund’s financial instruments into major categories is disclosed in the Schedule of Investments above.
| | | | |
| | | | |
| | | | |
| | | | |
| | | | |
Collaterized Mortgage Obligations | | | | |
| | | | |
Foreign Government Obligations | | | | |
Municipal Debt Obligations | | | | |
U.S. Government & Agency Obligations | | | | |
| | | | |
| | | | |
| | | | |
| | | | |
| | | | |
| | | | |
| | | | |
| | | | |
| | | | |
| | | | |
| | | | |
Derivative Financial Instruments(a) | | | | |
| | | | |
| | | | |
Foreign Currency Exchange Contracts | | | | |
| | | | |
| | | | |
| | | | |
Foreign Currency Exchange Contracts | | | | |
| | | | |
| | | | |
| Derivative financial instruments are swaps, futures contracts, forward foreign currency exchange contracts and options written. Swaps, futures contracts and forward foreign currency exchange contracts are valued at the unrealized appreciation (depreciation) on the instrument and options written are shown at value. |
See notes to financial statements.
Schedule of Investments96
Statements of Assets and LiabilitiesJuly 31, 2024
| | BlackRock
Flexible Income ETF | BlackRock
Floating Rate Loan ETF | BlackRock
High Yield Muni Income Bond ETF |
| | | | |
Investments, at value—unaffiliated(a)(b) | | | | |
Investments, at value—affiliated(c) | | | | |
| | | | |
| | | | |
Collateral — OTC derivatives | | | | |
| | | | |
| | | | |
Foreign currency, at value(d) | | | | |
| | | | |
| | | | |
Securities lending income—affiliated | | | | |
| | | | |
| | | | |
| | | | |
| | | | |
| | | | |
| | | | |
Variation margin on futures contracts | | | | |
Unrealized appreciation on: | | | | |
Forward foreign currency exchange contracts | | | | |
| | | | |
Unfunded floating rate loan interests | | | | |
| | | | |
| | | | |
| | | | |
| | | | |
| | | | |
Collateral — TBA commitments | | | | |
Collateral on securities loaned, at value | | | | |
| | | | |
| | | | |
Deferred foreign capital gain tax | | | | |
| | | | |
Variation margin on centrally cleared swaps | | | | |
| | | | |
Unrealized depreciation on: | | | | |
Forward foreign currency exchange contracts | | | | |
| | | | |
| | | | |
Commitments and contingent liabilities | | | | |
| | | | |
| | | | |
| | | | |
| | | | |
| | | | |
| | | | |
| | | | |
| | | | |
| | | | |
972024 BlackRock Annual Financial Statements
Statements of Assets and Liabilities (continued)July 31, 2024
| | BlackRock Flexible Income ETF | BlackRock Floating Rate Loan ETF | BlackRock High Yield Muni Income Bond ETF |
| | | | |
(a) Investments, at cost—unaffiliated | | | | |
(b) Securities loaned, at value | | | | |
(c) Investments, at cost—affiliated | | | | |
(d) Foreign currency, at cost | | | | |
See notes to financial statements.
Statements of Assets and Liabilities98
Statements of Assets and Liabilities (continued)July 31, 2024
| BlackRock
Intermediate Muni Income Bond ETF | BlackRock
Short-Term California Muni Bond ETF | |
| | | |
Investments, at value—unaffiliated(a)(b) | | | |
Investments, at value—affiliated(c) | | | |
| | | |
| | | |
| | | |
| | | |
Foreign currency, at value(d) | | | |
| | | |
| | | |
Securities lending income—affiliated | | | |
| | | |
| | | |
| | | |
Variation margin on futures contracts | | | |
Unrealized appreciation on: | | | |
Forward foreign currency exchange contracts | | | |
| | | |
| | | |
| | | |
Collateral on securities loaned, at value | | | |
Options written, at value(e) | | | |
TBA sales commitments, at value(f) | | | |
| | | |
| | | |
| | | |
Variation margin on centrally cleared swaps | | | |
| | | |
Unrealized depreciation on: | | | |
Forward foreign currency exchange contracts | | | |
| | | |
| | | |
Commitments and contingent liabilities | | | |
| | | |
| | | |
| | | |
Accumulated earnings (loss) | | | |
| | | |
| | | |
| | | |
| | | |
| | | |
992024 BlackRock Annual Financial Statements
Statements of Assets and Liabilities (continued)July 31, 2024
| BlackRock Intermediate Muni Income Bond ETF | BlackRock Short-Term California Muni Bond ETF | |
| | | |
(a) Investments, at cost—unaffiliated | | | |
(b) Securities loaned, at value | | | |
(c) Investments, at cost—affiliated | | | |
(d) Foreign currency, at cost | | | |
| | | |
(f) Proceeds from TBA sales commitments | | | |
See notes to financial statements.
Statements of Assets and Liabilities100
Statements of OperationsYear Ended July 31, 2024
| | BlackRock
Flexible Income ETF | BlackRock
Floating Rate Loan ETF | BlackRock
High Yield Muni Income Bond ETF |
| | | | |
| | | | |
| | | | |
Securities lending income—affiliated—net | | | | |
Other income—unaffiliated | | | | |
| | | | |
| | | | |
| | | | |
| | | | |
| | | | |
| | | | |
| | | | |
| | | | |
| | | | |
| | | | |
Investment advisory fees waived | | | | |
Total expenses after fees waived | | | | |
| | | | |
REALIZED AND UNREALIZED GAIN (LOSS) | | | | |
Net realized gain (loss) from: | | | | |
| | | | |
| | | | |
Capital gain distributions from underlying funds—affiliated | | | | |
Forward foreign currency exchange contracts | | | | |
Foreign currency transactions | | | | |
| | | | |
| | | | |
| | | | |
Net change in unrealized appreciation (depreciation) on: | | | | |
| | | | |
| | | | |
Forward foreign currency exchange contracts | | | | |
Foreign currency translations | | | | |
| | | | |
| | | | |
Unfunded floating rate loan interests | | | | |
| | | | |
Net realized and unrealized gain | | | | |
NET INCREASE IN NET ASSETS RESULTING FROM OPERATIONS | | | | |
See notes to financial statements.
1012024 BlackRock Annual Financial Statements
Statements of Operations(continued)Year Ended July 31, 2024
| BlackRock
Intermediate Muni Income Bond ETF | BlackRock
Short-Term California Muni Bond ETF | |
| | | |
| | | |
| | | |
| | | |
Securities lending income—affiliated—net | | | |
| | | |
| | | |
| | | |
| | | |
| | | |
| | | |
| | | |
| | | |
Investment advisory fees waived | | | |
Total expenses after fees waived | | | |
| | | |
REALIZED AND UNREALIZED GAIN (LOSS) | | | |
Net realized gain (loss) from: | | | |
| | | |
| | | |
Capital gain distributions from underlying funds—affiliated | | | |
Forward foreign currency exchange contracts | | | |
Foreign currency transactions | | | |
| | | |
| | | |
| | | |
| | | |
Net change in unrealized appreciation (depreciation) on: | | | |
| | | |
| | | |
Forward foreign currency exchange contracts | | | |
Foreign currency translations | | | |
| | | |
| | | |
| | | |
| | | |
Net realized and unrealized gain | | | |
NET INCREASE IN NET ASSETS RESULTING FROM OPERATIONS | | | |
(a) Commencement of operations. |
See notes to financial statements.
Statements of Operations102
Statements of Changes in Net Assets
| | BlackRock
Flexible Income ETF |
| | | | |
INCREASE (DECREASE) IN NET ASSETS | | | | |
| | | | |
| | | | |
| | | | |
Net change in unrealized appreciation (depreciation) | | | | |
Net increase in net assets resulting from operations | | | | |
DISTRIBUTIONS TO SHAREHOLDERS(b) | | | | |
Decrease in net assets resulting from distributions to shareholders | | | | |
CAPITAL SHARE TRANSACTIONS | | | | |
Net increase in net assets derived from capital share transactions | | | | |
| | | | |
Total increase in net assets | | | | |
| | | | |
| | | | |
| Commencement of operations. |
| Distributions for annual periods determined in accordance with U.S. federal income tax regulations. |
See notes to financial statements.
1032024 BlackRock Annual Financial Statements
Statements of Changes in Net Assets(continued)
| BlackRock
Floating Rate Loan ETF | BlackRock
High Yield Muni Income Bond ETF |
| | | | |
INCREASE (DECREASE) IN NET ASSETS | | | | |
| | | | |
| | | | |
| | | | |
Net change in unrealized appreciation (depreciation) | | | | |
Net increase in net assets resulting from operations | | | | |
DISTRIBUTIONS TO SHAREHOLDERS(b) | | | | |
Decrease in net assets resulting from distributions to shareholders | | | | |
CAPITAL SHARE TRANSACTIONS | | | | |
Net increase in net assets derived from capital share transactions | | | | |
| | | | |
Total increase in net assets | | | | |
| | | | |
| | | | |
| Commencement of operations. |
| Distributions for annual periods determined in accordance with U.S. federal income tax regulations. |
See notes to financial statements.
Statements of Changes in Net Assets104
Statements of Changes in Net Assets(continued)
| BlackRock
Intermediate Muni Income Bond ETF | BlackRock
Short-Term California Muni Bond ETF |
| | | | |
INCREASE (DECREASE) IN NET ASSETS | | | | |
| | | | |
| | | | |
| | | | |
Net change in unrealized appreciation (depreciation) | | | | |
Net increase in net assets resulting from operations | | | | |
DISTRIBUTIONS TO SHAREHOLDERS(b) | | | | |
Decrease in net assets resulting from distributions to shareholders | | | | |
CAPITAL SHARE TRANSACTIONS | | | | |
Net increase (decrease) in net assets derived from capital share transactions | | | | |
| | | | |
Total increase (decrease) in net assets | | | | |
| | | | |
| | | | |
| Commencement of operations. |
| Distributions for annual periods determined in accordance with U.S. federal income tax regulations. |
See notes to financial statements.
1052024 BlackRock Annual Financial Statements
Statements of Changes in Net Assets(continued)
| |
| |
INCREASE (DECREASE) IN NET ASSETS | |
| |
| |
| |
Net change in unrealized appreciation (depreciation) | |
Net increase in net assets resulting from operations | |
DISTRIBUTIONS TO SHAREHOLDERS(b) | |
Decrease in net assets resulting from distributions to shareholders | |
CAPITAL SHARE TRANSACTIONS | |
Net increase in net assets derived from capital share transactions | |
| |
Total increase in net assets | |
| |
| |
| Commencement of operations. |
| Distributions for annual periods determined in accordance with U.S. federal income tax regulations. |
See notes to financial statements.
Statements of Changes in Net Assets106
Financial Highlights(For a share outstanding throughout each period)
| |
| | |
Net asset value, beginning of period | | |
| | |
Net realized and unrealized gain(c) | | |
Net increase from investment operations | | |
Distributions from net investment income(d) | | |
Net asset value, end of period | | |
| | |
| | |
Ratios to Average Net Assets(g) | | |
| | |
Total expenses after fees waived | | |
| | |
| | |
Net assets, end of period (000) | | |
Portfolio turnover rate(i) | | |
(a) Commencement of operations. |
(b) Based on average shares outstanding. |
(c) The amounts reported for a share outstanding may not accord with the change in aggregate gains and losses in securities for the fiscal period due to the timing of capital share transactions in relation to the fluctuating market values of the Fund’s underlying securities. |
(d) Distributions for annual periods determined in accordance with U.S. federal income tax regulations. |
(e) Where applicable, assumes the reinvestment of distributions. |
|
(g) Excludes fees and expenses incurred indirectly as a result of investments in underlying funds. |
|
(i) Portfolio turnover rate excludes in-kind transactions, if any. |
See notes to financial statements.
1072024 BlackRock Annual Financial Statements
Financial Highlights(continued)(For a share outstanding throughout each period)
| BlackRock Flexible Income ETF |
| | |
Net asset value, beginning of period | | |
| | |
Net realized and unrealized gain(c) | | |
Net increase from investment operations | | |
Distributions from net investment income(d) | | |
Net asset value, end of period | | |
| | |
| | |
Ratios to Average Net Assets(g) | | |
| | |
Total expenses after fees waived | | |
| | |
| | |
Net assets, end of period (000) | | |
Portfolio turnover rate(i)(j) | | |
(a) Commencement of operations. |
(b) Based on average shares outstanding. |
(c) The amounts reported for a share outstanding may not accord with the change in aggregate gains and losses in securities for the fiscal period due to the timing of capital share transactions in relation to the fluctuating market values of the Fund’s underlying securities. |
(d) Distributions for annual periods determined in accordance with U.S. federal income tax regulations. |
(e) Where applicable, assumes the reinvestment of distributions. |
|
(g) Excludes fees and expenses incurred indirectly as a result of investments in underlying funds. |
|
(i) Includes mortgage dollar roll transactions ("MDRs"). Excluding MDRs, the portfolio turnover rate would have been 128%. |
(j) Portfolio turnover rate excludes in-kind transactions, if any. |
See notes to financial statements.
Financial Highlights(continued)(For a share outstanding throughout each period)
| BlackRock Floating Rate Loan ETF |
| | |
Net asset value, beginning of period | | |
| | |
Net realized and unrealized gain(c) | | |
Net increase from investment operations | | |
Distributions from net investment income(d) | | |
Net asset value, end of period | | |
| | |
| | |
Ratios to Average Net Assets(g) | | |
| | |
Total expenses after fees waived | | |
| | |
| | |
Net assets, end of period (000) | | |
Portfolio turnover rate(i) | | |
(a) Commencement of operations. |
(b) Based on average shares outstanding. |
(c) The amounts reported for a share outstanding may not accord with the change in aggregate gains and losses in securities for the fiscal period due to the timing of capital share transactions in relation to the fluctuating market values of the Fund’s underlying securities. |
(d) Distributions for annual periods determined in accordance with U.S. federal income tax regulations. |
(e) Where applicable, assumes the reinvestment of distributions. |
|
(g) Excludes fees and expenses incurred indirectly as a result of investments in underlying funds. |
|
(i) Portfolio turnover rate excludes in-kind transactions, if any. |
See notes to financial statements.
1092024 BlackRock Annual Financial Statements
Financial Highlights(continued)(For a share outstanding throughout each period)
| BlackRock High Yield Muni Income Bond ETF |
| | | | |
Net asset value, beginning of period | | | | |
| | | | |
Net realized and unrealized gain (loss)(c) | | | | |
Net increase (decrease) from investment operations | | | | |
| | | | |
From net investment income | | | | |
| | | | |
| | | | |
Net asset value, end of period | | | | |
| | | | |
| | | | |
Ratios to Average Net Assets(g) | | | | |
| | | | |
Total expenses after fees waived | | | | |
| | | | |
| | | | |
Net assets, end of period (000) | | | | |
Portfolio turnover rate(i) | | | | |
(a) Commencement of operations. |
(b) Based on average shares outstanding. |
(c) The amounts reported for a share outstanding may not accord with the change in aggregate gains and losses in securities for the fiscal period due to the timing of capital share transactions in relation to the fluctuating market values of the Fund’s underlying securities. |
(d) Distributions for annual periods determined in accordance with U.S. federal income tax regulations. |
(e) Where applicable, assumes the reinvestment of distributions. |
|
(g) Excludes fees and expenses incurred indirectly as a result of investments in underlying funds. |
|
(i) Portfolio turnover rate excludes in-kind transactions, if any. |
See notes to financial statements.
Financial Highlights(continued)(For a share outstanding throughout each period)
| BlackRock Intermediate Muni Income Bond ETF |
| | | | |
Net asset value, beginning of period | | | | |
| | | | |
Net realized and unrealized gain (loss)(c) | | | | |
Net increase (decrease) from investment operations | | | | |
| | | | |
From net investment income | | | | |
| | | | |
| | | | |
Net asset value, end of period | | | | |
| | | | |
| | | | |
Ratios to Average Net Assets(g) | | | | |
| | | | |
Total expenses after fees waived | | | | |
| | | | |
| | | | |
Net assets, end of period (000) | | | | |
Portfolio turnover rate(i) | | | | |
(a) Commencement of operations. |
(b) Based on average shares outstanding. |
(c) The amounts reported for a share outstanding may not accord with the change in aggregate gains and losses in securities for the fiscal period due to the timing of capital share transactions in relation to the fluctuating market values of the Fund’s underlying securities. |
(d) Distributions for annual periods determined in accordance with U.S. federal income tax regulations. |
(e) Where applicable, assumes the reinvestment of distributions. |
|
(g) Excludes fees and expenses incurred indirectly as a result of investments in underlying funds. |
|
(i) Portfolio turnover rate excludes in-kind transactions, if any. |
See notes to financial statements.
1112024 BlackRock Annual Financial Statements
Financial Highlights(continued)(For a share outstanding throughout each period)
| BlackRock Short-Term California Muni Bond ETF |
| | |
Net asset value, beginning of period | | |
| | |
Net realized and unrealized gain(c) | | |
Net increase from investment operations | | |
Distributions from net investment income(d) | | |
Net asset value, end of period | | |
| | |
| | |
Ratios to Average Net Assets(g) | | |
| | |
Total expenses after fees waived | | |
| | |
| | |
Net assets, end of period (000) | | |
Portfolio turnover rate(i) | | |
(a) Commencement of operations. |
(b) Based on average shares outstanding. |
(c) The amounts reported for a share outstanding may not accord with the change in aggregate gains and losses in securities for the fiscal period due to the timing of capital share transactions in relation to the fluctuating market values of the Fund’s underlying securities. |
(d) Distributions for annual periods determined in accordance with U.S. federal income tax regulations. |
(e) Where applicable, assumes the reinvestment of distributions. |
|
(g) Excludes fees and expenses incurred indirectly as a result of investments in underlying funds. |
|
(i) Portfolio turnover rate excludes in-kind transactions, if any. |
See notes to financial statements.
Financial Highlights(continued)(For a share outstanding throughout the period)
| |
| |
Net asset value, beginning of period | |
| |
Net realized and unrealized gain(c) | |
Net increase from investment operations | |
Distributions from net investment income(d) | |
Net asset value, end of period | |
| |
| |
Ratios to Average Net Assets(g) | |
| |
Total expenses after fees waived | |
| |
| |
Net assets, end of period (000) | |
Portfolio turnover rate(i)(j) | |
(a) Commencement of operations. |
(b) Based on average shares outstanding. |
(c) The amounts reported for a share outstanding may not accord with the change in aggregate gains and losses in securities for the fiscal period due to the timing of capital share transactions in relation to the fluctuating market values of the Fund’s underlying securities. |
(d) Distributions for annual periods determined in accordance with U.S. federal income tax regulations. |
(e) Where applicable, assumes the reinvestment of distributions. |
|
(g) Excludes fees and expenses incurred indirectly as a result of investments in underlying funds. |
|
(i) Portfolio turnover rate excludes in-kind transactions, if any. |
(j) Includes mortgage dollar roll transactions ("MDRs"). Excluding MDRs, the portfolio turnover rate would have been 281%. |
See notes to financial statements.
1132024 BlackRock Annual Financial Statements
Notes to Financial Statements
1. ORGANIZATION
BlackRock ETF Trust II (the "Trust") is registered under the Investment Company Act of 1940, as amended (the “1940 Act”), as an open-end management investment company. The Trust is organized as a Delaware statutory trust and is authorized to have multiple series or portfolios.
These financial statements relate only to the following funds (each, a “Fund” and collectively, the “Funds”):
| Diversification
Classification |
| |
| |
| |
High Yield Muni Income Bond | |
Intermediate Muni Income Bond | |
Short-Term California Muni Bond | |
| |
| The Fund commenced operations on December 12, 2023. |
On July 30, 2024, the Board approved a proposal to change the name of certain Funds as follows. Additionally, the Board approved a proposal to change BlackRock Short-Term California Muni Bond ETF’s ticker will be changed from CALY to CALI. These changes are expected to become effective on or about October 10, 2024.
| |
| iShares AAA CLO Active ETF |
BlackRock Flexible Income ETF | iShares Flexible Income Active ETF |
BlackRock Floating Rate Loan ETF | iShares Floating Rate Loan Active ETF |
BlackRock High Yield Muni Income Bond ETF | iShares High Yield Muni Income Active ETF |
BlackRock Intermediate Muni Income Bond ETF | iShares Intermediate Muni Income Active ETF |
BlackRock Short-Term California Muni Bond ETF | iShares Short-Term California Muni Active ETF |
BlackRock Total Return ETF | iShares Total Return Active ETF |
The Funds, together with certain other registered investment companies advised by BlackRock Fund Advisors (“BFA” or the “Manager”) or its affiliates, are included in a complex of funds referred to as the BlackRock Fixed-Income Complex.
2. SIGNIFICANT ACCOUNTING POLICIES
The financial statements are prepared in conformity with accounting principles generally accepted in the United States of America (“U.S. GAAP”), which may require management to make estimates and assumptions that affect the reported amounts of assets and liabilities in the financial statements, disclosure of contingent assets and liabilities at the date of the financial statements and the reported amounts of increases and decreases in net assets from operations during the reporting period. Actual results could differ from those estimates. Each Fund is considered an investment company under U.S. GAAP and follows the accounting and reporting guidance applicable to investment companies. Below is a summary of significant accounting policies:
Investment Transactions and Income Recognition: For financial reporting purposes, investment transactions are recorded on the dates the transactions are executed. Realized gains and losses on investment transactions are determined using the specific identification method. Dividend income and capital gain distributions, if any, are recorded on the ex-dividend date. Non-cash dividends, if any, are recorded on the ex-dividend date at fair value. Upon notification from issuers or as estimated by management, a portion of the dividend income received from a real estate investment trust may be redesignated as a reduction of cost of the related investment and/or realized gain. Interest income, including amortization and accretion of premiums and discounts on debt securities, is recognized daily on an accrual basis.
Foreign Currency Translation: Each Fund's books and records are maintained in U.S. dollars. Securities and other assets and liabilities denominated in foreign currencies are translated into U.S. dollars using prevailing market rates as quoted by one or more data service providers. Purchases and sales of investments are recorded at the rates of exchange prevailing on the respective dates of such transactions. Generally, when the U.S. dollar rises in value against a foreign currency, the investments denominated in that currency will lose value; the opposite effect occurs if the U.S. dollar falls in relative value.
Each Fund does not isolate the effect of fluctuations in foreign exchange rates from the effect of fluctuations in the market prices of investments for financial reporting purposes. Accordingly, the effects of changes in exchange rates on investments are not segregated in the Statements of Operations from the effects of changes in market prices of those investments, but are included as a component of net realized and unrealized gain (loss) from investments. Each Fund reports realized currency gains (losses) on foreign currency related transactions as components of net realized gain (loss) for financial reporting purposes, whereas such components are generally treated as ordinary income for U.S. federal income tax purposes.
Bank Overdraft: Certain Funds had outstanding cash disbursements exceeding deposited cash amounts at the custodian during the reporting period. The Funds are obligated to repay the custodian for any overdraft, including any related costs or expenses, where applicable. For financial reporting purposes, overdraft fees, if any, are included in interest expense in the Statements of Operations.
Notes to Financial Statements114
Notes to Financial Statements (continued)
Collateralization: If required by an exchange or counterparty agreement, the Funds may be required to deliver/deposit cash and/or securities to/with an exchange, or broker-dealer or custodian as collateral for certain investments.
In-kind Redemptions: For financial reporting purposes, in-kind redemptions are treated as sales of securities resulting in realized capital gains or losses to the Funds. Because such gains or losses are not taxable to the Funds and are not distributed to existing Fund shareholders, the gains or losses are reclassified from accumulated net realized gain (loss) to paid-in capital at the end of the Funds’ tax year. These reclassifications have no effect on net assets or net asset value (“NAV”) per share.
Distributions: Dividends and distributions paid by each Fund are recorded on the ex-dividend dates. Distributions are determined on a tax basis and may differ from net investment income and net realized capital gains for financial reporting purposes. Dividends and distributions are paid in U.S. dollars and cannot be automatically reinvested in additional shares of the Funds.
Indemnifications: In the normal course of business, each Fund enters into contracts that contain a variety of representations that provide general indemnification. The Funds’ maximum exposure under these arrangements is unknown because it involves future potential claims against the Funds, which cannot be predicted with any certainty.
3. INVESTMENT VALUATION AND FAIR VALUE MEASUREMENTS
Investment Valuation Policies: Each Fund’s investments are valued at fair value (also referred to as “market value” within the financial statements) each day that the Fund’s listing exchange is open and, for financial reporting purposes, as of the report date. U.S. GAAP defines fair value as the price a fund would receive to sell an asset or pay to transfer a liability in an orderly transaction between market participants at the measurement date. The Board of Trustees of the Trust (the “Board”) of each Fund has approved the designation of BlackRock Fund Advisors (“BFA”), the Funds’ investment adviser, as the valuation designee for each Fund. Each Fund determines the fair values of its financial instruments using various independent dealers or pricing services under BFA’s policies. If a security’s market price is not readily available or does not otherwise accurately represent the fair value of the security, the security will be valued in accordance with BFA’s policies and procedures as reflecting fair value. BFA has formed a committee (the “Valuation Committee”) to develop pricing policies and procedures and to oversee the pricing function for all financial instruments, with assistance from other BlackRock pricing committees.
Fair Value Inputs and Methodologies: The following methods and inputs are used to establish the fair value of each Fund’s assets and liabilities:
• Equity investments traded on a recognized securities exchange are valued at that day’s official closing price, as applicable, on the exchange where the stock is primarily traded. Equity investments traded on a recognized exchange for which there were no sales on that day are valued at the last traded price.
• Fixed-income investments for which market quotations are readily available are generally valued using the last available bid price or current market quotations provided by independent dealers or third-party pricing services. Floating rate loan interests are valued at the mean of the bid prices from one or more independent brokers or dealers as obtained from a third-party pricing service.Pricing services generally value fixed income securities assuming orderly transactions of an institutional round lot size, but a fund may hold or transact in such securities in smaller, odd lot sizes. Odd lots may trade at lower prices than institutional round lots. The pricing services may use matrix pricing or valuation models that utilize certain inputs and assumptions to derive values, including transaction data (e.g., recent representative bids and offers), market data, credit quality information, perceived market movements, news, and other relevant information. Certain fixed-income securities, including asset-backed and mortgage related securities may be valued based on valuation models that consider the estimated cash flows of each tranche of the entity, establish a benchmark yield and develop an estimated tranche specific spread to the benchmark yield based on the unique attributes of the tranche. The amortized cost method of valuation may be used with respect to debt obligations with sixty days or less remaining to maturity unless BFA determines such method does not represent fair value.
• Exchange-traded funds and closed-end funds traded on a recognized securities exchange are valued at that day’s official closing price, as applicable, on the exchange where the fund is primarily traded. Funds traded on a recognized exchange for which there were no sales on that day may be valued at the last traded price.
• Investments in open-end U.S. mutual funds (including money market funds) are valued at that day’s published NAV.
• Futures contracts are valued based on that day’s last reported settlement or trade price on the exchange where the contract is traded.
• Forward foreign currency exchange contracts are valued at the mean between the bid and ask prices and are determined as of the close of trading on the New York Stock Exchange (“NYSE”) based on that day’s prevailing forward exchange rate for the underlying currencies.
• Swap agreements are valued utilizing quotes received daily by independent pricing services or through brokers, which are derived using daily swap curves and models that incorporate a number of market data factors, such as discounted cash flows, trades and values of the underlying reference instruments.
• Exchange-traded options are valued at the mean between the last bid and ask prices at the close of the options market in which the options trade. An exchange-traded option for which there is no mean price is valued at the last bid (long positions) or ask (short positions) price. If no bid or ask price is available, the prior day's price will be used, unless it is determined that the prior day's price no longer reflects the fair value of the option.
If events (e.g., market volatility, company announcement or a natural disaster) occur that are expected to materially affect the value of such investment, or in the event that application of these methods of valuation results in a price for an investment that is deemed not to be representative of the market value of such investment, or if a price is not available, the investment will be valued by the Valuation Committee, in accordance with BFA’s policies and procedures as reflecting fair value (“Fair Valued
1152024 BlackRock Annual Financial Statements
Notes to Financial Statements (continued)
Investments”). The fair valuation approaches that may be used by the Valuation Committee include market approach, income approach and cost approach. Valuation techniques such as discounted cash flow, use of market comparables and matrix pricing are types of valuation approaches and are typically used in determining fair value. When determining the price for Fair Valued Investments, the Valuation Committee seeks to determine the price that each Fund might reasonably expect to receive or pay from the current sale or purchase of that asset or liability in an arm’s-length transaction. Fair value determinations shall be based upon all available factors that the Valuation Committee deems relevant and consistent with the principles of fair value measurement.
Fair Value Hierarchy: Various inputs are used in determining the fair value of financial instruments. These inputs to valuation techniques are categorized into a fair value hierarchy consisting of three broad levels for financial reporting purposes as follows:
• Level 1 – Unadjusted price quotations in active markets/exchanges for identical assets or liabilities that each Fund has the ability to access;
• Level 2 – Other observable inputs (including, but not limited to, quoted prices for similar assets or liabilities in markets that are active, quoted prices for identical or similar assets or liabilities in markets that are not active, inputs other than quoted prices that are observable for the assets or liabilities (such as interest rates, yield curves, volatilities, prepayment speeds, loss severities, credit risks and default rates) or other market-corroborated inputs); and
• Level 3 – Unobservable inputs based on the best information available in the circumstances, to the extent observable inputs are not available, (including the Valuation Committee’s assumptions used in determining the fair value of financial instruments).
The hierarchy gives the highest priority to unadjusted quoted prices in active markets for identical assets or liabilities (Level 1 measurements) and the lowest priority to unobservable inputs (Level 3 measurements). Accordingly, the degree of judgment exercised in determining fair value is greatest for instruments categorized in Level 3. The inputs used to measure fair value may fall into different levels of the fair value hierarchy. In such cases, for disclosure purposes, the fair value hierarchy classification is determined based on the lowest level input that is significant to the fair value measurement in its entirety. Investments classified within Level 3 have significant unobservable inputs used by the Valuation Committee in determining the price for Fair Valued Investments. Level 3 investments include equity or debt issued by privately held companies or funds that may not have a secondary market and/or may have a limited number of investors. The categorization of a value determined for financial instruments is based on the pricing transparency of the financial instruments and is not necessarily an indication of the risks associated with investing in those securities.
4. SECURITIES AND OTHER INVESTMENTS
Asset-Backed and Mortgage-Backed Securities: Asset-backed securities are generally issued as pass-through certificates or as debt instruments. Asset-backed securities issued as pass-through certificates represent undivided fractional ownership interests in an underlying pool of assets. Asset-backed securities issued as debt instruments, which are also known as collateralized obligations, are typically issued as the debt of a special purpose entity organized solely for the purpose of owning such assets and issuing such debt. Asset-backed securities are often backed by a pool of assets representing the obligations of a number of different parties. The yield characteristics of certain asset-backed securities may differ from traditional debt securities. One such major difference is that all or a principal part of the obligations may be prepaid at any time because the underlying assets (i.e., loans) may be prepaid at any time. As a result, a decrease in interest rates in the market may result in increases in the level of prepayments as borrowers, particularly mortgagors, refinance and repay their loans. An increased prepayment rate with respect to an asset-backed security will have the effect of shortening the maturity of the security. In addition, a fund may subsequently have to reinvest the proceeds at lower interest rates. If a fund has purchased such an asset-backed security at a premium, a faster than anticipated prepayment rate could result in a loss of principal to the extent of the premium paid.
For mortgage pass-through securities (the “Mortgage Assets”) there are a number of important differences among the agencies and instrumentalities of the U.S. Government that issue mortgage-related securities and among the securities that they issue. For example, mortgage-related securities guaranteed by Ginnie Mae are guaranteed as to the timely payment of principal and interest by Ginnie Mae and such guarantee is backed by the full faith and credit of the United States. However, mortgage-related securities issued by Freddie Mac and Fannie Mae, including Freddie Mac and Fannie Mae guaranteed mortgage pass-through certificates, which are solely the obligations of Freddie Mac and Fannie Mae, are not backed by or entitled to the full faith and credit of the United States, but are supported by the right of the issuer to borrow from the U.S. Treasury.
Non-agency mortgage-backed securities are securities issued by non-governmental issuers and have no direct or indirect government guarantees of payment and are subject to various risks. Non-agency mortgage loans are obligations of the borrowers thereunder only and are not typically insured or guaranteed by any other person or entity. The ability of a borrower to repay a loan is dependent upon the income or assets of the borrower. A number of factors, including a general economic downturn, acts of God, terrorism, social unrest and civil disturbances, may impair a borrower’s ability to repay its loans.
Collateralized Debt Obligations: Collateralized debt obligations (“CDOs”), including collateralized bond obligations (“CBOs”) and collateralized loan obligations (“CLOs”), are types of asset-backed securities. A CDO is an entity that is backed by a diversified pool of debt securities (CBOs) or syndicated bank loans (CLOs). The cash flows of the CDO can be split into multiple segments, called “tranches,” which will vary in risk profile and yield. The riskiest segment is the subordinated or “equity” tranche. This tranche bears the greatest risk of defaults from the underlying assets in the CDO and serves to protect the other, more senior, tranches from default in all but the most severe circumstances. Since it is shielded from defaults by the more junior tranches, a “senior” tranche will typically have higher credit ratings and lower yields than their underlying securities, and often receive investment grade ratings from one or more of the nationally recognized rating agencies. Despite the protection from the more junior tranches, senior tranches can experience substantial losses due to actual defaults, increased sensitivity to future defaults and the disappearance of one or more protecting tranches as a result of changes in the credit profile of the underlying pool of assets.
Zero-Coupon Bonds: Zero-coupon bonds are normally issued at a significant discount from face value and do not provide for periodic interest payments. These bonds may experience greater volatility in market value than other debt obligations of similar maturity which provide for regular interest payments.
Notes to Financial Statements116
Notes to Financial Statements (continued)
TBA Commitments: TBA commitments are forward agreements for the purchase or sale of securities, including mortgage-backed securities for a fixed price, with payment and delivery on an agreed upon future settlement date. The specific securities to be delivered are not identified at the trade date. However, delivered securities must meet specified terms, including issuer, rate and mortgage terms. When entering into TBA commitments, a fund may take possession of or deliver the underlying mortgage-backed securities but can extend the settlement or roll the transaction. TBA commitments involve a risk of loss if the value of the security to be purchased or sold declines or increases, respectively, prior to settlement date, if there are expenses or delays in connection with the TBA transactions, or if the counterparty fails to complete the transaction.
To mitigate counterparty risk, a fund enters into a two-way collateral agreement for TBA transactions with certain counterparties. Under such agreement, the “in-the-money” party of a TBA transaction may at any time require the other party to pledge collateral assets (in the form of cash or securities) to offset any loss the in-the-money party would incur upon cancellation of the TBA transaction. A party is in-the-money if they are the buyer and the market value of the TBA transaction increases or if they are the seller and the market value of the TBA transaction decreases. Cash collateral received from the counterparty may be reinvested in money market funds, including those managed by the Funds’ investment adviser, or its affiliates. Such collateral, if any, is noted in the Schedule of Investments and the obligation to return the collateral is presented as a liability in the Statements of Assets and Liabilities. Securities pledged as collateral by a fund, if any, are noted in the Schedule of Investments.
Mortgage Dollar Roll Transactions: Certain Funds may sell TBA mortgage-backed securities and simultaneously contract to repurchase substantially similar (i.e., same type, coupon and maturity) securities on a specific future date at an agreed upon price. During the period between the sale and repurchase, a fund is not entitled to receive interest and principal payments on the securities sold. Mortgage dollar roll transactions are treated as purchases and sales and a fund realizes gains and losses on these transactions. Mortgage dollar rolls involve the risk that the market value of the securities that a fund is required to purchase may decline below the agreed upon repurchase price of those securities.
Securities Lending: Each Fund may lend its securities to approved borrowers, such as brokers, dealers and other financial institutions. The borrower pledges and maintains with the Fund collateral consisting of cash, an irrevocable letter of credit issued by an approved bank, or securities issued or guaranteed by the U.S. government. The initial collateral received by each Fund is required to have a value of at least 102% of the current market value of the loaned securities for securities traded on U.S. exchanges and a value of at least 105% for all other securities. The collateral is maintained thereafter at a value equal to at least 100% of the current value of the securities on loan. The market value of the loaned securities is determined at the close of each business day of the Fund and any additional required collateral is delivered to the Fund or excess collateral is returned by the Fund, on the next business day. During the term of the loan, each Fund is entitled to all distributions made on or in respect of the loaned securities but does not receive interest income on securities received as collateral. Loans of securities are terminable at any time and the borrower, after notice, is required to return borrowed securities within the standard time period for settlement of securities transactions.
As of period end, any securities on loan were collateralized by cash and/or U.S. Government obligations. Cash collateral invested in money market funds managed by BFA, or its affiliates is disclosed in the Schedule of Investments. Any non-cash collateral received cannot be sold, re-invested or pledged by the Fund, except in the event of borrower default. The securities on loan, if any, are also disclosed in each Fund’s Schedule of Investments. The market value of any securities on loan and the value of any related cash collateral are disclosed in the Statements of Assets and Liabilities.
Securities lending transactions are entered into by the Funds under Master Securities Lending Agreements (each, an “MSLA”) which provide the right, in the event of default (including bankruptcy or insolvency) for the non-defaulting party to liquidate the collateral and calculate a net exposure to the defaulting party or request additional collateral. In the event that a borrower defaults, the Funds, as lender, would offset the market value of the collateral received against the market value of the securities loaned. When the value of the collateral is greater than that of the market value of the securities loaned, the lender is left with a net amount payable to the defaulting party. However, bankruptcy or insolvency laws of a particular jurisdiction may impose restrictions on or prohibitions against such a right of offset in the event of an MSLA counterparty’s bankruptcy or insolvency. Under the MSLA, absent an event of default, the borrower can resell or re-pledge the loaned securities, and the Funds can reinvest cash collateral received in connection with loaned securities. Upon an event of default, the parties’ obligations to return the securities or collateral to the other party are extinguished, and the parties can resell or re-pledge the loaned securities or the collateral received in connection with the loaned securities in order to satisfy the defaulting party’s net payment obligation for all transactions under the MSLA. The defaulting party remains liable for any deficiency.
1172024 BlackRock Annual Financial Statements
Notes to Financial Statements (continued)
As of period end, the following table is a summary of the securities on loan by counterparty which are subject to offset under an MSLA:
BlackRock ETF and Counterparty | Securities Loaned
at Value | | Non-Cash Collateral
Received, at Fair Value(a) | |
| | | | |
BMO Capital Markets Corp. | | | | |
| | | | |
| | | | |
| | | | |
Citigroup Global Markets, Inc. | | | | |
| | | | |
| | | | |
| | | | |
Scotia Capital (USA), Inc. | | | | |
| | | | |
| | | | |
| | | | |
Wells Fargo Securities LLC | | | | |
| | | | |
| | | | |
| | | | |
Citigroup Global Markets, Inc. | | | | |
J.P. Morgan Securities LLC | | | | |
| | | | |
| | | | |
| Collateral received, if any, in excess of the market value of securities on loan is not presented in this table. The total cash collateral received by each Fund is disclosed in the Fund’s Statements of Assets and Liabilities. |
The risks of securities lending include the risk that the borrower may not provide additional collateral when required or may not return the securities when due. To mitigate these risks, each Fund benefits from a borrower default indemnity provided by BlackRock, Inc. (“BlackRock”). BlackRock’s indemnity allows for full replacement of the securities loaned to the extent the collateral received does not cover the value of the securities loaned in the event of borrower default. Each Fund could incur a loss if the value of an investment purchased with cash collateral falls below the market value of the loaned securities or if the value of an investment purchased with cash collateral falls below the value of the original cash collateral received. Such losses are borne entirely by each Fund.
Floating Rate Loan Interests: Floating rate loan interests are typically issued to companies (the “borrower”) by banks, other financial institutions, or privately and publicly offered corporations (the “lender”). Floating rate loan interests are generally non-investment grade, often involve borrowers whose financial condition is troubled or uncertain and companies that are highly leveraged or in bankruptcy proceedings. In addition, transactions in floating rate loan interests may settle on a delayed basis, which may result in proceeds from the sale not being readily available for a fund to make additional investments or meet its redemption obligations. Floating rate loan interests may include fully funded term loans or revolving lines of credit. Floating rate loan interests are typically senior in the corporate capital structure of the borrower. Floating rate loan interests generally pay interest at rates that are periodically determined by reference to a base lending rate plus a premium. Since the rates reset only periodically, changes in prevailing interest rates (and particularly sudden and significant changes) can be expected to cause some fluctuations in the NAV of a fund to the extent that it invests in floating rate loan interests. The base lending rates are generally the lending rate offered by one or more European banks, such as the Secured Overnight Financing Rate (“SOFR”), the prime rate offered by one or more U.S. banks or the certificate of deposit rate. Floating rate loan interests may involve foreign borrowers, and investments may be denominated in foreign currencies. These investments are treated as investments in debt securities for purposes of a fund’s investment policies.
When a fund purchases a floating rate loan interest, it may receive a facility fee and when it sells a floating rate loan interest, it may pay a facility fee. On an ongoing basis, a fund may receive a commitment fee based on the undrawn portion of the underlying line of credit amount of a floating rate loan interest. Facility and commitment fees are typically amortized to income over the term of the loan or term of the commitment, respectively. Consent and amendment fees are recorded to income as earned. Prepayment penalty fees, which may be received by a fund upon the prepayment of a floating rate loan interest by a borrower, are recorded as realized gains. A fund may invest in multiple series or tranches of a loan. A different series or tranche may have varying terms and carry different associated risks.
Floating rate loan interests are usually freely callable at the borrower’s option. A fund may invest in such loans in the form of participations in loans (“Participations”) or assignments (“Assignments”) of all or a portion of loans from third parties. Participations typically will result in a fund having a contractual relationship only with the lender, not with the borrower. A fund has the right to receive payments of principal, interest and any fees to which it is entitled only from the lender selling the Participation and only upon receipt by the lender of the payments from the borrower. In connection with purchasing Participations, a fund generally will have no right to enforce compliance by the borrower with the terms of the loan agreement, nor any rights of offset against the borrower. A fund may not benefit directly from any collateral supporting the loan in which it has purchased the Participation. As a result, a fund assumes the credit risk of both the borrower and the lender that is selling the Participation. A fund’s investment in loan participation interests involves the risk of insolvency of the financial intermediaries who are parties to the transactions. In the event of the insolvency of the lender selling the Participation, a fund may be treated as a general creditor of the lender and may not benefit from any offset between the lender and the borrower. Assignments typically result in a fund having a direct contractual relationship with the borrower, and a fund may enforce compliance by the borrower with the terms of the loan agreement.
Notes to Financial Statements118
Notes to Financial Statements (continued)
In connection with floating rate loan interests, the Funds may also enter into unfunded floating rate loan interests (“commitments”). In connection with these commitments, a fund earns a commitment fee, typically set as a percentage of the commitment amount. Such fee income, which is included in interest income in the Statements of Operations, is recognized ratably over the commitment period. Unfunded floating rate loan interests are marked-to-market daily, and any unrealized appreciation (depreciation) is included in the Statements of Assets and Liabilities and Statements of Operations. As of period end, the Funds had the following unfunded floating rate loan interests:
| | | | | Unrealized
Appreciation
(Depreciation) |
| The Action Environmental Group Inc. | | | | |
| | | | | |
5. DERIVATIVE FINANCIAL INSTRUMENTS
Futures Contracts: Futures contracts are purchased or sold to gain exposure to, or manage exposure to, changes in interest rates (interest rate risk) and changes in the value of equity securities (equity risk) or foreign currencies (foreign currency exchange rate risk).
Futures contracts are exchange-traded agreements between the Funds and a counterparty to buy or sell a specific quantity of an underlying instrument at a specified price and on a specified date. Depending on the terms of a contract, it is settled either through physical delivery of the underlying instrument on the settlement date or by payment of a cash amount on the settlement date. Upon entering into a futures contract, the Funds are required to deposit initial margin with the broker in the form of cash or securities in an amount that varies depending on a contract’s size and risk profile. The initial margin deposit must then be maintained at an established level over the life of the contract. Amounts pledged, which are considered restricted, are included in cash pledged for futures contracts in the Statements of Assets and Liabilities.
Securities deposited as initial margin are designated in the Schedule of Investments and cash deposited, if any, are shown as cash pledged for futures contracts in the Statements of Assets and Liabilities. Pursuant to the contract, the Funds agree to receive from or pay to the broker an amount of cash equal to the daily fluctuation in market value of the contract (“variation margin”). Variation margin is recorded as unrealized appreciation (depreciation) and, if any, shown as variation margin receivable (or payable) on futures contracts in the Statements of Assets and Liabilities. When the contract is closed, a realized gain or loss is recorded in the Statements of Operations equal to the difference between the notional amount of the contract at the time it was opened and the notional amount at the time it was closed. The use of futures contracts involves the risk of an imperfect correlation in the movements in the price of futures contracts and interest rates, foreign currency exchange rates or underlying assets.
Forward Foreign Currency Exchange Contracts: Forward foreign currency exchange contracts are entered into to gain or reduce exposure to foreign currencies (foreign currency exchange rate risk).
A forward foreign currency exchange contract is an agreement between two parties to buy and sell a currency at a set exchange rate on a specified date. These contracts help to manage the overall exposure to the currencies in which some of the investments held by the Funds are denominated and in some cases, may be used to obtain exposure to a particular market.The contracts are traded over-the-counter (“OTC”) and not on an organized exchange.
The contract is marked-to-market daily and the change in market value is recorded as unrealized appreciation or depreciation in the Statements of Assets and Liabilities. When the contract is closed, a realized gain or loss is recorded in the Statements of Operations equal to the difference between the value at the time it was opened and the value at the time it was closed. Non-deliverable forward foreign currency exchange contracts are settled with the counterparty in cash without the delivery of foreign currency. The use of forward foreign currency exchange contracts involves the risk that the value of a contract changes unfavorably due to movements in the value of the referenced foreign currencies, and such value may exceed the amount(s) reflected in the Statements of Assets and Liabilities. Cash amounts pledged for forward foreign currency exchange contracts are considered restricted and are included in cash pledged as collateral for OTC derivatives in the Statements of Assets and Liabilities. A fund’s risk of loss from counterparty credit risk on OTC derivatives is generally limited to the aggregate unrealized gain netted against any collateral held by the Fund.
Options: The Fund may purchase and write call and put options to increase or decrease its exposure to the risks of underlying instruments, including equity risk, interest rate risk and/or commodity price risk and/or, in the case of options written, to generate gains from options premiums.
A call option gives the purchaser (holder) of the option the right (but not the obligation) to buy, and obligates the seller (writer) to sell (when the option is exercised) the underlying instrument at the exercise or strike price at any time or at a specified time during the option period. A put option gives the holder the right to sell and obligates the writer to buy the underlying instrument at the exercise or strike price at any time or at a specified time during the option period.
Premiums paid on options purchased and premiums received on options written, as well as the daily fluctuation in market value, are included in investments at value – unaffiliated and options written at value, respectively, in the Statements of Assets and Liabilities. When an instrument is purchased or sold through the exercise of an option, the premium is offset against the cost or proceeds of the underlying instrument. When an option expires, a realized gain or loss is recorded in the Statements of Operations to the extent of the premiums received or paid. When an option is closed or sold, a gain or loss is recorded in the Statements of Operations to the extent the cost of the closing transaction exceeds the premiums received or paid. When the Fund writes a call option, such option is typically “covered,” meaning that it holds the underlying instrument subject to being called by the option counterparty. When the Fund writes a put option, cash is segregated in an amount sufficient to cover the obligation. These amounts, which are considered restricted, are included in cash pledged as collateral for options written in the Statements of Assets and Liabilities.
1192024 BlackRock Annual Financial Statements
Notes to Financial Statements (continued)
• Swaptions – The Fund may purchase and write options on swaps (“swaptions”) primarily to preserve a return or spread on a particular investment or portion of the Fund's holdings, as a duration management technique or to protect against an increase in the price of securities it anticipates purchasing at a later date. The purchaser and writer of a swaption is buying or granting the right to enter into a previously agreed upon interest rate or credit default swap agreement (interest rate risk and/or credit risk) at any time before the expiration of the option.
• Interest rate — Interest rate caps and floors are entered into to gain or reduce exposure to interest rates (interest rate risk and/or other risk). Caps are agreements whereby one party agrees to make payments to the other, in return for a premium, to the extent that interest rate indexes exceed a specified rate, or “cap.” Floors are agreements whereby one party agrees to make payments to the other, in return for a premium, to the extent that interest rate indexes fall below a specified rate, or “floor.” The maximum potential amount of future payments that the Fund would be required to make under an interest rate cap would be the notional amount times the percentage increase in interest rates determined by the difference between the interest rate index current value and the value at the time the cap was entered into.
• Foreign currency options – The Fund may purchase and write foreign currency options, foreign currency futures and options on foreign currency futures to gain or reduce exposure to foreign currencies (foreign currency exchange rate risk). Foreign currency options give the purchaser the right to buy from or sell to the writer a foreign currency at any time before the expiration of the option.
In purchasing and writing options, the Fund bears the risk of an unfavorable change in the value of the underlying instrument or the risk that it may not be able to enter into a closing transaction due to an illiquid market. Exercise of a written option could result in the Fund purchasing or selling a security when it otherwise would not, or at a price different from the current market value.
Swaps: Swap contracts are entered into to manage exposure to issuers, markets and securities. Such contracts are agreements between the Funds and a counterparty to make periodic net payments on a specified notional amount or a net payment upon termination. Swap agreements are privately negotiated in the OTC market and may be entered into as a bilateral contract (“OTC swaps”) or centrally cleared (“centrally cleared swaps”).
For OTC swaps, any upfront premiums paid and any upfront fees received are shown as swap premiums paid and swap premiums received, respectively, in the Statements of Assets and Liabilities and amortized over the term of the contract. The daily fluctuation in market value is recorded as unrealized appreciation (depreciation) on OTC Swaps in the Statements of Assets and Liabilities. Payments received or paid are recorded in the Statements of Operations as realized gains or losses, respectively. When an OTC swap is terminated, a realized gain or loss is recorded in the Statements of Operations equal to the difference between the proceeds from (or cost of) the closing transaction and the Funds' basis in the contract, if any. Generally, the basis of the contract is the premium received or paid.
In a centrally cleared swap, immediately following execution of the swap agreement, the swap agreement is novated to a central counterparty (“CCP”) and the CCP becomes the Fund’s counterparty on the swap. Each Fund is required to interface with the CCP through a broker. Upon entering into a centrally cleared swap, each Fund is required to deposit initial margin with the broker in the form of cash or securities in an amount that varies depending on the size and risk profile of the particular swap. Securities deposited as initial margin are designated on the Schedule of Investments and cash deposited is shown as cash pledged for centrally cleared swaps on the Statements of Assets and Liabilities. Amounts pledged, which are considered restricted cash, are included in cash pledged for centrally cleared swaps in the Statements of Assets and Liabilities. Pursuant to the contract, each Fund agrees to receive from or pay to the broker an amount of cash equal to the daily fluctuation in market value of the contract (“variation margin”). Variation margin is recorded as unrealized appreciation (depreciation) and shown as variation margin receivable (or payable) on centrally cleared swaps in the Statements of Assets and Liabilities. Payments received from (paid to) the counterparty are amortized over the term of the contract and recorded as realized gains (losses) in the Statements of Operations, including those at termination.
Total return swaps are entered into by the BlackRock Flexible Income ETF and BlackRock Total Return ETF to obtain exposure to a security or market without owning such security or investing directly in such market or to exchange the risk/return of one security or market (e.g., fixed-income) with another security or market (e.g., equity or commodity prices) (equity risk, commodity price risk and/or interest rate risk).
Total return swaps are agreements in which there is an exchange of cash flows whereby one party commits to make payments based on the total return (distributions plus capital gains/losses) of an underlying instrument, or basket or underlying instruments, in exchange for fixed or floating rate interest payments. If the total return of the instruments or index underlying the transaction exceeds or falls short of the offsetting fixed or floating interest rate obligation, the Fund receives payment from or makes a payment to the counterparty.
Certain total return swaps are designed to function as a portfolio of direct investments in long and short equity positions. This means that the Fund has the ability to trade in and out of these long and short positions within the swap and will receive the economic benefits and risks equivalent to direct investment in these positions, subject to certain adjustments due to events related to the counterparty. Benefits and risks include capital appreciation (depreciation), corporate actions and dividends received and paid, all of which are reflected in the swap’s market value. The market value also includes interest charges and credits (“financing fees”) related to the notional values of the long and short positions and cash balances within the swap. These interest charges and credits are based on a specified benchmark rate plus or minus a specified spread determined based upon the country and/or currency of the positions in the portfolio.
Positions within the swap and financing fees are reset periodically. During a reset, any unrealized appreciation (depreciation) on positions and accrued financing fees become available for cash settlement between the Fund and the counterparty. The amounts that are available for cash settlement are recorded as realized gains or losses in the Statements of Operations. Cash settlement in and out of the swap may occur at a reset date or any other date, at the discretion of the Fund and the counterparty, over the life of the agreement. Certain swaps have no stated expiration and can be terminated by either party at any time.
Interest rate swaps are entered into to gain or reduce exposure to interest rates or to manage duration, the yield curve or interest rate (interest rate risk).
Notes to Financial Statements120
Notes to Financial Statements (continued)
Interest rate swaps are agreements in which one party pays a stream of interest payments, either fixed or floating, in exchange for another party’s stream of interest payments, either fixed or floating, on the same notional amount for a specified period of time. In more complex interest rate swaps, the notional principal amount may decline (or amortize) over time.
Swap transactions involve, to varying degrees, elements of interest rate, credit and market risks in excess of the amounts recognized in the Statements of Assets and Liabilities. Such risks involve the possibility that there will be no liquid market for these agreements, that the counterparty to the agreements may default on its obligation to perform or disagree as to the meaning of the contractual terms in the agreements, and that there may be unfavorable changes in interest rates and/or market values associated with these transactions.
Master Netting Arrangements: In order to define its contractual rights and to secure rights that will help mitigate its counterparty risk, a Fund may enter into an International Swaps and Derivatives Association, Inc. Master Agreement (“ISDA Master Agreement”) or similar agreement with its derivative contract counterparties. An ISDA Master Agreement is a bilateral agreement between a Fund and a counterparty that governs certain OTC derivatives and typically contains, among other things, collateral posting terms and netting provisions in the event of a default and/or termination event. Under an ISDA Master Agreement, a Fund may, under certain circumstances, offset with the counterparty certain derivative financial instruments’ payables and/or receivables with collateral held and/or posted and create one single net payment. The provisions of the ISDA Master Agreement typically permit a single net payment in the event of default including the bankruptcy or insolvency of the counterparty. However, bankruptcy or insolvency laws of a particular jurisdiction may impose restrictions on or prohibitions against the right of offset in bankruptcy, insolvency, or other events.
For derivatives traded under an ISDA Master Agreement, the collateral requirements are typically calculated by netting the mark-to-market amount for each transaction under such agreement, and comparing that amount to the value of any collateral currently pledged by a fund and the counterparty.
Cash collateral that has been pledged to cover obligations of the Funds and cash collateral received from the counterparty, if any, is reported separately in the Statements of Assets and Liabilities as cash pledged as collateral and cash received as collateral, respectively. Non-cash collateral pledged by the Funds, if any, is noted in the Schedules of Investments. Generally, the amount of collateral due from or to a counterparty is subject to a certain minimum transfer amount threshold before a transfer is required, which is determined at the close of business of the Funds. Any additional required collateral is delivered to/pledged by the Funds on the next business day. Typically, the counterparty is not permitted to sell, re-pledge or use cash and non-cash collateral it receives. A fund generally agrees not to use non-cash collateral that it receives but may, absent default or certain other circumstances defined in the underlying ISDA Master Agreement, be permitted to use cash collateral received. In such cases, interest may be paid pursuant to the collateral arrangement with the counterparty. To the extent amounts due to the Funds from the counterparty are not fully collateralized, each Fund bears the risk of loss from counterparty non-performance. Likewise, to the extent the Funds have delivered collateral to a counterparty and stand ready to perform under the terms of their agreement with such counterparty, each Fund bears the risk of loss from a counterparty in the amount of the value of the collateral in the event the counterparty fails to return such collateral. Based on the terms of agreements, collateral may not be required for all derivative contracts.
For financial reporting purposes, each Fund does not offset derivative assets and derivative liabilities that are subject to netting arrangements, if any, in the Statements of Assets and Liabilities.
6. INVESTMENT ADVISORY AGREEMENT AND OTHER TRANSACTIONS WITH AFFILIATES
Investment Advisory Fees: Pursuant to an Investment Advisory Agreement with the Trust, BFA manages the investment of each Fund’s assets. BFA is a California corporation indirectly owned by BlackRock. Under the Investment Advisory Agreement, BFA is responsible for substantially all expenses of the Funds, except (i) interest and taxes; (ii) brokerage commissions and other expenses connected with the execution of portfolio transactions; (iii) distribution fees; (iv) the advisory fee payable to BFA; and (v) litigation expenses and any extraordinary expenses (in each case as determined by a majority of the independent trustees).
For its investment advisory services to each of the following Funds, BFA will be paid a management fee from the Funds based on a percentage of each Fund’s average daily net assets as follows:
| |
| |
| |
| |
High Yield Muni Income Bond | |
Intermediate Muni Income Bond | |
Short-Term California Muni Bond | |
| |
Expense Waivers: For the BlackRock Flexible Income ETF, BlackRock High Yield Muni Income Bond ETF and BlackRock Intermediate Muni Income Bond ETF, BFA has contractually agreed to waive 0.10% of the management fee through June 30, 2025. For the BlackRock Floating Rate Loan ETF and BlackRock Short-Term California Muni Bond ETF, BFA has contractually agreed to waive 0.05% of the management fee through June 30, 2026. For the BlackRock Total Return ETF, BFA has contractually agreed
1212024 BlackRock Annual Financial Statements
Notes to Financial Statements (continued)
to waive 0.02% of the management fee through June 30, 2026. Each agreement may be terminated upon 90 days’ notice by a majority of the non-interested trustees of the Trust or by a vote of a majority of the outstanding voting securities of the Fund.
These amounts are included in investment advisory fees waived in the Statements of Operations. For the year ended July 31, 2024, the amounts waived in investment advisory fees pursuant to these arrangements were as follows:
| |
| |
| |
High Yield Muni Income Bond | |
Intermediate Muni Income Bond | |
Short-Term California Muni Bond | |
| |
In addition, BFA has contractually agreed to waive a portion of its management fees to each Fund in an amount equal to the aggregate Acquired Fund Fees and Expenses, if any, attributable to investments by each Fund in other equity and fixed-income mutual funds and ETFs advised by BFA or its affiliates through June 30, 2025. BFA has also contractually agreed to waive a portion of its management fees to each Fund by an amount equal to the aggregate Acquired Fund Fees and Expenses, if any, attributable to investments by each Fund in money market funds advised by BFA or its affiliates through June 30, 2025. The agreement may be terminated upon 90 days’ notice by a majority of the non-interested trustees of the Trust or by a vote of a majority of the outstanding voting securities of the Fund.
These amounts are included in investment advisory fees waived in the Statements of Operations. For the year ended July 31, 2024, the amounts waived in investment advisory fees pursuant to these arrangements were as follows:
| |
| |
| |
| |
High Yield Muni Income Bond | |
Intermediate Muni Income Bond | |
Short-Term California Muni Bond | |
| |
Sub-Adviser: BFA has entered into separate sub-advisory agreements with BlackRock International Limited and BlackRock (Singapore) Limited (together the “Sub-Advisers”), both affiliates of BFA, under which BFA pays each of the Sub-Advisers for services it provides to BlackRock Flexible Income ETF and BlackRock Total Return ETF.
Distributor: BlackRock Investments, LLC ("BRIL"), an affiliate of BFA, is the distributor for each Fund. Pursuant to the distribution agreement, BFA is responsible for any fees or expenses for distribution services provided to the Funds.
ETF Servicing Fees: Each Fund has entered into an ETF Services Agreement with BRIL to perform certain order processing, Authorized Participant communications, and related services in connection with the issuance and redemption of Creation Units (“ETF Services”). BRIL is entitled to a transaction fee from Authorized Participants on each creation or redemption order for the ETF Services provided. The Funds do not pay BRIL for ETF Services.
Prior to January 8, 2024 (date of conversion for BlackRock Floating Rate Loan ETF, BlackRock High Yield Muni Income Bond ETF and BlackRock Intermediate Muni Income Bond ETF), ETF Services were performed by State Street Bank and Trust Company.
Prior to January 22, 2024 (date of conversion for BlackRock AAA CLO ETF, BlackRock Flexible Income ETF, BlackRock Short-Term California Muni Bond ETF and BlackRock Total Return ETF), ETF Services were performed by State Street Bank and Trust Company.
Securities Lending: The U.S. Securities and Exchange Commission (the "SEC") has issued an exemptive order which permits BlackRock Institutional Trust Company, N.A. (“BTC”), an affiliate of BFA, to serve as securities lending agent for the Funds, subject to applicable conditions. As securities lending agent, BTC bears all operational costs directly related to securities lending, including any custodial costs. The Funds are responsible for fees in connection with the investment of cash collateral received for securities on loan (the “collateral investment fees”). The cash collateral is invested in a money market fund, BlackRock Cash Funds: Institutional or BlackRock Cash Funds: Treasury, managed by BFA or its affiliates. However, BTC has agreed to reduce the amount of securities lending income it receives in order to effectively limit the collateral investment fees the Funds bear to an annual rate of 0.04%. The SL Agency Shares of such money market fund will not be subject to a sales load, redemption fee, distribution fee or service fee. The money market fund in which the cash collateral has been invested may impose a discretionary liquidity fee of up to 2% of the value redeemed, if such fee is determined to be in the best interests of such money market fund.
Securities lending income is generally equal to the total of income earned from the reinvestment of cash collateral (and excludes collateral investment fees), and any fees or other payments to and from borrowers of securities. Each Fund retains a portion of the securities lending income and remits the remaining portion to BTC as compensation for its services as securities lending agent.
Notes to Financial Statements122
Notes to Financial Statements (continued)
Pursuant to the current securities lending agreement, each Fund retains 82% of securities lending income (which excludes collateral investment fees), and the amount retained can never be less than 70% of the total of securities lending income plus the collateral investment fees.
In addition, commencing the business day following the date that the aggregate securities lending income plus the collateral investment fees generated across the BlackRock Fixed-Income Complex in that calendar year exceeds a specified threshold, each Fund, pursuant to the securities lending agreement, will retain for the remainder of that calendar year 85% of securities lending income (which excludes collateral investment fees) and the amount retained can never be less than 70% of the total of securities lending income plus the collateral investment fees.
The share of securities lending income earned by each Fund is shown as securities lending income – affiliated – net in its Statements of Operations. For the year ended July 31, 2024, the Funds paid BTC the following amounts for securities lending agent services:
Officers and Trustees: Certain officers and/or trustees of the Trust are officers and/or trustees of BlackRock or its affiliates.
Other Transactions: Cross trading is the buying or selling of portfolio securities between funds to which BFA (or an affiliate) serves as investment adviser. At its regularly scheduled quarterly meetings, the Board reviews such transactions as of the most recent calendar quarter for compliance with the requirements and restrictions set forth by Rule 17a-7.
For the year ended July 31, 2024, transactions executed by the Funds pursuant to Rule 17a-7 under the 1940 Act were as follows:
| | | |
Short-Term California Muni Bond | | | |
Each Fund may invest its positive cash balances in certain money market funds managed by BFA or an affiliate. The income earned on these temporary cash investments is shown as dividends – affiliated in the Statements of Operations.
For the year ended July 31, 2024, purchases and sales of investments, including mortgage dollar rolls and excluding short-term securities and in-kind transactions, were as follows:
| U.S. Government Securities | |
| | | | |
| | | | |
| | | | |
| | | | |
High Yield Muni Income Bond | | | | |
Intermediate Muni Income Bond | | | | |
Short-Term California Muni Bond | | | | |
| | | | |
For the year ended July 31, 2024, purchases and sales related to mortgage dollar rolls were as follows:
There were no in-kind transactions for the year ended July 31, 2024.
8. INCOME TAX INFORMATION
Each Fund is treated as an entity separate from the Trust’s other funds for federal income tax purposes. It is each Fund’s policy to comply with the requirements of the Internal Revenue Code of 1986, as amended, applicable to regulated investment companies, and to distribute substantially all of its taxable income to its shareholders. Therefore, no U.S. federal income tax provision is required.
Management has analyzed tax laws and regulations and their application to the Funds as of July 31, 2024, inclusive of the open tax return years, and does not believe that there are any uncertain tax positions that require recognition of a tax liability in the Funds’ financial statements.
1232024 BlackRock Annual Financial Statements
Notes to Financial Statements (continued)
U.S. GAAP requires that certain components of net assets be adjusted to reflect permanent differences between financial and tax reporting. These reclassifications have no effect on net assets or NAV per share. As of July 31, 2024, permanent differences attributable to undistributed capital gains were reclassified to the following accounts:
| | Accumulated
Earnings (Loss) |
| | |
| | |
| | |
The tax character of distributions paid paid was as follows:
| | |
High Yield Muni Income Bond | | |
| | |
| | |
| | |
Intermediate Muni Income Bond | | |
| | |
| | |
| | |
| | |
Short-Term California Muni Bond | | |
| | |
| | |
| | |
| The Funds designate these amounts paid during the fiscal year ended July 31, 2024, as exempt-interest dividends. |
As of July 31, 2024, the tax components of accumulated net earnings (losses) were as follows:
| Undistributed
Ordinary Income | Undistributed
Tax Exempt Income | Undistributed
Long-Term Capital Gains | | | |
| | | | | | |
| | | | | | |
| | | | | | |
High Yield Muni Income Bond | | | | | | |
Intermediate Muni Income Bond | | | | | | |
Short-Term California Muni Bond | | | | | | |
| | | | | | |
Notes to Financial Statements124
Notes to Financial Statements (continued)
| Amounts available to offset future realized capital gains. |
| The difference between book-basis and tax-basis unrealized gains (losses) was attributable primarily to the tax deferral of losses on wash sales, the realization for tax purposes of unrealized gains (losses) on certain foreign currency contracts, futures contracts and options contracts, the accounting for swap agreements, the amortization methods for premiums and discounts on fixed income securities, the classification of investments, the TBA transactions and the tax deferral of losses on straddles. |
As of July 31, 2024, gross unrealized appreciation and depreciation based on cost of investments (including short positions and derivatives, if any) for U.S. federal income tax purposes were as follows:
| | Gross Unrealized
Appreciation | Gross Unrealized
Depreciation | Net Unrealized
Appreciation
(Depreciation) |
| | | | |
| | | | |
| | | | |
High Yield Muni Income Bond | | | | |
Intermediate Muni Income Bond | | | | |
Short-Term California Muni Bond | | | | |
| | | | |
The Trust, on behalf of the Funds, along with certain other funds managed by the Manager and its affiliates (“Participating Funds”), is party to a 364-day, $2.40 billion credit agreement with a group of lenders. Under this agreement, the Funds may borrow to fund shareholder redemptions. Excluding commitments designated for certain individual funds, the Participating Funds, including the Funds, can borrow up to an aggregate commitment amount of $1.75 billion at any time outstanding, subject to asset coverage and other limitations as specified in the agreement. With respect to Floating Rate Loan, of the aggregate $2.40 billion commitment amount, $650 million is specifically designated to the Fund and another participating Fund. The remaining $1.75 billion commitment is available to all Participating Funds, but Floating Rate Loan can borrow up to an additional $350 million in the aggregate of the remaining aggregate commitment, subject to asset coverage and other limitations as specified in the agreement. The credit agreement has the following terms: a fee of 0.10% per annum on unused commitment amounts and interest at a rate equal to the higher of (a) Overnight Bank Funding Rate (“OBFR”) (but in any event, not less than 0.00%) on the date the loan is made plus 0.80% per annum, (b) the Fed Funds rate (but in any event, not less than 0.00%) in effect from time to time plus 0.80% per annum on amounts borrowed or (c) the sum of (x) Daily SOFR (but, in any event, not less than 0.00%) on the date the loan is made plus 0.10% and (y) 0.80% per annum . The agreement expires in April 2025 unless extended or renewed. Floating Rate Loan paid an upfront commitment fee of 0.04% on new commitments of $250 million, in addition to administration, legal and arrangement fees, which are included in miscellaneous expenses in the Statements of Operations. These fees were allocated among such funds based upon portions of the aggregate commitment available to them and relative net assets of Participating Funds. During the year ended July 31, 2024, the Funds did not borrow under the credit agreement.
In the normal course of business, each Fund invests in securities or other instruments and may enter into certain transactions, and such activities subject the Fund to various risks, including, among others, fluctuations in the market (market risk) or failure of an issuer to meet all of its obligations. The value of securities or other instruments may also be affected by various factors, including, without limitation: (i) the general economy; (ii) the overall market as well as local, regional or global political and/or social instability; (iii) regulation, taxation or international tax treaties between various countries; or (iv) currency, interest rate or price fluctuations. Local, regional or global events such as war, acts of terrorism, the spread of infectious illness or other public health issues, recessions, or other events could have a significant impact on the Funds and their investments. Each Fund’s prospectus provides details of the risks to which the Fund is subject.
Market Risk: Each Fund may be exposed to prepayment risk, which is the risk that borrowers may exercise their option to prepay principal earlier than scheduled during periods of declining interest rates, which would force each Fund to reinvest in lower yielding securities. Each Fund may also be exposed to reinvestment risk, which is the risk that income from each Fund’s portfolio will decline if each Fund invests the proceeds from matured, traded or called fixed-income securities at market interest rates that are below each Fund portfolio’s current earnings rate.
Municipal securities are subject to the risk that litigation, legislation or other political events, local business or economic conditions, credit rating downgrades, or the bankruptcy of the issuer could have a significant effect on an issuer’s ability to make payments of principal and/or interest or otherwise affect the value of such securities. Municipal securities can be significantly affected by political or economic changes, including changes made in the law after issuance of the securities, as well as uncertainties in the municipal market related to, taxation, legislative changes or the rights of municipal security holders, including in connection with an issuer insolvency. Municipal securities backed by current or anticipated revenues from a specific project or specific assets can be negatively affected by the discontinuance of the tax benefits supporting the project or assets or the inability to collect revenues for the project or from the assets. Municipal securities may be less liquid than taxable bonds, and there may be less publicly available information on the financial condition of municipal security issuers than for issuers of other securities.
Valuation Risk: The price each Fund could receive upon the sale of any particular portfolio investment may differ from each Fund’s valuation of the investment, particularly for securities that trade in thin or volatile markets or that are valued using a fair valuation technique or a price provided by an independent pricing service. Changes to significant unobservable inputs and assumptions (i.e., publicly traded company multiples, growth rate, time to exit) due to the lack of observable inputs may significantly impact the resulting fair value and therefore each Fund’s results of operations. As a result, the price received upon the sale of an investment may be less than the value
1252024 BlackRock Annual Financial Statements
Notes to Financial Statements (continued)
ascribed by each Fund, and each Fund could realize a greater than expected loss or lesser than expected gain upon the sale of the investment. Each Fund’s ability to value its investments may also be impacted by technological issues and/or errors by pricing services or other third-party service providers.
Counterparty Credit Risk: The Funds may be exposed to counterparty credit risk, or the risk that an entity may fail to or be unable to perform on its commitments related to unsettled or open transactions, including making timely interest and/or principal payments or otherwise honoring its obligations. The Funds manage counterparty credit risk by entering into transactions only with counterparties that BFA believes have the financial resources to honor their obligations and by monitoring the financial stability of those counterparties. Financial assets, which potentially expose the Funds to market, issuer and counterparty credit risks, consist principally of financial instruments and receivables due from counterparties. The extent of the Funds’ exposure to market, issuer and counterparty credit risks with respect to these financial assets is approximately their value recorded in the Statements of Assets and Liabilities, less any collateral held by the Funds.
A derivative contract may suffer a mark-to-market loss if the value of the contract decreases due to an unfavorable change in the market rates or values of the underlying instrument. Losses can also occur if the counterparty does not perform under the contract.
With exchange-traded futures, there is less counterparty credit risk to the Funds since the exchange or clearinghouse, as counterparty to such instruments, guarantees against a possible default. The clearinghouse stands between the buyer and the seller of the contract; therefore, credit risk is limited to failure of the clearinghouse. While offset rights may exist under applicable law, a Fund does not have a contractual right of offset against a clearing broker or clearinghouse in the event of a default (including the bankruptcy or insolvency). Additionally, credit risk exists in exchange-traded futures with respect to initial and variation margin that is held in a clearing broker’s customer accounts. While clearing brokers are required to segregate customer margin from their own assets, in the event that a clearing broker becomes insolvent or goes into bankruptcy and at that time there is a shortfall in the aggregate amount of margin held by the clearing broker for all its clients, typically the shortfall would be allocated on a pro rata basis across all the clearing broker’s customers, potentially resulting in losses to the Funds.
Geographic/Asset Class Risk: A diversified portfolio, where this is appropriate and consistent with a fund’s objectives, minimizes the risk that a price change of a particular investment will have a material impact on the NAV of a fund. The investment concentrations within each Fund’s portfolio are disclosed in its Schedule of Investments.
The Funds invest a significant portion of their assets in securities of issuers located in the United States. A decrease in imports or exports, changes in trade regulations, inflation and/or an economic recession in the United States may have a material adverse effect on the U.S. economy and the securities listed on U.S. exchanges. Proposed and adopted policy and legislative changes in the United States may also have a significant effect on U.S. markets generally, as well as on the value of certain securities. Governmental agencies project that the United States will continue to maintain elevated public debt levels for the foreseeable future which may constrain future economic growth. Circumstances could arise that could prevent the timely payment of interest or principal on U.S. government debt, such as reaching the legislative “debt ceiling.” Such non-payment would result in substantial negative consequences for the U.S. economy and the global financial system. If U.S. relations with certain countries deteriorate, it could adversely affect issuers that rely on the United States for trade. The United States has also experienced increased internal unrest and discord. If these trends were to continue, they may have an adverse impact on the U.S. economy and the issuers in which the the Funds invest.
Certain Funds invest a significant portion of their assets in issuers located in a single state or limited number of states, When a fund concentrates its investments in this manner, it assumes the risk that economic, regulatory, political or social conditions affecting that state or group of states could have a significant impact on the fund and could affect the income from, or the value or liquidity of, the fund’s portfolio. Investment percentages in specific states or U.S. territories are presented in the Schedule of Investments.
Certain Funds invest a significant portion of their assets in high yield securities. High yield securities that are rated below investment-grade (commonly referred to as “junk bonds”) or are unrated may be deemed speculative, involve greater levels of risk than higher-rated securities of similar maturity and are more likely to default. High yield securities may be issued by less creditworthy issuers, and issuers of high yield securities may be unable to meet their interest or principal payment obligations. High yield securities are subject to extreme price fluctuations, may be less liquid than higher rated fixed-income securities, even under normal economic conditions, and frequently have redemption features.
The Funds invest a significant portion of their assets in fixed-income securities and/or use derivatives tied to the fixed-income markets. Changes in market interest rates or economic conditions may affect the value and/or liquidity of such investments. Interest rate risk is the risk that prices of bonds and other fixed-income securities will decrease as interest rates rise and increase as interest rates fall. The Funds may be subject to a greater risk of rising interest rates during a period of historically low interest rates. The Federal Reserve has raised the federal funds rate as part of its efforts to address inflation. Changing interest rates may have unpredictable effects on markets, may result in heightened market volatility, and could negatively impact the Funds' performance.
Significant Shareholder Redemption Risk: Certain shareholders may own or manage a substantial amount of fund shares and/or hold their fund investments for a limited period of time. Large redemptions of fund shares by these shareholders may force a fund to sell portfolio securities, which may negatively impact the fund’s NAV, increase the fund’s brokerage costs, and/or accelerate the realization of taxable income/gains and cause the fund to make additional taxable distributions to shareholders.
11. CAPITAL SHARE TRANSACTIONS
Capital shares are issued and redeemed by each Fund only in aggregations of a specified number of shares or multiples thereof (“Creation Units”) at NAV. Except when aggregated in Creation Units, shares of each Fund are not redeemable.
Notes to Financial Statements126
Notes to Financial Statements (continued)
Transactions in capital shares were as follows:
| | |
| | | | |
High Yield Muni Income Bond | | | | |
| | | | |
| | | | |
| | | | |
Intermediate Muni Income Bond | | | | |
| | | | |
| | | | |
| | | | |
| | |
| | | | |
Short-Term California Muni Bond(d) | | | | |
| | | | |
| The Fund commenced operations on January 10, 2023. |
| The Fund commenced operations on May 19, 2023. |
| The Fund commenced operations on October 4, 2022. |
| The Fund commenced operations on July 11, 2023. |
| The Fund commenced operations on December 12, 2023. |
The consideration for the purchase of Creation Units of a fund in the Trust generally consists of the in-kind deposit of a designated portfolio of securities and a specified amount of cash. Certain funds in the Trust may be offered in Creation Units solely or partially for cash in U.S. dollars. Authorized Participants purchasing and redeeming Creation Units may pay a purchase transaction fee and a redemption transaction fee directly to State Street Bank and Trust Company, the Trust’s administrator or BRIL, to offset transfer and other transaction costs associated with the issuance and redemption of Creation Units, including Creation Units for cash. Authorized Participants transacting in Creation Units for cash may also pay an additional variable charge to compensate the relevant fund for certain transaction costs (i.e., stamp taxes, taxes on currency or other financial transactions, and brokerage costs) and market impact expenses relating to investing in portfolio securities. Such variable charges, if any, are included in shares sold in the table above.
To the extent applicable, to facilitate the timely settlement of orders for Funds using a clearing facility outside of the continuous net settlement process, each Fund, at its sole discretion, may permit an Authorized Participant to post cash as collateral in anticipation of the delivery of all or a portion of the applicable Deposit Securities or Fund Securities, as further described in the applicable Authorized Participant Agreement. The collateral process is subject to a Control Agreement among the Authorized Participant, each Fund’s custodian, and the Funds. In the event that the Authorized Participant fails to deliver all or a portion of the applicable Deposit Securities or Fund Securities, the Fund may exercise control over such collateral pursuant to the terms of the Control Agreement in order to purchase the applicable Deposit Securities or Fund Securities.
From time to time, settlement of securities related to in-kind contributions or in-kind redemptions may be delayed. In such cases, securities related to in-kind transactions are reflected as a receivable or a payable in the Statements of Assets and Liabilities.
1272024 BlackRock Annual Financial Statements
Notes to Financial Statements (continued)
As of July 31, 2024, shares owned by BlackRock Financial Management, Inc., an affiliate of the Funds, were as follows:
| |
BlackRock Total Return ETF | |
Management has evaluated the impact of all subsequent events on the Funds through the date the financial statements were available to be issued and has determined that there were no subsequent events requiring adjustment or additional disclosure in the financial statements.
Notes to Financial Statements128
Report of Independent Registered Public Accounting Firm
To the Board of Trustees of
BlackRock ETF Trust II and Shareholders of each of the seven funds listed in the table below
Opinions on the Financial Statements
We have audited the accompanying statements of assets and liabilities, including the schedules of investments, of each of the funds listed in the table below (seven of the funds constituting BlackRock ETF Trust II, hereafter collectively referred to as the "Funds") as of July 31, 2024, the related statements of operations and of changes in net assets for each of the periods indicated in the table below, including the related notes, and the financial highlights for each of the periods indicated therein (collectively referred to as the “financial statements”). In our opinion, the financial statements present fairly, in all material respects, the financial position of each of the Funds listed in the table below as of July 31, 2024, the results of each of their operations and the changes in each of their net assets for the periods indicated in the table below and each of the financial highlights for each of the periods indicated therein, in conformity with accounting principles generally accepted in the United States of America.
|
BlackRock Flexible Income ETF(2) |
BlackRock Floating Rate Loan ETF(3) |
BlackRock High Yield Muni Income Bond ETF(4) |
BlackRock Intermediate Muni Income Bond ETF(4) |
BlackRock Short-Term California Muni Bond ETF(5) |
BlackRock Total Return ETF(6) |
(1) Statement of operations for the year ended July 31, 2024 and statement of changes in net assets for the year ended July 31, 2024 and the period January 10, 2023 (commencement of operations) to July 31, 2023.
(2) Statement of operations for the year ended July 31, 2024 and statement of changes in net assets for the year ended July 31, 2024 and the period May 19, 2023 (commencement of operations) to July 31, 2023.
(3) Statement of operations for the year ended July 31, 2024 and statement of changes in net assets for the year ended July 31, 2024 and the period October 4, 2022 (commencement of operations) to July 31, 2023.
(4) Statement of operations for the year ended July 31, 2024 and statement of changes in net assets for each of the two years in the period ended July 31, 2024.
(5) Statement of operations for the year ended July 31, 2024 and statement of changes in net assets for the year ended July 31, 2024 and the period July 11, 2023 (commencement of operations) to July 31, 2023.
(6) Statement of operations and statement of changes in net assets for the period December 12, 2023 (commencement of operations) to July 31, 2024.
These financial statements are the responsibility of the Funds’ management. Our responsibility is to express an opinion on the Funds’ financial statements based on our audits. We are a public accounting firm registered with the Public Company Accounting Oversight Board (United States) (PCAOB) and are required to be independent with respect to the Funds in accordance with the U.S. federal securities laws and the applicable rules and regulations of the Securities and Exchange Commission and the PCAOB.
We conducted our audits of these financial statements in accordance with the standards of the PCAOB. Those standards require that we plan and perform the audit to obtain reasonable assurance about whether the financial statements are free of material misstatement, whether due to error or fraud.
/s/PricewaterhouseCoopers LLP
Philadelphia, Pennsylvania
September 23, 2024
We have served as the auditor of one or more BlackRock investment companies since 2000.
1292024 BlackRock Annual Financial Statements
Important Tax Information (unaudited)
For California income tax purposes, the BlackRock Short-Term California Muni Bond ETF designates 99.99% of its distributions paid from net investment income during the fiscal year ended July 31, 2024 as California exempt-interest dividends under Section 17145 of the California Revenue and Taxation Code.
The Fund intends to pass through to its shareholders the following amount, or maximum amount allowable by law, of foreign source income earned and foreign taxes paid for the fiscal year ended July 31, 2024:
| Foreign Source
Income Earned |
| |
The Funds hereby designate the following amounts, or maximum amounts allowable by law, of distributions from direct federal obligation interest for the fiscal year ended July 31, 2024:
| Federal Obligation
Interest |
| |
| |
| |
| |
The Funds hereby designate the following amounts, or maximum amounts allowable by law, as interest income eligible to be treated as a Section 163(j) interest dividend for the fiscal year ended July 31, 2024:
| |
| |
| |
| |
High Yield Muni Income Bond | |
Intermediate Muni Income Bond | |
Short-Term California Muni Bond | |
| |
The Funds hereby designate the following amounts, or maximum amounts allowable by law, as interest-related dividends eligible for exemption from U.S. withholding tax for nonresident aliens and foreign corporations for the fiscal year ended July 31, 2024:
| Interest-Related
Dividends |
| |
| |
| |
High Yield Muni Income Bond | |
Intermediate Muni Income Bond | |
Short-Term California Muni Bond | |
| |
Important Tax Information130
Premium/Discount Information
Information on the Fund's net asset value, market price, premiums and discounts, and bid-ask spreads can be found at blackrock.com.
Changes in and Disagreements with Accountants
Remuneration Paid to Trustees, Officers, and Others
Because BFA has agreed in the Investment Advisory Agreements to cover all operating expenses of the Funds, subject to certain exclusions as provided for therein, BFA pays the compensation to each independent trustee for services to the Funds from BFA's investment management fees.
Quarterly performance, semi-annual and annual reports, current net asset value and other information regarding the Funds may be found on BlackRock’s website, which can be accessed at blackrock.com. Any reference to BlackRock’s website in this report is intended to allow investors public access to information regarding the Funds and does not, and is not intended to, incorporate BlackRock’s website in this report.
Shareholders can sign up for e-mail notifications of quarterly statements, annual and semi-annual shareholder reports and prospectuses by enrolling in the electronic delivery program.
To enroll in electronic delivery:
Shareholders Who Hold Accounts with Investment Advisors, Banks or Brokerages:
Please contact your financial advisor. Please note that not all investment advisors, banks or brokerages may offer this service.
Shareholders Who Hold Accounts Directly with BlackRock:
1. Access the BlackRock website at blackrock.com
2. Select “Access Your Account”
3. Next, select “eDelivery” in the “Related Resources” box and follow the sign-up instructions
Fund and Service Providers
| |
BlackRock Fund Advisors
San Francisco, CA 94105 | BlackRock Investments, LLC(a) New York, NY 10001 |
| BlackRock Investments, LLC(b) Princeton, NJ 08540 |
| Independent Registered Public Accounting Firm |
BlackRock International Limited
Edinburgh, EH3 8BL
United Kingdom | PricewaterhouseCoopers LLP
Philadelphia, Pennsylvania 19103 |
| |
BlackRock (Singapore) Limited
079912 Singapore | Willkie Farr & Gallagher LLP
New York, NY 10019 |
Administrator, Custodian and Transfer Agent | |
State Street Bank and Trust Company
Boston, MA, 02114 | 100 Bellevue Parkway
Wilmington, DE 19809 |
| (a) For BINC, CALY and BRTR. |
| (b) For CLOA, BRLN, HYMU and INMU. |
1312024 BlackRock Annual Financial Statements
Disclosure of Investment Advisory Agreement and Sub-Advisory Agreements
The Board of Trustees (the “Board,” the members of which are referred to as “Board Members”) of BlackRock ETF Trust II (the “Trust”) met on May 3, 2024 (the “May Meeting”) and June 6-7, 2024 (the “June Meeting”) to consider the approval to continue the investment advisory agreement (the “Advisory Agreements”) between the Trust, on behalf of BlackRock AAA CLO ETF (“CLOA”), BlackRock Flexible Income ETF (“BINC”), BlackRock Floating Rate Loan ETF (“BRLN”), BlackRock High Yield Muni Income Bond ETF (“HYMU”), BlackRock Intermediate Muni Income Bond ETF (“INMU”) and BlackRock Short-Term California Muni Bond ETF (“CALY”) (collectively, the “Funds” and each, a “Fund”), and BlackRock Fund Advisors (the “Manager”), each Fund’s investment advisor. The Board also considered the approval to continue the sub-advisory agreements (the “Sub-Advisory Agreements”) between (1) the Manager and BlackRock International Limited (“BIL”), with respect to BINC and (2) BlackRock (Singapore) Limited (“BRS” and together with BIL, the “Sub-Advisors”), with respect to BINC. The Manager and the Sub-Advisors are referred to herein as “BlackRock.” The Advisory Agreement and the Sub-Advisory Agreements are referred to herein as the “Agreements.”
Consistent with the requirements of the Investment Company Act of 1940 (the “1940 Act”), the Board considers the approval of the continuation of the Agreements for each Fund on an annual basis. The Board members who are not “interested persons” of the Trust, as defined in the 1940 Act, are considered independent Board members (the “Independent Board Members”). The Board’s consideration entailed a year-long deliberative process during which the Board and its committees assessed BlackRock’s various services to each Fund, including through the review of written materials and oral presentations, and the review of additional information provided in response to requests from the Independent Board Members. The Board had four quarterly meetings per year, each of which extended over a two-day period, as well as additional ad hoc meetings and executive sessions throughout the year, as needed. The committees of the Board similarly met throughout the year. The Board also had an additional one-day meeting to consider specific information regarding the renewal of the Agreements. In considering the renewal of the Agreements, the Board assessed, among other things, the nature, extent and quality of the services provided to each Fund by BlackRock, BlackRock’s personnel and affiliates, including (as applicable): investment management services; accounting oversight; administrative and shareholder services; oversight of each Fund’s service providers; risk management and oversight; and legal, regulatory and compliance services. Throughout the year, including during the contract renewal process, the Independent Board Members were advised by independent legal counsel, and met with independent legal counsel in various executive sessions outside of the presence of BlackRock’s management.
During the year, the Board, acting directly and through its committees, considered information that was relevant to its annual consideration of the renewal of the Agreements, including the services and support provided by BlackRock to each Fund and its shareholders. BlackRock also furnished additional information to the Board in response to specific questions from the Board. Among the matters the Board considered were: (a) investment performance for one-year, three-year, five-year, and/or since inception periods, as applicable, against peer funds, relevant benchmarks, and other performance metrics, as applicable, as well as BlackRock senior management’s and portfolio managers’ investment performance analyses, and the reasons for any outperformance or underperformance relative to its peers, benchmarks, and other performance metrics, as applicable; (b) fees, including advisory, administration, if applicable, and other amounts paid to BlackRock and its affiliates by each Fund for services; (c) Fund operating expenses and how BlackRock allocates expenses to each Fund; (d) the resources devoted to, risk oversight of, and compliance reports relating to, implementation of each Fund’s investment objective, policies and restrictions, and meeting regulatory requirements; (e) BlackRock’s and each Fund’s adherence to applicable compliance policies and procedures; (f) the nature, character and scope of non-investment management services provided by BlackRock and its affiliates and the estimated cost of such services, as applicable; (g) BlackRock’s and other service providers’ internal controls and risk and compliance oversight mechanisms; (h) BlackRock’s implementation of the proxy voting policies approved by the Board; (i) execution quality of portfolio transactions; (j) BlackRock’s implementation of each Fund’s valuation and liquidity procedures; (k) an analysis of management fees paid to BlackRock for products with similar investment mandates across the open-end fund, exchange-traded fund (“ETF”), closed-end fund, sub-advised mutual fund, separately managed account, collective investment trust, and institutional separate account product channels, as applicable, and the similarities and differences between these products and the services provided as compared to each Fund; (l) BlackRock’s compensation methodology for its investment professionals and the incentives and accountability it creates, along with investment professionals’ investments in the fund(s) they manage; and (m) periodic updates on BlackRock’s business.
Prior to and in preparation for the May Meeting, the Board received and reviewed materials specifically relating to the renewal of the Agreements. The Independent Board Members continuously engaged in a process with their independent legal counsel and BlackRock to review the nature and scope of the information provided to the Board to better assist its deliberations. The materials provided in connection with the May Meeting included, among other things: (a) information independently compiled and prepared by Broadridge Financial Solutions, Inc. (“Broadridge”), based on either a Lipper classification or Morningstar category, regarding each Fund’s fees and expenses as compared with a peer group of funds as determined by Broadridge (“Expense Peers”) and the investment performance of each Fund as compared with a peer group of funds (“Performance Peers”); (b) information on the composition of the Expense Peers and Performance Peers and a description of Broadridge’s methodology; (c) information on the estimated profits realized by BlackRock and its affiliates pursuant to the Agreements and a discussion of fall-out benefits to BlackRock and its affiliates; (d) a general analysis provided by BlackRock concerning investment management fees received in connection with other types of investment products, such as institutional accounts, sub-advised mutual funds, ETFs, closed-end funds, open-end funds, and separately managed accounts, under similar investment mandates, as well as the performance of such other products, as applicable; (e) a review of non-management fees; (f) the existence, impact and sharing of potential economies of scale, if any, with each Fund; (g) a summary of aggregate amounts paid by each Fund to BlackRock; (h) sales and redemption data regarding each Fund’s shares; and (i) various additional information requested by the Board as appropriate regarding BlackRock’s and each Fund’s operations.
At the May Meeting, the Board reviewed materials relating to its consideration of the Agreements and the Independent Board Members presented BlackRock with questions and requests for additional information. BlackRock responded to these questions and requests with additional written information in advance of the June Meeting, and such responses were reviewed by the Board Members.
At the June Meeting, the Board concluded its assessment of, among other things: (a) the nature, extent and quality of the services provided by BlackRock; (b) the investment performance of each Fund as compared to its Performance Peers and to other metrics, as applicable; (c) the advisory fee and the estimated cost of the services and estimated profits realized by BlackRock and its affiliates from their relationship with each Fund; (d) each Fund’s fees and expenses compared to its Expense Peers; (e) the
Disclosure of Investment Advisory Agreement and Sub-Advisory Agreements132
Disclosure of Investment Advisory Agreement and Sub-Advisory Agreements (continued)
existence and sharing of potential economies of scale; (f) any fall-out benefits to BlackRock and its affiliates as a result of BlackRock’s relationship with each Fund; and (g) other factors deemed relevant by the Board Members.
The Board also considered other matters it deemed important to the approval process, such as other payments made to BlackRock or its affiliates relating to securities lending and cash management, and BlackRock’s services related to the valuation and pricing of Fund portfolio holdings. The Board noted the willingness of BlackRock’s personnel to engage in open, candid discussions with the Board. The Board evaluated the information available to it on a fund-by-fund basis. The following paragraphs provide more information about some of the primary factors that were relevant to the Board’s decision. The Board Members did not identify any particular information, or any single factor as determinative, and each Board Member may have attributed different weights to the various items and factors considered.
A. Nature, Extent and Quality of the Services Provided by BlackRock
The Board, including the Independent Board Members, reviewed the nature, extent and quality of services provided by BlackRock, including the investment advisory services, and the resulting performance of each Fund. Throughout the year, the Board compared Fund performance to the performance of a comparable group of mutual funds, relevant benchmarks, and performance metrics, as applicable. The Board met with BlackRock’s senior management personnel responsible for investment activities, including the senior investment officers. The Board also reviewed the materials provided by each Fund’s portfolio management team discussing each Fund’s performance, investment strategies and outlook.
The Board considered, among other factors, with respect to BlackRock: the experience of each Fund’s portfolio management team; research capabilities; investments by portfolio managers in the funds they manage; portfolio trading capabilities; use of technology; commitment to compliance; credit analysis capabilities; risk analysis and oversight capabilities; and the approach to training and retaining portfolio managers and other research, advisory and management personnel. The Board also considered BlackRock’s overall risk management program, including the continued efforts of BlackRock and its affiliates to address cybersecurity risks and the role of BlackRock’s Risk & Quantitative Analysis Group. The Board engaged in a review of BlackRock’s compensation structure with respect to each Fund’s portfolio management team and BlackRock’s ability to attract and retain high-quality talent and create performance incentives.
In addition to investment advisory services, the Board considered the nature and quality of the administrative and other non-investment advisory services provided to each Fund. BlackRock and its affiliates provide each Fund with certain administrative, shareholder and other services (in addition to any such services provided to each Fund by third parties) and officers and other personnel as are necessary for the operations of each Fund. In particular, BlackRock and its affiliates provide each Fund with administrative services including, among others: (i) responsibility for disclosure documents, such as the prospectus, the summary prospectus (as applicable), the statement of additional information and periodic shareholder reports; (ii) oversight of daily accounting and pricing; (iii) responsibility for periodic filings with regulators; (iv) overseeing and coordinating the activities of third-party service providers including, among others, each Fund’s custodian, fund accountant, transfer agent, and auditor; (v) organizing Board meetings and preparing the materials for such Board meetings; (vi) providing legal and compliance support; (vii) furnishing analytical and other support to assist the Board in its consideration of strategic issues such as the merger, consolidation or repurposing of certain open-end funds; and (viii) performing or managing administrative functions necessary for the operation of each Fund, such as tax reporting, expense management, fulfilling regulatory filing requirements, overseeing each Fund’s distribution partners, and shareholder call center and other services. The Board reviewed the structure and duties of BlackRock’s fund administration, shareholder services, and legal and compliance departments and considered BlackRock’s policies and procedures for assuring compliance with applicable laws and regulations. The Board considered the operation of BlackRock’s business continuity plans.
The Board noted that the engagement of the Sub-Advisors with respect to BINC facilitates the provision of investment advice and trading by investment personnel out of non-U.S. jurisdictions. The Board considered that this arrangement provides additional flexibility to the portfolio management team, which may benefit BINC and its shareholders.
B. The Investment Performance of each Fund
The Board, including the Independent Board Members, reviewed and considered the performance history of each Fund throughout the year and at the May Meeting. In preparation for the May Meeting, the Board was provided with reports independently prepared by Broadridge, which included an analysis of each Fund’s performance as of December 31, 2023, as compared to its Performance Peers. Broadridge ranks funds in quartiles, ranging from first to fourth, where first is the most desirable quartile position and fourth is the least desirable. In connection with its review, the Board received and reviewed information regarding the investment performance of each Fund as compared to its Performance Peers and the respective Morningstar Category (“Morningstar Category”). The Board and its Performance Oversight Committee regularly review and meet with Fund management to discuss the performance of each Fund throughout the year.
In evaluating performance, the Board focused particular attention on funds with less favorable performance records. The Board also noted that while it found the data provided by Broadridge generally useful, it recognized the limitations of such data, including in particular, that notable differences may exist between a fund and its Performance Peers (for example, the investment objectives and strategies). Further, the Board recognized that the performance data reflects a snapshot of a period as of a particular date and that selecting a different performance period could produce significantly different results. The Board also acknowledged that long-term performance could be impacted by even one period of significant outperformance or underperformance, and that a single investment theme could have the ability to disproportionately affect long-term performance.
The Board noted that for the since inception period reported, CLOA ranked in the first quartile against its Morningstar Category. The Board noted that BlackRock believes that the Morningstar Category is an appropriate performance metric for CLOA, and that BlackRock has explained its rationale for this belief to the Board.
The Board noted that for the since inception period reported, BINC ranked in the first quartile against its Morningstar Category. The Board noted that BlackRock believes that the Morningstar Category is an appropriate performance metric for BINC, and that BlackRock has explained its rationale for this belief to the Board.
1332024 BlackRock Annual Financial Statements
Disclosure of Investment Advisory Agreement and Sub-Advisory Agreements (continued)
The Board noted that for the since inception period reported, BRLN ranked in the second quartile against its Morningstar Category. The Board noted that BlackRock believes that the Morningstar Category is an appropriate performance metric for BRLN, and that BlackRock has explained its rationale for this belief to the Board.
The Board noted that for each of the one-year and since inception periods reported, HYMU ranked in the first quartile against its Morningstar Category. The Board noted that BlackRock believes that the Morningstar Category is an appropriate performance metric for HYMU, and that BlackRock has explained its rationale for this belief to the Board.
The Board noted that for the one-year and since inception periods reported, INMU ranked in the second and first quartiles, respectively against its Morningstar Category. The Board noted that BlackRock believes that the Morningstar Category is an appropriate performance metric for INMU, and that BlackRock has explained its rationale for this belief to the Board.
The Board noted that for the since inception period reported, CALY ranked in the third quartile against its Morningstar Category. The Board noted that BlackRock believes that the Morningstar Category is an appropriate performance metric for CALY, and that BlackRock has explained its rationale for this belief to the Board. The Board and BlackRock reviewed CALY’s underperformance relative to its Morningstar Category during the applicable period.
C. Consideration of the Advisory/Management Fees and the Estimated Cost of the Services and Estimated Profits Realized by BlackRock and its Affiliates from their Relationship with each Fund
The Board, including the Independent Board Members, reviewed each Fund’s contractual management fee rate compared with those of its Expense Peers. The contractual management fee rate represents a combination of the advisory fee and any administrative fees, before taking into account any reimbursements or fee waivers. The Board also compared each Fund’s total expense ratio, as well as its actual management fee rate, to those of its Expense Peers. The total expense ratio represents a fund’s total net operating expenses, including any 12b-1 or non-12b-1 service fees. The total expense ratio gives effect to any expense reimbursements or fee waivers, and the actual management fee rate gives effect to any management fee reimbursements or waivers. The Board considered that the fee and expense information in the Broadridge report for each Fund reflected information for a specific period and that historical asset levels and expenses may differ from current levels, particularly in a period of market volatility. The Board considered the services provided and the fees charged by BlackRock and its affiliates to other types of clients with similar investment mandates, as applicable, including institutional accounts and sub-advised mutual funds (including mutual funds sponsored by third parties).
The Board received and reviewed statements relating to BlackRock’s financial condition. The Board reviewed BlackRock’s profitability methodology and was also provided with an estimated profitability analysis that detailed the revenues earned and the expenses incurred by BlackRock for services provided to each Fund. The Board reviewed BlackRock’s estimated profitability with respect to each Fund and other funds the Board currently oversees for the year ended December 31, 2023 compared to available aggregate estimated profitability data provided for the prior two years. The Board reviewed BlackRock’s estimated profitability with respect to certain other U.S. fund complexes managed by the Manager and/or its affiliates. The Board reviewed BlackRock’s assumptions and methodology of allocating expenses in the estimated profitability analysis, noting the inherent limitations in allocating costs among various advisory products. The Board recognized that profitability may be affected by numerous factors including, among other things, fee waivers and expense reimbursements by the Manager, the types of funds managed, precision of expense allocations and business mix. The Board thus recognized that calculating and comparing profitability at the individual fund level is difficult.
The Board noted that, in general, individual fund or product line profitability of other advisors is not publicly available. The Board reviewed BlackRock’s overall operating margin, in general, compared to that of certain other publicly traded asset management firms. The Board considered the differences between BlackRock and these other firms, including the contribution of technology at BlackRock, BlackRock’s expense management, and the relative product mix.
The Board considered whether BlackRock has the financial resources necessary to attract and retain high quality investment management personnel to perform its obligations under the Agreements and to continue to provide the high quality of services that is expected by the Board. The Board further considered factors including but not limited to BlackRock’s commitment of time and resources, assumption of risk, and liability profile in servicing each Fund, including in contrast to what is required of BlackRock with respect to other products with similar investment mandates across the open-end fund, ETF, closed-end fund, sub-advised mutual fund, separately managed account, collective investment trust, and institutional separate account product channels, as applicable.
The Board noted that CLOA’s contractual management fee rate ranked in the second quartile, and that the actual management fee rate and total expense ratio each ranked in the second quartile relative to CLOA’s Expense Peers.
The Board noted that BINC’s contractual management fee rate ranked in the second quartile, and that the actual management fee rate and total expense ratio each ranked in the first quartile relative to BINC’s Expense Peers. The Board further noted that BlackRock had contractually agreed to waive a portion of the advisory fee payable by BINC.
The Board noted that BRLN’s contractual management fee rate ranked in the third quartile, and that the actual management fee rate and total expense ratio each ranked in the second quartile relative to BRLN’s Expense Peers. The Board further noted that BlackRock had contractually agreed to waive a portion of the advisory fee payable by BRLN.
The Board noted that HYMU’s contractual management fee rate ranked in the third quartile, and that the actual management fee rate and total expense ratio each ranked in the second quartile relative to HYMU’s Expense Peers. The Board further noted that BlackRock had contractually agreed to waive a portion of the advisory fee payable by HYMU.
Disclosure of Investment Advisory Agreement and Sub-Advisory Agreements134
Disclosure of Investment Advisory Agreement and Sub-Advisory Agreements (continued)
The Board noted that INMU’s contractual management fee rate ranked in the second quartile, and that the actual management fee rate and total expense ratio each ranked in the second quartile relative to INMU’s Expense Peers. The Board further noted that BlackRock had contractually agreed to waive a portion of the advisory fee payable by INMU.
The Board noted that CALY’s contractual management fee rate ranked in the first quartile, and that the actual management fee rate and total expense ratio each ranked in the second quartile relative to CALY’s Expense Peers. The Board further noted that BlackRock had contractually agreed to waive a portion of the advisory fee payable by CALY.
The Board, including the Independent Board Members, considered the extent to which any economies of scale might benefit each Fund in a variety of ways as the assets of each Fund increase. The Board considered multiple factors, including the advisory fee rate and breakpoints, unitary fee structure, fee waivers, and/or expense caps, as applicable. The Board considered each Fund’s asset levels and whether the current fee schedule was appropriate.
E. Other Factors Deemed Relevant by the Board Members
The Board, including the Independent Board Members, also took into account other ancillary or “fall-out” benefits that BlackRock or its affiliates may derive from BlackRock’s respective relationships with each Fund, both tangible and intangible, such as BlackRock’s ability to leverage its investment professionals who manage other portfolios and its risk management personnel, an increase in BlackRock’s profile in the investment advisory community, and the engagement of BlackRock’s affiliates as service providers to each Fund, including for administrative, distribution, securities lending, ETF servicing and cash management services. With respect to securities lending, during the year the Board also considered information provided by independent third-party consultants related to the performance of each BlackRock affiliate as securities lending agent. The Board also considered BlackRock’s overall operations and its efforts to expand the scale of, and improve the quality of, its operations. The Board also noted that, subject to applicable law, BlackRock may use and benefit from third-party research obtained by soft dollars generated by certain registered fund transactions to assist in managing all or a number of its other client accounts.
In connection with its consideration of the Agreements, the Board also received information regarding BlackRock’s brokerage and soft dollar practices. The Board received reports from BlackRock which included information on brokerage commissions and trade execution practices throughout the year.
The Board noted the competitive nature of the ETF marketplace, and that shareholders are able to redeem or sell their Fund shares if they believe that each Fund’s fees and expenses are too high or if they are dissatisfied with the performance of each Fund.
At the June Meeting, in a continuation of the discussions that occurred during the May Meeting, and as a culmination of the Board’s year-long deliberative process, the Board, including the Independent Board Members, unanimously approved the continuation of the Advisory Agreement between the Manager and the Trust, on behalf of each Fund, for a one-year term ending June 30, 2025, and the Sub-Advisory Agreements between the Manager and the Sub-Advisors, with respect to BINC, for a one-year term ending June 30, 2025. Based upon its evaluation of all of the aforementioned factors in their totality, as well as other information, the Board, including the Independent Board Members, was satisfied that the terms of the Agreements were fair and reasonable and in the best interest of each Fund and its shareholders. In arriving at its decision to approve the Agreements, the Board did not identify any single factor or group of factors as all-important or controlling, but considered all factors together, and different Board Members may have attributed different weights to the various factors considered. The Independent Board Members were advised by independent legal counsel throughout the deliberative process.
1352024 BlackRock Annual Financial Statements
Glossary of Terms Used in this Report
|
| Assured Guaranty Municipal Corp. |
| |
| |
| Build America Mutual Assurance Co. |
| Overnight Brazil CETIP — Interbank Rate |
| Collateralized Loan Obligation |
| Constant Maturity Treasury |
| Certificates of Participation |
| |
| |
| Euro Interbank Offered Rate |
| Federal Housing Administration |
| |
| General Obligation Limited |
| Johannesburg Interbank Agreed Rate |
| London Interbank Offered Rate |
| Mexico Interbank TIIE 28 Day |
Portfolio Abbreviation (continued) |
| National Public Finance Guarantee Corp. |
| |
| |
| |
| Public Joint Stock Company |
| |
| |
| Real Estate Investment Trust |
| Securities Industry and Financial Markets Associations |
| Secured Overnight Financing Rate |
| Sterling Overnight Interbank Average Rate |
| |
| Separate Trading of Registered Interest & Principal of
Securities |
| |
| |
Currency Abbreviation (continued) |
| |
| |
| |
| |
| |
Glossary of Terms Used in this Report136
THIS PAGE INTENTIONALLY LEFT BLANK.
THIS PAGE INTENTIONALLY LEFT BLANK.
THIS PAGE INTENTIONALLY LEFT BLANK.
Want to know more?
blackrock.com | 1-800-474-2737
This report is intended for current holders. It is not authorized for use as an offer of sale or a solicitation of an offer to buy shares of the Funds unless preceded or accompanied by the Funds’ current prospectus. Past performance results shown in this report should not be considered a representation of future performance. Investment returns and principal value of shares will fluctuate so that shares, when redeemed, may be worth more or less than their original cost. Statements and other information herein are as dated and are subject to change.
Item 8 – Changes in and Disagreements with Accountants for Open-End Management Investment Companies – See Item 7
Item 9 – Proxy Disclosures for Open-End Management Investment Companies – See Item 7
Item 10 – Remuneration Paid to Directors, Officers, and Others of Open-End Management Investment Companies – See Item 7
Item 11 – Statement Regarding Basis for Approval of Investment Advisory Contract – See Item 7
Item 12 – Disclosure of Proxy Voting Policies and Procedures for Closed-End Management Investment Companies – Not Applicable
Item 13 – Portfolio Managers of Closed-End Management Investment Companies – Not Applicable
Item 14 – Purchases of Equity Securities by Closed-End Management Investment Company and Affiliated Purchasers – Not Applicable
Item 15 – Submission of Matters to a Vote of Security Holders – There have been no material changes to these procedures.
Item 16 – Controls and Procedures
(a) The registrant’s principal executive and principal financial officers, or persons performing similar functions, have concluded that the registrant’s disclosure controls and procedures (as defined in Rule 30a-3(c) under the Investment Company Act of 1940, as amended (the “1940 Act”)) are effective as of a date within 90 days of the filing date of this report based on the evaluation of these controls and procedures required by Rule 30a-3(b) under the 1940 Act and Rule 13a-15(b) or 15d-15(b) under the Securities Exchange Act of 1934, as amended.
(b) There were no changes in the registrant’s internal control over financial reporting (as defined in Rule 30a-3(d) under the 1940 Act) that occurred during the period covered by this report that have materially affected, or are reasonably likely to materially affect, the registrant’s internal control over financial reporting.
Item 17 – Disclosure of Securities Lending Activities for Closed-End Management Investment Companies – Not Applicable
Item 18 – Recovery of Erroneously Awarded Compensation – Not Applicable
Item 19 – Exhibits attached hereto
(a)(1) Code of Ethics – See Item 2
(a)(2) Any policy required by the listing standards adopted pursuant to Rule 10D-1 under the Exchange Act (17 CFR 240.10D-1) by the registered national securities exchange or registered national securities association upon which the registrant’s securities are listed – Not Applicable
(a)(3) Section 302 Certifications are attached
(a)(4) Any written solicitation to purchase securities under Rule 23c-1 – Not Applicable
(a)(5) Change in Registrant’s independent public accountant – Not Applicable
(b) Section 906 Certifications are attached
Pursuant to the requirements of the Securities Exchange Act of 1934 and the Investment Company Act of 1940, the registrant has duly caused this report to be signed on its behalf by the undersigned, thereunto duly authorized.
BlackRock ETF Trust II
| | |
| By: | | /s/ John M. Perlowski |
| | John M. Perlowski |
| | Chief Executive Officer (principal executive officer) of |
| | BlackRock ETF Trust II |
|
Date: September 23, 2024 |
Pursuant to the requirements of the Securities Exchange Act of 1934 and the Investment Company Act of 1940, this report has been signed below by the following persons on behalf of the registrant and in the capacities and on the dates indicated.
| | |
| By: | | /s/ John M. Perlowski |
| | John M. Perlowski |
| | Chief Executive Officer (principal executive officer) of |
| | BlackRock ETF Trust II |
|
Date: September 23, 2024 |
| |
By: | | /s/ Trent Walker |
| | Trent Walker |
| | Chief Financial Officer (principal financial officer) of |
| | BlackRock ETF Trust II |
|
Date: September 23, 2024 |