UNITED STATES
SECURITIES AND EXCHANGE COMMISSION
Washington, D.C. 20549
FORM N-CSR
CERTIFIED SHAREHOLDER REPORT OF REGISTERED
MANAGEMENT INVESTMENT COMPANIES
Investment Company Act file number: 811-23556
Datum One Series Trust
(Exact name of registrant as specified in charter)
50 S. LaSalle Street
Chicago, Illinois 60603
(Address of principal executive offices) (Zip code)
The Northern Trust Company
50 S. LaSalle Street
Chicago, Illinois 60603
(Name and address of agent for service)
Registrant’s telephone number, including area code: (312) 557-4100
Date of fiscal year end: March 31
Date of reporting period: March 31, 2022
Form N-CSR is to be used by management investment companies to file reports with the Commission not later than 10 days after the transmission to stockholders of any report that is required to be transmitted to stockholders under Rule 30e-1 under the Investment Company Act of 1940 (17 CFR 270.30e-1). The Commission may use the information provided on Form N-CSR in its regulatory, disclosure review, inspection, and policymaking roles.
A registrant is required to disclose the information specified by Form N-CSR, and the Commission will make this information public. A registrant is not required to respond to the collection of information contained in Form N-CSR unless the Form displays a currently valid Office of Management and Budget (“OMB”) control number. Please direct comments concerning the accuracy of the information collection burden estimate and any suggestions for reducing the burden to Secretary, Securities and Exchange Commission, 450 Fifth Street, NW, Washington, DC 20549-0609. The OMB has reviewed this collection of information under the clearance requirements of 44 U.S.C. § 3507.
Item 1. Reports to Stockholders.
(a) The following are copies of reports transmitted to shareholders pursuant to Rule 30e-1 under the Investment Company Act of 1940 (17 CFR 270.30e-1).

Polar Capital Emerging Market Stars Fund
ANNUAL REPORT
MARCH 31, 2022
This report is submitted for the general information of the shareholders of the Fund. It is not authorized for distribution to prospective investors unless preceded or accompanied by an effective prospectus.
POLAR CAPITAL EMERGING MARKET STARS FUND
TABLE OF CONTENTS
March 31, 2022
POLAR CAPITAL EMERGING MARKET STARS FUND
LETTER TO SHAREHOLDERS
Dear Shareholder:
We are pleased to present to shareholders the March 31, 2022 Annual Report for the Polar Capital Emerging Market Stars Fund (the “Fund”), a series of the Datum One Series Trust. This report contains the results of Fund operations for the year ended March 31, 2022.
We appreciate the trust and confidence you have placed in us by choosing the Fund and its Investment Adviser, Polar Capital LLP, and we look forward to continuing to serve your investing needs.
Sincerely,

Alastair Barrie
Managing Director - North America
Polar Capital
POLAR CAPITAL EMERGING MARKET STARS FUND
PERFORMANCE COMMENTARY
(Unaudited)
Fund performance
The Polar Capital Emerging Market Stars Fund (the “Fund”) returned -15.66% for the year ending 31 March 2022, compared to -11.37% for the MSCI Emerging Market Net Total Return Index, (the “Index”) for the same period, representing an underperformance of 4.30% (all figures in dollar terms, unless stated otherwise).
The past year has been a period with significant headwinds for our strategy, which is reflected in our negative absolute return as well as our underperformance relative to the benchmark. Value as an investment style in global equities has significantly outperformed growth and has been particularly profound in emerging markets. We have a clear and well-defined growth and quality style, meaning this has been a very difficult environment for us.
Macro background
Headlines over this period featured continued panic in the markets around inflation and the fear of a Fed rate hike cycle and their so-called quantitative tightening (QT). We believe this so-called ‘duration risk fear’ is more than priced into high quality growth companies in emerging markets that have experienced significant weakness and multiplier contraction on the back of this development. To be clear, we believe the fear of long rates structurally moving significantly higher is over-priced by the market and inflation levels are likely to normalize in 2023. Both the demand and supply sides have played a key role in the high inflation levels in the US (where it impacts liquidity globally). We believe inflation will ease, though we expect supply-driven inflation will be with us into next year while the Fed will be able to deal well with demand-side inflation which we believe will reach a more acceptable level towards the end of this year.
Much of the inflation fear significantly impacted many of our technology-driven investments even though we think the market has over-reacted. Most of these companies – in our case, semiconductor-related names – are short duration as they have high levels of cash on the balance sheet, trade at low earnings multipliers, sell in dollars and benefit from low levels of inflation. However, the market seems to take the view that if these companies are classified as technology businesses they must have duration risk. We still believe there is a compelling long-term investment case for these companies.
Another significant negative factor for emerging markets over this period was the extreme weakness in the Chinese equity market where internet, technology, industrials, and healthcare and pharma, saw significant selloffs. The MSCI China Net Total Return Index is down 32.54% (in dollar terms) over the past 12 months and the list of companies whose share price has more than halved is now a long one. A combination of regulation, particularly of internet companies, slower economic growth, Covid policies as well as geopolitical fears have sent shockwaves through the Chinese market. On a selective basis we are constructive because as stock-pickers we believe that we can identify growth and quality companies that we feel are cheap.
Fund activity
The year ended with Russia’s invasion of Ukraine, starting a war in Europe that sent risk aversion upwards and heralded another fear around global supply chains, spiking energy prices and increased geopolitical tension. We acted quickly when Russian troops crossed the border into Ukraine and the Fund had zero direct Russian exposure in the portfolio as of February 24, having already sold the small positions held in Yandex N.V. (internet)
1
POLAR CAPITAL EMERGING MARKET STARS FUND
PERFORMANCE COMMENTARY
(Unaudited)
and TCS Group Holding (FinTech/consumer finance). Performance suffered from the exit of the Russian market, but we strongly believe this was the right decision as we believe the war significantly changed the investment case for all Russian companies.
We also sold our position in EPAM Systems – a US-listed IT (information technology) services company – with most of its IT engineers located in Eastern Europe and its former headquarters in Ukraine. They do not sell into Russia, but their supply is focused on Ukraine and Eastern Europe.
India held up very well during the year and our stock selection was strong here giving a positive contribution to our portfolio performance. We had positive stock-picking in commodities, electric vehicles (EV) and renewable energy related sectors.
From a country perspective, we had positive performance contributions from India, South Korea, Vietnam and Russia, driven by not owning some of the large-cap names and having a zero weight when Russia was excluded from the emerging market benchmark.
We saw weak contribution from Brazil (our growth-related stocks were weak on an absolute basis while the benchmark-heavy value names were strong), Saudi Arabia (we had zero weight in the market which performed well on the back of rising oil prices), Taiwan (hit by the technology sell-off), Mexico (we had zero weight in a market that did well thank to its energy security) and China (we were underweight the market but our stronger growth profile meant performance was weaker than the market).
Industry-wise we did well within real estate and industrials, with IT adding a positive contribution through asset allocation as well as a small aggregated positive contribution from stock selection.
Financials dragged us down as did communication services, internet-related which hit us hard in China, south-east Asia and Brazil.
The best contributing stocks were eMemory Technology (Taiwan, semiconductors), Ivanhoe Mines (South Africa/DRC, copper mining), Daejoo Electronic Materials (Korea, special EV materials), EcoPro BM (Korea, special EV materials), Phoenix Mills (India, mall/consumers), Prestige Estates Projects (India, property), Sungrow Power Supply (China, renewable energy), Reliance Industries (India, industry and consumer conglomerate), Apollo Hospitals Enterprise (India, hospitals) and ICICI Bank (India, bank).
The weakest contributors were StoneCo (Brazil, FinTech), Alibaba Health Information Technology (China, digital healthcare/online pharmacy), Sea (south-east Asia, e-commerce), Bilibili (China, internet), TCS Group Holding (Russia, FinTech), MicroPort CardiFlow Medtech (China, MedTech), Tencent (China, internet), Petrobras (Brazil, oil exploration – not owning it), Prosus NV (broad-based emerging market internet and FinTech-related assets) and Ping An Insurance (China, insurance).
Our top-10 best contributing stocks generated significantly more positive contribution than we lost from our bottom-10 contributing stocks. We still believe we can find great stocks in emerging markets and that this has been an extreme period, with strong style headwinds against us, given our investment strategy.
Certain new stock purchases over the past year have been Shenzhen Inovance Technology (China, industrials), Sungrow Power Supply (China, renewable energy-related – inverters), JD Health International (China, digital healthcare), Venus MedTech Hangzhou (China, MedTech), Andes Technology (Taiwan, technology) and Itau Unibanco Holding (Brazil, bank).
2
POLAR CAPITAL EMERGING MARKET STARS FUND
PERFORMANCE COMMENTARY
(Unaudited)
Certain sells over the period were StoneCo (Brazil, FinTech), Alibaba Health Information Technology (China, digital healthcare), Daejoo Electronic Materials (Korea, special EV material), EPAM Systems (Ukraine, IT services), Yandex N.V. (Russia, internet) and TCS (Russia, FinTech).
In early April 2022, we introduced a number of commodity-related names as a reflection of the structural changes we believe are taking place.
Outlook
We see a number of factors that continue to create headwinds for many emerging market economies, such as: the US inflation scare adding significant duration risk into the asset class, US monetary policy creating a significant liquidity scare in the market, and the dollar on an appreciating trend which provides a headwind for many emerging market economies. In our view, sentiment towards China is probably the weakest in two decades. Energy prices are rising and there is now the risk this will, for a number of emerging markets, spread into food prices. Then there is Russia/Ukraine.
However, we believe many of these weak macroeconomic fundamentals are priced into the market and, in our view, we are starting to see extreme valuation levels. In our view, there are still many good growth opportunities in emerging markets, with opportunities in markets like India, Vietnam and Brazil. Furthermore, COVID-19 and the war in Ukraine has fast tracked some of the mega-trends such as those in technology and renewable energy. We believe the Russian-led energy panic can be solved by investment into renewable energy as this may also solve some of the energy security and environmental issues around the transition to net zero carbon emissions. We can also see the start of a selective commodity boom.
We believe emerging markets offer many ways to get exposure to these trends and we have structurally positioned the Fund to benefit from them. We do need an inflection point for the move from value back to a growth and quality investment style and we believe this will begin with the rollover of goods in the inflation basket – the more supply-driven factors will follow.

Jorry Nøddekær
Lead Portfolio Manager, Emerging Markets & Asia Team
March 31, 2022
3
POLAR CAPITAL EMERGING MARKET STARS FUND
PERFORMANCE COMMENTARY
(Unaudited)
Important Disclosures
This Commentary is for informational and discussion purposes only and does not constitute, and should not be construed as, an offer or solicitation for the purchase or sale with respect to any securities, products or services discussed, and neither does it provide investment advice. Any such offer or solicitation shall only be made pursuant to the Fund’s Prospectus which supersedes the information contained herein in its entirety.
The views expressed herein and any forward-looking statements are as of the date of this publication and are those of the portfolio management team. Future events or results may vary significantly from those expressed and are subject to change at any time in response to changing circumstances and industry developments. This information and data has been prepared from sources believed reliable, but the accuracy and completeness of the information cannot be guaranteed and is not a complete summary or statement of all available data.
Please refer to the Portfolio of Investments in this report for a complete list of the portfolio holdings. Portfolio composition will change due to ongoing management of the Fund. References to individual securities are for informational purposes only and should not be construed as recommendations by the Fund, the portfolio manager, the Adviser, or the distributor. It should not be assumed that future investments will be profitable or will equal the performance of the security examples discussed. The portfolio holdings as of the most recent quarter-end may be obtained at www.polarcapitalfunds.com. The Fund’s performance returns shown reflect applicable fee waivers and/or expense limits in effect during this period. Absent such fee waivers/expense limitations, if any, performance would have been lower. An index has no cash in its portfolio and imposes no sales charges. An investor cannot invest directly in an index.
4
POLAR CAPITAL EMERGING MARKET STARS FUND
HISTORICAL PERFORMANCE
March 31, 2022 (Unaudited)
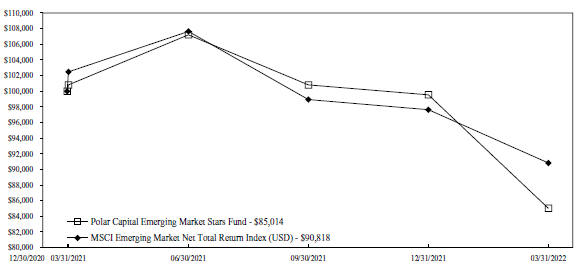
Change in Value of a $100,000 Investment in Polar Capital Emerging Market Stars Fund vs. MSCI Emerging Market Net Total Return Index for the Period December 30, 2020 to March 31, 2022
| | | | | | | | |
| | | Annualized Total Return | |
| | | | | | Commencement | |
| | | | | | of Operations | |
| | | | | | 12/30/2020 to | |
| | | 1 Year | | | 03/31/2022 | |
Polar Capital Emerging Market Stars Fund | | | -15.66 | % | | | -12.19 | % |
MSCI Emerging Market Net Total Return Index | | | -11.37 | % | | | -7.42 | % |
Based on a hypothetical $100,000 initial investment, the graph and table above illustrate the total return of the Fund against the MSCI Emerging Market Net Total Return Index. The Index is a float-adjusted market capitalization index that is designed to measure the combined equity market performance of developed and emerging market countries excluding the United States. This index does not reflect any commissions or fees which would be incurred by an investor purchasing the stocks it represents. An investor cannot invest directly in an index. The graph and the table above do not reflect the deduction of taxes that a shareholder would pay on the Fund distributions or redemption of Fund shares. The performance of the Fund and of the Index is computed on a total return basis which includes reinvestment of all distributions, if any.
Past performance is no guarantee of future results and current performance may be higher or lower than the performance shown. This data represents past performance and investors should understand that investment returns and principal values fluctuate, so that when you redeem your investment it may be worth more or less than its original cost. Current month-end performance data can be obtained by visiting the website at www.polarcapitalfunds.com or by calling 800-806-1112 (toll free) or 312-557-3164. The gross
5
POLAR CAPITAL EMERGING MARKET STARS FUND
HISTORICAL PERFORMANCE (Continued)
March 31, 2022 (Unaudited)
expense ratio is 5.34%; the net expense ratio is 1.00%. The latter reflects contractual fee waivers through July 31, 2022. Information regarding the Fund’s current expense ratio and redemption fees can be found on page 15. The Prospectus details the Fund’s objective and policies, sales charges, and other matters of interest to prospective investors. Please read the Prospectus carefully before investing. The Prospectus may be obtained by visiting the website at www.polarcapitalfunds.com, by email at PolarCapital@ntrs.com, by calling 800-806-1112 (toll free) or 312-557-3164 or by contacting the Fund in writing.
6
POLAR CAPITAL EMERGING MARKET STARS FUND
PORTFOLIO OF INVESTMENTS
March 31, 2022
| | | | |
| | | Percent of | |
| Industry Allocation | | Net Assets | |
Semiconductor Manufacturing | | | 21.8 | % |
Internet & Catalog Retail | | | 14.2 | |
Interactive Media & Services | | | 9.9 | |
Real Estate Management & Development | | | 8.4 | |
Technology Hardware, Storage & Peripherals | | | 7.3 | |
Banks | | | 6.1 | |
Oil, Gas & Consumable Fuels | | | 4.1 | |
Insurance | | | 4.0 | |
Electronic Equipment, Instruments & Components | | | 3.5 | |
Metals & Mining | | | 3.1 | |
Entertainment | | | 2.7 | |
Thrifts & Mortgage Finance | | | 2.6 | |
Machinery | | | 2.0 | |
IT Services | | | 1.6 | |
Electrical Equipment | | | 1.6 | |
Diversified Consumer Services | | | 0.9 | |
Health Care Providers & Services | | | 0.9 | |
Household Durables | | | 0.8 | |
Health Care Supplies | | | 0.7 | |
Other Assets And Liabilities, Net | | | 3.8 | % |
| | | | |
Net Assets | | | 100.0 | % |
| | | | |
| | | | |
| | | Percent of | |
| Country Allocation | | Net Assets | |
China | | | 24.9 | % |
Taiwan | | | 21.3 | |
India | | | 18.3 | |
South Korea | | | 15.2 | |
Brazil | | | 7.1 | |
Vietnam | | | 4.0 | |
Canada | | | 3.1 | |
Hong Kong | | | 2.3 | |
Other Assets And Liabilities, Net | | | 3.8 | % |
| | | | |
Net Assets | | | 100.0 | % |
| | | | |
Portfolio holdings and characteristics are subject to change and may not be representative of current holdings and characteristics. Fund holdings are subject to change daily.
See accompanying Notes to Financial Statements.
7
POLAR CAPITAL EMERGING MARKET STARS FUND
PORTFOLIO OF INVESTMENTS (Continued)
March 31, 2022
| | | | | | | | |
| | | Shares | | | Fair Value | |
COMMON STOCKS – 92.4% | | | | | | | | |
SEMICONDUCTOR MANUFACTURING – 21.8% | | | | | | | | |
Andes Technology Corp. (Taiwan) | | | 9,000 | | | $ | 124,945 | |
eMemory Technology Inc. (Taiwan) | | | 3,810 | | | | 242,110 | |
Koh Young Technology Inc. (South Korea) | | | 7,003 | | | | 108,709 | |
LandMark Optoelectronics Corp. (Taiwan) | | | 18,000 | | | | 114,668 | |
MediaTek Inc. (Taiwan) | | | 7,370 | | | | 229,358 | |
Silergy Corp. (China) | | | 610 | | | | 71,523 | |
SK Hynix Inc. (South Korea) | | | 1,875 | | | | 180,374 | |
Taiwan Semiconductor Manufacturing Co. Ltd. (Taiwan) | | | 39,500 | | | | 810,284 | |
| | | | | | | | |
| | | | | | $ | 1,881,971 | |
| | | | | | | | |
INTERNET & CATALOG RETAIL – 14.2% | | | | | | | | |
Alibaba Group Holding Ltd. (China) (a) | | | 25,572 | | | $ | 348,974 | |
Americanas S.A. (Brazil) (a) | | | 16,700 | | | | 114,524 | |
JD Health International Inc. (China) (a),(b) | | | 16,300 | | | | 97,598 | |
JD.com Inc. (China) (a) | | | 8,919 | | | | 253,433 | |
Meituan (China) (a),(b) | | | 9,200 | | | | 174,284 | |
MercadoLibre Inc. (Brazil) (a) | | | 196 | | | | 233,138 | |
| | | | | | | | |
| | | | | | $ | 1,221,951 | |
| | | | | | | | |
INTERACTIVE MEDIA & SERVICES – 9.9% | | | | | | | | |
NAVER Corp. (South Korea) | | | 940 | | | $ | 261,253 | |
Tencent Holdings Ltd. (China) | | | 12,950 | | | | 596,922 | |
| | | | | | | | |
| | | | | | $ | 858,175 | |
| | | | | | | | |
REAL ESTATE MANAGEMENT & DEVELOPMENT – 8.4% | | | | | | | | |
Phoenix Mills (The) Ltd. (India) | | | 21,300 | | | $ | 307,858 | |
Prestige Estates Projects Ltd. (India) | | | 17,346 | | | | 112,239 | |
Sunteck Realty Ltd. (India) | | | 11,996 | | | | 68,659 | |
Vincom Retail JSC (Vietnam) (a) | | | 56,660 | | | | 82,649 | |
Vinhomes JSC (Vietnam) (b) | | | 47,376 | | | | 156,756 | |
| | | | | | | | |
| | | | | | $ | 728,161 | |
| | | | | | | | |
TECHNOLOGY HARDWARE, STORAGE & PERIPHERALS – 7.3% | | | | | | | | |
Samsung Electronics Co. Ltd. (South Korea) | | | 10,958 | | | $ | 627,049 | |
| | | | | | | | |
OIL, GAS & CONSUMABLE FUELS – 4.1% | | | | | | | | |
Reliance Industries Ltd. (India) | | | 10,117 | | | $ | 349,923 | |
| | | | | | | | |
INSURANCE – 4.0% | | | | | | | | |
AIA Group Ltd. (Hong Kong) | | | 19,000 | | | $ | 198,396 | |
See accompanying Notes to Financial Statements.
8
POLAR CAPITAL EMERGING MARKET STARS FUND
PORTFOLIO OF INVESTMENTS (Continued)
March 31, 2022
| | | | | | | | |
| | | Shares | | | Fair Value | |
COMMON STOCKS — Continued | | | | | | | | |
Ping An Insurance Group Co. of China Ltd. (China) | | | 21,500 | | | $ | 150,308 | |
| | | | | | | | |
| | | | | | $ | 348,704 | |
| | | | | | | | |
BANKS – 3.9% | | | | | | | | |
ICICI Bank Ltd. (India) | | | 24,491 | | | $ | 233,595 | |
Vietnam Technological & Commercial Joint Stock Bank (Vietnam) (a) | | | 47,900 | | | | 103,343 | |
| | | | | | | | |
| | | | | | $ | 336,938 | |
| | | | | | | | |
METALS & MINING – 3.1% | | | | | | | | |
Ivanhoe Mines Ltd. (Canada) (a) | | | 28,553 | | | $ | 266,310 | |
| | | | | | | | |
ELECTRONIC EQUIPMENT, INSTRUMENTS & COMPONENTS – 2.8% | | | | | | | | |
Chroma ATE Inc. (Taiwan) | | | 19,000 | | | $ | 118,484 | |
Samsung SDI Co. Ltd. (South Korea) | | | 250 | | | | 121,673 | |
| | | | | | | | |
| | | | | | $ | 240,157 | |
| | | | | | | | |
ENTERTAINMENT – 2.7% | | | | | | | | |
Bilibili Inc. (China) (a) | | | 1,474 | | | $ | 37,522 | |
Sea Ltd. (Taiwan) (a),(c) | | | 1,649 | | | | 197,534 | |
| | | | | | | | |
| | | | | | $ | 235,056 | |
| | | | | | | | |
THRIFTS & MORTGAGE FINANCE – 2.6% | | | | | | | | |
Housing Development Finance Corp. Ltd. (India) | | | 7,268 | | | $ | 227,256 | |
| | | | | | | | |
IT SERVICES – 1.6% | | | | | | | | |
Coforge Ltd. (India) | | | 2,407 | | | $ | 140,829 | |
| | | | | | | | |
ELECTRICAL EQUIPMENT – 1.6% | | | | | | | | |
LG Energy Solution (South Korea) (a) | | | 25 | | | $ | 9,117 | |
Sungrow Power Supply Co. Ltd. (China) | | | 7,700 | | | | 128,903 | |
| | | | | | | | |
| | | | | | $ | 138,020 | |
| | | | | | | | |
MACHINERY – 1.1% | | | | | | | | |
Shenzhen Inovance Technology Co. Ltd. (China) | | | 10,300 | | | $ | 91,793 | |
| | | | | | | | |
DIVERSIFIED CONSUMER SERVICES – 0.9% | | | | | | | | |
Arco Platform Ltd. (Brazil) (a) | | | 3,772 | | | $ | 79,589 | |
| | | | | | | | |
HEALTH CARE PROVIDERS & SERVICES – 0.9% | | | | | | | | |
Apollo Hospitals Enterprise Ltd. (India) | | | 1,288 | | | $ | 76,440 | |
| | | | | | | | |
See accompanying Notes to Financial Statements.
9
POLAR CAPITAL EMERGING MARKET STARS FUND
PORTFOLIO OF INVESTMENTS (Continued)
March 31, 2022
| | | | | | | | |
| | | Shares | | | Fair Value | |
COMMON STOCKS — Continued | | | | | | | | |
HOUSEHOLD DURABLES – 0.8% | | | | | | | | |
Dixon Technologies India Ltd. (India) | | | 1,144 | | | $ | 64,639 | |
| | | | | | | | |
HEALTH CARE SUPPLIES – 0.7% | | | | | | | | |
Venus MedTech Hangzhou Inc. (China) (a),(b) | | | 30,500 | | | $ | 62,230 | |
| | | | | | | | |
TOTAL COMMON STOCKS–92.4% (Cost $9,192,384) | | | | | | $ | 7,975,191 | |
| | | | | | | | |
PARTICIPATORY NOTES – 1.6%(d) | | | | | | | | |
MACHINERY – 0.9% | | | | | | | | |
Leader Harmonious Drive Systems Co. Ltd., Issued by CLSA Global Markets Pte. Ltd. (China) (a) | | | 4,424 | | | $ | 73,679 | |
| | | | | | | | |
ELECTRONIC EQUIPMENT, INSTRUMENTS & COMPONENTS – 0.7% | | | | | | | | |
OPT Machine Vision Tech Co. Ltd., Issued by CLSA Global Markets Pte. Ltd. (China) (a) | | | 2,053 | | | $ | 59,699 | |
| | | | | | | | |
TOTAL PARTICIPATORY NOTES–1.6% (Cost $155,498) | | | | | | $ | 133,378 | |
| | | | | | | | |
See accompanying Notes to Financial Statements.
10
POLAR CAPITAL EMERGING MARKET STARS FUND
PORTFOLIO OF INVESTMENTS (Continued)
March 31, 2022
| | | | | | | | |
PREFERRED STOCKS – 2.2% | | | | | | | | |
BANKS – 2.2% | | | | | | | | |
Itau Unibanco Holding S.A. 2.56% (Brazil) (e) | | | 32,650 | | | $ | 188,450 | |
| | | | | | | | |
TOTAL INVESTMENTS–96.2% (Cost $9,504,773) | | | | | | $ | 8,297,019 | |
Other Assets and Liabilities, net – 3.8% | | | | | | $ | 331,525 | |
| | | | | | | | |
NET ASSETS–100.0% | | | | | | $ | 8,628,544 | |
| | | | | | | | |
| (a) | Non-income producing security. |
| (b) | Security exempt from registration under Rule 144A of the Securities Act of 1933. These securities may be resold in transactions exempt from registration, typically only to qualified institutional buyers. Unless otherwise indicated, these securities are not considered to be illiquid. |
| (c) | This security represents the common stock of a foreign company which trades directly or through an American Depositary Receipt (ADR) on the over-the-counter market or on a U.S. national securities exchange. |
| (d) | Participation notes are issued by banks or broker-dealers and are designed to offer a return linked to the performance of a particular underlying equity security or market. Accordingly, the equity-linked securities also expose investors to counterparty risk, which is the risk that the entity issuing the note may not be able to honor its financial commitments. |
| (e) | Current yield is disclosed. Dividends are calculated based on a percentage of the issuer’s net income. |
See accompanying Notes to Financial Statements.
11
POLAR CAPITAL EMERGING MARKET STARS FUND
STATEMENT OF ASSETS AND LIABILITIES
March 31, 2022
| | | | |
ASSETS | | | | |
Investment securities— at fair value (identified cost $9,504,773) | | $ | 8,297,019 | |
Cash | | | 333,996 | |
Foreign currencies at value (identified cost $46,605) | | | 46,519 | |
Receivable for: | | | | |
Dividends and interest | | | 13,652 | |
Reimbursement from Adviser | | | 11,861 | |
Reimbursement from Administrator | | | 37,500 | |
Prepaid assets | | | 16,791 | |
| | | | |
Total assets | | | 8,757,338 | |
| | | | |
LIABILITIES | | | | |
Payable for: | | | | |
Accrued expenses and other liabilities | | | 96,309 | |
Foreign capital gains taxes | | | 32,485 | |
| | | | |
Total liabilities | | | 128,794 | |
| | | | |
NET ASSETS | | $ | 8,628,544 | |
| | | | |
SUMMARY OF SHAREHOLDERS’ EQUITY | | | | |
Capital stock—no par value; unlimited authorized shares; 1,052,749 outstanding shares | | | 10,494,253 | |
Distributable earnings | | | (1,865,709 | ) |
| | | | |
NET ASSETS | | $ | 8,628,544 | |
| | | | |
NET ASSET VALUE | | | | |
Offering and redemption price per share | | $ | 8.20 | |
| | | | |
See accompanying Notes to Financial Statements.
12
POLAR CAPITAL EMERGING MARKET STARS FUND
STATEMENT OF OPERATIONS
For the Year Ended March 31, 2022
| | | | |
INVESTMENT INCOME | | | | |
Dividends (net of foreign taxes withheld of $11,186) | | $ | 86,821 | |
| | | | |
Total investment income | | | 86,821 | |
| | | | |
EXPENSES | | | | |
Fund accounting and administrative services fees (Note 6) | | | 130,923 | |
Advisory fees (Note 6) | | | 99,614 | |
Legal fees | | | 53,943 | |
Filing fees (Note 6) | | | 46,545 | |
Regulatory and compliance fees (Note 6) | | | 42,127 | |
Transfer agent fees and expenses (Note 6) | | | 41,767 | |
Audit and tax services fees | | | 36,168 | |
Custodian fees (Note 6) | | | 15,830 | |
Reports to shareholders | | | 3,779 | |
Trustee fees and expenses (Note 6) | | | 1,570 | |
Other | | | 1,442 | |
| | | | |
Total expenses | | | 473,708 | |
| | | | |
Waiver/Reimbursement from Administrator (Note 6) | | | (150,103 | ) |
Waiver/Reimbursement from Adviser (Note 6) | | | (222,876 | ) |
| | | | |
Net expenses | | | 100,729 | |
| | | | |
Net Investment Loss | | | (13,908 | ) |
| | | | |
NET REALIZED AND UNREALIZED APPRECIATION (DEPRECIATION) | | | | |
Net realized gain (loss) on: | | | | |
Investments | | | (369,944 | ) |
Foreign currency transactions | | | (865 | ) |
Net change in unrealized appreciation (depreciation) of: | | | | |
Investments (net change in deferred capital gains taxes of ($27,852)) | | | (1,222,349 | ) |
Translation of foreign currency denominated amounts | | | 1,607 | |
| | | | |
Net realized and unrealized (loss) | | | (1,591,551 | ) |
| | | | |
NET INCREASE IN NET ASSETS RESULTING FROM OPERATIONS | | $ | (1,605,459 | ) |
| | | | |
See accompanying Notes to Financial Statements.
13
POLAR CAPITAL EMERGING MARKET STARS FUND
STATEMENTS OF CHANGES IN NET ASSETS
| | | | | | | | |
| | | Year Ended
March 31, 2022 | | | Period Ended
March 31, 2021(a) | |
INCREASE (DECREASE) IN NET ASSETS | | | | | | | | |
Operations: | | | | | | | | |
Net investment loss | | $ | (13,908 | ) | | $ | (21,164 | ) |
Net realized gain (loss) | | | (370,809 | ) | | | 119,918 | |
Net change in unrealized appreciation (depreciation) | | | (1,220,742 | ) | | | (19,751 | ) |
| | | | | | | | |
Net increase (decrease) in net assets resulting from operations | | | (1,605,459 | ) | | | 79,003 | |
| | | | | | | | |
Distributions to shareholders | | | (348,707 | ) | | | — | |
| | | | | | | | |
Capital stock transactions: | | | | | | | | |
Proceeds from capital stock sold | | | 155,000 | | | | 9,900,000 | |
Proceeds from shares issued to shareholders upon reinvestment of dividends and distributions | | | 348,707 | | | | — | |
| | | | | | | | |
Net increase from capital stock transactions | | | 503,707 | | | | 9,900,000 | |
| | | | | | | | |
Total change in net assets | | | (1,450,459 | ) | | | 9,979,003 | |
| | | | | | | | |
NET ASSETS | | | | | | | | |
Beginning of period | | | 10,079,003 | | | | 100,000 | |
| | | | | | | | |
End of period | | $ | 8,628,544 | | | $ | 10,079,003 | |
| | | | | | | | |
CHANGE IN CAPITAL STOCK OUTSTANDING | | | | | | | | |
Shares of capital stock sold | | | 15,613 | | | | 990,000 | |
Shares issued to shareholders upon reinvestment of dividends and distributions | | | 37,136 | | | | — | |
| | | | | | | | |
Change in capital stock outstanding | | | 52,749 | | | | 990,000 | |
| | | | | | | | |
| (a) | For the period from December 30, 2020 (Commencement of Operations) to March 31, 2021. |
See accompanying Notes to Financial Statements.
14
POLAR CAPITAL EMERGING MARKET STARS FUND
FINANCIAL HIGHLIGHTS
Selected Data for Each Share of Capital Stock Outstanding Throughout The Period
| | | | | | | | |
| | | Year Ended
March 31,
2022 | | | Period Ended
March 31,
2021(a) | |
Per share operating performance: | | | | | | | | |
Net asset value, beginning of period | | $ | 10.08 | | | $ | 10.00 | |
| | | | | | | | |
Income from investment operations: | | | | | | | | |
Net investment loss(b) | | $ | (0.01 | ) | | $ | (0.02 | ) |
Net realized and unrealized gain (loss) on investment securities | | | (1.52 | ) | | | 0.10 | |
| | | | | | | | |
Total from investment operations | | $ | (1.53 | ) | | $ | 0.08 | |
| | | | | | | | |
Less distributions: | | | | | | | | |
Distributions from net investment income | | $ | (0.09 | ) | | $ | — | |
Distributions from net realized capital gains | | | (0.26 | ) | | | — | |
| | | | | | | | |
Total distributions | | $ | (0.35 | ) | | $ | — | |
| | | | | | | | |
Net asset value, end of period | | $ | 8.20 | | | $ | 10.08 | |
| | | | | | | | |
Total investment return(c), (d) | | | (15.66 | )% | | | 0.80 | % |
Ratios/supplemental data: | | | | | | | | |
Net assets, end of period (in $000’s) | | $ | 8,629 | | | $ | 10,079 | |
Ratio of expenses to average net assets | | | | | | | | |
Before waiver/reimbursement(e) | | | 4.70 | % | | | 5.34 | % |
After waiver/reimbursement(e) | | | 1.00 | % | | | 1.00 | % |
Ratio of net investment income to average net assets: | | | | | | | | |
Before waiver/reimbursement(e) | | | (3.84 | )% | | | (5.14 | )% |
After waiver/reimbursement(e) | | | (0.14 | )% | | | (0.80 | )% |
Portfolio turnover rate(c) | | | 38 | % | | | 15 | % |
| (a) | For the period from December 30, 2020 (Commencement of Operations) to March 31, 2021. |
| (b) | Per share amount is based on average shares outstanding. |
| (c) | Not annualized for periods less than a year. |
| (d) | Return is based on net asset value per share, adjusted for reinvestment of distributions, and does not reflect deduction of the sales charge. |
| (e) | Annualized for periods less than one year. |
See accompanying Notes to Financial Statements.
15
POLAR CAPITAL EMERGING MARKET STARS FUND
NOTES TO FINANCIAL STATEMENTS
March 31, 2022
NOTE 1 — Organization
Datum One Series Trust (the “Trust”) is a Massachusetts business trust operating under an Amended and Restated Agreement and Declaration of Trust (the “Trust Agreement”) dated March 3, 2020. The Trust is an open-end management investment company registered under the Investment Company Act of 1940, as amended (the “1940 Act”). The Trust Agreement permits the Board of Trustees (the “Trustees” or “Board”) to authorize and issue an unlimited number of shares of beneficial interest, at no par value, in separate series of the Trust. Polar Capital Emerging Market Stars Fund (the “Fund”) is a series of the Trust. These financial statements and notes only relate to the Fund.
The Fund is a non-diversified fund, meaning it may invest in a smaller number of companies than a diversified fund. The Fund seeks to achieve long term capital growth. For information on the specific strategies of the Fund, please refer to the Fund’s Prospectus.
Under the Trust’s organizational documents, its officers and Trustees are indemnified against certain liabilities arising out of the performance of their duties to the Trust and Fund. In addition, in the normal course of business, the Trust enters into contracts with its vendors and others that provide for general indemnifications. The Fund’s maximum exposure under these arrangements is unknown, as this would involve future claims that may be made against the Fund.
NOTE 2 — Significant Accounting Policies
The Fund is an investment company that applies the accounting and reporting guidance issued in Topic 946 by the U.S. Financial Accounting Standards Board. The financial statements of the Fund have been prepared in conformity with accounting principles generally accepted in the United States of America (“U.S. GAAP”).
The Fund’s investments are reported at fair value as defined by U.S. GAAP. The Fund generally determines its net asset value as of approximately 4:00 p.m. New York time each day the New York Stock Exchange is open. Further discussion of valuation methods, inputs and classifications can be found under Disclosure of Fair Value Measurements.
| B. | Securities Transactions, Related Investment Income and Foreign Currency Translations |
Securities transactions are accounted for on the date the securities are purchased or sold. Dividend income and distributions to shareholders are recorded on the ex-dividend date. Interest income and expenses are recorded on an accrual basis. The books and records of the Fund are maintained in U.S. dollars as follows: (1) the foreign currency fair value of investment securities, and other assets and liabilities stated in foreign currencies, are translated using the daily spot rate; and (2) purchases, sales, income and expenses are translated at the rate of exchange prevailing on the respective dates of such transactions.
The Fund does not isolate that portion of the results of operations resulting from changes in foreign exchange rates on investments from the fluctuations arising from changes in market prices of securities held. Such fluctuations are included with the “Net realized gain (loss) on investments” and “Net change in unrealized appreciation (depreciation) of investments” on the Statement of Operations.
16
POLAR CAPITAL EMERGING MARKET STARS FUND
NOTES TO FINANCIAL STATEMENTS (Continued)
March 31, 2022
Net realized gains and losses from foreign currency transactions arise from sales of foreign currency, currency gains or losses realized between the trade and settlement dates on securities transactions, and the difference between the amounts of dividends, interest, and foreign withholding taxes recorded on the Fund’s books, and the U.S. dollar equivalent of the amounts actually received or paid. Net unrealized appreciation or depreciation on translation of assets and liabilities denominated in foreign currencies arise from changes in the value of assets and liabilities other than investments in securities at the period end, resulting from changes in the exchange rates.
Expenses directly attributable to a fund in the Trust are charged to that fund, while expenses that are attributable to more than one fund in the Trust are allocated among the applicable funds on a pro-rata basis to each adviser’s series of funds based on relative net assets or another reasonable basis.
The preparation of the financial statements in accordance with U.S. GAAP requires management to make estimates and assumptions that affect the amounts reported. Actual results could differ from those estimates.
NOTE 3 — Risk Considerations
Investing in the Funds may involve certain risks including, but not limited to, those described below.
Credit Risk: The Fund will be exposed to credit risk relating to parties with whom it trades and may also bear the risk of settlement default. In the event of a bankruptcy or other default, the Fund could experience both delays in liquidating the underlying securities and losses including a possible decline in value of the underlying securities during the period when the Fund seeks to enforce its rights thereto. This will have the effect of reducing levels of capital and income in the Fund and lack of access to income during this period together with the expense of enforcing the Fund’s rights.
Risks Associated with Investing in Equities: The Fund may invest in equity and equity-related securities traded on recognized stock exchanges and over-the-counter markets. Equity securities will be subject to risks associated with such investments, including fluctuations in market prices, adverse issuer or market information and the fact that equity and equity-related interests are subordinate in the right of payment to other corporate securities, including debt securities. The value of these securities varies with the performance of the respective issuers and movements in the equity markets generally. As a result, the Fund may suffer losses if it invests in equity securities of issuers where performance falls below market expectations or if equity markets in general decline or the Fund has not hedged against such a general decline. Futures and options on futures on equity securities and indices are subject to all the foregoing risks, in addition to the risks particularly associated with futures and derivative contracts.
Risks Associated with Investing in Emerging Markets: The Fund’s investments in non-U.S. issuers in developing or emerging market countries may involve increased exposure to changes in economic, social and political factors as compared to investments in more developed countries. The economies of most emerging market countries are in the early stage of capital market development and may be dependent on relatively fewer industries. As a result, their economic systems are still evolving. Their legal and political systems may also be less stable
17
POLAR CAPITAL EMERGING MARKET STARS FUND
NOTES TO FINANCIAL STATEMENTS (Continued)
March 31, 2022
than those in developed economies. Securities markets in these countries can also be smaller, and there may be increased settlement risks. The Public Company Accounting Oversight Board, which regulates auditors of U.S. companies, is unable to inspect audit work papers in certain foreign countries. Investors in emerging markets often have limited rights and few practical remedies to pursue shareholder claims, including class actions or fraud claims, and the ability of the U.S. Securities and Exchange Commission, the U.S. Department of Justice and other authorities to bring and enforce actions against foreign issuers or foreign persons is limited. Emerging market countries often suffer from currency devaluation and higher rates of inflation. Due to these risks, securities issued in developing or emerging countries may be more volatile, less liquid, and harder to value than securities issued in more developed countries.
Investment in China: Investing in securities of Chinese issuers, including by investing in A Shares, involves certain risks and considerations not typically associated with investing in securities of U.S. issuers, including, among others, (i) more frequent (and potentially widespread) trading suspensions and government interventions with respect to Chinese issuers, resulting in a lack of liquidity and in price volatility, (ii) currency revaluations and other currency exchange rate fluctuations or blockage, (iii) the nature and extent of intervention by the Chinese government in the Chinese securities markets, whether such intervention will continue and the impact of such intervention or its discontinuation, (iv) the risk of nationalization or expropriation of assets, (v) the risk that the Chinese government may decide not to continue to support economic reform programs, (vi) potentially higher rates of inflation, (vii) the unavailability of consistently-reliable economic data, (viii) the relatively small size and absence of operating history of many Chinese companies, (ix) accounting, auditing and financial reporting standards in China are different from U.S. standards and, therefore, disclosure of certain material information may not be available, the quality of financial information may vary and the Public Company Accounting Oversight Board, which regulates auditors of U.S. public companies, is unable to inspect audit work papers in certain foreign countries, including China, (x) greater political, economic, social, legal and tax-related uncertainty, (xi) higher market volatility caused by any potential regional territorial conflicts or natural disasters, (xii) higher dependence on exports and international trade, (xiii) the risk of increased trade tariffs, embargoes and other trade limitations, (xiv) restrictions on foreign ownership, and (xv) custody risks associated with investing through programs to access Chinese securities. Significant portions of the Chinese securities markets may become rapidly illiquid, as Chinese issuers have the ability to suspend the trading of their equity securities, and have shown a willingness to exercise that option in response to market volatility and other events. The liquidity of Chinese securities may shrink or disappear suddenly and without warning as a result of adverse economic, market or political events, or adverse investor perceptions, whether or not accurate.
Stock Connect Investing Risk: China “A Shares” are equity securities of issuers incorporated in mainland China that are denominated and currently traded in Renminbi (“RMB”) on the Shanghai or Shenzhen Stock Exchanges. Subject to minor exceptions, under current regulations in China, foreign investors, such as the Fund, can invest in A Shares only (i) through certain institutional investors that have obtained a license and quota from the Chinese regulators or (ii) through the Hong Kong-Shanghai Stock Connect or Shenzhen-Hong Kong Stock Connect programs. The Fund will invest in A Shares listed and traded on the SSE or Shenzhen Stock Exchange (“SZSE”) through the Stock Connect program, or on such other stock exchanges in China which participate in the Stock Connect program from time to time. The Fund’s investments in Stock Connect A Shares are generally subject to Chinese securities regulations and listing rules, among other restrictions that may affect the Fund’s
18
POLAR CAPITAL EMERGING MARKET STARS FUND
NOTES TO FINANCIAL STATEMENTS (Continued)
March 31, 2022
investments and returns, including daily limits on net purchases and transfer restrictions. In addition, the Stock Connect program’s trading, clearance and settlement procedures are relatively untested in China, which could pose risks to the Fund. While overseas investors currently are exempt from paying capital gains or value added taxes on income and gains from investments in Stock Connect A Shares, these Chinese tax rules could be changed, which could result in unexpected tax liabilities for the Fund.
The Stock Connect program will only operate on days when both the Chinese and Hong Kong markets are open for trading and when banks in both markets are open on the corresponding settlement days. There may be occasions when the Fund may be subject to the risk of price fluctuations of A Shares during the time when the Stock Connect program is not trading. Because of the way in which China A shares are held in Stock Connect, the Fund may not be able to exercise the rights of a shareholder and may be limited in its ability to pursue claims against the issuer of a security, and may suffer losses in the event the depository of the SSE or the SZSE becomes insolvent. Only certain China A shares are eligible to be accessed through the Stock Connect program. Such securities may lose their eligibility at any time, in which case they presumably could be sold but could no longer be purchased through the Stock Connect program. The Stock Connect program is a relatively new program. Further developments are likely and there can be no assurance as to the program’s continued existence or whether future developments regarding the program may restrict or adversely affect the Fund’s investments or returns. In addition, the application and interpretation of the laws and regulations of Hong Kong and China, and the rules, policies or guidelines published or applied by relevant regulators and exchanges in respect of the Stock Connect program are uncertain, and they may have a detrimental effect on the Fund’s investments and returns.
Derivatives Risk: The use of derivatives involves the risk that their value may not move as expected relative to the value of the relevant underlying assets, rates, or indices. Derivatives also present other risks, including market risk, liquidity risk, and counterparty risk.
Market Risk: The value of securities and instruments owned by the Fund may rise and fall, sometimes rapidly or unpredictably, due to factors affecting securities markets generally or particular industries or geographic areas.
Liquidity Risk: In some circumstances, investments may be relatively illiquid making it difficult to acquire or dispose of them at the prices quoted on the various exchanges. Accordingly, the Fund’s ability to respond to market movements may be impaired and the Fund may experience adverse price movements upon liquidation of its investments. Settlement of transactions may be subject to delay and administrative uncertainties.
Counterparty and Third Party Risk: Transactions involving a counterparty (including a clearing member or clearing house through which the Fund holds a derivative position) to a derivative contract, repurchase agreement, reverse repurchase agreement, or other financial instrument, or a third party responsible for servicing the instrument, are subject to the credit risk of the counterparty or third party, and to the counterparty’s or third party’s ability to perform in accordance with the terms of the transaction.
Large Investor Risk: Ownership of shares of the Fund may be concentrated in one or a few large investors. Such investors may redeem shares in large quantities or on a frequent basis. Redemptions by a large investor may affect the performance of the Fund, may increase realized capital gains, may accelerate the realization of taxable income or gains for shareholders and may increase transaction costs. These transactions potentially limit the use of any capital loss carryforwards and certain other losses to offset future realized capital gains (if any). Such
19
POLAR CAPITAL EMERGING MARKET STARS FUND
NOTES TO FINANCIAL STATEMENTS (Continued)
March 31, 2022
transactions may also increase the Fund’s expenses. In addition, the Fund may be delayed in investing new cash after a large shareholder purchase, and under such circumstances may be required to maintain a larger cash position than it ordinarily would.
Management Risk: The Fund is subject to management risk as an actively managed investment portfolio. The portfolio managers will apply investment techniques and risk analyses in making investment decisions for the Fund, but there can be no guarantee that these will produce the desired results. The portfolio managers’ opinion about the intrinsic worth or creditworthiness of a company or security may be incorrect, the portfolio managers may not make timely purchases or sales of securities for the Fund, the Fund’s investment objective may not be achieved, or the market may continue to undervalue the Fund’s securities. In addition, the Fund may not be able to quickly dispose of certain securities holdings. Moreover, there can be no assurance that the personnel of Polar Capital LLP (the “Adviser”) will continue to be associated with the Adviser for any length of time, and the loss of services of one or more key employees of the Adviser, including the portfolio managers, could have an adverse impact on the Fund’s ability to achieve its investment objective. Certain securities or other instruments in which the Fund seeks to invest may not be available in the quantities desired. In such circumstances, the portfolio managers may determine to purchase other securities or instruments as substitutes. Such substitute securities or instruments may not perform as intended, which could result in losses to the Fund.
Risks Associated with Non-Diversification: The Fund is non-diversified, which generally means that it may invest a greater percentage of its total assets in the securities of fewer issuers than a “diversified” fund. This increases the risk that a change in the value of any one investment held by the Fund could affect the overall value of the Fund more than it would affect that of a diversified fund holding a greater number of investments. Accordingly, the Fund’s value will likely be more volatile than the value of a more diversified fund. In addition, due to its relatively low number of holdings, the Fund will be more susceptible to company-specific events and risks impacting the particular securities held by the Fund than a fund with a greater number of holdings.
ESG Investing Risk: The Fund’s consideration of environmental, social and/or governance factors as part of its investment process may cause it to make different investments or achieve lower investment returns than funds that have a similar investment universe and/or investment style but that do not incorporate such factors in their strategy or investment processes. Additionally, the Fund may forgo opportunities to buy certain securities when it might otherwise be advantageous to do so, or sell securities when it might be otherwise disadvantageous for it to do so. Incorporating ESG factors into investment decision making is qualitative and subjective by nature, and there is no guarantee that the factors considered by the Adviser or any judgment exercised by the Adviser will reflect the beliefs or values of any particular investor. Socially responsible norms differ by region and industry, and a company’s ESG practices or the Adviser’s assessment of a company’s ESG practices may change over time.
NOTE 4 — Purchases and Sales of Investment Securities
For the year ended March 31, 2022 the aggregate costs of purchases and proceeds from sales of securities (excluding short-term investments) for the Fund was as follows:
20
POLAR CAPITAL EMERGING MARKET STARS FUND
NOTES TO FINANCIAL STATEMENTS (Continued)
March 31, 2022
| | | | | | | | |
| | | Cost of
Purchases of
Investment securities | | | Proceeds of
Investment securities
sold | |
Polar Capital Emerging Market Stars Fund | | $ | 3,720,994 | | | $ | 3,934,947 | |
NOTE 5 — Federal Income Tax
No provision for federal income tax is required because the Fund has elected to be taxed as a “regulated investment company” under the Internal Revenue Code (the “Code”) and intends to maintain this qualification and to distribute each year to its shareholders, in accordance with the minimum distribution requirements of the Code, its taxable net investment income and taxable net realized gains on investments.
At March 31, 2022, the tax components of undistributed net investment income, undistributed realized gains and unrealized gains are as follows:
| | | | | | | | | | | | |
| | | Undistributed
Ordinary
Income | | | Long-term
Capital
Gains | | | Unrealized
Loss | |
| | | | | | | | | | | | |
Polar Capital Emerging Market Stars Fund | | $ | — | | | $ | — | | | $ | (1,256,764 | ) |
21
POLAR CAPITAL EMERGING MARKET STARS FUND
NOTES TO FINANCIAL STATEMENTS (Continued)
March 31, 2022
The tax status of distributions paid during the fiscal period ended March 31, 2022 were as follows:
| | | | | | | | | | | | |
| | | Dividends
from
ordinary
Income
2022 | | | Dividends
from
long-term
capital gains
2022 | | | Total
Distributions
2022 | |
Polar Capital Emerging Market Stars Fund | | $ | 348,707 | | | $ | — | | | $ | 348,707 | |
As of March 31, 2022, the cost, gross unrealized appreciation and gross unrealized depreciation on investments, for Federal income tax purposes, were as follows:
| | | | | | | | | | | | | | | | |
| | | Tax Cost | | | Tax Unrealized
Appreciation | | | Tax Unrealized
(Depreciation) | | | Net Unrealized
Appreciation
(Depreciation) | |
Polar Capital Emerging Market Stars Fund | | $ | 9,521,044 | | | $ | 719,165 | | | $ | (1,943,190 | ) | | $ | (1,224,025 | ) |
As of and during the fiscal year ended March 31, 2022, the Fund did not have any liability for unrecognized tax benefits. The Fund recognizes interest and penalties, if any, related to unrecognized tax benefits as income tax expense in the Statement of Operations. For the fiscal year ended, the Fund did not incur any interest or penalties. The statute of limitations remains open for three years, once a return is filed. No examinations are in progress at this time.
For the period subsequent to October 31, 2021, through the fiscal year ended March 31, 2022, the Fund incurred net capital losses and late year ordinary losses of $494,632 and $114,313, respectively, which the Fund intends to treat as having been incurred in the following fiscal year: As of March 31, 2022, the Fund had no short-term capital or long-term capital loss carryforwards.
22
POLAR CAPITAL EMERGING MARKET STARS FUND
NOTES TO FINANCIAL STATEMENTS (Continued)
March 31, 2022
NOTE 6 — Advisory Fees and Other Affiliated Transactions
Pursuant to an Investment Management Agreement (the “Management Agreement”), advisory fees were paid by the Fund to Polar Capital, LLP (the“Adviser”). Under the terms of this Management Agreement, the Fund pays the Adviser a monthly fee calculated at the annual rate of 1.00% of the Fund’s average daily net assets. The Adviser has contractually agreed to waive advisory fees expenses and reimburse other expenses to the extent total annual fund operating expenses (exclusive of brokerage costs, interest, taxes, dividends, litigation and indemnification expenses, expenses associated with the investments in underlying investment companies) exceed 1.00% of the average daily net assets of the Fund through July 31, 2022. Amounts waived or reimbursed in a particular contractual period may be recouped by the Adviser for 36 months following the waiver or reimbursement, however, such recoupment will be limited to the lesser of any expense limitation in place at the time of recoupment or the expense limitation in place at the time of waiver or reimbursement. This agreement may only be terminated earlier by the Fund’s Board or upon termination of the Advisory Agreement. For the year ended March 31, 2022 the Advisor reimbursed the Fund $222,876 which is reflected as “Waiver/Reimbursement from Adviser” on the Statement of Operations. The amounts eligible for recoupment by the Adviser as of March 31, 2022 are $78,109 and $222,876, expiring March 31, 2024 and March 31, 2025, respectively.
Foreside Financial Services, LLC (the “Distributor”), provides distribution services to the Fund pursuant to a Distribution Agreement with the Trust, on behalf of the Fund. Under its agreement with the Trust, the Distributor acts as an agent of the Trust in connection with the offering of the shares of the Fund on a continuous basis. No compensation is payable by the Trust to the Distributor for such distribution services. The Adviser, at its own expense, pays the Distributor an annual fee in consideration for certain distribution related services.
The Northern Trust Company (the “Administrator”) serves as the administrator, transfer agent, custodian and fund accounting agent for the Funds pursuant to written agreements with the Trust on behalf of the Funds. The Fund has agreed to pay the Administrator a tiered basis-point fee based on the Fund’s net assets and certain per account and transaction charges. The total fee is subject to a minimum annual fee of $150,000 relating to these services, and reimbursement for certain expenses incurred on behalf of the Fund, as well as other charges for additional service activities. The Administrator has agreed to voluntarily waive its minimum fee and certain other expenses. The waiver agreement may be terminated at any time and the waivers are not subject to recoupment. The total fees paid to or reimbursed from the Administrator for the year ended March 31, 2022 are disclosed on the Statement of Operations in the accounts disclosed below:
| | | | | | | | | | | | | | | | |
| | | Transfer Agent
Fees and
Expenses | | | Custodian Fees | | | Fund Accounting and
Administrative Services
and Fees | | | Waiver/
Reimbursement
from Administrator | |
Polar Capital Emerging Market Stars Fund | | $ | 41,767 | | | $ | 15,830 | | | $ | 130,923 | | | $ | (150,103 | ) |
Foreside Fund Officer Services, LLC (“Foreside”) provides compliance and financial control services for the Fund pursuant to a written agreement with the Trust, on behalf of the Fund, including providing certain officers
23
POLAR CAPITAL EMERGING MARKET STARS FUND
NOTES TO FINANCIAL STATEMENTS (Continued)
March 31, 2022
to the Fund. The Fund has agreed to pay Foreside an annual base fee, as well as a basis-point fee based on the Fund’s daily net assets and has agreed to reimburse Foreside for certain expenses incurred on behalf of the Fund. Total fees paid to Foreside pursuant to this agreement are reflected as “Regulatory and Compliance fees” on the Statement of Operations.
Certain officers and Trustees of the Trust are affiliated with Foreside, the Administrator, or the Distributor and receive no compensation directly from the Fund for serving in their respective role. For the year ended March 31, 2022 the Fund paid $1,570 in Trustee compensation and reimbursement of out-of-pocket expenses allocated from the Trust to the Fund, which is reflected as “Trustee fees and expenses” on the Statement of Operations.
NOTE 7 — Disclosure of Fair Value Measurements
The Fund uses the following methods and inputs to establish the fair value of its assets and liabilities. Use of particular methods and inputs may vary over time based on availability and relevance as market and economic conditions evolve.
Equity securities are generally valued each day at the official closing price of, or the last reported sale price on, the exchange or market on which such securities principally are traded, as of the close of business on that day. If there have been no sales that day, equity securities are generally valued at the last available bid price. Securities that are unlisted and fixed-income and convertible securities listed on a national securities exchange for which the over-the-counter (“OTC”) market more accurately reflects the securities’ value in the judgment of the Fund’s officers, are valued at the most recent bid price. Events occurring after the close of trading on non- U.S. exchanges may result in adjustments to the valuation of foreign securities to reflect their fair value as of the close of regular trading on the NYSE. The Fund may utilize an independent fair valuation service in adjusting the valuations of foreign securities. Currency forwards are valued at the closing currency exchange rate which is not materially different from the forward rate. Short-term corporate notes with maturities of 60 days or less at the time of purchase are valued at amortized cost.
Securities for which representative market quotations are not readily available or are considered unreliable by the Adviser are valued as determined in good faith under procedures adopted by the authority of the Fund’s Board of Trustees. Various inputs may be reviewed in order to make a good faith determination of a security’s value. These inputs include, but are not limited to, the type and cost of the security; contractual or legal restrictions on resale of the security; relevant financial or business developments of the issuer; actively traded similar or related securities; conversion or exchange rights on the security; related corporate actions; significant events occurring after the close of trading in the security; and changes in overall market conditions. Fair valuations and valuations of investments that are not actively trading involve judgment and may differ materially from valuations of investments that would have been used had greater market activity occurred.
The Fund classifies its assets based on three valuation methodologies. Level 1 values are based on quoted market prices in active markets for identical assets. Level 2 values are based on significant observable market inputs, such as quoted prices for similar assets and quoted prices in inactive markets or other market observable inputs as noted above including spreads, cash flows, financial performance, prepayments, defaults, collateral, credit enhancements, and interest rate volatility. Level 3 values are based on significant unobservable inputs that
24
POLAR CAPITAL EMERGING MARKET STARS FUND
NOTES TO FINANCIAL STATEMENTS (Continued)
March 31, 2022
reflect the Fund’s determination of assumptions that market participants might reasonably use in valuing the assets. The valuation levels are not necessarily an indication of the risk associated with investing in those securities.
The following table presents the valuation levels of the Fund’s investments as of March 31, 2022:
| | | | | | | | | | | | | | | | |
| Investments | | Level 1 | | | Level 2 | | | Level 3 | | | Total | |
Common stocks: | | | | | | | | | | | | | | | | |
Diversified Consumer Services | | $ | 79,589 | | | $ | — | | | $ | — | | | $ | 79,589 | |
Electrical Equipment | | | 9,117 | | | | 128,903 | | | | — | | | | 138,020 | |
Entertainment | | | 197,534 | | | | 37,522 | | | | — | | | | 235,056 | |
Internet & Catalog Retail | | | 347,662 | | | | 874,289 | | | | — | | | | 1,221,951 | |
Metals & Mining | | | 266,310 | | | | — | | | | — | | | | 266,310 | |
Other(1) | | | — | | | | 6,034,265 | | | | — | | | | 6,034,265 | |
| | | | | | | | | | | | | | | | |
Total common stocks | | $ | 900,212 | | | $ | 7,074,979 | | | $ | — | | | $ | 7,975,191 | |
| | | | | | | | | | | | | | | | |
Participatory Notes(1) | | $ | — | | | $ | 133,378 | | | $ | — | | | $ | 133,378 | |
Preferred Stocks | | $ | 188,450 | | | $ | — | | | $ | — | | | $ | 188,450 | |
| | | | | | | | | | | | | | | | |
Total Investments | | $ | 1,088,662 | | | $ | 7,208,357 | | | $ | — | | | $ | 8,297,019 | |
| | | | | | | | | | | | | | | | |
| | | | | | | | | | | | | | | | |
| (1) | See additional categories in the portfolio of investments. |
As of March 31, 2022 there were no Level 3 securities held by the Fund. There were no transfers to or from Level 3 for the year ended March 31, 2022.
NOTE 8 — Subsequent Events
Management has evaluated subsequent events for the Fund occurring after March 31, 2022 through the date this report was issued and concluded that no subsequent events occurred which require recognition or disclosure.
25
| | | | |
 | | | | Deloitte & Touche LLP 111 S Wacker Drive Chicago, IL 60606 USA |
| | | | Tel: +1 312 486 1890 Fax: +1 312 247 1890 www.deloitte.com |
REPORT OF INDEPENDENT REGISTERED PUBLIC ACCOUNTING FIRM
To the Shareholders and Board of Trustees of Datum One Series Trust:
Opinion on the Financial Statements and Financial Highlights
We have audited the accompanying statement of assets and liabilities, including the portfolio of investments, of the Polar Capital Emerging Market Stars Fund (the “Fund”), one of the funds constituting Datum One Series Trust (the “Trust”), as of March 31, 2022, the related statements of operations for the year then ended, the statements of changes in net assets and the financial highlights for the year ended March 31, 2022 and for the period from December 30, 2020 (commencement of operations) through March 31, 2021, ,and the related notes. In our opinion, the financial statements and financial highlights present fairly, in all material respects, the financial position of the Fund as of March 31, 2022, and the result of its operations for the year then ended, the changes in its net assets and the financial highlights for the year ended March 31, 2022 and for the period from December 30, 2020 (commencement of operations) through March 31, 2021, in conformity with accounting principles generally accepted in the United States of America.
Basis for Opinion
These financial statements and financial highlights are the responsibility of the Fund’s management. Our responsibility is to express an opinion on the Fund’s financial statements and financial highlights based on our audits. We are a public accounting firm registered with the Public Company Accounting Oversight Board (United States) (PCAOB) and are required to be independent with respect to the Fund in accordance with the U.S. federal securities laws and the applicable rules and regulations of the Securities and Exchange Commission and the PCAOB.
We conducted our audits in accordance with the standards of the PCAOB. Those standards require that we plan and perform the audit to obtain reasonable assurance about whether the financial statements and financial highlights are free of material misstatement, whether due to error or fraud. The Fund is not required to have, nor were we engaged to perform, an audit of its internal control over financial reporting. As part of our audits, we are required to obtain an understanding of internal control over financial reporting but not for the purpose of expressing an opinion on the effectiveness of the Fund’s internal control over financial reporting. Accordingly, we express no such opinion.
Our audits included performing procedures to assess the risks of material misstatement of the financial statements and financial highlights, whether due to error or fraud, and performing procedures that respond to those risks. Such procedures included examining, on a test basis, evidence regarding the amounts and disclosures in the financial statements and financial highlights. Our audits also included evaluating the accounting principles used and significant estimates made by management, as well as evaluating the overall presentation of the financial statements and financial highlights. Our procedures included confirmation of securities owned as of March 31, 2022, by correspondence with the custodian and brokers; when replies were not received from brokers, we performed other auditing procedures. We believe that our audits provide a reasonable basis for our opinion.

May 24, 2022
We have served as the auditor of one or more Polar Capital LLP investment companies since 2020.
26
POLAR CAPITAL EMERGING MARKET STARS FUND
ADDITIONAL INFORMATION
March 31, 2022 (Unaudited)
A. Board Approval of Investment Advisory Agreement
Section 15 of the Investment Company Act of 1940 (the“1940 Act”) requires that the Investment Management Agreement between Datum One Series Trust (the “Trust”) and Polar Capital, LLP (the “Investment Manager”) with respect to the Polar Capital Emerging Market Stars Fund (the “Fund”) be approved by the vote of a majority of the Board of Trustees of the Trust (the “Board”), including a majority of the Trustees who are not “interested persons,” as that term is defined in the 1940 Act (“Independent Trustees”), cast at a meeting called for the purpose of voting on such approval. It is the duty of the Board to request and evaluate, and the duty of the Investment Manager to furnish, such information as may reasonably be necessary to evaluate the terms of the Investment Management Agreement. At a meeting held on February 22, 2022, the Board formally considered and approved the continuation of the Investment Management Agreement between the Trust, on behalf of the Fund, and the Investment Manager, dated March 3, 2020, for an additional one-year term ending March 3, 2023. The February 22, 2022 meeting was held by videoconference, in reliance on a temporary exemptive order issued by the United States Securities and Exchange Commission (the “SEC”), in light of the novel coronavirus (“COVID-19”) pandemic, permitting mutual fund boards of directors to approve advisory agreements at meetings held using remote communications technology, subject to certain conditions, including that the board ratify the approval at its next in-person meeting (the “Order”). The trustees, including each of the independent directors, met in person on May 24, 2022, and ratified its approval of the Investment Management Agreement with respect to the Fund, as well as all other agreements it had previously approved in reliance on the Order.
Prior to the February 22 meeting, the Board requested, and the Investment Manager provided, both written and oral reports containing information and data relating to the following: (1) the nature and quality of services to be furnished by the Investment Manager, projections of the Investment Manager’s costs of providing the services and possible economies of scale as and if the Fund grows larger, and whether and how the benefits of scale may be shared with the Fund; (2) the Fund’s interest in having a financially strong investment manager capable of competing with other investment advisers and financial institutions in attracting and retaining high quality investment personnel and investigating and employing new investment techniques, and the need to provide staff capable of administering a developing and expanding investment management business; (3) the risks assumed by the Investment Manager in complying with investment restrictions and applicable securities and tax laws, and its possible substantial liabilities to the Fund for failure to comply; (4) the volatility of the financial markets and thus of investment management fee income; (5) comparative expense ratios and management fees of competitive funds; (6) fall-out benefits to the Investment Manager and its affiliates, if any; and (7) the projected profitability of the Investment Manager from providing services to the Fund as and if the Fund grows. The Board also received and reviewed a memorandum from counsel to the Fund regarding the Board’s responsibilities in evaluating the Investment Management Agreement.
The Board examined the nature and quality of services to be provided to the Fund by the Investment Manager. The Board considered the terms of the Investment Management Agreement, information and reports provided by the Investment Manager on its personnel and operations, and the Investment Manager’s experience managing assets using an investment strategy similar to the Fund’s. The Board reviewed the Investment Manager’s investment philosophy and portfolio construction process and the Investment Manager’s compliance program,
27
POLAR CAPITAL EMERGING MARKET STARS FUND
ADDITIONAL INFORMATION (Continued)
March 31, 2022 (Unaudited)
pending litigation, insurance coverage, business continuity program, and information security practices. Taking into account the personnel involved in servicing the Fund as well as the materials and services provided by the Investment Manager, the Board expressed satisfaction with the quality, extent, and nature of the services expected from the Investment Manager.
The Board considered the investment performance and expenses of the Polar Fund. As part of this analysis, the Board reviewed an independent report prepared by FUSE (the “FUSE Report”). The FUSE Report consisted of comparisons of the Polar Fund to (i) thirteen funds with the same Morningstar investment category, selected by FUSE, with similar pricing characteristics (the“Peer Group”), (ii) a group of funds comprised of the Peer Group and all other funds with the same Morningstar investment category with similar pricing characteristics, excluding any outliers (the “Universe”), and (iii) the benchmark of the Polar Fund. The Board reviewed the Polar Fund’s performance for the since-inception, three-month, and one-year periods ending December 31, 2021. The Board noted the underperformance of the Polar Fund compared to its Peer Group and Universe and its outperformance compared to its benchmark. The Board then reviewed the performance, net of fees, of other Undertakings for the Collective Investment in Transferable Securities with a similar investment strategy as the Polar Fund managed by the Investment Manager (“Similar Polar Accounts) as compared to the Polar Fund over various time periods as well as the management fees of each. The Board noted that the relative performance of the Polar Fund did not vary significantly from the Similar Polar Accounts but for the impact of the different fee structures.
The Board considered the cost of services provided to the Fund and the profits projected to be realized by the Investment Manager. The Board reviewed the management fee paid by the Fund and the total operating expenses of the Fund. The Board noted that the Investment Manager receives a management fee of 1.00% of the average daily net assets of the Fund and that, under the Expense Limitation Agreement, the Investment Manager contractually has agreed to waive fees and/or reimburse expenses to the extent necessary to limit the Fund’s total operating expenses to the annual rate of 1.00% of the Fund’s average daily net assets through July 31, 2023. The Board reviewed comparative data regarding fees and expenses of the Fund’s Peer Group. The Board concluded that the management fee was reasonable. The Board considered the marketing and distribution efforts undertaken by the Investment Manager in order to grow the Fund to a size that might result in meaningful profits to the Investment Manager and in economies of scale to the Fund.
The Board considered that the Investment Manager may derive fall-out financial or other benefits from its management of the Fund which may include, among other things, enhanced name recognition stemming from the management of the Fund.
In its deliberations, the Board did not identify any particular factor or factors that were all-important or controlling, and each Trustee may have assigned different weights to the various factors considered.
B. Board Review of Liquidity Risk Management Program
The Trust has adopted a liquidity risk management program (the “LRMP”) pursuant to Rule 22e-4 under the Investment Company Act of 1940, as amended (the “1940 Act”). The LRMP’s principal objectives are to support the Fund’s compliance with limits on investments in illiquid assets and to mitigate the risk that the Fund is unable to meet its redemption obligations in a timely manner. In this regard, the LRMP includes a number of elements
28
POLAR CAPITAL EMERGING MARKET STARS FUND
ADDITIONAL INFORMATION (Continued)
March 31, 2022 (Unaudited)
that support the assessment or management of liquidity risk, including an assessment of factors that influence a Fund’s liquidity and the periodic classification and, as determined necessary, re-classification of the Fund’s investments into buckets that reflect their relative liquidity under current market conditions. The Trust’s Board of Trustees approved the Adviser’s LRMP and the designation of the Adviser’s Group Risk Committee as the administrator of the LRMP for the Adviser on July 2, 2020. The Trust’s Board approved the LRMP of the Trust and the designation of the Trust’s President and Chief Compliance Officer as the administrator of the LRMP for the Trust at its meeting on March 3, 2020. Pursuant to the LRMPs, the Adviser manages liquidity risks associated with the Fund’s investments by monitoring cash and cash equivalents and the concentration of investments, and by classifying the portfolio holdings of the Fund as either highly liquid, moderately liquid, less liquid or illiquid on at least a monthly basis.
At the Board’s regular meeting on November 30, 2021, the Board reviewed a written report from the administrator of each LRMP on the operation and effectiveness of the LRMP for the period from October16, 2020 through September 30, 2021 (the “Reporting Period”), noting that each of the Trust’s and the Adviser’s LRMP was adequate and effectively implemented during the Reporting Period. The LRMPs supported the Fund’s ability to honor redemption requests timely and the Adviser’s management of the Fund’s liquidity risk profile, including during any periods of market volatility and net redemptions during the Reporting Period.
C. Shareholder Expense Example
Fund Expenses
Investors in the Fund generally incur two types of costs: (1) transaction costs, and (2) ongoing costs, including advisory and administrative fees; shareholder service fees; and other Fund expenses. The Example is intended to help you understand your ongoing costs (in dollars) of investing in the Fund and to compare these costs with the ongoing costs of investing in other mutual funds. The Example is based on an investment of $1,000 invested at the beginning of the period and held for the entire period.
Actual Expenses
The information in the table under the heading “Actual Performance” provides information about actual account values and actual expenses. You may use the information in this column, together with the amount you invested, to estimate the expenses that you paid over the period. Simply divide your account value by $1,000 (for example, an $8,600 account value divided by $1,000 = 8.6), then multiply the result by the first number in the row entitled “Expenses Paid During Period” that corresponds to your Fund to estimate the expenses you paid on your account during this period.
Hypothetical Example for Comparison Purposes
The information in the table under the heading “Hypothetical Performance (5% return before expenses)” provides information about hypothetical account values and hypothetical expenses based on the Fund’s actual expense ratio and an assumed rate of return of 5% per year before expenses, which is not the Fund’s actual return. The hypothetical account values and expenses may not be used to estimate the actual ending account balance or
29
POLAR CAPITAL EMERGING MARKET STARS FUND
ADDITIONAL INFORMATION (Continued)
March 31, 2022 (Unaudited)
expenses you paid for the period. You may use this information to compare the ongoing costs of investing in the Fund and other funds. To do so, compare this 5% hypothetical example with the 5% hypothetical examples that appear in the shareholder reports of other funds.
Please note that the expenses shown in the table are meant to highlight your ongoing costs only and do not reflect any transactional costs. Therefore, the information under the heading “Hypothetical Performance (5% return before expenses)” is useful in comparing ongoing costs only, and will not help you determine the relative total costs of owning different funds. In addition, if these transactional costs were included, your costs would have been higher. Even though the Fund does not charge transaction fees, if you purchase shares through a broker, the broker may charge you a fee. You should evaluate other mutual funds’ transaction fees and any applicable broker fees to assess the total cost of ownership for comparison purposes.
| | | | | | | | | | | | |
| Actual Performance | | | | | | | | | | | | |
| | | |
| | | Beginning Account Value | | | Ending Account Value | | | Expenses Paid During | |
Fund | | October 1, 2021 | | | March 31, 2022 | | | Period* | |
Polar Capital Emerging Market Stars Fund | | $ | 1,000.00 | | | $ | 843.40 | | | $ | 4.60 | |
| | | |
Hypothetical Performance (5% return before expenses) | | | | | | | | | | | | |
| | | |
| | | Beginning Account Value | | | Ending Account Value | | | Expenses Paid During | |
Fund | | October 1, 2021 | | | March 31, 2022 | | | Period* | |
Polar Capital Emerging Market Stars Fund | | $ | 1,000.00 | | | $ | 1,019.95 | | | $ | 5.04 | |
| * | Expenses are calculated using an annualized expense ratio 1.00%, multiplied by the average account value for the period, multiplied by the actual number of operational days in the most recent half fiscal year (182), and divided by the number of days in the current year (365). |
30
POLAR CAPITAL EMERGING MARKET STARS FUND
ADDITIONAL INFORMATION (Continued)
March 31, 2022 (Unaudited)
D. Other Information
A description of the policies and procedures that the Fund uses to determine how to vote proxies relating to portfolio securities is available (i) without charge, upon request, by writing to the Fund at Polar Capital Fund c/o The Northern Trust Company, P.O. Box 4766, Chicago, IL 60680-4766 or by calling (800) 806-1112 (toll free) or (312) 557-3164; and (ii) on the U.S. Securities and Exchange Commission’s (the “SEC”) website at www.sec.gov.
Information regarding how the Fund voted proxies relating to portfolio securities during the most recent 12-month period ended June 30 is available (i) without charge, by calling the Fund at (800) 982-4372 (toll free); and (ii) on the SEC’s website at www.sec.gov.
The Fund files its complete schedule of portfolio holdings with the SEC for the first and third quarters of each fiscal year as an exhibit to its reports on Form N-PORT. The Fund’s Form N-PORT reports are available on the SEC’s website at www.sec.gov. The information on Form N-PORT is also available to shareholders upon written request or by calling the Fund at (800) 806-1112 (toll free) or (312) 557-3164.
E. Trustees and Officers
Independent Trustees
The following table sets forth certain information concerning the Independent Trustees of the Trust:
| | | | | | | | | | |
Name, Address* and Year of Birth of Independent Trustee | | Positions(s)
Held with
Trust | | Term of
Office
and Length
of Time
Served | | Principal Occupation(s) During Past 5 Years | | Number of
Portfolios in
Fund
Complex
Overseen by
Trustee | | Other Directorships
Held by Trustee
During the
Past 5 Years |
| JoAnn S. Lilek Year of Birth: 1956 | | Trustee | | Indefinite/
March
2020 to
present | | Advisory Board Member, Milton’s Distributing, 2019 to present; Advisory Board Member, Gordon Logistics, 2019 to present; Independent Contractor 2018 to present; Chief Financial Officer, Accretive Solutions, Inc, 2010 to 2018; Chief Operating Officer, Accretive Solutions, Inc, 2016 to 2018. | | 3 | | Amalgamated
Financial
Corporation
and
Amalgamated
Bank, 2021
to present. |
| | | | | |
| Patricia A Weiland Year of Birth: 1959 | | Trustee | | Indefinite/
March
2020 to
present | | Consultant, PAW Consulting LLC, 2014 to present. | | 3 | | None |
| | | | | |
| Lloyd A. Wennlund Year of Birth: 1957 | | Trustee | | Indefinite/
March
2020 to
present | | Independent Contractor, June 2017 to present; Executive Vice President, The Northern Trust Company, 1989 to 2017. | | 3 | | Calamos
Funds (18
Funds), 2018
to present. |
| * | Each Trustee may be contacted at 50 South LaSalle Street, Chicago, Illinois 60603. |
31
POLAR CAPITAL EMERGING MARKET STARS FUND
ADDITIONAL INFORMATION (Continued)
March 31, 2022 (Unaudited)
Interested Trustees
The following table sets forth certain information concerning the Trustees who are “interested persons” (as defined in the 1940 Act) of the Trust:
| | | | | | | | | | |
Name, Address* and Year of Birth of Independent Trustee | | Positions(s)
Held with
Trust | | Term of
Office
and Length
of Time
Served | | Principal Occupation(s) During Past 5 Years | | Number of
Portfolios in
Fund
Complex
Overseen by
Trustee | | Other Directorships
Held by Trustee
During the
Past 5 Years |
| Ryan D. Burns Year of Birth: 19761 | | Trustee | | Indefinite/
March
2020 to
present | | Senior Vice President, The Northern Trust Company, 1998 to present. | | 3 | | None |
| | | | | |
| David M. Whitaker Year of Birth: 19712 | | Trustee | | Indefinite/
March
2020 to
present | | President, Foreside Financial Group, 2007 to present. | | 3 | | None |
| * | Each Trustee may be contacted at 50 South LaSalle Street, Chicago, Illinois 60603. |
| (1) | Mr. Burns may be deemed to be an “interested” person of the Trust, as that term is defined in the 1940 Act, by virtue of his affiliation with the Fund’s Administrator and Fund Accounting Agent, Transfer Agent, and Custodian. |
| (2) | Mr. Whitaker may be deemed to be an “interested” person of the Trust, as that term is defined in the 1940 Act, by virtue of his affiliation with the Fund’s Distributor. |
The Statement of Additional Information includes additional information about Fund Trustees and is available, without charge, upon request, by calling (800) 806-1112 (toll free) or (312) 557-3164.
Officers
The following table sets forth certain information concerning the Trust’s officers. The officers of the Trust are employees of the Trust’s Administrator or Distributor and certain of their affiliates:
| | | | | | |
Name, Address and Year of Birth of Officer | | Positions(s) Held with Trust | | Term of Office and Length of Time Served | | Principal Occupation(s) During Past 5 Years |
| Barbara J. Nelligan Year of Birth: 1969 | | President | | Indefinite/ March 2020 to present | | Senior Vice President, Global Fund Services Fund Governance Solutions, The Northern Trust Company, 2018 to Present; Senior Vice President, Global Fund Services Product Management, The Northern Trust Company, 2007 to 2018; Vice President of Advisers Investment Trust 2012 to 2017. |
| | | |
| Jack P. Huntington Year of Birth: 1970 | | Chief Compliance Officer and AML Officer | | Indefinite/ March 2020 to present | | Director, Foreside Fund Officer Services, LLC, 2015 to present; Senior Vice President, Citi Fund Services, 2008 to 2015. |
| | | |
| Tracy L. Dotolo Year of Birth: 1976 | | Treasurer | | Indefinite/ March 2020 to present | | Senior Director, Foreside Fund Officer Services, LLC, 2016 to present. |
32
POLAR CAPITAL EMERGING MARKET STARS FUND
ADDITIONAL INFORMATION (Continued)
March 31, 2022 (Unaudited)
| | | | | | |
Name, Address and
Year of Birth of Officer | | Positions(s) Held with Trust | | Term of Office and Length of Time Served | | Principal Occupation(s) During Past 5 Years |
| Toni M. Bugni Year of Birth: 1973 | | Secretary | | Indefinite/ March 2020 to present | | Senior Vice President, Global Fund Services Fund Governance Solutions, The Northern Trust Company 2011 to present. |
| | | |
| Matthew J. Broucek Year of Birth: 1988 | | Assistant Secretary | | Indefinite/ March 2020 to present | | Vice President, Global Fund Services Fund Governance Solutions, The Northern Trust Company 2020 to present; Second Vice President, Global Fund Services Fund Governance Solutions, The Northern Trust Company 2018 to 2020; Officer, Global Fund Services Fund Governance Solutions, The Northern Trust Company 2016 to 2018; Associate, RSM US LLP, 2015 to 2016. |
33
POLAR CAPITAL EMERGING MARKET STARS FUND PRIVACY POLICY
SAFEGUARDING PRIVACY
We recognize and respect the privacy expectations of each of our investors and we believe the confidentiality and protection of investor information is one of our fundamental responsibilities. New technologies have dramatically changed the way information is gathered and used, but our continuing commitment to preserving the security and confidentiality of investor information has remained a core value of the Datum One Series Trust.
INFORMATION WE COLLECT AND SOURCES OF INFORMATION
We may collect information about our customers to help identify you, evaluate your application, service and manage your account and offer services and products you may find valuable. We collect this information from a variety of sources including:
| | • | | Information we receive from you on applications or other forms (e.g. your name, address, date of birth, social security number and investment information); about a customer’s investment goals and risk tolerance; |
| | • | | Information about your transactions and experiences with us and our affiliates (e.g. your account balance, transaction history and investment selections); and |
| | • | | Information we obtain from third parties regarding their brokerage, investment advisory, custodial or other relationship with you (e.g. your account number, account balance and transaction history. |
INFORMATION WE SHARE WITH SERVICE PROVIDERS
We may disclose all non-public personal information we collect, as described above, to companies (including affiliates) that perform services on our behalf, including those that assist us in responding to inquiries, processing transactions, preparing and mailing account statements and other forms of shareholder services provided they use the information solely for these purposes and they enter into confidentiality agreements regarding the information.
INFORMATION WE MAY SHARE WITH AFFILIATES
If we have affiliates which are financial service providers that offer investment advisory, brokerage and other financial services, we may (subject to Board approval) share information among our affiliates to better assist you in achieving your financial goals.
SAFEGUARDING CUSTOMER INFORMATION
We will safeguard, according to federal standards of security and confidentiality, any non-public personal information our customers share with us.
We will limit the collection and use of non-public customer information to the minimum necessary to deliver superior service to our customers which includes advising our customers about our products and services and to administer our business.
We will permit only authorized employees who are trained in the proper handling of non-public customer information to have access to that information.
We will not reveal non-public customer information to any external organization unless we have previously informed the customer in disclosures or agreements, have been authorized by the customer or are required by law or our regulators.
POLAR CAPITAL EMERGING MARKET STARS FUND
PRIVACY POLICY (Continued)
We value you as a customer and take your personal privacy seriously. We will inform you of our policies for collecting, using, securing and sharing nonpublic personal information the first time we do business and every year that you are a customer of the Datum One Series Trust or anytime we make a material change to our privacy policy.
Investment Adviser
Polar Capital LLP
16 Palace Street
London, United Kingdom SW1E5JD
Custodian
The Northern Trust Company
50 South LaSalle Street
Chicago, Illinois 60603
Independent Registered Public Accounting Firm
Deloitte & Touche LLP
111 South Wacker Drive
Chicago, Illinois 60606-4301
Legal Counsel
Ropes & Gray LLP
800 Boylston Street
Boston, Massachusetts 02199
Distributor
Foreside Financial Services, LLC
3 Canal Plaza, Suite 100
Portland, Maine 04101
For Additional Information, call
(800) 806-1112 (toll free) or 312-557-3164
Phaeacian Funds
ANNUAL REPORT
MARCH 31, 2022
This report is submitted for the general information of the shareholders of the Funds. It is not authorized for distribution to prospective investors unless preceded or accompanied by an effective prospectus.
PHAEACIAN FUNDS
TABLE OF CONTENTS
March 31, 2022
PHAEACIAN ACCENT INTERNATIONAL VALUE FUND
PERFORMANCE COMMENTARY
(Unaudited)
Performance update
For the fiscal year ended March 31, 2022, the Phaeacian Accent International Value Fund (the “Fund”) declined 6.73% net of fees and expenses (all figures in dollar terms, unless stated otherwise). This compared to a -1.48% return over the same period for the MSCI All Country World ex-US Net TR Index (the “Index”). Since its inception on December 1, 2011, the Fund has returned an average of 7.98% per year,1 outperforming the Index, which has annualized 6.34% per year over a similar period.2
As of March 31, the Fund was primarily geared toward Europe with 14% exposure to the UK and Ireland (all figures in percentage of total assets, unless stated otherwise), and 47% to continental Europe. The remaining exposure was 15% Asia Pacific and 11% the Americas.
Portfolio discussion
Worst performance detractor
The largest disclosed detractor to performance this period was Nexi. Based in Italy, Nexi is a leading pan European merchant acquirer. It has a strong position in its home market which accounts for half of its business. The company today is the result of a long turnaround process under high-quality private equity ownership, followed by the recent acquisitions of Nets and SIA. Based in Denmark, Nets is a Northern European-focused merchant acquirer. Based in Italy, SIA was formerly owned by the State and a group of domestic banks. The company is recognized as the country’s leading payment processor.
Perceived competition in the payments industry has weighed on the share prices of many of the legacy companies that perform merchant acquiring and processing activities. While Nexi faces increased competition in these activities, particularly for online transactions, we believe that the industry structure in Europe will provide the opportunity for Nexi to increase its competitive position in the years ahead.
Best performance contributor
The biggest contributor to performance this period was MegaStudyEdu. Based in South Korea, MegaStudyEdu is the country’s leading provider of online and offline educational programs, primarily for students. After focusing on high-school students, in recent years the company expanded to serve middle and elementary-school students. Growth in these new areas has boosted the company’s reported results.
Portfolio activity
During the period, we initiated several new positions, including Ansell and Ryanair. Based in Australia, Ansell is a leading global manufacturer of industrial and medical gloves. Based in Ireland, Ryanair is Europe’s largest passenger airline. Both Ansell and Ryanair were former holdings of the Fund. We took advantage of declines in their share prices to re-establish positions in these high-quality businesses.
As we did during recent quarters, we also completed the sale of several holdings whose stock prices approached our estimates of intrinsic value. In particular, we exited Heineken. Based in the Netherlands, Heineken is a leading global beer brewer and distributor. We believe the company remains a high-quality business, and we would be happy to become owners of Heineken again in the future if its share price sold at a significant discount to our intrinsic value estimate.
1
PHAEACIAN ACCENT INTERNATIONAL VALUE FUND
PERFORMANCE COMMENTARY (Continued)
(Unaudited)
Important Disclosures
This Commentary is for informational and discussion purposes only and does not constitute, and should not be construed as, an offer or solicitation for the purchase or sale with respect to any securities, products or services discussed, and neither does it provide investment advice. Any such offer or solicitation shall only be made pursuant to the Fund’s Prospectus which supersedes the information contained herein in its entirety.
The views expressed herein and any forward-looking statements are as of the date of this publication and are those of the portfolio management team. Future events or results may vary significantly from those expressed and are subject to change at any time in response to changing circumstances and industry developments. This information and data has been prepared from sources believed reliable, but the accuracy and completeness of the information cannot be guaranteed and is not a complete summary or statement of all available data.
Portfolio composition will change due to ongoing management of the Fund. References to individual securities are for informational purposes only and should not be construed as recommendations by the Fund, the portfolio manager, the Adviser, or the distributor. It should not be assumed that future investments will be profitable or will equal the performance of the security examples discussed. The portfolio holdings as of the most recent quarter-end may be obtained at www.phaeacianpartners.com. The Fund’s performance returns shown reflect applicable fee waivers and/or expense limits in effect during this period. Absent such fee waivers/expense limitations, if any, performance would have been lower. An index has no cash in its portfolio and imposes no sales charges. An investor cannot invest directly in an index.
| 1 | Based on the annualized rate of the Fund from Dec. 1, 2011 to Mar. 31, 2022. |
| 2 | The Index’s annualized return of 6.34% is for the period from Nov. 30, 2011 to March 31, 2022. From Dec. 1, 2011 to March 31, 2022, the Index has produced an annualized return of 6.25% vs. 7.98% for the Fund. |
Periods over one year are annualized. The fund performance data quoted here represents past performance, which is not indicative of future results. Current performance may be lower or higher than the performance data quoted above. Investment return and principal value will fluctuate, so that shares, when redeemed, may be worth more or less than their original cost. The total operating expense ratio (including indirect expenses such as the costs of investing in underlying funds), as stated in the fee table in the Fund’s prospectus dated July 29, 2021, is 1.24%. Phaeacian Partners LLC, the Phaeacian Accent International Value Fund’s (the “Fund”) investment adviser, has contractually agreed to waive Management Fees and to reimburse Other Expenses to the extent Total Annual Fund Operating Expenses (exclusive of brokerage costs, interest, taxes, dividends, litigation and indemnification expenses, expenses associated with the investments in underlying investment companies) exceed 1.29% of the average daily net assets of the Fund through October 31, 2023. Phaeacian Accent International Value Fund commenced operations on October 19, 2020, following the receipt of the assets and liabilities of the FPA International Value Fund (“the Predecessor Fund”) through a reorganization into the Phaeacian Accent International Value Fund. First Pacific Advisors was the investment adviser from inception through October 16, 2020, and performance shown through that date reflects fees, charges and expenses of that vehicle for the time periods shown. Past performance is no guarantee of future results and current performance may be higher or lower than the performance shown. This data represents past performance and investors should understand that investment returns and principal values fluctuate, so that when you redeem your investment it may be worth more or less than its original cost. Current month-end performance data may be obtained by calling toll-free, (800) 258-9668 or 312-557-3523. The Prospectus details the Fund’s objective and policies, sales charges, and other matters of interest to prospective investors. Please read the Prospectus carefully before investing. The Prospectus may be obtained by visiting the website at www.phaeacianpartners.com, by email at PhaeacianPartners@ntrs.com, by calling 800-258-9668 (toll free) or 312-557-3523 or by contacting the Fund in writing.
2
PHAEACIAN GLOBAL VALUE FUND
PERFORMANCE COMMENTARY
(Unaudited)
Performance update
During the fiscal year ended March 31, 2022, the Phaeacian Global Value Fund (the “Fund”) fell 8.48% (all figures in dollar terms, unless stated otherwise) net of fees and expenses compared to an increase of 7.28% for the MSCI All Country World Net TR Index (the “Index”).
As of March 31, the Fund was primarily geared toward Europe with 11% exposure to the UK and Ireland (all figures in percentage of total assets, unless stated otherwise), and 49% to continental Europe. North America represented 27% and the remaining exposure was 11% Asia Pacific and 1% Other Americas.
Worst performer
The largest disclosed detractor to performance this period was Nexi. Based in Italy, Nexi is a leading pan-European merchant acquirer. It has a strong position in its home market which accounts for half the business. The company today is the result of a long turnaround process under high-quality private equity ownership, followed by the recent acquisitions of Nets and SIA. Based in Denmark, Nets is a Northern European-focused merchant acquirer. Based in Italy, SIA was formerly owned by the State and a group of domestic banks. The company is widely recognized as the country’s leading payment processor.
Perceived competition in the payments industry has weighed on the share prices of many of the legacy companies that perform merchant acquiring and processing activities. While Nexi faces increased competition in these activities, particularly for online transactions, we believe the industry structure in Europe will provide the opportunity for Nexi to increase its competitive position in the years ahead.
Best performer
The biggest contributor to performance this period was Alphabet. Based in the US, Alphabet is the holding company for Google, owner of many of the world’s leading online advertising platforms. Over time, the company has bolstered its position in digital advertising by increasing the efficacy of its search algorithms and collecting data that advertisers value. While the company was a positive contributor for the Fund in 2020 overall, the shares lagged behind the performance of many technology peers for that year. That trend reversed the following year as the company reported better-than-expected growth from its advertising businesses and was the Fund’s largest contributor to performance.
Portfolio activity
During the period, we initiated several new positions, including Ansell and Ryanair. Based in Australia, Ansell is a leading global manufacturer of industrial and medical gloves. Based in Ireland, Ryanair is Europe’s largest passenger airline. Both Ansell and Ryanair were former holdings of the Fund. We took advantage of declines in their share prices to re-establish positions in these high-quality businesses.
As we did throughout the year, we also completed the sale of several holdings whose stock prices approached our estimates of intrinsic value. In particular, we exited Heineken. Based in the Netherlands, Heineken is a leading global beer brewer and distributor. The company remains a high-quality business, and we would be happy to become owners of Heineken again in the future if its share price sold at a significant discount to our intrinsic value estimate.
3
PHAEACIAN GLOBAL VALUE FUND
PERFORMANCE COMMENTARY (Continued)
(Unaudited)
Important Disclosures
This Commentary is for informational and discussion purposes only and does not constitute, and should not be construed as, an offer or solicitation for the purchase or sale with respect to any securities, products or services discussed, and neither does it provide investment advice. Any such offer or solicitation shall only be made pursuant to the Fund’s Prospectus which supersedes the information contained herein in its entirety.
The views expressed herein and any forward-looking statements are as of the date of this publication and are those of the portfolio management team. Future events or results may vary significantly from those expressed and are subject to change at any time in response to changing circumstances and industry developments. This information and data has been prepared from sources believed reliable, but the accuracy and completeness of the information cannot be guaranteed and is not a complete summary or statement of all available data.
Portfolio composition will change due to ongoing management of the Fund. References to individual securities are for informational purposes only and should not be construed as recommendations by the Fund, the portfolio manager, the Adviser, or the distributor. It should not be assumed that future investments will be profitable or will equal the performance of the security examples discussed. The portfolio holdings as of the most recent quarter-end may be obtained at www.phaeacianpartners.com. The Fund’s performance returns shown reflect applicable fee waivers and/or expense limits in effect during this period. Absent such fee waivers/expense limitations, if any, performance would have been lower. An index has no cash in its portfolio and imposes no sales charges. An investor cannot invest directly in an index.
Periods over one year are annualized. The fund performance data quoted here represents past performance, which is not indicative of future results. Current performance may be lower or higher than the performance data quoted above. Investment return and principal value will fluctuate, so that shares, when redeemed, may be worth more or less than their original cost. The total operating expense ratio (including indirect expenses such as the costs of investing in underlying funds), as stated in the fee table in the Fund’s prospectus dated July 29, 2021, is 1.22%. Phaeacian Partners LLC, the Phaeacian Global Value Fund’s (the “Fund”) investment adviser, has contractually agreed to waive Management Fees and to reimburse Other Expenses to the extent Total Annual Fund Operating Expenses (exclusive of brokerage costs, interest, taxes, dividends, litigation and indemnification expenses, expenses associated with the investments in underlying investment companies) exceed 1.29% of the average daily net assets of the Fund through October 31, 2023.
Phaeacian Global Value Fund commenced operations on October 19, 2020, following the receipt of the assets and liabilities of the FPA Paramount Fund (“the Predecessor Fund”) through a reorganization into the Phaeacian Global Value Fund. First Pacific Advisors was the investment adviser from inception through October 16, 2020, and performance shown through that date reflects fees, charges and expenses of that vehicle for the time periods shown. Past performance is no guarantee of future results and current performance may be higher or lower than the performance shown. This data represents past performance and investors should understand that investment returns and principal values fluctuate, so that when you redeem your investment it may be worth more or less than its original cost. Current month-end performance data may be obtained by calling toll-free, (800) 258-9668 or 312-557-3523. The Prospectus details the Fund’s objective and policies, sales charges, and other matters of interest to prospective investors. Please read the Prospectus carefully before investing. The Prospectus may be obtained by visiting the website at www.phaeacianpartners.com, by email at PhaeacianPartners@ntrs.com,by calling 800-258-9668 (toll free) or 312-557-3523 or by contacting the Fund in writing.
4
PHAEACIAN ACCENT INTERNATIONAL VALUE FUND
HISTORICAL PERFORMANCE
March 31, 2022 (Unaudited)
Change in Value of a $10,000 Investment in Phaeacian Accent International Value Fund vs. MSCI ACWI ex-US Index for the Period March 31, 2012 to March 31, 2022
| | | | | | | | | | | | |
| | | Annualized Total Return | |
| | | 1 Year | | | 5 Year | | | 10 year | |
Phaeacian Accent International Value Fund | | | -6.73 | % | | | 8.14 | % | | | 6.81 | % |
MSCI ACWI ex-USA Index | | | -1.48 | % | | | 6.76 | % | | | 5.55 | % |
Based on a hypothetical $10,000 initial investment, the graph and table above illustrate the total return of the Fund against the MSCI ACWI Ex-USA Index. The Index is a float-adjusted market capitalization index that is designed to measure the combined equity market performance of developed and emerging market countries excluding the United States. This index does not reflect any commissions or fees which would be incurred by an investor purchasing the stocks it represents. An investor cannot invest directly in an index. The graph and the table above do not reflect the deduction of taxes that a shareholder would pay on the Fund distributions or redemption of Fund shares. The performance of the Fund and of the Index is computed on a total return basis which includes reinvestment of all distributions, if any.
Periods over one year are annualized. The fund performance data quoted here represents past performance, which is not indicative of future results. Current performance may be lower or higher than the performance data quoted above. Investment return and principal value will fluctuate, so that shares, when redeemed, may be worth more or less than their original cost. The total operating expense ratio (including indirect expenses such as the costs of investing in underlying funds), as stated in the fee table in the Fund’s prospectus dated July 29, 2021, is 1.24%. Phaeacian Partners LLC, the Phaeacian Accent
5
PHAEACIAN ACCENT INTERNATIONAL VALUE FUND
HISTORICAL PERFORMANCE (Continued)
March 31, 2022 (Unaudited)
International Value Fund’s (the “Fund”) investment adviser, has contractually agreed to waive Management Fees and to reimburse Other Expenses to the extent Total Annual Fund Operating Expenses (exclusive of brokerage costs, interest, taxes, dividends, litigation and indemnification expenses, expenses associated with the investments in underlying investment companies) exceed 1.29% of the average daily net assets of the Fund through October 31, 2023.
6
PHAEACIAN GLOBAL VALUE FUND
HISTORICAL PERFORMANCE
March 31, 2022 (Unaudited)
Change in Value of a $10,000 Investment in Phaeacian Global Value Fund vs. MSCI All Country World Index for the Period March 31, 2012 to March 31, 2022
| | | | | | | | | | | | |
| | | Annualized Total Return | |
| | | 1 Year | | | 5 Year | | | 10 year | |
Phaeacian Global Value Fund | | | -8.48 | % | | | 9.07 | % | | | 8.28 | % |
MSCI All Country World Index Net | | | 7.28 | % | | | 11.64 | % | | | 10.00 | % |
Based on a hypothetical $10,000 initial investment, the graph and table above illustrate the total return of the Fund against the MSCI All Country World Index Net. The Index is a float-adjusted market capitalization index that is designed to measure the combined equity market performance of developed and emerging market countries excluding the United States. This index does not reflect any commissions or fees which would be incurred by an investor purchasing the stocks it represents. An investor cannot invest directly in an index. The graph and the table above do not reflect the deduction of taxes that a shareholder would pay on the Fund distributions or redemption of Fund shares. The performance of the Fund and of the Index is computed on a total return basis which includes reinvestment of all distributions, if any.
Periods over one year are annualized. The fund performance data quoted here represents past performance, which is not indicative of future results. Current performance may be lower or higher than the performance data quoted above. Investment return and principal value will fluctuate, so that shares, when redeemed, may be worth more or less than their original cost. The total operating expense ratio (including indirect expenses such as the costs of investing in underlying funds), as stated in the fee table in the Fund’s prospectus dated July 29, 2021, is 1.22%. Phaeacian Partners LLC, the Phaeacian Global
7
PHAEACIAN GLOBAL VALUE FUND
HISTORICAL PERFORMANCE (Continued)
March 31, 2022 (Unaudited)
Value Fund’s (the “Fund”) investment adviser, has contractually agreed to waive Management Fees and to reimburse Other Expenses to the extent Total Annual Fund Operating Expenses (exclusive of brokerage costs, interest, taxes, dividends, litigation and indemnification expenses, expenses associated with the investments in underlying investment companies) exceed 1.29% of the average daily net assets of the Fund through October 31, 2023.
8
PHAEACIAN ACCENT INTERNATIONAL VALUE FUND
PORTFOLIO OF INVESTMENTS
March 31, 2022
| | | | |
| | | Percent of | |
| Industry Allocation | | Net Assets | |
IT Services | | | 17.5 | % |
Professional Services | | | 7.5 | |
Health Care Supplies | | | 5.4 | |
Construction Materials | | | 4.7 | |
Aerospace & Defense | | | 4.2 | |
Food Products | | | 4.1 | |
Commercial Services & Supplies | | | 3.8 | |
Entertainment | | | 3.1 | |
Marine | | | 3.0 | |
Machinery | | | 2.5 | |
Automobiles | | | 2.5 | |
Specialty Retail | | | 2.4 | |
Communications Equipment | | | 2.4 | |
Interactive Media & Services | | | 2.4 | |
Insurance | | | 2.3 | |
Trading Companies & Distributors | | | 2.2 | |
Electrical Equipment | | | 2.2 | |
Capital Markets | | | 2.1 | |
Application Software | | | 2.0 | |
Diversified Consumer Services | | | 2.0 | |
Household Durables | | | 1.8 | |
Semiconductor Manufacturing | | | 1.8 | |
Food & Staples Retailing | | | 1.7 | |
Airlines | | | 1.4 | |
Media | | | 1.1 | |
Diversified Financial Services | | | 0.0 | |
Other Assets And Liabilities, Net | | | 13.9 | % |
| | | | |
Net Assets | | | 100.0 | % |
| | | | |
| | | | |
| | | Percent of | |
| Country Allocation | | Net Assets | |
France | | | 14.7 | % |
United States | | | 9.8 | |
United Kingdom | | | 8.6 | |
Netherlands | | | 8.2 | |
Switzerland | | | 7.6 | |
South Korea | | | 7.6 | |
Sweden | | | 5.0 | |
Ireland | | | 3.4 | |
Italy | | | 3.3 | |
Germany | | | 3.2 | |
Spain | | | 2.4 | |
India | | | 2.1 | |
Denmark | | | 2.1 | |
Japan | | | 1.8 | |
Taiwan | | | 1.8 | |
Canada | | | 1.7 | |
Brazil | | | 1.5 | |
Australia | | | 1.3 | |
Other Assets And Liabilities, Net | | | 13.9 | % |
| | | | |
Net Assets | | | 100.0 | % |
| | | | |
Portfolio holdings and characteristics are subject to change and may not be representative of current holdings and characteristics. Fund holdings are subject to change daily.
See accompanying Notes to Financial Statements.
9
PHAEACIAN ACCENT INTERNATIONAL VALUE FUND
PORTFOLIO OF INVESTMENTS (Continued)
March 31, 2022
| | | | | | | | |
| | | Shares | | | Fair Value | |
COMMON STOCKS – 86.1% | | | | | | | | |
IT SERVICES – 17.5% | | | | | | | | |
Adyen N.V. (Netherlands) (a),(b) | | | 6,567 | | | $ | 13,007,223 | |
Capgemini SE (France) | | | 35,893 | | | | 7,964,769 | |
Edenred (France) | | | 212,767 | | | | 10,520,230 | |
Fidelity National Information Services Inc. (United States) | | | 104,413 | | | | 10,485,154 | |
Nexi SpA (Italy) (a),(b) | | | 1,040,246 | | | | 12,004,147 | |
Worldline S.A. (France) (a),(b) | | | 213,802 | | | | 9,279,049 | |
| | | | | | | | |
| | | | | | $ | 63,260,572 | |
| | | | | | | | |
PROFESSIONAL SERVICES – 7.5% | | | | | | | | |
Boa Vista Servicos S.A. (Brazil) | | | 3,083,900 | | | $ | 5,538,137 | |
Pagegroup PLC (United Kingdom) | | | 1,540,460 | | | | 9,924,303 | |
SaraminHR Co. Ltd. (South Korea) | | | 351,005 | | | | 11,823,153 | |
| | | | | | | | |
| | | | | | $ | 27,285,593 | |
| | | | | | | | |
HEALTH CARE SUPPLIES – 5.4% | | | | | | | | |
Alcon Inc. (Switzerland) | | | 86,063 | | | $ | 6,818,422 | |
Ansell Ltd. (Australia) | | | 239,883 | | | | 4,599,873 | |
Koninklijke Philips N.V. (Netherlands) | | | 264,187 | | | | 8,056,038 | |
| | | | | | | | |
| | | | | | $ | 19,474,333 | |
| | | | | | | | |
CONSTRUCTION MATERIALS – 4.7% | | | | | | | | |
CRH PLC (Ireland) | | | 180,012 | | | $ | 7,179,807 | |
Holcim Ltd. (Switzerland) (a) | | | 202,720 | | | | 9,859,647 | |
| | | | | | | | |
| | | | | | $ | 17,039,454 | |
| | | | | | | | |
AEROSPACE & DEFENSE – 4.2% | | | | | | | | |
Babcock International Group PLC (United Kingdom) (a) | | | 1,739,926 | | | $ | 7,387,603 | |
Safran S.A. (France) | | | 67,088 | | | | 7,898,640 | |
| | | | | | | | |
| | | | | | $ | 15,286,243 | |
| | | | | | | | |
FOOD PRODUCTS – 4.1% | | | | | | | | |
Danone S.A. (France) | | | 112,825 | | | $ | 6,232,792 | |
JDE Peet’s N.V. (Netherlands) | | | 305,663 | | | | 8,767,962 | |
| | | | | | | | |
| | | | | | $ | 15,000,754 | |
| | | | | | | | |
COMMERCIAL SERVICES & SUPPLIES – 3.8% | | | | | | | | |
Clipper Logistics PLC (United Kingdom) | | | 529,148 | | | $ | 6,130,917 | |
ISS A/S (Denmark) (a) | | | 420,148 | | | | 7,466,687 | |
| | | | | | | | |
| | | | | | $ | 13,597,604 | |
| | | | | | | | |
ENTERTAINMENT – 3.1% | | | | | | | | |
Ubisoft Entertainment S.A. (France) (a) | | | 254,692 | | | $ | 11,191,887 | |
| | | | | | | | |
See accompanying Notes to Financial Statements.
10
PHAEACIAN ACCENT INTERNATIONAL VALUE FUND
PORTFOLIO OF INVESTMENTS (Continued)
March 31, 2022
| | | | | | | | |
| | | Shares | | | Fair Value | |
COMMON STOCKS – Continued | | | | | | | | |
MARINE – 3.0% | | | | | | | | |
Kuehne + Nagel International A.G. (Switzerland) | | | 38,744 | | | $ | 11,000,551 | |
| | | | | | | | |
MACHINERY – 2.5% | | | | | | | | |
SKF AB (Sweden) | | | 565,003 | | | $ | 9,212,917 | |
| | | | | | | | |
AUTOMOBILES – 2.5% | | | | | | | | |
Stellantis N.V. (United States) | | | 551,418 | | | $ | 8,927,172 | |
| | | | | | | | |
SPECIALTY RETAIL – 2.4% | | | | | | | | |
Industria de Diseno Textil S.A. (Spain) | | | 405,566 | | | $ | 8,843,362 | |
| | | | | | | | |
COMMUNICATIONS EQUIPMENT – 2.4% | | | | | | | | |
Telefonaktiebolaget LM Ericsson (Sweden) | | | 969,596 | | | $ | 8,838,395 | |
| | | | | | | | |
INTERACTIVE MEDIA & SERVICES – 2.4% | | | | | | | | |
NAVER Corp. (South Korea) | | | 30,870 | | | $ | 8,579,670 | |
| | | | | | | | |
INSURANCE – 2.3% | | | | | | | | |
RenaissanceRe Holdings Ltd. (United States) | | | 52,844 | | | $ | 8,376,302 | |
| | | | | | | | |
TRADING COMPANIES & DISTRIBUTORS – 2.2% | | | | | | | | |
Electrocomponents PLC (United Kingdom) | | | 556,844 | | | $ | 7,864,459 | |
| | | | | | | | |
ELECTRICAL EQUIPMENT – 2.2% | | | | | | | | |
Sensata Technologies Holding PLC (United States) (a) | | | 153,787 | | | $ | 7,820,069 | |
| | | | | | | | |
CAPITAL MARKETS – 2.1% | | | | | | | | |
Care Ratings Ltd. (India) | | | 1,132,614 | | | $ | 7,609,212 | |
| | | | | | | | |
APPLICATION SOFTWARE – 2.0% | | | | | | | | |
SAP SE (Germany) | | | 65,673 | | | $ | 7,278,417 | |
| | | | | | | | |
DIVERSIFIED CONSUMER SERVICES – 2.0% | | | | | | | | |
MegaStudyEdu Co. Ltd. (South Korea) | | | 85,434 | | | $ | 7,236,133 | |
| | | | | | | | |
See accompanying Notes to Financial Statements.
11
PHAEACIAN ACCENT INTERNATIONAL VALUE FUND
PORTFOLIO OF INVESTMENTS (Continued)
March 31, 2022
| | | | | | | | |
| | | Shares | | | Fair Value | |
COMMON STOCKS – Continued | | | | | | | | |
HOUSEHOLD DURABLES – 1.8% | | | | | | | | |
Sony Group Corp. (Japan) | | | 63,883 | | | $ | 6,572,009 | |
| | | | | | | | |
SEMICONDUCTOR MANUFACTURING – 1.8% | | | | | | | | |
Taiwan Semiconductor Manufacturing Co. Ltd. (Taiwan) (c) | | | 61,117 | | | $ | 6,372,058 | |
| | | | | | | | |
FOOD & STAPLES RETAILING – 1.7% | | | | | | | | |
Empire Co. Ltd. (Canada) | | | 177,816 | | | $ | 6,306,732 | |
| | | | | | | | |
AIRLINES – 1.4% | | | | | | | | |
Ryanair Holdings PLC (Ireland) (a) | | | 329,608 | | | $ | 5,008,935 | |
| | | | | | | | |
MEDIA – 1.1% | | | | | | | | |
Stroeer SE & Co. KGaA (Germany) | | | 60,080 | | | $ | 4,146,067 | |
| | | | | | | | |
DIVERSIFIED FINANCIAL SERVICES – 0.0% | | | | | | | | |
Nm Inc. (United Kingdom) (a),(d) | | | 44,321 | | | $ | — | |
| | | | | | | | |
TOTAL COMMON STOCKS–86.1% (Cost $332,625,893) | | | | | | $ | 312,128,900 | |
| | | | | | | | |
TOTAL INVESTMENTS–86.1% (Cost $332,625,893) | | | | | | $ | 312,128,900 | |
| | | | | | | | |
Other Assets and Liabilities, net – 13.9% | | | | | | $ | 50,250,199 | |
| | | | | | | | |
NET ASSETS–100.0% | | | | | | $ | 362,379,099 | |
| | | | | | | | |
| (a) | Non-income producing security. |
| (b) | Security exempt from registration under Rule 144A of the Securities Act of 1933. These securities may be resold in transactions exempt from registration, typically only to qualified institutional buyers. Unless otherwise indicated, these securities are not considered to be illiquid. |
| (c) | This security represents the common stock of a foreign company which trades directly or through an American Depositary Receipt (ADR) on the over-the-counter market or on a U.S. national securities exchange. |
| (d) | Worthless security not yet issued as of March 31, 2022. |
See accompanying Notes to Financial Statements.
12
PHAEACIAN GLOBAL VALUE FUND
PORTFOLIO OF INVESTMENTS
March 31, 2022
| | | | |
| | | Percent of | |
| Industry Allocation | | Net Assets | |
IT Services | | | 14.6 | % |
Application Software | | | 6.8 | |
Aerospace & Defense | | | 5.6 | |
Interactive Media & Services | | | 5.2 | |
Specialty Retail | | | 5.1 | |
Professional Services | | | 4.8 | |
Health Care Supplies | | | 4.6 | |
Commercial Services & Supplies | | | 4.3 | |
Construction Materials | | | 4.2 | |
Entertainment | | | 4.0 | |
Food Products | | | 3.8 | |
Machinery | | | 3.7 | |
Marine | | | 2.9 | |
Communications Equipment | | | 2.4 | |
Semiconductor Manufacturing | | | 2.4 | |
Multiline Retail | | | 2.3 | |
Personal Products | | | 2.3 | |
Automobiles | | | 2.1 | |
Health Care Providers & Services | | | 2.0 | |
Insurance | | | 2.0 | |
Electrical Equipment | | | 1.9 | |
Household Products | | | 1.9 | |
Trading Companies & Distributors | | | 1.6 | |
Household Durables | | | 1.6 | |
Textiles, Apparel & Luxury Goods | | | 1.4 | |
Airlines | | | 1.2 | |
Beverages | | | 1.2 | |
Building Products | | | 1.0 | |
Food & Staples Retailing | | | 1.0 | |
Media | | | 0.9 | |
Other Assets And Liabilities, Net | | | 1.2 | % |
| | | | |
Net Assets | | | 100.0 | % |
| | | | |
| | | | |
| | | Percent of | |
| Country Allocation | | Net Assets | |
United States | | | 28.8 | % |
France | | | 14.8 | |
Netherlands | | | 7.9 | |
Switzerland | | | 7.9 | |
United Kingdom | | | 6.3 | |
Sweden | | | 4.8 | |
Germany | | | 4.5 | |
South Korea | | | 4.4 | |
Japan | | | 3.9 | |
Ireland | | | 2.8 | |
Italy | | | 2.6 | |
Spain | | | 2.1 | |
Denmark | | | 2.0 | |
Taiwan | | | 1.3 | |
Finland | | | 1.3 | |
Australia | | | 1.2 | |
Mexico | | | 1.2 | |
Canada | | | 1.0 | |
Other Assets And Liabilities, Net | | | 1.2 | % |
| | | | |
Net Assets | | | 100.0 | % |
| | | | |
Portfolio holdings and characteristics are subject to change and may not be representative of current holdings and characteristics. Fund holdings are subject to change daily.
See accompanying Notes to Financial Statements.
13
PHAEACIAN GLOBAL VALUE FUND
PORTFOLIO OF INVESTMENTS (Continued)
March 31, 2022
| | | | | | | | |
| | | Shares | | | Fair Value | |
COMMON STOCKS – 98.8% | | | | | | | | |
IT SERVICES – 14.6% | | | | | | | | |
Adyen N.V. (Netherlands) (a),(b) | | | 1,801 | | | $ | 3,567,232 | |
Capgemini SE (France) | | | 11,061 | | | | 2,454,471 | |
Edenred (France) | | | 81,450 | | | | 4,027,282 | |
Fidelity National Information Services Inc. (United States) | | | 39,934 | | | | 4,010,172 | |
Nexi SpA (Italy) (a),(b) | | | 335,284 | | | | 3,869,083 | |
Worldline S.A. (France) (a),(b) | | | 81,058 | | | | 3,517,933 | |
| | | | | | | | |
| | | | | | $ | 21,446,173 | |
| | | | | | | | |
APPLICATION SOFTWARE – 6.8% | | | | | | | | |
Microsoft Corp. (United States) | | | 14,873 | | | $ | 4,585,495 | |
Oracle Corp. (United States) | | | 38,791 | | | | 3,209,179 | |
SAP SE (Germany) | | | 19,718 | | | | 2,185,310 | |
| | | | | | | | |
| | | | | | $ | 9,979,984 | |
| | | | | | | | |
AEROSPACE & DEFENSE – 5.6% | | | | | | | | |
Babcock International Group PLC (United Kingdom) (a) | | | 585,961 | | | $ | 2,487,949 | |
General Dynamics Corp. (United States) | | | 10,591 | | | | 2,554,338 | |
Safran S.A. (France) | | | 26,772 | | | | 3,152,015 | |
| | | | | | | | |
| | | | | | $ | 8,194,302 | |
| | | | | | | | |
INTERACTIVE MEDIA & SERVICES – 5.2% | | | | | | | | |
Alphabet Inc. (United States) (a) | | | 1,628 | | | $ | 4,546,988 | |
NAVER Corp. (South Korea) | | | 11,316 | | | | 3,145,045 | |
| | | | | | | | |
| | | | | | $ | 7,692,033 | |
| | | | | | | | |
SPECIALTY RETAIL – 5.1% | | | | | | | | |
Fielmann A.G. (Germany) | | | 29,164 | | | $ | 1,588,177 | |
Industria de Diseno Textil S.A. (Spain) | | | 139,374 | | | | 3,039,048 | |
O’Reilly Automotive Inc. (United States) (a) | | | 4,221 | | | | 2,891,216 | |
| | | | | | | | |
| | | | | | $ | 7,518,441 | |
| | | | | | | | |
PROFESSIONAL SERVICES – 4.8% | | | | | | | | |
Dun & Bradstreet Holdings Inc. (United States) (a) | | | 230,913 | | | $ | 4,045,596 | |
Pagegroup PLC (United Kingdom) | | | 462,407 | | | | 2,979,024 | |
| | | | | | | | |
| | | | | | $ | 7,024,620 | |
| | | | | | | | |
HEALTH CARE SUPPLIES – 4.6% | | | | | | | | |
Alcon Inc. (Switzerland) | | | 26,069 | | | $ | 2,065,341 | |
Ansell Ltd. (Australia) | | | 93,410 | | | | 1,791,182 | |
Koninklijke Philips N.V. (Netherlands) | | | 93,951 | | | | 2,864,913 | |
| | | | | | | | |
| | | | | | $ | 6,721,436 | |
| | | | | | | | |
See accompanying Notes to Financial Statements.
14
PHAEACIAN GLOBAL VALUE FUND
PORTFOLIO OF INVESTMENTS (Continued)
March 31, 2022
| | | | | | | | |
| | | Shares | | | Fair Value | |
COMMON STOCKS – Continued | | | | | | | | |
COMMERCIAL SERVICES & SUPPLIES – 4.3% | | | | | | | | |
ISS A/S (Denmark) (a) | | | 167,663 | | | $ | 2,979,633 | |
S-1 Corp. (South Korea) | | | 57,212 | | | | 3,356,108 | |
| | | | | | | | |
| | | | | | $ | 6,335,741 | |
| | | | | | | | |
CONSTRUCTION MATERIALS – 4.2% | | | | | | | | |
CRH PLC (Ireland) | | | 58,912 | | | $ | 2,349,714 | |
Holcim Ltd. (Switzerland) (a) | | | 77,525 | | | | 3,770,566 | |
| | | | | | | | |
| | | | | | $ | 6,120,280 | |
| | | | | | | | |
ENTERTAINMENT – 4.0% | | | | | | | | |
Spotify Technology S.A. (United States) (a) | | | 9,604 | | | $ | 1,450,396 | |
Ubisoft Entertainment S.A. (France) (a) | | | 100,622 | | | | 4,421,616 | |
| | | | | | | | |
| | | | | | $ | 5,872,012 | |
| | | | | | | | |
FOOD PRODUCTS – 3.8% | | | | | | | | |
Danone S.A. (France) | | | 37,012 | | | $ | 2,044,654 | |
JDE Peet’s N.V. (Netherlands) | | | 122,865 | | | | 3,524,390 | |
| | | | | | | | |
| | | | | | $ | 5,569,044 | |
| | | | | | | | |
MACHINERY – 3.7% | | | | | | | | |
Konecranes OYJ (Finland) | | | 60,820 | | | $ | 1,867,111 | |
SKF AB (Sweden) | | | 216,607 | | | | 3,531,986 | |
| | | | | | | | |
| | | | | | $ | 5,399,097 | |
| | | | | | | | |
MARINE – 2.9% | | | | | | | | |
Kuehne + Nagel International A.G. (Switzerland) | | | 14,855 | | | $ | 4,217,768 | |
| | | | | | | | |
COMMUNICATIONS EQUIPMENT – 2.4% | | | | | | | | |
Telefonaktiebolaget LM Ericsson (Sweden) | | | 391,306 | | | $ | 3,566,967 | |
| | | | | | | | |
SEMICONDUCTOR MANUFACTURING – 2.4% | | | | | | | | |
ASML Holding N.V. (Netherlands) | | | 2,411 | | | $ | 1,611,083 | |
Taiwan Semiconductor Manufacturing Co. Ltd. (Taiwan) (c) | | | 18,386 | | | | 1,916,924 | |
| | | | | | | | |
| | | | | | $ | 3,528,007 | |
| | | | | | | | |
MULTILINE RETAIL – 2.3% | | | | | | | | |
Dollar General Corp. (United States) | | | 15,115 | | | $ | 3,365,052 | |
| | | | | | | | |
PERSONAL PRODUCTS – 2.3% | | | | | | | | |
Shiseido Co. Ltd. (Japan) | | | 66,000 | | | $ | 3,333,559 | |
| | | | | | | | |
See accompanying Notes to Financial Statements.
15
PHAEACIAN GLOBAL VALUE FUND
PORTFOLIO OF INVESTMENTS (Continued)
March 31, 2022
| | | | | | | | |
| | | Shares | | | Fair Value | |
COMMON STOCKS – Continued | | | | | | | | |
AUTOMOBILES – 2.1% | | | | | | | | |
Stellantis N.V. (United States) | | | 187,826 | | | $ | 3,040,806 | |
| | | | | | | | |
HEALTH CARE PROVIDERS & SERVICES – 2.0% | | | | | | | | |
Laboratory Corp. of America Holdings (United States) (a) | | | 10,903 | | | $ | 2,874,685 | |
| | | | | | | | |
INSURANCE – 2.0% | | | | | | | | |
RenaissanceRe Holdings Ltd. (United States) | | | 18,094 | | | $ | 2,868,080 | |
| | | | | | | | |
ELECTRICAL EQUIPMENT – 1.9% | | | | | | | | |
Sensata Technologies Holding PLC (United States) (a) | | | 55,974 | | | $ | 2,846,278 | |
| | | | | | | | |
HOUSEHOLD PRODUCTS – 1.9% | | | | | | | | |
Henkel A.G. & Co. KGaA (Germany) | | | 21,803 | | | $ | 1,439,100 | |
Reckitt Benckiser Group PLC (United Kingdom) | | | 17,928 | | | | 1,367,655 | |
| | | | | | | | |
| | | | | | $ | 2,806,755 | |
| | | | | | | | |
TRADING COMPANIES & DISTRIBUTORS – 1.6% | | | | | | | | |
Electrocomponents PLC (United Kingdom) | | | 170,741 | | | $ | 2,411,421 | |
| | | | | | | | |
HOUSEHOLD DURABLES – 1.6% | | | | | | | | |
Sony Group Corp. (Japan) | | | 22,376 | | | $ | 2,301,947 | |
| | | | | | | | |
TEXTILES, APPAREL & LUXURY GOODS – 1.4% | | | | | | | | |
EssilorLuxottica S.A. (France) | | | 11,328 | | | $ | 2,071,785 | |
| | | | | | | | |
AIRLINES – 1.2% | | | | | | | | |
Ryanair Holdings PLC (Ireland) (a) | | | 118,755 | | | $ | 1,804,677 | |
| | | | | | | | |
BEVERAGES – 1.2% | | | | | | | | |
Fomento Economico Mexicano S.A.B. de C.V. (Mexico) | | | 213,300 | | | $ | 1,773,318 | |
| | | | | | | | |
BUILDING PRODUCTS – 1.0% | | | | | | | | |
dormakaba Holding A.G. (Switzerland) | | | 2,842 | | | $ | 1,457,711 | |
| | | | | | | | |
FOOD & STAPLES RETAILING – 1.0% | | | | | | | | |
Empire Co. Ltd. (Canada) | | | 40,831 | | | $ | 1,448,183 | |
| | | | | | | | |
See accompanying Notes to Financial Statements.
16
PHAEACIAN GLOBAL VALUE FUND
PORTFOLIO OF INVESTMENTS (Continued)
March 31, 2022
| | | | | | | | |
| | | Shares | | | Fair Value | |
COMMON STOCKS – Continued | | | | | | | | |
MEDIA – 0.9% | | | | | | | | |
Stroeer SE & Co. KGaA (Germany) | | | 20,196 | | | $ | 1,393,708 | |
| | | | | | | | |
TOTAL COMMON STOCKS–98.8% (Cost $140,959,461) | | | | | | $ | 144,983,870 | |
| | | | | | | | |
TOTAL INVESTMENTS–98.8% (Cost $140,959,461) | | | | | | $ | 144,983,870 | |
Other Assets and Liabilities, net – 1.2% | | | | | | $ | 1,716,764 | |
| | | | | | | | |
NET ASSETS–100.0% | | | | | | $ | 146,700,634 | |
| | | | | | | | |
| (a) | Non-income producing security. |
| (b) | Security exempt from registration under Rule 144A of the Securities Act of 1933. These securities may be resold in transactions exempt from registration, typically only to qualified institutional buyers. Unless otherwise indicated, these securities are not considered to be illiquid. |
| (c) | This security represents the common stock of a foreign company which trades directly or through an American Depositary Receipt (ADR) on the over-the-counter market or on a U.S. national securities exchange. |
See accompanying Notes to Financial Statements.
17
PHAEACIAN FUNDS
STATEMENTS OF ASSETS AND LIABILITIES
March 31, 2022
| | | | | | | | |
| | | Phaeacian | | | | |
| | | Accent | | | Phaeacian | |
| | | International | | | Global | |
| | | Value Fund | | | Value Fund | |
ASSETS | | | | | | | | |
Investment securities—at fair value (identified cost $332,625,893 and $140,959,461, respectively) | | $ | 312,128,900 | | | $ | 144,983,870 | |
Cash | | | 53,223,546 | | | | 1,247,639 | |
Foreign currencies at value (identified cost $113,394 and $174,respectively) | | | 113,394 | | | | 176 | |
Receivable for: | | | | | | | | |
Dividends and interest | | | 475,618 | | | | 202,632 | |
Dividend reclaims | | | 569,615 | | | | 410,732 | |
Capital stock sold | | | 52,161 | | | | — | |
Investments sold | | | 473,513 | | | | 151,476 | |
Prepaid assets | | | 44,708 | | | | 26,753 | |
| | | | | | | | |
Total assets | | | 367,081,455 | | | | 147,023,278 | |
| | | | | | | | |
LIABILITIES | | | | | | | | |
Payable for: | | | | | | | | |
Investments purchased | | | 618 | | | | 242 | |
Advisory fees | | | 312,901 | | | | 123,897 | |
Capital stock repurchased | | | 4,128,157 | | | | 82,220 | |
Accrued expenses and other liabilities | | | 260,680 | | | | 116,285 | |
| | | | | | | | |
Total liabilities | | | 4,702,356 | | | | 322,644 | |
| | | | | | | | |
NET ASSETS | | $ | 362,379,099 | | | $ | 146,700,634 | |
| | | | | | | | |
SUMMARY OF SHAREHOLDERS’ EQUITY | | | | | | | | |
Capital stock—no par value; unlimited authorized shares; 23,258,822 and 7,372,099, respectively outstanding shares | | | 380,590,888 | | | | 136,470,951 | |
Distributable earnings | | | (18,211,789 | ) | | | 10,229,683 | |
| | | | | | | | |
NET ASSETS | | $ | 362,379,099 | | | $ | 146,700,634 | |
| | | | | | | | |
NET ASSET VALUE | | | | | | | | |
Offering and redemption price per share | | $ | 15.58 | | | $ | 19.90 | |
| | | | | | | | |
See accompanying Notes to Financial Statements.
18
PHAEACIAN FUNDS
STATEMENTS OF OPERATIONS
For the Year Ended March 31, 2022
| | | | | | | | |
| | | Phaeacian | | | | |
| | | Accent | | | Phaeacian | |
| | | International | | | Global | |
| | | Value | | | Value | |
| | | Fund | | | Fund | |
INVESTMENT INCOME | | | | | | | | |
Dividends (net of foreign taxes withheld of $ 609,567 and $ 249,100, respectively) | | $ | 5,312,141 | | | $ | 2,334,112 | |
| | | | | | | | |
Total investment income | | | 5,312,141 | | | | 2,334,112 | |
| | | | | | | | |
EXPENSES | | | | | | | | |
Advisory fees (Note 6) | | | 4,217,077 | | | | 1,850,051 | |
Fund accounting and administrative services fees (Note 6) | | | 314,596 | | | | 153,321 | |
Custodian fees (Note 6) | | | 110,312 | | | | 41,377 | |
Transfer agent fees and expenses (Note 6) | | | 109,451 | | | | 53,885 | |
Trustee fees and expenses (Note 6) | | | 94,666 | | | | 34,341 | |
Regulatory and compliance fees (Note 6) | | | 77,048 | | | | 55,509 | |
Audit and tax services fees | | | 39,428 | | | | 16,500 | |
Legal fees | | | 32,490 | | | | — | |
Filing fees | | | 13,169 | | | | 14,429 | |
Interest expense (Note 8) | | | — | | | | 4,432 | |
Other | | | 59,255 | | | | 20,203 | |
| | | | | | | | |
Total expenses | | | 5,067,492 | | | | 2,244,048 | |
| | | | | | | | |
Net investment income | | | 244,649 | | | | 90,064 | |
| | | | | | | | |
NET REALIZED AND UNREALIZED APPRECIATION (DEPRECIATION) | | | | | | | | |
Net realized gain (loss) on: | | | | | | | | |
Investments | | | 39,981,928 | | | | 25,162,086 | |
Foreign currency transactions | | | (199,345 | ) | | | 415 | |
Net change in unrealized appreciation (depreciation) of: Investments | | | (71,401,597 | ) | | | (38,928,510 | ) |
Translation of foreign currency denominated amounts. | | | (14,532 | ) | | | (11,811 | ) |
| | | | | | | | |
Net realized and unrealized (loss) | | | (31,633,546 | ) | | | (13,777,820 | ) |
| | | | | | | | |
NET DECREASE IN NET ASSETS RESULTING FROM OPERATIONS | | $ | (31,388,897 | ) | | $ | (13,687,756 | ) |
| | | | | | | | |
See accompanying Notes to Financial Statements.
19
PHAEACIAN FUNDS
STATEMENTS OF CHANGES IN NET ASSETS
| | | | | | | | | | | | |
| | | Phaeacian Accent International Value Fund | |
| | | Year | | | Three Months | | | Year | |
| | | Ended | | | Ended | | | Ended | |
| | | March 31, | | | March 31, | | | December 31, | |
| | | 2022 | | | 2021(a) | | | 2020 | |
INCREASE (DECREASE) IN NET ASSETS | | | | | | | | | | | | |
Operations: | | | | | | | | | | | | |
Net investment income (loss) | | $ | 244,649 | | | $ | (348,602 | ) | | $ | 1,201,218 | |
Net realized gain | | | 39,782,583 | | | | 21,587,651 | | | | 10,720,717 | |
Net change in unrealized appreciation (depreciation) | | | (71,416,129 | ) | | | (11,743,377 | ) | | | 46,118,471 | |
| | | | | | | | | | | | |
Net increase (decrease) in net assets resulting from operations | | | (31,388,897 | ) | | | 9,495,672 | | | | 58,040,406 | |
| | | | | | | | | | | | |
Distributions to shareholders | | | (59,210,592 | ) | | | — | | | | (3,822,379 | ) |
| | | | | | | | | | | | |
Capital stock transactions: | | | | | | | | | | | | |
Proceeds from capital stock sold | | | 115,276,883 | | | | 30,150,167 | | | | 127,552,930 | |
Proceeds from shares issued to shareholders upon reinvestment of dividends and distributions | | | 52,180,707 | | | | — | | | | 3,250,459 | |
Cost of capital stock repurchased | | | (103,717,869 | ) | | | (13,203,185 | ) | | | (94,118,723 | ) |
| | | | | | | | | | | | |
Net increase from capital stock transactions | | | 63,739,721 | | | | 16,946,982 | | | | 36,684,666 | |
| | | | | | | | | | | | |
Total change in net assets | | | (26,859,768 | ) | | | 26,442,654 | | | | 90,902,693 | |
| | | | | | | | | | | | |
NET ASSETS | | | | | | | | | | | | |
Beginning of period | | | 389,238,867 | | | | 362,796,213 | | | | 271,893,520 | |
| | | | | | | | | | | | |
End of period | | $ | 362,379,099 | | | $ | 389,238,867 | | | $ | 362,796,213 | |
| | | | | | | | | | | | |
CHANGE IN CAPITAL STOCK OUTSTANDING | | | | | | | | | | | | |
Shares of capital stock sold | | | 6,186,358 | | | | 1,545,438 | | | | 8,000,887 | |
Shares issued to shareholders upon reinvestment of dividends and distributions | | | 3,160,552 | | | | — | | | | 208,630 | |
Shares of capital stock repurchased | | | (6,066,129 | ) | | | (677,157 | ) | | | (6,007,532 | ) |
| | | | | | | | | | | | |
Change in capital stock outstanding | | | 3,280,781 | | | | 868,281 | | | | 2,201,985 | |
| | | | | | | | | | | | |
| (a) | As part of the Reorganization, the Board of Trustees approved a change in fiscal year end for the Fund from December 31 to March 31 (Note 1). |
See accompanying Notes to Financial Statements.
20
PHAEACIAN FUNDS
STATEMENTS OF CHANGES IN NET ASSETS (Continued)
| | | | | | | | | | | | |
| | | Phaeacian Global Value Fund | |
| | | Year | | | Six Months | | | Year | |
| | | Ended | | | Ended | | | Ended | |
| | | March 31, | | | March 31, | | | September 30, | |
| | | 2022 | | | 2021(a) | | | 2020 | |
INCREASE (DECREASE) IN NET ASSETS | | | | | | | | | | | | |
Operations: | | | | | | | | | | | | |
Net investment income (loss) | | $ | 90,064 | | | $ | (124,104 | ) | | $ | 1,602,649 | |
Net realized gain (loss) | | | 25,162,501 | | | | 18,039,352 | | | | (5,543,305 | ) |
Net change in unrealized appreciation (depreciation) | | | (38,940,321 | ) | | | 13,002,372 | | | | 20,740,694 | |
| | | | | | | | | | | | |
Net increase (decrease) in net assets resulting from operations | | | (13,687,756 | ) | | | 30,917,620 | | | | 16,800,038 | |
| | | | | | | | | | | | |
Distributions to shareholders | | | (30,218,013 | ) | | | (1,406,466 | ) | | | (12,376,261 | ) |
| | | | | | | | | | | | |
Capital stock transactions: | | | | | | | | | | | | |
Proceeds from capital stock sold | | | 4,773,257 | | | | 2,691,714 | | | | 4,141,699 | |
Proceeds from shares issued to shareholders upon reinvestment of dividends and distributions | | | 16,871,487 | | | | 780,210 | | | | 7,251,266 | |
Cost of capital stock repurchased | | | (17,594,711 | ) | | | (7,445,701 | ) | | | (18,792,708 | ) |
| | | | | | | | | | | | |
Net increase (decrease) from capital stock transactions | | | 4,050,033 | | | | (3,973,777 | ) | | | (7,399,743 | ) |
| | | | | | | | | | | | |
Total change in net assets | | | (39,855,736 | ) | | | 25,537,377 | | | | (2,975,966 | ) |
| | | | | | | | | | | | |
NET ASSETS | | | | | | | | | | | | |
Beginning of period | | | 186,556,370 | | | | 161,018,993 | | | | 163,994,959 | |
| | | | | | | | | | | | |
End of period | | $ | 146,700,634 | | | $ | 186,556,370 | | | $ | 161,018,993 | |
| | | | | | | | | | | | |
CHANGE IN CAPITAL STOCK OUTSTANDING | | | | | | | | | | | | |
Shares of capital stock sold | | | 178,075 | | | | 109,118 | | | | 212,429 | |
Shares issued to shareholders upon reinvestment of dividends and distributions | | | 773,921 | | | | 31,575 | | | | 336,798 | |
Shares of capital stock repurchased | | | (746,085 | ) | | | (313,112 | ) | | | (975,786 | ) |
| | | | | | | | | | | | |
Change in capital stock outstanding | | | 205,911 | | | | (172,419 | ) | | | (426,559 | ) |
| | | | | | | | | | | | |
| (a) | As part of the Reorganization, the Board of Trustees approved a change in fiscal year end for the Fund from September 30 to March 31 (Note 1). |
See accompanying Notes to Financial Statements.
21
PHAEACIAN ACCENT INTERNATIONAL VALUE FUND
FINANCIAL HIGHLIGHTS
Selected Data for Each Share of Capital Stock Outstanding Throughout Each Period
| | | | | | | | | | | | | | | | | | | | | | | | |
| | | | | | Three | | | | | | | | | | | | | |
| | | Year | | | Months | | | | | | | | | | | | | |
| | | Ended | | | Ended | | | | | | | | | | | | | |
| | | March 31, | | | March 31, | | | Year Ended December 31, | |
| | | 2022 | | | 2021(a) | | | 2020 | | | 2019 | | | 2018 | | | 2017 | |
Per share operating performance: | | | | | | | | | | | | | | | | | | | | | | | | |
Net asset value at beginning of period | | $ | 19.48 | | | $ | 18.98 | | | $ | 16.08 | | | $ | 13.54 | | | $ | 15.45 | | | $ | 12.21 | |
| | | | | | | | | | | | | | | | | | | | | | | | |
Income from investment operations: | | | | | | | | | | | | | | | | | | | | | | | | |
Net investment income (loss)(b) | | $ | 0.01 | | | $ | (0.02 | ) | | $ | 0.07 | | | $ | 0.01 | | | $ | 0.06 | | | $ | (0.01 | ) |
Net realized and unrealized gain (loss) on investment securities | | | (1.17 | ) | | | 0.52 | | | | 3.04 | | | | 3.24 | | | | (1.73 | ) | | | 3.32 | |
| | | | | | | | | | | | | | | | | | | | | | | | |
Total Investment from operations | | $ | (1.16 | ) | | $ | 0.50 | | | $ | 3.11 | | | $ | 3.25 | | | $ | (1.67 | ) | | $ | 3.31 | |
| | | | | | | | | | | | | | | | | | | | | | | | |
Less distributions: | | | | | | | | | | | | | | | | | | | | | | | | |
Distributions from net investment income. | | $ | — | (c) | | $ | — | | | $ | (0.13 | ) | | $ | (0.71 | ) | | $ | (0.14 | ) | | $ | (0.07 | ) |
Distributions from net realized capital gains. | | | (2.74 | ) | | | — | | | | (0.08 | ) | | | — | | | | (0.10 | ) | | | — | |
| | | | | | | | | | | | | | | | | | | | | | | | |
Total distributions | | $ | (2.74 | ) | | $ | — | | | $ | (0.21 | ) | | $ | (0.71 | ) | | $ | (0.24 | ) | | $ | (0.07 | ) |
| | | | | | | | | | | | | | | | | | | | | | | | |
Redemption fees | | | — | | | | — | | | | — | | | | — | | | | — | | | | — | (c) |
| | | | | | | | | | | | | | | | | | | | | | | | |
Net asset value, end of period | | $ | 15.58 | | | $ | 19.48 | | | $ | 18.98 | | | $ | 16.08 | | | $ | 13.54 | | | $ | 15.45 | |
| | | | | | | | | | | | | | | | | | | | | | | | |
Total investment return(d), (e) | | | (6.73 | )% | | | 2.63 | % | | | 19.63 | % | | | 24.05 | % | | | (10.81 | )% | | | 27.12 | % |
Ratios/supplemental data: | | | | | | | | | | | | | | | | | | | | | | | | |
Net assets, end of period (in $000’s) | | $ | 362,379 | | | $ | 389,239 | | | $ | 362,796 | | | $ | 271,894 | | | $ | 219,347 | | | $ | 254,886 | |
Ratio of expenses to average net assets | | | | | | | | | | | | | | | | | | | | | | | | |
Before waiver/reimbursement | | | 1.20 | % | | | 1.24 | %(f) | | | 1.25 | % | | | 1.34 | % | | | 1.35 | % | | | 1.31 | % |
After waiver/reimbursement | | | 1.20 | % | | | 1.24 | %(f) | | | 1.25 | % | | | 1.29 | % | | | 1.29 | % | | | 1.29 | % |
Ratio of net investment income to average net assets: | | | | | | | | | | | | | | | | | | | | | | | | |
Before waiver/reimbursement | | | 0.06 | % | | | (0.37 | )%(f) | | | 0.43 | % | | | 0.03 | % | | | 0.33 | % | | | (0.11 | )% |
After waiver/reimbursement | | | 0.06 | % | | | (0.37 | )%(f) | | | 0.43 | % | | | 0.09 | % | | | 0.39 | % | | | (0.09 | )% |
Portfolio turnover rate(d) | | | 116 | % | | | 35 | % | | | 176 | % | | | 88 | % | | | 120 | % | | | 146 | % |
| (a) | Formerly the FPA International Value Fund. As part of the Reorganization, the Board of Trustees approved a change in fiscal year end for the Fund from December 31 to March 31 (Note 1). |
| (b) | Per share amount is based on average shares outstanding. (c) Rounds to less than $0.01 per share. |
| (d) | Not annualized for periods less than a year. |
| (e) | Return is based on net asset value per share, adjusted for reinvestment of distributions, and does not reflect deduction of the sales charge. (f) Annualized for periods less than one year. |
See accompanying Notes to Financial Statements.
22
PHAEACIAN GLOBAL VALUE FUND
FINANCIAL HIGHLIGHTS
Selected Data for Each Share of Capital Stock Outstanding Throughout Each Period
| | | | | | | | | | | | | | | | | | | | | | | | |
| | | | | | Six | | | | | | | | | | | | | |
| | | Year | | | Months | | | | | | | | | | | | | |
| | | Ended | | | Ended | | | | | | | | | | | | | |
| | | March 31, | | | March 31, | | | Year Ended September 30, | |
| | | 2022 | | | 2021(a) | | | 2020 | | | 2019 | | | 2018 | | | 2017 | |
Per share operating performance: | | | | | | | | | | | | | | | | | | | | | | | | |
Net asset value at beginning of period | | $ | 26.03 | | | $ | 21.94 | | | $ | 21.12 | | | $ | 23.06 | | | $ | 21.30 | | | $ | 17.36 | |
| | | | | | | | | | | | | | | | | | | | | | | | |
Income from investment operations: | | | | | | | | | | | | | | | | | | | | | | | | |
Net investment income (loss)(b) | | $ | 0.01 | | | $ | (0.02 | ) | | $ | 0.21 | | | $ | 0.13 | | | $ | 0.12 | | | $ | 0.08 | |
Net realized and unrealized gain (loss) on investment securities | | | (1.84 | ) | | | 4.31 | | | | 2.23 | | | | 0.13 | | | | 1.72 | | | | 4.04 | |
| | | | | | | | | | | | | | | | | | | | | | | | |
Total Investment from operations | | $ | (1.83 | ) | | $ | 4.29 | | | $ | 2.44 | | | $ | 0.26 | | | $ | 1.84 | | | $ | 4.12 | |
| | | | | | | | | | | | | | | | | | | | | | | | |
Less distributions: | | | | | | | | | | | | | | | | | | | | | | | | |
Distributions from net investment income. | | $ | (0.03 | ) | | $ | (0.20 | ) | | $ | (0.12 | ) | | $ | (0.12 | ) | | $ | (0.08 | ) | | $ | (0.18 | ) |
Distributions from net realized capital gains. | | | (4.27 | ) | | | — | | | | (1.50 | ) | | | (2.08 | ) | | | — | | | | — | |
| | | | | | | | | | | | | | | | | | | | | | | | |
Total distributions | | $ | (4.30 | ) | | $ | (0.20 | ) | | $ | (1.62 | ) | | $ | (2.20 | ) | | $ | (0.08 | ) | | $ | (0.18 | ) |
| | | | | | | | | | | | | | | | | | | | | | | | |
Redemption fees | | | — | | | | — | | | | — | | | | — | | | | — | | | | — | (c) |
Net asset value, end of period | | $ | 19.90 | | | $ | 26.03 | | | $ | 21.94 | | | $ | 21.12 | | | $ | 23.06 | | | $ | 21.30 | |
| | | | | | | | | | | | | | | | | | | | | | | | |
Total investment return(d), (e) | | | (8.48 | )% | | | 19.58 | % | | | 11.69 | % | | | 2.69 | % | | | 8.65 | % | | | 23.92 | % |
Ratios/supplemental data: | | | | | | | | | | | | | | | | | | | | | | | | |
Net assets, end of period (in $000’s) | | $ | 146,701 | | | $ | 186,556 | | | $ | 161,019 | | | $ | 163,995 | | | $ | 180,293 | | | $ | 174,131 | |
Ratio of expenses to average net assets | | | | | | | | | | | | | | | | | | | | | | | | |
Before waiver/reimbursement | | | 1.21 | % | | | 1.22 | %(f) | | | 1.40 | % | | | 1.36 | % | | | 1.35 | % | | | 1.44 | % |
After waiver/reimbursement | | | 1.21 | % | | | 1.21 | %(f) | | | 1.29 | % | | | 1.29 | % | | | 1.29 | % | | | 1.29 | % |
Ratio of net investment income to average net assets: | | | | | | | | | | | | | | | | | | | | | | | | |
Before waiver/reimbursement | | | 0.05 | % | | | (0.16 | )%(f) | | | 0.91 | % | | | 0.54 | % | | | 0.46 | % | | | 0.27 | % |
After waiver/reimbursement | | | 0.05 | % | | | (0.15 | )%(f) | | | 1.02 | % | | | 0.61 | % | | | 0.52 | % | | | 0.41 | % |
Portfolio turnover rate(d) | | | 69 | % | | | 45 | % | | | 96 | % | | | 62 | % | | | 79 | % | | | 72 | % |
| (a) | Formerly the FPA Paramount Fund. As part of the Reorganization, the Board of Trustees approved a change in fiscal year end for the Fund from September 30 to March 31 (Note 1). |
| (b) | Per share amount is based on average shares outstanding. |
| (c) | Rounds to less than $0.01 per share. |
| (d) | Not annualized for periods less than a year. |
| (e) | Return is based on net asset value per share, adjusted for reinvestment of distributions, and does not reflect deduction of the sales charge. |
| (f) | Annualized for periods less than one year. |
See accompanying Notes to Financial Statements.
23
PHAEACIAN FUNDS
NOTES TO FINANCIAL STATEMENTS
March 31, 2022
NOTE 1 — Organization
Datum One Series Trust (the “Trust”) is a Massachusetts business trust operating under an Amended and Restated Agreement and Declaration of Trust (the “Trust Agreement”) dated March 3, 2020. The Trust is an open-end management investment company registered under the Investment Company Act of 1940, as amended (the “1940 Act”). The Trust Agreement permits the Board of Trustees (the “Trustees” or “Board”) to authorize and issue an unlimited number of shares of beneficial interest, at no par value, in separate series of the Trust. Phaeacian Accent International Value Fund and Phaeacian Global Value Fund (together the “Funds”; each a “Fund”) are series of the Trust. These financial statements and notes only relate to these Funds.
The Phaeacian Accent International Value Fund is a non-diversified fund, meaning it may invest in a smaller number of companies than a diversified fund. The Fund seeks to provide above average capital appreciation over the long-term while attempting to minimize the risk of capital loss. For information on the specific strategies of the Fund, please refer to the Fund’s Prospectus.
The Phaeacian Global Value Fund is a diversified fund. The Fund seeks to provide above average capital appreciation over the long-term while attempting to minimize the risk of capital loss. For information on the specific strategies of the Fund, please refer to the Fund’s Prospectus.
Under the Trust’s organizational documents, its officers and Trustees are indemnified against certain liabilities arising out of the performance of their duties to the Trust and Funds. In addition, in the normal course of business, the Trust enters into contracts with its vendors and others that provide for general indemnifications. The Funds’ maximum exposure under these arrangements is unknown, as this would involve future claims that may be made against the Funds.
Prior to October 16, 2020, the Phaeacian Accent International Value Fund and Phaeacian Global Value Fund (together the “Successor Funds”; each a “Successor Fund”) operated as the FPA International Value Fund, a series of the FPA Funds Trust and FPA Paramount Fund, a series of FPA Paramount Fund, Inc., respectively. The FPA International Value Fund and the FPA Paramount Fund (together the “Predecessor Funds”; each a “Predecessor Fund”) were each authorized to issue one class of shares. On October 16, 2020, the FPA International Value Fund was reorganized into the Phaeacian Accent International Value Fund and the FPA Paramount Fund was reorganized into the Phaeacian Global Value Fund, pursuant to separate Plans of Reorganization approved by each Fund’s Board of Trustees/Directors on May 12, 2020 and by each Predecessor Fund’s shareholders on October 1, 2020 (the “Reorganizations”). At the time of the Reorganizations, each Predecessor Fund transferred all of its assets to its corresponding Fund in exchange for shares of the corresponding Fund and the assumption of all of the liabilities of the Predecessor Fund by the corresponding Successor Fund. Upon closing of the Reorganizations, holders of a Predecessor Fund’s shares received shares of the corresponding Fund’s shares. The Reorganizations were tax-free for U.S federal income tax purposes.
As part of the Reorganizations, the Board of Trustees approved a change in fiscal year end for each Fund to March 31.
24
PHAEACIAN FUNDS
NOTES TO FINANCIAL STATEMENTS (Continued)
March 31, 2022
NOTE 2 — Significant Accounting Policies
The Funds are investment companies that apply the accounting and reporting guidance issued in Topic 946 by the U.S. Financial Accounting Standards Board. The financial statements of the Funds have been prepared in conformity with accounting principles generally accepted in the United States of America (“U.S. GAAP”).
The Funds’ investments are reported at fair value as defined by U.S. GAAP. The Funds generally determine their net asset value as of approximately 4:00 p.m. New York time each day the New York Stock Exchange is open. Further discussion of valuation methods, inputs and classifications can be found under Disclosure of Fair Value Measurements.
| B. | Securities Transactions, Related Investment Income and Foreign Currency Translations |
Securities transactions are accounted for on the date the securities are purchased or sold. Dividend income and distributions to shareholders are recorded on the ex-dividend date. Interest income and expenses are recorded on an accrual basis. The books and records of the Funds are maintained in U.S. dollars as follows: (1) the foreign currency fair value of investment securities, and other assets and liabilities stated in foreign currencies, are translated using the daily spot rate; and (2) purchases, sales, income and expenses are translated at the rate of exchange prevailing on the respective dates of such transactions. The Funds do not isolate that portion of the results of operations resulting from changes in foreign exchange rates on investments from the fluctuations arising from changes in market prices of securities held. Such fluctuations are included with the “Net realized gain (loss) on investments” and “Net change in unrealized appreciation (depreciation) of investments” on the Statements of Operations.
Net realized gains and losses from foreign currency transactions arise from sales of foreign currency, currency gains or losses realized between the trade and settlement dates on securities transactions, and the difference between the amounts of dividends, interest, and foreign withholding taxes recorded on each Fund’s books, and the U.S. dollar equivalent of the amounts actually received or paid. Net unrealized appreciation or depreciation on translation of assets and liabilities denominated in foreign currencies arise from changes in the value of assets and liabilities other than investments in securities at the period end, resulting from changes in the exchange rates.
Expenses directly attributable to a fund in the Trust are charged to that fund, while expenses that are attributable to more than one fund in the Trust are allocated among the applicable funds on a pro-rata basis to each adviser’s series of funds based on relative net assets or another reasonable basis.
The preparation of the financial statements in accordance with U.S. GAAP requires management to make estimates and assumptions that affect the amounts reported. Actual results could differ from those estimates.
NOTE 3 — Risk Considerations
Investing in the Funds may involve certain risks including, but not limited to, those described below.
25
PHAEACIAN FUNDS
NOTES TO FINANCIAL STATEMENTS (Continued)
March 31, 2022
Risks Associated with Investing in Equities: Equity securities, generally common stocks and/or depositary receipts, held by the Funds may experience sudden, unpredictable drops in value or long periods of decline in value. This may occur because of factors that affect the securities markets generally, such as adverse changes in economic or political conditions, the general outlook for corporate earnings, interest rates or investor sentiment. Sustained periods of market volatility, either globally or in any jurisdiction in which the Funds invest, may increase the risks associated with an investment in the Funds. Equity securities may also lose value because of factors affecting an entire industry or sector, such as increases in production costs, or factors directly related to a specific company, such as decisions made by its management. Equity securities generally have greater price volatility than debt securities. The Funds’ shares are not bank deposits and are not guaranteed, endorsed or insured by any financial institution, government authority or the Federal Deposit Insurance Corporation.
Risks Associated with Investing in Large-Capitalization Companies: Returns on investments in securities of large capitalization companies could trail the returns on investments in securities of smaller and mid-sized companies. Larger companies may be unable to respond as quickly as smaller and mid-sized companies to competitive challenges or to changes in business, product, financial, or other market conditions. Larger companies may not be able to maintain growth at the high rates that may be achieved by well-managed smaller and mid-sized companies.
Risks Associated with Investing in Smaller-Cap and Mid-Cap Companies: The prices of securities of mid-cap and smaller-cap companies tend to fluctuate more widely than those of larger, more established companies. Mid-cap and smaller-cap companies may have limited product lines, markets or financial resources or may depend on the expertise of a few people and may be subject to more abrupt or erratic market movements than securities of larger, more established companies or market averages in general. In addition, these companies often have shorter operating histories and are more reliant on key products or personnel than larger companies. The securities of smaller or medium-sized companies are often traded over-the-counter, and may not be traded in volumes typical of securities traded on a national securities exchange. Securities of such issuers may lack sufficient market liquidity to effect sales at an advantageous time or without a substantial drop in price.
Risks Associated with Investing in Non-U.S. Securities: Non-U.S. investments (including depositary receipts) can be riskier, more volatile and less liquid than investments in the United States. Adverse political, social and economic developments or instability, or changes in the value of non-U.S. currency, can make it more difficult for the Funds to sell their securities and could reduce the value of the Funds’ shares. Differences in regulatory, tax and accounting standards and differences in reporting standards may cause difficulties in obtaining information about non-U.S. companies and may negatively affect investment decisions. Investments in non-U.S. securities may be affected by restrictions on receiving investment proceeds from outside the U.S., confiscatory tax laws, and potential difficulties in enforcing contractual obligations. Transactions may be subject to less efficient settlement practices, including extended clearance and settlement periods. In addition, global economies are increasingly interconnected, which increases the possibility that conditions in one country, region or financial market might adversely impact a different country, region or financial market.
Risks Associated with Investing in Emerging Markets: The Funds’ investments in non-U.S. issuers in developing or emerging market countries may involve increased exposure to changes in economic, social and political factors as compared to investments in more developed countries. The economies of most emerging market
26
PHAEACIAN FUNDS
NOTES TO FINANCIAL STATEMENTS (Continued)
March 31, 2022
countries are in the early stage of capital market development and may be dependent on relatively fewer industries. As a result, their economic systems are still evolving. Their legal and political systems may also be less stable than those in developed economies. Securities markets in these countries can also be smaller, and there may be increased settlement risks. The Public Company Accounting Oversight Board, which regulates auditors of U.S. companies, is unable to inspect audit work papers in certain foreign countries. Investors in emerging markets often have limited rights and few practical remedies to pursue shareholder claims, including class actions or fraud claims, and the ability of the U.S. Securities and Exchange Commission, the U.S. Department of Justice and other authorities to bring and enforce actions against foreign issuers or foreign persons is limited. Emerging market countries often suffer from currency devaluation and higher rates of inflation. Due to these risks, securities issued in developing or emerging countries may be more volatile, less liquid, and harder to value than securities issued in more developed countries.
Risks Associated with Value Investing: Value stocks, including those selected by the portfolio manager for the Funds, are subject to the risks that their intrinsic value may never be realized by the market and that their prices may go down. In addition, value style investing may fall out of favor and underperform growth or other styles of investing during given periods. The Funds’ value discipline may result in a portfolio of stocks that differs materially from its benchmark index.
Securities selected by the portfolio manager using a value strategy may never reach their intrinsic value because the market fails to recognize what the portfolio manager considers to be the true business value or because the portfolio manager has misjudged those values. There may be periods during which the investment performance of the Funds suffers while using a value strategy.
Market Risk: The market price of investments owned by the Funds may go up or down, sometimes rapidly or unpredictably. Fund investments may decline in value due to factors affecting the overall markets, or particular industries or sectors. The value of a holding may decline due to general market conditions that are not specifically related to a particular issuer, such as real or perceived adverse economic conditions, changes in the general outlook for an issuer’s financial condition, changes in interest or currency rates, domestic or international monetary policy or adverse investor sentiment generally. The value of a holding may also decline due to factors that affect a particular industry or industries, such as competitive conditions within an industry or government regulations. The Funds may experience heavy redemptions that could cause the Funds to liquidate its assets at inopportune times or at a loss or depressed value, which could cause the value of an investment in the Funds to unexpectedly decline. The Funds may rely on various third-party sources to calculate its net asset value. Errors or systems failures and other technological issues may adversely impact the Funds’ calculation of its net asset value, and such net asset value calculation issues may result in inaccurately calculated net asset values, delays in net asset value calculation and/or the inability to calculate net asset values over extended periods. The Funds may be unable to recover any losses associated with such failures.
Liquidity Risk: The Funds’ investments in illiquid securities may reduce the returns of the Funds because they may not be able to sell the illiquid securities at an advantageous time or price.
Large Investor Risk: Ownership of shares of the Funds may be concentrated in one or a few large investors. Such investors may redeem shares in large quantities or on a frequent basis. Redemptions by a large investor may affect the performance of the Funds, may increase realized capital gains, may accelerate the realization of taxable
27
PHAEACIAN FUNDS
NOTES TO FINANCIAL STATEMENTS (Continued)
March 31, 2022
income or gains for shareholders and may increase transaction costs. These transactions potentially limit the use of any capital loss carryforwards and certain other losses to offset future realized capital gains (if any). Such transactions may also increase the Funds’ expenses. In addition, the Funds may be delayed in investing new cash after a large shareholder purchase, and under such circumstances may be required to maintain a larger cash position than it ordinarily would.
Management Risk: The Funds are subject to management risk as actively managed investment portfolios. The portfolio manager will apply investment techniques and risk analyses in making investment decisions for the Funds, but there can be no guarantee that these will produce the desired results. The portfolio manager’s opinion about the intrinsic worth or creditworthiness of a company or security may be incorrect, the portfolio manager may not make timely purchases or sales of securities for the Funds, the Funds’ investment objective may not be achieved, or the market may continue to undervalue the Funds’ securities. In addition, the Funds may not be able to quickly dispose of certain securities holdings. The frequency of trading within the Funds impacts portfolio turnover rates, which are shown in the financial highlights table. A higher rate of portfolio turnover could produce higher trading costs and taxable distributions, which would detract from the Funds’ performance. Moreover, there can be no assurance that all of the Adviser’s personnel will continue to be associated with the Adviser for any length of time. The loss of services of one or more key employees of the Adviser, including the portfolio manager, could have an adverse impact on the Funds’ ability to achieve their investment objective. Certain securities or other instruments in which the Funds seek to invest may not be available in the quantities desired. In such circumstances, the portfolio manager may determine to purchase other securities or instruments as substitutes. Such substitute securities or instruments may not perform as intended, which could result in losses to the Funds.
Key Person Risk: The Funds are heavily dependent upon either Messrs. Gregory A. Herr or Pierre O. Py for their operation and for the execution of their respective investment strategy. A Fund would likely find it more difficult to execute its investment strategy and to continue its operation in the event both Gregory A. Herr and Pierre O. Py were no longer involved in the management of the Funds.
Risks Associated with Non-Diversification: The Phaeacian Accent International Value Fund is non-diversified, which generally means that it may invest a greater percentage of its total assets in the securities of fewer issuers than a “diversified” fund. This increases the risk that a change in the value of any one investment held by the Fund could affect the overall value of the Fund more than it would affect that of a diversified fund holding a greater number of investments. Accordingly, the Fund’s value will likely be more volatile than the value of a more diversified fund. In addition, due to its relatively low number of holdings, the Fund will be more susceptible to company-specific events and risks impacting the particular securities held by the Fund than a fund with a greater number of holdings.
Market Disruption and Geopolitical Risk: The Funds are subject to the risk that geopolitical events will disrupt securities markets and adversely affect global economies and markets. War, terrorism, and related geopolitical events have led, and in the future may lead, to increased market volatility and may have adverse long-term effects on U.S. and world economies and markets generally. Natural and environmental disasters, epidemics or pandemics and systemic market dislocations may also be highly disruptive to economies and markets. Those events as well as other changes in non-U.S. and domestic economic, social, and political conditions also could adversely affect individual issuers or related groups of issuers, securities markets, interest rates, credit
28
PHAEACIAN FUNDS
NOTES TO FINANCIAL STATEMENTS (Continued)
March 31, 2022
ratings, inflation, investor sentiment, and other factors affecting the value of the investments of the Funds. Given the interdependence among global economies and markets, conditions in one country, market, or region might adversely impact markets, issuers and/or foreign exchange rates in other countries, including the U.S.
NOTE 4 — Purchases and Sales of Investment Securities
For the year ended March 31, 2022 the aggregate costs of purchases and proceeds from sales of securities (excluding short-term investments) for the Funds were as follows:
| | | | | | | | |
| | | Cost of
Purchases of
Investment securities | | | Proceeds of
Investment securities
sold | |
Phaeacian Accent International Value Fund | | $ | 415,249,783 | | | $ | 410,345,940 | |
Phaeacian Global Value Fund | | | 125,654,360 | | | | 149,685,671 | |
NOTE 5 — Federal Income Tax
No provision for federal income tax is required because the Funds have elected to be taxed as a “regulated investment company” under the Internal Revenue Code (the “Code”) and intends to maintain this qualification and to distribute each year to their shareholders, in accordance with the minimum distribution requirements of the Code, their taxable net investment income and taxable net realized gains on investments.
Distributions paid to shareholders are based on net investment income and net realized gains determined on a tax reporting basis, which may differ from financial reporting. For federal income tax purposes, the Funds had the following components of distributable earnings at March 31, 2022:
| | | | | | | | | | | | |
| | | Undistributed
ordinary
Income | | | Undistributed
Capital
Gains | | | Unrealized
Gain (Loss) | |
Phaeacian Accent International Value Fund | | $ | — | | | $ | 12,735,916 | | | $ | (29,747,401 | ) |
Phaeacian Global Value Fund | | | — | | | | 7,375,006 | | | | 2,854,677 | |
29
PHAEACIAN FUNDS
NOTES TO FINANCIAL STATEMENTS (Continued)
March 31, 2022
The tax status of distributions paid during the fiscal periods ended March 31 2022; March 31, 2021; December 31, 2020; September 30, 2020 were as follows:
| | | | | | | | | | | | | | | | | | | | | | | | | | | | | | | | | | | | |
| | | Dividends
from
ordinary
Income
2022 | | | Dividends
from
long-term
capital gains
2022 | | | Total
Distributions
2022 | | | Dividends
from
ordinary
Income
2021 | | | Dividends
from
long-term
capital gains
2021 | | | Total
Distributions
2021 | | | Dividends
from
ordinary
Income
2020 | | | Dividends
from
long-term
capital gains
2020 | | | Total
Distributions
2020 | |
Phaeacian Accent International Value Fund(a) | | $ | 26,507,710 | | | $ | 32,702,882 | | | $ | 59,210,592 | | | $ | — | | | $ | — | | | $ | — | | | $ | 2,399,246 | | | $ | 1,423,133 | | | $ | 3,822,379 | |
Phaeacian Global Value Fund(a) | | | 6,679,897 | | | | 23,538,116 | | | | 30,218,013 | | | | 1,406,466 | | | | — | | | | 1,406,466 | | | | 5,234,973 | | | | 7,141,288 | | | | 12,376,261 | |
| (a) | Values displayed for 2020 are as of December 31, 2020 for the Phaeacian Accent International Value Fund and September 30, 2020 for the Phaeacian Global Value Fund. |
As of March 31, 2022, the cost, gross unrealized appreciation and gross unrealized depreciation on investments, for Federal income tax purposes, were as follows:
| | | | | | | | | | | | | | | | |
| | | Tax Cost | | | Tax Unrealized
Appreciation | | | Tax Unrealized
(Depreciation) | | | Net Unrealized
Appreciation
(Depreciation) | |
Phaeacian Accent International Value Fund | | $ | 341,867,607 | | | $ | 23,243,423 | | | $ | (52,982,130 | ) | | $ | (29,738,707 | ) |
Phaeacian Global Value Fund | | | 142,123,311 | | | | 23,247,008 | | | | (20,386,449 | ) | | | 2,860,559 | |
As of and for the fiscal year ended March 31, 2022, the Funds did not have any liability for unrecognized tax benefits. The Funds recognize interest and penalties, if any, related to unrecognized tax benefits as income tax expense in the Statement of Operations. For the year ended March 31, 2022, the Funds did not incur any interest or penalties. The statute of limitations remains open for 3 years, once a return is filed. No examinations are in progress at this time.
For the period subsequent to October 31, 2021, through the fiscal year ended March 31, 2022, the following Fund incurred net capital losses and/or late year ordinary losses for which the Fund intends to treat as having been incurred in the following fiscal year:
| | | | | | | | |
| | | Ordinary Loss | | | Net Capital Loss | |
Phaeacian Accent International Value Fund | | $ | 276,882 | | | $ | 923,422 | |
30
PHAEACIAN FUNDS
NOTES TO FINANCIAL STATEMENTS (Continued)
March 31, 2022
As of March 31, 2022, the Funds had no short-term capital or long-term capital loss carryforwards.
NOTE 6 — Advisory Fees and Other Affiliated Transactions
Pursuant to an Investment Management Agreement (the “Management Agreement”) approved by the Board on July 2, 2020, advisory fees were paid by the Funds to Phaeacian Partners, LLC (the “Adviser”). Under the terms of this Management Agreement, the Funds pay the Adviser a monthly fee calculated at the annual rate of 1.00% of each Fund’s average daily net assets. The Adviser has contractually agreed to waive advisory fees expenses and reimburse other expenses to the extent total annual fund operating expenses (exclusive of brokerage costs, interest, taxes, dividends, litigation and indemnification expenses and expenses associated with the investments in underlying investment companies) exceed 1.29% of the average daily net assets of each fund through October 31, 2023. Amounts waived or reimbursed in a particular contractual period may be recouped by the Adviser for 36 months following the waiver or reimbursement, however, such recoupment will be limited to the lesser of any expense limitation in place at the time of recoupment or the expense limitation in place at the time of waiver or reimbursement. This agreement may only be terminated earlier by the Funds’ Board or upon termination of the Advisory Agreement.
Foreside Financial Services, LLC (the “Distributor”), provides distribution services to the Funds pursuant to a distribution agreement with the Trust, on behalf of the Funds. Under its agreement with the Trust, the Distributor acts as an agent of the Trust in connection with the offering of the shares of the Funds on a continuous basis. No compensation is payable by the Trust to the Distributor for such distribution services. The Adviser, at its own expense, pays the Distributor an annual fee in consideration for certain distribution related services.
The Northern Trust Company (the “Administrator”) serves as the administrator, transfer agent, custodian and fund accounting agent for the Funds pursuant to written agreements with the Trust on behalf of the Funds. The Funds have agreed to pay the Administrator a tiered basis-point fee based on each Fund’s net assets and certain per account and transaction charges. The total fee is subject to a minimum annual fee of $150,000 relating to these services, and reimbursement for certain expenses incurred on behalf of the Funds, as well as other charges for additional service activities. The total fees paid to the Administrator for the year ended March 31, 2022 are disclosed on the Statement of Operations in the accounts disclosed below:
| | | | | | | | | | | | |
| | | For the year ended March 31, 2022 | |
| | | Transfer Agent
Fees and
Expenses | | | Custodian Fees | | | Fund Accounting and
Administrative Services
and Fees | |
Phaeacian Accent International Value Fund | | $ | 109,451 | | | $ | 110,312 | | | $ | 314,596 | |
Phaeacian Global Value Fund | | | 53,885 | | | | 41,377 | | | | 153,321 | |
31
PHAEACIAN FUNDS
NOTES TO FINANCIAL STATEMENTS (Continued)
March 31, 2022
Foreside Fund Officer Services, LLC (“Foreside”) provides compliance and financial control services for the Funds pursuant to a written agreement with the Trust, on behalf of the Funds, including providing certain officers to the Funds. The Funds have agreed to pay Foreside an annual base fee, a basis-point fee based on each Fund’s daily net assets and has agreed to reimburse Foreside for certain expenses incurred on behalf of the Funds. Total fees paid to Foreside pursuant to this agreement are reflected as “Regulatory and Compliance fees” on the Statement of Operations.
Certain officers and Trustees of the Trust are affiliated with Foreside, the Administrator, or the Distributor and receive no compensation directly from the Funds for serving in their respective roles. For the year ended March 31, 2022 the Phaeacian Accent International Value Fund and the Phaeacian Global Value Fund paid $94,666 and $34,341, respectively in Trustee compensation and reimbursement of out-of-pocket expenses allocated from the Trust to the Funds, which is reflected as “Trustee fees and expenses” on the Statement of Operations.
NOTE 7 — Disclosure of Fair Value Measurements
The Funds use the following methods and inputs to establish the fair value of its assets and liabilities. Use of particular methods and inputs may vary over time based on availability and relevance as market and economic conditions evolve.
Equity securities are generally valued each day at the official closing price of, or the last reported sale price on, the exchange or market on which such securities principally are traded, as of the close of business on that day. If there have been no sales that day, equity securities are generally valued at the last available bid price. Securities that are unlisted and fixed-income and convertible securities listed on a national securities exchange for which the over-the-counter (“OTC”) market more accurately reflects the securities’ value in the judgment of each Fund’s officers, are valued at the most recent bid price. Events occurring after the close of trading on non- U.S. exchanges may result in adjustments to the valuation of foreign securities to reflect their fair value as of the close of regular trading on the NYSE. The Funds may utilize an independent fair valuation service in adjusting the valuations of foreign securities. Currency forwards are valued at the closing currency exchange rate which is not materially different from the forward rate. Short-term corporate notes with maturities of 60 days or less at the time of purchase are valued at amortized cost.
Securities for which representative market quotations are not readily available or are considered unreliable by the Adviser are valued as determined in good faith under procedures adopted by the authority of each Fund’s Board of Trustees. Various inputs may be reviewed in order to make a good faith determination of a security’s value. These inputs include, but are not limited to, the type and cost of the security; contractual or legal restrictions on resale of the security; relevant financial or business developments of the issuer; actively traded similar or related securities; conversion or exchange rights on the security; related corporate actions; significant events occurring after the close of trading in the security; and changes in overall market conditions. Fair valuations and valuations of investments that are not actively trading involve judgment and may differ materially from valuations of investments that would have been used had greater market activity occurred.
32
PHAEACIAN FUNDS
NOTES TO FINANCIAL STATEMENTS (Continued)
March 31, 2022
The Funds classify their assets based on three valuation methodologies. Level 1 values are based on quoted market prices in active markets for identical assets. Level 2 values are based on significant observable market inputs, such as quoted prices for similar assets and quoted prices in inactive markets or other market observable inputs as noted above including spreads, cash flows, financial performance, prepayments, defaults, collateral, credit enhancements, and interest rate volatility. Level 3 values are based on significant unobservable inputs that reflect each Fund’s determination of assumptions that market participants might reasonably use in valuing the assets. The valuation levels are not necessarily an indication of the risk associated with investing in those securities.
The following tables presents the valuation levels of each Fund’s investments as of March 31, 2022:
| | | | | | | | | | | | | | | | |
| | | Level 1 | | | Level 2 | | | Level 3 | | | Total | |
Investments | | | | | | | | | | | | | | | | |
Phaeacian Accent International Value Fund | | | | | | | | | | | | | | | | |
Common stocks: | | | | | | | | | | | | | | | | |
Commercial Services & Supplies | | $ | 6,130,917 | | | $ | 7,466,687 | | | $ | — | | | $ | 13,597,604 | |
Diversified Financial Services | | | — | | | | — | | | | — | | | | — | |
Electrical Equipment | | | 7,820,069 | | | | — | | | | — | | | | 7,820,069 | |
Food & Staples Retailing | | | 6,306,732 | | | | — | | | | — | | | | 6,306,732 | |
Food Products | | | 8,767,962 | | | | 6,232,792 | | | | — | | | | 15,000,754 | |
Insurance | | | 8,376,302 | | | | — | | | | — | | | | 8,376,302 | |
IT Services | | | 10,485,154 | | | | 52,775,418 | | | | — | | | | 63,260,572 | |
Professional Services | | | 5,538,137 | | | | 21,747,456 | | | | — | | | | 27,285,593 | |
Semiconductor Manufacturing | | | 6,372,058 | | | | — | | | | — | | | | 6,372,058 | |
Other(1) | | | — | | | | 164,109,216 | | | | — | | | | 164,109,216 | |
Total common stocks | | $ | 59,797,331 | | | $ | 252,331,569 | | | $ | — | | | $ | 312,128,900 | |
Total Investments | | $ | 59,797,331 | | | $ | 252,331,569 | | | $ | — | | | $ | 312,128,900 | |
Phaeacian Global Value Fund | | | | | | | | | | | | | | | | |
Common stocks: | | | | | | | | | | | | | | | | |
Aerospace & Defense | | | 2,554,338 | | | | 5,639,964 | | | | — | | | | 8,194,302 | |
Application Software | | | 7,794,674 | | | | 2,185,310 | | | | — | | | | 9,979,984 | |
Beverages | | | 1,773,318 | | | | — | | | | — | | | | 1,773,318 | |
Electrical Equipment | | | 2,846,278 | | | | — | | | | — | | | | 2,846,278 | |
Entertainment | | | 1,450,396 | | | | 4,421,616 | | | | — | | | | 5,872,012 | |
Food & Staples Retailing | | | 1,448,183 | | | | — | | | | — | | | | 1,448,183 | |
Food Products | | | 3,524,390 | | | | 2,044,654 | | | | — | | | | 5,569,044 | |
Health Care Providers & Services | | | 2,874,685 | | | | — | | | | — | | | | 2,874,685 | |
Insurance | | | 2,868,080 | | | | — | | | | — | | | | 2,868,080 | |
Interactive Media & Services | | | 4,546,988 | | | | 3,145,045 | | | | — | | | | 7,692,033 | |
33
PHAEACIAN FUNDS
NOTES TO FINANCIAL STATEMENTS (Continued)
March 31, 2022
| | | | | | | | | | | | | | | | |
| | | Level 1 | | | Level 2 | | | Level 3 | | | Total | |
Investments | | | | | | | | | | | | | | | | |
IT Services | | $ | 4,010,172 | | | $ | 17,436,001 | | | $ | — | | | $ | 21,446,173 | |
Multiline Retail | | | 3,365,052 | | | | — | | | | — | | | | 3,365,052 | |
Professional Services | | | 4,045,596 | | | | 2,979,024 | | | | — | | | | 7,024,620 | |
Semiconductor Manufacturing | | | 1,916,924 | | | | 1,611,083 | | | | — | | | | 3,528,007 | |
Specialty Retail | | | 2,891,216 | | | | 4,627,225 | | | | — | | | | 7,518,441 | |
Other(1) | | | — | | | | 52,983,658 | | | | — | | | | 52,983,658 | |
| | | | | | | | | | | | | | | | |
Total common stocks | | $ | 47,910,290 | | | $ | 97,073,580 | | | $ | — | | | $ | 144,983,870 | |
| | | | | | | | | | | | | | | | |
Total Investments | | $ | 47,910,290 | | | $ | 97,073,580 | | | $ | — | | | $ | 144,983,870 | |
| | | | | | | | | | | | | | | | |
| (1) | See additional categories in the portfolios of investments. |
As of March 31, 2022 there were no Level 3 securities held by the Funds. There were no transfers to or from Level 3 during the year ended March 31, 2022.
Forward foreign currency contracts are agreements to exchange one currency for another at a future date and at a specified price. Each Fund’s transactions in forward foreign currency contracts are limited to transaction and portfolio hedging. The contractual amounts of forward foreign currency contracts do not necessarily represent the amounts potentially subject to risk. The measurement of the risks associated with these instruments is meaningful only when all related and offsetting transactions are considered and could exceed the net unrealized value shown in the tables below. Risks arise from the possible inability of counterparties to meet the terms of their contracts and from movements in currency values. Forward foreign currency contracts are valued daily at the foreign exchange rates as of the close of the New York Stock Exchange. Unrealized appreciation or depreciation on the contracts as measured by the difference between the forward foreign exchange rates at the dates of entry into the contracts and the foreign exchange rates at the end of the period, if any, is included in the Statement of Assets and Liabilities under the caption “Forward Foreign Currency Contracts.” Realized gains and losses and the net change in unrealized appreciation (depreciation) on forward foreign currency contracts for the year, if any, are included in the Statement of Operations under the caption “Forward Foreign Currency Contracts.” As of March 31, 2022, the Funds had no open forward foreign currency contracts.
NOTE 8 — Line of Credit
The Trust, on behalf of the Phaeacian Funds, and the Administrator, entered into a $50 million Uncommitted and On Demand Overdraft Facility Agreement (“Credit Agreement”) for liquidity and other purposes effective March 10, 2021. Any advance under the Credit Agreement will accrue interest at a rate per annum equivalent to the sum of the U.S. Federal Fund Target Rate plus 1.25% per annum.
34
PHAEACIAN FUNDS
NOTES TO FINANCIAL STATEMENTS (Continued)
March 31, 2022
For the year ended March 31, 2022, the Phaeacian Global Value Fund had borrowings with the average loan and weighted interest rate as disclosed below:
| | | | | | | | | | | | |
| | | Dollar Amount | | | Days Outstanding | | | Interest Rate | |
Phaeacian Global Value Fund | | $ | 1,246,128 | | | | 94 | | | | 1.50 | % |
NOTE 9 — Collateral Requirements
For derivatives traded under an International Swaps and Derivatives Association, Inc. Master Agreement (“ISDA Master Agreement”), the collateral requirements are typically calculated by netting the mark to market amount for each transaction under such agreement and comparing that amount to the value of any collateral currently pledged by a fund and the counterparty. Cash collateral that has been pledged to cover obligations of a fund and cash collateral received from the counterparty, if any, is reported separately on the Statement of Assets and Liabilities as cash pledged as collateral and cash received as collateral, respectively. Non-cash collateral pledged by a fund, if any, is noted in the Portfolios of Investments. Typically, the Funds and counterparties are not permitted to sell, repledge or use the collateral they receive. To the extent amounts due to the Funds from its counterparties are not fully collateralized, contractually or otherwise, the Funds bear the risk of loss from counterparty non-performance. The Funds attempt to mitigate counterparty risk by entering into agreements only with counterparties that it believes have the financial resources to honor their obligations and by monitoring the financial stability of those counterparties.
For financial reporting purposes, the Funds do not offset derivative assets and derivative liabilities that are subject to netting arrangements in the Statement of Assets and Liabilities.
FASB ASU No. 2011-11, Disclosures about Offsetting Assets and Liabilities, requires disclosures to make financial statements that are prepared under U.S. GAAP more comparable to those prepared under International Financial Reporting Standards. Under this guidance the Funds disclose both gross and net information about instruments and transactions eligible for offset such as instruments and transactions subject to an agreement similar to a master netting arrangement. In addition, the Funds disclose collateral received and posted in connection with master netting agreements or similar arrangements. There were no derivatives that required offsetting disclosure at March 31, 2022.
NOTE 10 — Subsequent Events
Management has evaluated subsequent events for the Funds occurring after March 31, 2022 through the date this report was issued and concluded that no subsequent events occurred which require recognition or disclosure, other than disclosed below.
On April 11, 2022, the Board of Trustees of the Trust approved the liquidation of the Phaeacian Accent International Value Fund and the Phaeacian Global Value Fund. Such liquidations are expected to take place on or about May 26, 2022.
35
| | |
| | Deloitte & Touche LLP 111 S Wacker Drive Chicago, IL 60606 USA Tel: +1 312 486 1890 Fax: +1 312 247 1890 www.deloitte.com |
REPORT OF INDEPENDENT REGISTERED PUBLIC ACCOUNTING FIRM
To the Shareholders and Board of Trustees of Datum One Series Trust:
Opinion on the Financial Statements and Financial Highlights
We have audited the accompanying statements of assets and liabilities, including the portfolios of investments, of Phaeacian Accent International Value Fund and Phaeacian Global Value Fund, two separate series of Datum One Series Trust, (collectively, the “Funds”), as of March 31, 2022, the related statements of operations, the statements of changes in net assets, and the financial highlights for the periods indicated in the table below, and the related notes. In our opinion, the financial statements and financial highlights present fairly, in all material respects, the financial position of each of the Funds and the results of their operations, the changes in their net assets, and the financial highlights for periods listed in table below, in conformity with accounting principles generally accepted in the United States of America. For the Phaeacian Accent International Value Fund, its financial highlights for each of the three years in the period ended December 31, 2019, were audited by other auditors whose report dated February 26, 2020, expressed an unqualified opinion on those financial highlights. For the Phaeacian Global Value Fund, its financial highlights for each of the four years in the period ended September 30, 2020, were audited by other auditors whose report dated November 24, 2020, expressed an unqualified opinion on those financial highlights.
| | | | | | |
Fund Name | | Statement of
Operations | | Statements of Changes in
Net Assets | | Financial Highlights |
| Phaeacian Accent International Value Fund | | For the year ended March 31, 2022 | | For the year ended March 31, 2022, three months ended March 31, 2021, and the year ended December 31, 2020 | | For the year ended March 31, 2022, three months ended March 31, 2021, and the year ended December 31, 2020 |
| | | |
| Phaeacian Global Value Fund | | For the year ended March 31, 2022 | | For the year ended March 31, 2022, and the six months ended March 31, 2021 | | For the year ended March 31, 2022, and the six months ended March 31, 2021 |
Basis for Opinion
These financial statements and financial highlights are the responsibility of the Funds’ management. Our responsibility is to express an opinion on the Funds’ financial statements and financial highlights based on our audits. We are a public accounting firm registered with the Public Company Accounting Oversight Board (United States) (PCAOB) and are required to be independent with respect to the Funds in accordance with the U.S. federal securities laws and the applicable rules and regulations of the Securities and Exchange Commission and the PCAOB.
36
We conducted our audits in accordance with the standards of the PCAOB. Those standards require that we plan and perform the audit to obtain reasonable assurance about whether the financial statements and financial highlights are free of material misstatement, whether due to error or fraud. The Funds are not required to have, nor were we engaged to perform, an audit of their internal control over financial reporting. As part of our audits, we are required to obtain an understanding of internal control over financial reporting but not for the purpose of expressing an opinion on the effectiveness of the Funds’ internal control over financial reporting. Accordingly, we express no such opinion.
Our audits included performing procedures to assess the risks of material misstatement of the financial statements and financial highlights, whether due to error or fraud, and performing procedures that respond to those risks. Such procedures included examining, on a test basis, evidence regarding the amounts and disclosures in the financial statements and financial highlights. Our audits also included evaluating the accounting principles used and significant estimates made by management, as well as evaluating the overall presentation of the financial statements and financial highlights. Our procedures included confirmation of securities owned as of March 31, 2022, by correspondence with the custodian and brokers; when replies were not received from brokers, we performed other auditing procedures. We believe that our audits provide a reasonable basis for our opinion.
May 24, 2022
We have served as the auditor of one or more Phaeacian Partners LLC investment companies since 2020.
37
PHAEACIAN FUNDS
ADDITIONAL INFORMATION
March 31, 2022 (Unaudited)
A. Board Review of Liquidity Risk Management Program
The Trust has adopted a liquidity risk management program (the “LRMP”) pursuant to Rule 22e-4 under the Investment Company Act of 1940, as amended (the “1940 Act”). The LRMP’s principal objectives are to support the Funds’ compliance with limits on investments in illiquid assets and to mitigate the risk that a Fund is unable to meet its redemption obligations in a timely manner. In this regard, the LRMP includes a number of elements that support the assessment or management of liquidity risk, including an assessment of factors that influence a Fund’s liquidity and the periodic classification and, as determined necessary, re-classification of a Fund’s investments into buckets that reflect their relative liquidity under current market conditions. The Trust’s Board of Trustees approved Polar Capital LLP’s LRMP and the designation of Polar Capital LLP’s Group Risk Committee as the administrator of the LRMP for the Adviser on July 2, 2020. The Trust’s Board approved the LRMP of the Trust and the designation of the Trust’s President and Chief Compliance Officer as the administrator of the LRMP for the Trust at its meeting on March 3, 2020. Pursuant to the LRMPs, the Adviser manages liquidity risks associated with the Fund’s investments by monitoring cash and cash equivalents and the concentration of investments, and by classifying the portfolio holdings of the Fund as either highly liquid, moderately liquid, less liquid or illiquid on at least a monthly basis.
At the Board’s regular meeting on November 30, 2021, the Board reviewed a written report from the administrator of each LRMP on the operation and effectiveness of the LRMPs for the period from October 16, 2020 through September 30, 2021 (the “Reporting Period”), noting that each of the Trust’s and the Adviser’s LRMP was adequate and effectively implemented during the Reporting Period. The LRMPs supported each Fund’s ability to honor redemption requests timely and the Adviser’s management of each Fund’s liquidity risk profile, including during any periods of market volatility and net redemptions during the Reporting Period.
B. Shareholder Expense Example
Fund Expenses
Investors in the Fund generally incur two types of costs: (1) transaction costs, and (2) ongoing costs, including advisory and administrative fees; shareholder service fees; and other Fund expenses. The Example is intended to help you understand your ongoing costs (in dollars) of investing in the Funds and to compare these costs with the ongoing costs of investing in other mutual funds. The Example is based on an investment of $1,000 invested at the beginning of the period and held for the entire period.
Actual Expenses
The information in the table under the heading “Actual Performance” provides information about actual account values and actual expenses. You may use the information in this column, together with the amount you invested, to estimate the expenses that you paid over the period. Simply divide your account value by $1,000 (for example, an $8,600 account value divided by $1,000 = 8.6), then multiply the result by the first number in the column entitled “Expenses Paid During Period” that corresponds to your Fund to estimate the expenses you paid on your account during this period.
38
PHAEACIAN FUNDS
ADDITIONAL INFORMATION (Continued)
March 31, 2022 (Unaudited)
Hypothetical Example for Comparison Purposes
The information in the table under the heading “Hypothetical Performance (5% return before expenses)” provides information about hypothetical account values and hypothetical expenses based on each Fund’s actual expense ratio and an assumed rate of return of 5% per year before expenses, which is not each Fund’s actual return. The hypothetical account values and expenses may not be used to estimate the actual ending account balance or expenses you paid for the period. You may use this information to compare the ongoing costs of investing in the Funds and other funds. To do so, compare this 5% hypothetical example with the 5% hypothetical examples that appear in the shareholder reports of other funds.
Please note that the expenses shown in the table are meant to highlight your ongoing costs only and do not reflect any transactional costs. Therefore, the information under the heading “Hypothetical Performance (5% return before expenses)” is useful in comparing ongoing costs only, and will not help you determine the relative total costs of owning different funds. In addition, if these transactional costs were included, your costs would have been higher. Even though the Funds do not charge transaction fees, if you purchase shares through a broker, the broker may charge you a fee. You should evaluate other mutual funds’ transaction fees and any applicable broker fees to assess the total cost of ownership for comparison purposes.
| | | | | | | | | | | | |
Actual Performance | | | | | | | | | |
Fund | | Beginning Account Value
October 1, 2021 | | | Ending Account Value
March 31, 2022 | | | Expenses Paid During
Period | |
Phaeacian Accent
International
Value Fund* | | $ | 1,000.00 | | | $ | 910.70 | | | $ | 5.81 | |
Phaeacian Global
Value Fund* | | $ | 1,000.00 | | | $ | 896.30 | | | $ | 5.67 | |
| | | | | | | | | | | | |
| | | |
Hypothetical Performance
(5% return before expenses) | | | | | | | | | |
Fund | | Beginning Account Value
October 1, 2021 | | | Ending Account Value
March 31, 2022 | | | Expenses Paid During
Period | |
Phaeacian Accent
International
Value Fund* | | $ | 1,000.00 | | | $ | 1,018.85 | | | $ | 6.14 | |
Phaeacian Global
Value Fund* | | $ | 1,000.00 | | | $ | 1,018.95 | | | $ | 6.04 | |
| * | Expenses are calculated for the Phaeacian Accent International Value Fund and the Phaeacian Global Value Fund using annualized expense ratios 1.22% and 1.20%, respectively, multiplied by the average account value for the period, multiplied by the actual number of operational days in the most recent half fiscal year (182), and divided by the number of days in the current year (365). |
39
PHAEACIAN FUNDS
ADDITIONAL INFORMATION (Continued)
March 31, 2022 (Unaudited)
C. Other Information
A description of the policies and procedures that the Funds use to determine how to vote proxies relating to portfolio securities is available (i) without charge, upon request, by writing to the Funds at Phaeacian Funds c/o The Northern Trust Company, P.O. Box 4766, Chicago, IL 60680-4766 or by calling (800) 258-9668 (toll free) or (312) 557-3523; and (ii) on the U.S. Securities and Exchange Commission’s (the “SEC”) website at www.sec.gov.
Information regarding how the Funds voted proxies relating to portfolio securities during the most recent 12-month period ended June 30 is available (i) without charge, by calling the Funds at (800) 982-4372 (toll free); and (ii) on the SEC’s website at www.sec.gov.
The Funds file their complete schedule of portfolio holdings with the SEC for the first and third quarters of each fiscal year as an exhibit to their reports on Form N-PORT. Each Fund’s Form N-PORT reports are available on the SEC’s website at www.sec.gov. The information on Form N-PORT is also available to shareholders upon written request or by calling the Funds at (800) 258-9668 (toll free) or (312) 557-3523.
D. Trustees and Officers
Independent Trustees
The following table sets forth certain information concerning the Independent Trustees of the Trust:
| | | | | | | | | | |
Name, Address*
and Year of Birth
of Independent
Trustee | | Positions(s)
Held with
Trust | | Term of
Office
and Length
of Time
Served | | Principal Occupation(s) During Past 5 Years | | Number of
Portfolios in
Fund
Complex
Overseen by
Trustee | | Other Directorships Held by Trustee During the
Past 5 Years |
JoAnn S. Lilek Year of Birth: 1956 | | Trustee | | Indefinite/ March 2020 to present | | Advisory Board Member, Milton’s Distributing, 2019 to present; Advisory Board Member, Gordon Logistics, 2019 to present; Independent Contractor 2018 to present; Chief Financial Officer, Accretive Solutions, Inc, 2010 to 2018; Chief Operating Officer, Accretive Solutions, Inc, 2016 to 2018. | | 3 | | Amalgamated Financial Corporation and Amalgamated Bank, 2021 to present. |
| | | | | |
| Patricia A Weiland Year of Birth: 1959 | | Trustee | | Indefinite/ March 2020 to present | | Consultant, PAW Consulting LLC, 2014 to present. | | 3 | | None |
| | | | | |
| Lloyd A. Wennlund Year of Birth: 1957 | | Trustee | | Indefinite/ March 2020 to present | | Independent Contractor, June 2017 to present; Executive Vice President, The Northern Trust Company, 1989 to 2017. | | 3 | | Calamos Funds (18 Funds), 2018 to present. |
| * | Each Trustee may be contacted at 50 South LaSalle Street, Chicago, Illinois 60603. |
40
PHAEACIAN FUNDS
ADDITIONAL INFORMATION (Continued)
March 31, 2022 (Unaudited)
Interested Trustees
The following table sets forth certain information concerning the Trustees who are “interested persons” (as defined in the 1940 Act) of the Trust:
| | | | | | | | | | |
Name, Address*
and Year of Birth
of Independent
Trustee | | Positions(s)
Held with
Trust | | Term of
Office
and Length
of Time
Served | | Principal Occupation(s) During Past 5 Years | | Number of
Portfolios in
Fund
Complex
Overseen by
Trustee | | Other Directorships Held by Trustee During the
Past 5 Years |
Ryan D. Burns Year of Birth: 19761 | | Trustee | | Indefinite/ March 2020 to present | | Senior Vice President, The Northern Trust Company, 1998 to present. | | 3 | | None |
| | | | | |
| David M. Whitaker Year of Birth: 19712 | | Trustee | | Indefinite/ March 2020 to present | | President, Foreside Financial Group, 2007 to present. | | 3 | | None |
| * | Each Trustee may be contacted at 50 South LaSalle Street, Chicago, Illinois 60603. |
| (1) | Mr. Burns may be deemed to be an “interested” person of the Trust, as that term is defined in the 1940 Act, by virtue of his affiliation with the Fund’s Administrator and Fund Accounting Agent, Transfer Agent, and Custodian. |
| (2) | Mr. Whitaker may be deemed to be an “interested” person of the Trust, as that term is defined in the 1940 Act, by virtue of his affiliation with the Fund’s Distributor. |
The Statement of Additional Information includes additional information about Fund Trustees and is available, without charge, upon request, by calling (800) 258-9668 (toll free) or (312) 557-3523.
Officers
The following table sets forth certain information concerning the Trust’s officers. The officers of the Trust are employees of the Trust’s Administrator or Distributor and certain of their affiliates:
| | | | | | |
Name, Address and
Year of
Birth of Officer | | Positions(s)
Held with Trust | | Term of
Office and Length of Time Served | | Principal Occupation(s) During Past 5 Years |
| Barbara J. Nelligan Year of Birth: 1969 | | President | | Indefinite/ March 2020 to present | | Senior Vice President, Global Fund Services Fund Governance Solutions, The Northern Trust Company, 2018 to Present; Senior Vice President, Global Fund Services Product Management, The Northern Trust Company, 2007 to 2018; Vice President of Advisers Investment Trust 2012 to 2017. |
| | | |
| Jack P. Huntington Year of Birth: 1970 | | Chief Compliance Officer and AML Officer | | Indefinite/ March 2020 to present | | Director, Foreside Fund Officer Services, LLC, 2015 to present; Senior Vice President, Citi Fund Services, 2008 to 2015. |
| | | |
| Tracy L. Dotolo Year of Birth: 1976 | | Treasurer | | Indefinite/ March 2020 to present | | Senior Director, Foreside Fund Officer Services, LLC, 2016 to present. |
| | | |
| Toni M. Bugni Year of Birth: 1973 | | Secretary | | Indefinite/ March 2020 to present | | Senior Vice President, Global Fund Services Fund Governance Solutions, The Northern Trust Company 2011 to present. 41 |
41
PHAEACIAN FUNDS
ADDITIONAL INFORMATION (Continued)
March 31, 2022 (Unaudited)
| | | | | | |
Name, Address and
Year of
Birth of Officer | | Positions(s)
Held with Trust | | Term of
Office
and Length
of Time
Served | | Principal Occupation(s) During Past 5 Years |
| Matthew J. Broucek Year of Birth: 1988 | | Assistant Secretary | | Indefinite/ March 2020 to present | | Vice President, Global Fund Services Fund Governance Solutions, The Northern Trust Company 2020 to present; Second Vice President, Global Fund Services Fund Governance Solutions, The Northern Trust Company 2018 to 2020; Officer, Global Fund Services Fund Governance Solutions, The Northern Trust Company 2016 to 2018; Associate, RSM US LLP, 2015 to 2016. |
42
PHAEACIAN FUNDS
PRIVACY POLICY
(Unaudited)
SAFEGUARDING PRIVACY
We recognize and respect the privacy expectations of each of our investors and we believe the confidentiality and protection of investor information is one of our fundamental responsibilities. New technologies have dramatically changed the way information is gathered and used, but our continuing commitment to preserving the security and confidentiality of investor information has remained a core value of the Datum One Series Trust.
INFORMATION WE COLLECT AND SOURCES OF INFORMATION
We may collect information about our customers to help identify you, evaluate your application, service and manage your account and offer services and products you may find valuable. We collect this information from a variety of sources including:
| | • | | Information we receive from you on applications or other forms (e.g. your name, address, date of birth, social security number and investment information); about a customer’s investment goals and risk tolerance; |
| | • | | Information about your transactions and experiences with us and our affiliates (e.g. your account balance, transaction history and investment selections); and |
| | • | | Information we obtain from third parties regarding their brokerage, investment advisory, custodial or other relationship with you (e.g. your account number, account balance and transaction history. |
INFORMATION WE SHARE WITH SERVICE PROVIDERS
We may disclose all non-public personal information we collect, as described above, to companies (including affiliates) that perform services on our behalf, including those that assist us in responding to inquiries, processing transactions, preparing and mailing account statements and other forms of shareholder services provided they use the information solely for these purposes and they enter into confidentiality agreements regarding the information.
INFORMATION WE MAY SHARE WITH AFFILIATES
If we have affiliates which are financial service providers that offer investment advisory, brokerage and other financial services, we may (subject to Board approval) share information among our affiliates to better assist you in achieving your financial goals.
SAFEGUARDING CUSTOMER INFORMATION
We will safeguard, according to federal standards of security and confidentiality, any non-public personal information our customers share with us.
We will limit the collection and use of non-public customer information to the minimum necessary to deliver superior service to our customers which includes advising our customers about our products and services and to administer our business.
We will permit only authorized employees who are trained in the proper handling of non-public customer information to have access to that information.
We will not reveal non-public customer information to any external organization unless we have previously informed the customer in disclosures or agreements, have been authorized by the customer or are required by law or our regulators.
43
PHAEACIAN FUNDS
PRIVACY POLICY (Continued)
(Unaudited)
We value you as a customer and take your personal privacy seriously. We will inform you of our policies for collecting, using, securing and sharing nonpublic personal information the first time we do business and every year that you are a customer of the Datum One Series Trust or anytime we make a material change to our privacy policy.
44
Investment Adviser
Phaeacian Partners LLC
880 Apollo Street
Suite 222
El Segundo, California 90245
Custodian
The Northern Trust Company
50 South LaSalle Street
Chicago, Illinois 60603
Independent Registered Public Accounting Firm
Deloitte & Touche LLP
111 South Wacker Drive
Chicago, Illinois 60606-4301
Legal Counsel
Ropes & Gray LLP
800 Boylston Street
Boston, Massachusetts 02199
Distributor
Foreside Financial Services, LLC
3 Canal Plaza, Suite 100
Portland, Maine 04101
For Additional Information, call
(800) 258-9668 (toll free) or 312-557-3523
(b) Not applicable.
Item 2. Code of Ethics.
As of March 31, 2022, the registrant had adopted a “code of ethics” (as such term is defined in Item 2 of Form N-CSR) that applies to the registrant’s principal executive officer and principal financial officer. This code is filed as Exhibit 13(a)(1) hereto. There were no substantive amendments or waivers to the code of ethics during the period covered by this report.
Item 3. Audit Committee Financial Expert.
The registrant’s Board of Trustees has determined the registrant has at least one “audit committee financial expert” (as such term is defined in Item 3 of Form N-CSR) serving on its Audit Committee. The “audit committee financial expert” is JoAnn Lilek, who is “independent” for purposes of this Item 3 of Form N-CSR.
Item 4. Principal Accountant Fees and Services.
Polar Capital Emerging Market Stars Fund
2022: $27,500
2021: $35,000
Phaeacian Funds
2022: $55,000
2021: $63,000
The fees paid to Deloitte & Touche LLP relate to the audit of the registrant’s annual financial statements and letters for the filings of the registrant’s Form N-CEN and Form N-1A.
Polar Capital Emerging Market Stars Fund
2022: $0
2021: $0
Phaeacian Funds
2022: $0
2021: $0
Polar Capital Emerging Market Stars Fund
2022: $4,000
2021: $0
Phaeacian Funds
2022: $8,000
2021: $0
The fees to Deloitte & Touche LLP relate to the preparation of the registrant’s tax returns and review of annual distributions.
Polar Capital Emerging Market Stars Fund
2022: $0
2021: $0
Phaeacian Funds
2022: $0
2021: $0
(e)(1) Except as permitted by rule 2-01(c)(7)(i)(C) of regulation S-X the registrant’s audit committee must pre-approve all audit and non-audit services provided by the independent accountants relating to the operations or financial reporting of the registrant. Prior to the commencement of any audit or non-audit services to the registrant, the audit committee reviews the services to determine whether they are appropriate and permissible under applicable law.
(e)(2) Polar Capital Emerging Market Stars Fund
2022: 0%
2021: 0%
Phaeacian Funds
2022: 0%
2021: 0%
(f) Not applicable.
| (g) | Polar Capital Emerging Market Stars Fund |
2022: $0
2021: $0
Phaeacian Funds
2022: $0
2021: $0
(h) The Audit Committee considered the non-audit services rendered to the registrant’s investment adviser and believes the services are compatible with the principal accountant’s independence.
(i) The registrant has not been identified by the U.S. Securities and Exchange Commission as having filed an annual report issued by a registered public accounting firm branch or office that is located in a foreign jurisdiction where the Public Company Accounting Oversight Board is unable to inspect or completely investigate because of a position taken by an authority in that jurisdiction.
(j) The registrant is not a foreign issuer.
Item 5. Audit Committee of Listed Registrants.
Not applicable.
Item 6. Investments.
| (a) | The Schedule of Investments in securities of unaffiliated issuers is included in the report to shareholders filed under Item 1 of this Form. |
Item 7. Disclosure of Proxy Voting Policies and Procedures for Closed-End Management Investment Companies.
Not applicable.
Item 8. Portfolio Managers of Closed-End Management Investment Companies.
Not applicable.
Item 9. Purchases of Equity Securities by Closed-End Management Investment Company and Affiliated Purchasers.
Not applicable.
Item 10. Submission of Matters to a Vote of Security Holders.
Not applicable.
Item 11. Controls and Procedures.
(a) The registrant’s principal executive officer and principal financial officer have concluded, based on their evaluation of the registrant’s disclosure controls and
procedures as conducted within 90 days of the filing date of this report, that these disclosure controls and procedures are adequately designed and are operating effectively to ensure that information required to be disclosed by the registrant on Form N-CSR is recorded, processed, summarized and reported within the time periods specified in the Securities and Exchange Commission’s rules and forms.
(b) There were no changes in the registrant’s internal control over financial reporting (as defined in Rule 30a-3(d) under the Investment Company Act of 1940) that occurred during the period covered by this report that have materially affected or are reasonably likely to materially affect, the registrant’s internal control over financial reporting.
Item 12. Disclosure of Securities Lending Activities for Closed-End Management Investment Companies.
Not applicable.
Item 13. Exhibits.
SIGNATURES
Pursuant to the requirements of the Securities Exchange Act of 1934 and the Investment Company Act of 1940, the registrant has duly caused this report to be signed on its behalf by the undersigned, thereunto duly authorized.
Datum One Series Trust
| | |
| By: | | /s/ Tracy L. Dotolo |
| | Tracy L. Dotolo |
| | Treasurer and Principal Financial Officer |
| |
| Date: | | June 3, 2022 |
Pursuant to the requirements of the Securities Exchange Act of 1934 and the Investment Company Act of 1940, this report has been signed below by the following persons on behalf of the registrant and in the capacities and on the dates indicated.
| | |
| By: | | /s/ Barbara J. Nelligan |
| | Barbara J. Nelligan |
| | President and Principal Executive Officer |
| |
| Date: | | June 3, 2022 |
| |
| By: | | /s/ Tracy L. Dotolo |
| | Tracy L. Dotolo |
| | Treasurer and Principal Financial Officer |
| |
| Date: | | June 3, 2022 |