UNITED STATES
SECURITIES AND EXCHANGE COMMISSION
Washington, D.C. 20549
FORM N-CSR
CERTIFIED SHAREHOLDER REPORT OF REGISTERED
MANAGEMENT INVESTMENT COMPANIES
Investment Company Act file number: 811-23556
Datum One Series Trust
(Exact name of registrant as specified in charter)
50 S. LaSalle Street
Chicago, Illinois 60603
(Address of principal executive offices) (Zip code)
The Northern Trust Company
50 S. LaSalle Street
Chicago, Illinois 60603
(Name and address of agent for service)
Registrant’s telephone number, including area code: (866) 494-4270
Date of fiscal year end: March 31
Date of reporting period: March 31, 2024
Form N-CSR is to be used by management investment companies to file reports with the Commission not later than 10 days after the transmission to stockholders of any report that is required to be transmitted to stockholders under Rule 30e-1 under the Investment Company Act of 1940 (17 CFR 270.30e-1). The Commission may use the information provided on Form N-CSR in its regulatory, disclosure review, inspection, and policymaking roles.
A registrant is required to disclose the information specified by Form N-CSR, and the Commission will make this information public. A registrant is not required to respond to the collection of information contained in Form N-CSR unless the Form displays a currently valid Office of Management and Budget (“OMB”) control number. Please direct comments concerning the accuracy of the information collection burden estimate and any suggestions for reducing the burden to Secretary, Securities and Exchange Commission, 450 Fifth Street, NW, Washington, DC 20549-0609. The OMB has reviewed this collection of information under the clearance requirements of 44 U.S.C. § 3507.
Item 1. Reports to Stockholders.
(a) The following are copies of reports transmitted to shareholders pursuant to Rule 30e-1 under the Investment Company Act of 1940 (17 CFR 270.30e-1).

Polar Capital Funds
ANNUAL REPORT
MARCH 31, 2024
The Securities and Exchange Commission (“SEC”) recently adopted a rule requiring mutual funds to produce “concise and visually engaging” annual and semi-annual reports to shareholders. The streamlined format is intended to highlight key information for retail shareholders to permit them to assess and monitor their fund investments. More detailed information that has historically been part of shareholder reports, such as the shareholder letter, financial statements and financial highlights, will not appear in the new streamlined shareholder reports, but will be available free of charge upon request to the Funds or via the Funds’ Form N-CSR filed with the SEC on its EDGAR database. The compliance date for funds to implement streamlined shareholder reports is July 24, 2024; therefore, the Funds will issue their first streamlined shareholder reports beginning with their September 30, 2024 semi-annual report. The new rule requires that each series of a mutual fund issue a separate streamlined shareholder report. For example, if you are a shareholder of both funds you will receive two (2) separate streamlined shareholder reports, one for each fund, upon implementation of the new rule. In addition, the new rule requires that a hard copy of a fund’s streamlined shareholder report be mailed to each shareholder, unless the shareholder elects to receive such reports electronically. If you wish to ‘opt-in’ for electronic delivery of the Funds’ annual and semi-annual shareholder reports, please contact your financial advisor (or for direct shareholders, please contact the Funds at (800) 806-1112 (toll free) or (312) 557-3164 for assistance in enrolling your account in paperless (i.e., electronic) delivery of shareholder materials.
This report is submitted for the general information of the shareholders of the Funds. It is not authorized for distribution to prospective investors unless preceded or accompanied by an effective prospectus.
POLAR CAPITAL FUNDS
TABLE OF CONTENTS
March 31, 2024
POLAR CAPITAL FUNDS
LETTER TO SHAREHOLDERS
Dear Shareholder:
We are pleased to present to shareholders the March 31, 2024 Annual Report for the Polar Capital Emerging Market Stars Fund and the Polar Capital Emerging Market ex-China Stars Fund (together the “Funds” each a “Fund”), each a series of the Datum One Series Trust. This report contains the results of the Funds’ operations for the period ended March 31, 2024.
We appreciate the trust and confidence you have placed in us by choosing the Funds and their Investment Adviser, Polar Capital LLP, and we look forward to continuing to serve your investing needs.
Sincerely,
Alastair Barrie
Managing Director - North America
Polar Capital
1
POLAR CAPITAL EMERGING MARKET STARS FUND
PERFORMANCE COMMENTARY
(Unaudited)
Fund performance
The Polar Capital Emerging Market Stars Fund (the “Fund”) returned 9.63% for the year ending March 31, 2024, compared to 8.15% for its benchmark, the MSCI Emerging Markets Net Total Return Index (the “Index”), for the same period.
Macro background
The past 12 months has continued to be a challenging macroeconomic environment for emerging markets, however many have demonstrated great resilience given the difficult global backdrop of high US inflation and tight Federal Reserve (Fed) monetary policy as well as high geopolitical tensions. Despite these headwinds, we have seen what we believe are green shoots of a recovery that could be the beginning of a stronger structural growth period for many emerging market economies. The Fund, focusing on stock selection, has benefited from these positive trends to deliver good returns during this period.
There is no question that inflation in the US, on the back of extreme expansionary monetary policy, continued reckless – in our view – fiscal policy, the tight US monetary cycle and related strong dollar have created a strong headwind for the majority of emerging markets. It has led to central banks reacting conservatively even though there are few inflation issues in emerging markets (with the exception of small relatively irrelevant countries, from an investment point of view, such as Turkey). They have hiked rates and created an economic environment where most emerging markets are faced with relatively high interest rates hurting both the investment cycle and the credit/consumer cycle. In addition, we believe the whole ‘higher for longer’ narrative around inflation in the US, on top of direct monetary conditions, is creating a higher discount rate as risk aversion is higher.
On the positive side, we are very impressed with how well most emerging market economies have been able to cope with this backdrop, and we strongly believe this is testament to their significantly improved underlying fundamentals over the past 5-6 years.
Looking at countries like India and Indonesia, it is hard to believe it was not that long ago that they were part of the so-called ‘Fragile Five’. We believe this general level of improvement in macro (and corporate) fundamentals over the past five years or so is setting up emerging markets as an asset class very well for the next upcycle, which we feel we are not far away from.
Another negative over the past 12 months has been geopolitical tensions and we see returns from China being the hardest hit, given its weakness is externally related to geopolitics as well as domestic politics and economics. The trade and technology war between China and the US has been edging up over the past 12 months and it is very clear the world will never return to the old US/China relationship. Alongside this is Taiwan, plus China supporting Russia over Ukraine – or at least turning a blind eye to many Chinese companies selling sanctioned products to Russia. We believe this has all resulted in a significant expansion of the equity risk premium in Chinese equities expressed in those listed in Hong Kong where we have seen extreme selling pressure and now have a market on very cheap multiples.
The Fund has a significant underweight in Chinese equities and we are very selective when it comes to stock selection.
2
POLAR CAPITAL EMERGING MARKET STARS FUND
PERFORMANCE COMMENTARY
(Unaudited)
We also believe China’s domestic economic issues have played a significant role in its underperformance over the past 12 months (and before). In our view, much of this comes down to President Xi setting the wrong agendas for an economic recovery, micro-managing regulation of industries and encouraging government-linked companies to kill off private companies. Xi has clearly communicated that national security is the top priority and, in our view, there seems to be an element of paranoia that is discouraging willingness and encouraging risk aversion for businesses to invest. In our view, China is at a crossroads where it has to deal with huge levels of debt, over-capacity in many industries and a property market/asset class at a real risk of deflation. This is all at a time when China needs to export to drive growth but its export engine is at risk due to geopolitics. Therefore, the last thing China needs is an environment where local entrepreneurs are risk averse and are just as eager as foreign investors to take capital out of China. Given the domestic political situation, we see a real risk that large parts of the Chinese economy will face the risk of some form of debt/deflation trap which will be hard to reverse. From an investment point of view, we look for growth pockets within China or in those areas where we believe a risk to exports will be low.
While there has been a great deal of negative noise surrounding emerging markets over the past year, there have also been positive developments, many of which the Fund has participated very well in.
We have been very positive on technology, particularly semiconductors and hardware, which has given us strong exposure to Taiwan and South Korea. This has played out very well for the Fund over this period and the sector and stock selection have been important drivers behind the Fund’s outperformance over the past 12 months. Artificial intelligence (AI) has been one of the key developments for a renewed strong capex (capital expenditure) cycle for semiconductors. Many of the headlines have been written in the US, but the AI evolution and related buildout of data centers is very semiconductor and technology hardware-heavy, which is where Taiwan and South Korea come into the equation. We have seen strong performance here over the past 12 months, but believe we are early in a new technology upcycle and still see many attractive opportunities in both countries as there are plenty of companies with exposure to these growth areas. At the same time, we think valuation levels are still attractive. Given our current forecasts, we expect to keep a large exposure to these areas for now.
Another very positive development for the Fund has been India – even though we are fully aware that many have been saying for a long time that it is popular among investors and expensive – and our stock selection has helped deliver strong absolute and relative returns. We acknowledge the high market valuations in India, but still see a strong, growing economy and believe India will be one of the best emerging markets over the coming decade. Furthermore, India fits well into our so-called ‘Multipolar World’ narrative. Geopolitics and global supply chains are fast changing and we believe India is one country that stands to benefit structurally. We will continue to be selective in our stock-picking in India but strongly believe we can keep deploying capital with a good level of expected returns.
Elsewhere, we remain positive on Latin America (LatAm), where we have increased our exposure to Mexico over the past 12 months, again helped by our multipolar world view, thanks to the country’s ‘nearshoring’ trend. We see upside in Brazil, though do need a rate-cutting cycle to start before it can realize its full potential – Brazil is still faced with very high interest rates.
3
POLAR CAPITAL EMERGING MARKET STARS FUND
PERFORMANCE COMMENTARY
(Unaudited)
We see strong long-term potential for the CE-MENA (Central Europe, Middle East and North Africa) region, especially in Saudi Arabia and the United Arab Emirates (UAE), given a strong focus on driving domestic economic growth. However, there is a pause in the market at the moment due to the Hamas (and now Iran)/Israel conflict. We are increasingly positive on the economic developments in Central Asia as, in the years to come, we see the evolution of a larger, more integrated economic area between India, Central Asia and the Middle East. Here you will have labor and a large number of consumers which, combined with energy and commodities, provides the ingredients for a powerhouse region over the coming decade.
In the ASEAN (Association of Southeast Asian Nations) region, we continue to favor Vietnam (off benchmark for the Fund) and Indonesia, and are increasingly positive on the Philippines. The ASEAN region is well positioned to benefit from lower rates globally as well as taking lower-end manufacturing jobs from China.
Fund activity
The key activity in the Fund has, at the country level, been a further reduction in both our absolute and relative weighting towards China. As described above, structurally we see a risk of the Chinese economy finding itself in some form of debt/deflation trap that will be hard to work itself out of, so we are very careful on our overall allocation of capital towards China. We still see opportunities in attractive growth areas, and are very selective when it comes to stock selection.
Over the past 12 months, we have also allocated more capital to Mexico via selective stocks and, for the first time in many years, are overweight the country. We have also increased the Fund’s exposure to the Middle East and Central Asia.
The significantly reduced weighting in China, combined with the more attractive relative opportunities in LatAm and the Middle East, means the Fund is, for the first time ever, underweight Asia (though the Fund does still have strong exposure to the region).
At a sector level, we have retained a high overweight to technology though we have made changes within the sector. The most significant has been to increase exposure to the memory cycle within semiconductors, particularly via Samsung Electronics and SK Hynix, for exposure to the high bandwidth memory (HBM) segment, needed to train AI models.
We have kept our weighting to other sectors relatively stable, with smaller changes driven mainly by stock-specific issues as well as smaller variations in relative performance.
Key new stocks to mention over the past 12 months would be MakeMyTrip (Indian online travel agent), SK Hynix (South Korean technology), Faraday Technology (Taiwanese technology), Kaspi.kz (Kazakh internet and FinTech), Aldar Properties (UAE property), Nu Holdings (Brazilian online bank), Pinduoduo (Chinese e-commerce), Corp Inmobiliaria Vesta (Mexican industrial real estate) and Grupo Traxion (Mexican transportation and logistics).
Key exits over the past 12 months include Alibaba Group Holding, JD.com (both Chinese e-commerce), Venus MedTech Hangzhou (Chinese MedTech), JD Health International (Chinese online healthcare), Naver (South Korean internet/e-commerce) and Samsung SDI (South Korean electric vehicle battery maker).
4
POLAR CAPITAL EMERGING MARKET STARS FUND
PERFORMANCE COMMENTARY
(Unaudited)
Outlook
We believe we are close to the inflection point of the equity market moving more towards a growth style, which could provide a tailwind for the Fund, having been fighting a strong value environment for the past three years (since November 9, 2020, when the Covid vaccine was announced and the market style fully swung from growth to value).
We expect the Fed will soon start to pivot and we will see an easing cycle in late 2H24. The specific timing is difficult to predict but our best forecast is around December (i.e. after the US election). We cannot rule out rate cuts starting in 2025, though in such a scenario we would expect cuts to be more aggressive. We see key emerging markets starting to cut rates before the Fed, which is not normal practice but we have already seen a few start. We are clearly seeing a difference in underlying inflation trends that can fundamentally justify such a move and believe we are increasingly getting to a stage where the market will like these moves.
The recovery playing out in China will be gradual and will likely be a ‘muddle through’ scenario for the domestic side of the economy. We think the risk of China ‘turning Japanese’ in terms of being in a debt/deflation trap is high, however we also believe there will be opportunities in niche areas in the domestic economy and strong exporters to the rest of the emerging markets. For this reason, we also believe there will still be good EPS (earnings per share) growth stories in China so it is too early to call China, as some have, uninvestable.
Most emerging markets, excluding China, look good given the global backdrop and many economies in India as well as the ASEAN, LatAm and CE-MENA regions could be well positioned for a strong cyclical growth period when inflation eases and monetary conditions can become loose once again. Key companies in these areas are attractively priced now, in our view.
We believe we are entering a new structural technology upcycle for the next 12-24 months, in which North Asia is well positioned, on the back of the combination of an inventory cleanup, further supply-side consolidation (within semiconductors in particular) and AI – the Polar Capital Technology team talk excitedly about the whole redesign of compute architecture needed for the AI age. We believe the leading South Korean and Taiwanese technology companies give us attractive exposure to it at what we believe are attractive valuation levels.
Finally, we see the evolution of a new multipolar world underpinning a structural trend for many emerging market countries. This will sit in a world that will de-dollarize for trade to further boost spending power in many emerging economies and create an investment and consumption uptrend. These structural trends will likely create a very different emerging market universe to the one we saw in the past decade – and it makes us bullish from both an absolute and relative return perspective.
Polar Capital Emerging Markets & Asia Team
March 31, 2024
5
POLAR CAPITAL EMERGING MARKET STARS FUND
HISTORICAL PERFORMANCE
March 31, 2024 (Unaudited)
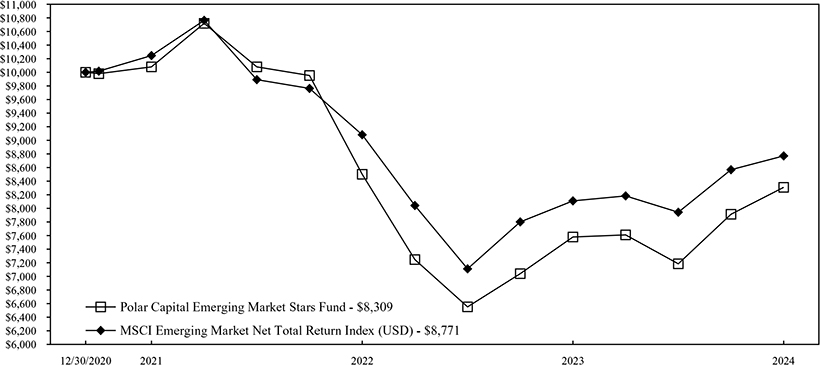
Change in Value of a $10,000 Investment in Polar Capital Emerging Market Stars Fund vs. MSCI Emerging Market Net Total Return Index for the Period December 30, 2020 to March 31, 2024
| | | | | | |
| | | | | Annualized Total Return |
| | | | 1 Year | | Commencement of Operations 12/30/2020 to 03/31/2024 |
| | Polar Capital Emerging Market Stars Fund | | 9.63%* | | -5.54% |
| | MSCI Emerging Market Net Total Return Index | | 8.15% | | -3.96% |
| | | | | | |
| * | Performance results do not include adjustments made for financial reporting purposes in accordance with U.S. generally accepted accounting principles and may differ from the amount reported in the Financial Highlights. |
Based on a hypothetical $10,000 initial investment, the graph and table above illustrate the total return of the Fund against the MSCI Emerging Market Net Total Return Index. The Index is a float-adjusted market capitalization index that is designed to measure the combined equity market performance of developed and emerging market countries excluding the United States. This index does not reflect any commissions or fees which would be incurred by an investor purchasing the stocks it represents. An investor cannot invest directly in an index. The graph and the table above do not reflect the deduction of taxes that a shareholder would pay on the Fund distributions or redemption of Fund shares. The performance of the Fund and of the Index is computed on a total return basis which includes reinvestment of all distributions, if any.
6
POLAR CAPITAL EMERGING MARKET STARS FUND
HISTORICAL PERFORMANCE
March 31, 2024 (Unaudited)
Past performance is no guarantee of future results and current performance may be higher or lower than the performance shown. This data represents past performance and investors should understand that investment returns and principal values fluctuate, so that when you redeem your investment it may be worth more or less than its original cost. Month-end performance data can be obtained by visiting the website at www.polarcapitalfunds.com or by calling (800) 806-1112 (toll free) or (312) 557-3164. The gross expense ratio is 2.45%; the net expense ratio is 1.00%. The latter reflects contractual fee waivers through July 31, 2024. Information regarding the Fund’s current expense ratio and redemption fees can be found on page 29. The Prospectus details the Fund’s objective and policies, sales charges, and other matters of interest to prospective investors. Please read the Prospectus carefully before investing. The Prospectus may be obtained by visiting the website at www.polarcapitalfunds.com, by email at PolarCapital@ntrs.com, by calling (800) 806-1112 (toll free) or (312) 557-3164 or by contacting the Fund in writing.
7
POLAR CAPITAL EMERGING MARKET EX-CHINA STARS FUND PERFORMANCE COMMENTARY
(Unaudited)
Fund performance
The Polar Capital Emerging Market ex-China Stars Fund (the “Fund”) was launched on June 30, 2023, since then it has returned 13.30%, compared to 13.64% for its benchmark, the MSCI Emerging Markets ex-China Net Total Return Index (the “Index”), for the same period.
Macro background
The past nine month period has continued to be a challenging macroeconomic environment for emerging markets, however many have demonstrated great resilience given the difficult global backdrop of high US inflation and tight Federal Reserve (Fed) monetary policy as well as high geopolitical tensions. Despite these headwinds, we have seen what we believe are green shoots of a recovery that could be the beginning of a stronger structural growth period for many emerging market economies outside China. The Fund, focusing on stock selection, has benefited from these positive trends to deliver good returns during this period.
There is no question that inflation in the US, on the back of extreme expansionary monetary policy, continued reckless – in our view – fiscal policy, the tight US monetary cycle and related strong dollar have created a strong headwind for the majority of emerging markets. It has led to central banks reacting conservatively even though there are few inflation issues in emerging markets (with the exception of small relatively irrelevant countries, from an investment point of view, such as Turkey). They have hiked rates and created an economic environment where most emerging markets are faced with relatively high interest rates hurting both the investment cycle and the credit/consumer cycle. In addition, we believe the whole ‘higher for longer’ narrative around inflation in the US, on top of direct monetary conditions, is creating a higher discount rate as risk aversion is higher.
On the positive side, we are very impressed with how well most emerging market economies have been able to cope with this backdrop, and we strongly believe this is testament to their significantly improved underlying fundamentals over the past 5-6 years.
Looking at countries like India and Indonesia, it is hard to believe it was not that long ago that they were part of the so-called ‘Fragile Five’. We believe this general level of improvement in macro (and corporate) fundamentals over the past five years or so is setting up emerging markets as an asset class very well for the next upcycle, which we feel we are not far away from.
Another negative over the past 12 months has been geopolitical tensions and we see returns from China being the hardest hit, given its weakness is externally related to geopolitics as well as domestic politics and economics. The trade and technology war between China and the US has been edging up over the past 12 months and it is very clear the world will never return to the old US/China relationship. Alongside this is Taiwan, plus China supporting Russia over Ukraine – or at least turning a blind eye to many Chinese companies selling sanctioned products to Russia.
The Fund, obviously, does not invest directly in Chinese equities though the size of its economy, number of consumers, geopolitical tensions and its position as a global manufacturing powerhouse combine to result in a significant expansion of the risk premiums into the broader emerging market universe.
8
POLAR CAPITAL EMERGING MARKET EX-CHINA STARS FUND
PERFORMANCE COMMENTARY
(Unaudited)
We believe China’s domestic economic issues come down to President Xi setting the wrong agendas for an economic recovery, micro-managing the regulation of industries and encouraging government-linked companies to kill off private companies. Xi has clearly communicated that national security is the top priority and, in our view, there seems to be an element of paranoia that is discouraging willingness and encouraging risk aversion for businesses to invest. In our view, China is at a crossroads where it has to deal with huge levels of debt, over-capacity in many industries and a property market/asset class at a real risk of deflation. This is all at a time when China needs to export to drive growth but its export engine is at risk due to geopolitics. Therefore, the last thing China needs is an environment where local entrepreneurs are risk averse and are just as eager as foreign investors to take capital out of China. Given the domestic political situation, we see a real risk that large parts of the Chinese economy will face the risk of some form of debt/deflation trap which will be hard to reverse.
While there has been negative noise surrounding emerging markets, there have also been positive developments, many of which the Fund has participated very well in.
We have been very positive on technology, particularly semiconductors and hardware, which has given us strong exposure to Taiwan and South Korea. This has played out very well for the Fund over this period and the sector and stock selection have been important drivers behind our outperformance over the past 12 months. Artificial intelligence (AI) has been one of the key developments for a renewed strong capex (capital expenditure) cycle for semiconductors. Many of the headlines have been written in the US, but the AI evolution and related buildout of data centers is very semiconductor and technology hardware-heavy, which is where Taiwan and South Korea come into the equation. We have seen strong performance here over the past 12 months, but believe we are early in a new technology upcycle and still see many attractive opportunities in both countries as there are plenty of companies with exposure to these growth areas. At the same time, we think valuation levels are still attractive. Given our current forecasts, we expect to keep a large exposure to these areas for now.
Another very positive development for the Fund has been India – even though we are fully aware that many have been saying for a long time that it is well owned and expensive – and our stock selection has helped deliver strong absolute and relative returns. We acknowledge the high market valuations in India, but still see a strong, growing economy and believe India will be one of the best emerging markets over the coming decade. Furthermore, India fits well into our so-called ‘Multipolar World’ narrative. Geopolitics and global supply chains are fast changing and we believe India is one country that stands to benefit structurally. We will continue to be selective in our stock-picking in India but strongly believe we can keep deploying capital with a good level of expected returns.
Elsewhere, we remain positive on Latin America (LatAm), where we have increased our exposure to Mexico over the past 12 months, again helped by our multipolar world view, thanks to the country’s ‘nearshoring’ trend. We see upside in Brazil, though do need a rate-cutting cycle to start before it can realize its full potential – Brazil is still faced with very high interest rates.
We see strong long-term potential for the CE-MENA (Central Europe, Middle East and North Africa) region, especially in Saudi Arabia and the United Arab Emirates (UAE), given a strong focus on driving domestic economic growth. However, there is a pause in the market at the moment due to the Hamas (and now Iran)/Israel conflict. We are increasingly positive on the economic developments in Central Asia as, in the years to come, we
9
POLAR CAPITAL EMERGING MARKET EX-CHINA STARS FUND
PERFORMANCE COMMENTARY
(Unaudited)
see the evolution of a larger, more integrated economic area between India, Central Asia and the Middle East. Here you will have labor and a large number of consumers which, combined with energy and commodities, provides the ingredients for another powerhouse region over the coming decade.
In the ASEAN (Association of Southeast Asian Nations) region, we continue to favor Vietnam (off benchmark for the Fund) and Indonesia, and are increasingly positive on the Philippines. The ASEAN region is well positioned to benefit from lower rates globally as well as taking lower-end manufacturing jobs from China.
Fund activity
Given our longer-term focus as investors, we have not made significant structural changes since we launched the strategy and any changes have been more driven by stock-specific changes during the period under review.
At a sector level, we have retained a high overweight to technology though we have made changes within the sector. The most significant has been to increase exposure to the memory cycle within semiconductors, particularly via Samsung Electronics and SK Hynix, for exposure to the high bandwidth memory (HBM) segment, needed to train AI models.
We have kept the Fund’s weighting to other sectors relatively stable, with smaller changes driven mainly by stock-specific issues as well as smaller variations in relative performance.
Key new stocks to mention over the past nine months would be SK Hynix (South Korean technology), Kaspi.kz (Kazakhstan internet and FinTech), Aldar Properties (UAE property), Nu Holdings (Brazilian online bank) and Grupo Traxion (Mexican transportation and logistics).
Key exits to mention include Ethos (Indian watch retailer), Prestige Estates Projects (Indian property developer), Allkem (Brazilian lithium producer) and Samsung SDI (South Korean electric vehicle battery maker).
Outlook
We believe we are close to the inflection point of the equity market moving more towards a growth style, which could provide a tailwind for the Fund, having been fighting a strong value environment since before the Fund was launched.
We expect the Fed will soon start to pivot and we will see an easing cycle in late 2H24. The specific timing is difficult to predict but our best forecast is around December (i.e. after the US election). We cannot rule out rate cuts starting in 2025, though in such a scenario we would expect cuts to be more aggressive. We see key emerging markets starting to cut rates before the Fed, which is not normal practice but we have already seen a few start. We are clearly seeing a difference in underlying inflation trends that can fundamentally justify such a move and believe we are increasingly getting to a stage where the market will like these moves.
Most emerging markets, excluding China, look good given the global backdrop and many economies in India as well as the ASEAN, LatAm and CE-MENA regions could be well positioned for a strong cyclical growth period when inflation eases and monetary conditions can become loose once again. Key companies in these areas are attractively priced now, in our view.
10
POLAR CAPITAL EMERGING MARKET EX-CHINA STARS FUND
PERFORMANCE COMMENTARY
(Unaudited)
We are entering a new structural technology upcycle for the next 12-24 months, in which North Asia is well positioned, on the back of the combination of an inventory cleanup, further supply-side consolidation (within semiconductors in particular) and AI – the Polar Capital Technology team talk excitedly about the whole redesign of compute architecture needed for the AI age. We believe the leading South Korean and Taiwanese technology companies give us attractive exposure to it at what we believe are attractive valuation levels.
Finally, we see the evolution of a new multipolar world underpinning a structural trend for many emerging market countries. This will sit in a world that will de-dollarize for trade to further boost spending power in many emerging economies and create an investment and consumption uptrend. These structural trends will likely create a very different emerging market universe to the one we saw in the past decade – and it makes us bullish from both an absolute and relative return perspective.
Polar Capital Emerging Markets & Asia Team
March 31, 2024
11
POLAR CAPITAL EMERGING MARKET EX-CHINA STARS FUND
HISTORICAL PERFORMANCE
March 31, 2024 (Unaudited)
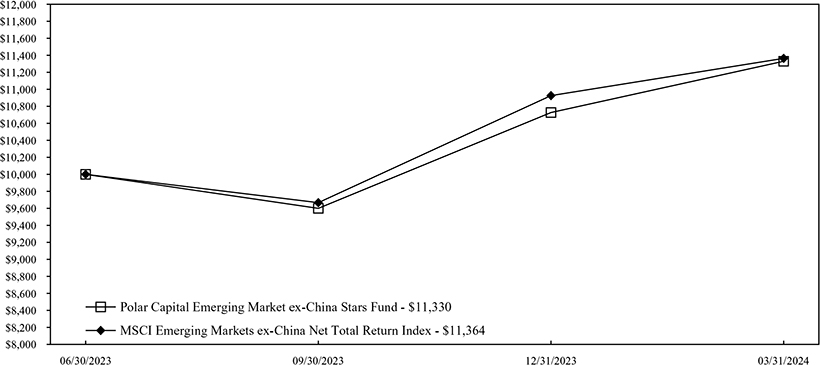
Change in Value of a $10,000 Investment in Polar Capital Emerging Market ex-China Stars Fund vs. MSCI Emerging Markets ex-China Net Total Return Index for the Period June 30, 2023 to March 31, 2024
| | | | |
| | | | Commencement of Operations 06/30/2023 to 03/31/2024 |
| | Polar Capital Emerging Market ex-China Stars Fund | | 13.30%* |
| | MSCI Emerging Markets ex-China Net Total Return Index | | 13.64% |
| | | | |
| * | Performance results do not include adjustments made for financial reporting purposes in accordance with U.S. generally accepted accounting principles and may differ from the amount reported in the Financial Highlights. |
Based on a hypothetical $10,000 initial investment, the graph and table above illustrate the total return of the Fund against the MSCI Emerging Markets ex-China Net Total Return Index. The Index is a float-adjusted market capitalization index that is designed to measure the combined equity market performance of developed and emerging market countries excluding the United States. This index does not reflect any commissions or fees which would be incurred by an investor purchasing the stocks it represents. An investor cannot invest directly in an index. The graph and the table above do not reflect the deduction of taxes that a shareholder would pay on the Fund distributions or redemption of Fund shares. The performance of the Fund and of the Index is computed on a total return basis which includes reinvestment of all distributions, if any.
12
POLAR CAPITAL EMERGING MARKET EX-CHINA STARS FUND
HISTORICAL PERFORMANCE
March 31, 2024 (Unaudited)
Past performance is no guarantee of future results and current performance may be higher or lower than the performance shown. This data represents past performance and investors should understand that investment returns and principal values fluctuate, so that when you redeem your investment it may be worth more or less than its original cost. Month-end performance data can be obtained by visiting the website at www.polarcapitalfunds.com or by calling (800) 806-1112 (toll free) or (312) 557-3164. The gross expense ratio is 17.88%; the net expense ratio is 1.00%. The latter reflects contractual fee waivers through November 8, 2024. Information regarding the Fund’s current expense ratio and redemption fees can be found on page 30. The Prospectus details the Fund’s objective and policies, sales charges, and other matters of interest to prospective investors. Please read the Prospectus carefully before investing. The Prospectus may be obtained by visiting the website at www.polarcapitalfunds.com, by email at PolarCapital@ntrs.com, by calling (800) 806-1112 (toll free) or (312) 557-3164 or by contacting the Fund in writing.
13
POLAR CAPITAL FUNDS
IMPORTANT DISCLOSURES, INDEX DEFINITIONS AND TERM DEFINITIONS
(Unaudited)
Important Disclosures
This Commentary is for informational and discussion purposes only and does not constitute, and should not be construed as, an offer or solicitation for the purchase or sale with respect to any securities, products or services discussed, and neither does it provide investment advice. Any such offer or solicitation shall only be made pursuant to the Fund’s Prospectus which supersedes the information contained herein in its entirety.
The views expressed herein and any forward-looking statements are as of the date of this publication and are those of the portfolio management team. Future events or results may vary significantly from those expressed and are subject to change at any time in response to changing circumstances and industry developments. This information and data has been prepared from sources believed reliable, but the accuracy and completeness of the information cannot be guaranteed and is not a complete summary or statement of all available data.
Please refer to the Portfolio of Investments in this report for a complete list of the portfolio holdings. Portfolio composition will change due to ongoing management of the Fund. References to individual securities are for informational purposes only and should not be construed as recommendations by the Fund, the portfolio manager, the Adviser, or the distributor. It should not be assumed that future investments will be profitable or will equal the performance of the security examples discussed. The portfolio holdings as of the most recent quarter-end may be obtained at www.polarcapitalfunds.com. The Fund’s performance returns shown reflect applicable fee waivers and/or expense limits in effect during this period. Absent such fee waivers/expense limitations, if any, performance would have been lower. An index has no cash in its portfolio and imposes no sales charges. An investor cannot invest directly in an index.
Index Definitions
The MSCI Emerging Markets Index is a free float-adjusted market capitalization index that is designed to measure equity market performance in the global emerging markets. The MSCI Emerging Markets Index consists of the following 26 emerging market country indices: Argentina, Brazil, Chile, China, Colombia, Czech Republic, Egypt, Greece, Hungary, India, Indonesia, Korea, Malaysia, Mexico, Pakistan, Peru, Philippines, Poland, Qatar, Russia, Saudi Arabia, South Africa, Taiwan, Thailand, Turkey and United Arab Emirates. Net dividends reinvested.
The MSCI Emerging Markets ex-China Index captures large and mid-cap representation across 23 of the 24 Emerging Markets countries excluding China. The 23 Emerging Markets countries include: Brazil, Chile, Colombia, Czech Republic, Egypt, Greece, Hungary, India, Indonesia, Korea, Kuwait, Malaysia, Mexico, Peru, Philippines, Poland, Qatar, Saudi Arabia, South Africa, Taiwan, Thailand, Turkey and United Arab Emirates. With 672 constituents, the index covers approximately 85% of the free float-adjusted market capitalization in each country.
14
POLAR CAPITAL FUNDS
IMPORTANT DISCLOSURES, INDEX DEFINITIONS AND TERM DEFINITIONS
(Unaudited)
Term Definitions
Basis points (bps or “bips”): A unit of measure used in finance to describe the percentage change in the value of financial instruments or the rate change in an index or other benchmark. One basis point is equivalent to 0.01% (1/100th of a percent) or 0.0001 in decimal form.
Capex (capital expenditure): Money a company uses to purchase, maintain or expand fixed assets.
Duration: How long a stock investor needs to receive dividends to be repaid the purchase price of the stock.
EPS (earnings per share): A measure of a company’s value by assessing how much money a company makes for each of its shares.
Nearshoring: To hire or outsource to workers in locales closer to a company’s home market.
15
POLAR CAPITAL EMERGING MARKET STARS FUND
PORTFOLIO OF INVESTMENTS
March 31, 2024
| | | | | |
| Industry Allocation | | Percent of
Net Assets |
Semiconductors & Semiconductor Equipment | | | | 19.1 | % |
Banks | | | | 12.6 | |
Real Estate Management & Development | | | | 7.9 | |
Technology Hardware, Storage & Peripherals | | | | 7.0 | |
Broadline Retail | | | | 5.2 | |
Hotels, Restaurants & Leisure | | | | 5.1 | |
Interactive Media & Services | | | | 5.1 | |
Oil, Gas & Consumable Fuels | | | | 4.9 | |
Electronic Equipment, Instruments & Components | | | | 4.8 | |
Metals & Mining | | | | 4.0 | |
IT Services | | | | 2.6 | |
Chemicals | | | | 1.9 | |
Capital Markets | | | | 1.9 | |
Machinery | | | | 1.8 | |
Insurance | | | | 1.5 | |
Electrical Equipment | | | | 1.5 | |
Industrial Conglomerates | | | | 1.4 | |
Consumer Finance | | | | 1.3 | |
Textiles, Apparel & Luxury Goods | | | | 1.2 | |
Construction & Engineering | | | | 1.2 | |
Consumer Staples Distribution & Retail | | | | 1.2 | |
Health Care Providers & Services | | | | 1.1 | |
Entertainment | | | | 1.0 | |
Software | | | | 1.0 | |
Ground Transportation | | | | 0.6 | |
Health Care Equipment & Supplies | | | | 0.5 | |
Financial Services | | | | 0.5 | |
Other Assets And Liabilities, Net | | | | 2.1 | % |
| | | | | |
| |
Net Assets | | | | 100.0 | % |
| | | | | |
| | | | | |
| Country Allocation | | Percent of
Net Assets |
India | | | | 18.3 | % |
Taiwan | | | | 16.4 | |
South Korea | | | | 15.3 | |
China | | | | 15.1 | |
Brazil | | | | 8.4 | |
Vietnam | | | | 4.4 | |
Mexico | | | | 4.3 | |
South Africa | | | | 3.5 | |
Argentina | | | | 2.5 | |
Indonesia | | | | 1.7 | |
Hong Kong | | | | 1.5 | |
United Arab Emirates | | | | 1.4 | |
Kazakhstan | | | | 1.3 | |
United States | | | | 1.2 | |
Singapore | | | | 1.0 | |
Saudi Arabia | | | | 1.0 | |
Jersey, Cayman Islands | | | | 0.6 | |
Other Assets And Liabilities, Net | | | | 2.1 | % |
| | | | | |
| |
Net Assets | | | | 100.0 | % |
| | | | | |
Portfolio holdings and characteristics are subject to change and may not be representative of current holdings and characteristics. Fund holdings are subject to change daily.
See accompanying Notes to Financial Statements.
16
POLAR CAPITAL EMERGING MARKET STARS FUND
PORTFOLIO OF INVESTMENTS (Continued)
March 31, 2024
| | | | | | | | |
COMMON STOCKS – 95.7% | | Shares | | Fair Value | |
SEMICONDUCTORS & SEMICONDUCTOR EQUIPMENT – 19.1% | | | | | | | | |
Andes Technology Corp. (Taiwan) | | | 31,926 | | | $ | 427,955 | |
eMemory Technology Inc. (Taiwan) | | | 50,087 | | | | 3,896,968 | |
Faraday Technology Corp. (Taiwan) | | | 211,335 | | | | 2,271,603 | |
HPSP Co. Ltd. (South Korea) | | | 57,500 | | | | 2,267,967 | |
SK Hynix Inc. (South Korea) | | | 30,994 | | | | 4,213,112 | |
StarPower Semiconductor Ltd. (China) | | | 61,198 | | | | 1,206,466 | |
Taiwan Semiconductor Manufacturing Co. Ltd. (Taiwan) | | | 603,108 | | | | 14,680,305 | |
| | | | | | | | |
| | | | | | $ | 28,964,376 | |
| | | | | | | | |
BANKS – 10.4% | | | | | | | | |
Alinma Bank (Saudi Arabia) | | | 133,985 | | | $ | 1,520,082 | |
Grupo Financiero Banorte S.A.B. de C.V. (Mexico) | | | 413,912 | | | | 4,396,324 | |
HDFC Bank Ltd. (India) | | | 122,151 | | | | 2,130,023 | |
ICICI Bank Ltd. (India) | | | 310,623 | | | | 4,095,149 | |
NU Holdings Ltd. (Brazil) (a) | | | 106,643 | | | | 1,272,251 | |
Vietnam Technological & Commercial Joint Stock Bank (Vietnam) (a) | | | 1,228,889 | | | | 2,356,671 | |
| | | | | | | | |
| | | | | | $ | 15,770,500 | |
| | | | | | | | |
REAL ESTATE MANAGEMENT & DEVELOPMENT – 7.9% | | | | | | | | |
Aldar Properties PJSC (United Arab Emirates) | | | 1,421,986 | | | $ | 2,160,714 | |
Corp. Inmobiliaria Vesta S.A.B. de C.V. (Mexico) | | | 296,499 | | | | 1,160,963 | |
Phoenix Mills (The) Ltd. (India) | | | 168,884 | | | | 5,634,968 | |
Vincom Retail JSC (Vietnam) (a) | | | 1,460,378 | | | | 1,522,515 | |
Vinhomes JSC (Vietnam) (a),(b) | | | 902,267 | | | | 1,559,272 | |
| | | | | | | | |
| | | | | | $ | 12,038,432 | |
| | | | | | | | |
TECHNOLOGY HARDWARE, STORAGE & PERIPHERALS – 7.0% | | | | | | | | |
Samsung Electronics Co. Ltd. (South Korea) | | | 174,294 | | | $ | 10,668,023 | |
| | | | | | | | |
| | |
BROADLINE RETAIL – 5.2% | | | | | | | | |
MercadoLibre Inc. (Brazil) (a) | | | 2,440 | | | $ | 3,689,182 | |
Mitra Adiperkasa Tbk PT (Indonesia) | | | 14,303,487 | | | | 1,642,533 | |
PDD Holdings Inc. (China) (a),(c) | | | 22,383 | | | | 2,602,024 | |
| | | | | | | | |
| | | | | | $ | 7,933,739 | |
| | | | | | | | |
HOTELS, RESTAURANTS & LEISURE – 5.1% | | | | | | | | |
H World Group Ltd. (China) | | | 465,552 | | | $ | 1,803,016 | |
MakeMyTrip Ltd. (India) (a) | | | 50,311 | | | | 3,574,597 | |
Meituan (China) (a),(b) | | | 193,310 | | | | 2,386,237 | |
| | | | | | | | |
| | | | | | $ | 7,763,850 | |
| | | | | | | | |
See accompanying Notes to Financial Statements.
17
POLAR CAPITAL EMERGING MARKET STARS FUND
PORTFOLIO OF INVESTMENTS (Continued)
March 31, 2024
| | | | | | | | |
COMMON STOCKS — Continued | | Shares | | Fair Value | |
INTERACTIVE MEDIA & SERVICES – 5.1% | | | | | | | | |
Tencent Holdings Ltd. (China) | | | 197,211 | | | $ | 7,681,358 | |
| | | | | | | | |
| | |
OIL, GAS & CONSUMABLE FUELS – 4.9% | | | | | | | | |
Reliance Industries Ltd. (India) | | | 205,598 | | | $ | 7,351,812 | |
| | | | | | | | |
| | |
ELECTRONIC EQUIPMENT, INSTRUMENTS & COMPONENTS – 4.8% | | | | | | | | |
Chroma ATE Inc. (Taiwan) | | | 442,836 | | | $ | 3,528,463 | |
Daejoo Electronic Materials Co. Ltd. (South Korea) (a) | | | 21,035 | | | | 1,448,427 | |
OPT Machine Vision Tech Co. Ltd. (China) | | | 81,182 | | | | 1,022,278 | |
Zhejiang Supcon Technology Co. Ltd. (China) | | | 195,783 | | | | 1,254,394 | |
| | | | | | | | |
| | | | | | $ | 7,253,562 | |
| | | | | | | | |
METALS & MINING – 4.0% | | | | | | | | |
Ivanhoe Mines Ltd. (South Africa) (a) | | | 439,653 | | | $ | 5,245,131 | |
Merdeka Copper Gold Tbk PT (Indonesia) (a) | | | 6,178,545 | | | | 889,618 | |
| | | | | | | | |
| | | | | | $ | 6,134,749 | |
| | | | | | | | |
IT SERVICES – 2.6% | | | | | | | | |
FPT Corp. (Vietnam) | | | 278,042 | | | $ | 1,306,388 | |
Globant S.A. (Argentina) (a) | | | 13,261 | | | | 2,677,396 | |
| | | | | | | | |
| | | | | | $ | 3,983,784 | |
| | | | | | | | |
CHEMICALS – 1.9% | | | | | | | | |
Arcadium Lithium PLC (Jersey, Cayman Islands) (a) | | | 190,108 | | | $ | 838,718 | |
Bioceres Crop Solutions Corp. (Argentina) (a) | | | 93,503 | | | | 1,183,748 | |
Ganfeng Lithium Group Co. Ltd. (China) (b) | | | 293,583 | | | | 899,926 | |
| | | | | | | | |
| | | | | | $ | 2,922,392 | |
| | | | | | | | |
CAPITAL MARKETS – 1.9% | | | | | | | | |
360 ONE WAM Ltd. (India) | | | 204,213 | | | $ | 1,659,372 | |
B3 S.A. - Brasil Bolsa Balcao (Brazil) | | | 520,984 | | | | 1,245,484 | |
| | | | | | | | |
| | | | | | $ | 2,904,856 | |
| | | | | | | | |
MACHINERY – 1.8% | | | | | | | | |
MTAR Technologies Ltd. (India) (a) | | | 47,116 | | | $ | 953,404 | |
Shenzhen Inovance Technology Co. Ltd. (China) | | | 217,822 | | | | 1,836,204 | |
| | | | | | | | |
| | | | | | $ | 2,789,608 | |
| | | | | | | | |
INSURANCE – 1.5% | | | | | | | | |
AIA Group Ltd. (Hong Kong) | | | 334,512 | | | $ | 2,250,120 | |
| | | | | | | | |
See accompanying Notes to Financial Statements.
18
POLAR CAPITAL EMERGING MARKET STARS FUND
PORTFOLIO OF INVESTMENTS (Continued)
March 31, 2024
| | | | | | | | |
COMMON STOCKS — Continued | | Shares | | Fair Value | |
ELECTRICAL EQUIPMENT – 1.5% | | | | | | | | |
Sungrow Power Supply Co. Ltd. (China) | | | 155,686 | | | $ | 2,225,219 | |
| | | | | | | | |
| | |
INDUSTRIAL CONGLOMERATES – 1.4% | | | | | | | | |
SK Square Co. Ltd. (South Korea) (a) | | | 35,353 | | | $ | 2,074,568 | |
| | | | | | | | |
| | |
CONSUMER FINANCE – 1.3% | | | | | | | | |
Kaspi.kz JSC (Kazakhstan) (c) | | | 15,213 | | | $ | 1,957,000 | |
| | | | | | | | |
| | |
TEXTILES, APPAREL & LUXURY GOODS – 1.2% | | | | | | | | |
Samsonite International S.A. (United States) (a),(b) | | | 484,295 | | | $ | 1,834,931 | |
| | | | | | | | |
| | |
CONSTRUCTION & ENGINEERING – 1.2% | | | | | | | | |
Samsung Engineering Co. Ltd. (South Korea) (a) | | | 96,254 | | | $ | 1,787,447 | |
| | | | | | | | |
| | |
CONSUMER STAPLES DISTRIBUTION & RETAIL – 1.2% | | | | | | | | |
Raia Drogasil S.A. (Brazil) | | | 318,922 | | | $ | 1,740,418 | |
| | | | | | | | |
| | |
HEALTH CARE PROVIDERS & SERVICES – 1.1% | | | | | | | | |
Apollo Hospitals Enterprise Ltd. (India) | | | 22,211 | | | $ | 1,695,533 | |
| | | | | | | | |
| | |
ENTERTAINMENT – 1.0% | | | | | | | | |
Sea Ltd. (Singapore) (a),(c) | | | 28,354 | | | $ | 1,522,893 | |
| | | | | | | | |
| | |
SOFTWARE – 1.0% | | | | | | | | |
TOTVS S.A. (Brazil) (a) | | | 266,158 | | | $ | 1,506,074 | |
| | | | | | | | |
| | |
GROUND TRANSPORTATION – 0.6% | | | | | | | | |
Grupo Traxion S.A.B. de C.V. (Mexico) (a),(b) | | | 525,694 | | | $ | 979,670 | |
| | | | | | | | |
| | |
HEALTH CARE EQUIPMENT & SUPPLIES – 0.5% | | | | | | | | |
Ray Co. Ltd. (South Korea) (a) | | | 65,477 | | | $ | 775,267 | |
| | | | | | | | |
| | |
FINANCIAL SERVICES – 0.5% | | | | | | | | |
Jio Financial Services Ltd. (India) (a) | | | 159,653 | | | $ | 678,748 | |
| | | | | | | | |
| | |
TOTAL COMMON STOCKS–95.7% (Cost $124,768,627) | | | | | | $ | 145,188,929 | |
| | | | | | | | |
See accompanying Notes to Financial Statements.
19
POLAR CAPITAL EMERGING MARKET STARS FUND
PORTFOLIO OF INVESTMENTS (Continued)
March 31, 2024
| | | | | | | | |
PREFERRED STOCKS – 2.2% | | | | | |
BANKS – 2.2% | | | | | | | | |
Itau Unibanco Holding S.A. (Brazil), 3.25% (d) | | | 474,276 | | | $ | 3,275,695 | |
| | | | | | | | |
TOTAL INVESTMENTS–97.9% (Cost $127,284,793) | | | | | | $ | 148,464,624 | |
Other Assets and Liabilities, net – 2.1% | | | $ | 3,199,243 | |
| | | | | | | | |
NET ASSETS–100.0% | | | | | | $ | 151,663,867 | |
| | | | | | | | |
| (a) | Non-income producing security. |
| (b) | Security exempt from registration under Rule 144A of the Securities Act of 1933. These securities may be resold in transactions exempt from registration, typically only to qualified institutional buyers. |
| (c) | This security represents the common stock of a foreign company which trades directly or through an American Depositary Receipt (“ADR”) on the over-the-counter market or on a U.S. national securities exchange. |
| (d) | Current yield is disclosed. Dividends are calculated based on a percentage of the issuer’s net income. |
See accompanying Notes to Financial Statements.
20
POLAR CAPITAL EMERGING MARKET EX-CHINA STARS FUND
PORTFOLIO OF INVESTMENTS
March 31, 2024
| | | | | |
| Industry Allocation | | Percent of
Net Assets |
Semiconductors & Semiconductor Equipment | | | | 19.7 | % |
Banks | | | | 12.2 | |
Technology Hardware, Storage & Peripherals | | | | 8.4 | |
Real Estate Management & Development | | | | 8.3 | |
Oil, Gas & Consumable Fuels | | | | 5.1 | |
Metals & Mining | | | | 4.8 | |
Consumer Staples Distribution & Retail | | | | 4.6 | |
Broadline Retail | | | | 4.0 | |
Electronic Equipment, Instruments & Components | | | | 3.9 | |
Electrical Equipment | | | | 3.7 | |
Hotels, Restaurants & Leisure | | | | 3.6 | |
Capital Markets | | | | 2.5 | |
Health Care Providers & Services | | | | 2.5 | |
Industrial Conglomerates | | | | 2.2 | |
IT Services | | | | 1.9 | |
Chemicals | | | | 1.7 | |
Consumer Finance | | | | 1.7 | |
Construction & Engineering | | | | 1.5 | |
Software | | | | 1.1 | |
Entertainment | | | | 1.1 | |
Specialty Retail | | | | 1.0 | |
Ground Transportation | | | | 0.9 | |
Transportation Infrastructure | | | | 0.8 | |
Machinery | | | | 0.7 | |
Health Care Equipment & Supplies | | | | 0.6 | |
Financial Services | | | | 0.5 | |
Other Assets And Liabilities, Net | | | | 1.0 | % |
| | | | | |
| |
Net Assets | | | | 100.0 | % |
| | | | | |
| | | | | |
| Country Allocation | | Percent of
Net Assets |
India | | | | 23.1 | % |
South Korea | | | | 18.6 | |
Taiwan | | | | 18.5 | |
Brazil | | | | 11.3 | |
Mexico | | | | 8.6 | |
South Africa | | | | 4.0 | |
Argentina | | | | 2.9 | |
Vietnam | | | | 2.9 | |
Indonesia | | | | 2.6 | |
Saudi Arabia | | | | 2.2 | |
Kazakhstan | | | | 1.6 | |
United Arab Emirates | | | | 1.4 | |
Jersey, Cayman Islands | | | | 0.7 | |
Singapore | | | | 0.6 | |
Other Assets And Liabilities, Net | | | | 1.0 | % |
| | | | | |
| |
Net Assets | | | | 100.0 | % |
| | | | | |
Portfolio holdings and characteristics are subject to change and may not be representative of current holdings and characteristics. Fund holdings are subject to change daily.
See accompanying Notes to Financial Statements.
21
POLAR CAPITAL EMERGING MARKET EX-CHINA STARS FUND
PORTFOLIO OF INVESTMENTS (Continued)
March 31, 2024
| | | | | | | | | | | | |
| COMMON STOCKS – 96.9% | | | | Shares | | | | Fair Value | |
SEMICONDUCTORS & SEMICONDUCTOR EQUIPMENT – 19.7% | | | | | | | | | | | | |
Andes Technology Corp. (Taiwan) | | | | | 656 | | | | | $ | 8,794 | |
eMemory Technology Inc. (Taiwan) | | | | | 420 | | | | | | 32,678 | |
Faraday Technology Corp. (Taiwan) | | | | | 2,073 | | | | | | 22,282 | |
HPSP Co. Ltd. (South Korea) | | | | | 462 | | | | | | 18,223 | |
SK Hynix Inc. (South Korea) | | | | | 233 | | | | | | 31,672 | |
Taiwan Semiconductor Manufacturing Co. Ltd. (Taiwan) | | | | | 4,545 | | | | | | 110,630 | |
| | | | | | | | | | | | |
| | | | | | | | | | $ | 224,279 | |
| | | | | | | | | | | | |
BANKS – 10.1% | | | | | | | | | | | | |
Alinma Bank (Saudi Arabia) | | | | | 1,211 | | | | | $ | 13,739 | |
Grupo Financiero Banorte S.A.B. de C.V. (Mexico) | | | | | 3,222 | | | | | | 34,222 | |
HDFC Bank Ltd. (India) | | | | | 1,076 | | | | | | 18,763 | |
ICICI Bank Ltd. (India) | | | | | 2,816 | | | | | | 37,125 | |
NU Holdings Ltd. (Brazil) (a) | | | | | 915 | | | | | | 10,916 | |
| | | | | | | | | | | | |
| | | | | | | | | | $ | 114,765 | |
| | | | | | | | | | | | |
TECHNOLOGY HARDWARE, STORAGE & PERIPHERALS – 8.4% | | | | | | | | | | | | |
Samsung Electronics Co. Ltd. (South Korea) | | | | | 1,556 | | | | | $ | 95,238 | |
| | | | | | | | | | | | |
| | | | |
REAL ESTATE MANAGEMENT & DEVELOPMENT – 8.3% | | | | | | | | | | | | |
Aldar Properties PJSC (United Arab Emirates) | | | | | 10,839 | | | | | $ | 16,470 | |
Corp. Inmobiliaria Vesta S.A.B. de C.V. (Mexico) | | | | | 3,857 | | | | | | 15,102 | |
Phoenix Mills (The) Ltd. (India) | | | | | 1,245 | | | | | | 41,541 | |
Vincom Retail JSC (Vietnam) (a) | | | | | 10,924 | | | | | | 11,389 | |
Vinhomes JSC (Vietnam) (a),(b) | | | | | 5,661 | | | | | | 9,783 | |
| | | | | | | | | | | | |
| | | | | | | | | | $ | 94,285 | |
| | | | | | | | | | | | |
OIL, GAS & CONSUMABLE FUELS – 5.1% | | | | | | | | | | | | |
Reliance Industries Ltd. (India) | | | | | 1,636 | | | | | $ | 58,500 | |
| | | | | | | | | | | | |
| | | | |
METALS & MINING – 4.8% | | | | | | | | | | | | |
Ivanhoe Mines Ltd. (South Africa) (a) | | | | | 3,817 | | | | | $ | 45,537 | |
Merdeka Copper Gold Tbk PT (Indonesia) (a) | | | | | 58,810 | | | | | | 8,468 | |
| | | | | | | | | | | | |
| | | | | | | | | | $ | 54,005 | |
| | | | | | | | | | | | |
CONSUMER STAPLES DISTRIBUTION & RETAIL – 4.6% | | | | | | | | | | | | |
BBB Foods Inc. (Mexico) (a) | | | | | 1,238 | | | | | $ | 29,440 | |
Nahdi Medical Co. (Saudi Arabia) | | | | | 290 | | | | | | 11,366 | |
Raia Drogasil S.A. (Brazil) | | | | | 2,201 | | | | | | 12,011 | |
| | | | | | | | | | | | |
| | | | | | | | | | $ | 52,817 | |
| | | | | | | | | | | | |
See accompanying Notes to Financial Statements.
22
POLAR CAPITAL EMERGING MARKET EX-CHINA STARS FUND
PORTFOLIO OF INVESTMENTS (Continued)
March 31, 2024
| | | | | | | | | | | | |
| COMMON STOCKS — Continued | | | | Shares | | | | Fair Value | |
BROADLINE RETAIL – 4.0% | | | | | | | | | | | | |
MercadoLibre Inc. (Brazil) (a) | | | | | 19 | | | | | $ | 28,727 | |
Mitra Adiperkasa Tbk PT (Indonesia) | | | | | 147,559 | | | | | | 16,945 | |
| | | | | | | | | | | | |
| | | | | | | | | | $ | 45,672 | |
| | | | | | | | | | | | |
ELECTRONIC EQUIPMENT, INSTRUMENTS & COMPONENTS – 3.9% | | | | | | | | | | | | |
Chroma ATE Inc. (Taiwan) | | | | | 3,482 | | | | | $ | 27,744 | |
Daejoo Electronic Materials Co. Ltd. (South Korea) (a) | | | | | 246 | | | | | | 16,939 | |
| | | | | | | | | | | | |
| | | | | | | | | | $ | 44,683 | |
| | | | | | | | | | | | |
ELECTRICAL EQUIPMENT – 3.7% | | | | | | | | | | | | |
KEI Industries Ltd. (India) | | | | | 417 | | | | | $ | 17,377 | |
Voltronic Power Technology Corp. (Taiwan) | | | | | 160 | | | | | | 8,199 | |
WEG S.A. (Brazil) | | | | | 2,221 | | | | | | 16,916 | |
| | | | | | | | | | | | |
| | | | | | | | | | $ | 42,492 | |
| | | | | | | | | | | | |
HOTELS, RESTAURANTS & LEISURE – 3.6% | | | | | | | | | | | | |
MakeMyTrip Ltd. (India) (a) | | | | | 570 | | | | | $ | 40,499 | |
| | | | | | | | | | | | |
| | | | |
CAPITAL MARKETS – 2.5% | | | | | | | | | | | | |
360 ONE WAM Ltd. (India) | | | | | 2,397 | | | | | $ | 19,477 | |
B3 S.A. - Brasil Bolsa Balcao (Brazil) | | | | | 3,934 | | | | | | 9,405 | |
| | | | | | | | | | | | |
| | | | | | | | | | $ | 28,882 | |
| | | | | | | | | | | | |
HEALTH CARE PROVIDERS & SERVICES – 2.5% | | | | | | | | | | | | |
Apollo Hospitals Enterprise Ltd. (India) | | | | | 200 | | | | | $ | 15,268 | |
Oncoclinicas do Brasil Servicos Medicos S.A. (Brazil) (a) | | | | | 7,682 | | | | | | 13,555 | |
| | | | | | | | | | | | |
| | | | | | | | | | $ | 28,823 | |
| | | | | | | | | | | | |
INDUSTRIAL CONGLOMERATES – 2.2% | | | | | | | | | | | | |
SK Square Co. Ltd. (South Korea) (a) | | | | | 418 | | | | | $ | 24,529 | |
| | | | | | | | | | | | |
| | | | |
IT SERVICES – 1.9% | | | | | | | | | | | | |
Globant S.A. (Argentina) (a) | | | | | 107 | | | | | $ | 21,603 | |
| | | | | | | | | | | | |
| | | | |
CHEMICALS – 1.7% | | | | | | | | | | | | |
Arcadium Lithium PLC (Jersey, Cayman Islands) (a) | | | | | 1,888 | | | | | $ | 8,329 | |
Bioceres Crop Solutions Corp. (Argentina) (a) | | | | | 883 | | | | | | 11,179 | |
| | | | | | | | | | | | |
| | | | | | | | | | $ | 19,508 | |
| | | | | | | | | | | | |
See accompanying Notes to Financial Statements.
23
POLAR CAPITAL EMERGING MARKET EX-CHINA STARS FUND
PORTFOLIO OF INVESTMENTS (Continued)
March 31, 2024
| | | | | | | | | | | | |
| COMMON STOCKS — Continued | | | | Shares | | | | Fair Value | |
CONSUMER FINANCE – 1.7% | | | | | | | | | | | | |
Kaspi.kz JSC (Kazakhstan) (c) | | | | | 146 | | | | | $ | 18,782 | |
| | | | | | | | | | | | |
| | | | |
CONSTRUCTION & ENGINEERING – 1.5% | | | | | | | | | | | | |
Samsung Engineering Co. Ltd. (South Korea) (a) | | | | | 938 | | | | | $ | 17,419 | |
| | | | | | | | | | | | |
| | | | |
SOFTWARE – 1.1% | | | | | | | | | | | | |
TOTVS S.A. (Brazil) (a) | | | | | 2,213 | | | | | $ | 12,523 | |
| | | | | | | | | | | | |
| | | | |
ENTERTAINMENT – 1.1% | | | | | | | | | | | | |
Nusantara Sejahtera Raya Tbk PT (Indonesia) (a),(b) | | | | | 325,338 | | | | | $ | 4,719 | |
Sea Ltd. (Singapore) (a),(c) | | | | | 135 | | | | | | 7,251 | |
| | | | | | | | | | | | |
| | | | | | | | | | $ | 11,970 | |
| | | | | | | | | | | | |
SPECIALTY RETAIL – 1.0% | | | | | | | | | | | | |
Mobile World Investment Corp. (Vietnam) | | | | | 5,500 | | | | | $ | 11,335 | |
| | | | | | | | | | | | |
| | | | |
GROUND TRANSPORTATION – 0.9% | | | | | | | | | | | | |
Grupo Traxion S.A.B. de C.V. (Mexico) (a),(b) | | | | | 5,290 | | | | | $ | 9,858 | |
| | | | | | | | | | | | |
| | | | |
TRANSPORTATION INFRASTRUCTURE – 0.8% | | | | | | | | | | | | |
Grupo Aeroportuario del Centro Norte S.A.B. de C.V. (Mexico) | | | | | 903 | | | | | $ | 8,918 | |
| | | | | | | | | | | | |
| | | | |
MACHINERY – 0.7% | | | | | | | | | | | | |
MTAR Technologies Ltd. (India) (a) | | | | | 369 | | | | | $ | 7,467 | |
| | | | | | | | | | | | |
| | | | |
HEALTH CARE EQUIPMENT & SUPPLIES – 0.6% | | | | | | | | | | | | |
Ray Co. Ltd. (South Korea) (a) | | | | | 598 | | | | | $ | 7,081 | |
| | | | | | | | | | | | |
| | | | |
FINANCIAL SERVICES – 0.5% | | | | | | | | | | | | |
Jio Financial Services Ltd. (India) (a) | | | | | 1,460 | | | | | $ | 6,207 | |
| | | | | | | | | | | | |
| | | | |
TOTAL COMMON STOCKS–96.9% (Cost $973,810) | | | | | | | | | | $ | 1,102,140 | |
| | | | | | | | | | | | |
See accompanying Notes to Financial Statements.
24
POLAR CAPITAL EMERGING MARKET EX-CHINA STARS FUND
PORTFOLIO OF INVESTMENTS (Continued)
March 31, 2024
| | | | | | | | | | | | |
PREFERRED STOCKS – 2.1% | | | | | | | | | |
BANKS – 2.1% | | | | | | | | | | | | |
Itau Unibanco Holding S.A. (Brazil), 3.25% (d) | | | | | 3,484 | | | | | $ | 24,063 | |
| | | | | | | | | | | | |
TOTAL INVESTMENTS–99.0% (Cost $994,765) | | | | | | | | | | $ | 1,126,203 | |
Other Assets and Liabilities, net – 1.0% | | | | | $ | 11,076 | |
| | | | | | | | | | | | |
NET ASSETS–100.0% | | | | | | | | | | $ | 1,137,279 | |
| | | | | | | | | | | | |
| (a) | Non-income producing security. |
| (b) | Security exempt from registration under Rule 144A of the Securities Act of 1933. These securities may be resold in transactions exempt from registration, typically only to qualified institutional buyers. |
| (c) | This security represents the common stock of a foreign company which trades directly or through an American Depositary Receipt (“ADR”) on the over-the-counter market or on a U.S. national securities exchange. |
| (d) | Current yield is disclosed. Dividends are calculated based on a percentage of the issuer’s net income. |
See accompanying Notes to Financial Statements.
25
POLAR CAPITAL FUNDS
STATEMENTS OF ASSETS AND LIABILITIES
March 31, 2024
| | | | | | | | |
| | Polar
Capital
Emerging
Market
Stars Fund | | | Polar
Capital
Emerging
Market
ex-China
Stars Fund | |
ASSETS | | | | | | | | |
Investment securities— at fair value (identified cost $127,284,793 and $994,765, respectively) | | $ | 148,464,624 | | | $ | 1,126,203 | |
Cash | | | 3,886,599 | | | | 9,672 | |
Foreign currencies at value (identified cost $68,714 and $17,746, respectively) | | | 68,497 | | | | 16,894 | |
Receivable for: | | | | | | | | |
Dividends and interest | | | 299,638 | | | | 2,314 | |
Dividend reclaims | | | 971 | | | | — | |
Capital stock sold | | | 295,300 | | | | — | |
Investments sold | | | 133,413 | | | | — | |
Reimbursement from Administrator (Note 6) | | | — | | | | 50,000 | |
Reimbursement from Adviser (Note 6) | | | 78,459 | | | | — | |
Prepaid expenses | | | 47,790 | | | | 16,712 | |
| | | | | | | | |
Total assets | | | 153,275,291 | | | | 1,221,795 | |
| | | | | | | | |
| | |
LIABILITIES | | | | | | | | |
Payable for: | | | | | | | | |
Investments purchased | | | 9,002 | | | | — | |
Capital stock repurchased | | | 583,548 | | | | — | |
Advisory fees | | | 126,248 | | | | 949 | |
Accrued expenses and other liabilities | | | 191,835 | | | | 76,720 | |
Foreign capital gains taxes payable | | | 700,791 | | | | 6,847 | |
| | | | | | | | |
Total liabilities | | | 1,611,424 | | | | 84,516 | |
| | | | | | | | |
| | |
NET ASSETS | | $ | 151,663,867 | | | $ | 1,137,279 | |
| | | | | | | | |
| | |
SUMMARY OF SHAREHOLDERS’ EQUITY | | | | | | | | |
Capital stock—no par value; unlimited authorized shares; 18,943,787 and 100,452, respectively outstanding shares | | | 136,634,962 | | | | 1,004,641 | |
Distributable earnings | | | 15,028,905 | | | | 132,638 | |
| | | | | | | | |
| | |
NET ASSETS | | $ | 151,663,867 | | | $ | 1,137,279 | |
| | | | | | | | |
| | |
NET ASSET VALUE | | | | | | | | |
Offering and redemption price per share | | $ | 8.01 | | | $ | 11.32 | |
| | | | | | | | |
See accompanying Notes to Financial Statements.
26
POLAR CAPITAL FUNDS
STATEMENTS OF OPERATIONS
For the Year Ended March 31, 2024
| | | | | | | | | | | | | | |
| | | | | Polar Capital Emerging Market Stars Fund | | | | Polar Capital Emerging Market ex-China Stars Fund(a) |
INVESTMENT INCOME | | | | | | | | | | | | | | |
Dividends (net of foreign taxes withheld of $220,505 and $1,263, respectively) | | | | | $ | 1,677,909 | | | | | | $ | 8,686 | |
Interest | | | | | | 114,801 | | | | | | | 401 | |
| | | | | | | | | | | | | | |
Total investment income | | | | | | 1,792,710 | | | | | | | 9,087 | |
| | | | | | | | | | | | | | |
| | | | |
EXPENSES | | | | | | | | | | | | | | |
Advisory fees (Note 6) | | | | | | 1,231,946 | | | | | | | 7,717 | |
Trustee fees and expenses (Note 6) | | | | | | 150,340 | | | | | | | 926 | |
Fund accounting and administrative services fees (Note 6) | | | | | | 130,000 | | | | | | | 98,222 | |
Legal fees | | | | | | 124,205 | | | | | | | 731 | |
Custodian fees (Note 6) | | | | | | 90,827 | | | | | | | 8,977 | |
Compliance fees (Note 6) | | | | | | 73,583 | | | | | | | 26,341 | |
Audit and tax services fees | | | | | | 38,793 | | | | | | | 37,114 | |
Transfer agent fees and expenses (Note 6) | | | | | | 37,832 | | | | | | | 22,717 | |
Reports to shareholders | | | | | | 26,228 | | | | | | | 4,661 | |
State filing fees | | | | | | 25,433 | | | | | | | 1,937 | |
Other | | | | | | 82,134 | | | | | | | 2,977 | |
| | | | | | | | | | | | | | |
Total expenses | | | | | | 2,011,321 | | | | | | | 212,320 | |
| | | | | | | | | | | | | | |
Waiver from Administrator (Note 6) | | | | | | — | | | | | | | (113,333 | ) |
Waiver/Reimbursement from Adviser (Note 6) | | | | | | (779,376 | ) | | | | | | (91,270 | ) |
| | | | | | | | | | | | | | |
Net expenses | | | | | | 1,231,945 | | | | | | | 7,717 | |
| | | | | | | | | | | | | | |
Net Investment Income | | | | | | 560,765 | | | | | | | 1,370 | |
| | | | | | | | | | | | | | |
| | | | |
NET REALIZED AND UNREALIZED GAIN (LOSS) | | | | | | | | | | | | | | |
Net realized gain (loss) on: | | | | | | | | | | | | | | |
Investments | | | | | | (3,182,257 | ) | | | | | | 13,401 | |
Foreign currency transactions | | | | | | (77,001 | ) | | | | | | (380 | ) |
Net change in unrealized appreciation (depreciation) of: | | | | | | | | | | | | | | |
Investments (net change in deferred capital gains taxes of ($700,791) and ($6,847), respectively) | | | | | | 16,760,639 | | | | | | | 124,591 | |
Translation of foreign currency denominated amounts | | | | | | (4,821 | ) | | | | | | (875 | ) |
| | | | | | | | | | | | | | |
Net realized and unrealized gain | | | | | | 13,496,560 | | | | | | | 136,737 | |
| | | | | | | | | | | | | | |
| | | | |
NET INCREASE IN NET ASSETS RESULTING FROM OPERATIONS | | | | | $ | 14,057,325 | | | | | | $ | 138,107 | |
| | | | | | | | | | | | | | |
| (a) | For the period from June 30, 2023 (Commencement of Operations) to March 31, 2024. |
See accompanying Notes to Financial Statements.
27
POLAR CAPITAL FUNDS
STATEMENTS OF CHANGES IN NET ASSETS
| | | | | | | | | | |
| | | Polar Capital Emerging Market Stars Fund |
| | | Year Ended
March 31, 2024 | | Year Ended
March 31, 2023 |
INCREASE (DECREASE) IN NET ASSETS | | | | | | | | | | |
Operations: | | | | | | | | | | |
Net investment income (loss) | | | $ | 560,765 | | | | $ | (162,933 | ) |
Net realized loss | | | | (3,259,258 | ) | | | | (1,441,714 | ) |
Net change in unrealized appreciation (depreciation) | | | | 16,755,818 | | | | | 4,960,647 | |
| | | | | | | | | | |
Net increase in net assets resulting from operations | | | | 14,057,325 | | | | | 3,356,000 | |
| | | | | | | | | | |
| | |
Distributions to shareholders | | | | (581,602 | ) | | | | — | |
| | | | | | | | | | |
Capital stock transactions: | | | | | | | | | | |
Proceeds from capital stock sold | | | | 49,309,876 | | | | | 88,690,524 | |
Proceeds from shares issued to shareholders upon reinvestment of dividends and distributions | | | | 176,107 | | | | | — | |
Cost of capital stock repurchased | | | | (9,975,917 | ) | | | | (1,996,990 | ) |
| | | | | | | | | | |
Net increase from capital stock transactions | | | | 39,510,066 | | | | | 86,693,534 | |
| | | | | | | | | | |
Total change in net assets | | | | 52,985,789 | | | | | 90,049,534 | |
| | | | | | | | | | |
| | |
NET ASSETS | | | | | | | | | | |
Beginning of period | | | | 98,678,078 | | | | | 8,628,544 | |
| | | | | | | | | | |
End of period | | | $ | 151,663,867 | | | | $ | 98,678,078 | |
| | | | | | | | | | |
| | |
CHANGE IN CAPITAL STOCK OUTSTANDING | | | | | | | | | | |
Shares of capital stock sold | | | | 6,780,535 | | | | | 12,722,603 | |
Shares issued to shareholders upon reinvestment of dividends and distributions | | | | 23,607 | | | | | — | |
Shares of capital stock repurchased | | | | (1,352,254 | ) | | | | (283,453 | ) |
| | | | | | | | | | |
Change in capital stock outstanding | | | | 5,451,888 | | | | | 12,439,150 | |
| | | | | | | | | | |
See accompanying Notes to Financial Statements.
28
POLAR CAPITAL FUNDS
STATEMENTS OF CHANGES IN NET ASSETS
| | | | | |
| | | Polar Capital Emerging Market ex-China Stars Fund |
| | | Period Ended
March 31, 2024* |
INCREASE (DECREASE) IN NET ASSETS | | | | | |
Operations: | | | | | |
Net investment income (loss) | | | $ | 1,370 | |
Net realized gain | | | | 13,021 | |
Net change in unrealized appreciation (depreciation) | | | | 123,716 | |
| | | | | |
Net increase in net assets resulting from operations | | | | 138,107 | |
| | | | | |
| |
Distributions to shareholders | | | | (5,521 | ) |
| | | | | |
| |
Capital stock transactions: | | | | | |
Proceeds from capital stock sold | | | | 1,000,010 | |
Proceeds from shares issued to shareholders upon reinvestment of dividends and distributions | | | | 4,693 | |
Cost of capital stock repurchased | | | | (10 | ) |
| | | | | |
Net increase from capital stock transactions | | | | 1,004,693 | |
| | | | | |
Total change in net assets | | | | 1,137,279 | |
| | | | | |
| |
NET ASSETS | | | | | |
Beginning of period | | | | — | |
| | | | | |
End of period | | | $ | 1,137,279 | |
| | | | | |
| |
CHANGE IN CAPITAL STOCK OUTSTANDING | | | | | |
Shares of capital stock sold | | | | 100,000 | |
Shares issued to shareholders upon reinvestment of dividends and distributions | | | | 453 | |
Shares of capital stock repurchased | | | | (1 | ) |
| | | | | |
Change in capital stock outstanding | | | | 100,452 | |
| | | | | |
| * | For the period from June 30, 2023 (Commencement of Operations) to March 31, 2024. |
See accompanying Notes to Financial Statements.
29
POLAR CAPITAL EMERGING MARKET STARS FUND
FINANCIAL HIGHLIGHTS
Selected Data for Each Share of Capital Stock Outstanding Throughout Each Year
| | | | | | | | | | | | | | | | | | | | | | | | |
| | | Year
Ended
March 31, | | | Period Ended
March 31, | |
| | | 2024 | | | 2023 | | | 2022 | | | 2021* | |
Per share operating performance: | | | | | | | | | | | | | | | | | | | | | | | | |
Net asset value at beginning of period | | $ | 7.31 | | | $ | 8.20 | | | $ | 10.08 | | | | | | | $ | 10.00 | | | | | |
| | | | | | | | | | | | | | | | | | | | | | | | |
| | | | | | |
Income from investment operations: | | | | | | | | | | | | | | | | | | | | | | | | |
Net investment income (loss)(a) | | $ | 0.03 | | | $ | (0.02 | ) | | $ | (0.01 | ) | | | | | | $ | (0.02 | ) | | | | |
Net realized and unrealized gain (loss) on investment securities | | | 0.70 | | | | (0.87 | ) | | | (1.52 | ) | | | | | | | 0.10 | | | | | |
| | | | | | | | | | | | | | | | | | | | | | | | |
Total Investment from operations | | $ | 0.73 | | | $ | (0.89 | ) | | $ | (1.53 | ) | | | | | | $ | 0.08 | | | | | |
| | | | | | | | | | | | | | | | | | | | | | | | |
| | | | | | |
Less distributions: | | | | | | | | | | | | | | | | | | | | | | | | |
Distributions from net investment income | | $ | (0.03 | ) | | $ | — | | | $ | (0.09 | ) | | | | | | $ | — | | | | | |
Distributions from net realized capital gains | | | — | | | | — | | | | (0.26 | ) | | | | | | | — | | | | | |
| | | | | | | | | | | | | | | | | | | | | | | | |
Total distributions | | $ | (0.03 | ) | | $ | — | | | $ | (0.35 | ) | | | | | | $ | — | | | | | |
| | | | | | | | | | | | | | | | | | | | | | | | |
Net asset value, end of period | | $ | 8.01 | | | $ | 7.31 | | | $ | 8.20 | | | | | | | $ | 10.08 | | | | | |
| | | | | | | | | | | | | | | | | | | | | | | | |
Total investment return(b), (c) | | | 10.05% | | | | (10.85 | )% | | | (15.66 | )% | | | | | | | 0.80% | | | | | |
| | | | | | |
Ratios/supplemental data: | | | | | | | | | | | | | | | | | | | | | | | | |
Net assets, end of period (in $000’s) | | $ | 151,664 | | | $ | 98,678 | | | $ | 8,629 | | | | | | | $ | 10,079 | | | | | |
Ratio of expenses to average net assets | | | | | | | | | | | | | | | | | | | | | | | | |
Before waiver/reimbursement (d) | | | 1.63% | | | | 2.45% | | | | 4.70% | | | | | | | | 5.34% | | | | | |
After waiver/reimbursement(d) | | | 1.00% | | | | 1.00% | | | | 1.00% | | | | | | | | 1.00% | | | | | |
Ratio of net investment income to average net assets: | | | | | | | | | | | | | | | | | | | | | | | | |
Before waiver/reimbursement(d) | | | (0.17 | )% | | | (1.80 | )% | | | (3.84 | )% | | | | | | | (5.14 | )% | | | | |
After waiver/reimbursement(d) | | | 0.46% | | | | (0.35 | )% | | | (0.14 | )% | | | | | | | (0.80 | )% | | | | |
| | | | | | |
Portfolio turnover rate(b) | | | 38% | | | | 29% | | | | 38% | | | | | | | | 15% | | | | | |
| * | For the period from December 30, 2020 (Commencement of Operations) to March 31, 2021. |
| (a) | Per share amount is based on average shares outstanding. |
| (b) | Not annualized for periods less than a year. |
| (c) | Return is based on net asset value per share, adjusted for reinvestment of distributions, and does not reflect deduction of the sales charge. |
| (d) | Annualized for periods less than one year. |
See accompanying Notes to Financial Statements.
30
POLAR CAPITAL EMERGING MARKET EX-CHINA STARS FUND
FINANCIAL HIGHLIGHTS
Selected Data for Each Share of Capital Stock Outstanding Throughout The Period
| | | | | |
| | | Period Ended
March 31, |
| | | 2024* |
Per share operating performance: | | | | | |
Net asset value, beginning of period | | | $ | 10.00 | |
| | | | | |
| |
Income from investment operations: | | | | | |
Net investment income (loss)(a) | | | $ | 0.01 | |
Net realized and unrealized gain (loss) on investment securities | | | | 1.37 | |
| | | | | |
Total from investment operations | | | $ | 1.38 | |
| | | | | |
Distributions from net realized capital gains | | | | (0.06 | ) |
Total distributions | | | $ | (0.06 | ) |
| | | | | |
Net asset value, end of period | | | $ | 11.32 | |
| | | | | |
Total investment return(b), (c) | | | | 13.82% | |
| |
Ratios/supplemental data: | | | | | |
Net assets, end of period (in $000’s) | | | $ | 1,137 | |
Ratio of expenses to average net assets | | | | | |
Before waiver/reimbursement(d) | | | | 27.51% | |
After waiver/reimbursement(d) | | | | 1.00% | |
Ratio of net investment income to average net assets: | | | | | |
Before waiver/reimbursement(d) | | | | (26.33 | )% |
After waiver/reimbursement(d) | | | | 0.18% | |
| |
Portfolio turnover rate(b) | | | | 22% | |
| * | For the period from June 30, 2023 (Commencement of Operations) to March 31, 2024. |
| (a) | Per share amount is based on average shares outstanding. |
| (b) | Not annualized for periods less than a year. |
| (c) | Return is based on net asset value per share, adjusted for reinvestment of distributions, and does not reflect deduction of the sales charge. |
| (d) | Annualized for periods less than one year. |
See accompanying Notes to Financial Statements.
31
POLAR CAPITAL FUNDS
NOTES TO FINANCIAL STATEMENTS
March 31, 2024
NOTE 1 — Organization
Datum One Series Trust (the “Trust”) is a Massachusetts business trust operating under an Amended and Restated Agreement and Declaration of Trust (the “Trust Agreement”) dated March 3, 2020. The Trust is an open-end management investment company registered under the Investment Company Act of 1940, as amended (the “1940 Act”). The Trust Agreement permits the Board of Trustees (the “Trustees” or “Board”) to authorize and issue an unlimited number of shares of beneficial interest, at no par value, in separate series of the Trust. The Trust consists of two series, Polar Capital Emerging Market Stars Fund (“Emerging Market Stars Fund”) and Polar Capital Emerging Market ex-China Stars Fund (“Emerging Market ex-China Stars Fund”) (together the “Funds”; each a “Fund”). These financial statements and notes only relate to these Funds.
The Funds are non-diversified funds, meaning each may invest in a smaller number of companies than a diversified fund. The Funds seek to achieve long term capital growth. For information on the specific strategies of the Funds, please refer to the Funds’ Prospectus.
Under the Trust’s organizational documents, its Officers and Trustees are indemnified against certain liabilities arising out of the performance of their duties to the Trust and Funds. In addition, in the normal course of business, the Trust enters into contracts with its vendors and others that provide for general indemnifications. The Funds’ maximum exposure under these arrangements is unknown, as this would involve future claims that may be made against the Funds.
NOTE 2 — Significant Accounting Policies
The Funds are investment companies that apply the accounting and reporting guidance issued in Topic 946 by the U.S. Financial Accounting Standards Board. The financial statements of the Funds have been prepared in conformity with accounting principles generally accepted in the United States of America (“U.S. GAAP”).
The Funds’ investments are reported at fair value as defined by U.S. GAAP. The Funds generally determine their net asset value as of approximately 4:00 p.m. New York time each day the New York Stock Exchange is open. Further discussion of valuation methods, inputs and classifications can be found under Disclosure of Fair Value Measurements.
| B. | Securities Transactions, Related Investment Income and Foreign Currency Translations |
Securities transactions are accounted for on the date the securities are purchased or sold. Dividend income and distributions to shareholders are recorded on the ex-dividend date. Interest income and expenses are recorded on an accrual basis. The books and records of the Funds are maintained in U.S. dollars as follows: (1) the foreign currency fair value of investment securities, and other assets and liabilities stated in foreign currencies, are translated using the daily spot rate; and (2) purchases, sales, income and expenses are translated at the rate of exchange prevailing on the respective dates of such transactions.
32
POLAR CAPITAL FUNDS
NOTES TO FINANCIAL STATEMENTS (Continued)
March 31, 2024
The Funds do not isolate that portion of the results of operations resulting from changes in foreign exchange rates on investments from the fluctuations arising from changes in market prices of securities held. Such fluctuations are included with the “Net realized gain (loss) on investments” and “Net change in unrealized appreciation (depreciation) of investments” on the Statements of Operations.
Net realized gains and losses from foreign currency transactions arise from sales of foreign currency, currency gains or losses realized between the trade and settlement dates on securities transactions, and the difference between the amounts of dividends, interest, and foreign withholding taxes recorded on each Fund’s books, and the U.S. dollar equivalent of the amounts actually received or paid. Net unrealized appreciation or depreciation on translation of assets and liabilities denominated in foreign currencies arise from changes in the value of assets and liabilities other than investments in securities at the period end, resulting from changes in the exchange rates.
Expenses directly attributable to a fund in the Trust are charged to that fund, while expenses that are attributable to more than one fund in the Trust are allocated among the applicable funds on a pro-rata basis to each adviser’s series of funds based on relative net assets or another reasonable basis.
The preparation of the financial statements in accordance with U.S. GAAP requires management to make estimates and assumptions that affect the amounts reported. Actual results could differ from those estimates.
NOTE 3 — Principal Risks
It is possible to lose money on an investment in a Fund: The Funds will be affected by the investment decisions, techniques and risk analyses of the Funds’ Adviser and there is no guarantee that a Fund will achieve its investment objective. Any of the following risks, among others, could affect the performance of the Funds or cause the Funds to lose money or to underperform market averages of other funds. Each risk summarized below is considered to be a “principal risk” of investing in the Funds, regardless of the order in which it appears.
Risks Associated with Investing in Equities: The Funds may invest in equity and equity-related securities traded on recognized stock exchanges and over-the-counter markets. Equity securities will be subject to risks associated with such investments, including fluctuations in market prices, adverse issuer or market information and the fact that equity and equity-related interests are subordinate in the right of payment to other corporate securities, including debt securities. The value of these securities varies with the performance of the respective issuers and movements in the equity markets generally. As a result, the Funds may suffer losses if they invest in equity securities of issuers where performance falls below market expectations or if equity markets in general decline or the Funds have not hedged against such a general decline. Futures and options on futures on equity securities and indices are subject to all the foregoing risks, in addition to the risks particularly associated with futures and derivative contracts.
ESG Investing Risk: The Funds’ consideration of environmental, social and/or governance factors as part of their investment process may cause them to make different investments than funds that have a similar investment universe and/or investment style but that do not incorporate such factors in their strategy or investment
33
POLAR CAPITAL FUNDS
NOTES TO FINANCIAL STATEMENTS (Continued)
March 31, 2024
processes. Additionally, the Funds may forgo opportunities to buy certain securities when it might otherwise be advantageous to do so, or sell securities when it might be otherwise disadvantageous for it to do so. Incorporating ESG factors into investment decision making is qualitative and subjective by nature, and there is no guarantee that the factors considered by the Adviser or any judgment exercised by the Adviser will reflect the beliefs or values of any particular investor. Socially responsible norms differ by region and industry, and a company’s ESG practices or the Adviser’s assessment of a company’s ESG practices may change over time.
Risks Associated with Investing in Emerging Markets: The Funds’ investments in non-U.S. issuers in developing or emerging market countries may involve increased exposure to changes in economic, social and political factors as compared to investments in more developed countries. The economies of most emerging market countries are in the early stage of capital market development and may be dependent on relatively fewer industries. As a result, their economic systems are still evolving. Their legal and political systems may also be less stable than those in developed economies. Securities markets in these countries can also be smaller, and there may be increased settlement risks. The Public Company Accounting Oversight Board, which regulates auditors of U.S. companies, is unable to inspect audit work papers in certain foreign countries. Investors in emerging markets often have limited rights and few practical remedies to pursue shareholder claims, including class actions or fraud claims, and the ability of the U.S. Securities and Exchange Commission, the U.S. Department of Justice and other authorities to bring and enforce actions against foreign issuers or foreign persons is limited. Emerging market countries often suffer from currency devaluation and higher rates of inflation. Due to these risks, securities issued in developing or emerging countries may be more volatile, less liquid, and harder to value than securities issued in more developed countries.
Investment in China (principal risk for the Emerging Market Stars Fund): The Chinese economy is generally considered an emerging and volatile market. Although China has experienced a relatively stable political environment in recent years, there is no guarantee that such stability will be maintained in the future. Political, regulatory and diplomatic events, such as the U.S.-China “trade war” that intensified in 2018, could have an adverse effect on the Chinese or Hong Kong economies and on investments made through Stock Connect program. Investing in securities of Chinese issuers, including by investing in A Shares, involves certain risks and considerations not typically associated with investing in securities of U.S. issuers, including, among others, (i) more frequent (and potentially widespread) trading suspensions and government interventions with respect to Chinese issuers, resulting in a lack of liquidity and in price volatility, (ii) currency revaluations and other currency exchange rate fluctuations or blockage, (iii) the nature and extent of intervention by the Chinese government in the Chinese securities markets, whether such intervention will continue and the impact of such intervention or its discontinuation, (iv) the risk of nationalization or expropriation of assets, (v) the risk that the Chinese government may decide not to continue to support economic reform programs, (vi) potentially higher rates of inflation, (vii) the unavailability of consistently-reliable economic data, (viii) the relatively small size and absence of operating history of many Chinese companies, (ix) accounting, auditing and financial reporting standards in China are different from U.S. standards and, therefore, disclosure of certain material information may not be available, the quality of financial information may vary and the Public Company Accounting Oversight Board, which regulates auditors of U.S. public companies, is unable to inspect audit work papers in certain foreign countries, including China, (x) greater political, economic, social, legal and tax-related uncertainty, (xi) higher market volatility caused by any potential regional territorial conflicts or natural disasters, (xii) higher dependence on exports and
34
POLAR CAPITAL FUNDS
NOTES TO FINANCIAL STATEMENTS (Continued)
March 31, 2024
international trade, (xiii) the risk of increased trade tariffs, embargoes and other trade limitations, (xiv) restrictions on foreign ownership, and (xv) custody risks associated with investing through programs to access Chinese securities. Significant portions of the Chinese securities markets may become rapidly illiquid, as Chinese issuers have the ability to suspend the trading of their equity securities, and have shown a willingness to exercise that option in response to market volatility and other events. The liquidity of Chinese securities may shrink or disappear suddenly and without warning as a result of adverse economic, market or political events, or adverse investor perceptions, whether or not accurate.
Stock Connect Investing Risk (principal risk for the Emerging Market Stars Fund): China “A Shares” are equity securities of issuers incorporated in mainland China that are denominated and currently traded in Renminbi (“RMB”) on the Shanghai or Shenzhen Stock Exchanges. Subject to minor exceptions, under current regulations in China, foreign investors, such as the Emerging Market Stars Fund, can invest in A Shares only (i) through certain institutional investors that have obtained a license and quota from the Chinese regulators or (ii) through the Hong Kong-Shanghai Stock Connect or Shenzhen-Hong Kong Stock Connect programs. The Emerging Market Stars Fund will invest in A Shares listed and traded on the SSE or Shenzhen Stock Exchange (“SZSE”) through the Stock Connect program, or on such other stock exchanges in China which participate in the Stock Connect program from time to time. The Emerging Market Stars Fund’s investments in Stock Connect A Shares are generally subject to Chinese securities regulations and listing rules, among other restrictions that may affect the Emerging Market Stars Fund’s investments and returns, including daily limits on net purchases and transfer restrictions. In addition, the Stock Connect program’s trading, clearance and settlement procedures are relatively untested in China, which could pose risks to the Emerging Market Stars Fund. While overseas investors currently are exempt from paying capital gains or value added taxes on income and gains from investments in Stock Connect A Shares, these Chinese tax rules could be changed, which could result in unexpected tax liabilities for the Emerging Market Stars Fund.
The Stock Connect program will only operate on days when both the Chinese and Hong Kong markets are open for trading and when banks in both markets are open on the corresponding settlement days. There may be occasions when the Emerging Market Stars Fund may be subject to the risk of price fluctuations of A Shares during the time when the Stock Connect program is not trading. Because of the way in which China A shares are held in Stock Connect, the Emerging Market Stars Fund may not be able to exercise the rights of a shareholder and may be limited in its ability to pursue claims against the issuer of a security, and may suffer losses in the event the depository of the SSE or the SZSE becomes insolvent. Only certain China A shares are eligible to be accessed through the Stock Connect program. Such securities may lose their eligibility at any time, in which case they presumably could be sold but could no longer be purchased through the Stock Connect program. The Stock Connect program is a relatively new program. Further developments are likely and there can be no assurance as to the program’s continued existence or whether future developments regarding the program may restrict or adversely affect the Emerging Market Stars Fund’s investments or returns. In addition, the application and interpretation of the laws and regulations of Hong Kong and China, and the rules, policies or guidelines published or applied by relevant regulators and exchanges in respect of the Stock Connect program are uncertain, and they may have a detrimental effect on the Emerging Market Stars Fund’s investments and returns.
35
POLAR CAPITAL FUNDS
NOTES TO FINANCIAL STATEMENTS (Continued)
March 31, 2024
Derivatives Risk: The use of derivatives involves the risk that their value may not move as expected relative to the value of the relevant underlying assets, rates, or indices. Derivatives also present other risks, including market risk, liquidity risk, and counterparty risk.
Market Risk: The value of securities and instruments owned by the Funds may rise and fall, sometimes rapidly or unpredictably, due to factors affecting securities markets generally or particular industries or geographic areas.
Liquidity Risk: In some circumstances, investments may be relatively illiquid making it difficult to acquire or dispose of them at the prices quoted on the various exchanges. Accordingly, the Funds’ ability to respond to market movements may be impaired and the Funds may experience adverse price movements upon liquidation of their investments. Settlement of transactions may be subject to delay and administrative uncertainties.
Counterparty and Third Party Risk: Transactions involving a counterparty (including a clearing member or clearing house through which the Funds hold a derivative position) to a derivative contract, repurchase agreement, reverse repurchase agreement, or other financial instrument, or a third party responsible for servicing the instrument, are subject to the credit risk of the counterparty or third party, and to the counterparty’s or third party’s ability to perform in accordance with the terms of the transaction.
Large Investor Risk: Ownership of shares of the Funds may be concentrated in one or a few large investors. Such investors may redeem shares in large quantities or on a frequent basis. Redemptions by a large investor may affect the performance of the Funds, may increase realized capital gains, may accelerate the realization of taxable income or gains for shareholders and may increase transaction costs. These transactions potentially limit the use of any capital loss carryforwards and certain other losses to offset future realized capital gains (if any). Such transactions may also increase the Funds’ expenses. In addition, the Funds may be delayed in investing new cash after a large shareholder purchase, and under such circumstances may be required to maintain a larger cash position than they ordinarily would.
Management Risk: The Funds are subject to management risk as an actively managed investment portfolio. The portfolio managers will apply investment techniques and risk analyses in making investment decisions for the Funds, but there can be no guarantee that these will produce the desired results. The portfolio managers’ opinion about the intrinsic worth or creditworthiness of a company or security may be incorrect, the portfolio managers may not make timely purchases or sales of securities for the Funds, the Funds’ investment objective may not be achieved, or the market may continue to undervalue the Funds’ securities. In addition, the Funds may not be able to quickly dispose of certain securities holdings. Moreover, there can be no assurance that the personnel of the Adviser will continue to be associated with the Adviser for any length of time, and the loss of services of one or more key employees of the Adviser, including the portfolio managers, could have an adverse impact on the Funds’ ability to achieve their investment objective. Certain securities or other instruments in which the Funds seek to invest may not be available in the quantities desired. In such circumstances, the portfolio managers may determine to purchase other securities or instruments as substitutes. Such substitute securities or instruments may not perform as intended, which could result in losses to the Funds.
Risks Associated with Non-Diversification: The Funds are non-diversified, which generally means that they may invest a greater percentage of their total assets in the securities of fewer issuers than a “diversified” fund. This increases the risk that a change in the value of any one investment held by the Funds could affect the overall
36
POLAR CAPITAL FUNDS
NOTES TO FINANCIAL STATEMENTS (Continued)
March 31, 2024
value of the Funds more than it would affect that of a diversified fund holding a greater number of investments. Accordingly, the Funds’ value will likely be more volatile than the value of a more diversified fund. In addition, due to its relatively low number of holdings, the Funds will be more susceptible to company-specific events and risks impacting the particular securities held by the Funds than a fund with a greater number of holdings.
Risks Associated with Changes to Non-U.S. Tax Laws: Fund investors should also consider the possibility of changes to non-U.S. tax laws and regulations (including potential retroactive changes) which may adversely affect certain investments made by the Funds, including as a result of the Action Plan on Base Erosion and Profit Shifting (“BEPS”), which has been developed with the aim of securing revenue by realigning taxation with economic activities and value creation by creating a single set of consensus based international tax rules. As part of the BEPS project, it is anticipated that new rules dealing with the operation of double tax treaties, the definition of permanent establishments, interest deductibility and how hybrid instruments and hybrid entities are taxed will have been and continue to be introduced. To facilitate implementation of the BEPS project, the Multilateral Convention to Implement Tax Treaty Related Measures to Prevent Base Erosion and Profit Shifting has modified, and continues to modify, a wide range of double tax treaty provisions. In addition, the European Council’s Anti-Tax Avoidance Directive addresses many of the same issues. These initiatives could adversely affect the Funds or certain or all Fund investors, including but not limited to causing additional reporting and disclosure obligations for Fund investors. In addition, there may be changes in the tax laws or interpretations of tax laws in jurisdictions in which the Funds, and/or any entity owned directly or indirectly by the Funds, are established, are operating, are managed, are advised, are promoted or are investing, or in which Fund investors are resident, that are adverse to the Funds, and/or any entities owned directly or indirectly by the Funds and/or the Fund investors. Changes to taxation treaties or interpretations of taxation treaties between one or more such jurisdictions and the countries through which the Funds and/or any entities owned directly or indirectly by the Funds hold investments or in which a Fund investor is resident or the introduction of, or change to, EU Directives (including but not limited to the Anti-Tax Avoidance Directives) may adversely affect the ability of the Funds and/or any entities owned directly or indirectly by the Funds to efficiently realize income or capital gains. Consequently, it is possible that the Funds and/or any entities owned directly or indirectly by the Funds may face unfavorable tax treatment in such jurisdictions that may materially adversely affect the value of the investments held by the Funds and/ or any entities owned directly or indirectly by the Funds or the feasibility of making investments in certain countries.
Participatory Notes Risk: An investment in participatory notes is subject to market risk. The performance results of participatory notes may not exactly replicate the performance of the underlying securities. An investment in participatory notes is also subject to counterparty risk, relating to the non-U.S. bank or broker-dealer that issues the participatory notes, and may be subject to liquidity risk.
Currency Risk: The currencies in which investments are denominated may be unstable, may be subject to significant depreciation and may not be freely convertible.
Custody Risk: In a limited number of markets, particularly in emerging economies, where a no failed trade policy is standard market practice, assets may be assigned, transferred, exchanged or delivered without the prior approval of the Depositary or its agent. Once a sale order is placed in relation to assets of the Funds, by virtue
37
POLAR CAPITAL FUNDS
NOTES TO FINANCIAL STATEMENTS (Continued)
March 31, 2024
of the operation of the settlement system within those markets, those assets will automatically move from custody of the Depositary without the need for the prior approval of the Depositary. Where this occurs the consideration for those assets is remitted to the entity releasing the assets.
Cyber Security Risk: The Funds and their service providers are susceptible to operational and information security and related risks of cyber security incidents. In general, cyber incidents can result from deliberate attacks or unintentional events. Cyber security attacks include, but are not limited to, gaining unauthorized access to digital systems (e.g., through “hacking” or malicious software coding) for purposes of misappropriating assets or sensitive information, corrupting data or causing operational disruption. Cyber-attacks also may be carried out in a manner that does not require gaining unauthorized access, such as causing denial-of-service attacks on websites (i.e., efforts to make services unavailable to intended users). Cyber security incidents affecting the Funds, Adviser, Custodian or Administrator or other service providers such as financial intermediaries have the ability to cause disruptions and impact business operations, potentially resulting in financial losses, including by interference with the Funds’ ability to calculate its NAV; impediments to trading for the Funds’ portfolio; the inability of Shareholders to transact business with the Funds; violations of applicable privacy, data security or other laws; regulatory fines and penalties; reputational damage; reimbursement or other compensation or remediation costs; legal fees; or additional compliance costs. Similar adverse consequences could result from cyber security incidents affecting issuers of securities in which the Funds invest, counterparties with which the Funds engage in transactions, governmental and other regulatory authorities, exchange and other financial market operators, banks, brokers, dealers, insurance companies and other financial institutions and other parties. While information risk management systems and business continuity plans have been developed which are designed to reduce the risks associated with cyber security, there are inherent limitations in any cyber security risk management systems or business continuity plans, including the possibility that certain risks have not been identified.
Because of these and other risks, you could lose money by investing in the Funds.
An investment in a Fund is not a bank deposit and is not insured or guaranteed by the Federal Deposit Insurance Corporation or any other government agency.
NOTE 4 — Purchases and Sales of Investment Securities
For the year ended March 31, 2024 the aggregate costs of purchases and proceeds from sales of securities (excluding short-term investments) for the Funds were as follows:
| | | | | | | | | | |
| | | Cost of | | Proceeds of |
| | | Purchases of | | Investment securities |
| | | Investment securities | | sold |
Emerging Market Stars Fund | | | | $83,737,241 | | | | | $44,931,508 | |
Emerging Market ex-China Stars Fund* | | | | 1,193,560 | | | | | 216,032 | |
| * | For the period from June 30, 2023 (Commencement of Operations) to March 31, 2024. |
38
POLAR CAPITAL FUNDS
NOTES TO FINANCIAL STATEMENTS (Continued)
March 31, 2024
NOTE 5 — Federal Income Tax
No provision for federal income tax is required because each of the Funds has elected to be taxed as a “regulated investment company” under the Internal Revenue Code (the “Code”) and intends to maintain this qualification and to distribute each year to its shareholders, in accordance with the minimum distribution requirements of the Code, its taxable net investment income and taxable net realized gains on investments.
At March 31, 2024, the components of distributable earnings (loss) on a tax basis were as follows:
| | | | | | | | | | | | | | | | | | | | |
| | | Undistributed
Ordinary
Income | | Undistributed
Long Term
Capital
Gains | | Accumulated
Capital
and Other
Losses | | Unrealized
Appreciation /
(Depreciation) |
Emerging Market Stars Fund | | | $ | 146,613 | | | | $ | — | | | | $ | (3,736,533 | ) | | | $ | 18,618,825 | |
Emerging Market ex-China Stars Fund | | | | 15,192 | | | | | — | | | | | — | | | | | 117,446 | |
Income dividends and capital gains distributions are determined in accordance with federal income tax regulations. The timing and character of distributions determined in accordance with federal income tax regulations may differ from financial statement amounts determined in accordance with U.S. GAAP. Accordingly, the Fund may periodically make reclassifications among the capital accounts to reflect differences between financial reporting and federal income tax basis distributions. The reclassifications are reported in order to reflect the tax treatment for certain permanent differences that exist between income tax regulations and U.S. GAAP. These reclassifications primarily relate to non-deductible expenses. These reclassifications have no impact on the net assets or the NAV per share of the Fund.
At March 31, 2024, the following reclassifications were recorded:
| | | | | | | | | | |
| | | Distributable Earnings | | Paid-in Capital |
Emerging Market Stars Fund | | | $ | — | | | | $ | — | |
Emerging Market ex-China Stars Fund | | | | 52 | | | | | (52 | ) |
39
POLAR CAPITAL FUNDS
NOTES TO FINANCIAL STATEMENTS (Continued)
March 31, 2024
The tax status of distributions paid during the fiscal years ended March 31, 2024 and March 31, 2023 were as follows:
| | | | | | | | | | | | | | | | |
| | | Dividends
from
Ordinary
Income
2024 | | | Dividends
from
Long-term
Capital Gains
2024 | | Total
Distributions
2024 | | | Dividends
from
Ordinary
Income
2023 | | Dividends
from
Long-term
Capital Gains
2023 | | Total
Distributions
2023 |
Emerging Market Stars Fund | | | $581,602 | | | $— | | | $581,602 | | | $— | | $— | | $— |
Emerging Market ex-China Stars Fund | | | 5,521 | | | — | | | 5,521 | | | — | | — | | — |
As of March 31, 2024, the cost, gross unrealized appreciation and gross unrealized depreciation on investments, for Federal income tax purposes, were as follows:
| | | | | | | | | | | | | | | | | | | | |
| | | Tax Cost | | Tax Unrealized
Appreciation | | Tax Unrealized
(Depreciation) | | Net Unrealized
Appreciation
(Depreciation) |
Emerging Market Stars Fund | | | | $129,141,941 | | | | | $28,564,183 | | | | | $(9,241,500 | ) | | | | $19,322,683 | |
Emerging Market ex-China Stars Fund | | | | 1,001,035 | | | | | 181,596 | | | | | (56,428 | ) | | | | 125,168 | |
Certain countries assess a capital gains tax on securities sold in their local markets. This tax is accrued as the securities in these foreign markets appreciate in value and is paid at the time of sale to the extent a capital gain is realized. Taxes accrued on securities in an unrealized appreciation position are included in “Net change in unrealized appreciation (depreciation) on deferred foreign capital gains tax” on the Statement of Operations. The capital gains tax paid on securities sold, if any, is included in “Net realized gain (loss) on foreign capital gains tax” on the Statements of Operations and any amounts unpaid are accrued and included in Foreign capital gains taxes payable on the Statements of Assets and Liabilities.
As of and for the fiscal year ended March 31, 2024, the Funds did not have any liability for unrecognized tax benefits. The Funds recognize interest and penalties, if any, related to unrecognized tax benefits as income tax expense in the Statement of Operations. For the year ended March 31, 2024, the Funds did not incur any interest or penalties. The statute of limitations remains open for 3 years, once a return is filed. No examinations are in progress at this time.
40
POLAR CAPITAL FUNDS
NOTES TO FINANCIAL STATEMENTS (Continued)
March 31, 2024
As of March 31, 2024, the short-term and long-term capital loss carryforwards were as follows:
| | | | |
| | | Short-Term Capital Loss
Carryforward | | Long-Term Capital Loss
Carryforward |
Emerging Market Stars Fund | | $3,621,846 | | $114,687 |
Emerging Market ex-China Stars Fund | | — | | — |
NOTE 6 — Advisory Fees and Other Affiliated Transactions
Pursuant to an Investment Management Agreement (the “Management Agreement”), advisory fees are accrued daily and paid monthly by the Emerging Market Stars Fund and Emerging Market ex-China Stars Fund to Polar Capital LLP (the “Adviser”). Under the terms of this Management Agreement, the Funds pay the Adviser a monthly fee calculated at the annual rate of 1.00% of the Funds’ average daily net assets. The Adviser has contractually agreed to waive advisory fees expenses and reimburse other expenses to the extent total annual fund operating expenses (exclusive of brokerage costs, interest, taxes, dividends, litigation and indemnification expenses, expenses associated with the investments in underlying investment companies) exceed 1.00% of the average daily net assets of the Funds through July 31, 2025 for the Emerging Market Stars Fund and the Emerging Market ex-China Stars Fund. Amounts waived or reimbursed in a particular contractual period may be recouped by the Adviser for 36 months following the waiver or reimbursement, however, such recoupment will be limited to the lesser of any expense limitation in place at the time of recoupment or the expense limitation in place at the time of waiver or reimbursement. This agreement may only be terminated earlier by the Funds’ Board or upon termination of the Management Agreement.
For the year ended March 31, 2024, the Advisor waived and/or reimbursed the Emerging Market Stars Fund and the Emerging Market ex-China Stars Fund $779,376 and $91,270, respectively, which is reflected as “Waiver/Reimbursement from Adviser” on the Statement of Operations. The amounts eligible for recoupment by the Adviser as of March 31, 2024 are $222,876, $559,630 and $779,376, expiring March 31, 2025, March 31, 2026 and March 31, 2027, respectively for the Emerging Market Stars Fund and $91,270 expiring March 31, 2027 for the Emerging Market ex-China Stars Fund.
Foreside Financial Services, LLC, a wholly owned subsidiary of Foreside Financial Group, LLC (doing business as ACA Group) (the “Distributor”), provides distribution services to the Funds pursuant to a Distribution Agreement with the Trust, on behalf of the Funds. Under its agreement with the Trust, the Distributor acts as an agent of the Trust in connection with the offering of the shares of the Funds on a continuous basis. No compensation is payable by the Trust to the Distributor for such distribution services. The Adviser, at its own expense, pays the Distributor an annual fee in consideration for certain distribution related services.
The Northern Trust Company (the “Administrator”) serves as the administrator, transfer agent, custodian and fund accounting agent for the Funds pursuant to written agreements with the Trust on behalf of the Funds. The Funds have agreed to pay the Administrator a tiered basis-point fee based on the Funds’ net assets and certain per account and transaction charges. The total fee for each Fund is subject to a minimum annual fee of $150,000 relating to these services, and reimbursement for certain expenses incurred on behalf of the Funds, as well as other
41
POLAR CAPITAL FUNDS
NOTES TO FINANCIAL STATEMENTS (Continued)
March 31, 2024
charges for additional service activities. The Administrator has agreed to voluntarily waive its minimum fee and certain other expenses through June 30, 2024 for the Emerging Market ex-China Stars Fund. The waiver agreement may be terminated at any time and the waivers are not subject to recoupment. The total fees paid to or waived by the Administrator for the year ended March 31, 2024 are disclosed on the Statement of Operations in the accounts disclosed below:
| | | | | | | | | | | | | | | | | | | | |
| | | Transfer Agent
Fees and
Expenses | | Custodian Fees | | Fund Accounting and
Administrative Services
and Fees | | Waiver from
Administrator |
Emerging Market Stars Fund | | | | $37,832 | | | | | $90,827 | | | | | $130,000 | | | | | $ — | |
Emerging Market ex-China Stars Fund* | | | | $22,717 | | | | | $ 8,977 | | | | | $ 98,222 | | | | | $(113,333 | ) |
| * | For the period from June 30, 2023 (Commencement of Operations) to March 31, 2024. |
Foreside Fund Officer Services, LLC, a wholly owned subsidiary of Foreside Financial Group, LLC (doing business as ACA Group) (“ACA Group”) provides compliance and financial control services for the Funds pursuant to a written agreement with the Trust, on behalf of the Funds, including providing certain officers to the Funds. The Funds have agreed to pay ACA Group an annual base fee, as well as a basis-point fee based on the Funds’ average daily net assets and has agreed to reimburse ACA Group for certain expenses incurred on behalf of the Funds. Total fees paid to ACA Group pursuant to this agreement are reflected as “Compliance fees” on the Statement of Operations.
Certain Officers and Trustees of the Trust are affiliated with ACA Group, the Administrator, or the Distributor and receive no compensation directly from the Funds for serving in their respective role. For the year ended March 31, 2024, the Emerging Market Stars Fund and the Emerging Market ex-China Stars Fund paid $150,340 and $926, respectively, in Trustee compensation and reimbursement of out-of-pocket expenses allocated from the Trust to the Funds, which is reflected as “Trustee fees and expenses” on the Statement of Operations.
NOTE 7 — Disclosure of Fair Value Measurements
The Funds’ Board of Trustees (the “Board”) has designated the Adviser through its Fair Valuation Committee (the “Committee”) as valuation designee, responsible for determining the fair value of the assets of the Funds for which market quotations are not readily available using valuation procedures approved by the Board. The Committee uses the following methods and inputs to establish the fair value of the Funds’ assets and liabilities. Use of particular methods and inputs may vary over time based on availability and relevance as market and economic conditions evolve.
Equity securities are generally valued each day at the official closing price of, or the last reported sale price on, the exchange or market on which such securities principally are traded, as of the close of business on that day. If there have been no sales that day, the Funds’ equity securities are generally valued at the latest quotations available from the approved pricing service as of the closing of the primary exchange.
42
POLAR CAPITAL FUNDS
NOTES TO FINANCIAL STATEMENTS (Continued)
March 31, 2024
The Committee may use various inputs in order to make a good faith determination of a security’s fair value. These inputs include, but are not limited to, the type and cost of the security; contractual or legal restrictions on resale of the security; relevant financial or business developments of the issuer; actively traded similar or related securities; conversion or exchange rights on the security; related corporate actions; significant events occurring after the close of trading in the security; and changes in overall market conditions. Events occurring after the close of trading on non- U.S. exchanges may result in adjustments to the valuation of foreign securities to reflect their fair value as of the close of regular trading on the NYSE. The Funds may utilize an independent fair valuation service in adjusting the valuations of foreign securities.
The Funds’ assets are classified on three hierarchical levels. Level 1 values are based on quoted market prices in active markets for identical assets. Level 2 values are based on significant observable market inputs, such as quoted prices for similar assets and quoted prices in inactive markets or other market observable inputs as noted above including spreads, cash flows, financial performance, prepayments, defaults, collateral, credit enhancements, and interest rate volatility. Level 3 values are based on significant unobservable inputs that reflect the Committee’s determination of assumptions that market participants might reasonably use in valuing the assets. The valuation levels are not necessarily an indication of the risk associated with investing in those securities.
The following tables present the valuation levels of each Funds’ investments as of March 31, 2024:
| | | | | | | | | | | | | | | | | | | | |
| Emerging Market Stars Fund | | Level 1 | | Level 2 | | Level 3 | | Total |
Investments | | | | | | | | | | | | | | | | | | | | |
Common stocks | | | $ | 99,861,474 | | | | $ | 45,327,455 | | | | $ | — | | | | $ | 145,188,929 | |
Preferred Stocks | | | | 3,275,695 | | | | | — | | | | | — | | | | | 3,275,695 | |
| | | | | | | | | | | | | | | | | | | | |
Total Investments | | | $ | 103,137,169 | | | | $ | 45,327,455 | | | | $ | — | | | | $ | 148,464,624 | |
| | | | | | | | | | | | | | | | | | | | |
| | | | | | | | | | | | | | | | | | | | |
| | | | |
| Emerging Market ex-China Stars Fund | | Level 1 | | Level 2 | | Level 3 | | Total |
Investments | | | | | | | | | | | | | | | | | | | | |
Common stocks | | | $ | 820,114 | | | | $ | 282,026 | | | | $ | — | | | | $ | 1,102,140 | |
Preferred Stocks | | | | 24,063 | | | | | — | | | | | — | | | | | 24,063 | |
| | | | | | | | | | | | | | | | | | | | |
Total Investments | | | $ | 844,177 | | | | $ | 282,026 | | | | $ | — | | | | $ | 1,126,203 | |
| | | | | | | | | | | | | | | | | | | | |
As of March 31, 2024 there were no Level 3 securities held by the Funds. There were no transfers to or from Level 3 for the year ended March 31, 2024.
NOTE 8 — Subsequent Events
Management has evaluated subsequent events for the Funds occurring after March 31, 2024 through the date this report was issued and concluded that no subsequent events occurred which require recognition or disclosure.
43
| | |
 | | Deloitte & Touche LLP 111 S Wacker Drive Chicago, IL 60606 USA |
| |
| | Tel: +1 312 486 1890 Fax: +1 312 247 1890 |
| |
| REPORT OF INDEPENDENT REGISTERED PUBLIC ACCOUNTING FIRM | | www.deloitte.com |
To the Shareholders and Board of Trustees of Datum One Series Trust:
Opinion on the Financial Statements and Financial Highlights
We have audited the accompanying statements of assets and liabilities of Datum One Series Trust comprising the Polar Capital Emerging Market Stars Fund and Polar Capital Emerging Market ex-China Stars Fund (the “Funds”), including the portfolios of investments, as of March 31, 2024; the related statements of operations, the statements of changes in net assets, and the financial highlights for each of the periods listed in the table below, and the related notes.
In our opinion, the financial statements and financial highlights present fairly, in all material respects, the financial position of each of the Funds as of March 31, 2024, and the results of their operations, the changes in their net assets, and the financial highlights for each of the periods listed in the table below in conformity with accounting principles generally accepted in the United States of America.
| | | | | | |
| Fund Name | | Statement of Operations | | Statements of Changes in Net Assets | | Financial Highlights |
| | | |
Polar Capital Emerging Market Stars Fund | | For the year ended March 31, 2024 | | For each of the two years in the period ended March 31, 2024 | | For each of the three years in the period ended March 31, 2024, and for the period from December 30, 2020 (Commencement of Operations) to March 31, 2021 |
| | | |
Polar Capital Emerging Market ex-China Stars Fund | | For the period from June 30, 2023 (Commencement of Operations) to March 31, 2024 | | For the period from June 30, 2023 (Commencement of Operations) to March 31, 2024 | | For the period from June 30, 2023 (Commencement of Operations) to March 31, 2024 |
Basis for Opinion
These financial statements and financial highlights are the responsibility of the Funds’ management. Our responsibility is to express an opinion on the Funds’ financial statements and financial highlights based on our audits. We are a public accounting firm registered with the Public Company Accounting Oversight Board (United States) (PCAOB) and are required to be independent with respect to the Funds in accordance with the U.S. federal securities laws and the applicable rules and regulations of the Securities and Exchange Commission and the PCAOB. We conducted our audits in accordance with the standards of the PCAOB. Those standards require that we plan and perform the audit to obtain reasonable assurance about whether the financial statements and financial highlights are free of material misstatement, whether due to error or fraud. The Funds are not required to have, nor were we engaged to perform, an audit of their internal control over financial reporting. As part of our audits, we are required to obtain an understanding of internal control over financial reporting but not for the purpose of expressing an opinion on the effectiveness of the Funds’ internal control over financial reporting. Accordingly, we express no such opinion.
Our audits included performing procedures to assess the risks of material misstatement of the financial statements and financial highlights, whether due to error or fraud, and performing procedures that respond to those risks. Such procedures included examining, on a test basis, evidence regarding the amounts and disclosures in the financial statements and financial highlights. Our audits also included evaluating the accounting principles used and significant estimates made by management, as well as evaluating the overall presentation of the financial statements and financial highlights. Our procedures included confirmation of securities owned as of March 31, 2024, by correspondence with the custodian and brokers; when replies were not received from brokers, we performed other auditing procedures. We believe that our audits provide a reasonable basis for our opinion.
May 23, 2024
We have served as the auditor of one or more Polar Capital LLP investment companies since 2020.
POLAR CAPITAL FUNDS
ADDITIONAL INFORMATION
March 31, 2024 (Unaudited)
A. Board Approval of Investment Management Agreement for the Polar Capital Emerging Market Stars Fund & Polar Capital Emerging Market ex-China Stars Fund
Section 15 of the Investment Company Act of 1940 (the“1940 Act”) requires that the Investment Management Agreement between Datum One Series Trust (the “Trust”) and Polar Capital, LLP (the “Adviser”) with respect to the Polar Capital Emerging Market Stars Fund (the “Polar EM Fund”) and the Polar Capital Emerging Market ex-China Stars Fund (the “Polar ex-China Fund”, each a “Fund” and together, the “Funds”) be approved by the vote of a majority of the Board of Trustees of the Trust (the “Board”), including a majority of the Trustees who are not “interested persons,” as that term is defined in the 1940 Act (“Independent Trustees”), cast in-person at a meeting called for the purpose of voting on such approval. It is the duty of the Board to request and evaluate, and the duty of the Adviser to furnish, such information as may reasonably be necessary to evaluate the terms of the Investment Management Agreement.
At a meeting held on February 27, 2024 (the “Meeting”), the Board formally considered and approved the continuation of the Investment Management Agreement between the Trust, on behalf of the Funds, and the Adviser, dated March 3, 2020, as amended November 8, 2022, for an additional one-year term ending March 3, 2025. The Meeting was held by videoconference, in reliance on a temporary exemptive order issued by the United States Securities and Exchange Commission (the “SEC”), in light of the novel coronavirus (“COVID-19”) pandemic, permitting mutual fund boards of directors to approve advisory agreements at meetings held using remote communications technology, subject to certain conditions, including that the board ratify the approval at its next in-person meeting (the “Order”). The Board, including each of the Independent Trustees, of the Trust met in person on May 22, 2024, and ratified its approval of the Investment Management Agreement with respect to the Funds, as well as all other agreements it had previously approved in reliance on the Order.
Prior to the Meeting, the Board requested, and the Adviser provided, both written and oral reports containing information in connection with the consideration of the Investment Management Agreement, and the Trustees had the opportunity to ask questions and request further information. In approving the Investment Management Agreement, the Board, including the Independent Trustees advised by independent legal counsel, considered the factors it deemed relevant, including: (1) the nature, extent, and quality of services furnished by the Adviser, projections of the Adviser’s costs of providing the services and possible economies of scale as and if the Funds grow larger, and whether and how the benefits of scale may be shared with the Funds and their shareholders; (2) each Fund’s performance; (3) each Fund’s interest in having a financially strong investment manager capable of competing with other investment advisers and financial institutions in attracting and retaining high quality investment personnel and investigating and employing new investment techniques, and the need to provide staff capable of administering a developing and expanding investment management business; (4) the risks assumed by the Adviser in complying with investment restrictions and applicable securities and tax laws, and its possible substantial liabilities to each Fund for failure to comply; (5) the volatility of the financial markets and thus of investment management fee income; (6) comparative expense ratios and management fees of competitive funds;
45
POLAR CAPITAL FUNDS
ADDITIONAL INFORMATION (Continued)
March 31, 2024 (Unaudited)
(7) fall-out benefits to the Adviser and its affiliates, if any; and (8) the projected profitability of the Adviser from providing services to the Funds. The Board also received and reviewed a memorandum from counsel to the Funds and the independent trustees regarding the Board’s responsibilities in evaluating the Investment Management Agreement.
The Board determined that continuation of the Investment Management Agreement between the Trust, on behalf of the Funds, and the Adviser is in the best interests of the Funds and each Fund’s shareholders in light of the services performed, fees charged and such other matters as the Trustees considered relevant in the exercise of their business judgment. The material factors and conclusions that formed the basis for the Board’s determinations to approve the renewal of the Investment Management Agreement are discussed separately below.
The Board examined the nature, extent, and quality of services provided to the Funds by the Adviser. The Board considered the terms of the Investment Management Agreement, information and reports provided by the Adviser on its personnel and operations, and the Adviser’s experience managing assets using investment strategies similar to the Funds’. The Board reviewed the Adviser’s investment philosophy and portfolio construction process and the Adviser’s compliance program, pending litigation, insurance coverage, and business continuity program. The Board took into account the personnel involved in servicing the Funds as well as the materials and services provided by the Adviser. In connection with its deliberations, the Board considered information provided at or in advance of the Meeting, as well as information provided throughout the year at regular and special Board meetings, including presentations from the Adviser and personnel such as portfolio managers. The Board expressed satisfaction with the quality, extent, and nature of the services provided by the Adviser.
The Board considered the investment performance and expenses of the Funds. As part of this analysis, the Board reviewed an independent report prepared by FUSE Research Network, LLC (the “FUSE Report”). The FUSE Report consisted of comparisons of the Polar EM Fund to (i) twelve funds with the same Morningstar investment category, selected by FUSE, with similar pricing characteristics (the “Peer Group”), (ii) a group of funds comprised of the Peer Group and all other funds with the same Morningstar investment category with similar pricing characteristics, excluding any outliers (the “Universe”), and (iii) the benchmark of the Polar EM Fund. The Board reviewed the Polar EM Fund’s performance for the three month, one-year, three-year, and since inception periods ending December 31, 2023. The Board noted the Fund’s outperformance compared to its Peer Group, noting top percentile performance for three-month period and top quartile performance for the other periods. The Board also reviewed the Polar EM Fund’s performance compared to its Universe and benchmark for each period, noting underperformance for the three-year and since-inception periods. The Board considered the Adviser’s assertion that the Fund’s performance was in the realm of expected outcomes in light of the Fund’s growth-style bias. The FUSE Report also consisted of comparisons of the Polar ex-China Fund to (i) eleven funds in a FUSE selected Peer Group, (ii) the Universe, and (iii) the benchmark of the Polar ex-China Fund. The Board reviewed the Polar ex-China Fund’s performance for the since-inception and three-month periods ending December 31, 2023. The Board noted the Polar ex-China Fund’s underperformance against its Peer Group and benchmark for those periods, and relative outperformance against the Universe. The Board considered FUSE’s assertion that the Polar ex-China Fund belonged to a newer subset of ex-China investment funds, and that the Peer Group was relatively small and comprised of investment funds that self-identified as running ex-China strategies.
46
POLAR CAPITAL FUNDS
ADDITIONAL INFORMATION (Continued)
March 31, 2024 (Unaudited)
The Board then reviewed the performance, net of fees, of other Undertakings for the Collective Investment in Transferable Securities with a similar investment strategy as the Funds managed by the Adviser (“Similar Polar Accounts”) as compared to the Funds over various time periods as well as the management fees of each. The Board noted that the relative performance of each Fund did not vary significantly from the Similar Polar Accounts but for the impact of the different fee structures.
The Board reviewed the management fees paid by each Fund and the total operating expenses of the Funds. The Board noted that, with respect to the Polar EM Fund, the Adviser receives a management fee of 1.00% of the average daily net assets of the Fund and that, under the Expense Limitation Agreement, the Adviser contractually has agreed to waive fees and/or reimburse expenses to the extent necessary to limit the Polar EM Fund’s total operating expenses to the annual rate of 1.00% of the Fund’s average daily net assets through July 31, 2025. The Board also noted that, with respect to the Polar ex-China Fund, the Adviser receives a management fee of 1.00% of the average daily net assets of the Fund and that, under the Expense Limitation Agreement, the Adviser has contractually agreed to waive fees and/or reimburse expenses to the extent necessary to limit the Polar ex-China Fund’s total operating expenses to the annual rate of 1.00% of the Fund’s average daily net assets through July 31, 2025. The Board reviewed comparative data regarding fees and expenses of the each Fund’s Peer Group. The Board concluded that the management fees for both Funds were reasonable.
The Board considered the cost of services provided to the Funds and the profits projected to be realized by the Adviser. The Board discussed with the Adviser the methodology utilized in assembling the information regarding profitability and considered its reasonableness. Taking these factors into account, the Board concluded that the profitability of the Manager and its affiliates in relation to the services rendered was not unreasonable. The Board considered the marketing and distribution efforts undertaken by the Adviser in order to grow the Funds to a size that might result in meaningful profits to the Adviser and in economies of scale to the Funds. The Board considered that economies of scale, if any, may be shared with the Funds in various ways, including low management fees from inception, maintaining existing expense structures in the face of a rising cost environment, as well as technological and personnel investments by the Adviser to enhance shareholder services.
The Board considered that the Adviser may derive fall-out financial or other benefits from its management of the Funds which may include, among other things, enhanced name recognition stemming from the management of the Funds and concluded that any such benefits derived by the Adviser were consistent with the types of benefits generally derived by investment managers to mutual funds.
In its deliberations, the Board did not identify any particular factor or factors that were all-important or controlling, and each Trustee may have assigned different weights to the various factors considered.
B. Board Review of Liquidity Risk Management Program
The Trust has adopted a liquidity risk management program (the “LRMP”) pursuant to Rule 22e-4 under the Investment Company Act of 1940, as amended (the “1940 Act”). The LRMP’s principal objectives are to support the Funds’ compliance with limits on investments in illiquid assets and to mitigate the risk that the Funds are unable to meet their redemption obligations in a timely manner. In this regard, the LRMP includes a number of elements that support the assessment or management of liquidity risk, including an assessment of factors that influence a
47
POLAR CAPITAL FUNDS
ADDITIONAL INFORMATION (Continued)
March 31, 2024 (Unaudited)
Fund’s liquidity and the periodic classification and, as determined necessary, re-classification of a Fund’s investments into buckets that reflect their relative liquidity under current market conditions. The Trust’s Board of Trustees approved the Adviser’s LRMP and the designation of the Adviser’s Group Risk Committee as the administrator of the LRMP for the Adviser on July 2, 2020. The Trust’s Board approved the LRMP of the Trust and the designation of the Trust’s President and Chief Compliance Officer as the administrator of the LRMP for the Trust at its meeting on March 3, 2020. Pursuant to the LRMPs, the Adviser manages liquidity risks associated with the Funds’ investments by monitoring cash and cash equivalents and the concentration of investments, and by classifying the portfolio holdings of each Fund as either highly liquid, moderately liquid, less liquid or illiquid on at least a monthly basis.
At its meeting on December 5, 2023, the Board reviewed a written report from the administrator of the LRMP on the operation and effectiveness of the LRMP for the period from October 1, 2022 through September 30, 2023 (the “Reporting Period”), noting the administrator’s conclusion that each of the Trust’s and the Adviser’s LRMP was adequate and effectively implemented during the Reporting Period. The LRMPs supported the Funds’ ability to honor redemption requests timely and the Adviser’s management of each Fund’s liquidity risk profile, including during any periods of market volatility and net redemptions during the Reporting Period.
Please refer to the Funds’ prospectus for more information regarding each Fund’s exposure to liquidity risk and other risks.
C. Shareholder Expense Example
Fund Expenses
Investors in the Funds generally incur two types of costs: (1) transaction costs, and (2) ongoing costs, including advisory and administrative fees; shareholder service fees; and other Fund expenses. The Example is intended to help you understand your ongoing costs (in dollars) of investing in the Funds and to compare these costs with the ongoing costs of investing in other mutual funds. The Example is based on an investment of $1,000 invested at the beginning of the period and held for the entire period.
Actual Expenses
The information in the table under the heading “Actual Performance” provides information about actual account values and actual expenses. You may use the information in this column, together with the amount you invested, to estimate the expenses that you paid over the period. Simply divide your account value by $1,000 (for example, an $8,600 account value divided by $1,000 = 8.6), then multiply the result by the first number in the row entitled “Expenses Paid During Period” that corresponds to your Fund to estimate the expenses you paid on your account during this period.
Hypothetical Example for Comparison Purposes
The information in the table under the heading “Hypothetical Performance (5% return before expenses)” provides information about hypothetical account values and hypothetical expenses based on the Fund’s actual expense ratio and an assumed rate of return of 5% per year before expenses, which is not the Fund’s actual return. The hypothetical account values and expenses may not be used to estimate the actual ending account balance or
48
POLAR CAPITAL FUNDS
ADDITIONAL INFORMATION (Continued)
March 31, 2024 (Unaudited)
expenses you paid for the period. You may use this information to compare the ongoing costs of investing in the Funds and other funds. To do so, compare this 5% hypothetical example with the 5% hypothetical examples that appear in the shareholder reports of other funds.
Please note that the expenses shown in the table are meant to highlight your ongoing costs only and do not reflect any transactional costs. Therefore, the information under the heading “Hypothetical Performance (5% return before expenses)” is useful in comparing ongoing costs only, and will not help you determine the relative total costs of owning different funds. In addition, if these transactional costs were included, your costs would have been higher. Even though the Funds do not charge transaction fees, if you purchase shares through a broker, the broker may charge you a fee. You should evaluate other mutual funds’ transaction fees and any applicable broker fees to assess the total cost of ownership for comparison purposes.
| | | | | | |
Actual Performance | | | | | | |
| | | |
| | | Beginning Account Value | | Ending Account Value | | Expenses Paid During |
Fund | | October 1, 2023 | | March 31, 2024 | | Period* |
Polar Capital Emerging | | | | | | |
Market Stars Fund | | $1,000.00 | | $1,156.50 | | $5.39 |
Polar Capital Emerging | | | | | | |
Market ex-China | | | | | | |
Stars Fund | | $1,000.00 | | $1,180.20 | | $5.45 |
| | | |
Hypothetical Performance | | | | | | |
(5% return before expenses) | | | | | | |
| | | |
| | | Beginning Account Value | | Ending Account Value | | Expenses Paid During |
Fund | | October 1, 2023 | | March 31, 2024 | | Period* |
Polar Capital Emerging | | | | | | |
Market Stars Fund | | $1,000.00 | | $1,020.00 | | $5.05 |
Polar Capital Emerging | | | | | | |
Market ex-China | | | | | | |
Stars Fund | | $1,000.00 | | $1,020.00 | | $5.05 |
*Expenses are calculated using an annualized expense ratio 1.00%, multiplied by the average account value for the period, multiplied by the actual number of operational days in the most recent half fiscal year (183), and divided by the number of days in the current year (366).
49
POLAR CAPITAL FUNDS
ADDITIONAL INFORMATION (Continued)
March 31, 2024 (Unaudited)
D. Other Information
A description of the policies and procedures that the Funds use to determine how to vote proxies relating to portfolio securities is available (i) without charge, upon request, by writing to the Funds at Polar Capital Funds c/o The Northern Trust Company, P.O. Box 4766, Chicago, IL 60680-4766 or by calling (800) 806-1112 (toll free) or (312) 557-3164; and (ii) on the U.S. Securities and Exchange Commission’s (the “SEC”) website at www.sec.gov.
Information regarding how the Funds voted proxies relating to portfolio securities during the most recent 12-month period ended June 30 is available (i) without charge, by calling the Funds at (800) 806-1112 (toll free); and (ii) on the SEC’s website at www.sec.gov.
The Funds file their complete schedule of portfolio holdings with the SEC for the first and third quarters of each fiscal year as an exhibit to their reports on Form N-PORT. The Funds’ Form N-PORT reports are available on the SEC’s website at www.sec.gov. The information on Form N-PORT is also available to shareholders, without charge, upon request, by writing to the Funds at Polar Capital Funds c/o The Northern Trust Company, P.O. Box 4766, Chicago, IL 60680-4766 or by calling (800) 806-1112 (toll free) or (312) 557-3164.
E. Trustees and Officers
Independent Trustees
The following table sets forth certain information concerning the Independent Trustees of the Trust:
| | | | | | | | | | |
Name, Address* and Year of Birth of Independent Trustee | | Positions(s) Held with Trust | | Term of Office and Length of Time Served | | Principal Occupation(s) During Past 5 Years | | Number of Portfolios in Fund
Complex
Overseen by
Trustee** | | Other Directorships Held by Trustee During the Past 5 Years |
JoAnn S. Lilek Year of Birth: 1956 | | Trustee | | Indefinite/ March, 2020 to present | | Advisory Board Member, MGX Beverage Group, 2019 to present; Independent Contractor 2018 to present. | | 10 | | Amalgamated Financial Corporation and Amalgamated Bank, 2021 to present. |
| | | | | |
Patricia A Weiland Year of Birth: 1959 | | Trustee | | Indefinite/ March, 2020 to present | | Consultant, PAW Consulting LLC, 2014 to present. | | 10 | | None. |
| | | | | |
Lloyd A. Wennlund Year of Birth: 1957 | | Trustee | | Indefinite/ March, 2020 to present | | Independent Contractor, June 2017 to present. | | 10 | | Calamos Funds (41 Funds), 2018 to present. |
50
POLAR CAPITAL FUNDS
ADDITIONAL INFORMATION (Continued)
March 31, 2024 (Unaudited)
Interested Trustees
The following table sets forth certain information concerning the Trustees who are “interested persons” (as defined in the 1940 Act) of the Trust:
| | | | | | | | | | |
Name, Address* and Year of Birth of Independent Trustee | | Positions(s) Held with Trust | | Term of Office and Length
of Time Served | | Principal Occupation(s) During Past 5 Years | | Number of
Portfolios in
Fund
Complex
Overseen by
Trustee | | Other Directorships Held by Trustee During the Past 5 Years |
Ryan D. Burns Year of Birth: 1976*** | | Trustee | | Indefinite/ March, 2020 to present | | Senior Vice President, The Northern Trust Company, 1998 to present. | | 10 | | None |
| * | Each Trustee may be contacted at 50 South LaSalle Street, Chicago, Illinois 60603. |
| ** | Polar Capital International Small Company Fund has not yet commenced operations. |
| *** | Mr. Burns may be deemed to be an “interested” person of the Trust, as that term is defined in the 1940 Act, by virtue of his affiliation with the Fund’s administrator and Fund Accounting Agent, Transfer Agent, and Custodian. |
The Statement of Additional Information includes additional information about the Trust’s Trustees and Officers and is available, without charge, upon request, by calling (800) 258-9668 (toll free) or (312) 557-3523.
Officers
The following table sets forth certain information concerning the Trust’s officers. The officers of the Trust are employees of the Trust’s Administrator or Distributor and certain of their affiliates:
| | | | | | |
Name, Address* and Year of Birth of Officer | | Positions(s) Held with Trust | | Term of Office and Length of Time Served | | Principal Occupation(s) During Past 5 Years |
Barbara J. Nelligan Year of Birth: 1969 | | President | | Indefinite/ March, 2020 to present | | Senior Vice President, Global Fund Services Fund Governance Solutions, The Northern Trust Company 2018 to Present; Senior Vice President, Global Fund Services Product Management, The Northern Trust Company 2007 to 2018. |
| | | |
Gregory T. Mino Year of Birth: 1971 | | Vice President | | Indefinite/ December, 2023 to present | | Senior Vice President, Global Fund Services Fund Governance Solutions, The Northern Trust Company, 2024 to present; Vice President, Global Fund Services Fund Governance Solutions, The Northern Trust Company, 2020 to 2024; Nuveen Solutions Chief Operating Officer, Nuveen Services LLC, 2017 to 2019. |
| | | |
Rodney L. Reuhle Year of Birth: 1968 | | Chief Compliance Officer and AML Officer | | Indefinite/ August 2022 to present | | Senior Principal Consultant, Foreside Fund Officer Services, LLC (doing business as ACA Group), 2016 to present. |
51
POLAR CAPITAL FUNDS
ADDITIONAL INFORMATION (Continued)
March 31, 2024 (Unaudited)
| | | | | | |
Name, Address* and Year of Birth of Officer | | Positions(s) Held with Trust | | Term of Office and Length of Time Served | | Principal Occupation(s) During Past 5 Years |
Tracy L. Dotolo Year of Birth: 1976 | | Treasurer, Principal Financial Officer, and Pricipal Accounting Officer | | Indefinite/ March, 2020 to present | | Senior Principal Consultant, Foreside Fund Officer Services, LLC (doing business as ACA Group), 2016 to present. |
| | | |
Matthew J. Broucek Year of Birth: 1988 | | Secretary | | Indefinite/ March, 2020 to present | | Vice President, Global Fund Services Fund Governance Solutions, The Northern Trust Company 2020 to present; Second Vice President, Global Fund Services Fund Governance Solutions, The Northern Trust Company 2018 to 2020. |
| | | |
David P. Michalik Year of Birth: 1991 | | Assistant Secretary | | Indefinite/ February 2023 to present | | Second Vice President, Global Fund Services Fund Governance Solutions, The Northern Trust Company 2022 to present; Officer, Global Fund Services Fund Governance Solutions, The Northern Trust Company 2019 to 2022; Associate Attorney, Leahy Eisenberg & Fraenkel, Ltd. 2017-2019. |
* Each Officer may be contacted at 50 South LaSalle Street, Chicago, Illinois 60603.
52
POLAR CAPITAL FUNDS
PRIVACY POLICY
SAFEGUARDING PRIVACY
We recognize and respect the privacy expectations of each of our investors and we believe the confidentiality and protection of investor information is one of our fundamental responsibilities. New technologies have dramatically changed the way information is gathered and used, but our continuing commitment to preserving the security and confidentiality of investor information has remained a core value of the Datum One Series Trust.
INFORMATION WE COLLECT AND SOURCES OF INFORMATION
We may collect information about our customers to help identify you, evaluate your application, service and manage your account and offer services and products you may find valuable. We collect this information from a variety of sources including:
● Information we receive from you on applications or other forms (e.g. your name, address, date of birth, social security number and investment information); about a customer’s investment goals and risk tolerance;
● Information about your transactions and experiences with us and our affiliates (e.g. your account balance, transaction history and investment selections); and
● Information we obtain from third parties regarding their brokerage, investment advisory, custodial or other relationship with you (e.g. your account number, account balance and transaction history.
INFORMATION WE SHARE WITH SERVICE PROVIDERS
We may disclose all non-public personal information we collect, as described above, to companies (including affiliates) that perform services on our behalf, including those that assist us in responding to inquiries, processing transactions, preparing and mailing account statements and other forms of shareholder services provided they use the information solely for these purposes and they enter into confidentiality agreements regarding the information.
INFORMATION WE MAY SHARE WITH AFFILIATES
If we have affiliates which are financial service providers that offer investment advisory, brokerage and other financial services, we may (subject to Board approval) share information among our affiliates to better assist you in achieving your financial goals.
SAFEGUARDING CUSTOMER INFORMATION
We will safeguard, according to federal standards of security and confidentiality, any non-public personal information our customers share with us.
We will limit the collection and use of non-public customer information to the minimum necessary to deliver superior service to our customers which includes advising our customers about our products and services and to administer our business.
We will permit only authorized employees who are trained in the proper handling of non-public customer information to have access to that information.
We will not reveal non-public customer information to any external organization unless we have previously informed the customer in disclosures or agreements, have been authorized by the customer or are required by law or our regulators.
POLAR CAPITAL FUNDS
PRIVACY POLICY (Continued)
We value you as a customer and take your personal privacy seriously. We will inform you of our policies for collecting, using, securing and sharing nonpublic personal information the first time we do business and every year that you are a customer of the Datum One Series Trust or anytime we make a material change to our privacy policy.
Investment Adviser
Polar Capital LLP
16 Palace Street
London, United Kingdom SW1E5JD
Custodian
The Northern Trust Company
50 South LaSalle Street
Chicago, Illinois 60603
Independent Registered Public Accounting Firm
Deloitte & Touche LLP
111 South Wacker Drive
Chicago, Illinois 60606-4301
Legal Counsel
Ropes & Gray LLP
800 Boylston Street
Boston, Massachusetts 02199
Distributor
Foreside Financial Services, LLC
3 Canal Plaza, Suite 100
Portland, Maine 04101
For Additional Information, call
(800) 806-1112 (toll free) or (312) 557-3164
(b) Not applicable.
Item 2. Code of Ethics.
As of March 31, 2024, the registrant had adopted a “code of ethics” (as such term is defined in Item 2 of Form N-CSR) that applies to the registrant’s principal executive officer and principal financial officer. This code is filed as Exhibit 13(a)(1) hereto. There were no substantive amendments or waivers to the code of ethics during the period covered by this report.
Item 3. Audit Committee Financial Expert.
The registrant’s Board of Trustees has determined the registrant has at least one “audit committee financial expert” (as such term is defined in Item 3 of Form N-CSR) serving on its Audit Committee. The “audit committee financial expert” is JoAnn Lilek, who is “independent” for purposes of this Item 3 of Form N-CSR.
Item 4. Principal Accountant Fees and Services.
Polar Funds
2024: $55,000
2023: $27,500
The fees paid to Deloitte & Touche LLP relate to the audit of the registrant’s annual financial statements and letters for the filings of the registrant’s Form N-CEN and Form N-1A.
Polar Funds
2024: $0
2023: $0
Polar Funds
2024: $9,000
2023: $4,000
The fees to Deloitte & Touche LLP relate to the preparation of the registrant’s tax returns and review of annual distributions.
Polar Funds
2024:$0
2023: $0
(e)(1) Except as permitted by rule 2-01(c)(7)(i)(C) of regulation S-X the registrant’s audit committee must pre-approve all audit and non-audit services provided by the independent accountants relating to the operations or financial reporting of the registrant. Prior to the commencement of any audit or non-audit services to the registrant, the audit committee reviews the services to determine whether they are appropriate and permissible under applicable law.
2024: 0%
2023: 0%
(f) Not applicable.
2024: $0
2023: $0
(h) The Audit Committee considered the non-audit services rendered to the registrant’s investment adviser and believes the services are compatible with the principal accountant’s independence.
(i) The registrant has not been identified by the U.S. Securities and Exchange Commission as having filed an annual report issued by a registered public accounting firm branch or office that is located in a foreign jurisdiction where the Public Company Accounting Oversight Board is unable to inspect or completely investigate because of a position taken by an authority in that jurisdiction.
(j) The registrant is not a foreign issuer.
Item 5. Audit Committee of Listed Registrants.
Not applicable.
Item 6. Investments.
| (a) | The Schedule of Investments in securities of unaffiliated issuers is included in the report to shareholders filed under Item 1 of this Form. |
Item 7. Disclosure of Proxy Voting Policies and Procedures for Closed-End Management Investment Companies.
Not applicable.
Item 8. Portfolio Managers of Closed-End Management Investment Companies.
Not applicable.
Item 9. Purchases of Equity Securities by Closed-End Management Investment Company and Affiliated Purchasers.
Not applicable.
Item 10. Submission of Matters to a Vote of Security Holders.
Not applicable.
Item 11. Controls and Procedures.
| (a) | The registrant’s principal executive officer and principal financial officer have concluded, based on their evaluation of the registrant’s disclosure controls and procedures as conducted within 90 days of the filing date of this report, that these disclosure controls and procedures are adequately designed and are operating effectively to ensure that information required to be disclosed by the registrant on Form N-CSR is recorded, processed, summarized and reported within the time periods specified in the Securities and Exchange Commission’s rules and forms. |
| (b) | There were no changes in the registrant’s internal control over financial reporting (as defined in Rule 30a-3(d) under the Investment Company Act of 1940) that occurred during the period covered by this report that have materially affected or are reasonably likely to materially affect, the registrant’s internal control over financial reporting. |
Item 12. Disclosure of Securities Lending Activities for Closed-End Management Investment Companies.
Not applicable.
Item 13. Exhibits.
(a)(1) The Code of Ethics that is the subject of the disclosure required by Item 2 is filed herewith.
(a)(2) Certifications pursuant to Rule 30a-2(a) are filed herewith.
(a)(3) Not applicable.
(a)(4) Not applicable.
(b) Certification pursuant to Rule 30a-2(b) is filed herewith.
SIGNATURES
Pursuant to the requirements of the Securities Exchange Act of 1934 and the Investment Company Act of 1940, the registrant has duly caused this report to be signed on its behalf by the undersigned, thereunto duly authorized.
Datum One Series Trust
| | |
| By: | | /s/ Tracy L. Dotolo |
| | Tracy L. Dotolo |
| | Treasurer, Principal Financial Officer, and Principal Accounting Officer |
| |
| Date: | | June 3, 2024 |
Pursuant to the requirements of the Securities Exchange Act of 1934 and the Investment Company Act of 1940, this report has been signed below by the following persons on behalf of the registrant and in the capacities and on the dates indicated.
| | |
| By: | | /s/ Barbara J. Nelligan |
| | Barbara J. Nelligan |
| | President and Principal Executive Officer |
| |
| Date: | | June 3, 2024 |
| |
| By: | | /s/ Tracy L. Dotolo |
| | Tracy L. Dotolo |
| | Treasurer, Principal Financial Officer, and Principal Accounting Officer and |
| |
| Date: | | June 3, 2024 |