UNITED STATES
SECURITIES AND EXCHANGE COMMISSION
Washington, D.C. 20549
----------------------------------------------------------------
FORM N-CSR
CERTIFIED SHAREHOLDER REPORT
OF REGISTERED MANAGEMENT
INVESTMENT COMPANIES
Investment Company Act File Number 811-23566
----------------------------------------------------------------
Bow River Capital Evergreen Fund
(Exact name of registrant as specified in charter)
----------------------------------------------------------------
205 Detroit Street, Suite 800
Denver, Colorado 80206
(Address of principal executive offices) (Zip code)
Jeremy Held
Bow River Advisers, LLC
205 Detroit Street, Suite 800
Denver, Colorado 80206
(Name and address of agent for service)
COPIES TO:
Joshua B. Deringer, Esq.
Faegre Drinker Biddle & Reath LLP
One Logan Square, Ste. 2000
Philadelphia, PA 19103-6996
215-988-2700
----------------------------------------------------------------
Registrant’s telephone number, including area code: (303) 861-8466
Date of fiscal year end: March 31
Date of reporting period: March 31, 2023
Item 1. Reports to Stockholders.
(a) The following is a copy of the report transmitted to shareholders pursuant to Rule 30e-1 under the Investment Company Act of 1940 (17 CFR 270.30e-1)

Bow River Capital Evergreen Fund |
Annual Report
March 31, 2023
bowriverevergreen.com • 1-888-330-3350
• DISTRIBUTED BY FORESIDE FINANCIAL SERVICES, LLC (MEMBER OF FINRA)
Bow River Capital Evergreen Fund |
TABLE OF CONTENTS
MARCH 31, 2023 |
Bow River Capital Evergreen Fund |
MANAGER’S DISCUSSION OF FUND PERFORMANCE
MARCH 31, 2023 (Unaudited) |
Dear Bow River Capital Evergreen Fund Investor:
We are pleased to present our annual report for the Bow River Capital Evergreen Fund.
The Bow River Capital Evergreen Fund (the “Fund”) was launched in May of 2020 to provide investors with access to institutional quality private equity investments with broader investment exposure and greater flexibility than traditional private investment funds. By providing access to private equity in an investor-friendly registered fund we believe the Fund will transform the way investors approach the asset class and provide them with an important tool to build better portfolios.
The Fund seeks to capture the best practices of private equity investing by combining the access, scale and pricing power of a large institution with the specialization and agility of a middle-market boutique. The Fund’s investment objective is to generate long-term capital appreciation by investing in a broad portfolio of private equity investments that provide attractive risk-adjusted return potential.
Since its launch in 2020 the Fund has been well received by investors as both a private markets access vehicle and as a portfolio customization tool. As of March 31, 2023, the Fund has a diverse investor base including individuals, wealth management firms, family offices and institutional investors.
Highlights for the fiscal year-ended March 31, 2023, include the following:
• Class I of the Fund returned 3.17% for the 1-year ended March 31, 2023.
• The Fund deployed a total of $77 million into 18 transactions during the fiscal year across the co-investment, secondary and primary fund market, bringing total private market investments in the Fund to 75.
• The Fund’s net assets increased from $217 million in March 2022 to $340 million at the end of March 2023.
Market Update
The 12-month period ended March 31, 2023, represented one of the most challenging periods for global markets since the great financial crisis. While it appears that inflation has finally started to moderate, it is still too early to tell what the long-term effects of a step change in interest rates will ultimately have on the broader economy. Expensive assets, both public and private, suffered mightily in this environment as calendar year 2022 was the worst year for a 60/40 stock/bond portfolio in nearly a century. For venture capital (“VC”), the most expensive segment of the private markets, the situation is likely to go from bad to worse. With the spectacular collapse of Silicon Valley Bank, startup firms that were already strapped for cash and feeling the weight of lofty valuations in previous funding rounds are now losing one of the most significant providers of capital and liquidity in their ecosystem. This lack of liquidity comes at a time when many VC-backed companies are likely running out of cash runway from capital raises executed around the 2021 peak. This could force firms to raise money sooner than expected in the teeth of a brutal funding market. Venture startup funding dropped more than 55% in the first quarter of 2023 year-over-year while late-stage valuations dropped approximately 17% in the same period. By contrast, privately held cash-flowing buyout businesses have remained quite resilient, benefiting in many cases from more moderate valuations and lower debt burdens, particularly in the middle and lower middle market.
Rising debt costs are not just a headwind, however; they also have the potential to create opportunities in previously expensive sectors of the market. The secondary market, in our view, was highly unattractive for several quarters due to high prices and an imbalance of supply and demand. Low interest rates created an artificial bid for secondary assets, allowing large sponsors to submit overpriced bids for mediocre assets by using significant amounts of deal or fund-level leverage to achieve their return targets. Now that the cost of these credit lines has increased, secondary pricing has rapidly reset to more rational levels. This dynamic, combined with a significant increase in volume of LP interest sales (and limited secondary-dedicated dry powder) has made secondary purchases much more attractive on a relative value basis in late 2022 and into 2023. Pricing in certain segments of the secondary market has already started to approach COVID-crisis levels, however we expect the buying window to be longer this time given the sustained sale volume coming from institutional investors.
1
Bow River Capital Evergreen Fund |
MANAGER’S DISCUSSION OF FUND PERFORMANCE (CONTINUED)
MARCH 31, 2023 (Unaudited) |
We also believe that the banking crisis has exacerbated trends in lending that were already shifting the balance of power from banks to private lenders. This will likely result in an overall reduction in deal flow, longer hold periods and more muted valuation multiples. However, we believe the impact will not be felt in a uniform fashion across the market. Highly levered, larger companies that have relied upon financial engineering and debt-funded inorganic growth, in our view, should be most acutely impacted. By contrast, companies with multiple organic growth levers alongside barriers to entry and pricing power, in our view, should not only do well, they may actually trade at higher multiples given scarcity value in the market based on a similar number of buyers and fewer high quality companies for sale.
As a result, we believe this environment has strengthened our conviction of investing in cash-flow generative middle market businesses while also creating interesting opportunities in both the private credit and secondary markets, two of the Fund’s most significant current overweights. As we approach our 3-year track record in May 2023, we continue to be comforted by the strong fundamentals in our current portfolio as well as the Fund’s current level of diversification, with no single company representing more than 3% of Fund assets and no single investment representing more than 5% as of March 31, 2023.
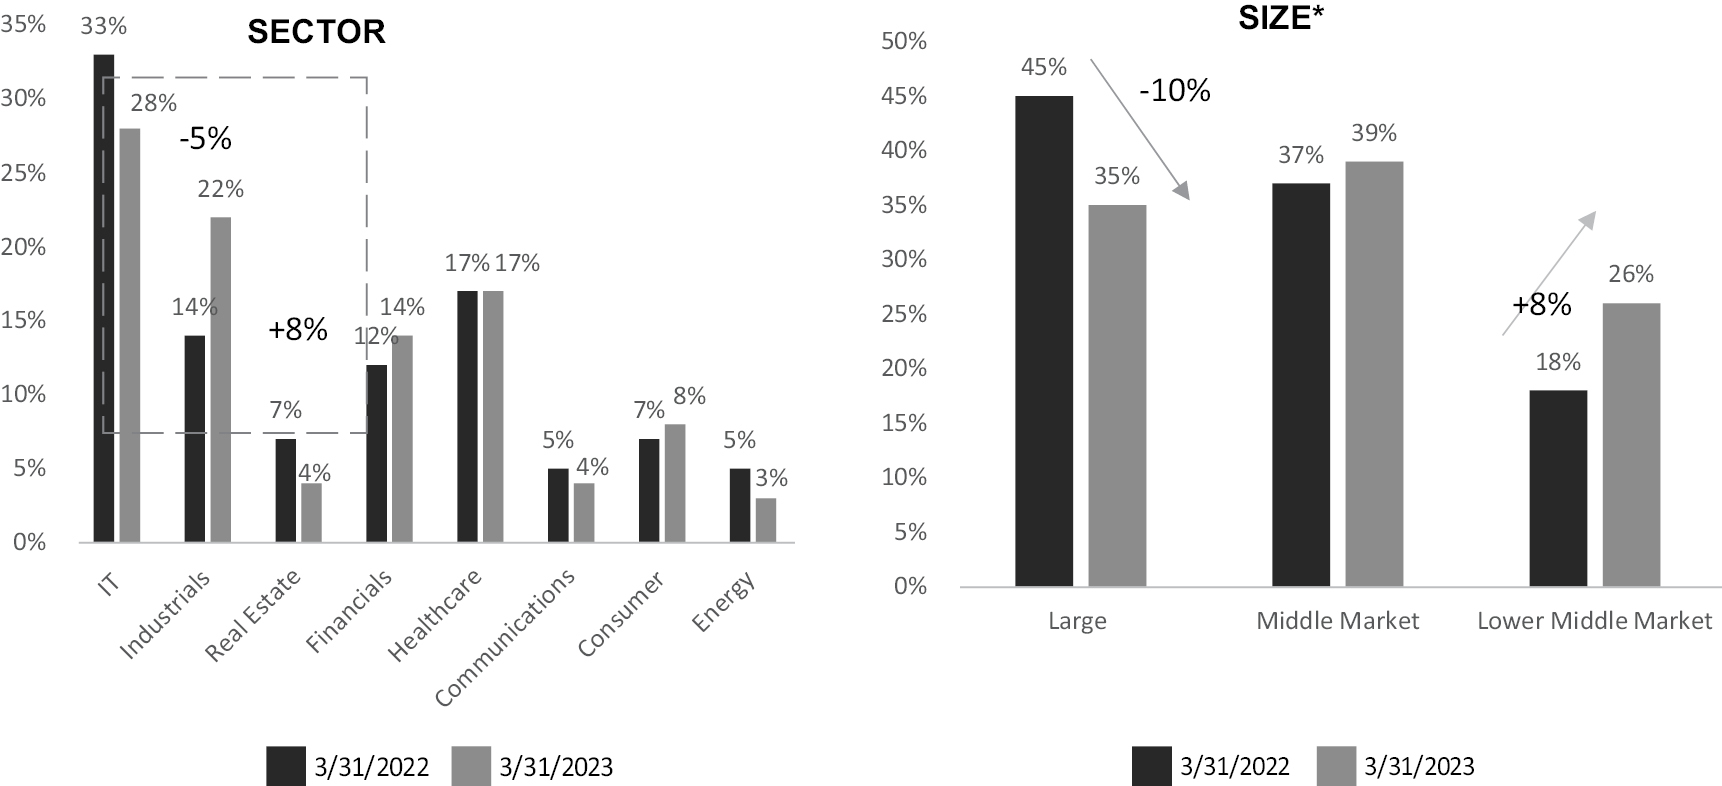
Asset Allocation
During the fiscal year ended March 31, 2023, the portfolio management team made a concerted effort to increase Fund exposure to Industrial Services and Financials, while reducing the Fund’s overall exposure to Technology. In addition, we meaningfully increased Fund exposure to lower middle market companies from 18% to 26% while large-cap exposure was reduced from 45% to 35%. The middle market continues to be the Fund’s largest overweight, with exposure increasing modestly from 37% to 39% in the most recent fiscal year ended March 31, 2023. The positive performance from our co-investment portfolio was partially offset by modest reductions in our secondaries portfolio, which was negatively impacted by multiple compression in older vintage exposures.
2
Bow River Capital Evergreen Fund |
MANAGER’S DISCUSSION OF FUND PERFORMANCE (CONTINUED)
MARCH 31, 2023 (Unaudited) |
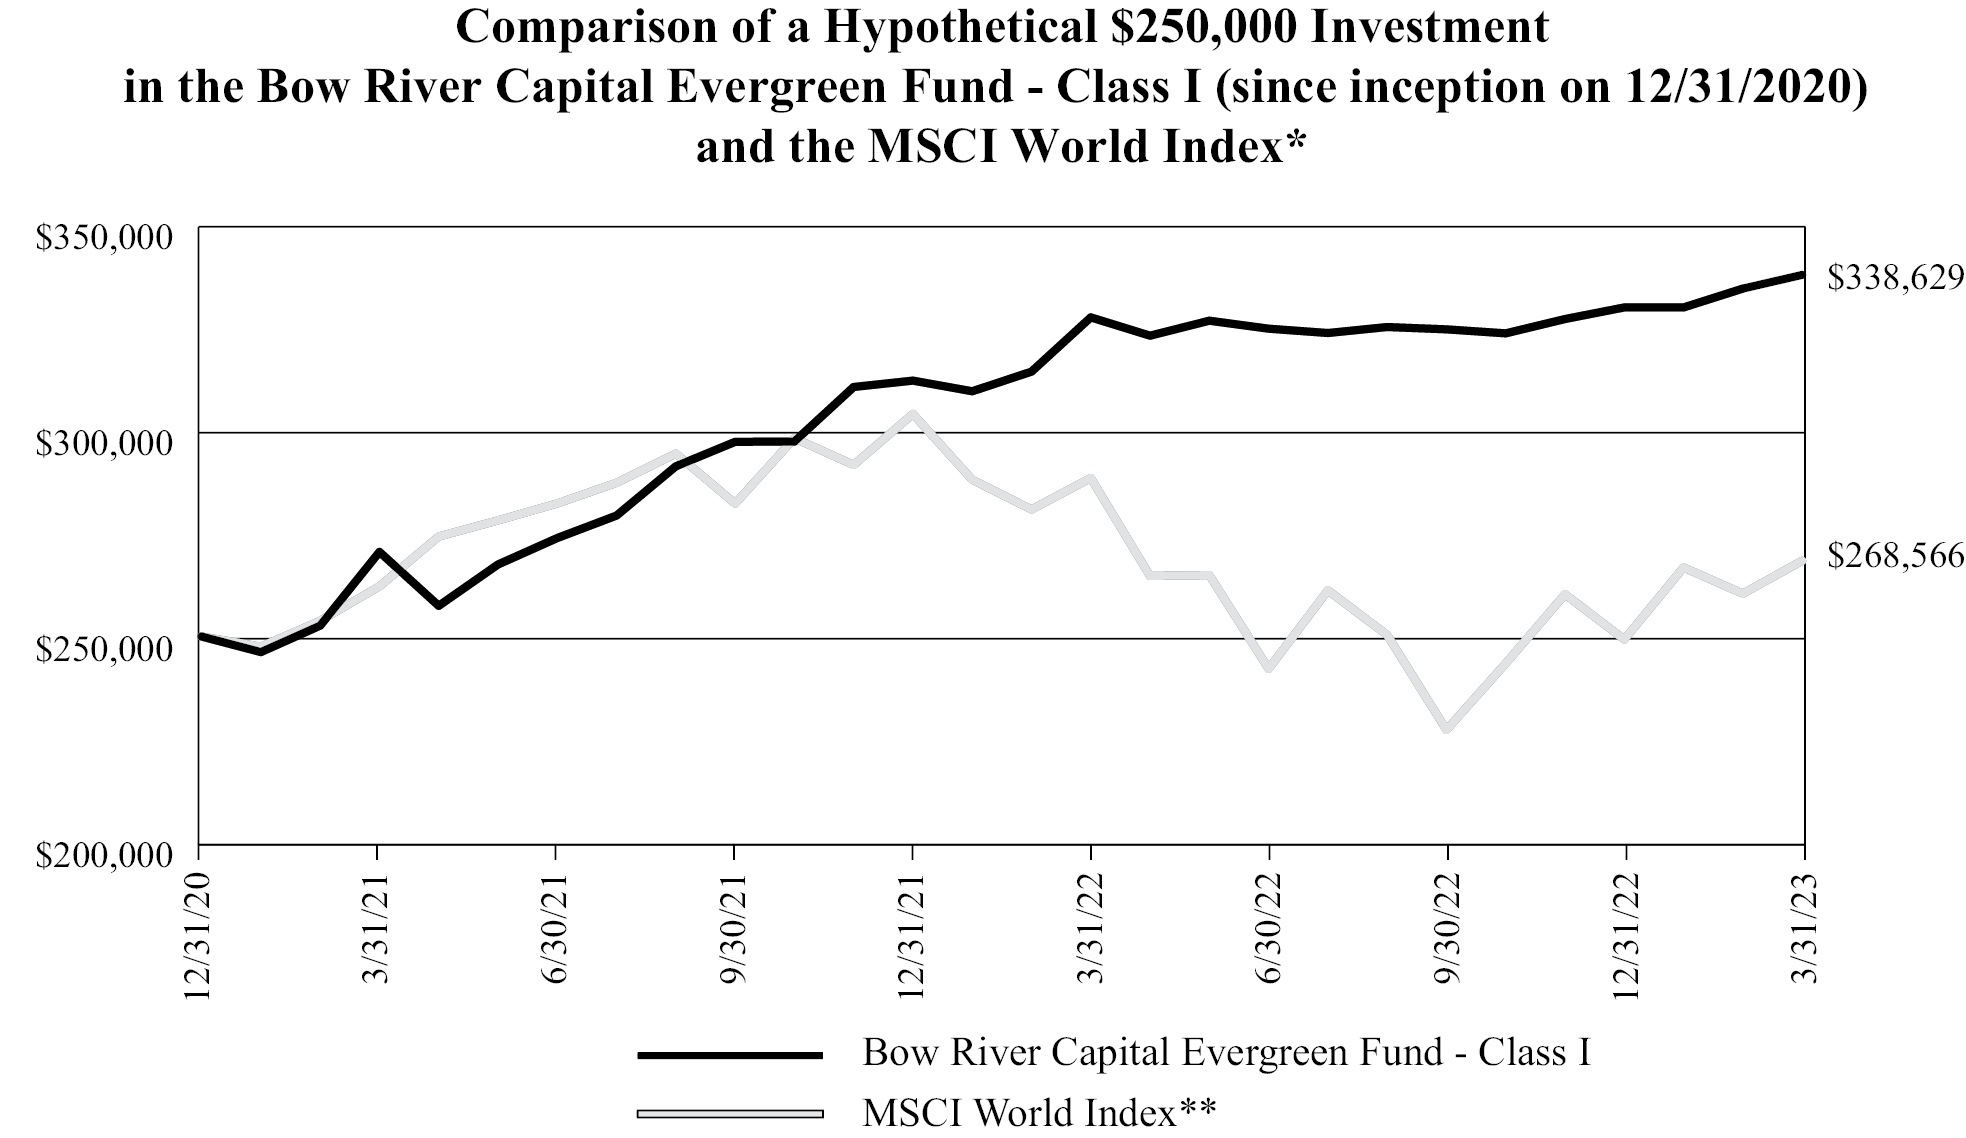
Performance
Class I of the Fund returned 3.17% for the 1-year ending March 31, 2023. Fund performance during the year was driven largely by valuation uplift in several of the Fund’s early direct co-investments, particularly in middle and lower middle market companies.
3
Bow River Capital Evergreen Fund |
MANAGER’S DISCUSSION OF FUND PERFORMANCE (CONTINUED)
MARCH 31, 2023 (Unaudited) |
Average Annual Total Return Information |
| |
Share Class | 1-Year | 2-Year | Since
Inception | Inception
Date | |
Class I | 3.17% | 11.84% | 14.46% | 12/31/2020 | |
Class II | 2.92% | —% | 6.37% | 1/3/2022 | |
Fund Benchmark | | | | | |
MSCI World Index(1) | (7.02)% | 1.19% | 3.24%(2) | | |
Outlook
Despite the resiliency in the Fund’s portfolio, on a go-forward basis we remain cautious with respect to the looming impact of higher borrowing costs, thinning margins and the potential for slower growth in a recession. While we believe labor costs will ultimately moderate in a slowing economy, easing margin pressure on many businesses, the short-term impact will be very difficult for companies that cannot pass through higher costs as the impact of higher rates will be felt before margins expand. A weak exit environment should also result in longer hold periods and an increased reliance on bolt-on or tuck-in acquisitions to bolster growth, further highlighting the importance of free cash flow and a manageable debt load. As a result of these changing market dynamics, the Fund has recently shifted from an underweight to an overweight in private credit. Private equity remains the Fund’s dominant asset class, and we firmly believe that high quality businesses, as they have done in the past, can thrive in a higher interest rate environment. Consequently, we are continuing to deploy capital in the private equity sector, maintaining our underweight to growth and venture, and doubling down on our overweight to middle market cash flowing businesses. We are particularly focused on businesses that can support higher borrowing costs, have high barriers to entry and can pass through higher inflation costs. Recent equity co-investments in the consumer staples and healthcare space are indicative of this approach. Lastly, the middle market will continue to be our dominant area of emphasis, as we believe these businesses have more levers for value creation alongside more reasonable entry prices.
In light of the market’s current challenges, we are comforted by the number of risk mitigants in the Fund’s portfolio that should allow it to continue to weather a difficult investing environment. In addition to the Fund’s underweight to growth equity and venture capital, we have increased our liquidity sleeve slightly above target. This enhanced liquidity serves two purposes — first, it provides an extra cash flow cushion given that we expect a decrease in the value of distributions in the coming quarters alongside an increase in capital calls as sponsors wind down expensive lines of credit. Secondly, it allows us ample dry powder to deploy in an environment that we believe will be increasingly attractive in coming quarters. The general trend in our portfolio has been one of positive revenue and EBITDA growth partially offset by a reduction in multiples. Preserving a larger amount of dry powder will allow us to be opportunistic as high-quality assets become available at attractive entry points across all asset types. We remain overweight in secondaries and while bid/ask spreads remain wide, we expect continual decay in prices in the coming quarters.
4
Bow River Capital Evergreen Fund |
MANAGER’S DISCUSSION OF FUND PERFORMANCE (CONTINUED)
MARCH 31, 2023 (Unaudited) |
As always, the investment team is available to answer any questions about the Fund and we look forward to speaking with you in the future.
Sincerely,
The Bow River Capital Evergreen Fund Team

| | 
| | 
| | 
|
Jeremy Held | | Michael Trihy | | Richard Wham | | Joe Stork |
An offer can only be made by the prospectus and only in jurisdictions in which such an offer would be lawful. The prospectus contains important information concerning risk factors and other material aspects of the Fund to carefully consider and must be read carefully before a decision to invest is made. Please visit www.bowriverevergreen.com or contact your Financial Advisor to obtain a copy of the prospectus.
The Fund commenced investment operations on December 31, 2020, after the conversion of a limited partnership Account, Bow River Capital Evergreen Private Equity Fund LP, which commenced operations on May 22, 2020, (the “Predecessor Account”), into shares of the Fund’s Class I Shares. Information portrayed prior to December 31, 2020 is for the Predecessor Account. The Fund’s objectives, policies, guidelines and restrictions are in all material respects equivalent to those of the Predecessor Account. The Predecessor Account was not registered under the Investment Company Act of 1940, as amended (the “1940 Act”), and therefore was not subject to certain restrictions imposed by the 1940 Act on registered investment companies and by the Internal Revenue Code of 1986, as amended, on regulated investment companies. If the Predecessor Account had been registered under the 1940 Act, the Predecessor Account’s performance may have been adversely affected.
Performance data quoted represents past performance and is no guarantee of future results. Total return figures include the reinvestment of dividends and capital gains. Current performance may be lower or higher than the performance data quoted. Investment return and principal value will fluctuate so that an investor’s shares, when redeemed, may be worth more or less than original cost. For the most recent month end performance, please call (888)-330-3350.
Any person subscribing for an investment must be able to bear the risks involved and must meet the suitability requirements of the Fund. Investors could lose all or a substantial amount of their investment. No assurance can be given that the Fund’s investment objectives will be achieved. The Fund is speculative and involves a substantial degree of risk. The Fund is a closed-end, non-diversified management investment company that will make periodic repurchase offers for its securities and is highly illiquid. There is no secondary market for investors’ interests, and none is expected to develop. There are certain restrictions on transferring interests. Fees and expenses will offset the Fund’s trading profits. The Fund is subject to conflicts of interest. Other risks include those related to equity securities, fixed income securities, high-yield/high risk bonds, listed private equity, listed infrastructure securities, foreign securities, derivative instruments, leverage, capital calls, investment manager risk, as well as those related to general economic and market conditions, all of which may present significant risks. Please see the prospectus for more information on these and other risks.
Bow River Advisers, LLC (“Bow River Capital”) is the management company for the Bow River Capital Evergreen Fund.
All statements made herein are opinions of Bow River Capital and should not be construed as investment advice and recommendations.
Fund Distributor: Foreside Financial Services, LLC
5
Bow River Capital Evergreen Fund |
SCHEDULE OF INVESTMENTS
MARCH 31, 2023 |
| | Value |
Private Investments — 78.1% | | | |
Credit Co-Investments — 7.5% | | | |
Ashgrove Specialty Lending Investments I, 12.07% (SONIA + CSA + 7.75%, 0.50% Floor), 4/9/2026, principal GBP 718,1471,2 | | $ | 861,613 |
Ashgrove Specialty Lending Investments I, DAC, 12.80% (SONIA + CSA + 8.50%, 0.25% Floor), 6/1/2026, principal GBP 2,500,0001,2 | | | 2,210,576 |
Digital Alpha Solutions Fund, LP, 14.27% (SOFR3M + CSA + 9.50% PIK)1,3 | | | 3,829,410 |
Ecoville Investments Limited, 9.50%, 1/11/24, principal $2,000,0001,2 | | | 1,980,000 |
Palmer Square Loan Funding 2021-3, Ltd.1 | | | 1,320,900 |
PARIOUS LP, 8.00% PIK, 10/31/2030, principal EUR 5,208,7201,3 | | | 5,842,948 |
Planet US Buyer, LLC, 11.26% (SOFR3M + 6.75%), 1/31/2030, principal $3,000,0001,2 | | | 2,711,806 |
Polaris Newco, 12.84% (LIBOR + 8.00%, 1.00% Floor), 6/3/2029, principal $2,000,0001,2 | | | 1,705,000 |
Sand Trust Series 21-1A – Class SUB, 10/15/20341 | | | 651,415 |
US Hospitality Publishers, Inc., 11.84% (LIBOR + 7.00%, 1.00% Floor), 12/18/2025, principal $2,000,0001,2 | | | 1,823,562 |
VCPF III Co-Invest 1-A, LP1,3 | | | 2,623,806 |
Total Credit Co-Investments
(Cost $24,692,171) | | | 25,561,036 |
| | | | |
Equity Co-Investments — 31.4% | | | |
ACP Hyperdrive Co-Invest, LLC1,3,4 | | | 2,620,000 |
AP DSB Co-Invest II, LP1,3,4 | | | 3,561,985 |
Ashgrove Specialty Lending Investments I, DAC1,2,4 | | | 722,592 |
Biloxi Co-Investment Partners, LP1,3,4 | | | 1,681,794 |
Butterfly Nourish Co-Invest, LP1,2,4 | | | 4,999,848 |
BW Colson Co-Invest Feeder (Cayman),
LP1,3,4 | | | 3,822,242 |
Carlyle Riser Co-Investment, LP1,3,4 | | | 4,635,058 |
Constellation 2022, LP1,3,4 | | | 4,998,967 |
Corsair Amore Investors, LP1,3,4 | | | 4,994,829 |
Coyote 2021, LP1,3,4 | | | 7,652,220 |
DSG Group Holdings, LP1,2,4 | | | 6,715,991 |
Enak Aggregator, LP1,3,4 | | | 3,185,673 |
Falcon Co-Investment Partners, LP1,3,4 | | | 2,895,574 |
ISH Co-Investment Aggregator, LP1,3,4 | | | 2,573,735 |
OceanSound Partners Co-Invest II, LP – Series B1,3,4,5 | | | 5,464,518 |
OceanSound Partners Co-Invest II, LP – Series E1,3,4 | | | 7,569,913 |
| | Value |
Private Investments — 78.1% (continued) | | | |
Equity Co-Investments — 31.4% (continued) | | | |
Onex OD Co-Invest, LP1,3,4 | | $ | 5,292,788 |
Palms Co-Investment Partners, LP1,3,4 | | | 3,807,958 |
Project Stream Co-Invest Fund, LP1,3,4 | | | 1,666,765 |
SANCY SLP1,3,4 | | | 1,624,496 |
SEP Hamilton III Aggregator, LP1,3,4 | | | 6,585,374 |
SEP Skyhawk Fund III Aggregator, LP1,3,4 | | | 545,487 |
The Global Atlantic Financial Group, LLC1,2,4 | | | 4,380,373 |
Veregy Parent, LLC1,2,4 | | | 3,182,840 |
Vistage Equity Investors, LP1,3,4 | | | 4,999,608 |
WestCap Cerebral Co-Invest 2021, LLC1,3,4 | | | 139,525 |
WestCap LoanPal Co-Invest 2020, LLC1,2,4 | | | 3,799,773 |
Wildcat 21 Co-Invest Fund, LP1,3,4 | | | 2,592,890 |
Total Equity Co-Investments (Cost $84,792,444) | | | 106,712,816 |
| | | | |
Primary Funds — 16.3% | | | |
Ashgrove Specialty Lending Fund I SCSp RAIF1,3,4 | | | 1,289,558 |
Avista Capital Partners V, LP1,3,4 | | | 4,690,650 |
Coller Credit Opportunities I – B, LP1,3 | | | 2,074,985 |
EnCap Energy Transition Fund 1-A, LP1,3,4 | | | 3,043,313 |
FFL Capital Partners V, LP1,3,4 | | | 5,651,328 |
Grain Spectrum Holdings III (Cayman), LP1,3,4 | | | 3,310,155 |
Lynx EBO Fund I (A), LLC1,3,4 | | | 447,112 |
OceanSound Partners Fund, LP1,3,4 | | | 4,583,838 |
Onex Structured Credit Opportunities International Fund I, LLC1,3 | | | 1,629,394 |
Overbay Fund XIV Offshore, LP1,3,4 | | | 2,411,632 |
Sheridan Capital Partners Fund III, LP1,2,4 | | | 984,347 |
Sumeru Equity Partners Fund III, LP1,3,4 | | | 2,460,102 |
Sumeru Equity Partners Fund IV, LP1,3,4 | | | 398,869 |
TKO Fund1,3,4 | | | 3,411,419 |
WestCap Strategic Operator Fund II, LP1,3,4 | | | 3,480,643 |
WestCap Strategic Operator U.S. Feeder Fund, LP1,2,4 | | | 8,652,438 |
Whitehorse Liquidity Partners IV, LP1,3,4 | | | 3,647,076 |
Whitehorse Liquidity Partners V, LP1,3,4 | | | 3,159,709 |
Total Primary Funds
(Cost $38,064,575) | | | 55,326,568 |
| | | | |
Private Investment Funds — 7.9% | | | |
PIMCO DSCO Fund II Offshore
Feeder, LP1,3,4 | | | 4,799,094 |
Post Limited Term High Yield Fund, LP1,3,4 | | | 6,042,865 |
Ruffer Absolute Institutional, Ltd.1,3,4 | | | 5,091,501 |
Saba Capital Carry Neutral Tail Hedge Offshore Fund, Ltd.1,3,4 | | | 5,475,615 |
Voloridge Fund, LP1,3,4 | | | 5,293,489 |
Total Private Investment Funds (Cost $25,883,485) | | | 26,702,564 |
See accompanying Notes to Financial Statements.
6
Bow River Capital Evergreen Fund |
SCHEDULE OF INVESTMENTS (CONTINUED)
MARCH 31, 2023 |
| | Value |
Private Investments — 78.1% (continued) | | | |
Secondary Funds — 15.0% | | | |
Adams Street 2009 Direct Fund, LP1,3,4 | | $ | 24,107 |
Adams Street 2010 Direct Fund, LP1,3,4 | | | 29,343 |
Adams Street 2011 Direct Fund, LP1,3,4 | | | 41,638 |
Adams Street 2011 Non-U.S. Developed Markets Fund, LP1,3,4 | | | 140,953 |
Adams Street 2011 U.S. Fund, LP1,3,4 | | | 318,549 |
Adams Street 2013 Global Fund, LP1,3,4 | | | 1,907,607 |
Adams Street 2014 Global Fund, LP1,3,4 | | | 1,055,592 |
Adams Street Partnership Fund 2009 Non-U.S. Developed Markets Fund, LP1,3,4 | | | 115,939 |
Adams Street Partnership Fund 2009 U.S. Fund, LP1,3,4 | | | 260,310 |
Adams Street Partnership Fund 2010 Non-U.S. Developed Markets Fund, LP1,3,4 | | | 111,342 |
Adams Street Partnership Fund 2010 U.S. Fund, LP1,3,4 | | | 291,712 |
Altor Fund IV (No. 1) AB1,3,4 | | | 6,208,258 |
ASP (Feeder) 2017 Global Fund, LP1,3,4 | | | 1,160,633 |
BRCE SPV I, LLC1,2 | | | 254,491 |
Coller Credit Opportunities I – Annex I,
SLP1,3 | | | 3,136,179 |
Coller International Partners VI Feeder Fund, LP – Class A1,3,4 | | | 990,109 |
Coller International Partners VII Feeder Fund, LP – Series B1,3,4 | | | 1,805,561 |
CRG Partners III – Parallel Fund (A), LP1,3,4 | | | 3,615,488 |
Forrest Holdings I, LP – Class A1,2,4 | | | 13,634 |
Forrest Holdings I, LP – Class B1,2,4 | | | 190,808 |
Global Infrastructure Partners II-C, LP1,3,4 | | | 1,215,146 |
Graphite Capital Partners VIII D, LP1,2,4 | | | 4,841,715 |
KH Aggregator, LP1,3,4 | | | 4,824,252 |
Onex Fund V, LP1,3,4 | | | 6,516,342 |
Overbay Fund XIV (AIV III), LP1,3,4 | | | 2,443,436 |
Overbay Fund XIV Offshore (AIV), LP1,3,4,5 | | | 4,121,372 |
Porcupine Holdings, LP – Class A1,3,4 | | | 2,895,534 |
Porcupine Holdings, LP – Class B1,3,4 | | | 2,543,439 |
Total Secondary Funds
(Cost $30,385,723) | | | 51,073,489 |
| | | | |
Total Private Investments
(Cost $203,818,398) | | | 265,376,473 |
| | | | |
Exchange Traded Funds — 0.9% | | | |
Equity Funds — 0.9% | | | |
Core Alternative ETF, shares 100,000 | | | 2,983,000 |
Total Exchange Traded Funds
(Cost $3,047,500) | | | 2,983,000 |
| | | | |
| | Value |
U.S. Treasury Bills — 8.8% | | | | |
United States Treasury Bill, 0.00%, 04/13/2023, principal $20,227,000 | | $ | 19,999,321 | |
United States Treasury Bill, 4.57% OID, 05/09/2023, principal $10,149,000 | | | 9,954,208 | |
Total U.S. Treasury Bills
(Cost $29,999,108) | | | 29,953,529 | |
| | | | | |
Short-Term Investments — 16.2% | | | | |
UMB Money Market Fiduciary, 0.01%, shares 9,556,0676,7 | | | 9,556,067 | |
UMB Money Market Special, 4.68%, shares 20,000,0006,7 | | | 20,000,000 | |
Goldman Sachs Financial Square Government Fund – Institutional Class, 4.73%, shares 25,462,6296 | | | 25,462,629 | |
Total Short-Term Investments
(Cost $55,018,696) | | | 55,018,696 | |
| | | | | |
Total Investments
(Cost $291,883,702) — 104.0% | | $ | 353,331,698 | |
Liabilities in excess of other assets — (4.0%) | | | (13,711,766 | ) |
Net Assets — 100% | | $ | 339,619,932 | |
CSA — Credit Spread Adjustment
DAC — Designated Activity Company
LLC — Limited Liability Company
LP — Limited Partnership
LIBOR — London Interbank Offered Rate
OID — Original Issue Discount
PIK — Payment In Kind
RAIF — Reserved Alternative Investment Fund
SCSp — Special Limited Partnership
SLP — Special Limited Partnership
SONIA — Sterling Overnight Index Average
SOFR3M — Three month average Secured Overnight Financing Rate
See accompanying Notes to Financial Statements.
7
Bow River Capital Evergreen Fund |
SCHEDULE OF INVESTMENTS (CONTINUED)
MARCH 31, 2023 |
1 Restricted security. The total value of these securities is $265,376,473, which represents 78.1% of total net assets of the Fund. Please refer to Note 7 in the Notes to the Financial Statements.
2 Level 3 securities fair valued using significant unobservable inputs. The total value of these securities is $50,031,407, which represents 14.7% of total net assets of the Fund.
3 Investment is valued using the Fund’s pro rata net asset value (or its equivalent) as a practical expedient. Please see Note 3 in the Notes to the Financial Statements for respective investment strategies, unfunded commitments, and redemptive restrictions.
4 Non-income producing.
5 Affiliated investment for which ownership exceeds 5% of the investment’s capital. Please refer to Note 6 in the Notes to the Financial Statements.
6 Rate disclosed represents the seven day yield as of the Fund’s period end.
7 The account is an interest-bearing money market deposit account maintained by UMB Bank, n.a. in its capacity as a custodian for various participating custody accounts. The Fund may redeem its investments in whole, or in part, on each business day.
On March 31, 2023, the Bow River Capital Evergreen Fund had outstanding forward foreign currency contracts with terms as set forth below:
Settlement Date | | Counterparty | | Currency Purchased | | Currency Sold | | Contract Amount | | Value | | Unrealized
Appreciation |
Buy | | Sell | |
June 30, 2023 | | Bannockburn Global
Forex, LLC | | USD | | EUR | | $ | 2,185,000 | | EUR 2,000,000 | | $ | 2,178,249 | | $ | 6,751 |
June 30, 2023 | | Bannockburn Global
Forex, LLC | | USD | | GBP | | $ | 1,858,500 | | GBP 1,500,000 | | $ | 1,852,731 | | $ | 5,769 |
| | | | | | | | | | | | | | | | | $ | 12,520 |
See accompanying Notes to Financial Statements.
8
Bow River Capital Evergreen Fund |
SUMMARY OF INVESTMENTS
MARCH 31, 2023 |
Security Type/Geographic Region | | Percent of
Total
Net Assets |
Private Investments | | | |
North America | | 58.1 | % |
Global | | 10.5 | % |
Europe | | 8.9 | % |
Asia | | 0.6 | % |
Total Private Investments | | 78.1 | % |
Exchange Traded-Funds | | | |
North America | | 0.9 | % |
Total Exchange Traded-Funds | | 0.9 | % |
U.S. Treasury Bills | | 8.8 | % |
Short-Term Investments | | 16.2 | % |
Total Investments | | 104.0 | % |
Liabilities in excess of other assets | | -4.0 | % |
Net Assets | | 100.0 | % |
See accompanying Notes to Financial Statements.
9
Bow River Capital Evergreen Fund |
STATEMENT OF ASSETS AND LIABILITIES
MARCH 31, 2023 |
Assets: | | | |
Unaffiliated investments, at fair value (cost $202,911,293) | | $ | 258,773,583 |
Affiliated investments, at fair value (cost $3,954,605) | | | 9,585,890 |
Short-term investments, at fair value (cost $85,017,804) | | | 84,972,225 |
Cash | | | 35,589 |
Interest receivable | | | 315,084 |
Prepaid expenses | | | 114,339 |
Unrealized appreciation on forward foreign currency contracts | | | 12,520 |
Total Assets | | | 353,809,230 |
| | | | |
Liabilities: | | | |
Payables | | | |
Shareholder subscriptions received in advance | | | 9,556,067 |
Shareholder redemptions | | | 3,819,112 |
Net Investment management fee and expense recoupment | | | 526,712 |
Distribution and service fees | | | 5,161 |
Professional fees | | | 248,728 |
Accounting and administration fees | | | 33,518 |
Total Liabilities | | | 14,189,298 |
Commitments and contingencies (Note 9) | | | |
| | | | |
Net Assets | | $ | 339,619,932 |
| | | | |
Composition of Net Assets: | | | |
Paid-in capital | | $ | 292,584,976 |
Total distributable earnings | | | 47,034,956 |
Net Assets | | $ | 339,619,932 |
| | | | |
Net Assets Attributable to: | | | |
Class I Shares | | $ | 315,332,694 |
Class II Shares | | | 24,287,238 |
| | | $ | 339,619,932 |
Shares of Beneficial Interest Outstanding (Unlimited Number of Shares
Authorized, 100,000 shares registered; par value of $0.001): | | | |
Class I Shares | | | 7,817,381 |
Class II Shares | | | 603,960 |
| | | | 8,421,341 |
Net Asset Value per Share1: | | | |
Class I Shares | | $ | 40.34 |
Class II Shares | | | 40.21 |
See accompanying Notes to Financial Statements.
10
Bow River Capital Evergreen Fund |
STATEMENT OF OPERATIONS
FOR THE YEAR ENDED MARCH 31, 2023 |
Investment Income: | | | | |
Interest income from unaffiliated investments | | $ | 2,626,044 | |
Other Income | | | 34,367 | |
Dividend income from unaffiliated investments | | | 33,433 | |
Total Investment Income | | | 2,693,844 | |
| | | | | |
Expenses: | | | | |
Investment management fee (Note 5) | | | 4,916,262 | |
Audit and tax fees | | | 244,536 | |
Accounting and administration fees | | | 302,654 | |
Legal fees | | | 161,000 | |
Trustee fees (Note 5) | | | 102,500 | |
Interest Expense | | | 60,000 | |
Pricing Fees | | | 57,206 | |
Distribution and service fees (Class II) | | | 48,649 | |
Transfer agent fees | | | 92,000 | |
Chief Compliance Officer and Chief Financial Officer fees (Note 5) | | | 90,533 | |
Other fees | | | 137,975 | |
Custody fees | | | 32,200 | |
Total Expenses Before Recoupment | | | 6,245,515 | |
Fund expenses recouped by the Adviser (Note 5) | | | 192,185 | |
Net Expenses | | | 6,437,700 | |
Net Investment Loss | | | (3,743,856 | ) |
| | | | | |
Net Realized and Unrealized Gain (Loss): | | | | |
Net realized gain (loss) on: | | | | |
Unaffiliated investments | | | 2,565,408 | |
Foreign currency transactions | | | 9,214 | |
Forward foreign currency contracts | | | 10,126 | |
Total net realized gain | | | 2,584,748 | |
Net change in unrealized appreciation (depreciation) on: | | | | |
Unaffiliated investments | | | 11,365,193 | |
Affiliated investments | | | 1,367,299 | |
Investments paid in advance | | | (841,033 | ) |
Forward foreign currency contracts | | | 12,520 | |
Total net change in unrealized appreciation | | | 11,903,979 | |
Net Realized and Unrealized Gain | | | 14,488,727 | |
| | | | | |
Net Increase in Net Assets from Operations | | $ | 10,744,871 | |
See accompanying Notes to Financial Statements.
11
Bow River Capital Evergreen Fund |
STATEMENT OF CHANGES IN NET ASSETS
|
| | For the
year ended
March 31, 2023 | | For the
year ended
March 31, 2022 |
Net Increase in Net Assets from: | | | | | | | | |
Operations: | | | | | | | | |
Net investment loss | | $ | (3,743,856 | ) | | $ | (2,712,270 | ) |
Net realized gain | | | 2,584,748 | | | | 595,511 | |
Net change in unrealized appreciation | | | 11,903,979 | | | | 35,286,186 | |
Net Increase in Net Assets Resulting from Operations | | | 10,744,871 | | | | 33,169,427 | |
| | | | | | | | | |
Distributions to Shareholders: | | | | | | | | |
Distributions: | | | | | | | | |
Class I | | | (7,818,326 | ) | | | (1,278,522 | ) |
Class II | | | (647,048 | ) | | | —3 | |
Decrease in Net Assets from Distributions to Shareholders | | | (8,465,374 | ) | | | (1,278,522 | ) |
| | | | | | | | | |
Capital Transactions: | | | | | | | | |
Proceeds from shares sold: | | | | | | | | |
Class I | | | 101,446,819 | | | | 88,816,420 | |
Class II | | | 18,222,387 | | | | 6,091,3283 | |
Reinvestment of distributions: | | | | | | | | |
Class I | | | 6,076,353 | | | | 1,077,120 | |
Class II | | | 207,174 | | | | — | |
Cost of shares repurchased: | | | | | | | | |
Class I | | | (9,170,783 | )1 | | | (2,492,250 | ) |
Class II | | | (728,873 | )2 | | | —3 | |
Net Increase in Net Assets from Capital Transactions | | | 116,053,077 | | | | 93,492,618 | |
| | | | | | | | | |
Total Net Increase in Net Assets | | | 118,332,574 | | | | 125,383,523 | |
| | | | | | | | | |
Net Assets | | | | | | | | |
Beginning of period | | | 221,287,358 | | | | 95,903,835 | |
End of period | | $ | 339,619,932 | | | $ | 221,287,358 | |
| | | | | | | | | |
Capital Share Transactions: | | | | | | | | |
Shares sold: | | | | | | | | |
Class I | | | 2,551,057 | | | | 2,512,347 | |
Class II | | | 457,545 | | | | 159,4193 | |
Shares issued in reinvestment of distributions: | | | | | | | | |
Class I | | | 154,273 | | | | 28,100 | |
Class II | | | 5,273 | | | | — | |
Shares redeemed: | | | | | | | | |
Class I | | | (229,544 | ) | | | (68,170 | ) |
Class II | | | (18,277 | ) | | | —3 | |
Net Increase in Capital Shares Outstanding | | | 2,920,327 | | | | 2,631,696 | |
See accompanying Notes to Financial Statements.
12
Bow River Capital Evergreen Fund |
STATEMENT OF CASH FLOWS
FOR THE YEAR ENDED MARCH 31, 2023 |
Cash Flows from Operating Activities | | | | |
Net increase in net assets from operations | | $ | 10,744,871 | |
Adjustments to reconcile net increase in net assets
from operations to net cash used in operating activities: | | | | |
Net realized gain from investments | | | (2,565,408 | ) |
Net realized gain from foreign currency transactions | | | (9,214 | ) |
Net realized gain from foreign currency contracts | | | (10,126 | ) |
Net change in unrealized appreciation from investments | | | (12,732,492 | ) |
Net change in unrealized depreciation from investments paid in advance | | | 841,033 | |
Net change in unrealized appreciation from foreign currency contracts | | | (12,520 | ) |
Purchases of investments | | | (106,136,929 | ) |
Sales of investments | | | 28,973,488 | |
Purchases of short term investments, net | | | (42,854,798 | ) |
(Increase)/Decrease in Assets: | | | | |
Due from Adviser | | | 50,545 | |
Interest receivable | | | (243,168 | ) |
Prepaid expenses | | | (25,275 | ) |
Unrealized appreciation on forward foreign currency contracts | | | (12,520 | ) |
Investments paid in advance, at cost | | | 9,945,832 | |
Increase/(Decrease) in Liabilities: | | | | |
Unrealized depreciation on forward foreign currency contracts | | | (4,829 | ) |
Net Investment management fee and expense recoupment | | | 209,111 | |
Interest fees | | | (6,250 | ) |
Distribution and service fees | | | 3,860 | |
Professional fees | | | 2,287 | |
Transfer agent fees | | | (11,377 | ) |
Accounting and administration fees | | | 12,269 | |
Other accrued liabilities | | | (10,311 | ) |
Net Cash Used in Operating Activities | | | (113,851,921 | ) |
| | | | | |
Cash Flows from Financing Activities | | | | |
Proceeds from shares sold | | | 121,112,273 | |
Distributions paid to shareholders, net of reinvestments | | | (2,181,847 | ) |
Payments for shares repurchased, net of repurchase fees | | | (6,080,544 | ) |
Net Cash Provided by Financing Activities | | | 112,849,882 | |
| | | | | |
Effects of foreign currency exchange rate changes in cash | | | 31,860 | |
| | | | | |
Net decrease in cash | | | (970,179 | ) |
| | | | | |
Cash at beginning of period | | | 1,005,768 | |
Cash denominated in foreign currencies at beginning of period | | | — | |
Total cash and cash equivalents at beginning of period | | | 1,005,768 | |
| | | | | |
Cash at end of period | | | 35,589 | |
Cash denominated in foreign currencies at end of period | | | — | |
Total cash at end of period | | $ | 35,589 | |
| | | | | |
Supplemental disclosure of non-cash activity: | | | | |
Reinvestment of distributions | | $ | 6,283,527 | |
See accompanying Notes to Financial Statements.
13
Bow River Capital Evergreen Fund |
FINANCIAL HIGHLIGHTS
CLASS I SHARES |
Per share operating performance.
For a capital share outstanding throughout each period.
| | For the
year ended
March 31,
20231 | | For the
year ended
March 31,
20221 | | For the
period ended
March 31,
20211,2 |
Net Asset Value, beginning of period | | $ | 40.23 | | | $ | 33.42 | | | $ | 30.86 | |
Income from Investment Operations: | | | | | | | | | | | | |
Net investment loss3 | | | (0.52 | ) | | | (0.63 | ) | | | (0.13 | ) |
Net realized and unrealized gain on investments | | | 1.76 | | | | 7.71 | | | | 2.69 | |
Total from investment operations | | | 1.24 | | | | 7.08 | | | | 2.56 | |
| | | | | | | | | | | | | |
Distributions to investors: | | | | | | | | | | | | |
From net realized gain | | | (1.14 | ) | | | (0.27 | ) | | | — | |
Total distributions to investors | | | (1.14 | ) | | | (0.27 | ) | | | — | |
Redemption Fees3: | | | 0.01 | | | | — | | | | — | |
Net Asset Value, end of period | | $ | 40.34 | | | $ | 40.23 | | | $ | 33.42 | |
| | | | | | | | | | | | | |
Total Return4 | | | 3.17 | % | | | 21.23 | % | | | 8.30 | %5 |
| | | | | | | | | | | | | |
Ratios and Supplemental Data: | | | | | | | | | | | | |
Net Assets, end of period (in thousands) | | $ | 315,333 | | | $ | 214,878 | | | $ | 95,904 | |
| | | | | | | | | | | | | |
Net investment loss6 | | | (1.31 | )% | | | (1.73 | )% | | | (1.71 | )%7 |
| | | | | | | | | | | | | |
Gross expenses inclusive of interest expense6,8 | | | 2.20 | % | | | 2.42 | % | | | 3.06 | %9 |
Net expenses inclusive of interest expense6,10 | | | 2.27 | % | | | 2.26 | % | | | 2.25 | %7 |
| | | | | | | | | | | | | |
Gross expenses exclusive of interest expense6,8 | | | 2.18 | % | | | 2.41 | % | | | 3.06 | %9 |
Net expenses exclusive of interest expense6,10 | | | 2.25 | % | | | 2.25 | % | | | 2.25 | %7 |
| | | | | | | | | | | | | |
Portfolio Turnover Rate | | | 13 | % | | | 19 | % | | | 21 | %5 |
Borrowings – Revolving Credit Facility | | $ | — | | | $ | — | | | $ | — | |
Assets Coverage per $1,000 of Borrowings11 | | | — | | | | — | | | | — | |
Revolving Credit Facility | | | Not Applicable | | | | Not Applicable | | | | Not Applicable | |
See accompanying Notes to Financial Statements.
14
Bow River Capital Evergreen Fund |
FINANCIAL HIGHLIGHTS
CLASS II SHARES |
Per share operating performance.
For a capital share outstanding throughout each period.
| | For the
year ended
March 31,
20231 | | For the
period ended
March 31,
20221,2 |
Net Asset Value, beginning of period | | $ | 40.20 | | | $ | 38.33 | |
Income from Investment Operations: | | | | | | | | |
Net investment loss3 | | | (0.62 | ) | | | (0.14 | ) |
Net realized and unrealized gain on investments | | | 1.76 | | | | 2.01 | |
Total from investment operations | | | 1.14 | | | | 1.87 | |
| | | | | | | | | |
Distributions to investors: | | | | | | | | |
From net realized gain | | | (1.14 | ) | | | — | |
Total distributions to investors | | | (1.14 | ) | | | — | |
Redemption Fees3: | | | 0.01 | | | | — | |
Net Asset Value, end of period | | $ | 40.21 | | | $ | 40.20 | |
| | | | | | | | | |
Total Return4 | | | 2.92 | % | | | 4.88 | %5 |
| | | | | | | | | |
Ratios and Supplemental Data: | | | | | | | | |
Net Assets, end of period (in thousands) | | $ | 24,287 | | | $ | 6,409 | |
| | | | | | | | | |
Net investment loss6,7 | | | (1.56 | )% | | | (1.71 | )% |
| | | | | | | | | |
Gross expenses inclusive of interest expense6,8 | | | 2.45 | % | | | 2.67 | %7 |
Net expenses inclusive of interest expense6,9 | | | 2.52 | % | | | 2.51 | %7 |
| | | | | | | | | |
Gross expenses exclusive of interest expense6,8 | | | 2.43 | % | | | 2.66 | %7 |
Net expenses exclusive of interest expense6,9 | | | 2.50 | % | | | 2.50 | %7 |
| | | | | | | | | |
Portfolio Turnover Rate | | | 13 | % | | | 19 | %10 |
Borrowings – Revolving Credit Facility | | $ | — | | | $ | — | |
Assets Coverage per $1,000 of Borrowings11 | | | — | | | | — | |
Revolving Credit Facility | | | Not Applicable | | | | Not Applicable | |
See accompanying Notes to Financial Statements.
15
Bow River Capital Evergreen Fund |
NOTES TO THE FINANCIAL STATEMENTS
MARCH 31, 2023 |
1. Organization
Bow River Capital Evergreen Fund (the “Fund”) was organized as a Delaware statutory trust on April 21, 2020 and commenced operations on January 1, 2021 following the reorganization of the Bow River Capital Evergreen Private Equity Fund, LP (the “Predecessor Fund”) with and into Class I shares of the Fund, which was effective as of the close of business on December 31, 2020. The Fund currently offers two classes of shares: Class I Shares and Class II Shares (“Shares”). Class II Shares commenced operations on January 3, 2022. The Fund is a non-diversified, closed-end management investment company that operates as an interval fund pursuant to Rule 23c-3 of the Investment Company Act of 1940 (the “1940 Act”), as amended. The Fund is available to “accredited investors” within the meaning of Rule 501 under the Security Act of 1933, as amended.
The Fund’s investment objective is to generate long-term capital appreciation by investing in a broad portfolio of private equity investments that provide attractive risk-adjusted return potential. The Fund will seek to achieve its investment objective through broad exposure to private equity, private credit, and semi-liquid or listed investments, that may include: (i) direct investments; (ii) secondary investments; (iii) private credit instruments; (iv) primary fund commitments; (v) direct or secondary purchases of liquid credit instruments; (vi) other liquid investments; and (vii) short-term investments.
Effective at the close of business on March 31, 2023, Bow River Asset Management LLC transferred its rights and obligations under the investment management agreement with the Fund to Bow River Advisers, LLC, (the “Adviser”) a majority-owned subsidiary that is registered as an investment adviser under the Investment Advisers Act of 1940 (the “Advisers Act”), as amended. Aksia CA LLC, an investment adviser registered under the Advisers Act, serves as a non-discretionary investment consultant to the Adviser with respect to the Fund. The Fund’s Board of Trustees (the “Board”) has the overall responsibility for the management and supervision of the business operations of the Fund. The Board may delegate any of its rights, powers, and authority to, among others, the officers of the Fund, any committee of the Board, or the Adviser.
2. Significant Accounting Policies
Basis of Presentation and Use of Estimates — The Fund is an investment company and as a result, maintains its accounting records and has presented these financial statements in accordance with the reporting requirements under Financial Accounting Standards Board (“FASB”) Accounting Standards Codification (“ASC”) Topic 946, Financial Services — Investment Companies (“ASC 946”). The presentation of the financial statements are in conformity with generally accepted accounting principles in the United States of America (“GAAP”), which requires management to make estimates and assumptions that affect the reported amounts of assets and liabilities and disclosure of contingent assets and liabilities at the date of the financial statement, as well as reported amounts of increases and decreases in net assets from operations during the reporting period. Actual results could differ from these estimates.
Income Recognition and Expenses — Interest income is recognized on an accrual basis as earned. Dividend income is recorded on the ex-dividend date. Distributions received from investments in securities and private funds that represent a return of capital or capital gains are recorded as a reduction of cost of investment or as a realized gain, respectively. Expenses are recognized on an accrual basis as incurred. The Fund bears all expenses incurred in the course of its operations, including, but not limited to, the following: all costs and expenses related to portfolio transactions and positions for the Fund’s account; professional fees; costs of insurance; registration expenses; and expenses of meetings of the Board. Expenses are subject to the Fund’s Expense Limitation Agreement (see Note 5).
Investment Transactions — Investment transactions are accounted for on a trade date basis. Cost is determined and gains and losses are based upon the identified cost basis for publicly traded investments and average cost for the Fund’s private investments for both financial statement and federal income tax purposes.
Distributions to Shareholders — Distributions to shareholders arising from net investment income and net realized capital gains, if any, are declared and paid annually. The amount of distributions from net investment income and net realized capital gains are determined in accordance with federal income tax regulations, which may differ from GAAP. Distributions to shareholders are recorded on the ex-dividend date.
Valuation — The Fund will calculate its net asset value (“NAV”) as of the close of regular trading on the New York Stock Exchange on the last business day of each calendar week, each business day for the five business days preceding a repurchase request deadline (at such specific time set by the Board), each date that a Share is offered or repurchased, as of the date of any distribution and at such other times as the Board shall determine (each, a “Determination Date”). In determining its NAV, the Fund will value its investments as of the relevant Determination Date. The NAV of the Fund will equal, unless otherwise noted, the value of the total assets of the Fund, less all liabilities, including accrued fees and expenses, each determined as of the relevant Determination Date.
16
Bow River Capital Evergreen Fund |
NOTES TO THE FINANCIAL STATEMENTS (CONTINUED)
MARCH 31, 2023 |
In December 2020, the Securities and Exchange Commission (“SEC”) adopted a new rule providing a framework for fund valuation practices (“Rule 2a-5”). Rule 2a-5 establishes requirements for determining fair value in good faith for purposes of the 1940 Act. The Fund was required to comply with Rule 2a-5 by September 8, 2022 and as a result, the Board has approved valuation procedures for the Fund (the “Valuation Procedures”) which will be used for determining the fair value of any Fund investments for which a market quotation is not readily available. The valuation of the Fund’s investments is performed in accordance with the principles found in Rule 2a-5 and in conjunction with FASB’s ASC Topic 820, Fair Value Measurements and Disclosures (“ASC 820-10). The Board has designated the Adviser as the valuation designee of the Fund. As valuation designee, the Adviser performs the fair value determination relating to any and all Fund investments, subject to the conditions and oversight requirements described in the Valuation Procedures. In furtherance of its duties as valuation designee, the Adviser has formed a valuation committee (the “Valuation Committee”), to perform fair value determinations and oversee the day-to-day functions related to the fair valuation of the Fund’s investments. The Valuation Committee may consult with representatives from the Fund’s outside legal counsel or other third-party consultants in their discussions and deliberations.
Securities traded on one or more of the U.S. national securities exchanges, the Nasdaq Stock Market or any foreign stock exchange will be valued based on their respective market price. The money market demand accounts are priced at cost. Shares of mutual funds, including money market funds, are valued at their reported NAV. U.S. Treasury Bills with a maturity date of 91 days or less from the date of purchase are valued at amortized cost. U.S. Treasury Bills with a maturity date more than 91 days from the date of purchase are valued using the latest bid prices or using valuations based on a matrix system (which considers such factors as security prices, yields, maturities, and ratings), both as furnished by independent pricing services.
Debt instruments for which market quotations are readily available are typically valued based on such market quotations. In validating market quotations, the Valuation Committee considers different factors such as the source and the nature of the quotation in order to determine whether the quotation represents fair value. The Valuation Committee makes use of reputable financial information providers in order to obtain the relevant quotations.
For debt and equity securities which are not publicly traded or for which market prices are not readily available (unquoted investments) the fair value is determined in good faith. In determining the fair values of these investments, the Valuation Committee will typically apply widely recognized market and income valuation methodologies including, but not limited to, earnings and multiple analysis, discounted cash flow method and third-party valuations. In order to determine a fair value, these methods, in the discretion of the Valuation Committee, are applied to the latest information provided by the underlying portfolio companies or other business counterparties.
Due to the inherent uncertainty in determining the fair value of investments for which market values are not readily available the fair values of these investments may fluctuate from period to period. In addition, such fair value may differ materially from the values that may have been used had a ready market existed for such investments and may significantly differ from the value ultimately realized by the Fund.
Assets and liabilities initially expressed in foreign currencies will be converted into U.S. Dollars using foreign exchange rates provided by a recognized pricing service.
Primary and Secondary Fund Investments
Primary investments are commitments to new private equity, private credit, or other private funds. Secondary investments are purchases of existing interests that are acquired on the secondary market. Primary or secondary investments in private funds are generally valued based on the latest NAV reported by the third-party fund manager or General Partner. This is commonly referred to as using NAV as a practical expedient which allows for estimation of the fair value of an investment in a private fund based on NAV or its equivalent if the NAV of the private fund is calculated in a manner consistent with ASC 946. Because of the inherent uncertainty of valuations of the investments in private funds, their estimated values may differ significantly from the values that would have been used had a ready market for the private funds existed, and the differences could be material. New purchases of primary or secondary investments in private funds will be valued at acquisition cost initially until a NAV is provided by the third-party fund manager or General Partner. The Fund will review any cash flows since the reference date of the last NAV for a private fund received by the Fund from a third-party manager (“Portfolio Fund Manager”) until the Determination Date are recognized by (i) adding the nominal amount of the investment related capital calls and (ii) deducting the nominal amount of investment related distributions from the NAV as reported by the Portfolio Fund Manager.
In addition to tracking the NAV plus related cash flows of such secondary purchases of interests in closed-end private funds (“Portfolio Funds”), the Valuation Committee may also track relevant broad-based and issuer (or fund) specific valuation information relating to the assets held by each private fund which is reasonably available at the time the Fund values its investments. Portfolio Funds’ Managers
17
Bow River Capital Evergreen Fund |
NOTES TO THE FINANCIAL STATEMENTS (CONTINUED)
MARCH 31, 2023 |
only provide determinations of the net asset values of the Portfolio Funds on a monthly or quarterly basis, in which event it will not be possible to determine the net asset value of the Fund more frequently. The Valuation Committee will consider such information and may conclude in certain circumstances that the information provided by the Portfolio Fund Manager does not represent the fair value of a particular asset held by a Portfolio Fund. If the Valuation Committee concludes in good faith that the latest NAV reported by a Portfolio Fund Manager does not represent fair value (e.g., there is more current information regarding a portfolio asset which significantly changes its fair value) the Valuation Committee will make a corresponding adjustment to reflect the current fair value of such asset within such Portfolio Fund. In determining the fair value of assets held by Portfolio Funds, the Valuation Committee applies valuation methodologies as outlined above.
Co-Investments
Co-investments are minority investments in a company made by investors alongside a private equity fund manager or venture capital firm. Co-investments in private equity funds may be valued based on the latest NAV reported by the third-party fund manager or General Partner. In assessing the fair value of the Fund’s Co-Investments in accordance with the Valuation Procedures, the Adviser uses a variety of methods such as earnings and multiple analysis, discounted cash flow and market data from third party pricing services and makes assumptions that are based on market conditions existing at the end of each reporting period. Because of the inherent uncertainty of estimates, fair value determinations based on estimates may differ from the values that would have been used had a ready market for the securities existed, and the differences could be material.
Foreign Currency Exchange Contracts — The Fund may enter into foreign currency exchange contracts. The Fund may enter into these contracts for the purchase or sale of a specific foreign currency at a fixed price on a future date to hedge various investments, for risk management (i.e., hedging purposes). All foreign currency exchange contracts are market-to-market at the applicable translation rates resulting in unrealized gains or losses. Realized gains or losses are recorded at the time the foreign currency exchange contract is offset by entering into a closing transaction, or by the delivery, or receipt, of the currency. Risk may arise upon entering into these contracts from the potential inability of counterparties to meet the terms of their contracts and from unanticipated movements in the value of a foreign currency relative to the U.S. dollar.
Federal Income Taxes — The Fund intends to continue to qualify as a “regulated investment company” under Subchapter M of the Internal Revenue Code of 1986, as amended. The Fund utilizes a tax-year end of September 30 and the Fund’s income and federal excise tax returns and all financial records supporting the prior year returns are subject to examination by the federal and Delaware revenue authorities. If so qualified, the Fund will not be subject to federal income tax to the extent it distributes substantially all of its net investment income and capital gains to shareholders. Therefore, no federal income tax provision is required. Management of the Fund is required to determine whether a tax position taken by the Fund is more likely than not to be sustained upon examination by the applicable taxing authority, based on the technical merits of the position. Based on its analysis, there were no tax positions identified by management of the Fund which did not meet the “more likely than not” standard as of March 31, 2023. The Fund’s policy is to classify any interest or penalties associated with underpayment of federal and state income taxes as an income tax expense on the Statement of Operations.
Shareholder Subscriptions — Shareholder subscriptions received in advance are comprised of cash received on or prior to March 31, 2023 for which shares are issued on April 1, 2023. Shareholder subscriptions received in advance do not participate in the earnings of the Fund until shares are issued.
3. Fair Value Disclosures
GAAP defines fair value, establishes a three-tier framework for measuring fair value based on a hierarchy of inputs, and expands disclosure about fair value measurements. It also provides guidance on determining when there has been a significant decrease in the volume and level of activity for an asset or liability, when a transaction is not orderly and how that information must be incorporated into a fair value measurement. The hierarchy distinguishes between market data obtained from independent sources (observable inputs) and the Fund’s own market assumptions (unobservable inputs). These inputs are used in determining the fair value of the Fund’s investments. These inputs are summarized in the three broad levels listed below:
• Level 1 — unadjusted quoted prices in active markets for identical securities. An active market for the security is a market in which transactions occur with sufficient frequency and volume to provide pricing information on an ongoing basis. A quoted price in an active market provides the most reliable evidence of fair value.
18
Bow River Capital Evergreen Fund |
NOTES TO THE FINANCIAL STATEMENTS (CONTINUED)
MARCH 31, 2023 |
• Level 2 — other significant observable inputs (including quoted prices for similar securities, interest rates, prepayment speeds, credit risk, etc. and quoted prices for identical or similar assets in markets that are not active.) Inputs that are derived principally from or corroborated by observable market data. An adjustment to any observable input that is significant to the fair value may render the measurement a Level 3 measurement.
• Level 3 — significant unobservable inputs, including inputs that are not derived from market data or cannot be corroborated by market data and when the investment is not redeemable in the near term.
Private investments that are reported on the Fund’s schedule of investments as being measured at fair value using the Fund’s pro rata NAV (or its equivalent) without further adjustment, as a practical expedient of fair value and therefore these investments are excluded from the fair value hierarchy. Generally, the fair value of the Fund’s investment in a private investment represents the amount that the Fund could reasonably expect to receive from the investment fund if the Fund’s investment is withdrawn at the measurement date based on NAV.
The inputs used to measure fair value may fall into different levels of the fair value hierarchy. In such cases, for disclosure purposes, the level in the fair value hierarchy within which the fair value measurement falls in its entirety is determined based on the lowest level input that is significant to the fair value measurement in its entirety.
The inputs or methodology used for valuing securities are not necessarily an indication of the risk associated with investing in those securities. The following is a summary of the valuation inputs used to value the Fund’s assets and liabilities as of March 31, 2023:
| | | | Fair Value Measurements at the
End of the Reporting Period Using | | |
Investments | | Practical
Expedient* | | Level 1
Quoted Prices | | Level 2
Other Significant
Observable
Inputs | | Level 3
Significant
Unobservable
Inputs | | Total |
Security Type | | | | | | | | | | | | | | | |
Private Investments** | | $ | 213,372,751 | | $ | — | | $ | 1,972,315 | | $ | 50,031,407 | | $ | 265,376,473 |
Exchange Traded Funds | | | — | | | 2,983,000 | | | — | | | — | | | 2,983,000 |
U.S. Treasury Bills | | | — | | | — | | | 29,953,529 | | | — | | | 29,953,529 |
Short-Term Investments | | | — | | | 55,018,696 | | | — | | | — | | | 55,018,696 |
Total | | $ | 213,372,751 | | $ | 58,001,696 | | $ | 31,925,844 | | $ | 50,031,407 | | $ | 353,331,698 |
| |
The following is a summary of valuation inputs used to measure the Fund’s other financial instruments that are derivative instruments not reflected in the Schedule of Investments as of March 31, 2023:
Type | | Level 1 | | Level 2 | | Level 3 | | Total |
Forward foreign currency contracts | | $ | — | | $ | 12,520 | | $ | — | | $ | 12,520 |
| | | $ | — | | $ | 12,520 | | $ | — | | $ | 12,520 |
| |
19
Bow River Capital Evergreen Fund |
NOTES TO THE FINANCIAL STATEMENTS (CONTINUED)
MARCH 31, 2023 |
The following is a roll-forward of the activity in investments in which significant unobservable inputs (Level 3) were used in determining fair value on a recurring basis:
| | Beginning
balance
April 1, 2022 | | Transfers
into Level 3
during the
period | | Transfers
out of
Level 3
during the
period | | Purchases or
Contributions | | Sales or
Distributions | | Net realized
gain | | Change in net
unrealized
appreciation | | Ending
balance
March 31,
2023 |
Private Investments | | $ | 57,564,880 | | $ | 22,144,933 | | $ | (23,263,214) | | $ | 4,303,315 | | $ | (12,817,182) | | $ | 3,022,035 | | $ | (923,360) | | $ | 50,031,407 |
The change in net unrealized appreciation (depreciation) included in the Statement of Operations attributable to Level 3 investments that were held as of March 31, 2023 is $(1,589,537).
Transfers into Level 3 during the period represent investments being valued by management using unobservable inputs as an adjustment to reported fair values. Transfers out of Level 3 during the period represent investments that are being measured at fair value using the Fund’s pro rata NAV (or its equivalent) as a practical expedient and/or being valued using observable market data.
The following is a summary of quantitative information about significant unobservable valuation inputs for Level 3 Fair Value Measurements for investments held as of March 31, 2023:
Level 3 Investments | | Fair Value as of
March 31, 2023 | | Valuation Technique | | Unobservable
Inputs | | Range of
Inputs/Discount
Rate/Price | | Impact to
Valuation from
an Increase in
Input |
Credit Co-Investments | | | | | | | | | | | |
Ashgrove Specialty Lending Investments I | | $ | 861,613 | | Market Approach | | General Partner Net Asset Value | | Not Applicable | | Increase |
Ashgrove Specialty Lending Investments I, DAC | | $ | 2,210,576 | | Market Approach | | Transaction Price | | Not Applicable | | Increase |
Ecoville Investments Limited | | $ | 1,980,000 | | Income Approach | | Discount Rate | | 11.16% - 12.16% | | Decrease |
Polaris Newco | | $ | 1,705,000 | | Income Approach | | Discount Rate | | 13.97% - 14.97% | | Decrease |
US Hospitality Publishers, Inc. | | $ | 1,823,562 | | Income Approach | | Discount Rate | | 11.46% - 12.46% | | Decrease |
Planet US Buyer, LLC | | $ | 2,711,806 | | Income Approach | | Discount Rate | | 9.95% - 10.95% | | Decrease |
Equity Co-Investments | | | | | | | | | | | |
The Global Atlantic Financial Group, LLC | | $ | 4,380,373 | | Market Approach | | Net Book Value | | Not Applicable | | Increase |
Veregy Parent, LLC | | $ | 3,182,840 | | Market Approach | | Adjusted EBITDA Multiple | | 9.1x - 14.3x | | Increase |
Ashgrove Specialty Lending Investments I, DAC | | $ | 722,592 | | Market Approach | | Transaction Price | | Not Applicable | | Increase |
Westcap Loanpal Co-invest 2020 LLC* | | $ | 3,799,773 | | Income Approach | | Discount Rate | | 31.00% | | Decrease |
| | | | | | Market Approach | | Adjusted EBITDA Multiple | | 16.2x - 28.7x | | Increase |
| | | | | | Market Approach | | General Partner Net Asset Value | | Not Applicable | | Increase |
DSG Group Holdings, LP | | $ | 6,715,991 | | Market Approach | | Adjusted EBITDA Multiple | | 10.5x | | Increase |
Butterfly Nourish Co-Invest, LP | | $ | 4,999,848 | | Market Approach | | Recent Transaction Price | | Not Applicable | | Increase |
20
Bow River Capital Evergreen Fund |
NOTES TO THE FINANCIAL STATEMENTS (CONTINUED)
MARCH 31, 2023 |
Level 3 Investments | | Fair Value as of
March 31, 2023 | | Valuation Technique | | Unobservable
Inputs | | Range of
Inputs/Discount
Rate/Price | | Impact to
Valuation from
an Increase in
Input |
Primary Funds | | | | | | | | | | | |
Sheridan Capital Partners Fund III, LP | | $ | 984,347 | | Market Approach | | Recent Transaction Price | | Not Applicable | | Increase |
Westcap Strategic Operator U.S. Feeder Fund, LP | | $ | 8,652,438 | | Market Approach | | General Partner Net Asset Value | | Not Applicable | | Increase |
| | | | | | | | Discount Rate | | 1.77% | | Decrease |
Secondary Funds | | | | | | | | | | | |
BRCE SPV I, LLC | | $ | 254,491 | | Market Approach | | General Partner Net Asset Value | | Not Applicable | | Increase |
Forrest Holdings I, LP – Class A | | $ | 13,634 | | Market Approach | | Transaction Price | | Not Applicable | | Increase |
Forrest Holdings I, LP – Class B | | $ | 190,808 | | Market Approach | | Transaction Price | | Not Applicable | | Increase |
Graphite Capital Partners VIII D, LP | | $ | 4,841,715 | | Market Approach | | General Partner Net Asset Value | | Not Applicable | | Increase |
Total Level 3 Investments | | $ | 50,031,407 | | | | | | | | |
The following is the fair value measurement of investments that are measured at the Fund’s pro rata NAV (or its equivalent) as a practical expedient:
Private Investments* | | Investment Strategy | | Fair Value | | Unfunded
Commitments | | Redemption
Frequency | | Redemption
Notice Period | | Lock Up Period |
ACP Hyperdrive Co-Invest, LLC | | Private Equity Co-Investment | | $ | 2,620,000 | | $ | — | | Subject to GP Consent | | Not Applicable | | Not Applicable |
Adams Street 2009 Direct Fund, LP | | Private Equity Secondary | | | 24,107 | | | 1,762 | | Subject to GP Consent | | Not Applicable | | Not Applicable |
Adams Street 2010 Direct Fund, LP | | Private Equity Secondary | | | 29,343 | | | 3,471 | | Subject to GP Consent | | Not Applicable | | Not Applicable |
Adams Street 2011 Direct Fund, LP | | Private Equity Secondary | | | 41,638 | | | 6,666 | | Subject to GP Consent | | Not Applicable | | Not Applicable |
Adams Street 2011 Non-U.S. Developed Markets Fund, LP | | Private Equity Secondary | | | 140,953 | | | 42,587 | | Subject to GP Consent | | Not Applicable | | Not Applicable |
Adams Street 2011 U.S. Fund, LP | | Private Equity Secondary | | | 318,549 | | | 58,073 | | Subject to GP Consent | | Not Applicable | | Not Applicable |
Adams Street 2013 Global Fund, LP | | Private Equity Secondary | | | 1,907,607 | | | 134,811 | | Subject to GP Consent | | Not Applicable | | Not Applicable |
Adams Street 2014 Global Fund, LP | | Private Equity Secondary | | | 1,055,592 | | | 69,822 | | Subject to GP Consent | | Not Applicable | | Not Applicable |
Adams Street Partnership Fund 2009 Non-U.S. Developed Markets Fund, LP | | Private Equity Secondary | | | 115,939 | | | 29,504 | | Subject to GP Consent | | Not Applicable | | Not Applicable |
Adams Street Partnership Fund 2009 U.S. Fund, LP | | Private Equity Secondary | | | 260,310 | | | 36,490 | | Subject to GP Consent | | Not Applicable | | Not Applicable |
Adams Street Partnership Fund 2010 Non-U.S. Developed Markets Fund, LP | | Private Equity Secondary | | | 111,342 | | | 26,567 | | Subject to GP Consent | | Not Applicable | | Not Applicable |
Adams Street Partnership Fund 2010 U.S. Fund, LP | | Private Equity Secondary | | | 291,712 | | | 52,955 | | Subject to GP Consent | | Not Applicable | | Not Applicable |
Altor Fund IV (No. 1) AB | | Private Equity Secondary | | | 6,208,258 | | | 1,986,344 | | Subject to GP Consent | | Not Applicable | | Not Applicable |
21
Bow River Capital Evergreen Fund |
NOTES TO THE FINANCIAL STATEMENTS (CONTINUED)
MARCH 31, 2023 |
Private Investments* | | Investment Strategy | | Fair Value | | Unfunded
Commitments | | Redemption
Frequency | | Redemption
Notice Period | | Lock Up Period |
AP DSB Co-Invest II, LP | | Private Equity Co-Investment | | $ | 3,561,985 | | $ | 39,424 | | Subject to GP Consent | | Not Applicable | | Not Applicable |
Ashgrove Specialty Lending Fund I SCSp RAIF | | Private Credit Primary | | | 1,289,558 | | | 976,033 | | Subject to GP Consent | | Not Applicable | | Not Applicable |
ASP (Feeder) 2017 Global Fund, LP | | Private Equity Secondary | | | 1,160,633 | | | 179,185 | | Subject to GP Consent | | Not Applicable | | Not Applicable |
Avista Capital Partners V, LP | | Private Equity Primary | | | 4,690,650 | | | 112,052 | | Subject to GP Consent | | Not Applicable | | Not Applicable |
Biloxi Co-Investment Partners, LP | | Private Equity Co-Investment | | | 1,681,794 | | | 544,679 | | Subject to GP Consent | | Not Applicable | | Not Applicable |
BW Colson Co-Invest Feeder (Cayman), LP | | Private Equity Co-Investment | | | 3,822,242 | | | — | | Subject to GP Consent | | Not Applicable | | Not Applicable |
Carlyle Riser Co-Investment, LP | | Private Equity Co-Investment | | | 4,635,058 | | | 1,000,000 | | Subject to GP Consent | | Not Applicable | | Not Applicable |
Coller Credit Opportunities I – Annex I, SLP | | Private Credit Secondary | | | 3,136,179 | | | 1,126,133 | | Subject to GP Consent | | Not Applicable | | Not Applicable |
Coller Credit Opportunities I – B, LP | | Private Credit Primary | | | 2,074,985 | | | 3,111,281 | | Subject to GP Consent | | Not Applicable | | Not Applicable |
Coller International Partners VI Feeder Fund, LP – Class A | | Private Equity Secondary | | | 990,109 | | | 327,000 | | Subject to GP Consent | | Not Applicable | | Not Applicable |
Coller International Partners VII Feeder Fund, LP – Series B | | Private Equity Secondary | | | 1,805,561 | | | 1,244,188 | | Subject to GP Consent | | Not Applicable | | Not Applicable |
Constellation 2022, LP | | Private Equity Co-Investment | | | 4,998,967 | | | — | | Subject to GP Consent | | Not Applicable | | Not Applicable |
Corsair Amore Investors, LP | | Private Equity Co-Investment | | | 4,994,829 | | | — | | Subject to GP Consent | | Not Applicable | | Not Applicable |
Coyote 2021, LP | | Private Equity Co-Investment | | | 7,652,220 | | | 393,776 | | Subject to GP Consent | | Not Applicable | | Not Applicable |
CRG Partners III – Parallel Fund (A), LP | | Private Credit Secondary | | | 3,615,488 | | | 2,895,395 | | Subject to GP Consent | | Not Applicable | | Not Applicable |
Digital Alpha Solutions Fund, LP | | Private Credit Co-Investment | | | 3,829,410 | | | 560,154 | | Subject to GP Consent | | Not Applicable | | Not Applicable |
Enak Aggregator, LP | | Private Equity Co-Investment | | | 3,185,673 | | | — | | Subject to GP Consent | | Not Applicable | | Not Applicable |
EnCap Energy Transition Fund 1-A, LP | | Private Equity Primary | | | 3,043,313 | | | 1,607,436 | | Subject to GP Consent | | Not Applicable | | Not Applicable |
Falcon Co-Investment Partners, LP | | Private Equity Co-Investment | | | 2,895,574 | | | 1,101,449 | | Subject to GP Consent | | Not Applicable | | Not Applicable |
FFL Capital Partners V, LP | | Private Equity Primary | | | 5,651,328 | | | 3,382,145 | | Subject to GP Consent | | Not Applicable | | Not Applicable |
Global Infrastructure Partners II-C, LP | | Private Equity Secondary | | | 1,215,146 | | | 229,867 | | Subject to GP Consent | | Not Applicable | | Not Applicable |
Grain Spectrum Holdings III (Cayman), LP | | Private Equity Primary | | | 3,310,155 | | | 553,296 | | Subject to GP Consent | | Not Applicable | | Not Applicable |
ISH Co-Investment Aggregator, LP | | Private Equity Co-Investment | | | 2,573,735 | | | 692,308 | | Subject to GP Consent | | Not Applicable | | Not Applicable |
KH Aggregator, LP | | Private Equity Secondary | | | 4,824,252 | | | — | | Subject to GP Consent | | Not Applicable | | Not Applicable |
Lynx EBO Fund I (A), LLC | | Private Credit Primary | | | 447,112 | | | — | | Subject to GP Consent | | Not Applicable | | Not Applicable |
OceanSound Partners Co-Invest II, LP – Series B | | Private Equity Co-Investment | | | 5,464,518 | | | — | | Subject to GP Consent | | Not Applicable | | Not Applicable |
OceanSound Partners Co-Invest II, LP – Series E | | Private Equity Co-Investment | | | 7,569,913 | | | — | | Subject to GP Consent | | Not Applicable | | Not Applicable |
OceanSound Partners Fund, LP | | Private Equity Primary | | | 4,583,838 | | | 934,679 | | Subject to GP Consent | | Not Applicable | | Not Applicable |
Onex Fund V, LP | | Private Equity Secondary | | | 6,516,342 | | | 1,554,275 | | Subject to GP Consent | | Not Applicable | | Not Applicable |
22
Bow River Capital Evergreen Fund |
NOTES TO THE FINANCIAL STATEMENTS (CONTINUED)
MARCH 31, 2023 |
Private Investments* | | Investment Strategy | | Fair Value | | Unfunded
Commitments | | Redemption
Frequency | | Redemption
Notice Period | | Lock Up Period |
Onex OD Co-Invest, LP | | Private Equity Co-Investment | | $ | 5,292,788 | | $ | — | | Subject to GP Consent | | Not Applicable | | Not Applicable |
Onex Structured Credit Opportunities International Fund I, LLC | | Private Equity Primary | | | 1,629,394 | | | 284,515 | | Subject to GP Consent | | Not Applicable | | Not Applicable |
Overbay Fund XIV (AIV III), LP | | Private Equity Secondary | | | 2,443,436 | | | 170,407 | | Subject to GP Consent | | Not Applicable | | Not Applicable |
Overbay Fund XIV Offshore (AIV), LP | | Private Equity Secondary | | | 4,121,372 | | | 579,387 | | Subject to GP Consent | | Not Applicable | | Not Applicable |
Overbay Fund XIV Offshore, LP | | Private Equity Secondary | | | 2,411,632 | | | 16,715 | | Subject to GP Consent | | Not Applicable | | Not Applicable |
Palms Co-Investment Partners, LP | | Private Equity Co-Investment | | | 3,807,958 | | | 190,476 | | Subject to GP Consent | | Not Applicable | | Not Applicable |
PARIOU S.L.P. | | Private Credit Co-Investment | | | 5,842,948 | | | 33,576 | | Subject to GP Consent | | Not Applicable | | Not Applicable |
PIMCO DSCO Fund II Offshore Feeder, LP | | Private Credit Primary | | | 4,799,094 | | | — | | Quarterly | | 60 days | | Not Applicable |
Porcupine Holdings, LP – Class A | | Private Equity Secondary | | | 2,895,534 | | | 2,075,472 | | Subject to GP Consent | | Not Applicable | | Not Applicable |
Porcupine Holdings, LP – Class B | | Private Equity Secondary | | | 2,543,439 | | | — | | Subject to GP Consent | | Not Applicable | | Not Applicable |
Post Limited Term High Yield Fund, LP | | Short Duration High Yield | | | 6,042,865 | | | — | | Monthly | | 30 days | | Not Applicable |
Project Stream Co-Invest Fund, LP | | Private Equity Co-Investment | | | 1,666,765 | | | — | | Subject to GP Consent | | Not Applicable | | Not Applicable |
Ruffer Absolute Institutional, Ltd. | | Global Macro | | | 5,091,501 | | | — | | Subject to GP Consent | | Not Applicable | | Not Applicable |
Saba Capital Carry Neutral Tail Hedge Offshore Fund, Ltd. | | Long/Short Carry Neutral | | | 5,475,615 | | | — | | Monthly | | 35 days | | 6 months |
SANCY S.L.P. | | Private Equity Co-Investment | | | 1,624,496 | | | 11,192 | | Subject to GP Consent | | Not Applicable | | Not Applicable |
SEP Hamilton III Aggregator, LP | | Private Equity Co-Investment | | | 6,585,374 | | | — | | Subject to GP Consent | | Not Applicable | | Not Applicable |
SEP Skyhawk Fund III Aggregator, LP | | Private Equity Co-Investment | | | 545,487 | | | — | | Subject to GP Consent | | Not Applicable | | Not Applicable |
Sumeru Equity Partners Fund III, LP | | Private Equity Primary | | | 2,460,102 | | | 509,451 | | Subject to GP Consent | | Not Applicable | | Not Applicable |
Sumeru Equity Partners Fund IV, LP | | Private Equity Primary | | | 398,869 | | | 3,513,298 | | Subject to GP Consent | | Not Applicable | | Not Applicable |
TKO Fund | | Private Credit Primary | | | 3,411,419 | | | 2,150,460 | | Subject to GP Consent | | Not Applicable | | Not Applicable |
VCPF III Co-Invest 1-A, LP | | Private Credit Co-Investment | | | 2,623,806 | | | — | | Subject to GP Consent | | Not Applicable | | Not Applicable |
Vistage Equity Investors, LP | | Private Equity Co-Investment | | | 4,999,608 | | | — | | Subject to GP Consent | | Not Applicable | | Not Applicable |
Voloridge Fund, LP | | Absolute Return | | | 5,293,489 | | | — | | Monthly | | 90 days | | Not Applicable |
WestCap Cerebral Co-Invest 2021, LLC | | Private Equity Co-Investment | | | 139,525 | | | — | | Subject to GP Consent | | Not Applicable | | Not Applicable |
WestCap Strategic Operator Fund II, LP | | Private Equity Primary | | | 3,480,643 | | | 2,559,246 | | Subject to GP Consent | | Not Applicable | | Not Applicable |
Whitehorse Liquidity Partners IV, LP | | Private Equity Primary | | | 3,647,076 | | | 1,872,331 | | Subject to GP Consent | | Not Applicable | | Not Applicable |
Whitehorse Liquidity Partners V, LP | | Private Equity Primary | | | 3,159,709 | | | 5,120,562 | | Subject to GP Consent | | Not Applicable | | Not Applicable |
Wildcat 21 Co-Invest Fund, LP | | Private Equity Co-Investment | | | 2,592,890 | | | — | | Subject to GP Consent | | Not Applicable | | Not Applicable |
| | | | | $ | 213,372,751 | | $ | 44,100,895 | | | | | | |
23
Bow River Capital Evergreen Fund |
NOTES TO THE FINANCIAL STATEMENTS (CONTINUED)
MARCH 31, 2023 |
4. Investment Transactions
Purchases and sales of investments, excluding short-term investments, for the year ended March 31, 2023 were $103,748,648 and $27,692,350, respectively.
5. Investment Management and Other Agreements
Pursuant to an Investment Management Agreement, the Fund will pay the Adviser a monthly investment management fee (the “Investment Management Fee”) in consideration of the advisory services provided by the Adviser to the Fund. The Investment Management Fee is equal to 1.75% on an annualized basis of the Fund’s average daily Managed Assets during such period. “Managed Assets” means the total assets of the Fund (including any assets attributable to money borrowed for investment purposes) minus the sum of the Fund’s accrued liabilities (other than money borrowed for investment purposes). The Investment Management Fee is paid to the Adviser out of the Fund’s assets and decreases the net profits or increases the net losses of the Fund. The Investment Management Fee will be computed as of the last day of each month. During the year ended March 31, 2023, the Fund incurred $4,916,262 in investment management fees.
The Adviser has entered into an Investment Consultant Agreement with Aksia CA, LLC (the “Investment Consultant”) to assist the Adviser with sourcing, evaluating, and selecting investments for the Fund’s portfolio. As the investment consultant, Aksia CA only recommends investments to the Adviser and has no involvement in investment decisions, any related negotiations, or the finalization of any investment. Currently, a high concentration of the Fund’s investments are sourced by the Investment Consultant. In consideration for services provided, the Adviser will pay the Investment Consultant a monthly fee of 0.375%, on an annualized basis, of the Fund’s average daily Managed Assets.
The Adviser has entered into an expense limitation and reimbursement agreement (the “Expense Limitation Agreement”) with the Fund, whereby the Adviser has agreed to waive fees that it would otherwise be paid, and/or to assume expenses of the Fund (a “Waiver”), if required to ensure the Fund’s aggregate monthly ordinary operating expenses, excluding certain “Specified Expenses” listed below, borne by the Fund in respect of each Class of Shares to an amount not to exceed 0.50%, on an annualized basis, of the Fund’s month-end net assets (the “Expense Cap”).
If the Fund’s aggregate monthly ordinary operating expenses, exclusive of the Specified Expenses in respect of any Class of Shares for any month, exceed the Expense Cap applicable to that Class of Shares, the Adviser will waive its Management Fee and/or reimburse the Fund for expenses to the extent necessary to eliminate such excess. The Adviser may also directly pay expenses on behalf of the Fund and waive reimbursement under the Expense Limitation Agreement. To the extent that the Adviser waives its Management Fee and/or reimburses expenses, the Adviser may, for a period not to exceed three years from the date on which a Waiver is made, recoup amounts waived or assumed, provided it is able to effect such recoupment without causing the Fund’s expense ratio (after recoupment) to exceed the lesser of (a) the expense limit in effect at the time of the waiver, and (b) the expense limit in effect at the time of the recoupment.
Specified Expenses that are not covered by the Expense Limitation Agreement and are therefore borne by shareholders of the Fund include: (i) the Management Fee; (ii) all fees and expenses of Fund Investments (including any underlying fees of the Fund Investments (the “Acquired Fund Fees and Expenses”)); (iii) transactional costs, including legal costs and brokerage commissions, associated with the acquisition and disposition of Fund Investments; (iv) interest payments incurred on borrowing by the Fund; (v) fees and expenses incurred in connection with a credit facility, if any, obtained by the Fund; (vi) distribution and shareholder servicing fees, as applicable; (vii) taxes; and (viii) extraordinary expenses resulting from events and transactions that are distinguished by their unusual nature and by the infrequency of their occurrence, including, without limitation, costs incurred in connection with any claim, litigation, arbitration, mediation, government investigation or similar proceeding, indemnification expenses, and expenses in connection with holding and/or soliciting proxies for all annual and other meetings of common shareholders.
The Expense Limitation Agreement is in effect until January 1, 2024, and will automatically renew thereafter for consecutive twelve-month terms, provided that such continuance is specifically approved at least annually by a majority of the Board. The Expense Limitation Agreement may be terminated by the Board upon thirty days’ written notice to the Adviser. During the year ended March 31, 2023, the Adviser recouped $192,185 from previously waived expenses. As of March 31, 2023, the Adviser may seek recoupment for previously waived or reimbursed expenses, subject to the limitations noted above, no later than the dates and amounts as outlined below:
| | March 31, 2024 | | March 31, 2025 | | |
$ | 128,992 | | $ | 257,589 | |
24
Bow River Capital Evergreen Fund |
NOTES TO THE FINANCIAL STATEMENTS (CONTINUED)
MARCH 31, 2023 |
Effective January 1, 2023, the Fund pays each Independent Trustee a retainer of $40,000 per year in consideration of the services rendered by the Independent Trustees. Prior to January 1, 2023, the Fund paid each Independent Trustee a retainer of $30,000 per year. In addition, the Fund pays an additional retainer of $2,500 per year to the Chairman of the Audit Committee and to the Chairman of the Nominating Committee. Trustees that are interested persons will not be compensated by the Fund. The Trustees do not receive any pension or retirement benefits.
Employees of PINE Advisors LLC (“PINE”) serve as officers of the Fund. PINE receives a monthly fee for the services provided to the Fund. The Fund also reimburses PINE for certain out-of-pocket expenses incurred on the Fund’s behalf.
The Fund has adopted a Distribution and Service Plan with respect to Class II Shares in compliance with Rule 12b-1 under the 1940 Act. The Distribution and Service Plan allows the Fund to pay distribution and servicing fees for the sale and servicing of its Class II Shares. Under the Distribution and Service Plan, the Fund may pay as compensation up to 0.25% on an annualized basis of the aggregate net assets of the Fund attributable to Class II Shares (the “Distribution and Servicing Fee”) to Foreside Financial Services, LLC (the “Distributor”) and/or other qualified recipients. Class I Shares are not subject to the Distribution and Servicing Fee. Foreside Financial Services, LLC acts as Distributor to the Fund on a best-efforts basis, subject to various conditions, pursuant to a Distribution Agreement (the “Distribution Agreement”) between the Fund and the Distributor. The Distributor may enter into agreements with selected broker-dealers, banks or other financial intermediaries for distribution of Class II Shares of the Fund. For the year ended March 31, 2023, distribution and service fees incurred are disclosed on the Statement of Operations.
The Adviser may make payments from its resources, which include a portion of the Investment Management Fee, to brokers or dealers that assist in the distribution of Shares, including brokers or dealers that may be affiliated with the Adviser.
UMB Fund Services, Inc. serves as the Fund’s Administrator, Accounting Agent, and Transfer Agent. UMB Bank, N.A. serves as the Fund’s Custodian.
Certain officers and trustees of the Fund are also officers of the Adviser.
6. Affiliated Investments
Issuers that are considered affiliates, as defined in Section 2(a)(3) of the 1940 Act, of the Fund at period-end are noted in the Fund’s Schedule of Investments. The table below reflects transactions during the period with entities that are affiliates as of March 31, 2023 and may include acquisitions of new investments, prior year holdings that become affiliated during the period, and prior period affiliated holdings that are no longer affiliated as of period-end.
Non-Controlled Affiliates | | Beginning
Fair Value
April 1,
2022 | | Purchases or
Contributions | | Sales or
Distributions | | Change in
Unrealized
Appreciation
(Depreciation) | | Net Realized
Gain (Loss) | | Ending
Fair Value
March 31,
2023 | | Investment
Income |
OceanSound Partners Co-Invest II, LP – Series B | | $ | 2,491,234 | | $ | 1,377,424 | | $ | — | | | $ | 1,595,860 | | | $ | — | | $ | 5,464,518 | | $ | — |
Overbay Fund XIV Offshore (AIV), LP | | | 5,181,429 | | | — | | | (831,496 | ) | | | (228,561 | ) | | | — | | | 4,121,372 | | | — |
Total Non-Controlled Affiliates | | $ | 7,672,663 | | $ | 1,377,424 | | $ | (831,496 | ) | | $ | 1,367,299 | | | $ | — | | $ | 9,585,890 | | $ | — |
7. Restricted Securities
Restricted securities include securities that have not been registered under the Securities Act of 1933, as amended, and securities that are subject to restrictions on resale. The Fund may invest in restricted securities that are consistent with the Fund’s investment objectives and investment strategies. Investments in restricted securities are valued at fair value as determined in good faith in accordance with procedures adopted by the Board of Trustees.
25
Bow River Capital Evergreen Fund |
NOTES TO THE FINANCIAL STATEMENTS (CONTINUED)
MARCH 31, 2023 |
Additional information on each restricted investment held by the Fund on March 31, 2023 is as follows:
Investments | | Initial
Acquisition Date | | Cost | | Fair Value | | % of
Net Assets |
ACP Hyperdrive Co-Invest, LLC | | March 7, 2022 | | $ | 2,594,796 | | $ | 2,620,000 | | 0.8 | % |
Adams Street 2009 Direct Fund, LP | | April 1, 2022 | | | 27,979 | | | 24,107 | | 0.0 | % |
Adams Street 2010 Direct Fund, LP | | April 1, 2022 | | | 28,757 | | | 29,343 | | 0.0 | % |
Adams Street 2011 Direct Fund, LP | | April 1, 2022 | | | 47,251 | | | 41,638 | | 0.0 | % |
Adams Street 2011 Non-U.S. Developed Markets Fund, LP | | April 1, 2022 | | | 108,883 | | | 140,953 | | 0.0 | % |
Adams Street 2011 U.S. Fund, LP | | April 1, 2022 | | | 207,745 | | | 318,549 | | 0.1 | % |
Adams Street 2013 Global Fund, LP | | April 1, 2022 | | | 1,566,106 | | | 1,907,607 | | 0.6 | % |
Adams Street 2014 Global Fund, LP | | April 1, 2022 | | | 845,906 | | | 1,055,592 | | 0.3 | % |
Adams Street Partnership Fund 2009 Non-U.S. Developed Markets Fund, LP | | April 1, 2022 | | | 93,355 | | | 115,939 | | 0.0 | % |
Adams Street Partnership Fund 2009 U.S. Fund, LP | | April 1, 2022 | | | 201,126 | | | 260,310 | | 0.1 | % |
Adams Street Partnership Fund 2010 Non-U.S. Developed Markets Fund, LP | | April 1, 2022 | | | 82,818 | | | 111,342 | | 0.0 | % |
Adams Street Partnership Fund 2010 U.S. Fund, LP | | April 1, 2022 | | | 206,493 | | | 291,712 | | 0.1 | % |
Altor Fund IV (No. 1) AB | | August 12, 2022 | | | 6,030,959 | | | 6,208,258 | | 1.8 | % |
AP DSB Co-Invest II, LP | | July 30, 2021 | | | 1,799,272 | | | 3,561,985 | | 1.0 | % |
Ashgrove Specialty Lending Investments I | | July 8, 2021 | | | 979,081 | | | 861,613 | | 0.3 | % |
Ashgrove Specialty Lending Investments I, DAC | | April 7, 2022 | | | 1,876,722 | | | 2,210,576 | | 0.6 | % |
Ashgrove Specialty Lending Investments I, DAC | | April 7, 2022 | | | 477,599 | | | 722,592 | | 0.2 | % |
Ashgrove Specialty Lending Fund I SCSp RAIF | | December 17, 2021 | | | 1,155,355 | | | 1,289,558 | | 0.4 | % |
ASP (Feeder) 2017 Global Fund, LP | | April 1, 2022 | | | 831,226 | | | 1,160,633 | | 0.3 | % |
Avista Capital Partners V, LP | | March 16, 2021 | | | 3,891,948 | | | 4,690,650 | | 1.4 | % |
Biloxi Co-Investment Partners, LP | | August 13, 2021 | | | 1,459,320 | | | 1,681,794 | | 0.5 | % |
BRCE SPV I, LLC | | May 22, 2020 | | | 52,838 | | | 254,491 | | 0.1 | % |
Butterfly Nourish Co-Invest, LP | | February 3, 2023 | | | 5,004,000 | | | 4,999,848 | | 1.5 | % |
BW Colson Co-Invest Feeder (Cayman), LP | | March 15, 2021 | | | 3,049,786 | | | 3,822,242 | | 1.1 | % |
Carlyle Riser Co-Investment, LP | | November 11, 2022 | | | 4,114,405 | | | 4,635,058 | | 1.4 | % |
Coller Credit Opportunities I – Annex I, SLP | | July 29, 2021 | | | 2,546,667 | | | 3,136,179 | | 0.9 | % |
Coller Credit Opportunities I – B, LP | | January 5, 2022 | | | 1,850,842 | | | 2,074,985 | | 0.6 | % |
Coller International Partners VI Feeder Fund, LP – Class A | | October 1, 2020 | | | 202,038 | | | 990,109 | | 0.3 | % |
Coller International Partners VII Feeder Fund, LP – Series B | | October 1, 2020 | | | — | | | 1,805,561 | | 0.5 | % |
26
Bow River Capital Evergreen Fund |
NOTES TO THE FINANCIAL STATEMENTS (CONTINUED)
MARCH 31, 2023 |
Investments | | Initial
Acquisition Date | | Cost | | Fair Value | | % of
Net Assets |
Constellation 2022, LP | | August 12, 2022 | | $ | 5,010,118 | | $ | 4,998,967 | | 1.5 | % |
Corsair Amore Investors, LP | | May 27, 2022 | | | 5,029,000 | | | 4,994,829 | | 1.5 | % |
Coyote 2021, LP | | March 29, 2021 | | | 2,613,833 | | | 7,652,220 | | 2.3 | % |
CRG Partners III – Parallel Fund (A), LP | | December 31, 2022 | | | 2,605,791 | | | 3,615,488 | | 1.1 | % |
DSG Group Holdings, LP | | September 9, 2002 | | | 5,585,674 | | | 6,715,991 | | 2.0 | % |
Digital Alpha Solutions Fund, LP | | October 28, 2022 | | | 3,383,846 | | | 3,829,410 | | 1.1 | % |
Ecoville Investments Limited | | February 24, 2022 | | | 1,986,966 | | | 1,980,000 | | 0.6 | % |
Enak Aggregator, LP | | January 18, 2022 | | | 2,861,507 | | | 3,185,673 | | 0.9 | % |
EnCap Energy Transition Fund 1-A, LP | | April 21, 2021 | | | 1,445,359 | | | 3,043,313 | | 0.9 | % |
Falcon Co-Investment Partners, LP | | January 26, 2022 | | | 2,908,067 | | | 2,895,574 | | 0.9 | % |
FFL Capital Partners V, LP | | June 16, 2022 | | | 3,711,107 | | | 5,651,328 | | 1.7 | % |
Forrest Holdings I, LP – Class A | | March 17, 2021 | | | — | | | 13,634 | | 0.0 | % |
Forrest Holdings I, LP – Class B | | March 17, 2021 | | | — | | | 190,808 | | 0.1 | % |
Global Infrastructure Partners II-C, LP | | January 14, 2022 | | | 280,363 | | | 1,215,146 | | 0.4 | % |
Grain Spectrum Holdings III (Cayman), LP | | October 28, 2020 | | | 2,455,015 | | | 3,310,155 | | 1.0 | % |
Graphite Capital Partners VIII D, LP | | June 30, 2020 | | | — | | | 4,841,715 | | 1.4 | % |
ISH Co-Investment Aggregator, LP | | May 6, 2021 | | | 2,311,692 | | | 2,573,735 | | 0.8 | % |
KH Aggregator, LP | | November 30, 2020 | | | 3,149,715 | | | 4,824,252 | | 1.4 | % |
Lynx EBO Fund I (A), LLC | | December 18, 2020 | | | — | | | 447,112 | | 0.1 | % |
OceanSound Partners Co-Invest II, LP – Series B | | November 5, 2021 | | | 3,897,268 | | | 5,464,518 | | 1.6 | % |
OceanSound Partners Co-Invest II, LP – Series E | | December 16, 2022 | | | 5,004,000 | | | 7,569,913 | | 2.2 | % |
OceanSound Partners Fund, LP | | December 27, 2021 | | | 3,131,852 | | | 4,583,838 | | 1.3 | % |
Onex Fund V, LP | | September 30, 2022 | | | 5,725,882 | | | 6,516,342 | | 1.9 | % |
Onex OD Co-Invest, LP | | November 9, 2020 | | | 3,511,271 | | | 5,292,788 | | 1.6 | % |
Onex Structured Credit Opportunities International Fund I, LLC | | May 11, 2021 | | | 1,481,250 | | | 1,629,394 | | 0.5 | % |
Overbay Fund XIV (AIV III), LP | | March 26, 2021 | | | 1,236,382 | | | 2,443,436 | | 0.7 | % |
Overbay Fund XIV Offshore (AIV), LP | | January 5, 2021 | | | 57,337 | | | 4,121,372 | | 1.2 | % |
Overbay Fund XIV Offshore, LP | | January 22, 2021 | | | 1,241,144 | | | 2,411,632 | | 0.7 | % |
Palmer Square Loan Funding 2021-3, Ltd. | | July 9, 2021 | | | 1,734,983 | | | 1,320,900 | | 0.4 | % |
Palms Co-Investment Partners, LP | | June 3, 2022 | | | 3,813,524 | | | 3,807,958 | | 1.1 | % |
PARIOU SLP | | October 14, 2022 | | | 5,055,979 | | | 5,842,948 | | 1.7 | % |
PIMCO DSCO Fund II Offshore Feeder, LP | | June 30, 2020 | | | 4,205,485 | | | 4,799,094 | | 1.4 | % |
Planet US Buyer, LLC | | January 31, 2023 | | | 2,691,778 | | | 2,711,806 | | 0.8 | % |
Polaris Newco | | June 18, 2021 | | | 1,944,556 | | | 1,705,000 | | 0.5 | % |
Porcupine Holdings, LP – Class A | | December 29, 2021 | | | 2,239,594 | | | 2,895,534 | | 0.9 | % |
27
Bow River Capital Evergreen Fund |
NOTES TO THE FINANCIAL STATEMENTS (CONTINUED)
MARCH 31, 2023 |
Investments | | Initial
Acquisition Date | | Cost | | Fair Value | | % of
Net Assets |
Porcupine Holdings, LP – Class B | | December 29, 2021 | | $ | 2,010,512 | | $ | 2,543,439 | | 0.7 | % |
Post Limited Term High Yield Fund, LP | | January 1, 2021 | | | 6,000,000 | | | 6,042,865 | | 1.8 | % |
Project Stream Co-Invest Fund, LP | | October 1, 2021 | | | 2,237,313 | | | 1,666,765 | | 0.5 | % |
Ruffer Absolute Institutional, Ltd. | | April 1, 2022 | | | 5,004,000 | | | 5,091,501 | | 1.5 | % |
Saba Capital Carry Neutral Tail Hedge Offshore Fund, Ltd. | | January 28, 2022 | | | 5,004,000 | | | 5,475,615 | | 1.6 | % |
SANCY SLP | | October 14, 2022 | | | 1,698,500 | | | 1,624,496 | | 0.5 | % |
Sand Trust Series 21-1A – Class SUB | | November 6, 2021 | | | 916,162 | | | 651,415 | | 0.2 | % |
SEP Hamilton III Aggregator, LP | | August 17, 2020 | | | 2,519,336 | | | 6,585,374 | | 1.9 | % |
SEP Skyhawk Fund III Aggregator, LP | | August 24, 2021 | | | 510,355 | | | 545,487 | | 0.2 | % |
Sheridan Capital Partners Fund III | | March 31, 2023 | | | 1,090,945 | | | 984,347 | | 0.3 | % |
Sumeru Equity Partners Fund III, LP | | December 8, 2020 | | | 1,917,638 | | | 2,460,102 | | 0.7 | % |
Sumeru Equity Partners Fund IV, LP | | September 2, 2022 | | | 490,663 | | | 398,869 | | 0.1 | % |
The Global Atlantic Financial Group, LLC | | January 1, 2021 | | | 3,849,077 | | | 4,380,373 | | 1.3 | % |
TKO Fund | | November 4, 2022 | | | 2,818,793 | | | 3,411,419 | | 1.0 | % |
US Hospitality Publishers, Inc. | | January 11, 2021 | | | 1,866,181 | | | 1,823,562 | | 0.5 | % |
VCPF III Co-Invest 1-A, LP | | May 13, 2021 | | | 2,255,917 | | | 2,623,806 | | 0.8 | % |
Veregy Parent, LLC | | November 3, 2020 | | | 3,005,300 | | | 3,182,840 | | 0.9 | % |
Vistage Equity Investors, LP | | July 22, 2022 | | | 5,004,000 | | | 4,999,608 | | 1.5 | % |
Voloridge Fund, LP | | November 1, 2020 | | | 5,670,000 | | | 5,293,489 | | 1.6 | % |
WestCap Cerebral Co-Invest 2021, LLC | | June 17, 2021 | | | 256,842 | | | 139,525 | | 0.0 | % |
WestCap LoanPal Co-Invest 2020, LLC | | December 18, 2020 | | | 2,411,328 | | | 3,799,773 | | 1.1 | % |
WestCap Strategic Operator Fund II, LP | | July 31, 2021 | | | 3,418,560 | | | 3,480,643 | | 1.0 | % |
WestCap Strategic Operator U.S. Feeder Fund, LP | | February 5, 2021 | | | 2,675,404 | | | 8,652,438 | | 2.5 | % |
Whitehorse Liquidity Partners IV, LP | | November 10, 2020 | | | 2,478,093 | | | 3,647,076 | | 1.1 | % |
Whitehorse Liquidity Partners V, LP | | February 4, 2022 | | | 2,810,607 | | | 3,159,709 | | 0.9 | % |
Wildcat 21 Co-Invest Fund, LP | | August 13, 2021 | | | 2,255,261 | | | 2,592,890 | | 0.8 | % |
| | | | | $ | 203,818,398 | | $ | 265,376,473 | | 78.1 | % |
8. Capital Share Transactions
The Fund’s Shares are generally offered for purchase once per month at the NAV per Share as of the last business day of such month, except that Shares may be offered more or less frequently as determined by the Board in its sole discretion. The Fund has elected to implement a hybrid repurchase mechanism, where under normal circumstances, the Fund provides a limited degree of liquidity to common shareholders by conducting semi-annual repurchase offers pursuant to Rule 23c-3 of the 1940 Act (each a “Required Repurchase Offer”), as well as discretionary repurchase offers. While the Board may consider the recommendation of the Adviser, discretionary repurchase offers will be made at the sole discretion of the Board.
28
Bow River Capital Evergreen Fund |
NOTES TO THE FINANCIAL STATEMENTS (CONTINUED)
MARCH 31, 2023 |
Each Required Repurchase Offer will be for no less than 5% and no more than 25% of the Fund’s Shares outstanding, but if the value of Shares tendered for repurchase exceeds the value the Fund intended to repurchase, the Fund may determine to repurchase less than the full number of Shares tendered. In such event, common shareholders will have their Shares repurchased on a pro rata basis and tendering common shareholders will not have all of their tendered Shares repurchased by the Fund.
The Adviser also anticipates recommending to the Board that, under normal market circumstances, the Fund conduct periodic repurchase offers of no more than 5% of the Fund’s net assets generally for each calendar quarter following a Required Repurchase Offer (each, a “Discretionary Repurchase”). In determining whether the Fund should offer a Discretionary Repurchase, the Board may consider the recommendation of the Adviser as well as a variety of other operational, business and economic factors. While it is anticipated that each Discretionary Repurchase will be offered for each calendar quarter following a Required Repurchase Offer (i.e. twice per year), any Discretionary Repurchase of Shares will be made at such times and on such terms as may be determined by the Board from time to time in its sole discretion. As a result, Discretionary Repurchases may be offered at any amount, as determined by the Board, or not at all. The Fund may also elect to repurchase less than the full amount that a common shareholder requests to be repurchased. In addition, the Board may under certain circumstances elect to postpone, suspend or terminate an offer to repurchase Shares.
A 2.00% early repurchase fee will be charged by the Fund with respect to any repurchase of Shares from a common shareholder at any time prior to the day immediately preceding the one-year anniversary of the common shareholder’s purchase of the Shares. Shares tendered for repurchase will be treated as having been repurchased on a “first in-first out” basis. An early repurchase fee payable by a common shareholder may be waived by the Fund in circumstances where the Board determines that doing so is in the best interests of the Fund.
During the year ended March 31, 2023, the Fund completed four repurchase offers. The results of those were as follows:
| | Required
Repurchase Offer | | Discretionary
Repurchase | | Required
Repurchase Offer | | Discretionary Repurchase |
Commencement Date | | April 21, 2022 | | | | July 27, 2022 | | | October 14, 2022 | | | February 15, 2023 | |
Repurchase Request Deadline | | May 20, 2022 | | | | August 26, 2022 | | | November 18, 2022 | | | March 17, 2023 | |
Repurchase Pricing Date | | May 31, 2022 | | | | August 31, 2022 | | | November 30, 2022 | | | March 31, 2023 | |
Repurchase Pricing Date Net Asset Value – Class I | | $40.13 | | | | $39.94 | | | $40.18 | | | $40.09 | |
Repurchase Pricing Date Net Asset Value – Class II | | $40.09 | | | | $39.88 | | | $40.09 | | | $39.97 | |
Shares Repurchased – Class I | | 16,067 | | | | 44,166 | | | 79,750 | | | 89,561 | |
Shares Repurchased – Class II | | 0 | | | | 3,392 | | | 9,173 | | | 5,713 | |
Value of Shares Repurchased – Class I | | $644,808 | | | | $1,764,188 | | | $3,204,033 | | | $3,590,785 | |
Value of Shares Repurchased – Class II | | $0 | | | $ | 135,260 | | | $367,748 | | | $228,327 | |
Percentage of Shares Repurchased – Class I | | 0.28 | % | | | 0.71 | % | | 1.19 | % | | 1.15 | % |
Percentage of Shares Repurchased – Class II | | 0.00 | % | | | 0.64 | % | | 1.61 | % | | 0.95 | % |
Percentage of Shares Repurchased – Total Fund | | 0.27 | % | | | 0.71 | % | | 1.22 | % | | 1.13 | % |
9. Contingencies and Commitments
The Fund indemnifies the Fund’s officers and the Board for certain liabilities that might arise from their performance of their duties to the Fund. Additionally, in the normal course of business the Fund enters into contracts that contain a variety of representations and warranties and which provide general indemnifications. The Fund’s maximum exposure under these arrangements is unknown, as this would involve future claims that may be made against the Fund that have not yet occurred. However, based on experience, the Fund expects the risk of loss to be remote.
29
Bow River Capital Evergreen Fund |
NOTES TO THE FINANCIAL STATEMENTS (CONTINUED)
MARCH 31, 2023 |
The Fund is required to provide financial support in the form of investment commitments to certain investees as part of the conditions for entering into such investments. At March 31, 2023, the Fund reasonably believes its assets will provide adequate cover to satisfy all its unfunded commitments.
The Fund’s unfunded commitments as of March 31, 2023 are as follows:
Private Investments | | Fair Value | | Unfunded
Commitments |
Forrest Holdings I, LP – Class A | | $ | 13,634 | | $ | 1,263,959 |
Graphite Capital Partners VIII D, LP | | | 4,841,715 | | | 748,969 |
Planet US Buyer, LLC | | | 2,711,806 | | | 222,222 |
Sheridan Capital Partners Fund III, LP | | | 984,347 | | | 3,914,424 |
US Hospitality Publishers, Inc. | | | 1,823,562 | | | 631,579 |
Investments valued at the Fund’s pro rata NAV as a practical expedient1 | | | 213,372,751 | | | 44,100,895 |
| | | $ | 223,747,815 | | $ | 50,882,048 |
10. Federal Tax Information
At March 31, 2023, gross unrealized appreciation and (depreciation) of investments, based on cost for federal income tax purposes were as follows:
| | Bow River Capital
Evergreen Fund |
Cost of investments | | $ | 295,559,281 | |
Gross unrealized appreciation | | $ | 64,662,820 | |
Gross unrealized depreciation | | | (6,890,403 | ) |
Net unrealized appreciation/(depreciation) | | $ | 57,772,417 | |
The difference between cost amounts for financial statement and federal income tax purposes is due primarily to timing differences in recognizing certain gains and losses on partnership investments, passive foreign investment companies and return of capital distributions from underlying investments.
GAAP requires that certain components of net assets be reclassified between financial and tax reporting. These reclassifications have no effect on net assets or net asset value per share. These reclassifications are due primarily to non-deductible expenses and tax-exempt income from partnership investments.
For the year ended September 30, 2022, permanent differences in book and tax accounting have been reclassified to Capital and total distributable earnings/(deficit) as follows:
| | Paid-In
Capital | | Total
Distributable
Earnings/(Deficit) |
Bow River Capital Evergreen Fund | | $ | (133,060 | ) | | $ | 133,060 |
30
Bow River Capital Evergreen Fund |
NOTES TO THE FINANCIAL STATEMENTS (CONTINUED)
MARCH 31, 2023 |
As of September 30, 2022, the components of accumulated earnings/(deficit) on a tax basis were as follows:
| | Bow River Capital Evergreen Fund |
Undistributed ordinary income | | $ | — | |
Undistributed long-term capital gains | | | 3,034,339 | |
Accumulated capital and other losses | | | (2,920,195 | ) |
Unrealized appreciation/(depreciation) on investments | | | 42,742,501 | |
Total accumulated earnings/(deficit) | | $ | 42,856,645 | |
The tax character of distributions paid during the fiscal year ended September 30, 2022 and September 30, 2021 were as follows:
| | Bow River Capital Evergreen Fund | | Bow River Capital Evergreen Fund |
| | | 9/30/2022 | | 9/30/2021 |
Distributions paid from: | | | | | | |
Ordinary income | | $ | — | | $ | — |
Return of Capital | | | — | | | — |
Net long term capital gains | | | 1,278,522 | | | — |
Total distributions paid | | $ | 1,278,522 | | $ | — |
The Fund has $2,886,691 in Qualified late-year losses, which are deferred until Tax year ending September 30, 2023 for tax purposes. Net late-year ordinary losses incurred after December 31 and within the taxable year and net late-year specified losses incurred after October 31 and within the taxable year are deemed to arise on the first day of the Fund’s next taxable year.
11. Indemnifications
The Fund indemnifies the Fund’s officers and Board of Trustees for certain liabilities that might arise from their performance of their duties to the Fund. Additionally, in the normal course of business the Fund enters into contracts that contain a variety of representations and warranties and which provide general indemnifications. The Fund’s maximum exposure under these arrangements is unknown, as this would involve future claims that may be made against the Fund that have not yet occurred. However, based on experience, the Fund expects the risk of loss to be remote.
12. Other Derivative Information
The average quarterly notional value of forward foreign currency contracts as of March 31, 2023 was $3,474,100. The notional value outstanding as of March 31, 2023 was $4,043,500.
The effects of forward foreign currency contracts on the Fund’s financial positions and financial performance are reflected in the Statement of Assets and Liabilities (“SAL”) and Statement of Operations (“SOP”). The Fund engaged in forward foreign currency contracts during the year ended March 31, 2023. $12,520 of unrealized appreciation on forward currency contracts listed in the liabilities section of the SAL is subject to forward foreign exchange contract risk. $10,126 in net realized gain on forward foreign currency contracts and $12,520 in the change in unrealized appreciation on forward foreign currency contract as listed in the SOP are each subject to forward foreign net exchange contract risk.
31
Bow River Capital Evergreen Fund |
NOTES TO THE FINANCIAL STATEMENTS (CONTINUED)
MARCH 31, 2023 |
Offsetting of Assets and Liabilities — Disclosures about offsetting assets and liabilities require an entity to disclose information about offsetting and related arrangements to enable users of its financial statements to understand the effect of those arrangements on its financial position. As of March 31, 2023, no master netting arrangements exist related to the Fund. The Fund’s SAL presents derivative instruments on a gross basis; therefore, no net amounts and no offset amounts exist within the SAL to present below. Gross amounts of the derivative instruments, amounts related to financial instruments/cash collateral not offset in the SAL and net amounts are presented below:
| | Derivative Assets | | Derivative (Liabilities) | | Collateral Pledged |
Counterparty | | Forward Foreign
Exchange
Contracts | | Forward Foreign
Exchange
Contracts | | Financial Instruments | | Cash |
Bannockburn Global Forex, LLC | | $ | 12,520 | | $ | — | | $ | — | | $ | — |
13. Revolving Credit Facility
On July 14, 2021, the Fund entered into a committed revolving line of credit agreement (“Credit Agreement”) with UMB Bank, n.a. (the “UMB Bank”) effective until July 14, 2023. The Fund may borrow an amount up to the lesser of $25,000,000 or 100% of the value of the Fund’s unencumbered U.S. Dollar denominated cash held at UMB Bank or its affiliates, plus 60% of the value of Fund’s liquid exchange-traded funds and other publicly-traded, liquid, investment grade equities listed on any tier of The Nasdaq Stock Market, the NYSE American or the New York Stock Exchange (NYSE), or any successor of such exchanges, plus 20% of the value of Fund’s semi-liquid assets (as defined in the Fund’s registration statement) that may be liquidated within 90 days. The interest rate on borrowings from the Credit Agreement is equal to the Prime Rate, subject to 3.50% rate floor, per annum. During the year ended March 31, 2023, there were no borrowings and $60,000 in unused borrowing fees were incurred.
14. Risk Factors
There can be no assurance that the investment objective of the Fund will be achieved or that the Fund’s portfolio design and risk monitoring strategies will be successful. The following list is not intended to be a comprehensive listing of all the potential risks associated with the Fund. The Fund’s prospectus provides further details regarding the Fund’s risks and considerations.
Private Equity Risk — There are inherent risks in investing in private equity companies, which are vehicles whose principal business is to invest in and lend capital to privately held companies. Generally, little public information exists for private and thinly traded companies, and there is a risk that private equity investors, like the Fund, may not be able to make a fully informed investment decision.
Private Credit Risk — Typically, private credit investments are in restricted securities that are not traded in public markets and subject to substantial holding periods, so that the Fund may not be able to resell some of its holdings for extended periods, which may be several years. The Fund’s investments are also subject to the risks associated with investing in private securities. Investments in private securities are illiquid, can be subject to various restrictions on resale, and there can be no assurance that the Fund will be able to realize the value of such investments in a timely manner. Additionally, private credit investments can range in credit quality depending on security-specific factors, including total leverage, amount of leverage senior to the security in question, variability in the issuer’s cash flows, the size of the issuer, the quality of assets securing debt and the degree to which such assets cover the subject company’s debt obligations.
Semi-Liquid Investment Risk — Semi-liquid investments do not offer investors full liquidity (i.e. such investments typically only offer monthly or quarterly liquidity).
General Economic and Market Conditions — The success of the Fund’s activities may be materially affected by general economic and market conditions, including interest rates, inflation rates, economic uncertainty, availability of credit, financial market volatility, changes in laws and national and international political circumstances. The stability and sustainability of growth in global economies may be impacted by terrorism or acts of war. The availability, unavailability or hindered operation of external credit markets, equity markets and other economic systems which the Fund may depend upon to achieve its objectives may have a significant negative impact on the Fund’s operations and profitability. There can be no assurance that such markets and economic systems will be available or will be available as anticipated or needed for the Fund to operate successfully. These factors may adversely impact the performance and growth prospects for Fund Investments.
32
Bow River Capital Evergreen Fund |
NOTES TO THE FINANCIAL STATEMENTS (CONTINUED)
MARCH 31, 2023 |
Russia’s recent military interventions in Ukraine have led to, and may lead to additional sanctions being levied by the United States, European Union and other countries against Russia. Russia’s military incursion and the resulting sanctions could adversely affect global energy and financial markets and thus could affect the value of the Fund’s investments, even beyond any direct exposure the Fund may have to Russian issuers or the adjoining geographic regions. The extent and duration of the military action, sanctions and resulting market disruptions are impossible to predict, but could be substantial. Any such disruptions caused by Russian military action or resulting sanctions may magnify the impact of other risks of the Fund and Fund Investments.
Direct Investments Risk — The Fund may make direct investments on an opportunistic basis. There can be no assurance that the Fund will be given direct investment opportunities, or that any direct investment offered to the Fund would be appropriate or attractive to the Fund. Direct investments generally are more concentrated than investments in portfolio companies, which generally hold multiple portfolio companies. Due diligence will be conducted on direct investment opportunities; however, the Adviser or Investment Consultant may not have the ability to conduct the same level of due diligence applied to portfolio company investments. In addition, there may be limited opportunities to negotiate the terms of such direct investments. However, in instances where the terms of a direct investment are negotiable, such terms may be heavily negotiated and may incur additional transactional costs for the Fund. As is typical in such matters, the Adviser or Investment Consultant, as applicable, generally will rely on the portfolio company manager or sponsor offering such direct investment opportunity to perform most of the due diligence on the relevant portfolio company and to negotiate terms of the direct investment.
Secondary Investments Risk — The overall performance of the Fund’s secondary investments will depend in large part on the acquisition price paid, which may be negotiated based on incomplete or imperfect information. Certain secondary investments may be purchased as a portfolio, and in such cases the Fund may not be able to exclude from such purchases those investments that the Adviser considers (for commercial, tax, legal or other reasons) less attractive. Where the Fund acquires a portfolio company interest as a secondary investment, the Fund will generally not have the ability to modify or amend such portfolio company’s constituent documents (e.g., limited partnership agreements) or otherwise negotiate the economic terms of the interests being acquired. In addition, the costs and resources required to investigate the commercial, tax and legal issues relating to secondary investments may be greater than those relating to primary investments.
Primary Fund Commitments Risk — The commitment to invest in newly created private equity funds, private credit funds, or other private funds, exposes the Fund to the risk of investing in funds with limited operating histories and the information the Fund will obtain about such investments may be limited. As such, the ability to evaluate past performance or to validate the investment strategies will be limited.
Exchange-Traded Funds Risk — The Fund may invest in long (or short) positions in ETFs. Through its positions in ETFs, the Fund will be subject to the risks associated with such vehicles’ investments, including the possibility that the value of the securities or instruments held by an ETF could decrease (or increase), and will bear its proportionate share of the ETF’s fees and expenses. In addition, certain of the ETFs may hold common portfolio positions, thereby reducing any diversification benefits.
Money Market Funds Risk — An investment in a money market fund is not a deposit of any bank and is not insured or guaranteed by the Federal Deposit Insurance Company or any other government agency. Certain money market funds seek to preserve the value of their shares at $1.00 per share, although there can be no assurance that they will do so, and it is possible to lose money by investing in such a money market fund. A major or unexpected increase in interest rates or a decline in the credit quality of an issuer or entity providing credit support, an inactive trading market for money market instruments, or adverse market, economic, industry, political, regulatory, geopolitical, and other conditions could cause the share price of such a money market fund to fall below $1.00. It is possible that such a money market fund will issue and redeem shares at $1.00 per share at times when the fair value of the money market fund’s portfolio per share is more or less than $1.00. Other money market funds price and transact at a “floating” NAV that will fluctuate along with changes in the market-based value of fund assets. Shares sold utilizing a floating NAV may be worth more or less than their original purchase price.
Closed-End Fund; Liquidity Limited to Periodic Repurchases of Shares — The Fund has been organized as a non-diversified, closed-end management investment company and designed primarily for long-term investors. An investor should not invest in the Fund if the investor needs a liquid investment. Closed-end funds differ from open-end management investment companies (commonly known as mutual funds) in that investors in a closed-end fund do not have the right to redeem their shares on a daily basis. Unlike most closed-end funds, which typically list their shares on a securities exchange, the Fund does not intend to list the Shares for trading on any securities exchange, and the Fund does not expect any secondary market to develop for the Shares. Although the Fund will offer
33
Bow River Capital Evergreen Fund |
NOTES TO THE FINANCIAL STATEMENTS (CONTINUED)
MARCH 31, 2023 |
a limited degree of liquidity by conducting semi-annual repurchase offers and periodic repurchase offers made at the sole discretion of the Board, a Common Shareholder may not be able to tender its Shares in the Fund promptly after it has made a decision to do so. There is no assurance that you will be able to tender your Shares when or in the amount that you desire. Furthermore, discretionary repurchases are made at the discretion of the Board and therefore, may not occur. In addition, with very limited exceptions, Shares are not transferable, and liquidity will be provided only through repurchase offers made semi-annually by the Fund, as well as periodically at the sole discretion of the Board. Shares are considerably less liquid than Shares of funds that trade on a stock exchange or Shares of open-end registered investment companies and are therefore, suitable only for investors who can bear the risks associated with illiquid shares and should be viewed as a long-term investment.
Non-Diversified Status — The Fund is a “non-diversified” management investment company. Thus, there are no percentage limitations imposed by the Investment Company Act on the Fund’s assets that may be invested, directly or indirectly, in the securities of any one issuer. Consequently, if one or more Fund Investments are allocated a relatively large percentage of the Fund’s assets, losses suffered by such Fund Investments could result in a higher reduction in the Fund’s capital than if such capital had been more proportionately allocated among a larger number of investments. The Fund may also be more susceptible to any single economic or regulatory occurrence than a diversified investment company. However, the Fund will be subject to diversification requirements applicable to RICs under the Code.
Valuation Risk — The valuation of the Fund’s investments in Portfolio Funds is ordinarily determined based upon valuations provided by the Portfolio Fund Managers on a quarterly basis. Although such valuations are provided on a quarterly basis, the Fund will provide valuations, and will issue Shares, on a monthly basis. A large percentage of the securities in which the Fund invest will not have a readily ascertainable market price and will be fair valued by the Portfolio Fund Manager. In this regard, a Portfolio Fund Manager may face a conflict of interest in valuing the securities, as their value may affect the Portfolio Fund Manager’s compensation or its ability to raise additional funds. No assurances can be given regarding the valuation methodology or the sufficiency of systems utilized by any Portfolio Fund Manager, the accuracy of the valuations provided by the Portfolio Fund Managers, that the Portfolio Fund Managers will comply with their own internal policies or procedures for keeping records or making valuations, or that the Portfolio Fund Managers’ policies and procedures and systems will not change without notice to the Fund. As a result, a Portfolio Fund Manager’s valuation of the securities may fail to match the amount ultimately realized with respect to the disposition of such securities. A Portfolio Fund Manager’s information could also be inaccurate due to fraudulent activity, mis-valuation or inadvertent error. The Fund may not uncover errors in valuation for a significant period of time, if ever.
Capital Call Risk — The Fund may maintain a sizeable cash position in anticipation of funding capital calls or near-term investment opportunities. Even though the Fund may maintain a sizeable position in cash and short-term securities, it may not contribute the full amount of its commitment to a fund at the time of investment. Instead, the Fund will be required to make incremental contributions pursuant to capital calls issued from time to time by the underlying fund. If the Fund defaults on its commitment to an underlying fund or fails to satisfy capital calls to an underlying fund in a timely manner then, generally, it will be subject to significant penalties, including the complete forfeiture of the Fund’s investment in the underlying fund. Any failure by the Fund to make timely capital contributions in respect of its commitments may (i) impair the ability of the Fund and the Fund to pursue its investment strategy, (ii) force the Fund to borrow, (iii) indirectly cause the Fund, and, indirectly, the Investors to be subject to certain penalties from the Fund Investments (including the complete forfeiture of the Fund’s investment in an Investment Fund), or (iv) otherwise impair the value of the Fund’s investments (including the devaluation of the Fund).
Currency Risk — Although the Fund intends to invest predominantly in the United States, the Fund’s portfolio is anticipated to include investments in a number of different currencies. Any returns on, and the value of such investments may, therefore, be materially affected by exchange rate fluctuations, local exchange control, limited liquidity of the relevant foreign exchange markets, the convertibility of the currencies in question and/or other factors. A decline in the value of the currencies in which the Fund Investments are denominated against the U.S. Dollar may result in a decrease the Fund’s net asset value. The Adviser may or may not elect to hedge the value of investments made by the Fund against currency fluctuations, and even if the Adviser deems hedging appropriate, it may not be possible or practicable to hedge currency risk exposure. Accordingly, the performance of the Fund could be adversely affected by such currency fluctuations.
Foreign Investments and Emerging Markets Risk — The Fund may invest in the securities of non-U.S. issuers, including those located in developing countries, which securities involve risks beyond those associated with investments in U.S. securities. These risks may relate to foreign political, social and economic matters, less developed markets, political immobility and less developed legal and accounting practices.
34
Bow River Capital Evergreen Fund |
NOTES TO THE FINANCIAL STATEMENTS (CONTINUED)
MARCH 31, 2023 |
Derivatives and Hedging — The Fund may invest and trade in a variety of derivative instruments to hedge the Fund’s primary Fund Investments, including options, swaps, futures contracts, forward agreements and other derivatives contracts. Derivatives are financial instruments or arrangements in which the risk and return are related to changes in the value of other assets, reference rates or indices. Transactions in derivative instruments present risks arising from the use of leverage (which increases the magnitude of losses), volatility, the possibility of default by a counterparty, and illiquidity. Use of derivative instruments for hedging or speculative purposes by the Adviser could present significant risks, including the risk of losses in excess of the amounts invested. The Fund’s ability to avoid risk through investment or trading in derivatives will depend on the ability to anticipate changes in the underlying assets, reference rates or indices.
LIBOR Transition Risk — Certain instruments in which the Fund may invest rely in some fashion upon the London Interbank Offered Rate (“LIBOR”). The United Kingdom’s Financial Conduct Authority, which regulates London Interbank Offered Rate (“LIBOR”), announced plans to phase out the use of LIBOR at the end of 2021 and a majority of U.S. dollar LIBOR settings will cease publication after June 30, 2023. It is possible that a subset of LIBOR settings will be published after these dates on a “synthetic” basis, but any such publications would be considered non-representative of the underlying market. The U.S. Federal Reserve, based on the recommendations of the New York Federal Reserve’s Alternative Reference Rate Committee (comprised of major derivative market participants and their regulators), has begun publishing Secured Overnight Financing Rate Data that is intended to replace U.S. dollar LIBOR. Proposals for alternative reference rates for other currencies have also been announced or have already begun publication. Markets are slowly developing in response to these new reference rates. There remains uncertainty regarding the future use of LIBOR and the nature of any replacement rate. The transition process away from LIBOR may involve, among other things, increased volatility or illiquidity in markets for instruments that currently rely on LIBOR. The transition process may also result in a reduction in the value of certain instruments held by the Fund or reduce the effectiveness of related Fund transactions such as hedges. Volatility, the potential reduction in value, and/or the hedge effectiveness of financial instruments may be heightened for financial instruments that do not include fallback provisions that address the cessation of LIBOR. Any potential effects of the transition away from LIBOR on any of the financial instruments in which the Fund invests, as well as other unforeseen effects, could result in losses to the Fund.
Recent Market and Economic Developments — The global outbreak of COVID-19 (commonly referred to as “coronavirus”) has disrupted economic markets and the prolonged economic impact is uncertain. Although vaccines for COVID-19 are available, the ultimate economic fallout from the pandemic, and the long-term impact on economies, markets, industries and individual issuers, are not known. The operational and financial performance of the issuers of securities in which the Fund invest depends on future developments, including the duration and spread of the outbreak and the pace of recovery which may vary from market to market, and such uncertainty may in turn adversely affect the value and liquidity of the Fund’s investments, impair the Fund’s ability to satisfy redemption requests, and negatively impact the Fund’s performance.
The impairment or failure of one or more banks with whom the Fund transacts may inhibit the Fund’s ability to access depository accounts. In such cases, the Fund may be forced to delay or forgo investments, resulting in lower Fund performance. In the event of such a failure of a banking institution where the Fund holds depository accounts, access to such accounts could be restricted and U.S. Federal Deposit Insurance Corporation (“FDIC”) protection may not be available for balances in excess of amounts insured by the FDIC. In such instances, the Fund may not recover such excess, uninsured amounts.
Large Shareholder Risk — From time to time, and at present, a significant percentage of the Fund’s shares may be owned or controlled by one or more large shareholders, including shareholders that are affiliated with either the Fund, the Adviser, or both. Accordingly, in these instances, the Fund is subject to increased risks related to potential large-scale outflows as the result of participation in fund repurchase offers by these significant shareholders. Although the Fund’s structure mitigates this risk by only providing liquidity through Required Repurchases and Discretionary Repurchases, transactions to accommodate outflows associated with repurchase participation by these large shareholders could cause the fund to sell portfolio investments at inopportune times, potentially negatively affecting the Fund’s net asset value and performance. In the case of investments by affiliates of the Fund or Adviser, conflicts of interest may exist, including the possibility that the Fund will be able to attract more assets from third-party investors because of the affiliate’s investment, thereby growing the Fund and increasing the management fees received by the Adviser.
35
Bow River Capital Evergreen Fund |
NOTES TO THE FINANCIAL STATEMENTS (CONTINUED)
MARCH 31, 2023 |
15. Beneficial Ownership
The beneficial ownership, either directly or indirectly, of more than 25% of the voting securities of the Fund creates a presumption of control under Section 2(a)(9) of the 1940 Act. As of March 31, 2023, Pershing LLC and First Premier Bank, for the benefit of their customers, owned 45.27% and 31.21%, respectively, of Class II Shares of the Fund. No persons or entities own, either directly or indirectly, more than 25% of the outstanding shares of Class I.
16. Subsequent Events
Effective April 1, 2023 there were subscriptions to Class I Shares in the amount of $12,306,067 and $150,000 to Class II Shares. Effective May 1, 2023 there were subscriptions to Class I Shares in the amount of $6,754,500 and $290,241 to Class II Shares.
On May 31, 2023, the Fund completed a Required Repurchase Offer. At the time of this report mailing, the results of the offer were not known. The results of the offer will be disclosed in the semi-annual report to shareholders dated September 30, 2023.
The Fund has evaluated subsequent events through the date the financial statements were issued and has determined that there were no other subsequent events that require disclosure in or adjustment to the financial statements.
36

|
Bow River Capital Evergreen Fund |
REPORT OF INDEPENDENT REGISTERED PUBLIC ACCOUNTING FIRM |
To the Shareholders and Board of Trustees of
Bow River Capital Evergreen Fund
Opinion on the Financial Statements
We have audited the accompanying statement of assets and liabilities, including the schedule of investments, of Bow River Capital Evergreen Fund (the “Fund”) as of March 31, 2023, the related statements of operations and cash flows for the year then ended, the statements of changes in net assets for each of the two years in the period then ended, the related notes, and the financial highlights for each of the two years in the period then ended and for the period January 1, 2021 (commencement of operations) through March 31, 2021 (collectively referred to as the “financial statements”). In our opinion, the financial statements present fairly, in all material respects, the financial position of the Fund as of March 31, 2023, the results of its operations for the year then ended, the changes in its net assets for each of the two years in the period then ended, and the financial highlights for each of the two years in the period then ended and for the period January 1, 2021 (commencement of operations) through March 31, 2021, in conformity with accounting principles generally accepted in the United States of America.
Basis for Opinion
These financial statements are the responsibility of the Fund’s management. Our responsibility is to express an opinion on the Fund’s financial statements based on our audits. We are a public accounting firm registered with the Public Company Accounting Oversight Board (United States) (“PCAOB”) and are required to be independent with respect to the Fund in accordance with the U.S. federal securities laws and the applicable rules and regulations of the Securities and Exchange Commission and the PCAOB.
We conducted our audits in accordance with the standards of the PCAOB. Those standards require that we plan and perform the audits to obtain reasonable assurance about whether the financial statements are free of material misstatement whether due to error or fraud.
Our audits included performing procedures to assess the risks of material misstatement of the financial statements, whether due to error or fraud, and performing procedures that respond to those risks. Such procedures included examining, on a test basis, evidence regarding the amounts and disclosures in the financial statements. Our procedures included confirmation of securities owned as of March 31, 2023, by correspondence with the custodian, private investment counterparties, and brokers; when replies were not received from underlying private investment counterparties, we performed other auditing procedures. Our audits also included evaluating the accounting principles used and significant estimates made by management, as well as evaluating the overall presentation of the financial statements. We believe that our audits provide a reasonable basis for our opinion.
We have served as the Fund’s auditor since 2020.

COHEN & COMPANY, LTD.
Cleveland, Ohio
May 30, 2023

37
Bow River Capital Evergreen Fund |
TRUSTEES AND OFFICERS
MARCH 31, 2023 (Unaudited) |
INDEPENDENT TRUSTEES |
NAME,
ADDRESS
AND YEAR
OF BIRTH | POSITION(S)
WITH THE
FUND | LENGTH
OF TIME
SERVICED* | PRINCIPAL OCCUPATION(S)
DURING PAST 5 YEARS | PORTFOLIOS
IN FUND
COMPLEX
OVERSEEN
BY TRUSTEE | OTHER
DIRECTORSHIPS**
HELD BY TRUSTEE |
Jeremy May
(1970) | Chairman and Trustee | Since
Inception | Founder and CEO of Paralel Technologies, LLC (a fintech firm) and its wholly owned subsidiaries, Paralel Advisors (a registered investment adviser) and Paralel Distributors (a registered broker/dealer) (Since October 2019); Previously, President and Director of ALPS Fund Services, Inc., ALPS Distributors, Inc., and ALPS Portfolio Solutions Distributor, Inc., Executive Vice President and Director of ALPS Holdings, Inc. and ALPS Advisors, Inc. (1995 to 2019). | 1 | Russell Investment Company and Russell Investment Funds (40 funds) (since 2021); New Age Alpha ETF Trust (2020 to 2022); Reaves Utility Income Fund (2009 to 2021); ALPS Series Trust (9 funds) (2012 to 2021); RiverNorth Opportunities Fund, Inc. (2018 to 2019). |
Michael Imhoff
(1963) | Trustee | Since
Inception | Managing Director of Stifel (full service investment firm) (Since 2015); Previously, other roles at Stifel (Since 1985). | 1 | N/A |
Jack Swift
(1973) | Trustee | Since
Inception | President and Chief Revenue Officer of TIFIN (a financial technology company) (Since 2019); Previously, Partner and President of Crestone Capital, LLC (investment management and wealth advisory firm) (2016 to 2019); Managing Director, Head of Global Business Development of Pacific Current Group (a boutique asset management firm) (2010 to 2016). | 1 | Member of the Board of Advisors at Magnifi (Since 2020); Chairman of the Board at Clout (Since 2020). |
INTERESTED TRUSTEE AND OFFICERS |
NAME,
ADDRESS
AND YEAR
OF BIRTH | POSITION(S)
WITH THE
FUND | LENGTH
OF TIME
SERVICED* | PRINCIPAL OCCUPATION(S)
DURING PAST 5 YEARS | PORTFOLIOS
IN FUND
COMPLEX
OVERSEEN
BY TRUSTEE/
OFFICER | OTHER
DIRECTORSHIPS**
HELD BY
TRUSTEE/OFFICER |
Jeremy Held***
(1974) | Trustee and President | Since Inception | Managing Director, Bow River Capital (Since 2019); Previously, ALPS Advisors, Inc. (investment management company) – Chief Investment Officer (2007 to 2019). | 1 | Director, Principal Real Estate Income Fund (Since 2017) |
Rich Wham
(1964) | Vice President | Since Inception | Chairman, Bow River Capital (Since 2017); Previously Partner, Westfield Company Inc. (real estate company) (2015 to 2017). | 1 | N/A |
38
Bow River Capital Evergreen Fund |
TRUSTEES AND OFFICERS (CONTINUED)
MARCH 31, 2023 (Unaudited) |
INTERESTED TRUSTEE AND OFFICERS (Continued) |
NAME,
ADDRESS
AND YEAR
OF BIRTH | POSITION(S)
WITH THE
FUND | LENGTH
OF TIME
SERVICED* | PRINCIPAL OCCUPATION(S)
DURING PAST 5 YEARS | PORTFOLIOS
IN FUND
COMPLEX
OVERSEEN
BY TRUSTEE/
OFFICER | OTHER
DIRECTORSHIPS**
HELD BY
TRUSTEE/OFFICER |
Jane Ingalls
(1966) | Vice President
and Secretary | Since Inception | Chief Operating Officer (since 2022); Managing Director and Chief of Staff, Bow River Capital (2020 to 2022); Previously, Founder and President,Artemis Consulting Group (2007 to 2020). | 1 | N/A |
Derek Mullins
(1973) | Treasurer | Since Inception | Managing Partner, PINE Advisor Solutions (provider of outsourced non-investment fund services) (since 2018). | 1 | N/A |
John Blue
(1977) | Chief Compliance Officer | Since Inception | Managing Partner, PINE Advisor Solutions (provider of outsourced non-investment fund services) (Since 2018); Chief Compliance Officer, Kelly Strategic Management, LLC (Since 2022). | 1 | N/A |
Marcie McVeigh
(1979) | Assistant Treasurer | Since
Inception | Director of CFO Services, PINE Advisor Solutions (provider of outsourced non-investment fund services) (Since 2020); Assistant Vice President and Performance Measurement Manager at Brown Brothers Harriman (financial services firm) (2019 to 2020). | 1 | N/A |
James Kerr
(1983) | Assistant Secretary | Since March 2021 | Chief Compliance Officer & General Counsel, Bow River Capital (since 2021); Previously, Senior Legal Counsel (2021) and Legal Counsel (2018 to 2021), Janus Henderson Investors U.S.; Assistant Secretary, Janus Detroit Street Trust (ETF Trust) and Assistant Secretary, Clayton Street Trust (VIT Trust) (2018 to 2021). | 1 | N/A |
39
Bow River Capital Evergreen Fund |
ADDITIONAL INFORMATION
MARCH 31, 2023 (Unaudited) |
Proxy Voting Policy — The Fund is required to file Form N-PX, with its complete proxy voting record for the twelve months ended June 30, no later than August 31. The Fund’s Form N-PX filing is available: (i) without charge, upon request, by 1-888-330-3350 or (ii) by visiting the SEC’s website at www.sec.gov.
Portfolio Holdings — The Fund files its complete schedule of portfolio holdings with the SEC for the first and third quarters of each fiscal year on Form N-PORT. Form N-PORT is available on the SEC’s website at http://www.sec.gov. The information on Form N-PORT is available without charge, upon request, by calling 1-888-330-3350.
40
Bow River Capital Evergreen Fund |
PRIVACY NOTICE |
Bow River Capital Evergreen Fund (“we,” “us,” or the “Fund”) respects your right to privacy. We are committed to maintaining the confidentiality and integrity of nonpublic personal information. We want our investors and prospective investors to understand what information we collect and how we use it. “Nonpublic personal information” is defined as personally identifiable information about you. We do not sell your personal information, and we do not disclose it to anyone except as permitted or required by law or as described in this notice.
CONFIDENTIALITY & SECURITY
We take our responsibility to protect the privacy and confidentiality of investors’ and prospective investors’ information very seriously. We maintain appropriate physical, electronic, and procedural safeguards to guard nonpublic personal information. Our network is protected by firewall barriers, encryption techniques, and authentication procedures, among other safeguards, to maintain the security of your information. We provide this Privacy Notice to investors at the start of new relationships and annually after that. We continue to adhere to the practices described herein after investors’ accounts close. Furthermore, vendors with access to nonpublic personal information undergo an annual due diligence verification process to ensure their informational safeguards adhere to our strict standards.
WHY WE COLLECT YOUR INFORMATION
Bow River Capital Evergreen Fund gathers information about our investors and their accounts to (1) know investors’ identities and thereby prevent unauthorized access to confidential information; (2) design and improve the products and services we offer to investors; and (3) comply with the laws and regulations that govern us.
HOW WE PROTECT YOUR INFORMATION
To fulfill our privacy commitment for prospective, current, and former investors, Bow River Capital Evergreen Fund has safeguards in place to protect nonpublic personal information. Safeguards include, but are not limited to:
• Policies and procedures to protect your nonpublic information and comply with federal and state regulations; and
• Contractual agreements with third-party service providers to protect your nonpublic personal information.
INFORMATION WE COLLECT
Bow River Capital Evergreen Fund is required by industry guidelines to obtain personal information about you in providing investment management services to you. We use this information to manage your account, direct your financial transactions, and provide you with valuable information about the assets we manage for you. We gather information from documents you provide to us, forms that you complete, and personal interviews. This information may include:
• Your name, address, and social security number;
• Proprietary information regarding your beneficiaries;
• Information regarding your earned wages and other sources of income;
• The composition and value of your managed portfolio;
• Historical information we receive and maintain relating to transactions made on your behalf by Bow River Capital Evergreen Fund, your custodian, or others;
• Information we receive from your institutional financial advisor, investment consultant, or other financial institutions with whom Bow River Capital Evergreen Fund has a relationship and/or with whom you may be authorized us to gather and maintain such information.
41
Bow River Capital Evergreen Fund |
PRIVACY NOTICE (CONTINUED) |
SHARING INFORMATION WITH NON-AFFILIATED THIRD PARTIES
We only disclose nonpublic investor information to non-affiliated third parties (e.g. investor’s custodian or broker) without prior investor consent when we believe it necessary to conduct our business or as required or permitted by law such as:
• If you request or authorize the disclosure of the information;
• To provide investor account services or account maintenance;
• To respond to regulatory authorities, a subpoena or court order, judicial process, or law enforcement;
• To perform services for the Fund, or on its behalf, to maintain business operations and services;
• To help us to prevent fraud;
• With attorneys, accountants, and auditors of the Fund;
• To comply with federal, state, or local laws, rules, and other applicable legal requirements.
We do not sell your information and do not make any disclosure of investor nonpublic personal information to other companies who may want to sell their products or services to you.
OPT-OUT NOTICE
If, at any time in the future, it is necessary to disclose any investor personal information in a way that is inconsistent with this notice, Bow River Capital Evergreen Fund will provide you with proper advanced notice of the proposed disclosure so that you will have the opportunity to either opt-in or opt-out of such disclosure, as required by applicable law.
If you have any questions about this Privacy Notice, please contact John Blue, Chief Compliance Officer of Bow River Capital Evergreen Fund at jb@pineadvisorsolutions.com.
42
This page intentionally left blank.
| | |
| | | Adviser:
Bow River Advisers, LLC
205 Detroit Street, Suite 800
Denver, CO 80206 |
| | | Distributor:
Foreside Financial Services, LLC
3 Canal Plaza #100
Portland, ME 04101 |
(b) There were no notices transmitted to stockholders in reliance on Rule 30e-3 under the Investment Company Act of 1940, as amended, that contained disclosures specified by paragraph (c)(3) of that rule.
Item 2. Code of Ethics.
The Registrant has a code of ethics (the “Code”) that applies to the Registrant’s principal executive officer and principal financial officer. During the period covered by this report, there were no material amendments to the provisions of the Code, nor were there any implicit or explicit waivers to the provisions of the Code. The Code is filed herewith.
Item 3. Audit Committee Financial Expert.
(a) (1) The Board of Trustees of the Registrant (the “Board”) has determined that the Registrant has at least one Board member serving on the Audit Committee that possesses the attributes identified in Instruction 2(b) of Item 3 to Form N-CSR to qualify as an “audit committee financial expert.”
(2) Jeremy May is the Registrant’s audit committee financial expert and is “independent” for purposes of Item 3(a)(2) to Form N-CSR.
Item 4. Principal Accountant Fees and Services.
The aggregate fees for professional services by Cohen & Company, Ltd. during the Registrant’s last two fiscal years were as follows:
(a) Audit Fees.
Fiscal year ended March 31, 2023 | | $ | 160,000 |
Fiscal year ended March 31, 2022 | | $ | 82,500 |
(b) Audit-Related Fees. These are fees by the Registrant’s independent auditors for assurance and related services that were reasonably related to the performance of the audit of the Registrant’s financial statements that are not reported under “Audit Fees”.
Fiscal year ended March 31, 2023 | | $ | 0 |
Fiscal year ended March 31, 2022 | | $ | 0 |
(c) Tax Fees. These are fees billed for professional services rendered by the Registrant’s independent auditors for tax compliance, tax advice, and tax planning.
Fiscal year ended March 31, 2023 | | $ | 28,000 |
Fiscal year ended March 31, 2022 | | $ | 28,000 |
(d) All Other Fees.
Fiscal year ended March 31, 2023 | | $ | 0 |
Fiscal year ended March 31, 2022 | | $ | 0 |
(e) Audit Committee’s pre-approval policies and procedures.
(1) The Audit Committee has adopted pre-approval policies and procedures that require the Audit Committee to pre-approve all audit and non-audit services of the Registrant, including services provided to the Registrant’s investment adviser or any entity controlling, controlled by or under common control with the Registrant’s investment adviser that provides ongoing services to the Registrant with respect to any engagement that directly relates to the operations and financial reporting of the Registrant.
(2) None of the services described in paragraphs (b) through (d) of this Item 4 were approved by the audit committee pursuant to paragraph (c)(7)(i)(C) of Rule 2- 01 of Regulation S-X.
(f) None.
(g) None.
(h) Not applicable.
(i) Not applicable.
(j) Not applicable.
Item 5. Audit Committee of Listed Registrants.
Not applicable.
Item 6. Schedule of Investments.
(a) Included as part of the report to shareholders filed under Item 1 of this Form N-CSR.
(b) Not applicable.
Item 7. Disclosure of Proxy Voting Policies and Procedures for Closed-End Management Investment Companies.
The Registrant’s Proxy Voting Policies and Procedures is attached hereto as Exhibit 13(c).
Item 8. Portfolio Managers of Closed-End Management Investment Companies.
(a)(1)Identification of Portfolio Manager(s) or Management Team Members and Description of Role of Portfolio Manager(s) or Management Team Members
Jeremy Held
Jeremy Held, CFA, is currently responsible for Bow River Capital’s registered asset management business including investment oversight, research and product development. Prior to joining Bow River Capital in 2019, Mr. Held was the Director of Research and Chief Investment Officer at ALPS Advisors, a Denver-based asset manager that specializes in registered fund vehicles focused on real assets and alternative investments. Mr. Held began his career at ALPS in 1996 and helped lead a variety of business initiatives over two decades, including the launch of the firm’s asset management business in 2007. Mr. Held has a strong track record launching innovative investment products, including the world’s first Master Limited Partnership (“MLP”) Exchange-Traded Fund (“ETF”), as well as the first Listed Private Equity (“LPE”) mutual fund. Mr. Held was ultimately responsible for all aspects of the ALPS Advisors business, overseeing 44 registered investment companies and more than $20 billion in assets. Mr. Held has significant investment oversight experience, advising several registered mutual fund boards and serving as President of Red Rocks Capital, a wholly- owned subsidiary of ALPS focused on Listed Private Equity investments.
Mike Trihy
Mike Trihy, CFA, CAIA, serves as a Director and Portfolio Manager at Bow River Capital, and is currently responsible for portfolio construction and investment research for the Fund. Prior to joining Bow River Capital in 2019, Mr. Trihy was a Portfolio Manager at Partners Group, a Swiss-based global private markets manager. Mike joined Partners Group in January 2017 and was responsible for the day-to-day portfolio management for separate account and evergreen fund mandates in the Americas region, including the largest private equity-focused tender offer fund globally. During his time as Portfolio Manager, the evergreen funds under his mandate delivered consistent total returns with low levels of volatility, while maintaining appropriate liquidity and a high level of portfolio diversification. He has constructed portfolios across multiple asset classes, including private equity, real assets, private credit, and liquid investments (equity and credit). Before his time at Partners Group, Mr. Trihy and Mr. Held worked together for six years when Mr. Trihy served as a Client Portfolio Manager at Red Rocks Capital, a Denver-based asset manager focused on Listed Private Equity investments. He was responsible for investment research and portfolio management of the firm’s equity index products.
Rich Wham
Prior to joining Bow River Capital in 2017, Mr. Wham spent thirteen years as a partner at Denver-based Westfield Company where he led the capitalization of numerous real estate investments exceeding $1 billion in total value. As President and Chief Operating Officer at Bow River Capital, Mr. Wham is responsible for overseeing operations of Bow River Capital and its funds, investor relations, and engaging specialized and experienced personnel to advise on potential new fund opportunities. Additionally, he oversees the real estate group and co-chairs the advisory board for the 2017 Buyout Fund. Mr. Wham represents a “C-level” point of contact for all Bow River Capital investors.
(a)(2)Other Accounts Managed by Portfolio Manager(s) or Management Team Member and Potential Conflicts of Interest
The following tables provide information about portfolios and accounts, other than the Registrant, for which the portfolio managers are primarily responsible for the day-to-day portfolio management as of March 31, 2023:
| | Registered investment companies | | Other pooled investment vehicles | | Other accounts | | Registered investment companies | | Other pooled investment vehicles | | Other accounts |
Jeremy Held | | 0 | | 0 | | 0 | | $0 | | $0 | | $0 |
Mike Trihy | | 0 | | 0 | | 0 | | 0 | | 0 | | 0 |
Rich Wham | | 0 | | 0 | | 0 | | 0 | | 0 | | 0 |
Potential Conflicts of Interests
The Investment Team may manage separate accounts or other pooled investment vehicles that may have materially higher or different fee arrangements than the Fund and may also be subject to performance-based fees. The side-by-side management of these separate accounts and pooled investment vehicles may raise potential conflicts of interest relating to cross-trading and the allocation of investment opportunities. The Adviser has a fiduciary responsibility to manage all client accounts in a fair and equitable manner. The Adviser seeks to provide best execution of all securities transactions and to allocate investments to client accounts in a fair and reasonable manner. To this end, the Adviser has developed policies and procedures designed to mitigate and manage the potential conflicts of interest that may arise from side-by-side management.
(a)(3)Compensation Structure of Portfolio Manager(s) or Management Team Members
A competitive base salary and a performance-based bonus structure are in place for all team members. Members of the Investment Team, analysts, and other associates are paid a competitive base salary and discretionary bonus based on their fiduciary investment responsibilities, performance of the individual, and performance of the firm. The discretionary bonus structure gives the Adviser the ability to remain competitive under current market conditions affecting compensation across the industry. The discretionary bonus may be payable in both cash and equity.
(a)(4)Disclosure of Securities Ownership
The following tables set forth the dollar range of equity securities beneficially owned by each of the portfolio managers in the Registrant as of March 31, 2023:
Portfolio Manager | | Dollar Range of Registrant Shares Beneficially Owned |
Jeremy Held | | $100,001 – $500,000 |
Mike Trihy | | $10,001 – $50,000 |
Rich Wham | | over $1,000,000 |
(b) Not applicable.
Item 9. Purchases of Equity Securities by Closed-End Management Investment Company and Affiliated Purchasers.
There were no purchases made by or on behalf of the registrant or any “affiliated purchaser,” as defined in Rule 10b-18(a)(3) under the Exchange Act (17 CFR 240.10b-18(a)(3)), of shares or other units of any class of the registrant’s equity securities that is registered by the registrant pursuant to Section 12 of the Exchange Act (15 U.S.C. 781).
There were no purchases that do not satisfy the conditions of the safe harbor of Rule 10b-18 under the Exchange Act (17 CFR 240.10b-18), made in the period covered by this report.
Item 10. Submission of Matters to a Vote of Security Holders.
Not applicable.
Item 11. Controls and Procedures.
(a) The Registrant’s principal executive officer and principal financial officer have reviewed the Registrant’s disclosure controls and procedures (as defined in Rule 30a- 3(c) under the Investment Company Act of 1940, as amended, (the “Act”)) as of a date within 90 days of the filing of this report, as required by Rule 30a-3(b) under the Act. Based on their review, such officers have concluded that the disclosure controls and procedures were effective in ensuring that information required to be disclosed in this report was appropriately recorded, processed, summarized and reported and made known to them by others within the Registrant and by the Registrant’s service providers.
(b) There were no changes in the Registrant’s internal control over financial reporting (as defined in Rule 30a-3(d) under the Act (17 CFR 270.30a-3(d)) that occurred during the period covered by this report that materially affected, or were reasonably likely to materially affect, the Registrant’s internal control over financial reporting.
Item 12. Disclosure of Securities Lending Activities for Closed-End Management Investment Companies.
The Fund has not engaged in Security Lending Activities.
Item 13. Exhibits.
SIGNATURES
Pursuant to the requirements of the Securities Exchange Act of 1934 and the Investment Company Act of 1940, the Registrant has duly caused this report to be signed on its behalf by the undersigned, thereunto duly authorized.
| | Bow River Capital Evergreen Fund |
| | | /s/ Jeremy Held |
| | | By: Jeremy Held |
| | | Trustee, President and Chief Executive Officer |
| | | (Principal Executive Officer)
June 8, 2023 |
Pursuant to the requirements of the Securities Exchange Act of 1934 and the Investment Company Act of 1940, this report has been signed below by the following persons on behalf of the Registrant and in the capacities and on the dates indicated.
| | /s/ Jeremy Held |
| | | By: Jeremy Held |
| | | Trustee, President and Chief Executive Officer |
| | | (Principal Executive Officer)
June 8, 2023 |
| | /s/ Derek Mullins |
| | | By: Derek Mullins |
| | | Treasurer and Chief Financial Officer |
| | | (Principal Financial Officer)
June 8, 2023 |