UNITED STATES
SECURITIES AND EXCHANGE COMMISSION
Washington, D.C. 20549
FORM N-CSR
CERTIFIED SHAREHOLDER REPORT OF REGISTERED MANAGEMENT
INVESTMENT COMPANIES
Investment Company Act File Number 811-23566
Bow River Capital Evergreen Fund
(Exact name of registrant as specified in charter)
205 Detroit Street, Suite 800
Denver, Colorado 80206
(Address of principal executive offices) (Zip code)
Jeremy Held
Bow River Advisers, LLC
205 Detroit Street, Suite 800
Denver, Colorado 80206
(Name and address of agent for service)
COPIES TO:
Joshua B. Deringer, Esq.
Faegre Drinker Biddle & Reath LLP
One Logan Square, Ste. 2000
Philadelphia, PA 19103-6996
215-988-2700
Registrant's telephone number, including area code: (303) 861-8466
Date of fiscal year end: March 31
Date of reporting period: March 31, 2024
Item 1. Reports to Stockholders.
| (a) | The following is a copy of the report transmitted to shareholders pursuant to Rule 30e-1 under the Investment Company Act of 1940 (17 CFR 270.30e-1) |

Bow River Capital Evergreen Fund |
Annual Report
March 31, 2024
bowriverevergreen.com • 1-888-330-3350
• DISTRIBUTED BY FORESIDE FINANCIAL SERVICES, LLC (MEMBER OF FINRA)
Bow River Capital Evergreen Fund |
TABLE OF CONTENTS
MARCH 31, 2024 |
Bow River Capital Evergreen Fund |
MANAGER’S DISCUSSION OF FUND PERFORMANCE
MARCH 31, 2024 |
Dear Bow River Capital Evergreen Fund Investor:
We are pleased to present our annual report for the Bow River Capital Evergreen Fund.
The Bow River Capital Evergreen Fund (the “Fund”) was launched in May of 2020 to provide investors with access to institutional quality private equity investments with broader investment exposure and greater flexibility than traditional private investment funds. By providing access to private equity in an investor-friendly registered fund we believe the Fund will transform the way investors approach the asset class and provide them with an important tool to build better portfolios.
The Fund seeks to capture the best practices of private equity investing by combining the access, scale and pricing power of a large institution with the specialization and agility of a middle-market boutique. The Fund’s investment objective is to generate long-term capital appreciation by investing in a broad portfolio of private equity investments that provide attractive risk-adjusted return potential.
Since its launch in 2020 the Fund has been well received by investors as both a private markets access vehicle and as a portfolio customization tool. As of March 31, 2024, the Fund has a diverse investor base including individuals, wealth management firms, family offices and institutional investors.
Highlights for the fiscal year-ended March 31, 2024, include the following:
• Class I of the Fund returned 12.77% for the 1-year ended March 31, 2024.
• The Fund deployed a total of $111 million into 22 transactions during the fiscal year across the direct investment, secondary and primary fund market, bringing total private market investments in the Fund to 94.
• The Fund’s net assets increased from $340 million in March 2023 to $492 million at the end of March 2024.
Market Update
The Fund’s most recent fiscal year represented a period of normalization as private market firms adjusted to a higher-for-longer environment on the heels of the interest rate and inflationary shocks from 2022. We believe that the excesses that formed in 2020 and 2021 may take longer to work out than originally forecasted. Firms that exercised more discipline in the past and utilize a more operationally driven strategy going forward should be able to distance themselves from generalist peers that relied heavily on the tailwinds of an easy-money environment.
The biggest takeaways for investors are as follows: most private markets firms remain significantly behind plan in terms of generating distributions, fundraising is remarkably difficult, and the dispersion in go-forward returns will likely increase. Distributions as a percentage of invested capital are at a 25-year low and exits are at the lowest point since the Global Financial Crisis. Lower distributions to limited partners have exacerbated an already difficult fundraising environment causing firms to either delay fundraising entirely or take longer to raise smaller funds. The number of successful completed fundraises is down 50% from the peak in 2021 and if history is a guide, the current fundraising recession in private markets could last at least 2-3 years.
Despite clouds on the horizon, there are signs of life emerging for private market investors. Easier debt market conditions and better visibility on interest rates seem to be driving significantly increased private markets activity, with early signs that sponsors may push to exit businesses rapidly into easing financial conditions. This pent-up demand to provide liquidity to investors combined with a major dry powder overhang for buyers could lead to a flurry of activity if markets hold steady or continue to improve.
We find this combination of an opening of the capital markets alongside a difficult distribution and fundraising environment to be quite compelling. The pendulum has swung in favor of limited partners over the past several quarters and disciplined investors with plenty of dry powder should be better compensated for risk than in previous vintages. Smaller funds and longer fundraising cycles should lead to a higher volume of direct investment deal flow as well as more highly seasoned primary funds with better visibility to underlying portfolio companies and potential value creation. GP-led secondaries have also emerged with much more investor-friendly terms and offer private equity firms an opportunity to deliver distributions to liquidity starved LP’s while still retaining control of their best performing assets.
1
Bow River Capital Evergreen Fund |
MANAGER’S DISCUSSION OF FUND PERFORMANCE (CONTINUED)
MARCH 31, 2024 |
Given these changing market dynamics, we believe the increasing attractiveness of direct investments and GP-led secondaries is somewhat offset by a slightly less attractive environment for traditional LP-secondaries. High-quality secondary interests are routinely pricing in the mid-to-high 90’s as a percentage of net asset value. Pricing deferrals and the slew of dedicated evergreen secondaries funds may distort pricing further in a market that we believe is already fully priced in many cases. We still believe plenty of value exists in smaller, less-competed secondary transactions but these are becoming increasingly harder to find.
Alongside the ebbs and flows of the capital markets, the Fund continues to seek consistency in deployment, asset allocation, and return composition in all market environments. We believe consistent performance is the result of a disciplined asset allocation and deployment plan complemented by the freedom to allocate new capital into the most attractive segments of the market. This philosophy is illustrated by both the short-term and long-term performance of the Fund which we believe should be an attractive alternative to both public and private markets investments.
Asset Allocation
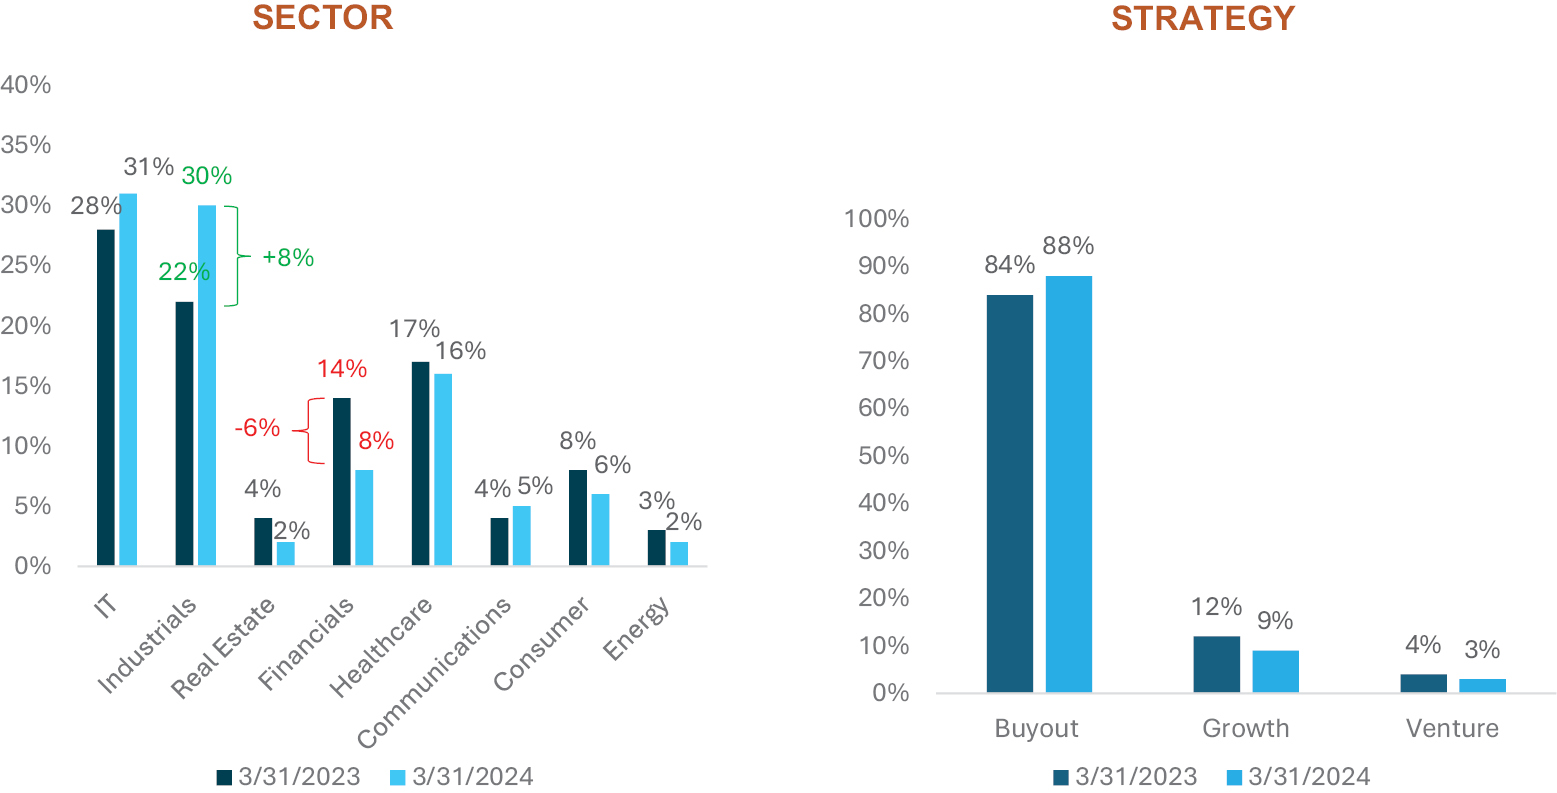
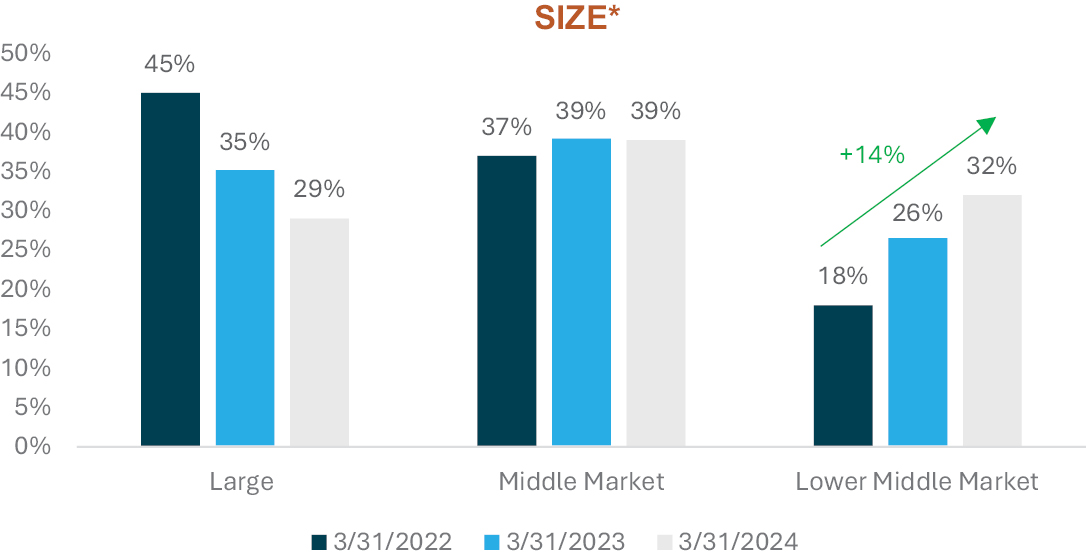
During the year-ended March 31, 2024, the portfolio management team continued to add exposure to smaller companies, reinforcing our belief in the ability of middle market companies to outperform their larger peers. As of the end of the fiscal year, middle market companies represent more than 70% of the entire portfolio with the biggest increase coming at the lower end of the middle market which increased from 26% last year to 32% this year. From a sector standpoint the team increased exposure predominantly to industrials, represented most significantly by business services and technology enabled services. The Fund continues to maintain an overweight to the Buyout sector and an underweight to Growth Equity and Venture Capital which collectively represents just over 10% of our overall private equity allocation.
2
Bow River Capital Evergreen Fund |
MANAGER’S DISCUSSION OF FUND PERFORMANCE (CONTINUED)
MARCH 31, 2024 |
Performance
Class I of the Fund returned 12.77% for the 1-year period ended March 31, 2024. Fund performance during the fiscal year was driven largely by valuation uplift in several of the Fund’s direct investments, particularly in middle and lower middle market companies.
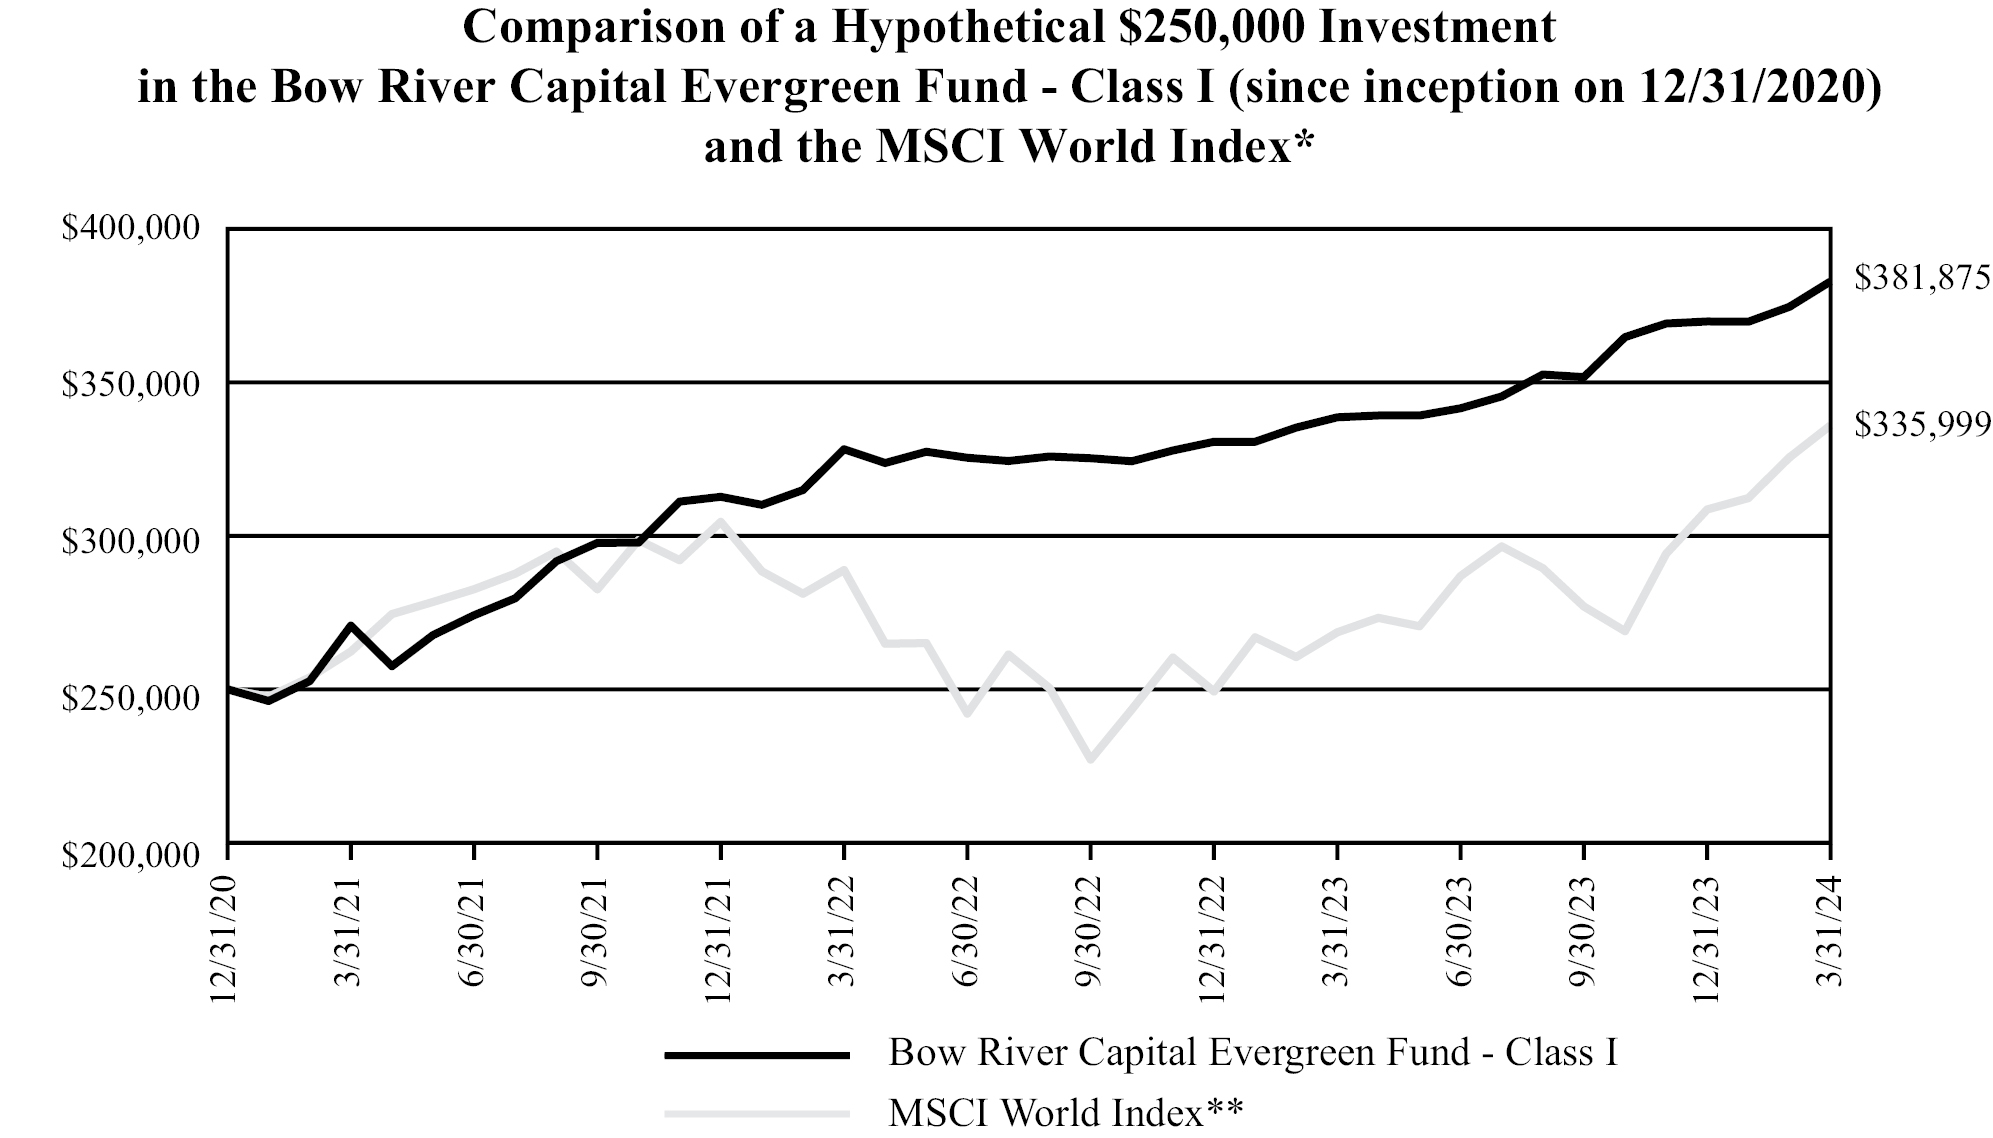
Average Annual Total Return Information |
| |
Share Class | 1-Year | 2-Year | 3-Year | Since
Inception | Inception
Date | |
Class I | 12.77% | 7.86% | 12.15% | 13.94% | 12/31/2020 | |
Class II | 12.51% | 7.61% | —% | 9.07% | 1/3/2022 | |
Fund Benchmark | | | | | | |
MSCI World Index(1) | 25.11% | 7.85% | 8.60% | 9.53%(2) | | |
3
Bow River Capital Evergreen Fund |
MANAGER’S DISCUSSION OF FUND PERFORMANCE (CONTINUED)
MARCH 31, 2024 |
Outlook
With the improvement in financial conditions and visibility toward an increase in deal flow in private markets, all near-term signs are generally positive for private equity portfolios in 2024. That being said, the Fund team remains cautious as we still see material risks to this rosy outlook. Inflation (particularly in services) has remained stubbornly high, increasing the risk that the Fed may hold rates higher than markets are currently pricing (this year and beyond). Higher-for-longer rates would be a performance drag on some legacy private equity portfolios, particularly for GPs that over-paid and over-levered assets in the peak years of 2020 and 2021. This could also translate to a spike in defaults in private credit after the recipients of covenant-lite loans issued in the zero-interest rate policy years may finally run out of liquidity runway after years of kicking the can down the road. And there is still the risk that the slow-motion car crash taking place in commercial real estate markets could finally start to have more meaningful ripple effects on the broader economy.
Our investment strategy focuses on businesses and deals that we believe can prove resilient in a number of these different market scenarios while deploying into each new vintage year. We believe that this consistent approach leads to long-term outperformance of both public and private markets benchmarks. In 2024 we are seeing attractive opportunities across all of our target transaction types, with particularly unique opportunities in equity direct investments, GP-led secondaries, and seasoned primaries. If market exuberance proves stable and the exit environment improves, our portfolio should be well-positioned to rapidly re-deploy exited capital into new opportunities and continue compounding returns year-over-year.
As always, the investment team is available to answer any questions about the Fund and we look forward to speaking with you in the future.
Sincerely,
The Bow River Capital Evergreen Fund Team

| | 
| | 
| | 
|
Jeremy Held | | Michael Trihy | | Richard Wham | | Joe Stork |
The Bow River Capital Evergreen Fund Team
An offer can only be made by the prospectus and only in jurisdictions in which such an offer would be lawful. The prospectus contains important information concerning risk factors and other material aspects of the Fund to carefully consider and must be read carefully before a decision to invest is made. Please visit www.bowriverevergreen.com or contact your Financial Advisor to obtain a copy of the prospectus.
The Fund commenced investment operations on December 31, 2020, after the conversion of a limited partnership Account, Bow River Capital Evergreen Private Equity Fund LP, which commenced operations on May 22, 2020, (the “Predecessor Account”), into shares of the Fund’s Class I Shares. Information portrayed prior to December 31, 2020 is for the Predecessor Account. The Fund’s objectives, policies, guidelines and restrictions are in all material respects equivalent to those of the Predecessor Account. The Predecessor Account was not registered under the Investment Company Act of 1940, as amended (the “1940 Act”), and therefore was not subject to certain restrictions imposed by the 1940 Act on registered investment companies and by the Internal Revenue Code of 1986, as amended on regulated investment companies. If the Predecessor Account had been registered under the 1940 Act, the Predecessor Account’s performance may have been adversely affected.
Performance data quoted represents past performance and is no guarantee of future results. Total return figures include the reinvestment of dividends and capital gains. Current performance may be lower or higher than the performance data quoted. Investment return and principal value will fluctuate so that an investor’s shares, when redeemed, may be worth more or less than original cost. For the most recent month end performance, please call (888)-330-3350.
4
Bow River Capital Evergreen Fund |
MANAGER’S DISCUSSION OF FUND PERFORMANCE (CONTINUED)
MARCH 31, 2024 |
Any person subscribing for an investment must be able to bear the risks involved and must meet the suitability requirements of the Fund. Investors could lose all or a substantial amount of their investment. No assurance can be given that the Fund’s investment objectives will be achieved. The Fund is speculative and involves a substantial degree of risk. The Fund is a closed-end, diversified management investment company that will make periodic repurchase offers for its securities and is highly illiquid. There is no secondary market for investors’ interests, and none is expected to develop. There are certain restrictions on transferring interests. Fees and expenses will offset the Fund’s trading profits. The Fund is subject to conflicts of interest. Other risks include those related to equity securities, fixed income securities, high-yield/high risk bonds, listed private equity, listed infrastructure securities, foreign securities, derivative instruments, leverage, capital calls, investment manager risk, as well as those related to general economic and market conditions, all of which may present significant risks. Please see the prospectus for more information on these and other risks.
Bow River Advisers, LLC (“Bow River Capital”) is the management company for the Bow River Capital Evergreen Fund.
All statements made herein are opinions of Bow River Capital and should not be construed as investment advice and recommendations.
Fund Distributor: Foreside Financial Services, LLC
5
Bow River Capital Evergreen Fund |
SCHEDULE OF INVESTMENTS
MARCH 31, 2024 |
| | Investment Strategy | | Value |
Private Investments — 81.6% | | | | | |
Direct Investments — 42.1% | | | | | |
Credit — 4.5% | | | | | |
AP DSB Co-Invest II, LP1,2,4 | | Private Credit Direct Investment | | $ | 3,807 |
Digital Alpha Solutions Fund, LP, 14.86% (SOFR3M + 9.50% PIK + CSA)1,2 | | Private Credit Direct Investment | | | 4,450,897 |
Palmer Square Loan Funding 2021-3, Ltd.1 | | Private Credit Direct Investment | | | 1,331,780 |
PARIOU SLP, 8.00% PIK, 10/31/2030, principal EUR 5,208,7201,2 | | Private Credit Direct Investment | | | 6,281,055 |
Pathstone Family Office, LLC, 12.18% (SOFR1M + 6.75% + CSA, 1.00% Floor), 5/19/2029, principal $3,000,0001,3 | | Private Credit Direct Investment | | | 2,349,359 |
Polaris Newco, 15.41% (SOFR3M + 9.00%, 1.00% Floor), 6/3/2029, principal $2,000,0001,3 | | Private Credit Direct Investment | | | 2,077,416 |
Sand Trust Series 21-1A – Class SUB, 10/15/20341 | | Private Credit Direct Investment | | | 668,917 |
US Hospitality Publishers, Inc., 12.43% (SOFR3M + 7.00% + CSA, 1.00% Floor), 12/18/2025, principal $2,150,0001,3 | | Private Credit Direct Investment | | | 2,518,551 |
VCPF III Co-Invest 1-A, LP1,2 | | Private Credit Direct Investment | | | 2,601,343 |
| | | | | | 22,283,125 |
Equity — 37.6% | | | | | |
ACP Hyperdrive Co-Invest, LLC1,2,4 | | Private Equity Direct Investment | | | 2,845,934 |
Alpine Investors Iceman CV[-A], LP1,2,4 | | Private Equity Direct Investment | | | 8,427,046 |
AP DSB Co-Invest II, LP1,2,4 | | Private Equity Direct Investment | | | 3,871,074 |
Biloxi Co-Investment Partners, LP1,2,4 | | Private Equity Direct Investment | | | 1,966,317 |
Butterfly Nourish Co-Invest, LP1,2,4 | | Private Equity Direct Investment | | | 6,062,698 |
BW Colson Co-Invest Feeder (Cayman), LP1,2,4 | | Private Equity Direct Investment | | | 5,391,418 |
BW Phoenix Co-Invest, LP1,3,4 | | Private Equity Direct Investment | | | 7,000,000 |
Carlyle Riser Co-Investment, LP1,2,4 | | Private Equity Direct Investment | | | 3,052,298 |
Constellation 2022, LP1,2,4 | | Private Equity Direct Investment | | | 7,055,257 |
Corsair Amore Investors, LP1,2,4 | | Private Equity Direct Investment | | | 4,658,101 |
Coyote 2021, LP1,2,4 | | Private Equity Direct Investment | | | 5,475,105 |
DSG Group Holdings, LP1,3,4 | | Private Equity Direct Investment | | | 7,779,653 |
Enak Aggregator, LP1,2,4 | | Private Equity Direct Investment | | | 3,509,083 |
Falcon Co-Investment Partners, LP1,2,4 | | Private Equity Direct Investment | | | 2,921,783 |
ISH Co-Investment Aggregator, LP1,2,4 | | Private Equity Direct Investment | | | 2,717,136 |
IvyRehab Holdings, LLC1,3,4 | | Private Equity Direct Investment | | | 8,566,477 |
OceanSound Partners Co-Invest II, LP – Series B1,2,4,5 | | Private Equity Direct Investment | | | 10,109,829 |
OceanSound Partners Co-Invest II, LP – Series E1,2,4 | | Private Equity Direct Investment | | | 11,452,087 |
OceanSound SMX Continuation Fund, LP1,3,4 | | Private Equity Direct Investment | | | 6,451,445 |
Onex OD Co-Invest, LP1,2,4 | | Private Equity Direct Investment | | | 6,628,985 |
OSP Co-Invest II, LP1,2,4,5 | | Private Equity Direct Investment | | | 4,996,980 |
Palms Co-Investment Partners, LP1,2,4 | | Private Equity Direct Investment | | | 4,310,600 |
Project Stream Co-Invest Fund, LP1,2,4 | | Private Equity Direct Investment | | | 1,688,624 |
SANCY SLP1,2,4 | | Private Equity Direct Investment | | | 1,430,548 |
SCPCV-A, LP1,3,4 | | Private Equity Direct Investment | | | 7,881,462 |
SEP Hamilton III Aggregator, LP1,2,4 | | Private Equity Direct Investment | | | 6,512,899 |
SEP Hamilton, LP1,3,4 | | Private Equity Direct Investment | | | 1,439,640 |
SEP Skyhawk Fund III Aggregator, LP1,2,4 | | Private Equity Direct Investment | | | 539,121 |
Silver Lake Strategic Investors VI, LP1,2,4 | | Private Equity Direct Investment | | | 6,108,908 |
The Global Atlantic Financial Group, LLC1,3,4 | | Private Equity Direct Investment | | | 373,422 |
See accompanying Notes to Financial Statements.
6
Bow River Capital Evergreen Fund |
SCHEDULE OF INVESTMENTS (CONTINUED)
MARCH 31, 2024 |
| | Investment Strategy | | Value |
Private Investments — 81.6% (continued) | | | | | |
Direct Investments — 42.1% (continued) | | | | | |
Equity — 37.6% (continued) | | | | | |
TPG IX Evergreen Cl 1, LP1,2,4 | | Private Equity Direct Investment | | $ | 8,690,780 |
Veregy Parent, LLC1,3,4 | | Private Equity Direct Investment | | | 3,849,659 |
Vistage Equity Investors, LP1,2,4 | | Private Equity Direct Investment | | | 7,144,487 |
WestCap Cerebral Co-Invest 2021, LLC1,2,4 | | Private Equity Direct Investment | | | 17,593 |
WestCap LoanPal Co-Invest 2020, LLC1,3,4 | | Private Equity Direct Investment | | | 3,372,917 |
Wildcat 21 Co-Invest Fund, LP1,2,4 | | Private Equity Direct Investment | | | 3,238,001 |
WP Gateway Co-Invest, LP1,2,4 | | Private Equity Direct Investment | | | 7,212,925 |
| | | | | | 184,750,292 |
Total Direct Investments (Cost $151,274,265) | | | | | 207,033,417 |
| | | | | | |
Primary Funds — 14.4% | | | | | |
Credit — 1.9% | | | | | |
Ashgrove Specialty Lending Fund I SCSp RAIF1,2,4 | | Private Credit Primary | | | 1,196,160 |
Coller Credit Opportunities I – B, LP1,2 | | Private Credit Primary | | | 3,149,040 |
Lynx EBO Fund I (A), LLC1,2,4 | | Private Credit Primary | | | 89,259 |
Onex Structured Credit Opportunities International Fund I, LLC1,2 | | Private Credit Primary | | | 1,719,037 |
TKO Fund1,2,4 | | Private Credit Primary | | | 3,348,348 |
| | | | | | 9,501,844 |
| | | | | | |
Equity — 12.5% | | | | | |
Avista Capital Partners V, LP1,2,4 | | Private Equity Primary | | | 5,415,796 |
EnCap Energy Transition Fund 1-A, LP1,2,4 | | Private Equity Primary | | | 1,767,055 |
Ethos Capital Investments, LP1,2,4 | | Private Equity Primary | | | 3,133,847 |
FFL Capital Partners V, LP1,2,4 | | Private Equity Primary | | | 5,954,618 |
Grain Spectrum Holdings III (Cayman), LP1,2,4 | | Private Equity Primary | | | 3,727,980 |
Gridiron Capital Fund V, LP1,2,4 | | Private Equity Primary | | | 2,269,402 |
ICG LP Secondaries Fund I, LP1,2,4 | | Private Equity Primary | | | 1,999,109 |
OceanSound Partners Fund, LP1,2,4 | | Private Equity Primary | | | 4,495,918 |
OceanSound Partners Fund II, LP1,3,4 | | Private Equity Primary | | | 5,275,714 |
Overbay Fund XIV Offshore, LP1,2,4 | | Private Equity Primary | | | 1,785,284 |
Sheridan Capital Partners Fund III, LP1,2,4 | | Private Equity Primary | | | 1,656,349 |
Sumeru Equity Partners Fund III, LP1,2,4 | | Private Equity Primary | | | 2,733,393 |
Sumeru Equity Partners Fund IV, LP1,2,4 | | Private Equity Primary | | | 1,177,812 |
WestCap Strategic Operator Fund II, LP1,2,4 | | Private Equity Primary | | | 4,704,445 |
WestCap Strategic Operator U.S. Feeder Fund, LP1,3,4 | | Private Equity Primary | | | 7,829,614 |
Whitehorse Liquidity Partners IV, LP1,2,4 | | Private Equity Primary | | | 3,684,158 |
Whitehorse Liquidity Partners V, LP1,2,4 | | Private Equity Primary | | | 3,462,312 |
| | | | | | 61,072,806 |
Total Primary Funds (Cost $49,286,746) | | | | | 70,574,650 |
| | | | | | |
Private Investment Funds — 9.1% | | | | | |
PIMCO DSCO Fund II Offshore Feeder, LP1,2,4 | | Private Credit Primary | | | 5,292,607 |
Post Limited Term High Yield Fund, LP1,2,4 | | Alternative Strategy Short Duration High Yield | | | 6,481,140 |
See accompanying Notes to Financial Statements.
7
Bow River Capital Evergreen Fund |
SCHEDULE OF INVESTMENTS (CONTINUED)
MARCH 31, 2024 |
| | Investment Strategy | | Value |
Private Investments — 81.6% (continued) | | | | | |
Private Investment Funds — 9.1% (continued) | | | | | |
RenaissanceRe Medici Fund, Ltd.1,2,4 | | Alternative Strategy Insurance Linked Securities | | $ | 8,117,348 |
Ruffer Absolute Institutional, Ltd.1,2,4 | | Alternative Strategy Global Macro | | | 4,759,748 |
Saba Capital Carry Neutral Tail Hedge Offshore Fund, Ltd.1,2,4 | | Alternative Strategy Long/Short Carry Neutral | | | 4,403,209 |
Voleon Composition International Fund1,2,4 | | Alternative Strategy Quant Market Neutral | | | 10,174,522 |
Voloridge Fund, LP1,2,4 | | Alternative Strategy Quant Market Neutral | | | 5,689,687 |
Total Private Investment Funds (Cost $42,891,485) | | | | | 44,918,261 |
| | | | | | |
Secondary Funds — 16.0% | | | | | |
Credit — 6.6% | | | | | |
AG DLI IV (Unlevered), LP1,2,4 | | Private Credit Secondary | | | 13,136,514 |
BRCE SPV I, LLC1,3,4 | | Private Credit Secondary | | | 227,374 |
CCS Co-Investment Vehicle I, LP1,3,4,5 | | Private Credit Secondary | | | 5,456,763 |
Coller Credit Opportunities I – Annex I, SLP1,2 | | Private Credit Secondary | | | 3,053,570 |
CRG Partners III – Parallel Fund (A), LP1,2,4 | | Private Credit Secondary | | | 3,509,669 |
PGC U.S. Middle Market Direct Lending Offshore Fund I, LP1,2 | | Private Credit Secondary | | | 7,184,633 |
| | | | | | 32,568,523 |
| | | | | | |
Equity — 9.4% | | | | | |
Adams Street 2009 Direct Fund, LP1,2,4 | | Private Equity Secondary | | | 22,778 |
Adams Street 2010 Direct Fund, LP1,2,4 | | Private Equity Secondary | | | 27,988 |
Adams Street 2011 Direct Fund, LP1,2,4 | | Private Equity Secondary | | | 38,817 |
Adams Street 2011 Non-U.S. Developed Markets Fund, LP1,2,4 | | Private Equity Secondary | | | 130,617 |
Adams Street 2011 U.S. Fund, LP1,2,4 | | Private Equity Secondary | | | 255,722 |
Adams Street 2013 Global Fund, LP1,2,4 | | Private Equity Secondary | | | 1,677,941 |
Adams Street 2014 Global Fund, LP1,2,4 | | Private Equity Secondary | | | 955,926 |
Adams Street Partnership Fund 2009 Non-U.S. Developed Markets Fund, LP1,2,4 | | Private Equity Secondary | | | 105,897 |
Adams Street Partnership Fund 2009 U.S. Fund, LP1,2,4 | | Private Equity Secondary | | | 222,875 |
Adams Street Partnership Fund 2010 Non-U.S. Developed Markets Fund, LP1,2,4 | | Private Equity Secondary | | | 100,674 |
Adams Street Partnership Fund 2010 U.S. Fund, LP1,2,4 | | Private Equity Secondary | | | 238,843 |
Altor Fund IV (No. 1) AB1,2,4 | | Private Equity Secondary | | | 5,834,923 |
ASP (Feeder) 2017 Global Fund, LP1,2,4 | | Private Equity Secondary | | | 1,143,285 |
Coller International Partners VI Feeder Fund, LP – Class A1,2,4 | | Private Equity Secondary | | | 661,367 |
Coller International Partners VII Feeder Fund, LP – Series B1,2,4 | | Private Equity Secondary | | | 1,612,973 |
Forrest Holdings I, LP – Class A1,2,4 | | Private Equity Secondary | | | 1,065 |
Forrest Holdings I, LP – Class B1,2,4 | | Private Equity Secondary | | | 14,897 |
Global Infrastructure Partners II-C, LP1,2,4 | | Private Equity Secondary | | | 1,116,189 |
Graphite Capital Partners VIII D, LP1,3,4 | | Private Equity Secondary | | | 5,156,378 |
ICG Ludgate Hill IV-A Leopard, LP1,2,4 | | Private Equity Secondary | | | 5,451,728 |
See accompanying Notes to Financial Statements.
8
Bow River Capital Evergreen Fund |
SCHEDULE OF INVESTMENTS (CONTINUED)
MARCH 31, 2024 |
| | Investment Strategy | | Value |
Private Investments — 81.6% (continued) | | | | | |
Secondary Funds — 16.0% (continued) | | | | | |
Equity — 9.4% (continued) | | | | | |
KH Aggregator, LP1,2,4 | | Private Equity Secondary | | $ | 4,343,138 |
Onex Fund V, LP1,2,4 | | Private Equity Secondary | | | 7,984,594 |
Overbay Fund XIV (AIV III), LP1,2,4 | | Private Equity Secondary | | | 1,555,878 |
Overbay Fund XIV Offshore (AIV), LP1,2,4,5 | | Private Equity Secondary | | | 2,908,427 |
Porcupine Holdings, LP – Class A1,2,4 | | Private Equity Secondary | | | 2,820,894 |
Porcupine Holdings, LP – Class B1,2,4 | | Private Equity Secondary | | | 1,958,855 |
| | | | | | 46,342,669 |
Total Secondary Funds (Cost $51,703,866) | | | | | 78,911,192 |
| | | | | | |
Total Private Investments (Cost $295,156,362) | | | | | 401,437,520 |
| | | | | | |
U.S. Treasury Bills — 9.1% | | | | | |
United States Treasury Bill, 0.00%, 5/30/2024, principal $30,750,000 | | | | | 29,999,489 |
United States Treasury Bill, 5.23% OID, 5/23/2024, principal $15,200,000 | | | | | 14,999,174 |
Total U.S. Treasury Bills (Cost $44,998,663) | | | | | 44,998,663 |
| | | | | | |
Short-Term Investments — 7.0% | | | | | |
Goldman Sachs Financial Square Government Fund – Institutional Class, 5.13%, shares 36,1526 | | | | | 36,152 |
UMB Money Market Fiduciary, 0.01%, shares 15,064,8016,7 | | | | | 15,064,801 |
UMB Money Market Special, 5.18%, shares 19,187,3666,7 | | | | | 19,187,366 |
Total Short-Term Investments (Cost $34,288,319) | | | | | 34,288,319 |
| | | | | | |
Total Investments (Cost $374,443,344) — 97.7% | | | | $ | 480,724,502 |
Other assets in excess of liabilities — 2.3% | | | | | 11,519,106 |
Net Assets — 100% | | | | $ | 492,243,608 |
CSA — Credit Spread Adjustment
1 Restricted security. The total value of these securities is $401,437,520, which represents 81.6% of total net assets of the Fund. Please refer to Note 7 in the Notes to the Financial Statements.
2 Investment is valued using the Fund’s pro rata net asset value (or its equivalent) as a practical expedient. Please refer to Note 3 in the Notes to the Financial Statements for respective investment strategies, unfunded commitments, and redemptive restrictions.
3 Level 3 securities fair valued using significant unobservable inputs. The total value of these securities is $77,605,844, which represents 15.8% of total net assets of the Fund.
4 Non-income producing.
See accompanying Notes to Financial Statements.
9
Bow River Capital Evergreen Fund |
SCHEDULE OF INVESTMENTS (CONTINUED)
MARCH 31, 2024 |
5 Affiliated investment for which ownership exceeds 5% of the investment’s capital. Please refer to Note 6 in the Notes to the Financial Statements.
6 Rate disclosed represents the seven day yield as of the Fund’s period end.
7 The account is an interest-bearing money market deposit account maintained by UMB Bank, n.a. in its capacity as a custodian for various participating custody accounts. The Fund may redeem its investments in whole, or in part, on each business day.
See accompanying Notes to Financial Statements.
10
Bow River Capital Evergreen Fund |
Summary OF INVESTMENTS
MARCH 31, 2024 |
Security Type/Geographic Region | | Percent of
Total
Net Assets |
Private Investments | | | |
North America | | 65.8 | % |
Global | | 10.4 | % |
Europe | | 5.4 | % |
Total Private Investments | | 81.6 | % |
U.S. Treasury Bills | | 9.1 | % |
Short-Term Investments | | 7.0 | % |
Total Investments | | 97.7 | % |
Other assets in excess of liabilities | | 2.3 | % |
Net Assets | | 100.0 | % |
See accompanying Notes to Financial Statements.
11
Bow River Capital Evergreen Fund |
STATEMENT OF ASSETS AND LIABILITIES
MARCH 31, 2024 |
Assets: | | | |
Unaffiliated investments, at fair value (cost $282,046,894) | | $ | 377,965,521 |
Short-term investments, at fair value (cost $79,286,982) | | | 79,286,982 |
Affiliated investments, at fair value (cost $13,109,468) | | | 23,471,999 |
Cash | | | 37,514,169 |
Interest receivable | | | 1,013,237 |
Distributions receivable | | | 486,808 |
Prepaid expenses | | | 160,302 |
Investment proceeds receivable | | | 23,527 |
Total Assets | | | 519,922,545 |
| | | | |
Liabilities: | | | |
Payables | | | |
Shareholder subscriptions received in advance | | | 15,064,801 |
Shareholder redemptions | | | 11,485,844 |
Investment management fee | | | 733,721 |
Professional fees | | | 347,974 |
Other accrued liabilities | | | 36,407 |
Distribution and service fees | | | 6,778 |
Accounting and administration fees | | | 3,412 |
Total Liabilities | | | 27,678,937 |
Commitments and contingencies (Note 9) | | | |
| | | | |
Net Assets | | $ | 492,243,608 |
| | | | |
Composition of Net Assets: | | | |
Paid-in capital | | $ | 400,839,894 |
Total distributable earnings | | | 91,403,714 |
Net Assets | | $ | 492,243,608 |
| | | | |
Net Assets Attributable to: | | | |
Class I Shares | | $ | 462,506,031 |
Class II Shares | | | 29,737,577 |
| | | $ | 492,243,608 |
| | | | |
Shares of Beneficial Interest Outstanding (Unlimited Number of Shares
Authorized, 100,000 shares registered; par value of $0.001): | | | |
Class I Shares | | | 10,327,322 |
Class II Shares | | | 667,750 |
| | | | 10,995,072 |
| | | | |
Net Asset Value per Share1: | | | |
Class I Shares | | $ | 44.78 |
Class II Shares | | | 44.53 |
See accompanying Notes to Financial Statements.
12
Bow River Capital Evergreen Fund |
STATEMENT OF OPERATIONS
FOR THE YEAR ENDED MARCH 31, 2024 |
Investment Income: | | | | |
Interest income from unaffiliated investments | | $ | 7,547,064 | |
Total Investment Income | | | 7,547,064 | |
| | | | | |
Expenses: | | | | |
Investment management fee (Note 5) | | | 7,273,687 | |
Accounting and administration fees | | | 286,262 | |
Audit and tax fees | | | 230,001 | |
Other fees | | | 207,720 | |
Legal fees | | | 205,000 | |
Transfer agent fees | | | 135,000 | |
Trustee fees (Note 5) | | | 125,000 | |
Chief Compliance Officer and Chief Financial Officer fees (Note 5) | | | 110,038 | |
Pricing fees | | | 108,000 | |
Interest expense | | | 85,502 | |
Distribution and Service fees (Class II) | | | 67,244 | |
Custody fees | | | 55,000 | |
Total Expenses Before Recoupment | | | 8,888,454 | |
Fund Expenses Recouped by the Adviser (Note 5) | | | 386,581 | |
Gross Expenses | | | 9,275,035 | |
Net Investment Loss | | | (1,727,971 | ) |
| | | | | |
Net Realized and Unrealized Gain (Loss): | | | | |
Net realized gain (loss) on: | | | | |
Unaffiliated investments | | | 7,577,338 | |
Affiliated investments | | | 968,761 | |
Foreign currency transactions | | | (14,728 | ) |
Forward foreign currency contracts | | | (73,050 | ) |
Total net realized gain | | | 8,458,321 | |
Net change in unrealized appreciation (depreciation) on: | | | | |
Unaffiliated investments | | | 40,101,916 | |
Affiliated investments | | | 4,731,246 | |
Forward foreign currency contracts | | | (12,520 | ) |
Total net change in unrealized appreciation | | | 44,820,642 | |
| | | | | |
Net Realized and Unrealized Gain | | | 53,278,963 | |
| | | | | |
Net Increase in Net Assets from Operations | | $ | 51,550,992 | |
See accompanying Notes to Financial Statements.
13
Bow River Capital Evergreen Fund |
STATEMENTS OF CHANGES IN NET ASSETS
|
| | For the
year ended
March 31,
2024 | | For the
year ended
March 31,
2023 |
Net Increase in Net Assets from: | | | | | | | | |
Operations: | | | | | | | | |
Net investment loss | | $ | (1,727,971 | ) | | $ | (3,743,856 | ) |
Net realized gain | | | 8,458,321 | | | | 2,584,748 | |
Net change in unrealized appreciation | | | 44,820,642 | | | | 11,903,979 | |
Net Increase in Net Assets Resulting from Operations | | | 51,550,992 | | | | 10,744,871 | |
| | | | | | | | | |
Distributions to Shareholders: | | | | | | | | |
Distributions: | | | | | | | | |
Class I | | | (6,688,367 | ) | | | (7,818,326 | ) |
Class II | | | (453,008 | ) | | | (647,048 | ) |
Decrease in Net Assets from Distributions to Shareholders | | | (7,141,375 | ) | | | (8,465,374 | ) |
| | | | | | | | | |
Capital Transactions: | | | | | | | | |
Proceeds from shares sold: | | | | | | | | |
Class I | | | 121,554,391 | | | | 101,446,819 | |
Class II | | | 8,585,645 | | | | 18,222,387 | |
Reinvestment of distributions: | | | | | | | | |
Class I | | | 4,096,717 | | | | 6,076,353 | |
Class II | | | 193,368 | | | | 207,174 | |
Cost of shares repurchased: | | | | | | | | |
Class I1 | | | (20,141,902 | ) | | | (9,170,783 | ) |
Class II2 | | | (6,074,160 | ) | | | (728,873 | ) |
Net Increase in Net Assets from Capital Transactions | | | 108,214,059 | | | | 116,053,077 | |
| | | | | | | | | |
Total Net Increase in Net Assets | | | 152,623,676 | | | | 118,332,574 | |
| | | | | | | | | |
Net Assets | | | | | | | | |
Beginning of period | | | 339,619,932 | | | | 221,287,358 | |
End of period | | $ | 492,243,608 | | | $ | 339,619,932 | |
| | | | | | | | | |
Capital Share Transactions: | | | | | | | | |
Shares sold: | | | | | | | | |
Class I | | | 2,882,350 | | | | 2,551,057 | |
Class II | | | 200,139 | | | | 457,545 | |
Shares issued in reinvestment of distributions: | | | | | | | | |
Class I | | | 94,462 | | | | 154,273 | |
Class II | | | 4,481 | | | | 5,273 | |
Shares redeemed: | | | | | | | | |
Class I | | | (466,871 | ) | | | (229,544 | ) |
Class II | | | (140,830 | ) | | | (18,277 | ) |
Net Increase in Capital Shares Outstanding | | | 2,573,731 | | | | 2,920,327 | |
See accompanying Notes to Financial Statements.
14
Bow River Capital Evergreen Fund |
STATEMENT OF CASH FLOWS
FOR THE YEAR ENDED MARCH 31, 2024 |
Cash Flows from Operating Activities | | | | |
Net increase in net assets from operations | | $ | 51,550,992 | |
Adjustments to reconcile net increase in net assets from operations to net cash used in operating activities: | | | | |
Net realized gain from investments | | | (8,546,099 | ) |
Net realized loss from foreign currency transactions | | | 14,728 | |
Net realized loss from foreign currency contracts | | | 73,050 | |
Net change in unrealized appreciation from investments | | | (44,833,162 | ) |
Net change in unrealized depreciation from foreign currency contracts | | | 12,520 | |
Purchases of investments | | | (129,806,931 | ) |
Sales of investments | | | 50,084,618 | |
Sales of short term investments, net | | | 5,685,243 | |
(Increase)/Decrease in Assets: | | | | |
Interest receivable | | | (698,153 | ) |
Distributions receivable | | | (486,808 | ) |
Prepaid expenses | | | (45,963 | ) |
Unrealized appreciation on forward foreign currency contracts | | | 12,520 | |
Increase/(Decrease) in Liabilities: | | | | |
Net investment management fee and expense recoupment | | | 207,009 | |
Distribution and service fees | | | 1,617 | |
Professional fees | | | 99,246 | |
Accounting and administration fees | | | (30,106 | ) |
Other accrued liabilities | | | 36,407 | |
Net Cash Used in Operating Activities | | | (76,669,272 | ) |
| | | | | |
Cash Flows from Financing Activities | | | | |
Proceeds from shares sold | | | 135,648,770 | |
Distributions paid to shareholders, net of reinvestments | | | (2,851,290 | ) |
Payments for shares repurchased, net of repurchase fees | | | (18,549,330 | ) |
Net Cash Provided by Financing Activities | | | 114,248,150 | |
| | | | | |
Effects of foreign currency exchange rate changes in cash | | | (100,298 | ) |
| | | | | |
Net increase in cash | | | 37,478,580 | |
| | | | | |
Cash at beginning of period | | | 35,589 | |
Cash denominated in foreign currencies at beginning of period | | | — | |
Total cash and cash equivalents at beginning of period | | | 35,589 | |
| | | | | |
Cash at end of period | | | 37,514,169 | |
Cash denominated in foreign currencies at end of period | | | — | |
Total cash at end of period | | $ | 37,514,169 | |
| | | | | |
Supplemental disclosure of non-cash activity | | | | |
Reinvestment of distributions from underlying investments | | $ | 509,212 | |
Reinvestment of distributions to shareholders | | | 4,290,085 | |
See accompanying Notes to Financial Statements.
15
Bow River Capital Evergreen Fund |
FINANCIAL HIGHLIGHTS
CLASS I SHARES |
Per share operating performance.
For a capital share outstanding throughout each period.
| | For the
year ended
March 31,
20241 | | For the
year ended
March 31,
20231 | | For the
year ended
March 31,
20221 | | For the
period ended
March 31,
20211,2 |
Net Asset Value, beginning of period | | $ | 40.34 | | | $ | 40.23 | | | $ | 33.42 | | | $ | 30.86 | |
Income from Investment Operations: | | | | | | | | | | | | | | | | |
Net investment loss3 | | | (0.17 | ) | | | (0.52 | ) | | | (0.63 | ) | | | (0.13 | ) |
Net realized and unrealized gain on investments | | | 5.31 | | | | 1.76 | | | | 7.71 | | | | 2.69 | |
Total from investment operations | | | 5.14 | | | | 1.24 | | | | 7.08 | | | | 2.56 | |
| | | | | | | | | | | | | | | | | |
Distributions to investors: | | | | | | | | | | | | | | | | |
From net realized gain | | | (0.70 | ) | | | (1.14 | ) | | | (0.27 | ) | | | — | |
Total distributions to investors | | | (0.70 | ) | | | (1.14 | ) | | | (0.27 | ) | | | — | |
Redemption Fees3: | | | 0.004 | | | | 0.01 | | | | — | | | | — | |
Net Asset Value, end of period | | $ | 44.78 | | | $ | 40.34 | | | $ | 40.23 | | | $ | 33.42 | |
| | | | | | | | | | | | | | | | | |
Total Return5 | | | 12.77 | % | | | 3.17 | % | | | 21.23 | % | | | 8.30 | %6 |
| | | | | | | | | | | | | | | | | |
Ratios and Supplemental Data: | | | | | | | | | | | | | | | | |
Net Assets, end of period (in thousands) | | $ | 462,506 | | | $ | 315,333 | | | $ | 214,878 | | | $ | 95,904 | |
| | | | | | | | | | | | | | | | | |
Net investment loss7 | | | (0.40 | )% | | | (1.31 | )% | | | (1.73 | )% | | | (1.71 | )%8 |
| | | | | | | | | | | | | | | | | |
Gross expenses inclusive of interest expense7,9 | | | 2.13 | % | | | 2.20 | % | | | 2.42 | % | | | 3.06 | %10 |
Net expenses inclusive of interest expense7,11 | | | 2.22 | % | | | 2.27 | % | | | 2.26 | % | | | 2.25 | %8 |
| | | | | | | | | | | | | | | | | |
Gross expenses exclusive of interest expense7,9 | | | 2.11 | % | | | 2.18 | % | | | 2.41 | % | | | 3.06 | %10 |
Net expenses exclusive of interest expense7,11 | | | 2.20 | % | | | 2.25 | % | | | 2.25 | % | | | 2.25 | %8 |
| | | | | | | | | | | | | | | | | |
Portfolio Turnover Rate | | | 15 | % | | | 13 | % | | | 19 | % | | | 21 | %6 |
| | | | | | | | | | | | | | | | | |
Borrowings – Revolving Credit Facility | | $ | — | | | $ | — | | | $ | — | | | $ | — | |
Assets Coverage per $1,000 of Borrowings12 | | | — | | | | — | | | | — | | | | — | |
Revolving Credit Facility | | | Not Applicable | | | | Not Applicable | | | | Not Applicable | | | | Not Applicable | |
See accompanying Notes to Financial Statements.
16
Bow River Capital Evergreen Fund |
FINANCIAL HIGHLIGHTS
CLASS II SHARES |
Per share operating performance.
For a capital share outstanding throughout each period.
| | For the
year ended
March 31,
20241 | | For the
year ended
March 31,
20231 | | For the
period ended
March 31,
20221,2 |
Net Asset Value, beginning of period | | $ | 40.21 | | | $ | 40.20 | | | $ | 38.33 | |
Income from Investment Operations: | | | | | | | | | | | | |
Net investment loss3 | | | (0.27 | ) | | | (0.62 | ) | | | (0.14 | ) |
Net realized and unrealized gain on investments | | | 5.29 | | | | 1.76 | | | | 2.01 | |
Total from investment operations | | | 5.02 | | | | 1.14 | | | | 1.87 | |
| | | | | | | | | | | | | |
Distributions to investors: | | | | | | | | | | | | |
From net realized gain | | | (0.70 | ) | | | (1.14 | ) | | | — | |
Total distributions to investors | | | (0.70 | ) | | | (1.14 | ) | | | — | |
Redemption Fees3: | | | 0.004 | | | | 0.01 | | | | — | |
Net Asset Value, end of period | | $ | 44.53 | | | $ | 40.21 | | | $ | 40.20 | |
| | | | | | | | | | | | | |
Total Return5 | | | 12.51 | % | | | 2.92 | % | | | 4.88 | %6 |
| | | | | | | | | | | | | |
Ratios and Supplemental Data: | | | | | | | | | | | | |
Net Assets, end of period (in thousands) | | $ | 29,737 | | | $ | 24,287 | | | $ | 6,409 | |
| | | | | | | | | | | | | |
Net investment loss7,8 | | | (0.65 | )% | | | (1.56 | )% | | | (1.71 | )% |
| | | | | | | | | | | | | |
Gross expenses inclusive of interest expense7,9 | | | 2.38 | % | | | 2.45 | % | | | 2.67 | %8 |
Net expenses inclusive of interest expense7,10 | | | 2.47 | % | | | 2.52 | % | | | 2.51 | %8 |
| | | | | | | | | | | | | |
Gross expenses exclusive of interest expense7,9 | | | 2.36 | % | | | 2.43 | % | | | 2.66 | %8 |
Net expenses exclusive of interest expense7,10 | | | 2.45 | % | | | 2.50 | % | | | 2.50 | %8 |
| | | | | | | | | | | | | |
Portfolio Turnover Rate | | | 15 | % | | | 13 | % | | | 19 | %11 |
| | | | | | | | | | | | | |
Borrowings – Revolving Credit Facility | | $ | — | | | $ | — | | | $ | — | |
Assets Coverage per $1,000 of Borrowings12 | | | — | | | | — | | | | — | |
Revolving Credit Facility | | | Not Applicable | | | | Not Applicable | | | | Not Applicable | |
See accompanying Notes to Financial Statements.
17
Bow River Capital Evergreen Fund |
NOTES TO THE FINANCIAL STATEMENTS
MARCH 31, 2024 |
1. Organization
Bow River Capital Evergreen Fund (the “Fund”) was organized as a Delaware statutory trust on April 21, 2020 and commenced operations on January 1, 2021 following the reorganization of the Bow River Capital Evergreen Private Equity Fund, LP (the “Predecessor Fund”) with and into Class I shares of the Fund, which was effective as of the close of business on December 31, 2020. The Fund currently offers two classes of shares: Class I Shares and Class II Shares (“Shares”). Class II Shares commenced operations on January 3, 2022. The Fund is a diversified, closed-end management investment company that operates as an interval fund pursuant to Rule 23c-3 of the Investment Company Act of 1940 (the “1940 Act”), as amended. During the fiscal year ended March 31, 2024, the Fund’s diversification status under the 1940 Act automatically converted from non-diversified to diversified status because the Fund operated as a diversified fund for a period of three years. The Fund is available to “accredited investors” within the meaning of Rule 501 under the Security Act of 1933, as amended.
The Fund’s investment objective is to generate long-term capital appreciation by investing in a broad portfolio of private equity investments that provide attractive risk-adjusted return potential. The Fund will seek to achieve its investment objective through broad exposure to private equity, private credit, and semi-liquid or listed investments, that may include: (i) direct investments; (ii) secondary investments; (iii) private credit instruments; (iv) primary fund commitments; (v) direct or secondary purchases of liquid credit instruments; (vi) other liquid investments; and (vii) short-term investments.
Bow River Advisers, LLC, an investment adviser under the Investment Advisers Act of 1940 (the “Advisers Act”), as amended, serves as the Fund’s investment adviser (the “Adviser”). Bow River Asset Management, LLC owns a majority, controlling interest in the Adviser and effective December 29, 2023, New York Life Investment Management Holdings LLC owns a minority but controlling (as defined by the 1940 Act) stake in the Adviser. Aksia CA LLC, an investment adviser registered under the Advisers Act, serves as a non-discretionary investment consultant to the Adviser with respect to the Fund. The Fund’s Board of Trustees (the “Board”) has the overall responsibility for the management and supervision of the business operations of the Fund. The Board may delegate any of its rights, powers, and authority to, among others, the officers of the Fund, any committee of the Board, or the Adviser.
2. Significant Accounting Policies
Basis of Presentation and Use of Estimates — The Fund is an investment company and as a result, maintains its accounting records and has presented these financial statements in accordance with the reporting requirements under Financial Accounting Standards Board (“FASB”) Accounting Standards Codification (“ASC”) Topic 946, Financial Services — Investment Companies (“ASC 946”). The presentation of the financial statements are in conformity with generally accepted accounting principles in the United States of America (“GAAP”), which requires management to make estimates and assumptions that affect the reported amounts of assets and liabilities and disclosure of contingent assets and liabilities at the date of the financial statement, as well as reported amounts of increases and decreases in net assets from operations during the reporting period. Actual results could differ from these estimates.
Income Recognition and Expenses — Interest income is recognized on an accrual basis as earned. Dividend income is recorded on the ex-dividend date. Distributions received from investments in securities and private funds that represent a return of capital or capital gains are recorded as a reduction of cost of investment or as a realized gain, respectively. Expenses are recognized on an accrual basis as incurred. The Fund bears all expenses incurred in the course of its operations, including, but not limited to, the following: all costs and expenses related to portfolio transactions and positions for the Fund’s account; professional fees; costs of insurance; registration expenses; and expenses of meetings of the Board. Expenses are subject to the Fund’s Expense Limitation Agreement (see Note 5).
Investment Transactions — Investment transactions are accounted for on a trade date basis. Cost is determined and gains and losses are based upon the identified cost basis for publicly traded investments and average cost for the Fund’s private investments for both financial statement and federal income tax purposes.
Distributions to Shareholders — Distributions to shareholders arising from net investment income and net realized capital gains, if any, are declared and paid annually. The amount of distributions from net investment income and net realized capital gains are determined in accordance with federal income tax regulations, which may differ from GAAP. Distributions to shareholders are recorded on the ex-dividend date.
Valuation — The Fund will calculate its net asset value (“NAV”) as of the close of regular trading on the New York Stock Exchange on the last business day of each calendar week, each business day for the five business days preceding a repurchase request deadline (at such specific time set by the Board), each date that a Share is offered or repurchased, as of the date of any distribution and at such other
18
Bow River Capital Evergreen Fund |
NOTES TO THE FINANCIAL STATEMENTS (CONTINUED)
MARCH 31, 2024 |
times as the Board shall determine (each, a “Determination Date”). In determining its NAV, the Fund will value its investments as of the relevant Determination Date. The NAV of the Fund will equal, unless otherwise noted, the value of the total assets of the Fund, less all liabilities, including accrued fees and expenses, each determined as of the relevant Determination Date.
The Board has approved valuation procedures (“Valuation Procedures”) for the Fund and has approved the delegation of the day-to-day work of determining fair values and pricing responsibility for the Fund to the Adviser (“Valuation Designee”), subject to the oversight of the Board. The valuation of the Fund’s investments is performed in accordance with FASB’s ASC Topic 820 — Fair Value Measurements and Disclosures.
Securities that are publicly traded on a U.S. national securities exchange or any foreign stock exchange and for which a quoted market exists will be valued at the closing price of such securities based on their respective market. The money market demand accounts are priced at cost and are generally classified as Level 1 investments.
Debt instruments for which market quotations are readily available are typically valued based on such market quotations. In validating market quotations, the Valuation Designee considers different factors such as the source and the nature of the quotation in order to determine whether the quotation represents fair value. The Valuation Designee makes use of reputable financial information providers in order to obtain the relevant quotations.
For debt and equity securities which are not publicly traded or for which market prices are not readily available (unquoted investments) the fair value is determined in good faith by the Valuation Designee. In determining the fair values of these investments, the Valuation Designee will typically apply widely recognized valuation methodologies including, but not limited to, income approach, market approach, cost approach, discounted cash flow methods and third-party valuations. In order to determine a fair value, these methods are applied to the latest information as of the Determination Date provided by the underlying portfolio companies or other business counterparties, to the extent that such information is available and deemed reliable.
Due to the inherent uncertainty in determining the fair value of investments for which market values are not readily available the fair values of these investments may fluctuate from period to period. In addition, such fair value may differ materially from the values that may have been used had a ready market existed for such investments and may significantly differ from the value ultimately realized by the Fund.
Assets and liabilities initially expressed in foreign currencies will be converted into U.S. Dollars using foreign exchange rates provided by a recognized pricing service.
Primary and Secondary Fund Investments
Primary investments are commitments to new private equity, private credit, or other private funds. Secondary investments are purchases of existing interests that are acquired on the secondary market. Primary or secondary investments in private funds are generally valued based on the latest NAV reported by the third-party fund manager or General Partner. This is commonly referred to as using NAV as a practical expedient which allows for estimation of the fair value of an investment in a private fund based on NAV or its equivalent if the NAV of the private fund is calculated in a manner consistent with ASC 946. Because of the inherent uncertainty of valuations of the investments in private funds, their estimated values may differ significantly from the values that would have been used had a ready market for the private funds existed, and the differences could be material. New purchases of primary or secondary investments in private funds will be valued at acquisition cost initially until a NAV is provided by the third-party fund manager or General Partner. The Fund will review any cash flows since the reference date of the last NAV for a private fund received by the Fund from a third-party manager (“Portfolio Fund Manager”) until the Determination Date are recognized by (i) adding the nominal amount of the investment related capital calls and (ii) deducting the nominal amount of investment related distributions from the NAV as reported by the Portfolio Fund Manager.
In addition to tracking the NAV plus related cash flows of such secondary purchases of interests in closed-end private funds (“Portfolio Funds”), the Valuation Designee may also track relevant broad-based and issuer (or fund) specific valuation information relating to the assets held by each private fund which is reasonably available at the time the Fund values its investments. Portfolio Funds’ Managers only provide determinations of the net asset values of the Portfolio Funds on a monthly or quarterly basis, in which event it will not be possible to determine the net asset value of the Fund more frequently. The Valuation Designee will consider such information and may conclude in certain circumstances that the information provided by the Portfolio Fund Manager does not represent the fair value of a particular asset held by a Portfolio Fund. If the Valuation Designee concludes in good faith that the latest NAV reported by a Portfolio Fund Manager does not represent fair value (e.g., there is more current information regarding a portfolio asset which significantly changes its fair value) the Valuation Designee will make a corresponding adjustment to reflect the current fair value of such asset within such Portfolio Fund. In determining the fair value of assets held by Portfolio Funds, the Valuation Designee applies valuation methodologies as outlined above.
19
Bow River Capital Evergreen Fund |
NOTES TO THE FINANCIAL STATEMENTS (CONTINUED)
MARCH 31, 2024 |
Direct Investments
Direct investments are minority investments in a company made by investors alongside a private equity fund manager or venture capital firm. Direct investments in private equity funds may be valued based on the latest NAV reported by the third-party fund manager or General Partner. In assessing the fair value of the Fund’s direct investments in accordance with the Valuation Procedures, the Adviser uses a variety of methods such as earnings and multiple analysis, discounted cash flow and market data from third party pricing services and makes assumptions that are based on market conditions existing at the end of each reporting period. Because of the inherent uncertainty of estimates, fair value determinations based on estimates may differ from the values that would have been used had a ready market for the securities existed, and the differences could be material.
Foreign Currency Exchange Contracts — The Fund may enter into foreign currency exchange contracts. The Fund may enter into these contracts for the purchase or sale of a specific foreign currency at a fixed price on a future date to hedge various investments, for risk management (i.e. hedging purposes). All foreign currency exchange contracts are market-to-market at the applicable translation rates resulting in unrealized gains or losses. Realized gains or losses are recorded at the time the foreign currency exchange contract is offset by entering into a closing transaction, or by the delivery, or receipt, of the currency. Risk may arise upon entering into these contracts from the potential inability of counterparties to meet the terms of their contracts and from unanticipated movements in the value of a foreign currency relative to the U.S. dollar.
Federal Income Taxes — The Fund intends to continue to qualify as a “regulated investment company” under Subchapter M of the Internal Revenue Code of 1986, as amended. The Fund utilizes a tax-year end of September 30 and the Fund’s income and federal excise tax returns and all financial records supporting the prior year returns are subject to examination by the federal and Delaware revenue authorities. If so qualified, the Fund will not be subject to federal income tax to the extent it distributes substantially all of its net investment income and capital gains to shareholders. Therefore, no federal income tax provision is required. Management of the Fund is required to determine whether a tax position taken by the Fund is more likely than not to be sustained upon examination by the applicable taxing authority, based on the technical merits of the position. Based on its analysis, there were no tax positions identified by management of the Fund which did not meet the “more likely than not” standard as of September 30, 2023. The Fund’s policy is to classify any interest or penalties associated with underpayment of federal and state income taxes as an income tax expense on the Statement of Operations.
Shareholder Subscriptions — Shareholder subscriptions received in advance are comprised of cash received on or prior to March 31, 2024 for which shares are issued on April 1, 2024. Shareholder subscriptions received in advance do not participate in the earnings of the Fund until shares are issued.
3. Fair Value Disclosures
GAAP defines fair value, establishes a three-tier framework for measuring fair value based on a hierarchy of inputs, and expands disclosure about fair value measurements. It also provides guidance on determining when there has been a significant decrease in the volume and level of activity for an asset or liability, when a transaction is not orderly and how that information must be incorporated into a fair value measurement. The hierarchy distinguishes between market data obtained from independent sources (observable inputs) and the Fund’s own market assumptions (unobservable inputs). These inputs are used in determining the fair value of the Fund’s investments. These inputs are summarized in the three broad levels listed below:
• Level 1 — unadjusted quoted prices in active markets for identical securities. An active market for the security is a market in which transactions occur with sufficient frequency and volume to provide pricing information on an ongoing basis. A quoted price in an active market provides the most reliable evidence of fair value.
• Level 2 — other significant observable inputs (including quoted prices for similar securities, interest rates, prepayment speeds, credit risk, etc. and quoted prices for identical or similar assets in markets that are not active.) Inputs that are derived principally from or corroborated by observable market data. An adjustment to any observable input that is significant to the fair value may render the measurement a Level 3 measurement.
• Level 3 — significant unobservable inputs, including inputs that are not derived from market data or cannot be corroborated by market data and when the investment is not redeemable in the near term.
20
Bow River Capital Evergreen Fund |
NOTES TO THE FINANCIAL STATEMENTS (CONTINUED)
MARCH 31, 2024 |
Private investments that are reported on the Fund’s schedule of investments as being measured at fair value using the Fund’s pro rata NAV (or its equivalent) without further adjustment, as a practical expedient of fair value and therefore these investments are excluded from the fair value hierarchy. Generally, the fair value of the Fund’s investment in a private investment represents the amount that the Fund could reasonably expect to receive from the investment fund if the Fund’s investment is withdrawn at the measurement date based on NAV.
The inputs used to measure fair value may fall into different levels of the fair value hierarchy. In such cases, for disclosure purposes, the level in the fair value hierarchy within which the fair value measurement falls in its entirety is determined based on the lowest level input that is significant to the fair value measurement in its entirety.
The inputs or methodology used for valuing securities are not necessarily an indication of the risk associated with investing in those securities. The following is a summary of the valuation inputs used to value the Fund’s assets and liabilities as of March 31, 2024:
| | | | Fair Value Measurements at the
End of the Reporting Period Using | | |
Investments | | Practical
Expedient* | | Level 1
Quoted Prices | | Level 2
Other Significant
Observable
Inputs | | Level 3
Significant
Unobservable
Inputs | | Total |
Security Type | | | | | | | | | | | | | | | |
Private Investments** | | $ | 321,830,979 | | $ | — | | $ | 2,000,697 | | $ | 77,605,844 | | $ | 401,437,520 |
U.S. Treasury Bills | | | — | | | — | | | 44,998,663 | | | — | | | 44,998,663 |
Short-Term Investments | | | — | | | 34,288,319 | | | — | | | — | | | 34,288,319 |
Total | | $ | 321,830,979 | | $ | 34,288,319 | | $ | 46,999,360 | | $ | 77,605,844 | | $ | 480,724,502 |
The following is a roll-forward of the activity in investments in which significant unobservable inputs (Level 3) were used in determining fair value on a recurring basis:
| | Beginning
balance
April 1, 2023 | | Transfers
into Level 3
during the
period | | Transfers
out of
Level 3
during the
period | | Purchases or
Contributions | | Sales or
Distributions | | Net realized
gain | | Change in net
unrealized
appreciation | | Ending
balance
March 31,
2024 |
Private Investments | | $ | 50,031,407 | | $ | — | | $ | (7,735,009) | | $ | 40,725,035 | | $ | (14,039,254) | | $ | 1,898,457 | | $ | 6,725,208 | | $ | 77,605,844 |
The change in net unrealized appreciation (depreciation) included in the Statement of Operations attributable to Level 3 investments that were held as of March 31, 2024 is $6,466,273.
Transfers out of Level 3 during the period represent investments that are being measured at fair value using the Fund’s pro rata NAV (or its equivalent) as a practical expedient and/or being valued using observable market data which was not available in the prior year.
21
Bow River Capital Evergreen Fund |
NOTES TO THE FINANCIAL STATEMENTS (CONTINUED)
MARCH 31, 2024 |
The following is a summary of quantitative information about significant unobservable valuation inputs for Level 3 Fair Value Measurements for investments held as of March 31, 2024:
Level 3 Investments | | Fair Value
as of
March 31,
2024 | | Valuation
Technique | | Unobservable Inputs | | Range of Inputs/Discount
Rate/Price/Simple Average | | Impact to Valuation
from an Increase in
Input |
Private Credit Direct Investments | | | | | | | | | | | | |
Pathstone Family Office, LLC | | $ | 2,349,359 | | Income approach | | Discount rate | | | 10.57% – 11.57%/11.07% | | Decrease |
Polaris Newco | | $ | 2,077,416 | | Income approach | | Discount rate | | | 13.07% – 13.82%/13.45% | | Decrease |
US Hospitality Publishers, Inc. | | $ | 2,518,551 | | Income approach | | Discount rate | | | 11.77% – 12.77%/12.27% | | Decrease |
| | | | | | | | | | | | | |
Private Equity Direct Investments | | | | | | | | | | | | |
BW Phoenix Co-Invest, LP | | $ | 7,000,000 | | Market approach | | Transaction Price | | | Not Applicable | | Increase |
DSG Group Holdings, LP | | $ | 7,779,653 | | Market approach | | Adjusted EBITDA multiple | | | 11.00x | | Increase |
IvyRehab Holdings, LLC | | $ | 8,566,477 | | Market approach | | General Partner Net Asset Value | | | Not Applicable | | Increase |
OceanSound SMX Continuation Fund, LP* | | $ | 6,451,445 | | Market Approach | | General Partner Net Asset Value | | | Not Applicable | | Increase |
| | | | | | Market Approach | | Transaction Price | | | Not Applicable | | Increase |
| | | | | | Income Approach | | Discount Rate | | | 21.00% | | Decrease |
| | | | | | Market Approach | | Transaction Method Adjusted EBITDA multiple | | | 13.20x | | Increase |
| | | | | | Market Approach | | Guideline Public Companies Method Adjusted EBITDA multiple | | | 12.87x | | Increase |
SCPCV-A, LP* | | $ | 7,881,462 | | Market Approach | | General Partner Net Asset Value | | | Not Applicable | | Increase |
| | | | | | Market Approach | | Transaction Price | | | Not Applicable | | Increase |
| | | | | | Income Approach | | Discount Rate | | | 29.50% | | Decrease |
| | | | | | Market Approach | | Transaction Method Adjusted EBITDA multiple | | | 10.60x | | Increase |
| | | | | | Market Approach | | Guideline Public Companies Method Adjusted EBITDA multiple | | | 9.57x | | Increase |
SEP Hamilton, LP | | $ | 1,439,640 | | Market approach | | Fair Value of Underlying Company | | $ | 2.69 per share | | Increase |
The Global Atlantic Financial Group, LLC | | $ | 373,422 | | Market approach | | Net Book Value | | | Not Applicable | | Increase |
Veregy Parent, LLC | | $ | 3,849,659 | | Market approach | | Adjusted EBITDA multiple | | | 10.40x | | Increase |
Westcap Loanpal Co-invest 2020, LLC** | | $ | 3,372,917 | | Market approach | | General Partner Net Asset Value | | | Not Applicable | | Increase |
| | | | | | Market approach | | Guideline Public Companies Method Adjusted EBITDA multiple | | | 20.68x | | Increase |
| | | | | | Income approach | | Discount Rate | | | 22.50% | | Decrease |
| | | | | | | | | | | | | |
Private Equity Primary Funds | | | | | | | | | | | | |
OceanSound Partners Fund II, LP*** | | $ | 5,275,714 | | Market Approach | | Adjusted General Partner Net Asset Value | | | Not Applicable | | Increase |
| | | | | | Market Approach | | Transaction Price | | | Not Applicable | | Increase |
| | | | | | Income Approach | | Discount Rate | | | 21.00% | | Decrease |
| | | | | | Market Approach | | Transaction Method Adjusted EBITDA multiple | | | 13.20x | | Increase |
| | | | | | Market Approach | | Guideline Public Companies Method Adjusted EBITDA multiple | | | 12.87x | | Increase |
| | | | | | Market Approach | | General Partner Net Asset Value | | | Not Applicable | | Increase |
Westcap Strategic Operator US Feeder
Fund, LP | | $ | 7,829,614 | | Market approach | | General Partner Net Asset Value | | | Not Applicable | | Increase |
| | | | | | | | | | | | | |
Private Credit Secondary Funds | | | | | | | | | | | | |
BRCE SPV I, LLC | | $ | 227,374 | | Market approach | | General Partner Net Asset Value | | | Not Applicable | | Increase |
CCS Co-Investment Vehicle I, LP | | $ | 5,456,763 | | Market approach | | General Partner Net Asset Value | | | Not Applicable | | Increase |
| | | | | | | | | | | | | |
Private Equity Secondary Funds | | | | | | | | | | | | |
Graphite Capital Partners VIII D, LP | | $ | 5,156,378 | | Market approach | | General Partner Net Asset Value | | | Not Applicable | | Increase |
Total Level 3 Investments | | $ | 77,605,844 | | | | | | | | | |
22
Bow River Capital Evergreen Fund |
NOTES TO THE FINANCIAL STATEMENTS (CONTINUED)
MARCH 31, 2024 |
The following is the fair value measurement of investments that are measured at the Fund’s pro rata NAV (or its equivalent) as a practical expedient:
Private Investments* | | Investment Strategy | | Fair Value | | Unfunded
Commitments | | Redemption
Frequency | | Redemption
Notice Period | | Lock Up Period |
ACP Hyperdrive Co-Invest, LLC | | Private Equity Direct Investment | | $ | 2,845,934 | | $ | — | | Subject to GP Consent | | Not Applicable | | Not Applicable |
Adams Street 2009 Direct Fund, LP | | Private Equity Secondary | | | 22,778 | | | 1,762 | | Subject to GP Consent | | Not Applicable | | Not Applicable |
Adams Street 2010 Direct Fund, LP | | Private Equity Secondary | | | 27,988 | | | 3,471 | | Subject to GP Consent | | Not Applicable | | Not Applicable |
Adams Street 2011 Direct Fund, LP | | Private Equity Secondary | | | 38,817 | | | 6,666 | | Subject to GP Consent | | Not Applicable | | Not Applicable |
Adams Street 2011 Non-U.S. Developed Markets Fund, LP | | Private Equity Secondary | | | 130,617 | | | 42,587 | | Subject to GP Consent | | Not Applicable | | Not Applicable |
Adams Street 2011 U.S. Fund, LP | | Private Equity Secondary | | | 255,722 | | | 58,073 | | Subject to GP Consent | | Not Applicable | | Not Applicable |
Adams Street 2013 Global Fund, LP | | Private Equity Secondary | | | 1,677,941 | | | 130,224 | | Subject to GP Consent | | Not Applicable | | Not Applicable |
Adams Street 2014 Global Fund, LP | | Private Equity Secondary | | | 955,926 | | | 67,754 | | Subject to GP Consent | | Not Applicable | | Not Applicable |
Adams Street Partnership Fund 2009 Non-U.S. Developed Markets Fund, LP | | Private Equity Secondary | | | 105,897 | | | 29,504 | | Subject to GP Consent | | Not Applicable | | Not Applicable |
Adams Street Partnership Fund 2009 U.S. Fund, LP | | Private Equity Secondary | | | 222,875 | | | 36,490 | | Subject to GP Consent | | Not Applicable | | Not Applicable |
Adams Street Partnership Fund 2010 Non-U.S. Developed Markets Fund, LP | | Private Equity Secondary | | | 100,674 | | | 26,567 | | Subject to GP Consent | | Not Applicable | | Not Applicable |
Adams Street Partnership Fund 2010 U.S. Fund, LP | | Private Equity Secondary | | | 238,843 | | | 52,955 | | Subject to GP Consent | | Not Applicable | | Not Applicable |
AG DLI IV (Unlevered), LP | | Private Credit Secondary | | | 13,136,514 | | | — | | Subject to GP Consent | | Not Applicable | | Not Applicable |
Alpine Investors Iceman CV[-A], LP | | Private Equity Direct Investment | | | 8,427,046 | | | 780,592 | | Subject to GP Consent | | Not Applicable | | Not Applicable |
Altor Fund IV (No. 1) AB | | Private Equity Secondary | | | 5,834,923 | | | 1,602,053 | | Subject to GP Consent | | Not Applicable | | Not Applicable |
AP DSB Co-Invest II, LP | | Private Credit Direct Investment | | | 3,807 | | | 1,941 | | Subject to GP Consent | | Not Applicable | | Not Applicable |
AP DSB Co-Invest II, LP | | Private Equity Direct Investment | | | 3,871,074 | | | 39,424 | | Subject to GP Consent | | Not Applicable | | Not Applicable |
Ashgrove Specialty Lending Fund I SCSp RAIF | | Private Credit Primary | | | 1,196,160 | | | 935,977 | | Subject to GP Consent | | Not Applicable | | Not Applicable |
ASP (Feeder) 2017 Global Fund, LP | | Private Equity Secondary | | | 1,143,285 | | | 101,245 | | Subject to GP Consent | | Not Applicable | | Not Applicable |
Avista Capital Partners V, LP | | Private Equity Primary | | | 5,415,796 | | | 112,052 | | Subject to GP Consent | | Not Applicable | | Not Applicable |
Biloxi Co-Investment Partners, LP | | Private Equity Direct Investment | | | 1,966,317 | | | 544,438 | | Subject to GP Consent | | Not Applicable | | Not Applicable |
Butterfly Nourish Co-Invest, LP | | Private Equity Direct Investment | | | 6,062,698 | | | — | | Subject to GP Consent | | Not Applicable | | Not Applicable |
BW Colson Co-Invest Feeder (Cayman), LP | | Private Equity Direct Investment | | | 5,391,418 | | | — | | Subject to GP Consent | | Not Applicable | | Not Applicable |
Carlyle Riser Co-Investment, LP | | Private Equity Direct Investment | | | 3,052,298 | | | 689,712 | | Subject to GP Consent | | Not Applicable | | Not Applicable |
Coller Credit Opportunities I – Annex I, SLP | | Private Credit Secondary | | | 3,053,570 | | | 1,126,133 | | Subject to GP Consent | | Not Applicable | | Not Applicable |
Coller Credit Opportunities I – B, LP | | Private Credit Primary | | | 3,149,040 | | | 2,360,674 | | Subject to GP Consent | | Not Applicable | | Not Applicable |
Coller International Partners VI Feeder Fund, LP – Class A | | Private Equity Secondary | | | 661,367 | | | 327,000 | | Subject to GP Consent | | Not Applicable | | Not Applicable |
Coller International Partners VII Feeder Fund, LP – Series B | | Private Equity Secondary | | | 1,612,973 | | | 1,244,187 | | Subject to GP Consent | | Not Applicable | | Not Applicable |
Constellation 2022, LP | | Private Equity Direct Investment | | | 7,055,257 | | | — | | Subject to GP Consent | | Not Applicable | | Not Applicable |
Corsair Amore Investors, LP | | Private Equity Direct Investment | | | 4,658,101 | | | — | | Subject to GP Consent | | Not Applicable | | Not Applicable |
Coyote 2021, LP | | Private Equity Direct Investment | | | 5,475,105 | | | 393,776 | | Subject to GP Consent | | Not Applicable | | Not Applicable |
CRG Partners III – Parallel
Fund (A), LP | | Private Credit Secondary | | | 3,509,669 | | | 3,047,928 | | Subject to GP Consent | | Not Applicable | | Not Applicable |
Digital Alpha Solutions Fund, LP | | Private Credit Direct Investment | | | 4,450,897 | | | 259,353 | | Subject to GP Consent | | Not Applicable | | Not Applicable |
Enak Aggregator, LP | | Private Equity Direct Investment | | | 3,509,083 | | | — | | Subject to GP Consent | | Not Applicable | | Not Applicable |
EnCap Energy Transition
Fund 1-A, LP | | Private Equity Primary | | | 1,767,055 | | | 1,916,527 | | Subject to GP Consent | | Not Applicable | | Not Applicable |
Ethos Capital Investments, LP | | Private Equity Primary | | | 3,133,847 | | | 2,373,667 | | Subject to GP Consent | | Not Applicable | | Not Applicable |
Falcon Co-Investment Partners, LP | | Private Equity Direct Investment | | | 2,921,783 | | | 1,072,756 | | Subject to GP Consent | | Not Applicable | | Not Applicable |
FFL Capital Partners V, LP | | Private Equity Primary | | | 5,954,618 | | | 3,238,772 | | Subject to GP Consent | | Not Applicable | | Not Applicable |
23
Bow River Capital Evergreen Fund |
NOTES TO THE FINANCIAL STATEMENTS (CONTINUED)
MARCH 31, 2024 |
Private Investments* | | Investment Strategy | | Fair Value | | Unfunded
Commitments | | Redemption
Frequency | | Redemption
Notice Period | | Lock Up Period |
Forrest Holdings I LP – Class A | | Private Equity Secondary | | $ | 1,065 | | $ | 1,263,959 | | Subject to GP Consent | | Not Applicable | | Not Applicable |
Forrest Holdings I LP – Class B | | Private Equity Secondary | | | 14,897 | | | — | | Subject to GP Consent | | Not Applicable | | Not Applicable |
Global Infrastructure Partners II-C, LP | | Private Equity Secondary | | | 1,116,189 | | | 229,867 | | Subject to GP Consent | | Not Applicable | | Not Applicable |
Grain Spectrum Holdings III (Cayman), LP | | Private Equity Primary | | | 3,727,980 | | | 311,630 | | Subject to GP Consent | | Not Applicable | | Not Applicable |
Gridiron Capital Fund V, LP | | Private Equity Primary | | | 2,269,402 | | | 2,857,215 | | Subject to GP Consent | | Not Applicable | | Not Applicable |
ICG LP Secondaries Fund I, LP | | Private Equity Primary | | | 1,999,109 | | | 4,512,150 | | Subject to GP Consent | | Not Applicable | | Not Applicable |
ICG Ludgate Hill IV-A Leopard, LP | | Private Equity Secondary | | | 5,451,728 | | | 2,221,391 | | Subject to GP Consent | | Not Applicable | | Not Applicable |
ISH Co-Investment Aggregator, LP | | Private Equity Direct Investment | | | 2,717,136 | | | 692,308 | | Subject to GP Consent | | Not Applicable | | Not Applicable |
KH Aggregator, LP | | Private Equity Secondary | | | 4,343,138 | | | — | | Subject to GP Consent | | Not Applicable | | Not Applicable |
Lynx EBO Fund I (A), LLC | | Private Credit Primary | | | 89,259 | | | — | | Subject to GP Consent | | Not Applicable | | Not Applicable |
OceanSound Partners Co-Invest II, LP – Series B | | Private Equity Direct Investment | | | 10,109,829 | | | — | | Subject to GP Consent | | Not Applicable | | Not Applicable |
OceanSound Partners Co-Invest II, LP – Series E | | Private Equity Direct Investment | | | 11,452,087 | | | — | | Subject to GP Consent | | Not Applicable | | Not Applicable |
OceanSound Partners Fund, LP | | Private Equity Primary | | | 4,495,918 | | | 658,894 | | Subject to GP Consent | | Not Applicable | | Not Applicable |
Onex Fund V, LP | | Private Equity Secondary | | | 7,984,594 | | | 985,834 | | Subject to GP Consent | | Not Applicable | | Not Applicable |
Onex OD Co-Invest, LP | | Private Equity Direct Investment | | | 6,628,985 | | | — | | Subject to GP Consent | | Not Applicable | | Not Applicable |
Onex Structured Credit Opportunities International
Fund I, LLC | | Private Credit Primary | | | 1,719,037 | | | 214,515 | | Subject to GP Consent | | Not Applicable | | Not Applicable |
OSP Co-Invest II, LP | | Private Equity Direct Investment | | | 4,996,980 | | | — | | Subject to GP Consent | | Not Applicable | | Not Applicable |
Overbay Fund XIV (AIV III), LP | | Private Equity Secondary | | | 1,555,878 | | | 170,407 | | Subject to GP Consent | | Not Applicable | | Not Applicable |
Overbay Fund XIV Offshore (AIV), LP | | Private Equity Secondary | | | 2,908,427 | | | 579,387 | | Subject to GP Consent | | Not Applicable | | Not Applicable |
Overbay Fund XIV Offshore, LP | | Private Equity Primary | | | 1,785,284 | | | 16,715 | | Subject to GP Consent | | Not Applicable | | Not Applicable |
Palms Co-Investment Partners, LP | | Private Equity Direct Investment | | | 4,310,600 | | | 190,039 | | Subject to GP Consent | | Not Applicable | | Not Applicable |
PARIOU SLP | | Private Credit Direct Investment | | | 6,281,055 | | | 22,268 | | Subject to GP Consent | | Not Applicable | | Not Applicable |
PGC U.S. Middle Market Direct Lending Offshore Fund I, LP | | Private Credit Secondary | | | 7,184,633 | | | — | | Subject to GP Consent | | Not Applicable | | Not Applicable |
PIMCO DSCO Fund II Offshore Feeder, LP | | Private Credit Primary | | | 5,292,607 | | | — | | Quarterly | | 60 Days | | One Year |
Porcupine Holdings, LP – Class A | | Private Equity Secondary | | | 2,820,894 | | | 2,075,472 | | Subject to GP Consent | | Not Applicable | | Not Applicable |
Porcupine Holdings, LP – Class B | | Private Equity Secondary | | | 1,958,855 | | | — | | Subject to GP Consent | | Not Applicable | | Not Applicable |
Post Limited Term High Yield Fund, LP | | Alternative Strategy Short Duration High Yield | | | 6,481,140 | | | — | | Monthly | | 30 Days | | Not Applicable |
Project Stream Co-Invest Fund, LP | | Private Equity Direct Investment | | | 1,688,624 | | | — | | Subject to GP Consent | | Not Applicable | | Not Applicable |
RenaissanceRe Medici Fund, Ltd. | | Alternative Strategy Insurance Linked Securities | | | 8,117,348 | | | — | | Monthly | | 30 Days | | Not Applicable |
Ruffer Absolute Institutional, Ltd. | | Alternative Strategy Global Macro | | | 4,759,748 | | | — | | Subject to GP Consent | | Not Applicable | | Not Applicable |
Saba Capital Carry Neutral Tail Hedge Offshore Fund, Ltd. | | Alternative Strategy Long/Short Carry Neutral | | | 4,403,209 | | | — | | Monthly | | 35 Days | | 6 Months |
SANCY SLP | | Private Equity Direct Investment | | | 1,430,548 | | | 22,268 | | Subject to GP Consent | | Not Applicable | | Not Applicable |
SEP Hamilton III Aggregator, LP | | Private Equity Direct Investment | | | 6,512,899 | | | — | | Subject to GP Consent | | Not Applicable | | Not Applicable |
SEP Skyhawk Fund III Aggregator, LP | | Private Equity Direct Investment | | | 539,121 | | | — | | Subject to GP Consent | | Not Applicable | | Not Applicable |
Sheridan Capital Partners
Fund III, LP | | Private Equity Primary | | | 1,656,349 | | | 3,110,004 | | Subject to GP Consent | | Not Applicable | | Not Applicable |
Silver Lake Strategic Investors VI, LP | | Private Equity Direct Investment | | | 6,108,908 | | | — | | Subject to GP Consent | | Not Applicable | | Not Applicable |
Sumeru Equity Partners Fund III, LP | | Private Equity Primary | | | 2,733,393 | | | 269,544 | | Subject to GP Consent | | Not Applicable | | Not Applicable |
Sumeru Equity Partners Fund IV, LP | | Private Equity Primary | | | 1,177,812 | | | 2,781,950 | | Subject to GP Consent | | Not Applicable | | Not Applicable |
TKO Fund | | Private Credit Primary | | | 3,348,348 | | | 1,714,215 | | Subject to GP Consent | | Not Applicable | | Not Applicable |
24
Bow River Capital Evergreen Fund |
NOTES TO THE FINANCIAL STATEMENTS (CONTINUED)
MARCH 31, 2024 |
Private Investments* | | Investment Strategy | | Fair Value | | Unfunded
Commitments | | Redemption
Frequency | | Redemption
Notice Period | | Lock Up Period |
TPG IX Evergreen Cl 1, LP | | Private Equity Direct Investment | | $ | 8,690,780 | | $ | 640,323 | | Subject to GP Consent | | Not Applicable | | Not Applicable |
VCPF III Co-Invest 1-A, LP | | Private Credit Direct Investment | | | 2,601,343 | | | — | | Subject to GP Consent | | Not Applicable | | Not Applicable |
Vistage Equity Investors, LP | | Private Equity Direct Investment | | | 7,144,487 | | | — | | Subject to GP Consent | | Not Applicable | | Not Applicable |
Voleon Composition International Fund | | Alternative Strategy Quant Market Neutral | | | 10,174,522 | | | — | | Monthly | | 30 Days | | Not Applicable |
Voloridge Fund, LP | | Alternative Strategy Quant Market Neutral | | | 5,689,687 | | | — | | Monthly | | 90 Days | | Not Applicable |
WestCap Cerebral Co-Invest 2021, LLC | | Private Equity Direct Investment | | | 17,593 | | | — | | Subject to GP Consent | | Not Applicable | | Not Applicable |
WestCap Strategic Operator Fund II, LP | | Private Equity Primary | | | 4,704,445 | | | 1,129,153 | | Subject to GP Consent | | Not Applicable | | Not Applicable |
Whitehorse Liquidity Partners IV, LP | | Private Equity Primary | | | 3,684,158 | | | 1,408,575 | | Subject to GP Consent | | Not Applicable | | Not Applicable |
Whitehorse Liquidity Partners V, LP | | Private Equity Primary | | | 3,462,312 | | | 4,797,487 | | Subject to GP Consent | | Not Applicable | | Not Applicable |
Wildcat 21 Co-Invest Fund, LP | | Private Equity Direct Investment | | | 3,238,001 | | | — | | Subject to GP Consent | | Not Applicable | | Not Applicable |
WP Gateway Co-Invest, LP | | Private Equity Direct Investment | | | 7,212,925 | | | — | | Subject to GP Consent | | Not Applicable | | Not Applicable |
| | | | | $ | 321,830,979 | | $ | 55,499,830 | | | | | | |
4. Investment Transactions
Purchases and sales of investments, excluding short-term investments, for the year ended March 31, 2024 were $129,806,931 and $50,108,145, respectively.
5. Investment Management and Other Agreements
Pursuant to an Investment Management Agreement, the Fund will pay the Adviser a monthly investment management fee (the “Investment Management Fee”) in consideration of the advisory services provided by the Adviser to the Fund. The Investment Management Fee is equal to 1.75% on an annualized basis of the Fund’s average daily Managed Assets during such period. “Managed Assets” means the total assets of the Fund (including any assets attributable to money borrowed for investment purposes) minus the sum of the Fund’s accrued liabilities (other than money borrowed for investment purposes). The Investment Management Fee is paid to the Adviser out of the Fund’s assets and decreases the net profits or increases the net losses of the Fund. The Investment Management Fee will be computed as of the last day of each month. During the year ended March 31, 2024, the Fund incurred $7,273,687 in investment management fees.
The Adviser has entered into an Investment Consultant Agreement with Aksia CA, LLC (the “Investment Consultant”) to assist the Adviser with sourcing, evaluating, and selecting investments for the Fund’s portfolio. As the investment consultant, Aksia CA only recommends investments to the Adviser and has no involvement in investment decisions, any related negotiations, or the finalization of any investment. Currently, a high concentration of the Fund’s investments are sourced by the Investment Consultant. In consideration for services provided, the Adviser will pay the Investment Consultant a monthly fee of 0.375%, on an annualized basis, of the Fund’s average daily Managed Assets.
The Adviser has entered into an expense limitation and reimbursement agreement (the “Expense Limitation Agreement”) with the Fund, whereby the Adviser has agreed to waive fees that it would otherwise be paid, and/or to assume expenses of the Fund (a “Waiver”), if required to ensure the Fund’s aggregate monthly ordinary operating expenses, excluding certain “Specified Expenses” listed below, borne by the Fund in respect of each Class of Shares to an amount not to exceed 0.50%, on an annualized basis, of the Fund’s month-end net assets (the “Expense Cap”).
If the Fund’s aggregate monthly ordinary operating expenses, exclusive of the Specified Expenses in respect of any Class of Shares for any month, exceed the Expense Cap applicable to that Class of Shares, the Adviser will waive its Management Fee and/or reimburse the Fund for expenses to the extent necessary to eliminate such excess. The Adviser may also directly pay expenses on behalf of the Fund and waive reimbursement under the Expense Limitation Agreement. To the extent that the Adviser waives its Management Fee and/or reimburses expenses, the Adviser may, for a period not to exceed three years from the date on which a Waiver is made, recoup amounts waived or assumed, provided it is able to effect such recoupment without causing the Fund’s expense ratio (after recoupment) to exceed the lesser of (a) the expense limit in effect at the time of the waiver, and (b) the expense limit in effect at the time of the recoupment.
25
Bow River Capital Evergreen Fund |
NOTES TO THE FINANCIAL STATEMENTS (CONTINUED)
MARCH 31, 2024 |
Specified Expenses that are not covered by the Expense Limitation Agreement and are therefore borne by shareholders of the Fund include: (i) the Management Fee; (ii) all fees and expenses of Fund Investments (including any underlying fees of the Fund Investments (the “Acquired Fund Fees and Expenses”)); (iii) transactional costs, including legal costs and brokerage commissions, associated with the acquisition and disposition of Fund Investments; (iv) interest payments incurred on borrowing by the Fund; (v) fees and expenses incurred in connection with a credit facility, if any, obtained by the Fund; (vi) distribution and shareholder servicing fees, as applicable; (vii) taxes; and (viii) extraordinary expenses resulting from events and transactions that are distinguished by their unusual nature and by the infrequency of their occurrence, including, without limitation, costs incurred in connection with any claim, litigation, arbitration, mediation, government investigation or similar proceeding, indemnification expenses, and expenses in connection with holding and/or soliciting proxies for all annual and other meetings of common shareholders.
The Expense Limitation Agreement is in effect until December 29, 2024, and will automatically renew thereafter for consecutive twelve-month terms, provided that such continuance is specifically approved at least annually by a majority of the Board. The Expense Limitation Agreement may be terminated by the Board upon thirty days’ written notice to the Adviser. During the year ended March 31, 2024, the Adviser recouped $386,581 from previously waived expenses. As of March 31, 2024, all previously waived or reimbursed expenses have been recouped by the Adviser.
In consideration of the services rendered by the Independent Trustees, the Fund pays each Independent Trustee a retainer of $40,000 per year. In addition, the Fund pays an additional retainer of $2,500 per year to the Chairman of the Audit Committee and to the Chairman of the Nominating Committee. Trustees that are interested persons will not be compensated by the Fund. The Trustees do not receive any pension or retirement benefits.
Employees of PINE Advisors LLC (“PINE”) serve as officers of the Fund. PINE receives a monthly fee for the services provided to the Fund. The Fund also reimburses PINE for certain out-of-pocket expenses incurred on the Fund’s behalf.
The Fund has adopted a Distribution and Service Plan with respect to Class II Shares in compliance with Rule 12b-1 under the 1940 Act. The Distribution and Service Plan allows the Fund to pay distribution and servicing fees for the sale and servicing of its Class II Shares. Under the Distribution and Service Plan, the Fund may pay as compensation up to 0.25% on an annualized basis of the aggregate net assets of the Fund attributable to Class II Shares (the “Distribution and Servicing Fee”) to Foreside Financial Services, LLC (the “Distributor”) and/or other qualified recipients. Class I Shares are not subject to the Distribution and Servicing Fee. Foreside Financial Services, LLC acts as Distributor to the Fund on a best-efforts basis, subject to various conditions, pursuant to a Distribution Agreement (the “Distribution Agreement”) between the Fund and the Distributor. The Distributor may enter into agreements with selected broker-dealers, banks or other financial intermediaries for distribution of Class II Shares of the Fund. For the year ended March 31, 2024, distribution and service fees incurred are disclosed on the Statement of Operations.
The Adviser may make payments from its resources, which include a portion of the Investment Management Fee, to brokers or dealers that assist in the distribution of Shares, including brokers or dealers that may be affiliated with the Adviser.
UMB Fund Services, Inc. serves as the Fund’s Administrator, Accounting Agent, and Transfer Agent. UMB Bank, N.A. serves as the Fund’s Custodian.
Certain officers and trustees of the Fund are also officers of the Adviser.
6. Affiliated Investments
Issuers that are considered affiliates, as defined in Section 2(a)(3) of the 1940 Act, of the Fund at period-end are noted in the Fund’s Schedule of Investments. The table below reflects transactions during the period with entities that are affiliates as of March 31, 2024 and may include acquisitions of new investments, prior year holdings that become affiliated during the period, and prior period affiliated holdings that are no longer affiliated as of period-end.
26
Bow River Capital Evergreen Fund |
NOTES TO THE FINANCIAL STATEMENTS (CONTINUED)
MARCH 31, 2024 |
Non-Controlled Affiliates | | Beginning
Fair Value
April 1,
2023 | | Purchases or
Contributions | | Sales or
Distributions | | Change in
Unrealized
Appreciation
(Depreciation) | | Net
Realized
Gain | | Ending
Fair Value
March 31,
2024 | | Investment
Income |
CCS Co-Investment Vehicle I, LP | | $ | — | | $ | 4,208,200 | | $ | — | | | $ | 1,248,563 | | | $ | — | | $ | 5,456,763 | | $ | — |
OceanSound Partners Co-Invest II, LP – Series B | | | 5,464,518 | | | — | | | — | | | | 4,645,311 | | | | — | | | 10,109,829 | | | — |
OSP Co-Invest II, LP | | | — | | | 5,004,000 | | | — | | | | (7,020 | ) | | | — | | | 4,996,980 | | | — |
Overbay Fund XIV Offshore (AIV), LP | | | 4,121,372 | | | — | | | (1,026,098 | ) | | | (1,155,608 | ) | | | 968,761 | | | 2,908,427 | | | — |
Total Non-Controlled Affiliates | | $ | 9,585,890 | | $ | 9,212,200 | | $ | (1,026,098 | ) | | $ | 4,731,246 | | | $ | 968,761 | | $ | 23,471,999 | | $ | — |
7. Restricted Securities
Restricted securities include securities that have not been registered under the Securities Act of 1933, as amended, and securities that are subject to restrictions on resale. The Fund may invest in restricted securities that are consistent with the Fund’s investment objectives and investment strategies. Investments in restricted securities are valued at fair value as determined in good faith in accordance with procedures adopted by the Board of Trustees.
Additional information on each restricted investment held by the Fund on March 31, 2024 is as follows:
Investments | | Initial
Acquisition Date | | Cost | | Fair Value | | % of
Net Assets |
ACP Hyperdrive Co-Invest, LLC | | March 7, 2022 | | $ | 2,594,796 | | $ | 2,845,934 | | 0.6 | % |
Adams Street 2009 Direct Fund, LP | | April 1, 2022 | | | 26,619 | | | 22,778 | | 0.0 | % |
Adams Street 2010 Direct Fund, LP | | April 1, 2022 | | | 28,757 | | | 27,988 | | 0.0 | % |
Adams Street 2011 Direct Fund, LP | | April 1, 2022 | | | 47,251 | | | 38,817 | | 0.0 | % |
Adams Street 2011 Non-U.S. Developed Markets Fund, LP | | April 1, 2022 | | | 97,987 | | | 130,617 | | 0.0 | % |
Adams Street 2011 U.S. Fund, LP | | April 1, 2022 | | | 168,823 | | | 255,722 | | 0.1 | % |
Adams Street 2013 Global Fund, LP | | April 1, 2022 | | | 1,381,460 | | | 1,677,941 | | 0.3 | % |
Adams Street 2014 Global Fund, LP | | April 1, 2022 | | | 740,128 | | | 955,926 | | 0.2 | % |
Adams Street Partnership Fund 2009 Non-U.S. Developed Markets Fund, LP | | April 1, 2022 | | | 81,682 | | | 105,897 | | 0.0 | % |
Adams Street Partnership Fund 2009 U.S. Fund, LP | | April 1, 2022 | | | 171,308 | | | 222,875 | | 0.0 | % |
Adams Street Partnership Fund 2010 Non-U.S. Developed Markets Fund, LP | | April 1, 2022 | | | 77,380 | | | 100,674 | | 0.0 | % |
Adams Street Partnership Fund 2010 U.S. Fund, LP | | April 1, 2022 | | | 177,297 | | | 238,843 | | 0.1 | % |
AG DLI IV (Unlevered), LP | | April 28, 2023 | | | 10,917,255 | | | 13,136,514 | | 2.7 | % |
Alpine Investors Iceman CV[-A], LP | | October 20, 2023 | | | 7,223,408 | | | 8,427,046 | | 1.7 | % |
Altor Fund IV (No. 1) AB | | August 12, 2022 | | | 6,224,095 | | | 5,834,923 | | 1.2 | % |
AP DSB Co-Invest II, LP | | July 30, 2021 | | | 4,001 | | | 3,807 | | 0.0 | % |
AP DSB Co-Invest II, LP | | July 30, 2021 | | | 1,795,398 | | | 3,871,074 | | 0.8 | % |
Ashgrove Specialty Lending Fund I SCSp RAIF | | December 17, 2021 | | | 969,423 | | | 1,196,160 | | 0.2 | % |
ASP (Feeder) 2017 Global Fund, LP | | April 1, 2022 | | | 799,295 | | | 1,143,285 | | 0.2 | % |
Avista Capital Partners V, LP | | March 16, 2021 | | | 3,891,948 | | | 5,415,796 | | 1.1 | % |
Biloxi Co-Investment Partners, LP | | August 13, 2021 | | | 1,459,561 | | | 1,966,317 | | 0.4 | % |
BRCE SPV I, LLC | | May 22, 2020 | | | 22,501 | | | 227,374 | | 0.1 | % |
Butterfly Nourish Co-Invest, LP | | February 3, 2023 | | | 5,010,381 | | | 6,062,698 | | 1.2 | % |
BW Colson Co-Invest Feeder (Cayman), LP | | March 15, 2021 | | | 3,049,786 | | | 5,391,418 | | 1.1 | % |
BW Phoenix Co-Invest, LP | | February 9, 2024 | | | 7,004,000 | | | 7,000,000 | | 1.4 | % |
Carlyle Riser Co-Investment, LP | | November 11, 2022 | | | 1,826,610 | | | 3,052,298 | | 0.6 | % |
27
Bow River Capital Evergreen Fund |
NOTES TO THE FINANCIAL STATEMENTS (CONTINUED)
MARCH 31, 2024 |
Investments | | Initial
Acquisition Date | | Cost | | Fair Value | | % of
Net Assets |
CCS Co-Investment Vehicle I, LP | | March 29, 2024 | | $ | 4,208,200 | | $ | 5,456,763 | | 1.1 | % |
Coller Credit Opportunities I – Annex I, SLP | | July 29, 2021 | | | 2,217,467 | | | 3,053,570 | | 0.6 | % |
Coller Credit Opportunities I – B, LP | | January 5, 2022 | | | 2,630,356 | | | 3,149,040 | | 0.6 | % |
Coller International Partners VI Feeder Fund, LP – Class A | | October 1, 2020 | | | 93,680 | | | 661,367 | | 0.1 | % |
Coller International Partners VII Feeder Fund, LP – Series B | | October 1, 2020 | | | — | | | 1,612,973 | | 0.3 | % |
Constellation 2022, LP | | August 12, 2022 | | | 5,011,479 | | | 7,055,257 | | 1.4 | % |
Corsair Amore Investors, LP | | May 27, 2022 | | | 5,051,022 | | | 4,658,101 | | 0.9 | % |
Coyote 2021, LP | | March 29, 2021 | | | 2,614,724 | | | 5,475,105 | | 1.1 | % |
CRG Partners III – Parallel Fund (A), LP | | December 31, 2022 | | | 2,373,967 | | | 3,509,669 | | 0.7 | % |
Digital Alpha Solutions Fund, LP | | October 28, 2022 | | | 2,879,671 | | | 4,450,897 | | 0.9 | % |
DSG Group Holdings, LP | | September 9, 2022 | | | 5,585,674 | | | 7,779,653 | | 1.6 | % |
Enak Aggregator, LP | | January 18, 2022 | | | 2,861,507 | | | 3,509,083 | | 0.7 | % |
EnCap Energy Transition Fund 1-A, LP | | April 21, 2021 | | | — | | | 1,767,055 | | 0.4 | % |
Ethos Capital Investments, LP | | August 16, 2023 | | | 2,124,959 | | | 3,133,847 | | 0.6 | % |
Falcon Co-Investment Partners, LP | | January 26, 2022 | | | 2,932,899 | | | 2,921,783 | | 0.6 | % |
FFL Capital Partners V, LP | | June 16, 2022 | | | 3,854,480 | | | 5,954,618 | | 1.2 | % |
Forrest Holdings I LP – Class A | | March 17, 2021 | | | — | | | 1,065 | | 0.0 | % |
Forrest Holdings I LP – Class B | | March 17, 2021 | | | — | | | 14,897 | | 0.0 | % |
Global Infrastructure Partners II-C, LP | | January 14, 2022 | | | 144,803 | | | 1,116,189 | | 0.2 | % |
Grain Spectrum Holdings III (Cayman), LP | | October 28, 2020 | | | 2,696,681 | | | 3,727,980 | | 0.8 | % |
Graphite Capital Partners VIII D, LP | | June 30, 2020 | | | — | | | 5,156,378 | | 1.0 | % |
Gridiron Capital Fund V, LP | | November 27, 2023 | | | 2,184,205 | | | 2,269,402 | | 0.5 | % |
ICG LP Secondaries Fund I, LP | | July 31, 2023 | | | 1,482,206 | | | 1,999,109 | | 0.4 | % |
ICG Ludgate Hill IV-A Leopard, LP | | July 31, 2023 | | | 3,796,496 | | | 5,451,728 | | 1.1 | % |
ISH Co-Investment Aggregator, LP | | May 6, 2021 | | | 2,311,692 | | | 2,717,136 | | 0.6 | % |
IvyRehab Holdings, LLC | | August 25, 2023 | | | 8,004,000 | | | 8,566,477 | | 1.7 | % |
KH Aggregator, LP | | November 30, 2020 | | | 2,358,139 | | | 4,343,138 | | 0.9 | % |
Lynx EBO Fund I (A), LLC | | December 18, 2020 | | | — | | | 89,259 | | 0.0 | % |
OceanSound Partners Co-Invest II, LP – Series B | | November 5, 2021 | | | 3,897,268 | | | 10,109,829 | | 2.1 | % |
OceanSound Partners Co-Invest II, LP – Series E | | December 16, 2022 | | | — | | | 11,452,087 | | 2.3 | % |
OceanSound Partners Fund, LP | | December 27, 2021 | | | 1,551,397 | | | 4,495,918 | | 0.9 | % |
OceanSound Partners Fund II, LP | | January 12, 2024 | | | 5,199,720 | | | 5,275,714 | | 1.1 | % |
OceanSound SMX Continuation Fund, LP | | March 29, 2024 | | | 5,440,041 | | | 6,451,445 | | 1.3 | % |
Onex Fund V, LP | | September 30, 2022 | | | 6,187,089 | | | 7,984,594 | | 1.6 | % |
Onex OD Co-Invest, LP | | November 9, 2020 | | | 3,511,271 | | | 6,628,985 | | 1.3 | % |
Onex Structured Credit Opportunities International Fund I, LLC | | May 11, 2021 | | | 1,310,928 | | | 1,719,037 | | 0.3 | % |
OSP Co-Invest II, LP | | January 5, 2024 | | | 5,004,000 | | | 4,996,980 | | 1.0 | % |
Overbay Fund XIV (AIV III), LP | | March 26, 2021 | | | 548,170 | | | 1,555,878 | | 0.3 | % |
Overbay Fund XIV Offshore (AIV), LP | | January 5, 2021 | | | — | | | 2,908,427 | | 0.6 | % |
Overbay Fund XIV Offshore, LP | | January 22, 2021 | | | 794,078 | | | 1,785,284 | | 0.4 | % |
28
Bow River Capital Evergreen Fund |
NOTES TO THE FINANCIAL STATEMENTS (CONTINUED)
MARCH 31, 2024 |
Investments | | Initial
Acquisition Date | | Cost | | Fair Value | | % of
Net Assets |
Palmer Square Loan Funding 2021-3, Ltd. | | July 9, 2021 | | $ | 1,456,741 | | $ | 1,331,780 | | 0.3 | % |
Palms Co-Investment Partners, LP | | June 3, 2022 | | | 3,813,961 | | | 4,310,600 | | 0.9 | % |
PARIOU SLP | | October 14, 2022 | | | 5,055,979 | | | 6,281,055 | | 1.3 | % |
Pathstone Family Office, LLC | | May 16, 2023 | | | 2,335,292 | | | 2,349,359 | | 0.5 | % |
PGC U.S. Middle Market Direct Lending Offshore Fund I, LP | | July 24, 2023 | | | 4,741,871 | | | 7,184,633 | | 1.5 | % |
PIMCO DSCO Fund II Offshore Feeder, LP | | June 30, 2020 | | | 4,205,485 | | | 5,292,607 | | 1.1 | % |
Polaris Newco | | June 18, 2021 | | | 1,944,556 | | | 2,077,416 | | 0.4 | % |
Porcupine Holdings, LP – Class A | | December 29, 2021 | | | 2,061,634 | | | 2,820,894 | | 0.6 | % |
Porcupine Holdings, LP – Class B | | December 29, 2021 | | | 2,010,512 | | | 1,958,855 | | 0.4 | % |
Post Limited Term High Yield Fund, LP | | January 1, 2021 | | | 6,000,000 | | | 6,481,140 | | 1.3 | % |
Project Stream Co-Invest Fund, LP | | October 1, 2021 | | | 2,237,313 | | | 1,688,624 | | 0.3 | % |
RenaissanceRe Medici Fund Ltd. | | April 28, 2023 | | | 7,004,000 | | | 8,117,348 | | 1.6 | % |
Ruffer Absolute Institutional, Ltd. | | April 1, 2022 | | | 5,004,000 | | | 4,759,748 | | 1.0 | % |
Saba Capital Carry Neutral Tail Hedge Offshore Fund, Ltd. | | January 28, 2022 | | | 5,004,000 | | | 4,403,209 | | 0.9 | % |
SANCY SLP | | October 14, 2022 | | | 1,698,500 | | | 1,430,548 | | 0.3 | % |
Sand Trust Series 21-1A – Class SUB | | November 6, 2021 | | | 916,162 | | | 668,917 | | 0.1 | % |
SCPCV-A, LP | | March 29, 2024 | | | 5,764,000 | | | 7,881,462 | | 1.6 | % |
SEP Hamilton III Aggregator, LP | | August 17, 2020 | | | 2,519,336 | | | 6,512,899 | | 1.3 | % |
SEP Hamilton, LP | | June 30, 2023 | | | 941,500 | | | 1,439,640 | | 0.3 | % |
SEP Skyhawk Fund III Aggregator, LP | | August 24, 2021 | | | 510,356 | | | 539,121 | | 0.1 | % |
Sheridan Capital Partners Fund III, LP | | March 31, 2023 | | | 1,897,559 | | | 1,656,349 | | 0.4 | % |
Silver Lake Strategic Investors VI, LP | | June 2, 2023 | | | 5,008,155 | | | 6,108,908 | | 1.2 | % |
Sumeru Equity Partners Fund III, LP | | December 8, 2020 | | | 2,157,545 | | | 2,733,393 | | 0.6 | % |
Sumeru Equity Partners Fund IV, LP | | September 2, 2022 | | | 1,222,010 | | | 1,177,812 | | 0.2 | % |
The Global Atlantic Financial Group, LLC | | January 1, 2021 | | | — | | | 373,422 | | 0.1 | % |
TKO Fund | | November 4, 2022 | | | 2,474,903 | | | 3,348,348 | | 0.7 | % |
TPG IX Evergreen Cl 1, LP | | November 22, 2023 | | | 7,363,677 | | | 8,690,780 | | 1.8 | % |
US Hospitality Publishers, Inc. | | January 11, 2021 | | | 2,569,943 | | | 2,518,551 | | 0.5 | % |
VCPF III Co-Invest 1-A, LP | | May 13, 2021 | | | 2,036,738 | | | 2,601,343 | | 0.5 | % |
Veregy Parent, LLC | | November 3, 2020 | | | 3,005,300 | | | 3,849,659 | | 0.8 | % |
Vistage Equity Investors, LP | | July 22, 2022 | | | 5,004,000 | | | 7,144,487 | | 1.5 | % |
Voleon Composition International Fund | | February 29, 2024 | | | 10,004,000 | | | 10,174,522 | | 2.1 | % |
Voloridge Fund, LP | | November 1, 2020 | | | 5,670,000 | | | 5,689,687 | | 1.2 | % |
WestCap Cerebral Co-Invest 2021, LLC | | June 17, 2021 | | | 259,342 | | | 17,593 | | 0.0 | % |
WestCap LoanPal Co-Invest 2020, LLC | | December 18, 2020 | | | 2,436,328 | | | 3,372,917 | | 0.7 | % |
WestCap Strategic Operator Fund II, LP | | July 31, 2021 | | | 4,815,737 | | | 4,704,445 | | 1.0 | % |
WestCap Strategic Operator U.S. Feeder Fund, LP | | February 5, 2021 | | | 2,712,690 | | | 7,829,614 | | 1.6 | % |
Whitehorse Liquidity Partners IV, LP | | November 10, 2020 | | | 2,443,789 | | | 3,684,158 | | 0.8 | % |
Whitehorse Liquidity Partners V, LP | | February 24, 2022 | | | 2,872,132 | | | 3,462,312 | | 0.7 | % |
Wildcat 21 Co-Invest Fund, LP | | August 13, 2021 | | | 2,255,434 | | | 3,238,001 | | 0.7 | % |
WP Gateway Co-Invest, LP | | October 2, 2023 | | | 7,068,463 | | | 7,212,925 | | 1.5 | % |
| | | | | $ | 295,156,362 | | $ | 401,437,520 | | 81.6 | % |
29
Bow River Capital Evergreen Fund |
NOTES TO THE FINANCIAL STATEMENTS (CONTINUED)
MARCH 31, 2024 |
8. Capital Share Transactions
The Fund’s Shares are generally offered for purchase once per month at the NAV per Share as of the last business day of such month, except that Shares may be offered more or less frequently as determined by the Board in its sole discretion. The Fund has elected to implement a hybrid repurchase mechanism, where under normal circumstances, the Fund provides a limited degree of liquidity to common shareholders by conducting semi-annual repurchase offers pursuant to Rule 23c-3 of the 1940 Act (each a “Required Repurchase Offer”), as well as discretionary repurchase offers. While the Board may consider the recommendation of the Adviser, discretionary repurchase offers will be made at the sole discretion of the Board.
Each Required Repurchase Offer will be for no less than 5% and no more than 25% of the Fund’s Shares outstanding, but if the value of Shares tendered for repurchase exceeds the value the Fund intended to repurchase, the Fund may determine to repurchase less than the full number of Shares tendered. In such event, common shareholders will have their Shares repurchased on a pro rata basis and tendering common shareholders will not have all of their tendered Shares repurchased by the Fund.
The Adviser also anticipates recommending to the Board that, under normal market circumstances, the Fund conduct periodic repurchase offers of no more than 5% of the Fund’s net assets generally for each calendar quarter following a Required Repurchase Offer (each, a “Discretionary Repurchase”). In determining whether the Fund should offer a Discretionary Repurchase, the Board may consider the recommendation of the Adviser as well as a variety of other operational, business and economic factors. While it is anticipated that each Discretionary Repurchase will be offered for each calendar quarter following a Required Repurchase Offer (i.e. twice per year), any Discretionary Repurchase of Shares will be made at such times and on such terms as may be determined by the Board from time to time in its sole discretion. As a result, Discretionary Repurchases may be offered at any amount, as determined by the Board, or not at all. The Fund may also elect to repurchase less than the full amount that a common shareholder requests to be repurchased. In addition, the Board may under certain circumstances elect to postpone, suspend or terminate an offer to repurchase Shares.
A 2.00% early repurchase fee will be charged by the Fund with respect to any repurchase of Shares from a common shareholder at any time prior to the day immediately preceding the one-year anniversary of the common shareholder’s purchase of the Shares. Shares tendered for repurchase will be treated as having been repurchased on a “first in-first out” basis. An early repurchase fee payable by a common shareholder may be waived by the Fund in circumstances where the Board determines that doing so is in the best interests of the Fund.
During the year ended March 31, 2024, the Fund completed four repurchase offers. The results of those were as follows:
| | Required
Repurchase
Offer | | Discretionary
Repurchase
Offer | | Required
Repurchase
Offer | | Discretionary
Repurchase
Offer |
Commencement Date | | April 19, 2023 | | | July 21, 2023 | | | October 13, 2023 | | | February 16, 2024 | |
Repurchase Request Deadline | | May 19, 2023 | | | August 18, 2023 | | | November 17, 2023 | | | March 22, 2024 | |
Repurchase Pricing Date | | May 31, 2023 | | | August 31, 2023 | | | November 30, 2023 | | | March 28, 2024 | |
Repurchase Pricing Date Net Asset
Value – Class I | | $40.41 | | | $42.00 | | | $43.98 | | | $44.29 | |
Repurchase Pricing Date Net Asset Value – Class II | | $40.27 | | | $41.82 | | | $43.77 | | | $44.04 | |
Shares Repurchased – Class I | | 40,415 | | | 143,676 | | | 86,969 | | | 195,811 | |
Shares Repurchased – Class II | | 1,331 | | | 51,779 | | | 23,829 | | | 63,891 | |
Value of Shares Repurchased – Class I | | $1,633,326 | | | $6,033,757 | | | $3,824,776 | | | $8,672,213 | |
Value of Shares Repurchased – Class II | | $53,613 | | | $2,165,484 | | | $1,042,965 | | | $2,813,631 | |
Percentage of Shares Repurchased – Class I | | 0.49 | % | | 1.63 | % | | 0.92 | % | | 1.86 | % |
Percentage of Shares Repurchased – Class II | | 0.22 | % | | 8.22 | % | | 3.89 | % | | 8.73 | % |
Percentage of Shares Repurchased – Total Fund | | 0.47 | % | | 2.07 | % | | 1.10 | % | | 2.31 | % |
30
Bow River Capital Evergreen Fund |
NOTES TO THE FINANCIAL STATEMENTS (CONTINUED)
MARCH 31, 2024 |
9. Contingencies and Commitments
The Fund indemnifies the Fund’s officers and the Board for certain liabilities that might arise from their performance of their duties to the Fund. Additionally, in the normal course of business the Fund enters into contracts that contain a variety of representations and warranties and which provide general indemnifications. The Fund’s maximum exposure under these arrangements is unknown, as this would involve future claims that may be made against the Fund that have not yet occurred. However, based on experience, the Fund expects the risk of loss to be remote.
The Fund is required to provide financial support in the form of investment commitments to certain investees as part of the conditions for entering into such investments. At March 31, 2024, the Fund reasonably believes its assets will provide adequate cover to satisfy all its unfunded commitments.
The Fund’s unfunded commitments as of March 31, 2024 are as follows:
Private Investments | | Fair Value | | Unfunded
Commitments |
BRCE SPV I, LLC | | $ | 227,374 | | $ | 367,891 |
CCS Co-Investment Vehicle I, LP | | | 5,456,763 | | | 2,889,525 |
Graphite Capital Partners VIII D, LP | | | 5,156,378 | | | 766,211 |
OceanSound Partners Fund II, LP | | | 5,275,714 | | | 2,914,797 |
OceanSound SMX Continuation Fund, LP | | | 6,451,445 | | | 994,266 |
SCPCV-A, LP | | | 7,881,462 | | | 1,440,000 |
US Hospitality Publishers, Inc. | | | 2,518,551 | | | 73,684 |
WestCap Strategic Operator U.S. Feeder Fund, LP | | | 7,829,614 | | | 30,660 |
Investments valued at the Fund’s pro rata NAV as a practical expedient1 | | | 321,830,979 | | | 55,499,830 |
| | | $ | 362,628,280 | | $ | 64,976,864 |
10. Federal Tax Information
At March 31, 2024, gross unrealized appreciation and depreciation of investments owned by the Fund, based on cost for federal income tax purposes were as follows:
| | Bow River Capital Evergreen Fund |
Cost of investments | | $ | 388,658,381 | |
Gross unrealized appreciation | | $ | 109,874,013 | |
Gross unrealized depreciation | | | (17,807,892 | ) |
Net unrealized appreciation/(depreciation) | | $ | 92,066,121 | |
The difference between cost amounts for financial statement and federal income tax purposes is due primarily to timing differences in recognizing certain gains and losses on partnership investments, and passive foreign investment companies.
GAAP requires that certain components of net assets be reclassified between financial and tax reporting. These reclassifications have no effect on net assets or net asset value per share.These reclassifications are due primarily to non-deductible expenses and tax-exempt income from partnership investments and net operating losses.
31
Bow River Capital Evergreen Fund |
NOTES TO THE FINANCIAL STATEMENTS (CONTINUED)
MARCH 31, 2024 |
For the year ended September 30, 2023, permanent differences in book and tax accounting have been reclassified to Capital and total distributable earnings/(deficit) as follows:
| | Paid-In
Capital | | Total
Distributable
Earnings/(Deficit) |
Bow River Capital Evergreen Fund | | $ | 45,688 | | $ | (45,688 | ) |
As of September 30, 2023, the components of accumulated earnings/(deficit) on a tax basis were as follows:
| | Bow River Capital
Evergreen Fund |
Undistributed ordinary income | | $ | — | |
Undistributed long-term capital gains | | | 1,522,342 | |
Accumulated capital and other losses | | | (1,537,324 | ) |
Unrealized appreciation/(depreciation) on investments | | | 61,613,538 | |
Total accumulated earnings/(deficit) | | $ | 61,598,556 | |
The tax character of distributions paid during the fiscal year ended September 30, 2023 and September 30, 2022 were as follows:
| | Bow River
Capital
Evergreen Fund | | Bow River
Capital
Evergreen Fund |
| | | 9/30/2023 | | 9/30/2022 |
Distributions paid from: | | | | | | |
Ordinary income | | $ | — | | $ | — |
Return of Capital | | | — | | | — |
Net long term capital gains | | | 8,465,374 | | | 1,278,522 |
Total distributions paid | | $ | 8,465,374 | | $ | 1,278,522 |
The Fund has $1,506,349 in Qualified late-year losses, which are deferred until Tax year ending September 30, 2024 for tax purposes. Net late-year ordinary losses incurred after December 31 and within the taxable year and net late-year specified losses incurred after October 31 and within the taxable year are deemed to arise on the first day of the Fund’s next taxable year.
11. Other Derivative Information
The average quarterly notional value of forward foreign currency contracts during the year ended March 31, 2024 was $1,666,860. The notional value outstanding as of March 31, 2024 was $0.
The effects of forward foreign currency contracts on the Fund’s financial positions and financial performance are reflected in the Statement of Operations (“SOP”). The Fund engaged in forward foreign currency contracts during the year ended March 31, 2024 and incurred $73,050 in net realized loss and $12,520 in the change in unrealized depreciation on forward foreign currency contracts.
Offsetting of Assets and Liabilities — Disclosures about offsetting assets and liabilities require an entity to disclose information about offsetting and related arrangements to enable users of its financial statements to understand the effect of those arrangements on its financial position. As of March 31, 2024, no master netting arrangements exist related to the Fund. The Fund did not hold any derivative instruments as of March 31, 2024.
32
Bow River Capital Evergreen Fund |
NOTES TO THE FINANCIAL STATEMENTS (CONTINUED)
MARCH 31, 2024 |
12. Revolving Credit Facility
The Fund has a committed revolving line of credit agreement (“Committed Credit Agreement”) and an uncommitted revolving line of credit agreement (“Uncommitted Credit Agreement”), (“Committed Credit Agreement” and “Uncommitted Credit Agreement”, together referred to as “Credit Agreements”) of $25,000,000 and $20,000,000 respectively with UMB Bank, n.a. (“UMB Bank”) effective until July 12, 2024. The Fund may borrow an amount up to the lesser of $45,000,000 or one hundred percent (100%) of the value of the Fund’s unencumbered U.S. Dollar denominated cash held at UMB Bank or its affiliates, plus ninety percent (90%) of the market or par value, whichever is less, for any U.S. Government or U.S. Agency Securities, with maturity of less than 5 years or eighty years or more, plus sixty percent (60%) of the value of the Fund’s liquid exchange-traded funds (EFTs) and other publicly-traded, liquid, investment grade equities listed on any tier of the Nasdaq Stock Market, the NYSE American or the New York Stock Exchange (NYSE), or any successor of such exchanges, plus twenty percent (20%) of the value of the Fund’s semi-liquid assets that may be liquidated within ninety (90) days. The interest rate on the borrowings from the Credit Agreements is equal to the Prime Rate minus twenty-five basis points, subject to a 3.50% rate floor, per annum. During the year ended March 31, 2024, there were no borrowings and $85,502 in unused borrowing fees were incurred.
13. Risk Factors
There can be no assurance that the investment objective of the Fund will be achieved or that the Fund’s portfolio design and risk monitoring strategies will be successful. The following list is not intended to be a comprehensive listing of all the potential risks associated with the Fund. The Fund’s prospectus provides further details regarding the Fund’s risks and considerations.
Private Equity Risk — There are inherent risks in investing in private equity companies, which are vehicles whose principal business is to invest in and lend capital to privately held companies. Generally, little public information exists for private and thinly traded companies, and there is a risk that private equity investors, like the Fund, may not be able to make a fully informed investment decision.
Private Credit Risk — Typically, private credit investments are in restricted securities that are not traded in public markets and subject to substantial holding periods, so that the Fund may not be able to resell some of its holdings for extended periods, which may be several years. The Fund’s investments are also subject to the risks associated with investing in private securities. Investments in private securities are illiquid, can be subject to various restrictions on resale, and there can be no assurance that the Fund will be able to realize the value of such investments in a timely manner. Additionally, private credit investments can range in credit quality depending on security-specific factors, including total leverage, amount of leverage senior to the security in question, variability in the issuer’s cash flows, the size of the issuer, the quality of assets securing debt and the degree to which such assets cover the subject company’s debt obligations.
Semi-Liquid Investment Risk — Semi-liquid investments do not offer investors full liquidity (i.e. such investments typically only offer monthly or quarterly liquidity).
General Economic and Market Conditions — The success of the Fund’s investment program may be affected by general economic and market conditions, such as interest rates, availability of credit, inflation rates, economic uncertainty, changes in laws, and national and international political circumstances. These factors may affect the level and volatility of securities prices and the liquidity of investments held by the Fund. Unexpected volatility or illiquidity could impair the Fund’s profitability or result in losses.
The United Kingdom (“UK”) left the European Union (“EU”) on January 31, 2020, and a transition period during which the UK and EU negotiated terms of departure ended on December 31, 2020. The departure is commonly referred to as “Brexit”. The UK and EU reached an agreement, effective January 1, 2021, on the terms of their future trading relationship, which principally relates to the trading of goods. Further discussions are expected to be held between the UK and the EU in relation to matters not covered by the trade agreement, such as financial services. Brexit may have significant political and financial consequences for the Eurozone markets and broader global economy, including greater volatility in the global stock markets and illiquidity, fluctuations in currency and exchange rates, and an increased likelihood of a recession in the UK. Securities issued by companies domiciled in the UK could be subject to changing regulatory and tax regimes. Banking and financial services companies that operate in the UK or EU could be disproportionately impacted by these actions. Further insecurity in EU membership or the abandonment of the euro could exacerbate market and currency
33
Bow River Capital Evergreen Fund |
NOTES TO THE FINANCIAL STATEMENTS (CONTINUED)
MARCH 31, 2024 |
volatility and negatively impact investments in securities issued by companies located in EU countries. Brexit also may cause additional member states to contemplate departing the EU, which would likely perpetuate political and economic instability in the region and cause additional market disruption in global financial markets. As a result, markets in the UK, Europe and globally could experience increased volatility and illiquidity, and potentially lower economic growth which in return could potentially have an adverse effect on the value of the Fund’s investments. Market disruption in the EU and globally may have a negative effect on the value of the Fund’s investments. Additionally, there could be additional risks if one or more additional EU member states seek to leave the EU.
International war or conflicts (including Russia’s invasion of Ukraine and the Israel-Hamas war) and geopolitical events in foreign countries, along with instability in regions such as Asia, Eastern Europe and the Middle East, possible terrorist attacks in the United States or around the world, and other similar events could adversely affect the U.S. and foreign financial markets. As a result, whether or not the Fund or and a Portfolio Fund invests in securities located in or with significant exposure to the countries directly affected, the value and liquidity of the Fund’s or a Portfolio Fund’s investments may be negatively impacted. Further, due to closures of certain markets and restrictions on trading certain securities, the value of certain securities held by the Fund or a Portfolio Fund could be significantly impacted.
Interest rates in the United States and many other countries have risen in recent periods and may continue to rise in the future. Additionally, the impairment or failure of one or more banks with whom the Fund or a Portfolio Fund transacts may inhibit the Fund’s or a Portfolio Fund’s ability to access depository accounts. In such cases, the Fund or a Portfolio Fund may be forced to delay or forgo investments, resulting in lower Fund performance. In the event of such a failure of a banking institution where the Fund or a Portfolio Fund holds depository accounts, access to such accounts could be restricted and the Federal Deposit Insurance Corporation (“FDIC”) protection may not be available for balances in excess of amounts insured by the FDIC. In such instances, the Fund or a Portfolio Fund may not recover such excess, uninsured amounts.
Direct Investments Risk — The Fund may make direct investments on an opportunistic basis. There can be no assurance that the Fund will be given direct investment opportunities, or that any direct investment offered to the Fund would be appropriate or attractive to the Fund. Direct investments generally are more concentrated than investments in portfolio companies, which generally hold multiple portfolio companies. Due diligence will be conducted on direct investment opportunities; however, the Adviser or Investment Consultant may not have the ability to conduct the same level of due diligence applied to portfolio company investments. In addition, there may be limited opportunities to negotiate the terms of such direct investments. However, in instances where the terms of a direct investment are negotiable, such terms may be heavily negotiated and may incur additional transactional costs for the Fund. As is typical in such matters, the Adviser or Investment Consultant, as applicable, generally will rely on the portfolio company manager or sponsor offering such direct investment opportunity to perform most of the due diligence on the relevant portfolio company and to negotiate terms of the direct investment.
Secondary Investments Risk — The overall performance of the Fund’s secondary investments will depend in large part on the acquisition price paid, which may be negotiated based on incomplete or imperfect information. Certain secondary investments may be purchased as a portfolio, and in such cases the Fund may not be able to exclude from such purchases those investments that the Adviser considers (for commercial, tax, legal or other reasons) less attractive. Where the Fund acquires a portfolio company interest as a secondary investment, the Fund will generally not have the ability to modify or amend such portfolio company’s constituent documents (e.g., limited partnership agreements) or otherwise negotiate the economic terms of the interests being acquired. In addition, the costs and resources required to investigate the commercial, tax and legal issues relating to secondary investments may be greater than those relating to primary investments.
Primary Fund Commitments Risk — The commitment to invest in newly created private equity funds, private credit funds, or other private funds, exposes the Fund to the risk of investing in funds with limited operating histories and the information the Fund will obtain about such investments may be limited. As such, the ability to evaluate past performance or to validate the investment strategies will be limited.
Liquid Credit Instruments Risk — Investments in liquid credit instruments are subject to the risks associated with investments in high-yield credit. High-yield/high risk bonds, or “junk” bonds, are bonds rated below investment-grade by the primary rating agencies, such as Standard & Poor’s, Fitch and Moody’s, or are unrated bonds of similar quality. The value of lower quality bonds generally is more
34
Bow River Capital Evergreen Fund |
NOTES TO THE FINANCIAL STATEMENTS (CONTINUED)
MARCH 31, 2024 |
dependent on credit risk than investment-grade bonds. Issuers of high-yield/high risk bonds may not be as strong financially as those issuing bonds with higher credit ratings and are more vulnerable to real or perceived economic changes, political changes or adverse developments specific to the issuer. In addition, the junk bond market can experience sudden and sharp price swings. Further, secondary markets for high-yield securities are less liquid than the market for investment-grade securities. Therefore, it may be more difficult to value the securities because valuation may require more research, and elements of judgment may play a larger role in the valuation because there is less reliable, objective data available.
Listed Private Equity Risk — Listed private equity companies are typically regulated vehicles listed on a public stock exchange that invest in private equity transactions or funds. Such vehicles may take the form of corporations, business development companies, unit trusts, publicly traded partnerships, or other structures, and may focus on mezzanine, infrastructure, buyout or venture capital investments. Listed private equity may also include investments in publicly listed companies in connection with a privately negotiated financing or an attempt to exercise significant influence on the subject of the investment. Listed private equity investments usually have an indefinite duration. Listed private equity occupies a small portion of the public equity universe, including only a few professional investors who focus on and actively trade such vehicles. As a result, relatively little market research is performed on listed private equity companies, only limited public data may be available regarding these vehicles and their underlying investments, and market pricing may significantly deviate from published net asset value. This can result in market inefficiencies and may offer opportunities to specialists that can value the underlying private equity investments. Listed private equity vehicles are typically liquid and capable of being traded daily, in contrast to direct investments and private equity funds, in which capital is subject to lengthy holding periods. Accordingly, listed private equity transactions are significantly easier to execute than other types of private equity investments, giving investors an opportunity to adjust the investment level of their portfolios more efficiently.
Exchange-Traded Funds Risk — The Fund may invest in long (or short) positions in ETFs. Through its positions in ETFs, the Fund will be subject to the risks associated with such vehicles’ investments, including the possibility that the value of the securities or instruments held by an ETF could decrease (or increase), and will bear its proportionate share of the ETF’s fees and expenses. In addition, certain of the ETFs may hold common portfolio positions, thereby reducing any diversification benefits.
Money Market Funds Risk — An investment in a money market fund is not a deposit of any bank and is not insured or guaranteed by the Federal Deposit Insurance Company or any other government agency. Certain money market funds seek to preserve the value of their shares at $1.00 per share, although there can be no assurance that they will do so, and it is possible to lose money by investing in such a money market fund. A major or unexpected increase in interest rates or a decline in the credit quality of an issuer or entity providing credit support, an inactive trading market for money market instruments, or adverse market, economic, industry, political, regulatory, geopolitical, and other conditions could cause the share price of such a money market fund to fall below $1.00. It is possible that such a money market fund will issue and redeem shares at $1.00 per share at times when the fair value of the money market fund’s portfolio per share is more or less than $1.00. Other money market funds price and transact at a “floating” NAV that will fluctuate along with changes in the market-based value of fund assets. Shares sold utilizing a floating NAV may be worth more or less than their original purchase price.
Closed-End Fund; Liquidity Limited to Periodic Repurchases of Shares — The Fund has been organized as a diversified, closed-end management investment company and designed primarily for long-term investors. An investor should not invest in the Fund if the investor needs a liquid investment. Closed-end funds differ from open-end management investment companies (commonly known as mutual funds) in that investors in a closed-end fund do not have the right to redeem their shares on a daily basis. Unlike most closed-end funds, which typically list their shares on a securities exchange, the Fund does not intend to list the Shares for trading on any securities exchange, and the Fund does not expect any secondary market to develop for the Shares. Although the Fund will offer a limited degree of liquidity by conducting semi-annual repurchase offers and periodic repurchase offers made at the sole discretion of the Board, a Common Shareholder may not be able to tender its Shares in the Fund promptly after it has made a decision to do so. There is no assurance that you will be able to tender your Shares when or in the amount that you desire. Furthermore, discretionary repurchases are made at the discretion of the Board and therefore, may not occur. In addition, with very limited exceptions, Shares are not transferable, and liquidity will be provided only through repurchase offers made semi-annually by the Fund, as well as periodically at the sole discretion of the Board. Shares are considerably less liquid than Shares of funds that trade on a stock exchange or Shares of open-end registered investment companies and are therefore, suitable only for investors who can bear the risks associated with illiquid shares and should be viewed as a long-term investment.
35
Bow River Capital Evergreen Fund |
NOTES TO THE FINANCIAL STATEMENTS (CONTINUED)
MARCH 31, 2024 |
Valuation Risk — Under the 1940 Act, the Fund is required to carry Fund Investments at market value or, if there is no readily available market value, at fair value as determined by the Fund’s Valuation Designee, in accordance with the Fund’s valuation policy, which has been approved by the Board and is consistent with the Adviser’s Valuation Policy. There is not a public market or active secondary market for many of the securities of the privately-held companies in which the Fund intends to invest. Rather, many of the Fund Investments may be traded on a privately negotiated over-the-counter secondary market for institutional investors. As a result, the Fund values these securities at fair value as determined in good faith by the Adviser, as Valuation Designee, in accordance with the Valuation Procedures.
The determination of fair value, and thus the amount of unrealized losses the Fund may incur in any year, is to a degree subjective. The Fund values these securities at fair value determined in good faith by the Valuation Designee in accordance with the Valuation Procedures. Because such valuations, and particularly valuations of private securities and private companies, are inherently uncertain, may fluctuate over short periods of time and may be based on estimates, the Fund’s determinations of fair value may differ materially from the values that would have been used if a ready market for these non-traded securities existed. Due to this uncertainty, the Fund’s fair value determinations may cause the Fund’s net asset value on a given date to understate or overstate materially the value that the Fund may ultimately realize upon the sale of one or more Fund Investments.
Capital Call Risk — The Fund may maintain a sizeable cash position in anticipation of funding capital calls or near-term investment opportunities. Even though the Fund may maintain a sizeable position in cash and short-term securities, it may not contribute the full amount of its commitment to a fund at the time of investment. Instead, the Fund will be required to make incremental contributions pursuant to capital calls issued from time to time by the underlying fund. If the Fund defaults on its commitment to an underlying fund or fails to satisfy capital calls to an underlying fund in a timely manner then, generally, it will be subject to significant penalties, including the complete forfeiture of the Fund’s investment in the underlying fund. Any failure by the Fund to make timely capital contributions in respect of its commitments may (i) impair the ability of the Fund and the Fund to pursue its investment strategy, (ii) force the Fund to borrow, (iii) indirectly cause the Fund, and, indirectly, the Investors to be subject to certain penalties from the Fund Investments (including the complete forfeiture of the Fund’s investment in an Investment Fund), or (iv) otherwise impair the value of the Fund’s investments (including the devaluation of the Fund).
Currency Risk — Although the Fund intends to invest predominantly in the United States, the Fund’s portfolio is anticipated to include investments in a number of different currencies. Any returns on, and the value of such investments may, therefore, be materially affected by exchange rate fluctuations, local exchange control, limited liquidity of the relevant foreign exchange markets, the convertibility of the currencies in question and/or other factors. A decline in the value of the currencies in which the Fund Investments are denominated against the U.S. Dollar may result in a decrease the Fund’s net asset value. The Adviser may or may not elect to hedge the value of investments made by the Fund against currency fluctuations, and even if the Adviser deems hedging appropriate, it may not be possible or practicable to hedge currency risk exposure. Accordingly, the performance of the Fund could be adversely affected by such currency fluctuations.
Foreign Investments and Emerging Markets Risk — The Fund may invest in the securities of non-U.S. issuers, including those located in developing countries, which securities involve risks beyond those associated with investments in U.S. securities. These risks may relate to foreign political, social and economic matters, less developed markets, political immobility and less developed legal and accounting practices.
Derivatives and Hedging — The Fund may invest and trade in a variety of derivative instruments to hedge the Fund’s primary Fund Investments, including options, swaps, futures contracts, forward agreements and other derivatives contracts. Derivatives are financial instruments or arrangements in which the risk and return are related to changes in the value of other assets, reference rates or indices. Transactions in derivative instruments present risks arising from the use of leverage (which increases the magnitude of losses), volatility, the possibility of default by a counterparty, and illiquidity. Use of derivative instruments for hedging or speculative purposes by the Adviser could present significant risks, including the risk of losses in excess of the amounts invested. The Fund’s ability to avoid risk through investment or trading in derivatives will depend on the ability to anticipate changes in the underlying assets, reference rates or indices.
LIBOR Transition Risk — Many financial instruments may be based on floating rates, such as the London Interbank Offered Rate (“LIBOR”), Euro Interbank Offered Rate and other similar types of reference rates. In July of 2017, the head of the United Kingdom Financial Conduct Authority (“FCA”) announced a desire to phase out the use of LIBOR at the end of 2021. Most LIBOR
36
Bow River Capital Evergreen Fund |
NOTES TO THE FINANCIAL STATEMENTS (CONTINUED)
MARCH 31, 2024 |
settings are no longer published as of December 31, 2021. Overnight and 12-month U.S. dollar LIBOR settings permanently ceased after publication on June 30, 2021. The 1-, 3- and 6-month U.S. dollar LIBOR settings will continue to be published using a synthetic methodology until September 2024. Neither the effect of the LIBOR transition process nor its ultimate success can yet be known. Although the transition away from LIBOR has become increasingly well-defined, any potential effects of the transition away from LIBOR and other benchmark rates on financial markets, a fund or the financial instruments in which a fund invests can be difficult to ascertain. Not all existing LIBOR-based instruments may have alternative rate-setting provisions and there remains uncertainty regarding the willingness and ability of issuers to add alternative rate-setting provisions in certain existing instruments. Global regulators have advised market participants to cease entering into new contracts using LIBOR as a reference rate, and it is possible that investments in LIBOR-based instruments could invite regulatory scrutiny. In addition, a liquid market for newly-issued instruments that use a reference rate other than LIBOR still may be developing. All of the aforementioned may adversely affect the Fund or a Portfolio Fund’s performance or NAV.
SOFR Risk — SOFR is intended to be a broad measure of the cost of borrowing funds overnight in transactions that are collateralized by U.S. Treasury securities. SOFR is calculated based on transaction-level repurchase data collected from various sources. For each trading day, SOFR is calculated as a volume-weighted median rate derived from such data. SOFR is calculated and published by the Federal Reserve Bank of New York (“FRBNY”). If data from a given source required by the FRBNY to calculate SOFR is unavailable for any day, then the most recently available data for that segment will be used, with certain adjustments. If errors are discovered in the transaction data or the calculations underlying SOFR after its initial publication on a given day, SOFR may be republished at a later time that day. Rate revisions will be effected only on the day of initial publication and will be republished only if the change in the rate exceeds one basis point.
Because SOFR is a financing rate based on overnight secured funding transactions, it differs fundamentally from LIBOR. LIBOR is intended to be an unsecured rate that represents interbank funding costs for different short-term maturities or tenors. It is a forward-looking rate reflecting expectations regarding interest rates for the applicable tenor. Thus, LIBOR is intended to be sensitive, in certain respects, to bank credit risk and to term interest rate risk. In contrast, SOFR is a secured overnight rate reflecting the credit of U.S. Treasury securities as collateral. Thus, it is largely insensitive to credit-risk considerations and to short-term interest rate risks. SOFR is a transaction-based rate, and it has been more volatile than other benchmark or market rates, such as three-month LIBOR, during certain periods. For these reasons, among others, there is no assurance that SOFR, or rates derived from SOFR, will perform in the same or similar way as LIBOR would have performed at any time, and there is no assurance that SOFR-based rates will be a suitable substitute for LIBOR. SOFR has a limited history, having been first published in April 2018. The future performance of SOFR, and SOFR-based reference rates, cannot be predicted based on SOFR’s history or otherwise. Levels of SOFR in the future, including following the discontinuation of LIBOR, may bear little or no relation to historical levels of SOFR, LIBOR or other rates.
Large Shareholder Risk — From time to time, and at present, a significant percentage of the Fund’s shares may be owned or controlled by one or more large shareholders, including shareholders that are affiliated with either the Fund, the Adviser, or both. Accordingly, in these instances, the Fund is subject to increased risks related to potential large-scale outflows as the result of participation in fund repurchase offers by these significant shareholders. Although the Fund’s structure mitigates this risk by only providing liquidity through Required Repurchases and Discretionary Repurchases, transactions to accommodate outflows associated with repurchase participation by these large shareholders could cause the fund to sell portfolio investments at inopportune times, potentially negatively affecting the Fund’s net asset value and performance. In the case of investments by affiliates of the Fund or Adviser, conflicts of interest may exist, including the possibility that the Fund will be able to attract more assets from third-party investors because of the affiliate’s investment, thereby growing the Fund and increasing the management fees received by the Adviser.
14. Beneficial Ownership
The beneficial ownership, either directly or indirectly, of more than 25% of the voting securities of the Fund creates a presumption of control under Section 2(a)(9) of the 1940 Act. As of March 31, 2024, First Premier Bank, for the benefit of their customers, owned 27.87% of Class II Shares of the Fund. No persons or entities own, either directly or indirectly, more than 25% of the outstanding shares of Class I.
37
Bow River Capital Evergreen Fund |
NOTES TO THE FINANCIAL STATEMENTS (CONTINUED)
MARCH 31, 2024 |
15. Subsequent Events
Effective April 1, 2024 there were subscriptions to Class I Shares in the amount of $15,394,801 and $375,000 to Class II Shares. Effective May 1, 2024 there were subscriptions to Class I Shares in the amount of $14,054,247 and $2,026,100 to Class II Shares.
On May 31, 2024, the Fund completed a Required Repurchase Offer. At the time of this report mailing, the results of the offer were not known. The results of the offer will be disclosed in the semi-annual report to shareholders dated September 30, 2024.
The Fund has evaluated subsequent events through the date the financial statements were issued and has determined that there were no other subsequent events that require disclosure in or adjustment to the financial statements.
38
Bow River Capital Evergreen Fund |
REPORT OF INDEPENDENT REGISTERED PUBLIC ACCOUNTING FIRM |
To the Shareholders and Board of Trustees of
Bow River Capital Evergreen Fund
Opinion on the Financial Statements
We have audited the accompanying statement of assets and liabilities, including the schedule of investments, of Bow River Capital Evergreen Fund (the “Fund”) as of March 31, 2024, the related statements of operations and cash flows for the year then ended, the statements of changes in net assets for each of the two years in the period then ended, the financial highlights for each of the three years in the period then ended and for the period January 1, 2021 (commencement of operations) through March 31, 2021, and the related notes (collectively referred to as the “financial statements”). In our opinion, the financial statements present fairly, in all material respects, the financial position of the Fund as of March 31, 2024, the results of its operations and its cash flows for the year then ended, the changes in net assets for each of the two years in the period then ended, and the financial highlights for each of the three years in the period then ended and for the period January 1, 2021 (commencement of operations) through March 31, 2021, in conformity with accounting principles generally accepted in the United States of America.
Basis for Opinion
These financial statements are the responsibility of the Fund’s management. Our responsibility is to express an opinion on the Fund’s financial statements based on our audits. We are a public accounting firm registered with the Public Company Accounting Oversight Board (United States) (“PCAOB”) and are required to be independent with respect to the Fund in accordance with the U.S. federal securities laws and the applicable rules and regulations of the Securities and Exchange Commission and the PCAOB.
We conducted our audits in accordance with the standards of the PCAOB. Those standards require that we plan and perform the audit to obtain reasonable assurance about whether the financial statements are free of material misstatement whether due to error or fraud.
Our audits included performing procedures to assess the risks of material misstatement of the financial statements, whether due to error or fraud, and performing procedures that respond to those risks. Such procedures included examining, on a test basis, evidence regarding the amounts and disclosures in the financial statements. Our procedures included confirmation of securities owned as of March 31, 2024, by correspondence with the custodian, private investment counterparties, and brokers; when replies were not received from underlying private investment counterparties, we performed other auditing procedures. Our audits also included evaluating the accounting principles used and significant estimates made by management, as well as evaluating the overall presentation of the financial statements. We believe that our audits provide a reasonable basis for our opinion.
We have served as the Fund’s auditor since 2020.

COHEN & COMPANY, LTD.
Cleveland, Ohio
May 30, 2024
39
Bow River Capital Evergreen Fund |
TRUSTEES AND OFFICERS
MARCH 31, 2024 (Unaudited) |
INDEPENDENT TRUSTEES |
NAME,
AND YEAR
OF BIRTH | POSITION(S)
WITH THE
FUND | LENGTH
OF TIME
SERVICED* | PRINCIPAL OCCUPATION(S)
DURING PAST 5 YEARS | PORTFOLIOS
IN FUND
COMPLEX
OVERSEEN
BY TRUSTEE | OTHER
DIRECTORSHIPS**
HELD BY TRUSTEE |
Jeremy May (1970) | Chairman and
Trustee | Since
Inception | Founder and CEO of Paralel Technologies, LLC (a fintech firm) and its wholly owned subsidiaries, Paralel Advisors (a registered investment adviser) and Paralel Distributors (a registered broker/dealer) (Since October 2019); Previously, President and Director of ALPS Fund Services, Inc., ALPS Distributors, Inc., and ALPS Portfolio Solutions Distributor, Inc., Executive Vice President and Director of ALPS Holdings, Inc. and ALPS Advisors, Inc. (1995 to 2019). | 1 | Russell Investment Company and Russell Investment Funds (40 funds) (since 2021); New Age Alpha ETF Trust (2020 to 2022); Reaves Utility Income Fund (2009 to 2021); ALPS Series Trust (9 funds) (2012 to 2021); RiverNorth Opportunities Fund, Inc. (2018 to 2019). |
Michael Imhoff (1963) | Trustee | Since
Inception | Managing Director of Stifel (full-service investment firm) (Since 2000); Previously, other roles at Stifel (Since 1987). | 1 | N/A |
Jack Swift (1973) | Trustee | Since
Inception | Co-Founder and CEO of Liminal Collective (a human performance company) (since 2023); President and Chief Revenue Officer of TIFIN (a financial technology company) (2019 to 2023); Previously, Partner and President of Crestone Capital, LLC (investment management and wealth advisory firm) (2016 to 2019). | 1 | Advisor of Vantage Discovery (since 2024); Advisor of Brightwave (since 2024); Member Of The Board Of Advisors at Magnifi (2020 to 2023); Chairman of the Board at Clout (2020 to 2023). |
INTERESTED TRUSTEE AND OFFICERS |
NAME | POSITION(S)
WITH THE
FUND | LENGTH
OF TIME
SERVICED* | PRINCIPAL OCCUPATION(S)
DURING PAST 5 YEARS | PORTFOLIOS
IN FUND
COMPLEX
OVERSEEN
BY TRUSTEE | OTHER
DIRECTORSHIPS**
HELD BY TRUSTEE |
Jeremy Held***
(1974) | Trustee and President | Since Inception | Managing Director, Bow River Advisers (since 2023); Managing Director, Bow River Capital (Since 2019); Previously, Chief Investment Officer, ALPS Advisors, Inc. (investment management company) (2007 to 2019). | 1 | Director, Principal Real Estate Income Fund (Since 2017) |
40
Bow River Capital Evergreen Fund |
TRUSTEES AND OFFICERS (CONTINUED)
MARCH 31, 2024 (Unaudited) |
INTERESTED TRUSTEE AND OFFICERS (Continued) |
NAME | POSITION(S)
WITH THE
FUND | LENGTH
OF TIME
SERVICED* | PRINCIPAL OCCUPATION(S)
DURING PAST 5 YEARS | PORTFOLIOS
IN FUND
COMPLEX
OVERSEEN
BY TRUSTEE | OTHER
DIRECTORSHIPS**
HELD BY TRUSTEE |
Rich Wham
(1964) | Vice President | Since Inception | Chairman, Bow River Capital (Since 2017). | 1 | N/A |
Jane Ingalls
(1966) | Vice President and Secretary | Since Inception | President, Bow River Advisers (since 2024); Chief Operating Officer, Bow River Advisers (since 2023); Chief Operating Officer (since 2022); Managing Director and Chief of Staff, Bow River Capital (2020 to 2022); Previously, Founder and President, Artemis Consulting Group (2007 to 2020). | 1 | N/A |
Derek Mullins
(1973) | Treasurer | Since Inception | Managing Partner, PINE Advisor Solutions (provider of outsourced non-investment fund services) (since 2018). | 1 | N/A |
John Blue
(1977) | Chief Compliance Officer | Since Inception | Managing Partner, PINE Advisor Solutions (provider of outsourced non-investment fund services) (Since 2018). | 1 | N/A |
Marcie McVeigh
(1979) | Assistant Treasurer | Since Inception | Director, Head of PFO Services, PINE Advisor Solutions (provider of outsourced non-investment fund services) (Since 2020); Assistant Vice President and Performance Measurement Manager at Brown Brothers Harriman (financial services firm) (2019 to 2020). | 1 | N/A |
James Kerr (1983) | Assistant Secretary | Since March 2021 | Chief Compliance Officer, Bow River Advisers (since 2023); Chief Compliance Officer & General Counsel, Bow River Capital (since 2021); Previously, Senior Legal Counsel (2021) and Legal Counsel (2018 to 2021), Janus Henderson Investors U.S.; Assistant Secretary, Janus Detroit Street Trust (ETF Trust) and Assistant Secretary, Clayton Street Trust (VIT Trust) (2018 to 2021). | 1 | N/A |
The Fund’s Statement of Additional Information includes additional information about the Trustees and is available without charge and upon request by calling 1-303-861-8466, or visiting www.bowriverevergreen.com.
41
Bow River Capital Evergreen Fund |
ADDITIONAL INFORMATION
MARCH 31, 2024 (Unaudited) |
Proxy Voting Policy — A description of the policies and procedures that the Fund uses to vote proxies relating to portfolio securities is available without charge upon request by calling toll-free 1-888-330-3350, or on the SEC’s website at www.sec.gov. Information regarding how the Fund voted proxies relating to portfolio securities during the most recent 12-month period ended June 30 is available without charge upon request by calling toll-free 1-888-330-3350, or on the SEC’s website at www.sec.gov.
Portfolio Holdings — The Fund files its complete schedule of portfolio holdings with the SEC for the first and third quarters of each fiscal year on Form N-PORT. Form N-PORT is available on the SEC’s website at http://www.sec.gov. The information on Form N-PORT is available without charge, upon request, by calling 1-888-330-3350.
Approval of Investment Management Agreement and Investment Consultant Agreement
Approval of Investment Management Agreement
At a special meeting of the Board of Trustees of the Fund (the “Board”) held on October 31, 2023, the entire Board, including all of the Trustees who are not “interested persons” (as defined in the Investment Company Act of 1940, as amended), (the “Independent Trustees”), discussed and approved the New Advisory Agreement between Bow River Advisers, LLC (“Bow River Advisers” or the “Adviser”) and the Fund, as well as the Interim Agreement. In considering information relating to the approval of the New Advisory Agreement and Interim Agreement, the Board and the Independent Trustees received assistance and advice from its counsel who had provided the Board with a written description of their responsibilities in considering each of the New Advisory Agreement and Interim Agreement.
Independent legal counsel, on behalf of the Independent Trustees, had requested a variety of information from the Adviser, which the Adviser provided to the Board in advance of the Board meeting held on October 31, 2023. At the Board meeting, the Trustees discussed those materials and the transaction pursuant to which New York Life Investment Management Holdings LLC a Delaware limited liability company (“NYLIM,”) would acquire a minority interest in the Adviser (the “Investment Transaction”) with representatives of both Bow River Advisers and NYLIM, including the strategic rationale for the Investment Transaction. In addition, at the October 31, 2023 Board meeting, the Independent Trustees met in executive sessions with their independent legal counsel, at which no representative of either the Adviser or NYLIM was present.
In making the decision to approve each agreement, the Independent Trustees gave attention to all information furnished. The following discussion identifies the material factors taken into account by the Board in approving the New Advisory Agreement. The Board did not identify any one factor as dispositive, and each Board member may have attributed different weights to the factors considered.
The nature, extent, and quality of services to be provided to the Fund by Bow River Advisers. The Board considered the materials provided describing the services to be provided by Bow River Advisers to the Fund, as well their conversations with both Bow River Advisers and NYLIM. In reviewing the nature, extent, and quality of services to be provided to the Fund, the Board considered, among other things: that the New Advisory Agreement will be identical to both the existing advisory agreement and the Interim Agreement (except for certain provisions contained in the Interim Agreement that are different, as required by law); that Bow River Advisers’ services and the current portfolio management team would not change as a result of the Investment Transaction. Further, because the Board considered that the Fund’s investment objective and investment strategies will not change, the investment advisory personnel of Bow River Advisers who provide advisory services to the Fund are expected to remain the same, and Bow River Advisers will continue to provide the same advisory services to the Fund for the same fees subject to the oversight of the Board of Trustees, there would not be any detrimental effects to the Adviser’s management of the Fund.
Based on its consideration and review of the foregoing and other information, the Board determined that the Fund was likely to benefit from the nature, extent, and quality of services to be provided by Bow River Advisers, as well as Bow River Advisers’ ability to render such services based on its experience, operations, and resources, as well as the experience, operations and resources of NYLIM.
Comparison of the fees to be charged by Bow River Advisers. The Board considered Bow River Advisers’ proposed advisory fee structure, noting that it was identical to the structure under the Existing Advisory Agreement. The Board noted that the Fund’s advisory fee was calculated on average daily managed assets (as defined in the New Advisory Agreement) and its 1.75% advisory fee, on a net and gross basis, was within the range of comparable peers identified in the report provided by FUSE Research Network and at approximately
42
Bow River Capital Evergreen Fund |
ADDITIONAL INFORMATION (CONTINUED)
MARCH 31, 2024 (Unaudited) |
the median on a total net expenses basis, as compared to those peers. The Board also noted that Bow River Advisers would maintain its expense limitation and reimbursement agreement with the Fund, in order to cap the costs paid by shareholders, and that such agreement was only terminable by the Board. Accordingly, the Board determined that the fees for the New Advisory Agreement were reasonable.
Profitability and Economies of Scale. The Board considered and reviewed information concerning the costs incurred and profits realized by the Adviser from its relationship with the Fund, including that the Adviser believed that the Investment Transaction has the potential to increase the Fund’s growth over time, which could result in economies of scale being realized by the Fund and its shareholders. In addition, the Adviser noted that an increase in the size of the Fund could allow the Fund to engage in a wider variety of investments and also could create additional liquidity.
Other Factors. Finally, the Board noted that Bow River Advisers and the Fund had agreed that they will use their respective reasonable best efforts to comply with all of the requirements of Section 15(f), thus allowing Bow River Advisers to rely upon the safe harbor afforded by Section 15(f). In addition, the Board noted that Bow River Advisers and NYLIM had agreed to pay all expenses of the Fund in connection with the Board’s consideration of the New Advisory Agreement and all costs of this proxy solicitation. As a result, the Fund will bear no costs in seeking shareholder approval of the New Advisory Agreement.
Conclusion. Based on the totality of the information considered, the Trustees concluded that the Fund was likely to benefit from the nature, extent and quality of Bow River Advisers’ services and that Bow River Advisers has the ability to provide these services based on its experience, operations and resources, as well as the experience, operations and resources of NYLIM. After evaluation of the considerations described above, and in light of the nature, extent and quality of services to be provided by Bow River Advisers, the Trustees, including a majority of the Independent Trustees, in keeping with its fiduciary obligations to shareholders, approved the New Advisory Agreement as being in the best interests of shareholders.
Approval of Investment Consultant Agreement
At a special meeting of the Board held on October 31, 2023, the entire Board, including all of the Independent Trustees, discussed and approved the New Investment Consultant Agreement between Bow River Advisers and Aksia CA LLC (“Aksia”), as well as the Interim Investment Consultant Agreement. In considering information relating to the approval of the New Investment Consultant Agreement, the Board and the Independent Trustees received assistance and advice from its counsel who had provided the Board with a written description of their responsibilities in considering the New Investment Consultant Agreement.
Independent legal counsel, on behalf of the Independent Trustees, had requested a variety of information from Aksia, which Aksia provided to the Board in advance of the Board meeting held on October 31, 2023. At the Board meeting, the Trustees discussed those materials and met in executive sessions with their independent legal counsel.
In making the decision to approve the New Investment Consultant Agreement, the Independent Trustees gave attention to all information furnished. The following discussion identifies the material factors taken into account by the Board in approving the New Investment Consultant Agreement. The Board did not identify any one factor as dispositive, and each Board member may have attributed different weights to the factors considered.
The nature, extent, and quality of services to be provided to the Fund by Aksia. The Board reviewed and considered the nature and extent of the investment consultant services provided by Aksia to the Adviser, and therefore the Fund, under the New Investment Consultant Agreement, including the recommendation of Fund investments. The Board noted that Investment Transaction would not impact the services provided and Aksia would continue to source investments and assist in the due diligence process, but serve as a non-discretionary consultant and have no involvement in investment decisions, any related negotiations, or the finalization of any investment. The Board also reviewed and considered the nature and extent of the non-advisory, administrative services provided by Aksia, including, among other things, providing office facilities, equipment, and personnel. The Board also reviewed and considered the qualifications of the key personnel of Aksia who provide the investment consulting and/or administrative services to the Fund.
Based on its consideration and review of the foregoing and other information, the Board determined that the Fund was likely to benefit from the nature, extent, and quality of services to be provided by Aksia, as well as Aksia’s ability to render such services based on its experience, operations, and resources.
43
Bow River Capital Evergreen Fund |
ADDITIONAL INFORMATION (CONTINUED)
MARCH 31, 2024 (Unaudited) |
Fees and Expenses. The Board reviewed the proposed investment consultant fee to be paid to Aksia under the New Investment Consultant Agreement and noted that such fee was identical to that which is paid under the existing investment consultant agreement. They also noted that the fee is paid by the Adviser out of the Adviser’s investment management fee. Accordingly, the Board determined that the fees for the New Investment Consultant Agreement were reasonable.
Profitability and Economies of Scale. The Board considered Aksia’s assets under management and discussed Aksia’s responses regarding its financial condition and its methodology for allocating its expenses to the funds to which it provides services, including the Fund; but did not consider specific information concerning the costs incurred and profits realized by Aksia from its relationship with the Fund. The Board determined that the compensation to Aksia was reasonable and the financial condition was adequate. The Board also determined that, given the Fund’s current size, economies of scale were not present at this time.
Other Factors. The Board also discussed other benefits that may be received by Aksia from its service to the Adviser with respect to Fund, including, without limitation, the ability to market its consulting services for similar products in the future. The Board noted that Aksia did not have affiliations with the Fund’s transfer agent, administrator, custodian or distribution agent and therefore does not derive any benefits from the relationships these parties may have with the Fund. The Board concluded that the consultancy fees were reasonable in light of the fall-out benefits.
Conclusion. Based on the totality of the information considered, the Trustees concluded that the Fund was likely to benefit from the nature, extent and quality of Aksia’s services and that Aksia has the ability to provide these services based on its experience, operations and resources. After evaluation of the considerations described above, and in light of the nature, extent and quality of services to be provided by Aksia, the Trustees, including a majority of the Independent Trustees, approved the New Investment Consultant Agreement.
Results of a Special Meeting of Shareholders — A special meeting of shareholders was held on December 22, 2023. The matters were voted on by shareholders of record as of November 1, 2023 and the results of the vote at the shareholder meeting held on December 22, 2023 are as follows:
1. Approval of a new investment advisory agreement with Bow River Advisers, LLC (the “Adviser”) that will replace the current investment advisory agreement with the Adviser.
| | Proposal One |
Consent (C) | | 5,629,740 |
Consent Withheld (CW) | | 11,146 |
Abstain (A) | | 37,594 |
Total Received | | 5,678,480 |
Outstanding | | 10,076,766 |
2. Approval of a new investment consultant agreement between the Adviser and Aksia CA LLC (“Aksia”) that will replace the current investment consultant agreement between the Adviser and Aksia.
| | Proposal Two |
Consent (C) | | 5,627,233 |
Consent Withheld (CW) | | 11,146 |
Abstain (A) | | 40,101 |
Total Received | | 5,678,480 |
Outstanding | | 10,076,766 |
44
Bow River Capital Evergreen Fund |
PRIVACY NOTICE |
Bow River Capital Evergreen Fund (“we,” “us,” or the “Fund”) respects your right to privacy. We are committed to maintaining the confidentiality and integrity of nonpublic personal information. We want our investors and prospective investors to understand what information we collect and how we use it. “Nonpublic personal information” is defined as personally identifiable information about you. We do not sell your personal information, and we do not disclose it to anyone except as permitted or required by law or as described in this notice.
CONFIDENTIALITY & SECURITY
We take our responsibility to protect the privacy and confidentiality of investors’ and prospective investors’ information very seriously. We maintain appropriate physical, electronic, and procedural safeguards to guard nonpublic personal information. Our network is protected by firewall barriers, encryption techniques, and authentication procedures, among other safeguards, to maintain the security of your information. We provide this Privacy Notice to investors at the start of new relationships and annually after that. We continue to adhere to the practices described herein after investors’ accounts close. Furthermore, vendors with access to nonpublic personal information undergo an annual due diligence verification process to ensure their informational safeguards adhere to our strict standards.
WHY WE COLLECT YOUR INFORMATION
Bow River Capital Evergreen Fund gathers information about our investors and their accounts to (1) know investors’ identities and thereby prevent unauthorized access to confidential information; (2) design and improve the products and services we offer to investors; and (3) comply with the laws and regulations that govern us.
HOW WE PROTECT YOUR INFORMATION
To fulfill our privacy commitment for prospective, current, and former investors, Bow River Capital Evergreen Fund has safeguards in place to protect nonpublic personal information. Safeguards include, but are not limited to:
• Policies and procedures to protect your nonpublic information and comply with federal and state regulations; and
• Contractual agreements with third-party service providers to protect your nonpublic personal information.
INFORMATION WE COLLECT
Bow River Capital Evergreen Fund is required by industry guidelines to obtain personal information about you in providing investment management services to you. We use this information to manage your account, direct your financial transactions, and provide you with valuable information about the assets we manage for you. We gather information from documents you provide to us, forms that you complete, and personal interviews. This information may include:
• Your name, address, and social security number;
• Proprietary information regarding your beneficiaries;
• Information regarding your earned wages and other sources of income;
• The composition and value of your managed portfolio;
• Historical information we receive and maintain relating to transactions made on your behalf by Bow River Capital Evergreen Fund, your custodian, or others;
• Information we receive from your institutional financial advisor, investment consultant, or other financial institutions with whom Bow River Capital Evergreen Fund has a relationship and/or with whom you may be authorized us to gather and maintain such information.
45
Bow River Capital Evergreen Fund |
PRIVACY NOTICE (CONTINUED) |
SHARING INFORMATION WITH NON-AFFILIATED THIRD PARTIES
We only disclose nonpublic investor information to non-affiliated third parties (e.g. investor’s custodian or broker) without prior investor consent when we believe it necessary to conduct our business or as required or permitted by law such as:
• If you request or authorize the disclosure of the information;
• To provide investor account services or account maintenance;
• To respond to regulatory authorities, a subpoena or court order, judicial process, or law enforcement;
• To perform services for the Fund, or on its behalf, to maintain business operations and services;
• To help us to prevent fraud;
• With attorneys, accountants, and auditors of the Fund;
• To comply with federal, state, or local laws, rules, and other applicable legal requirements.
We do not sell your information and do not make any disclosure of investor nonpublic personal information to other companies who may want to sell their products or services to you.
OPT-OUT NOTICE
If, at any time in the future, it is necessary to disclose any investor personal information in a way that is inconsistent with this notice, Bow River Capital Evergreen Fund will provide you with proper advanced notice of the proposed disclosure so that you will have the opportunity to either opt-in or opt-out of such disclosure, as required by applicable law.
If you have any questions about this Privacy Notice, please contact John Blue, Chief Compliance Officer of Bow River Capital Evergreen Fund at jb@pineadvisorsolutions.com.
46
| | |
| | | Adviser:
Bow River Advisers, LLC
205 Detroit Street, Suite 800
Denver, CO 80206 |
| | | Distributor:
Foreside Financial Services, LLC
3 Canal Plaza #100
Portland, ME 04101 |
(b) There were no notices transmitted to stockholders in reliance on Rule 30e-3 under the Investment Company Act of 1940, as amended, that contained disclosures specified by paragraph (c)(3) of that rule.
Item 2. Code of Ethics.
The Registrant has a code of ethics (the “Code”) that applies to the Registrant’s principal executive officer and principal financial officer. During the period covered by this report, there were no material amendments to the provisions of the Code, nor were there any implicit or explicit waivers to the provisions of the Code. The Code is filed herewith.
Item 3. Audit Committee Financial Expert.
(a) (1) The Board of Trustees of the Registrant (the “Board”) has determined that the Registrant has at least one Board member serving on the Audit Committee that possesses the attributes identified in Instruction 2(b) of Item 3 to Form N-CSR to qualify as an “audit committee financial expert.”
(2) Jeremy May is the Registrant’s audit committee financial expert and is “independent” for purposes of Item 3(a)(2) to Form N-CSR.
Item 4. Principal Accountant Fees and Services.
The aggregate fees for professional services by Cohen & Company, Ltd. during the Registrant’s last two fiscal years were as follows:
(a) Audit Fees.
| Fiscal year ended March 31, 2024 | | $ | 245,000 | |
| Fiscal year ended March 31, 2023 | | $ | 160,000 | |
(b) Audit-Related Fees. These are fees by the Registrant’s independent auditors for assurance and related services that were reasonably related to the performance of the audit of the Registrant’s financial statements that are not reported under “Audit Fees”.
| Fiscal year ended March 31, 2024 | | $ | 0 | |
| Fiscal year ended March 31, 2023 | | $ | 0 | |
(c) Tax Fees. These are fees billed for professional services rendered by the Registrant’s independent auditors for tax compliance, tax advice, and tax planning.
| Fiscal year ended March 31, 2024 | | $ | 30,000 | |
| Fiscal year ended March 31, 2023 | | $ | 28,000 | |
(d) All Other Fees.
| Fiscal year ended March 31, 2024 | | $ | 0 | |
| Fiscal year ended March 31, 2023 | | $ | 0 | |
(e) Audit Committee’s pre-approval policies and procedures.
| (1) | The Audit Committee has adopted pre-approval policies and procedures that require the Audit Committee to pre-approve all audit and non-audit services of the Registrant, including services provided to the Registrant’s investment adviser or any entity controlling, controlled by or under common control with the Registrant’s investment adviser that provides ongoing services to the Registrant with respect to any engagement that directly relates to the operations and financial reporting of the Registrant. |
| (2) | None of the services described in paragraphs (b) through (d) of this Item 4 were approved by the audit committee pursuant to paragraph (c)(7)(i)(C) of Rule 2- 01 of Regulation S-X. |
(f) None.
(g) None.
(h) Not applicable.
(i) Not applicable.
(j) Not applicable.
Item 5. Audit Committee of Listed Registrants.
Not applicable.
Item 6. Schedule of Investments.
(a) Included as part of the report to shareholders filed under Item 1 of this Form N-CSR.
(b) Not applicable.
Item 7. Disclosure of Proxy Voting Policies and Procedures for Closed-End Management Investment Companies.
The Registrant’s Proxy Voting Policies and Procedures is attached hereto as Exhibit 13(c).
Item 8. Portfolio Managers of Closed-End Management Investment Companies.
(a)(1) Identification of Portfolio Manager(s) or Management Team Members and Description of Role of Portfolio Manager(s) or Management Team Members as of May 30, 2024.
Jeremy Held
Jeremy Held, CFA, is currently responsible for Bow River Capital’s registered asset management business and serves as the President and Chairman of the Investment Committee for the Bow River Capital Evergreen Fund. Prior to joining BRAM in 2019, Mr. Held was the Director of Research and Chief Investment Officer (CIO) at ALPS Advisors, a Denver-based asset manager that specializes in registered fund vehicles focused on real assets and alternative investments. Mr. Held began his career at ALPS in 1996 and helped lead a variety of business initiatives over two decades, including the launch of the firm’s asset management business in 2007. Mr. Held was ultimately responsible for all aspects of the ALPS Advisors business, overseeing 44 registered investment companies and more than $20 billion in assets. Mr. Held has significant investment oversight experience, advising several registered mutual fund boards and serving as President of Red Rocks Capital, a wholly-owned subsidiary of ALPS focused on Listed Private Equity investments.
Mike Trihy
Mike Trihy, CFA, serves as the Lead Portfolio Manager of the Fund and is responsible for portfolio construction, asset allocation and investment research for the Fund. Prior to joining BRAM in 2019, Mr. Trihy was a Portfolio Manager at Partners Group, a Swiss-based global private markets manager. Mike joined Partners Group in January 2017 and was responsible for the day-to-day portfolio management for separate account and evergreen fund mandates in the Americas region, including the largest private equity-focused tender offer fund globally. During his time as Portfolio Manager, the evergreen funds under his mandate delivered consistent total returns with low levels of volatility, while maintaining appropriate liquidity and a high level of portfolio diversification. He has constructed portfolios across multiple asset classes, including private equity, real assets, private credit, and liquid investments (equity and credit). Before his time at Partners Group, Mr. Trihy and Mr. Held worked together for six years when Mr. Trihy served as a Client Portfolio Manager at Red Rocks Capital, a Denver-based asset manager focused on Listed Private Equity investments. He was responsible for investment research and portfolio management of the firm’s equity index products.
(a)(2) Other Accounts Managed by Portfolio Manager(s) or Management Team Member and Potential Conflicts of Interest
The following tables provide information about portfolios and accounts, other than the Registrant, for which the portfolio managers are primarily responsible for the day-to-day portfolio management as of March 31, 2024:
| | | Registered
investment
companies | | | Other pooled
investment
vehicles | | | Other
accounts | | | Registered
investment
companies | | | Other pooled
investment vehicles | | | Other accounts | |
| Jeremy Held | | | 0 | | | | 0 | | | | 0 | | | | 0 | | | | 0 | | | | 0 | |
| Mike Trihy | | | 0 | | | | 0 | | | | 0 | | | | 0 | | | | 0 | | | | 0 | |
Potential Conflicts of Interests
The Investment Team may manage separate accounts or other pooled investment vehicles that may have materially higher or different fee arrangements than the Fund and may also be subject to performance-based fees. The side-by-side management of these separate accounts and pooled investment vehicles may raise potential conflicts of interest relating to cross-trading and the allocation of investment opportunities. The Adviser has a fiduciary responsibility to manage all client accounts in a fair and equitable manner. The Adviser seeks to provide best execution of all securities transactions and to allocate investments to client accounts in a fair and reasonable manner. To this end, the Adviser has developed policies and procedures designed to mitigate and manage the potential conflicts of interest that may arise from side-by-side management.
(a)(3) Compensation Structure of Portfolio Manager(s) or Management Team Members as of March 31, 2024.
A competitive base salary and a performance-based bonus structure are in place for all team members. Members of the Investment Team, analysts, and other associates are paid a competitive base salary and discretionary bonus based on their fiduciary investment responsibilities, performance of the individual, and performance of the firm. The discretionary bonus structure gives the Adviser the ability to remain competitive under current market conditions affecting compensation across the industry. The discretionary bonus may be payable in both cash and equity.
(a)(4) Disclosure of Securities Ownership
The following tables set forth the dollar range of equity securities beneficially owned by each of the portfolio managers in the Registrant as of March 31, 2024:
| Portfolio Manager | | Dollar Range of Registrant
Shares Beneficially Owned |
| Jeremy Held | | $100,001-$500,000 |
| Mike Trihy | | $50,000-$100,000 |
(b) Not applicable.
Item 9. Purchases of Equity Securities by Closed-End Management Investment Company and Affiliated Purchasers.
There were no purchases made by or on behalf of the registrant or any “affiliated purchaser,” as defined in Rule 10b-18(a)(3) under the Exchange Act (17 CFR 240.10b-18(a)(3)), of shares or other units of any class of the registrant’s equity securities that is registered by the registrant pursuant to Section 12 of the Exchange Act (15 U.S.C. 781).
There were no purchases that do not satisfy the conditions of the safe harbor of Rule 10b-18 under the Exchange Act (17 CFR 240.10b-18), made in the period covered by this report.
Item 10. Submission of Matters to a Vote of Security Holders.
Not applicable.
Item 11. Controls and Procedures.
| (a) | The Registrant’s principal executive officer and principal financial officer have reviewed the Registrant's disclosure controls and procedures (as defined in Rule 30a- 3(c) under the Investment Company Act of 1940, as amended, (the “Act”)) as of a date within 90 days of the filing of this report, as required by Rule 30a-3(b) under the Act. Based on their review, such officers have concluded that the disclosure controls and procedures were effective in ensuring that information required to be disclosed in this report was appropriately recorded, processed, summarized and reported and made known to them by others within the Registrant and by the Registrant’s service providers. |
| (b) | There were no changes in the Registrant’s internal control over financial reporting (as defined in Rule 30a-3(d) under the Act (17 CFR 270.30a-3(d)) that occurred during the period covered by this report that materially affected, or were reasonably likely to materially affect, the Registrant’s internal control over financial reporting. |
Item 12. Disclosure of Securities Lending Activities for Closed-End Management Investment Companies.
The Fund has not engaged in Security Lending Activities.
Item 13. Exhibits.
SIGNATURES
Pursuant to the requirements of the Securities Exchange Act of 1934 and the Investment Company Act of 1940, the Registrant has duly caused this report to be signed on its behalf by the undersigned, thereunto duly authorized.
Bow River Capital Evergreen Fund
| /s/ Jeremy Held | |
| By: Jeremy Held | |
| Trustee, President and Chief Executive Officer | |
| (Principal Executive Officer) | |
| June 7, 2024 | |
Pursuant to the requirements of the Securities Exchange Act of 1934 and the Investment Company Act of 1940, this report has been signed below by the following persons on behalf of the Registrant and in the capacities and on the dates indicated.
| /s/ Jeremy Held | |
| By: Jeremy Held | |
| Trustee, President and Chief Executive Officer | |
| (Principal Executive Officer) | |
| June 7, 2024 | |
| /s/ Derek Mullins | |
| By: Derek Mullins | |
| Treasurer and Chief Financial Officer | |
| (Principal Financial Officer) | |
| June 7, 2024 | |