united states
securities and exchange commission
Washington, d.c. 20549
form n-csr
certified shareholder report of registered
management investment companies
Investment Company Act file number: 811-23570
Simplify Exchange Traded Funds
(Exact name of registrant as specified in charter)
10845 Griffith Peak Drive 2/F
Las Vegas, NV 89135 |
| (Address of principal executive offices) (Zip code) |
The Corporation Trust Company
Corporation Trust Center
1209 Orange Street
Wilmington, DE 19801
(Name and address of agent for service)
Registrant’s telephone number, including area code: (646) 585-0476
Date of fiscal year end: June 30
Date of reporting period: June 30, 2024
Item 1. Reports to Stockholders.
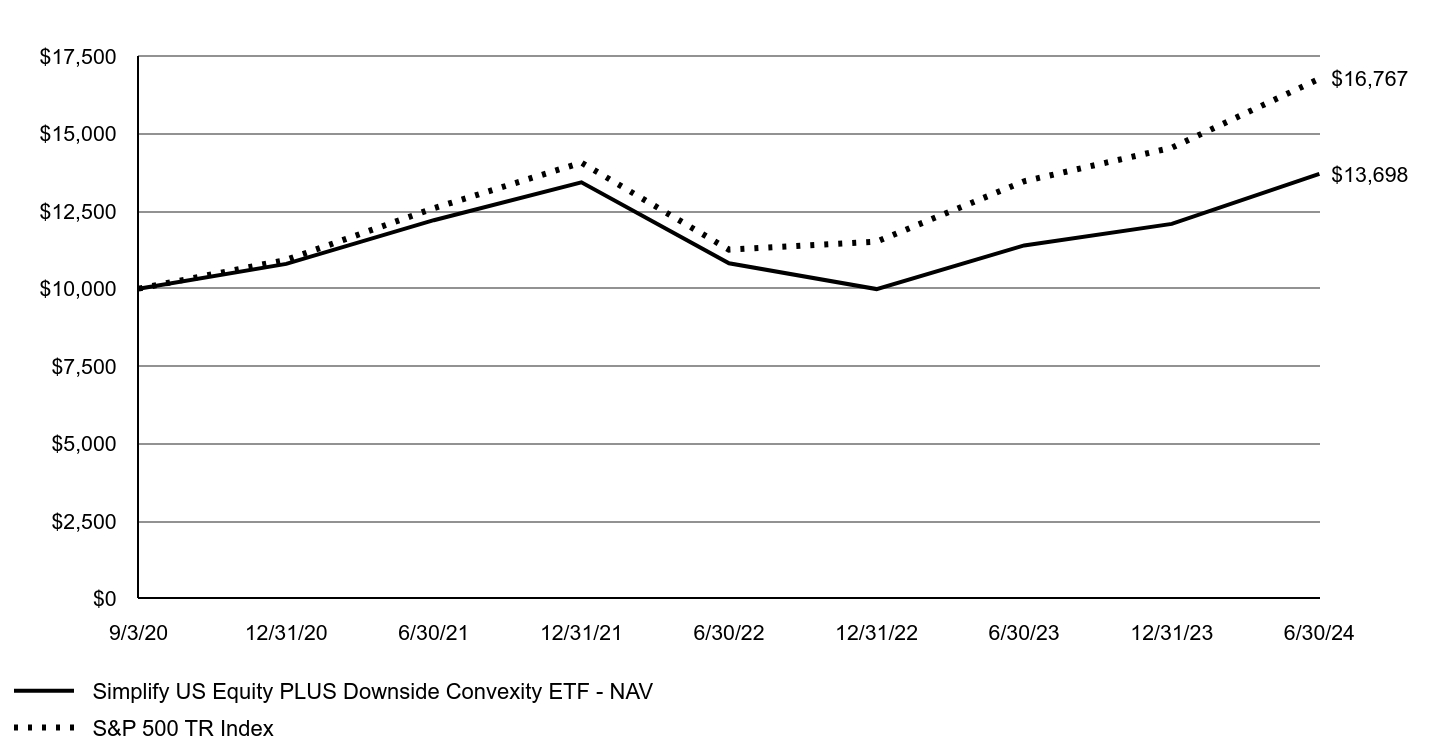
0001810747 simplify:SimplifyUSEquityPLUSDownsideConvexityETFMinusMarket34375AdditionalIndexMember 2020-09-03 2024-06-30
Simplify Aggregate Bond ETF
Annual Shareholder Report | June 30, 2024
This annual shareholder report contains important information about Simplify Aggregate Bond ETF ("AGGH" or the "Fund") for the period of July 1, 2023 to June 30, 2024. You can find additional information about the Fund at www.simplify.us/resources. You can also request this information by contacting us at (855) 772-8488.
This report describes changes to the Fund that occurred during the reporting period.
What were the Fund’s costs for the period?
(based on a hypothetical $10,000 investment)
| Fund | Costs of a $10,000 investment | Costs paid as a percentage of a $10,000 investment |
|---|
| Simplify Aggregate Bond ETF | $27 | 0.26% |
Management's Discussion of Fund Performance
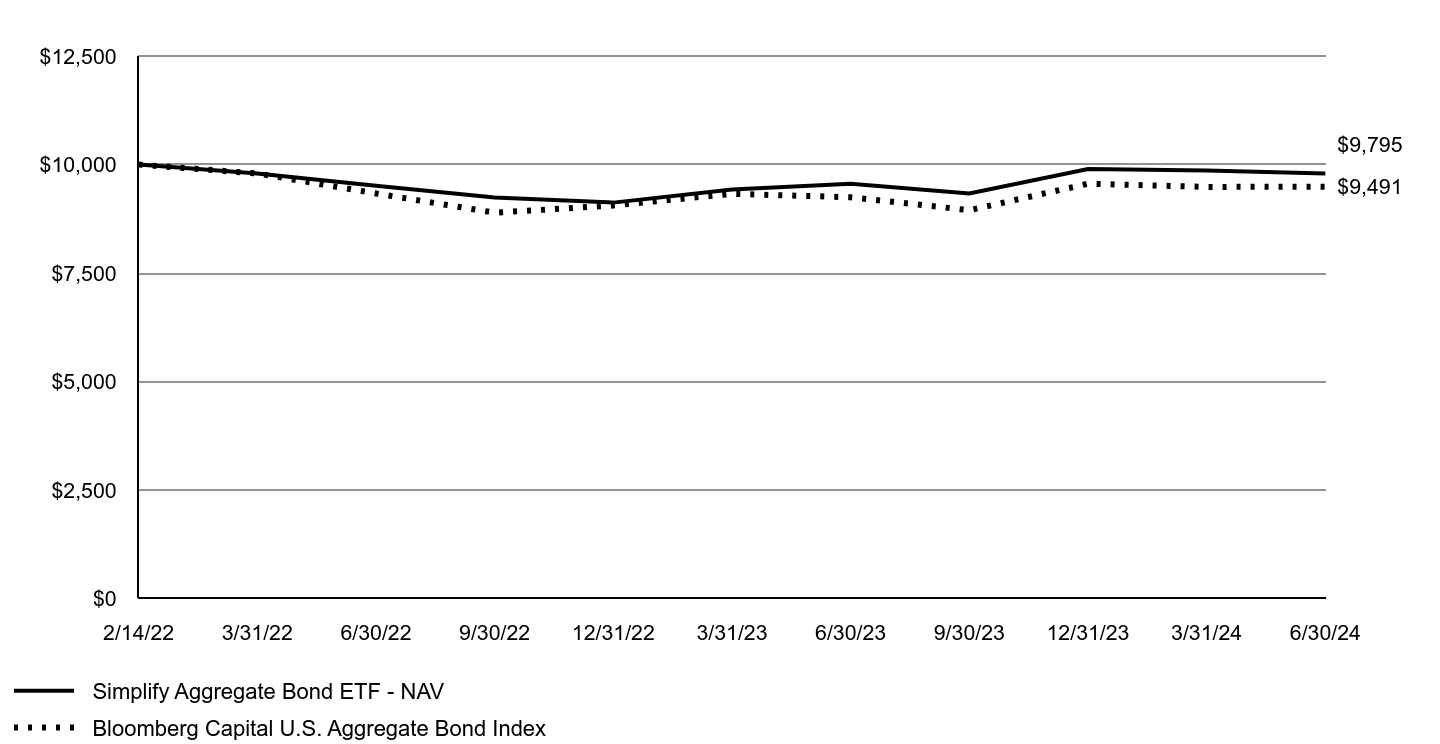
For the year ended June 30, 2024, AGGH returned 2.48% vs its referenced benchmark, Bloomberg Capital U.S. Aggregate Bond Index, return of 2.63%, underperforming the benchmark by 0.15%.
Rising interest rates were a headwind for the Fund and the bond market in general. The Fund underperformed the benchmark due to the challenges in hedging structural volatility selling strategies in rapidly changing long-term treasury rates. The Fund used long and short positions in options across equities, fixed income, volatility indices, commodities, and currencies asset classes to hedge against relevant interest rate and credit risks as well as generate potential income.
In the next 12 months, we believe the Fed will likely start a rate-cutting cycle, which will potentially stall last year’s trend of rising rates. We believe AGGH is well-positioned to deliver high returns and outperform the Bloomberg Capital U.S. Aggregate Bond Index due to structural volatility selling strategies as long-term treasury rates stabilize.
Growth of an Assumed $10,000 Investment
| Simplify Aggregate Bond ETF - NAV | Bloomberg Capital U.S. Aggregate Bond Index |
|---|
| 2/14/22 | $10,000 | $10,000 |
| 3/31/22 | $9,797 | $9,795 |
| 6/30/22 | $9,511 | $9,335 |
| 9/30/22 | $9,243 | $8,892 |
| 12/31/22 | $9,124 | $9,058 |
| 3/31/23 | $9,424 | $9,326 |
| 6/30/23 | $9,558 | $9,248 |
| 9/30/23 | $9,336 | $8,949 |
| 12/31/23 | $9,897 | $9,559 |
| 3/31/24 | $9,861 | $9,485 |
| 6/30/24 | $9,795 | $9,491 |
| AVERAGE ANNUAL TOTAL RETURN Fund/Index | 1 Year | Since Inception 2/14/2022 |
|---|
| Simplify Aggregate Bond ETF - NAV | 2.48% | |
| Simplify Aggregate Bond ETF - Market | 2.57% | |
| Bloomberg Capital U.S. Aggregate Bond Index | 2.63% | |
The Fund's past performance is not a good predictor of future performance. The graph and table do not reflect deduction of taxes that a shareholder would pay on Fund distributions or redemption of Fund shares.
The Fund had a return of capital of $8,368,404.
The following table outlines key fund statistics that you should pay attention to.
| Fund net assets | $207,337,384 |
| Total number of portfolio holdings | 4 |
| Total advisory fee paid, net of waiver | $319,366 |
| Period portfolio turnover rate | 385% |
Graphical Representation of Holdings
The table below shows the types of investments that make up the Fund as of the end of the reporting period.
| Investment Categories | % of Net Assets |
| Exchange-Traded Funds | 94.4% |
| U.S. Treasury Bills | 5.0% |
| U.S. Government Agency Mortgage Backed Securities | 4.9% |
| Liabilities in Excess of Other Assets | (4.3)% |
| Total | 100.0% |
This is a summary of certain changes to the Fund since July 1, 2023. For more complete information, you may review the Fund's next prospectus, which we expect to be available by November 1, 2024 at www.simplify.us/resources or upon request at (855) 772-8488.
- The Fund's name changed from Simplify Aggregate Bond PLUS Credit Hedge ETF to Simplify Aggregate Bond ETF.
- The Fund's investment objective changed from seeking to maximize total return by investing primarily in investment grade bonds while mitigating credit risk to seeking to maximize total return.
- "Other expenses" in the Fund's fee table were restated.
Availability of Additional Information
You can find additional information about the Fund such as the prospectus, financial information, fund holdings and proxy voting at the website address or contact number included at the beginning of this shareholder report.
Distributed by Foreside Financial Services, LLC.
Annual Shareholder Report | June 30, 2024
This annual shareholder report contains important information about Simplify Health Care ETF ("PINK" or the "Fund") for the period of July 1, 2023 to June 30, 2024. You can find additional information about the Fund at www.simplify.us/resources. You can also request this information by contacting us at (855) 772-8488.
What were the Fund’s costs for the period?
(based on a hypothetical $10,000 investment)
| Fund | Costs of a $10,000 investment | Costs paid as a percentage of a $10,000 investment |
|---|
| Simplify Health Care ETF | $55 | 0.50% |
Management's Discussion of Fund Performance
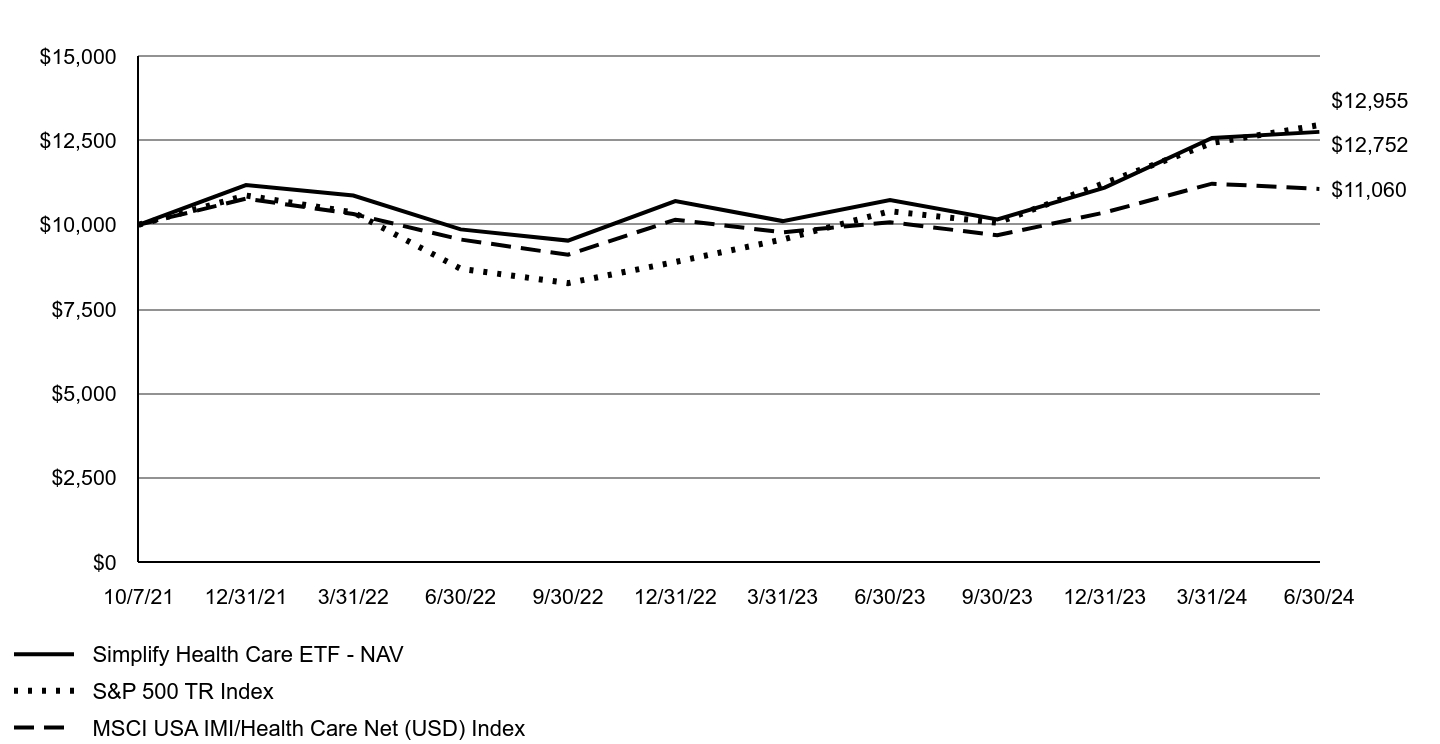
For the year ended June 30, 2024, PINK returned 18.83% vs its referenced benchmark, MSCI USA IMI/Health Care Net Index, return of 9.76% for the same period, outperforming the benchmark by 9.07%.
PINK's outperformance is attributed to bottoms-up analysis, tactical trading, and strategic weightings in subsectors. In FY2024, stock selection played the most significant role, avoiding major drawdowns and identifying alpha-generating stocks across subsectors.
Looking ahead, we believe PINK is positioned defensively, anticipating a cyclical economic slowdown. We expect a rotation from economically sensitive areas to defensives. The Fund currently is overweight in select drug stocks versus Medtech and HMOs, anticipating economic headwinds for the latter. We focus on drug stocks with asymmetric earnings potential and will selectively add Medtech and HMOs. PINK adapts its strategy to optimize alpha, recognizing the diminishing global tailwind from government spending. We will monitor and adjust as needed.
Growth of an Assumed $10,000 Investment
| Simplify Health Care ETF - NAV | S&P 500 TR Index | MSCI USA IMI/Health Care Net (USD) Index |
|---|
| 10/7/21 | $10,000 | $10,000 | $10,000 |
| 12/31/21 | $11,178 | $10,866 | $10,774 |
| 3/31/22 | $10,865 | $10,366 | $10,318 |
| 6/30/22 | $9,863 | $8,697 | $9,563 |
| 9/30/22 | $9,531 | $8,272 | $9,112 |
| 12/31/22 | $10,701 | $8,898 | $10,151 |
| 3/31/23 | $10,109 | $9,565 | $9,778 |
| 6/30/23 | $10,731 | $10,401 | $10,076 |
| 9/30/23 | $10,159 | $10,060 | $9,689 |
| 12/31/23 | $11,102 | $11,237 | $10,364 |
| 3/31/24 | $12,570 | $12,423 | $11,218 |
| 6/30/24 | $12,752 | $12,955 | $11,060 |
| AVERAGE ANNUAL TOTAL RETURN Fund/Index | 1 Year | Since Inception 10/7/2021 |
|---|
| Simplify Health Care ETF - NAV | 18.83% | 9.32% |
| Simplify Health Care ETF - Market | 19.08% | 9.52% |
| S&P 500 TR Index | 24.56% | 9.95% |
| MSCI USA IMI/Health Care Net (USD) Index | 9.76% | 3.76% |
The Fund's past performance is not a good predictor of future performance. The graph and table do not reflect deduction of taxes that a shareholder would pay on Fund distributions or redemption of Fund shares.
The following table outlines key fund statistics that you should pay attention to.
| Fund net assets | $137,169,249 |
| Total number of portfolio holdings | 53 |
| Total advisory fee paid, net of waiver | $426,070 |
| Period portfolio turnover rate | 210% |
Graphical Representation of Holdings
The table below shows the types of investments that make up the Fund as of the end of the reporting period.
| Investment Categories | % of Net Assets |
| Common Stocks | 90.0% |
| Money Market Funds | 5.8% |
| Other Assets in Excess of Liabilities | 4.2% |
| Total | 100.0% |
Availability of Additional Information
You can find additional information about the Fund such as the prospectus, financial information, fund holdings and proxy voting at the website address or contact number included at the beginning of this shareholder report.
Distributed by Foreside Financial Services, LLC.
Simplify Hedged Equity ETF
Annual Shareholder Report | June 30, 2024
This annual shareholder report contains important information about Simplify Hedged Equity ETF ("HEQT" or the "Fund") for the period of July 1, 2023 to June 30, 2024. You can find additional information about the Fund at www.simplify.us/resources. You can also request this information by contacting us at (855) 772-8488.
This report describes changes to the Fund that occurred during the reporting period.
What were the Fund’s costs for the period?
(based on a hypothetical $10,000 investment)
| Fund | Costs of a $10,000 investment | Costs paid as a percentage of a $10,000 investment |
|---|
| Simplify Hedged Equity ETF | $55 | 0.51% |
Management's Discussion of Fund Performance
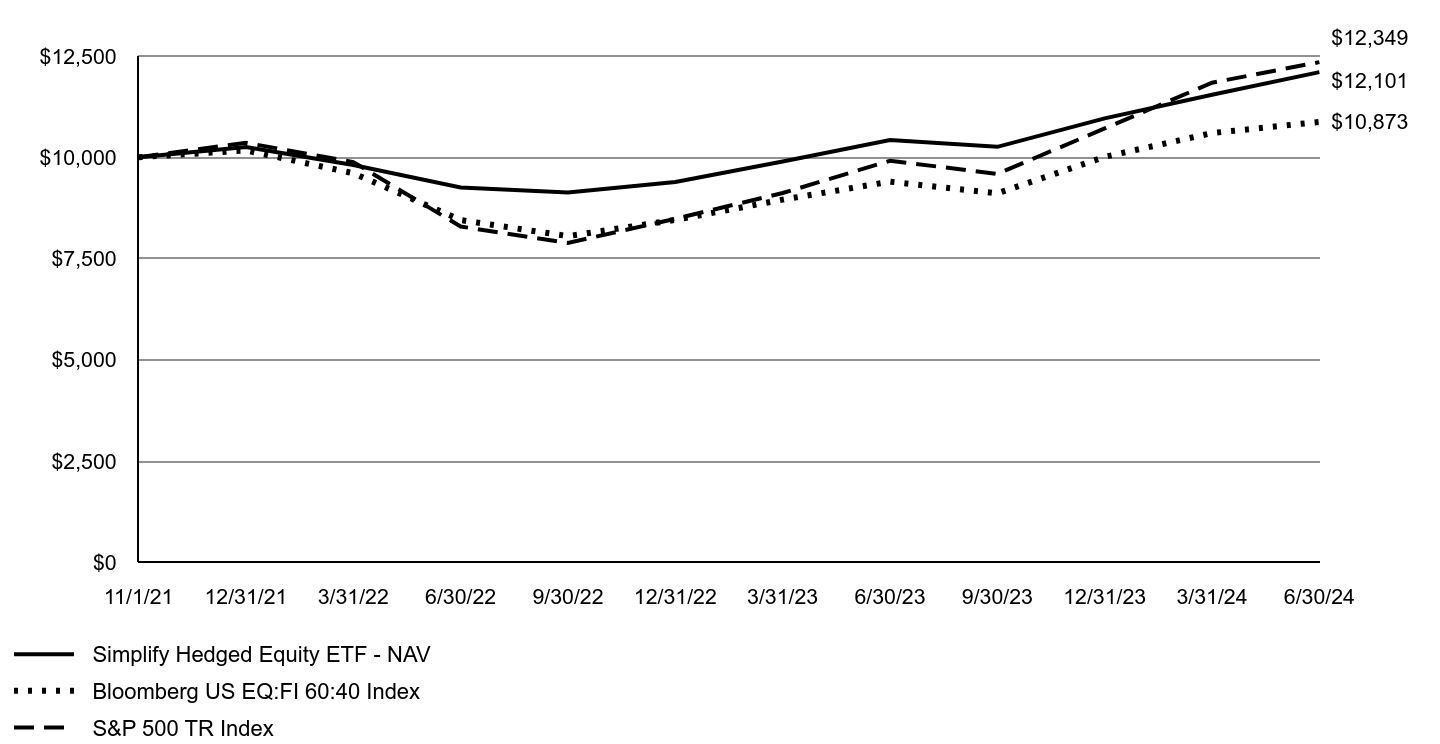
For the year ended June 30, 2024, HEQT returned 16.08% vs its referenced benchmark, Bloomberg US EQ:FI 60:40 Index, return of 15.69% for the same period, outperforming the benchmark by 0.39%.
Stock market weakness in Q3 2023 drove HEQT to an early 3% gain versus the large cap index but relinquished this alpha as stocks rose steadily rose until the end of Q1 2024. Subsequent periods of choppy price action in the broader market enabled HEQT to post a similar relative outperformance. More frequent strike resets in the HEQT were a benefit versus its competitors during the cycle of brief drawdowns with ensuing market rebounds.
Due to continued investor demand for market upside, call strike moneyness on regular monthly option rolls has consistently been above 5%. The relative cheapness of puts to calls in the 1-3 month maturity make costless collars an attractive defensive positioning alternative for a sustained correction in stocks, and with the potential for heightened volatility in the upcoming election cycle we believe HEQT is well-positioned to perform favorably.
Growth of an Assumed $10,000 Investment
| Simplify Hedged Equity ETF - NAV | Bloomberg US EQ:FI 60:40 Index | S&P 500 TR Index |
|---|
| 11/1/21 | $10,000 | $10,000 | $10,000 |
| 12/31/21 | $10,251 | $10,168 | $10,357 |
| 3/31/22 | $9,810 | $9,606 | $9,881 |
| 6/30/22 | $9,254 | $8,449 | $8,290 |
| 9/30/22 | $9,128 | $8,053 | $7,885 |
| 12/31/22 | $9,389 | $8,454 | $8,481 |
| 3/31/23 | $9,895 | $8,953 | $9,117 |
| 6/30/23 | $10,425 | $9,398 | $9,914 |
| 9/30/23 | $10,258 | $9,108 | $9,590 |
| 12/31/23 | $10,961 | $10,010 | $10,711 |
| 3/31/24 | $11,545 | $10,597 | $11,841 |
| 6/30/24 | $12,101 | $10,873 | $12,349 |
| AVERAGE ANNUAL TOTAL RETURN Fund/Index | 1 Year | Since Inception 11/1/2021 |
|---|
| Simplify Hedged Equity ETF - NAV | 16.08% | 7.43% |
| Simplify Hedged Equity ETF - Market | 16.28% | 7.31% |
| S&P 500 TR Index | 24.56% | 8.25% |
| Bloomberg US EQ:FI 60:40 Index | 15.69% | 3.20% |
The Fund's past performance is not a good predictor of future performance. The graph and table do not reflect deduction of taxes that a shareholder would pay on Fund distributions or redemption of Fund shares.
The following table outlines key fund statistics that you should pay attention to.
| Fund net assets | $168,665,904 |
| Total number of portfolio holdings | 5 |
| Total advisory fee paid, net of waiver | $754,254 |
| Period portfolio turnover rate | 1% |
Graphical Representation of Holdings
The table below shows the types of investments that make up the Fund as of the end of the reporting period.
| Investment Categories | % of Net Assets |
| Exchange-Traded Funds | 101.3% |
| Purchased Options | 0.3% |
| Money Market Funds | 0.0%Footnote Reference† |
| Liabilities in Excess of Other Assets | (1.6)% |
| Total | 100.0% |
| Footnote | Description |
Footnote† | Less than 0.05% |
This is a summary of certain changes to the Fund since July 1, 2023. For more complete information, you may review the Fund's next prospectus, which we expect to be available by November 1, 2024 at www.simplify.us/resources or upon request at (855) 772-8488.
- "Other expenses" in the Fund's fee table were restated.
Availability of Additional Information
You can find additional information about the Fund such as the prospectus, financial information, fund holdings and proxy voting at the website address or contact number included at the beginning of this shareholder report.
Distributed by Foreside Financial Services, LLC.
Simplify High Yield PLUS Credit Hedge ETF
Annual Shareholder Report | June 30, 2024
This annual shareholder report contains important information about Simplify High Yield PLUS Credit Hedge ETF ("CDX" or the "Fund") for the period of July 1, 2023 to June 30, 2024. You can find additional information about the Fund at www.simplify.us/resources. You can also request this information by contacting us at (855) 772-8488.
What were the Fund’s costs for the period?
(based on a hypothetical $10,000 investment)
| Fund | Costs of a $10,000 investment | Costs paid as a percentage of a $10,000 investment |
|---|
| Simplify High Yield PLUS Credit Hedge ETF | $27 | 0.25% |
Management's Discussion of Fund Performance
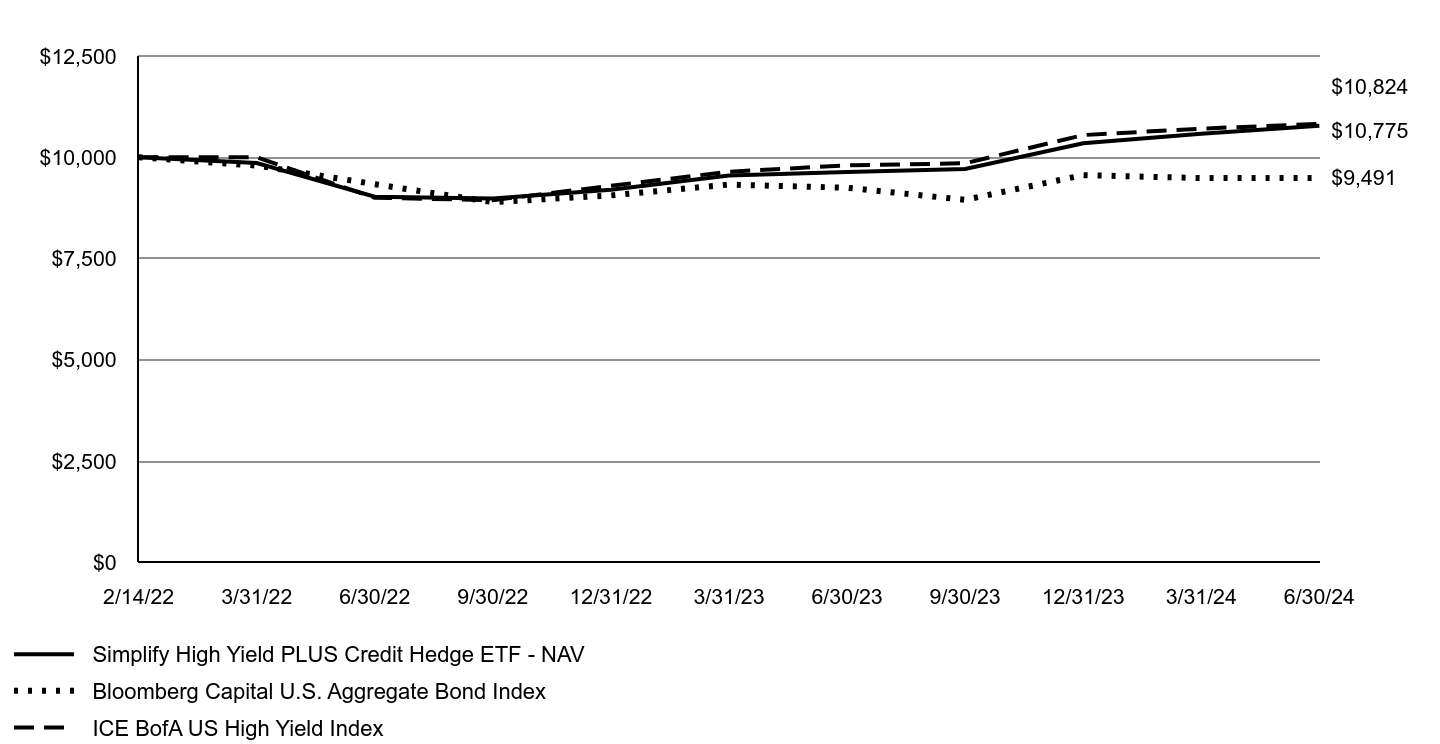
For the year ended June 30, 2024, CDX returned 11.82% vs its referenced benchmark, ICE BofA U.S. High Yield Index, return of 10.45%. The Fund outperformed the benchmark by 3.27% during spread widening and underperformed the benchmark by 2.26% during tightening.
Outperformance was driven by:
1. Credit hedges, including the “Quality-Junk” overlay, High Yield CDS, and equity puts, added 1.88%, mainly from the Quality-Junk overlay.
2. Total return swaps via the iShares iBoxx $ High Yield Corporate Bond ETF ("HYG ETF") added 9.91%, despite HYG ETF underperforming the benchmark by 1.07%.
3. Tightening of High Yield credit spreads from 3.90% to 3.09% added 2.75% to absolute return but subtracted a 0.80% from relative performance.
Looking forward, CDX is modestly over-hedged due to tight credit spreads and deteriorating US growth. Tight conditions and high bankruptcy filings suggest outperformance if spreads widen. Current positioning could generate a 0.02% outperformance for every 0.01% of spread widening, potentially leading to a 10% outperformance if spreads reach recession averages. If spreads do not widen, performance should remain favorable.
Growth of an Assumed $10,000 Investment
| Simplify High Yield PLUS Credit Hedge ETF - NAV | Bloomberg Capital U.S. Aggregate Bond Index | ICE BofA US High Yield Index |
|---|
| 2/14/22 | $10,000 | $10,000 | $10,000 |
| 3/31/22 | $9,859 | $9,795 | $9,999 |
| 6/30/22 | $9,027 | $9,335 | $9,002 |
| 9/30/22 | $8,983 | $8,892 | $8,941 |
| 12/31/22 | $9,200 | $9,058 | $9,297 |
| 3/31/23 | $9,551 | $9,326 | $9,643 |
| 6/30/23 | $9,636 | $9,248 | $9,800 |
| 9/30/23 | $9,709 | $8,949 | $9,852 |
| 12/31/23 | $10,347 | $9,559 | $10,548 |
| 3/31/24 | $10,583 | $9,485 | $10,707 |
| 6/30/24 | $10,775 | $9,491 | $10,824 |
| AVERAGE ANNUAL TOTAL RETURN Fund/Index | 1 Year | Since Inception 2/14/2022 |
|---|
| Simplify High Yield PLUS Credit Hedge ETF - NAV | 11.82% | 3.20% |
| Simplify High Yield PLUS Credit Hedge ETF - Market | 11.66% | 3.20% |
| Bloomberg Capital U.S. Aggregate Bond Index | 2.63% | |
| ICE BofA US High Yield Index | 10.45% | 3.39% |
The Fund's past performance is not a good predictor of future performance. The graph and table do not reflect deduction of taxes that a shareholder would pay on Fund distributions or redemption of Fund shares.
The following table outlines key fund statistics that you should pay attention to.
| Fund net assets | $156,167,780 |
| Total number of portfolio holdings | 5 |
| Total advisory fee paid, net of waiver | $181,060 |
| Period portfolio turnover rate | 0% |
Graphical Representation of Holdings
The table below shows the types of investments that make up the Fund as of the end of the reporting period.
| Investment Categories | % of Net Assets |
| U.S. Treasury Bills | 98.9% |
| Purchased Options | 0.0%Footnote Reference† |
| Other Assets in Excess of Liabilities | 1.1% |
| Total | 100.0% |
| Footnote | Description |
Footnote† | Less than 0.05% |
Availability of Additional Information
You can find additional information about the Fund such as the prospectus, financial information, fund holdings and proxy voting at the website address or contact number included at the beginning of this shareholder report.
Distributed by Foreside Financial Services, LLC.
Simplify Interest Rate Hedge ETF
Annual Shareholder Report | June 30, 2024
This annual shareholder report contains important information about Simplify Interest Rate Hedge ETF ("PFIX" or the "Fund") for the period of July 1, 2023 to June 30, 2024. You can find additional information about the Fund at www.simplify.us/resources. You can also request this information by contacting us at (855) 772-8488.
What were the Fund’s costs for the period?
(based on a hypothetical $10,000 investment)
| Fund | Costs of a $10,000 investment | Costs paid as a percentage of a $10,000 investment |
|---|
| Simplify Interest Rate Hedge ETF | $61 | 0.50% |
Management's Discussion of Fund Performance
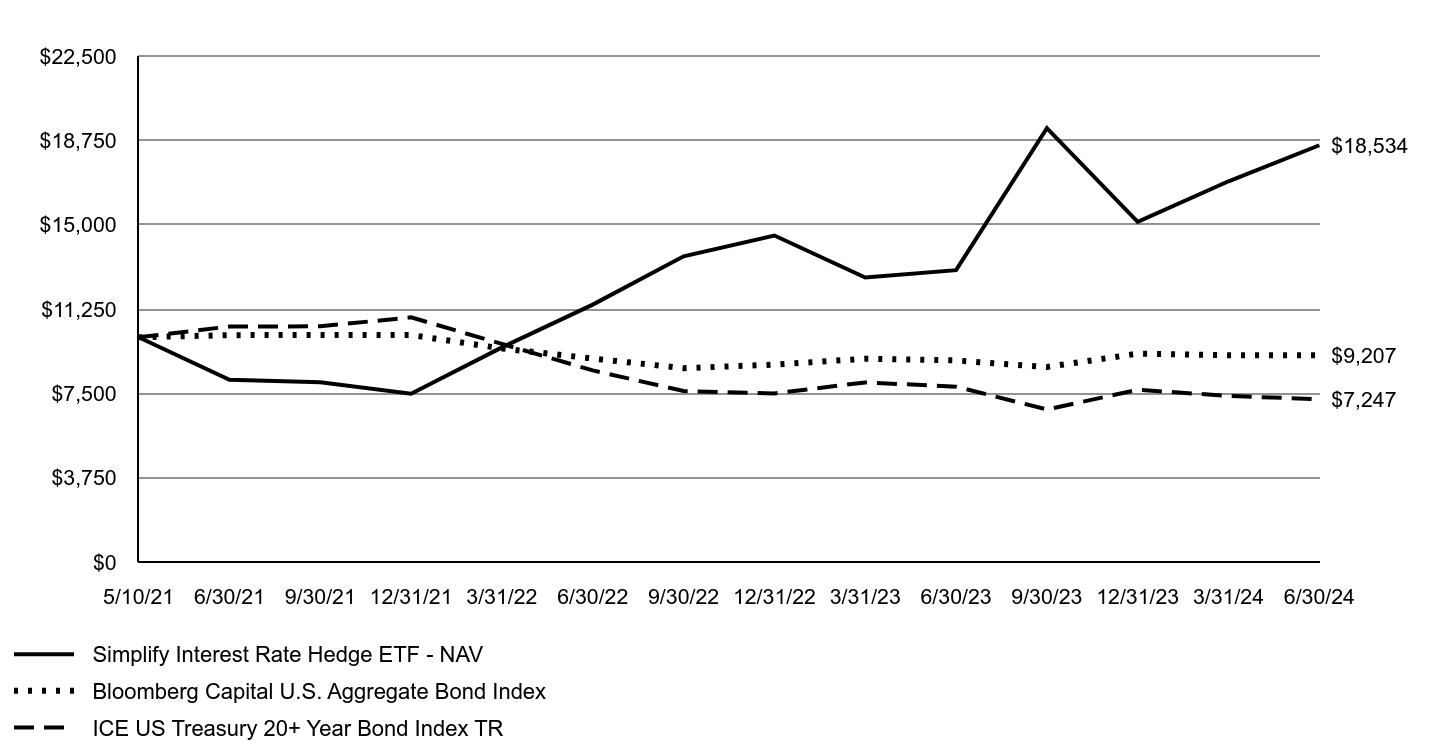
For the year ended June 30, 2024, PFIX returned 42.78% vs. its referenced benchmark, ICE U.S. Treasury 20+ Year Bond Index, return of -7.15% for the same period, outperforming the benchmark by 49.93%.
The main reason for the difference is that PFIX holds a long position in a set of out-of-the-money pay-fixed options with 5 to 7 years to expiry into a 20-year swap. These swaptions performed well as the forward interest rates that underly them increased. These increases were offset somewhat by time decay on the options and increases in the rates used to discount the option payoff.
Looking forward, increases in rates that drive increases in the forward rates along with increases in implied volatilities would be beneficial to the Fund’s performance while decreases in forward rates and declines in implied volatilities would be harmful. The path of future interest rates and implied volatilities is notoriously difficult to predict.
Growth of an Assumed $10,000 Investment
| Simplify Interest Rate Hedge ETF - NAV | Bloomberg Capital U.S. Aggregate Bond Index | ICE US Treasury 20+ Year Bond Index TR |
|---|
| 5/10/21 | $10,000 | $10,000 | $10,000 |
| 6/30/21 | $8,111 | $10,095 | $10,478 |
| 9/30/21 | $8,000 | $10,100 | $10,488 |
| 12/31/21 | $7,489 | $10,101 | $10,885 |
| 3/31/22 | $9,551 | $9,502 | $9,705 |
| 6/30/22 | $11,452 | $9,056 | $8,527 |
| 9/30/22 | $13,597 | $8,626 | $7,610 |
| 12/31/22 | $14,523 | $8,787 | $7,506 |
| 3/31/23 | $12,654 | $9,047 | $7,995 |
| 6/30/23 | $12,981 | $8,971 | $7,805 |
| 9/30/23 | $19,295 | $8,681 | $6,791 |
| 12/31/23 | $15,133 | $9,273 | $7,669 |
| 3/31/24 | $16,932 | $9,201 | $7,393 |
| 6/30/24 | $18,534 | $9,207 | $7,247 |
| AVERAGE ANNUAL TOTAL RETURN Fund/Index | 1 Year | Since Inception 5/10/2021 |
|---|
| Simplify Interest Rate Hedge ETF - NAV | 42.78% | 21.72% |
| Simplify Interest Rate Hedge ETF - Market | 45.24% | 21.60% |
| Bloomberg Capital U.S. Aggregate Bond Index | 2.63% | |
| ICE US Treasury 20+ Year Bond Index TR | | |
The Fund's past performance is not a good predictor of future performance. The graph and table do not reflect deduction of taxes that a shareholder would pay on Fund distributions or redemption of Fund shares.
The following table outlines key fund statistics that you should pay attention to.
| Fund net assets | $145,441,147 |
| Total number of portfolio holdings | 9 |
| Total advisory fee paid, net of waiver | $873,405 |
| Period portfolio turnover rate | 164% |
Graphical Representation of Holdings
The table below shows the types of investments that make up the Fund as of the end of the reporting period.
| Investment Categories | % of Net Assets |
| U.S. Treasury Bills | 52.1% |
| U.S. Government Obligations | 33.2% |
| Purchased Swaptions | 14.5% |
| Other Assets in Excess of Liabilities | 0.2% |
| Total | 100.0% |
Availability of Additional Information
You can find additional information about the Fund such as the prospectus, financial information, fund holdings and proxy voting at the website address or contact number included at the beginning of this shareholder report.
Distributed by Foreside Financial Services, LLC.
Simplify Intermediate Term Treasury Futures Strategy ETF
| Cboe BZX Exchange, Inc.
Annual Shareholder Report | June 30, 2024
This annual shareholder report contains important information about Simplify Intermediate Term Treasury Futures Strategy ETF ("TYA" or the "Fund") for the period of July 1, 2023 to June 30, 2024. You can find additional information about the Fund at www.simplify.us/resources. You can also request this information by contacting us at (855) 772-8488.
What were the Fund’s costs for the period?
(based on a hypothetical $10,000 investment)
| Fund | Costs of a $10,000 investment | Costs paid as a percentage of a $10,000 investment |
|---|
| Simplify Intermediate Term Treasury Futures Strategy ETF | $14 | 0.15% |
Management's Discussion of Fund Performance
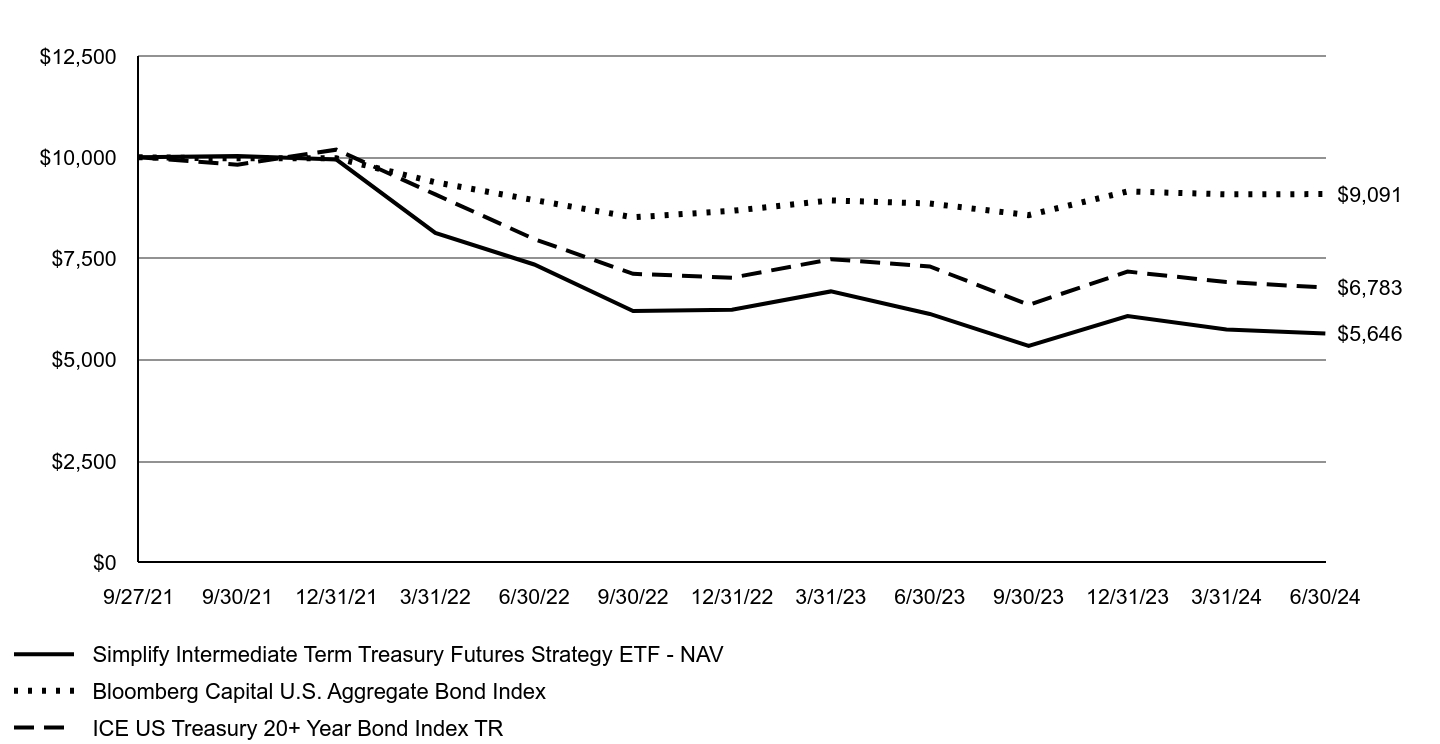
For the year ended June 30, 2024, TYA returned -7.93% vs its referenced benchmark, ICE U.S. Treasury 20+ Year Bond Index, return of -7.15% for the same period, under performing the benchmark by 0.78%.
The Fund’s performance was driven by its long exposure to Intermediate-Term Treasury Futures and short-term treasuries. A long position in Treasury futures earns returns on the cheapest to deliver bond in exchange for paying a short-term financing rate. With an inverted yield curve (long-term rates below short-term rates), this exposure has a negative carry. Leveraged up to 3 times, increases in yields on intermediate-term treasuries led to negative returns, outweighing positive returns on short-term treasuries.
Looking forward, TYA's performance will depend on rate movements. Increases in rates or further inversions will be harmful, while decreases and steepening would be beneficial. Predicting future rates and their term structure is challenging.
Growth of an Assumed $10,000 Investment
| Simplify Intermediate Term Treasury Futures Strategy ETF - NAV | Bloomberg Capital U.S. Aggregate Bond Index | ICE US Treasury 20+ Year Bond Index TR |
|---|
| 9/27/21 | $10,000 | $10,000 | $10,000 |
| 9/30/21 | $10,031 | $9,973 | $9,816 |
| 12/31/21 | $9,944 | $9,974 | $10,187 |
| 3/31/22 | $8,132 | $9,382 | $9,083 |
| 6/30/22 | $7,353 | $8,942 | $7,981 |
| 9/30/22 | $6,204 | $8,517 | $7,123 |
| 12/31/22 | $6,238 | $8,677 | $7,026 |
| 3/31/23 | $6,688 | $8,934 | $7,483 |
| 6/30/23 | $6,132 | $8,858 | $7,305 |
| 9/30/23 | $5,345 | $8,572 | $6,356 |
| 12/31/23 | $6,078 | $9,156 | $7,177 |
| 3/31/24 | $5,747 | $9,085 | $6,920 |
| 6/30/24 | $5,646 | $9,091 | $6,783 |
| AVERAGE ANNUAL TOTAL RETURN Fund/Index | 1 Year | Since Inception 9/27/2021 |
|---|
| Simplify Intermediate Term Treasury Futures Strategy ETF - NAV | | |
| Simplify Intermediate Term Treasury Futures Strategy ETF - Market | | |
| Bloomberg Capital U.S. Aggregate Bond Index | 2.63% | |
| ICE US Treasury 20+ Year Bond Index TR | | |
The Fund's past performance is not a good predictor of future performance. The graph and table do not reflect deduction of taxes that a shareholder would pay on Fund distributions or redemption of Fund shares.
The following table outlines key fund statistics that you should pay attention to.
| Fund net assets | $48,678,096 |
| Total number of portfolio holdings | 5 |
| Total advisory fee paid, net of waiver | $70,871 |
| Period portfolio turnover rate | 0% |
Graphical Representation of Holdings
The table below shows the types of investments that make up the Fund as of the end of the reporting period.
| Investment Categories | % of Net Assets |
| U.S. Treasury Bills | 98.7% |
| Money Market Funds | 0.2% |
| Other Assets in Excess of Liabilities | 1.1% |
| Total | 100.0% |
Availability of Additional Information
You can find additional information about the Fund such as the prospectus, financial information, fund holdings and proxy voting at the website address or contact number included at the beginning of this shareholder report.
Distributed by Foreside Financial Services, LLC.
Simplify Market Neutral Equity Long/Short ETF
Annual Shareholder Report | June 30, 2024
This annual shareholder report contains important information about Simplify Market Neutral Equity Long/Short ETF ("EQLS" or the "Fund") for the period of July 1, 2023 to June 30, 2024. You can find additional information about the Fund at www.simplify.us/resources. You can also request this information by contacting us at (855) 772-8488.
This report describes changes to the Fund that occurred during the reporting period.
What were the Fund’s costs for the period?
(based on a hypothetical $10,000 investment)
| Fund | Costs of a $10,000 investment | Costs paid as a percentage of a $10,000 investment |
|---|
| Simplify Market Neutral Equity Long/Short ETF | $103 | 1.00% |
Management's Discussion of Fund Performance
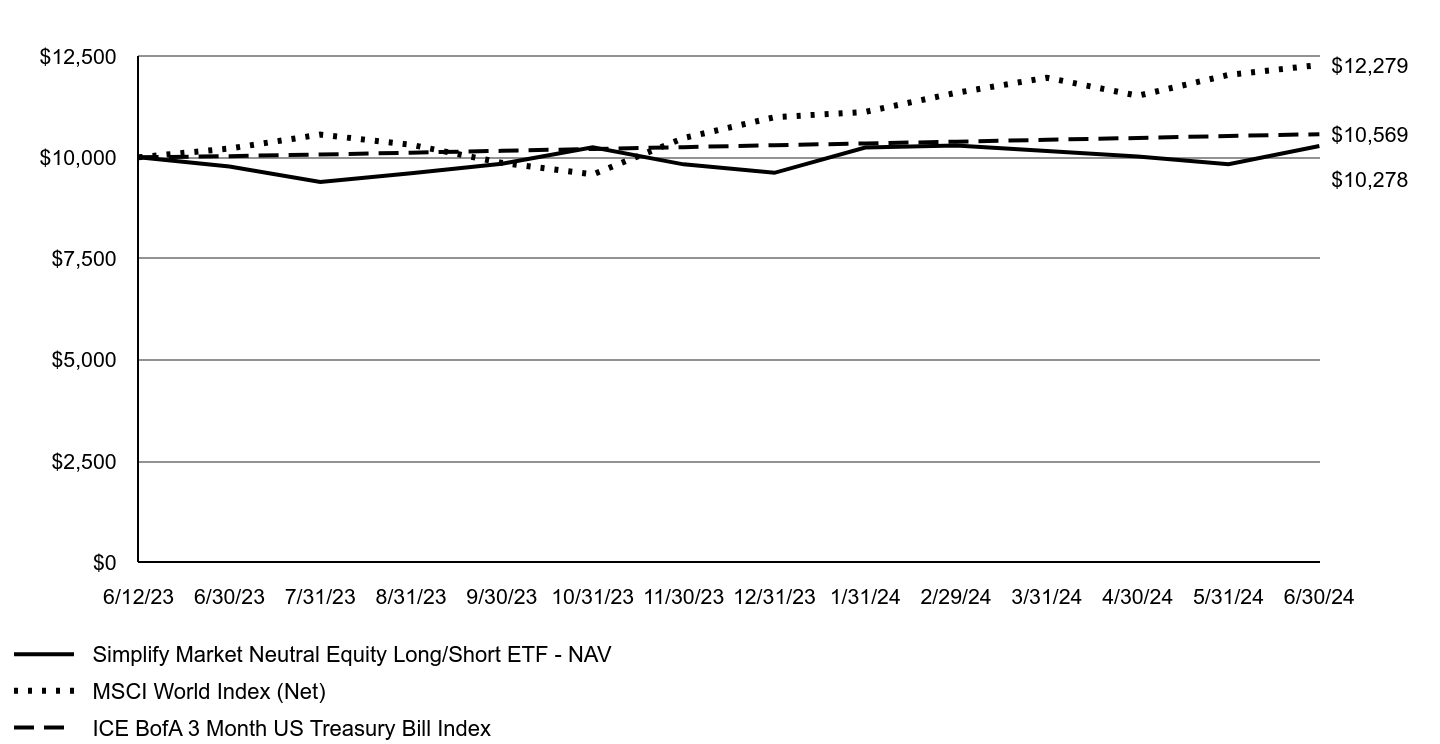
For the year ended June 30, 2024, EQLS returned 5.19% vs its referenced benchmark, ICE BofA US 3-Month Treasury Bill Index, return of 5.40% for the same period, underperforming the benchmark by 0.21%.
Performance derived from systematic exposure was positive and in-line with expectations. Significant contributors included negative exposures to Short Interest Utilization and positive exposures to Profitability, Momentum, and Size. Detractors included negative exposure to Volatility and positive exposures to Revision and Earnings Yield, which underperformed. Non-systematic/idiosyncratic performance was positive but below expectations. Historically, residual performance improves as the model adapts.
Looking ahead, a rate-cutting regime is anticipated, which should boost economic growth and firm investment. We believe EQLS is well-positioned with positive exposures to Profitability and Earnings Yield, and negative exposure to Book-to-Market, to benefit from this transition.
Growth of an Assumed $10,000 Investment
| Simplify Market Neutral Equity Long/Short ETF - NAV | MSCI World Index (Net) | ICE BofA 3 Month US Treasury Bill Index |
|---|
| 6/12/23 | $10,000 | $10,000 | $10,000 |
| 6/30/23 | $9,771 | $10,216 | $10,028 |
| 7/31/23 | $9,389 | $10,559 | $10,068 |
| 8/31/23 | $9,603 | $10,307 | $10,113 |
| 9/30/23 | $9,838 | $9,862 | $10,159 |
| 10/31/23 | $10,246 | $9,576 | $10,205 |
| 11/30/23 | $9,825 | $10,474 | $10,250 |
| 12/31/23 | $9,616 | $10,988 | $10,298 |
| 1/31/24 | $10,242 | $11,120 | $10,342 |
| 2/29/24 | $10,291 | $11,591 | $10,385 |
| 3/31/24 | $10,155 | $11,964 | $10,431 |
| 4/30/24 | $10,016 | $11,519 | $10,476 |
| 5/31/24 | $9,829 | $12,034 | $10,526 |
| 6/30/24 | $10,278 | $12,279 | $10,569 |
| AVERAGE ANNUAL TOTAL RETURN Fund/Index | 1 Year | Since Inception 6/12/2023 |
|---|
| Simplify Market Neutral Equity Long/Short ETF - NAV | 5.19% | 2.65% |
| Simplify Market Neutral Equity Long/Short ETF - Market | 4.42% | 2.51% |
| MSCI World Index (Net) | 20.19% | 21.61% |
| ICE BofA 3 Month US Treasury Bill Index | 5.40% | 5.42% |
The Fund's past performance is not a good predictor of future performance. The graph and table do not reflect deduction of taxes that a shareholder would pay on Fund distributions or redemption of Fund shares.
The Fund had a return of capital of $687,184.
The following table outlines key fund statistics that you should pay attention to.
| Fund net assets | $156,231,187 |
| Total number of portfolio holdings | 3 |
| Total advisory fee paid, net of waiver | $1,196,259 |
| Period portfolio turnover rate | 0% |
Graphical Representation of Holdings
The table below shows the types of investments that make up the Fund as of the end of the reporting period.
| Investment Categories | % of Net Assets |
| U.S. Treasury Bills | 98.1% |
| Other Assets in Excess of Liabilities | 1.9% |
| Total | 100.0% |
This is a summary of certain changes to the Fund since July 1, 2023. For more complete information, you may review the Fund's next prospectus, which we expect to be available by November 1, 2024 at www.simplify.us/resources or upon request at (855) 772-8488.
- Effective May 24, 2024, Simplify EQLS LLC became the investment advisor of the Fund.
Availability of Additional Information
You can find additional information about the Fund such as the prospectus, financial information, fund holdings and proxy voting at the website address or contact number included at the beginning of this shareholder report.
Distributed by Foreside Financial Services, LLC.
Annual Shareholder Report | June 30, 2024
This annual shareholder report contains important information about Simplify MBS ETF ("MTBA" or the "Fund") for the period of November 6, 2023 to June 30, 2024. You can find additional information about the Fund at www.simplify.us/resources. You can also request this information by contacting us at (855) 772-8488.
What were the Fund’s costs for the period?
(based on a hypothetical $10,000 investment)
| Fund | Costs of a $10,000 investment | Costs paid as a percentage of a $10,000 investment |
|---|
| Simplify MBS ETF | $12Footnote Reference(1) | 0.17% |
| Footnote | Description |
Footnote(1) | Based on the period November 6, 2023 (commencement of operations) through June 30, 2024. Expenses would have been higher if based on the full reporting period. |
Management's Discussion of Fund Performance
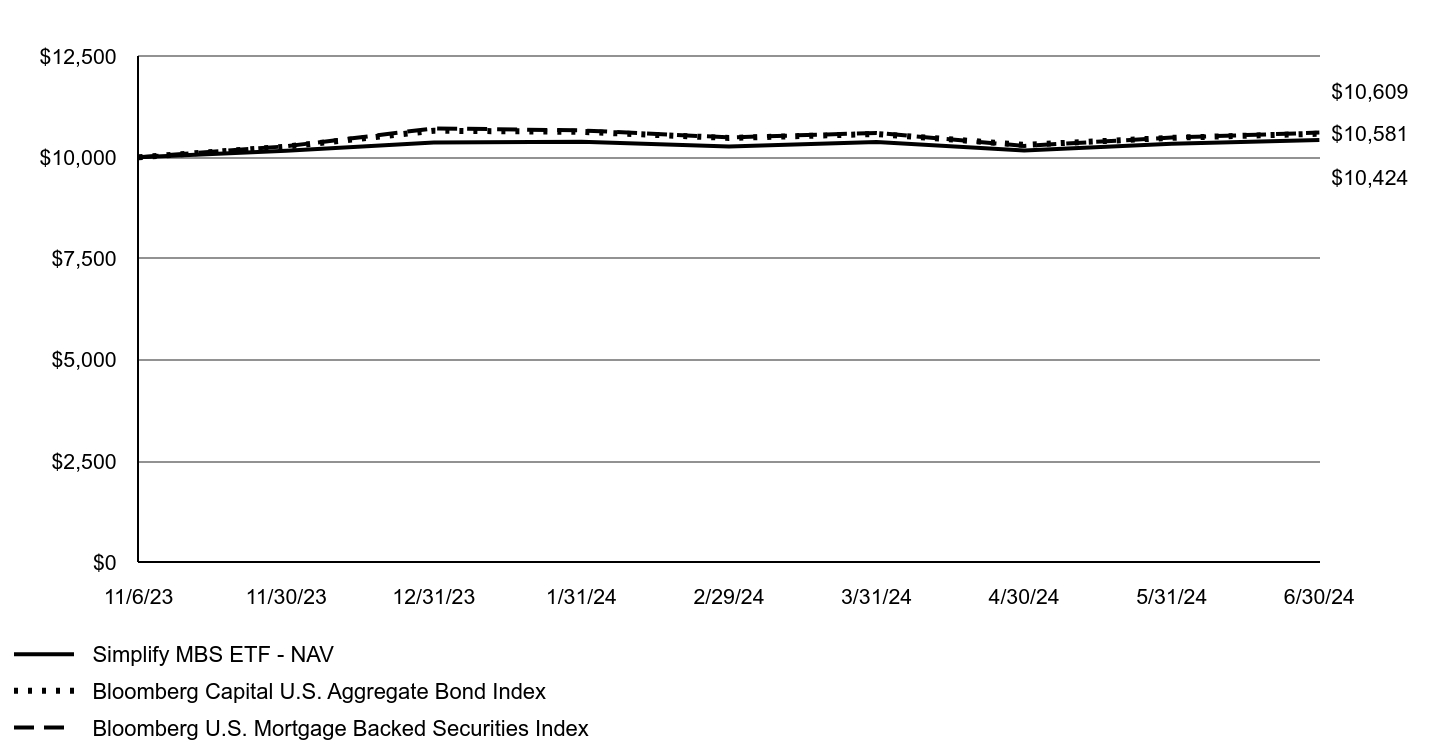
For the period November 7, 2023, to June 30, 2024, MTBA returned 4.24% vs. the Bloomberg US MBS Index Total Return of 6.09%, underperforming the benchmark by 1.85%.
MTBA invests in the mortgage market by taking long positions in current coupon TBA mortgage futures in the over-the-counter market. These positions accrue mortgage interest, incur financing charges, and experience mark-to-market gains and losses from interest rate changes. From inception, mortgage rates were volatile but decreased slightly. TBA positions are notional, leaving NAV to be invested in short-term treasuries.
Looking ahead, the Fund's performance is sensitive to changes in fixed-rate mortgage rates and short-term financing rates. Mortgage rates depend on multiple points on the term structure, volatilities, and supply-demand dynamics, all of which are challenging to predict.
Growth of an Assumed $10,000 Investment
| Simplify MBS ETF - NAV | Bloomberg Capital U.S. Aggregate Bond Index | Bloomberg U.S. Mortgage Backed Securities Index |
|---|
| 11/6/23 | $10,000 | $10,000 | $10,000 |
| 11/30/23 | $10,158 | $10,263 | $10,271 |
| 12/31/23 | $10,367 | $10,656 | $10,713 |
| 1/31/24 | $10,384 | $10,627 | $10,664 |
| 2/29/24 | $10,268 | $10,477 | $10,490 |
| 3/31/24 | $10,377 | $10,574 | $10,601 |
| 4/30/24 | $10,168 | $10,307 | $10,281 |
| 5/31/24 | $10,333 | $10,481 | $10,486 |
| 6/30/24 | $10,424 | $10,581 | $10,609 |
| AVERAGE ANNUAL TOTAL RETURN Fund/Index | Since Inception 11/6/2023 |
|---|
| Simplify MBS ETF - NAV | 4.24% |
| Simplify MBS ETF - Market | 4.01% |
| Bloomberg Capital U.S. Aggregate Bond Index | 5.81% |
| Bloomberg U.S. Mortgage Backed Securities Index | 6.09% |
The Fund's past performance is not a good predictor of future performance. The graph and table do not reflect deduction of taxes that a shareholder would pay on Fund distributions or redemption of Fund shares.
The Fund had a return of capital of $2,807,611.
The following table outlines key fund statistics that you should pay attention to.
| Fund net assets | $750,306,937 |
| Total number of portfolio holdings | 5 |
| Total advisory fee paid, net of waiver | $387,878 |
| Period portfolio turnover rate | 769% |
Graphical Representation of Holdings
The table below shows the types of investments that make up the Fund as of the end of the reporting period.
| Investment Categories | % of Net Assets |
| U.S. Treasury Bills | 99.7% |
| U.S. Government Agency Mortgage Backed Securities | 98.3% |
| Liabilities in Excess of Other Assets | (98.0)% |
| Total | 100.0% |
Availability of Additional Information
You can find additional information about the Fund such as the prospectus, financial information, fund holdings and proxy voting at the website address or contact number included at the beginning of this shareholder report.
Distributed by Foreside Financial Services, LLC.
Simplify Multi-QIS Alternative ETF
Annual Shareholder Report | June 30, 2024
This annual shareholder report contains important information about Simplify Multi-QIS Alternative ETF ("QIS" or the "Fund") for the period of July 10, 2023 to June 30, 2024. You can find additional information about the Fund at www.simplify.us/resources. You can also request this information by contacting us at (855) 772-8488.
What were the Fund’s costs for the period?
(based on a hypothetical $10,000 investment)
| Fund | Costs of a $10,000 investment | Costs paid as a percentage of a $10,000 investment |
|---|
| Simplify Multi-QIS Alternative ETF | $99.6Footnote Reference(1) | 1.00% |
| Footnote | Description |
Footnote(1) | Based on the period July 10, 2023 (commencement of operations) through June 30, 2024. Expenses would have been higher if based on the full reporting period. |
Management's Discussion of Fund Performance
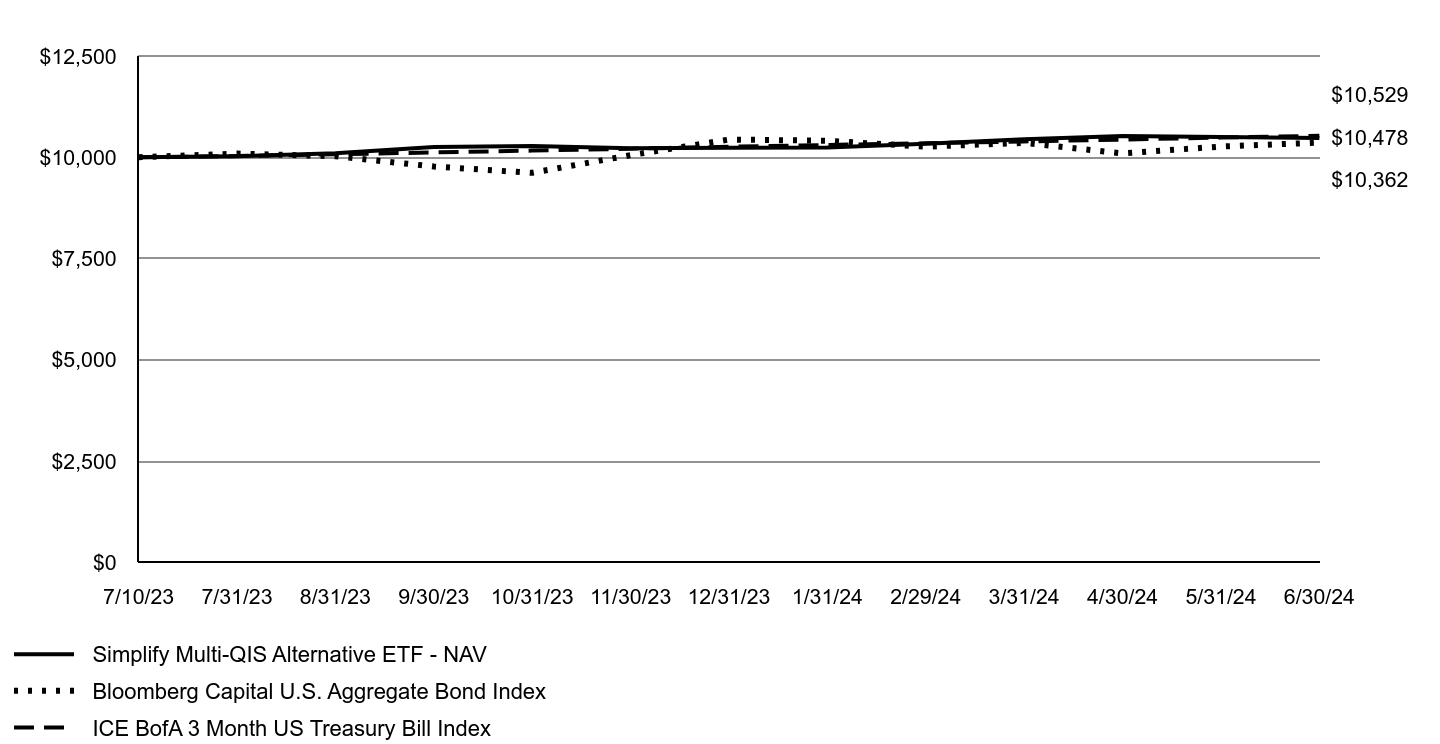
For the period July 10, 2023, to June 30, 2024, QIS returned 4.78% vs. the ICE BofA US 3-Month Treasury Bill Index benchmark return of 5.29%, underperforming by 0.51%.
Quantitative strategies across the board have had one of their most challenging periods in the last decade, and we have seen above average correlations between strategies further reduce normal diversification benefits. Equity volatility strategies have also been a headwind, as implied volatilities have been low and realized volatilities have been high. We did also see some more idiosyncratic headwinds out of the commodity complex. Bouts of higher correlations and challenging realized volatility are expected to happen occasionally, and as such the performance thus far is well within our expected bounds.
Looking ahead, we expect normalization of these features, which should become tailwinds and improve performance.
Growth of an Assumed $10,000 Investment
| Simplify Multi-QIS Alternative ETF - NAV | Bloomberg Capital U.S. Aggregate Bond Index | ICE BofA 3 Month US Treasury Bill Index |
|---|
| 7/10/23 | $10,000 | $10,000 | $10,000 |
| 7/31/23 | $10,026 | $10,090 | $10,029 |
| 8/31/23 | $10,101 | $10,025 | $10,074 |
| 9/30/23 | $10,256 | $9,771 | $10,120 |
| 10/31/23 | $10,276 | $9,616 | $10,165 |
| 11/30/23 | $10,221 | $10,052 | $10,211 |
| 12/31/23 | $10,237 | $10,437 | $10,259 |
| 1/31/24 | $10,243 | $10,408 | $10,303 |
| 2/29/24 | $10,335 | $10,261 | $10,345 |
| 3/31/24 | $10,445 | $10,356 | $10,391 |
| 4/30/24 | $10,527 | $10,094 | $10,436 |
| 5/31/24 | $10,500 | $10,265 | $10,486 |
| 6/30/24 | $10,478 | $10,362 | $10,529 |
| AVERAGE ANNUAL TOTAL RETURN Fund/Index | Since Inception 7/10/2023 |
|---|
| Simplify Multi-QIS Alternative ETF - NAV | 4.78% |
| Simplify Multi-QIS Alternative ETF - Market | 4.80% |
| Bloomberg Capital U.S. Aggregate Bond Index | 3.62% |
| ICE BofA 3 Month US Treasury Bill Index | 5.29% |
The Fund's past performance is not a good predictor of future performance. The graph and table do not reflect deduction of taxes that a shareholder would pay on Fund distributions or redemption of Fund shares.
The following table outlines key fund statistics that you should pay attention to.
| Fund net assets | $114,939,300 |
| Total number of portfolio holdings | 4 |
| Total advisory fee paid, net of waiver | $1,095,980 |
| Period portfolio turnover rate | 0% |
Graphical Representation of Holdings
The table below shows the types of investments that make up the Fund as of the end of the reporting period.
| Investment Categories | % of Net Assets |
| U.S. Treasury Bills | 99.6% |
| Purchased Options | 0.0%Footnote Reference† |
| Other Assets in Excess of Liabilities | 0.4% |
| Total | 100.0% |
| Footnote | Description |
Footnote† | Less than 0.05% |
Availability of Additional Information
You can find additional information about the Fund such as the prospectus, financial information, fund holdings and proxy voting at the website address or contact number included at the beginning of this shareholder report.
Distributed by Foreside Financial Services, LLC.
Simplify Next Intangible Core Index ETF
| Cboe BZX Exchange, Inc.
Annual Shareholder Report | June 30, 2024
This annual shareholder report contains important information about Simplify Next Intangible Core Index ETF ("NXTI" or the "Fund") for the period of April 15, 2024 to June 30, 2024. You can find additional information about the Fund at www.simplify.us/resources. You can also request this information by contacting us at (855) 772-8488.
What were the Fund’s costs for the period?
(based on a hypothetical $10,000 investment)
| Fund | Costs of a $10,000 investment | Costs paid as a percentage of a $10,000 investment |
|---|
| Simplify Next Intangible Core Index ETF | $5Footnote Reference(1) | 0.25% |
| Footnote | Description |
Footnote(1) | Based on the period April 15, 2024 (commencement of operations) through June 30, 2024. Expenses would have been higher if based on the full reporting period. |
Management's Discussion of Fund Performance
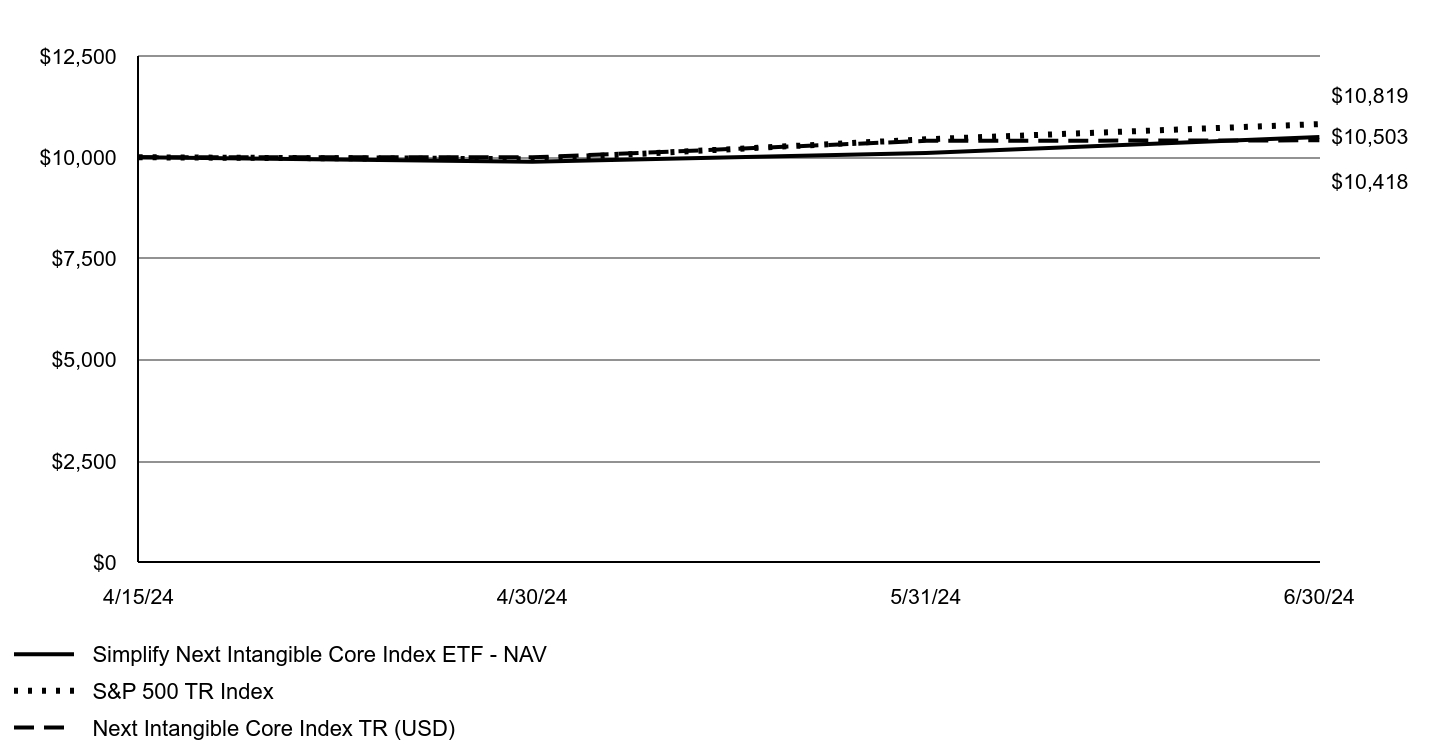
For the period April 15, 2024, to June 30, 2024, NXTI returned 5.03% vs. the NEXT Intangible Core Index benchmark return of 4.18%, underperforming by 0.85%.
NXTI had positive returns in Healthcare, Utilities, Consumer Staples, Information Technology, Communication Services, Consumer Discretionary, Real Estate, Financials, and Industrials. NXTI had negative returns in Energy and Materials. Eli Lilly, Qualcomm, and Walmart were key contributors to positive returns while Cisco Systems, Mastercard, and Accenture were distractors to performance.
Looking ahead, NXTI will continue to select companies with high intangible capital-to-book asset ratios within their respective sectors.
Growth of an Assumed $10,000 Investment
| Simplify Next Intangible Core Index ETF - NAV | S&P 500 TR Index | Next Intangible Core Index TR (USD) |
|---|
| 4/15/24 | $10,000 | $10,000 | $10,000 |
| 4/30/24 | $9,891 | $9,951 | $9,998 |
| 5/31/24 | $10,106 | $10,444 | $10,405 |
| 6/30/24 | $10,503 | $10,819 | $10,418 |
| AVERAGE ANNUAL TOTAL RETURN Fund/Index | Since Inception 4/15/2024 |
|---|
| Simplify Next Intangible Core Index ETF - NAV | 5.03% |
| Simplify Next Intangible Core Index ETF- Market | 4.92% |
| S&P 500 TR Index | 8.19% |
| Next Intangible Core Index TR (USD) | 4.18% |
The Fund's past performance is not a good predictor of future performance. The graph and table do not reflect deduction of taxes that a shareholder would pay on Fund distributions or redemption of Fund shares.
The following table outlines key fund statistics that you should pay attention to.
| Fund net assets | $2,620,804 |
| Total number of portfolio holdings | 202 |
| Total advisory fee paid, net of waiver | $1,303 |
| Period portfolio turnover rate | 28% |
Graphical Representation of Holdings
The table below shows the types of investments that make up the Fund as of the end of the reporting period.
| Investment Categories | % of Net Assets |
| Common Stocks | 100.0% |
| Money Market Funds | 0.0%Footnote Reference† |
| Other Assets in Excess of Liabilities | 0.0%Footnote Reference† |
| Total | 100.0% |
| Footnote | Description |
Footnote† | Less than 0.05% |
Availability of Additional Information
You can find additional information about the Fund such as the prospectus, financial information, fund holdings and proxy voting at the website address or contact number included at the beginning of this shareholder report.
Distributed by Foreside Financial Services, LLC.
Simplify Next Intangible Value Index ETF
| Cboe BZX Exchange, Inc.
Annual Shareholder Report | June 30, 2024
This annual shareholder report contains important information about Simplify Next Intangible Value Index ETF ("NXTV" or the "Fund") for the period of April 15, 2024 to June 30, 2024. You can find additional information about the Fund at www.simplify.us/resources. You can also request this information by contacting us at (855) 772-8488.
What were the Fund’s costs for the period?
(based on a hypothetical $10,000 investment)
| Fund | Costs of a $10,000 investment | Costs paid as a percentage of a $10,000 investment |
|---|
| Simplify Next Intangible Value Index ETF | $5Footnote Reference(1) | 0.25% |
| Footnote | Description |
Footnote(1) | Based on the period April 15, 2024 (commencement of operations) through June 30, 2024. Expenses would have been higher if based on the full reporting period. |
Management's Discussion of Fund Performance
For the period April 15, 2024, to June 30, 2024, NXTV returned 4.18% vs. the NEXT Intangible Value Total Return Index benchmark return of 5.05%, underperforming by 0.87%.
NXTV had positive returns in Communication Services, Utilities, Financials, Industrials, Consumer Discretionary, Real Estate, Consumer Staples, Information Technology and Healthcare. NXTV had negative returns in Energy and Materials. Walmart, AT&T, and Micron Technology were key contributors to positive returns while Intel, Cisco Systems, and International Business Machines were distractors to performance.
Looking ahead, NXTV will continue to select companies with attractive equity value to intangible-adjusted book value within their respective sectors.
Growth of an Assumed $10,000 Investment
| Simplify Next Intangible Value Index ETF - NAV | S&P 500 TR Index | Next Intangible Value Index TR (USD) |
|---|
| 4/15/24 | $10,000 | $10,000 | $10,000 |
| 4/30/24 | $10,000 | $9,951 | $9,887 |
| 5/31/24 | $10,405 | $10,444 | $10,108 |
| 6/30/24 | $10,418 | $10,819 | $10,505 |
| AVERAGE ANNUAL TOTAL RETURN Fund/Index | Since Inception 4/15/2024 |
|---|
| Simplify Next Intangible Value Index ETF - NAV | 4.18% |
| Simplify Next Intangible Value Index ETF - Market | 4.38% |
| S&P 500 TR Index | 8.19% |
| Next Intangible Value Index TR (USD) | 5.05% |
The Fund's past performance is not a good predictor of future performance. The graph and table do not reflect deduction of taxes that a shareholder would pay on Fund distributions or redemption of Fund shares.
The following table outlines key fund statistics that you should pay attention to.
| Fund net assets | $2,599,486 |
| Total number of portfolio holdings | 202 |
| Total advisory fee paid, net of waiver | $1,313 |
| Period portfolio turnover rate | 65% |
Graphical Representation of Holdings
The table below shows the types of investments that make up the Fund as of the end of the reporting period.
| Investment Categories | % of Net Assets |
| Common Stocks | 99.8% |
| Money Market Funds | 0.1% |
| Other Assets in Excess of Liabilities | 0.1% |
| Total | 100.0% |
Availability of Additional Information
You can find additional information about the Fund such as the prospectus, financial information, fund holdings and proxy voting at the website address or contact number included at the beginning of this shareholder report.
Distributed by Foreside Financial Services, LLC.
Simplify Short Term Treasury Futures Strategy ETF
Annual Shareholder Report | June 30, 2024
This annual shareholder report contains important information about Simplify Short Term Treasury Futures Strategy ETF ("TUA" or the "Fund") for the period of July 1, 2023 to June 30, 2024. You can find additional information about the Fund at www.simplify.us/resources. You can also request this information by contacting us at (855) 772-8488.
What were the Fund’s costs for the period?
(based on a hypothetical $10,000 investment)
| Fund | Costs of a $10,000 investment | Costs paid as a percentage of a $10,000 investment |
|---|
| Simplify Short Term Treasury Futures Strategy ETF | $15 | 0.15% |
Management's Discussion of Fund Performance
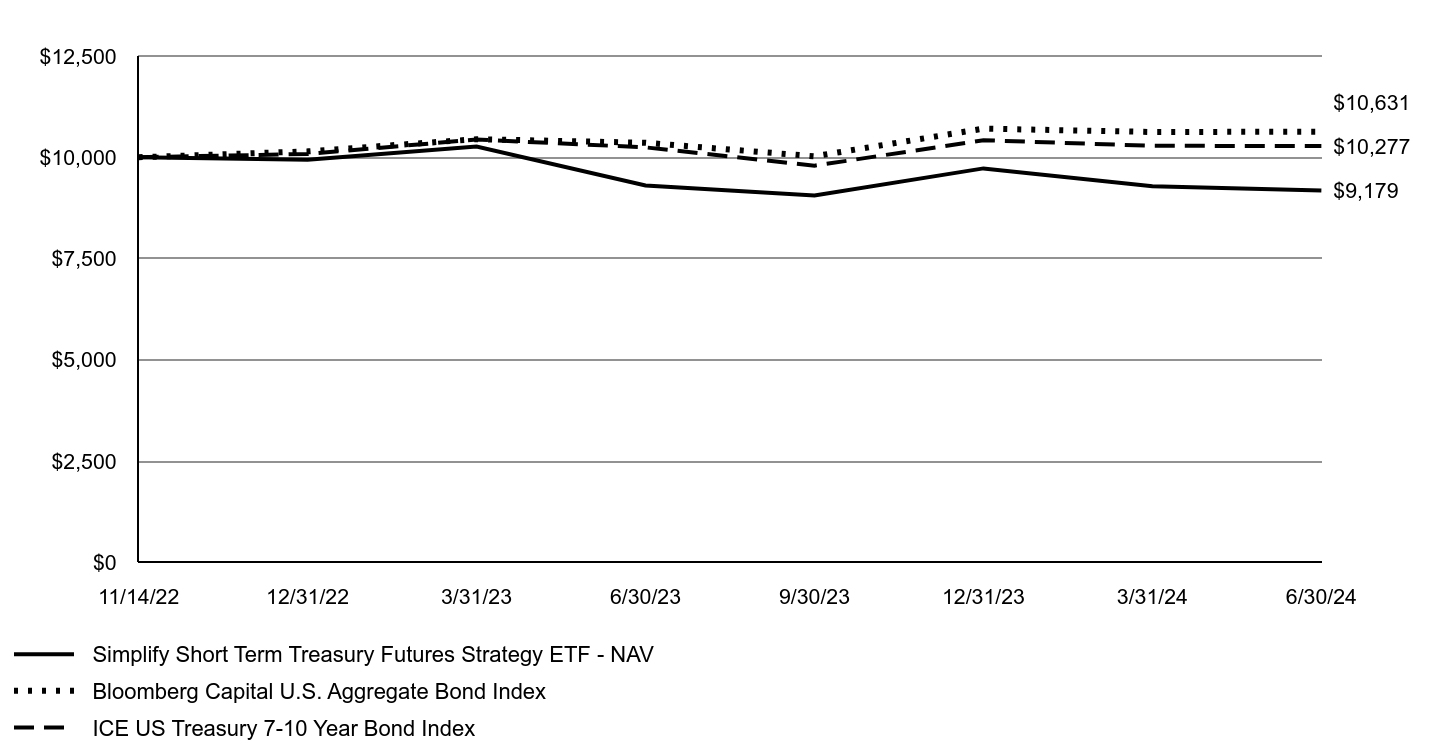
For the year ended June 30, 2024, TUA returned -1.33% vs. the ICE U.S. Treasury 7-10 Year Bond Index benchmark return of 0.32% for the same period, underperforming the benchmark by 1.65%.
TUA's performance was driven by its long exposure to Two Year Treasury Futures and holdings of short-term treasuries. A long position in Treasury futures earns returns on the cheapest to deliver bond in exchange for paying a short-term financing rate. With an inverted yield curve (2-year rates below short-term rates), this exposure has a structurally negative carry. Leveraged up 5 times, minimal yield changes in the focus treasuries led to negative returns, offsetting positive returns on short-term treasuries.
Looking forward, performance for TUA will be driven by movements in rates. Increases in rates and/or further inversions will generally be harmful and decreases accompanied by steepening would be beneficial. The path of future interest rates and their term structure is notoriously difficult to predict.
Growth of an Assumed $10,000 Investment
| Simplify Short Term Treasury Futures Strategy ETF - NAV | Bloomberg Capital U.S. Aggregate Bond Index | ICE US Treasury 7-10 Year Bond Index |
|---|
| 11/14/22 | $10,000 | $10,000 | $10,000 |
| 12/31/22 | $9,940 | $10,146 | $10,081 |
| 3/31/23 | $10,267 | $10,446 | $10,438 |
| 6/30/23 | $9,303 | $10,358 | $10,244 |
| 9/30/23 | $9,055 | $10,024 | $9,792 |
| 12/31/23 | $9,725 | $10,707 | $10,422 |
| 3/31/24 | $9,286 | $10,624 | $10,283 |
| 6/30/24 | $9,179 | $10,631 | $10,277 |
| AVERAGE ANNUAL TOTAL RETURN Fund/Index | 1 Year | Since Inception 11/14/2022 |
|---|
| Simplify Short Term Treasury Futures Strategy ETF - NAV | | |
| Simplify Short Term Treasury Futures Strategy ETF - Market | | |
| Bloomberg Capital U.S. Aggregate Bond Index | 2.63% | 3.84% |
| ICE US Treasury 7-10 Year Bond Index | 0.32% | 1.69% |
The Fund's past performance is not a good predictor of future performance. The graph and table do not reflect deduction of taxes that a shareholder would pay on Fund distributions or redemption of Fund shares.
The following table outlines key fund statistics that you should pay attention to.
| Fund net assets | $539,079,601 |
| Total number of portfolio holdings | 4 |
| Total advisory fee paid, net of waiver | $882,008 |
| Period portfolio turnover rate | 0% |
Graphical Representation of Holdings
The table below shows the types of investments that make up the Fund as of the end of the reporting period.
| Investment Categories | % of Net Assets |
| U.S. Treasury Bills | 99.5% |
| Other Assets in Excess of Liabilities | 0.5% |
| Total | 100.0% |
Availability of Additional Information
You can find additional information about the Fund such as the prospectus, financial information, fund holdings and proxy voting at the website address or contact number included at the beginning of this shareholder report.
Distributed by Foreside Financial Services, LLC.
Simplify US Equity PLUS GBTC ETF
| Nasdaq Stock Market LLC
Annual Shareholder Report | June 30, 2024
This annual shareholder report contains important information about Simplify US Equity PLUS GBTC ETF ("SPBC" or the "Fund") for the period of July 1, 2023 to June 30, 2024. You can find additional information about the Fund at www.simplify.us/resources. You can also request this information by contacting us at (855) 772-8488.
What were the Fund’s costs for the period?
(based on a hypothetical $10,000 investment)
| Fund | Costs of a $10,000 investment | Costs paid as a percentage of a $10,000 investment |
|---|
| Simplify U.S. Equity PLUS GBTC ETF | $61 | 0.51% |
Management's Discussion of Fund Performance
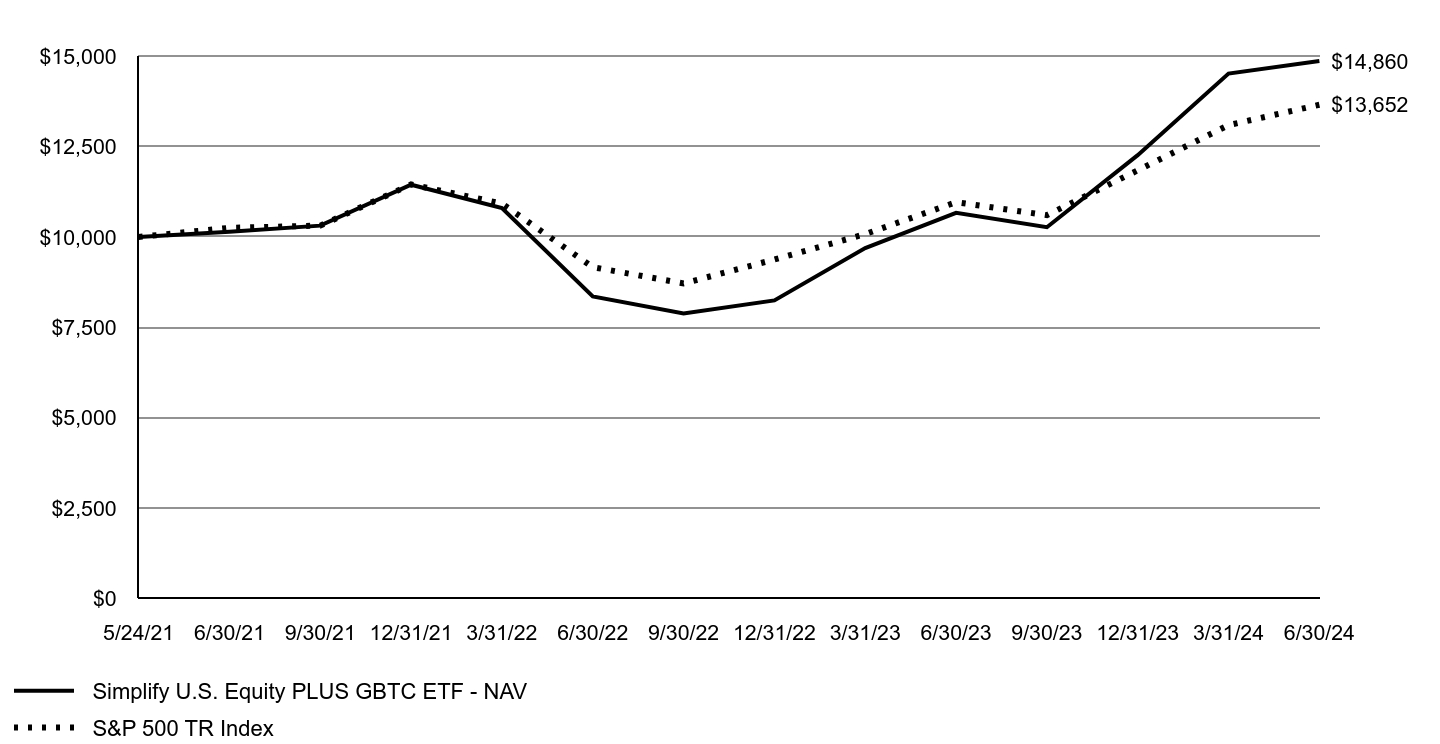
For the year ended June 30, 2024, SPBC returned 39.29% vs its referenced benchmark, S&P 500 Index, return of 24.56%, outperforming the benchmark by 14.73%.
SPBC targets a 10% exposure to GBTC, which returned 93.79% over the same period, driving the outperformance of 14.73% vs. the benchmark. The Fund’s holding in GBTC also benefitted from a shrinking in the premium between the market price of GBTC to its NAV, which shrunk from -30.15% to -0.01%, over the same period.
Looking forward, SPBC remains uniquely positioned to provide investors with exposure to U.S. Large Cap Equity combined with Bitcoin exposure. With the advent of Bitcoin exchange traded products in early 2024, GBTC should act as a good proxy for exposure to the price of spot Bitcoin moving forward, as the Fund pursues its stated investment objective.
Growth of an Assumed $10,000 Investment
| Simplify U.S. Equity PLUS GBTC ETF - NAV | S&P 500 TR Index |
|---|
| 5/24/21 | $10,000 | $10,000 |
| 6/30/21 | $10,146 | $10,253 |
| 9/30/21 | $10,313 | $10,313 |
| 12/31/21 | $11,444 | $11,450 |
| 3/31/22 | $10,798 | $10,923 |
| 6/30/22 | $8,355 | $9,165 |
| 9/30/22 | $7,883 | $8,717 |
| 12/31/22 | $8,247 | $9,376 |
| 3/31/23 | $9,693 | $10,079 |
| 6/30/23 | $10,668 | $10,960 |
| 9/30/23 | $10,269 | $10,602 |
| 12/31/23 | $12,260 | $11,841 |
| 3/31/24 | $14,513 | $13,091 |
| 6/30/24 | $14,860 | $13,652 |
| AVERAGE ANNUAL TOTAL RETURN Fund/Index | 1 Year | Since Inception 5/24/2021 |
|---|
| Simplify US Equity PLUS GBTC ETF - NAV | 39.29% | 13.62% |
| Simplify U.S. Equity PLUS GBTC ETF - Market | 39.50% | 13.97% |
| S&P 500 TR Index | 24.56% | 10.56% |
The Fund's past performance is not a good predictor of future performance. The graph and table do not reflect deduction of taxes that a shareholder would pay on Fund distributions or redemption of Fund shares.
The Fund had a return of capital of $93,611.
The following table outlines key fund statistics that you should pay attention to.
| Fund net assets | $21,526,455 |
| Total number of portfolio holdings | 4 |
| Total advisory fee paid, net of waiver | $53,810 |
| Period portfolio turnover rate | 21% |
Graphical Representation of Holdings
The table below shows the types of investments that make up the Fund as of the end of the reporting period.
| Investment Categories | % of Net Assets |
| Exchange-Traded Funds | 85.2% |
| Grantor Trusts | 9.9% |
| U.S. Treasury Bills | 4.6% |
| Money Market Funds | 0.0%Footnote Reference† |
| Other Assets in Excess of Liabilities | 0.3% |
| Total | 100.0% |
| Footnote | Description |
Footnote† | Less than 0.05% |
Availability of Additional Information
You can find additional information about the Fund such as the prospectus, financial information, fund holdings and proxy voting at the website address or contact number included at the beginning of this shareholder report.
Distributed by Foreside Financial Services, LLC.
Simplify US Equity PLUS QIS ETF
Annual Shareholder Report | June 30, 2024
This annual shareholder report contains important information about Simplify US Equity PLUS QIS ETF ("SPQ" or the "Fund") for the period of November 13, 2023 to June 30, 2024. You can find additional information about the Fund at www.simplify.us/resources. You can also request this information by contacting us at (855) 772-8488.
What were the Fund’s costs for the period?
(based on a hypothetical $10,000 investment)
| Fund | Costs of a $10,000 investment | Costs paid as a percentage of a $10,000 investment |
|---|
| Simplify US Equity PLUS QIS ETF | $39Footnote Reference(1) | 0.56% |
| Footnote | Description |
Footnote(1) | Based on the period November 13, 2023 (commencement of operations) through June 30, 2024. Expenses would have been higher if based on the full reporting period. |
Management's Discussion of Fund Performance
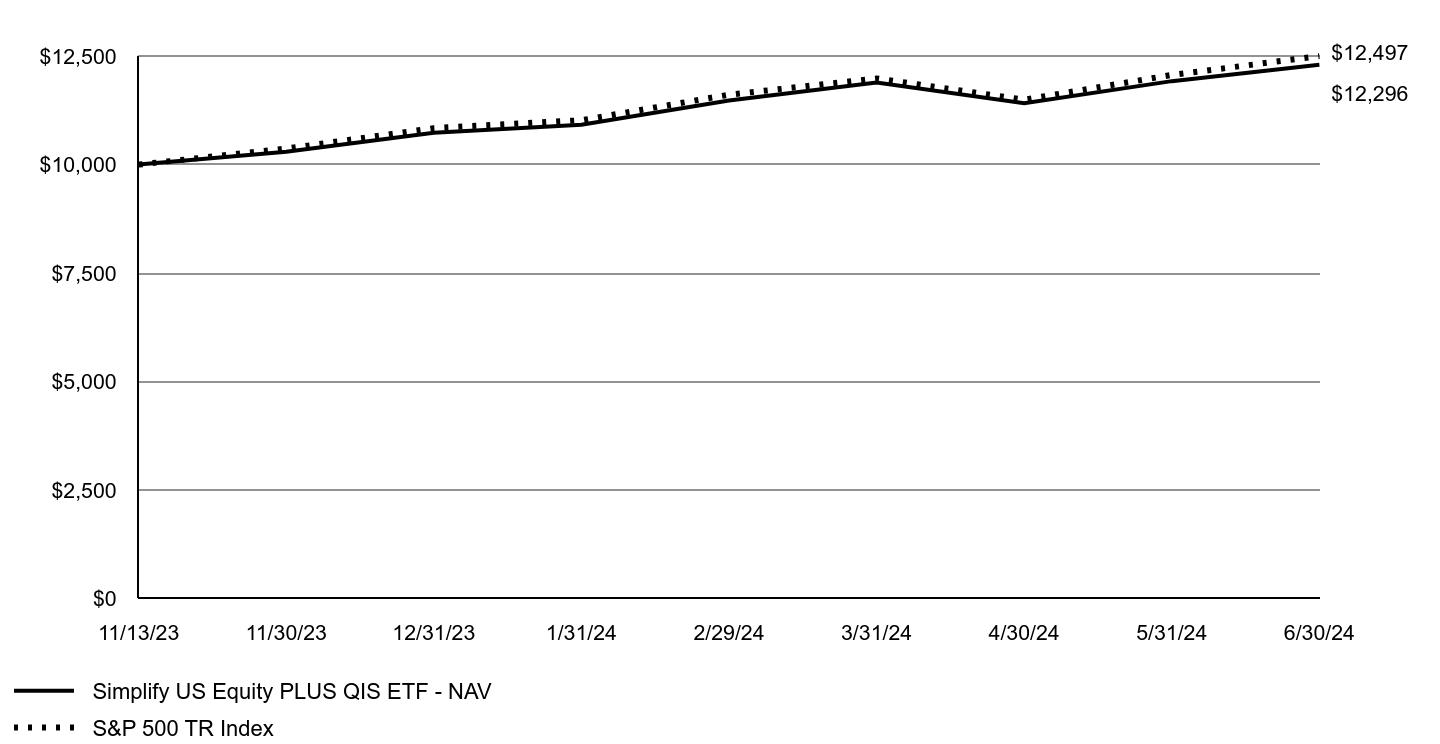
For the period November 13 2023, to June 30, 2024, SPQ returned 22.97% vs. its referenced benchmark, S&P 500 Index, return of 24.97%, underperforming by 2.00%.
Quant strategies across the board have had one of their most challenging periods in the last decade, and we have seen above average correlations between strategies further reduce normal diversification benefits. Equity volatility strategies have also been a headwind, as implied volatilities have been low and realized volatilities have been high. We did also see some more idiosyncratic headwinds out of the commodity complex. Bouts of higher correlations and challenging realized volatilities are expected to happen occasionally, and as such the performance thus far is well within our expected bounds.
Looking ahead, we expect normalization of these features, which should become tailwinds and improve performance.
Growth of an Assumed $10,000 Investment
| Simplify US Equity PLUS QIS ETF - NAV | S&P 500 TR Index |
|---|
| 11/13/23 | $10,000 | $10,000 |
| 11/30/23 | $10,295 | $10,368 |
| 12/31/23 | $10,732 | $10,839 |
| 1/31/24 | $10,915 | $11,021 |
| 2/29/24 | $11,475 | $11,610 |
| 3/31/24 | $11,887 | $11,983 |
| 4/30/24 | $11,413 | $11,494 |
| 5/31/24 | $11,921 | $12,064 |
| 6/30/24 | $12,296 | $12,497 |
| AVERAGE ANNUAL TOTAL RETURN Fund/Index | Since Inception 11/13/2023 |
|---|
| Simplify US Equity PLUS QIS ETF - NAV | 22.97% |
| Simplify US Equity PLUS QIS ETF - Market | 20.88% |
| S&P 500 TR Index | 24.97% |
The Fund's past performance is not a good predictor of future performance. The graph and table do not reflect deduction of taxes that a shareholder would pay on Fund distributions or redemption of Fund shares.
The following table outlines key fund statistics that you should pay attention to.
| Fund net assets | $3,002,992 |
| Total number of portfolio holdings | 3 |
| Total advisory fee paid, net of waiver | $10,319 |
| Period portfolio turnover rate | 88% |
Graphical Representation of Holdings
The table below shows the types of investments that make up the Fund as of the end of the reporting period.
| Investment Categories | % of Net Assets |
| Exchange-Traded Funds | 94.7% |
| U.S. Treasury Bills | 3.3% |
| Other Assets in Excess of Liabilities | 2.0% |
| Total | 100.0% |
Availability of Additional Information
You can find additional information about the Fund such as the prospectus, financial information, fund holdings and proxy voting at the website address or contact number included at the beginning of this shareholder report.
Distributed by Foreside Financial Services, LLC.
Simplify Commodities Strategy No K-1 ETF
Annual Shareholder Report | June 30, 2024
This annual shareholder report contains important information about Simplify Commodities Strategy No K-1 ETF ("HARD" or the "Fund") for the period of July 1, 2023 to June 30, 2024. You can find additional information about the Fund at www.simplify.us/resources. You can also request this information by contacting us at (855) 772-8488.
What were the Fund’s costs for the period?
(based on a hypothetical $10,000 investment)
| Fund | Costs of a $10,000 investment | Costs paid as a percentage of a $10,000 investment |
|---|
| Simplify Commodities Strategy No K-1 ETF | $75 | 0.75% |
Management's Discussion of Fund Performance
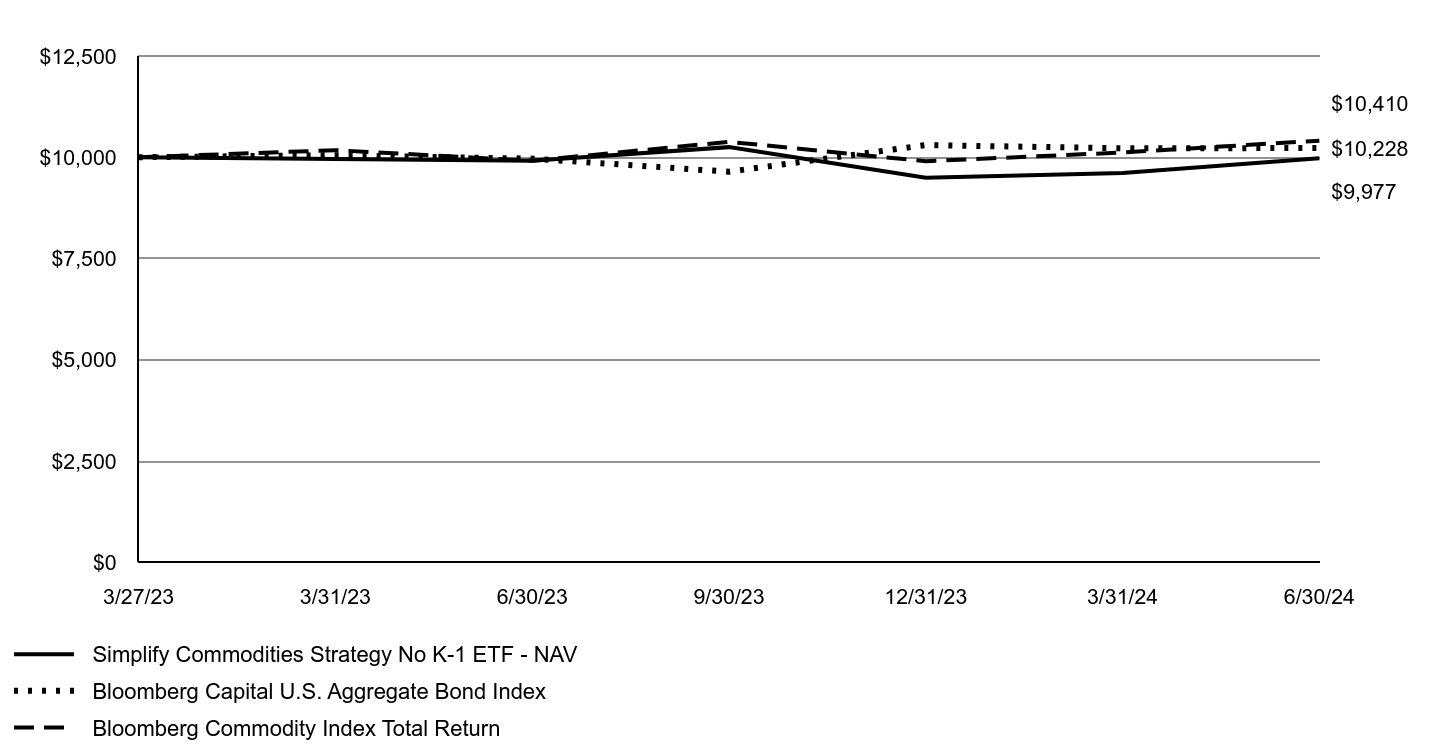
For the year ended June 30, 2024, HARD returned 0.63% vs its referenced benchmark, Bloomberg Commodity Index Total Return, return of 2.63% for the same period, underperforming the benchmark by 2.00%.
Positive returns from positions in selected energy and base metals were helpful to the Fund performance, while giving back performance in its precious metals posture. Average overall weight of aggregate commodity positioning was about +30%, which is a result of the strategy’s long commodity bias. Additionally, the Fund minimized negative carry positioning in individual commodities with curves having excess steepness or inversion.
Going forward, our view is that HARD’s asset selection and positioning should enable it to outperform during a cyclical bull market in commodities, especially in energy and metals.
Growth of an Assumed $10,000 Investment
| Simplify Commodities Strategy No K-1 ETF - NAV | Bloomberg Capital U.S. Aggregate Bond Index | Bloomberg Commodity Index Total Return |
|---|
| 3/27/23 | $10,000 | $10,000 | $10,000 |
| 3/31/23 | $9,956 | $10,050 | $10,175 |
| 6/30/23 | $9,914 | $9,966 | $9,914 |
| 9/30/23 | $10,250 | $9,644 | $10,381 |
| 12/31/23 | $9,497 | $10,301 | $9,901 |
| 3/31/24 | $9,611 | $10,221 | $10,118 |
| 6/30/24 | $9,977 | $10,228 | $10,410 |
| AVERAGE ANNUAL TOTAL RETURN Fund/Index | 1 Year | Since Inception 3/27/2023 |
|---|
| Simplify Commodities Strategy No K-1 ETF - NAV | 0.63% | |
| Simplify Commodities Strategy No K-1 ETF - Market | 0.44% | |
| Bloomberg Capital U.S. Aggregate Bond Index | 2.63% | 1.80% |
| Bloomberg Commodity Index Total Return | 5.00% | 3.24% |
The Fund's past performance is not a good predictor of future performance. The graph and table do not reflect deduction of taxes that a shareholder would pay on Fund distributions or redemption of Fund shares.
The following table outlines key fund statistics that you should pay attention to.
| Fund net assets | $10,273,122 |
| Total number of portfolio holdings | 3 |
| Total advisory fee paid, net of waiver | $65,614 |
| Period portfolio turnover rate | 0% |
Graphical Representation of Holdings
The table below shows the types of investments that make up the Fund as of the end of the reporting period.
| Investment Categories | % of Net Assets |
| U.S. Treasury Bills | 98.8% |
| Other Assets in Excess of Liabilities | 1.2% |
| Total | 100.0% |
Availability of Additional Information
You can find additional information about the Fund such as the prospectus, financial information, fund holdings and proxy voting at the website address or contact number included at the beginning of this shareholder report.
Distributed by Foreside Financial Services, LLC.
Simplify Macro Strategy ETF
Annual Shareholder Report | June 30, 2024
This annual shareholder report contains important information about Simplify Macro Strategy ETF ("FIG" or the "Fund") for the period of July 1, 2023 to June 30, 2024. You can find additional information about the Fund at www.simplify.us/resources. You can also request this information by contacting us at (855) 772-8488.
What were the Fund’s costs for the period?
(based on a hypothetical $10,000 investment)
| Fund | Costs of a $10,000 investment | Costs paid as a percentage of a $10,000 investment |
|---|
| Simplify Macro Strategy ETF | $59 | 0.61% |
Management's Discussion of Fund Performance
For the year ended June 30, 2024, FIG returned -7.19% vs its referenced benchmark, Bloomberg US EQ:FI 60:40 Index, return of 15.69% for the same period, underperforming the benchmark by -22.88%.
The Fund’s net short US equity position drove underperformance. From June 30, 2023 to October 26, 2023, equity shorts and investment in the Simplify Managed Futures ETF boosted performance by 2.56% over the benchmark. A strong equity rally from October 26, 2023 led to a 1.25% underperformance in Q1-2024 and a 2.5% underperformance in Q2-2024 due to underinvestment. An aggressive short on Carvana (CVNA) resulted in a 7.8% NAV loss on May 2, 2024, and a -10.24% impact overall.
Looking forward, FIG remains underinvested in US equities due to high valuations and aggressive earnings expectations. Despite disappointing earnings, valuations have risen sharply. Implied volatility and equity correlations are low, and equity allocations are at historic highs. US government bonds offer attractive real yields of 2-2.5%. We anticipate that slowing economic growth and rising unemployment will highlight the divergence between bonds and equities, impacting performance.
Growth of an Assumed $10,000 Investment
| Simplify Macro Strategy ETF - NAV | Bloomberg US EQ:FI 60:40 Index | ICE BofA 3 Month US Treasury Bill Index |
|---|
| 5/16/22 | $10,000 | $10,000 | $10,000 |
| 6/30/22 | $9,439 | $9,654 | $10,006 |
| 9/30/22 | $9,504 | $9,202 | $10,052 |
| 12/31/22 | $9,668 | $9,660 | $10,137 |
| 3/31/23 | $9,770 | $10,231 | $10,246 |
| 6/30/23 | $9,811 | $10,739 | $10,366 |
| 9/30/23 | $9,520 | $10,408 | $10,502 |
| 12/31/23 | $9,913 | $11,438 | $10,645 |
| 3/31/24 | $9,915 | $12,109 | $10,783 |
| 6/30/24 | $9,106 | $12,424 | $10,926 |
| AVERAGE ANNUAL TOTAL RETURN Fund/Index | 1 Year | Since Inception 5/16/2022 |
|---|
| Simplify Macro Strategy ETF - NAV | | |
| Simplify Macro Strategy ETF - Market | | |
| Bloomberg US EQ:FI 60:40 Index | 15.69% | 10.76% |
| ICE BofA 3 Month US Treasury Bill Index | 5.40% | 4.26% |
The Fund's past performance is not a good predictor of future performance. The graph and table do not reflect deduction of taxes that a shareholder would pay on Fund distributions or redemption of Fund shares.
The following table outlines key fund statistics that you should pay attention to.
| Fund net assets | $17,785,413 |
| Total number of portfolio holdings | 21 |
| Total advisory fee paid, net of waiver | $162,934 |
| Period portfolio turnover rate | 68% |
Graphical Representation of Holdings
The table below shows the types of investments that make up the Fund as of the end of the reporting period.
| Investment Categories | % of Net Assets |
| Exchange-Traded Funds | 79.8% |
| U.S. Treasury Inflation Indexed Bonds | 18.5% |
| Purchased Options | 1.8% |
| Money Market Funds | 0.3% |
| Liabilities in Excess of Other Assets | (0.4)% |
| Total | 100.0% |
Availability of Additional Information
You can find additional information about the Fund such as the prospectus, financial information, fund holdings and proxy voting at the website address or contact number included at the beginning of this shareholder report.
Distributed by Foreside Financial Services, LLC.
Simplify Managed Futures Strategy ETF
Annual Shareholder Report | June 30, 2024
This annual shareholder report contains important information about Simplify Managed Futures Strategy ETF ("CTA" or the "Fund") for the period of July 1, 2023 to June 30, 2024. You can find additional information about the Fund at www.simplify.us/resources. You can also request this information by contacting us at (855) 772-8488.
What were the Fund’s costs for the period?
(based on a hypothetical $10,000 investment)
| Fund | Costs of a $10,000 investment | Costs paid as a percentage of a $10,000 investment |
|---|
| Simplify Managed Futures Strategy ETF | $81 | 0.76% |
Management's Discussion of Fund Performance
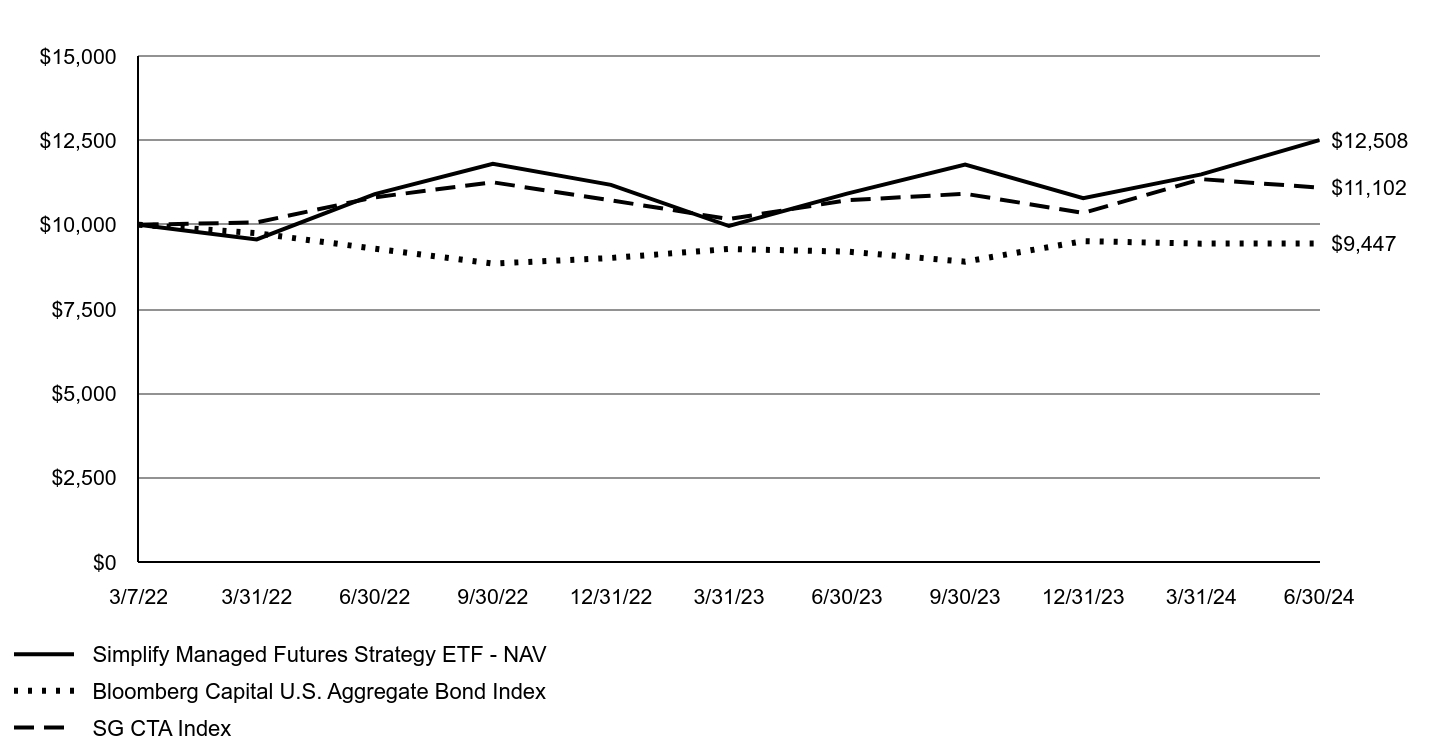
For the year ended June 30, 2024, CTA returned 14.52% vs its referenced benchmark, SG CTA Index, return of 3.50% for the same period, outperforming the benchmark by 11.02%.
Short interest rate and related positions were the predominant risks and primary contributors to CTA. Higher rates across the curve, along with timely energy, metals, and agricultural positioning, resulted in a nearly 15% total return, outperforming competitors and the benchmark. The Fund's positioning benefited from asset curves' shapes, providing positive carry. Additionally, the Fund’s realized volatility was around 14%, slightly below the typical target for trend-following funds.
Looking ahead, we believe the Fund is well-positioned to capitalize on a near-term bull market in energy and metals and softer agricultural prices, coinciding with higher global yields. The inclusion of additional liquid energy, metal, and agricultural positions should enhance diversification and provide broader sources of potential alpha.
Growth of an Assumed $10,000 Investment
| Simplify Managed Futures Strategy ETF - NAV | Bloomberg Capital U.S. Aggregate Bond Index | SG CTA Index |
|---|
| 3/7/22 | $10,000 | $10,000 | $10,000 |
| 3/31/22 | $9,566 | $9,749 | $10,070 |
| 6/30/22 | $10,907 | $9,292 | $10,814 |
| 9/30/22 | $11,809 | $8,850 | $11,258 |
| 12/31/22 | $11,182 | $9,016 | $10,725 |
| 3/31/23 | $9,963 | $9,283 | $10,169 |
| 6/30/23 | $10,922 | $9,205 | $10,727 |
| 9/30/23 | $11,783 | $8,907 | $10,918 |
| 12/31/23 | $10,789 | $9,515 | $10,351 |
| 3/31/24 | $11,492 | $9,441 | $11,351 |
| 6/30/24 | $12,508 | $9,447 | $11,102 |
| AVERAGE ANNUAL TOTAL RETURN Fund/Index | 1 Year | Since Inception 3/7/2022 |
|---|
| Simplify Managed Futures Strategy ETF - NAV | 14.52% | 10.15% |
| Simplify Managed Futures Strategy ETF - Market | 14.61% | 9.58% |
| Bloomberg Capital U.S. Aggregate Bond Index | 2.63% | |
| SG CTA Index | 3.50% | 4.62% |
The Fund's past performance is not a good predictor of future performance. The graph and table do not reflect deduction of taxes that a shareholder would pay on Fund distributions or redemption of Fund shares.
The following table outlines key fund statistics that you should pay attention to.
| Fund net assets | $204,869,602 |
| Total number of portfolio holdings | 3 |
| Total advisory fee paid, net of waiver | $1,155,079 |
| Period portfolio turnover rate | 0% |
Graphical Representation of Holdings
The table below shows the types of investments that make up the Fund as of the end of the reporting period.
| Investment Categories | % of Net Assets |
| U.S. Treasury Bills | 93.1% |
| Other Assets in Excess of Liabilities | 6.9% |
| Total | 100.0% |
Availability of Additional Information
You can find additional information about the Fund such as the prospectus, financial information, fund holdings and proxy voting at the website address or contact number included at the beginning of this shareholder report.
Distributed by Foreside Financial Services, LLC.
Simplify Opportunistic Income ETF
Annual Shareholder Report | June 30, 2024
This annual shareholder report contains important information about Simplify Opportunistic Income ETF ("CRDT" or the "Fund") for the period of July 1, 2023 to June 30, 2024. You can find additional information about the Fund at www.simplify.us/resources. You can also request this information by contacting us at (855) 772-8488.
What were the Fund’s costs for the period?
(based on a hypothetical $10,000 investment)
| Fund | Costs of a $10,000 investment | Costs paid as a percentage of a $10,000 investment |
|---|
| Simplify Opportunistic Income ETF | $53 | 0.51% |
Management's Discussion of Fund Performance
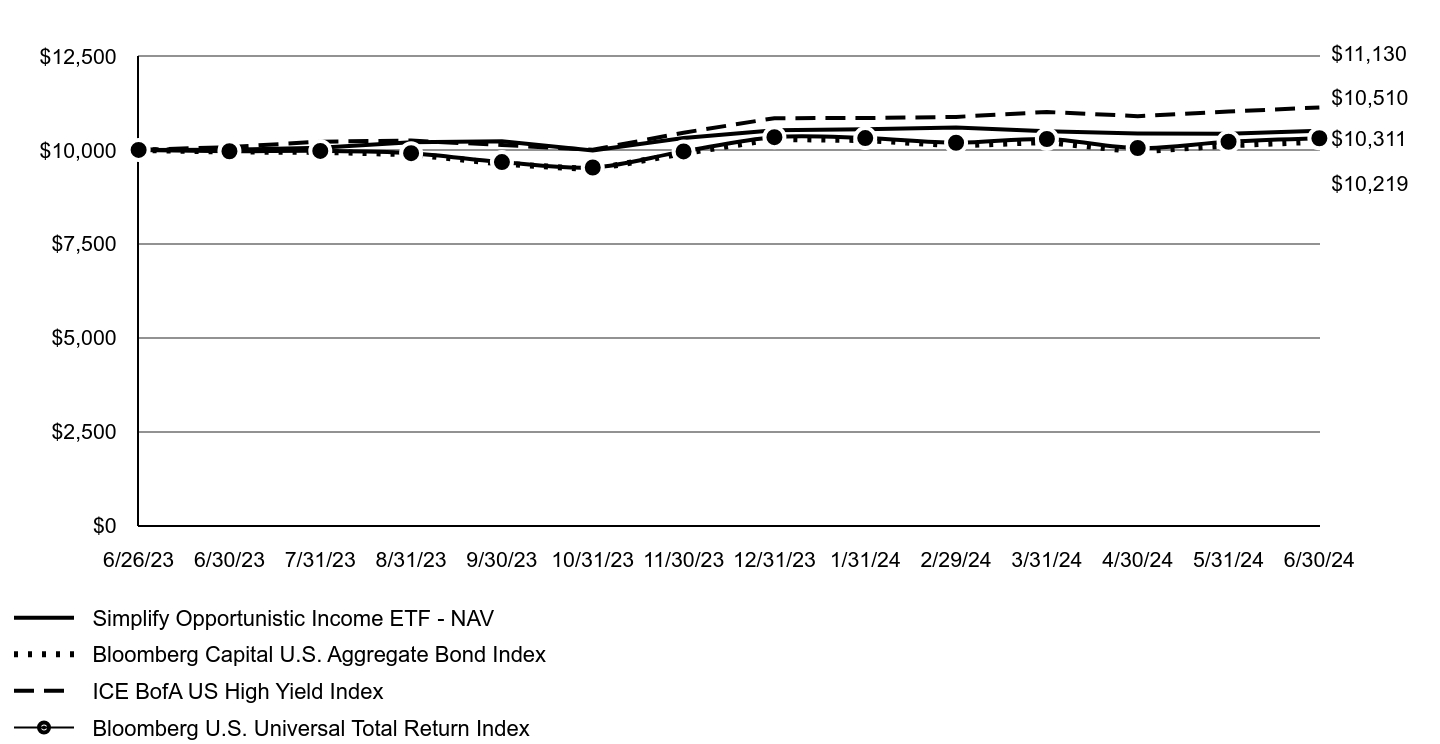
For the year ended June 30, 2024, CRDT returned 5.05% vs. the Bloomberg U.S. Universal Total Return Index benchmark return of 3.47% for the same period, outperforming the benchmark by 1.58%.
Tactical positioning during the year focused on dislocations in single name distressed and high dividend preferred corporate bonds, which provided a steady source of coupon income, but were somewhat offset by price return losses. Other major positions generated modest positive return and included securitized bonds (mortgage-related and ABS), foreign positions including sovereign CDS buy protection, and futures and TRS overlays (e.g., long Quality vs Junk equities).
Looking ahead, the Fund continues to focus on undervalued sectors like ABS and corporates where management is addressing fundamentals and will identify cheap high yield and distressed credits versus underweighting the index, where our view is that the spreads are too tight.
Growth of an Assumed $10,000 Investment
| Simplify Opportunistic Income ETF - NAV | Bloomberg Capital U.S. Aggregate Bond Index | ICE BofA US High Yield Index | Bloomberg U.S. Universal Total Return Index |
|---|
| 6/26/23 | $10,000 | $10,000 | $10,000 | $10,000 |
| 6/30/23 | $10,004 | $9,958 | $10,077 | $9,965 |
| 7/31/23 | $10,060 | $9,951 | $10,221 | $9,975 |
| 8/31/23 | $10,204 | $9,887 | $10,250 | $9,915 |
| 9/30/23 | $10,232 | $9,636 | $10,131 | $9,678 |
| 10/31/23 | $9,986 | $9,484 | $10,005 | $9,533 |
| 11/30/23 | $10,319 | $9,913 | $10,460 | $9,962 |
| 12/31/23 | $10,526 | $10,293 | $10,846 | $10,340 |
| 1/31/24 | $10,550 | $10,264 | $10,848 | $10,315 |
| 2/29/24 | $10,596 | $10,119 | $10,880 | $10,192 |
| 3/31/24 | $10,497 | $10,213 | $11,010 | $10,292 |
| 4/30/24 | $10,441 | $9,955 | $10,900 | $10,051 |
| 5/31/24 | $10,428 | $10,124 | $11,023 | $10,218 |
| 6/30/24 | $10,510 | $10,219 | $11,130 | $10,311 |
| AVERAGE ANNUAL TOTAL RETURN Fund/Index | 1 Year | Since Inception 6/26/2023 |
|---|
| Simplify Opportunistic Income ETF - NAV | 5.05% | 5.04% |
| Simplify Opportunistic Income ETF - Market | 5.12% | 4.99% |
| Bloomberg Capital U.S. Aggregate Bond Index | 2.63% | 2.17% |
| ICE BofA US High Yield Index | 10.45% | 11.17% |
| Bloomberg U.S. Universal Total Return Index | 3.47% | 3.09% |
The Fund's past performance is not a good predictor of future performance. The graph and table do not reflect deduction of taxes that a shareholder would pay on Fund distributions or redemption of Fund shares.
The following table outlines key fund statistics that you should pay attention to.
| Fund net assets | $74,700,650 |
| Total number of portfolio holdings | 79 |
| Total advisory fee paid, net of waiver | $329,974 |
| Period portfolio turnover rate | 322% |
Graphical Representation of Holdings
The table below shows the types of investments that make up the Fund as of the end of the reporting period.
| Investment Categories | % of Net Assets |
| U.S. Treasury Bills | 27.5% |
| Corporate Bonds | 25.9% |
| U.S. Government Agency Mortgage Backed Securities | 18.1% |
| Asset Backed Securities | 14.2% |
| Foreign Bonds | 13.9% |
| Preferred Stocks | 7.5% |
| Common Stocks | 7.2% |
| Closed-End Funds | 0.6% |
| Term Loans | 0.3% |
| Liabilities in Excess of Other Assets | (15.2)% |
| Total | 100.0% |
Availability of Additional Information
You can find additional information about the Fund such as the prospectus, financial information, fund holdings and proxy voting at the website address or contact number included at the beginning of this shareholder report.
Distributed by Foreside Financial Services, LLC.
Simplify Propel Opportunities ETF
Annual Shareholder Report | June 30, 2024
This annual shareholder report contains important information about Simplify Propel Opportunities ETF ("SURI" or the "Fund") for the period of July 1, 2023 to June 30, 2024. You can find additional information about the Fund at www.simplify.us/resources. You can also request this information by contacting us at (855) 772-8488.
What were the Fund’s costs for the period?
(based on a hypothetical $10,000 investment)
| Fund | Costs of a $10,000 investment | Costs paid as a percentage of a $10,000 investment |
|---|
| Simplify Propel Opportunities ETF | $272 | 2.50% |
Management's Discussion of Fund Performance
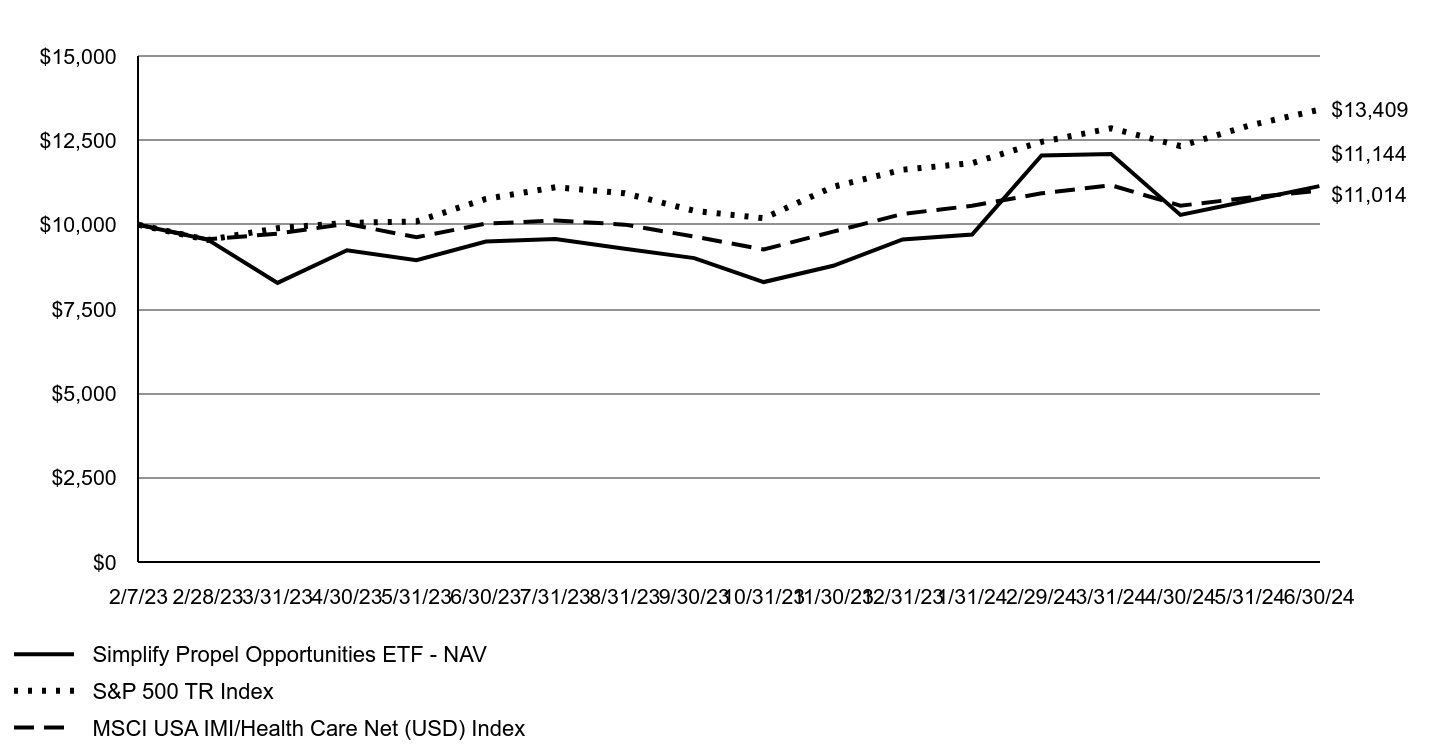
For the year ended June 30, 2024, SURI returned 17.27% vs. the MSCI USA IMI Health Care Net Total Return USD Index benchmark return of 9.76% for the same period, outperforming the benchmark by 7.51%.
SURI has a heavier weighting of early-stage and small/mid-cap (SMID) companies in SURI versus MSCI USA IMI Health Care Net Total Return USD Index. While, in general SMID companies have underperformed versus large cap healthcare companies during this period, we have still been able to outperform versus the benchmark due to our high touch, active management of the portfolio.
In the next 12 months, while we anticipate continued volatility in SMID healthcare companies versus the overall market, we expect specific catalysts within the SURI portfolio along with increased M&A and strategic activities targeting SMID healthcare companies to drive outperformance.
Growth of an Assumed $10,000 Investment
| Simplify Propel Opportunities ETF - NAV | S&P 500 TR Index | MSCI USA IMI/Health Care Net (USD) Index |
|---|
| 2/7/23 | $10,000 | $10,000 | $10,000 |
| 2/28/23 | $9,552 | $9,549 | $9,568 |
| 3/31/23 | $8,279 | $9,900 | $9,737 |
| 4/30/23 | $9,245 | $10,055 | $10,029 |
| 5/31/23 | $8,948 | $10,098 | $9,629 |
| 6/30/23 | $9,503 | $10,766 | $10,034 |
| 7/31/23 | $9,581 | $11,111 | $10,126 |
| 8/31/23 | $9,290 | $10,934 | $10,004 |
| 9/30/23 | $9,012 | $10,413 | $9,649 |
| 10/31/23 | $8,303 | $10,194 | $9,269 |
| 11/30/23 | $8,785 | $11,125 | $9,796 |
| 12/31/23 | $9,566 | $11,631 | $10,321 |
| 1/31/24 | $9,709 | $11,826 | $10,563 |
| 2/29/24 | $12,053 | $12,457 | $10,931 |
| 3/31/24 | $12,099 | $12,858 | $11,172 |
| 4/30/24 | $10,293 | $12,333 | $10,566 |
| 5/31/24 | $10,720 | $12,945 | $10,806 |
| 6/30/24 | $11,144 | $13,409 | $11,014 |
| AVERAGE ANNUAL TOTAL RETURN Fund/Index | 1 Year | Since Inception 2/7/2023 |
|---|
| Simplify Propel Opportunities ETF - NAV | 17.27% | 8.09% |
| Simplify Propel Opportunities ETF - Market | 16.83% | 8.96% |
| S&P 500 TR Index | 24.56% | 23.46% |
| MSCI USA IMI/Health Care Net (USD) Index | 9.76% | 7.18% |
The Fund's past performance is not a good predictor of future performance. The graph and table do not reflect deduction of taxes that a shareholder would pay on Fund distributions or redemption of Fund shares.
The Fund had a return of capital of $13,554,166.
The following table outlines key fund statistics that you should pay attention to.
| Fund net assets | $96,943,570 |
| Total number of portfolio holdings | 26 |
| Total advisory fee paid, net of waiver | $2,421,546 |
| Period portfolio turnover rate | 42% |
Graphical Representation of Holdings
The table below shows the types of investments that make up the Fund as of the end of the reporting period.
| Investment Categories | % of Net Assets |
| Common Stocks | 68.2% |
| Limited Partnership | 26.7% |
| Corporate Bonds | 3.3% |
| Closed-End Funds | 1.6% |
| Money Market Funds | 0.3% |
| Liabilities in Excess of Other Assets | (0.1)% |
| Total | 100.0% |
Availability of Additional Information
You can find additional information about the Fund such as the prospectus, financial information, fund holdings and proxy voting at the website address or contact number included at the beginning of this shareholder report.
Distributed by Foreside Financial Services, LLC.
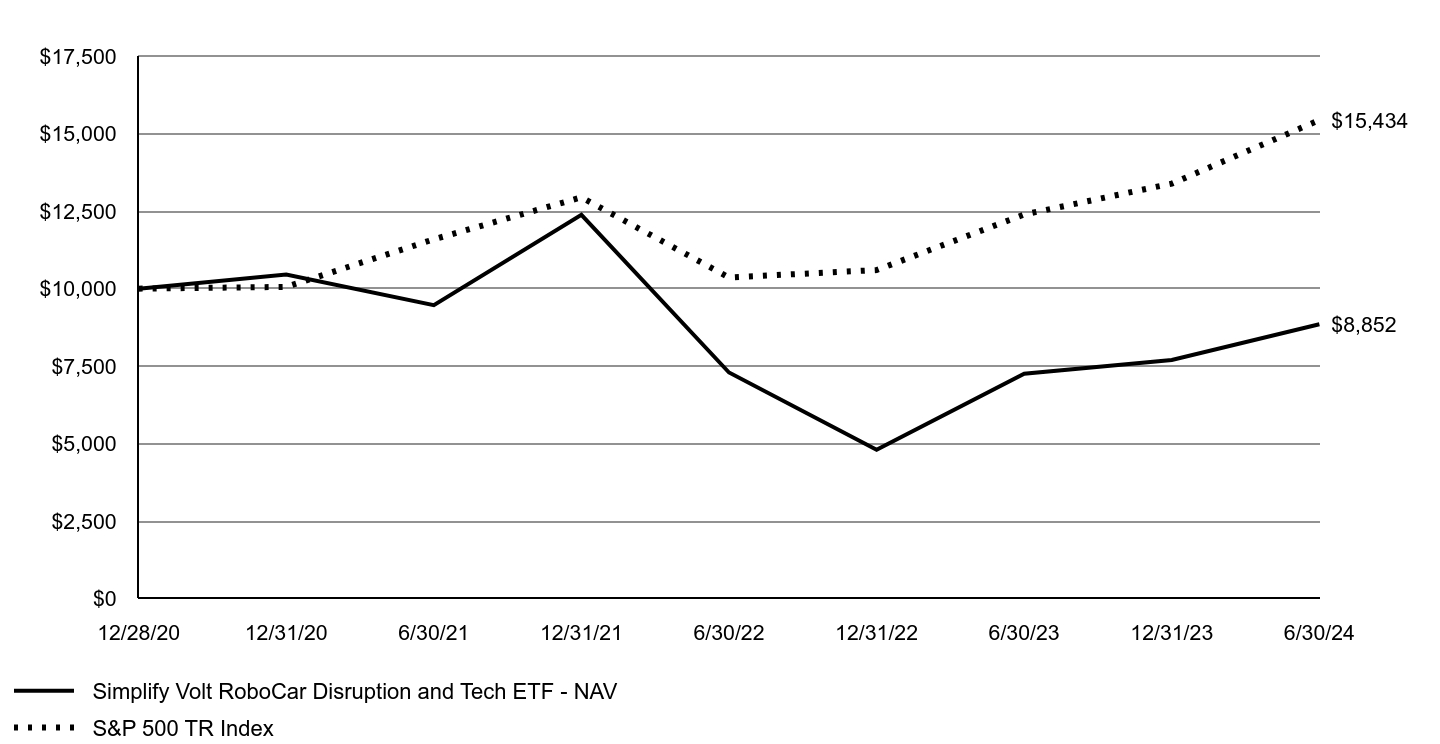
Simplify Volt RoboCar Disruption and Tech ETF
Annual Shareholder Report | June 30, 2024
This annual shareholder report contains important information about Simplify Volt RoboCar Disruption and Tech ETF ("VCAR" or the "Fund") for the period of July 1, 2023 to June 30, 2024. You can find additional information about the Fund at www.simplify.us/resources. You can also request this information by contacting us at (855) 772-8488.
What were the Fund’s costs for the period?
(based on a hypothetical $10,000 investment)
| Fund | Costs of a $10,000 investment | Costs paid as a percentage of a $10,000 investment |
|---|
| Simplify Volt RoboCar Disruption and Tech ETF | $106 | 0.95% |
Management's Discussion of Fund Performance
For the year ended June 30, 2024, VCAR returned 21.96% vs its referenced benchmark, S&P 500 Index, return of 24.56%, underperforming the benchmark by 2.60%.
VCAR performed well alongside the broader market despite experiencing a downward drag due to significant exposure to Tesla. This was mitigated by substantial exposure to NVIDIA (NVDA), which greatly benefited from the rise of artificial intelligence (AI) technologies. The strategic positioning in NVDA helped buoy the Fund's performance.
Looking forward, we believe there will continue to be strong tailwinds for VCAR and the autonomous driving space, and we continue to be optimistic about Tesla in particular. The advancements in AI are poised to have a transformative impact on society, and we remain optimistic about the Fund's future performance given its focus on robocar and tech names at the forefront of this technological evolution.
Growth of an Assumed $10,000 Investment
| Simplify Volt RoboCar Disruption and Tech ETF - NAV | S&P 500 TR Index |
|---|
| 12/28/20 | $10,000 | $10,000 |
| 12/31/20 | $10,456 | $10,057 |
| 6/30/21 | $9,466 | $11,591 |
| 12/31/21 | $12,382 | $12,944 |
| 6/30/22 | $7,297 | $10,361 |
| 12/31/22 | $4,810 | $10,600 |
| 6/30/23 | $7,258 | $12,391 |
| 12/31/23 | $7,699 | $13,387 |
| 6/30/24 | $8,852 | $15,434 |
| AVERAGE ANNUAL TOTAL RETURN Fund/Index | 1 Year | Since Inception 12/28/2020 |
|---|
| Simplify Volt RoboCar Disruption and Tech ETF - NAV | 21.96% | |
| Simplify Volt RoboCar Disruption and Tech ETF - Market | 22.68% | |
| S&P 500 TR Index | 24.56% | 13.18% |
The Fund's past performance is not a good predictor of future performance. The graph and table do not reflect deduction of taxes that a shareholder would pay on Fund distributions or redemption of Fund shares.
The following table outlines key fund statistics that you should pay attention to.
| Fund net assets | $5,513,452 |
| Total number of portfolio holdings | 81 |
| Total advisory fee paid, net of waiver | $44,271 |
| Period portfolio turnover rate | 19% |
Graphical Representation of Holdings
The table below shows the types of investments that make up the Fund as of the end of the reporting period.
| Investment Categories | % of Net Assets |
| Common Stocks | 93.7% |
| Purchased Options | 2.7% |
| Money Market Funds | 3.8% |
| Liabilities in Excess of Other Assets | (0.2)% |
| Total | 100.0% |
Availability of Additional Information
You can find additional information about the Fund such as the prospectus, financial information, fund holdings and proxy voting at the website address or contact number included at the beginning of this shareholder report.
Distributed by Foreside Financial Services, LLC.
Simplify US Equity PLUS Convexity ETF
Annual Shareholder Report | June 30, 2024
This annual shareholder report contains important information about Simplify US Equity PLUS Convexity ETF ("SPYC" or the "Fund") for the period of July 1, 2023 to June 30, 2024. You can find additional information about the Fund at www.simplify.us/resources. You can also request this information by contacting us at (855) 772-8488.
This report describes changes to the Fund that occurred during the reporting period.
What were the Fund’s costs for the period?
(based on a hypothetical $10,000 investment)
| Fund | Costs of a $10,000 investment | Costs paid as a percentage of a $10,000 investment |
|---|
| Simplify US Equity PLUS Convexity ETF | $43 | 0.38% |
Management's Discussion of Fund Performance
For the year ended June 30, 2024, SPYC returned 26.21% vs its referenced benchmark, S&P 500 Index, return of 24.56%, outperforming the benchmark by 1.65%.
The outperformance was driven by the timely monetization of our call options. Regarding the puts overlay, the down moves in equities during this period were not deep enough to hit our strikes, causing our puts to expire worthless with the expected drag in performance.
In the next 12 months, we aim to capitalize on these monetization opportunities, when possible, to potentially enhance performance on the upside while maintaining a strong notional coverage on the downside.
Growth of an Assumed $10,000 Investment
| Simplify US Equity PLUS Convexity ETF - NAV | S&P 500 TR Index |
|---|
| 9/3/20 | $10,000 | $10,000 |
| 12/31/20 | $10,834 | $10,927 |
| 6/30/21 | $12,367 | $12,593 |
| 12/31/21 | $13,976 | $14,063 |
| 6/30/22 | $10,923 | $11,256 |
| 12/31/22 | $10,427 | $11,516 |
| 6/30/23 | $12,088 | $13,462 |
| 12/31/23 | $12,931 | $14,543 |
| 6/30/24 | $15,257 | $16,767 |
| AVERAGE ANNUAL TOTAL RETURN Fund/Index | 1 Year | Since Inception 9/3/2020 |
|---|
| Simplify US Equity PLUS Convexity ETF - NAV | 26.21% | 11.69% |
| Simplify US Equity PLUS Convexity ETF - Market | 26.12% | 11.87% |
| S&P 500 TR Index | 24.56% | 14.48% |
The Fund's past performance is not a good predictor of future performance. The graph and table do not reflect deduction of taxes that a shareholder would pay on Fund distributions or redemption of Fund shares.
The following table outlines key fund statistics that you should pay attention to.
| Fund net assets | $73,356,656 |
| Total number of portfolio holdings | 9 |
| Total advisory fee paid, net of waiver | $249,420 |
| Period portfolio turnover rate | 3% |
Graphical Representation of Holdings
The table below shows the types of investments that make up the Fund as of the end of the reporting period.
| Investment Categories | % of Net Assets |
| Exchange-Traded Funds | 98.3% |
| Purchased Options | 1.8% |
| Liabilities in Excess of Other Assets | (0.1)% |
| Total | 100.0% |
This is a summary of certain changes to the Fund since July 1, 2023. For more complete information, you may review the Fund's next prospectus, which we expect to be available by November 1, 2024 at www.simplify.us/resources or upon request at (855) 772-8488.
- A fee waiver arrangement previously in place for the Fund expired on October 31, 2023.
- "Other expenses" in the Fund's fee table were restated.
Availability of Additional Information
You can find additional information about the Fund such as the prospectus, financial information, fund holdings and proxy voting at the website address or contact number included at the beginning of this shareholder report.
Distributed by Foreside Financial Services, LLC.
Simplify US Equity PLUS Downside Convexity ETF
Annual Shareholder Report | June 30, 2024
This annual shareholder report contains important information about Simplify US Equity PLUS Downside Convexity ETF ("SPD" or the "Fund") for the period of July 1, 2023 to June 30, 2024. You can find additional information about the Fund at www.simplify.us/resources. You can also request this information by contacting us at (855) 772-8488.
This report describes changes to the Fund that occurred during the reporting period.
What were the Fund’s costs for the period?
(based on a hypothetical $10,000 investment)
| Fund | Costs of a $10,000 investment | Costs paid as a percentage of a $10,000 investment |
|---|
| Simplify US Equity PLUS Downside Convexity ETF | $41 | 0.38% |
Management's Discussion of Fund Performance
For the year ended June 30, 2024, SPD returned 20.23% vs its referenced benchmark, S&P 500 Index, return of 24.56%, underperforming the benchmark by 4.33%.
The main reason for this underperformance is the put options expiring worthless most of the time, without meaningful monetization opportunities intra-period. There were two equity drawdowns during this period, but both were in the 5% to 10% range, whereas our options overlay focuses more on delivering downside convexity for down moves beyond the 10-15% mark.
In the next 12 months, we aim to maintain a strong notional coverage while remaining in this low volatility environment, as we prepare for a potential increase in uncertainty coming into the presidential election in November 2024.
Growth of an Assumed $10,000 Investment
| Simplify US Equity PLUS Downside Convexity ETF - NAV | S&P 500 TR Index |
|---|
| 9/3/20 | $10,000 | $10,000 |
| 12/31/20 | $10,798 | $10,927 |
| 6/30/21 | $12,207 | $12,593 |
| 12/31/21 | $13,429 | $14,063 |
| 6/30/22 | $10,818 | $11,256 |
| 12/31/22 | $9,986 | $11,516 |
| 6/30/23 | $11,393 | $13,462 |
| 12/31/23 | $12,088 | $14,543 |
| 6/30/24 | $13,698 | $16,767 |
| AVERAGE ANNUAL TOTAL RETURN Fund/Index | 1 Year | Since Inception 9/3/2020 |
|---|
| Simplify US Equity PLUS Downside Convexity ETF - NAV | 20.23% | 8.58% |
| Simplify US Equity PLUS Downside Convexity ETF - Market | 20.20% | 8.71% |
| S&P 500 TR Index | 24.56% | 14.48% |
The Fund's past performance is not a good predictor of future performance. The graph and table do not reflect deduction of taxes that a shareholder would pay on Fund distributions or redemption of Fund shares.
The Fund had a return of capital of $407,750.
The following table outlines key fund statistics that you should pay attention to.
| Fund net assets | $114,185,973 |
| Total number of portfolio holdings | 7 |
| Total advisory fee paid, net of waiver | $357,495 |
| Period portfolio turnover rate | 0% |
Graphical Representation of Holdings
The table below shows the types of investments that make up the Fund as of the end of the reporting period.
| Investment Categories | % of Net Assets |
| Exchange-Traded Funds | 99.8% |
| Purchased Options | 0.4% |
| Money Market Funds | 0.0%Footnote Reference† |
| Liabilities in Excess of Other Assets | (0.2)% |
| Total | 100.0% |
| Footnote | Description |
Footnote† | Less than 0.05% |
This is a summary of certain changes to the Fund since July 1, 2023. For more complete information, you may review the Fund's next prospectus, which we expect to be available by November 1, 2024 at www.simplify.us/resources or upon request at (855) 772-8488.
- A fee waiver arrangement previously in place for the Fund expired on October 31, 2023.
- "Other expenses" in the Fund's fee table were restated.
Availability of Additional Information
You can find additional information about the Fund such as the prospectus, financial information, fund holdings and proxy voting at the website address or contact number included at the beginning of this shareholder report.
Distributed by Foreside Financial Services, LLC.
Simplify US Equity PLUS Upside Convexity ETF
Annual Shareholder Report | June 30, 2024
This annual shareholder report contains important information about Simplify US Equity PLUS Upside Convexity ETF ("SPUC" or the "Fund") for the period of July 1, 2023 to June 30, 2024. You can find additional information about the Fund at www.simplify.us/resources. You can also request this information by contacting us at (855) 772-8488.
This report describes changes to the Fund that occurred during the reporting period.
What were the Fund’s costs for the period?
(based on a hypothetical $10,000 investment)
| Fund | Costs of a $10,000 investment | Costs paid as a percentage of a $10,000 investment |
|---|
| Simplify US Equity PLUS Upside Convexity ETF | $43 | 0.37% |
Management's Discussion of Fund Performance
For the year ended June 30, 2024, SPUC returned 33.28% vs its referenced benchmark, S&P 500 Index, return of 24.56%, outperforming the benchmark by 8.72%.
The strong outperformance was driven by timely monetization of call options in the Fund, as well as partially rolling the gains into the next optimal structure to maintain a high level of notional around the target levels. This process led to a contribution of more than 8% from our options overlay.
In the next 12 months, we aim to capitalize on these monetization opportunities, when possible, to potentially enhance performance on the upside, while maintaining our options budget within boundaries to minimize the impact of potential down periods in equities.
Growth of an Assumed $10,000 Investment
| Simplify US Equity PLUS Upside Convexity ETF - NAV | S&P 500 TR Index |
|---|
| 9/3/20 | $10,000 | $10,000 |
| 12/31/20 | $10,877 | $10,927 |
| 6/30/21 | $12,552 | $12,593 |
| 12/31/21 | $14,561 | $14,063 |
| 6/30/22 | $11,047 | $11,256 |
| 12/31/22 | $10,973 | $11,516 |
| 6/30/23 | $12,886 | $13,462 |
| 12/31/23 | $13,986 | $14,543 |
| 6/30/24 | $17,174 | $16,767 |
| AVERAGE ANNUAL TOTAL RETURN Fund/Index | 1 Year | Since Inception 9/3/2020 |
|---|
| Simplify US Equity PLUS Upside Convexity ETF - NAV | 33.28% | 15.20% |
| Simplify US Equity PLUS Upside Convexity ETF - Market | 33.03% | 15.39% |
| S&P 500 TR Index | 24.56% | 14.48% |
The Fund's past performance is not a good predictor of future performance. The graph and table do not reflect deduction of taxes that a shareholder would pay on Fund distributions or redemption of Fund shares.
The following table outlines key fund statistics that you should pay attention to.
| Fund net assets | $8,063,951 |
| Total number of portfolio holdings | 7 |
| Total advisory fee paid, net of waiver | $23,663 |
| Period portfolio turnover rate | 4% |
Graphical Representation of Holdings
The table below shows the types of investments that make up the Fund as of the end of the reporting period.
| Investment Categories | % of Net Assets |
| Exchange-Traded Funds | 97.3% |
| Purchased Options | 2.6% |
| Money Market Funds | 0.2% |
| Liabilities in Excess of Other Assets | (0.1)% |
| Total | 100.0% |
This is a summary of certain changes to the Fund since July 1, 2023. For more complete information, you may review the Fund's next prospectus, which we expect to be available by November 1, 2024 at www.simplify.us/resources or upon request at (855) 772-8488.
- A fee waiver arrangement previously in place for the Fund expired on October 31, 2023.
Availability of Additional Information
You can find additional information about the Fund such as the prospectus, financial information, fund holdings and proxy voting at the website address or contact number included at the beginning of this shareholder report.
Distributed by Foreside Financial Services, LLC.
Simplify Enhanced Income ETF
Annual Shareholder Report | June 30, 2024
This annual shareholder report contains important information about Simplify Enhanced Income ETF ("HIGH" or the "Fund") for the period of July 1, 2023 to June 30, 2024. You can find additional information about the Fund at www.simplify.us/resources. You can also request this information by contacting us at (855) 772-8488.
This report describes changes to the Fund that occurred during the reporting period.
What were the Fund’s costs for the period?
(based on a hypothetical $10,000 investment)
| Fund | Costs of a $10,000 investment | Costs paid as a percentage of a $10,000 investment |
|---|
| Simplify Enhanced Income ETF | $54 | 0.52% |
Management's Discussion of Fund Performance
For the year ended June 30, 2024, HIGH returned 6.51% vs its referenced benchmark, ICE BofA US 3-Month US Treasury Bill Index, return of 5.40% for the same period, outperforming the benchmark by 1.11%.
During the first half of the period, the Fund adopted a conservative risk stance due to challenging conditions for equity index put selling, characterized by multiple volatility spikes and a negative equity market trend in late 2023. Conditions improved in early 2024, enabling us to increase risk to normal levels and achieve our target income. However, a market correction in April 2024 necessitated risk management actions that impacted performance for approximately two weeks.
In the next 12 months, we expect the Fund may perform more favorably if implied volatility and the equity market trends are closer to their historical long-term average.
Growth of an Assumed $10,000 Investment
| Simplify Enhanced Income ETF - NAV | Bloomberg Capital U.S. Aggregate Bond Index | Capital U.S. Corporate High Yield Index | ICE BofA 3 Month US Treasury Bill Index |
|---|
| 10/27/22 | $10,000 | $10,000 | $10,000 | $10,000 |
| 12/31/22 | $10,073 | $10,253 | $10,161 | $10,070 |
| 3/31/23 | $10,244 | $10,557 | $10,524 | $10,178 |
| 6/30/23 | $10,507 | $10,468 | $10,708 | $10,297 |
| 9/30/23 | $10,706 | $10,130 | $10,757 | $10,432 |
| 12/31/23 | $10,830 | $10,820 | $11,528 | $10,575 |
| 3/31/24 | $11,010 | $10,736 | $11,697 | $10,712 |
| 6/30/24 | $11,191 | $10,743 | $11,825 | $10,853 |
| AVERAGE ANNUAL TOTAL RETURN Fund/Index | 1 Year | Since Inception 10/27/2022 |
|---|
| Simplify Enhanced Income ETF - NAV | 6.51% | 6.95% |
| Simplify Enhanced Income ETF - Market | 6.38% | 6.72% |
| Bloomberg Capital U.S. Aggregate Bond Index | 2.63% | 4.38% |
| Capital U.S. Corporate High Yield Index | 10.44% | 10.54% |
| ICE BofA 3 Month US Treasury Bill Index | 5.40% | 5.01% |
The Fund's past performance is not a good predictor of future performance. The graph and table do not reflect deduction of taxes that a shareholder would pay on Fund distributions or redemption of Fund shares.
The Fund had a return of capital of $7,633,526.
The following table outlines key fund statistics that you should pay attention to.
| Fund net assets | $435,486,435 |
| Total number of portfolio holdings | 14 |
| Total advisory fee paid, net of waiver | $1,238,372 |
| Period portfolio turnover rate | 0% |
Graphical Representation of Holdings
The table below shows the types of investments that make up the Fund as of the end of the reporting period.
| Investment Categories | % of Net Assets |
| U.S. Treasury Bills | 100.2% |
| Purchased Options | 0.1% |
| Liabilities in Excess of Other Assets | (0.3)% |
| Total | 100.0% |
This is a summary of certain changes to the Fund since July 1, 2023. For more complete information, you may review the Fund's next prospectus, which we expect to be available by November 1, 2024 at www.simplify.us/resources or upon request at (855) 772-8488.
- Revisions were made to the Fund's principal investment strategy and principal risks relating to additional underlying investments used for the options spread writing strategy.
- Revisions were made to the Fund's principal investment strategy and principal risks relating to investments in a Cayman Subsidiary.
- "Other expenses" in the Fund's fee table were restated.
Availability of Additional Information
You can find additional information about the Fund such as the prospectus, financial information, fund holdings and proxy voting at the website address or contact number included at the beginning of this shareholder report.
Distributed by Foreside Financial Services, LLC.
Simplify Stable Income ETF
Annual Shareholder Report | June 30, 2024
This annual shareholder report contains important information about Simplify Stable Income ETF ("BUCK" or the "Fund") for the period of July 1, 2023 to June 30, 2024. You can find additional information about the Fund at www.simplify.us/resources. You can also request this information by contacting us at (855) 772-8488.
This report describes changes to the Fund that occurred during the reporting period.
What were the Fund’s costs for the period?
(based on a hypothetical $10,000 investment)
| Fund | Costs of a $10,000 investment | Costs paid as a percentage of a $10,000 investment |
|---|
| Simplify Treasury Option Income ETF | $37 | 0.36% |
Management's Discussion of Fund Performance
For the year ended June 30, 2024, BUCK returned 5.39% vs its referenced benchmark, Bloomberg 1-3 Month U.S. Treasury Bill Index, return of 5.50%, underperforming the benchmark by 0.11%.
It has been a challenging year for option-selling strategies across various sectors. The strategy in BUCK has focused on structural volatility selling in the treasury market. The Fund performance was impacted by challenges in hedging structural volatility selling strategies in rapidly changing long-term treasury rates.
In the next 12 months, we expect long term treasury rates to stabilize as uncertainties regarding fiscal outlook resolve. We believe BUCK is well-positioned to deliver and outperform the Bloomberg 1-3 Month U.S. Treasury Bill Index.
Growth of an Assumed $10,000 Investment
| Simplify Treasury Option Income ETF - NAV | Bloomberg Capital U.S. Aggregate Bond Index | Bloomberg Barclays 1 - 3 Month U.S. Treasury Bill Index | ICE BofA 3 Month US Treasury Bill Index |
|---|
| 10/27/22 | $10,000 | $10,000 | $10,000 | $10,000 |
| 12/31/22 | $10,077 | $10,253 | $10,070 | $10,070 |
| 3/31/23 | $10,188 | $10,557 | $10,180 | $10,178 |
| 6/30/23 | $10,327 | $10,468 | $10,304 | $10,297 |
| 9/30/23 | $10,466 | $10,130 | $10,443 | $10,432 |
| 12/31/23 | $10,533 | $10,820 | $10,587 | $10,575 |
| 3/31/24 | $10,882 | $10,736 | $10,727 | $10,712 |
| 6/30/24 | $10,884 | $10,743 | $10,871 | $10,853 |
| AVERAGE ANNUAL TOTAL RETURN Fund/Index | 1 Year | Since Inception 10/27/2022 |
|---|
| Simplify Stable Income ETF - NAV | 5.39% | 5.19% |
| Simplify Treasury Option Income ETF - Market | 5.55% | 5.04% |
| Bloomberg Capital U.S. Aggregate Bond Index | 2.63% | 4.38% |
| Bloomberg Barclays 1 - 3 Month U.S. Treasury Bill Index | 5.50% | 5.11% |
| ICE BofA 3 Month US Treasury Bill Index | 5.40% | 5.01% |
The Fund's past performance is not a good predictor of future performance. The graph and table do not reflect deduction of taxes that a shareholder would pay on Fund distributions or redemption of Fund shares.
The Fund had a return of capital of $2,109,218.
The following table outlines key fund statistics that you should pay attention to.
| Fund net assets | $139,527,399 |
| Total number of portfolio holdings | 2 |
| Total advisory fee paid, net of waiver | $229,709 |
| Period portfolio turnover rate | 0% |
Graphical Representation of Holdings
The table below shows the types of investments that make up the Fund as of the end of the reporting period.
| Investment Categories | % of Net Assets |
| U.S. Treasury Bills | 99.5% |
| Other Assets in Excess of Liabilities | 0.5% |
| Total | 100.0% |
This is a summary of certain changes to the Fund since July 1, 2023. For more complete information, you may review the Fund's next prospectus, which we expect to be available by November 1, 2024 at www.simplify.us/resources or upon request at (855) 772-8488.
- Revisions were made to the Fund's principal investment strategy and principal risks relating to additional underlying investments used for the options spread writing strategy.
- Revisions were made to the Fund's principal investment strategy and principal risks relating to investments in a Cayman Subsidiary.
- "Other expenses" in the Fund's fee table were restated.
Availability of Additional Information
You can find additional information about the Fund such as the prospectus, financial information, fund holdings and proxy voting at the website address or contact number included at the beginning of this shareholder report.
Distributed by Foreside Financial Services, LLC.
Simplify Bitcoin Strategy PLUS Income ETF
| Nasdaq Stock Market LLC
Annual Shareholder Report | June 30, 2024
This annual shareholder report contains important information about Simplify Bitcoin Strategy PLUS Income ETF ("MAXI" or the "Fund") for the period of July 1, 2023 to June 30, 2024. You can find additional information about the Fund at www.simplify.us/resources. You can also request this information by contacting us at (855) 772-8488.
What were the Fund’s costs for the period?
(based on a hypothetical $10,000 investment)
| Fund | Costs of a $10,000 investment | Costs paid as a percentage of a $10,000 investment |
|---|
| Simplify Bitcoin Strategy PLUS Income ETF | $865 | 6.09% |
Management's Discussion of Fund Performance
For the year ended June 30, 2024, MAXI returned 84.03% vs its referenced benchmark, Nasdaq Bitcoin Reference Price Index, return of 97.47% for the same period, underperforming the benchmark by 13.44%.
The Fund underperformance was mostly due to the futures roll costs, which the option selling overlay could not offset fully due to a rather low implied volatility environment. Over this period, the futures roll cost was in the range of 10-12% annually, which is at the high end of the distribution of the recent years.
In the next 12 months, we expect the Fund to perform better if the futures roll cost, as well as implied volatility and the equity market trends, are closer to their historical long-term average.
Growth of an Assumed $10,000 Investment
| Simplify Bitcoin Strategy PLUS Income ETF - NAV | S&P 500 TR Index | Nasdaq Bitcoin Reference Price Index (USD) |
|---|
| 9/29/22 | $10,000 | $10,000 | $10,000 |
| 9/30/22 | $10,000 | $9,850 | $9,925 |
| 12/31/22 | $8,693 | $10,595 | $8,511 |
| 3/31/23 | $14,761 | $11,389 | $14,671 |
| 6/30/23 | $15,816 | $12,384 | $15,648 |
| 9/30/23 | $13,805 | $11,979 | $13,791 |
| 12/31/23 | $21,172 | $13,380 | $21,544 |
| 3/31/24 | $34,930 | $14,792 | $36,305 |
| 6/30/24 | $29,106 | $15,426 | $30,899 |
| AVERAGE ANNUAL TOTAL RETURN Fund/Index | 1 Year | Since Inception 9/29/2022 |
|---|
| Simplify Bitcoin Strategy PLUS Income ETF - NAV | 84.03% | 84.09% |
| Simplify Bitcoin Strategy PLUS Income ETF - Market | 80.92% | 83.75% |
| S&P 500 TR Index | 24.56% | 28.09% |
| Nasdaq Bitcoin Reference Price Index (USD) | 97.47% | 90.48% |
The Fund's past performance is not a good predictor of future performance. The graph and table do not reflect deduction of taxes that a shareholder would pay on Fund distributions or redemption of Fund shares.
The following table outlines key fund statistics that you should pay attention to.
| Fund net assets | $18,680,056 |
| Total number of portfolio holdings | 15 |
| Total advisory fee paid, net of waiver | $203,674 |
| Period portfolio turnover rate | 0% |
Graphical Representation of Holdings
The table below shows the types of investments that make up the Fund as of the end of the reporting period.
| Investment Categories | % of Net Assets |
| U.S. Treasury Bills | 303.2% |
| Purchased Options | 0.2% |
| Liabilities in Excess of Other Assets | (203.4)% |
| Total | 100.0% |
Availability of Additional Information
You can find additional information about the Fund such as the prospectus, financial information, fund holdings and proxy voting at the website address or contact number included at the beginning of this shareholder report.
Distributed by Foreside Financial Services, LLC.
Simplify Volatility Premium ETF
Annual Shareholder Report | June 30, 2024
This annual shareholder report contains important information about Simplify Volatility Premium ETF ("SVOL" or the "Fund") for the period of July 1, 2023 to June 30, 2024. You can find additional information about the Fund at www.simplify.us/resources. You can also request this information by contacting us at (855) 772-8488.
What were the Fund’s costs for the period?
(based on a hypothetical $10,000 investment)
| Fund | Costs of a $10,000 investment | Costs paid as a percentage of a $10,000 investment |
|---|
| Simplify Volatility Premium ETF | $70 | 0.65% |
Management's Discussion of Fund Performance
For the year ended June 30, 2024, SVOL returned 15.05% vs its referenced benchmark, S&P 500 Index, return of 24.56%, underperforming the benchmark by 9.51%.
The Fund's performance is due to CBOE Volatility Index (“VIX”) remaining low and upward sloping VIX curve (Contango) for most of the year. The steep VIX curve resulting in falling futures prices, due to roll down, has helped SVOL to deliver total return in line with its distribution yield of around 15%.
In the next 12 months, we expect SVOL to remain correlated with the S&P 500 Index.
Growth of an Assumed $10,000 Investment
| Simplify Volatility Premium ETF - NAV | S&P 500 TR Index |
|---|
| 5/12/21 | $10,000 | $10,000 |
| 6/30/21 | $10,805 | $10,599 |
| 9/30/21 | $10,704 | $10,661 |
| 12/31/21 | $11,436 | $11,836 |
| 3/31/22 | $10,641 | $11,292 |
| 6/30/22 | $10,132 | $9,474 |
| 9/30/22 | $9,918 | $9,011 |
| 12/31/22 | $10,914 | $9,693 |
| 3/31/23 | $11,333 | $10,419 |
| 6/30/23 | $12,476 | $11,330 |
| 9/30/23 | $12,706 | $10,959 |
| 12/31/23 | $13,429 | $12,241 |
| 3/31/24 | $13,912 | $13,533 |
| 6/30/24 | $14,353 | $14,113 |
| AVERAGE ANNUAL TOTAL RETURN Fund/Index | 1 Year | Since Inception 5/12/2021 |
|---|
| Simplify Volatility Premium ETF - NAV | 15.05% | 12.22% |
| Simplify Volatility Premium ETF - Market | 14.76% | 11.98% |
| S&P 500 TR Index | 24.56% | 11.62% |
The Fund's past performance is not a good predictor of future performance. The graph and table do not reflect deduction of taxes that a shareholder would pay on Fund distributions or redemption of Fund shares.
The following table outlines key fund statistics that you should pay attention to.
| Fund net assets | $1,000,016,224 |
| Total number of portfolio holdings | 13 |
| Total advisory fee paid, net of waiver | $3,098,140 |
| Period portfolio turnover rate | 97% |
Graphical Representation of Holdings
The table below shows the types of investments that make up the Fund as of the end of the reporting period.
| Investment Categories | % of Net Assets |
| U.S. Treasury Bills | 126.4% |
| Exchange-Traded Funds | 31.6% |
| Purchased Options | 0.2% |
| U.S. Government Obligations | 0.0%Footnote Reference† |
| Liabilities in Excess of Other Assets | (58.2)% |
| Total | 100.0% |
| Footnote | Description |
Footnote† | Less than 0.05% |
Availability of Additional Information
You can find additional information about the Fund such as the prospectus, financial information, fund holdings and proxy voting at the website address or contact number included at the beginning of this shareholder report.
Distributed by Foreside Financial Services, LLC.
Simplify Tara India Opportunities ETF
Annual Shareholder Report | June 30, 2024
This annual shareholder report contains important information about Simplify Tara India Opportunities ETF ("IOPP" or the "Fund") for the period of March 4, 2024 to June 30, 2024. You can find additional information about the Fund at www.simplify.us/resources. You can also request this information by contacting us at (855) 772-8488.
What were the Fund’s costs for the period?
(based on a hypothetical $10,000 investment)
| Fund | Costs of a $10,000 investment | Costs paid as a percentage of a $10,000 investment |
|---|
| Simplify Tara India Opportunities ETF | $41Footnote Reference(1) | 1.21% |
| Footnote | Description |
Footnote(1) | Based on the period March 4, 2024 (commencement of operations) through June 30, 2024. Expenses would have been higher if based on the full reporting period. |
Management's Discussion of Fund Performance
For the period March 4 2024, to June 30, 2024, IOPP returned 12.29% vs. the benchmark, MSCI India Net Total Return USD Index, return of 9.16%, outperforming the benchmark by 3.13%.
The Fund’s allocations to the Industrials, Consumer Staples, and Consumer Discretionary sectors all contributed positively to performance. Stock selection contributed meaningfully to performance, with several holdings in the Information Technology and Industrials sectors nearly doubling in price since the Fund’s inception.
Looking forward, we expect the Fund will continue to favor sectors which benefit from India’s expanding middle class and which are levered to the formalization of the economy and inclusive growth in the country. We also expect stock selection to remain an important driver of performance, utilizing the deep bench of local expertise of System Two Advisors, the Fund’s subadvisor.
Growth of an Assumed $10,000 Investment
| Simplify Tara India Opportunities ETF - NAV | MSCI INDIA Net (USD) |
|---|
| 3/4/24 | $10,000 | $10,000 |
| 3/31/24 | $9,960 | $9,905 |
| 4/30/24 | $10,312 | $10,134 |
| 5/31/24 | $10,382 | $10,206 |
| 6/30/24 | $11,229 | $10,916 |
| AVERAGE ANNUAL TOTAL RETURN Fund/Index | Since Inception 3/4/2024 |
|---|
| Simplify Tara India Opportunities ETF - NAV | 12.29% |
| Simplify Tara India Opportunities ETF - Market | 12.40% |
| MSCI INDIA Net (USD) | 9.16% |
The Fund's past performance is not a good predictor of future performance. The graph and table do not reflect deduction of taxes that a shareholder would pay on Fund distributions or redemption of Fund shares.
The following table outlines key fund statistics that you should pay attention to.
| Fund net assets | $8,421,660 |
| Total number of portfolio holdings | 27 |
| Total advisory fee paid, net of waiver | $11,156 |
| Period portfolio turnover rate | 33% |
Graphical Representation of Holdings
The table below shows the types of investments that make up the Fund as of the end of the reporting period.
| Investment Categories | % of Net Assets |
| Common Stocks | 92.9% |
| Other Assets in Excess of Liabilities | 7.1% |
| Total | 100.0% |
Availability of Additional Information
You can find additional information about the Fund such as the prospectus, financial information, fund holdings and proxy voting at the website address or contact number included at the beginning of this shareholder report.
Distributed by Foreside Financial Services, LLC.
Item 2. Code of Ethics.
| (a) | As of the end of the period covered by the report, the registrant has adopted a code of ethics that applies to the registrant’s principal executive officer, principal financial officer, principal accounting officer or controller, or persons performing similar functions, regardless of whether these individuals are employed by the registrant or a third party. |
| (c) | During the period covered by this report, there have been no amendments to the registrant’s code of ethics that apply to its principal executive officer or principal financial officer. |
| (d) | During the period covered by this report, the registrant has not granted any waivers, including an implicit waiver, from a provision of the code of ethics that applies to the registrant’s principal executive officer, principal financial officer, principal accounting officer or controller, or persons performing similar functions, regardless of whether these individuals are employed by the registrant or a third party, that relates to one or more of the items set forth in paragraph (b) of this Item. |
| (f) | (1) See Item 19 (a)(1). |
(2) Not Applicable.
(3) Not Applicable.
Item 3. Audit Committee Financial Expert.
| (a) | (1) The registrant’s board of trustees has determined that there is one audit committee financial expert serving on its audit committee. |
| (a) | (2) Christopher Caltagirone possesses the attributes identified in Item 3(b) of Form N-CSR. Mr. Caltagirone is the “audit committee financial expert” and is considered to be “independent” as each term is defined in Item 3(a)(2)(ii) of Form N-CSR. |
Item 4. Principal Accountant Fees and Services.
Audit Fees
| (a) | The aggregate fees billed for each of the last two fiscal years for professional services rendered by the principal accountant for the audit of the registrant’s annual financial statements or services that are normally provided by the accountant in connection with statutory and regulatory filings or engagements for those fiscal years are $410,650for 2023 and $515,900 for 2024. |
Audit-Related Fees
| (b) | The aggregate fees billed in each of the last two fiscal years for assurance and related services by the principal accountant that are reasonably related to the performance of the audit of the registrant’s financial statements and are not reported under paragraph (a) of this Item are $1,972.55 for 2023 and $0 for 2024. Audit-related services refer to the assurance and related services performed by the principal accountant that are reasonably related to the performance of the audit, such as, when requested, review of internally prepared dividend calculations; review of equalization calculations; review of semi-annual financial statements; and consent for required filings. |
Tax Fees
| (c) | The aggregate fees billed in each of the last two fiscal years for professional services rendered by the principal accountant for tax services in regard to the year-end audit, tax compliance, tax advice, and tax planning are $108,192.50for 2023 and $124,000 for 2024. Tax related services include review of federal and state tax returns as well excise tax distribution calculations. |
All Other Fees
| (d) | The aggregate fees billed in each of the last two fiscal years for products and services provided by the principal accountant, other than the services reported in paragraphs (a) through (c) of this Item are $0 for 2023 and $0 for 2024. |
| (e) | (1) The audit committee’s pre-approval policies and procedures described in paragraph (c)(7) of Rule 2-01 of Regulation S-X are as follows. |
| (a) | Pre-Approval Requirements. |
| (i) | Pre-Approval Requirements. Before the Auditor is engaged by a Fund to render audit or non-audit services, either: |
| (A) | The Audit Committee shall pre-approve all auditing services and permissible non-audit services (e.g., tax services) provided to a Fund. The Audit Committee may delegate to one or more of its members the authority to grant pre-approvals. The decisions of any member to whom authority is delegated under this section shall be presented to the full Audit Committee at each of its scheduled meetings; or |
| (B) | The engagement to render the audit service or permissible non-audit service is entered into pursuant to pre-approval policies and procedures established by the Audit Committee. Any such policies and procedures must (1) be detailed as to the particular service and (2) not involve any delegation of the Audit Committee’s responsibilities to the Advisers. The Audit Committee must be informed of each service entered into pursuant to the policies and procedures. A copy of any such policies and procedures shall be attached as an exhibit to the Audit Committee Charter; |
| (ii) | De Minimis Exceptions to Pre-Approval Requirements. Pre-Approval for a service provided to a Fund other than audit, review or attest services is not required if: (1) the aggregate amount of all such non-audit services provided to a Fund constitutes not more than 5 percent of the total amount of revenues paid by a Fund to the Auditor during the fiscal year in which the non-audit services are provided; (2) such services were not recognized by a Fund at the time of the engagement to be non-audit services; and (3) such services are promptly brought to the attention of the Audit Committee and are approved by the Audit Committee or by one or more members of the Audit Committee to whom authority to grant such approvals has been delegated by the Audit Committee prior to the completion of the audit; |
| (iii) | Pre-Approval of Non-Audit Services Provided to the Advisers and Certain Control Persons. The Audit Committee shall pre-approve any non-audit services proposed to be provided by the Auditor to (a) the Advisers and (b) any entity controlling, controlled by, or under common control with the Advisers that provides ongoing services to a Fund, if the Auditor’s engagement with the Advisers or any such control persons relates directly to the operations and financial reporting of a Fund. |
Application of De Minimis Exception. The De Minimis exception set forth above under Section 5(d)(ii) applies to pre-approvals under this Section (iii) as well, except that the “total amount of revenues” calculation is based on the total amount of revenues paid to the Auditor by a Fund and any other entity that has its services approved under this Section (i.e., the Advisers or any control person).
| (e) | (2) The percentage of services described in each of paragraphs (b) through (d) of this Item that were approved by the audit committee pursuant to paragraph (c)(7)(i)(C) of Rule 2-01 of Regulation S-X are as follows: |
| (g) | Aggregate non-audit fees billed by the Registrant’s accountant to: |
| | | Registrant | Investment Adviser |
| | Fiscal Year Ended June 30, 2024 | $124,000 | $0 |
| | Fiscal Year Ended June 30, 2023 | $110,165.05 | $0 |
Item 5. Audit Committee of Listed Registrants.
| (a) | The registrant has a separately designated audit committee consisting of all the independent trustees of the registrant. The members of the audit committee are Christopher Caltagirone, Craig Enders and Zung T. Nguyen. |
Item 6. Investments.
| (a) | The Registrant’s schedule of investments in unaffiliated issuers is included in the Financial Statements under Item 7 of this form. |
Item 7. Financial Statements and Financial Highlights for Open-End Management Investment Companies.
| (a) | The following is a copy of the report(s) of the Funds’ Financial Statements and Financial Highlights. |
June 30, 2024
Annual Financial Statements and
Other Important Information
Simplify Exchange Traded Funds
Simplify Aggregate Bond ETF (formerly Simplify Aggregate Bond PLUS Credit Hedge ETF) (AGGH)
Simplify Health Care ETF (PINK)
Simplify Hedged Equity ETF (HEQT)
Simplify High Yield PLUS Credit Hedge ETF (CDX)
Simplify Interest Rate Hedge ETF (PFIX)
Simplify Intermediate Term Treasury Futures Strategy ETF (TYA)
Simplify Market Neutral Equity Long/Short ETF (EQLS)
Simplify MBS ETF (MTBA)
Simplify Multi-QIS Alternative ETF (QIS)
Simplify Next Intangible Core Index ETF (NXTI)
Simplify Next Intangible Value Index ETF (NXTV)
Simplify Short Term Treasury Futures Strategy ETF (TUA)
Simplify US Equity PLUS GBTC ETF (SPBC)
Simplify US Equity PLUS QIS ETF (SPQ)
Simplify Commodities Strategy No K-1 ETF (HARD)
Simplify Macro Strategy ETF (FIG)
Simplify Managed Futures Strategy ETF (CTA)

(This page intentionally left blank)
Simplify Exchange Traded Funds
Table of Contents
This report is provided for the general information of shareholders and is not authorized for distribution to prospective investors unless preceded or accompanied by a current prospectus.
Simplify Aggregate Bond ETF
Schedule of Investments
June 30, 2024
| | | Shares | | | Value | |
| Exchange-Traded Funds – 94.4% | | | | | | | | |
| Fixed Income Funds – 94.4% | | | | | | | | |
| iShares Core U.S. Aggregate Bond ETF(a)(b) | | | 1,692,591 | | | $ | 164,299,808 | |
| Schwab US TIPS ETF | | | 605,686 | | | | 31,501,729 | |
| Total Exchange-Traded Funds (Cost $195,554,110) | | | | | | | 195,801,537 | |
| | | Principal | | | | |
| U.S. Treasury Bills – 5.0% | | | | | | | | |
| U.S. Treasury Bill, 5.39%, 7/5/2024(b)(c) | | | | | | | | |
| (Cost $10,343,929) | | $ | 10,350,000 | | | | 10,343,980 | |
| | | | | | | | | |
| U.S. Government Agency Mortgage Backed Security – 4.9% | | | | | | | | |
| Federal National Mortgage Association, 6.50%, 7/15/2054 | | | | | | | | |
| (Cost $10,200,390) | | $ | 10,000,000 | | | | 10,186,602 | |
| | | | | | | | | |
| Total Investments – 104.3% | | | | | | | | |
| (Cost $216,098,429) | | | | | | $ | 216,332,119 | |
| Liabilities in Excess of Other Assets – (4.3)% | | | | | | | (8,994,735 | ) |
| Net Assets – 100.0% | | | | | | $ | 207,337,384 | |
| | | Number of
Contracts | | | Notional Amount | | | | |
| Written Options – (0.2)% | | | | | | | | | | | |
| | | | | | | | | | | | |
| Calls – Exchange-Traded – (0.0)%† | | | | | | | | | | | |
| U.S. Treasury Bond Future, July Strike Price $127, Expires 7/26/24 | | (1,500) | | | $ | (190,500,000 | ) | | $ | (70,313 | ) |
| Puts – Exchange-Traded – (0.2)% | | | | | | | | | | | |
| U.S. Treasury Bond Future, July Strike Price $112, Expires 7/26/24 | | (3,000) | | | | (336,000,000 | ) | | | (328,125 | ) |
| | | | | | | | | | | | |
| Total Written Options (Premiums Received $529,979) | | | | | | | | | $ | (398,438 | ) |
| † | Less than 0.05% |
| (a) | A copy of the security’s annual report to shareholders may be obtained without charge at www.ishares.com. |
| (b) | Securities with an aggregate market value of $68,252,757 have been pledged as collateral for options and futures as of June 30, 2024. |
| (c) | Represents a zero coupon bond. Rate shown reflects the effective yield. |
At June 30, 2024, open futures contracts were as follows:
| | | Number of
Contracts | | | Notional
Value | | | Expiration
Date | | | Value/
Unrealized
Appreciation
(Depreciation) | |
| Long position contracts: | | | | | | | | | | | | | | |
| U.S. Treasury 10 Year Note | | 281 | | | $ | 30,905,609 | | | 9/19/24 | | | $ | 397,824 | |
| | | | | | | | | | | | | | | |
| Short position contracts: | | | | | | | | | | | | | | |
| U.S. Long Bond | | (37) | | | | (4,377,562 | ) | | 9/19/24 | | | | (98,281 | ) |
| Total net unrealized appreciation | | | | | | | | | | | | $ | 299,543 | |
See Notes to Financial Statements.
Simplify Aggregate Bond ETF
Schedule of Investments (Continued)
June 30, 2024
Summary of Investment Type††
| Investment Categories | | % of
Net Assets | |
| Exchange-Traded Funds | | | 94.4 | % |
| U.S. Treasury Bills | | | 5.0 | % |
| U.S. Government Agency Mortgage Backed Securities | | | 4.9 | % |
| Total Investments | | | 104.3 | % |
| Liabilities in Excess of Other Assets | | | (4.3 | )% |
| Net Assets | | | 100.0 | % |
| †† | The percentage shown for each investment category is the total value of investments in that category as a percentage of the net assets of the Fund. The table depicts the Fund’s investments but may not represent the Fund’s market exposure to certain derivatives, if any, which are included in Liabilities in Excess of Other Assets. |
See Notes to Financial Statements.
Simplify Health Care ETF
Schedule of Investments
June 30, 2024
| | | Shares | | | Value | |
| Common Stocks – 90.0% | | | | | | | | |
| Health Care – 82.8% | | | | | | | | |
| Abbott Laboratories | | | 8,419 | | | $ | 874,818 | |
| agilon health, Inc.* | | | 100,728 | | | | 658,761 | |
| Akero Therapeutics, Inc.* | | | 33,010 | | | | 774,415 | |
| Argenx SE, ADR* | | | 1,475 | | | | 634,309 | |
| Ascendis Pharma A/S, ADR* | | | 8,877 | | | | 1,210,645 | |
| Avantor Inc.* | | | 50,576 | | | | 1,072,211 | |
| Benitec Biopharma, Inc.* | | | 51,216 | | | | 358,000 | |
| Biogen, Inc.* | | | 1,465 | | | | 339,616 | |
| BioMarin Pharmaceutical, Inc.* | | | 5,067 | | | | 417,166 | |
| Bio-Techne Corp. | | | 4,550 | | | | 326,008 | |
| Boston Scientific Corp.* | | | 79,639 | | | | 6,132,999 | |
| Bristol-Myers Squibb Co. | | | 527 | | | | 21,886 | |
| Cigna Group (The) | | | 4,855 | | | | 1,604,917 | |
| Cooper Cos., Inc. (The) | | | 20,338 | | | | 1,775,507 | |
| Danaher Corp. | | | 1,246 | | | | 311,313 | |
| Elevance Health, Inc. | | | 5,209 | | | | 2,822,549 | |
| Eli Lilly & Co. | | | 11,412 | | | | 10,332,197 | |
| Embecta Corp. | | | 1,391 | | | | 17,388 | |
| Establishment Labs Holdings, Inc.* | | | 12,907 | | | | 586,494 | |
| Exact Sciences Corp.* | | | 17,477 | | | | 738,403 | |
| Fulcrum Therapeutics, Inc.* | | | 209,832 | | | | 1,300,958 | |
| HCA Healthcare Inc. | | | 1,407 | | | | 452,041 | |
| Henry Schein, Inc.* | | | 3,500 | | | | 224,350 | |
| Humana, Inc. | | | 5,722 | | | | 2,138,025 | |
| Insmed, Inc.* | | | 20,645 | | | | 1,383,215 | |
| Intra-Cellular Therapies, Inc.* | | | 18,445 | | | | 1,263,298 | |
| Intuitive Surgical, Inc.* | | | 15,338 | | | | 6,823,109 | |
| IQVIA Holdings, Inc.* | | | 5,743 | | | | 1,214,300 | |
| Johnson & Johnson | | | 23,520 | | | | 3,437,683 | |
| Leap Therapeutics, Inc.* | | | 631,269 | | | | 1,237,287 | |
| LivaNova PLC* | | | 8,564 | | | | 469,479 | |
| Masimo Corp.* | | | 21,670 | | | | 2,729,120 | |
| Merck & Co., Inc. | | | 51,302 | | | | 6,351,188 | |
| Natera, Inc.* | | | 12,597 | | | | 1,364,129 | |
| Neurocrine Biosciences Inc.* | | | 22,745 | | | | 3,131,304 | |
| NOVO Nordisk A/S, ADR | | | 39,427 | | | | 5,627,810 | |
| Regeneron Pharmaceuticals, Inc.* | | | 6,360 | | | | 6,684,551 | |
| Revvity Inc. | | | 25,772 | | | | 2,702,452 | |
| Royalty Pharma PLC, Class A | | | 56,188 | | | | 1,481,678 | |
| Sarepta Therapeutics Inc.* | | | 104,449 | | | | 16,502,942 | |
| Stryker Corp. | | | 1,104 | | | | 375,636 | |
| Syndax Pharmaceuticals, Inc.* | | | 25,193 | | | | 517,212 | |
| Tenet Healthcare Corp.* | | | 4,686 | | | | 623,379 | |
| Thermo Fisher Scientific, Inc. | | | 8,224 | | | | 4,547,872 | |
| Twist Bioscience Corp.* | | | 25,471 | | | | 1,255,211 | |
| Ultragenyx Pharmaceutical Inc.* | | | 30,578 | | | | 1,256,756 | |
| UnitedHealth Group, Inc. | | | 13,492 | | | | 6,870,936 | |
| Veeva Systems, Inc., Class A* | | | 1,925 | | | | 352,294 | |
See Notes to Financial Statements.
Simplify Health Care ETF
Schedule of Investments (Continued)
June 30, 2024
| | | Shares | | | Value | |
| Common Stocks (continued) | | | | | | | | |
| Health Care (continued) | | | | | | | | |
| Zimmer Biomet Holdings Inc. | | | 2,038 | | | $ | 221,184 | |
| | | | | | | | 113,549,001 | |
| Industrials – 2.6% | | | | | | | | |
| 3M Co. | | | 34,731 | | | | 3,549,161 | |
| Veralto Corp. | | | 386 | | | | 36,851 | |
| | | | | | | | 3,586,012 | |
| Materials – 4.6% | | | | | | | | |
| PureCycle Technologies, Inc.* | | | 1,058,392 | | | | 6,265,681 | |
| Total Common Stocks (Cost $115,026,691) | | | | | | | 123,400,694 | |
| | | | | | | | | |
| Money Market Funds – 5.8% | | | | | | | | |
| Fidelity Investments Money Market Treasury Only Portfolio - Class I, 5.19%(a) | | | | | | | | |
| (Cost $7,939,837) | | | 7,939,837 | | | | 7,939,837 | |
| | | | | | | | | |
| Total Investments – 95.8% | | | | | | | | |
| (Cost $122,966,528) | | | | | | $ | 131,340,531 | |
| Other Assets in Excess of Liabilities – 4.2% | | | | | | | 5,828,718 | |
| Net Assets – 100.0% | | | | | | $ | 137,169,249 | |
| * | Non Income Producing |
| (a) | Rate shown reflects the 7-day yield as of June 30, 2024. |
ADR : American Depositary Receipt
Summary of Investment Type††
| Investment Categories | | % of
Net Assets | |
| Common Stocks | | | 90.0 | % |
| Money Market Funds | | | 5.8 | % |
| Total Investments | | | 95.8 | % |
| Other Assets in Excess of Liabilities | | | 4.2 | % |
| Net Assets | | | 100.0 | % |
| †† | The percentage shown for each investment category is the total value of investments in that category as a percentage of the net assets of the Fund. The table depicts the Fund’s investments but may not represent the Fund’s market exposure to certain derivatives, if any, which are included in Other Assets in Excess of Liabilities. |
See Notes to Financial Statements.
Simplify Hedged Equity ETF
Schedule of Investments
June 30, 2024
| | | Shares | | | Value | |
| Exchange-Traded Funds – 101.3% | | | | | | | | |
| Equity Funds – 101.3% | | | | | | | | |
| iShares Core S&P 500 ETF(a)(b) | | | | | | | | |
| (Cost $158,205,152) | | | 312,190 | | | $ | 170,839,734 | |
| | | Number of
Contracts | | | Notional Amount | | | | |
| Purchased Options – 0.3% | | | | | | | | | | | |
| Puts – Exchange-Traded – 0.3% | | | | | | | | | | | |
| S&P 500 Index, July Strike Price $4,760, Expires 7/19/24(c) | | 103 | | | $ | 49,028,000 | | | | 11,845 | |
| S&P 500 Index, August Strike Price $5,045, Expires 8/16/24(c) | | 103 | | | | 51,963,500 | | | | 118,965 | |
| S&P 500 Index, September Strike Price $5,200, Expires 9/20/24(c) | | 103 | | | | 53,560,000 | | | | 427,965 | |
| | | | | | | | | | | 558,775 | |
| | | | | | | | | | | | |
| Total Purchased Options (Cost $1,514,435) | | | | | | | | | | 558,775 | |
| | | Shares | | | | |
| Money Market Funds – 0.0%† | | | | | | | | |
| Fidelity Investments Money Market Treasury Only Portfolio - Class I, 5.19%(d) | | | | | | | | |
| (Cost $38,529) | | | 38,529 | | | | 38,529 | |
| | | | | | | | | |
| Total Investments – 101.6% | | | | | | | | |
| (Cost $159,758,116) | | | | | | $ | 171,437,038 | |
| Liabilities in Excess of Other Assets – (1.6)% | | | | | | | (2,771,134 | ) |
| Net Assets – 100.0% | | | | | | $ | 168,665,904 | |
| | | Number of
Contracts | | | Notional Amount | | | | |
| Written Options – (1.6)% | | | | | | | | | | | |
| | | | | | | | | | | | |
| Calls – Exchange-Traded – (1.6)% | | | | | | | | | | | |
| S&P 500 Index, July Strike Price $5,290, Expires 7/19/24 | | (103) | | | $ | (54,487,000 | ) | | $ | (2,076,480 | ) |
| S&P 500 Index, August Strike Price $5,620, Expires 8/16/24 | | (103) | | | | (57,886,000 | ) | | | (344,535 | ) |
| S&P 500 Index, September Strike Price $5,775, Expires 9/20/24 | | (103) | | | | (59,482,500 | ) | | | (247,715 | ) |
| | | | | | | | | | | (2,668,730 | ) |
| Puts – Exchange-Traded – (0.0)%† | | | | | | | | | | | |
| S&P 500 Index, July Strike Price $4,000, Expires 7/19/24 | | (103) | | | $ | (41,200,000 | ) | | $ | (3,090 | ) |
| S&P 500 Index, August Strike Price $4,250, Expires 8/16/24 | | (103) | | | | (43,775,000 | ) | | | (21,115 | ) |
| S&P 500 Index, September Strike Price $4,380, Expires 9/20/24 | | (103) | | | | (45,114,000 | ) | | | (69,010 | ) |
| | | | | | | | | | | (93,215 | ) |
| | | | | | | | | | | | |
| Total Written Options (Premiums Received $1,519,827) | | | | | | | | | $ | (2,761,945 | ) |
| † | Less than 0.05% |
| (a) | A copy of the security’s annual report to shareholders may be obtained without charge at www.ishares.com. |
| (b) | Securities with an aggregate market value of $128,062,765 have been pledged as collateral for options as of June 30, 2024. |
| (c) | Held in connection with Written Options. |
| (d) | Rate shown reflects the 7-day yield as of June 30, 2024. |
See Notes to Financial Statements.
Simplify Hedged Equity ETF
Schedule of Investments (Continued)
June 30, 2024
Summary of Investment Type††
| Investment Categories | | % of
Net Assets | |
| Exchange-Traded Funds | | | 101.3 | % |
| Purchased Options | | | 0.3 | % |
| Money Market Funds | | | 0.0 | %† |
| Total Investments | | | 101.6 | % |
| Liabilities in Excess of Other Assets | | | (1.6 | )% |
| Net Assets | | | 100.0 | % |
| †† | The percentage shown for each investment category is the total value of investments in that category as a percentage of the net assets of the Fund. The table depicts the Fund’s investments but may not represent the Fund’s market exposure to certain derivatives, if any, which are included in Liabilities in Excess of Other Assets. |
See Notes to Financial Statements.
Simplify High Yield PLUS Credit Hedge ETF
Schedule of Investments
June 30, 2024
| | | Principal | | | Value | |
| U.S. Treasury Bills – 98.9% | | | | | | | | |
| U.S. Treasury Bill, 5.37%, 7/5/2024(a) | | $ | 25,000,000 | | | $ | 24,985,458 | |
| U.S. Treasury Bill, 5.41%, 8/13/2024(a)(b) | | | 27,500,000 | | | | 27,328,119 | |
| U.S. Treasury Bill, 5.39%, 9/19/2024(a)(b) | | | 103,300,000 | | | | 102,104,475 | |
| Total U.S. Treasury Bills (Cost $154,412,537) | | | | | | | 154,418,052 | |
| | | Number of
Contracts | | | Notional Amount | | | | |
| Purchased Options – 0.0%† | | | | | | | | | | | |
| Puts – Exchange-Traded – 0.0%† | | | | | | | | | | | |
| S&P 500 Index, July Strike Price $5,200, Expires 7/02/24(c) | | 783 | | | | 407,160,000 | | | | 9,787 | |
| S&P 500 Index, July Strike Price $5,250, Expires 7/08/24(c) | | 196 | | | | 102,900,000 | | | | 19,600 | |
| | | | | | | | | | | 29,387 | |
| | | | | | | | | | | | |
| Total Purchased Options (Cost $91,427) | | | | | | | | | | 29,387 | |
| | | | | | | | | | | | |
| Total Investments – 98.9% | | | | | | | | | | | |
| (Cost $154,503,964) | | | | | | | | | $ | 154,447,439 | |
| Other Assets in Excess of Liabilities – 1.1% | | | | | | | | | | 1,720,341 | |
| Net Assets – 100.0% | | | | | | | | | $ | 156,167,780 | |
| | | Number of
Contracts | | | Notional Amount | | | | |
| Written Options – (0.0)%† | | | | | | | | | | | |
| | | | | | | | | | | | |
| Puts – Exchange-Traded – (0.0)%† | | | | | | | | | | | |
| S&P 500 Index, July Strike Price $5,000, Expires 7/02/24 | | (783) | | | $ | (391,500,000 | ) | | $ | (5,873 | ) |
| S&P 500 Index, July Strike Price $5,000, Expires 7/08/24 | | (196) | | | | (98,000,000 | ) | | | (8,820 | ) |
| | | | | | | | | | | (14,693 | ) |
| | | | | | | | | | | | |
| Total Written Options (Premiums Received $42,692) | | | | | | | | | $ | (14,693 | ) |
| † | Less than 0.05% |
| (a) | Represents a zero coupon bond. Rate shown reflects the effective yield. |
| (b) | Securities with an aggregate market value of $51,889,723 have been pledged as collateral for options as of June 30, 2024. |
| (c) | Held in connection with Written Options. |
Summary of Investment Type††
| Investment Categories | | % of
Net Assets | |
| U.S. Treasury Bills | | | 98.9 | % |
| Purchased Options | | | 0.0 | %† |
| Total Investments | | | 98.9 | % |
| Other Assets in Excess of Liabilities | | | 1.1 | % |
| Net Assets | | | 100.0 | % |
| †† | The percentage shown for each investment category is the total value of investments in that category as a percentage of the net assets of the Fund. The table depicts the Fund’s investments but may not represent the Fund’s market exposure to certain derivatives, if any, which are included in Other Assets in Excess of Liabilities. |
See Notes to Financial Statements.
Simplify High Yield PLUS Credit Hedge ETF
Schedule of Investments (Continued)
June 30, 2024
At June 30, 2024, centrally cleared credit default swap contracts outstanding were as follows:
| Reference Entity | | Maturity
Date | | Buy/Sell
Protection | | (Pay)/
Receive
Financing
Rate(1) | | Counterparty | | | Notional
Amount(2) | | | Fair Value | | | Premium
(Paid)/
Received | | | Unrealized
Appreciation/
(Depreciation) | |
| CDX.NA.HY.42 | | 06/20/2029 | | Buy(3) | | 5.00% | | MSCS | | | | 10,000,000 | | | $ | (624,304 | ) | | $ | 691,111 | | | $ | 66,807 | |
| (1) | Payments received quarterly. |
| (2) | The maximum amount of future payments (undiscounted) that a Fund as seller of protection could be required to make or receive as a buyer of credit protection under a credit default swap agreement would be an amount equal to the notional amount of the agreement. |
| (3) | If the Fund is a buyer of protection and a credit event occurs, as defined under the terms of that particular swap agreement, the Fund will either i) receive from the seller of protection an amount equal to the notional amount of the swap and deliver the referenced obligation, other deliverable obligations or underlying securities comprising the referenced index or ii) receive a net settlement amount in the form of cash or securities equal to the notional amount of the swap less the recovery value of the referenced obligation or underlying securities comprising the referenced index. |
At June 30, 2024, over the counter total return swap contracts outstanding were as follows:
| Reference Obligation/Index | | Termination
Date(a) | | Financing
Rate Paid
(Received)
by the Fund | | Counterparty | | Notional
Amount | | | Unrealized
Appreciation/
(Depreciation)(b) | |
| iShares iBoxx $ High Yield Corporate Bond ETF | | 3/17/2025 | | 5.23% (EFFR - 0.10%)(c) | | MSCS | | | (107,349,920 | ) | | $ | (114,190 | ) |
| iShares iBoxx $ High Yield Corporate Bond ETF | | 5/15/2025 | | 5.23% (EFFR - 0.10%)(c) | | Nomura International | | | (49,823,928 | ) | | $ | (57,326 | ) |
| Morgan Stanley Custom Junk Index* | | 2/14/2025 | | 5.08% (EFFR - 0.25%)(c) | | MSCS | | | 40,219,774 | | | | (334,182 | ) |
| Morgan Stanley Custom Quality Index* | | 2/14/2025 | | 5.68% (EFFR + 0.35%)(c) | | MSCS | | | (47,463,035 | ) | | | (346,285 | ) |
| | | | | | | | | | | | | $ | (851,983 | ) |
| * | The components of the basket shown below. |
| (a) | The Fund pays/receives annual coupon payments in accordance with the swap contract. On the termination date of the swap contract(s), the Fund will either receive from or pay to the counterparty an amount equal to the net of the accrued financing fees and the value of the reference security subtracted from the original notional cost (notional multiplied by the price change of the reference security). |
| (b) | There are no upfront payments on the swap contracts, therefore the unrealized gain (loss) on the swap contracts is equal to their market value. |
| (c) | Payments made quarterly. |
Abbreviations:
| EFFR | : | Effective Federal Funds Rate |
| MSCS | : | Morgan Stanley Capital Services LLC |
| * | The following table shows the top 50 positions and related Unrealized Appreciation/(Depreciation) of the securities within the Morgan Stanley Custom Junk Index basket. |
| | | Shares | | | Unrealized
Appreciation/
(Depreciation) | | | % of basket | |
| Common Stocks | | | | | | | | | | | | |
| Communication Services | | | | | | | | | | | | |
| AT&T Inc. | | | (29,065 | ) | | $ | (4,570 | ) | | | 1.37 | % |
| Charter Communications Inc, Class A | | | (1,505 | ) | | | (3,702 | ) | | | 1.11 | % |
| Frontier Communications Parent Inc. | | | (16,240 | ) | | | (3,499 | ) | | | 1.05 | % |
| Nexstar Media Group Inc, Class A | | | (2,650 | ) | | | (3,620 | ) | | | 1.08 | % |
See Notes to Financial Statements.
Simplify High Yield PLUS Credit Hedge ETF
Schedule of Investments (Continued)
June 30, 2024
| | | Shares | | | Unrealized
Appreciation/
(Depreciation) | | | % of basket | |
| Common Stocks (continued) | | | | | | | | | | | | |
| Communication Services (continued) | | | | | | | | | | | | |
| Paramount Global, Class B | | | (41,061 | ) | | $ | (3,511 | ) | | | 1.05 | % |
| Warner Bros Discovery, Inc. | | | (58,152 | ) | | | (3,560 | ) | | | 1.06 | % |
| ZoomInfo Technologies Inc, Class A | | | (33,461 | ) | | | (3,516 | ) | | | 1.05 | % |
| | | | | | | | (25,978 | ) | | | | |
| Consumer Discretionary | | | | | | | | | | | | |
| ADT, Inc. | | | (55,928 | ) | | | (3,498 | ) | | | 1.05 | % |
| Caesars Entertainment Inc. | | | (11,332 | ) | | | (3,705 | ) | | | 1.11 | % |
| Kohl’s Corp. | | | (18,489 | ) | | | (3,498 | ) | | | 1.05 | % |
| Macy’s Inc. | | | (21,810 | ) | | | (3,446 | ) | | | 1.03 | % |
| Norwegian Cruise Line Holdings Ltd. | | | (24,485 | ) | | | (3,786 | ) | | | 1.13 | % |
| Penn Entertainment Inc. | | | (21,854 | ) | | | (3,481 | ) | | | 1.04 | % |
| Petco Health & Wellness Co Inc, Class A | | | (115,241 | ) | | | (3,584 | ) | | | 1.07 | % |
| Travel + Leisure Co. | | | (9,091 | ) | | | (3,365 | ) | | | 1.01 | % |
| Whirlpool Corp. | | | (4,367 | ) | | | (3,673 | ) | | | 1.10 | % |
| | | | | | | | (32,036 | ) | | | | |
| Consumer Staples | | | | | | | | | | | | |
| Darling Ingredients Inc. | | | (11,425 | ) | | | (3,455 | ) | | | 1.03 | % |
| | | | | | | | | | | | | |
| Consumer, Cyclical | | | | | | | | | | | | |
| Carnival Corp. | | | (26,722 | ) | | | (4,116 | ) | | | 1.23 | % |
| MGM Resorts International | | | (9,288 | ) | | | (3,397 | ) | | | 1.02 | % |
| | | | | | | | (7,513 | ) | | | | |
| Consumer, Non-cyclical | | | | | | | | | | | | |
| Viatris Inc. | | | (40,836 | ) | | | (3,572 | ) | | | 1.07 | % |
| | | | | | | | | | | | | |
| Energy | | | | | | | | | | | | |
| Apa Corp. | | | (14,658 | ) | | | (3,551 | ) | | | 1.06 | % |
| | | | | | | | | | | | | |
| Health Care | | | | | | | | | | | | |
| Alnylam Pharmaceuticals Inc. | | | (2,552 | ) | | | (5,103 | ) | | | 1.53 | % |
| Baxter International Inc. | | | (12,051 | ) | | | (3,317 | ) | | | 0.99 | % |
| CVS Health Corp. | | | (7,680 | ) | | | (3,733 | ) | | | 1.12 | % |
| DaVita Inc. | | | (2,884 | ) | | | (3,288 | ) | | | 0.99 | % |
| ICU Medical Inc. | | | (3,390 | ) | | | (3,312 | ) | | | 0.99 | % |
| Integra LifeSciences Holdings | | | (13,799 | ) | | | (3,309 | ) | | | 0.99 | % |
| Organon & Co. | | | (19,677 | ) | | | (3,352 | ) | | | 1.00 | % |
| Sotera Health Co. | | | (35,299 | ) | | | (3,448 | ) | | | 1.03 | % |
| | | | | | | | (28,862 | ) | | | | |
| Industrials | | | | | | | | | | | | |
| Air Lease Corp. | | | (8,832 | ) | | | (3,454 | ) | | | 1.03 | % |
| American Airlines Group Inc. | | | (35,819 | ) | | | (3,340 | ) | | | 1.00 | % |
| Concentrix Corp. | | | (6,857 | ) | | | (3,571 | ) | | | 1.07 | % |
| Delta Air Lines Inc. | | | (8,692 | ) | | | (3,393 | ) | | | 1.02 | % |
| Driven Brands Holdings Inc. | | | (35,130 | ) | | | (3,680 | ) | | | 1.10 | % |
| GXO Logistics Inc. | | | (8,401 | ) | | | (3,491 | ) | | | 1.05 | % |
| Hertz Global Holdings Inc. | | | (123,520 | ) | | | (3,588 | ) | | | 1.07 | % |
| Ryder System Inc. | | | (3,363 | ) | | | (3,429 | ) | | | 1.03 | % |
| Southwest Airlines Co. | | | (14,521 | ) | | | (3,419 | ) | | | 1.02 | % |
| Spirit AeroSystems Holdings Inc, Class A | | | (13,292 | ) | | | (3,595 | ) | | | 1.08 | % |
See Notes to Financial Statements.
Simplify High Yield PLUS Credit Hedge ETF
Schedule of Investments (Continued)
June 30, 2024
| | | Shares | | | Unrealized
Appreciation/
(Depreciation) | | | % of basket | |
| Common Stocks (continued) | | | | | | | | | | | | |
| Industrials (continued) | | | | | | | | | | | | |
| United Airlines Holdings Inc. | | | (8,302 | ) | | $ | (3,324 | ) | | | 0.99 | % |
| Vestis Corp. | | | (33,956 | ) | | | (3,417 | ) | | | 1.02 | % |
| | | | | | | | (41,701 | ) | | | | |
| Information Technology | | | | | | | | | | | | |
| DXC Technology Co. | | | (22,308 | ) | | | (3,504 | ) | | | 1.05 | % |
| Kyndryl Holdings, Inc. | | | (15,833 | ) | | | (3,428 | ) | | | 1.03 | % |
| Lumentum Holdings Inc. | | | (8,127 | ) | | | (3,405 | ) | | | 1.02 | % |
| NCR Voyix Corp. | | | (33,292 | ) | | | (3,384 | ) | | | 1.01 | % |
| RingCentral Inc, Class A | | | (14,238 | ) | | | (3,304 | ) | | | 0.99 | % |
| | | | | | | | (17,025 | ) | | | | |
| Materials | | | | | | | | | | | | |
| Alcoa Corp. | | | (10,718 | ) | | | (3,509 | ) | | | 1.05 | % |
| FMC Corp. | | | (7,313 | ) | | | (3,463 | ) | | | 1.03 | % |
| Mosaic Co. (The) | | | (14,743 | ) | | | (3,506 | ) | | | 1.05 | % |
| Scotts Miracle-Gro Co/The | | | (6,234 | ) | | | (3,338 | ) | | | 1.00 | % |
| | | | | | | | (13,816 | ) | | | | |
| Other Components | | | (1,184,960 | ) | | | (156,673 | ) | | | 46.88 | % |
| Total | | | | | | $ | (334,182 | ) | | | 100.00 | % |
| * | The following table shows the top 50 positions and related Unrealized Appreciation/(Depreciation) of the securities within the Morgan Stanley Custom Quality Index basket. |
| | | Shares | | | Unrealized
Appreciation/
(Depreciation) | | | % of basket | |
| Common Stocks | | | | | | | | | | | | |
| Communication Services | | | | | | | | | | | | |
| Omnicom Group Inc. | | | 5,276 | | | $ | (3,473 | ) | | | 1.00 | % |
| Sirius XM Holdings Inc. | | | 179,880 | | | | (3,735 | ) | | | 1.08 | % |
| | | | | | | | (7,208 | ) | | | | |
| Consumer Discretionary | | | | | | | | | | | | |
| AutoZone Inc. | | | 162 | | | | (3,522 | ) | | | 1.02 | % |
| Grand Canyon Education Inc. | | | 3,459 | | | | (3,551 | ) | | | 1.02 | % |
| LKQ Corp. | | | 11,656 | | | | (3,557 | ) | | | 1.03 | % |
| O’Reilly Automotive Inc. | | | 455 | | | | (3,525 | ) | | | 1.02 | % |
| | | | | | | | (14,155 | ) | | | | |
| Consumer Staples | | | | | | | | | | | | |
| Hershey Co/The | | | 2,589 | | | | (3,492 | ) | | | 1.01 | % |
| | | | | | | | | | | | | |
| Energy | | | | | | | | | | | | |
| Antero Midstream Corp. | | | 33,006 | | | | (3,570 | ) | | | 1.03 | % |
| Cheniere Energy Inc. | | | 3,057 | | | | (3,922 | ) | | | 1.14 | % |
| HF Sinclair Corp. | | | 9,043 | | | | (3,539 | ) | | | 1.02 | % |
| | | | | | | | (11,031 | ) | | | | |
| Financials | | | | | | | | | | | | |
| Cboe Global Markets Inc. | | | 2,804 | | | | (3,499 | ) | | | 1.01 | % |
| Fiserv Inc. | | | 3,170 | | | | (3,467 | ) | | | 1.00 | % |
| Intercontinental Exchange Inc. | | | 3,489 | | | | (3,504 | ) | | | 1.01 | % |
| Nasdaq Inc. | | | 8,075 | | | | (3,570 | ) | | | 1.03 | % |
See Notes to Financial Statements.
Simplify High Yield PLUS Credit Hedge ETF
Schedule of Investments (Continued)
June 30, 2024
| | | Shares | | | Unrealized
Appreciation/
(Depreciation) | | | % of basket | |
| Common Stocks (continued) | | | | | | | | | | | | |
| Financials (continued) | | | | | | | | | | | | |
| S&P Global Inc. | | | 1,095 | | | $ | (3,584 | ) | | | 1.04 | % |
| | | | | | | | (17,624 | ) | | | | |
| Health Care | | | | | | | | | | | | |
| AbbVie Inc. | | | 2,799 | | | | (3,522 | ) | | | 1.02 | % |
| Chemed Corp | | | 882 | | | | (3,511 | ) | | | 1.01 | % |
| Elevance Health Inc. | | | 891 | | | | (3,541 | ) | | | 1.02 | % |
| UnitedHealth Group Inc. | | | 969 | | | | (3,621 | ) | | | 1.05 | % |
| | | | | | | | (14,195 | ) | | | | |
| Industrial | | | | | | | | | | | | |
| IDEX Corp. | | | 2,373 | | | | (3,504 | ) | | | 1.01 | % |
| | | | | | | | | | | | | |
| Industrials | | | | | | | | | | | | |
| Allegion plc. | | | 4,082 | | | | (3,539 | ) | | | 1.02 | % |
| Booz Allen Hamilton Holding Corp | | | 3,110 | | | | (3,512 | ) | | | 1.01 | % |
| Broadridge Financial Solutions Inc. | | | 2,410 | | | | (3,484 | ) | | | 1.01 | % |
| CACI International Inc, Class A | | | 1,102 | | | | (3,477 | ) | | | 1.00 | % |
| Nordson Corp. | | | 2,046 | | | | (3,483 | ) | | | 1.01 | % |
| Rockwell Automation Inc. | | | 1,830 | | | | (3,697 | ) | | | 1.07 | % |
| SS&C Technologies Holdings Inc. | | | 7,759 | | | | (3,568 | ) | | | 1.03 | % |
| Verisk Analytics Inc, Class A | | | 1,774 | | | | (3,509 | ) | | | 1.01 | % |
| | | | | | | | (28,269 | ) | | | | |
| Information Technology | | | | | | | | | | | | |
| Accenture PLC, Class A | | | 1,660 | | | | (3,695 | ) | | | 1.07 | % |
| Adobe Inc. | | | 915 | | | | (3,730 | ) | | | 1.08 | % |
| Cisco Systems Inc. | | | 10,412 | | | | (3,630 | ) | | | 1.05 | % |
| Cognizant Technology Solutions Corp, Class A | | | 7,258 | | | | (3,621 | ) | | | 1.04 | % |
| Intuit Inc. | | | 788 | | | | (3,799 | ) | | | 1.10 | % |
| Microsoft Corp. | | | 1,058 | | | | (3,469 | ) | | | 1.00 | % |
| Motorola Solutions, Inc. | | | 1,243 | | | | (3,522 | ) | | | 1.02 | % |
| Oracle Corp. | | | 3,374 | | | | (3,496 | ) | | | 1.01 | % |
| Trimble Inc. | | | 8,555 | | | | (3,511 | ) | | | 1.01 | % |
| | | | | | | | (32,473 | ) | | | | |
| Materials | | | | | | | | | | | | |
| Element Solutions Inc. | | | 17,542 | | | | (3,491 | ) | | | 1.01 | % |
| | | | | | | | | | | | | |
| Real Estate | | | | | | | | | | | | |
| Agree Realty Corp. | | | 7,714 | | | | (3,506 | ) | | | 1.01 | % |
| Digital Realty Trust Inc. | | | 3,176 | | | | (3,543 | ) | | | 1.02 | % |
| EastGroup Properties Inc. | | | 2,846 | | | | (3,552 | ) | | | 1.03 | % |
| First Industrial Realty Trust Inc. | | | 9,984 | | | | (3,481 | ) | | | 1.01 | % |
| Gaming and Leisure Properties | | | 10,876 | | | | (3,608 | ) | | | 1.04 | % |
| STAG Industrial Inc. | | | 13,355 | | | | (3,534 | ) | | | 1.02 | % |
| | | | | | | | (21,224 | ) | | | | |
| Technology | | | | | | | | | | | | |
| Manhattan Associates, Inc. | | | 2,042 | | | | (3,697 | ) | | | 1.07 | % |
| NetApp Inc. | | | 3,753 | | | | (3,547 | ) | | | 1.02 | % |
| | | | | | | | (7,244 | ) | | | | |
See Notes to Financial Statements.
Simplify High Yield PLUS Credit Hedge ETF
Schedule of Investments (Continued)
June 30, 2024
| | | Shares | | | Unrealized
Appreciation/
(Depreciation) | | | % of basket | |
| Common Stocks (continued) | | | | | | | | | | | | |
| Utilities | | | | | | | | | | | | |
| Alliant Energy Corp. | | | 9,528 | | | $ | (3,559 | ) | | | 1.03 | % |
| Edison International | | | 6,610 | | | | (3,483 | ) | | | 1.00 | % |
| Essential Utilities Inc. | | | 12,798 | | | | (3,506 | ) | | | 1.01 | % |
| Sempra | | | 6,320 | | | | (3,527 | ) | | | 1.02 | % |
| | | | | | | | (14,075 | ) | | | | |
| Other Components | | | 309,845 | | | | (168,300 | ) | | | 48.60 | % |
| Total | | | | | | $ | (346,285 | ) | | | 100.00 | % |
See Notes to Financial Statements.
Simplify Interest Rate Hedge ETF
Schedule of Investments
June 30, 2024
| | | Principal | | | Value | |
| U.S. Treasury Bills – 52.1% | | | | | | | | |
| U.S. Treasury Bill, 5.41%, 8/13/2024(a) | | $ | 39,600,000 | | | $ | 39,352,491 | |
| U.S. Treasury Bill, 5.39%, 9/19/2024(a) | | | 36,800,000 | | | | 36,374,101 | |
| Total U.S. Treasury Bills (Cost $75,721,787) | | | | | | | 75,726,592 | |
| | | | | | | | | |
| U.S. Government Obligations – 33.2% | | | | | | | | |
| U.S. Treasury Note, 0.25%, 9/30/2025(b) | | | | | | | | |
| (Cost $48,358,825) | | $ | 51,225,000 | | | | 48,308,577 | |
| | | Notional Amount | | | | |
| Purchased Swaptions – 14.5% | | | | | | | | |
| | | | | | | | | |
| Puts – Over the Counter – 14.5% | | | | | | | | |
| Interest Rate Swaption, pay semi annually a fixed rate of 4.25% and received quarterly a floating rate of SOFR, Expires 5/11/30 (counterparty: Bank of America NA) | | | 180,000,000 | | | | 3,780,150 | |
| Interest Rate Swaption, pay semi annually a fixed rate of 4.50% and received quarterly a floating rate of SOFR, Expires 5/13/30 (counterparty: Barclays Bank PLC)(c) | | | 245,000,000 | | | | 2,966,692 | |
| Interest Rate Swaption, pay semi annually a fixed rate of 4.25% and received quarterly a floating rate of SOFR, Expires 5/11/30 (counterparty: Goldman Sachs International)(c) | | | 150,000,000 | | | | 3,101,641 | |
| Interest Rate Swaption, pay semi annually a fixed rate of 4.50% and received quarterly a floating rate of SOFR, Expires 5/13/30 (counterparty: Goldman Sachs International)(c) | | | 375,000,000 | | | | 2,707,185 | |
| Interest Rate Swaption, pay semi annually a fixed rate of 4.50% and received quarterly a floating rate of SOFR, Expires 5/13/30 (counterparty: J&P Morgan Chase & Co.) | | | 120,000,000 | | | | (258,988 | ) |
| Interest Rate Swaption, pay semi annually a fixed rate of 4.50% and received quarterly a floating rate of SOFR, Expires 5/13/30 (counterparty: Morgan Stanley Capital Services LLC)(c) | | | 745,000,000 | | | | 8,763,641 | |
| | | | | | | | 21,060,321 | |
| | | | | | | | | |
| Total Purchased Swaptions (Cost $0) | | | | | | | 21,060,321 | |
| | | | | | | | | |
| Total Investments – 99.8% | | | | | | | | |
| (Cost $124,080,612) | | | | | | $ | 145,095,490 | |
| Other Assets in Excess of Liabilities – 0.2% | | | | | | | 345,657 | |
| Net Assets – 100.0% | | | | | | $ | 145,441,147 | |
| (a) | Represents a zero coupon bond. Rate shown reflects the effective yield. |
| (b) | Securities with an aggregate market value of $5,188,751 have been pledged as collateral for purchased swaptions as of June 30, 2024. |
| (c) | U.S. Treasury Notes with a market value of $11,321,662 have been pledged as collateral by the broker for purchased swaptions as of June 30, 2024. |
See Notes to Financial Statements.
Simplify Interest Rate Hedge ETF
Schedule of Investments (Continued)
June 30, 2024
At June 30, 2024, interest rate swap contracts outstanding were as follows:
Rate Paid by
Fund | | | Rate Received
by the Fund(1) | | Payment
Frequency Paid/
received | | Counterparty | | Maturity
Date | | | Notional
Amount | | | Fair Value | | | Upfront
Premium Paid/
(Received) | | | Unrealized
Appreciation/
(depreciation) | |
| 2.11% | | | 5.34% (1 Day SOFR + 0.00%) | | Annual/Annual | | Morgan Stanley Capital Services LLC | | May 15, 2048 | | | | 10,000 | | | $ | 1,923 | | | $ | 0 | | | $ | 1,923 | |
| (1) | The Fund pays the fixed rate and receives the floating rate. |
Abbreviations:
| SOFR | : | Secured Overnight Financing Rate |
Summary of Investment Type††
| Investment Categories | | % of
Net Assets | |
| U.S. Treasury Bills | | | 52.1 | % |
| U.S. Government Obligations | | | 33.2 | % |
| Purchased Swaptions | | | 14.5 | % |
| Total Investments | | | 99.8 | % |
| Other Assets in Excess of Liabilities | | | 0.2 | % |
| Net Assets | | | 100.0 | % |
| †† | The percentage shown for each investment category is the total value of investments in that category as a percentage of the net assets of the Fund. The table depicts the Fund’s investments but may not represent the Fund’s market exposure to certain derivatives, if any, which are included in Other Assets in Excess of Liabilities. |
See Notes to Financial Statements.
Simplify Intermediate Term Treasury Futures Strategy ETF
Schedule of Investments
June 30, 2024
| | | Principal | | | Value | |
| U.S. Treasury Bills – 98.7% | | | | | | | | |
| U.S. Treasury Bill, 5.38%, 7/5/2024(a)(b) | | $ | 1,300,000 | | | $ | 1,299,244 | |
| U.S. Treasury Bill, 5.40%, 9/12/2024(a)(b) | | | 1,700,000 | | | | 1,681,993 | |
| U.S. Treasury Bill, 5.40%, 9/19/2024(a)(b) | | | 24,100,000 | | | | 23,821,083 | |
| U.S. Treasury Bill, 5.43%, 9/24/2024(a)(b) | | | 21,500,000 | | | | 21,235,685 | |
| Total U.S. Treasury Bills (Cost $48,033,287) | | | | | | | 48,038,005 | |
| | | Shares | | | | |
| Money Market Funds – 0.2% | | | | | | | | |
| Fidelity Investments Money Market Treasury Only Portfolio - Class I, 5.19%(c) | | | | | | | | |
| (Cost $105,997) | | | 105,997 | | | | 105,997 | |
| | | | | | | | | |
| Total Investments – 98.9% | | | | | | | | |
| (Cost $48,139,284) | | | | | | $ | 48,144,002 | |
| Other Assets in Excess of Liabilities – 1.1% | | | | | | | 534,094 | |
| Net Assets – 100.0% | | | | | | $ | 48,678,096 | |
| (a) | Represents a zero coupon bond. Rate shown reflects the effective yield. |
| (b) | Security, or a portion thereof, in the amount of $17,406,963 has been pledged as collateral for futures as of June 30, 2024. |
| (c) | Rate shown reflects the 7-day yield as of June 30, 2024. |
At June 30, 2024, open futures contracts were as follows:
| | | Number of
Contracts | | | Notional
Value | | | Expiration
Date | | Value/Unrealized
Appreciation
(Depreciation) | |
| Long position contracts: | | | | | | | | | | | | | |
| U.S. Treasury 10 Year Note | | 1,350 | | | $ | 148,478,906 | | | 9/19/24 | | $ | 1,326,249 | |
Summary of Investment Type††
| Investment Categories | | % of
Net Assets | |
| U.S. Treasury Bills | | | 98.7 | % |
| Money Market Funds | | | 0.2 | % |
| Total Investments | | | 98.9 | % |
| Other Assets in Excess of Liabilities | | | 1.1 | % |
| Net Assets | | | 100.0 | % |
| †† | The percentage shown for each investment category is the total value of investments in that category as a percentage of the net assets of the Fund. The table depicts the Fund’s investments but may not represent the Fund’s market exposure to certain derivatives, if any, which are included in Other Assets in Excess of Liabilities. |
See Notes to Financial Statements.
Simplify Market Neutral Equity Long/Short ETF
Schedule of Investments
June 30, 2024
| | | Principal | | | Value | |
| U.S. Treasury Bills – 98.1% | | | | | | | | |
| U.S. Treasury Bill, 5.36%, 7/5/2024(a) | | $ | 35,200,000 | | | $ | 35,179,525 | |
| U.S. Treasury Bill, 5.41%, 8/13/2024(a)(b) | | | 82,550,000 | | | | 82,034,044 | |
| U.S. Treasury Bill, 5.40%, 9/19/2024(a) | | | 36,500,000 | | | | 36,077,573 | |
| Total U.S. Treasury Bills (Cost $153,282,815) | | | | | | | 153,291,142 | |
| | | | | | | | | |
| Total Investments – 98.1% | | | | | | | | |
| (Cost $153,282,815) | | | | | | $ | 153,291,142 | |
| Other Assets in Excess of Liabilities – 1.9% | | | | | | | 2,940,045 | |
| Net Assets – 100.0% | | | | | | $ | 156,231,187 | |
| (a) | Represents a zero coupon bond. Rate shown reflects the effective yield. |
| (b) | Security, or a portion thereof, in the amount of $72,742,483 has been pledged as collateral for swaps as of June 30, 2024. |
Summary of Investment Type††
| Investment Categories | | % of
Net Assets | |
| U.S. Treasury Bills | | | 98.1 | % |
| Total Investments | | | 98.1 | % |
| Other Assets in Excess of Liabilities | | | 1.9 | % |
| Net Assets | | | 100.0 | % |
| †† | The percentage shown for each investment category is the total value of investments in that category as a percentage of the net assets of the Fund. The table depicts the Fund’s investments but may not represent the Fund’s market exposure to certain derivatives, if any, which are included in Other Assets in Excess of Liabilities. |
At June 30, 2024, over the counter total return swap contracts outstanding were as follows:
| Reference Obligation/Index | | Termination
Date(a) | | Financing
Rate Paid
(Received)
by the Fund | | Counterparty | | Notional
Amount | | | Unrealized
Appreciation/
(Depreciation)(b) | |
| BNP Custom Global Long Equity Index* | | 8/5/2024 | | 5.03% (EFFR+0.47)(c) | | BNP Paribas | | | 155,494,170 | | | $ | 124,365 | |
| BNP Custom Global Short Equity Index* | | 8/5/2024 | | 5.33% (EFFR+0.19)(c) | | BNP Paribas | | | (155,042,244 | ) | | | 497,684 | |
| Goldman Sachs Custom Global Long Equity Index* | | 6/30/2025 | | 4.86% (EFFR+0.30)(c) | | GS | | | 155,580,105 | | | | 104,635 | |
| Goldman Sachs Custom Global Short Equity Index* | | 6/30/2025 | | 5.14% (EFFR+0.0)(c) | | GS | | | (154,956,388 | ) | | | 451,665 | |
| | | | | | | | | | | | | $ | 1,178,349 | |
| * | The components of the basket shown below. |
| (a) | The Fund pays/receives annual coupon payments in accordance with the swap contract. On the termination date of the swap contract(s), the Fund will either receive from or pay to the counterparty an amount equal to the net of the accrued financing fees and the value of the reference security subtracted from the original notional cost (notional multiplied by the price change of the reference security). |
| (b) | There are no upfront payments on the swap contracts, therefore the unrealized gain (loss) on the swap contracts is equal to their market value. |
| (c) | Payments made quarterly. |
Abbreviations:
| BNP | : | BNP Paribas |
| EFFR | : | Effective Federal Funds Rate |
| GS | : | Goldman Sachs |
See Notes to Financial Statements.
Simplify Market Neutral Equity Long/Short ETF
Schedule of Investments (Continued)
June 30, 2024
| * | The following table shows the top 50 positions and related Unrealized Appreciation/(Depreciation) of the securities within the BNP Custom Global Long Equity Index basket. |
| | | Shares | | | Unrealized
Appreciation/
(Depreciation) | | | % of basket | |
| Common Stocks | | | | | | | | | | | | |
| Basic Materials | | | | | | | | | | | | |
| Novonesis (Novozymes) B, Class B | | | 16,943 | | | $ | 829 | | | | 0.67 | % |
| Rio Tinto Ltd. | | | 14,191 | | | | 902 | | | | 0.73 | % |
| Rio Tinto PLC | | | 22,563 | | | | 1,185 | | | | 0.95 | % |
| | | | | | | | 2,916 | | | | | |
| Communications | | | | | | | | | | | | |
| Juniper Networks, Inc. | | | 40,583 | | | | 1,182 | | | | 0.95 | % |
| KDDI Corp. | | | 59,107 | | | | 1,250 | | | | 1.00 | % |
| Nippon Telegraph & Telephone Corp. | | | 1,650,496 | | | | 1,245 | | | | 1.00 | % |
| Singapore Telecommunications Ltd. | | | 660,454 | | | | 1,071 | | | | 0.86 | % |
| VeriSign Inc. | | | 8,709 | | | | 1,237 | | | | 1.00 | % |
| | | | | | | | 5,985 | | | | | |
| Consumer, Cyclical | | | | | | | | | | | | |
| Dollarama Inc. | | | 16,942 | | | | 1,236 | | | | 0.99 | % |
| Evolution AB, 144A | | | 10,659 | | | | 888 | | | | 0.71 | % |
| Hermes International SCA | | | 663 | | | | 1,215 | | | | 0.98 | % |
| Industria de Diseno Textil SA | | | 21,764 | | | | 864 | | | | 0.70 | % |
| Next PLC | | | 9,050 | | | | 826 | | | | 0.66 | % |
| Volvo AB, Class B | | | 42,007 | | | | 859 | | | | 0.69 | % |
| | | | | | | | 5,888 | | | | | |
| Consumer, Non-cyclical | | | | | | | | | | | | |
| Adyen NV, 144A | | | 1,277 | | | | 1,217 | | | | 0.98 | % |
| Cigna Group/The | | | 3,143 | | | | 830 | | | | 0.67 | % |
| Dexcom Inc. | | | 13,605 | | | | 1,233 | | | | 0.99 | % |
| MarketAxess Holdings Inc. | | | 6,641 | | | | 1,064 | | | | 0.85 | % |
| Neurocrine Biosciences Inc. | | | 11,531 | | | | 1,269 | | | | 1.02 | % |
| PayPal Holdings Inc. | | | 18,535 | | | | 859 | | | | 0.69 | % |
| | | | | | | | 6,472 | | | | | |
| Energy | | | | | | | | | | | | |
| Ovintiv Inc. | | | 24,944 | | | | 934 | | | | 0.75 | % |
| | | | | | | | | | | | | |
| Financial | | | | | | | | | | | | |
| Allstate Corp. (The) | | | 9,741 | | | | 1,243 | | | | 1.00 | % |
| Ally Financial Inc. | | | 38,172 | | | | 1,210 | | | | 0.97 | % |
| Coinbase Global Inc, Class A | | | 6,988 | | | | 1,241 | | | | 1.00 | % |
| Corebridge Financial Inc. | | | 53,491 | | | | 1,245 | | | | 1.00 | % |
| Discover Financial Services | | | 12,594 | | | | 1,316 | | | | 1.06 | % |
| Equity LifeStyle Properties, Inc. | | | 17,870 | | | | 930 | | | | 0.75 | % |
| KKR & Co Inc, Class Miscellaneous | | | 14,687 | | | | 1,235 | | | | 0.99 | % |
| Mastercard, Inc., Class A | | | 3,338 | | | | 1,177 | | | | 0.95 | % |
| Progressive Corp/The | | | 7,388 | | | | 1,226 | | | | 0.99 | % |
| QBE Insurance Group Ltd. | | | 99,195 | | | | 921 | | | | 0.74 | % |
| Skandinaviska Enskilda Banken AB, Class A | | | 76,815 | | | | 907 | | | | 0.73 | % |
| State Street Corp. | | | 21,314 | | | | 1,260 | | | | 1.01 | % |
| Svenska Handelsbanken AB, Class A | | | 137,872 | | | | 1,050 | | | | 0.84 | % |
See Notes to Financial Statements.
Simplify Market Neutral Equity Long/Short ETF
Schedule of Investments (Continued)
June 30, 2024
| | | Shares | | | Unrealized
Appreciation/
(Depreciation) | | | % of basket | |
| Common Stocks (continued) | | | | | | | | | | | | |
| Financial (continued) | | | | | | | | | | | | |
| Swedbank AB, Class A | | | 60,302 | | | $ | 993 | | | | 0.80 | % |
| | | | | | | | 15,954 | | | | | |
| Industrial | | | | | | | | | | | | |
| AECOM | | | 17,430 | | | | 1,228 | | | | 0.99 | % |
| Atlas Copco AB | | | 82,623 | | | | 1,242 | | | | 1.00 | % |
| Canadian National Railway Co. | | | 10,663 | | | | 1,006 | | | | 0.81 | % |
| Carlisle Cos Inc. | | | 2,895 | | | | 937 | | | | 0.75 | % |
| IDEX Corp. | | | 7,796 | | | | 1,253 | | | | 1.01 | % |
| Masco Corp. | | | 18,649 | | | | 994 | | | | 0.80 | % |
| TFI International Inc. | | | 7,181 | | | | 833 | | | | 0.67 | % |
| Union Pacific Corp. | | | 5,161 | | | | 933 | | | | 0.75 | % |
| | | | | | | | 8,426 | | | | | |
| Technology | | | | | | | | | | | | |
| BE Semiconductor Industries NV | | | 6,190 | | | | 828 | | | | 0.67 | % |
| Lam Research Corp. | | | 1,058 | | | | 900 | | | | 0.72 | % |
| Manhattan Associates, Inc. | | | 6,213 | | | | 1,225 | | | | 0.98 | % |
| MSCI Inc, Class A | | | 3,184 | | | | 1,226 | | | | 0.99 | % |
| NetApp Inc. | | | 9,138 | | | | 940 | | | | 0.76 | % |
| NVIDIA Corp. | | | 12,506 | | | | 1,234 | | | | 0.99 | % |
| QUALCOMM Inc. | | | 7,303 | | | | 1,162 | | | | 0.93 | % |
| | | | | | | | 7,515 | | | | | |
| Other Components | | | 15,939 | | | | 70,275 | | | | 56.51 | % |
| Total | | | | | | $ | 124,365 | | | | 100.00 | % |
* The following table shows the top 50 positions and related Unrealized Appreciation/(Depreciation) of the securities within the BNP Custom Global Short Equity Index basket.
| | | Shares | | | Unrealized
Appreciation/
(Depreciation) | | | % of basket | |
| Common Stocks | | | | | | | | | | | | |
| Basic Materials | | | | | | | | | | | | |
| Arcelormittal SA | | | (64,312 | ) | | $ | 4,743 | | | | 0.96 | % |
| Cameco Corp. | | | (27,399 | ) | | | 4,340 | | | | 0.87 | % |
| Westlake Corp. | | | (8,320 | ) | | | 3,880 | | | | 0.78 | % |
| | | | | | | | 12,963 | | | | | |
| Communications | | | | | | | | | | | | |
| BT Group PLC, Class A | | | (718,749 | ) | | | 4,106 | | | | 0.83 | % |
| Informa PLC | | | (120,581 | ) | | | 4,200 | | | | 0.84 | % |
| Liberty Media Corp-Liberty Formula One, Class C | | | (21,364 | ) | | | 4,943 | | | | 0.99 | % |
| T-Mobile US, Inc. | | | (8,762 | ) | | | 4,971 | | | | 1.00 | % |
| Zillow Group Inc, Class C | | | (23,866 | ) | | | 3,565 | | | | 0.72 | % |
| | | | | | | | 21,785 | | | | | |
| Consumer, Cyclical | | | | | | | | | | | | |
| Carnival Corp. | | | (83,811 | ) | | | 5,052 | | | | 1.01 | % |
| Cie Generale des Etablissement | | | (39,813 | ) | | | 4,962 | | | | 1.00 | % |
| Live Nation Entertainment, Inc. | | | (17,122 | ) | | | 5,169 | | | | 1.04 | % |
| MGM Resorts International | | | (28,274 | ) | | | 4,046 | | | | 0.81 | % |
| Nitori Holdings Co Ltd. | | | (12,514 | ) | | | 4,258 | | | | 0.86 | % |
See Notes to Financial Statements.
Simplify Market Neutral Equity Long/Short ETF
Schedule of Investments (Continued)
June 30, 2024
| | | Shares | | | Unrealized
Appreciation/
(Depreciation) | | | % of basket | |
| Common Stocks (continued) | | | | | | | | | | | | |
| Consumer, Cyclical (continued) | | | | | | | | | | | | |
| Walgreens Boots Alliance, Inc. | | | (124,641 | ) | | $ | 4,855 | | | | 0.98 | % |
| | | | | | | | 28,342 | | | | | |
| Consumer, Non-cyclical | | | | | | | | | | | | |
| Alcon Inc. | | | (15,125 | ) | | | 4,348 | | | | 0.87 | % |
| Anheuser-Busch InBev SA/NV | | | (24,489 | ) | | | 4,574 | | | | 0.92 | % |
| Asahi Group Holdings Ltd. | | | (38,976 | ) | | | 4,430 | | | | 0.89 | % |
| Charles River Laboratories International Inc. | | | (6,009 | ) | | | 3,997 | | | | 0.80 | % |
| Constellation Brands Inc, Class A | | | (6,039 | ) | | | 5,003 | | | | 1.01 | % |
| Danaher Corp. | | | (6,151 | ) | | | 4,949 | | | | 0.99 | % |
| Exact Sciences Corp. | | | (28,725 | ) | | | 3,908 | | | | 0.78 | % |
| Haleon PLC | | | (372,520 | ) | | | 4,891 | | | | 0.98 | % |
| Heineken NV | | | (15,750 | ) | | | 4,909 | | | | 0.99 | % |
| Mondelez International Inc, Class A | | | (22,667 | ) | | | 4,777 | | | | 0.96 | % |
| Otsuka Holdings Co Ltd. | | | (27,316 | ) | | | 3,703 | | | | 0.74 | % |
| Quest Diagnostics, Inc. | | | (11,174 | ) | | | 4,925 | | | | 0.99 | % |
| Tesco PLC | | | (398,672 | ) | | | 4,965 | | | | 1.00 | % |
| Viatris, Inc. | | | (139,070 | ) | | | 4,761 | | | | 0.96 | % |
| Zimmer Biomet Holdings Inc. | | | (14,329 | ) | | | 5,008 | | | | 1.01 | % |
| | | | | | | | 69,148 | | | | | |
| Energy | | | | | | | | | | | | |
| Kinder Morgan Inc. | | | (72,778 | ) | | | 4,657 | | | | 0.93 | % |
| TotalEnergies SE | | | (23,270 | ) | | | 5,006 | | | | 1.01 | % |
| | | | | | | | 9,663 | | | | | |
| Financial | | | | | | | | | | | | |
| HSBC Holdings PLC | | | (137,224 | ) | | | 3,820 | | | | 0.77 | % |
| Mitsubishi UFJ Financial Group | | | (103,714 | ) | | | 3,591 | | | | 0.72 | % |
| | | | | | | | 7,411 | | | | | |
| Industrial | | | | | | | | | | | | |
| Amcor PLC | | | (157,768 | ) | | | 4,969 | | | | 1.00 | % |
| Carrier Global Corp. | | | (24,468 | ) | | | 4,970 | | | | 1.00 | % |
| Ingersoll Rand Inc. | | | (17,013 | ) | | | 4,977 | | | | 1.00 | % |
| Jacobs Solutions Inc. | | | (9,587 | ) | | | 4,313 | | | | 0.87 | % |
| Johnson Controls International | | | (23,273 | ) | | | 4,982 | | | | 1.00 | % |
| Republic Services Inc, Class A | | | (7,357 | ) | | | 4,604 | | | | 0.92 | % |
| Siemens Energy AG | | | (43,880 | ) | | | 3,682 | | | | 0.74 | % |
| | | | | | | | 32,497 | | | | | |
| Technology | | | | | | | | | | | | |
| Analog Devices Inc. | | | (6,825 | ) | | | 5,017 | | | | 1.01 | % |
| Ceridian Hcm Holding, Inc. | | | (31,155 | ) | | | 4,976 | | | | 1.00 | % |
| International Business Machine Corp. | | | (8,330 | ) | | | 4,640 | | | | 0.93 | % |
| Take-Two Interactive Software,Inc. | | | (9,825 | ) | | | 4,919 | | | | 0.99 | % |
| Texas Instruments, Inc. | | | (5,739 | ) | | | 3,595 | | | | 0.72 | % |
| | | | | | | | 23,147 | | | | | |
| Utilities | | | | | | | | | | | | |
| Consolidated Edison, Inc. | | | (17,292 | ) | | | 4,979 | | | | 1.00 | % |
| Duke Energy Corp. | | | (15,392 | ) | | | 4,968 | | | | 1.00 | % |
| Essential Utilities Inc. | | | (35,800 | ) | | | 4,304 | | | | 0.86 | % |
| Fortis, Inc./Canada | | | (35,785 | ) | | | 4,477 | | | | 0.90 | % |
See Notes to Financial Statements.
Simplify Market Neutral Equity Long/Short ETF
Schedule of Investments (Continued)
June 30, 2024
| | | Shares | | | Unrealized
Appreciation/
(Depreciation) | | | % of basket | |
| Common Stocks (continued) | | | | | | | | | | | | |
| Utilities (continued) | | | | | | | | | | | | |
| RWE AG | | | (42,498 | ) | | $ | 4,686 | | | | 0.94 | % |
| | | | | | | | 23,414 | | | | | |
| Other Components | | | (26,249 | ) | | | 269,314 | | | | 54.11 | % |
| Total | | | | | | $ | 497,684 | | | | 100.00 | % |
| * | The following table shows the top 50 positions and related Unrealized Appreciation/(Depreciation) of the securities within the Goldman Sachs Custom Global Long Equity Index basket. |
| | | Shares | | | Unrealized
Appreciation/
(Depreciation) | | | % of basket | |
| Common Stocks | | | | | | | | | | | | |
| Basic Materials | | | | | | | | | | | | |
| Arcelormittal SA | | | (64,590 | ) | | $ | 1,002 | | | | 0.96 | % |
| Cameco Corp. | | | (27,924 | ) | | | 930 | | | | 0.89 | % |
| Westlake Corp. | | | (8,319 | ) | | | 816 | | | | 0.78 | % |
| | | | | | | | 2,748 | | | | | |
| Communications | | | | | | | | | | | | |
| BT Group PLC, Class A | | | (728,309 | ) | | | 875 | | | | 0.84 | % |
| Informa PLC | | | (119,936 | ) | | | 879 | | | | 0.84 | % |
| Liberty Media Corp-Liberty Formula One, Class C | | | (21,562 | ) | | | 1,049 | | | | 1.00 | % |
| T-Mobile US, Inc. | | | (8,817 | ) | | | 1,052 | | | | 1.01 | % |
| Zillow Group Inc, Class C | | | (24,051 | ) | | | 756 | | | | 0.72 | % |
| | | | | | | | 4,611 | | | | | |
| Consumer, Cyclical | | | | | | | | | | | | |
| Carnival Corp. | | | (84,644 | ) | | | 1,074 | | | | 1.03 | % |
| Cie Generale des Etablissement | | | (39,679 | ) | | | 1,040 | | | | 0.99 | % |
| Live Nation Entertainment, Inc. | | | (17,209 | ) | | | 1,094 | | | | 1.04 | % |
| MGM Resorts International. | | | (28,810 | ) | | | 867 | | | | 0.83 | % |
| Nitori Holdings Co Ltd. | | | (12,394 | ) | | | 887 | | | | 0.85 | % |
| Walgreens Boots Alliance, Inc. | | | (94,933 | ) | | | 778 | | | | 0.74 | % |
| | | | | | | | 5,740 | | | | | |
| Consumer, Non-cyclical | | | | | | | | | | | | |
| Alcon Inc. | | | (15,229 | ) | | | 921 | | | | 0.88 | % |
| Anheuser-Busch InBev SA/NV | | | (24,562 | ) | | | 965 | | | | 0.92 | % |
| Asahi Group Holdings Ltd. | | | (38,473 | ) | | | 920 | | | | 0.88 | % |
| Charles River Laboratories International Inc. | | | (6,032 | ) | | | 844 | | | | 0.81 | % |
| Constellation Brands Inc, Class A | | | (5,946 | ) | | | 1,036 | | | | 0.99 | % |
| Danaher Corp. | | | (6,130 | ) | | | 1,037 | | | | 0.99 | % |
| Exact Sciences Corp. | | | (29,249 | ) | | | 837 | | | | 0.80 | % |
| Haleon PLC | | | (370,792 | ) | | | 1,024 | | | | 0.98 | % |
| Heineken NV | | | (15,588 | ) | | | 1,022 | | | | 0.98 | % |
| Mondelez International Inc, Class A | | | (22,738 | ) | | | 1,008 | | | | 0.96 | % |
| Otsuka Holdings Co Ltd. | | | (26,966 | ) | | | 769 | | | | 0.73 | % |
| Quest Diagnostics, Inc. | | | (11,144 | ) | | | 1,033 | | | | 0.99 | % |
| Tesco PLC | | | (398,986 | ) | | | 1,045 | | | | 1.00 | % |
| Viatris, Inc. | | | (140,507 | ) | | | 1,012 | | | | 0.97 | % |
| Zimmer Biomet Holdings Inc. | | | (14,377 | ) | | | 1,057 | | | | 1.01 | % |
| | | | | | | | 14,530 | | | | | |
See Notes to Financial Statements.
Simplify Market Neutral Equity Long/Short ETF
Schedule of Investments (Continued)
June 30, 2024
| | | Shares | | | Unrealized
Appreciation/
(Depreciation) | | | % of basket | |
| Common Stocks (continued) | | | | | | | | | | | | |
| Energy | | | | | | | | | | | | |
| Kinder Morgan Inc. | | | (72,916 | ) | | $ | 981 | | | | 0.94 | % |
| TotalEnergies SE | | | (23,433 | ) | | | 1,060 | | | | 1.01 | % |
| | | | | | | | 2,041 | | | | | |
| Financial | | | | | | | | | | | | |
| HSBC Holdings PLC | | | (138,752 | ) | | | 812 | | | | 0.77 | % |
| Mitsubishi UFJ Financial Group | | | (104,907 | ) | | | 764 | | | | 0.73 | % |
| | | | | | | | 1,576 | | | | | |
| Industrial | | | | | | | | | | | | |
| Amcor PLC | | | (157,925 | ) | | | 1,046 | | | | 1.00 | % |
| Carrier Global Corp | | | (24,679 | ) | | | 1,054 | | | | 1.01 | % |
| Ingersoll Rand Inc. | | | (17,209 | ) | | | 1,059 | | | | 1.01 | % |
| Jacobs Solutions Inc. | | | (9,619 | ) | | | 910 | | | | 0.87 | % |
| Johnson Controls International | | | (23,575 | ) | | | 1,062 | | | | 1.02 | % |
| Republic Services Inc, Class A | | | (7,406 | ) | | | 975 | | | | 0.93 | % |
| Siemens Energy AG | | | (44,162 | ) | | | 779 | | | | 0.74 | % |
| | | | | | | | 6,885 | | | | | |
| Technology | | | | | | | | | | | | |
| Analog Devices Inc. | | | (6,814 | ) | | | 1,053 | | | | 1.01 | % |
| Ceridian Hcm Holding, Inc. | | | (31,145 | ) | | | 1,046 | | | | 1.00 | % |
| International Business Machine Corp. | | | (8,319 | ) | | | 974 | | | | 0.93 | % |
| Take-Two Interactive Software,Inc. | | | (9,831 | ) | | | 1,035 | | | | 0.99 | % |
| Texas Instruments, Inc. | | | (5,761 | ) | | | 759 | | | | 0.72 | % |
| | | | | | | | 4,867 | | | | | |
| Utilities | | | | | | | | | | | | |
| Consolidated Edison, Inc. | | | (17,327 | ) | | | 1,049 | | | | 1.00 | % |
| Duke Energy Corp. | | | (15,521 | ) | | | 1,054 | | | | 1.01 | % |
| Essential Utilities Inc. | | | (35,927 | ) | | | 908 | | | | 0.87 | % |
| Fortis, Inc./Canada | | | (36,176 | ) | | | 952 | | | | 0.91 | % |
| RWE AG | | | (41,927 | ) | | | 972 | | | | 0.93 | % |
| | | | | | | | 4,935 | | | | | |
| Other Components | | | (26,625 | ) | | | 56,702 | | | | 54.19 | % |
| Total | | | | | | $ | 104,635 | | | | 100.00 | % |
| * | The following table shows the top 50 positions and related Unrealized Appreciation/(Depreciation) of the securities within the Goldman Sachs Custom Global Short Equity Index basket. |
| | | Shares | | | Unrealized
Appreciation/
(Depreciation) | | | % of basket | |
| Common Stocks | | | | | | | | | | | | |
| Basic Materials | | | | | | | | | | | | |
| Novonesis (Novozymes) B, Class B | | | 16,989 | | | $ | 3,018 | | | | 0.67 | % |
| Rio Tinto Ltd. | | | 14,283 | | | | 3,293 | | | | 0.73 | % |
| Rio Tinto PLC | | | 22,214 | | | | 4,236 | | | | 0.94 | % |
| | | | | | | | 10,547 | | | | | |
| Communications | | | | | | | | | | | | |
| Juniper Networks, Inc. | | | 40,809 | | | | 4,316 | | | | 0.96 | % |
| KDDI Corp. | | | 59,072 | | | | 4,533 | | | | 1.00 | % |
| Nippon Telegraph & Telephone C | | | 1,643,684 | | | | 4,501 | | | | 1.00 | % |
See Notes to Financial Statements.
Simplify Market Neutral Equity Long/Short ETF
Schedule of Investments (Continued)
June 30, 2024
| | | Shares | | | Unrealized
Appreciation/
(Depreciation) | | | % of basket | |
| Common Stocks (continued) | | | | | | | | | | | | |
| Communications (continued) | | | | | | | | | | | | |
| Singapore Telecommunications Ltd. | | | 673,779 | | | $ | 3,966 | | | | 0.88 | % |
| VeriSign Inc. | | | 8,677 | | | | 4,475 | | | | 0.99 | % |
| | | | | | | | 21,791 | | | | | |
| Consumer, Cyclical | | | | | | | | | | | | |
| Dollarama Inc. | | | 17,302 | | | | 4,580 | | | | 1.01 | % |
| Evolution AB, 144A | | | 10,701 | | | | 3,236 | | | | 0.72 | % |
| Hermes International SCA | | | 661 | | | | 4,395 | | | | 0.97 | % |
| Industria de Diseno Textil SA | | | 21,759 | | | | 3,136 | | | | 0.70 | % |
| Next PLC | | | 9,041 | | | | 2,995 | | | | 0.66 | % |
| Volvo AB, Class B | | | 41,687 | | | | 3,096 | | | | 0.69 | % |
| | | | | | | | 21,438 | | | | | |
| Consumer, Non-cyclical | | | | | | | | | | | | |
| Adyen NV, 144A | | | 1,284 | | | | 4,445 | | | | 0.98 | % |
| Cigna Group/The | | | 3,109 | | | | 2,981 | | | | 0.66 | % |
| Dexcom Inc. | | | 13,695 | | | | 4,504 | | | | 1.00 | % |
| MarketAxess Holdings Inc. | | | 6,735 | | | | 3,917 | | | | 0.87 | % |
| Neurocrine Biosciences Inc. | | | 11,442 | | | | 4,569 | | | | 1.01 | % |
| PayPal Holdings Inc. | | | 18,525 | | | | 3,118 | | | | 0.69 | % |
| | | | | | | | 23,534 | | | | | |
| Energy | | | | | | | | | | | | |
| Ovintiv Inc. | | | 25,168 | | | | 3,422 | | | | 0.76 | % |
| | | | | | | | | | | | | |
| Financial | | | | | | | | | | | | |
| Allstate Corp. (The) | | | 9,815 | | | | 4,545 | | | | 1.01 | % |
| Ally Financial Inc. | | | 37,891 | | | | 4,360 | | | | 0.96 | % |
| Coinbase Global Inc, Class A | | | 7,245 | | | | 4,669 | | | | 1.03 | % |
| Corebridge Financial Inc. | | | 53,369 | | | | 4,508 | | | | 1.00 | % |
| Discover Financial Services | | | 12,401 | | | | 4,704 | | | | 1.04 | % |
| Equity LifeStyle Properties, Inc. | | | 17,986 | | | | 3,398 | | | | 0.75 | % |
| KKR & Co Inc, Class Miscellaneous | | | 14,689 | | | | 4,484 | | | | 0.99 | % |
| Mastercard, Inc., Class A | | | 3,279 | | | | 4,196 | | | | 0.93 | % |
| Progressive Corp/The | | | 7,465 | | | | 4,498 | | | | 1.00 | % |
| QBE Insurance Group Ltd. | | | 97,625 | | | | 3,289 | | | | 0.73 | % |
| Skandinaviska Enskilda Banken AB, Class A | | | 77,480 | | | | 3,322 | | | | 0.74 | % |
| State Street Corp. | | | 21,330 | | | | 4,578 | | | | 1.01 | % |
| Svenska Handelsbanken AB, Class A | | | 137,369 | | | | 3,799 | | | | 0.84 | % |
| Swedbank AB, Class A | | | 60,502 | | | | 3,615 | | | | 0.80 | % |
| | | | | | | | 57,965 | | | | | |
| Industrial | | | | | | | | | | | | |
| AECOM | | | 17,469 | | | | 4,466 | | | | 0.99 | % |
| Atlas Copco AB | | | 82,256 | | | | 4,489 | | | | 0.99 | % |
| Canadian National Railway Co. | | | 10,664 | | | | 3,654 | | | | 0.81 | % |
| Carlisle Cos Inc. | | | 2,891 | | | | 3,398 | | | | 0.75 | % |
| IDEX Corp. | | | 7,804 | | | | 4,554 | | | | 1.01 | % |
| Masco Corp. | | | 18,606 | | | | 3,598 | | | | 0.80 | % |
| TFI International Inc. | | | 7,243 | | | | 3,049 | | | | 0.67 | % |
| Union Pacific Corp. | | | 5,166 | | | | 3,390 | | | | 0.75 | % |
| | | | | | | | 30,598 | | | | | |
See Notes to Financial Statements.
Simplify Market Neutral Equity Long/Short ETF
Schedule of Investments (Continued)
June 30, 2024
| | | Shares | | | Unrealized
Appreciation/
(Depreciation) | | | % of basket | |
| Common Stocks (continued) | | | | | | | | | | | | |
| Technology | | | | | | | | | | | | |
| BE Semiconductor Industries NV | | | 6,268 | | | $ | 3,043 | | | | 0.67 | % |
| Lam Research Corp. | | | 1,060 | | | | 3,272 | | | | 0.72 | % |
| Manhattan Associates, Inc. | | | 6,427 | | | | 4,598 | | | | 1.02 | % |
| MSCI Inc, Class A | | | 3,193 | | | | 4,461 | | | | 0.99 | % |
| NetApp Inc. | | | 9,178 | | | | 3,429 | | | | 0.76 | % |
| NVIDIA Corp. | | | 12,289 | | | | 4,404 | | | | 0.97 | % |
| QUALCOMM Inc. | | | 7,236 | | | | 4,180 | | | | 0.93 | % |
| | | | | | | | 27,387 | | | | | |
| Other Components | | | 15,844 | | | | 254,983 | | | | 56.45 | % |
| Total | | | | | | $ | 451,665 | | | | 100.00 | % |
See Notes to Financial Statements.
Simplify MBS ETF
Schedule of Investments
June 30, 2024
| | | Principal | | | Value | |
| U.S. Treasury Bills – 99.7% | | | | | | | | |
| U.S. Treasury Bill, 5.37%, 7/5/2024(a) | | $ | 444,500,000 | | | $ | 444,241,448 | |
| U.S. Treasury Bill, 5.41%, 7/30/2024(a)(b) | | | 305,200,000 | | | | 303,910,487 | |
| Total U.S. Treasury Bills (Cost $748,137,649) | | | | | | | 748,151,935 | |
| | | | | | | | | |
| U.S. Government Agency Mortgage Backed Securities – 98.3% | | | | | | | | |
| Federal National Mortgage Association, 5.00%, 7/15/2054(TBA) | | | 186,250,000 | | | | 180,341,822 | |
| Federal National Mortgage Association, 5.50%, 7/15/2054(TBA) | | | 236,250,000 | | | | 233,317,150 | |
| Federal National Mortgage Association, 6.00%, 7/15/2054(TBA) | | | 322,500,000 | | | | 323,764,548 | |
| Total U.S. Government Agency Mortgage Backed Securities (Cost $735,351,613) | | | | | | | 737,423,520 | |
| | | | | | | | | |
| Total Investments – 198.0% | | | | | | | | |
| (Cost $1,483,489,262) | | | | | | $ | 1,485,575,455 | |
| Liabilities in Excess of Other Assets – (98.0)% | | | | | | | (735,268,518 | ) |
| Net Assets – 100.0% | | | | | | $ | 750,306,937 | |
| (a) | Represents a zero coupon bond. Rate shown reflects the effective yield. |
| (b) | Security, or a portion thereof, in the amount of $11,949,298 has been pledged as collateral for TBAs as of June 30, 2024. |
Portfolio Abbreviations:
Summary of Investment Type††
| Investment Categories | | % of
Net Assets | |
| U.S. Treasury Bills | | | 99.7 | % |
| U.S. Government Agency Mortgage Backed Securities | | | 98.3 | % |
| Total Investments | | | 198.0 | % |
| Liabilities in Excess of Other Assets | | | (98.0 | )% |
| Net Assets | | | 100.0 | % |
| †† | The percentage shown for each investment category is the total value of investments in that category as a percentage of the net assets of the Fund. The table depicts the Fund’s investments but may not represent the Fund’s market exposure to certain derivatives, if any, which are included in Liabilities in Excess of Other Assets. |
See Notes to Financial Statements.
Simplify Multi-QIS Alternative ETF
Schedule of Investments
June 30, 2024
| | | Principal | | | Value | |
| U.S. Treasury Bills – 99.6% | | | | | | | | |
| U.S. Treasury Bill, 5.36%, 7/5/2024(a)(b) | | $ | 17,200,000 | | | $ | 17,189,995 | |
| U.S. Treasury Bill, 5.41%, 8/13/2024(a)(b) | | | 92,800,000 | | | | 92,219,979 | |
| U.S. Treasury Bill, 5.39%, 9/19/2024(a)(b) | | | 5,100,000 | | | | 5,040,976 | |
| Total U.S. Treasury Bills (Cost $114,444,912) | | | | | | | 114,450,950 | |
| | | Number of
Contracts | | | Notional Amount | | | | |
| Purchased Options – 0.0%† | | | | | | | | | | | |
| Puts – Exchange-Traded – 0.0%† | | | | | | | | | | | |
| S&P 500 Index, July Strike Price $5,200, Expires 7/02/24(c) | | 253 | | | | 131,560,000 | | | | 3,162 | |
| | | | | | | | | | | | |
| Total Purchased Options (Cost $24,448) | | | | | | | | | | 3,162 | |
| | | | | | | | | | | | |
| Total Investments – 99.6% | | | | | | | | | | | |
| (Cost $114,469,360) | | | | | | | | | $ | 114,454,112 | |
| Other Assets in Excess of Liabilities – 0.4% | | | | | | | | | | 485,188 | |
| Net Assets – 100.0% | | | | | | | | | $ | 114,939,300 | |
| | | Number of
Contracts | | | Notional Amount | | | | |
| Written Option – (0.0)%† | | | | | | | | | | | |
| | | | | | | | | | | | |
| Puts – Exchange-Traded – (0.0)%† | | | | | | | | | | | |
| S&P 500 Index, July Strike Price $5,000, Expires 7/02/24 (Premiums Received $12,637) | | (253) | | | | (126,500,000 | ) | | $ | (1,898 | ) |
| † | Less than 0.05% |
| (a) | Represents a zero coupon bond. Rate shown reflects the effective yield. |
| (b) | Securities with an aggregate market value of $23,047,701 have been pledged as collateral for options and swaps as of June 30, 2024. |
| (c) | Held in connection with Written Options. |
Summary of Investment Type††
| Investment Categories | | % of Net
Assets | |
| U.S. Treasury Bills | | | 99.6 | % |
| Purchased Options | | | 0.0 | %† |
| Total Investments | | | 99.6 | % |
| Other Assets in Excess of Liabilities | | | 0.4 | % |
| Net Assets | | | 100.0 | % |
| †† | The percentage shown for each investment category is the total value of investments in that category as a percentage of the net assets of the Fund. The table depicts the Fund’s investments but may not represent the Fund’s market exposure to certain derivatives, if any, which are included in Other Assets in Excess of Liabilities. |
See Notes to Financial Statements.
Simplify Multi-QIS Alternative ETF
Schedule of Investments (Continued)
June 30, 2024
At June 30, 2024, over the counter total return swap contracts outstanding were as follows:
| Reference Obligation/Index | | Termination
Date(a) | | Financing
Rate Paid
(Received)
by the Fund | | Counterparty | | Notional Amount | | | Unrealized
Appreciation/
(Depreciation)(b) | |
| AIJPMTRS* | | 7/15/2024 | | 0.20%(c) | | JPM | | | 3,447,142 | | | $ | 3,563 | |
| BAEISETRS* | | 1/15/2025 | | 0.20%(c) | | BOFA | | | 7,566,949 | | | | 754 | |
| BASRUFTRS* | | 1/15/2025 | | 0.20%(c) | | BOFA | | | 4,580,362 | | | | (13,106 | ) |
| BNPIDTRS* | | 7/15/2024 | | 0.10%(c) | | BNP | | | 15,680,968 | | | | 83,472 | |
| BNPX0TRS* | | 3/14/2025 | | 0.10%(c) | | BNP | | | 5,459,449 | | | | 1,125 | |
| BNPX2TRS* | | 3/14/2025 | | 0.10%(c) | | BNP | | | 14,566,447 | | | | 3,479 | |
| BNPXDTRS* | | 7/15/2024 | | 0.80%(c) | | BNP | | | 11,876,754 | | | | 79,268 | |
| BNPXMTRS* | | 3/14/2025 | | 0.10%(c) | | BNP | | | 13,516,392 | | | | (10,103 | ) |
| GSISDRTRS* | | 1/15/2025 | | —%(c) | | GS | | | 1,894,968 | | | | — | |
| GSISSTRS* | | 7/15/2024 | | —%(c) | | GS | | | 10,775,492 | | | | 17,309 | |
| GSIVVTRS* | | 7/15/2024 | | —%(c) | | GS | | | 5,576,061 | | | | 47,595 | |
| GSVICVTRS* | | 6/16/2025 | | —%(c) | | GS | | | 11,504,662 | | | | (17,903 | ) |
| GSVIKGTRS* | | 1/15/2025 | | —%(c) | | GS | | | 2,854,544 | | | | 1,059 | |
| GSVIKTRS* | | 7/15/2024 | | —%(c) | | GS | | | 7,171,280 | | | | 47,280 | |
| GSVLFTRS* | | 7/15/2024 | | —%(c) | | GS | | | 8,597,029 | | | | 165,463 | |
| Morgan Stanley Custom Junk Index* | | 6/22/2026 | | 5.33% (EFFR + 0.25%)(c) | | MSCS | | | (19,545,442 | ) | | | (271,804 | ) |
| Morgan Stanley Custom Quality Index* | | 6/22/2026 | | 5.33% (EFFR + 0.35%)(c) | | MSCS | | | 23,026,850 | | | | (265,457 | ) |
| MQIS2TRS* | | 7/16/2024 | | 0.25%(c) | | MBL | | | 4,423,444 | | | | (42,488 | ) |
| MQIS6TRS* | | 7/16/2024 | | 0.20%(c) | | MBL | | | 14,197,392 | | | | 69,034 | |
| MQISBTRS* | | 7/16/2024 | | 1.25%(c) | | MBL | | | 18,130,258 | | | | 184,039 | |
| MSCBL3TRS* | | 1/15/2025 | | —%(c) | | MSCS | | | 1,897,483 | | | | — | |
| MSCBUOTRS* | | 1/15/2025 | | 0.55%(c) | | MSCS | | | 8,196,394 | | | | 73,192 | |
| MSCFCETRS* | | 1/15/2025 | | —%(c) | | MSCS | | | 2,830,123 | | | | 25,391 | |
| MSCFVATRS* | | 1/15/2025 | | —%(c) | | MSCS | | | 1,846,331 | | | | (9,969 | ) |
| MSVCDDTRS* | | 1/15/2025 | | —%(c) | | MSCS | | | 2,835,561 | | | | 12,099 | |
| MSVCDNTRS* | | 1/15/2025 | | —%(c) | | MSCS | | | 6,689,643 | | | | 33,954 | |
| MSVCDRTRS* | | 1/15/2025 | | —%(c) | | MSCS | | | 13,083,437 | | | | 79,937 | |
| VMACBTRS* | | 7/16/2024 | | 0.15%(c) | | MBL | | | 11,046,128 | | | | 88,086 | |
| VMAQDSTRS* | | 1/15/2025 | | 0.20%(c) | | MBL | | | 2,846,821 | | | | 2,565 | |
| | | | | | | | | | | | | $ | 387,834 | |
| * | The components of the basket shown below. |
| (a) | The Fund pays/receives annual coupon payments in accordance with the swap contract. On the termination date of the swap contract(s), the Fund will either receive from or pay to the counterparty an amount equal to the net of the accrued financing fees and the value of the reference security subtracted from the original notional cost (notional multiplied by the price change of the reference security). |
| (b) | There are no upfront payments on the swap contracts, therefore the unrealized gain (loss) on the swap contracts is equal to their market value. |
| (c) | Payments made quarterly. |
Abbreviations:
| BNP | : | BNP Paribas |
| BOFA | : | Bank of America |
| EFFR | : | Effective Federal Funds Rate |
| GS | : | Goldman Sachs |
| JPM | : | JP Morgan |
| MBL | : | Macquarie Bank Limited |
| MSCS | : | Morgan Stanley Capital Services LLC |
See Notes to Financial Statements.
Simplify Multi-QIS Alternative ETF
Schedule of Investments (Continued)
June 30, 2024
| * | The following table shows the individual positions and related values of the securities within the AIJPMTRS (J.P. Morgan Short-Term Rates Trend Following, Fixed Income) basket. |
| Security description | | Notional
Value | | | Long
Short | | Unrealized
Appreciation/
(Depreciation) | | | % of basket | |
| JPM 2 ER MM Fut IdxUSD | | $ | 40,955 | | | Short | | | 727 | | | | 20.4 | % |
| JPM 2 ED MM Fut IdxUSD | | | 36,500 | | | Short | | | 648 | | | | 18.2 | % |
| JPM 3 ER MM Fut IdxUSD | | | 29,278 | | | Short | | | 520 | | | | 14.6 | % |
| JPM 4 ER MM Fut IdxUSD | | | 24,656 | | | Short | | | 438 | | | | 12.3 | % |
| JPM 3 ED MM Fut IdxUSD | | | 23,652 | | | Short | | | 420 | | | | 11.8 | % |
| JPM 4 ED MM Fut IdxUSD | | | 18,241 | | | Short | | | 324 | | | | 9.1 | % |
| JIRAW03U Index | | | 8,422 | | | Long | | | 150 | | | | 4.2 | % |
| JPM 3 L MM Fut IdxUSD | | | 4,790 | | | Short | | | 85 | | | | 2.4 | % |
| JPM 2 L MM Fut IdxUSD | | | 4,078 | | | Short | | | 72 | | | | 2.0 | % |
| JPM 4 L MM Fut IdxUSD | | | 3,442 | | | Short | | | 61 | | | | 1.7 | % |
| JIRAJ03U Index | | | 3,030 | | | Short | | | 54 | | | | 1.5 | % |
| JIRAS03U Index | | | 2,010 | | | Long | | | 36 | | | | 1.0 | % |
| JIRAA03U Index | | | 1,418 | | | Short | | | 25 | | | | 0.7 | % |
| JIRAC03U Index | | | 223 | | | Short | | | 4 | | | | 0.1 | % |
| Total | | | | | | | | | 3,563 | | | | 100.0 | % |
| * | The following table shows the individual positions and related values of the securities within the BAEISETRS (BofA Shore E Index - Series YF, Equity) basket. |
| Security description | | Notional
Value | | | Long
Short | | Unrealized
Appreciation/
(Depreciation) | | | % of basket | |
| USD_CURRENCY | | $ | 8,175,190 | | | Long | | | — | | | | 93.0 | % |
| SPY UP Equity | | | 615,007 | | | Short | | | 752 | | | | 7.0 | % |
| SPY US 07/01/24 P536 Equity | | | 451 | | | Short | | | 1 | | | | 0.0 | % |
| SPY US 07/01/24 P537 Equity | | | 394 | | | Short | | | 1 | | | | 0.0 | % |
| SPY US 07/01/24 P535 Equity | | | 381 | | | Short | | | — | | | | 0.0 | % |
| SPY US 07/02/24 P534 Equity | | | 222 | | | Short | | | — | | | | 0.0 | % |
| SPY US 07/02/24 P533 Equity | | | 175 | | | Short | | | — | | | | 0.0 | % |
| SPY US 07/02/24 P532 Equity | | | 152 | | | Short | | | — | | | | 0.0 | % |
| SPY US 07/01/24 P534 Equity | | | 103 | | | Short | | | — | | | | 0.0 | % |
| Total | | | | | | | | | 754 | | | | 100.0 | % |
| * | The following table shows the individual positions and related values of the securities within the BASRUFTRS (BofA Rates Fragility - 20%, Fixed Income) basket. |
| Security description | | Notional
Value | | | Long
Short | | Unrealized
Appreciation/
(Depreciation) | | | % of basket | |
| USQ4P 119.0 Comdty | | $ | 4,688 | | | Short | | | (263 | ) | | | 2.0 | % |
| USQ4P 119.0 Comdty | | | 4,688 | | | Short | | | (263 | ) | | | 2.0 | % |
| USQ4P 119.0 Comdty | | | 4,688 | | | Short | | | (263 | ) | | | 2.0 | % |
| USQ4P 119.0 Comdty | | | 4,688 | | | Short | | | (263 | ) | | | 2.0 | % |
| USQ4P 119.0 Comdty | | | 4,688 | | | Short | | | (263 | ) | | | 2.0 | % |
| TYQ4P 110.00 Comdty | | | 3,826 | | | Short | | | (215 | ) | | | 1.6 | % |
See Notes to Financial Statements.
Simplify Multi-QIS Alternative ETF
Schedule of Investments (Continued)
June 30, 2024
| Security description | | Notional
Value | | | Long
Short | | Unrealized
Appreciation/
(Depreciation) | | | % of basket | |
| TYQ4P 110.00 Comdty | | | 3,826 | | | Short | | | (215 | ) | | | 1.6 | % |
| TYQ4P 110.00 Comdty | | | 3,826 | | | Short | | | (215 | ) | | | 1.6 | % |
| TYQ4P 110.00 Comdty | | | 3,826 | | | Short | | | (215 | ) | | | 1.6 | % |
| TYQ4P 110.00 Comdty | | | 3,826 | | | Short | | | (215 | ) | | | 1.6 | % |
| USQ4P 118.0 Comdty | | | 3,457 | | | Short | | | (194 | ) | | | 1.5 | % |
| USQ4P 118.0 Comdty | | | 3,456 | | | Short | | | (194 | ) | | | 1.5 | % |
| USQ4P 118.0 Comdty | | | 3,456 | | | Short | | | (194 | ) | | | 1.5 | % |
| USQ4P 118.0 Comdty | | | 3,456 | | | Short | | | (194 | ) | | | 1.5 | % |
| USQ4P 118.0 Comdty | | | 3,456 | | | Short | | | (194 | ) | | | 1.5 | % |
| USQ4P 120.0 Comdty | | | 3,054 | | | Short | | | (171 | ) | | | 1.3 | % |
| USQ4P 120.0 Comdty | | | 3,054 | | | Short | | | (171 | ) | | | 1.3 | % |
| USQ4P 120.0 Comdty | | | 3,054 | | | Short | | | (171 | ) | | | 1.3 | % |
| USQ4P 120.0 Comdty | | | 3,054 | | | Short | | | (171 | ) | | | 1.3 | % |
| USQ4P 120.0 Comdty | | | 3,054 | | | Short | | | (171 | ) | | | 1.3 | % |
| TYQ4P 109.50 Comdty | | | 2,655 | | | Short | | | (149 | ) | | | 1.1 | % |
| TYQ4P 109.50 Comdty | | | 2,655 | | | Short | | | (149 | ) | | | 1.1 | % |
| TYQ4P 109.50 Comdty | | | 2,655 | | | Short | | | (149 | ) | | | 1.1 | % |
| TYQ4P 109.50 Comdty | | | 2,655 | | | Short | | | (149 | ) | | | 1.1 | % |
| TYQ4P 109.50 Comdty | | | 2,655 | | | Short | | | (149 | ) | | | 1.1 | % |
| TYQ4P 110.50 Comdty | | | 2,607 | | | Short | | | (146 | ) | | | 1.1 | % |
| TYQ4P 110.50 Comdty | | | 2,607 | | | Short | | | (146 | ) | | | 1.1 | % |
| TYQ4P 110.50 Comdty | | | 2,607 | | | Short | | | (146 | ) | | | 1.1 | % |
| TYQ4P 110.50 Comdty | | | 2,607 | | | Short | | | (146 | ) | | | 1.1 | % |
| TYQ4P 110.50 Comdty | | | 2,607 | | | Short | | | (146 | ) | | | 1.1 | % |
| USQ4P 117.0 Comdty | | | 2,465 | | | Short | | | (138 | ) | | | 1.1 | % |
| USQ4P 117.0 Comdty | | | 2,465 | | | Short | | | (138 | ) | | | 1.1 | % |
| USQ4P 117.0 Comdty | | | 2,465 | | | Short | | | (138 | ) | | | 1.1 | % |
| USQ4P 117.0 Comdty | | | 2,465 | | | Short | | | (138 | ) | | | 1.1 | % |
| USQ4P 117.0 Comdty | | | 2,465 | | | Short | | | (138 | ) | | | 1.1 | % |
| FVQ4P 106.50 Comdty | | | 2,394 | | | Short | | | (134 | ) | | | 1.0 | % |
| FVQ4P 106.50 Comdty | | | 2,394 | | | Short | | | (134 | ) | | | 1.0 | % |
| FVQ4P 106.50 Comdty | | | 2,394 | | | Short | | | (134 | ) | | | 1.0 | % |
| FVQ4P 106.50 Comdty | | | 2,394 | | | Short | | | (134 | ) | | | 1.0 | % |
| FVQ4P 106.50 Comdty | | | 2,394 | | | Short | | | (134 | ) | | | 1.0 | % |
| FVQ4P 106.25 Comdty | | | 1,814 | | | Short | | | (102 | ) | | | 0.8 | % |
| FVQ4P 106.25 Comdty | | | 1,814 | | | Short | | | (102 | ) | | | 0.8 | % |
| FVQ4P 106.25 Comdty | | | 1,814 | | | Short | | | (102 | ) | | | 0.8 | % |
| FVQ4P 106.25 Comdty | | | 1,814 | | | Short | | | (102 | ) | | | 0.8 | % |
| FVQ4P 106.25 Comdty | | | 1,814 | | | Short | | | (102 | ) | | | 0.8 | % |
| TYQ4C 111.00 Comdty | | | 1,722 | | | Short | | | (97 | ) | | | 0.7 | % |
| TYQ4C 111.00 Comdty | | | 1,722 | | | Short | | | (97 | ) | | | 0.7 | % |
| TYQ4C 111.00 Comdty | | | 1,722 | | | Short | | | (97 | ) | | | 0.7 | % |
| TYQ4C 111.00 Comdty | | | 1,722 | | | Short | | | (97 | ) | | | 0.7 | % |
| TYQ4C 111.00 Comdty | | | 1,722 | | | Short | | | (97 | ) | | | 0.7 | % |
| Other Components | | | 90,039 | | | — | | | (5,055 | ) | | | 38.6 | % |
| Total | | | | | | | | | (13,106 | ) | | | 100.0 | % |
See Notes to Financial Statements.
Simplify Multi-QIS Alternative ETF
Schedule of Investments (Continued)
June 30, 2024
| * | The following table shows the individual positions and related values of the securities within the BNPIDTRS (BNPP Dynamic Volatility Roll Down US, Equity) basket. |
| Security description | | Notional
Value | | | Long
Short | | Unrealized
Appreciation/
(Depreciation) | | | % of basket | |
| USD Cash | | $ | 17,616,733 | | | Long | | | — | | | | 90.4 | % |
| CBOE VIX FUTURE Jul 24 | | | 1,871,158 | | | Short | | | 83,472 | | | | 9.6 | % |
| Total | | | | | | | | | 83,472 | | | | 100.0 | % |
| * | The following table shows the individual positions and related values of the securities within the BNPX0TRS (BNP Paribas Kinetis R 10Y Swap, Fixed Income) basket. |
| Security description | | Notional
Value | | | Long
Short | | Unrealized
Appreciation/
(Depreciation) | | | % of basket | |
| USD Cash | | $ | 8,153,235 | | | Long | | | — | | | | 70.3 | % |
| USD 19/07/2024 Swap 19/07/2034 | | | 447,093 | | | Short | | | 164 | | | | 3.9 | % |
| USD 22/11/2024 Swap 22/11/2034 | | | 447,093 | | | Short | | | 164 | | | | 3.9 | % |
| USD 23/08/2024 Swap 23/08/2034 | | | 447,093 | | | Short | | | 164 | | | | 3.9 | % |
| USD 20/09/2024 Swap 20/09/2034 | | | 447,093 | | | Short | | | 164 | | | | 3.9 | % |
| USD 18/10/2024 Swap 18/10/2034 | | | 447,093 | | | Short | | | 164 | | | | 3.9 | % |
| USD 20/12/2024 Swap 20/12/2034 | | | 447,093 | | | Short | | | 164 | | | | 3.9 | % |
| EUR Cash | | | 383,101 | | | Long | | | — | | | | 3.3 | % |
| EUR 19/07/2024 Swap 19/07/2034 | | | 63,850 | | | Short | | | 23 | | | | 0.6 | % |
| EUR 20/09/2024 Swap 20/09/2034 | | | 63,850 | | | Short | | | 23 | | | | 0.6 | % |
| EUR 23/08/2024 Swap 23/08/2034 | | | 63,850 | | | Short | | | 23 | | | | 0.6 | % |
| EUR 18/10/2024 Swap 18/10/2034 | | | 63,850 | | | Short | | | 23 | | | | 0.6 | % |
| EUR 22/11/2024 Swap 22/11/2034 | | | 63,850 | | | Short | | | 23 | | | | 0.6 | % |
| EUR 20/12/2024 Swap 20/12/2034 | | | 63,850 | | | Short | | | 23 | | | | 0.6 | % |
| Total | | | | | | | | | 1,125 | | | | 100.0 | % |
| * | The following table shows the individual positions and related values of the securities within the BNPX2TRS (BNP Paribas Kinetis R 2Y Swap, Fixed Income) basket. |
| Security description | | Notional
Value | | | Long
Short | | Unrealized
Appreciation/
(Depreciation) | | | % of basket | |
| USD Cash | | $ | 46,342,370 | | | Long | | | — | | | | 47.0 | % |
| USD 19/07/2024 Swap 19/07/2026 | | | 31,770,721 | | | Short | | | 2,629 | | | | 32.2 | % |
| EUR 19/07/2024 Swap 19/07/2026 | | | 10,279,565 | | | Short | | | 850 | | | | 10.4 | % |
| EUR Cash | | | 10,279,562 | | | Long | | | — | | | | 10.4 | % |
| Total | | | | | | | | | 3,479 | | | | 100.0 | % |
| * | The following table shows the individual positions and related values of the securities within the BNPXDTRS (BNPP Daily CDI Carry ex-Agriculture and Livestock 12x, Commodity) basket. |
| Security description | | Notional
Value | | | Long
Short | | Unrealized
Appreciation/
(Depreciation) | | | % of basket | |
| USD Cash | | $ | 140,198,711 | | | Long | | | — | | | | 32.8 | % |
| USD Cash | | | 128,294,823 | | | Short | | | — | | | | 30.0 | % |
| GOLD 100 OZ FUTR Dec24 | | | 6,942,263 | | | Long | | | 3,469 | | | | 1.6 | % |
| GOLD 100 OZ FUTR Aug24 | | | 6,940,055 | | | Short | | | 3,467 | | | | 1.6 | % |
| WTI CRUDE FUTURE Aug24 | | | 4,678,912 | | | Short | | | 2,338 | | | | 1.1 | % |
See Notes to Financial Statements.
Simplify Multi-QIS Alternative ETF
Schedule of Investments (Continued)
June 30, 2024
| Security description | | Notional
Value | | | Long
Short | | Unrealized
Appreciation/
(Depreciation) | | | % of basket | |
| WTI CRUDE FUTURE Dec25 | | | 4,581,444 | | | Short | | | 2,289 | | | | 1.1 | % |
| WTI CRUDE FUTURE Oct24 | | | 4,575,237 | | | Long | | | 2,286 | | | | 1.1 | % |
| WTI CRUDE FUTURE Jan25 | | | 4,511,770 | | | Long | | | 2,254 | | | | 1.1 | % |
| WTI CRUDE FUTURE Dec24 | | | 4,082,951 | | | Long | | | 2,040 | | | | 1.0 | % |
| BRENT CRUDE FUTR Jun25 | | | 4,052,171 | | | Short | | | 2,025 | | | | 0.9 | % |
| BRENT CRUDE FUTR Oct24 | | | 4,051,355 | | | Long | | | 2,024 | | | | 0.9 | % |
| BRENT CRUDE FUTR Mar25 | | | 4,040,225 | | | Long | | | 2,019 | | | | 0.9 | % |
| BRENT CRUDE FUTR Dec24 | | | 4,036,334 | | | Long | | | 2,017 | | | | 0.9 | % |
| LME COPPER FUTURE Mar25 | | | 3,713,416 | | | Long | | | 1,855 | | | | 0.9 | % |
| LME COPPER FUTURE Dec24 | | | 3,708,354 | | | Long | | | 1,853 | | | | 0.9 | % |
| LME COPPER FUTURE Sep24 | | | 3,707,636 | | | Short | | | 1,852 | | | | 0.9 | % |
| NATURAL GAS FUTR Apr25 | | | 3,581,574 | | | Long | | | 1,789 | | | | 0.8 | % |
| NATURAL GAS FUTR Feb25 | | | 3,451,185 | | | Long | | | 1,724 | | | | 0.8 | % |
| NATURAL GAS FUTR Dec24 | | | 3,401,427 | | | Short | | | 1,699 | | | | 0.8 | % |
| NATURAL GAS FUTR Mar25 | | | 3,377,299 | | | Short | | | 1,687 | | | | 0.8 | % |
| WTI CRUDE FUTURE Jun25 | | | 3,329,591 | | | Short | | | 1,664 | | | | 0.8 | % |
| LME COPPER FUTURE Dec25 | | | 3,324,761 | | | Long | | | 1,661 | | | | 0.8 | % |
| LME COPPER FUTURE Aug24 | | | 3,239,642 | | | Short | | | 1,619 | | | | 0.8 | % |
| BRENT CRUDE FUTR Sep25 | | | 3,064,165 | | | Short | | | 1,531 | | | | 0.7 | % |
| WTI CRUDE FUTURE Mar25 | | | 3,056,444 | | | Long | | | 1,527 | | | | 0.7 | % |
| BRENT CRUDE FUTR Apr25 | | | 2,930,265 | | | Short | | | 1,464 | | | | 0.7 | % |
| WTI CRUDE FUTURE Sep24 | | | 2,913,395 | | | Short | | | 1,456 | | | | 0.7 | % |
| BRENT CRUDE FUTR Sep24 | | | 2,441,348 | | | Short | | | 1,220 | | | | 0.6 | % |
| BRENT CRUDE FUTR Nov24 | | | 2,350,116 | | | Long | | | 1,174 | | | | 0.6 | % |
| LME COPPER FUTURE Nov24 | | | 2,276,336 | | | Short | | | 1,137 | | | | 0.5 | % |
| NATURAL GAS FUTR Aug24 | | | 2,261,789 | | | Short | | | 1,130 | | | | 0.5 | % |
| LME COPPER FUTURE Oct24 | | | 2,190,983 | | | Short | | | 1,095 | | | | 0.5 | % |
| LME PRI ALUM FUTR Dec24 | | | 2,075,000 | | | Long | | | 1,037 | | | | 0.5 | % |
| LME PRI ALUM FUTR Sep24 | | | 2,064,301 | | | Short | | | 1,031 | | | | 0.5 | % |
| WTI CRUDE FUTURE Nov25 | | | 2,012,976 | | | Short | | | 1,006 | | | | 0.5 | % |
| WTI CRUDE FUTURE Nov24 | | | 2,012,563 | | | Long | | | 1,006 | | | | 0.5 | % |
| NATURAL GAS FUTR Jan25 | | | 1,792,151 | | | Short | | | 895 | | | | 0.4 | % |
| NATURAL GAS FUTR Oct24 | | | 1,602,136 | | | Long | | | 800 | | | | 0.4 | % |
| GASOLINE RBOB FUT Oct24 | | | 1,528,431 | | | Long | | | 764 | | | | 0.4 | % |
| GASOLINE RBOB FUT Jan25 | | | 1,522,347 | | | Short | | | 761 | | | | 0.4 | % |
| Low Su Gasoil G Jun25 | | | 1,346,992 | | | Long | | | 673 | | | | 0.3 | % |
| Low Su Gasoil G Mar25 | | | 1,346,208 | | | Long | | | 673 | | | | 0.3 | % |
| Low Su Gasoil G Dec24 | | | 1,343,109 | | | Long | | | 671 | | | | 0.3 | % |
| Low Su Gasoil G Oct24 | | | 1,342,017 | | | Short | | | 671 | | | | 0.3 | % |
| Low Su Gasoil G Nov24 | | | 1,341,716 | | | Long | | | 670 | | | | 0.3 | % |
| Low Su Gasoil G Dec25 | | | 1,341,638 | | | Short | | | 670 | | | | 0.3 | % |
| Low Su Gasoil G Sep24 | | | 1,341,092 | | | Short | | | 670 | | | | 0.3 | % |
| Low Su Gasoil G Aug24 | | | 1,338,432 | | | Short | | | 669 | | | | 0.3 | % |
| BRENT CRUDE FUTR Feb25 | | | 1,280,621 | | | Short | | | 640 | | | | 0.3 | % |
| NATURAL GAS FUTR Sep24 | | | 1,263,257 | | | Long | | | 631 | | | | 0.3 | % |
| Other Components | | | 19,947,808 | | | — | | | 9,966 | | | | 4.7 | % |
| Total | | | | | | | | | 79,268 | | | | 100.0 | % |
See Notes to Financial Statements.
Simplify Multi-QIS Alternative ETF
Schedule of Investments (Continued)
June 30, 2024
| * | The following table shows the individual positions and related values of the securities within the BNPXMTRS (BNP Paribas Kinetis R Money Markets, Fixed Income) basket. |
| Security description | | Notional
Value | | | Long
Short | | Unrealized
Appreciation/
(Depreciation) | | | % of basket | |
| USD Cash | | $ | 75,805,378 | | | Long | | | — | | | | 40.0 | % |
| EUR Cash | | | 25,531,607 | | | Long | | | — | | | | 13.5 | % |
| SFRM5 Comdty | | | 15,695,633 | | | Short | | | (1,802 | ) | | | 8.3 | % |
| SFRH5 Comdty | | | 15,647,421 | | | Short | | | (1,796 | ) | | | 8.3 | % |
| SFRZ4 Comdty | | | 15,584,482 | | | Short | | | (1,789 | ) | | | 8.2 | % |
| SFRU4 Comdty | | | 15,518,285 | | | Short | | | (1,781 | ) | | | 8.2 | % |
| ERM5 Comdty | | | 6,416,464 | | | Short | | | (737 | ) | | | 3.4 | % |
| ERH5 Comdty | | | 6,401,629 | | | Short | | | (735 | ) | | | 3.4 | % |
| ERZ4 Comdty | | | 6,382,833 | | | Short | | | (733 | ) | | | 3.4 | % |
| ERU4 Comdty | | | 6,363,382 | | | Short | | | (730 | ) | | | 3.4 | % |
| Total | | | | | | | | | (10,103 | ) | | | 100.0 | % |
| * | The following table shows the individual positions and related values of the securities within the GSISDRTRS(GS Intraday Delta Replication VX Series 5, Equity) basket. |
| Security description | | Notional
Value | | | Long
Short | | Unrealized
Appreciation/
(Depreciation) | | | % of basket | |
| UXN4 Index | | $ | 7,052 | | | Long | | | 0 | | | | 57.0 | % |
| UXQ4 Index | | | 1,110 | | | Long | | | 0 | | | | 9.0 | % |
| VIX 07/17/24 C17 Index | | | 949 | | | Short | | | 0 | | | | 7.7 | % |
| VIX 07/17/24 C16 Index | | | 677 | | | Short | | | 0 | | | | 5.5 | % |
| VIX 07/17/24 C18 Index | | | 564 | | | Short | | | 0 | | | | 4.6 | % |
| VIX 07/17/24 C25 Index | | | 290 | | | Long | | | 0 | | | | 2.3 | % |
| VIX 07/17/24 C27 Index | | | 177 | | | Long | | | 0 | | | | 1.4 | % |
| VIX 07/17/24 C26 Index | | | 167 | | | Long | | | 0 | | | | 1.3 | % |
| VIX 07/17/24 C15.5 Index | | | 161 | | | Short | | | 0 | | | | 1.3 | % |
| VIX 08/21/24 C18 Index | | | 157 | | | Short | | | 0 | | | | 1.3 | % |
| VIX 08/21/24 C19 Index | | | 152 | | | Short | | | 0 | | | | 1.2 | % |
| VIX 07/17/24 C19 Index | | | 140 | | | Short | | | 0 | | | | 1.1 | % |
| VIX 07/17/24 C24 Index | | | 102 | | | Long | | | 0 | | | | 0.8 | % |
| VIX 08/21/24 C20 Index | | | 84 | | | Short | | | 0 | | | | 0.7 | % |
| VIX 08/21/24 C34 Index | | | 71 | | | Long | | | 0 | | | | 0.6 | % |
| VIX 08/21/24 C21 Index | | | 66 | | | Short | | | 0 | | | | 0.5 | % |
| VIX 07/17/24 C28 Index | | | 63 | | | Long | | | 0 | | | | 0.5 | % |
| VIX 07/17/24 C15 Index | | | 57 | | | Short | | | 0 | | | | 0.5 | % |
| VIX 07/17/24 C22 Index | | | 54 | | | Long | | | 0 | | | | 0.4 | % |
| VIX 08/21/24 C33 Index | | | 47 | | | Long | | | 0 | | | | 0.4 | % |
| VIX 08/21/24 C22 Index | | | 47 | | | Short | | | 0 | | | | 0.4 | % |
| VIX 07/17/24 C32 Index | | | 45 | | | Long | | | 0 | | | | 0.4 | % |
| VIX 08/21/24 C36 Index | | | 41 | | | Long | | | 0 | | | | 0.3 | % |
| VIX 07/17/24 C20 Index | | | 39 | | | Short | | | 0 | | | | 0.3 | % |
| VIX 07/17/24 C29 Index | | | 24 | | | Long | | | 0 | | | | 0.2 | % |
| VIX 07/17/24 C30 Index | | | 20 | | | Long | | | 0 | | | | 0.2 | % |
| VIX 08/21/24 C37 Index | | | 11 | | | Long | | | 0 | | | | 0.1 | % |
| VIX 08/21/24 C35 Index | | | 6 | | | Long | | | 0 | | | | 0.0 | % |
| VIX 07/17/24 C33 Index | | | 5 | | | Long | | | 0 | | | | 0.0 | % |
See Notes to Financial Statements.
Simplify Multi-QIS Alternative ETF
Schedule of Investments (Continued)
June 30, 2024
| Security description | | Notional
Value | | | Long
Short | | Unrealized
Appreciation/
(Depreciation) | | | % of basket | |
| VIX 07/17/24 C21 Index | | | 4 | | | Short | | | 0 | | | | 0.0 | % |
| Total | | | | | | | | | — | | | | 100.0 | % |
| * | The following table shows the individual positions and related values of the securities within the GSISSTRS (GS Systematic Skew US Series 1D, Equity) basket. |
| Security description | | Notional
Value | | | Long
Short | | Unrealized
Appreciation/
(Depreciation) | | | % of basket | |
| SPX 07/19/24 C5230 Index | | $ | 37,082 | | | Long | | | 739 | | | | 4.3 | % |
| SPX 07/19/24 C5215 Index | | | 27,698 | | | Long | | | 552 | | | | 3.2 | % |
| SPX 09/20/24 5485 Index | | | 24,510 | | | Short | | | 488 | | | | 2.8 | % |
| SPX 07/19/24 C5290 Index | | | 19,013 | | | Long | | | 379 | | | | 2.2 | % |
| SPX 08/16/24 C5250 Index | | | 18,913 | | | Long | | | 377 | | | | 2.2 | % |
| SPX 07/19/24 C5360 Index | | | 16,406 | | | Long | | | 327 | | | | 1.9 | % |
| SPX 08/16/24 5485 Index | | | 15,838 | | | Short | | | 316 | | | | 1.8 | % |
| SPX 08/16/24 C5340 Index | | | 15,091 | | | Long | | | 301 | | | | 1.7 | % |
| SPX 07/19/24 C5305 Index | | | 13,576 | | | Long | | | 271 | | | | 1.6 | % |
| SPX 09/20/24 C5410 Index | | | 12,919 | | | Long | | | 257 | | | | 1.5 | % |
| SPX 10/18/24 5485 Index | | | 12,719 | | | Short | | | 253 | | | | 1.5 | % |
| SPX 07/19/24 C5320 Index | | | 11,964 | | | Long | | | 238 | | | | 1.4 | % |
| SPX 07/19/24 C5335 Index | | | 11,920 | | | Long | | | 238 | | | | 1.4 | % |
| SPX 07/19/24 C5330 Index | | | 11,386 | | | Long | | | 227 | | | | 1.3 | % |
| SPX 08/16/24 C5270 Index | | | 11,261 | | | Long | | | 224 | | | | 1.3 | % |
| SPX 07/19/24 5485 Index | | | 11,257 | | | Short | | | 224 | | | | 1.3 | % |
| SPX 07/19/24 C5410 Index | | | 10,212 | | | Long | | | 203 | | | | 1.2 | % |
| SPX 07/19/24 C5310 Index | | | 9,949 | | | Long | | | 198 | | | | 1.1 | % |
| SPX 07/19/24 C5370 Index | | | 9,940 | | | Long | | | 198 | | | | 1.1 | % |
| SPX 07/19/24 C5405 Index | | | 9,355 | | | Long | | | 186 | | | | 1.1 | % |
| SPX 09/20/24 C5440 Index | | | 9,109 | | | Long | | | 182 | | | | 1.0 | % |
| SPX 08/16/24 C5370 Index | | | 8,836 | | | Long | | | 176 | | | | 1.0 | % |
| SPX 08/16/24 C5440 Index | | | 8,731 | | | Long | | | 174 | | | | 1.0 | % |
| SPX 07/19/24 C5235 Index | | | 8,721 | | | Long | | | 174 | | | | 1.0 | % |
| SPX 08/16/24 C5410 Index | | | 8,704 | | | Long | | | 173 | | | | 1.0 | % |
| SPX 09/20/24 C5380 Index | | | 8,656 | | | Long | | | 172 | | | | 1.0 | % |
| SPX 07/19/24 C5255 Index | | | 8,494 | | | Long | | | 169 | | | | 1.0 | % |
| SPX 07/19/24 C5325 Index | | | 8,360 | | | Long | | | 167 | | | | 1.0 | % |
| SPX 07/19/24 C5250 Index | | | 8,244 | | | Long | | | 164 | | | | 0.9 | % |
| SPX 08/16/24 C5400 Index | | | 7,886 | | | Long | | | 157 | | | | 0.9 | % |
| SPX 07/19/24 C5340 Index | | | 7,278 | | | Long | | | 145 | | | | 0.8 | % |
| SPX 08/16/24 C5360 Index | | | 7,099 | | | Long | | | 141 | | | | 0.8 | % |
| SPX 08/16/24 C5450 Index | | | 7,079 | | | Long | | | 141 | | | | 0.8 | % |
| SPX 07/19/24 C5425 Index | | | 7,070 | | | Long | | | 141 | | | | 0.8 | % |
| SPX 07/19/24 C5380 Index | | | 6,901 | | | Long | | | 138 | | | | 0.8 | % |
| SPX 09/20/24 C5490 Index | | | 6,819 | | | Long | | | 136 | | | | 0.8 | % |
| SPX 10/18/24 C5660 Index | | | 6,805 | | | Long | | | 136 | | | | 0.8 | % |
| SPX 08/16/24 C5280 Index | | | 6,155 | | | Long | | | 123 | | | | 0.7 | % |
| SPX 08/16/24 C5290 Index | | | 6,101 | | | Long | | | 122 | | | | 0.7 | % |
| SPX 07/19/24 C5365 Index | | | 5,769 | | | Long | | | 115 | | | | 0.7 | % |
| SPX 07/19/24 C5375 Index | | | 5,632 | | | Long | | | 112 | | | | 0.6 | % |
| SPX 08/16/24 P4995 Index | | | 5,596 | | | Short | | | 112 | | | | 0.6 | % |
| SPX 08/16/24 C5475 Index | | | 5,572 | | | Long | | | 111 | | | | 0.6 | % |
| SPX 08/16/24 P5065 Index | | | 5,274 | | | Short | | | 105 | | | | 0.6 | % |
See Notes to Financial Statements.
Simplify Multi-QIS Alternative ETF
Schedule of Investments (Continued)
June 30, 2024
| Security description | | Notional
Value | | | Long
Short | | Unrealized
Appreciation/
(Depreciation) | | | % of basket | |
| SPX 09/20/24 P4995 Index | | | 5,111 | | | Short | | | 102 | | | | 0.6 | % |
| SPX 09/20/24 C5325 Index | | | 5,045 | | | Long | | | 101 | | | | 0.6 | % |
| SPX 09/20/24 C5475 Index | | | 4,999 | | | Long | | | 100 | | | | 0.6 | % |
| SPX 09/20/24 P5090 Index | | | 4,877 | | | Short | | | 97 | | | | 0.6 | % |
| SPX 07/19/24 C5420 Index | | | 4,859 | | | Long | | | 97 | | | | 0.6 | % |
| SPX 08/16/24 C5365 Index | | | 4,826 | | | Long | | | 96 | | | | 0.6 | % |
| Other Components | | | 353,000 | | | — | | | 7,034 | | | | 40.6 | % |
| Total | | | | | | | | | 17,309 | | | | 100.0 | % |
| * | The following table shows the individual positions and related values of the securities within the GSIVVTRS (GS VX Volatility Carry Series 6, Equity) basket. |
| Security description | | Notional
Value | | | Long
Short | | Unrealized
Appreciation/
(Depreciation) | | | % of basket | |
| UXN4 Index | | $ | 703,881 | | | Short | | | 36,228 | | | | 76.1 | % |
| UXQ4 Index | | | 70,283 | | | Short | | | 3,617 | | | | 7.6 | % |
| VIX 07/17/24 P14 Index | | | 32,082 | | | Short | | | 1,651 | | | | 3.5 | % |
| VIX 07/17/24 P14.5 Index | | | 21,737 | | | Short | | | 1,119 | | | | 2.4 | % |
| VIX 07/17/24 P13.5 Index | | | 17,711 | | | Short | | | 912 | | | | 1.9 | % |
| VIX 07/17/24 C15 Index | | | 13,739 | | | Short | | | 707 | | | | 1.5 | % |
| VIX 07/17/24 C16 Index | | | 12,399 | | | Short | | | 638 | | | | 1.3 | % |
| VIX 07/17/24 C15.5 Index | | | 11,092 | | | Short | | | 571 | | | | 1.2 | % |
| VIX 07/17/24 C14.5 Index | | | 6,405 | | | Short | | | 330 | | | | 0.7 | % |
| VIX 08/21/24 P15 Index | | | 5,844 | | | Short | | | 301 | | | | 0.6 | % |
| VIX 07/17/24 C17 Index | | | 4,201 | | | Short | | | 216 | | | | 0.5 | % |
| VIX 08/21/24 P14.5 Index | | | 3,553 | | | Short | | | 183 | | | | 0.4 | % |
| VIX 08/21/24 C17 Index | | | 3,503 | | | Short | | | 180 | | | | 0.4 | % |
| VIX 08/21/24 C18 Index | | | 2,669 | | | Short | | | 137 | | | | 0.3 | % |
| VIX 07/17/24 P15 Index | | | 2,379 | | | Short | | | 122 | | | | 0.3 | % |
| VIX 08/21/24 C16 Index | | | 2,322 | | | Short | | | 120 | | | | 0.3 | % |
| VIX 08/21/24 P14 Index | | | 1,714 | | | Short | | | 88 | | | | 0.2 | % |
| VIX 07/17/24 C35 Index | | | 879 | | | Long | | | 45 | | | | 0.1 | % |
| VIX 07/17/24 C42.5 Index | | | 630 | | | Long | | | 32 | | | | 0.1 | % |
| VIX 07/17/24 C38 Index | | | 597 | | | Long | | | 31 | | | | 0.1 | % |
| VIX 07/17/24 C33 Index | | | 570 | | | Long | | | 29 | | | | 0.1 | % |
| VIX 07/17/24 C34 Index | | | 537 | | | Long | | | 28 | | | | 0.1 | % |
| VIX 07/17/24 C37 Index | | | 513 | | | Long | | | 26 | | | | 0.1 | % |
| VIX 08/21/24 C19 Index | | | 506 | | | Short | | | 26 | | | | 0.1 | % |
| VIX 08/21/24 P16 Index | | | 477 | | | Short | | | 25 | | | | 0.1 | % |
| VIX 07/17/24 C18 Index | | | 467 | | | Short | | | 24 | | | | 0.1 | % |
| VIX 07/17/24 C45 Index | | | 440 | | | Long | | | 23 | | | | 0.0 | % |
| VIX 07/17/24 C40 Index | | | 394 | | | Long | | | 20 | | | | 0.0 | % |
| VIX 07/17/24 P13 Index | | | 368 | | | Short | | | 19 | | | | 0.0 | % |
| VIX 08/21/24 C55 Index | | | 363 | | | Long | | | 19 | | | | 0.0 | % |
| VIX 07/17/24 C32 Index | | | 323 | | | Long | | | 17 | | | | 0.0 | % |
| VIX 07/17/24 C39 Index | | | 314 | | | Long | | | 16 | | | | 0.0 | % |
| VIX 07/17/24 C31 Index | | | 276 | | | Long | | | 14 | | | | 0.0 | % |
| VIX 08/21/24 C47.5 Index | | | 273 | | | Long | | | 14 | | | | 0.0 | % |
See Notes to Financial Statements.
Simplify Multi-QIS Alternative ETF
Schedule of Investments (Continued)
June 30, 2024
| Security description | | Notional
Value | | | Long
Short | | Unrealized
Appreciation/
(Depreciation) | | | % of basket | |
| VIX 08/21/24 C45 Index | | | 236 | | | Long | | | 12 | | | | 0.0 | % |
| VIX 07/17/24 C36 Index | | | 211 | | | Long | | | 11 | | | | 0.0 | % |
| VIX 08/21/24 C50 Index | | | 166 | | | Long | | | 9 | | | | 0.0 | % |
| VIX 07/17/24 C28 Index | | | 152 | | | Long | | | 8 | | | | 0.0 | % |
| VIX 07/17/24 C30 Index | | | 146 | | | Long | | | 8 | | | | 0.0 | % |
| VIX 07/17/24 C47.5 Index | | | 124 | | | Long | | | 6 | | | | 0.0 | % |
| VIX 08/21/24 C65 Index | | | 93 | | | Long | | | 5 | | | | 0.0 | % |
| VIX 08/21/24 C60 Index | | | 65 | | | Long | | | 3 | | | | 0.0 | % |
| VIX 07/17/24 C55 Index | | | 65 | | | Long | | | 3 | | | | 0.0 | % |
| VIX 07/17/24 C50 Index | | | 40 | | | Long | | | 2 | | | | 0.0 | % |
| VIX 07/17/24 C60 Index | | | 6 | | | Long | | | 0 | | | | 0.0 | % |
| Total | | | | | | | | | 47,595 | | | | 100.0 | % |
| * | The following table shows the individual positions and related values of the securities within the GSVICVTRS (GS Corridor Variance Swap US Series 1, Equity) basket. |
| Security description | | Notional
Value | | | Long
Short | | Unrealized
Appreciation/
(Depreciation) | | | % of basket | |
| SPX 09/20/24 P5100 Index | | $ | 35,787 | | | Short | | | (3,076 | ) | | | 17.2 | % |
| SPX 09/20/24 P4850 Index | | | 22,185 | | | Long | | | (1,907 | ) | | | 10.7 | % |
| SPX 09/20/24 P5150 Index | | | 13,299 | | | Short | | | (1,143 | ) | | | 6.4 | % |
| SPX 08/16/24 P5000 Index | | | 12,194 | | | Short | | | (1,048 | ) | | | 5.9 | % |
| SPX 09/20/24 P4900 Index | | | 9,333 | | | Long | | | (802 | ) | | | 4.5 | % |
| SPX 08/16/24 P4750 Index | | | 8,264 | | | Long | | | (710 | ) | | | 4.0 | % |
| SPX 08/16/24 P5100 Index | | | 5,096 | | | Short | | | (438 | ) | | | 2.4 | % |
| SPX 08/16/24 P5050 Index | | | 4,606 | | | Short | | | (396 | ) | | | 2.2 | % |
| SPX 09/20/24 P4800 Index | | | 4,142 | | | Long | | | (356 | ) | | | 2.0 | % |
| SPXW 08/30/24 P5150 Index | | | 4,017 | | | Short | | | (345 | ) | | | 1.9 | % |
| SPX 08/16/24 P4800 Index | | | 3,906 | | | Long | | | (336 | ) | | | 1.9 | % |
| SPX 08/16/24 P4850 Index | | | 3,897 | | | Long | | | (335 | ) | | | 1.9 | % |
| SPXW 08/09/24 P5100 Index | | | 2,974 | | | Short | | | (256 | ) | | | 1.4 | % |
| SPX 08/16/24 P4700 Index | | | 2,614 | | | Long | | | (225 | ) | | | 1.3 | % |
| SPX 09/20/24 P5000 Index | | | 2,415 | | | Long | | | (208 | ) | | | 1.2 | % |
| SPX 09/20/24 P4950 Index | | | 2,169 | | | Long | | | (186 | ) | | | 1.0 | % |
| SPX 08/16/24 P4650 Index | | | 2,132 | | | Long | | | (183 | ) | | | 1.0 | % |
| SPX 08/16/24 P5150 Index | | | 2,042 | | | Short | | | (176 | ) | | | 1.0 | % |
| SPX 09/20/24 P5050 Index | | | 1,946 | | | Short | | | (167 | ) | | | 0.9 | % |
| SPXW 08/30/24 P4900 Index | | | 1,876 | | | Long | | | (161 | ) | | | 0.9 | % |
| SPXW 07/26/24 P5100 Index | | | 1,813 | | | Short | | | (156 | ) | | | 0.9 | % |
| SPXW 08/09/24 P5150 Index | | | 1,646 | | | Short | | | (141 | ) | | | 0.8 | % |
| SPX 09/20/24 P4750 Index | | | 1,489 | | | Long | | | (128 | ) | | | 0.7 | % |
| SPXW 07/31/24 P5100 Index | | | 1,464 | | | Short | | | (126 | ) | | | 0.7 | % |
| SPX 09/20/24 P4700 Index | | | 1,376 | | | Long | | | (118 | ) | | | 0.7 | % |
| SPXW 08/09/24 P4850 Index | | | 1,315 | | | Long | | | (113 | ) | | | 0.6 | % |
| SPX 09/20/24 P4650 Index | | | 1,274 | | | Long | | | (109 | ) | | | 0.6 | % |
| SPX 09/20/24 P4600 Index | | | 1,185 | | | Long | | | (102 | ) | | | 0.6 | % |
| SPXW 08/02/24 P5100 Index | | | 1,136 | | | Short | | | (98 | ) | | | 0.5 | % |
| SPXW 07/26/24 P5050 Index | | | 1,117 | | | Short | | | (96 | ) | | | 0.5 | % |
| SPX 09/20/24 P4550 Index | | | 1,108 | | | Long | | | (95 | ) | | | 0.5 | % |
| SPX 08/16/24 P4950 Index | | | 1,093 | | | Short | | | (94 | ) | | | 0.5 | % |
| SPX 07/19/24 P5100 Index | | | 1,086 | | | Short | | | (93 | ) | | | 0.5 | % |
See Notes to Financial Statements.
Simplify Multi-QIS Alternative ETF
Schedule of Investments (Continued)
June 30, 2024
| Security description | | Notional
Value | | | Long
Short | | Unrealized
Appreciation/
(Depreciation) | | | % of basket | |
| SPX 09/20/24 P4500 Index | | | 1,039 | | | Long | | | (89 | ) | | | 0.5 | % |
| SPX 07/19/24 P5000 Index | | | 983 | | | Short | | | (84 | ) | | | 0.5 | % |
| SPX 09/20/24 P4450 Index | | | 978 | | | Long | | | (84 | ) | | | 0.5 | % |
| SPX 08/16/24 P4600 Index | | | 954 | | | Long | | | (82 | ) | | | 0.5 | % |
| SPX 09/20/24 P4400 Index | | | 923 | | | Long | | | (79 | ) | | | 0.4 | % |
| SPXW 07/31/24 P5050 Index | | | 908 | | | Short | | | (78 | ) | | | 0.4 | % |
| SPX 08/16/24 P4550 Index | | | 889 | | | Long | | | (76 | ) | | | 0.4 | % |
| SPX 09/20/24 P4350 Index | | | 874 | | | Long | | | (75 | ) | | | 0.4 | % |
| SPXW 07/26/24 P5000 Index | | | 870 | | | Short | | | (75 | ) | | | 0.4 | % |
| SPXW 07/26/24 P5150 Index | | | 860 | | | Short | | | (74 | ) | | | 0.4 | % |
| SPX 08/16/24 P4500 Index | | | 834 | | | Long | | | (72 | ) | | | 0.4 | % |
| SPX 09/20/24 P4300 Index | | | 828 | | | Long | | | (71 | ) | | | 0.4 | % |
| SPX 09/20/24 P4250 Index | | | 789 | | | Long | | | (68 | ) | | | 0.4 | % |
| SPX 08/16/24 P4450 Index | | | 780 | | | Long | | | (67 | ) | | | 0.4 | % |
| SPX 09/20/24 P4200 Index | | | 751 | | | Long | | | (65 | ) | | | 0.4 | % |
| SPXW 07/26/24 P4850 Index | | | 749 | | | Long | | | (64 | ) | | | 0.4 | % |
| SPX 08/16/24 P4400 Index | | | 738 | | | Long | | | (63 | ) | | | 0.4 | % |
| Other Components | | | 31,530 | | | — | | | (2,710 | ) | | | 15.1 | % |
| Total | | | | | | | | | (17,903 | ) | | | 100.0 | % |
| * | The following table shows the individual positions and related values of the securities within the GSVIKGTRS (GS Credit Volatility Carry Global Series 5, Credit) basket. |
| Security description | | Notional
Value | | | Long
Short | | Unrealized
Appreciation/
(Depreciation) | | | % of basket | |
| ITXEB541 Corp | | $ | 2,754,504 | | | Long | | | 88 | | | | 8.3 | % |
| (CDX.NA.IG.42-V1.5Y 17Jul24 55 Payer) | | | 1,504,745 | | | Short | | | 48 | | | | 4.6 | % |
| (CDX.NA.IG.42-V1.5Y 17Jul24 50 Receiver) | | | 1,373,435 | | | Short | | | 44 | | | | 4.2 | % |
| (CDX.NA.IG.42-V1.5Y 17Jul24 57.5 Payer) | | | 1,300,440 | | | Short | | | 42 | | | | 3.9 | % |
| (CDX.NA.IG.42-V1.5Y 17Jul24 52.5 Payer) | | | 1,225,049 | | | Short | | | 39 | | | | 3.7 | % |
| (CDX.NA.IG.42-V1.5Y 17Jul24 47.5 Receiver) | | | 1,174,986 | | | Short | | | 38 | | | | 3.6 | % |
| CDXIG542 Corp | | | 1,148,689 | | | Long | | | 37 | | | | 3.5 | % |
| (iTraxx Europe.41-V1.5Y 17Jul24 50 Receiver) | | | 1,088,255 | | | Short | | | 35 | | | | 3.3 | % |
| (iTraxx Europe.41-V1.5Y 17Jul24 57.5 Payer) | | | 1,016,860 | | | Short | | | 33 | | | | 3.1 | % |
| (iTraxx Europe.41-V1.5Y 17Jul24 55 Payer) | | | 997,051 | | | Short | | | 32 | | | | 3.0 | % |
| (iTraxx Europe.41-V1.5Y 17Jul24 47.5 Receiver) | | | 703,266 | | | Short | | | 23 | | | | 2.1 | % |
| (iTraxx Europe.41-V1.5Y 17Jul24 52.5 Receiver) | | | 659,101 | | | Short | | | 21 | | | | 2.0 | % |
| (iTraxx Europe.41-V1.5Y 17Jul24 60 Payer) | | | 646,534 | | | Short | | | 21 | | | | 2.0 | % |
| (CDX.NA.IG.42-V1.5Y 21Aug24 50 Receiver) | | | 638,323 | | | Short | | | 20 | | | | 1.9 | % |
| (CDX.NA.IG.42-V1.5Y 21Aug24 52.5 Receiver) | | | 608,119 | | | Short | | | 19 | | | | 1.8 | % |
| (CDX.NA.IG.42-V1.5Y 21Aug24 60 Payer) | | | 596,091 | | | Short | | | 19 | | | | 1.8 | % |
See Notes to Financial Statements.
Simplify Multi-QIS Alternative ETF
Schedule of Investments (Continued)
June 30, 2024
| Security description | | Notional
Value | | | Long
Short | | Unrealized
Appreciation/
(Depreciation) | | | % of basket | |
| (iTraxx Europe.41-V1.5Y 17Jul24 52.5 Payer) | | | 487,113 | | | Short | | | 16 | | | | 1.5 | % |
| (CDX.NA.IG.42-V1.5Y 21Aug24 62.5 Payer) | | | 476,408 | | | Short | | | 15 | | | | 1.4 | % |
| (iTraxx Europe.41-V1.5Y 21Aug24 60 Receiver) | | | 449,322 | | | Short | | | 14 | | | | 1.4 | % |
| (iTraxx Europe.41-V1.5Y 21Aug24 62.5 Receiver) | | | 431,540 | | | Short | | | 14 | | | | 1.3 | % |
| ITXEX541 Corp | | | 425,021 | | | Long | | | 14 | | | | 1.3 | % |
| (CDX.NA.IG.42-V1.5Y 17Jul24 60 Payer) | | | 410,309 | | | Short | | | 13 | | | | 1.2 | % |
| (iTraxx Europe.41-V1.5Y 21Aug24 70 Payer) | | | 397,795 | | | Short | | | 13 | | | | 1.2 | % |
| (iTraxx Europe.41-V1.5Y 17Jul24 62.5 Payer) | | | 376,969 | | | Short | | | 12 | | | | 1.1 | % |
| (iTraxx Europe.41-V1.5Y 17Jul24 65 Payer) | | | 369,994 | | | Short | | | 12 | | | | 1.1 | % |
| (CDX.NA.IG.42-V1.5Y 21Aug24 57.5 Payer) | | | 361,662 | | | Short | | | 12 | | | | 1.1 | % |
| (iTraxx Europe.41-V1.5Y 21Aug24 65 Payer) | | | 360,322 | | | Short | | | 12 | | | | 1.1 | % |
| (CDX.NA.IG.42-V1.5Y 17Jul24 45 Receiver) | | | 359,816 | | | Short | | | 12 | | | | 1.1 | % |
| (iTraxx Europe.41-V1.5Y 21Aug24 57.5 Receiver) | | | 357,811 | | | Short | | | 11 | | | | 1.1 | % |
| (CDX.NA.IG.42-V1.5Y 21Aug24 47.5 Receiver) | | | 352,142 | | | Short | | | 11 | | | | 1.1 | % |
| (CDX.NA.IG.42-V1.5Y 21Aug24 55 Payer) | | | 352,142 | | | Short | | | 11 | | | | 1.1 | % |
| (CDX.NA.HY.42-V1.5Y 17Jul24 106.75 Receiver) | | | 343,218 | | | Short | | | 11 | | | | 1.0 | % |
| (iTraxx Europe.41-V1.5Y 17Jul24 57.5 Receiver) | | | 320,094 | | | Short | | | 10 | | | | 1.0 | % |
| (CDX.NA.HY.42-V1.5Y 17Jul24 106.5 Receiver) | | | 309,663 | | | Short | | | 10 | | | | 0.9 | % |
| (iTraxx Europe.41-V1.5Y 17Jul24 60 Receiver) | | | 307,996 | | | Short | | | 10 | | | | 0.9 | % |
| (iTraxx Europe.41-V1.5Y 21Aug24 75 Payer) | | | 303,262 | | | Short | | | 10 | | | | 0.9 | % |
| (iTraxx Europe XOver.41-V1.5Y 17Jul24 287.5 Receiver) | | | 295,813 | | | Short | | | 9 | | | | 0.9 | % |
| (CDX.NA.IG.42-V1.5Y 17Jul24 52.5 Receiver) | | | 291,543 | | | Short | | | 9 | | | | 0.9 | % |
| (iTraxx Europe XOver.41-V1.5Y 17Jul24 325 Payer) | | | 290,961 | | | Short | | | 9 | | | | 0.9 | % |
| (CDX.NA.IG.42-V1.5Y 21Aug24 55 Receiver) | | | 286,181 | | | Short | | | 9 | | | | 0.9 | % |
| (CDX.NA.HY.42-V1.5Y 17Jul24 105.75 Payer) | | | 281,670 | | | Short | | | 9 | | | | 0.9 | % |
| (iTraxx Europe XOver.41-V1.5Y 17Jul24 312.5 Payer) | | | 256,322 | | | Short | | | 8 | | | | 0.8 | % |
| (iTraxx Europe.41-V1.5Y 17Jul24 55 Receiver) | | | 248,762 | | | Short | | | 8 | | | | 0.8 | % |
| (iTraxx Europe.41-V1.5Y 17Jul24 67.5 Payer) | | | 240,452 | | | Short | | | 8 | | | | 0.7 | % |
| (iTraxx Europe XOver.41-V1.5Y 17Jul24 275 Receiver) | | | 232,027 | | | Short | | | 7 | | | | 0.7 | % |
| (CDX.NA.HY.42-V1.5Y 17Jul24 106.25 Receiver) | | | 222,071 | | | Short | | | 7 | | | | 0.7 | % |
| (iTraxx Europe XOver.41-V1.5Y 17Jul24 337.5 Payer) | | | 219,566 | | | Short | | | 7 | | | | 0.7 | % |
See Notes to Financial Statements.
Simplify Multi-QIS Alternative ETF
Schedule of Investments (Continued)
June 30, 2024
| Security description | | Notional
Value | | | Long
Short | | Unrealized
Appreciation/
(Depreciation) | | | % of basket | |
| (iTraxx Europe XOver.41-V1.5Y 17Jul24 300 Receiver) | | | 212,855 | | | Short | | | 7 | | | | 0.6 | % |
| (CDX.NA.HY.42-V1.5Y 17Jul24 105.25 Payer) | | | 207,987 | | | Short | | | 7 | | | | 0.6 | % |
| CXPHY542 Corp | | | 194,122 | | | Short | | | 6 | | | | 0.6 | % |
| Other Components | | | 4,575,026 | | | — | | | 147 | | | | 13.8 | % |
| Total | | | | | | | | | 1,059 | | | | 100.0 | % |
| * | The following table shows the individual positions and related values of the securities within the GSVIKTRS (GS Credit Volatility Carry US HY Series 5, Credit) basket. |
| Security description | | Notional
Value | | | Long
Short | | Unrealized
Appreciation/
(Depreciation) | | | % of basket | |
| HYG 07/19/24 P77 Equity | | $ | 35,112 | | | Short | | | 13,167 | | | | 27.8 | % |
| HYG 08/16/24 P77 Equity | | | 22,515 | | | Short | | | 8,443 | | | | 17.9 | % |
| HYG 07/01/24 77.5 Equity | | | 17,099 | | | Short | | | 6,412 | | | | 13.6 | % |
| HYG 07/19/24 C77 Equity | | | 14,187 | | | Short | | | 5,320 | | | | 11.3 | % |
| HYG 08/16/24 C77 Equity | | | 8,554 | | | Short | | | 3,208 | | | | 6.8 | % |
| HYG 08/16/24 P76 Equity | | | 7,837 | | | Short | | | 2,939 | | | | 6.2 | % |
| HYG 07/19/24 P76 Equity | | | 5,005 | | | Short | | | 1,877 | | | | 4.0 | % |
| HYG 08/16/24 C78 Equity | | | 2,944 | | | Short | | | 1,104 | | | | 2.3 | % |
| HYG 07/01/24 77 Equity | | | 2,823 | | | Short | | | 1,059 | | | | 2.2 | % |
| HYG 09/20/24 P77 Equity | | | 1,725 | | | Short | | | 647 | | | | 1.4 | % |
| HYG 07/19/24 P77.5 Equity | | | 1,494 | | | Short | | | 560 | | | | 1.2 | % |
| HYG 07/19/24 C77.5 Equity | | | 1,383 | | | Short | | | 519 | | | | 1.1 | % |
| HYG 07/19/24 C78 Equity | | | 1,358 | | | Short | | | 509 | | | | 1.1 | % |
| HYG 07/19/24 C76 Equity | | | 1,009 | | | Short | | | 378 | | | | 0.8 | % |
| HYG 07/19/24 P76.5 Equity | | | 918 | | | Short | | | 344 | | | | 0.7 | % |
| HYG 09/20/24 P76 Equity | | | 724 | | | Short | | | 271 | | | | 0.6 | % |
| HYG 09/20/24 C77 Equity | | | 549 | | | Short | | | 206 | | | | 0.4 | % |
| HYG 09/20/24 C78 Equity | | | 354 | | | Short | | | 133 | | | | 0.3 | % |
| HYG 07/19/24 P75 Equity | | | 259 | | | Short | | | 97 | | | | 0.2 | % |
| HYG 08/16/24 P75 Equity | | | 229 | | | Short | | | 86 | | | | 0.2 | % |
| HYG 07/19/24 P74 Equity | | | 2 | | | Short | | | 1 | | | | 0.0 | % |
| Total | | | | | | | | | 47,280 | | | | 100.0 | % |
The following table shows the individual positions and related values of the securities within the GSVLFTRS (GS USD Swaption Forward Volatility, Fixed Income) basket.
| Security description | | Notional
Value | | | Long
Short | | Unrealized
Appreciation/
(Depreciation) | | | % of basket | |
| SWO Put USD 14Jul27 404 17Apr24 5y | | $ | 10,336,614 | | | Long | | | 4,543 | | | | 2.8 | % |
| SWO Call USD 14Jul27 404 17Apr24 5y | | | 10,336,614 | | | Long | | | 4,543 | | | | 2.8 | % |
| SWP USD5y 170424140727 0.0404 | | | 9,812,286 | | | Short | | | 4,313 | | | | 2.7 | % |
| SWP USD5y 030424250631 0.0391 | | | 8,448,721 | | | Short | | | 3,713 | | | | 2.2 | % |
| SWO Put USD 23Jul31 416 1May24 5y | | | 7,306,758 | | | Long | | | 3,212 | | | | 2.0 | % |
| SWO Put USD 31Jul24 431 1May24 7y | | | 7,306,758 | | | Long | | | 3,212 | | | | 2.0 | % |
| SWO Call USD 23Jul31 416 1May24 5y | | | 7,306,758 | | | Long | | | 3,212 | | | | 2.0 | % |
| SWO Call USD 31Jul24 431 1May24 7y | | | 7,306,758 | | | Long | | | 3,212 | | | | 2.0 | % |
See Notes to Financial Statements.
Simplify Multi-QIS Alternative ETF
Schedule of Investments (Continued)
June 30, 2024
| Security description | | Notional
Value | | | Long
Short | | Unrealized
Appreciation/
(Depreciation) | | | % of basket | |
| SWP USD5y 010524230731 0.0416 | | | 7,296,022 | | | Short | | | 3,207 | | | | 2.0 | % |
| SWO Put USD 17Jul24 426 17Apr24 7y | | | 6,925,531 | | | Short | | | 3,044 | | | | 1.9 | % |
| SWO Put USD 17Jul24 472 17Apr24 2y | | | 6,925,531 | | | Long | | | 3,044 | | | | 1.9 | % |
| SWO Call USD 17Jul24 426 17Apr24 7y | | | 6,925,531 | | | Short | | | 3,044 | | | | 1.9 | % |
| SWO Call USD 17Jul24 472 17Apr24 2y | | | 6,925,531 | | | Long | | | 3,044 | | | | 1.9 | % |
| SWO Put USD 25Jun31 391 3Apr24 5y | | | 6,844,526 | | | Long | | | 3,008 | | | | 1.8 | % |
| SWO Call USD 3Jul24 396 3Apr24 7y | | | 6,844,526 | | | Long | | | 3,008 | | | | 1.8 | % |
| SWO Call USD 25Jun31 391 3Apr24 5y | | | 6,844,526 | | | Long | | | 3,008 | | | | 1.8 | % |
| SWO Put USD 3Jul24 396 3Apr24 7y | | | 6,844,526 | | | Long | | | 3,008 | | | | 1.8 | % |
| SWO Put USD 31Jul24 426 1May24 10y | | | 4,384,055 | | | Short | | | 1,927 | | | | 1.2 | % |
| SWO Call USD 31Jul24 426 1May24 10y | | | 4,384,055 | | | Short | | | 1,927 | | | | 1.2 | % |
| SWO Call USD 3Jul24 394 3Apr24 10y | | | 4,106,715 | | | Short | | | 1,805 | | | | 1.1 | % |
| SWO Put USD 3Jul24 394 3Apr24 10y | | | 4,106,715 | | | Short | | | 1,805 | | | | 1.1 | % |
| SWO Put USD 14Aug24 402 15May24 20y | | | 3,949,686 | | | Short | | | 1,736 | | | | 1.0 | % |
| SWO Put USD 14Aug24 405 15May24 10y | | | 3,949,686 | | | Long | | | 1,736 | | | | 1.0 | % |
| SWO Call USD 2Aug34 398 15May24 10y | | | 3,949,686 | | | Long | | | 1,736 | | | | 1.0 | % |
| SWO Call USD 14Aug24 402 15May24 20y | | | 3,949,686 | | | Short | | | 1,736 | | | | 1.0 | % |
| SWO Call USD 14Aug24 405 15May24 10y | | | 3,949,686 | | | Long | | | 1,736 | | | | 1.0 | % |
| SWO Put USD 2Aug34 398 15May24 10y | | | 3,949,686 | | | Long | | | 1,736 | | | | 1.0 | % |
| SWO Put USD 23Aug34 389 5Jun24 10y | | | 3,866,802 | | | Long | | | 1,700 | | | | 1.0 | % |
| SWO Call USD 4Sep24 392 5Jun24 20y | | | 3,866,802 | | | Short | | | 1,700 | | | | 1.0 | % |
| SWO Call USD 4Sep24 394 5Jun24 10y | | | 3,866,802 | | | Long | | | 1,700 | | | | 1.0 | % |
| SWO Call USD 23Aug34 389 5Jun24 10y | | | 3,866,802 | | | Long | | | 1,700 | | | | 1.0 | % |
| SWO Put USD 4Sep24 392 5Jun24 20y | | | 3,866,802 | | | Short | | | 1,699 | | | | 1.0 | % |
| SWO Put USD 4Sep24 394 5Jun24 10y | | | 3,866,802 | | | Long | | | 1,699 | | | | 1.0 | % |
| SWO Put USD 26Jul34 393 8May24 10y | | | 3,864,229 | | | Long | | | 1,698 | | | | 1.0 | % |
| SWO Call USD 7Aug24 398 8May24 20y | | | 3,864,229 | | | Short | | | 1,698 | | | | 1.0 | % |
| SWO Call USD 7Aug24 401 8May24 10y | | | 3,864,229 | | | Long | | | 1,698 | | | | 1.0 | % |
| SWO Call USD 26Jul34 393 8May24 10y | | | 3,864,229 | | | Long | | | 1,698 | | | | 1.0 | % |
| SWO Put USD 7Aug24 398 8May24 20y | | | 3,864,229 | | | Short | | | 1,698 | | | | 1.0 | % |
| SWO Put USD 7Aug24 401 8May24 10y | | | 3,864,229 | | | Long | | | 1,698 | | | | 1.0 | % |
| SWO Put USD 10Jul24 392 10Apr24 20y | | | 3,839,634 | | | Short | | | 1,688 | | | | 1.0 | % |
| SWO Put USD 10Jul24 395 10Apr24 10y | | | 3,839,634 | | | Long | | | 1,688 | | | | 1.0 | % |
| SWO Put USD 28Jun34 388 10Apr24 10y | | | 3,839,634 | | | Long | | | 1,688 | | | | 1.0 | % |
| SWO Call USD 10Jul24 392 10Apr24 20y | | | 3,839,634 | | | Short | | | 1,688 | | | | 1.0 | % |
| SWO Call USD 10Jul24 395 10Apr24 10y | | | 3,839,634 | | | Long | | | 1,688 | | | | 1.0 | % |
| SWO Call USD 28Jun34 388 10Apr24 10y | | | 3,839,634 | | | Long | | | 1,688 | | | | 1.0 | % |
| SWP USD10y 150524020834 0.0398 | | | 3,639,898 | | | Short | | | 1,600 | | | | 1.0 | % |
See Notes to Financial Statements.
Simplify Multi-QIS Alternative ETF
Schedule of Investments (Continued)
June 30, 2024
| Security description | | Notional
Value | | | Long
Short | | Unrealized
Appreciation/
(Depreciation) | | | % of basket | |
| SWO Put USD 17Jul24 422 17Apr24 10y | | | 3,411,082 | | | Short | | | 1,499 | | | | 0.9 | % |
| SWO Put USD 17Jul24 434 17Apr24 5y | | | 3,411,082 | | | Long | | | 1,499 | | | | 0.9 | % |
| SWO Call USD 17Jul24 422 17Apr24 10y | | | 3,411,082 | | | Short | | | 1,499 | | | | 0.9 | % |
| SWO Call USD 17Jul24 434 17Apr24 5y | | | 3,411,082 | | | Long | | | 1,499 | | | | 0.9 | % |
| Other Components | | | 118,531,830 | | | — | | | 52,098 | | | | 31.5 | % |
| Total | | | | | | | | | 165,463 | | | | 100.0 | % |
The following table shows the individual positions and related values of the securities within the MSSIJNK1A (Morgan Stanley Custom Junk Index, Equity) basket.
| Security description | | Notional
Value | | | Long
Short | | Unrealized
Appreciation/
(Depreciation) | | | % of basket | |
| Alnylam Pharmaceuticals Inc. | | $ | (302,978 | ) | | — | | | (4,151 | ) | | | 1.5 | % |
| AT&T Inc. | | | (271,341 | ) | | — | | | (3,717 | ) | | | 1.4 | % |
| Carnival Corp. | | | (244,374 | ) | | — | | | (3,348 | ) | | | 1.2 | % |
| Norwegian Cruise Line Holdings | | | (224,755 | ) | | — | | | (3,079 | ) | | | 1.1 | % |
| CVS Health Corp. | | | (221,587 | ) | | — | | | (3,036 | ) | | | 1.1 | % |
| Caesars Entertainment Inc. | | | (219,990 | ) | | — | | | (3,014 | ) | | | 1.1 | % |
| Charter Communications Inc. | | | (219,758 | ) | | — | | | (3,011 | ) | | | 1.1 | % |
| Driven Brands Holdings Inc. | | | (218,472 | ) | | — | | | (2,993 | ) | | | 1.1 | % |
| Whirlpool Corp. | | | (218,049 | ) | | — | | | (2,987 | ) | | | 1.1 | % |
| Nexstar Media Group Inc. | | | (214,918 | ) | | — | | | (2,944 | ) | | | 1.1 | % |
| Spirit AeroSystems Holdings In | | | (213,437 | ) | | — | | | (2,924 | ) | | | 1.1 | % |
| Hertz Global Holdings Inc. | | | (213,009 | ) | | — | | | (2,918 | ) | | | 1.1 | % |
| Petco Health & Wellness Co Inc. | | | (212,807 | ) | | — | | | (2,916 | ) | | | 1.1 | % |
| Viatris Inc. | | | (212,062 | ) | | — | | | (2,905 | ) | | | 1.1 | % |
| Concentrix Corp. | | | (211,972 | ) | | — | | | (2,904 | ) | | | 1.1 | % |
| Warner Bros Discovery Inc. | | | (211,361 | ) | | — | | | (2,896 | ) | | | 1.1 | % |
| APA Corp. | | | (210,814 | ) | | — | | | (2,888 | ) | | | 1.1 | % |
| ZoomInfo Technologies Inc. | | | (208,743 | ) | | — | | | (2,860 | ) | | | 1.1 | % |
| Paramount Global | | | (208,417 | ) | | — | | | (2,855 | ) | | | 1.1 | % |
| Alcoa Corp. | | | (208,287 | ) | | — | | | (2,854 | ) | | | 1.0 | % |
| Mosaic Co/The | | | (208,148 | ) | | — | | | (2,852 | ) | | | 1.0 | % |
| DXC Technology Co. | | | (208,040 | ) | | — | | | (2,850 | ) | | | 1.0 | % |
| Frontier Communications Parent | | | (207,704 | ) | | — | | | (2,846 | ) | | | 1.0 | % |
| Kohl’s Corp. | | | (207,653 | ) | | — | | | (2,845 | ) | | | 1.0 | % |
| ADT Inc. | | | (207,649 | ) | | — | | | (2,845 | ) | | | 1.0 | % |
| GXO Logistics Inc. | | | (207,267 | ) | | — | | | (2,840 | ) | | | 1.0 | % |
| Penn Entertainment Inc. | | | (206,636 | ) | | — | | | (2,831 | ) | | | 1.0 | % |
| FMC Corp. | | | (205,596 | ) | | — | | | (2,817 | ) | | | 1.0 | % |
| Darling Ingredients Inc. | | | (205,110 | ) | | — | | | (2,810 | ) | | | 1.0 | % |
| Air Lease Corp. | | | (205,078 | ) | | — | | | (2,810 | ) | | | 1.0 | % |
| Sotera Health Co. | | | (204,690 | ) | | — | | | (2,804 | ) | | | 1.0 | % |
| Macy’s Inc. | | | (204,571 | ) | | — | | | (2,803 | ) | | | 1.0 | % |
| Ryder System Inc. | | | (203,550 | ) | | — | | | (2,789 | ) | | | 1.0 | % |
| Kyndryl Holdings Inc. | | | (203,503 | ) | | — | | | (2,788 | ) | | | 1.0 | % |
| Southwest Airlines Co. | | | (202,953 | ) | | — | | | (2,781 | ) | | | 1.0 | % |
| Vestis Corp. | | | (202,877 | ) | | — | | | (2,779 | ) | | | 1.0 | % |
| Lumentum Holdings Inc. | | | (202,167 | ) | | — | | | (2,770 | ) | | | 1.0 | % |
| MGM Resorts International | | | (201,644 | ) | | — | | | (2,763 | ) | | | 1.0 | % |
See Notes to Financial Statements.
Simplify Multi-QIS Alternative ETF
Schedule of Investments (Continued)
June 30, 2024
| Security description | | Notional
Value | | | Long
Short | | Unrealized
Appreciation/
(Depreciation) | | | % of basket | |
| Delta Air Lines Inc. | | | (201,444 | ) | | — | | | (2,760 | ) | | | 1.0 | % |
| NCR Voyix Corp. | | | (200,862 | ) | | — | | | (2,752 | ) | | | 1.0 | % |
| Travel + Leisure Co. | | | (199,762 | ) | | — | | | (2,737 | ) | | | 1.0 | % |
| Organon & Co. | | | (198,984 | ) | | — | | | (2,726 | ) | | | 1.0 | % |
| American Airlines Group Inc. | | | (198,259 | ) | | — | | | (2,716 | ) | | | 1.0 | % |
| Scotts Miracle-Gro Co/The | | | (198,152 | ) | | — | | | (2,715 | ) | | | 1.0 | % |
| United Airlines Holdings Inc. | | | (197,346 | ) | | — | | | (2,704 | ) | | | 1.0 | % |
| Baxter International Inc. | | | (196,928 | ) | | — | | | (2,698 | ) | | | 1.0 | % |
| ICU Medical Inc. | | | (196,643 | ) | | — | | | (2,694 | ) | | | 1.0 | % |
| Integra LifeSciences Holdings | | | (196,431 | ) | | — | | | (2,691 | ) | | | 1.0 | % |
| RingCentral Inc. | | | (196,155 | ) | | — | | | (2,687 | ) | | | 1.0 | % |
| DaVita Inc. | | | (195,217 | ) | | — | | | (2,675 | ) | | | 1.0 | % |
| Other Components | | | (9,301,161 | ) | | — | | | (127,428 | ) | | | 46.9 | % |
| Total | | | | | | | | | (271,804 | ) | | | 100.0 | % |
| * | The following table shows the individual positions and related values of the securities within the MSSIQUA1A (Morgan Stanley Custom Quality Index, Equity) basket. |
| Security description | | Notional
Value | | | Long
Short | | Unrealized
Appreciation/
(Depreciation) | | | % of basket | |
| Cheniere Energy Inc. | | $ | 258,132 | | | — | | | (3,007 | ) | | | 1.1 | % |
| Intuit Inc. | | | 250,045 | | | — | | | (2,912 | ) | | | 1.1 | % |
| Sirius XM Holdings Inc. | | | 245,842 | | | — | | | (2,864 | ) | | | 1.1 | % |
| Adobe Inc. | | | 245,459 | | | — | | | (2,859 | ) | | | 1.1 | % |
| Rockwell Automation Inc. | | | 243,284 | | | — | | | (2,834 | ) | | | 1.1 | % |
| Manhattan Associates Inc. | | | 243,277 | | | — | | | (2,834 | ) | | | 1.1 | % |
| Accenture PLC | | | 243,202 | | | — | | | (2,833 | ) | | | 1.1 | % |
| Cisco Systems Inc. | | | 238,888 | | | — | | | (2,783 | ) | | | 1.0 | % |
| Cognizant Technology Solutions | | | 238,334 | | | — | | | (2,776 | ) | | | 1.0 | % |
| UnitedHealth Group Inc. | | | 238,316 | | | — | | | (2,776 | ) | | | 1.0 | % |
| Gaming and Leisure Properties | | | 237,454 | | | — | | | (2,766 | ) | | | 1.0 | % |
| S&P Global Inc. | | | 235,853 | | | — | | | (2,747 | ) | | | 1.0 | % |
| Nasdaq Inc. | | | 234,989 | | | — | | | (2,737 | ) | | | 1.0 | % |
| Antero Midstream Corp. | | | 234,950 | | | — | | | (2,737 | ) | | | 1.0 | % |
| SS&C Technologies Holdings Inc. | | | 234,817 | | | — | | | (2,735 | ) | | | 1.0 | % |
| Alliant Energy Corp. | | | 234,209 | | | — | | | (2,728 | ) | | | 1.0 | % |
| LKQ Corp. | | | 234,108 | | | — | | | (2,727 | ) | | | 1.0 | % |
| EastGroup Properties Inc. | | | 233,782 | | | — | | | (2,723 | ) | | | 1.0 | % |
| Grand Canyon Education Inc. | | | 233,698 | | | — | | | (2,722 | ) | | | 1.0 | % |
| NetApp Inc. | | | 233,458 | | | — | | | (2,719 | ) | | | 1.0 | % |
| Digital Realty Trust Inc. | | | 233,208 | | | — | | | (2,716 | ) | | | 1.0 | % |
| Elevance Health Inc. | | | 233,081 | | | — | | | (2,715 | ) | | | 1.0 | % |
| HF Sinclair Corp. | | | 232,946 | | | — | | | (2,713 | ) | | | 1.0 | % |
| Allegion plc | | | 232,920 | | | — | | | (2,713 | ) | | | 1.0 | % |
| STAG Industrial Inc. | | | 232,573 | | | — | | | (2,709 | ) | | | 1.0 | % |
| Sempra | | | 232,160 | | | — | | | (2,704 | ) | | | 1.0 | % |
| O’Reilly Automotive Inc. | | | 231,982 | | | — | | | (2,702 | ) | | | 1.0 | % |
| AbbVie Inc. | | | 231,820 | | | — | | | (2,700 | ) | | | 1.0 | % |
| Motorola Solutions Inc. | | | 231,815 | | | — | | | (2,700 | ) | | | 1.0 | % |
| AutoZone Inc. | | | 231,796 | | | — | | | (2,700 | ) | | | 1.0 | % |
| Booz Allen Hamilton Holding Co. | | | 231,167 | | | — | | | (2,693 | ) | | | 1.0 | % |
See Notes to Financial Statements.
Simplify Multi-QIS Alternative ETF
Schedule of Investments (Continued)
June 30, 2024
| Security description | | Notional
Value | | | Long
Short | | Unrealized
Appreciation/
(Depreciation) | | | % of basket | |
| Chemed Corp. | | | 231,050 | | | — | | | (2,691 | ) | | | 1.0 | % |
| Trimble Inc. | | | 231,033 | | | — | | | (2,691 | ) | | | 1.0 | % |
| Verisk Analytics Inc. | | | 230,962 | | | — | | | (2,690 | ) | | | 1.0 | % |
| Agree Realty Corp. | | | 230,744 | | | — | | | (2,688 | ) | | | 1.0 | % |
| Essential Utilities Inc. | | | 230,728 | | | — | | | (2,687 | ) | | | 1.0 | % |
| Intercontinental Exchange Inc. | | | 230,634 | | | — | | | (2,686 | ) | | | 1.0 | % |
| IDEX Corp. | | | 230,591 | | | — | | | (2,686 | ) | | | 1.0 | % |
| Cboe Global Markets Inc. | | | 230,285 | | | — | | | (2,682 | ) | | | 1.0 | % |
| Oracle Corp. | | | 230,085 | | | — | | | (2,680 | ) | | | 1.0 | % |
| Hershey Co/The | | | 229,808 | | | — | | | (2,677 | ) | | | 1.0 | % |
| Element Solutions Inc. | | | 229,755 | | | — | | | (2,676 | ) | | | 1.0 | % |
| Broadridge Financial Solutions | | | 229,281 | | | — | | | (2,671 | ) | | | 1.0 | % |
| Nordson Corp. | | | 229,222 | | | — | | | (2,670 | ) | | | 1.0 | % |
| Edison International | | | 229,214 | | | — | | | (2,670 | ) | | | 1.0 | % |
| First Industrial Realty Trust | | | 229,083 | | | — | | | (2,668 | ) | | | 1.0 | % |
| CACI International Inc. | | | 228,864 | | | — | | | (2,666 | ) | | | 1.0 | % |
| Omnicom Group Inc. | | | 228,533 | | | — | | | (2,662 | ) | | | 1.0 | % |
| Microsoft Corp. | | | 228,313 | | | — | | | (2,659 | ) | | | 1.0 | % |
| Fiserv Inc. | | | 228,189 | | | — | | | (2,658 | ) | | | 1.0 | % |
| Other Components | | | 11,076,519 | | | — | | | (129,016 | ) | | | 48.6 | % |
| Total | | | | | | | | | (265,457 | ) | | | 100.0 | % |
| * | The following table shows the individual positions and related values of the securities within the MQIS2TRS (Macquarie Cross Asset Trend Defensive with Non-Benchmark Commodities, Multi Assets) basket. |
| Security description | | Notional
Value | | | Long
Short | | Unrealized
Appreciation/
(Depreciation) | | | % of basket | |
| CNHUSD 07/17/2024 | | $ | 648,024 | | | Short | | | (4,066 | ) | | | 9.4 | % |
| US 10YR NOTE (CBT)Sep24 | | | 602,515 | | | Long | | | (3,781 | ) | | | 8.8 | % |
| EURO-SCHATZ FUT Sep24 | | | 492,419 | | | Long | | | (3,090 | ) | | | 7.2 | % |
| CAN 10YR BOND FUT Sep24 | | | 451,696 | | | Long | | | (2,834 | ) | | | 6.6 | % |
| IDRUSD 07/18/2024 | | | 399,337 | | | Short | | | (2,506 | ) | | | 5.8 | % |
| JPN 10Y BOND(OSE) Sep24 | | | 392,654 | | | Short | | | (2,464 | ) | | | 5.7 | % |
| MXNUSD 07/17/2024 | | | 291,951 | | | Short | | | (1,832 | ) | | | 4.2 | % |
| KRWUSD 07/18/2024 | | | 291,280 | | | Short | | | (1,828 | ) | | | 4.2 | % |
| BRLUSD 07/18/2024 | | | 286,475 | | | Short | | | (1,798 | ) | | | 4.2 | % |
| US 2YR NOTE (CBT) Sep24 | | | 283,469 | | | Long | | | (1,779 | ) | | | 4.1 | % |
| US 5YR NOTE (CBT) Sep24 | | | 259,151 | | | Long | | | (1,626 | ) | | | 3.8 | % |
| SGDUSD 07/17/2024 | | | 214,367 | | | Short | | | (1,345 | ) | | | 3.1 | % |
| ZARUSD 07/17/2024 | | | 187,786 | | | Long | | | (1,178 | ) | | | 2.7 | % |
| LONG GILT FUTURE Sep24 | | | 186,261 | | | Long | | | (1,169 | ) | | | 2.7 | % |
| EURO-BUND FUTURE Sep24 | | | 183,704 | | | Long | | | (1,153 | ) | | | 2.7 | % |
| EURO STOXX 50 Sep24 | | | 129,198 | | | Short | | | (811 | ) | | | 1.9 | % |
| TWDUSD 07/18/2024 | | | 107,509 | | | Short | | | (675 | ) | | | 1.6 | % |
| RED WHEAT FUT MGE Sep24 | | | 102,789 | | | Short | | | (645 | ) | | | 1.5 | % |
| LIVE CATTLE FUTR Aug24 | | | 99,803 | | | Long | | | (626 | ) | | | 1.5 | % |
| EURO-BOBL FUTURE Sep24 | | | 95,056 | | | Long | | | (596 | ) | | | 1.4 | % |
| LEAN HOGS FUTURE Aug24 | | | 91,282 | | | Short | | | (573 | ) | | | 1.3 | % |
| INRUSD 07/19/2024 | | | 88,449 | | | Long | | | (555 | ) | | | 1.3 | % |
| GOLD 100 OZ FUTR Aug24 | | | 66,596 | | | Short | | | (418 | ) | | | 1.0 | % |
| FCOJ-A FUTURE Sep24 | | | 63,916 | | | Long | | | (401 | ) | | | 0.9 | % |
See Notes to Financial Statements.
Simplify Multi-QIS Alternative ETF
Schedule of Investments (Continued)
June 30, 2024
| Security description | | Notional
Value | | | Long
Short | | Unrealized
Appreciation/
(Depreciation) | | | % of basket | |
| COFF ROBUSTA 10tn Sep24 | | | 58,476 | | | Long | | | (367 | ) | | | 0.9 | % |
| LME NICKEL FUTURE Sep24 | | | 42,105 | | | Short | | | (264 | ) | | | 0.6 | % |
| EUR | | | 42,098 | | | Short | | | — | | | | 0.6 | % |
| LME PRI ALUM FUTR Sep24 | | | 38,462 | | | Short | | | (241 | ) | | | 0.6 | % |
| PALLADIUM FUTURE Sep24 | | | 37,535 | | | Short | | | (236 | ) | | | 0.5 | % |
| LME LEAD FUTURE Sep24 | | | 35,752 | | | Short | | | (224 | ) | | | 0.5 | % |
| WHITE SUGAR (ICE) Oct24 | | | 35,356 | | | Long | | | (222 | ) | | | 0.5 | % |
| JPY | | | 34,603 | | | Short | | | — | | | | 0.5 | % |
| SOYBEAN FUTURE Nov24 | | | 32,674 | | | Short | | | (205 | ) | | | 0.5 | % |
| AUST 10Y BOND FUT Sep24 | | | 31,616 | | | Short | | | (198 | ) | | | 0.5 | % |
| LME COPPER FUTURE Sep24 | | | 31,090 | | | Short | | | (195 | ) | | | 0.5 | % |
| LME LEAD FUTURE Aug24 | | | 28,167 | | | Short | | | (177 | ) | | | 0.4 | % |
| NATURAL GAS FUTR Sep24 | | | 27,676 | | | Long | | | (174 | ) | | | 0.4 | % |
| SGX Iron Ore 62% Aug24 | | | 27,632 | | | Short | | | (173 | ) | | | 0.4 | % |
| ROUGH RICE (CBOT) Sep24 | | | 27,007 | | | Short | | | (169 | ) | | | 0.4 | % |
| MILL WHEAT EURO Sep24 | | | 25,836 | | | Short | | | (162 | ) | | | 0.4 | % |
| WHEAT FUTURE(CBT) Sep24 | | | 25,403 | | | Short | | | (159 | ) | | | 0.4 | % |
| CORN FUTURE Sep24 | | | 24,156 | | | Short | | | (152 | ) | | | 0.4 | % |
| SPI 200 FUTURES Sep24 | | | 22,215 | | | Short | | | (139 | ) | | | 0.3 | % |
| COFFEE ‘C’ FUTURE Sep24 | | | 19,716 | | | Long | | | (124 | ) | | | 0.3 | % |
| GASOLINE RBOB FUT Sep24 | | | 19,669 | | | Short | | | (123 | ) | | | 0.3 | % |
| OAT FUTURE Sep24 | | | 17,283 | | | Short | | | (108 | ) | | | 0.3 | % |
| SILVER FUTURE Sep24 | | | 17,087 | | | Long | | | (107 | ) | | | 0.2 | % |
| COCOA FUTURE - IC Sep24 | | | 15,723 | | | Short | | | (99 | ) | | | 0.2 | % |
| COTTON NO.2 FUTR Dec24 | | | 15,639 | | | Short | | | (98 | ) | | | 0.2 | % |
| PLATINUM FUTURE Oct24 | | | 14,478 | | | Long | | | (91 | ) | | | 0.2 | % |
| Other Components | | | 19,817 | | | — | | | (533 | ) | | | 1.6 | % |
| Total | | | | | | | | | (42,488 | ) | | | 100.0 | % |
| * | The following table shows the individual positions and related values of the securities within the MQIS6TRS (Macquarie FX Cross-Sectional Carry, Foreign Exchnage) basket. |
| Security description | | Notional
Value | | | Long
Short | | Unrealized
Appreciation/
(Depreciation) | | | % of basket | |
| JPYUSD 07/17/2024 | | $ | 3,978,067 | | | Short | | | 8,556 | | | | 12.4 | % |
| INRUSD 07/19/2024 | | | 3,329,527 | | | Long | | | 7,161 | | | | 10.4 | % |
| KRWUSD 07/18/2024 | | | 3,212,137 | | | Short | | | 6,909 | | | | 10.0 | % |
| CHFUSD 07/17/2024 | | | 3,148,982 | | | Short | | | 6,773 | | | | 9.8 | % |
| BRLUSD 07/18/2024 | | | 2,480,853 | | | Long | | | 5,336 | | | | 7.7 | % |
| IDRUSD 07/18/2024 | | | 2,216,027 | | | Long | | | 4,766 | | | | 6.9 | % |
| HUFUSD 07/17/2024 | | | 2,133,472 | | | Long | | | 4,589 | | | | 6.6 | % |
| CNHUSD 07/17/2024 | | | 2,033,661 | | | Short | | | 4,374 | | | | 6.3 | % |
| AUDUSD 07/17/2024 | | | 1,933,530 | | | Short | | | 4,159 | | | | 6.0 | % |
| ZARUSD 07/17/2024 | | | 1,885,357 | | | Long | | | 4,055 | | | | 5.9 | % |
| NZDUSD 07/17/2024 | | | 1,423,214 | | | Long | | | 3,061 | | | | 4.4 | % |
| SEKUSD 07/17/2024 | | | 1,341,230 | | | Short | | | 2,885 | | | | 4.2 | % |
| GBPUSD 07/17/2024 | | | 948,137 | | | Long | | | 2,039 | | | | 3.0 | % |
| CLPUSD 07/19/2024 | | | 906,717 | | | Long | | | 1,950 | | | | 2.8 | % |
See Notes to Financial Statements.
Simplify Multi-QIS Alternative ETF
Schedule of Investments (Continued)
June 30, 2024
| Security description | | Notional
Value | | | Long
Short | | Unrealized
Appreciation/
(Depreciation) | | | % of basket | |
| MXNUSD 07/17/2024 | | | 729,783 | | | Long | | | 1,570 | | | | 2.3 | % |
| NOKUSD 07/17/2024 | | | 361,637 | | | Short | | | 778 | | | | 1.1 | % |
| EURUSD 07/17/2024 | | | 33,234 | | | Short | | | 71 | | | | 0.1 | % |
| Total | | | | | | | | | 69,034 | | | | 100.0 | % |
| * | The following table shows the individual positions and related values of the securities within the MQISBTRS (Macquarie Fixed-Weights Cross Asset Basket, Multi Assets) basket. |
| Security description | | Notional
Value | | | Long
Short | | Unrealized
Appreciation/
(Depreciation) | | | % of basket | |
| GOLD 100 OZ FUTR Oct24 | | $ | 3,002,086 | | | Long | | | 8,804 | | | | 4.8 | % |
| LME COPPER FUTURE Jul24 | | | 2,638,557 | | | Short | | | 7,738 | | | | 4.2 | % |
| GOLD 100 OZ FUTR Aug24 | | | 1,618,853 | | | Long | | | 4,747 | | | | 2.6 | % |
| GOLD 100 OZ FUTR Dec24 | | | 1,513,930 | | | Long | | | 4,440 | | | | 2.4 | % |
| LME PRI ALUM FUTR Sep24 | | | 1,444,600 | | | Short | | | 4,236 | | | | 2.3 | % |
| CNHUSD 07/17/2024 | | | 1,301,176 | | | Short | | | 3,816 | | | | 2.1 | % |
| SOYBEAN FUTURE Nov24 | | | 1,149,772 | | | Short | | | 3,372 | | | | 1.8 | % |
| BRENT CRUDE FUTR Sep24 | | | 1,143,099 | | | Long | | | 3,352 | | | | 1.8 | % |
| GASOLINE RBOB FUT Sep24 | | | 1,114,757 | | | Short | | | 3,269 | | | | 1.8 | % |
| INRUSD 07/19/2024 | | | 1,066,634 | | | Long | | | 3,128 | | | | 1.7 | % |
| SOYBEAN FUTURE Mar25 | | | 1,058,828 | | | Long | | | 3,105 | | | | 1.7 | % |
| LME ZINC FUTURE Sep24 | | | 1,042,806 | | | Short | | | 3,058 | | | | 1.7 | % |
| CORN FUTURE Mar25 | | | 1,005,407 | | | Long | | | 2,948 | | | | 1.6 | % |
| WHEAT FUTURE(CBT) Sep24 | | | 994,749 | | | Short | | | 2,917 | | | | 1.6 | % |
| WTI CRUDE FUTURE Sep24 | | | 993,620 | | | Short | | | 2,914 | | | | 1.6 | % |
| COPPER FUTURE Mar25 | | | 984,375 | | | Long | | | 2,887 | | | | 1.6 | % |
| LIVE CATTLE FUTR Aug24 | | | 976,296 | | | Short | | | 2,863 | | | | 1.6 | % |
| LEAN HOGS FUTURE Aug24 | | | 957,688 | | | Short | | | 2,808 | | | | 1.5 | % |
| NATURAL GAS FUTR Sep24 | | | 884,627 | | | Short | | | 2,594 | | | | 1.4 | % |
| COPPER FUTURE Sep24 | | | 861,319 | | | Short | | | 2,526 | | | | 1.4 | % |
| LME PRI ALUM FUTR Mar25 | | | 850,480 | | | Long | | | 2,494 | | | | 1.4 | % |
| JPYUSD 07/17/2024 | | | 703,762 | | | Short | | | 2,064 | | | | 1.1 | % |
| CORN FUTURE Sep24 | | | 703,721 | | | Short | | | 2,064 | | | | 1.1 | % |
| KRWUSD 07/18/2024 | | | 696,494 | | | Short | | | 2,042 | | | | 1.1 | % |
| CHFUSD 07/17/2024 | | | 679,661 | | | Short | | | 1,993 | | | | 1.1 | % |
| LME COPPER FUTURE Aug24 | | | 651,871 | | | Short | | | 1,912 | | | | 1.0 | % |
| WHEAT FUTURE(CBT) Dec24 | | | 647,122 | | | Long | | | 1,898 | | | | 1.0 | % |
| COCOA FUTURE Dec24 | | | 622,689 | | | Short | | | 1,826 | | | | 1.0 | % |
| Low Su Gasoil G Jul24 | | | 617,231 | | | Long | | | 1,810 | | | | 1.0 | % |
| LME ZINC FUTURE Mar25 | | | 584,784 | | | Long | | | 1,715 | | | | 0.9 | % |
| Low Su Gasoil G Aug24 | | | 563,609 | | | Short | | | 1,653 | | | | 0.9 | % |
| SOYBEAN MEAL FUTR Dec24 | | | 548,775 | | | Short | | | 1,609 | | | | 0.9 | % |
| COCOA FUTURE Mar25 | | | 530,919 | | | Long | | | 1,557 | | | | 0.8 | % |
| ZARUSD 07/17/2024 | | | 506,223 | | | Long | | | 1,485 | | | | 0.8 | % |
| NATURAL GAS FUTR Mar25 | | | 505,718 | | | Long | | | 1,483 | | | | 0.8 | % |
| LIVE CATTLE FUTR Oct24 | | | 497,450 | | | Long | | | 1,459 | | | | 0.8 | % |
| BRLUSD 07/18/2024 | | | 493,282 | | | Long | | | 1,447 | | | | 0.8 | % |
| SUGAR #11 (WORLD) Mar25 | | | 488,878 | | | Long | | | 1,434 | | | | 0.8 | % |
| WTI CRUDE FUTURE Mar25 | | | 487,565 | | | Long | | | 1,430 | | | | 0.8 | % |
| NATURAL GAS FUTR Oct24 | | | 475,668 | | | Long | | | 1,395 | | | | 0.8 | % |
| GASOLINE RBOB FUT Oct24 | | | 474,394 | | | Long | | | 1,391 | | | | 0.8 | % |
| LME NICKEL FUTURE Sep24 | | | 462,733 | | | Short | | | 1,357 | | | | 0.7 | % |
See Notes to Financial Statements.
Simplify Multi-QIS Alternative ETF
Schedule of Investments (Continued)
June 30, 2024
| Security description | | Notional
Value | | | Long
Short | | Unrealized
Appreciation/
(Depreciation) | | | % of basket | |
| WTI CRUDE FUTURE Dec24 | | | 461,776 | | | Long | | | 1,354 | | | | 0.7 | % |
| COCOA FUTURE Sep24 | | | 458,160 | | | Short | | | 1,344 | | | | 0.7 | % |
| NATURAL GAS FUTR Feb25 | | | 456,905 | | | Long | | | 1,340 | | | | 0.7 | % |
| NATURAL GAS FUTR Jan25 | | | 456,851 | | | Short | | | 1,340 | | | | 0.7 | % |
| COFFEE ‘C’ FUTURE Mar25 | | | 448,987 | | | Long | | | 1,317 | | | | 0.7 | % |
| AUDUSD 07/17/2024 | | | 423,538 | | | Short | | | 1,242 | | | | 0.7 | % |
| SUGAR #11 (WORLD) Oct24 | | | 420,703 | | | Short | | | 1,234 | | | | 0.7 | % |
| LME NICKEL FUTURE Jul24 | | | 406,350 | | | Long | | | 1,192 | | | | 0.6 | % |
| Other Components | | | 20,680,420 | | | — | | | 60,640 | | | | 33.0 | % |
| Total | | | | | | | | | 184,039 | | | | 100.0 | % |
| * | The following table shows the individual positions and related values of the securities within the MSCBL3TRS (MS Crude Oil Long/Short Intraday Momentum 3, Commodity) basket. |
| Security description | | Notional
Value | | | Long
Short | | Unrealized
Appreciation/
(Depreciation) | | | % of basket | |
| USD Curncy | | $ | 1,897,448 | | | Long | | | — | | | | 100.0 | % |
| Total | | | | | | | | | 0 | | | | 100.0 | % |
| * | The following table shows the individual positions and related values of the securities within the MSCBUOTRS (MS MSCBUO01, Commodity) basket. |
| Security description | | Notional
Value | | | Long
Short | | Unrealized
Appreciation/
(Depreciation) | | | % of basket | |
| LNQ4 Comdty | | $ | 971,507 | | | Long | | | 7,116 | | | | 9.7 | % |
| LAQ24 Comdty | | | 926,328 | | | Short | | | 6,785 | | | | 9.3 | % |
| CLQ4 Comdty | | | 836,556 | | | Short | | | 6,128 | | | | 8.4 | % |
| QSQ4 Comdty | | | 706,555 | | | Short | | | 5,175 | | | | 7.1 | % |
| S X4 Comdty | | | 696,165 | | | Long | | | 5,099 | | | | 7.0 | % |
| XBQ4 Comdty | | | 574,369 | | | Long | | | 4,207 | | | | 5.7 | % |
| GCQ4 Comdty | | | 544,451 | | | Short | | | 3,988 | | | | 5.4 | % |
| PLV4 Comdty | | | 504,161 | | | Long | | | 3,693 | | | | 5.0 | % |
| COU4 Comdty | | | 503,140 | | | Long | | | 3,685 | | | | 5.0 | % |
| CTZ4 Comdty | | | 465,544 | | | Long | | | 3,410 | | | | 4.7 | % |
| KCU4 Comdty | | | 391,127 | | | Short | | | 2,865 | | | | 3.9 | % |
| CCU4 Comdty | | | 348,538 | | | Short | | | 2,553 | | | | 3.5 | % |
| LPQ24 Comdty | | | 207,935 | | | Short | | | 1,523 | | | | 2.1 | % |
| W U4 Comdty | | | 177,532 | | | Short | | | 1,300 | | | | 1.8 | % |
| C U4 Comdty | | | 176,753 | | | Long | | | 1,295 | | | | 1.8 | % |
| QWV4 Comdty | | | 165,953 | | | Long | | | 1,216 | | | | 1.7 | % |
| SIU4 Comdty | | | 164,051 | | | Short | | | 1,202 | | | | 1.6 | % |
| BOZ4 Comdty | | | 163,257 | | | Long | | | 1,196 | | | | 1.6 | % |
| KWU4 Comdty | | | 156,924 | | | Short | | | 1,149 | | | | 1.6 | % |
| PAU4 Comdty | | | 156,299 | | | Long | | | 1,145 | | | | 1.6 | % |
| HGU4 Comdty | | | 154,775 | | | Short | | | 1,134 | | | | 1.5 | % |
| LXQ4 Comdty | | | 150,385 | | | Long | | | 1,102 | | | | 1.5 | % |
| HOQ4 Comdty | | | 147,093 | | | Long | | | 1,077 | | | | 1.5 | % |
| FCQ4 Comdty | | | 135,324 | | | Short | | | 991 | | | | 1.4 | % |
| NGQ24 Comdty | | | 134,635 | | | Long | | | 986 | | | | 1.3 | % |
See Notes to Financial Statements.
Simplify Multi-QIS Alternative ETF
Schedule of Investments (Continued)
June 30, 2024
| Security description | | Notional
Value | | | Long
Short | | Unrealized
Appreciation/
(Depreciation) | | | % of basket | |
| LHQ4 Comdty | | | 131,460 | | | Long | | | 963 | | | | 1.3 | % |
| LLQ4 Comdty | | | 125,428 | | | Short | | | 919 | | | | 1.3 | % |
| SBV4 Comdty | | | 114,413 | | | Short | | | 838 | | | | 1.1 | % |
| SMZ4 Comdty | | | 50,583 | | | Short | | | 371 | | | | 0.5 | % |
| LCQ4 Comdty | | | 11,089 | | | Long | | | 81 | | | | 0.1 | % |
| Total | | | | | | | | | 73,192 | | | | 100.0 | % |
| * | The following table shows the individual positions and related values of the securities within the MSCFCETRS (MS FX EM Carry T1, Foreign Exchange) basket. |
| Security description | | Notional
Value | | | Long
Short | | Unrealized
Appreciation/
(Depreciation) | | | % of basket | |
| USD Curncy | | $ | 2,850,374 | | | Long | | | — | | | | 33.4 | % |
| MSCF1INR Index | | | 524,768 | | | Long | | | 2,341 | | | | 6.1 | % |
| MSCF1CNH Index | | | 522,826 | | | Short | | | 2,332 | | | | 6.1 | % |
| MSCF1ILS Index | | | 505,840 | | | Short | | | 2,256 | | | | 5.9 | % |
| MSCF1ZAR Index | | | 498,460 | | | Long | | | 2,223 | | | | 5.8 | % |
| MSCF1COP Index | | | 494,307 | | | Long | | | 2,205 | | | | 5.8 | % |
| MSCF1PEN Index | | | 489,781 | | | Short | | | 2,185 | | | | 5.7 | % |
| MSCF1IDR Index | | | 375,752 | | | Long | | | 1,676 | | | | 4.4 | % |
| MSCF1THB Index | | | 373,564 | | | Short | | | 1,666 | | | | 4.4 | % |
| MSCF1HUF Index | | | 306,581 | | | Long | | | 1,368 | | | | 3.6 | % |
| MSCF1CZK Index | | | 304,450 | | | Short | | | 1,358 | | | | 3.6 | % |
| MSCF1MXN Index | | | 246,713 | | | Long | | | 1,101 | | | | 2.9 | % |
| MSCF1CLP Index | | | 245,269 | | | Short | | | 1,094 | | | | 2.9 | % |
| MSCF1KRW Index | | | 225,515 | | | Short | | | 1,006 | | | | 2.6 | % |
| MSCF1PHP Index | | | 225,208 | | | Long | | | 1,005 | | | | 2.6 | % |
| MSCF1PLN Index | | | 102,159 | | | Long | | | 456 | | | | 1.2 | % |
| MSCF1RON Index | | | 101,704 | | | Short | | | 454 | | | | 1.2 | % |
| MSCF1SGD Index | | | 74,811 | | | Long | | | 334 | | | | 0.9 | % |
| MSCF1TWD Index | | | 74,474 | | | Short | | | 332 | | | | 0.9 | % |
| Total | | | | | | | | | 25,391 | | | | 100.0 | % |
| * | The following table shows the individual positions and related values of the securities within the MSCFVATRS (MS FX DM Value PPP – 1, Foreign Exchange) basket. |
| Security description | | Notional
Value | | | Long
Short | | Unrealized
Appreciation/
(Depreciation) | | | % of basket | |
| USD Curncy | | $ | 1,837,243 | | | Long | | | — | | | | 33.3 | % |
| MSCF1JPY | | | 733,675 | | | Long | | | (1,991 | ) | | | 13.3 | % |
| MSCF1CHF | | | 733,494 | | | Short | | | (1,990 | ) | | | 13.3 | % |
| MSCF1AUD | | | 552,784 | | | Short | | | (1,500 | ) | | | 10.0 | % |
| MSCF1NOK | | | 551,174 | | | Long | | | (1,496 | ) | | | 10.0 | % |
| MSCF1EUR | | | 367,630 | | | Long | | | (998 | ) | | | 6.7 | % |
| MSCF1NZD | | | 367,418 | | | Short | | | (997 | ) | | | 6.7 | % |
| MSCF1SEK | | | 183,975 | | | Long | | | (499 | ) | | | 3.3 | % |
| MSCF1GBP | | | 183,606 | | | Short | | | (498 | ) | | | 3.3 | % |
| Total | | | | | | | | | (9,969 | ) | | | 100.0 | % |
See Notes to Financial Statements.
Simplify Multi-QIS Alternative ETF
Schedule of Investments (Continued)
June 30, 2024
| * | The following table shows the individual positions and related values of the securities within the MSVCDDTRS (MS Defensive Calendar Equity Volatility Relative Value NDX Vega-Weighted Put-Only, Equity) basket. |
| Security description | | Notional
Value | | | Long
Short | | Unrealized
Appreciation/
(Depreciation) | | | % of basket | |
| USD Curncy | | | 4,224,788 | | | Long | | | — | | | | 98.5 | % |
| NDX UL 03/21/25 P14800 Index | | | 857 | | | Long | | | 161 | | | | 0.0 | % |
| NDX UL 03/21/25 P14600 Index | | | 813 | | | Long | | | 153 | | | | 0.0 | % |
| NDXP UL 07/05/24 P19810 Index | | | 804 | | | Short | | | 151 | | | | 0.0 | % |
| NDXP UL 07/05/24 P19800 Index | | | 779 | | | Short | | | 146 | | | | 0.0 | % |
| NDX UL 03/21/25 P14400 Index | | | 772 | | | Long | | | 145 | | | | 0.0 | % |
| NDXP UL 07/05/24 P19790 Index | | | 755 | | | Short | | | 142 | | | | 0.0 | % |
| NDX UL 03/21/25 P14200 Index | | | 733 | | | Long | | | 138 | | | | 0.0 | % |
| NDX UL 03/21/25 P14000 Index | | | 697 | | | Long | | | 131 | | | | 0.0 | % |
| NDXP UL 07/05/24 P19760 Index | | | 687 | | | Short | | | 129 | | | | 0.0 | % |
| NDX UL 03/21/25 P15000 Index | | | 678 | | | Long | | | 127 | | | | 0.0 | % |
| NDXP UL 07/05/24 P19750 Index | | | 665 | | | Short | | | 125 | | | | 0.0 | % |
| NDX UL 03/21/25 P13800 Index | | | 663 | | | Long | | | 124 | | | | 0.0 | % |
| NDXP UL 07/05/24 P19740 Index | | | 644 | | | Short | | | 121 | | | | 0.0 | % |
| NDX UL 03/21/25 P13600 Index | | | 631 | | | Long | | | 118 | | | | 0.0 | % |
| NDXP UL 07/05/24 P19820 Index | | | 621 | | | Short | | | 117 | | | | 0.0 | % |
| NDX UL 03/21/25 P13400 Index | | | 601 | | | Long | | | 113 | | | | 0.0 | % |
| NDX UL 03/21/25 P16000 Index | | | 594 | | | Long | | | 111 | | | | 0.0 | % |
| NDXP UL 07/05/24 P19710 Index | | | 582 | | | Short | | | 109 | | | | 0.0 | % |
| NDX UL 03/21/25 P15900 Index | | | 577 | | | Long | | | 108 | | | | 0.0 | % |
| NDX UL 03/21/25 P13200 Index | | | 573 | | | Long | | | 108 | | | | 0.0 | % |
| NDX UL 03/21/25 P16100 Index | | | 570 | | | Long | | | 107 | | | | 0.0 | % |
| NDXP UL 07/05/24 P19700 Index | | | 563 | | | Short | | | 106 | | | | 0.0 | % |
| NDX UL 03/21/25 P15800 Index | | | 562 | | | Long | | | 106 | | | | 0.0 | % |
| NDX UL 03/21/25 P16900 Index | | | 551 | | | Long | | | 104 | | | | 0.0 | % |
| NDXP UL 07/05/24 P19780 Index | | | 549 | | | Short | | | 103 | | | | 0.0 | % |
| NDX UL 03/21/25 P15700 Index | | | 547 | | | Long | | | 103 | | | | 0.0 | % |
| NDX UL 03/21/25 P13000 Index | | | 547 | | | Long | | | 103 | | | | 0.0 | % |
| NDXP UL 07/05/24 P19690 Index | | | 544 | | | Short | | | 102 | | | | 0.0 | % |
| NDX UL 03/21/25 P16200 Index | | | 541 | | | Long | | | 102 | | | | 0.0 | % |
| NDX UL 03/21/25 P16500 Index | | | 537 | | | Long | | | 101 | | | | 0.0 | % |
| NDX UL 03/21/25 P16800 Index | | | 537 | | | Long | | | 101 | | | | 0.0 | % |
| NDX UL 03/21/25 P15600 Index | | | 532 | | | Long | | | 100 | | | | 0.0 | % |
| NDXP UL 07/05/24 P19770 Index | | | 532 | | | Short | | | 100 | | | | 0.0 | % |
| NDX UL 03/21/25 P12800 Index | | | 522 | | | Long | | | 98 | | | | 0.0 | % |
| NDX UL 03/21/25 P16400 Index | | | 522 | | | Long | | | 98 | | | | 0.0 | % |
| NDX UL 03/21/25 P16700 Index | | | 522 | | | Long | | | 98 | | | | 0.0 | % |
| NDX UL 03/21/25 P15500 Index | | | 518 | | | Long | | | 97 | | | | 0.0 | % |
| NDX UL 03/21/25 P16300 Index | | | 508 | | | Long | | | 95 | | | | 0.0 | % |
| NDX UL 03/21/25 P16600 Index | | | 508 | | | Long | | | 95 | | | | 0.0 | % |
| NDX UL 03/21/25 P15400 Index | | | 504 | | | Long | | | 95 | | | | 0.0 | % |
| NDX UL 03/21/25 P12600 Index | | | 499 | | | Long | | | 94 | | | | 0.0 | % |
| NDX UL 03/21/25 P15300 Index | | | 490 | | | Long | | | 92 | | | | 0.0 | % |
| NDXP UL 07/05/24 P19660 Index | | | 490 | | | Short | | | 92 | | | | 0.0 | % |
| NDX UL 03/21/25 P12400 Index | | | 477 | | | Long | | | 90 | | | | 0.0 | % |
| NDX UL 03/21/25 P15200 Index | | | 477 | | | Long | | | 90 | | | | 0.0 | % |
| NDXP UL 07/05/24 P19650 Index | | | 472 | | | Short | | | 89 | | | | 0.0 | % |
| NDXP UL 07/05/24 P19730 Index | | | 467 | | | Short | | | 88 | | | | 0.0 | % |
| NDX UL 03/21/25 P15100 Index | | | 464 | | | Long | | | 87 | | | | 0.0 | % |
| NDX UL 03/21/25 P12200 Index | | | 457 | | | Long | | | 86 | | | | 0.0 | % |
See Notes to Financial Statements.
Simplify Multi-QIS Alternative ETF
Schedule of Investments (Continued)
June 30, 2024
| Security description | | Notional
Value | | | Long
Short | | Unrealized
Appreciation/
(Depreciation) | | | % of basket | |
| Other Components | | | 35,686 | | | — | | | 6,702 | | | | 0.8 | % |
| Total | | | | | | | | | 12,099 | | | | 100.0 | % |
| * | The following table shows the individual positions and related values of the securities within the MSVCDNTRS (MS Calendar Equity Volatility Relative Value NDX Vega-Weighted Put-Only, Equity) basket. |
| Security description | | Notional
Value | | | Long Short | | Unrealized
Appreciation/
(Depreciation) | | | % of basket | |
| USD Curncy | | | 10,336,471 | | | Long | | | — | | | | 99.2 | % |
| NDXP UL 07/05/24 P19810 Index | | | 1,897 | | | Short | | | 734 | | | | 0.0 | % |
| NDXP UL 07/05/24 P19800 Index | | | 1,840 | | | Short | | | 712 | | | | 0.0 | % |
| NDXP UL 07/05/24 P19790 Index | | | 1,784 | | | Short | | | 690 | | | | 0.0 | % |
| NDXP UL 07/05/24 P19760 Index | | | 1,622 | | | Short | | | 628 | | | | 0.0 | % |
| NDXP UL 07/05/24 P19750 Index | | | 1,570 | | | Short | | | 608 | | | | 0.0 | % |
| NDXP UL 07/05/24 P19740 Index | | | 1,519 | | | Short | | | 588 | | | | 0.0 | % |
| NDXP UL 07/05/24 P19820 Index | | | 1,467 | | | Short | | | 568 | | | | 0.0 | % |
| NDXP UL 07/05/24 P19710 Index | | | 1,375 | | | Short | | | 532 | | | | 0.0 | % |
| NDXP UL 07/05/24 P19700 Index | | | 1,329 | | | Short | | | 514 | | | | 0.0 | % |
| NDXP UL 07/05/24 P19780 Index | | | 1,296 | | | Short | | | 502 | | | | 0.0 | % |
| NDXP UL 07/05/24 P19690 Index | | | 1,284 | | | Short | | | 497 | | | | 0.0 | % |
| NDXP UL 07/05/24 P19770 Index | | | 1,256 | | | Short | | | 486 | | | | 0.0 | % |
| NDXP UL 07/05/24 P19660 Index | | | 1,156 | | | Short | | | 447 | | | | 0.0 | % |
| NDXP UL 07/05/24 P19650 Index | | | 1,115 | | | Short | | | 432 | | | | 0.0 | % |
| NDXP UL 07/05/24 P19730 Index | | | 1,102 | | | Short | | | 427 | | | | 0.0 | % |
| NDXP UL 07/05/24 P19640 Index | | | 1,076 | | | Short | | | 417 | | | | 0.0 | % |
| NDXP UL 07/05/24 P19720 Index | | | 1,066 | | | Short | | | 413 | | | | 0.0 | % |
| NDXP UL 07/05/24 P19825 Index | | | 993 | | | Short | | | 384 | | | | 0.0 | % |
| NDXP UL 07/05/24 P19610 Index | | | 965 | | | Short | | | 373 | | | | 0.0 | % |
| NDXP UL 07/05/24 P19680 Index | | | 930 | | | Short | | | 360 | | | | 0.0 | % |
| NDXP UL 07/05/24 P19600 Index | | | 930 | | | Short | | | 360 | | | | 0.0 | % |
| NDXP UL 07/05/24 P19670 Index | | | 898 | | | Short | | | 348 | | | | 0.0 | % |
| NDXP UL 07/05/24 P19590 Index | | | 896 | | | Short | | | 347 | | | | 0.0 | % |
| NDXP UL 07/05/24 P19775 Index | | | 851 | | | Short | | | 329 | | | | 0.0 | % |
| NDXP UL 07/05/24 P19560 Index | | | 800 | | | Short | | | 310 | | | | 0.0 | % |
| NDXP UL 07/05/24 P19630 Index | | | 778 | | | Short | | | 301 | | | | 0.0 | % |
| NDXP UL 07/05/24 P19550 Index | | | 770 | | | Short | | | 298 | | | | 0.0 | % |
| NDXP UL 07/05/24 P19620 Index | | | 751 | | | Short | | | 291 | | | | 0.0 | % |
| NDXP UL 07/05/24 P19540 Index | | | 740 | | | Short | | | 287 | | | | 0.0 | % |
| NDXP UL 07/05/24 P19725 Index | | | 723 | | | Short | | | 280 | | | | 0.0 | % |
| NDX UL 03/21/25 P14800 Index | | | 672 | | | Long | | | 260 | | | | 0.0 | % |
| NDXP UL 07/05/24 P19510 Index | | | 659 | | | Short | | | 255 | | | | 0.0 | % |
| NDXP UL 07/05/24 P19580 Index | | | 647 | | | Short | | | 250 | | | | 0.0 | % |
| NDX UL 03/21/25 P14600 Index | | | 637 | | | Long | | | 247 | | | | 0.0 | % |
| NDXP UL 07/05/24 P19500 Index | | | 633 | | | Short | | | 245 | | | | 0.0 | % |
| NDXP UL 07/05/24 P19570 Index | | | 623 | | | Short | | | 241 | | | | 0.0 | % |
| NDXP UL 07/05/24 P19675 Index | | | 609 | | | Short | | | 236 | | | | 0.0 | % |
| NDXP UL 07/05/24 P19490 Index | | | 608 | | | Short | | | 236 | | | | 0.0 | % |
| NDX UL 03/21/25 P14400 Index | | | 605 | | | Long | | | 234 | | | | 0.0 | % |
| NDX UL 03/21/25 P14200 Index | | | 575 | | | Long | | | 222 | | | | 0.0 | % |
| NDX UL 03/21/25 P14000 Index | | | 546 | | | Long | | | 211 | | | | 0.0 | % |
| NDXP UL 07/05/24 P19460 Index | | | 539 | | | Short | | | 209 | | | | 0.0 | % |
See Notes to Financial Statements.
Simplify Multi-QIS Alternative ETF
Schedule of Investments (Continued)
June 30, 2024
| Security description | | Notional
Value | | | Long
Short | | Unrealized
Appreciation/
(Depreciation) | | | % of basket | |
| NDXP UL 07/05/24 P19530 Index | | | 534 | | | Short | | | 207 | | | | 0.0 | % |
| NDX UL 03/21/25 P15000 Index | | | 532 | | | Long | | | 206 | | | | 0.0 | % |
| NDX UL 03/21/25 P13800 Index | | | 519 | | | Long | | | 201 | | | | 0.0 | % |
| NDXP UL 07/05/24 P19450 Index | | | 518 | | | Short | | | 201 | | | | 0.0 | % |
| NDXP UL 07/05/24 P19520 Index | | | 514 | | | Short | | | 199 | | | | 0.0 | % |
| NDXP UL 07/05/24 P19625 Index | | | 510 | | | Short | | | 197 | | | | 0.0 | % |
| NDXP UL 07/05/24 P19440 Index | | | 497 | | | Short | | | 193 | | | | 0.0 | % |
| Other Components | | | 41,957 | | | — | | | 16,242 | | | | 0.4 | % |
| Total | | | | | | | | | 33,954 | | | | 100.0 | % |
| * | The following table shows the individual positions and related values of the securities within the MSVCDRTRS (MS Calendar Equity Volatility Relative Value RTY Vega-Weighted Put-Only, Equity) basket. |
| Security description | | Notional
Value | | | Long
Short | | Unrealized
Appreciation/
(Depreciation) | | | % of basket | |
| USD Curncy | | | 17,336,856 | | | Long | | | — | | | | 99.2 | % |
| RUTW UO 07/05/24 P2040 Index | | | 9,988 | | | Short | | | 5,609 | | | | 0.1 | % |
| RUTW UO 07/05/24 P2035 Index | | | 8,495 | | | Short | | | 4,771 | | | | 0.0 | % |
| RUTW UO 07/05/24 P2030 Index | | | 7,171 | | | Short | | | 4,027 | | | | 0.0 | % |
| RUTW UO 07/05/24 P2025 Index | | | 6,005 | | | Short | | | 3,372 | | | | 0.0 | % |
| RUTW UO 07/05/24 P2020 Index | | | 4,983 | | | Short | | | 2,798 | | | | 0.0 | % |
| RUTW UO 07/05/24 P2015 Index | | | 4,094 | | | Short | | | 2,299 | | | | 0.0 | % |
| RUTW UO 07/05/24 P2010 Index | | | 3,326 | | | Short | | | 1,868 | | | | 0.0 | % |
| RUT UO 03/21/25 P1600 Index | | | 3,311 | | | Long | | | 1,859 | | | | 0.0 | % |
| RUT UO 03/21/25 P1550 Index | | | 2,946 | | | Long | | | 1,654 | | | | 0.0 | % |
| RUTW UO 07/05/24 P2005 Index | | | 2,670 | | | Short | | | 1,499 | | | | 0.0 | % |
| RUT UO 03/21/25 P1500 Index | | | 2,655 | | | Long | | | 1,491 | | | | 0.0 | % |
| RUT UO 03/21/25 P1650 Index | | | 2,636 | | | Long | | | 1,480 | | | | 0.0 | % |
| RUT UO 03/21/25 P1450 Index | | | 2,422 | | | Long | | | 1,360 | | | | 0.0 | % |
| RUT UO 12/20/24 P1800 Index | | | 2,386 | | | Long | | | 1,340 | | | | 0.0 | % |
| RUT UO 03/21/25 P1400 Index | | | 2,232 | | | Long | | | 1,254 | | | | 0.0 | % |
| RUT UO 12/20/24 P1750 Index | | | 2,137 | | | Long | | | 1,200 | | | | 0.0 | % |
| RUTW UO 07/05/24 P2000 Index | | | 2,116 | | | Short | | | 1,188 | | | | 0.0 | % |
| RUT UO 03/21/25 P1350 Index | | | 2,075 | | | Long | | | 1,165 | | | | 0.0 | % |
| RUT UO 03/21/25 P1300 Index | | | 1,941 | | | Long | | | 1,090 | | | | 0.0 | % |
| RUT UO 03/21/25 P1250 Index | | | 1,823 | | | Long | | | 1,024 | | | | 0.0 | % |
| RUT UO 12/20/24 P1700 Index | | | 1,785 | | | Long | | | 1,002 | | | | 0.0 | % |
| RUT UO 12/20/24 P1850 Index | | | 1,775 | | | Long | | | 997 | | | | 0.0 | % |
| RUT UO 03/21/25 P1200 Index | | | 1,716 | | | Long | | | 964 | | | | 0.0 | % |
| RUTW UO 07/05/24 P1995 Index | | | 1,656 | | | Short | | | 930 | | | | 0.0 | % |
| RUT UO 03/21/25 P1150 Index | | | 1,616 | | | Long | | | 908 | | | | 0.0 | % |
| RUT UO 12/20/24 P1650 Index | | | 1,518 | | | Long | | | 852 | | | | 0.0 | % |
| RUT UO 03/21/25 P1100 Index | | | 1,388 | | | Long | | | 780 | | | | 0.0 | % |
| RUT UO 12/20/24 P1600 Index | | | 1,317 | | | Long | | | 740 | | | | 0.0 | % |
| RUT UO 03/21/25 P1050 Index | | | 1,305 | | | Long | | | 733 | | | | 0.0 | % |
| RUTW UO 07/05/24 P1990 Index | | | 1,283 | | | Short | | | 721 | | | | 0.0 | % |
| RUT UO 03/21/25 P1860 Index | | | 1,208 | | | Long | | | 678 | | | | 0.0 | % |
| RUT UO 03/21/25 P1670 Index | | | 1,193 | | | Long | | | 670 | | | | 0.0 | % |
| RUT UO 03/21/25 P1850 Index | | | 1,172 | | | Long | | | 658 | | | | 0.0 | % |
| RUT UO 12/20/24 P1550 Index | | | 1,166 | | | Long | | | 655 | | | | 0.0 | % |
| RUT UO 03/21/25 P1820 Index | | | 1,157 | | | Long | | | 650 | | | | 0.0 | % |
See Notes to Financial Statements.
Simplify Multi-QIS Alternative ETF
Schedule of Investments (Continued)
June 30, 2024
| Security description | | Notional
Value | | | Long
Short | | Unrealized
Appreciation/
(Depreciation) | | | % of basket | |
| RUT UO 03/21/25 P1870 Index | | | 1,145 | | | Long | | | 643 | | | | 0.0 | % |
| RUT UO 03/21/25 P1840 Index | | | 1,137 | | | Long | | | 638 | | | | 0.0 | % |
| RUT UO 03/21/25 P1810 Index | | | 1,122 | | | Long | | | 630 | | | | 0.0 | % |
| RUT UO 03/21/25 P1830 Index | | | 1,103 | | | Long | | | 619 | | | | 0.0 | % |
| RUT UO 03/21/25 P1780 Index | | | 1,096 | | | Long | | | 615 | | | | 0.0 | % |
| RUT UO 03/21/25 P1800 Index | | | 1,089 | | | Long | | | 611 | | | | 0.0 | % |
| RUT UO 03/21/25 P1770 Index | | | 1,063 | | | Long | | | 597 | | | | 0.0 | % |
| RUT UO 03/21/25 P1790 Index | | | 1,056 | | | Long | | | 593 | | | | 0.0 | % |
| RUT UO 12/20/24 P1500 Index | | | 1,050 | | | Long | | | 590 | | | | 0.0 | % |
| RUT UO 03/21/25 P1760 Index | | | 1,032 | | | Long | | | 579 | | | | 0.0 | % |
| RUT UO 03/21/25 P1750 Index | | | 1,002 | | | Long | | | 562 | | | | 0.0 | % |
| RUTW UO 07/05/24 P1985 Index | | | 988 | | | Short | | | 555 | | | | 0.0 | % |
| RUT UO 03/21/25 P1740 Index | | | 972 | | | Long | | | 546 | | | | 0.0 | % |
| RUT UO 12/20/24 P1450 Index | | | 958 | | | Long | | | 538 | | | | 0.0 | % |
| Other Components | | | 30,871 | | | — | | | 17,336 | | | | 0.2 | % |
| Total | | | | | | | | | 79,937 | | | | 100.0 | % |
| * | The following table shows the individual positions and related values of the securities within the VMACBTRS (Macquarie Commodity Vol Carry Basket BK2P with Long Options Overlay, Commodity) basket. |
| Security description | | Notional
Value | | | Long
Short | | Unrealized
Appreciation/
(Depreciation) | | | % of basket | |
| GOLD 100 OZ FUTR Oct24 | | | 3,659,508 | | | Long | | | 18,930 | | | | 21.5 | % |
| LME COPPER FUTURE Jul24 | | | 3,216,371 | | | Short | | | 16,637 | | | | 18.9 | % |
| GOLD 100 OZ FUTR Aug24 | | | 2,943,011 | | | Long | | | 15,223 | | | | 17.3 | % |
| BRENT CRUDE FUTR Sep24 | | | 2,193,910 | | | Long | | | 11,349 | | | | 12.9 | % |
| GOLD 100 OZ FUTR Dec24 | | | 897,318 | | | Long | | | 4,642 | | | | 5.3 | % |
| LME COPPER FUTURE Aug24 | | | 673,421 | | | Short | | | 3,483 | | | | 4.0 | % |
| NATURAL GAS FUTR Aug24 | | | 343,530 | | | Short | | | 1,777 | | | | 2.0 | % |
| COCOA FUTURE Sep24 | | | 324,685 | | | Short | | | 1,680 | | | | 1.9 | % |
| LME PRI ALUM FUTR Jul24 | | | 229,021 | | | Short | | | 1,185 | | | | 1.3 | % |
| LME ZINC FUTURE Jul24 | | | 199,551 | | | Short | | | 1,032 | | | | 1.2 | % |
| LME ZINC FUTURE Aug24 | | | 127,586 | | | Long | | | 660 | | | | 0.7 | % |
| COFFEE ‘C’ FUTURE Sep24 | | | 101,722 | | | Long | | | 526 | | | | 0.6 | % |
| GASOLINE RBOB FUT Aug24 | | | 88,037 | | | Long | | | 455 | | | | 0.5 | % |
| COCOA FUTURE Dec24 | | | 80,689 | | | Short | | | 417 | | | | 0.5 | % |
| NY Harb ULSD Fut Aug24 | | | 34,194 | | | Long | | | 177 | | | | 0.2 | % |
| LME PRI ALUM FUTR Aug24 | | | 28,911 | | | Short | | | 150 | | | | 0.2 | % |
| GOLD FUT OPT(CMX) Oct24C 2160 | | | 26,926 | | | Short | | | 139 | | | | 0.2 | % |
| COPPER LME OPT Jul24P 10200 | | | 26,279 | | | Short | | | 136 | | | | 0.2 | % |
| CRUDE OIL OPT IPE Sep24C 83.25 | | | 23,527 | | | Short | | | 122 | | | | 0.1 | % |
| GOLD FUT OPT(CMX) Oct24C 2245 | | | 22,007 | | | Short | | | 114 | | | | 0.1 | % |
| GOLD FUT OPT(CMX) Aug24C 2120 | | | 19,081 | | | Short | | | 99 | | | | 0.1 | % |
| GOLD FUT OPT(CMX) Oct24C 2150 | | | 19,046 | | | Short | | | 99 | | | | 0.1 | % |
| LME LEAD FUTURE Jul24 | | | 17,664 | | | Short | | | 91 | | | | 0.1 | % |
| GOLD FUT OPT(CMX) Oct24C 2170 | | | 17,175 | | | Short | | | 89 | | | | 0.1 | % |
| GOLD FUT OPT(CMX) Aug24C 2150 | | | 16,335 | | | Short | | | 84 | | | | 0.1 | % |
| NATURAL GAS FUTR Sep24 | | | 15,834 | | | Short | | | 82 | | | | 0.1 | % |
| CRUDE OIL OPT IPE Sep24C 83.75 | | | 15,603 | | | Short | | | 81 | | | | 0.1 | % |
| GOLD FUT OPT(CMX) Oct24C 2145 | | | 14,634 | | | Short | | | 76 | | | | 0.1 | % |
| BRENT CRUDE FUTR Oct24 | | | 14,634 | | | Short | | | 76 | | | | 0.1 | % |
See Notes to Financial Statements.
Simplify Multi-QIS Alternative ETF
Schedule of Investments (Continued)
June 30, 2024
| Security description | | Notional
Value | | | Long
Short | | Unrealized
Appreciation/
(Depreciation) | | | % of basket | |
| GOLD FUT OPT(CMX) Aug24C 2170 | | | 14,554 | | | Short | | | 75 | | | | 0.1 | % |
| LME LEAD FUTURE Oct24 | | | 14,415 | | | Long | | | 75 | | | | 0.1 | % |
| COFFEE ‘C’ FUTURE Dec24 | | | 14,272 | | | Short | | | 74 | | | | 0.1 | % |
| GOLD FUT OPT(CMX) Oct24C 2260 | | | 14,241 | | | Short | | | 74 | | | | 0.1 | % |
| CRUDE OIL OPT IPE Sep24C 84 | | | 13,834 | | | Short | | | 72 | | | | 0.1 | % |
| GOLD FUT OPT(CMX) Oct24C 2165 | | | 13,425 | | | Short | | | 69 | | | | 0.1 | % |
| GOLD FUT OPT(CMX) Oct24C 2230 | | | 12,579 | | | Short | | | 65 | | | | 0.1 | % |
| GOLD FUT OPT(CMX) Oct24C 2200 | | | 12,048 | | | Short | | | 62 | | | | 0.1 | % |
| NGQ24P 2.8 Comdty | | | 11,594 | | | Short | | | 60 | | | | 0.1 | % |
| COPPER LME OPT Jul24P 9925 | | | 11,518 | | | Short | | | 60 | | | | 0.1 | % |
| GOLD FUT OPT(CMX) Aug24C 2160 | | | 11,383 | | | Short | | | 59 | | | | 0.1 | % |
| CRUDE OIL OPT IPE Sep24C 79.5 | | | 10,970 | | | Short | | | 57 | | | | 0.1 | % |
| CRUDE OIL OPT IPE Sep24C 86.75 | | | 10,716 | | | Short | | | 55 | | | | 0.1 | % |
| NGQ24P 2.75 Comdty | | | 10,710 | | | Short | | | 55 | | | | 0.1 | % |
| GOLD FUT OPT(CMX) Aug24C 2180 | | | 10,703 | | | Short | | | 55 | | | | 0.1 | % |
| COPPER LME OPT Jul24P 9800 | | | 10,688 | | | Short | | | 55 | | | | 0.1 | % |
| GOLD FUT OPT(CMX) Oct24C 2140 | | | 10,400 | | | Short | | | 54 | | | | 0.1 | % |
| LME LEAD FUTURE Aug24 | | | 10,127 | | | Long | | | 52 | | | | 0.1 | % |
| CRUDE OIL OPT IPE Sep24C 80.25 | | | 9,855 | | | Short | | | 51 | | | | 0.1 | % |
| COPPER LME OPT Jul24P 10600 | | | 9,722 | | | Short | | | 50 | | | | 0.1 | % |
| GOLD FUT OPT(CMX) Dec24C 2180 | | | 9,654 | | | Short | | | 50 | | | | 0.1 | % |
| Other Components | | | 1,391,239 | | | — | | | 7,197 | | | | 8.2 | % |
| Total | | | | | | | | | 88,086 | | | | 100.0 | % |
| * | The following table shows the individual positions and related values of the securities within the VMAQDSTRS (Macquarie S&P 500 GRIP Weekly Volatility Carry, Equity) basket. |
| Security description | | Notional
Value | | | Long
Short | | Unrealized
Appreciation/
(Depreciation) | | | % of basket | |
| S&P500 EMINI FUT Sep24 | | $ | 91,449 | | | Short | | | 2,463 | | | | 96.0 | % |
| July 24 Puts on SPX | | | 1,268 | | | Short | | | 34 | | | | 1.3 | % |
| July 24 Calls on SPX | | | 1,083 | | | Short | | | 29 | | | | 1.1 | % |
| July 24 Puts on SPX | | | 855 | | | Short | | | 23 | | | | 0.9 | % |
| July 24 Calls on SPX | | | 278 | | | Long | | | 8 | | | | 0.3 | % |
| July 24 Puts on SPX | | | 94 | | | Short | | | 3 | | | | 0.1 | % |
| July 24 Puts on SPX | | | 89 | | | Short | | | 2 | | | | 0.1 | % |
| July 24 Puts on SPX | | | 55 | | | Short | | | 1 | | | | 0.1 | % |
| July 24 Calls on SPX | | | 38 | | | Short | | | 1 | | | | 0.0 | % |
| July 24 Puts on SPX | | | 38 | | | Short | | | 1 | | | | 0.0 | % |
| July 24 Calls on SPX | | | 6 | | | Short | | | 0 | | | | 0.0 | % |
| Total | | | | | | | | | 2,565 | | | | 100.0 | % |
See Notes to Financial Statements.
Simplify Next Intangible Core Index ETF
Schedule of Investments
June 30, 2024
| | | Shares | | | Value | |
| Common Stocks – 100.0% | | | | | | | | |
| Communication Services – 8.3% | | | | | | | | |
| Electronic Arts Inc. | | | 112 | | | $ | 15,605 | |
| Live Nation Entertainment, Inc.* | | | 40 | | | | 3,750 | |
| Match Group, Inc.* | | | 115 | | | | 3,494 | |
| Meta Platforms, Inc., Class A | | | 257 | | | | 129,585 | |
| New York Times Co. (The), Class A | | | 69 | | | | 3,533 | |
| Paramount Global, Class A | | | 121 | | | | 2,224 | |
| Pinterest Inc, Class A* | | | 282 | | | | 12,428 | |
| Reddit, Inc., Class A* | | | 70 | | | | 4,472 | |
| Snap Inc, Class A* | | | 684 | | | | 11,361 | |
| Spotify Technology SA* | | | 82 | | | | 25,731 | |
| Warner Music Group Corp., Class A | | | 113 | | | | 3,463 | |
| | | | | | | | 215,646 | |
| Consumer Discretionary – 8.0% | | | | | | | | |
| Airbnb Inc, Class A* | | | 105 | | | | 15,921 | |
| Aptiv PLC* | | | 46 | | | | 3,239 | |
| AutoZone Inc.* | | | 3 | | | | 8,892 | |
| Bath & Body Works Inc. | | | 71 | | | | 2,773 | |
| Best Buy Co., Inc. | | | 63 | | | | 5,310 | |
| Booking Holdings, Inc. | | | 6 | | | | 23,769 | |
| Burlington Stores Inc.* | | | 19 | | | | 4,560 | |
| Chewy, Inc., Class A* | | | 129 | | | | 3,514 | |
| Deckers Outdoor Corp.* | | | 6 | | | | 5,808 | |
| DoorDash Inc, Class A* | | | 69 | | | | 7,506 | |
| DraftKings Inc, Class A* | | | 78 | | | | 2,977 | |
| Duolingo, Inc.* | | | 17 | | | | 3,547 | |
| eBay, Inc. | | | 209 | | | | 11,228 | |
| GameStop Corp., Class A* | | | 104 | | | | 2,568 | |
| Gap, Inc. (The) | | | 110 | | | | 2,628 | |
| Genuine Parts Co. | | | 23 | | | | 3,181 | |
| Home Depot, Inc. (The) | | | 115 | | | | 39,588 | |
| Light & Wonder, Inc.* | | | 16 | | | | 1,678 | |
| Lowe’s Cos Inc. | | | 66 | | | | 14,550 | |
| Lululemon Athletica, Inc.* | | | 28 | | | | 8,364 | |
| O’Reilly Automotive, Inc.* | | | 10 | | | | 10,561 | |
| Ralph Lauren Corp. | | | 19 | | | | 3,326 | |
| Skechers USA, Inc., Class A* | | | 35 | | | | 2,419 | |
| Tapestry, Inc. | | | 70 | | | | 2,995 | |
| Tractor Supply Co. | | | 13 | | | | 3,510 | |
| Ulta Beauty, Inc.* | | | 15 | | | | 5,788 | |
| Williams-Sonoma, Inc. | | | 19 | | | | 5,365 | |
| Wingstop, Inc. | | | 9 | | | | 3,804 | |
| | | | | | | | 209,369 | |
| Consumer Staples – 11.9% | | | | | | | | |
| Albertsons Cos., Inc., Class A | | | 178 | | | | 3,516 | |
| BJ’s Wholesale Club Holdings, Inc.* | | | 39 | | | | 3,426 | |
| Clorox Co. (The) | | | 107 | | | | 14,602 | |
| Coca-Cola Co. (The) | | | 519 | | | | 33,034 | |
| Colgate-Palmolive Co. | | | 184 | | | | 17,855 | |
| Estee Lauder Cos., Inc. (The), Class A | | | 80 | | | | 8,512 | |
See Notes to Financial Statements.
Simplify Next Intangible Core Index ETF
Schedule of Investments (Continued)
June 30, 2024
| | | Shares | | | Value | |
| Common Stocks (continued) | | | | | | | | |
| Consumer Staples (continued) | | | | | | | | |
| Hershey Co/The | | | 25 | | | $ | 4,596 | |
| Kimberly-Clark Corp. | | | 72 | | | | 9,950 | |
| Kroger Co. (The) | | | 221 | | | | 11,035 | |
| Monster Beverage Corp.* | | | 123 | | | | 6,144 | |
| PepsiCo, Inc. | | | 165 | | | | 27,213 | |
| Philip Morris International, Inc. | | | 189 | | | | 19,151 | |
| Sysco Corp. | | | 58 | | | | 4,141 | |
| Target Corp. | | | 140 | | | | 20,726 | |
| Walmart Inc. | | | 1,900 | | | | 128,649 | |
| | | | | | | | 312,550 | |
| Energy – 5.5% | | | | | | | | |
| Baker Hughes Co. | | | 185 | | | | 6,506 | |
| Exxon Mobil Corp. | | | 854 | | | | 98,313 | |
| Kinder Morgan Inc. | | | 505 | | | | 10,034 | |
| Marathon Petroleum Corp. | | | 66 | | | | 11,450 | |
| Targa Resources Corp. | | | 50 | | | | 6,439 | |
| Williams Cos., Inc. (The) | | | 278 | | | | 11,815 | |
| | | | | | | | 144,557 | |
| Financials – 11.7% | | | | | | | | |
| Aflac, Inc. | | | 65 | | | | 5,805 | |
| Allstate Corp. (The) | | | 30 | | | | 4,790 | |
| American Express Co. | | | 82 | | | | 18,987 | |
| American International Group, Inc. | | | 77 | | | | 5,716 | |
| Ameriprise Financial Inc. | | | 11 | | | | 4,699 | |
| Arch Capital Group Ltd.* | | | 42 | | | | 4,237 | |
| Arthur J Gallagher & Co. | | | 25 | | | | 6,483 | |
| Berkshire Hathaway, Inc., Class B* | | | 250 | | | | 101,700 | |
| Blackstone Inc. | | | 140 | | | | 17,332 | |
| Brown & Brown, Inc. | | | 32 | | | | 2,861 | |
| Hartford Financial Services Group, Inc. (The) | | | 34 | | | | 3,418 | |
| Marsh & McLennan Cos., Inc. | | | 56 | | | | 11,800 | |
| Mastercard Inc, Class A | | | 201 | | | | 88,673 | |
| Progressive Corp. (The) | | | 67 | | | | 13,917 | |
| Prudential Financial, Inc. | | | 41 | | | | 4,805 | |
| Toast Inc, Class A* | | | 237 | | | | 6,108 | |
| Travelers Cos., Inc. (The) | | | 26 | | | | 5,287 | |
| | | | | | | | 306,618 | |
| Health Care – 13.1% | | | | | | | | |
| Agilent Technologies, Inc. | | | 62 | | | | 8,037 | |
| Align Technology, Inc.* | | | 69 | | | | 16,659 | |
| Alkermes PLC* | | | 150 | | | | 3,615 | |
| Alnylam Pharmaceuticals Inc.* | | | 115 | | | | 27,945 | |
| Apellis Pharmaceuticals, Inc.* | | | 110 | | | | 4,220 | |
| Axsome Therapeutics, Inc.* | | | 41 | | | | 3,300 | |
| Blueprint Medicines Corp.* | | | 55 | | | | 5,928 | |
| Bridgebio Pharma, Inc.* | | | 169 | | | | 4,281 | |
| Centene Corp.* | | | 62 | | | | 4,111 | |
| Cigna Group (The) | | | 33 | | | | 10,909 | |
| Corcept Therapeutics, Inc.* | | | 94 | | | | 3,054 | |
See Notes to Financial Statements.
Simplify Next Intangible Core Index ETF
Schedule of Investments (Continued)
June 30, 2024
| | | Shares | | | Value | |
| Common Stocks (continued) | | | | | | | | |
| Health Care (continued) | | | | | | | | |
| CVS Health Corp. | | | 145 | | | $ | 8,564 | |
| Cytokinetics, Inc.* | | | 103 | | | | 5,580 | |
| Elevance Health Inc. | | | 27 | | | | 14,630 | |
| Exelixis, Inc.* | | | 260 | | | | 5,842 | |
| GRAIL, Inc.* | | | 5 | | | | 77 | |
| Guardant Health, Inc.* | | | 108 | | | | 3,119 | |
| Henry Schein, Inc.* | | | 113 | | | | 7,243 | |
| Humana, Inc. | | | 14 | | | | 5,231 | |
| IDEXX Laboratories, Inc.* | | | 74 | | | | 36,053 | |
| Illumina, Inc.* | | | 34 | | | | 3,549 | |
| Incyte Corp.* | | | 200 | | | | 12,124 | |
| Insmed, Inc.* | | | 143 | | | | 9,581 | |
| Inspire Medical Systems, Inc.* | | | 27 | | | | 3,613 | |
| Intra-Cellular Therapies, Inc.* | | | 92 | | | | 6,301 | |
| Ionis Pharmaceuticals Inc.* | | | 130 | | | | 6,196 | |
| Madrigal Pharmaceuticals, Inc.* | | | 19 | | | | 5,323 | |
| Mettler-Toledo International Inc* | | | 5 | | | | 6,988 | |
| Natera, Inc.* | | | 108 | | | | 11,695 | |
| Neurocrine Biosciences Inc.* | | | 89 | | | | 12,253 | |
| Penumbra, Inc.* | | | 35 | | | | 6,299 | |
| Sarepta Therapeutics Inc.* | | | 87 | | | | 13,746 | |
| Summit Therapeutics, Inc.* | | | 677 | | | | 5,281 | |
| Ultragenyx Pharmaceutical Inc.* | | | 73 | | | | 3,000 | |
| UnitedHealth Group, Inc. | | | 108 | | | | 55,000 | |
| Waters Corp.* | | | 13 | | | | 3,771 | |
| | | | | | | | 343,118 | |
| Industrials – 7.5% | | | | | | | | |
| 3M Co. | | | 120 | | | | 12,263 | |
| Booz Allen Hamilton Holding Corp. | | | 28 | | | | 4,309 | |
| CACI International Inc, Class A* | | | 9 | | | | 3,871 | |
| Cummins Inc. | | | 23 | | | | 6,369 | |
| Dover Corp. | | | 21 | | | | 3,790 | |
| Expeditors International of Washington Inc. | | | 24 | | | | 2,995 | |
| Fastenal Co. | | | 66 | | | | 4,148 | |
| Ferguson PLC | | | 24 | | | | 4,648 | |
| GE Vernova, Inc.* | | | 63 | | | | 10,805 | |
| Honeywell International Inc. | | | 108 | | | | 23,062 | |
| Illinois Tool Works Inc. | | | 63 | | | | 14,929 | |
| Lennox International, Inc. | | | 8 | | | | 4,280 | |
| Northrop Grumman Corp. | | | 25 | | | | 10,899 | |
| Otis Worldwide Corp. | | | 47 | | | | 4,524 | |
| Rollins, Inc. | | | 103 | | | | 5,025 | |
| Trane Technologies PLC | | | 48 | | | | 15,789 | |
| Uber Technologies, Inc.* | | | 350 | | | | 25,438 | |
| United Parcel Service, Inc., Class B | | | 145 | | | | 19,843 | |
| Veralto Corp. | | | 56 | | | | 5,346 | |
| WW Grainger, Inc. | | | 10 | | | | 9,022 | |
| Xylem, Inc./NY | | | 37 | | | | 5,018 | |
| | | | | | | | 196,373 | |
See Notes to Financial Statements.
Simplify Next Intangible Core Index ETF
Schedule of Investments (Continued)
June 30, 2024
| | | Shares | | | Value | |
| Common Stocks (continued) | | | | | | | | |
| Information Technology – 30.9% | | | | | | | | |
| Adobe, Inc.* | | | 192 | | | $ | 106,664 | |
| Altair Engineering, Inc., Class A* | | | 34 | | | | 3,335 | |
| Appfolio, Inc., Class A* | | | 15 | | | | 3,668 | |
| Applied Materials, Inc. | | | 126 | | | | 29,735 | |
| AppLovin Corp., Class A* | | | 137 | | | | 11,401 | |
| Astera Labs, Inc.* | | | 64 | | | | 3,873 | |
| Atlassian Corp., Class A* | | | 112 | | | | 19,811 | |
| Autodesk, Inc.* | | | 85 | | | | 21,033 | |
| Cadence Design Systems, Inc.* | | | 111 | | | | 34,160 | |
| CDW Corp. | | | 56 | | | | 12,535 | |
| Cloudflare Inc, Class A* | | | 142 | | | | 11,762 | |
| Cognizant Technology Solutions Corp., Class A | | | 208 | | | | 14,144 | |
| Confluent Inc, Class A* | | | 135 | | | | 3,987 | |
| Datadog, Inc., Class A* | | | 142 | | | | 18,416 | |
| Dell Technologies, Inc., Class C | | | 284 | | | | 39,166 | |
| DocuSign, Inc.* | | | 87 | | | | 4,654 | |
| Dolby Laboratories, Inc., Class A | | | 17 | | | | 1,347 | |
| Dropbox, Inc., Class A* | | | 142 | | | | 3,191 | |
| Dynatrace Inc.* | | | 127 | | | | 5,682 | |
| Elastic NV* | | | 43 | | | | 4,898 | |
| F5 Inc.* | | | 25 | | | | 4,306 | |
| Fair Isaac Corp.* | | | 10 | | | | 14,887 | |
| Fortinet, Inc.* | | | 320 | | | | 19,286 | |
| Gartner, Inc.* | | | 16 | | | | 7,185 | |
| Gitlab, Inc., Class A* | | | 68 | | | | 3,381 | |
| GoDaddy, Inc., Class A* | | | 59 | | | | 8,243 | |
| Guidewire Software, Inc.* | | | 34 | | | | 4,688 | |
| HashiCorp, Inc., Class A* | | | 88 | | | | 2,965 | |
| HP, Inc. | | | 411 | | | | 14,393 | |
| HubSpot Inc.* | | | 22 | | | | 12,975 | |
| International Business Machine Corp. | | | 388 | | | | 67,105 | |
| Juniper Networks, Inc. | | | 138 | | | | 5,031 | |
| Keysight Technologies, Inc.* | | | 37 | | | | 5,060 | |
| Lam Research Corp. | | | 20 | | | | 21,297 | |
| Lattice Semiconductor Corp* | | | 58 | | | | 3,363 | |
| Manhattan Associates, Inc.* | | | 26 | | | | 6,414 | |
| MongoDB Inc.* | | | 31 | | | | 7,749 | |
| Motorola Solutions, Inc. | | | 69 | | | | 26,637 | |
| NetApp, Inc. | | | 86 | | | | 11,077 | |
| Nutanix, Inc., Class A* | | | 102 | | | | 5,799 | |
| Palantir Technologies Inc, Class A* | | | 889 | | | | 22,518 | |
| Procore Technologies, Inc.* | | | 62 | | | | 4,111 | |
| Pure Storage, Inc., Class A* | | | 137 | | | | 8,797 | |
| Qorvo, Inc.* | | | 40 | | | | 4,642 | |
| Samsara Inc, Class A* | | | 235 | | | | 7,919 | |
| Seagate Technology Holdings PLC | | | 86 | | | | 8,881 | |
| ServiceNow Inc.* | | | 87 | | | | 68,440 | |
| SPS Commerce, Inc.* | | | 15 | | | | 2,822 | |
| Synopsys, Inc.* | | | 62 | | | | 36,894 | |
See Notes to Financial Statements.
Simplify Next Intangible Core Index ETF
Schedule of Investments (Continued)
June 30, 2024
| | | Shares | | | Value | |
| Common Stocks (continued) | | | | | | | | |
| Information Technology (continued) | | | | | | | | |
| Teradyne Inc. | | | 34 | | | $ | 5,042 | |
| UiPath, Inc., Class A* | | | 244 | | | | 3,094 | |
| Workday, Inc., Class A* | | | 110 | | | | 24,592 | |
| Zebra Technologies Corp, Class A* | | | 22 | | | | 6,796 | |
| | | | | | | | 809,851 | |
| Materials – 1.8% | | | | | | | | |
| Avery Dennison Corp. | | | 17 | | | | 3,717 | |
| CRH PLC | | | 79 | | | | 5,923 | |
| DuPont de Nemours, Inc. | | | 65 | | | | 5,232 | |
| Ecolab Inc. | | | 44 | | | | 10,472 | |
| PPG Industries, Inc. | | | 27 | | | | 3,399 | |
| Reliance, Inc. | | | 11 | | | | 3,142 | |
| Sherwin-Williams Co. (The) | | | 29 | | | | 8,655 | |
| Vulcan Materials Co. | | | 25 | | | | 6,217 | |
| | | | | | | | 46,757 | |
| Real Estate – 0.1% | | | | | | | | |
| CBRE Group, Inc., Class A* | | | 35 | | | | 3,119 | |
| | | | | | | | | |
| Utilities – 1.2% | | | | | | | | |
| Consolidated Edison, Inc. | | | 79 | | | | 7,064 | |
| Dominion Energy, Inc. | | | 197 | | | | 9,653 | |
| NiSource, Inc. | | | 103 | | | | 2,968 | |
| NRG Energy, Inc. | | | 48 | | | | 3,737 | |
| Vistra Corp. | | | 84 | | | | 7,222 | |
| | | | | | | | 30,644 | |
| Total Common Stocks (Cost $2,527,611) | | | | | | | 2,618,602 | |
| | | | | | | | | |
| Money Market Funds – 0.0%† | | | | | | | | |
| Fidelity Investments Money Market Treasury Only Portfolio - Class I, 5.19%(a) | | | | | | | | |
| (Cost $1,154) | | | 1,154 | | | | 1,154 | |
| | | | | | | | | |
| Total Investments – 100.0% | | | | | | | | |
| (Cost $2,528,765) | | | | | | $ | 2,619,756 | |
| Other Assets in Excess of Liabilities – 0.0%† | | | | | | | 1,048 | |
| Net Assets – 100.0% | | | | | | $ | 2,620,804 | |
| * | Non Income Producing |
| † | Less than 0.05% |
| (a) | Rate shown reflects the 7-day yield as of June 30, 2024. |
See Notes to Financial Statements.
Simplify Next Intangible Core Index ETF
Schedule of Investments (Continued)
June 30, 2024
Summary of Investment Type††
| Investment Categories | | % of Net
Assets | |
| Common Stocks | | | 100.0 | % |
| Money Market Funds | | | 0.0 | %† |
| Total Investments | | | 100.0 | % |
| Other Assets in Excess of Liabilities | | | 0.0 | %† |
| Net Assets | | | 100.0 | % |
| †† | The percentage shown for each investment category is the total value of investments in that category as a percentage of the net assets of the Fund. The table depicts the Fund’s investments but may not represent the Fund’s market exposure to certain derivatives, if any, which are included in Other Assets in Excess of Liabilities. |
See Notes to Financial Statements.
Simplify Next Intangible Value Index ETF
Schedule of Investments
June 30, 2024
| | | Shares | | | Value | |
| Common Stocks – 99.8% | | | | | | | | |
| Communication Services – 22.8% | | | | | | | | |
| AT&T, Inc. | | | 6,546 | | | $ | 125,094 | |
| Comcast Corp., Class A | | | 3,372 | | | | 132,048 | |
| EchoStar Corp., Class A* | | | 244 | | | | 4,346 | |
| Fox Corp., Class A | | | 426 | | | | 14,642 | |
| Frontier Communications Parent, Inc.* | | | 229 | | | | 5,995 | |
| IAC, Inc.* | | | 80 | | | | 3,748 | |
| Liberty Broadband Corp., Class A* | | | 128 | | | | 6,989 | |
| New York Times Co. (The), Class A | | | 149 | | | | 7,630 | |
| News Corp., Class B | | | 522 | | | | 14,820 | |
| Paramount Global, Class A | | | 143 | | | | 2,628 | |
| Roku, Inc.* | | | 109 | | | | 6,532 | |
| T-Mobile US, Inc. | | | 722 | | | | 127,202 | |
| United States Cellular Corp.* | | | 78 | | | | 4,354 | |
| Verizon Communications, Inc. | | | 3,199 | | | | 131,927 | |
| Warner Bros Discovery, Inc.* | | | 517 | | | | 3,846 | |
| | | | | | | | 591,801 | |
| Consumer Discretionary – 11.3% | | | | | | | | |
| Academy Sports & Outdoors, Inc. | | | 76 | | | | 4,047 | |
| ADT, Inc. | | | 705 | | | | 5,358 | |
| American Eagle Outfitters, Inc. | | | 208 | | | | 4,152 | |
| AutoNation, Inc.* | | | 22 | | | | 3,506 | |
| Best Buy Co., Inc. | | | 221 | | | | 18,628 | |
| BorgWarner, Inc. | | | 142 | | | | 4,578 | |
| Boyd Gaming Corp. | | | 20 | | | | 1,102 | |
| Brunswick Corp. | | | 42 | | | | 3,056 | |
| Capri Holdings Ltd.* | | | 121 | | | | 4,003 | |
| CarMax, Inc.* | | | 88 | | | | 6,454 | |
| Dillard’s, Inc., Class A | | | 17 | | | | 7,487 | |
| DR Horton, Inc. | | | 100 | | | | 14,093 | |
| eBay, Inc. | | | 450 | | | | 24,174 | |
| Expedia Group, Inc.* | | | 76 | | | | 9,575 | |
| Ford Motor Co. | | | 2,251 | | | | 28,228 | |
| Gap, Inc. (The) | | | 383 | | | | 9,150 | |
| General Motors Co. | | | 641 | | | | 29,781 | |
| Genuine Parts Co. | | | 78 | | | | 10,789 | |
| Lennar Corp., Class A | | | 83 | | | | 12,439 | |
| Life Time Group Holdings, Inc.* | | | 40 | | | | 753 | |
| Lithia Motors, Inc. | | | 15 | | | | 3,787 | |
| LKQ Corp. | | | 150 | | | | 6,238 | |
| Lucid Group, Inc.* | | | 1,276 | | | | 3,330 | |
| Macy’s, Inc. | | | 296 | | | | 5,683 | |
| Mattel, Inc.* | | | 360 | | | | 5,854 | |
| MGM Resorts International* | | | 65 | | | | 2,889 | |
| Nordstrom, Inc. | | | 169 | | | | 3,586 | |
| Penske Automotive Group, Inc. | | | 38 | | | | 5,663 | |
| PulteGroup, Inc. | | | 64 | | | | 7,046 | |
| PVH Corp. | | | 59 | | | | 6,246 | |
| Ralph Lauren Corp. | | | 65 | | | | 11,379 | |
| Rivian Automotive, Inc., Class A* | | | 566 | | | | 7,596 | |
See Notes to Financial Statements.
Simplify Next Intangible Value Index ETF
Schedule of Investments (Continued)
June 30, 2024
| | | Shares | | | Value | |
| Common Stocks (continued) | | | | | | | | |
| Consumer Discretionary (continued) | | | | | | | | |
| Signet Jewelers Ltd. | | | 45 | | | $ | 4,031 | |
| Toll Brothers, Inc. | | | 31 | | | | 3,571 | |
| Urban Outfitters, Inc.* | | | 96 | | | | 3,941 | |
| VF Corp. | | | 404 | | | | 5,454 | |
| Whirlpool Corp. | | | 56 | | | | 5,723 | |
| | | | | | | | 293,370 | |
| Consumer Staples – 7.9% | | | | | | | | |
| Albertsons Cos., Inc., Class A | | | 616 | | | | 12,166 | |
| Archer-Daniels-Midland Co. | | | 195 | | | | 11,788 | |
| Bunge Global SA | | | 56 | | | | 5,979 | |
| Coca-Cola Consolidated, Inc. | | | 4 | | | | 4,340 | |
| Kraft Heinz Co. (The) | | | 475 | | | | 15,305 | |
| Kroger Co. (The) | | | 767 | | | | 38,296 | |
| Maplebear, Inc.* | | | 149 | | | | 4,789 | |
| Molson Coors Beverage Co., Class B | | | 83 | | | | 4,219 | |
| Performance Food Group Co.* | | | 87 | | | | 5,752 | |
| Sysco Corp. | | | 191 | | | | 13,635 | |
| Target Corp. | | | 482 | | | | 71,355 | |
| Tyson Foods, Inc., Class A | | | 135 | | | | 7,714 | |
| Walgreens Boots Alliance, Inc. | | | 942 | | | | 11,393 | |
| | | | | | | | 206,731 | |
| Energy – 3.8% | | | | | | | | |
| Antero Resources Corp.* | | | 193 | | | | 6,298 | |
| Chesapeake Energy Corp. | | | 80 | | | | 6,575 | |
| Chord Energy Corp. | | | 26 | | | | 4,360 | |
| Civitas Resources, Inc. | | | 61 | | | | 4,209 | |
| EQT Corp. | | | 274 | | | | 10,133 | |
| HF Sinclair Corp. | | | 117 | | | | 6,241 | |
| Marathon Oil Corp. | | | 345 | | | | 9,891 | |
| Murphy Oil Corp. | | | 93 | | | | 3,835 | |
| Noble Corp. PLC | | | 83 | | | | 3,706 | |
| NOV, Inc. | | | 236 | | | | 4,486 | |
| Ovintiv, Inc. | | | 164 | | | | 7,687 | |
| PBF Energy, Inc., Class A | | | 72 | | | | 3,313 | |
| Permian Resources Corp. | | | 355 | | | | 5,733 | |
| SM Energy Co. | | | 70 | | | | 3,026 | |
| Southwestern Energy Co.* | | | 678 | | | | 4,563 | |
| TechnipFMC PLC | | | 329 | | | | 8,603 | |
| Weatherford International PLC* | | | 44 | | | | 5,388 | |
| | | | | | | | 98,047 | |
| Financials – 11.0% | | | | | | | | |
| Allstate Corp. (The) | | | 113 | | | | 18,042 | |
| Ally Financial, Inc. | | | 128 | | | | 5,078 | |
| American International Group, Inc. | | | 285 | | | | 21,158 | |
| Assurant, Inc. | | | 22 | | | | 3,657 | |
| Cincinnati Financial Corp. | | | 66 | | | | 7,795 | |
| Citigroup, Inc. | | | 808 | | | | 51,276 | |
| Citizens Financial Group, Inc. | | | 195 | | | | 7,026 | |
| CNA Financial Corp. | | | 116 | | | | 5,344 | |
See Notes to Financial Statements.
Simplify Next Intangible Value Index ETF
Schedule of Investments (Continued)
June 30, 2024
| | | Shares | | | Value | |
| Common Stocks (continued) | | | | | | | | |
| Financials (continued) | | | | | | | | |
| Corebridge Financial, Inc. | | | 258 | | | $ | 7,513 | |
| Equitable Holdings, Inc. | | | 139 | | | | 5,679 | |
| Everest Group Ltd. | | | 18 | | | | 6,858 | |
| Fidelity National Financial, Inc. | | | 116 | | | | 5,733 | |
| First Citizens BancShares, Inc., Class A | | | 11 | | | | 18,520 | |
| Jefferies Financial Group, Inc. | | | 90 | | | | 4,478 | |
| Loews Corp. | | | 93 | | | | 6,951 | |
| Markel Group, Inc.* | | | 6 | | | | 9,454 | |
| MetLife, Inc. | | | 304 | | | | 21,338 | |
| Old Republic International Corp. | | | 116 | | | | 3,584 | |
| Principal Financial Group, Inc. | | | 100 | | | | 7,845 | |
| Prudential Financial, Inc. | | | 152 | | | | 17,813 | |
| Reinsurance Group of America, Inc. | | | 28 | | | | 5,747 | |
| RenaissanceRe Holdings Ltd. | | | 22 | | | | 4,917 | |
| Synchrony Financial | | | 167 | | | | 7,881 | |
| Travelers Cos., Inc. (The) | | | 97 | | | | 19,724 | |
| Unum Group | | | 80 | | | | 4,089 | |
| W R Berkley Corp. | | | 108 | | | | 8,487 | |
| | | | | | | | 285,987 | |
| Health Care – 12.3% | | | | | | | | |
| Baxter International, Inc. | | | 330 | | | | 11,039 | |
| Biogen, Inc.* | | | 97 | | | | 22,487 | |
| Bio-Rad Laboratories, Inc., Class A* | | | 21 | | | | 5,735 | |
| Bristol-Myers Squibb Co. | | | 1,337 | | | | 55,526 | |
| Centene Corp.* | | | 231 | | | | 15,315 | |
| CVS Health Corp. | | | 534 | | | | 31,538 | |
| DENTSPLY SIRONA, Inc. | | | 138 | | | | 3,438 | |
| Exelixis, Inc.* | | | 190 | | | | 4,269 | |
| GRAIL, Inc.* | | | 20 | | | | 307 | |
| Henry Schein, Inc.* | | | 82 | | | | 5,256 | |
| Humana, Inc. | | | 52 | | | | 19,430 | |
| Illumina, Inc.* | | | 122 | | | | 12,734 | |
| Incyte Corp.* | | | 146 | | | | 8,851 | |
| Jazz Pharmaceuticals PLC* | | | 41 | | | | 4,376 | |
| Pfizer, Inc. | | | 3,780 | | | | 105,764 | |
| Solventum Corp.* | | | 113 | | | | 5,975 | |
| Viatris, Inc. | | | 783 | | | | 8,323 | |
| | | | | | | | 320,363 | |
| Industrials – 2.8% | | | | | | | | |
| Air Lease Corp. | | | 84 | | | | 3,993 | |
| Alight, Inc., Class A* | | | 488 | | | | 3,601 | |
| Builders FirstSource, Inc.* | | | 37 | | | | 5,121 | |
| Clarivate PLC* | | | 669 | | | | 3,807 | |
| CNH Industrial NV | | | 500 | | | | 5,065 | |
| Dun & Bradstreet Holdings, Inc. | | | 408 | | | | 3,778 | |
| Flowserve Corp. | | | 100 | | | | 4,810 | |
| Lyft, Inc., Class A* | | | 316 | | | | 4,456 | |
| MSC Industrial Direct Co., Inc., Class A | | | 42 | | | | 3,331 | |
| Robert Half, Inc. | | | 81 | | | | 5,182 | |
See Notes to Financial Statements.
Simplify Next Intangible Value Index ETF
Schedule of Investments (Continued)
June 30, 2024
| | | Shares | | | Value | |
| Common Stocks (continued) | | | | | | | | |
| Industrials (continued) | | | | | | | | |
| Snap-on, Inc. | | | 16 | | | $ | 4,182 | |
| Southwest Airlines Co. | | | 339 | | | | 9,699 | |
| Stanley Black & Decker, Inc. | | | 96 | | | | 7,669 | |
| Timken Co. (The) | | | 44 | | | | 3,526 | |
| WESCO International, Inc. | | | 39 | | | | 6,182 | |
| | | | | | | | 74,402 | |
| Information Technology – 18.7% | | | | | | | | |
| Amkor Technology, Inc. | | | 217 | | | | 8,684 | |
| Arrow Electronics, Inc.* | | | 40 | | | | 4,830 | |
| ASGN, Inc.* | | | 35 | | | | 3,086 | |
| Avnet, Inc. | | | 69 | | | | 3,553 | |
| BILL Holdings, Inc.* | | | 97 | | | | 5,104 | |
| Box, Inc., Class A* | | | 133 | | | | 3,517 | |
| C3.ai, Inc., Class A* | | | 110 | | | | 3,186 | |
| Ciena Corp.* | | | 132 | | | | 6,360 | |
| Cirrus Logic, Inc.* | | | 48 | | | | 6,128 | |
| Cognizant Technology Solutions Corp., Class A | | | 447 | | | | 30,396 | |
| CommVault Systems, Inc.* | | | 39 | | | | 4,741 | |
| Dell Technologies, Inc., Class C | | | 612 | | | | 84,401 | |
| DocuSign, Inc.* | | | 187 | | | | 10,005 | |
| Dropbox, Inc., Class A* | | | 305 | | | | 6,853 | |
| Flex Ltd.* | | | 308 | | | | 9,083 | |
| Freshworks, Inc., Class A* | | | 273 | | | | 3,464 | |
| Hewlett Packard Enterprise Co. | | | 1,174 | | | | 24,854 | |
| HP, Inc. | | | 885 | | | | 30,993 | |
| Insight Enterprises, Inc.* | | | 29 | | | | 5,752 | |
| Intel Corp. | | | 3,842 | | | | 118,987 | |
| IPG Photonics Corp.* | | | 41 | | | | 3,460 | |
| Juniper Networks, Inc. | | | 297 | | | | 10,829 | |
| Kyndryl Holdings, Inc.* | | | 211 | | | | 5,551 | |
| NetApp, Inc. | | | 187 | | | | 24,086 | |
| Pegasystems, Inc. | | | 78 | | | | 4,721 | |
| Qorvo, Inc.* | | | 85 | | | | 9,863 | |
| Sanmina Corp.* | | | 50 | | | | 3,313 | |
| Silicon Laboratories, Inc.* | | | 29 | | | | 3,208 | |
| TD SYNNEX Corp. | | | 78 | | | | 9,001 | |
| Twilio, Inc., Class A* | | | 156 | | | | 8,862 | |
| UiPath, Inc., Class A* | | | 526 | | | | 6,670 | |
| Unity Software, Inc.* | | | 359 | | | | 5,837 | |
| Zoom Video Communications, Inc., Class A* | | | 289 | | | | 17,106 | |
| | | | | | | | 486,484 | |
| Materials – 4.9% | | | | | | | | |
| Albemarle Corp. | | | 111 | | | | 10,603 | |
| Alcoa Corp. | | | 115 | | | | 4,575 | |
| Cleveland-Cliffs, Inc.* | | | 294 | | | | 4,525 | |
| Commercial Metals Co. | | | 73 | | | | 4,014 | |
| Corteva, Inc. | | | 274 | | | | 14,780 | |
| CRH PLC | | | 204 | | | | 15,296 | |
| DuPont de Nemours, Inc. | | | 263 | | | | 21,169 | |
See Notes to Financial Statements.
Simplify Next Intangible Value Index ETF
Schedule of Investments (Continued)
June 30, 2024
| | | Shares | | | Value | |
| Common Stocks (continued) | | | | | | | | |
| Materials (continued) | | | | | | | | |
| Huntsman Corp. | | | 181 | | | $ | 4,121 | |
| International Paper Co. | | | 265 | | | | 11,435 | |
| Mosaic Co. (The) | | | 129 | | | | 3,728 | |
| PPG Industries, Inc. | | | 71 | | | | 8,938 | |
| Reliance, Inc. | | | 34 | | | | 9,710 | |
| United States Steel Corp. | | | 141 | | | | 5,330 | |
| Westrock Co. | | | 197 | | | | 9,901 | |
| | | | | | | | 128,125 | |
| Real Estate – 1.4% | | | | | | | | |
| Alexandria Real Estate Equities, Inc. | | | 75 | | | | 8,773 | |
| Jones Lang LaSalle, Inc.* | | | 20 | | | | 4,105 | |
| VICI Properties, Inc. | | | 806 | | | | 23,084 | |
| | | | | | | | 35,962 | |
| Utilities – 2.9% | | | | | | | | |
| Ameren Corp. | | | 66 | | | | 4,693 | |
| Atmos Energy Corp. | | | 37 | | | | 4,316 | |
| Avangrid, Inc. | | | 96 | | | | 3,411 | |
| Consolidated Edison, Inc. | | | 88 | | | | 7,869 | |
| Dominion Energy, Inc. | | | 212 | | | | 10,388 | |
| Entergy Corp. | | | 53 | | | | 5,671 | |
| PG&E Corp. | | | 542 | | | | 9,463 | |
| PPL Corp. | | | 183 | | | | 5,060 | |
| Sempra | | | 158 | | | | 12,017 | |
| UGI Corp. | | | 224 | | | | 5,130 | |
| Xcel Energy, Inc. | | | 138 | | | | 7,371 | |
| | | | | | | | 75,389 | |
| Total Common Stocks (Cost $2,557,955) | | | | | | | 2,596,661 | |
| | | | | | | | | |
| Money Market Funds – 0.1% | | | | | | | | |
| Fidelity Investments Money Market Treasury Only Portfolio - Class I, 5.19%(a) | | | | | | | | |
| (Cost $1,521) | | | 1,521 | | | | 1,521 | |
| | | | | | | | | |
| Total Investments – 99.9% | | | | | | | | |
| (Cost $2,559,476) | | | | | | $ | 2,598,182 | |
| Other Assets in Excess of Liabilities – 0.1% | | | | | | | 1,304 | |
| Net Assets – 100.0% | | | | | | $ | 2,599,486 | |
| * | Non Income Producing |
| (a) | Rate shown reflects the 7-day yield as of June 30, 2024. |
See Notes to Financial Statements.
Simplify Next Intangible Value Index ETF
Schedule of Investments (Continued)
June 30, 2024
Summary of Investment Type††
Investment Categories | | % of Net
Assets | |
| Common Stocks | | | 99.8 | % |
| Money Market Funds | | | 0.1 | % |
| Total Investments | | | 99.9 | % |
| Other Assets in Excess of Liabilities | | | 0.1 | % |
| Net Assets | | | 100.0 | % |
| †† | The percentage shown for each investment category is the total value of investments in that category as a percentage of the net assets of the Fund. The table depicts the Fund’s investments but may not represent the Fund’s market exposure to certain derivatives, if any, which are included in Other Assets in Excess of Liabilities. |
See Notes to Financial Statements.
Simplify Short Term Treasury Futures Strategy ETF
Schedule of Investments
June 30, 2024
| | | Principal | | | Value | |
| U.S. Treasury Bills – 99.5% | | | | | | | | |
| U.S. Treasury Bill, 5.37%, 7/5/2024(a)(b) | | $ | 1,000,000 | | | $ | 999,418 | |
| U.S. Treasury Bill, 5.39%, 9/12/2024(a)(b) | | | 10,000,000 | | | | 9,894,079 | |
| U.S. Treasury Bill, 5.40%, 9/19/2024(a)(b) | | | 369,700,000 | | | | 365,421,340 | |
| U.S. Treasury Bill, 5.43%, 9/24/2024(a)(b) | | | 162,000,000 | | | | 160,008,418 | |
| Total U.S. Treasury Bills (Cost $536,270,680) | | | | | | | 536,323,255 | |
| | | | | | | | | |
| Total Investments – 99.5% | | | | | | | | |
| (Cost $536,270,680) | | | | | | $ | 536,323,255 | |
| Other Assets in Excess of Liabilities – 0.5% | | | | | | | 2,756,346 | |
| Net Assets – 100.0% | | | | | | $ | 539,079,601 | |
| (a) | Securities with an aggregate market value of $207,584,642 have been pledged as collateral for futures as of June 30, 2024. |
| (b) | Represents a zero coupon bond. Rate shown reflects the effective yield. |
At June 30, 2024, open futures contracts were as follows:
| | | Number of
Contracts | | | Notional
Value | | | Expiration
Date | | | Value/
Unrealized
Appreciation (Depreciation) | |
| Long position contracts: | | | | | | | | | | | | | | |
| U.S. 2 Years Note (CBT) | | 13,959 | | | $ | 2,850,689,531 | | | 9/30/24 | | | $ | 7,683,579 | |
Summary of Investment Type††
| Investment Categories | | % of Net
Assets | |
| U.S. Treasury Bills | | | 99.5 | % |
| Total Investments | | | 99.5 | % |
| Other Assets in Excess of Liabilities | | | 0.5 | % |
| Net Assets | | | 100.0 | % |
| †† | The percentage shown for each investment category is the total value of investments in that category as a percentage of the net assets of the Fund. The table depicts the Fund’s investments but may not represent the Fund’s market exposure to certain derivatives, if any, which are included in Other Assets in Excess of Liabilities. |
See Notes to Financial Statements.
Simplify US Equity PLUS GBTC ETF
Schedule of Investments
June 30, 2024
| | | Shares | | | Value | |
| Exchange-Traded Funds – 85.2% | | | | | | | | |
| Equity Funds – 85.2% | | | | | | | | |
| iShares Core S&P 500 ETF(a) | | | | | | | | |
| (Cost $17,033,450) | | | 33,507 | | | $ | 18,336,035 | |
| Grantor Trusts – 9.9% | | | | | | | | |
| Alternative Funds – 9.9% | | | | | | | | |
| Grayscale Bitcoin Trust BTC* | | | | | | | | |
| (Cost $1,874,582) | | | 39,867 | | | | 2,122,519 | |
| | | Principal | | | | |
| U.S. Treasury Bills – 4.6% | | | | | | | | |
| U.S. Treasury Bill, 5.36%, 9/19/2024(b)(c) | | | | | | | | |
| (Cost $988,432) | | $ | 1,000,000 | | | | 988,427 | |
| | | Shares | | | | |
| Money Market Funds – 0.0%† | | | | | | | | |
| Fidelity Investments Money Market Treasury Only Portfolio - Class I, 5.19%(d) | | | | | | | | |
| (Cost $9,756) | | | 9,756 | | | | 9,756 | |
| | | | | | | | | |
| Total Investments – 99.7% | | | | | | | | |
| (Cost $19,906,220) | | | | | | $ | 21,456,737 | |
| Other Assets in Excess of Liabilities – 0.3% | | | | | | | 69,718 | |
| Net Assets – 100.0% | | | | | | $ | 21,526,455 | |
| * | Non Income Producing |
| † | Less than 0.05% |
| (a) | A copy of the security’s annual report to shareholders may be obtained without charge at www.ishares.com. |
| (b) | Security, or a portion thereof, in the amount of $988,427 has been pledged as collateral for futures as of June 30, 2024 |
| (c) | Represents a zero coupon bond. Rate shown reflects the effective yield. |
| (d) | Rate shown reflects the 7-day yield as of June 30, 2024. |
At June 30, 2024, open futures contracts were as follows:
| | | Number of
Contracts | | | Notional
Value | | | Expiration
Date | | | Value/
Unrealized
Appreciation (Depreciation) | |
| Long position contracts: | | | | | | | | | | | | | | |
| S&P 500 E-Mini Future | | 12 | | | $ | 3,312,900 | | | 9/20/24 | | | $ | 8,900 | |
See Notes to Financial Statements.
Simplify US Equity PLUS GBTC ETF
Schedule of Investments (Continued)
June 30, 2024
Summary of Investment Type††
| Investment Categories | | % of Net
Assets | |
| Exchange-Traded Funds | | | 85.2 | % |
| Grantor Trusts | | | 9.9 | % |
| U.S. Treasury Bills | | | 4.6 | % |
| Money Market Funds | | | 0.0 | %† |
| Total Investments | | | 99.7 | % |
| Other Assets in Excess of Liabilities | | | 0.3 | % |
| Net Assets | | | 100.0 | % |
| †† | The percentage shown for each investment category is the total value of investments in that category as a percentage of the net assets of the Fund. The table depicts the Fund’s investments but may not represent the Fund’s market exposure to certain derivatives, if any, which are included in Other Assets in Excess of Liabilities. |
See Notes to Financial Statements.
Simplify US Equity PLUS QIS ETF
Schedule of Investments
June 30, 2024
| | | Shares | | | Value | |
| Exchange-Traded Funds – 94.7% | | | | | | | | |
| Alternative Funds – 50.0% | | | | | | | | |
| Simplify Multi-QIS Alternative ETF(a)(b) | | | 59,335 | | | $ | 1,501,176 | |
| Equity Funds – 44.7% | | | | | | | | |
| iShares Core S&P 500 ETF(c) | | | 2,453 | | | | 1,342,355 | |
| Total Exchange-Traded Funds (Cost $2,688,599) | | | | | | | 2,843,531 | |
| | | Principal | | | | |
| U.S. Treasury Bills – 3.3% | | | | | | | | |
| U.S. Treasury Bill, 5.37%, 7/5/2024(d)(e) | | | | | | | | |
| (Cost $99,941) | | $ | 100,000 | | | | 99,942 | |
| | | | | | | | | |
| Total Investments – 98.0% | | | | | | | | |
| (Cost $2,788,540) | | | | | | $ | 2,943,473 | |
| Other Assets in Excess of Liabilities – 2.0% | | | | | | | 59,519 | |
| Net Assets – 100.0% | | | | | | $ | 3,002,992 | |
| (a) | Affiliated fund managed by Simplify Asset Management Inc. |
| (b) | A copy of the security’s annual report to shareholders may be obtained without charge at www.simplify.us. |
| (c) | A copy of the security’s annual report to shareholders may be obtained without charge at www.ishares.com. |
| (d) | Represents a zero coupon bond. Rate shown reflects the effective yield. |
| (e) | Security, or a portion thereof, in the amount of $99,942 has been pledged as collateral for futures as of June 30, 2024. |
At June 30, 2024, open futures contracts were as follows:
| | | Number of
Contracts | | | Notional
Value | | | Expiration
Date | | | Value/
Unrealized
Appreciation (Depreciation) | |
| Long position contracts: | | | | | | | | | | | | | | |
| S&P 500 E-Mini Future | | 6 | | | $ | 1,656,450 | | | 9/20/24 | | | $ | 5,550 | |
Affiliates
Fiscal year to date transactions with companies which are or were affiliates are as follows:
| Affiliate | | Value at
beginning of
the period | | | Purchases
Cost | | | Sales
Proceeds | | | Net Realized
Gain/(Loss) | | | Net Change
in Unrealized
Appreciation/
Depreciation | | | Value at the
end of the
period | | | Number of
Shares at
the end of
the period | | | Dividend
Income | | | Capital Gain
Distributions | |
| Simplify Multi-QIS Alternative ETF | | $ | — | | | $ | 1,905,087 | | | $ | (381,466 | ) | | $ | (4,184 | ) | | $ | (18,261 | ) | | $ | 1,501,176 | | | | 59,335 | | | $ | 56,067 | | | $ | — | |
See Notes to Financial Statements.
Simplify US Equity PLUS QIS ETF
Schedule of Investments (Continued)
June 30, 2024
Summary of Investment Type††
| Investment Categories | | % of Net
Assets | |
| Exchange-Traded Funds | | | 94.7 | % |
| U.S. Treasury Bills | | | 3.3 | % |
| Total Investments | | | 98.0 | % |
| Other Assets in Excess of Liabilities | | | 2.0 | % |
| Net Assets | | | 100.0 | % |
| †† | The percentage shown for each investment category is the total value of investments in that category as a percentage of the net assets of the Fund. The table depicts the Fund’s investments but may not represent the Fund’s market exposure to certain derivatives, if any, which are included in Other Assets in Excess of Liabilities. |
See Notes to Financial Statements.
Simplify Commodities Strategy No K-1 ETF
Consolidated Schedule of Investments
June 30, 2024
| | | Principal | | | Value | |
| U.S. Treasury Bills – 98.8% | | | | | | | | |
| U.S. Treasury Bill, 5.39%, 7/5/2024(a)(b) | | $ | 500,000 | | | $ | 499,709 | |
| U.S. Treasury Bill, 5.41%, 8/13/2024(a)(b) | | | 2,600,000 | | | | 2,583,749 | |
| U.S. Treasury Bill, 5.40%, 9/19/2024(a)(b) | | | 7,150,000 | | | | 7,067,251 | |
| Total U.S. Treasury Bills (Cost $10,149,994) | | | | | | | 10,150,709 | |
| | | | | | | | | |
| Total Investments – 98.8% | | | | | | | | |
| (Cost $10,149,994) | | | | | | $ | 10,150,709 | |
| Other Assets in Excess of Liabilities – 1.2% | | | | | | | 122,413 | |
| Net Assets – 100.0% | | | | | | $ | 10,273,122 | |
| (a) | Represents a zero coupon bond. Rate shown reflects the effective yield. |
| (b) | Securities with an aggregate market value of $2,186,955 have been pledged as collateral for futures as of June 30, 2024. |
At June 30, 2024, open futures contracts were as follows:
| | | Number of
Contracts | | | Notional
Value | | | Expiration
Date | | | Value/
Unrealized
Appreciation
(Depreciation) | |
| Long position contracts: | | | | | | | | | | | | | | |
| Natural Gas Future | | 4 | | | $ | 104,040 | | | 7/29/24 | | | $ | (18,386 | ) |
| NY Harbor ULSD Future | | 5 | | | | 531,951 | | | 7/31/24 | | | | (239 | ) |
| WTI Crude Future | | 5 | | | | 403,200 | | | 8/20/24 | | | | 960 | |
| GOLD 100 OZ FUTR | | 4 | | | | 935,840 | | | 8/28/24 | | | | (1,907 | ) |
| Natural Gas Future | | 8 | | | | 207,840 | | | 8/28/24 | | | | (30,037 | ) |
| NY Harbor ULSD Future | | 2 | | | | 214,108 | | | 8/30/24 | | | | (46 | ) |
| Soybean Future | | 2 | | | | 110,000 | | | 9/13/24 | | | | (2,583 | ) |
| WTI Crude Future | | 3 | | | | 239,280 | | | 9/20/24 | | | | 3,130 | |
| Copper Future | | 1 | | | | 109,788 | | | 9/26/24 | | | | (875 | ) |
| Natural Gas Future | | 8 | | | | 215,360 | | | 9/26/24 | | | | (31,028 | ) |
| NY Harbor ULSD Future | | 1 | | | | 107,428 | | | 9/30/24 | | | | (46 | ) |
| WTI Crude Future | | 3 | | | | 237,000 | | | 10/22/24 | | | | 2,880 | |
| Natural Gas Future | | 1 | | | | 30,810 | | | 10/29/24 | | | | (1,850 | ) |
| WTI Crude Future | | 10 | | | | 783,400 | | | 11/20/24 | | | | 10,540 | |
| Natural Gas Future | | 3 | | | | 106,740 | | | 11/26/24 | | | | (9,570 | ) |
| WTI Crude Future | | 1 | | | | 77,740 | | | 12/19/24 | | | | 130 | |
| Natural Gas Future | | 16 | | | | 611,840 | | | 12/27/24 | | | | (37,433 | ) |
| Natural Gas Future | | 9 | | | | 329,580 | | | 1/29/25 | | | | (13,440 | ) |
| Natural Gas Future | | 13 | | | | 423,020 | | | 2/26/25 | | | | (23,920 | ) |
| Natural Gas Future | | 2 | | | | 60,420 | | | 3/27/25 | | | | (2,450 | ) |
| Total unrealized appreciation/(depreciation) | | | | | | | | | | | | $ | (156,170 | ) |
| | | | | | | | | | | | | | | |
| Short position contracts: | | | | | | | | | | | | | | |
| Soybean Oil Future | | (3) | | | | (79,326 | ) | | 8/14/24 | | | | (240 | ) |
| Wheat Future (CBT) | | (17) | | | | (487,475 | ) | | 9/13/24 | | | | 19,512 | |
| Corn Future | | (10) | | | | (203,750 | ) | | 9/13/24 | | | | 10,537 | |
| Soybean Oil Future | | (2) | | | | (52,884 | ) | | 9/13/24 | | | | (126 | ) |
| Silver Future | | (1) | | | | (147,800 | ) | | 9/26/24 | | | | (1,450 | ) |
| Corn Future | | (7) | | | | (147,263 | ) | | 12/13/24 | | | | 7,212 | |
| Wheat Future (CBT) | | (6) | | | | (179,100 | ) | | 12/13/24 | | | | 7,063 | |
| Corn Future | | (1) | | | | (21,738 | ) | | 3/14/25 | | | | 987 | |
See Notes to Financial Statements.
Simplify Commodities Strategy No K-1 ETF
Consolidated Schedule of Investments (Continued)
June 30, 2024
| | | Number of
Contracts | | | Notional
Value | | | Expiration
Date | | | Value/
Unrealized
Appreciation (Depreciation) | |
| Short position contracts: (continued) | | | | | | | | | | | | | | |
| Total unrealized appreciation/(depreciation) | | | | | | | | | | | | $ | 43,495 | |
| Total net unrealized depreciation | | | | | | | | | | | | $ | (112,675 | ) |
Summary of Investment Type††
| Investment Categories | | % of Net
Assets | |
| U.S. Treasury Bills | | | 98.8 | % |
| Total Investments | | | 98.8 | % |
| Other Assets in Excess of Liabilities | | | 1.2 | % |
| Net Assets | | | 100.0 | % |
| †† | The percentage shown for each investment category is the total value of investments in that category as a percentage of the net assets of the Fund. The table depicts the Fund’s investments but may not represent the Fund’s market exposure to certain derivatives, if any, which are included in Other Assets in Excess of Liabilities. |
See Notes to Financial Statements.
Simplify Macro Strategy ETF
Consolidated Schedule of Investments
June 30, 2024
| | | Shares | | | Value | |
| Exchange-Traded Funds – 79.8% | | | | | | | | |
| Alternative Funds – 28.2% | | | | | | | | |
| Simplify Managed Futures Strategy ETF(a)(b) | | | 79,883 | | | $ | 2,150,450 | |
| Simplify Market Neutral Equity Long/Short ETF(b)(c) | | | 121,722 | | | | 2,871,422 | |
| | | | | | | | 5,021,872 | |
| Commodity Funds – 6.4% | | | | | | | | |
| iShares Gold Trust* | | | 25,892 | | | | 1,137,436 | |
| Equity Funds – 18.6% | | | | | | | | |
| Simplify Next Intangible Core Index ETF(a) | | | 36,956 | | | | 968,288 | |
| Simplify Next Intangible Value Index ETF(a) | | | 36,956 | | | | 960,246 | |
| Simplify US Equity PLUS QIS ETF(a) | | | 45,978 | | | | 1,383,961 | |
| | | | | | | | 3,312,495 | |
| Fixed Income Funds – 26.6% | | | | | | | | |
| Simplify High Yield PLUS Credit Hedge ETF(a)(b) | | | 96,041 | | | | 2,205,629 | |
| Simplify Intermediate Term Treasury Futures Strategy ETF(a)(b) | | | 26,945 | | | | 348,938 | |
| Simplify Short Term Treasury Futures Strategy ETF(a)(b) | | | 101,484 | | | | 2,163,639 | |
| | | | | | | | 4,718,206 | |
| Total Exchange-Traded Funds (Cost $13,869,434) | | | | | | | 14,190,009 | |
| | | Principal | | | | |
| U.S. Treasury Inflation Indexed Bonds – 18.5% | | | | | | | | |
| U.S. Treasury Inflation Indexed Bond, 0.13%, 2/15/2052(b) | | | | | | | | |
| (Cost $3,477,129) | | $ | 5,100,000 | | | | 3,297,212 | |
| | | Number of
Contracts | | | Notional
Amount | | | | |
| Purchased Options – 1.8% | | | | | | | | | | | |
| Calls – Exchange-Traded – 0.8% | | | | | | | | | | | |
| Carvana Co., August Strike Price $140, Expires 8/16/24(d) | | 100 | | | $ | 1,400,000 | | | | 123,250 | |
| S&P 500 Index, July Strike Price $5,540, Expires 7/12/24(d) | | 2 | | | | 1,108,000 | | | | 3,380 | |
| S&P 500 Index, July Strike Price $5,530, Expires 7/19/24(d) | | 2 | | | | 1,106,000 | | | | 6,010 | |
| S&P 500 Index, July Strike Price $5,535, Expires 7/26/24(d) | | 2 | | | | 1,107,000 | | | | 8,026 | |
| | | | | | | | | | | 140,666 | |
| Puts – Exchange-Traded – 1.0% | | | | | | | | | | | |
| Carvana Co., August Strike Price $65, Expires 8/16/24(d) | | 1,250 | | | | 8,125,000 | | | | 55,625 | |
| Carvana Co., August Strike Price $70, Expires 8/16/24(d) | | 500 | | | | 3,500,000 | | | | 33,500 | |
| S&P 500 Index, July Strike Price $4,920, Expires 7/05/24(d) | | 13 | | | | 6,396,000 | | | | 325 | |
| S&P 500 Index, July Strike Price $4,940, Expires 7/12/24(d) | | 13 | | | | 6,422,000 | | | | 936 | |
| S&P 500 Index, August Strike Price $4,500, Expires 8/30/24(d) | | 84 | | | | 37,800,000 | | | | 40,740 | |
| S&P 500 Index, August Strike Price $4,750, Expires 8/30/24(d) | | 50 | | | | 23,750,000 | | | | 39,750 | |
| | | | | | | | | | | 170,876 | |
| | | | | | | | | | | | |
| Total Purchased Options (Cost $2,101,756) | | | | | | | | | | 311,542 | |
| | | Shares | | | | |
| Money Market Funds – 0.3% | | | | | | | | |
| Fidelity Investments Money Market Treasury Only Portfolio - Class I, 5.19%(e) | | | | | | | | |
| (Cost $57,422) | | | 57,422 | | | | 57,422 | |
See Notes to Financial Statements.
Simplify Macro Strategy ETF
Consolidated Schedule of Investments (Continued)
June 30, 2024
| | | Value | |
| Total Investments – 100.4% | | | | |
| (Cost $19,505,741) | | $ | 17,856,185 | |
| Liabilities in Excess of Other Assets – (0.4)% | | | (70,772 | ) |
| Net Assets – 100.0% | | $ | 17,785,413 | |
| | | Number of
Contracts | | | Notional
Amount | | | | |
| Written Options – (3.0)% | | | | | | | | | | | |
| | | | | | | | | | | | |
| Calls – Exchange-Traded – (2.4)% | | | | | | | | | | | |
| 3 Month SOFR Future, December Strike Price $95.5, Expires 12/13/24 | | (400) | | | $ | (95,500,000 | ) | | $ | (95,000 | ) |
| Carvana Co., August Strike Price $100, Expires 8/16/24 | | (100) | | | | (1,000,000 | ) | | | (336,500 | ) |
| | | | | | | | | | | (431,500 | ) |
| Puts – Exchange-Traded – (0.6)% | | | | | | | | | | | |
| Carvana Co., August Strike Price $50, Expires 8/16/24 | | (1,250) | | | $ | (6,250,000 | ) | | $ | (30,000 | ) |
| S&P 500 Index, July Strike Price $5,250, Expires 7/05/24 | | (13) | | | | (6,825,000 | ) | | | (780 | ) |
| S&P 500 Index, July Strike Price $5,260, Expires 7/12/24 | | (13) | | | | (6,838,000 | ) | | | (5,538 | ) |
| S&P 500 Index, August Strike Price $4,250, Expires 8/30/24 | | (200) | | | | (85,000,000 | ) | | | (64,000 | ) |
| | | | | | | | | | | (100,318 | ) |
| | | | | | | | | | | | |
| Total Written Options (Premiums Received $1,109,962) | | | | | | | | | $ | (531,818 | ) |
| * | Non Income Producing |
| (a) | Affiliated fund managed by Simplify Asset Management Inc. |
| (b) | Securities with an aggregate market value of $10,714,822 have been pledged as collateral for options as of June 30, 2024. |
| (c) | Affiliated fund managed by Simplify EQLS, LLC. |
| (d) | Held in connection with Written Options. |
| (e) | Rate shown reflects the 7-day yield as of June 30, 2024. |
At June 30, 2024, open futures contracts were as follows:
| | | Number of
Contracts | | | Notional
Value | | | Expiration
Date | | | Value/
Unrealized
Appreciation
(Depreciation) | |
| Long position contracts: | | | | | | | | | | | | | | |
| 3 Month SOFR Future | | 400 | | | $ | 95,145,000 | | | 3/18/25 | | | $ | 185,000 | |
See Notes to Financial Statements.
Simplify Macro Strategy ETF
Consolidated Schedule of Investments (Continued)
June 30, 2024
Affiliates
Fiscal year to date transactions with companies which are or were affiliates are as follows:
| Affiliate | | Value at
beginning of
the period | | | Purchases
Cost | | | Sales
Proceeds | | | Net Realized
Gain/(Loss) | | | Net Change
in Unrealized
Appreciation/
Depreciation | | | Value at the
end of the
period | | | Number of
Shares at
the end of
the period | | | Dividend
Income | | | Capital Gain
Distributions | |
| Simplify Aggregate Bond ETF | | $ | 2,397,076 | | | $ | 1,006,275 | | | $ | (3,252,084 | ) | | $ | (217,443 | ) | | $ | 66,176 | | | $ | — | | | | — | | | $ | 172,789 | | | $ | — | |
| Simplify Commodities Strategy No K-1 ETF | | | 3,245,076 | | | | 27,079 | | | | (3,214,716 | ) | | | (107,931 | ) | | | 50,492 | | | | — | | | | — | | | | 26,200 | | | | — | |
| Simplify High Yield PLUS Credit Hedge ETF | | | 8,900,355 | | | | 73,292 | | | | (7,067,981 | ) | | | 158,493 | | | | 141,471 | | | | 2,205,629 | | | | 96,041 | | | | 306,042 | | | | — | |
| Simplify Interest Rate Hedge ETF | | | — | | | | 185,570 | | | | (179,349 | ) | | | (6,221 | ) | | | — | | | | — | | | | — | | | | — | | | | — | |
| Simplify Intermediate Term Treasury Futures Strategy ETF | | | 3,006,326 | | | | 10,046 | | | | (2,444,021 | ) | | | (428,670 | ) | | | 205,257 | | | | 348,938 | | | | 26,945 | | | | 51,725 | | | | — | |
| Simplify Managed Futures Strategy ETF | | | 7,095,936 | | | | 63,920 | | | | (5,303,085 | ) | | | 212,464 | | | | 81,215 | | | | 2,150,450 | | | | 79,883 | | | | 176,766 | | | | 125,988 | |
| Simplify Market Neutral Equity Long/Short ETF | | | 2,461,750 | | | | 6,957,311 | | | | (6,326,620 | ) | | | (223,182 | ) | | | 2,163 | | | | 2,871,422 | | | | 121,722 | | | | 12,172 | | | | — | |
| Simplify Next Intangible Core Index ETF | | | — | | | | 1,264,253 | | | | (357,991 | ) | | | 8,439 | | | | 53,587 | | | | 968,288 | | | | 36,956 | | | | 1,848 | | | | — | |
| Simplify Next Intangible Value Index ETF | | | — | | | | 1,278,132 | | | | (365,224 | ) | | | 11,823 | | | | 35,515 | | | | 960,246 | | | | 36,956 | | | | 1,848 | | | | — | |
| Simplify Short Term Treasury Futures Strategy ETF | | | 7,990,232 | | | | 2,634,534 | | | | (8,200,381 | ) | | | (714,556 | ) | | | 453,810 | | | | 2,163,639 | | | | 101,484 | | | | 242,607 | | | | — | |
| Simplify US Equity PLUS QIS ETF | | | — | | | | 2,713,546 | | | | (1,680,522 | ) | | | 143,739 | | | | 207,198 | | | | 1,383,961 | | | | 45,978 | | | | 55,901 | | | | — | |
| Simplify Volatility Premium ETF | | | 2,740,253 | | | | — | | | | (2,758,056 | ) | | | 135,519 | | | | (117,716 | ) | | | — | | | | — | | | | — | | | | — | |
| | | $ | 37,837,004 | | | $ | 16,213,958 | | | $ | (41,150,030 | ) | | $ | (1,027,526 | ) | | $ | 1,179,168 | | | $ | 13,052,573 | | | | 545,965 | | | $ | 1,047,898 | | | $ | 125,988 | |
See Notes to Financial Statements.
Simplify Macro Strategy ETF
Consolidated Schedule of Investments (Continued)
June 30, 2024
As of June 30, 2024, the Fund had the following forward foreign currency contracts outstanding:
| Counterparty | | Settlement
Date | | | Currency To
Deliver | | | Currency To
Receive | | | Unrealized
Appreciation | | | Unrealized
Depreciation | |
| Nomura Securities | | 9/18/2024 | | | AUD | 1,550,000 | | | USD | 1,027,776 | | | $ | — | | | $ | (8,404 | ) |
| BNY Mellon Capital Market | | 9/18/2024 | | | BRL | 2,667,076 | | | USD | 476,000 | | | | 3,244 | | | | — | |
| BNY Mellon Capital Market | | 9/18/2024 | | | BRL | 1,286,930 | | | USD | 238,000 | | | | 9,884 | | | | — | |
| Nomura Securities | | 9/18/2024 | | | CAD | 2,900,000 | | | USD | 2,122,881 | | | | — | | | | (1,037 | ) |
| Nomura Securities | | 9/18/2024 | | | CAD | 1,920,000 | | | USD | 1,399,348 | | | | — | | | | (6,832 | ) |
| Nomura Securities | | 9/18/2024 | | | CHF | 340,000 | | | USD | 381,980 | | | | — | | | | (191 | ) |
| Nomura Securities | | 9/18/2024 | | | CHF | 620,000 | | | USD | 701,095 | | | | 4,196 | | | | — | |
| Nomura Securities | | 9/18/2024 | | | CHF | 630,000 | | | USD | 710,144 | | | | 2,005 | | | | — | |
| Nomura Securities | | 9/18/2024 | | | GBP | 840,000 | | | USD | 1,061,801 | | | | — | | | | (687 | ) |
| Nomura Securities | | 9/18/2024 | | | GBP | 850,000 | | | USD | 1,079,281 | | | | 4,143 | | | | — | |
| The Bank of New York Mellon | | 9/18/2024 | | | HUF | 449,165,953 | | | USD | 1,201,000 | | | | — | | | | (13,406 | ) |
| The Bank of New York Mellon | | 9/18/2024 | | | HUF | 156,892,720 | | | USD | 424,000 | | | | — | | | | (189 | ) |
| BNY Mellon Capital Market | | 9/18/2024 | | | IDR | 28,355,081,756 | | | USD | 1,717,657 | | | | — | | | | (11,606 | ) |
| Nomura Securities | | 9/18/2024 | | | JPY | 391,000,000 | | | USD | 2,493,059 | | | | 32,409 | | | | — | |
| Nomura Securities | | 9/18/2024 | | | JPY | 57,480,000 | | | USD | 361,659 | | | | — | | | | (75 | ) |
| The Bank of New York Mellon | | 9/18/2024 | | | MXN | 2,927,598 | | | USD | 158,000 | | | | — | | | | (5 | ) |
| The Bank of New York Mellon | | 9/18/2024 | | | MXN | 6,577,900 | | | USD | 349,000 | | | | — | | | | (6,015 | ) |
| Nomura Securities | | 9/18/2024 | | | NOK | 4,190,000 | | | USD | 394,221 | | | | 996 | | | | — | |
| Nomura Securities | | 9/18/2024 | | | NOK | 11,160,000 | | | USD | 1,049,333 | | | | 1,984 | | | | — | |
| Nomura Securities | | 9/18/2024 | | | NOK | 11,240,000 | | | USD | 1,065,287 | | | | 10,430 | | | | — | |
| Nomura Securities | | 9/18/2024 | | | NOK | 14,720,000 | | | USD | 1,390,387 | | | | 8,938 | | | | — | |
| Nomura Securities | | 9/18/2024 | | | NZD | 1,743,000 | | | USD | 1,067,666 | | | | 6,020 | | | | — | |
| Nomura Securities | | 9/18/2024 | | | NZD | 1,727,000 | | | USD | 1,060,594 | | | | 8,693 | | | | — | |
| Nomura Securities | | 9/18/2024 | | | SEK | 7,330,000 | | | USD | 703,080 | | | | 8,609 | | | | — | |
| Nomura Securities | | 9/18/2024 | | | SEK | 7,320,000 | | | USD | 701,781 | | | | 8,257 | | | | — | |
| The Bank of New York Mellon | | 9/18/2024 | | | SGD | 341,353 | | | USD | 254,000 | | | | 1,295 | | | | — | |
| The Bank of New York Mellon | | 9/18/2024 | | | SGD | 386,093 | | | USD | 286,000 | | | | 175 | | | | — | |
| The Bank of New York Mellon | | 9/18/2024 | | | SGD | 1,275,242 | | | USD | 951,602 | | | | 7,538 | | | | — | |
| The Bank of New York Mellon | | 9/18/2024 | | | TWD | 20,646,610 | | | USD | 641,000 | | | | — | | | | (1,108 | ) |
| The Bank of New York Mellon | | 9/18/2024 | | | TWD | 25,885,593 | | | USD | 808,041 | | | | 3,001 | | | | — | |
| Nomura Securities | | 9/18/2024 | | | USD | 254,303 | | | AUD | 380,000 | | | | — | | | | (272 | ) |
| Nomura Securities | | 9/18/2024 | | | USD | 2,088,831 | | | AUD | 3,160,000 | | | | 23,638 | | | | — | |
| BNY Mellon Capital Market | | 9/18/2024 | | | USD | 290,000 | | | BRL | 1,593,015 | | | | — | | | | (7,628 | ) |
| The Bank of New York Mellon | | 9/18/2024 | | | USD | 1,034,513 | | | BRL | 5,658,269 | | | | — | | | | (31,550 | ) |
| The Bank of New York Mellon | | 9/18/2024 | | | USD | 656,000 | | | BRL | 3,578,874 | | | | — | | | | (21,623 | ) |
| Nomura Securities | | 9/18/2024 | | | USD | 1,405,797 | | | CAD | 1,920,000 | | | | 382 | | | | — | |
| Nomura Securities | | 9/18/2024 | | | USD | 1,060,926 | | | CAD | 1,450,000 | | | | 1,033 | | | | — | |
| Nomura Securities | | 9/18/2024 | | | USD | 1,064,117 | | | CAD | 1,450,000 | | | | — | | | | (2,158 | ) |
| Nomura Securities | | 9/18/2024 | | | USD | 2,141,732 | | | GBP | 1,690,000 | | | | — | | | | (4,106 | ) |
| The Bank of New York Mellon | | 9/18/2024 | | | USD | 323,250 | | | HUF | 117,998,903 | | | | — | | | | (4,217 | ) |
| The Bank of New York Mellon | | 9/18/2024 | | | USD | 887,000 | | | HUF | 327,036,900 | | | | — | | | | (2,793 | ) |
| The Bank of New York Mellon | | 9/18/2024 | | | USD | 1,496,000 | | | HUF | 556,850,096 | | | | 9,551 | | | | — | |
| BNY Mellon Capital Market | | 9/18/2024 | | | USD | 1,710,000 | | | IDR | 28,261,170,000 | | | | 13,536 | | | | — | |
| Nomura Securities | | 9/18/2024 | | | USD | 1,053,419 | | | JPY | 164,110,000 | | | | — | | | | (20,638 | ) |
| The Bank of New York Mellon | | 9/18/2024 | | | USD | 838,136 | | | MXN | 16,141,530 | | | | 33,035 | | | | — | |
| Nomura Securities | | 9/18/2024 | | | USD | 1,063,746 | | | NOK | 11,240,000 | | | | — | | | | (8,889 | ) |
| Nomura Securities | | 9/18/2024 | | | USD | 1,051,095 | | | NOK | 11,160,000 | | | | — | | | | (3,746 | ) |
See Notes to Financial Statements.
Simplify Macro Strategy ETF
Consolidated Schedule of Investments (Continued)
June 30, 2024
| Counterparty | | Settlement
Date | | | Currency To
Deliver | | | Currency To
Receive | | | Unrealized
Appreciation | | | Unrealized
Depreciation | |
| Nomura Securities | | 9/18/2024 | | | USD | 2,128,224 | | | NZD | 3,470,000 | | | $ | — | | | $ | (14,677 | ) |
| Nomura Securities | | 9/18/2024 | | | USD | 2,656,456 | | | NZD | 4,360,000 | | | | — | | | | (818) | |
| Nomura Securities | | 9/18/2024 | | | USD | 1,401,006 | | | SEK | 14,650,000 | | | | — | | | | (13,011 | ) |
| Nomura Securities | | 9/18/2024 | | | USD | 1,338,828 | | | SEK | 14,120,000 | | | | — | | | | (1,047 | ) |
| The Bank of New York Mellon | | 9/18/2024 | | | USD | 416,000 | | | SGD | 561,683 | | | | — | | | | (185 | ) |
| BNY Mellon Capital Market | | 9/18/2024 | | | USD | 1,225,321 | | | TWD | 39,639,134 | | | | 7,453 | | | | — | |
| BNY Mellon Capital Market | | 9/18/2024 | | | USD | 217,000 | | | TWD | 6,996,080 | | | | 577 | | | | — | |
| The Bank of New York Mellon | | 9/18/2024 | | | USD | 642,000 | | | ZAR | 11,913,722 | | | | 8,782 | | | | — | |
| The Bank of New York Mellon | | 9/18/2024 | | | USD | 810,991 | | | ZAR | 15,109,940 | | | | 14,384 | | | | — | |
| The Bank of New York Mellon | | 9/18/2024 | | | ZAR | 6,154,989 | | | USD | 335,000 | | | | — | | | | (1,214 | ) |
| The Bank of New York Mellon | | 9/18/2024 | | | ZAR | 4,338,717 | | | USD | 234,000 | | | | — | | | | (3,001 | ) |
| BNY Mellon Capital Market | | 9/19/2024 | | | CNH | 2,947,641 | | | USD | 406,000 | | | | — | | | | (344 | ) |
| The Bank of New York Mellon | | 9/19/2024 | | | CNH | 1,190,690 | | | USD | 165,000 | | | | 859 | | | | — | |
| The Bank of New York Mellon | | 9/19/2024 | | | CNH | 2,298,618 | | | USD | 319,045 | | | | 2,172 | | | | — | |
| The Bank of New York Mellon | | 9/19/2024 | | | HKD | 2,765,912 | | | USD | 355,000 | | | | — | | | | (6 | ) |
| The Bank of New York Mellon | | 9/19/2024 | | | KRW | 802,644,200 | | | USD | 586,000 | | | | 136 | | | | — | |
| The Bank of New York Mellon | | 9/19/2024 | | | KRW | 1,512,602,615 | | | USD | 1,111,701 | | | | 7,627 | | | | — | |
| BNY Mellon Capital Market | | 9/19/2024 | | | USD | 438,000 | | | KRW | 600,760,800 | | | | 505 | | | | — | |
| Total unrealized appreciation (depreciation) | | | | | | | | | | | | | $ | 245,487 | | | $ | (191,478 | ) |
Currency Abbreviations
| AUD | Australian Dollar |
| BRL | Brazilian Real |
| CAD | Canadian Dollar |
| CHF | Swiss Franc |
| CNH | Chinese Yuan |
| GBP | Pound Sterling |
| HKD | Hong Kong Dollar |
| HUF | Hungarian Forint |
| IDR | Indonesian Rupiah |
| JPY | Japanese Yen |
| KRW | South Korean Won |
| MXN | Mexican Peso |
| NOK | Norwegian Krone |
| NZD | New Zealand Dollar |
| SEK | Swedish Krona |
| SGD | Singapore Dollar |
| TWD | New Taiwan Dollar |
| USD | U.S. Dollar |
| ZAR | South African Rand |
See Notes to Financial Statements.
Simplify Macro Strategy ETF
Consolidated Schedule of Investments (Continued)
June 30, 2024
Summary of Investment Type††
| Investment Categories | | % of Net
Assets | |
| Exchange-Traded Funds | | | 79.8 | % |
| U.S. Treasury Inflation Indexed Bonds | | | 18.6 | % |
| Purchased Options | | | 1.8 | % |
| Money Market Funds | | | 0.3 | % |
| Total Investments | | | 100.5 | % |
| Liabilities in Excess of Other Assets | | | (0.5 | )% |
| Net Assets | | | 100.0 | % |
| †† | The percentage shown for each investment category is the total value of investments in that category as a percentage of the net assets of the Fund. The table depicts the Fund’s investments but may not represent the Fund’s market exposure to certain derivatives, if any, which are included in Liabilities in Excess of Other Assets. |
See Notes to Financial Statements.
Simplify Managed Futures Strategy ETF
Consolidated Schedule of Investments
June 30, 2024
| | | Principal | | | Value | |
| U.S. Treasury Bills – 93.1% | | | | | | | | |
| U.S. Treasury Bill, 5.37%, 7/5/2024(a)(b) | | $ | 8,000,000 | | | $ | 7,995,347 | |
| U.S. Treasury Bill, 5.23%, 8/13/2024(a)(b) | | | 9,200,000 | | | | 9,142,498 | |
| U.S. Treasury Bill, 5.29%, 9/19/2024(a)(b) | | | 175,600,000 | | | | 173,567,723 | |
| Total U.S. Treasury Bills (Cost $190,691,701) | | | | | | | 190,705,568 | |
| | | | | | | | | |
| Total Investments – 93.1% | | | | | | | | |
| (Cost $190,691,701) | | | | | | $ | 190,705,568 | |
| Other Assets in Excess of Liabilities – 6.9% | | | | | | | 14,164,034 | |
| Net Assets – 100.0% | | | | | | $ | 204,869,602 | |
| (a) | Represents a zero coupon bond. Rate shown reflects the effective yield. |
| (b) | Securities with an aggregate market value of $116,743,573 have been pledged as collateral for futures as of June 30, 2024. |
At June 30, 2024, open futures contracts were as follows:
| | | Number of
Contracts | | | Notional
Value | | | Expiration
Date | | | Value/
Unrealized
Appreciation
(Depreciation) | |
| Long position contracts: | | | | | | | | | | | | | | |
| Natural Gas Future | | 8 | | | $ | 208,080 | | | 7/29/24 | | | $ | (34,912 | ) |
| WTI Crude Future | | 15 | | | | 1,209,600 | | | 8/20/24 | | | | 2,142 | |
| Natural Gas Future | | 57 | | | | 1,480,860 | | | 8/28/24 | | | | (248,720 | ) |
| Live Cattle Future | | 171 | | | | 12,683,070 | | | 8/30/24 | | | | 230,252 | |
| WTI Crude Future | | 33 | | | | 2,632,080 | | | 9/20/24 | | | | 5,780 | |
| Natural Gas Future | | 45 | | | | 1,211,400 | | | 9/26/24 | | | | (123,549 | ) |
| Sugar #11 (World) Future | | 435 | | | | 9,890,160 | | | 9/30/24 | | | | 423,868 | |
| WTI Crude Future | | 41 | | | | 3,239,000 | | | 10/22/24 | | | | 9,750 | |
| Live Cattle Future | | 183 | | | | 13,532,850 | | | 10/31/24 | | | | 53,171 | |
| WTI Crude Future | | 111 | | | | 8,695,740 | | | 11/20/24 | | | | 27,000 | |
| Natural Gas Future | | 13 | | | | 462,540 | | | 11/26/24 | | | | (36,535 | ) |
| WTI Crude Future | | 17 | | | | 1,321,580 | | | 12/19/24 | | | | 4,680 | |
| Gold 100 OZ Future | | 2 | | | | 477,120 | | | 12/27/24 | | | | (895 | ) |
| Natural Gas Future | | 161 | | | | 6,156,640 | | | 12/27/24 | | | | (506,816 | ) |
| Live Cattle Future | | 27 | | | | 2,007,720 | | | 12/31/24 | | | | (4,340 | ) |
| WTI Crude Future | | 7 | | | | 540,190 | | | 1/21/25 | | | | 1,970 | |
| Natural Gas Future | | 69 | | | | 2,526,780 | | | 1/29/25 | | | | (158,328 | ) |
| WTI Crude Future | | 18 | | | | 1,379,700 | | | 2/20/25 | | | | 4,440 | |
| Natural Gas Future | | 152 | | | | 4,946,080 | | | 2/26/25 | | | | (473,166 | ) |
| Sugar #11 (World) Future | | 103 | | | | 2,375,262 | | | 2/28/25 | | | | 85,351 | |
| Natural Gas Future | | 23 | | | | 694,830 | | | 3/27/25 | | | | (29,220 | ) |
| Sugar #11 (World) Future | | 19 | | | | 418,152 | | | 4/30/25 | | | | 7,235 | |
| Total unrealized appreciation/(depreciation) | | | | | | | | | | | | $ | (760,842 | ) |
| | | | | | | | | | | | | | | |
| Short position contracts: | | | | | | | | | | | | | | |
| Soybean Oil Future | | (287) | | | | (7,588,854 | ) | | 8/14/24 | | | | 7,715 | |
| Corn Future | | (525) | | | | (10,696,875 | ) | | 9/13/24 | | | | 958,842 | |
| Wheat Future (CBT) | | (398) | | | | (11,412,650 | ) | | 9/13/24 | | | | 838,734 | |
| Soybean Oil Future | | (172) | | | | (4,548,024 | ) | | 9/13/24 | | | | (834 | ) |
See Notes to Financial Statements
Simplify Managed Futures Strategy ETF
Consolidated Schedule of Investments (Continued)
June 30, 2024
| | | Number of
Contracts | | | Notional
Value | | | Expiration
Date | | | Value/
Unrealized
Appreciation
(Depreciation) | |
| Short position contracts: (continued) | | | | | | | | | | | | |
| CAN 10Year Bond Future | | (792) | | | $ | (69,511,670 | ) | | 9/18/24 | | | $ | (696,222 | ) |
| Copper Future | | (58) | | | | (6,367,675 | ) | | 9/26/24 | | | | 11,827 | |
| Silver Future | | (56) | | | | (8,276,800 | ) | | 9/26/24 | | | | (32,153 | ) |
| U.S. 5 Year Note (CBT) | | (1,584) | | | | (168,819,750 | ) | | 9/30/24 | | | | 653,219 | |
| Soybean Oil Future | | (8) | | | | (210,384 | ) | | 10/14/24 | | | | (1,200 | ) |
| Cotton No. 2 Future | | (91) | | | | (3,307,395 | ) | | 12/6/24 | | | | 22,549 | |
| Corn Future | | (509) | | | | (10,708,088 | ) | | 12/13/24 | | | | 853,467 | |
| Wheat Future (CBT) | | (158) | | | | (4,716,300 | ) | | 12/13/24 | | | | 383,267 | |
| 3-Month CORRA Futures | | (750) | | | | (130,916,268 | ) | | 12/17/24 | | | | (30,835 | ) |
| Copper Future | | (14) | | | | (1,543,850 | ) | | 12/27/24 | | | | 20,081 | |
| Silver Future | | (8) | | | | (1,199,600 | ) | | 12/27/24 | | | | 9,850 | |
| Cotton No. 2 Future | | (40) | | | | (1,487,200 | ) | | 3/7/25 | | | | 9,817 | |
| Corn Future | | (51) | | | | (1,108,612 | ) | | 3/14/25 | | | | 67,012 | |
| Wheat Future (CBT) | | (23) | | | | (707,825 | ) | | 3/14/25 | | | | (7,538 | ) |
| 3 Month SOFR Future | | (401) | | | | (95,382,862 | ) | | 3/18/25 | | | | 365,033 | |
| 3-Month CORRA Futures | | (758) | | | | (132,638,226 | ) | | 3/18/25 | | | | (55,215 | ) |
| Corn Future | | (10) | | | | (222,125 | ) | | 5/14/25 | | | | 7,750 | |
| 3 Month SOFR Future | | (290) | | | | (69,190,375 | ) | | 6/17/25 | | | | 130,489 | |
| 3-Month CORRA Futures | | (514) | | | | (90,162,750 | ) | | 6/17/25 | | | | (108,179 | ) |
| 3 Month SOFR Future | | (993) | | | | (237,538,012 | ) | | 9/16/25 | | | | (176,787 | ) |
| 3 Month SOFR Future | | (1,156) | | | | (277,093,200 | ) | | 12/16/25 | | | | 266,824 | |
| Total unrealized appreciation/(depreciation) | | | | | | | | | | | | $ | 3,497,513 | |
| Total net unrealized appreciation | | | | | | | | | | | | $ | 2,736,671 | |
Summary of Investment Type††
| Investment Categories | | % of Net
Assets | |
| U.S. Treasury Bills | | | 93.1 | % |
| Total Investments | | | 93.1 | % |
| Other Assets in Excess of Liabilities | | | 6.9 | % |
| Net Assets | | | 100.0 | % |
| †† | The percentage shown for each investment category is the total value of investments in that category as a percentage of the net assets of the Fund. The table depicts the Fund’s investments but may not represent the Fund’s market exposure to certain derivatives, if any, which are included in Other Assets in Excess of Liabilities. |
See Notes to Financial Statements
(This page intentionally left blank)
Simplify Exchange Traded Funds
Statements of Assets and Liabilities
June 30, 2024
| | | Simplify
Aggregate
Bond ETF | | | Simplify Health
Care ETF | | | Simplify
Hedged Equity
ETF | | | Simplify High
Yield PLUS
Credit Hedge
ETF | |
| Assets | | | | | | | | | | | | | | | | |
| Investments, at value | | $ | 216,332,119 | | | $ | 131,340,531 | | | $ | 171,437,038 | | | $ | 154,447,439 | |
| Cash | | | 197,702 | | | | — | | | | — | | | | 2,452,695 | |
| Cash held as collateral for swaps | | | — | | | | — | | | | — | | | | 788,570 | |
| Unrealized appreciation on over the counter swaps | | | — | | | | — | | | | — | | | | 66,807 | |
| Receivables: | | | | | | | | | | | | | | | | |
| Securities sold | | | 10,031,718 | | | | 5,798,748 | | | | 65,063 | | | | — | |
| Due from broker | | | 1,251,064 | | | | — | | | | — | | | | 18 | |
| Prepaid expenses | | | 58 | | | | 58 | | | | 403 | | | | 403 | |
| Interest | | | — | | | | — | | | | 659 | | | | — | |
| Dividends | | | — | | | | 62,827 | | | | — | | | | 15,536 | |
| Foreign tax reclaim | | | — | | | | 18,461 | | | | — | | | | — | |
| Capital shares | | | — | | | | — | | | | 4,147,521 | | | | — | |
| Total assets | | | 227,812,661 | | | | 137,220,625 | | | | 175,650,684 | | | | 157,771,468 | |
| | | | | | | | | | | | | | | | | |
| Liabilities | | | | | | | | | | | | | | | | |
| Unrealized depreciation on over the counter swaps | | | — | | | | — | | | | — | | | | 851,984 | |
| Payables: | | | | | | | | | | | | | | | | |
| Securities purchased | | | 20,035,156 | | | | — | | | | 4,156,865 | | | | — | |
| Written options | | | 398,438 | | | | — | | | | 2,761,945 | | | | 14,692 | |
| Investment advisory fees | | | 41,683 | | | | 51,376 | | | | 65,970 | | | | 32,012 | |
| Reset of swaps | | | — | | | | — | | | | — | | | | 705,000 | |
| Total liabilities | | | 20,475,277 | | | | 51,376 | | | | 6,984,780 | | | | 1,603,688 | |
| Net Assets | | $ | 207,337,384 | | | $ | 137,169,249 | | | $ | 168,665,904 | | | $ | 156,167,780 | |
| | | | | | | | | | | | | | | | | |
| Net Assets Consist of | | | | | | | | | | | | | | | | |
| Paid-in capital | | $ | 208,275,577 | | | $ | 135,912,138 | | | $ | 177,250,175 | | | $ | 157,385,532 | |
| Distributable earnings (loss) | | | (938,193 | ) | | | 1,257,111 | | | | (8,584,271 | ) | | | (1,217,752 | ) |
| Net Assets | | $ | 207,337,384 | | | $ | 137,169,249 | | | $ | 168,665,904 | | | $ | 156,167,780 | |
| Number of Common Shares outstanding | | | 10,000,001 | | | | 4,375,001 | | | | 6,100,001 | | | | 6,800,001 | |
| Net Asset Value, offering and redemption price per share | | $ | 20.73 | | | $ | 31.35 | | | $ | 27.65 | | | $ | 22.97 | |
| Investments, at cost | | $ | 216,098,429 | | | $ | 122,966,528 | | | $ | 159,758,116 | | | $ | 154,503,964 | |
| Premiums received | | $ | 529,979 | | | $ | — | | | $ | 1,519,827 | | | $ | 42,692 | |
See Notes to Financial Statements.
Simplify Exchange Traded Funds
Statements of Assets and Liabilities (Continued)
June 30, 2024
| | | Simplify
Interest Rate
Hedge ETF | | | Simplify
Intermediate
Term Treasury
Futures
Strategy ETF | | | Simplify Market
Neutral Equity
Long/Short ETF | | | Simplify MBS
ETF | |
| Assets | | | | | | | | | | | | | | | | |
| Investments, at value | | $ | 145,095,490 | | | $ | 48,144,002 | | | $ | 153,291,142 | | | $ | 1,485,575,455 | |
| Cash | | | 328,707 | | | | — | | | | 1,888,440 | | | | 173,026 | |
| Unrealized appreciation on over the counter swaps | | | 1,923 | | | | — | | | | 1,178,349 | | | | — | |
| Receivables: | | | | | | | | | | | | | | | | |
| Due from broker | | | 39,905 | | | | — | | | | — | | | | — | |
| Interest | | | 31,841 | | | | 773 | | | | — | | | | — | |
| Prepaid expenses | | | 1,150 | | | | 173 | | | | 30 | | | | — | |
| Capital shares | | | — | | | | 3,569,726 | | | | — | | | | — | |
| Securities sold | | | — | | | | 791,505 | | | | — | | | | — | |
| Total assets | | | 145,499,016 | | | | 52,506,179 | | | | 156,357,961 | | | | 1,485,748,481 | |
| | | | | | | | | | | | | | | | | |
| Liabilities | | | | | | | | | | | | | | | | |
| Due to custodian | | | — | | | | 363,115 | | | | — | | | | — | |
| Payables: | | | | | | | | | | | | | | | | |
| Investment advisory fees | | | 57,869 | | | | 5,498 | | | | 126,774 | | | | 89,931 | |
| Securities purchased | | | — | | | | 3,459,470 | | | | — | | | | 735,351,613 | |
| Total liabilities | | | 57,869 | | | | 3,828,083 | | | | 126,774 | | | | 735,441,544 | |
| Net Assets | | $ | 145,441,147 | | | $ | 48,678,096 | | | $ | 156,231,187 | | | $ | 750,306,937 | |
| | | | | | | | | | | | | | | | | |
| Net Assets Consist of | | | | | | | | | | | | | | | | |
| Paid-in capital | | $ | 128,345,010 | | | $ | 75,950,902 | | | $ | 157,003,507 | | | $ | 751,032,970 | |
| Distributable earnings (loss) | | | 17,096,137 | | | | (27,272,806 | ) | | | (772,320 | ) | | | (726,033 | ) |
| Net Assets | | $ | 145,441,147 | | | $ | 48,678,096 | | | $ | 156,231,187 | | | $ | 750,306,937 | |
| Number of Common Shares outstanding | | | 3,025,001 | | | | 3,750,001 | | | | 6,625,001 | | | | 14,900,001 | |
| Net Asset Value, offering and redemption price per share | | $ | 48.08 | | | $ | 12.98 | | | $ | 23.58 | | | $ | 50.36 | |
| Investments, at cost | | $ | 124,080,612 | | | $ | 48,139,284 | | | $ | 153,282,815 | | | $ | 1,483,489,262 | |
See Notes to Financial Statements.
Simplify Exchange Traded Funds
Statements of Assets and Liabilities (Continued)
June 30, 2024
| | | Simplify Multi-
QIS Alternative
ETF | | | Simplify Next
Intangible Core
Index ETF | | | Simplify Next
Intangible Value
Index ETF | | | Simplify Short
Term Treasury
Futures
Strategy ETF | |
| Assets | | | | | | | | | | | | | | | | |
| Investments, at value | | $ | 114,454,112 | | | $ | 2,619,756 | | | $ | 2,598,182 | | | $ | 536,323,255 | |
| Cash | | | 128,576 | | | | — | | | | — | | | | 269,459 | |
| Deposit at Broker for Option Contracts | | | 64,975 | | | | — | | | | — | | | | — | |
| Unrealized appreciation on over the counter swaps | | | 1,018,664 | | | | — | | | | — | | | | — | |
| Receivables: | | | | | | | | | | | | | | | | |
| Dividends | | | — | | | | 1,574 | | | | 1,773 | | | | — | |
| Prepaid expenses | | | — | | | | — | | | | — | | | | 2,248 | |
| Due from broker | | | — | | | | — | | | | — | | | | 2,550,592 | |
| Securities sold | | | — | | | | — | | | | 61 | | | | — | |
| Total assets | | | 115,666,327 | | | | 2,621,330 | | | | 2,600,016 | | | | 539,145,554 | |
| | | | | | | | | | | | | | | | | |
| Liabilities | | | | | | | | | | | | | | | | |
| Unrealized depreciation on over the counter swaps | | | 630,830 | | | | — | | | | — | | | | — | |
| Payables: | | | | | | | | | | | | | | | | |
| Investment advisory fees | | | 94,299 | | | | 526 | | | | 530 | | | | 65,953 | |
| Written options | | | 1,898 | | | | — | | | | — | | | | — | |
| Total liabilities | | | 727,027 | | | | 526 | | | | 530 | | | | 65,953 | |
| Net Assets | | $ | 114,939,300 | | | $ | 2,620,804 | | | $ | 2,599,486 | | | $ | 539,079,601 | |
| | | | | | | | | | | | | | | | | |
| Net Assets Consist of | | | | | | | | | | | | | | | | |
| Paid-in capital | | $ | 114,051,627 | | | $ | 2,500,025 | | | $ | 2,500,025 | | | $ | 591,729,358 | |
| Distributable earnings (loss) | | | 887,673 | | | | 120,779 | | | | 99,461 | | | | (52,649,757 | ) |
| Net Assets | | $ | 114,939,300 | | | $ | 2,620,804 | | | $ | 2,599,486 | | | $ | 539,079,601 | |
| Number of Common Shares outstanding | | | 4,550,001 | | | | 100,001 | | | | 100,001 | | | | 25,275,001 | |
| Net Asset Value, offering and redemption price per share | | $ | 25.26 | | | $ | 26.21 | | | $ | 25.99 | | | $ | 21.33 | |
| Investments, at cost | | $ | 114,469,360 | | | $ | 2,528,765 | | | $ | 2,559,476 | | | $ | 536,270,680 | |
| Premiums received | | $ | 12,637 | | | $ | — | | | $ | — | | | $ | — | |
See Notes to Financial Statements.
Simplify Exchange Traded Funds
Statements of Assets and Liabilities (Continued)
June 30, 2024
| | | Simplify US
Equity PLUS
GBTC ETF | | | Simplify US
Equity PLUS
QIS ETF | |
| Assets | | | | | | | | |
| Investments in unaffiliated securities, at value | | $ | 21,456,737 | | | $ | 1,442,297 | |
| Investments in affiliated securities, at value | | | — | | | | 1,501,176 | |
| Cash | | | — | | | | 3,720 | |
| Receivables: | | | | | | | | |
| Securities sold | | | 820,816 | | | | 35,569 | |
| Due from broker | | | 497,573 | | | | 70,426 | |
| Interest | | | 1,944 | | | | — | |
| Prepaid expenses | | | 58 | | | | — | |
| Total assets | | | 22,777,128 | | | | 3,053,188 | |
| | | | | | | | | |
| Liabilities | | | | | | | | |
| Payables: | | | | | | | | |
| Securities purchased | | | 1,242,314 | | | | 48,975 | |
| Investment advisory fees | | | 8,359 | | | | 1,221 | |
| Total liabilities | | | 1,250,673 | | | | 50,196 | |
| Net Assets | | $ | 21,526,455 | | | $ | 3,002,992 | |
| | | | | | | | | |
| Net Assets Consist of | | | | | | | | |
| Paid-in capital | | $ | 24,448,086 | | | $ | 2,470,447 | |
| Distributable earnings (loss) | | | (2,921,631 | ) | | | 532,545 | |
| Net Assets | | $ | 21,526,455 | | | $ | 3,002,992 | |
| Number of Common Shares outstanding | | | 625,001 | | | | 100,001 | |
| Net Asset Value, offering and redemption price per share | | $ | 34.44 | | | $ | 30.03 | |
| Investments, at cost | | $ | 19,906,220 | | | $ | 1,269,103 | |
| Investments in affiliated securities, at cost | | $ | — | | | $ | 1,519,437 | |
See Notes to Financial Statements.
Simplify Exchange Traded Funds
Consolidated Statements of Assets and Liabilities
June 30, 2024
| | | Simplify
Commodities
Strategy No K-1
ETF | | | Simplify Macro
Strategy ETF | | | Simplify
Managed
Futures
Strategy ETF | |
| Assets | | | | | | | | | | | | |
| Investments in unaffiliated securities, at value | | $ | 10,150,709 | | | $ | 4,803,612 | | | $ | 190,705,568 | |
| Investments in affiliated securities, at value | | | — | | | | 13,052,573 | | | | — | |
| Cash | | | 5,460 | | | | 128,264 | | | | 2,282,592 | |
| Unrealized appreciation on forward foreign currency contracts | | | — | | | | 245,487 | | | | — | |
| Receivables: | | | | | | | | | | | | |
| Due from broker | | | 123,381 | | | | — | | | | 23,731,060 | |
| Prepaid expenses | | | 30 | | | | 58 | | | | 403 | |
| Interest | | | — | | | | 3,329 | | | | — | |
| Securities sold | | | — | | | | 699,291 | | | | — | |
| Investment adviser | | | — | | | | 86,333 | | | | — | |
| Total assets | | | 10,279,580 | | | | 19,018,947 | | | | 216,719,623 | |
| | | | | | | | | | | | | |
| Liabilities | | | | | | | | | | | | |
| Unrealized depreciation on forward foreign currency contracts | | | — | | | | 191,478 | | | | — | |
| Payables: | | | | | | | | | | | | |
| Investment advisory fees | | | 6,458 | | | | — | | | | 123,746 | |
| Due to broker | | | — | | | | 504,761 | | | | — | |
| Capital shares | | | — | | | | — | | | | 1,347,826 | |
| Securities purchased | | | — | | | | 5,477 | | | | 10,378,449 | |
| Written options | | | — | | | | 531,818 | | | | — | |
| Total liabilities | | | 6,458 | | | | 1,233,534 | | | | 11,850,021 | |
| Net Assets | | $ | 10,273,122 | | | $ | 17,785,413 | | | $ | 204,869,602 | |
| | | | | | | | | | | | | |
| Net Assets Consist of | | | | | | | | | | | | |
| Paid-in capital | | $ | 10,350,976 | | | $ | 21,952,822 | | | $ | 193,185,005 | |
| Distributable earnings (loss) | | | (77,854 | ) | | | (4,167,409 | ) | | | 11,684,597 | |
| Net Assets | | $ | 10,273,122 | | | $ | 17,785,413 | | | $ | 204,869,602 | |
| Number of Common Shares outstanding | | | 425,001 | | | | 850,001 | | | | 7,600,001 | |
| Net Asset Value, offering and redemption price per share | | $ | 24.17 | | | $ | 20.92 | | | $ | 26.96 | |
| Investments, at cost | | $ | 10,149,994 | | | $ | 6,484,937 | | | $ | 190,691,701 | |
| Investments in affiliated securities, at cost | | $ | — | | | $ | 13,020,804 | | | $ | — | |
| Premiums received | | $ | — | | | $ | 1,109,962 | | | $ | — | |
See Notes to Financial Statements.
Simplify Exchange Traded Funds
Statements of Operations
For the Year Ended June 30, 2024
| | | Simplify
Aggregate
Bond ETF | | | Simplify Health
Care ETF | | | Simplify
Hedged Equity
ETF | | | Simplify High
Yield PLUS
Credit Hedge
ETF | |
| Investment Income | | | | | | | | | | | | | | | | |
| Dividend income | | $ | 2,166,733 | | | $ | 797,691 | | | $ | 2,563,272 | | | $ | — | |
| Interest income | | | 3,806,243 | | | | — | | | | — | | | | 3,788,182 | |
| Total income | | | 5,972,976 | | | | 797,691 | | | | 2,563,272 | | | | 3,788,182 | |
| | | | | | | | | | | | | | | | | |
| Expenses | | | | | | | | | | | | | | | | |
| Investment advisory fees | | | 671,047 | | | | 426,070 | | | | 754,254 | | | | 362,128 | |
| Interest expense | | | 32,439 | | | | 126 | | | | 15,775 | | | | 3,098 | |
| Other expenses | | | 94 | | | | — | | | | 100 | | | | — | |
| Total expenses | | | 703,580 | | | | 426,196 | | | | 770,129 | | | | 365,226 | |
| Less fees waived: | | | | | | | | | | | | | | | | |
| Waiver | | | (351,681 | ) | | | — | | | | — | | | | (181,068 | ) |
| Net expenses | | | 351,899 | | | | 426,196 | | | | 770,129 | | | | 184,158 | |
| Net investment income (loss) | | | 5,621,077 | | | | 371,495 | | | | 1,793,143 | | | | 3,604,024 | |
| | | | | | | | | | | | | | | | | |
| Realized and Unrealized Gain (Loss) | | | | | | | | | | | | | | | | |
| Net realized gain (loss) from: | | | | | | | | | | | | | | | | |
| Investments | | | (2,013,119 | ) | | | (431,783 | ) | | | (5,749,173 | ) | | | (582,571 | ) |
| In-kind redemptions | | | 55,093 | | | | 6,935,472 | | | | 30,611,866 | | | | — | |
| Futures | | | (1,565,246 | ) | | | — | | | | — | | | | — | |
| Swaps | | | 7,364 | | | | — | | | | — | | | | 4,923,017 | |
| Written options | | | 2,861,197 | | | | — | | | | (6,544,735 | ) | | | 277,655 | |
| Net realized gain (loss) | | | (654,711 | ) | | | 6,503,689 | | | | 18,317,958 | | | | 4,618,101 | |
| Net change in unrealized appreciation (depreciation) on: | | | | | | | | | | | | | | | | |
| Investments | | | 283,689 | | | | 6,718,265 | | | | 3,902,210 | | | | (10,994 | ) |
| Futures | | | 328,056 | | | | — | | | | — | | | | — | |
| Swaps | | | (2,346 | ) | | | — | | | | — | | | | (736,809 | ) |
| Written options | | | 103,354 | | | | — | | | | (18,710 | ) | | | (3,135 | ) |
| Net unrealized gain (loss) | | | 712,753 | | | | 6,718,265 | | | | 3,883,500 | | | | (750,938 | ) |
| Net realized and unrealized gain (loss) | | | 58,042 | | | | 13,221,954 | | | | 22,201,458 | | | | 3,867,163 | |
| Net Increase (Decrease) in Net Assets Resulting from Operations | | $ | 5,679,119 | | | $ | 13,593,449 | | | $ | 23,994,601 | | | $ | 7,471,187 | |
See Notes to Financial Statements.
Simplify Exchange Traded Funds
Statements of Operations (Continued)
For the Year Ended June 30, 2024
| | | Simplify
Interest Rate
Hedge ETF | | | Simplify
Intermediate
Term Treasury
Futures
Strategy ETF | | |
Simplify Market
Neutral Equity
Long/Short ETF | | | Simplify MBS
ETF(1) | |
| Investment Income | | | | | | | | | | | | | | | | |
| Dividend income | | $ | — | | | $ | 11,624 | | | $ | — | | | $ | — | |
| Interest income | | | 7,519,177 | | | | 2,477,103 | | | | 6,371,039 | | | | 13,722,311 | |
| Total income | | | 7,519,177 | | | | 2,488,727 | | | | 6,371,039 | | | | 13,722,311 | |
| | | | | | | | | | | | | | | | | |
| Expenses | | | | | | | | | | | | | | | | |
| Investment advisory fees | | | 873,405 | | | | 118,977 | | | | 1,196,259 | | | | 646,463 | |
| Interest expense | | | 159 | | | | 211 | | | | — | | | | 62,463 | |
| Total expenses | | | 873,564 | | | | 119,188 | | | | 1,196,259 | | | | 708,926 | |
| Less fees waived: | | | | | | | | | | | | | | | | |
| Waiver | | | — | | | | (48,106 | ) | | | — | | | | (258,585 | ) |
| Net expenses | | | 873,564 | | | | 71,082 | | | | 1,196,259 | | | | 450,341 | |
| Net investment income (loss) | | | 6,645,613 | | | | 2,417,645 | | | | 5,174,780 | | | | 13,271,970 | |
| | | | | | | | | | | | | | | | | |
| Realized and Unrealized Gain (Loss) | | | | | | | | | | | | | | | | |
| Net realized gain (loss) from: | | | | | | | | | | | | | | | | |
| Investments | | | 24,670,221 | | | | 19,432 | | | | 953 | | | | (2,812,226 | ) |
| Futures | | | — | | | | (10,807,134 | ) | | | — | | | | — | |
| Swaps | | | — | | | | — | | | | 1,568,686 | | | | — | |
| Net realized gain (loss) | | | 24,670,221 | | | | (10,787,702 | ) | | | 1,569,639 | | | | (2,812,226 | ) |
| Net change in unrealized appreciation (depreciation) on: | | | | | | | | | | | | | | | | |
| Investments | | | 28,080,558 | | | | (6,383 | ) | | | 7,510 | | | | 2,086,193 | |
| Futures | | | — | | | | 3,928,917 | | | | — | | | | — | |
| Swaps | | | 728 | | | | — | | | | 1,184,238 | | | | — | |
| Net unrealized gain (loss) | | | 28,081,286 | | | | 3,922,534 | | | | 1,191,748 | | | | 2,086,193 | |
| Net realized and unrealized gain (loss) | | | 52,751,507 | | | | (6,865,168 | ) | | | 2,761,387 | | | | (726,033 | ) |
| Net Increase (Decrease) in Net Assets Resulting from Operations | | $ | 59,397,120 | | | $ | (4,447,523 | ) | | $ | 7,936,167 | | | $ | 12,545,937 | |
| (1) | For the period November 7, 2023 (commencement of operations) through June 30, 2024. |
See Notes to Financial Statements.
Simplify Exchange Traded Funds
Statements of Operations (Continued)
For the Year Ended June 30, 2024
| | | Simplify Multi-
QIS Alternative
ETF(1) | | | Simplify Next
Intangible Core
Index ETF(2) | | | Simplify Next
Intangible Value
Index ETF(2) | | | Simplify Short
Term Treasury
Futures
Strategy ETF | |
| Investment Income | | | | | | | | | | | | | | | | |
| Dividend income* | | $ | — | | | $ | 7,554 | | | $ | 10,505 | | | $ | — | |
| Interest income | | | 5,876,634 | | | | — | | | | — | | | | 31,529,193 | |
| Total income | | | 5,876,634 | | | | 7,554 | | | | 10,505 | | | | 31,529,193 | |
| | | | | | | | | | | | | | | | | |
| Expenses | | | | | | | | | | | | | | | | |
| Investment advisory fees | | | 1,095,980 | | | | 1,303 | | | | 1,313 | | | | 1,492,632 | |
| Interest expense | | | 70 | | | | — | | | | 1 | | | | 3,278 | |
| Total expenses | | | 1,096,050 | | | | 1,303 | | | | 1,314 | | | | 1,495,910 | |
| Less fees waived: | | | | | | | | | | | | | | | | |
| Waiver | | | — | | | | — | | | | — | | | | (610,624 | ) |
| Net expenses | | | 1,096,050 | | | | 1,303 | | | | 1,314 | | | | 885,286 | |
| Net investment income (loss) | | | 4,780,584 | | | | 6,251 | | | | 9,191 | | | | 30,643,907 | |
| | | | | | | | | | | | | | | | | |
| Realized and Unrealized Gain (Loss) | | | | | | | | | | | | | | | | |
| Net realized gain (loss) from: | | | | | | | | | | | | | | | | |
| Investments | | | (119,319 | ) | | | 28,537 | | | | 56,564 | | | | 43,215 | |
| Futures | | | — | | | | — | | | | — | | | | (57,457,682 | ) |
| Swaps | | | 35,149 | | | | — | | | | — | | | | — | |
| Written options | | | 17,186 | | | | — | | | | — | | | | — | |
| Net realized gain (loss) | | | (66,984 | ) | | | 28,537 | | | | 56,564 | | | | (57,414,467 | ) |
| Net change in unrealized appreciation (depreciation) on: | | | | | | | | | | | | | | | | |
| Investments | | | (15,248 | ) | | | 90,991 | | | | 38,706 | | | | (64,354 | ) |
| Futures | | | — | | | | — | | | | — | | | | 30,980,859 | |
| Swaps | | | 387,834 | | | | — | | | | — | | | | — | |
| Written options | | | 10,739 | | | | — | | | | — | | | | — | |
| Net unrealized gain (loss) | | | 383,325 | | | | 90,991 | | | | 38,706 | | | | 30,916,505 | |
| Net realized and unrealized gain (loss) | | | 316,341 | | | | 119,528 | | | | 95,270 | | | | (26,497,962 | ) |
| Net Increase (Decrease) in Net Assets Resulting from Operations | | $ | 5,096,925 | | | $ | 125,779 | | | $ | 104,461 | | | $ | 4,145,945 | |
| * Withholding tax | | $ | — | | | $ | 16 | | | $ | — | | | $ | — | |
| (1) | For the period July 11, 2023 (commencement of operations) through June 30, 2024. |
| (2) | For the period April 16, 2024 (commencement of operations) through June 30, 2024. |
See Notes to Financial Statements.
Simplify Exchange Traded Funds
Statements of Operations (Continued)
For the Year Ended June 30, 2024
| | | Simplify US
Equity PLUS
GBTC ETF | | | Simplify US
Equity PLUS
QIS ETF(1) | |
| Investment Income | | | | | | | | |
| Unaffiliated dividend income | | $ | 144,881 | | | $ | 14,316 | |
| Affiliated dividend income | | | — | | | | 56,067 | |
| Interest income | | | — | | | | 7,406 | |
| Total income | | | 144,881 | | | | 77,789 | |
| | | | | | | | | |
| Expenses | | | | | | | | |
| Investment advisory fees | | | 53,810 | | | | 10,319 | |
| Interest expense | | | 1,265 | | | | 1,307 | |
| Total expenses | | | 55,075 | | | | 11,626 | |
| Net investment income (loss) | | | 89,806 | | | | 66,163 | |
| | | | | | | | | |
| Realized and Unrealized Gain (Loss) | | | | | | | | |
| Net realized gain (loss) from: | | | | | | | | |
| Investments | | | 31,283 | | | | 131,774 | |
| Affiliated investments | | | — | | | | (4,184 | ) |
| In-kind redemptions | | | 949,211 | | | | — | |
| Futures | | | 278,100 | | | | 308,966 | |
| Net realized gain (loss) | | | 1,258,594 | | | | 436,556 | |
| Net change in unrealized appreciation (depreciation) on: | | | | | | | | |
| Investments | | | 1,726,506 | | | | 173,194 | |
| Affiliated investments | | | — | | | | (18,261 | ) |
| Futures | | | (21,628 | ) | | | 5,550 | |
| Net unrealized gain (loss) | | | 1,704,878 | | | | 160,483 | |
| Net realized and unrealized gain (loss) | | | 2,963,472 | | | | 597,039 | |
| Net Increase (Decrease) in Net Assets Resulting from Operations | | $ | 3,053,278 | | | $ | 663,202 | |
| (1) | For the period November 14, 2023 (commencement of operations) through June 30, 2024. |
See Notes to Financial Statements.
Simplify Exchange Traded Funds
Consolidated Statements of Operations
For the Year Ended June 30, 2024
| | | Simplify
Commodities
Strategy No K-1
ETF | | | Simplify Macro
Strategy ETF | | | Simplify
Managed
Futures
Strategy ETF | |
| Investment Income | | | | | | | | | | | | |
| Affiliated dividend income | | $ | — | | | $ | 1,047,898 | | | $ | — | |
| Interest income | | | 423,664 | | | | 331,603 | | | | 7,417,152 | |
| Total income | | | 423,664 | | | | 1,379,501 | | | | 7,417,152 | |
| | | | | | | | | | | | | |
| Expenses | | | | | | | | | | | | |
| Investment advisory fees | | | 65,614 | | | | 244,892 | | | | 1,155,079 | |
| Interest expense | | | — | | | | 35,434 | | | | 10,492 | |
| Other expenses | | | — | | | | 59 | | | | — | |
| Total expenses | | | 65,614 | | | | 280,385 | | | | 1,165,571 | |
| Less fees waived: | | | | | | | | | | | | |
| Waiver | | | — | | | | (81,958 | ) | | | — | |
| Net expenses | | | 65,614 | | | | 198,427 | | | | 1,165,571 | |
| Net investment income (loss) | | | 358,050 | | | | 1,181,074 | | | | 6,251,581 | |
| | | | | | | | | | | | | |
| Realized and Unrealized Gain (Loss) | | | | | | | | | | | | |
| Net realized gain (loss) from: | | | | | | | | | | | | |
| Investments | | | (33 | ) | | | (2,863,283 | ) | | | 9,403 | |
| Affiliated investments | | | — | | | | (870,015 | ) | | | — | |
| Affiliated in-kind redemptions | | | — | | | | (157,511 | ) | | | — | |
| Futures | | | (336,685 | ) | | | 683,332 | | | | 17,163,890 | |
| Written options | | | — | | | | 858,514 | | | | — | |
| Forward foreign currency contracts | | | — | | | | (145,620 | ) | | | — | |
| Foreign currency transactions | | | — | | | | — | | | | (70,711 | ) |
| Capital gain distributions from affiliated funds | | | — | | | | 125,988 | | | | — | |
| Net realized gain (loss) | | | (336,718 | ) | | | (2,368,595 | ) | | | 17,102,582 | |
| Net change in unrealized appreciation (depreciation) on: | | | | | | | | | | | | |
| Investments | | | 652 | | | | (2,257,873 | ) | | | 11,350 | |
| Affiliated investments | | | — | | | | 1,179,168 | | | | — | |
| Forward foreign currency contracts | | | — | | | | 54,009 | | | | — | |
| Foreign currency translations | | | — | | | | — | | | | 2,458 | |
| Futures | | | (119,744 | ) | | | 185,000 | | | | (3,536,458 | ) |
| Written options | | | — | | | | 29,575 | | | | — | |
| Net unrealized gain (loss) | | | (119,092 | ) | | | (810,121 | ) | | | (3,522,650 | ) |
| Net realized and unrealized gain (loss) | | | (455,810 | ) | | | (3,178,716 | ) | | | 13,579,932 | |
| Net Increase (Decrease) in Net Assets Resulting from Operations | | $ | (97,760 | ) | | $ | (1,997,642 | ) | | $ | 19,831,513 | |
See Notes to Financial Statements.
Simplify Exchange Traded Funds
Statements of Changes in Net Assets
| | | Simplify Aggregate Bond ETF | | | Simplify Health Care ETF | |
| | | Year Ended
June 30,
2024 | | | Year Ended
June 30,
2023 | | | Year Ended
June 30,
2024 | | | Year Ended
June 30,
2023 | |
| Increase (Decrease) in Net Assets from Operations | | | | | | | | | | | | | | | | |
| Net investment income (loss) | | $ | 5,621,077 | | | $ | 89,130 | | | $ | 371,495 | | | $ | 353,397 | |
| Net realized gain (loss) | | | (654,711 | ) | | | (123,717 | ) | | | 6,503,689 | | | | (3,223,584 | ) |
| Net change in net unrealized appreciation (depreciation) | | | 712,753 | | | | 20,355 | | | | 6,718,265 | | | | 4,827,651 | |
| Net increase (decrease) in net assets resulting from operations | | | 5,679,119 | | | | (14,232 | ) | | | 13,593,449 | | | | 1,957,464 | |
| | | | | | | | | | | | | | | | | |
| Distributions to Shareholders from: | | | | | | | | | | | | | | | | |
| Distributions | | | (6,394,098 | ) | | | (193,442 | ) | | | (490,865 | ) | | | (399,848 | ) |
| Return of capital | | | (8,368,404 | ) | | | (98,448 | ) | | | — | | | | — | |
| Total distributions | | | (14,762,502 | ) | | | (291,890 | ) | | | (490,865 | ) | | | (399,848 | ) |
| | | | | | | | | | | | | | | | | |
| Fund Shares Transactions | | | | | | | | | | | | | | | | |
| Proceeds from shares sold | | | 209,989,955 | | | | 13,780,959 | | | | 134,296,970 | | | | 94,962,880 | |
| Value of shares redeemed | | | (5,381,902 | ) | | | (2,844,322 | ) | | | (69,294,326 | ) | | | (71,260,601 | ) |
| Net increase (decrease) in net assets resulting from fund share transactions | | | 204,608,053 | | | | 10,936,637 | | | | 65,002,644 | | | | 23,702,279 | |
| Total net increase (decrease) in Net Assets | | | 195,524,670 | | | | 10,630,515 | | | | 78,105,228 | | | | 25,259,895 | |
| | | | | | | | | | | | | | | | | |
| Net Assets | | | | | | | | | | | | | | | | |
| Beginning of period | | | 11,812,714 | | | | 1,182,199 | | | | 59,064,021 | | | | 33,804,126 | |
| End of period | | $ | 207,337,384 | | | $ | 11,812,714 | | | $ | 137,169,249 | | | $ | 59,064,021 | |
| | | | | | | | | | | | | | | | | |
| Changes in Shares Outstanding | | | | | | | | | | | | | | | | |
| Shares outstanding, beginning of period | | | 525,001 | | | | 50,001 | | | | 2,225,001 | | | | 1,375,001 | |
| Shares sold | | | 9,725,000 | | | | 600,000 | | | | 4,700,000 | | | | 3,675,000 | |
| Shares redeemed | | | (250,000 | ) | | | (125,000 | ) | | | (2,550,000 | ) | | | (2,825,000 | ) |
| Shares outstanding, end of period | | | 10,000,001 | | | | 525,001 | | | | 4,375,001 | | | | 2,225,001 | |
See Notes to Financial Statements.
Simplify Exchange Traded Funds
Statements of Changes in Net Assets (Continued)
| | | Simplify Hedged Equity ETF | | | Simplify High Yield PLUS Credit Hedge ETF | |
| | | Year Ended
June 30,
2024 | | | Year Ended
June 30,
2023 | | | Year Ended
June 30,
2024 | | | Year Ended
June 30,
2023 | |
| Increase (Decrease) in Net Assets from Operations | | | | | | | | | | | | | | | | |
| Net investment income (loss) | | $ | 1,793,143 | | | $ | 900,809 | | | $ | 3,604,024 | | | $ | 1,342,066 | |
| Net realized gain (loss) | | | 18,317,958 | | | | (537,959 | ) | | | 4,618,101 | | | | 534,079 | |
| Net change in net unrealized appreciation (depreciation) | | | 3,883,500 | | | | 10,760,851 | | | | (750,938 | ) | | | 54,828 | |
| Net increase (decrease) in net assets resulting from operations | | | 23,994,601 | | | | 11,123,701 | | | | 7,471,187 | | | | 1,930,973 | |
| | | | | | | | | | | | | | | | | |
| Distributions to Shareholders from: | | | | | | | | | | | | | | | | |
| Distributions | | | (6,120,484 | ) | | | (4,428,969 | ) | | | (4,715,001 | ) | | | (2,959,704 | ) |
| Return of capital | | | — | | | | — | | | | — | | | | (708,226 | ) |
| Total distributions | | | (6,120,484 | ) | | | (4,428,969 | ) | | | (4,715,001 | ) | | | (3,667,930 | ) |
| | | | | | | | | | | | | | | | | |
| Fund Shares Transactions | | | | | | | | | | | | | | | | |
| Proceeds from shares sold | | | 242,299,095 | | | | 119,805,768 | | | | 120,041,111 | | | | 43,515,463 | |
| Value of shares redeemed | | | (198,304,502 | ) | | | (57,066,544 | ) | | | (11,870,064 | ) | | | (26,548,334 | ) |
| Net increase (decrease) in net assets resulting from fund share transactions | | | 43,994,593 | | | | 62,739,224 | | | | 108,171,047 | | | | 16,967,129 | |
| Total net increase (decrease) in Net Assets | | | 61,868,710 | | | | 69,433,956 | | | | 110,927,233 | | | | 15,230,172 | |
| | | | | | | | | | | | | | | | | |
| Net Assets | | | | | | | | | | | | | | | | |
| Beginning of period | | | 106,797,195 | | | | 37,363,239 | | | | 45,240,547 | | | | 30,010,375 | |
| End of period | | $ | 168,665,905 | | | $ | 106,797,195 | | | $ | 156,167,780 | | | $ | 45,240,547 | |
| | | | | | | | | | | | | | | | | |
| Changes in Shares Outstanding | | | | | | | | | | | | | | | | |
| Shares outstanding, beginning of period | | | 4,300,001 | | | | 1,625,001 | | | | 2,075,001 | | | | 1,350,001 | |
| Shares sold | | | 9,325,000 | | | | 5,125,000 | | | | 5,250,000 | | | | 1,925,000 | |
| Shares redeemed | | | (7,525,000 | ) | | | (2,450,000 | ) | | | (525,000 | ) | | | (1,200,000 | ) |
| Shares outstanding, end of period | | | 6,100,001 | | | | 4,300,001 | | | | 6,800,001 | | | | 2,075,001 | |
See Notes to Financial Statements.
Simplify Exchange Traded Funds
Statements of Changes in Net Assets (Continued)
| | | Simplify Interest Rate Hedge ETF | | | Simplify Intermediate Term
Treasury Futures Strategy ETF | |
| | | Year Ended
June 30,
2024 | | | Year Ended
June 30,
2023 | | | Year Ended
June 30,
2024 | | | Year Ended
June 30,
2023 | |
| Increase (Decrease) in Net Assets from Operations | | | | | | | | | | | | | | | | |
| Net investment income (loss) | | $ | 6,645,613 | | | $ | 6,979,611 | | | $ | 2,417,645 | | | $ | 1,338,107 | |
| Net realized gain (loss) | | | 24,670,221 | | | | 93,935,396 | | | | (10,787,702 | ) | | | (8,252,209 | ) |
| Net change in net unrealized appreciation (depreciation) | | | 28,081,286 | | | | (58,638,322 | ) | | | 3,922,534 | | | | (1,461,252 | ) |
| Net increase (decrease) in net assets resulting from operations | | | 59,397,120 | | | | 42,276,685 | | | | (4,447,523 | ) | | | (8,375,354 | ) |
| | | | | | | | | | | | | | | | | |
| Distributions | | | (76,106,598 | ) | | | (3,979,978 | ) | | | (2,051,789 | ) | | | (1,438,455 | ) |
| | | | | | | | | | | | | | | | | |
| Fund Shares Transactions | | | | | | | | | | | | | | | | |
| Proceeds from shares sold | | | 47,576,466 | | | | 14,379,391 | | | | 18,754,647 | | | | 51,335,724 | |
| Variable transaction fees (see Note 7) | | | 1,814,321 | | | | 2,285,825 | | | | — | | | | — | |
| Value of shares redeemed | | | (105,095,882 | ) | | | (139,082,947 | ) | | | (16,917,836 | ) | | | (28,395,498 | ) |
| Net increase (decrease) in net assets resulting from fund share transactions | | | (55,705,095 | ) | | | (122,417,731 | ) | | | 1,836,811 | | | | 22,940,226 | |
| Total net increase (decrease) in Net Assets | | | (72,414,573 | ) | | | (84,121,024 | ) | | | (4,662,501 | ) | | | 13,126,417 | |
| | | | | | | | | | | | | | | | | |
| Net Assets | | | | | | | | | | | | | | | | |
| Beginning of period | | | 217,855,720 | | | | 301,976,744 | | | | 53,340,597 | | | | 40,214,180 | |
| End of period | | $ | 145,441,147 | | | $ | 217,855,720 | | | $ | 48,678,096 | | | $ | 53,340,597 | |
| | | | | | | | | | | | | | | | | |
| Changes in Shares Outstanding | | | | | | | | | | | | | | | | |
| Shares outstanding, beginning of period | | | 3,400,001 | | | | 5,275,001 | | | | 3,625,001 | | | | 2,200,001 | |
| Shares sold | | | 950,000 | | | | 200,000 | | | | 1,400,000 | | | | 3,075,000 | |
| Shares redeemed | | | (1,325,000 | ) | | | (2,075,000 | ) | | | (1,275,000 | ) | | | (1,650,000 | ) |
| Shares outstanding, end of period | | | 3,025,001 | | | | 3,400,001 | | | | 3,750,001 | | | | 3,625,001 | |
See Notes to Financial Statements.
Simplify Exchange Traded Funds
Statements of Changes in Net Assets (Continued)
| | | Simplify Market Neutral Equity Long/Short ETF | | | Simplify MBS ETF | | | Simplify Multi- QIS Alternative ETF | |
| | | Year Ended June 30,
2024 | | | For the period
June 14,
2023(1) to June 30,
2023 | | | For the period
November 7,
2023(1) to June 30,
2024 | | | For the period
July 11,
2023(1) to
June 30,
2024 | |
| Increase (Decrease) in Net Assets from Operations | | | | | | | | | | | | | | | | |
| Net investment income (loss) | | $ | 5,174,780 | | | $ | 5,382 | | | $ | 13,271,970 | | | $ | 4,780,584 | |
| Net realized gain (loss) | | | 1,569,639 | | | | (84,475 | ) | | | (2,812,226 | ) | | | (66,984 | ) |
| Net change in net unrealized appreciation (depreciation) | | | 1,191,748 | | | | (5,072 | ) | | | 2,086,193 | | | | 383,325 | |
| Net increase (decrease) in net assets resulting from operations | | | 7,936,167 | | | | (84,165 | ) | | | 12,545,937 | | | | 5,096,925 | |
| | | | | | | | | | | | | | | | | |
| Distributions to Shareholders from: | | | | | | | | | | | | | | | | |
| Distributions | | | (8,626,872 | ) | | | — | | | | (13,271,970 | ) | | | (4,209,252 | ) |
| Return of capital | | | (687,184 | ) | | | — | | | | (2,807,611 | ) | | | — | |
| Total distributions | | | (9,314,056 | ) | | | — | | | | (16,079,581 | ) | | | (4,209,252 | ) |
| | | | | | | | | | | | | | | | | |
| Fund Shares Transactions | | | | | | | | | | | | | | | | |
| Proceeds from shares sold | | | 162,082,194 | | | | 4,358,968 | | | | 786,576,820 | | | | 127,357,696 | |
| Value of shares redeemed | | | (8,747,921 | ) | | | — | | | | (32,736,239 | ) | | | (13,306,069 | ) |
| Net increase (decrease) in net assets resulting from fund share transactions | | | 153,334,273 | | | | 4,358,968 | | | | 753,840,581 | | | | 114,051,627 | |
| Total net increase (decrease) in Net Assets | | | 151,956,384 | | | | 4,274,803 | | | | 750,306,937 | | | | 114,939,300 | |
| | | | | | | | | | | | | | | | | |
| Net Assets | | | | | | | | | | | | | | | | |
| Beginning of period | | | 4,274,803 | | | | — | | | | — | | | | — | |
| End of period | | $ | 156,231,187 | | | $ | 4,274,803 | | | $ | 750,306,937 | | | $ | 114,939,300 | |
| | | | | | | | | | | | | | | | | |
| Changes in Shares Outstanding | | | | | | | | | | | | | | | | |
| Shares outstanding, beginning of period | | | 175,001 | | | | — | | | | — | | | | — | |
| Shares sold | | | 6,825,000 | | | | 175,001 | (2) | | | 15,550,001 | (2) | | | 5,075,001 | (2) |
| Shares redeemed | | | (375,000 | ) | | | — | | | | (650,000 | ) | | | (525,000 | ) |
| Shares outstanding, end of period | | | 6,625,001 | | | | 175,001 | | | | 14,900,001 | | | | 4,550,001 | |
| (1) | Commencement of operations. |
| (2) | Shares not in increment of 25,000 shares, a creation unit, represent the Adviser’s initial seed investment in connection with the commencement of operations. |
See Notes to Financial Statements.
Simplify Exchange Traded Funds
Statements of Changes in Net Assets (Continued)
| | | Simplify Next
Intangible Core
Index ETF | | | Simplify Next
Intangible Value
Index ETF | | | Simplify Short Term Treasury
Futures Strategy ETF | |
| | | For the period
April 16,
2024(1) to
June 30,
2024 | | | For the period
April 16,
2024(1) to
June 30,
2024 | | | Year Ended
June 30,
2024 | | | For the period
November 15,
2022(1) to
June 30,
2023 | |
| Increase (Decrease) in Net Assets from Operations | | | | | | | | | | | | | | | | |
| Net investment income (loss) | | $ | 6,251 | | | $ | 9,191 | | | $ | 30,643,907 | | | $ | 3,561,571 | |
| Net realized gain (loss) | | | 28,537 | | | | 56,564 | | | | (57,414,467 | ) | | | (3,945,448 | ) |
| Net change in net unrealized appreciation (depreciation) | | | 90,991 | | | | 38,706 | | | | 30,916,505 | | | | (23,180,351 | ) |
| Net increase (decrease) in net assets resulting from operations | | | 125,779 | | | | 104,461 | | | | 4,145,945 | | | | (23,564,228 | ) |
| | | | | | | | | | | | | | | | | |
| Distributions | | | (5,000 | ) | | | (5,000 | ) | | | (28,690,445 | ) | | | (4,542,976 | ) |
| | | | | | | | | | | | | | | | | |
| Fund Shares Transactions | | | | | | | | | | | | | | | | |
| Proceeds from shares sold | | | 2,500,025 | | | | 2,500,025 | | | | 661,933,504 | | | | 595,701,359 | |
| Value of shares redeemed | | | — | | | | — | | | | (632,576,103 | ) | | | (33,327,455 | ) |
| Net increase (decrease) in net assets resulting from fund share transactions | | | 2,500,025 | | | | 2,500,025 | | | | 29,357,401 | | | | 562,373,904 | |
| Total net increase (decrease) in Net Assets | | | 2,620,804 | | | | 2,599,486 | | | | 4,812,901 | | | | 534,266,700 | |
| | | | | | | | | | | | | | | | | |
| Net Assets | | | | | | | | | | | | | | | | |
| Beginning of period | | | — | | | | — | | | | 534,266,700 | | | | — | |
| End of period | | $ | 2,620,804 | | | $ | 2,599,486 | | | $ | 539,079,601 | | | $ | 534,266,700 | |
| | | | | | | | | | | | | | | | | |
| Changes in Shares Outstanding | | | | | | | | | | | | | | | | |
| Shares outstanding, beginning of period | | | — | | | | — | | | | 23,575,001 | | | | — | |
| Shares sold | | | 100,001 | (2) | | | 100,001 | (2) | | | 29,975,000 | | | | 24,925,001 | (2) |
| Shares redeemed | | | — | | | | — | | | | (28,275,000 | ) | | | (1,350,000 | ) |
| Shares outstanding, end of period | | | 100,001 | | | | 100,001 | | | | 25,275,001 | | | | 23,575,001 | |
| (1) | Commencement of operations. |
| (2) | Shares not in increment of 25,000 shares, a creation unit, represent the Adviser’s initial seed investment in connection with the commencement of operations. |
See Notes to Financial Statements.
Simplify Exchange Traded Funds
Statements of Changes in Net Assets (Continued)
| | | Simplify US Equity PLUS GBTC
ETF | | | Simplify US
Equity PLUS
QIS ETF | |
| | | Year Ended
June 30,
2024 | | | Year Ended
June 30,
2023 | | | For the period
November 14,
2023(1) to
June 30,
2024 | |
| Increase (Decrease) in Net Assets from Operations | | | | | | | | | | | | |
| Net investment income (loss) | | $ | 89,806 | | | $ | 270,618 | | | $ | 66,163 | |
| Net realized gain (loss) | | | 1,258,594 | | | | (11,061,508 | ) | | | 436,556 | |
| Net change in net unrealized appreciation (depreciation) | | | 1,704,878 | | | | 16,227,543 | | | | 160,483 | |
| Net increase (decrease) in net assets resulting from operations | | | 3,053,278 | | | | 5,436,653 | | | | 663,202 | |
| | | | | | | | | | | | | |
| Distributions to Shareholders from: | | | | | | | | | | | | |
| Distributions | | | (41,389 | ) | | | (94,553 | ) | | | (77,979 | ) |
| Return of capital | | | (93,611 | ) | | | (174,233 | ) | | | — | |
| Total distributions | | | (135,000 | ) | | | (268,786 | ) | | | (77,979 | ) |
| | | | | | | | | | | | | |
| Fund Shares Transactions | | | | | | | | | | | | |
| Proceeds from shares sold | | | 19,130,905 | | | | 1,855,304 | | | | 3,136,051 | |
| Value of shares redeemed | | | (9,264,119 | ) | | | (85,622,116 | ) | | | (718,282 | ) |
| Net increase (decrease) in net assets resulting from fund share transactions | | | 9,866,786 | | | | (83,766,812 | ) | | | 2,417,769 | |
| Total net increase (decrease) in Net Assets | | | 12,785,064 | | | | (78,598,945 | ) | | | 3,002,992 | |
| | | | | | | | | | | | | |
| Net Assets | | | | | | | | | | | | |
| Beginning of period | | | 8,741,391 | | | | 87,340,336 | | | | — | |
| End of period | | $ | 21,526,455 | | | $ | 8,741,391 | | | $ | 3,002,992 | |
| | | | | | | | | | | | | |
| Changes in Shares Outstanding | | | | | | | | | | | | |
| Shares outstanding, beginning of period | | | 350,001 | | | | 4,275,001 | | | | — | |
| Shares sold | | | 600,000 | | | | 75,000 | | | | 125,001 | (2) |
| Shares redeemed | | | (325,000 | ) | | | (4,000,000 | ) | | | (25,000 | ) |
| Shares outstanding, end of period | | | 625,001 | | | | 350,001 | | | | 100,001 | |
| (1) | Commencement of operations. |
| (2) | Shares not in increment of 25,000 shares, a creation unit, represent the Adviser’s initial seed investment in connection with the commencement of operations. |
See Notes to Financial Statements.
Simplify Exchange Traded Funds
Consolidated Statements of Changes in Net Assets
| | | Simplify Commodities Strategy
No K-1 ETF | | | Simplify Macro Strategy
ETF | |
| | | Year Ended
June 30,
2024 | | | For the period
March 28,
2023(1) to
June 30,
2023 | | | Year Ended
June 30,
2024 | | | Year Ended
June 30,
2023 | |
| Increase (Decrease) in Net Assets from Operations | | | | | | | | | | | | | | | | |
| Net investment income (loss) | | $ | 358,050 | | | $ | 35,540 | | | $ | 1,181,074 | | | $ | 1,594,762 | |
| Net realized gain (loss) | | | (336,718 | ) | | | (168,665 | ) | | | (2,368,595 | ) | | | (1,857,490 | ) |
| Net change in net unrealized appreciation (depreciation) | | | (119,092 | ) | | | 7,132 | | | | (810,121 | ) | | | 327,435 | |
| Net increase (decrease) in net assets resulting from operations | | | (97,760 | ) | | | (125,993 | ) | | | (1,997,642 | ) | | | 64,707 | |
| | | | | | | | | | | | | | | | | |
| Distributions | | | (250,815 | ) | | | (25,000 | ) | | | (1,100,199 | ) | | | (1,363,559 | ) |
| | | | | | | | | | | | | | | | | |
| Fund Shares Transactions | | | | | | | | | | | | | | | | |
| Proceeds from shares sold | | | 8,042,779 | | | | 6,322,453 | | | | 2,199,857 | | | | 52,046,178 | |
| Value of shares redeemed | | | (3,592,542 | ) | | | — | | | | (32,613,335 | ) | | | (5,936,670 | ) |
| Net increase (decrease) in net assets resulting from fund share transactions | | | 4,450,237 | | | | 6,322,453 | | | | (30,413,478 | ) | | | 46,109,508 | |
| Total net increase (decrease) in Net Assets | | | 4,101,662 | | | | 6,171,460 | | | | (33,511,319 | ) | | | 44,810,656 | |
| | | | | | | | | | | | | | | | | |
| Net Assets | | | | | | | | | | | | | | | | |
| Beginning of period | | | 6,171,460 | | | | — | | | | 51,296,732 | | | | 6,486,076 | |
| End of period | | $ | 10,273,122 | | | $ | 6,171,460 | | | $ | 17,785,413 | | | $ | 51,296,732 | |
| | | | | | | | | | | | | | | | | |
| Changes in Shares Outstanding | | | | | | | | | | | | | | | | |
| Shares outstanding, beginning of period | | | 250,001 | | | | — | | | | 2,200,001 | | | | 275,001 | |
| Shares sold | | | 325,000 | | | | 250,001 | (2) | | | 100,000 | | | | 2,175,000 | |
| Shares redeemed | | | (150,000 | ) | | | — | | | | (1,450,000 | ) | | | (250,000 | ) |
| Shares outstanding, end of period | | | 425,001 | | | | 250,001 | | | | 850,001 | | | | 2,200,001 | |
| (1) | Commencement of operations. |
| (2) | Shares not in increment of 25,000 shares, a creation unit, represent the Adviser’s initial seed investment in connection with the commencement of operations. |
See Notes to Financial Statements.
Simplify Exchange Traded Funds
Consolidated Statements of Changes in Net Assets (Continued)
| | | Simplify Managed Futures Strategy
ETF | |
| | | Year Ended
June 30,
2024 | | | Year Ended
June 30,
2023 | |
| Increase (Decrease) in Net Assets from Operations | | | | | | | | |
| Net investment income (loss) | | $ | 6,251,581 | | | $ | 3,269,817 | |
| Net realized gain (loss) | | | 17,102,582 | | | | (24,226,742 | ) |
| Net change in net unrealized appreciation (depreciation) | | | (3,522,650 | ) | | | 4,740,056 | |
| Net increase (decrease) in net assets resulting from operations | | | 19,831,513 | | | | (16,216,869 | ) |
| | | | | | | | | |
| Distributions | | | (12,670,742 | ) | | | (10,767,132 | ) |
| | | | | | | | | |
| Fund Shares Transactions | | | | | | | | |
| Proceeds from shares sold | | | 131,896,571 | | | | 269,507,617 | |
| Value of shares redeemed | | | (61,930,645 | ) | | | (143,417,215 | ) |
| Net increase (decrease) in net assets resulting from fund share transactions | | | 69,965,926 | | | | 126,090,402 | |
| Total net increase (decrease) in Net Assets | | | 77,126,697 | | | | 99,106,401 | |
| | | | | | | | | |
| Net Assets | | | | | | | | |
| Beginning of period | | | 127,742,905 | | | | 28,636,504 | |
| End of period | | $ | 204,869,602 | | | $ | 127,742,905 | |
| | | | | | | | | |
| Changes in Shares Outstanding | | | | | | | | |
| Shares outstanding, beginning of period | | | 5,000,001 | | | | 1,050,001 | |
| Shares sold | | | 5,025,000 | | | | 9,350,000 | |
| Shares redeemed | | | (2,425,000 | ) | | | (5,400,000 | ) |
| Shares outstanding, end of period | | | 7,600,001 | | | | 5,000,001 | |
See Notes to Financial Statements.
Simplify Exchange Traded Funds
Financial Highlights
| Simplify Aggregate Bond ETF | | Years Ended
June 30 | | | Period Ended
June 30, | |
| Selected Per Share Data | | 2024 | | | 2023 | | | 2022(a) | |
| Net Asset Value, beginning of period | | $ | 22.50 | | | $ | 23.64 | | | $ | 25.00 | |
| Income (loss) from investment operations: | | | | | | | | | | | | |
| Net investment income (loss)(b) | | | 0.89 | | | | 0.55 | | | | 0.13 | |
| Net realized and unrealized gain (loss) | | | (0.38 | )(c) | | | (0.45 | ) | | | (1.35 | ) |
| Total from investment operations | | | 0.51 | | | | 0.10 | | | | (1.22 | ) |
| Less distributions from: | | | | | | | | | | | | |
| Net investment income | | | (0.99 | ) | | | (0.83 | ) | | | (0.14 | ) |
| Return of capital | | | (1.29 | ) | | | (0.41 | ) | | | — | |
| Total distributions | | | (2.28 | ) | | | (1.24 | ) | | | (0.14 | ) |
| Net Asset Value, end of period | | $ | 20.73 | | | $ | 22.50 | | | $ | 23.64 | |
| Total Return (%) | | | 2.48 | | | | 0.49 | (d) | | | (4.89 | )(e) |
| Ratios to Average Net Assets and Supplemental Data | | | | | | | | | | | | |
| Net Assets, end of period ($ millions) | | $ | 207 | | | $ | 12 | | | $ | 1 | |
| Ratio of expenses before fee waiver (%) | | | 0.52 | (f)(g) | | | 0.87 | (g)(h) | | | 0.50 | (g)(i) |
| Ratio of expenses after fee waiver (%) | | | 0.26 | (f)(g) | | | 0.60 | (g)(h) | | | 0.25 | (g)(i) |
| Ratio of net investment income (loss) (%) | | | 4.19 | | | | 2.44 | | | | 1.43 | (i) |
| Portfolio turnover rate (%)(j) | | | 385 | | | | 400 | | | | 14 | (e) |
| Simplify Health Care ETF | | Years Ended
June 30 | | | Period Ended
June 30, | |
| Selected Per Share Data | | 2024 | | | 2023 | | | 2022(k) | |
| Net Asset Value, beginning of period | | $ | 26.55 | | | $ | 24.58 | | | $ | 25.00 | |
| Income (loss) from investment operations: | | | | | | | | | | | | |
| Net investment income (loss)(b) | | | 0.12 | | | | 0.18 | | | | 0.08 | |
| Net realized and unrealized gain (loss) | | | 4.85 | | | | 1.99 | | | | (0.42 | ) |
| Total from investment operations. | | | 4.97 | | | | 2.17 | | | | (0.34 | ) |
| Less distributions from: | | | | | | | | | | | | |
| Net investment income | | | (0.17 | ) | | | (0.20 | ) | | | (0.08 | ) |
| Total distributions | | | (0.17 | ) | | | (0.20 | ) | | | (0.08 | ) |
| Net Asset Value, end of period | | $ | 31.35 | | | $ | 26.55 | | | $ | 24.58 | |
| Total Return (%) | | | 18.83 | | | | 8.81 | | | | (1.38 | )(e) |
| Ratios to Average Net Assets and Supplemental Data | | | | | | | | | | | | |
| Net Assets, end of period ($ millions) | | $ | 137 | | | $ | 59 | | | $ | 34 | |
| Ratio of expenses (%) | | | 0.50 | | | | 0.50 | | | | 0.50 | (i) |
| Ratio of net investment income (loss) (%) | | | 0.44 | | | | 0.72 | | | | 0.45 | (i) |
| Portfolio turnover rate (%)(j) | | | 210 | | | | 118 | | | | 146 | (e) |
| (a) | For the period February 15, 2022 (commencement of operations) through June 30, 2022. |
| (b) | Per share numbers have been calculated using the average shares method. |
| (c) | Because of the timing of subscriptions and redemptions in relation to fluctuating markets at value, the amount shown may not agree with the change in aggregate gains and losses. |
| (d) | Total Return would have been lower if certain expenses had not been waived/reimbursed by the Advisor. |
| (e) | Not annualized. |
| (f) | The ratios of expenses to average net assets includes interest expense fees of 0.02%. |
| (g) | The Fund invests in other ETFs and indirectly bears its proportionate shares of fees and expenses incurred by the Underlying Funds in which the Fund is invested. This ratio does not included these indirect fees and expenses. |
| (h) | The ratios of expenses to average net assets includes interest expense fees of 0.36%. |
| (i) | Annualized. |
| (j) | Excludes the impact of in-kind transactions related to the processing of capital share transactions in Creation Units. |
| (k) | For the period October 8, 2021 (commencement of operations) through June 30, 2022. |
See Notes to Financial Statements.
Simplify Exchange Traded Funds
Financial Highlights (Continued)
| Simplify Hedged Equity ETF | | Years Ended
June 30 | | | Period Ended
June 30, | |
| Selected Per Share Data | | 2024 | | | 2023 | | | 2022(a) | |
| Net Asset Value, beginning of period | | $ | 24.84 | | | $ | 22.99 | | | $ | 25.00 | |
| Income (loss) from investment operations: | | | | | | | | | | | | |
| Net investment income (loss)(b) | | | 0.30 | | | | 0.24 | | | | 0.18 | |
| Net realized and unrealized gain (loss) | | | 3.59 | | | | 2.58 | | | | (2.04 | ) |
| Total from investment operations | | | 3.89 | | | | 2.82 | | | | (1.86 | ) |
| Less distributions from: | | | | | | | | | | | | |
| Net investment income | | | (0.31 | ) | | | (0.54 | ) | | | (0.15 | ) |
| Net realized gains | | | (0.77 | ) | | | (0.43 | ) | | | — | |
| Total distributions | | | (1.08 | ) | | | (0.97 | ) | | | (0.15 | ) |
| Net Asset Value, end of period | | $ | 27.65 | | | $ | 24.84 | | | $ | 22.99 | |
| Total Return (%) | | | 16.08 | | | | 12.65 | | | | (7.46 | )(c) |
| Ratios to Average Net Assets and Supplemental Data | | | | | | | | | | | | |
| Net Assets, end of period ($ millions) | | $ | 169 | | | $ | 107 | | | $ | 37 | |
| Ratio of expenses (%) | | | 0.51 | (d)(e) | | | 0.73 | (e)(f) | | | 0.50 | (e)(g) |
| Ratio of net investment income (loss) (%) | | | 1.19 | | | | 1.02 | | | | 1.16 | (g) |
| Portfolio turnover rate (%)(h) | | | 1 | | | | 10 | | | | 2 | (c) |
| Simplify High Yield PLUS Credit Hedge ETF | | Years Ended
June 30 | | | Period Ended
June 30, | |
| Selected Per Share Data | | 2024 | | | 2023 | | | 2022(i) | |
| Net Asset Value, beginning of period | | $ | 21.80 | | | $ | 22.23 | | | $ | 25.00 | |
| Income (loss) from investment operations: | | | | | | | | | | | | |
| Net investment income (loss)(b) | | | 1.12 | | | | 0.67 | | | | 0.01 | |
| Net realized and unrealized gain (loss) | | | 1.40 | | | | 0.76 | | | | (2.44 | ) |
| Total from investment operations | | | 2.52 | | | | 1.43 | | | | (2.43 | ) |
| Variable transaction fees (see Note 7) | | | — | | | | — | | | | 0.01 | |
| Less distributions from: | | | | | | | | | | | | |
| Net investment income | | | (1.35 | ) | | | (1.39 | ) | | | (0.24 | ) |
| Return of capital | | | — | | | | (0.47 | ) | | | (0.11 | ) |
| Total distributions | | | (1.35 | ) | | | (1.86 | ) | | | (0.35 | ) |
| Net Asset Value, end of period | | $ | 22.97 | | | $ | 21.80 | | | $ | 22.23 | |
| Total Return (%) | | | 11.82 | | | | 6.75 | | | | (9.74 | )(c) |
| Ratios to Average Net Assets and Supplemental Data | | | | | | | | | | | | |
| Net Assets, end of period ($ millions) | | $ | 156 | | | $ | 45 | | | $ | 30 | |
| Ratio of expenses before fee waiver (%) | | | 0.50 | | | | 0.51 | (d) | | | 0.50 | (e)(g) |
| Ratio of expenses after fee waiver (%) | | | 0.25 | | | | 0.26 | (d) | | | 0.25 | (e)(g) |
| Ratio of net investment income (loss) (%) | | | 4.98 | | | | 3.05 | | | | 0.15 | (g) |
| Portfolio turnover rate (%)(h) | | | 0 | | | | 0 | | | | 77 | (c) |
| (a) | For the period November 2, 2021 (commencement of operations) through June 30, 2022. |
| (b) | Per share numbers have been calculated using the average shares method. |
| (c) | Not annualized. |
| (d) | The ratios of expenses to average net assets includes interest expense fees of 0.01%. |
| (e) | The Fund invests in other ETFs and indirectly bears its proportionate shares of fees and expenses incurred by the Underlying Funds in which the Fund is invested. This ratio does not included these indirect fees and expenses. |
| (f) | The ratios of expenses to average net assets includes interest expense fees of 0.23%. |
| (g) | Annualized. |
| (h) | Excludes the impact of in-kind transactions related to the processing of capital share transactions in Creation Units. |
| (i) | For the period February 15, 2022 (commencement of operations) through June 30, 2022. |
See Notes to Financial Statements.
Simplify Exchange Traded Funds
Financial Highlights (Continued)
| Simplify Interest Rate Hedge ETF | | Years Ended June 30 | | | Period Ended
June 30, | |
| Selected Per Share Data | | 2024 | | | 2023 | | | 2022 | | | 2021(a) | |
| Net Asset Value, beginning of period | | $ | 64.08 | | | $ | 57.25 | | | $ | 40.55 | | | $ | 50.00 | |
| Income (loss) from investment operations: | | | | | | | | | | | | | | | | |
| Net investment income (loss)(b) | | | 2.47 | | | | 1.45 | | | | 0.03 | | | | (0.00 | )(c) |
| Net realized and unrealized gain (loss) | | | 16.32 | | | | 5.75 | | | | 15.86 | | | | (10.42 | ) |
| Total from investment operations | | | 18.79 | | | | 7.20 | | | | 15.89 | | | | (10.42 | ) |
| Variable transaction fees (see Note 7) | | | 0.67 | | | | 0.47 | | | | 0.82 | | | | 0.97 | |
| Less distributions from: | | | | | | | | | | | | | | | | |
| Net investment income | | | (3.96 | ) | | | (0.84 | ) | | | (0.01 | ) | | | — | |
| Net realized gains | | | (31.50 | ) | | | — | | | | — | | | | — | |
| Total distributions | | | (35.46 | ) | | | (0.84 | ) | | | (0.01 | ) | | | — | |
| Net Asset Value, end of period | | $ | 48.08 | | | $ | 64.08 | | | $ | 57.25 | | | $ | 40.55 | |
| Total Return (%) | | | 42.78 | | | | 13.35 | | | | 41.18 | | | | (18.89 | )(d) |
| Ratios to Average Net Assets and Supplemental Data | | | | | | | | | | | | | | | | |
| Net Assets, end of period ($ millions) | | $ | 145 | | | $ | 218 | | | $ | 302 | | | $ | 63 | |
| Ratio of expenses (%) | | | 0.50 | | | | 0.50 | | | | 0.50 | | | | 0.50 | (e) |
| Ratio of net investment income (loss) (%) | | | 3.80 | | | | 2.26 | | | | 0.05 | | | | (0.05 | )(e) |
| Portfolio turnover rate (%)(f) | | | 164 | | | | 124 | | | | 3 | | | | 0 | (d) |
| Simplify Intermediate Term Treasury Futures Strategy ETF | | Years Ended
June 30 | | | Period Ended
June 30, | |
| Selected Per Share Data | | 2024 | | | 2023 | | | 2022(g) | |
| Net Asset Value, beginning of period | | $ | 14.71 | | | $ | 18.28 | | | $ | 25.00 | |
| Income (loss) from investment operations: | | | | | | | | | | | | |
| Net investment income (loss)(b) | | | 0.68 | | | | 0.51 | | | | 0.14 | |
| Net realized and unrealized gain (loss) | | | (1.84 | ) | | | (3.53 | ) | | | (6.74 | ) |
| Total from investment operations | | | (1.16 | ) | | | (3.02 | ) | | | (6.60 | ) |
| Less distributions from: | | | | | | | | | | | | |
| Net investment income | | | (0.57 | ) | | | (0.55 | ) | | | (0.12 | ) |
| Total distributions | | | (0.57 | ) | | | (0.55 | ) | | | (0.12 | ) |
| Net Asset Value, end of period | | $ | 12.98 | | | $ | 14.71 | | | $ | 18.28 | |
| Total Return (%) | | | (7.93 | ) | | | (16.61 | ) | | | (26.47 | )(d) |
| Ratios to Average Net Assets and Supplemental Data | | | | | | | | | | | | |
| Net Assets, end of period ($ millions) | | $ | 49 | | | $ | 53 | | | $ | 40 | |
| Ratio of expenses before fee waiver (%) | | | 0.25 | | | | 0.27 | (h) | | | 0.25 | (e) |
| Ratio of expenses after fee waiver (%) | | | 0.15 | | | | 0.17 | (h) | | | 0.15 | (e) |
| Ratio of net investment income (loss) (%) | | | 5.08 | | | | 3.16 | | | | 0.85 | (e) |
| Portfolio turnover rate (%)(f) | | | 0 | | | | 0 | | | | 153 | (d) |
| (a) | For the period May 11, 2021 (commencement of operations) through June 30, 2021. |
| (b) | Per share numbers have been calculated using the average shares method. |
| (c) | Less than $.005. |
| (d) | Not annualized. |
| (e) | Annualized. |
| (f) | Excludes the impact of in-kind transactions related to the processing of capital share transactions in Creation Units. |
| (g) | For the period September 28, 2021 (commencement of operations) through June 30, 2022. |
| (h) | The ratios of expenses to average net assets includes interest expense fees of 0.02%. |
See Notes to Financial Statements.
Simplify Exchange Traded Funds
Financial Highlights (Continued)
| Simplify Market Neutral Equity Long/Short ETF | | Year Ended
June 30, | | | Period Ended
June 30, | |
| Selected Per Share Data | | 2024 | | | 2023(a) | |
| Net Asset Value, beginning of period | | $ | 24.43 | | | $ | 25.00 | |
| Income (loss) from investment operations: | | | | | | | | |
| Net investment income (loss)(b) | | | 1.02 | | | | 0.04 | |
| Net realized and unrealized gain (loss) | | | 0.12 | | | | (0.61 | ) |
| Total from investment operations | | | 1.14 | | | | (0.57 | ) |
| Less distributions from: | | | | | | | | |
| Net investment income | | | (1.84 | ) | | | — | |
| Return of capital | | | (0.15 | ) | | | — | |
| Total distributions | | | (1.99 | ) | | | — | |
| Net Asset Value, end of period | | $ | 23.58 | | | $ | 24.43 | |
| Total Return (%) | | | 5.19 | | | | (2.29 | )(c) |
| Ratios to Average Net Assets and Supplemental Data | | | | | | | | |
| Net Assets, end of period ($ millions) | | $ | 156 | | | $ | 4 | |
| Ratio of expenses (%) | | | 1.00 | | | | 1.00 | (d) |
| Ratio of net investment income (loss) (%) | | | 4.33 | | | | 4.02 | (d) |
| Portfolio turnover rate (%)(e) | | | 0 | | | | 0 | (c) |
| Simplify MBS ETF | | Period Ended
June 30, | |
| Selected Per Share Data | | 2024(f) | |
| Net Asset Value, beginning of period | | $ | 50.00 | |
| Income (loss) from investment operations: | | | | |
| Net investment income (loss)(b) | | | 1.66 | |
| Net realized and unrealized gain (loss) | | | 0.45 | (g) |
| Total from investment operations | | | 2.11 | |
| Less distributions from: | | | | |
| Net investment income | | | (1.44 | ) |
| Return of capital. | | | (0.31 | ) |
| Total distributions | | | (1.75 | ) |
| Net Asset Value, end of period | | $ | 50.36 | |
| Total Return (%) | | | 4.24 | (c) |
| Ratios to Average Net Assets and Supplemental Data | | | | |
| Net Assets, end of period ($ millions) | | $ | 750 | |
| Ratio of expenses before fee waiver (%) | | | 0.27 | (d)(h) |
| Ratio of expenses after fee waiver (%) | | | 0.17 | (d)(h) |
| Ratio of net investment income (loss) (%) | | | 5.13 | (d) |
| Portfolio turnover rate (%)(e) | | | 769 | (c) |
| (a) | For the period June 14, 2023 (commencement of operations) through June 30, 2023. |
| (b) | Per share numbers have been calculated using the average shares method. |
| (c) | Not annualized. |
| (d) | Annualized. |
| (e) | Excludes the impact of in-kind transactions related to the processing of capital share transactions in Creation Units. |
| (f) | For the period November 7, 2023 (commencement of operations) through June 30, 2024. |
| (g) | Because of the timing of subscriptions and redemptions in relation to fluctuating markets at value, the amount shown may not agree with the change in aggregate gains and losses. |
| (h) | The ratios of expenses to average net assets includes interest expense fees of 0.02%. |
See Notes to Financial Statements.
Simplify Exchange Traded Funds
Financial Highlights (Continued)
| Simplify Multi-QIS Alternative ETF | | Period Ended
June 30, | |
| Selected Per Share Data | | 2024(a) | |
| Net Asset Value, beginning of period | | $ | 25.00 | |
| Income (loss) from investment operations: | | | | |
| Net investment income (loss)(b) | | | 1.07 | |
| Net realized and unrealized gain (loss) | | | 0.10 | |
| Total from investment operations | | | 1.17 | |
| Less distributions from: | | | | |
| Net investment income | | | (0.91 | ) |
| Total distributions | | | (0.91 | ) |
| Net Asset Value, end of period | | $ | 25.26 | |
| Total Return (%) | | | 4.78 | (c) |
| Ratios to Average Net Assets and Supplemental Data | | | | |
| Net Assets, end of period ($ millions) | | $ | 115 | |
| Ratio of expenses (%) | | | 1.00 | (d) |
| Ratio of net investment income (loss) (%) | | | 4.36 | (d) |
| Portfolio turnover rate (%)(e) | | | 0 | (c) |
| Simplify Next Intangible Core Index ETF | | Period Ended
June 30, | |
| Selected Per Share Data | | 2024(f) | |
| Net Asset Value, beginning of period | | $ | 25.00 | |
| Income (loss) from investment operations: | | | | |
| Net investment income (loss)(b) | | | 0.06 | |
| Net realized and unrealized gain (loss) | | | 1.20 | |
| Total from investment operations | | | 1.26 | |
| Less distributions from: | | | | |
| Net investment income | | | (0.05 | ) |
| Total distributions | | | (0.05 | ) |
| Net Asset Value, end of period | | $ | 26.21 | |
| Total Return (%) | | | 5.03 | (c) |
| Ratios to Average Net Assets and Supplemental Data | | | | |
| Net Assets, end of period ($ millions) | | $ | 3 | |
| Ratio of expenses (%) | | | 0.25 | (d) |
| Ratio of net investment income (loss) (%) | | | 1.18 | (d) |
| Portfolio turnover rate (%)(e) | | | 28 | (c) |
| (a) | For the period July 11, 2023 (commencement of operations) through June 30, 2024. |
| (b) | Per share numbers have been calculated using the average shares method. |
| (c) | Not annualized. |
| (d) | Annualized. |
| (e) | Excludes the impact of in-kind transactions related to the processing of capital share transactions in Creation Units. |
| (f) | For the period April 16, 2024 (commencement of operations) through June 30, 2024. |
See Notes to Financial Statements.
Simplify Exchange Traded Funds
Financial Highlights (Continued)
| Simplify Next Intangible Value Index ETF | | Period Ended
June 30, | |
| Selected Per Share Data | | 2024(a) | |
| Net Asset Value, beginning of period | | $ | 25.00 | |
| Income (loss) from investment operations: | | | | |
| Net investment income (loss)(b) | | | 0.09 | |
| Net realized and unrealized gain (loss) | | | 0.95 | |
| Total from investment operations | | | 1.04 | |
| Less distributions from: | | | | |
| Net investment income | | | (0.05 | ) |
| Total distributions | | | (0.05 | ) |
| Net Asset Value, end of period | | $ | 25.99 | |
| Total Return (%) | | | 4.18 | (c) |
| Ratios to Average Net Assets and Supplemental Data | | | | |
| Net Assets, end of period ($ millions) | | $ | 3 | |
| Ratio of expenses (%) | | | 0.25 | (d) |
| Ratio of net investment income (loss) (%) | | | 1.73 | (d) |
| Portfolio turnover rate (%)(e) | | | 65 | (c) |
| Simplify Short Term Treasury Futures Strategy ETF | | Year Ended
June 30, | | | Period Ended
June 30, | |
| Selected Per Share Data | | 2024 | | | 2023(f) | |
| Net Asset Value, beginning of period | | $ | 22.66 | | | $ | 25.00 | |
| Income (loss) from investment operations: | | | | | | | | |
| Net investment income (loss)(b) | | | 1.14 | | | | 0.68 | |
| Net realized and unrealized gain (loss) | | | (1.43 | ) | | | (2.38 | ) |
| Total from investment operations | | | (0.29 | ) | | | (1.70 | ) |
| Less distributions from: | | | | | | | | |
| Net investment income | | | (1.04 | ) | | | (0.64 | ) |
| Total distributions | | | (1.04 | ) | | | (0.64 | ) |
| Net Asset Value, end of period | | $ | 21.33 | | | $ | 22.66 | |
| Total Return (%) | | | (1.33 | ) | | | (6.97 | )(c) |
| Ratios to Average Net Assets and Supplemental Data | | | | | | | | |
| Net Assets, end of period ($ millions) | | $ | 539 | | | $ | 534 | |
| Ratio of expenses before fee waiver (%) | | | 0.25 | | | | 0.26 | (d)(g) |
| Ratio of expenses after fee waiver (%) | | | 0.15 | | | | 0.15 | (d)(g) |
| Ratio of net investment income (loss) (%) | | | 5.13 | | | | 4.62 | (d) |
| Portfolio turnover rate (%)(e) | | | 0 | | | | 0 | (c) |
| (a) | For the period April 16, 2024 (commencement of operations) through June 30, 2024. |
| (b) | Per share numbers have been calculated using the average shares method. |
| (c) | Not annualized. |
| (d) | Annualized. |
| (e) | Excludes the impact of in-kind transactions related to the processing of capital share transactions in Creation Units. |
| (f) | For the period November 15, 2022 (commencement of operations) through June 30, 2023. |
| (g) | The ratios of expenses to average net assets includes interest expense fees of 0.01%. |
See Notes to Financial Statements.
Simplify Exchange Traded Funds
Financial Highlights (Continued)
| Simplify US Equity PLUS GBTC ETF | | Years Ended June 30 | | | Period Ended
June 30, | |
| Selected Per Share Data | | 2024 | | | 2023 | | | 2022 | | | 2021(a) | |
| Net Asset Value, beginning of period | | $ | 24.98 | | | $ | 20.43 | | | $ | 25.32 | | | $ | 25.00 | |
| Income (loss) from investment operations: | | | | | | | | | | | | | | | | |
| Net investment income (loss)(b) | | | 0.25 | | | | 0.18 | | | | 0.17 | | | | 0.06 | |
| Net realized and unrealized gain (loss) | | | 9.51 | | | | 5.35 | | | | (4.51 | ) | | | 0.30 | |
| Total from investment operations | | | 9.76 | | | | 5.53 | | | | (4.34 | ) | | | 0.36 | |
| Less distributions from: | | | | | | | | | | | | | | | | |
| Net investment income | | | (0.09 | ) | | | (0.11 | ) | | | (0.21 | ) | | | (0.04 | ) |
| Net realized gains | | | — | | | | — | | | | (0.34 | ) | | | — | |
| Return of capital | | | (0.21 | ) | | | (0.87 | ) | | | — | | | | — | |
| Total distributions | | | (0.30 | ) | | | (0.98 | ) | | | (0.55 | ) | | | (0.04 | ) |
| Net Asset Value, end of period | | $ | 34.44 | | | $ | 24.98 | | | $ | 20.43 | | | $ | 25.32 | |
| Total Return (%) | | | 39.29 | | | | 27.69 | | | | (17.66 | ) | | | 1.46 | (c) |
| Ratios to Average Net Assets and Supplemental Data | | | | | | | | | | | | | | | | |
| Net Assets, end of period ($ millions) | | $ | 22 | | | $ | 9 | | | $ | 87 | | | $ | 103 | |
| Ratio of expenses (%) | | | 0.51 | (d)(e) | | | 0.51 | (d)(e) | | | 0.50 | (e) | | | 0.51 | (d)(e)(f) |
| Ratio of net investment income (loss) (%) | | | 0.83 | | | | 0.84 | | | | 0.66 | | | | 2.65 | (f) |
| Portfolio turnover rate (%)(g) | | | 21 | | | | 8 | | | | 6 | | | | 2 | (c) |
| Simplify US Equity PLUS QIS ETF | | Period Ended
June 30, | |
| Selected Per Share Data | | 2024(h) | |
| Net Asset Value, beginning of period | | $ | 25.00 | |
| Income (loss) from investment operations: | | | | |
| Net investment income (loss)(b) | | | 0.56 | |
| Net realized and unrealized gain (loss) | | | 5.11 | |
| Total from investment operations | | | 5.67 | |
| Less distributions from: | | | | |
| Net investment income | | | (0.64 | ) |
| Total distributions | | | (0.64 | ) |
| Net Asset Value, end of period | | $ | 30.03 | |
| Total Return (%) | | | 22.97 | (c) |
| Ratios to Average Net Assets and Supplemental Data | | | | |
| Net Assets, end of period ($ millions) | | $ | 3 | |
| Ratio of expenses (%) | | | 0.56 | (e)(f)(i) |
| Ratio of net investment income (loss) (%) | | | 3.21 | (f) |
| Portfolio turnover rate (%)(g) | | | 88 | (c) |
| (a) | For the period May 25, 2021 (commencement of operations) through June 30, 2021. |
| (b) | Per share numbers have been calculated using the average shares method. |
| (c) | Not annualized. |
| (d) | The ratios of expenses to average net assets includes interest expense fees of 0.01%. |
| (e) | The Fund invests in other ETFs and indirectly bears its proportionate shares of fees and expenses incurred by the Underlying Funds in which the Fund is invested. This ratio does not included these indirect fees and expenses. |
| (f) | Annualized. |
| (g) | Excludes the impact of in-kind transactions related to the processing of capital share transactions in Creation Units. |
| (h) | For the period November 14, 2023 (commencement of operations) through June 30, 2024. |
| (i) | The ratios of expenses to average net assets includes interest expense fees of 0.06%. |
See Notes to Financial Statements.
Simplify Exchange Traded Funds
Consolidated Financial Highlights
| Simplify Commodities Strategy No K-1 ETF | | Year Ended
June 30, | | | Period Ended
June 30, | |
| Selected Per Share Data | | 2024 | | | 2023(a) | |
| Net Asset Value, beginning of period | | $ | 24.69 | | | $ | 25.00 | |
| Income (loss) from investment operations: | | | | | | | | |
| Net investment income (loss)(b) | | | 0.99 | | | | 0.20 | |
| Net realized and unrealized gain (loss) | | | (0.85 | ) | | | (0.41 | ) |
| Total from investment operations | | | 0.14 | | | | (0.21 | ) |
| Less distributions from: | | | | | | | | |
| Net investment income | | | (0.66 | ) | | | (0.10 | ) |
| Total distributions | | | (0.66 | ) | | | (0.10 | ) |
| Net Asset Value, end of period | | $ | 24.17 | | | $ | 24.69 | |
| Total Return (%) | | | 0.63 | | | | (0.86 | )(c) |
| Ratios to Average Net Assets and Supplemental Data | | | | | | | | |
| Net Assets, end of period ($ millions) | | $ | 10 | | | $ | 6 | |
| Ratio of expenses (%) | | | 0.75 | (d) | | | 0.75 | (d)(e) |
| Ratio of net investment income (loss) (%) | | | 4.09 | | | | 3.06 | (e) |
| Portfolio turnover rate (%)(f) | | | 0 | | | | 0 | (c) |
| Simplify Macro Strategy ETF | | Years Ended
June 30 | | | Period Ended
June 30, | |
| Selected Per Share Data | | 2024 | | | 2023 | | | 2022(g) | |
| Net Asset Value, beginning of period. | | $ | 23.32 | | | $ | 23.59 | | | $ | 25.00 | |
| Income (loss) from investment operations: | | | | | | | | | | | | |
| Net investment income (loss)(b) | | | 0.82 | | | | 1.35 | | | | 0.16 | |
| Net realized and unrealized gain (loss) | | | (2.46 | ) | | | (0.43 | ) | | | (1.56 | ) |
| Total from investment operations | | | (1.64 | ) | | | 0.92 | | | | (1.40 | ) |
| Less distributions from: | | | | | | | | | | | | |
| Net investment income | | | (0.76 | ) | | | (1.19 | ) | | | (0.01 | ) |
| Total distributions | | | (0.76 | ) | | | (1.19 | ) | | | (0.01 | ) |
| Net Asset Value, end of period | | $ | 20.92 | | | $ | 23.32 | | | $ | 23.59 | |
| Total Return (%) | | | (7.19 | )(h) | | | 3.94 | (h) | | | (5.61 | )(c)(h) |
| Ratios to Average Net Assets and Supplemental Data | | | | | | | | | | | | |
| Net Assets, end of period ($ millions) | | $ | 18 | | | $ | 51 | | | $ | 6 | |
| Ratio of expenses before fee waiver (%) | | | 0.86 | (d)(i) | | | 0.77 | (d)(j) | | | 0.75 | (d)(e) |
| Ratio of expenses after fee waiver (%) | | | 0.61 | (d)(i) | | | 0.44 | (d)(j)(k) | | | 0.45 | (d)(e) |
| Ratio of net investment income (loss) (%) | | | 3.62 | | | | 5.74 | | | | 5.88 | (e) |
| Portfolio turnover rate (%)(f) | | | 68 | | | | 71 | | | | 11 | (c) |
| (a) | For the period March 28, 2023 (commencement of operations) through June 30, 2023. |
| (b) | Per share numbers have been calculated using the average shares method. |
| (d) | The Fund invests in other ETFs and indirectly bears its proportionate shares of fees and expenses incurred by the Underlying Funds in which the Fund is invested. This ratio does not included these indirect fees and expenses. |
| (f) | Excludes the impact of in-kind transactions related to the processing of capital share transactions in Creation Units. |
| (g) | For the period May 17, 2022 (commencement of operations) through June 30, 2022. |
| (h) | Total Return would have been lower if certain expenses had not been waived/reimbursed by the Advisor. |
| (i) | The ratios of expenses to average net assets includes interest expense fees of 0.11%. |
| (j) | The ratios of expenses to average net assets includes interest expense fees of 0.02%. |
| (k) | The ratio of expenses after fee waiver includes a voluntary waiver of 0.12%. See note 5. |
See Notes to Financial Statements.
Simplify Exchange Traded Funds
Consolidated Financial Highlights (Continued)
| Simplify Managed Futures Strategy ETF | | Years Ended June 30 | | | Period Ended
June 30, | |
| Selected Per Share Data | | 2024 | | | 2023 | | | 2022(a) | |
| Net Asset Value, beginning of period | | $ | 25.55 | | | $ | 27.27 | | | $ | 25.00 | |
| Income (loss) from investment operations: | | | | | | | | | | | | |
| Net investment income (loss)(b) | | | 1.05 | | | | 0.67 | | | | (0.02 | ) |
| Net realized and unrealized gain (loss) | | | 2.40 | | | | (0.58 | ) | | | 2.29 | |
| Total from investment operations | | | 3.45 | | | | 0.09 | | | | 2.27 | |
| Less distributions from: | | | | | | | | | | | | |
| Net investment income | | | (0.78 | ) | | | (1.14 | ) | | | — | |
| Net realized gains | | | (1.26 | ) | | | (0.67 | ) | | | — | |
| Total distributions | | | (2.04 | ) | | | (1.81 | ) | | | — | |
| Net Asset Value, end of period | | $ | 26.96 | | | $ | 25.55 | | | $ | 27.27 | |
| Total Return (%) | | | 14.52 | | | | 0.13 | | | | 9.07 | (c) |
| Ratios to Average Net Assets and Supplemental Data | | | | | | | | | | | | |
| Net Assets, end of period ($ millions) | | $ | 205 | | | $ | 128 | | | $ | 29 | |
| Ratio of expenses (%) | | | 0.76 | (d)(e) | | | 0.78 | (e)(f) | | | 0.75 | (e)(g) |
| Ratio of net investment income (loss) (%) | | | 4.06 | | | | 2.49 | | | | (0.27 | )(g) |
| Portfolio turnover rate (%)(h) | | | 0 | | | | 0 | | | | 0 | (c) |
| (a) | For the period March 8, 2022 (commencement of operations) through June 30, 2022. |
| (b) | Per share numbers have been calculated using the average shares method. |
| (c) | Not annualized. |
| (d) | The ratios of expenses to average net assets includes interest expense fees of 0.01%. |
| (e) | The Fund invests in other ETFs and indirectly bears its proportionate shares of fees and expenses incurred by the Underlying Funds in which the Fund is invested. This ratio does not included these indirect fees and expenses. |
| (f) | The ratios of expenses to average net assets includes interest expense fees of 0.03%. |
| (g) | Annualized. |
| (h) | Excludes the impact of in-kind transactions related to the processing of capital share transactions in Creation Units. |
See Notes to Financial Statements.
Simplify Exchange Traded Funds
Notes to Financial Statements
June 30, 2024
1. Organization
Simplify Exchange Traded Funds (the “Trust”) is registered under the Investment Company Act of 1940, as amended (the “1940 Act”), as an open-end registered management investment company organized as a Delaware statutory trust.
As of June 30, 2024, the Trust consists of twenty eight investment series of exchange-traded funds (“ETFs”) (each a “Fund” and collectively, the “Funds”) in operation and trading. These financial statements report on the Funds listed below:
Simplify Aggregate Bond ETF
Simplify Health Care ETF
Simplify Hedged Equity ETF
Simplify High Yield PLUS Credit Hedge ETF
Simplify Interest Rate Hedge ETF
Simplify Intermediate Term Treasury Futures Strategy ETF
Simplify Market Neutral Equity Long/Short ETF
Simplify MBS ETF
Simplify Multi-QIS Alternative ETF
Simplify Next Intangible Core Index ETF
Simplify Next Intangible Value Index ETF
Simplify Short Term Treasury Futures Strategy ETF
Simplify US Equity PLUS GBTC ETF
Simplify US Equity PLUS QIS ETF
Simplify Commodities Strategy No K-1 ETF
Simplify Macro Strategy ETF
Simplify Managed Futures Strategy ETF
Effective August 29, 2023, Simplify Aggregate Bond PLUS Credit Hedge ETF changed its name to Simplify Aggregate Bond ETF.
The Simplify Interest Rate Hedge ETF is a non-diversified Fund of the Trust.
Simplify Asset Management Inc. (the “Adviser”) serves as investment adviser to each Fund except for Simplify Market Neutral Equity Long/Short ETF, for which Simplify EQLS LLC serves as investment adviser. The Adviser and has overall responsibility for the general management and administration of the Funds, subject to the oversight of the Trust’s Board of Trustees (the “Board”).
Each Fund offers shares that are listed and traded on the NYSE Arca, Inc. (“NYSE Arca”), except for Simplify Intermediate Term Treasury Futures Strategy ETF which offers shares that are listed and traded on the CBOE BZX Exchange, Inc. and Simplify US Equity PLUS GBTC ETF which offer shares that are listed and traded on the Nasdaq Stock Market LLC (“Nasdaq”). Unlike mutual funds, each Fund issues and redeems shares on a continuous basis, at net asset value (“NAV”), only in large specified lots consisting of 25,000 shares, each called a “Creation Unit”, to authorized participants who have entered into agreements with the Funds’ distributor. Shares are not individually redeemable securities of the Funds, and owners of the shares may acquire those shares from the Funds, or tender such shares for redemption to the Funds, in Creation Units only.
| Fund | | Investment objectives |
| Simplify Aggregate Bond ETF | | The Fund seeks to maximize total return. |
| Simplify Health Care ETF | | The Fund seeks long-term capital appreciation. |
| Simplify Hedged Equity ETF | | The Fund seeks to provide long-term capital appreciation. |
| Simplify High Yield PLUS Credit Hedge ETF | | The Fund seeks to maximize current income by investing primarily in high-yield bonds through swaps on exchange traded funds while mitigating credit risk. |
| Simplify Interest Rate Hedge ETF | | The Fund seeks to hedge interest rate movements arising from rising long-term interest rates, and to benefit from market stress when fixed income volatility increases, while providing the potential for income. |
| Simplify Intermediate Term Treasury Futures Strategy ETF | | The Fund seeks to provide total return, before fees and expenses that matches or outperforms the performance of the ICE US Treasury 20+ Year Index on a calendar quarter basis. The Fund does not seek to achieve its stated investment objective over a period of time different than a full calendar quarter. |
| Simplify Market Neutral Equity Long/Short ETF | | The Fund seeks to provide positive absolute returns and income. |
| Simplify MBS ETF | | The Fund seeks to provide total return, consistent with preservation of capital and prudent investment management. |
| Simplify Multi-QIS Alternative ETF | | The Fund seeks to provide positive absolute returns and income. |
| Simplify Next Intangible Core Index ETF | | The Fund seeks to provide investment results that track, before fees and expenses, the performance of the Next Intangible Core Index. |
| Simplify Next Intangible Value Index ETF | | The Fund seeks to provide investment results that track, before fees and expenses, the performance of the Next Intangible Value Index. |
Simplify Exchange Traded Funds
Notes to Financial Statements (Continued)
June 30, 2024
| Fund | | Investment objectives |
| Simplify Short Term Treasury Futures Strategy ETF | | The Fund seeks to provide total return, before fees and expenses that matches or outperforms the performance of the ICE US Treasury 7-10 Year Bond Index on a calendar quarter basis. The Fund does not seek to achieve its stated investment objective over a period of time different than a full calendar quarter. |
| Simplify US Equity PLUS GBTC ETF | | The Fund seeks long-term capital appreciation. |
| Simplify US Equity PLUS QIS ETF | | The Fund seeks to achieve long-term capital appreciation. |
| Simplify Commodities Strategy No K-1 ETF | | The Fund seeks long term capital appreciation. |
| Simplify Macro Strategy ETF | | The Fund seeks to provide absolute returns. |
| Simplify Managed Futures Strategy ETF | | The Fund seeks long term capital appreciation. |
2. Consolidation of Subsidiary
The Consolidated Schedules of Investments, Consolidated Statements of Assets and Liabilities, Consolidated Statements of Operations, Consolidated Statement of Changes in Net Assets, and the Consolidated Financial Highlights of the Funds listed below include the accounts of a wholly owned subsidiaries. All inter-company accounts and transactions have been eliminated in consolidation.
Each Subsidiary is a Cayman Islands exempted company with limited liability. For tax purposes, each Fund is required to increase its taxable income by its shares of the Cayman subsidiary’s income. Net losses incurred by each Subsidiary cannot offset income earned by each Fund and cannot be carried back or forward by each Subsidiary to offset income from prior or future years.
| Fund | | Wholly Owned Subsidiary |
| Simplify Commodities Strategy No K-1 ETF | | Simplify Commodities Strategy No K-1 Cayman Fund |
| Simplify Macro Strategy ETF | | Simplify Macro Strategy Cayman Fund |
| Simplify Managed Futures Strategy ETF | | Simplify Managed Futures Strategy Cayman Fund |
A summary of each Fund’s investment in its corresponding subsidiary is as follows:
| Fund | | Inception Date of
Subsidiary | | Subsidiary Net
Assets at
June 30,
2024 | | | % of Fund’s
Consolidated
Total Assets at
June 30,
2024 | |
| Simplify Commodities Strategy No K-1 ETF | | March 28, 2023 | | $ | 2,305,738 | | | | 22.4 | % |
| Simplify Macro Strategy ETF | | May 17, 2022 | | $ | 1,223,973 | | | | 6.4 | % |
| Simplify Managed Futures Strategy ETF | | March 8, 2022 | | $ | 48,380,722 | | | | 22.3 | % |
3. Significant Accounting Policies
The financial statements have been prepared in conformity with U.S. generally accepted accounting principles (“U.S. GAAP”), which require management to make certain estimates and assumptions that affect the reported amounts and disclosures of contingent assets and liabilities at the date of the financial statement and the reported amounts of revenues and expenses during the reporting period. Actual results could differ from those estimates. The Funds are investment companies and accordingly follow the investment company accounting and reporting guidance of the Financial Accounting Standards Board (“FASB”) Accounting Standards Codification Topic 946 Financial Services – Investment Companies including Accounting Standards Update 2013-08. The following is a summary of significant accounting policies followed by the Funds.
Investment Valuation
Each Fund’s investments are valued using procedures approved by the Board and are generally valued using market valuations (Market Approach). A market valuation generally means a valuation (i) obtained from an exchange, a pricing service, or a major market maker (or dealer) or (ii) based on a price quotation or other equivalent indication of value supplied by an exchange, a pricing service, or a major market maker (or dealer). A price obtained from a pricing service based on such pricing service’s valuation matrix may be considered a market valuation. Any assets or liabilities denominated in currencies other than the U.S. dollar are converted into U.S. dollars at the current market rates on the date of valuation as quoted by one or more sources.
If market quotations are not readily available, securities will be valued at their fair market value as determined using the “fair value” procedures approved by the Board. Fair value pricing involves subjective judgments and it is possible that the fair value determined for a security may be materially different than the value that could be realized upon the sale of that security. The fair value prices can differ from market prices when they become available or when a price becomes available. The Board has designated the Adviser as its valuation designee to execute these procedures. The Adviser may also enlist third party consultants such as an audit firm or financial officer of a security issuer on an as-needed basis to assist in determining a security-specific fair value. These securities are either categorized as Level 2 or 3 of the fair value hierarchy depending on the relevant inputs used. The Board reviews and ratifies the execution of this process and the resultant fair value prices at least quarterly to assure the process produces reliable results.
Simplify Exchange Traded Funds
Notes to Financial Statements (Continued)
June 30, 2024
Equity securities and ETFs are valued at the most recent sale price or official closing price reported on the exchange (U.S. or foreign) or over-the-counter market on which they trade. Securities or ETFs for which no sales are reported are valued at the calculated mean between the most recent bid and asked quotations on the relevant market or, if a mean cannot be determined, at the most recent bid quotation. Equity securities and ETFs are generally categorized as Level 1 of the fair value hierarchy.
Exchange traded options are valued at the mean between the current bid and ask prices on the exchange on which such options are traded. If a mean price is not available, the closing price is used. Exchange trade options are categorized as Level 1. Options with international equity exposure are marked to market using closing prices for the underlying and interpolated option implied volatilities obtained from mid-market prices for options on the same underlying of similar expiries and strike prices. These securities are categorized as Level 2 in the fair value hierarchy.
Debt securities not traded on an exchange may be valued at prices supplied by a pricing agent(s) based on broker or dealer supplied valuations or matrix pricing, a method of valuing securities by reference to the value of other securities with similar characteristics, such as rating, interest rate and maturity. Debt securities are generally categorized as Level 2 of the fair value hierarchy.
Swaptions are valued based on prices provided by a third-party pricing vendor that collects and aggregates market data to produce valuations. These securities are categorized as Level 2 in the fair value hierarchy.
Futures contracts are generally valued at the settlement prices established each day on the exchange on which they are traded and are categorized as Level 1.
Swap agreements and other derivatives are generally valued daily depending on the type of instrument and reference assets based upon market prices, the mean between bid and asked prices quotations from market makers or by a pricing service or other parties in accordance with the valuation procedures approved by the Board.
Money Market Funds are valued at NAV.
Forward foreign currency contracts are valued at the prevailing forward exchange rate of the underlying currencies and are categorized as Level 2.
Under certain circumstances, a Fund may use an independent pricing service to calculate the fair market value of foreign equity securities on a daily basis by applying valuation factors to the last sale price or the mean price as noted above. The fair market values supplied by the independent pricing service will generally reflect market trading that occurs after the close of the applicable foreign markets of comparable securities or the value of other instruments that have a strong correlation to the fair valued securities. The independent pricing service will also take into account the current relevant currency exchange rate. A security that is fair valued may be valued at a price higher or lower than actual market quotations or the value determined by other funds using their own fair valuation procedures. Because foreign securities may trade on days when Shares are not priced, the value of securities held by the Funds can change on days when Shares cannot be redeemed or purchased. In the event that a foreign security’s market quotations are not readily available or are deemed unreliable (for reasons other than because the foreign exchange on which it trades closed before the Funds’ calculation of NAV), the security will be valued at its fair market value as determined in good faith by the Funds’ Adviser as the Board’s valuation designee in accordance with procedures approved by the Board. Without fair valuation, it is possible that short-term traders could take advantage of the arbitrage opportunity and dilute the NAV of long-term investors. Fair valuation of the Funds’ portfolio securities can serve to reduce arbitrage opportunities available to short-term traders, but there is no assurance that it will prevent dilution of the Funds’ NAV by short-term traders. In addition, because the Funds may invest in underlying ETFs which hold portfolio securities primarily listed on foreign (non-U.S.) exchanges, and these exchanges may trade on weekends or other days when the underlying ETFs do not price their shares, the value of these portfolio securities may change on days when you may not be able to buy or sell Shares.
Investments initially valued in currencies other than the U.S. dollar are converted to U.S. dollars using exchange rates obtained from pricing services or other parties in accordance with the valuation procedures of the Adviser as the Board’s valuation designee. As a result, the NAV of the Shares may be affected by changes in the value of currencies in relation to the U.S. dollar. The value of securities traded in markets outside the United States or denominated in currencies other than the U.S. dollar may be affected significantly on a day that the Exchange is closed and an investor is not able to purchase, redeem or exchange Shares.
Each Fund categorizes the inputs to valuation techniques used to value its investments into a disclosure hierarchy consisting of three levels as shown below:
| ● | Level 1 – Quoted prices in active markets for identical assets that the funds have the ability to access. |
| ● | Level 2 – Other significant observable inputs (including quoted prices for similar securities, interest rates, prepayment speeds, credit risk, etc.). |
| ● | Level 3 – Significant unobservable inputs (including each Fund’s own assumptions in determining the fair value of investments). |
Simplify Exchange Traded Funds
Notes to Financial Statements (Continued)
June 30, 2024
The inputs or methodology used for valuing securities are not necessarily an indication of the risk associated with investing in those securities.
The following is a summary of the valuations as of June 30, 2024 for each Fund based upon the three levels defined above:
Simplify Aggregate Bond ETF
| Assets | | Level 1 | | | Level 2 | | | Level 3 | | | Total | |
| Exchange-Traded Funds | | $ | 195,801,537 | | | $ | — | | | $ | — | | | $ | 195,801,537 | |
| U.S. Treasury Bills | | | 10,343,980 | | | | — | | | | — | | | | 10,343,980 | |
| U.S. Government Agency Mortgage Backed Security | | | — | | | | 10,186,602 | | | | — | | | | 10,186,602 | |
| Futures | | | 397,824 | | | | — | | | | — | | | | 397,824 | |
| TOTAL | | $ | 206,543,341 | | | $ | 10,186,602 | | | $ | — | | | $ | 216,729,943 | |
| Liabilities | | Level 1 | | | Level 2 | | | Level 3 | | | Total | |
| Written Options | | $ | (398,438 | ) | | $ | — | | | $ | — | | | $ | (398,438 | ) |
| Futures | | | (98,281 | ) | | | — | | | | — | | | | (98,281 | ) |
| TOTAL | | $ | (496,719 | ) | | $ | — | | | $ | — | | | $ | (496,719 | ) |
Simplify Health Care ETF
| Assets | | Level 1 | | | Level 2 | | | Level 3 | | | Total | |
| Common Stocks | | $ | 123,400,694 | | | $ | — | | | $ | — | | | $ | 123,400,694 | |
| Money Market Funds | | | 7,939,837 | | | | — | | | | — | | | | 7,939,837 | |
| TOTAL | | $ | 131,340,531 | | | $ | — | | | $ | — | | | $ | 131,340,531 | |
Simplify Hedged Equity ETF
| Assets | | Level 1 | | | Level 2 | | | Level 3 | | | Total | |
| Exchange-Traded Funds | | $ | 170,839,734 | | | $ | — | | | $ | — | | | $ | 170,839,734 | |
| Purchased Options | | | 558,775 | | | | — | | | | — | | | | 558,775 | |
| Money Market Funds | | | 38,529 | | | | — | | | | — | | | | 38,529 | |
| TOTAL | | $ | 171,437,038 | | | $ | — | | | $ | — | | | $ | 171,437,038 | |
| Liabilities | | Level 1 | | | Level 2 | | | Level 3 | | | Total | |
| Written Options | | $ | (2,761,945 | ) | | $ | — | | | $ | — | | | $ | (2,761,945 | ) |
| TOTAL | | $ | (2,761,945 | ) | | $ | — | | | $ | — | | | $ | (2,761,945 | ) |
Simplify High Yield PLUS Credit Hedge ETF
| Assets | | Level 1 | | | Level 2 | | | Level 3 | | | Total | |
| U.S. Treasury Bills | | $ | 154,418,052 | | | $ | — | | | $ | — | | | $ | 154,418,052 | |
| Purchased Options | | | 29,387 | | | | — | | | | — | | | | 29,387 | |
| Credit Default Swaps | | | — | | | | 66,807 | | | | — | | | | 66,807 | |
| TOTAL | | $ | 154,447,439 | | | $ | 66,807 | | | $ | — | | | $ | 154,514,246 | |
| Liabilities | | Level 1 | | | Level 2 | | | Level 3 | | | Total | |
| Written Options | | $ | (14,693 | ) | | $ | — | | | $ | — | | | $ | (14,693 | ) |
| Total Return Swaps | | | — | | | | (851,983 | ) | | | — | | | | (851,983 | ) |
| TOTAL | | $ | (14,693 | ) | | $ | (851,983 | ) | | $ | — | | | $ | (866,676 | ) |
Simplify Exchange Traded Funds
Notes to Financial Statements (Continued)
June 30, 2024
Simplify Interest Rate Hedge ETF
| Assets | | Level 1 | | | Level 2 | | | Level 3 | | | Total | |
| U.S. Treasury Bills | | $ | 75,726,592 | | | $ | — | | | $ | — | | | $ | 75,726,592 | |
| U.S. Government Obligations | | | 48,308,577 | | | | — | | | | — | | | | 48,308,577 | |
| Purchased Swaptions | | | — | | | | 21,319,309 | | | | — | | | | 21,319,309 | |
| Interest Rate Swaps | | | — | | | | 1,923 | | | | — | | | | 1,923 | |
| TOTAL | | $ | 124,035,169 | | | $ | 21,321,232 | | | $ | — | | | $ | 145,356,401 | |
| Liabilities | | Level 1 | | | Level 2 | | | Level 3 | | | Total | |
| Purchased Swaptions. | | $ | — | | | $ | (258,988 | ) | | $ | — | | | $ | (258,988 | ) |
| TOTAL | | $ | — | | | $ | (258,988 | ) | | $ | — | | | $ | (258,988 | ) |
Simplify Intermediate Term Treasury Futures Strategy ETF
| Assets | | Level 1 | | | Level 2 | | | Level 3 | | | Total | |
| U.S. Treasury Bills | | $ | 48,038,005 | | | $ | — | | | $ | — | | | $ | 48,038,005 | |
| Money Market Funds | | | 105,997 | | | | — | | | | — | | | | 105,997 | |
| Futures | | | 1,326,249 | | | | — | | | | — | | | | 1,326,249 | |
| TOTAL | | $ | 49,470,251 | | | $ | — | | | $ | — | | | $ | 49,470,251 | |
Simplify Market Neutral Equity Long/Short ETF
| Assets | | Level 1 | | | Level 2 | | | Level 3 | | | Total | |
| U.S. Treasury Bills | | $ | 153,291,142 | | | $ | — | | | $ | — | | | $ | 153,291,142 | |
| Total Return Swaps | | | — | | | | 1,178,349 | | | | — | | | | 1,178,349 | |
| TOTAL | | $ | 153,291,142 | | | $ | 1,178,349 | | | $ | — | | | $ | 154,469,491 | |
Simplify MBS ETF
| Assets | | Level 1 | | | Level 2 | | | Level 3 | | | Total | |
| U.S. Treasury Bills | | $ | 748,151,935 | | | $ | — | | | $ | — | | | $ | 748,151,935 | |
| U.S. Government Agency Mortgage Backed Securities | | | — | | | | 737,423,520 | | | | — | | | | 737,423,520 | |
| TOTAL | | $ | 748,151,935 | | | $ | 737,423,520 | | | $ | — | | | $ | 1,485,575,455 | |
Simplify Multi-QIS Alternative ETF
| Assets | | Level 1 | | | Level 2 | | | Level 3 | | | Total | |
| U.S. Treasury Bills | | $ | 114,450,950 | | | $ | — | | | $ | — | | | $ | 114,450,950 | |
| Purchased Options | | | 3,162 | | | | — | | | | — | | | | 3,162 | |
| Total Return Swaps | | | — | | | | 1,018,664 | | | | — | | | | 1,018,664 | |
| TOTAL | | $ | 114,454,112 | | | $ | 1,018,664 | | | $ | — | | | $ | 115,472,776 | |
| Liabilities | | Level 1 | | | Level 2 | | | Level 3 | | | Total | |
| Written Options | | $ | (1,898 | ) | | $ | — | | | $ | — | | | $ | (1,898 | ) |
| Total Return Swaps | | | — | | | | (630,830 | ) | | | — | | | | (630,830 | ) |
| TOTAL | | $ | (1,898 | ) | | $ | (630,830 | ) | | $ | — | | | $ | (632,728 | ) |
Simplify Next Intangible Core Index ETF
| Assets | | Level 1 | | | Level 2 | | | Level 3 | | | Total | |
| Common Stocks | | $ | 2,618,602 | | | $ | — | | | $ | — | | | $ | 2,618,602 | |
| Money Market Funds | | | 1,154 | | | | — | | | | — | | | | 1,154 | |
| TOTAL | | $ | 2,619,756 | | | $ | — | | | $ | — | | | $ | 2,619,756 | |
Simplify Exchange Traded Funds
Notes to Financial Statements (Continued)
June 30, 2024
Simplify Next Intangible Value Index ETF
| Assets | | Level 1 | | | Level 2 | | | Level 3 | | | Total | |
| Common Stocks | | $ | 2,596,661 | | | $ | — | | | $ | — | | | $ | 2,596,661 | |
| Money Market Funds | | | 1,521 | | | | — | | | | — | | | | 1,521 | |
| TOTAL | | $ | 2,598,182 | | | $ | — | | | $ | — | | | $ | 2,598,182 | |
Simplify Short Term Treasury Futures Strategy ETF
| Assets | | Level 1 | | | Level 2 | | | Level 3 | | | Total | |
| U.S. Treasury Bills | | $ | 536,323,255 | | | $ | — | | | $ | — | | | $ | 536,323,255 | |
| Futures | | | 7,683,579 | | | | — | | | | — | | | | 7,683,579 | |
| TOTAL | | $ | 544,006,834 | | | $ | — | | | $ | — | | | $ | 544,006,834 | |
Simplify US Equity PLUS GBTC ETF
| Assets | | Level 1 | | | Level 2 | | | Level 3 | | | Total | |
| Exchange-Traded Funds | | $ | 18,336,035 | | | $ | — | | | $ | — | | | $ | 18,336,035 | |
| Grantor Trusts | | | 2,122,519 | | | | — | | | | — | | | | 2,122,519 | |
| U.S. Treasury Bills | | | 988,427 | | | | — | | | | — | | | | 988,427 | |
| Money Market Funds | | | 9,756 | | | | — | | | | — | | | | 9,756 | |
| Futures | | | 8,900 | | | | — | | | | — | | | | 8,900 | |
| TOTAL | | $ | 21,465,637 | | | $ | — | | | $ | — | | | $ | 21,465,637 | |
Simplify US Equity PLUS QIS ETF
| Assets | | Level 1 | | | Level 2 | | | Level 3 | | | Total | |
| Exchange-Traded Funds | | $ | 2,843,531 | | | $ | — | | | $ | — | | | $ | 2,843,531 | |
| U.S. Treasury Bills | | | 99,942 | | | | — | | | | — | | | | 99,942 | |
| Futures | | | 5,550 | | | | — | | | | — | | | | 5,550 | |
| TOTAL | | $ | 2,949,023 | | | $ | — | | | $ | — | | | $ | 2,949,023 | |
Simplify Commodities Strategy No K-1 ETF
| Assets | | Level 1 | | | Level 2 | | | Level 3 | | | Total | |
| U.S. Treasury Bills | | $ | 10,150,709 | | | $ | — | | | $ | — | | | $ | 10,150,709 | |
| Futures | | | 62,951 | | | | — | | | | — | | | | 62,951 | |
| TOTAL | | $ | 10,213,660 | | | $ | — | | | $ | — | | | $ | 10,213,660 | |
| Liabilities | | Level 1 | | | Level 2 | | | Level 3 | | | Total | |
| Futures | | $ | (175,626 | ) | | $ | — | | | $ | — | | | $ | (175,626 | ) |
| TOTAL | | $ | (175,626 | ) | | $ | — | | | $ | — | | | $ | (175,626 | ) |
Simplify Exchange Traded Funds
Notes to Financial Statements (Continued)
June 30, 2024
Simplify Macro Strategy ETF
| Assets | | Level 1 | | | Level 2 | | | Level 3 | | | Total | |
| Exchange-Traded Funds | | $ | 14,190,009 | | | $ | — | | | $ | — | | | $ | 14,190,009 | |
| U.S. Treasury Inflation Indexed Bonds | | | 3,297,212 | | | | — | | | | — | | | | 3,297,212 | |
| Purchased Options | | | 311,542 | | | | — | | | | — | | | | 311,542 | |
| Money Market Funds | | | 57,422 | | | | — | | | | — | | | | 57,422 | |
| Futures | | | 185,000 | | | | — | | | | — | | | | 185,000 | |
| Forward Foreign Currency Contracts | | | — | | | | 245,487 | | | | — | | | | 245,487 | |
| TOTAL | | $ | 18,041,185 | | | $ | 245,487 | | | $ | — | | | $ | 18,286,672 | |
| Liabilities | | Level 1 | | | Level 2 | | | Level 3 | | | Total | |
| Written Options | | $ | (531,818 | ) | | $ | — | | | $ | — | | | $ | (531,818 | ) |
| Forward Foreign Currency Contracts | | | — | | | | (191,478 | ) | | | — | | | | (191,478 | ) |
| TOTAL | | $ | (531,818 | ) | | $ | (191,478 | ) | | $ | — | | | $ | (723,296 | ) |
Simplify Managed Futures Strategy ETF
| Assets | | Level 1 | | | Level 2 | | | Level 3 | | | Total | |
| U.S. Treasury Bills | | $ | 190,705,568 | | | $ | — | | | $ | — | | | $ | 190,705,568 | |
| Futures | | | 5,462,115 | | | | — | | | | — | | | | 5,462,115 | |
| TOTAL | | $ | 196,167,683 | | | $ | — | | | $ | — | | | $ | 196,167,683 | |
| Liabilities | | Level 1 | | | Level 2 | | | Level 3 | | | Total | |
| Futures | | $ | (2,725,444 | ) | | $ | — | | | $ | — | | | $ | (2,725,444 | ) |
| TOTAL | | $ | (2,725,444 | ) | | $ | — | | | $ | — | | | $ | (2,725,444 | ) |
Cash
Cash consists of cash on deposit with a major financial institution which may exceed federally insured limits.
Foreign Currency Translations
The books and records of the Funds are maintained in U.S. dollars. Investment securities and other assets and liabilities denominated in a foreign currency are translated into U.S. dollars at the prevailing exchange rates at period end. Purchases and sales of investment securities, income and expenses are translated into U.S. dollars at the prevailing exchange rates on the respective dates of the transactions.
Net realized and unrealized gains and losses on foreign currency transactions represent net gains and losses between trade and settlement dates on securities transactions, the acquisition and disposition of foreign currencies, and the difference between the amount of net investment income accrued and the U.S. dollar amount actually received. The portion of both realized and unrealized gains and losses on investments that results from fluctuations in foreign currency exchange rates is not separately disclosed, but is included with net realized and unrealized gain/appreciation and loss/depreciation on investments.
Investment Transactions and Related Income
For financial reporting purposes, investment transactions are reported on the trade date. However, for daily NAV determination, portfolio securities transactions are reflected no later than in the first calculation on the first business day following trade date. Dividend income is recorded on the ex-dividend date. Interest income is recognized on an accrual basis and includes, where applicable, the amortization of premium or accretion of discount based on effective yield. Gains or losses realized on sales of securities are determined using the specific identification method by comparing the identified cost of the security lot sold with the net sales proceeds. Dividend Income on the Statements of Operations is shown net of any foreign taxes withheld on income from foreign securities, which are provided for in accordance with each Fund’s understanding of the applicable tax rules and regulations.
Income Tax Information and Distributions to Shareholders
It is the Funds’ policy to comply with all requirements of the Internal Revenue Code of 1986, as amended (“the Code”). Each Fund intends to qualify for and to elect treatment as a separate Regulated Investment Company (“RIC”) under Subchapter M of the Code. It is each Fund’s policy to pay out dividends from net investment income monthly, except for Simplify Health Care ETF, Simplify Hedged Equity ETF, Simplify Market Neutral Equity Long Short ETF, Simplify Multi-QIS Alternative ETF, Simplify Next Intangible Core Index ETF, Simplify Next Intangible Value Index ETF, Simplify US Equity PLUS GBTC ETF, Simplify US Equity PLUS QIS ETF and Simplify Commodities Strategy No K-1 ETF which pay out dividends from net investment income quarterly. Taxable net realized gains from
Simplify Exchange Traded Funds
Notes to Financial Statements (Continued)
June 30, 2024
investment transactions, reduced by capital loss carryforwards, if any, will be declared and distributed to shareholders at least annually. The capital loss carryforward amount, if any, will be available to offset future net capital gains. Each Fund may occasionally be required to make supplemental distributions at some other time during the year. Each Fund reserves the right to declare special distributions if, in its reasonable discretion, such action is necessary or advisable to preserve the status of a Fund as a RIC or to avoid imposition of income or excise taxes on undistributed income. Dividends and distributions to shareholders, if any, will be recorded on the ex-dividend date. The amount of dividends and distributions from net investment income and net realized capital gains will be determined in accordance with Federal income tax regulations which may differ from U.S. GAAP. These “book/tax” differences are either considered temporary or permanent in nature. To the extent these differences are permanent in nature, (e.g., return of capital and distribution reclassifications), such amounts are reclassified within the composition of net assets based on their federal tax basis treatment; temporary differences (e.g., wash sales and straddles) do not require a reclassification. Dividends and distributions, which exceed earnings and profits for the full year for tax purposes, will be reported as a tax return of capital.
In accordance with U.S. GAAP requirements regarding accounting for uncertainties in income taxes, management has analyzed each Fund’s tax positions expected to be taken on foreign, federal and state income tax returns for all open tax years and has concluded that no provision for income tax is required in any Fund’s financial statement.
Each Fund will recognize interest and penalties, if any, related to uncertain tax positions as income tax expense on the Statement of Operations.
4. Derivative Financial Instruments
In the normal course of business, a Fund uses derivative contracts in connection with its proprietary trading activities. Derivative contracts are subject to additional risks that can result in a loss of all or part of an investment. A Fund’s derivative activities and exposure to derivative contracts are classified by the following primary underlying risks: interest rate, credit, foreign exchange, commodity price, and equity price. In addition to its primary underlying risks, the Fund is also subject to additional counterparty risk due to inability of its counterparties to meet the terms of their contracts.
FASB Accounting Standards Codification, Derivatives and Hedging (“ASC 815”) requires enhanced disclosures about a Fund’s use of, and accounting for, derivative instruments and the effect of derivative instruments on a Fund’s financial position and results of operations.
Tabular disclosure regarding derivative fair value and gain/loss by contract type (e.g., interest rate contracts, foreign exchange contracts, credit contracts, etc.) is required and derivatives accounted for as hedging instruments under ASC 815 must be disclosed separately from those that do not qualify for hedge accounting. Even though a Fund may use derivatives in an attempt to achieve an economic hedge, a Fund’s derivatives are not accounted for as hedging instruments under ASC 815 because investment companies account for their derivatives at fair value and record any changes in fair value in current period earnings.
Futures Contracts
A futures contract provides for the future sale by one party and purchase by another party of a specified amount of a specific financial instrument (e.g., units of a stock index) for a specified price, date, time and place designated at the time the contract is made. Brokerage fees are paid when a futures contract is bought or sold and margin deposits must be maintained. Unlike when a Fund purchases or sells a security, no price would be paid or received by a Fund upon the purchase or sale of a futures contract. Upon entering into a futures contract, and to maintain a Fund’s open positions in futures contracts, a Fund would be required to deposit with its custodian or futures broker in a segregated account in the name of the futures broker an amount of cash, U.S. government securities, suitable money market instruments, or other liquid securities, known as “initial margin.” The margin required for a particular futures contract is set by the exchange on which the contract is traded, and may be significantly modified from time to time by the exchange during the term of the contract. If the price of an open futures contract changes (by increase in underlying instrument or index in the case of a sale or by decrease in the case of a purchase) so that the loss on the futures contract reaches a point at which the margin on deposit does not satisfy margin requirements, the broker will require an increase in the margin. However, if the value of a position increases because of favorable price changes in the futures contract so that the margin deposit exceeds the required margin, the broker will pay the excess to a Fund.
These subsequent payments, called “variation margin,” to and from the futures broker, are made on a daily basis as the price of the underlying assets fluctuate making the long and short positions in the futures contract more or less valuable, a process known as “marking to the market.” A Fund expects to earn interest income on margin deposits.
The primary risks associated with the use of futures contracts are (a) the imperfect correlation between the change in market value of the instruments held by a Fund and the price of the forward or futures contract; (b) possible lack of a liquid secondary market for a forward or futures contract and the resulting inability to close a forward or futures contract when desired; (c) investments in futures contracts involves leverage, which means a small percentage of assets in futures can have a disproportionately large impact on a Fund and the Fund can lose more than the principal amount invested; (d) losses caused by unanticipated market movements, which are potentially unlimited; (e) the adviser’s inability to predict correctly the direction of securities prices, interest rates, currency exchange rates and other economic factors; (f) the possibility that the counterparty will default in the performance of its obligations; and (g) if the Fund has insufficient cash, it may have to sell securities from its portfolio to meet daily variation margin requirements, and a Fund may have to sell securities at a time when it may be disadvantageous to do so.
Simplify Exchange Traded Funds
Notes to Financial Statements (Continued)
June 30, 2024
Option Contracts
A Fund may purchase and write (i.e., sell) put and call options. Such options may relate to particular securities or stock indices, and may or may not be listed on a domestic or foreign securities exchange and may or may not be issued by the Options Clearing Corporation. Options trading is a highly specialized activity that entails greater than ordinary investment risk. Options may be more volatile than the underlying instruments, and therefore, on a percentage basis, an investment in options may be subject to greater fluctuation than an investment in the underlying instruments themselves.
A call option for a particular security gives the purchaser of the option the right to buy, and the writer (seller) the obligation to sell, the underlying security at the stated exercise price at any time prior to the expiration of the option, regardless of the market price of the security. The premium paid to the writer is in consideration for undertaking the obligation under the option contract. A put option for a particular security gives the purchaser the right to sell the security at the stated exercise price at any time prior to the expiration date of the option, regardless of the market price of the security. Stock index options are put options and call options on various stock indices. In most respects, they are identical to listed options on common stocks. The primary difference between stock options and index options occurs when index options are exercised. In the case of stock options, the underlying security, common stock, is delivered. However, upon the exercise of an index option, settlement does not occur by delivery of the securities comprising the index. The option holder who exercises the index option receives an amount of cash if the closing level of the stock index upon which the option is based is greater than, in the case of a call, or less than, in the case of a put, the exercise price of the option. This amount of cash is equal to the difference between the closing price of the stock index and the exercise price of the option expressed in dollars times a specified multiple. A stock index fluctuates with changes in the market value of the stocks included in the index.
Premiums paid on options purchased and premiums received on options written, as well as the daily fluctuation in market value, are included in investments at value and options written at value, respectively, in the Statements of Assets and Liabilities. When an instrument is purchased or sold through the exercise of an option, the premium is offset against the cost or proceeds of the underlying instrument. When an option expires, a realized gain or loss is recorded in the Statements of Operations to the extent of the premiums received or paid. When an option is closed or sold, a gain or loss is recorded in the Statements of Operations to the extent the cost of the closing transaction exceeds the premiums received or paid. When the Funds write a call option, such option is typically “covered,” meaning that they hold the underlying instrument subject to being called by the option counterparty. When the Funds write a put option, cash is segregated in an amount sufficient to cover the obligation. These amounts, which are considered restricted, are included in cash pledged as collateral for options written in the Statements of Assets and Liabilities.
Swaptions. A swaption is a contract that gives a counterparty the right (but not the obligation) to enter into a new swap agreement or to shorten, extend, cancel or otherwise modify an existing swap agreement, at some designated future time on specified terms. A Fund may write (sell) and purchase put and call swaptions. Depending on the terms of the particular swaption agreement, a Fund will generally incur a greater degree of risk when it writes a swaption than it will incur when it purchases a swaption. When a Fund purchases a swaption, it risks losing only the amount of the premium it has paid should it decide to let the swaption expire unexercised. However, when a Fund writes a swaption, it becomes obligated (if the swaption is exercised) according to the terms of the underlying agreement.
When a Fund writes a swaption, an amount equal to the premium received by a Fund is recorded as a liability, the value of which is marked-to-market daily to reflect the current market value of the swaption written. If the written swaption expires, a Fund realizes a gain equal to the amount of the premium paid, which is included in realized gain (loss) on written swaptions in the Statement of Operations. If the written swaption is exercised or sold, the premium received is added to the proceeds or offset against amounts paid on the underlying security to determine the realized gain or loss, which is reported as gain (loss) on written swaptions in the Statements of Operations.
A Fund may also purchase swaptions which involve the payment of premium in exchange for an option to enter into an interest rate swap and credit default swap with specified terms and conditions on a future date. The purchaser has the right, but not the obligation, to enter into the new swap agreement. Periodic payments are typically made during the life of the swap agreement according to the terms of such agreement. Changes in value of purchased swaptions are reported as part of change in unrealized gain (loss) on investments in the Statements of Operations. When the purchased swaption is exercised, terminated, expires or is sold, a Fund will record a gain or loss, which is reported as part of realized gain (loss) on investments in the Statements of Operations.
Swaps. Swap agreements are agreements between a Fund and a counterparty to exchange cash flows, assets, foreign currencies or market-linked returns at specified intervals. Swap agreements are privately negotiated in the OTC market (OTC swaps) or may be executed on a registered commodities exchange (centrally cleared swaps). Swaps are marked-to-market daily and the change in value is recorded as a component of unrealized appreciation/depreciation of swap contracts. The value of the swap will typically impose collateral posting obligations on the party that is considered out-of-the-money on the swap. Upfront payments made/received by the fund, if any, are amortized/accreted for financial reporting purposes, with the unamortized/unaccreted portion included in the Statement of assets and liabilities. A termination payment by the counterparty or the fund is recorded as realized gain or loss, as well as the net periodic payments received or paid by the fund. Entering into swap agreements involves, to varying degrees, elements of credit, market and documentation risk that may provide outcomes that produce losses in excess of the amounts recognized on the Statement of assets and liabilities. Such risks involve the possibility that there will be no liquid market for the swap, or that a counterparty may default on its obligation or delay payment under the swap terms. The counterparty may disagree or contest the terms of the swap. In addition to interest rate risk, market risks may also impact the swap. The fund may also suffer losses if it is unable to terminate or assign outstanding swaps or reduce its exposure through offsetting transactions.
Simplify Exchange Traded Funds
Notes to Financial Statements (Continued)
June 30, 2024
Total Return Swaps. Total return swaps are commitments where one party pays a fixed or variable rate premium (the Buyer) in exchange for a market-linked return (the Seller). The Seller pays the total return of a specific reference asset or index and in return receives interest payments from the Buyer. To the extent the total return of the underlying asset or index exceeds or falls short of the offsetting interest rate obligation, the Buyer will receive or make a payment to the Seller. A fund may enter into total return swaps in which it may act as either the Buyer or the Seller. Total return swap contracts are subject to the risk associated with the investment in the underlying reference asset or index. The risk in the case of short total return swap contracts is unlimited based on the potential for unlimited increases in the market value of the underlying reference asset or index.
Forward Foreign Exchange Currency Contracts
The Simplify Macro Strategy ETF entered into forward foreign exchange contracts primarily to manage and/or gain exposure to certain foreign currencies. A forward exchange contract is an agreement between the Fund and a counterparty to buy or sell a foreign currency at a specific exchange rate on a future date.
The following table summarizes the value of the Funds’ derivative instruments held as of June 30, 2024 and the related location in the accompanying Statement of Assets and Liabilities or Consolidated Statement of Assets and Liabilities, presented by underlying risk exposure:
| Fund | | Asset Derivatives | | | Liability Derivatives | |
| Simplify Aggregate Bond ETF | | | | | | | | | | | | |
| Interest Rate Contracts | | Unrealized appreciation on futures contracts* | | $ | 397,824 | | | Unrealized depreciation on futures contracts* | | $ | 98,281 | |
| Interest Rate Contracts | | Written options | | $ | — | | | Written options | | $ | 398,438 | |
| | | | | | | | | | | | | |
| Simplify Hedged Equity ETF | | | | | | | | | | | | |
| Equity Contracts | | Investments, at value(1) | | $ | 558,775 | | | Investments, at value(1) | | $ | — | |
| Equity Contracts | | Written options | | $ | — | | | Written options | | $ | 2,761,945 | |
| | | | | | | | | | | | | |
| Simplify High Yield PLUS Credit Hedge ETF | | | | | | | | | | | | |
| Credit Contracts | | Unrealized appreciation on centrally cleared swaps | | $ | 66,807 | | | Unrealized depreciation on centrally cleared swaps | | $ | — | |
| Equity Contracts | | Investments, at value(1) | | $ | 29,387 | | | Investments, at value(1) | | $ | — | |
| Equity Contracts | | Unrealized appreciation on OTC swaps | | $ | — | | | Unrealized depreciation on OTC swaps | | $ | 680,467 | |
| Interest Rate Contracts | | Unrealized appreciation on OTC swaps | | $ | — | | | Unrealized depreciation on OTC swaps | | $ | 171,516 | |
| Equity Contracts | | Written options | | $ | — | | | Written options | | $ | 14,693 | |
| | | | | | | | | | | | | |
| Simplify Interest Rate Hedge ETF | | | | | | | | | | | | |
| Interest Rate Contracts | | Unrealized appreciation on OTC swaps | | $ | 1,923 | | | Unrealized depreciation on OTC swaps | | $ | — | |
| Interest Rate Contracts | | Investments, at value(2) | | $ | 21,319,309 | | | Investments, at value(2) | | $ | 258,988 | |
| | | | | | | | | | | | | |
| Simplify Intermediate Term Treasury Futures Strategy ETF | | | | | | | | | | | | |
| Interest Rate Contracts | | Unrealized appreciation on futures contracts* | | $ | 1,326,249 | | | Unrealized depreciation on futures contracts* | | $ | — | |
| | | | | | | | | | | | | |
| Simplify Market Neutral Equity Long/Short ETF | | | | | | | | | | | | |
| Equity Contracts | | Unrealized appreciation on OTC swaps | | $ | 1,178,349 | | | Unrealized depreciation on OTC swaps | | $ | — | |
Simplify Exchange Traded Funds
Notes to Financial Statements (Continued)
June 30, 2024
| Fund | | Asset Derivatives | | | Liability Derivatives | |
| Simplify Multi-QIS Alternative ETF | | | | | | | | | | | | |
| Equity Contracts | | Investments, at value(1) | | $ | 3,162 | | | Investments, at value(1) | | $ | — | |
| Commodity Contracts | | Unrealized appreciation on OTC swaps | | $ | 424,585 | | | Unrealized depreciation on OTC swaps | | $ | 42,488 | |
| Credit Contracts | | Unrealized appreciation on OTC swaps | | $ | 48,339 | | | Unrealized depreciation on OTC swaps | | $ | — | |
| Equity Contracts | | Unrealized appreciation on OTC swaps | | $ | 277,685 | | | Unrealized depreciation on OTC swaps | | $ | 555,164 | |
| Foreign Exchange Contracts | | Unrealized appreciation on OTC swaps | | $ | 94,425 | | | Unrealized depreciation on OTC swaps | | $ | 9,969 | |
| Interest Rate Contracts | | Unrealized appreciation on OTC swaps | | $ | 173,630 | | | Unrealized depreciation on OTC swaps | | $ | 23,209 | |
| Equity Contracts | | Written options | | $ | — | | | Written options | | $ | 1,898 | |
| | | | | | | | | | | | | |
| Simplify Short Term Treasury Futures Strategy ETF | | | | | | | | | | | | |
| Interest Rate Contracts | | Unrealized appreciation on futures contracts* | | $ | 7,683,579 | | | Unrealized depreciation on futures contracts* | | $ | — | |
| | | | | | | | | | | | | |
| Simplify US Equity PLUS GBTC ETF | | | | | | | | | | | | |
| Equity Contracts | | Unrealized appreciation on futures contracts* | | $ | 8,900 | | | Unrealized depreciation on futures contracts* | | $ | — | |
| | | | | | | | | | | | | |
| Simplify US Equity PLUS QIS ETF | | | | | | | | | | | | |
| Equity Contracts | | Unrealized appreciation on futures contracts* | | $ | 5,550 | | | Unrealized depreciation on futures contracts* | | $ | — | |
| | | | | | | | | | | | | |
| Simplify Commodities Strategy No K-1 ETF | | | | | | | | | | | | |
| Commodity Contracts | | Unrealized appreciation on futures contracts* | | $ | 62,951 | | | Unrealized depreciation on futures contracts* | | $ | 175,626 | |
| | | | | | | | | | | | | |
| Simplify Macro Strategy ETF | | | | | | | | | | | | |
| Interest Rate Contracts | | Unrealized appreciation on futures contracts* | | $ | 185,000 | | | Unrealized depreciation on futures contracts* | | $ | — | |
| Equity Contracts | | Investments, at value(1) | | $ | 311,542 | | | Investments, at value(1) | | $ | — | |
| Equity Contracts | | Written options | | $ | — | | | Written options | | $ | 436,818 | |
| Interest Rate Contracts | | Written options | | $ | — | | | Written options | | $ | 95,000 | |
| Foreign Exchange Contracts | | Unrealized appreciation on forward foreign currency contracts | | $ | 245,487 | | | Unrealized depreciation on forward foreign currency contracts | | $ | 191,478 | |
| | | | | | | | | | | | | |
| Simplify Managed Futures Strategy ETF | | | | | | | | | | | | |
| Commodity Contracts | | Unrealized appreciation on futures contracts* | | $ | 4,046,550 | | | Unrealized depreciation on futures contracts* | | $ | 1,658,206 | |
| Interest Rate Contracts | | Unrealized appreciation on futures contracts* | | $ | 1,415,565 | | | Unrealized depreciation on futures contracts* | | $ | 1,067,238 | |
| * | Includes cumulative unrealized appreciation or unrealized cumulative depreciation on futures contracts as disclosed in the Schedule of Investments. |
| (1) | Purchased option contracts are included in Investments within the Statement of Assets and Liabilities or Consolidated Statement of Assets and Liabilities. |
| (2) | Purchased swaption contracts are included in Investments within the Statement of Assets and Liabilities. |
Simplify Exchange Traded Funds
Notes to Financial Statements (Continued)
June 30, 2024
For the year/period ended June 30, 2024, realized gains/(losses) and the change in unrealized appreciation/(depreciation) on purchased option contracts (a) by risk type, as disclosed in the Statements of Operations, is as follows:
| Fund | | Risk Type | | | Realized
Gain/(Loss) | | | Change in Unrealized
Appreciation/
(Depreciation) | |
| Simplify Aggregate Bond ETF | | Interest Rate | | | $ | (324,311 | ) | | $ | — | |
| Simplify Hedged Equity ETF | | Equity | | | | (5,662,441 | ) | | | 35,032 | |
| Simplify High Yield PLUS Credit Hedge ETF | | Equity | | | | (506,777 | ) | | | (9,192 | ) |
| Simplify Multi-QIS Alternative ETF | | Equity | | | | (135,079 | ) | | | (21,285 | ) |
| Simplify Macro Strategy ETF | | Equity | | | | (2,532,042 | ) | | | (2,728,562 | ) |
| Simplify Macro Strategy ETF | | Interest Rate | | | | (446,749 | ) | | | 455,324 | |
| (a) | Purchased option contracts are included in Net Realized Gain (Loss) on Investments within the Statement of Operations or Consolidated Statement of Operations. |
For the year ended June 30, 2024, realized gains/(losses) and the change in unrealized appreciation/(depreciation) on purchased swaption contracts (b) by risk type, as disclosed in the Statements of Operations, is as follows:
| Fund | | Risk Type | | | Realized
Gain/(Loss) | | | Change in Unrealized
Appreciation/
(Depreciation) | |
| Simplify Interest Rate Hedge ETF | | Interest Rate | | | $ | 25,116,891 | | | $ | 27,637,827 | |
| (b) | Purchased Swaptions are included in Net Realized Gain (Loss) on Investments within the Statement of Operations. |
For the year/period ended June 30, 2024, realized gains/(losses) and the change in unrealized appreciation/(depreciation) on swap contracts by risk type, as disclosed in the Statements of Operations, is as follows:
| Fund | | Risk Type | | | Realized
Gain/(Loss) | | | Change in Unrealized
Appreciation/
(Depreciation) | |
| Simplify Aggregate Bond ETF | | Equity | | | $ | 7,364 | | | $ | (2,346 | ) |
| Simplify High Yield PLUS Credit Hedge ETF | | Equity | | | | 78,921 | | | | (729,815 | ) |
| Simplify High Yield PLUS Credit Hedge ETF | | Interest Rate | | | | 5,085,850 | | | | (73,801 | ) |
| Simplify High Yield PLUS Credit Hedge ETF | | Credit | | | | (241,754 | ) | | | 66,807 | |
| Simplify Interest Rate Hedge ETF | | Interest Rate | | | | — | | | | 728 | |
| Simplify Market Neutral Equity Long/Short ETF | | Equity | | | | 1,568,686 | | | | 1,184,238 | |
| Simplify Multi-QIS Alternative ETF | | Equity | | | | (134,265 | ) | | | (277,479 | ) |
| Simplify Multi-QIS Alternative ETF | | Commodity | | | | 355,038 | | | | 382,097 | |
| Simplify Multi-QIS Alternative ETF | | Interest Rate | | | | (339,728 | ) | | | 150,421 | |
| Simplify Multi-QIS Alternative ETF | | Foreign Exchange | | | | 154,104 | | | | 84,456 | |
| Simplify Multi-QIS Alternative ETF | | Credit | | | | — | | | | 48,339 | |
Simplify Exchange Traded Funds
Notes to Financial Statements (Continued)
June 30, 2024
For the year/period ended June 30, 2024, realized gains/(losses) and the change in unrealized appreciation/(depreciation) on futures contracts by risk type, as disclosed in the Statements of Operations, is as follows:
| Fund | | Risk Type | | | Realized
Gain/(Loss) | | | Change in Unrealized
Appreciation/
(Depreciation) | |
| Simplify Aggregate Bond ETF | | Equity | | | $ | (680,299 | ) | | $ | — | |
| Simplify Aggregate Bond ETF | | Interest Rate | | | | (884,947 | ) | | | 328,056 | |
| Simplify Intermediate Term Treasury Futures Strategy ETF | | Interest Rate | | | | (10,807,134 | ) | | | 3,928,917 | |
| Simplify Short Term Treasury Futures Strategy ETF | | Interest Rate | | | | (57,457,682 | ) | | | 30,980,859 | |
| Simplify US Equity PLUS GBTC ETF | | Equity | | | | 278,100 | | | | (21,628 | ) |
| Simplify US Equity PLUS QIS ETF | | Equity | | | | 308,966 | | | | 5,550 | |
| Simplify Commodities Strategy No K-1 ETF | | Commodity | | | | (336,685 | ) | | | (119,744 | ) |
| Simplify Macro Strategy ETF | | Commodity | | | | 682,314 | | | | — | |
| Simplify Macro Strategy ETF | | Interest Rate | | | | 17,514 | | | | 185,000 | |
| Simplify Macro Strategy ETF | | Foreign Exchange | | | | (16,496 | ) | | | — | |
| Simplify Managed Futures Strategy ETF | | Commodity | | | | 4,919,934 | | | | 1,155,005 | |
| Simplify Managed Futures Strategy ETF | | Interest Rate | | | | 12,243,956 | | | | (4,691,463 | ) |
For the year/period ended June 30, 2024, realized gains/(losses) and the change in unrealized appreciation/(depreciation) on written option contracts by risk type, as disclosed in the Statements of Operations, is as follows:
| Fund | | Risk Type | | | Realized
Gain/(Loss) | | | Change in Unrealized
Appreciation/
(Depreciation) | |
| Simplify Aggregate Bond ETF | | Equity | | | $ | (4,100 | ) | | $ | (24,911 | ) |
| Simplify Aggregate Bond ETF | | Interest Rate | | | | 2,865,297 | | | | 128,265 | |
| Simplify Hedged Equity ETF | | Equity | | | | (6,544,735 | ) | | | (18,711 | ) |
| Simplify High Yield PLUS Credit Hedge ETF | | Equity | | | | 277,655 | | | | (3,135 | ) |
| Simplify Multi-QIS Alternative ETF | | Equity | | | | 17,186 | | | | 10,739 | |
| Simplify Macro Strategy ETF | | Equity | | | | 387,693 | | | | 223,349 | |
| Simplify Macro Strategy ETF | | Interest Rate | | | | 470,821 | | | | (193,774 | ) |
For the year ended June 30, 2024, realized gains/(losses) and the change in unrealized appreciation/(depreciation) on forward foreign currency contracts by risk type, as disclosed in the Statements of Operations, is as follows:
| Fund | | Risk Type | | | Realized
Gain/(Loss) | | | Change in Unrealized
Appreciation/
(Depreciation) | |
| Simplify Macro Strategy ETF | | Foreign Exchange | | | $ | (145,620 | ) | | $ | 54,009 | |
Simplify Exchange Traded Funds
Notes to Financial Statements (Continued)
June 30, 2024
For the year ended June 30, 2024, the average fiscal quarter end balances of outstanding derivative financial instruments were as follows:
| Fund | | Purchased Option
Contracts
(Contract Value) | | | Purchased
Swaption
Contracts
(Contract Value) | | | Forward Foreign
Currency
Contracts
(Notional Value) | | | Futures Contracts
(Notional Value) | | | Written Option
Contracts
(Contract Value) | | | Swaps
(Notional Value) | |
| Simplify Aggregate Bond ETF | | $ | 27,680 | | | $ | — | | | $ | — | | | $ | 56,733,356 | | | $ | (575,607 | ) | | $ | 534 | |
| Simplify Hedged Equity ETF | | | 772,792 | | | | — | | | | — | | | | — | | | | (3,744,029 | ) | | | — | |
| Simplify High Yield PLUS Credit Hedge ETF | | | 35,495 | | | | — | | | | — | | | | — | | | | (20,058 | ) | | | (51,452,279 | ) |
| Simplify Interest Rate Hedge ETF | | | — | | | | 15,962,739 | | | | — | | | | — | | | | — | | | | 6,000 | |
| Simplify Intermediate Term Treasury Futures Strategy ETF | | | — | | | | — | | | | — | | | | 158,611,553 | | | | — | | | | — | |
| Simplify Market Neutral Equity Long/Short ETF | | | — | | | | — | | | | — | | | | — | | | | — | | | | (196,279 | ) |
| Simplify Multi-QIS Alternative ETF | | | 791 | | | | — | | | | — | | | | — | | | | (474 | ) | | | (100,959,398 | ) |
| Simplify Short Term Treasury Futures Strategy ETF | | | — | | | | — | | | | — | | | | 3,116,944,288 | | | | — | | | | — | |
| Simplify US Equity PLUS GBTC ETF | | | — | | | | — | | | | — | | | | 1,838,375 | | | | — | | | | — | |
| Simplify US Equity PLUS QIS ETF | | | — | | | | — | | | | — | | | | 1,902,617 | | | | — | | | | — | |
| Simplify Commodities Strategy No K-1 ETF | | | — | | | | — | | | | — | | | | 1,579,905 | | | | — | | | | — | |
| Simplify Macro Strategy ETF | | | 1,368,904 | | | | — | | | | 10,802 | | | | 40,882,500 | | | | (519,362 | ) | | | — | |
| Simplify Managed Futures Strategy ETF | | | — | | | | — | | | | — | | | | (1,208,969,525 | ) | | | — | | | | — | |
Certain Funds enter into International Swaps and Derivatives Association, Inc. Master Agreements (“ISDA Master Agreements”) or similar master agreements (collectively, “Master Agreements”) with its OTC derivative contract counterparties in order to, among other things, reduce its credit risk to counterparties. ISDA Master Agreements include provisions for general obligations, representations, collateral and events of default or termination. Under an ISDA Master Agreement, the Fund typically may offset with the counterparty certain derivative financial instrument’s payables and/or receivables with collateral held and/or posted and create one single net payment (close-out netting) in the event of default or termination.
The following table presents Funds’ derivative assets and liabilities by counterparty net of amounts available for offset under a master netting agreement or similar arrangement (collectively referred to as “MNA”) and net of the related collateral received/pledged by the Fund as of June 30, 2024:
| Fund | | Gross Amounts
of Liabilities
Presented in
the Statements
of Assets and
Liabilities | | | Financial
Instruments
and Derivatives
Available for Offset | | | Cash
Collateral
Pledged(1) | | | Non-Cash Collateral
Pledged(1) | | | Net Amount
of Derivatives
Liabilities | |
| Simplify High Yield PLUS Credit Hedge ETF | | | | | | | | | | | | | | | | | | | | |
| Morgan Stanley Capital | | | | | | | | | | | | | | | | | | | | |
| Services LLC | | $ | 794,657 | | | $ | — | | | $ | — | | | $ | (794,657 | ) | | $ | — | |
| Nomura Securities | | | 57,326 | | | | — | | | | — | | | | (57,326 | ) | | | — | |
| | | $ | 851,983 | | | $ | — | | | $ | — | | | $ | (851,983 | ) | | $ | — | |
| (1) | The actual collateral received and/or pledged may be more than amount shown. |
Simplify Exchange Traded Funds
Notes to Financial Statements (Continued)
June 30, 2024
| Fund | | Gross Amounts of
Assets Presented
in the Statement
of Assets and
Liabilities(1) | | | Financial
Instruments
and Derivatives
Available for Offset | | | Collateral
Received(2) | | | Non-Cash
Collateral
Pledged(2) | | | Net Amount of
Derivatives Assets | |
| Simplify Interest Rate Hedge ETF | | | | | | | | | | | | | | | | | | | | |
| Bank of America NA | | $ | 3,780,150 | | | $ | — | | | $ | — | | | $ | — | | | $ | 3,780,150 | |
| Barclays Bank PLC | | | 2,966,692 | | | | — | | | | — | | | | (2,433,669 | ) | | | 533,023 | |
| Goldman Sachs International | | | 5,808,826 | | | | — | | | | — | | | | (1,012,232 | ) | | | 4,796,594 | |
| Morgan Stanley Capital Services LLC | | | 8,763,641 | | | | — | | | | — | | | | (7,875,761 | ) | | | 887,880 | |
| | | $ | 21,319,309 | | | $ | — | | | $ | — | | | $ | (11,321,662 | ) | | $ | 9,997,647 | |
| (1) | Purchased swaption contracts are included in Investments within the Statement of Assets and Liabilities. |
| (2) | The actual collateral received and/or pledged may be more than amount shown. |
| Fund | | Gross Amounts of Liabilities Presented in
the Statements
of Assets and
Liabilities(1) | | | Financial
Instruments
and Derivatives
Available for Offset | | | Cash Collateral
Pledged(2) | | | Non-Cash
Collateral
Pledged(2) | | | Net Amount of Derivatives Liabilities | |
| Simplify Interest Rate Hedge ETF | | | | | | | | | | | | | | | | | | | | |
| J&P Morgan Chase & Co | | $ | 258,988 | | | $ | — | | | $ | — | | | $ | — | | | $ | 258,988 | |
| | | $ | 258,988 | | | $ | — | | | $ | — | | | $ | — | | | $ | 258,988 | |
| (1) | Purchased swaption contracts are included in Investments within the Statement of Assets and Liabilities. |
| (2) | The actual collateral received and/or pledged may be more than amount shown. |
| Fund | | Gross Amounts of
Assets Presented in
the Statement
of Assets and
Liabilities | | | Financial
Instruments
and Derivatives
Available for Offset | | | Collateral
Received(1) | | | Non-Cash
Collateral
Pledged(1) | | | Net Amount of Derivatives Assets | |
| Simplify Market Neutral Equity Long/Short ETF | | | | | | | | | | | | | | | | | | | | |
| BNP Paribas | | $ | 622,049 | | | $ | — | | | $ | — | | | $ | — | | | $ | 622,049 | |
| Goldman Sachs International | | | 556,300 | | | | — | | | | — | | | | — | | | | 556,300 | |
| | | $ | 1,178,349 | | | $ | — | | | $ | — | | | $ | — | | | $ | 1,178,349 | |
| (1) | The actual collateral received and/or pledged may be more than amount shown. |
| Fund | | Gross Amounts of
Liabilities Presented in
the Statements
of Assets and
Liabilities | | | Financial
Instruments
and Derivatives
Available for Offset | | | Cash
Collateral
Pledged(1) | | | Non-Cash
Collateral
Pledged(1) | | | Net Amount of
Derivatives Liabilities | |
| Simplify Market Neutral Equity Long/Short ETF | | | | | | | | | | | | | | | | | | | | |
| | | $ | — | | | $ | — | | | $ | — | | | $ | — | | | $ | — | |
| (1) | The actual collateral received and/or pledged may be more than amount shown. |
Simplify Exchange Traded Funds
Notes to Financial Statements (Continued)
June 30, 2024
| Fund | | Gross Amounts of
Assets Presented in
the Statement
of Assets and
Liabilities | | | Financial
Instruments
and Derivatives
Available for Offset | | | Collateral
Received(1) | | | Non-Cash
Collateral
Pledged(1) | | | Net Amount of
Derivatives Assets | |
| Simplify Multi-QIS Alternative ETF | | | | | | | | | | | | | | | | | | | | |
| Bank of America NA | | $ | 754 | | | $ | (754 | ) | | $ | — | | | $ | — | | | $ | — | |
| BNP Paribas | | | 167,344 | | | | (10,103 | ) | | | — | | | | — | | | | 157,241 | |
| Goldman Sachs International | | | 278,706 | | | | (17,903 | ) | | | — | | | | — | | | | 260,803 | |
| J&P Morgan Chase & Co. | | | 3,563 | | | | — | | | | — | | | | — | | | | 3,563 | |
| Macquarie Bank | | | 343,724 | | | | (42,488 | ) | | | — | | | | — | | | | 301,236 | |
| Morgan Stanley Capital Services LLC | | | 224,573 | | | | (224,573 | ) | | | — | | | | — | | | | — | |
| | | $ | 1,018,664 | | | $ | (295,821 | ) | | $ | — | | | $ | — | | | $ | 722,843 | |
| (1) | The actual collateral received and/or pledged may be more than amount shown. |
| Fund | | Gross Amounts of Liabilities Presented in
the Statements
of Assets and
Liabilities | | | Financial
Instruments
and Derivatives
Available for Offset | | | Cash
Collateral
Pledged(1) | | | Non-Cash
Collateral
Pledged(1) | | | Net Amount
of Derivatives
Liabilities | |
| Simplify Multi-QIS Alternative ETF | | | | | | | | | | | | | | | | | | | | |
| Bank of America NA | | $ | 13,106 | | | $ | (754 | ) | | $ | — | | | $ | (12,352 | ) | | $ | — | |
| BNP Paribas | | | 10,103 | | | | (10,103 | ) | | | — | | | | — | | | | — | |
| Goldman Sachs International | | | 17,903 | | | | (17,903 | ) | | | — | | | | — | | | | — | |
| Macquarie Bank | | | 42,488 | | | | (42,488 | ) | | | — | | | | — | | | | — | |
| Morgan Stanley Capital Services LLC | | | 547,230 | | | | (224,573 | ) | | | — | | | | (322,657 | ) | | | — | |
| | | $ | 630,830 | | | $ | (295,821 | ) | | $ | — | | | $ | (335,009 | ) | | $ | — | |
| (1) | The actual collateral received and/or pledged may be more than amount shown. |
| Fund | | Gross Amounts of
Assets Presented in
the Statement
of Assets and
Liabilities | | | Financial
Instruments
and Derivatives
Available for Offset | | | Collateral
Received(1) | | | Non-Cash
Collateral
Pledged(1) | | | Net Amount of
Derivatives Assets | |
| Simplify Macro Strategy ETF | | | | | | | | | | | | | | | | | | | | |
| BNY Mellon Capital Market | | $ | 35,199 | | | $ | (19,578 | ) | | $ | — | | | $ | — | | | $ | 15,621 | |
| Nomura Securities | | | 121,733 | | | | (86,588 | ) | | | — | | | | — | | | | 35,145 | |
| The Bank of New York Mellon | | | 88,555 | | | | (85,312 | ) | | | — | | | | — | | | | 3,243 | |
| | | $ | 245,487 | | | $ | (191,478 | ) | | $ | — | | | $ | — | | | $ | 54,009 | |
| (1) | The actual collateral received and/or pledged may be more than amount shown. |
| Fund | | Gross Amounts of Liabilities Presented in
the Statements
of Assets and
Liabilities | | | Financial
Instruments
and Derivatives
Available for Offset | | | Cash
Collateral
Pledged(1) | | | Non-Cash
Collateral
Pledged(1) | | | Net Amount of
Derivatives Liabilities | |
| Simplify Macro Strategy ETF | | | | | | | | | | | | | | | | | | | | |
| BNY Mellon Capital Market | | $ | 19,578 | | | $ | (19,578 | ) | | $ | — | | | $ | — | | | $ | — | |
| Nomura Securities | | | 86,588 | | | | (86,588 | ) | | | — | | | | — | | | | — | |
| The Bank of New York Mellon | | | 85,312 | | | | (85,312 | ) | | | — | | | | — | | | | — | |
| | | $ | 191,478 | | | $ | (191,478 | ) | | $ | — | | | $ | — | | | $ | — | |
| (1) | The actual collateral received and/or pledged may be more than amount shown. |
Simplify Exchange Traded Funds
Notes to Financial Statements (Continued)
June 30, 2024
5. Investment Advisory Agreement and Other Agreements
The Adviser has overall responsibility for the general management and administration of the Funds, subject to the oversight of the Board. Under an investment advisory agreement between the Trust, on behalf of the Funds, and the Adviser (the “Investment Advisory Agreement”), the Adviser is responsible for arranging sub-advisory, transfer agency, custody, fund administration, and all other non-distribution related services for the Funds to operate. The Adviser has engaged Altis Partners (Jersey) Limited to act as the futures adviser to the Simplify Commodities Strategy No K-1 ETF and Simplify Managed Futures Strategy ETF under a futures advisory agreement (“Futures Advisory Agreement”) with the Adviser. The Adviser, not the Fund, pays the futures adviser.
For its investment advisory services to the Funds below, the Adviser was entitled to receive a management fee based on each Fund’s average daily net assets, computed and accrued daily and payable monthly, at an annual rate equal to:
| | | Management | |
| Fund | | Fee | |
| Simplify Aggregate Bond ETF | | | 0.50 | % |
| Simplify Health Care ETF | | | 0.50 | % |
| Simplify Hedged Equity ETF | | | 0.50 | % |
| Simplify High Yield PLUS Credit Hedge ETF | | | 0.50 | % |
| Simplify Interest Rate Hedge ETF | | | 0.50 | % |
| Simplify Intermediate Term Treasury Futures Strategy ETF | | | 0.25 | % |
| Simplify Market Neutral Equity Long/Short ETF | | | 1.00 | %* |
| Simplify MBS ETF | | | 0.25 | % |
| Simplify Multi-QIS Alternative ETF | | | 1.00 | % |
| Simplify Next Intangible Core Index ETF | | | 0.25 | % |
| Simplify Next Intangible Value Index ETF | | | 0.25 | % |
| Simplify Short Term Treasury Futures Strategy ETF | | | 0.25 | % |
| Simplify US Equity PLUS GBTC ETF | | | 0.50 | % |
| Simplify US Equity PLUS QIS ETF | | | 0.50 | % |
| Simplify Commodities Strategy No K-1 ETF | | | 0.75 | % |
| Simplify Macro Strategy ETF | | | 0.75 | % |
| Simplify Managed Futures Strategy ETF | | | 0.75 | % |
| * | For the period July 1, 2023 to May 23, 2024 Simplify Asset Management Inc. was the Adviser of the Fund and total fees earned during this period was $1,034,934. Effective May 24, 2024, Simplify EQLS LLC became the investment adviser of the Fund and total fees earned effective May 24, 2024 to period ended June 30, 2024 was $161,325. The management fee remains the same. |
The Adviser for the Funds below has contractually agreed, until at least October 31, 2024, to waive its management fees to 0.25% of the Fund’s average daily net assets. The agreement may only be terminated by the Board on 60 days’ written notice to the Adviser. For the year ended June 30, 2024, the Adviser waived fees of the Funds as follows:
| Fund | | Fees Waived | |
| Simplify Aggregate Bond ETF | | $ | 351,681 | |
| Simplify High Yield PLUS Credit Hedge ETF | | | 181,068 | |
The Adviser for the Funds below has contractually agreed, until at least October 31, 2024, to waive its management fees to 0.15% of the Fund’s average daily net assets. The agreement may only be terminated by the Board on 60 days’ written notice to the Adviser. For the year ended June 30, 2024, the Adviser waived fees of the Fund as follows:
| Fund | | Fees Waived | |
| Simplify Intermediate Term Treasury Futures Strategy ETF | | $ | 48,106 | |
| Simplify MBS ETF | | | 258,585 | |
| Simplify Short Term Treasury Futures Strategy ETF | | | 610,624 | |
The Adviser for the Fund below has contractually agreed, until at least October 31, 2024, to waive its management fees to 0.50% of the Fund’s average daily net assets. For the year ended June 30, 2024, the Adviser waived fees of the Fund as follows:
| Fund | | Fees Waived | |
| Simplify Macro Strategy ETF | | $ | 66,635 | |
The Adviser agreed to waive a portion of its management fee earned by investing a Fund’s assets invested in an affiliated fund until October 31, 2023. The affiliated funds fee waivers are not subject to recoupment. For the year ended June 30, 2024, the affiliated funds fees waived by the Adviser are as follows:
| | | Affiliated Fees | |
| Fund | | Waived | |
| Simplify Macro Strategy ETF | | $ | 15,323 | |
Simplify Exchange Traded Funds
Notes to Financial Statements (Continued)
June 30, 2024
Under the Investment Advisory Agreement, the Adviser has agreed to pay substantially all the operating expenses of the Funds, excluding interest expenses, taxes, brokerage expenses, Rule 12b-1 fees (if any), acquired fund fees and expenses, expenses incidental to a meeting of a Fund’s shareholders and the management fee. In addition to the excluded operating expenses, the Funds also pay non-operating expenses such as litigation and indemnification expenses and other expenses determined to be extraordinary by the Trust.
The Board has adopted a Distribution and Service Plan pursuant to Rule 12b-1 under the 1940 Act. In accordance with its Rule 12b-1 plan, each Fund is authorized to pay an amount up to 0.25% of its average daily net assets each year to finance activities primarily intended to result in the sale of Creation Units of the Fund or the provision of investor services. No Rule 12b-1 fees are currently paid by the Funds and there are no plans to impose these fees. However, in the event Rule 12b-1 fees are charged in the future, they will be paid out of the Fund’s assets, and directly impact the NAV per share of each Fund.
The Bank of New York Mellon, a wholly-owned subsidiary of The Bank of New York Mellon Corporation, serves as Administrator, Custodian, Accounting Agent and Transfer Agent for each Fund.
Foreside Financial Services, LLC (the “Distributor”) serves as the distributor of Creation Units for each Fund on an agency basis. The Distributor does not maintain a secondary market in shares of a Fund. Foreside Fund Officer Services, LLC a related party to the Distributor also serves as the Trust’s Compliance Officer.
A Trustee and certain Officers of the Trust are also employees of the Adviser and/or the Distributor.
6. Investment Transactions
Purchases and sales of securities, other than short-term securities, U.S. Government Securities and in-kind transactions were as follows:
| Fund | | Purchases | | | Sales | |
| Simplify Aggregate Bond PLUS Credit Hedge ETF | | $ | 386,450,145 | | | $ | 259,913,446 | |
| Simplify Health Care ETF | | | 171,039,984 | | | | 182,851,345 | |
| Simplify Hedged Equity ETF | | | 1,186,991 | | | | 21,769,251 | |
| Simplify High Yield PLUS Credit Hedge ETF | | | — | | | | — | |
| Simplify Interest Rate Hedge ETF | | | — | | | | — | |
| Simplify Intermediate Term Treasury Futures Strategy ETF | | | — | | | | — | |
| Simplify Market Neutral Equity Long/Short ETF | | | — | | | | — | |
| Simplify MBS ETF | | | — | | | | — | |
| Simplify Multi-QIS Alternative ETF | | | — | | | | — | |
| Simplify Next Intangible Core Index ETF | | | 840,206 | | | | 710,660 | |
| Simplify Next Intangible Value Index ETF | | | 1,382,424 | | | | 1,249,822 | |
| Simplify Short Term Treasury Futures Strategy ETF | | | — | | | | — | |
| Simplify US Equity PLUS GBTC ETF | | | 2,290,158 | | | | 2,195,106 | |
| Simplify US Equity PLUS QIS ETF | | | 5,177,234 | | | | 2,616,635 | |
| Simplify Commodities Strategy No K-1 ETF | | | — | | | | — | |
| Simplify Macro Strategy ETF | | | 15,824,871 | | | | 22,441,414 | |
| Simplify Managed Futures Strategy ETF | | | — | | | | — | |
Securities received and delivered in-kind through subscriptions and redemptions were as follows:
| Fund | | Purchases | | | Sales | |
| Simplify Aggregate Bond PLUS Credit Hedge ETF | | $ | 67,595,591 | | | $ | 3,938,845 | |
| Simplify Health Care ETF | | | 132,143,514 | | | | 67,417,422 | |
| Simplify Hedged Equity ETF | | | 245,606,964 | | | | 197,782,656 | |
| Simplify High Yield PLUS Credit Hedge ETF | | | — | | | | — | |
| Simplify Interest Rate Hedge ETF | | | 559,816 | | | | — | |
| Simplify Intermediate Term Treasury Futures Strategy ETF | | | — | | | | — | |
| Simplify Market Neutral Equity Long/Short ETF | | | — | | | | — | |
| Simplify MBS ETF | | | — | | | | — | |
| Simplify Multi-QIS Alternative ETF | | | — | | | | — | |
| Simplify Next Intangible Core Index ETF | | | 2,369,530 | | | | — | |
| Simplify Next Intangible Value Index ETF | | | 2,368,788 | | | | — | |
| Simplify Short Term Treasury Futures Strategy ETF | | | — | | | | — | |
| Simplify US Equity PLUS GBTC ETF | | | 18,159,426 | | | | 8,798,083 | |
| Simplify US Equity PLUS QIS ETF | | | — | | | | — | |
| Simplify Commodities Strategy No K-1 ETF | | | — | | | | — | |
| Simplify Macro Strategy ETF | | | 422,892 | | | | 21,522,216 | |
| Simplify Managed Futures Strategy ETF | | | — | | | | — | |
Purchases and sales of long term U.S. Government Securities were as follows:
| Fund | | Purchases | | | Sales | |
| Simplify Aggregate Bond PLUS Credit Hedge ETF | | $ | 29,871,094 | | | $ | 19,958,720 | |
Simplify Exchange Traded Funds
Notes to Financial Statements (Continued)
June 30, 2024
| Fund | | Purchases | | | Sales | |
| Simplify Interest Rate Hedge ETF | | | 99,825,044 | | | | 154,867,535 | |
| Simplify Macro Strategy ETF | | | 3,274,475 | | | | — | |
| Simplify MBS ETF | | | 3,669,374,669 | | | | 2,931,210,480 | |
7. Fund Share Transactions
The Funds issue and redeem Shares at NAV only in large blocks of 25,000 Shares (each block of Shares is called a “Creation Unit”). Creation Units are issued and redeemed primarily in-kind for securities but may include cash. Individual Shares may only be purchased and sold in secondary market transactions through brokers. Except when aggregated in Creation Units in transactions with Authorized Participants, the Shares are not redeemable securities of the Fund.
Fund Shares are listed and traded on the Exchange on each day that the Exchange is open for business (“Business Day”). Each Fund’s Shares may only be purchased and sold on the Exchange through a broker-dealer. Because each Fund’s Shares trade at market prices rather than at their NAV, Shares may trade at a price equal to the NAV, greater than NAV (premium) or less than NAV (discount).
Authorized participants pay a fixed transaction fee of $500 to the shareholder servicing agent when purchasing and redeeming Creation Units of a Fund. The transaction fee is used to defray the costs associated with the issuance and redemption of Creation Units. In addition to the fixed transaction fee, the Funds may charge an additional maximum 3% of the amount invested variable fee for creations and redemptions in cash, to offset brokerage and impact expenses associated with a cash transaction.
8. Federal Income Taxes
For the year/period ended June 30, 2024, the effect of permanent “book/tax” reclassifications to the components of net assets are included below. These differences are primarily due to redemptions-in-kind, non-deductible excise tax paid, prior year true ups, distributions in excess, return of capital distributions, and controlled foreign corporations income reversal and equalization.
| Fund |
| Distributable
earnings (loss) |
|
| Paid-in
Capital |
|
| Simplify Aggregate Bond ETF | | $ | 5,640 | | | $ | (5,640 | ) |
| Simplify Health Care ETF | | | (5,577,569 | ) | | | 5,577,569 | |
| Simplify Hedged Equity ETF | | | (28,661,080 | ) | | | 28,661,080 | |
| Simplify High Yield PLUS Credit Hedge ETF | | | — | | | | — | |
| Simplify Interest Rate Hedge ETF | | | (52,103,425 | ) | | | 52,103,425 | |
| Simplify Intermediate Term Treasury Futures Strategy ETF | | | — | | | | — | |
| Simplify Market Neutral Equity Long/Short ETF | | | — | | | | — | |
| Simplify MBS ETF | | | — | | | | — | |
| Simplify Multi-QIS Alternative ETF | | | — | | | | — | |
| Simplify Next Intangible Core Index ETF | | | — | | | | — | |
| Simplify Next Intangible Value Index ETF | | | — | | | | — | |
| Simplify Short Term Treasury Futures Strategy ETF | | | — | | | | — | |
| Simplify US Equity PLUS GBTC ETF | | | (1,216,198 | ) | | | 1,216,198 | |
| Simplify US Equity PLUS QIS ETF | | | (52,678 | ) | | | 52,678 | |
| Simplify Commodities Strategy No K-1 ETF | | | 261,436 | | | | (261,436 | ) |
| Simplify Macro Strategy ETF | | | 661,644 | | | | (661,644 | ) |
| Simplify Managed Futures Strategy ETF | | | (1,596,970 | ) | | | 1,596,970 | |
The tax character of dividends and distributions declared for the year/period ended June 30, 2024 were as follows:
| Fund |
|
Ordinary Income* |
|
| Long-Term
Capital Gains |
|
| Return of
Capital |
|
| Simplify Aggregate Bond ETF | | $ | 6,394,098 | | | $ | — | | | $ | 8,368,404 | |
| Simplify Health Care ETF | | | 490,865 | | | | — | | | | — | |
| Simplify Hedged Equity ETF | | | 3,828,551 | | | | 2,291,933 | | | | — | |
| Simplify High Yield PLUS Credit Hedge ETF | | | 4,715,001 | | | | — | | | | — | |
| Simplify Interest Rate Hedge ETF | | | 9,178,055 | | | | 66,928,543 | | | | — | |
| Simplify Intermediate Term Treasury Futures Strategy ETF | | | 2,051,789 | | | | — | | | | — | |
Simplify Exchange Traded Funds
Notes to Financial Statements (Continued)
June 30, 2024
| Fund |
|
Ordinary Income* |
|
| Long-Term
Capital Gains |
|
| Return of
Capital |
|
| Simplify Market Neutral Equity Long/Short ETF | | $ | 8,626,872 | | | $ | — | | | $ | 687,184 | |
| Simplify MBS ETF | | | 13,271,970 | | | | — | | | | 2,807,611 | |
| Simplify Multi-QIS Alternative ETF | | | 4,209,252 | | | | — | | | | — | |
| Simplify Next Intangible Core Index ETF | | | 5,000 | | | | — | | | | — | |
| Simplify Next Intangible Value Index ETF | | | 5,000 | | | | — | | | | — | |
| Simplify Short Term Treasury Futures Strategy ETF | | | 28,690,445 | | | | — | | | | — | |
| Simplify US Equity PLUS GBTC ETF | | | 41,389 | | | | — | | | | 93,611 | |
| Simplify US Equity PLUS QIS ETF | | | 77,979 | | | | — | | | | — | |
| Simplify Commodities Strategy No K-1 ETF | | | 250,815 | | | | — | | | | — | |
| Simplify Macro Strategy ETF | | | 1,100,199 | | | | — | | | | — | |
| Simplify Managed Futures Strategy ETF | | | 7,586,987 | | | | 5,083,755 | | | | — | |
| * | For tax purposes short-term capital gain distributions are considered ordinary income distributions. |
The tax character of dividends and distributions declared for the year/period ended June 30, 2023 were as follows:
| Fund |
|
Ordinary Income* |
|
| Long-Term
Capital Gains |
|
| Return of
Capital |
|
| Simplify Aggregate Bond ETF | | $ | 193,442 | | | $ | — | | | $ | 98,448 | |
| Simplify Health Care ETF | | | 399,848 | | | | — | | | | — | |
| Simplify Hedged Equity ETF | | | 2,448,208 | | | | 1,980,761 | | | | — | |
| Simplify High Yield PLUS Credit Hedge ETF | | | 2,959,704 | | | | — | | | | 708,226 | |
| Simplify Interest Rate Hedge ETF | | | 3,979,978 | | | | — | | | | — | |
| Simplify Intermediate Term Treasury Futures Strategy ETF | | | 1,438,455 | | | | — | | | | — | |
| Simplify Short Term Treasury Futures Strategy ETF | | | 4,542,976 | | | | — | | | | — | |
| Simplify Developed Ex-US PLUS Downside Convexity ETF | | | 451,205 | | | | — | | | | — | |
| Simplify Emerging Markets Equity PLUS Downside Convexity ETF | | | 88,043 | | | | — | | | | — | |
| Simplify US Equity PLUS GBTC ETF | | | 94,553 | | | | — | | | | 174,233 | |
| Simplify Commodities Strategy No K-1 ETF | | | 25,000 | | | | — | | | | — | |
| Simplify Macro Strategy ETF | | | 1,363,559 | | | | — | | | | — | |
| Simplify Managed Futures Strategy ETF | | | 6,630,857 | | | | 4,136,275 | | | | — | |
| * | For tax purposes short-term capital gain distributions are considered ordinary income distributions. |
As of June 30, 2024, the components of accumulated earnings (losses) on a tax basis were as follows:
| Fund | | Undistributed
Ordinary
Income | | | Undistributed
Long-term
Capital Gains | | | Temporary
Book/Tax
Differences(a) | | | Net Unrealized
Appreciation
(Depreciation) | | | Accumulated
Capital and
Other Losses | | | Post-October/
Late-year
Ordinary Loss
Deferrals | | | Distributable
earnings (loss) | |
| Simplify Aggregate Bond ETF | | $ | — | | | $ | — | | | $ | — | | | $ | (938,193 | ) | | $ | — | | | $ | — | | | $ | (938,193 | ) |
| Simplify Health Care ETF | | | — | | | | — | | | | — | | | | 6,911,570 | | | | (5,654,459 | ) | | | — | | | | 1,257,111 | |
| Simplify Hedged Equity ETF | | | — | | | | — | | | | (5,179,373 | ) | | | 12,605,694 | | | | (16,010,592 | ) | | | — | | | | (8,584,271 | ) |
| Simplify High Yield PLUS Credit Hedge ETF | | | 3,158,206 | | | | — | | | | — | | | | (185,369 | ) | | | (4,190,589 | ) | | | — | | | | (1,217,752 | ) |
| Simplify Interest Rate Hedge ETF | | | 507,945 | | | | — | | | | — | | | | 21,016,627 | | | | — | | | | (4,428,435 | ) | | | 17,096,137 | |
| Simplify Intermediate Term Treasury Futures Strategy ETF | | | 272,534 | | | | — | | | | — | | | | 4,718 | | | | (27,550,058 | ) | | | — | | | | (27,272,806 | ) |
| Simplify Market Neutral Equity Long/ Short ETF | | | — | | | | — | | | | — | | | | (69,690 | ) | | | (85,564 | ) | | | (617,066 | ) | | | (772,320 | ) |
| Simplify MBS ETF | | | — | | | | — | | | | — | | | | 2,086,193 | | | | (2,812,226 | ) | | | — | | | | (726,033 | ) |
| Simplify Multi-QIS Alternative ETF | | | 624,384 | | | | — | | | | — | | | | 375,896 | | | | (112,607 | ) | | | — | | | | 887,673 | |
| Simplify Next Intangible Core Index ETF | | | 29,836 | | | | — | | | | — | | | | 90,943 | | | | — | | | | — | | | | 120,779 | |
| Simplify Next Intangible Value Index ETF | | | 61,414 | | | | 12 | | | | — | | | | 38,035 | | | | — | | | | — | | | | 99,461 | |
Simplify Exchange Traded Funds
Notes to Financial Statements (Continued)
June 30, 2024
| Fund | | Undistributed
Ordinary
Income | | | Undistributed
Long-term
Capital Gains | | | Temporary
Book/Tax
Differences(a) | | | Net Unrealized
Appreciation
(Depreciation) | | | Accumulated
Capital and
Other Losses | | | Post-October/
Late-year
Ordinary Loss
Deferrals | | | Distributable
earnings (loss) | |
| Simplify Short Term Treasury Futures Strategy ETF | | $ | 974,004 | | | $ | — | | | $ | — | | | $ | 52,575 | | | $ | (53,676,336 | ) | | $ | — | | | $ | (52,649,757 | ) |
| Simplify US Equity PLUS GBTC ETF | | | — | | | | — | | | | — | | | | 1,569,830 | | | | (4,491,461 | ) | | | — | | | | (2,921,631 | ) |
| Simplify US Equity PLUS QIS ETF | | | 212,216 | | | | 165,619 | | | | — | | | | 154,710 | | | | — | | | | — | | | | 532,545 | |
| Simplify Commodities Strategy No K-1 ETF | | | 34,257 | | | | — | | | | — | | | | (111,960 | ) | | | (151 | ) | | | — | | | | (77,854 | ) |
| Simplify Macro Strategy ETF | | | 245,240 | | | | — | | | | — | | | | (994,230 | ) | | | (3,418,419 | ) | | | — | | | | (4,167,409 | ) |
| Simplify Managed Futures Strategy ETF | | | 10,167,306 | | | | — | | | | — | | | | 1,517,291 | | | | — | | | | — | | | | 11,684,597 | |
| (a) | The temporary book/tax differences was attributable primarily due to straddles deferral and Subpart F income. |
At June 30, 2024, gross unrealized appreciation and depreciation of investments owned by each Fund, based on cost for federal income tax purposes were as follows:
| Fund | | Tax Cost | | | Gross
Unrealized
Appreciation | | | Gross
Unrealized
Depreciation | | | Net Unrealized
Appreciation
(Depreciation) | |
| Simplify Aggregate Bond PLUS Credit Hedge ETF | | $ | 217,270,312 | | | $ | 255,646 | | | $ | (1,193,839 | ) | | $ | (938,193 | ) |
| Simplify Health Care ETF | | | 124,428,961 | | | | 12,076,207 | | | | (5,164,637 | ) | | | 6,911,570 | |
| Simplify Hedged Equity ETF | | | 158,831,344 | | | | 15,147,437 | | | | (2,541,743 | ) | | | 12,605,694 | |
| Simplify High Yield PLUS Credit Hedge ETF | | | 154,441,924 | | | | 34,040 | | | | (28,525 | ) | | | 5,515 | |
| Simplify Interest Rate Hedge ETF | | | 124,080,786 | | | | 21,377,501 | | | | (362,797 | ) | | | 21,014,704 | |
| Simplify Intermediate Term Treasury Futures Strategy ETF | | | 48,139,284 | | | | 4,718 | | | | — | | | | 4,718 | |
| Simplify Market Neutral Equity Long/Short ETF | | | 153,282,815 | | | | 8,327 | | | | — | | | | 8,327 | |
| Simplify MBS ETF | | | 1,483,489,262 | | | | 2,281,785 | | | | (195,592 | ) | | | 2,086,193 | |
| Simplify Multi-QIS Alternative ETF | | | 114,469,360 | | | | 6,037 | | | | (21,285 | ) | | | (15,248 | ) |
| Simplify Next Intangible Core Index ETF | | | 2,528,813 | | | | 142,928 | | | | (51,985 | ) | | | 90,943 | |
| Simplify Next Intangible Value Index ETF | | | 2,560,147 | | | | 101,096 | | | | (63,061 | ) | | | 38,035 | |
| Simplify Short Term Treasury Futures Strategy ETF | | | 536,270,680 | | | | 52,575 | | | | — | | | | 52,575 | |
| Simplify US Equity PLUS GBTC ETF | | | 19,886,906 | | | | 1,667,234 | | | | (97,404 | ) | | | 1,569,830 | |
| Simplify US Equity PLUS QIS ETF | | | 2,788,763 | | | | 173,194 | | | | (18,484 | ) | | | 154,710 | |
| Simplify Commodities Strategy No K-1 ETF | | | 10,149,994 | | | | 715 | | | | — | | | | 715 | |
| Simplify Macro Strategy ETF | | | 19,480,435 | | | | 1,657,449 | | | | (3,281,699 | ) | | | (1,624,250 | ) |
| Simplify Managed Futures Strategy ETF | | | 190,691,701 | | | | 1,358,335 | | | | (1,344,468 | ) | | | 13,867 | |
The differences between book-basis and tax-basis components of net assets are primarily attributable to the tax deferral of losses on wash sales, grantor trust adjustments, section 1256 mark-to-market treatment of derivatives and return of capital basis adjustments from underlying investments.
The following Funds utilized capital loss carryforwards to offset taxable gains realized during the year ended June 30, 2024:
| Fund | | Amount | |
| Simplify Aggregate Bond ETF | | $ | 29,231 | |
| Simplify Health Care ETF | | | 1,022,838 | |
| Simplify US Equity PLUS GBTC ETF | | | 346,410 | |
At June 30, 2024, for federal income tax purposes, the Funds had capital loss carryforwards available as shown in the table below, to the extent provided by regulations, to offset future capital gains for an unlimited period. To the extent that these capital loss carryforwards are used to offset future capital gains, it is probable that the capital gains so offset will not be distributed to shareholders.
Simplify Exchange Traded Funds
Notes to Financial Statements (Continued)
June 30, 2024
| Fund | | Short-Term | | | Long-Term | | | Total Amount | |
| Simplify Health Care ETF | | $ | 3,236,205 | | | $ | 2,418,254 | | | $ | 5,654,459 | |
| Simplify Hedged Equity ETF | | | 6,358,353 | | | | 9,652,239 | | | | 16,010,592 | |
| Simplify High Yield PLUS Credit Hedge ETF | | | 3,686,350 | | | | 504,239 | | | | 4,190,589 | |
| Simplify Intermediate Term Treasury Futures Strategy ETF | | | 12,036,668 | | | | 15,513,390 | | | | 27,550,058 | |
| Simplify Market Neutral Equity Long/Short ETF | | | 85,564 | | | | — | | | | 85,564 | |
| Simplify MBS ETF | | | 2,812,226 | | | | — | | | | 2,812,226 | |
| Simplify Multi-QIS Alternative ETF | | | 35,543 | | | | 77,064 | | | | 112,607 | |
| Simplify Short Term Treasury Futures Strategy ETF | | | 21,444,825 | | | | 32,231,511 | | | | 53,676,336 | |
| Simplify US Equity PLUS GBTC ETF | | | 2,023,055 | | | | 2,468,406 | | | | 4,491,461 | |
| Simplify Commodities Strategy No K-1 ETF | | | 151 | | | | — | | | | 151 | |
| Simplify Macro Strategy ETF | | | 3,418,419 | | | | — | | | | 3,418,419 | |
Certain capital and qualified late year ordinary losses incurred after October 31 and December 31, respectively, and within the current taxable year, are deemed to arise on the first business day of each Fund’s next taxable year. At June 30 2024, the following Funds incurred and will elect to defer post-October capital losses and late year ordinary losses:
| | | Capital Post- | | | Late-year | |
| Fund | | October Losses | | | ordinary Losses | |
| Simplify Interest Rate Hedge ETF | | $ | 4,428,435 | | | $ | — | |
| Simplify Market Neutral Equity Long/Short ETF | | | — | | | | 617,066 | |
9. Subsequent Events
Management has evaluated subsequent events through the date of issuance of these financial statements and, except as noted above, has determined that there are no other subsequent events that require adjustment to, or disclosure in, the financial statement.
Simplify Exchange Traded Funds
Report of Independent Registered Public Accounting Firm
To the Shareholders and Board of Trustees of
Simplify Exchange Traded Funds
Opinion on the Financial Statements
We have audited the accompanying statements of assets and liabilities or consolidated statements of assets and liabilities, including the schedules of investments or consolidated schedules of investments, of the funds listed below (the “Funds”), each a series of Simplify Exchange Traded Funds, as of June 30, 2024, the related statements of operations or consolidated statements of operations, the statements of changes in net assets or consolidated statements of changes in net assets, the financial highlights or consolidated financial highlights for each of the periods indicated below, and the related notes (collectively referred to as the “financial statements”). In our opinion, the financial statements present fairly, in all material respects, the financial position of each of the Funds as of June 30, 2024, the results of their operations, the changes in net assets, and the financial highlights for each of the periods indicated below in conformity with accounting principles generally accepted in the United States of America.
| Fund Name | | Statements of
Operations and Cash Flows
(as applicable) | | Statements of
Changes in Net Assets | | Financial Highlights |
| Simplify Aggregate Bond ETF (formerly Simplify Aggregate Bond PLUS Credit Hedge ETF) | | For the year ended June 30, 2024 | | For the years ended June 30, 2024 and 2023 | | For the years ended June 30, 2024 and 2023, and for the period from February 15, 2022 (commencement of operations) through June 30, 2022 |
| | | | | | | |
| Simplify Health Care ETF | | For the year ended June 30, 2024 | | For the years ended June 30, 2024 and 2023 | | For the years ended June 30, 2024 and 2023, and for the period from October 8, 2021 (commencement of operations) through June 30, 2022 |
| | | | | | | |
| Simplify Hedged Equity ETF | | For the year ended June 30, 2024 | | For the years ended June 30, 2024 and 2023 | | For the years ended June 30, 2024 and 2023, and for the period from November 2, 2021 (commencement of operations) through June 30, 2022 |
| | | | | | | |
| Simplify High Yield PLUS Credit Hedge ETF | | For the year ended June 30, 2024 | | For the years ended June 30, 2024 and 2023 | | For the years ended June 30, 2024 and 2023, and for the period from February 15, 2022 (commencement of operations) through June 30, 2022 |
| | | | | | | |
| Simplify Interest Rate Hedge ETF | | For the year ended June 30, 2024 | | For the years ended June 30, 2024 and 2023 | | For the years ended June 30, 2024, 2023, and 2022, and for the period from May 11, 2021 (commencement of operations) through June 30, 2021 |
Simplify Exchange Traded Funds
Report of Independent Registered Public Accounting Firm(Continued)
| Fund Name | | Statements of
Operations and Cash Flows
(as applicable) | | Statements of
Changes in Net Assets | | Financial Highlights |
| Simplify Intermediate Term Treasury Futures Strategy ETF | | For the year ended June 30, 2024 | | For the years ended June 30, 2024 and 2023 | | For the years ended June 30, 2024 and 2023, and for the period from September 28, 2021 (commencement of operations) through June 30, 2022 |
| Simplify Market Neutral Equity Long/Short ETF | | For the year ended June 30, 2024 | | For the year ended June 30, 2024 and for the period from June 14, 2023 (commencement of operations) through June 30, 2023 |
| Simplify MBS ETF | | For the period from November 7, 2023 (commencement of operations) through June 30, 2024 |
| Simplify Multi-QIS Alternative ETF | | For the period from July 11, 2023 (commencement of operations) through June 30, 2024 |
| Simplify Next Intangible Core Index ETF and Simplify Next Intangible Value Index ETF | | For the period from April 16, 2024 (commencement of operations) through June 30, 2024 |
| Simplify Short Term Treasury Futures Strategy ETF | | For the year ended June 30, 2024 | | For the year ended June 30, 2024 and for the period from November 15, 2022 (commencement of operations) through June 30, 2023 |
| Simplify US Equity PLUS GBTC ETF | | For the year ended June 30, 2024 | | For the years ended June 30, 2024 and 2023 | | For the years ended June 30, 2024, 2023, and 2022, and for the period from May 25, 2021 (commencement of operations) through June 30, 2021 |
| Simplify US Equity PLUS QIS ETF | | For the period from November 14, 2023 (commencement of operations) through June 30, 2024 |
| Simplify Commodities Strategy No K-1 ETF | | Consolidated for the year ended June 30, 2024 | | Consolidated for the year ended June 30, 2024 and for the period from March 28, 2023 (commencement of operations) through June 30, 2023 |
| Simplify Macro Strategy ETF | | Consolidated for the year ended June 30, 2024 | | Consolidated for the years ended June 30, 2024 and 2023 | | Consolidated for the years ended June 30, 2024 and 2023, and for the period from May 17, 2022 (commencement of operations) through June 30, 2022 |
| Simplify Managed Futures Strategy ETF | | Consolidated for the year ended June 30, 2024 | | Consolidated for the years ended June 30, 2024 and 2023 | | Consolidated for the years ended June 30, 2024 and 2023, and for the period from March 8, 2022 (commencement of operations) through June 30, 2022 |
Simplify Exchange Traded Funds
Report of Independent Registered Public Accounting Firm(Continued)
Basis for Opinion
These financial statements are the responsibility of the Funds’ management. Our responsibility is to express an opinion on the Funds’ financial statements based on our audits. We are a public accounting firm registered with the Public Company Accounting Oversight Board (United States) (“PCAOB”) and are required to be independent with respect to the Funds in accordance with the U.S. federal securities laws and the applicable rules and regulations of the Securities and Exchange Commission and the PCAOB.
We conducted our audits in accordance with the standards of the PCAOB. Those standards require that we plan and perform the audit to obtain reasonable assurance about whether the financial statements are free of material misstatement whether due to error or fraud.
Our audits included performing procedures to assess the risks of material misstatement of the financial statements, whether due to error or fraud, and performing procedures that respond to those risks. Such procedures included examining, on a test basis, evidence regarding the amounts and disclosures in the financial statements. Our procedures included confirmation of securities owned as of June 30, 2024, by correspondence with the custodian and brokers; when replies were not received from brokers, we performed other auditing procedures. Our audits also included evaluating the accounting principles used and significant estimates made by management, as well as evaluating the overall presentation of the financial statements. We believe that our audits provide a reasonable basis for our opinion.
We have served as the auditor of one of more funds advised by Simplify Asset Management, Inc. since 2020.

COHEN & COMPANY, LTD.
Cleveland, Ohio
August 29, 2024
Simplify Exchange Traded Funds
Additional Information (Unaudited)
Discount & Premium Information
Information regarding how often shares of each Fund traded on Cboe BZX Exhange, Inc., NYSE Arca or NASDAQ, as applicable, at a price above (i.e., at a premium) or below (i.e., at a discount) the NAV of the Fund can be found at www.simplify.us.
Tax Information
Form 1099-DIV and other year-end tax information provide shareholders with actual calendar year amounts that should be included in their tax returns. Shareholders should consult their tax advisors.
Each Fund designates the following amounts or, if subsequently determined to be different, the maximum allowable for its period ended June 30, 2024.
| Fund | | Qualified
Dividend
Income* | | | Dividends
Received
Deduction | |
| Simplify Aggregate Bond PLUS Credit Hedge ETF | | | 00.00 | % | | | 00.00 | % |
| Simplify Health Care ETF | | | 100.00 | % | | | 99.82 | % |
| Simplify Hedged Equity ETF | | | 75.25 | % | | | 73.21 | % |
| Simplify High Yield PLUS Credit Hedge ETF | | | 00.00 | % | | | 00.00 | % |
| Simplify Interest Rate Hedge ETF | | | 00.00 | % | | | 00.00 | % |
| Simplify Intermediate Term Treasury Futures Strategy ETF | | | 00.00 | % | | | 00.00 | % |
| Simplify Market Neutral Equity Long Short ETF | | | 00.00 | % | | | 00.00 | % |
| Simplify MBS ETF | | | 00.00 | % | | | 00.00 | % |
| Simplify Multi-QIS Alternative ETF | | | 00.00 | % | | | 00.00 | % |
| Simplify Next Intangible Core Index ETF | | | 21.08 | % | | | 20.76 | % |
| Simplify Next Intangible Value Index ETF | | | 14.57 | % | | | 14.39 | % |
| Simplify Short Term Treasury Futures Strategy ETF | | | 00.00 | % | | | 00.00 | % |
| Simplify US Equity PLUS GBTC ETF | | | 100.00 | % | | | 100.00 | % |
| Simplify US Equity PLUS QIS ETF | | | 3.80 | % | | | 3.71 | % |
| Simplify Commodities Strategy No K-1 ETF | | | 00.00 | % | | | 00.00 | % |
| Simplify Macro Strategy ETF | | | 00.00 | % | | | 0.23 | % |
| Simplify Managed Futures Strategy ETF | | | 00.00 | % | | | 00.00 | % |
| * | The above percentage is based on ordinary income dividends paid to shareholders during each Fund’s fiscal year. |
This report must be preceded or accompanied by a prospectus.
(This page intentionally left blank)
Investment Adviser
Simplify Asset Management Inc.
10845 Griffith Peak Drive, 2/F
Las Vegas, NV 89135 | | Simplify Exchange Traded Funds
10845 Griffith Peak Drive, 2/F
Las Vegas, NV 89135 | | Custodian, Administrator & Transfer Agent
The Bank of New York Mellon
240 Greenwich Street
New York, NY 10286 |
| | | | | |
Futures Adviser
(HARD/CTA)
Le Quai House, Le Quai
D’ Auvergne, Jersey JE2 3TN | | Independent Registered Public Accounting Firm
Cohen & Company Ltd.
1350 Euclid Ave., Suite 800
Cleveland, OH 44115 | | Legal Counsel
Thompson Hine LLP
41 South High Street
Suite 1700
Columbus, OH 43215 |
June 30, 2024
Annual Financial Statements and
Other Important Information
Simplify Exchange Traded Funds
Simplify Opportunistic Income ETF (CRDT)

(This page intentionally left blank)
Simplify Exchange Traded Funds
Table of Contents
This report is provided for the general information of shareholders and is not authorized for distribution to prospective investors unless preceded or accompanied by a current prospectus.
Simplify Opportunistic Income ETF
Schedule of Investments
June 30, 2024
| | | Principal | | | Value | |
| U.S. Treasury Bills – 27.5% | | | | | | | | |
| U.S. Treasury Bill, 5.37%, 7/5/2024(a) | | $ | 5,500,000 | | | $ | 5,496,801 | |
| U.S. Treasury Bill, 5.39%, 9/19/2024(a)(e)(f) | | | 15,200,000 | | | | 15,024,085 | |
| Total U.S. Treasury Bills (Cost $20,520,463) | | | | | | | 20,520,886 | |
| | | | | | | | | |
| Corporate Bonds – 25.9% | | | | | | | | |
| Basic Materials – 0.7% | | | | | | | | |
| Domtar Corp., 6.75%, 10/1/2028, 144A(b) | | | 600,000 | | | | 535,742 | |
| | | | | | | | | |
| Communications – 2.8% | | | | | | | | |
| Clear Channel Outdoor Holdings, Inc., 7.75%, 4/15/2028, 144A(b) | | | 500,000 | | | | 438,220 | |
| Frontier Communications Holdings LLC, 8.63%, 3/15/2031, 144A(b) | | | 200,000 | | | | 206,916 | |
| GoTo Group, Inc., 5.50%, 5/1/2028, 144A(b) | | | 223,300 | | | | 90,436 | |
| GrubHub Holdings, Inc., 5.50%, 7/1/2027, 144A(b) | | | 700,000 | | | | 635,083 | |
| Lumen Technologies, Inc., 7.60%, 9/15/2039, Series P | | | 1,550,000 | | | | 428,076 | |
| Urban One, Inc., 7.38%, 2/1/2028, 144A(b) | | | 350,000 | | | | 272,692 | |
| | | | | | | | 2,071,423 | |
| Consumer, Cyclical – 5.1% | | | | | | | | |
| Carvana Co., 5.63%, 10/1/2025, 144A(b) | | | 1,500,000 | | | | 1,473,350 | |
| Ford Motor Credit Co. LLC, 4.13%, 8/4/2025 | | | 1,000,000 | | | | 981,608 | |
| QVC, Inc., 4.38%, 9/1/2028 | | | 600,000 | | | | 439,681 | |
| Tenneco, Inc., 8.00%, 11/17/2028, 144A(b) | | | 1,000,000 | | | | 910,998 | |
| | | | | | | | 3,805,637 | |
| Energy – 2.5% | | | | | | | | |
| Enterprise Products Operating LLC, 5.38%, (CME 3-Month SOFR + 2.83%), 2/15/2078(c) | | | 550,000 | | | | 514,392 | |
| Sabine Pass Liquefaction LLC, 5.63%, 3/1/2025 | | | 600,000 | | | | 598,870 | |
| Valaris Ltd., 8.38%, 4/30/2030, 144A(b) | | | 750,000 | | | | 777,075 | |
| | | | | | | | 1,890,337 | |
| Financial – 12.4% | | | | | | | | |
| Apollo Commercial Real Estate Finance, Inc., 4.63%, 6/15/2029, 144A(b) | | | 400,000 | | | | 335,835 | |
| First Republic Bank, 4.63%, 2/13/2047 | | | 1,500,000 | | | | 63,750 | |
| Flagstar Bancorp, Inc., 4.13%, (CME 3-Month SOFR + 3.91%), 11/1/2030(c) | | | 1,000,000 | | | | 858,235 | |
| Global Atlantic Fin Co., 7.95%, (US 5 Year CMT T-Note + 3.61%), 10/15/2054, 144A(b)(c) | | | 1,000,000 | | | | 1,008,605 | |
| Liberty Mutual Group, Inc., 4.13%, (US 5 Year CMT T-Note + 3.32%), 12/15/2051, 144A(b)(c) | | | 1,500,000 | | | | 1,400,337 | |
| Office Properties Income Trust, 9.00%, 3/31/2029, 144A(b) | | | 850,000 | | | | 779,470 | |
| PennyMac Corp., 8.50%, 6/1/2029, 144A(b) | | | 1,000,000 | | | | 970,966 | |
| Rithm Capital Corp., 6.25%, 10/15/2025, 144A(b) | | | 173,000 | | | | 172,409 | |
| Rithm Capital Corp., 8.00%, 4/1/2029, 144A(b) | | | 1,000,000 | | | | 971,641 | |
| Signature Bank/New York NY, 4.00%, 10/15/2030 | | | 750,000 | | | | 402,774 | |
| Starwood Property Trust, Inc., 7.25%, 4/1/2029, 144A(b) | | | 1,000,000 | | | | 1,010,612 | |
| Uniti Group LP / Uniti Group Finance, Inc. / CSL Capital LLC, 10.50%, 2/15/2028, 144A(b) | | | 650,000 | | | | 637,218 | |
| Uniti Group LP / Uniti Group Finance, Inc. / CSL Capital LLC, 4.75%, 4/15/2028, 144A(b) | | | 800,000 | | | | 655,115 | |
| | | | | | | | 9,266,967 | |
| Technology – 1.3% | | | | | | | | |
| Crowdstrike Holdings, Inc., 3.00%, 2/15/2029 | | | 500,000 | | | | 451,283 | |
| Veritone, Inc., 1.75%, 11/15/2026 | | | 1,444,000 | | | | 518,403 | |
| | | | | | | | 969,686 | |
| Utilities – 1.1% | | | | | | | | |
| NRG Energy, Inc., 10.25%, (US 5 Year CMT T-Note + 5.92%), 9/15/2172, 144A(b)(c) | | | 767,000 | | | | 839,535 | |
| Total Corporate Bonds (Cost $18,652,441) | | | | | | | 19,379,327 | |
See Notes to Financial Statements.
Simplify Opportunistic Income ETF
Schedule of Investments (Continued)
June 30, 2024
| | | | | Principal | | | Value | |
| U.S. Government Agency Mortgage Backed Securities – 18.1% | | | | | | | | | | |
| Federal National Mortgage Association, 3.50%, 7/15/2054 (TBA) | | | | $ | 11,900,000 | | | $ | 10,553,869 | |
| Federal National Mortgage Association, 6.00%, 7/15/2054 (TBA) | | | | | 3,000,000 | | | | 3,011,763 | |
| Total U.S. Government Agency Mortgage Backed Securities (Cost $13,433,516) | | | | | | | | | 13,565,632 | |
| | | | | | | | | | | |
| Asset Backed Securities – 14.2% | | | | | | | | | | |
| Adams Outdoor Advertising LP, Class B, Series 2023-1, 144A, 8.81%, 7/15/2053(b) | | | | | 500,000 | | | | 514,594 | |
| Anchorage Capital CLO 19 Ltd., Class E, Series 2021-19A, 144A, 13.04%, (CME 3-Month SOFR + 7.71%), 10/15/2034(b)(c) | | | | | 1,000,000 | | | | 989,097 | |
| Ares LIV CLO Ltd., Class E, Series 2019-54A, 144A, 12.93%, (CME 3-Month SOFR + 7.60%), 10/15/2032(b)(c) | | | | | 1,000,000 | | | | 1,002,882 | |
| Avid Automobile Receivables Trust 2023-1, Class A, Series 2023-1, 144A, 6.63%, 7/15/2026(b) | | | | | 642,814 | | | | 643,200 | |
| FIGRE Trust 2024-HE2, Class A, Series 2024-HE2, 144A, 6.38%, 5/25/2054(b)(c) | | | | | 975,443 | | | | 984,528 | |
| Flagship Credit Auto Trust 2021-4, Class A, Series 2021-4, 144A, 0.81%, 7/17/2026(b) | | | | | 167,914 | | | | 166,949 | |
| Frontier Issuer LLC, Class B, Series 2023-1, 144A, 8.30%, 8/20/2053(b) | | | | | 300,000 | | | | 308,605 | |
| Frontier Issuer LLC, Class C, Series 2023-1, 144A, 11.50%, 8/20/2053(b) | | | | | 300,000 | | | | 303,896 | |
| Hertz Vehicle Financing LLC, Class D, Series 2022-4A, 144A, 6.56%, 9/25/2026(b) | | | | | 1,000,000 | | | | 973,311 | |
| Jack in The Box Funding LLC, Class A2I, Series 2022-1A, 144A, 3.45%, 2/26/2052(b) | | | | | 955,000 | | | | 890,743 | |
| KKR Static CLO I Ltd., Class E, Series 2022-1A, 144A, 11.54%, (CME 3-Month SOFR + 6.22%), 7/20/2031(b)(c) | | | | | 1,000,000 | | | | 1,001,031 | |
| Navient Private Education Refi Loan Trust 2021-B, Residual Class, Class R, Series 2021- BA, 144A, 7/15/2069(b)(d) | | | | | 2,222 | | | | 844,360 | |
| Octane Receivables Trust 2022-1, Residual Class, Class R1, Series 2022-1A, 144A, 12/20/2029(b)(d) | | | | | 12,121 | | | | 1,999,965 | |
| Total Asset Backed Securities (Cost $10,699,332) | | | | | | | | | 10,623,161 | |
| | | | | | | | | | | |
| Foreign Bonds – 13.9% | | | | | | | | | | |
| Communications – 1.1% | | | | | | | | | | |
| Altice France Holding SA, 10.50%, 5/15/2027, 144A(b) | | | | | 2,000,000 | | | | 800,560 | |
| | | | | | | | | | | |
| Consumer, Cyclical – 2.0% | | | | | | | | | | |
| Azul Investments LLP, 7.25%, 6/15/2026 | | | | | 650,000 | | | | 546,816 | |
| Azul Secured Finance LLP, 11.93%, 8/28/2028, 144A(b) | | | | | 1,000,000 | | | | 971,592 | |
| | | | | | | | | | 1,518,408 | |
| Energy – 1.7% | | | | | | | | | | |
| MC Brazil Downstream Trading SARL, 7.25%, 6/30/2031, 144A(b) | | | | | 404,069 | | | | 358,344 | |
| SierraCol Energy Andina LLC, 6.00%, 6/15/2028, 144A(b) | | | | | 1,000,000 | | | | 894,621 | |
| | | | | | | | | | 1,252,965 | |
| Financial – 3.7% | | | | | | | | | | |
| Danske Bank A/S, 6.47%, (US 5 Year CMT T-Note + 2.10%), 1/9/2026, 144A(b)(c) | | | | | 1,000,000 | | | | 1,002,815 | |
| Danske Bank A/S, 7.00%, (US 7 Year CMT T-Note + 4.13%), 12/26/2172(c) | | | | | 350,000 | | | | 350,000 | |
| Deutsche Bank AG, 7.50%, (USISDA05 + 5.00%), 4/30/2173(c) | | | | | 400,000 | | | | 394,660 | |
| Santander UK Group Holdings PLC, 6.83%, (SOFR + 2.75%), 11/21/2026(c) | | | | | 1,000,000 | | | | 1,013,663 | |
| | | | | | | | | | 2,761,138 | |
| Government – 4.1% | | | | | | | | | | |
| Egypt Government International Bond, 7.90%, 2/21/2048 | | | | | 750,000 | | | | 528,554 | |
| Mexican Bonos, 8.00%, 9/5/2024, Series M | | MXN | | | 32,400,000 | | | | 1,758,856 | |
| Mexican Bonos, 10.00%, 12/5/2024, Series M | | MXN | | | 14,000,000 | | | | 760,519 | |
| | | | | | | | | | 3,047,929 | |
See Notes to Financial Statements.
Simplify Opportunistic Income ETF
Schedule of Investments (Continued)
June 30, 2024
| | | Principal | | | Value | |
| Foreign Bonds (continued) | | | | | | | | |
| Utilities – 1.3% | | | | | | | | |
| Israel Electric Corp. Ltd., 5.00%, 11/12/2024, Series 6, 144A(b) | | $ | 1,000,000 | | | $ | 993,403 | |
| Total Foreign Bonds (Cost $10,520,585) | | | | | | | 10,374,403 | |
| | | Shares | | | | |
| Preferred Stocks – 7.5% | | | | | | | | |
| Consumer, Cyclical – 1.1% | | | | | | | | |
| Qurate Retail, Inc. | | | 18,600 | | | | 782,130 | |
| | | | | | | | | |
| Financial – 5.9% | | | | | | | | |
| AGNC Investment Corp., (CME 3-Month SOFR + 5.37%), Series C(c) | | | 23,400 | | | | 608,166 | |
| Annaly Capital Management, Inc., (CME 3-Month SOFR + 5.25%), Series F(c) | | | 24,500 | | | | 624,505 | |
| Chimera Investment Corp., (CME 3-Month SOFR + 6.05%), Series B(c) | | | 24,800 | | | | 611,320 | |
| Franklin BSP Realty Trust, Inc., Series E | | | 11,300 | | | | 244,984 | |
| Rithm Capital Corp., (3-Month US LIBOR + 4.97%), Series C(c) | | | 47,696 | | | | 1,128,487 | |
| Rithm Capital Corp., (US 5 Year CMT T-Note + 6.22%), Series D(c) | | | 45,564 | | | | 1,054,807 | |
| Silvergate Capital Corp., Series A* | | | 10,000 | | | | 132,500 | |
| | | | | | | | 4,404,769 | |
| Government – 0.5% | | | | | | | | |
| Federal Home Loan Mortgage Corporation, Series W* | | | 37,500 | | | | 151,875 | |
| Federal National Mortgage Association, Series S* | | | 50,000 | | | | 256,500 | |
| | | | | | | | 408,375 | |
| Total Preferred Stocks (Cost $5,077,236) | | | | | | | 5,595,274 | |
| | | | | | | | | |
| Common Stocks – 7.2% | | | | | | | | |
| Communications – 0.7% | | | | | | | | |
| Lumen Technologies, Inc.* | | | 500,000 | | | | 550,000 | |
| | | | | | | | | |
| Consumer, Cyclical – 0.3% | | | | | | | | |
| Qurate Retail, Inc., Class A, Series A* | | | 350,000 | | | | 220,500 | |
| | | | | | | | | |
| Financial – 6.2% | | | | | | | | |
| AGNC Investment Corp. | | | 180,000 | | | | 1,717,200 | |
| Annaly Capital Management, Inc. | | | 93,200 | | | | 1,776,392 | |
| ARMOUR Residential REIT, Inc., Class REIT | | | 15,000 | | | | 290,700 | |
| Rithm Capital Corp. | | | 35,800 | | | | 390,578 | |
| WeWorK, Inc., Class A* | | | 20,956 | | | | 419,120 | |
| | | | | | | | 4,593,990 | |
| Total Common Stocks (Cost $5,192,352) | | | | | | | 5,364,490 | |
| | | | | | | | | |
| Closed-End Funds – 0.6% | | | | | | | | |
| Equity Funds – 0.6% | | | | | | | | |
| Central and Eastern Europe Fund, Inc. | | | | | | | | |
| (Cost $367,413) | | | 40,423 | | | | 430,909 | |
| | | Principal | | | | | |
| Term Loans – 0.3% | | | | | | | | |
| Communications – 0.3% | | | | | | | | |
| Diamond Sports Group LLC, 5.00%, 8/2/2027 | | | | | | | | |
| (Cost $139,993) | | | 139,993 | | | | 198,616 | |
See Notes to Financial Statements.
Simplify Opportunistic Income ETF
Schedule of Investments (Continued)
June 30, 2024
| | | Value | |
| Total Investments – 115.2% | | | | |
| (Cost $84,603,331) | | $ | 86,052,698 | |
| Liabilities in Excess of Other Assets – (15.2)% | | | (11,352,048 | ) |
| Net Assets – 100.0% | | $ | 74,700,650 | |
| * | Non Income Producing |
| (a) | Represents a zero coupon bond. Rate shown reflects the effective yield. |
| (b) | Security was purchased (sold) pursuant to Rule 144A under the Securities Act of 1933 and may not be resold (repurchased) subject to that rule except to qualified institutional buyers. Unless otherwise noted, Rule 144A securities are deemed to be liquid. Total fair value of Rule 144A securities amounts to $29,766,751, which represents 39.8% of net assets as of June 30, 2024. |
| (c) | Floating rate investment. Interest rates reset periodically. Interest rate shown reflects the rate in effect at June 30, 2024. For securities based on a published reference rate and spread, the reference rate and spread are indicated in the description above. |
| (d) | Investment was valued using significant unobservable inputs. |
| (e) | Security, or a portion thereof, in the amount of $9,390,053 has been pledged as collateral for futures and swaps as of June 30, 2024. |
| (f) | Security, or a portion thereof, in the amount of $494,213 has been pledged as collateral for TBAs as of June 30, 2024. |
Currency Abbreviations:
Portfolio Abbreviations:
| CMT | : | Treasury Constant Maturity Rate |
| LIBOR | : | London Interbank Offered Rate |
| SOFR | : | Secured Overnight Financing Rate |
| TBA | : | To Be Announced |
At June 30, 2024, open futures contracts were as follows:
| | | Number of
Contracts | | | Notional
Value | | | Expiration
Date | | Value/
Unrealized
Appreciation
(Depreciation) | |
| Long position contracts: | | | | | | | | | | | | | |
| U.S. 5 Year Note (CBT) | | 110 | | | $ | 11,723,594 | | | 9/30/24 | | $ | 67,805 | |
| U.S. 2 Years Note (CBT) | | 700 | | | | 142,953,125 | | | 9/30/24 | | | 23,914 | |
| Total unrealized appreciation/(depreciation) | | | | | | | | | | | $ | 91,719 | |
| | | | | | | | | | | | | | |
| Short position contracts: | | | | | | | | | | | | | |
| U.S. Long Bond (CBT) | | (179) | | | | (21,177,937 | ) | | 9/19/24 | | | 182,250 | |
| U.S. Ultra Bond (CBT) | | (6) | | | | (752,063 | ) | | 9/19/24 | | | 4,312 | |
| Total unrealized appreciation/(depreciation) | | | | | | | | | | | $ | 186,562 | |
| Total net unrealized appreciation | | | | | | | | | | | $ | 278,281 | |
At June 30, 2024, centrally cleared credit default swap contracts outstanding were as follows:
| Reference Entity | | Maturity
Date | | Buy/Sell
Protection | | (Pay)/
Receive
Financing
Rate(1) | | Counterparty | | | Notional
Amount(2) | | | Fair
Value | | | Premium
(Paid)/
Received | | | Unrealized
Appreciation/
(Depreciation) | |
| CDX.NA.HY.42 | | 06/20/2029 | | Buy(3) | | 5.00% | | MSCS | | | | 25,000,000 | | | $ | (1,560,760 | ) | | $ | (1,745,785 | ) | | $ | 150,303 | |
| Republic of Italy | | 06/20/2029 | | Buy(3) | | 1.00% | | MSCS | | | | 22,500,000 | | | | (202,239 | ) | | | (362,428 | ) | | | 153,939 | |
| | | | | | | | | | | | | | | | $ | (1,762,999 | ) | | $ | (2,108,213 | ) | | $ | 304,242 | |
See Notes to Financial Statements.
Simplify Opportunistic Income ETF
Schedule of Investments (Continued)
June 30, 2024
| (1) | Payments received quarterly. |
| (2) | The maximum amount of future payments (undiscounted) that a Fund as seller of protection could be required to make or receive as a buyer of credit protection under a credit default swap agreement would be an amount equal to the notional amount of the agreement. |
| (3) | If the Fund is a buyer of protection and a credit event occurs, as defined under the terms of that particular swap agreement, the Fund will either i) receive from the seller of protection an amount equal to the notional amount of the swap and deliver the referenced obligation, other deliverable obligations or underlying securities comprising the referenced index or ii) receive a net settlement amount in the form of cash or securities equal to the notional amount of the swap less the recovery value of the referenced obligation or underlying securities comprising the referenced index. |
At June 30, 2024, over the counter total return swap contracts outstanding were as follows:
| Reference Obligation/Index | | Termination
Date(a) | | Financing
Rate Paid
(Received)
by the Fund | | Counterparty | | | Notional
Amount | | | Unrealized
Appreciation/
(Depreciation)(b) | |
| Morgan Stanley Custom Junk Index* | | 2/14/2025 | | 5.33% (EFFR - 0.25%)(c) | | MSCS | | | | (5,219,633 | ) | | $ | (43,368 | ) |
| Morgan Stanley Custom Quality Index* | | 2/14/2025 | | 5.33% (EFFR + 0.35%)(c) | | MSCS | | | | 7,482,718 | | | | (54,592 | ) |
| | | | | | | | | | | | | | $ | (97,960 | ) |
| * | The components of the basket shown below. |
| (a) | The Fund pays/receives annual coupon payments in accordance with the swap contract. On the termination date of the swap contract(s), the Fund will either receive from or pay to the counterparty an amount equal to the net of the accrued financing fees and the value of the reference security subtracted from the original notional cost (notional multiplied by the price change of the reference security). |
| (b) | There are no upfront payments on the swap contracts, therefore the unrealized gain (loss) on the swap contracts is equal to their market value. |
| (c) | Payments made quarterly. |
Abbreviations:
| EFFR | : | Effective Federal Funds Rate |
| MSCS | : | Morgan Stanley Capital Services LLC |
See Notes to Financial Statements.
Simplify Opportunistic Income ETF
Schedule of Investments (Continued)
June 30, 2024
Affiliates
Fiscal year to date transactions with companies which are or were affiliates are as follows:
Affiliate | | Value at
beginning of
the period | | |
Purchases
Cost | | | Sales
Proceeds | | | Net Realized
Gain/(Loss) | | | Net Change
in Unrealized
Appreciation/
Depreciation | | | Value at the
end of the
period | | | Number of
Shares at
the end of
the period | | | Dividend
Income | | | Capital Gain Distributions | |
| Simplify Aggregate Bond ETF | | $ | — | | | $ | 4,113,584 | | | $ | (3,909,627 | ) | | $ | (203,957 | ) | | $ | — | | | $ | — | | | | — | | | $ | 82,252 | | | $ | — | |
| Simplify Enhanced Income ETF | | | — | | | | 3,067,950 | | | | (3,056,451 | ) | | | (11,499 | ) | | | — | | | | — | | | | — | | | | 25,000 | | | | — | |
| Simplify Interest Rate Hedge ETF | | | — | | | | 4,961,720 | | | | (5,140,357 | ) | | | 178,637 | | | | — | | | | — | | | | — | | | | 68,388 | | | | 608,939 | |
| Simplify MBS ETF | | | — | | | | 3,118,470 | | | | (3,160,693 | ) | | | 42,223 | | | | — | | | | — | | | | — | | | | 46,510 | | | | — | |
| Simplify Short Term Treasury Futures Strategy ETF | | | — | | | | 23,082,101 | | | | (22,987,536 | ) | | | (94,565 | ) | | | — | | | | — | | | | — | | | | 214,302 | | | | — | |
| Simplify Volatility Premium ETF | | | — | | | | 2,961,500 | | | | (2,952,805 | ) | | | (8,695 | ) | | | — | | | | — | | | | — | | | | 39,000 | | | | — | |
| | | $ | — | | | $ | 41,305,325 | | | $ | (41,207,469 | ) | | $ | (97,856 | ) | | $ | — | | | $ | — | | | | — | | | $ | 475,452 | | | $ | 608,939 | |
Summary of Investment Type††
| | | % of | |
| Investment Categories | | Net Assets | |
| U.S. Treasury Bills | | | 27.5 | % |
| Corporate Bonds | | | 25.9 | % |
| U.S. Government Agency Mortgage Backed Securities | | | 18.1 | % |
| Asset Backed Securities | | | 14.2 | % |
| Foreign Bonds | | | 13.9 | % |
| Preferred Stocks | | | 7.5 | % |
| Common Stocks | | | 7.2 | % |
| Closed-End Funds | | | 0.6 | % |
| Term Loans | | | 0.3 | % |
| Total Investments | | | 115.2 | % |
| Liabilities in Excess of Other Assets | | | (15.2 | )% |
| Net Assets | | | 100.0 | % |
| †† | The percentage shown for each investment category is the total value of investments in that category as a percentage of the net assets of the Fund. The table depicts the Fund’s investments but may not represent the Fund’s market exposure to certain derivatives, if any, which are included in Liabilities in Excess of Other Assets. |
| * | The following table shows the top 50 positions and related Unrealized Appreciation/(Depreciation) of the securities within the Morgan Stanley Custom Quality Index basket. |
See Notes to Financial Statements.
Simplify Opportunistic Income ETF
Schedule of Investments (Continued)
June 30, 2024
| | | Shares | | | Unrealized
Appreciation/
(Depreciation) | | | % of
basket | |
| Common Stocks | | | | | | | | | | | | |
| Communication Services | | | | | | | | | | | | |
| Omnicom Group, Inc. | | | 832 | | | $ | (547 | ) | | | 1.00 | % |
| Sirius XM Holdings, Inc. | | | 28,359 | | | | (589 | ) | | | 1.08 | % |
| | | | | | | | (1,136 | ) | | | | |
| Consumer Discretionary | | | | | | | | | | | | |
| AutoZone Inc. | | | 26 | | | | (555 | ) | | | 1.02 | % |
| Grand Canyon Education, Inc. | | | 545 | | | | (560 | ) | | | 1.02 | % |
| LKQ Corp. | | | 1,838 | | | | (561 | ) | | | 1.03 | % |
| O'Reilly Automotive, Inc. | | | 72 | | | | (556 | ) | | | 1.02 | % |
| | | | | | | | (2,232 | ) | | | | |
| Consumer Staples | | | | | | | | | | | | |
| Hershey Co/The | | | 408 | | | | (550 | ) | | | 1.01 | % |
| | | | | | | | | | | | | |
| Energy | | | | | | | | | | | | |
| Antero Midstream Corp. | | | 5,203 | | | | (563 | ) | | | 1.03 | % |
| Cheniere Energy Inc. | | | 482 | | | | (618 | ) | | | 1.14 | % |
| HF Sinclair Corp. | | | 1,426 | | | | (558 | ) | | | 1.02 | % |
| | | | | | | | (1,739 | ) | | | | |
| Financials | | | | | | | | | | | | |
| Cboe Global Markets Inc. | | | 442 | | | | (552 | ) | | | 1.01 | % |
| Fiserv, Inc. | | | 500 | | | | (547 | ) | | | 1.00 | % |
| Intercontinental Exchange Inc. | | | 550 | | | | (552 | ) | | | 1.01 | % |
| NASDAQ, Inc. | | | 1,273 | | | | (563 | ) | | | 1.03 | % |
| S&p Global, Inc. | | | 173 | | | | (565 | ) | | | 1.04 | % |
| | | | | | | | (2,779 | ) | | | | |
| Health Care | | | | | | | | | | | | |
| AbbVie, Inc. | | | 441 | | | | (555 | ) | | | 1.02 | % |
| Chemed Corp. | | | 139 | | | | (554 | ) | | | 1.01 | % |
| Elevance Health Inc. | | | 140 | | | | (558 | ) | | | 1.02 | % |
| UnitedHealth Group, Inc. | | | 153 | | | | (571 | ) | | | 1.05 | % |
| | | | | | | | (2,238 | ) | | | | |
| Industrials | | | | | | | | | | | | |
| Allegion PLC | | | 644 | | | | (558 | ) | | | 1.02 | % |
| Booz Allen Hamilton Holding Corp. | | | 490 | | | | (554 | ) | | | 1.01 | % |
| Broadridge Financial Solutions | | | 380 | | | | (549 | ) | | | 1.01 | % |
| CACI International Inc., Class A | | | 174 | | | | (548 | ) | | | 1.00 | % |
| IDEX Corp. | | | 374 | | | | (552 | ) | | | 1.01 | % |
| Nordson Corp. | | | 323 | | | | (549 | ) | | | 1.01 | % |
| Rockwell Automation, Inc. | | | 289 | | | | (583 | ) | | | 1.07 | % |
| SS&C Technologies Holdings Inc. | | | 1,223 | | | | (563 | ) | | | 1.03 | % |
| Verisk Analytics Inc., Class A | | | 280 | | | | (553 | ) | | | 1.01 | % |
| | | | | | | | (5,009 | ) | | | | |
| Information Technology | | | | | | | | | | | | |
| Accenture PLC, Class A | | | 262 | | | | (583 | ) | | | 1.07 | % |
| Adobe, Inc. | | | 144 | | | | (588 | ) | | | 1.08 | % |
| Cisco Systems, Inc. | | | 1,641 | | | | (572 | ) | | | 1.05 | % |
| Cognizant Technology Solutions Corp., Class A | | | 1,144 | | | | (571 | ) | | | 1.04 | % |
| Intuit, Inc. | | | 124 | | | | (599 | ) | | | 1.10 | % |
| Manhattan Associates, Inc. | | | 322 | | | | (583 | ) | | | 1.07 | % |
| Microsoft Corp. | | | 167 | | | | (547 | ) | | | 1.00 | % |
See Notes to Financial Statements.
Simplify Opportunistic Income ETF
Schedule of Investments (Continued)
June 30, 2024
| | | Shares | | | Unrealized
Appreciation/
(Depreciation) | | | % of
basket | |
| Common Stocks (continued) | | | | | | | | | | | | |
| Information Technology (continued) | | | | | | | | | | | | |
| Motorola Solutions, Inc. | | | 196 | | | $ | (555 | ) | | | 1.02 | % |
| NetApp Inc. | | | 592 | | | | (559 | ) | | | 1.02 | % |
| Oracle Corp. | | | 532 | | | | (551 | ) | | | 1.01 | % |
| Trimble Inc. | | | 1,349 | | | | (553 | ) | | | 1.01 | % |
| | | | | | | | (6,261 | ) | | | | |
| Materials | | | | | | | | | | | | |
| Element Solutions Inc. | | | 2,766 | | | | (550 | ) | | | 1.01 | % |
| | | | | | | | | | | | | |
| Real Estate | | | | | | | | | | | | |
| Agree Realty Corp. | | | 1,216 | | | | (553 | ) | | | 1.01 | % |
| Digital Realty Trust Inc. | | | 501 | | | | (558 | ) | | | 1.02 | % |
| EastGroup Properties, Inc. | | | 449 | | | | (560 | ) | | | 1.03 | % |
| First Industrial Realty Trust | | | 1,574 | | | | (549 | ) | | | 1.01 | % |
| Gaming and Leisure Properties | | | 1,715 | | | | (569 | ) | | | 1.04 | % |
| STAG Industrial Inc. | | | 2,105 | | | | (557 | ) | | | 1.02 | % |
| | | | | | | | (3,346 | ) | | | | |
| Utilities | | | | | | | | | | | | |
| Alliant Energy Corp. | | | 1,502 | | | | (561 | ) | | | 1.03 | % |
| Edison International | | | 1,042 | | | | (549 | ) | | | 1.00 | % |
| Essential Utilities Inc. | | | 2,018 | | | | (553 | ) | | | 1.01 | % |
| Sempra | | | 996 | | | | (556 | ) | | | 1.02 | % |
| | | | | | | | (2,219 | ) | | | | |
| Other Components | | | 48,848 | | | | (26,533 | ) | | | 48.60 | % |
| Total | | | | | | $ | (54,592 | ) | | | 100.00 | % |
| * | The following table shows the top 50 positions and related Unrealized Appreciation/(Depreciation) of the securities within the Morgan Stanley Custom Junk Index basket. |
| | | Shares | | | Unrealized
Appreciation/
(Depreciation) | | | % of
basket | |
| Common Stocks | | | | | | | | | | | | |
| Communication Services | | | | | | | | | | | | |
| AT&T, Inc. | | | (3,772 | ) | | $ | (593 | ) | | | 1.37 | % |
| Charter Communications Inc, Class A | | | (195 | ) | | | (480 | ) | | | 1.11 | % |
| Frontier Communications Parent, Inc. | | | (2,108 | ) | | | (454 | ) | | | 1.05 | % |
| Nexstar Media Group, Inc., Class A | | | (344 | ) | | | (470 | ) | | | 1.08 | % |
| Paramount Global, Class B | | | (5,329 | ) | | | (456 | ) | | | 1.05 | % |
| Warner Bros Discovery, Inc. | | | (7,547 | ) | | | (462 | ) | | | 1.06 | % |
| Zoominfo Technologies, Inc., Class A | | | (4,342 | ) | | | (456 | ) | | | 1.05 | % |
| | | | | | | | (3,371 | ) | | | | |
| Consumer Discretionary | | | | | | | | | | | | |
| ADT, Inc. | | | (7,258 | ) | | | (454 | ) | | | 1.05 | % |
| Caesars Entertainment Inc. | | | (1,471 | ) | | | (481 | ) | | | 1.11 | % |
| Carnival Corp. | | | (3,468 | ) | | | (534 | ) | | | 1.23 | % |
| Kohl's Corp. | | | (2,399 | ) | | | (454 | ) | | | 1.05 | % |
| Macy's, Inc. | | | (2,830 | ) | | | (447 | ) | | | 1.03 | % |
| MGM Resorts International | | | (1,205 | ) | | | (441 | ) | | | 1.02 | % |
| Norwegian Cruise Line Holdings Ltd. | | | (3,178 | ) | | | (491 | ) | | | 1.13 | % |
See Notes to Financial Statements.
Simplify Opportunistic Income ETF
Schedule of Investments (Continued)
June 30, 2024
| | | Shares | | | Unrealized
Appreciation/
(Depreciation) | | | % of
basket | |
| Common Stocks (continued) | | | | | | | | | | | | |
| Consumer Discretionary (continued) | | | | | | | | | | | | |
| Penn Entertainment Inc. | | | (2,836 | ) | | $ | (452 | ) | | | 1.04 | % |
| Petco Health & Wellness Co Inc, Class A | | | (14,956 | ) | | | (465 | ) | | | 1.07 | % |
| Travel + Leisure Co. | | | (1,180 | ) | | | (437 | ) | | | 1.01 | % |
| Whirlpool Corp. | | | (567 | ) | | | (476 | ) | | | 1.10 | % |
| | | | | | | | (5,132 | ) | | | | |
| Consumer Staples | | | | | | | | | | | | |
| Darling Ingredients Inc. | | | (1,483 | ) | | | (448 | ) | | | 1.03 | % |
| | | | | | | | | | | | | |
| Energy | | | | | | | | | | | | |
| Apa Corp. | | | (1,902 | ) | | | (461 | ) | | | 1.06 | % |
| | | | | | | | | | | | | |
| Health Care | | | | | | | | | | | | |
| Alnylam Pharmaceuticals Inc. | | | (331 | ) | | | (662 | ) | | | 1.53 | % |
| Baxter International, Inc. | | | (1,564 | ) | | | (431 | ) | | | 0.99 | % |
| CVS Health Corp. | | | (997 | ) | | | (484 | ) | | | 1.12 | % |
| DaVita, Inc. | | | (374 | ) | | | (427 | ) | | | 0.99 | % |
| ICU Medical Inc. | | | (440 | ) | | | (430 | ) | | | 0.99 | % |
| Integra LifeSciences Holdings | | | (1,791 | ) | | | (429 | ) | | | 0.99 | % |
| Organon & Co. | | | (2,554 | ) | | | (435 | ) | | | 1.00 | % |
| Sotera Health Co. | | | (4,581 | ) | | | (447 | ) | | | 1.03 | % |
| Viatris, Inc. | | | (5,300 | ) | | | (464 | ) | | | 1.07 | % |
| | | | | | | | (4,209 | ) | | | | |
| Industrials | | | | | | | | | | | | |
| Air Lease Corp. | | | (1,146 | ) | | | (448 | ) | | | 1.03 | % |
| American Airlines Group, Inc. | | | (4,649 | ) | | | (433 | ) | | | 1.00 | % |
| Concentrix Corp. | | | (890 | ) | | | (463 | ) | | | 1.07 | % |
| Delta Air Lines Inc. | | | (1,128 | ) | | | (440 | ) | | | 1.02 | % |
| Driven Brands Holdings, Inc. | | | (4,559 | ) | | | (478 | ) | | | 1.10 | % |
| GXO Logistics Inc. | | | (1,090 | ) | | | (453 | ) | | | 1.05 | % |
| Hertz Global Holdings, Inc. | | | (16,030 | ) | | | (466 | ) | | | 1.07 | % |
| Ryder System, Inc. | | | (437 | ) | | | (445 | ) | | | 1.03 | % |
| Southwest Airlines Co. | | | (1,884 | ) | | | (444 | ) | | | 1.02 | % |
| Spirit Aerosystems Holdings, Inc., Class A | | | (1,725 | ) | | | (467 | ) | | | 1.08 | % |
| United Airlines Holdings, Inc. | | | (1,077 | ) | | | (431 | ) | | | 0.99 | % |
| Vestis Corp. | | | (4,407 | ) | | | (444 | ) | | | 1.02 | % |
| | | | | | | | (5,412 | ) | | | | |
| Information Technology | | | | | | | | | | | | |
| Dxc Technology Co. | | | (2,895 | ) | | | (455 | ) | | | 1.05 | % |
| Kyndryl Holdings, Inc. | | | (2,055 | ) | | | (445 | ) | | | 1.03 | % |
| Lumentum Holdings Inc. | | | (1,055 | ) | | | (442 | ) | | | 1.02 | % |
| NCR Corp. | | | (4,321 | ) | | | (439 | ) | | | 1.01 | % |
| Ringcentral, Inc., Class A | | | (1,848 | ) | | | (429 | ) | | | 0.99 | % |
| | | | | | | | (2,210 | ) | | | | |
| Materials | | | | | | | | | | | | |
| Alcoa Corp. | | | (1,391 | ) | | | (455 | ) | | | 1.05 | % |
| FMC Corp. | | | (949 | ) | | | (450 | ) | | | 1.03 | % |
| Mosaic Co. (The) | | | (1,913 | ) | | | (455 | ) | | | 1.05 | % |
See Notes to Financial Statements.
Simplify Opportunistic Income ETF
Schedule of Investments (Continued)
June 30, 2024
| | | Shares | | | Unrealized
Appreciation/
(Depreciation) | | | % of
basket | |
| Common Stocks (continued) | | | | | | | | | | | | |
| Materials (continued) | | | | | | | | | | | | |
| Scotts Miracle-GRO Co. (The) | | | (809 | ) | | $ | (433 | ) | | | 1.00 | % |
| | | | | | | | (1,793 | ) | | | | |
| Other Components | | | (153,781 | ) | | | (20,332 | ) | | | 46.88 | % |
| Total | | | | | | $ | (43,368 | ) | | | 100.00 | % |
See Notes to Financial Statements.
Simplify Exchange Traded Funds
Statement of Assets and Liabilities
June 30, 2024
| | | Simplify
Opportunistic
Income ETF | |
| Assets | | | | |
| Investments, at value | | $ | 86,052,698 | |
| Cash | | | 999,833 | |
| Unrealized appreciation on centrally cleared swaps | | | 304,242 | |
| Receivables: | | | | |
| Interest | | | 630,687 | |
| Due from broker | | | 274,756 | |
| Dividends | | | 109,570 | |
| Prepaid expenses | | | 18,887 | |
| Total assets | | | 88,390,673 | |
| | | | | |
| Liabilities | | | | |
| Unrealized depreciation on over the counter swaps | | | 97,960 | |
| Payables: | | | | |
| Securities purchased | | | 13,561,766 | |
| Investment advisory fees | | | 30,297 | |
| Total liabilities | | | 13,690,023 | |
| Net Assets | | $ | 74,700,650 | |
| | | | | |
| Net Assets Consist of | | | | |
| Paid-in capital | | $ | 76,070,896 | |
| Distributable earnings (loss) | | | (1,370,246 | ) |
| Net Assets | | $ | 74,700,650 | |
| Number of Common Shares outstanding | | | 3,025,001 | |
| Net Asset Value, offering and redemption price per share | | $ | 24.69 | |
| Investments, at cost | | $ | 84,603,331 | |
| Foreign currency, at cost | | $ | 38,273 | |
See Notes to Financial Statements.
Simplify Exchange Traded Funds
Statement of Operations
For the Year Ended June 30, 2024
| | | Simplify
Opportunistic
Income ETF | |
| Investment Income | | | | |
| Unaffiliated dividend income | | $ | 1,213,818 | |
| Affiliated dividend income | | | 475,452 | |
| Interest income | | | 3,809,451 | |
| Total income | | | 5,498,721 | |
| | | | | |
| Expenses | | | | |
| Investment advisory fees | | | 625,907 | |
| Interest expense | | | 9,094 | |
| Total expenses | | | 635,001 | |
| Less fees waived: | | | | |
| Waiver | | | (295,933 | ) |
| Net expenses | | | 339,068 | |
| Net investment income (loss) | | | 5,159,653 | |
| | | | | |
| Realized and Unrealized Gain (Loss) | | | | |
| Net realized gain (loss) from: | | | | |
| Investments | | | (780,509 | ) |
| Affiliated investments | | | (97,856 | ) |
| Futures | | | (2,748,929 | ) |
| Swaps | | | (1,023,779 | ) |
| Written options | | | (61,187 | ) |
| Foreign currency transactions | | | (79,631 | ) |
| Capital gain distributions from affiliated funds | | | 608,939 | |
| Net realized gain (loss) | | | (4,182,952 | ) |
| Net change in unrealized appreciation (depreciation) on: | | | | |
| Investments | | | 1,442,856 | |
| Foreign currency translations | | | 36,593 | |
| Futures | | | 278,281 | |
| Swaps | | | 206,282 | |
| Net unrealized gain (loss) | | | 1,964,012 | |
| Net realized and unrealized gain (loss) | | | (2,218,940 | ) |
| Net Increase (Decrease) in Net Assets Resulting from Operations | | $ | 2,940,713 | |
See Notes to Financial Statements.
Simplify Exchange Traded Funds
Statements of Changes in Net Assets
| | | Simplify Opportunistic Income ETF | |
| | | Year Ended
June 30,
2024 | | | For the period June 27,
2023(1) to June 30,
2023 | |
| Increase (Decrease) in Net Assets from Operations | | | | | | | | |
| Net investment income (loss) | | $ | 5,159,653 | | | $ | 9,278 | |
| Net realized gain (loss) | | | (4,182,952 | ) | | | — | |
| Net change in net unrealized appreciation (depreciation) | | | 1,964,012 | | | | 6,511 | |
| Net increase (decrease) in net assets resulting from operations | | | 2,940,713 | | | | 15,789 | |
| | | | | | | | | |
| Distributions | | | (4,326,748 | ) | | | — | |
| | | | | | | | | |
| Fund Shares Transactions | | | | | | | | |
| Proceeds from shares sold | | | 41,737,365 | | | | 37,500,114 | |
| Value of shares redeemed | | | (3,166,583 | ) | | | — | |
| Net increase (decrease) in net assets resulting from fund share transactions | | | 38,570,782 | | | | 37,500,114 | |
| Total net increase (decrease) in Net Assets | | | 37,184,747 | | | | 37,515,903 | |
| | | | | | | | | |
| Net Assets | | | | | | | | |
| Beginning of period | | | 37,515,903 | | | | — | |
| End of period | | $ | 74,700,650 | | | $ | 37,515,903 | |
| | | | | | | | | |
| Changes in Shares Outstanding | | | | | | | | |
| Shares outstanding, beginning of period | | | 1,500,001 | | | | — | |
| Shares sold | | | 1,650,000 | | | | 1,500,001 | (2) |
| Shares redeemed | | | (125,000 | ) | | | — | |
| Shares outstanding, end of period | | | 3,025,001 | | | | 1,500,001 | |
| (1) | Commencement of operations. |
| (2) | Shares not in increment of 25,000 shares, a creation unit, represent the Adviser’s initial seed investment in connection with the commencement of operations. |
See Notes to Financial Statements.
Simplify Exchange Traded Funds
Financial Highlights
Simplify Opportunistic Income ETF
Selected Per Share Data | | Year Ended
June 30,
2024 | | | Period Ended
June 30,
2023(a) | |
| Net Asset Value, beginning of period | | $ | 25.01 | | | $ | 25.00 | |
| Income (loss) from investment operations: | | | | | | | | |
| Net investment income (loss)(b) | | | 1.97 | | | | 0.01 | |
| Net realized and unrealized gain (loss) | | | (0.73 | ) | | | — | |
| Total from investment operations | | | 1.24 | | | | 0.01 | |
| Less distributions from: | | | | | | | | |
| Net investment income | | | (1.56 | ) | | | — | |
| Total distributions | | | (1.56 | ) | | | — | |
| Net Asset Value, end of period | | $ | 24.69 | | | $ | 25.01 | |
| Total Return (%) | | | 5.05 | | | | 0.04 | (c) |
| Ratios to Average Net Assets and Supplemental Data | | | | | | | | |
| Net Assets, end of period ($ millions) | | $ | 75 | | | $ | 38 | |
| Ratio of expenses before fee waiver (%) | | | 0.96 | (d)(e) | | | 0.95 | (f) |
| Ratio of expenses after fee waiver (%) | | | 0.51 | (d)(e) | | | 0.50 | (f) |
| Ratio of net investment income (loss) (%) | | | 7.83 | | | | 4.52 | (f) |
| Portfolio turnover rate (%)(g) | | | 322 | | | | 0 | (c) |
| (a) | For the period June 27, 2023 (commencement of operations) through June 30, 2023. |
| (b) | Per share numbers have been calculated using the average shares method. |
| (c) | Not annualized. |
| (d) | The ratios of expenses to average net assets includes interest expense fees of 0.01%. |
| (e) | The Fund invests in other ETFs and indirectly bears its proportionate shares of fees and expenses incurred by the Underlying Funds in which the Fund is invested. This ratio does not included these indirect fees and expenses. |
| (f) | Annualized. |
| (g) | Excludes the impact of in-kind transactions related to the processing of capital share transactions in Creation Units. |
See Notes to Financial Statements.
Simplify Exchange Traded Funds
Notes to Financial Statements
June 30, 2024
1. Organization
Simplify Exchange Traded Funds (the “Trust”) is registered under the Investment Company Act of 1940, as amended (the “1940 Act”), as an open-end registered management investment company organized as a Delaware statutory trust.
As of June 30, 2024, the Trust consists of twenty eight investment series of exchange-traded funds (“ETFs”) in operation and trading. These financial statements report on the Fund listed below:
Simplify Opportunistic Income ETF
Simplify Asset Management Inc. (the “Adviser”) serves as investment adviser to the Fund and has overall responsibility for the general management and administration of the Fund, subject to the oversight of the Trust’s Board of Trustees (the “Board”).
The Fund offers shares that are listed and traded on the NYSE Arca, Inc. (“NYSE Arca”). Unlike mutual funds, the Fund issues and redeems shares on a continuous basis, at net asset value (“NAV”), only in large specified lots consisting of 25,000 shares, each called a “Creation Unit”, to authorized participants who have entered into agreements with the Fund’s distributor. Shares are not individually redeemable securities of the Fund, and owners of the shares may acquire those shares from the Fund, or tender such shares for redemption to the Fund, in Creation Units only.
| Fund | | Investment objectives |
| Simplify Opportunistic Income ETF | | The Fund seeks to provide current income. Long-term capital appreciation is a secondary objective. |
2. Significant Accounting Policies
The financial statements have been prepared in conformity with U.S. generally accepted accounting principles (“U.S. GAAP”), which require management to make certain estimates and assumptions that affect the reported amounts and disclosures of contingent assets and liabilities at the date of the financial statement and the reported amounts of revenues and expenses during the reporting period. Actual results could differ from those estimates. The Fund is an investment company and accordingly follow the investment company accounting and reporting guidance of the Financial Accounting Standards Board (“FASB”) Accounting Standards Codification Topic 946 Financial Services – Investment Companies including Accounting Standards Update 2013-08. The following is a summary of significant accounting policies followed by the Fund.
Investment Valuation
The Fund’s investments are valued using procedures approved by the Board and are generally valued using market valuations (Market Approach). A market valuation generally means a valuation (i) obtained from an exchange, a pricing service, or a major market maker (or dealer) or (ii) based on a price quotation or other equivalent indication of value supplied by an exchange, a pricing service, or a major market maker (or dealer). A price obtained from a pricing service based on such pricing service’s valuation matrix may be considered a market valuation. Any assets or liabilities denominated in currencies other than the U.S. dollar are converted into U.S. dollars at the current market rates on the date of valuation as quoted by one or more sources.
If market quotations are not readily available, securities will be valued at their fair market value as determined using the “fair value” procedures approved by the Board. Fair value pricing involves subjective judgments and it is possible that the fair value determined for a security may be materially different than the value that could be realized upon the sale of that security. The fair value prices can differ from market prices when they become available or when a price becomes available. The Board has designated the Adviser as its valuation designee to execute these procedures. The Adviser may also enlist third party consultants such as an audit firm or financial officer of a security issuer on an as-needed basis to assist in determining a security-specific fair value. These securities are either categorized as Level 2 or 3 of the fair value hierarchy depending on the relevant inputs used. The Board reviews the execution of this process and the resultant fair value prices at least quarterly to assure the process produces reliable results.
Equity securities, closed-end funds and ETFs are valued at the most recent sale price or official closing price reported on the exchange (U.S. or foreign) or over-the-counter market on which they trade. Securities or ETFs for which no sales are reported are valued at the calculated mean between the most recent bid and asked quotations on the relevant market or, if a mean cannot be determined, at the most recent bid quotation. Equity securities, closed-end funds and ETFs are generally categorized as Level 1 of the fair value hierarchy.
Exchange traded options are valued at the mean between the current bid and ask prices on the exchange on which such options are traded. If a mean price is not available, the closing price is used. Exchange trade options are categorized as Level 1. Options with international equity exposure are marked to market using closing prices for the underlying and interpolated option implied volatilities obtained from mid-market prices for options on the same underlying of similar expiries and strike prices. These securities are categorized as Level 2 in the fair value hierarchy.
Debt securities not traded on an exchange may be valued at prices supplied by a pricing agent(s) based on broker or dealer supplied valuations or matrix pricing, a method of valuing securities by reference to the value of other securities with similar characteristics, such as rating, interest rate and maturity. Debt securities are generally categorized as Level 2 of the fair value hierarchy.
Simplify Exchange Traded Funds
Notes to Financial Statements (Continued)
June 30, 2024
Futures contracts are generally valued at the settlement prices established each day on the exchange on which they are traded and are categorized as Level 1.
Swap agreements and other derivatives are generally valued daily depending on the type of instrument and reference assets based upon market prices, the mean between bid and asked prices quotations from market makers or by a pricing service or other parties in accordance with the valuation procedures approved by the Board.
Under certain circumstances, the Fund may use an independent pricing service to calculate the fair market value of foreign equity securities on a daily basis by applying valuation factors to the last sale price or the mean price as noted above. The fair market values supplied by the independent pricing service will generally reflect market trading that occurs after the close of the applicable foreign markets of comparable securities or the value of other instruments that have a strong correlation to the fair valued securities. The independent pricing service will also take into account the current relevant currency exchange rate. A security that is fair valued may be valued at a price higher or lower than actual market quotations or the value determined by other funds using their own fair valuation procedures. Because foreign securities may trade on days when Shares are not priced, the value of securities held by the Fund can change on days when Shares cannot be redeemed or purchased. In the event that a foreign security’s market quotations are not readily available or are deemed unreliable (for reasons other than because the foreign exchange on which it trades closed before the Fund’s calculation of NAV), the security will be valued at its fair market value as determined in good faith by the Adviser as the Board’s valuation designee in accordance with procedures approved by the Board. Without fair valuation, it is possible that short-term traders could take advantage of the arbitrage opportunity and dilute the NAV of long-term investors. Fair valuation of the Fund’s portfolio securities can serve to reduce arbitrage opportunities available to short-term traders, but there is no assurance that it will prevent dilution of the Fund’s NAV by short-term traders. In addition, because the Fund’s may invest in underlying ETFs which hold portfolio securities primarily listed on foreign (non-U.S.) exchanges, and these exchanges may trade on weekends or other days when the underlying ETFs do not price their shares, the value of these portfolio securities may change on days when you may not be able to buy or sell Shares.
Investments initially valued in currencies other than the U.S. dollar are converted to U.S. dollars using exchange rates obtained from pricing services or other parties in accordance with the valuation procedures of the Adviser as the Board’s valuation designee. As a result, the NAV of the Shares may be affected by changes in the value of currencies in relation to the U.S. dollar. The value of securities traded in markets outside the United States or denominated in currencies other than the U.S. dollar may be affected significantly on a day that the Exchange is closed and an investor is not able to purchase, redeem or exchange Shares.
The Fund categorizes the inputs to valuation techniques used to value its investments into a disclosure hierarchy consisting of three levels as shown below:
| ● | Level 1 – Quoted prices in active markets for identical assets that the fund has the ability to access. |
| | | |
| ● | Level 2 – Other significant observable inputs (including quoted prices for similar securities, interest rates, prepayment speeds, credit risk, etc.). |
| | | |
| ● | Level 3 – Significant unobservable inputs (including the Fund’s own assumptions in determining the fair value of investments). |
The inputs or methodology used for valuing securities are not necessarily an indication of the risk associated with investing in those securities.
The following is a summary of the valuations as of June 30, 2024 for the Fund based upon the three levels defined above:
Simplify Exchange Traded Funds
Notes to Financial Statements (Continued)
June 30, 2024
Simplify Opportunistic Income ETF
| Assets | | Level 1 | | | Level 2 | | | Level 3 | | | Total | |
| U.S. Treasury Bills | | $ | 20,520,886 | | | $ | — | | | $ | — | | | $ | 20,520,886 | |
| Corporate Bonds | | | — | | | | 19,379,327 | | | | — | | | | 19,379,327 | |
| U.S. Government Agency Mortgage Backed Securities | | | — | | | | 13,565,632 | | | | — | | | | 13,565,632 | |
| Asset Backed Securities | | | — | | | | 7,778,836 | | | | 2,844,325 | | | | 10,623,161 | |
| Foreign Bonds | | | — | | | | 10,374,403 | | | | — | | | | 10,374,403 | |
| Preferred Stocks | | | 5,595,274 | | | | — | | | | — | | | | 5,595,274 | |
| Common Stocks | | | 5,364,490 | | | | — | | | | — | | | | 5,364,490 | |
| Closed-End Funds | | | 430,909 | | | | — | | | | — | | | | 430,909 | |
| Term Loans | | | — | | | | 198,616 | | | | — | | | | 198,616 | |
| Futures | | | 278,281 | | | | — | | | | — | | | | 278,281 | |
| Credit Default Swaps | | | — | | | | 304,242 | | | | — | | | | 304,242 | |
| TOTAL | | $ | 32,189,840 | | | $ | 51,601,056 | | | $ | 2,844,325 | | | $ | 86,635,221 | |
| Liabilities | | Level 1 | | | Level 2 | | | Level 3 | | | Total | |
| Total Return Swaps | | $ | — | | | $ | (97,960 | ) | | $ | — | | | $ | (97,960 | ) |
| TOTAL | | $ | — | | | $ | (97,960 | ) | | $ | — | | | $ | (97,960 | ) |
A reconciliation of assets in which Level 3 inputs are used in determining fair value is presented when there are significant Level 3 financial instruments at the beginning and/or end of the reporting year. At June 30, 2024, the reconciliation of assets is as follows:
| Simplify Opportunistic Income ETF | | Asset Backed
Securities | |
| Balance at June 30, 2023 | | $ | — | |
| Purchases | | | 3,005,420 | |
| Sales | | | — | |
| Transfer into Level 3 | | | — | |
| Transfer out of Level 3 | | | — | |
| Net Realized Gain (Loss) | | | — | |
| Net Change in Unrealized Appreciation (Depreciation) | | | (161,095 | ) |
| Balance at June 30, 2024 | | $ | 2,844,325 | |
The following table presents quantitative information about valuation techniques and inputs used for investments that are measured at fair value and categorized within Level 3 at June 30, 2024:
Simplify Opportunistic Income ETF
| | | Fair Value at
June 30,
2024 | | | Valuation
Technique | | Unobservable
Input | | Range (Weighted
Average)(a) | | Impact to
Valuation from
an Increase in Input(b) |
| Asset Backed Security | | $ | 844,360 | | | Market Approach | | Broker Quote | | 100% | | Increase |
| Asset Backed Security | | $ | 1,999,965 | | | Market Approach | | Transaction Price | | 100% | | Increase |
| | | $ | 2,844,325 | | | | | | | | | |
| (a) | Unobservable inputs were weighted by the notional value of the instruments. |
| (b) | Represents the change in fair value of the level 3 investments that would result from an increase in the corresponding input. A decrease in the unobservable input would have the opposite effect. |
Cash
Cash consists of cash on deposit with a major financial institution which may exceed federally insured limits.
Simplify Exchange Traded Funds
Notes to Financial Statements (Continued)
June 30, 2024
Foreign Currency Translations
The books and records of the Fund are maintained in U.S. dollars. Investment securities and other assets and liabilities denominated in a foreign currency are translated into U.S. dollars at the prevailing exchange rates at period end. Purchases and sales of investment securities, income and expenses are translated into U.S. dollars at the prevailing exchange rates on the respective dates of the transactions.
Net realized and unrealized gains and losses on foreign currency transactions represent net gains and losses between trade and settlement dates on securities transactions, the acquisition and disposition of foreign currencies, and the difference between the amount of net investment income accrued and the U.S. dollar amount actually received. The portion of both realized and unrealized gains and losses on investments that results from fluctuations in foreign currency exchange rates is not separately disclosed, but is included with net realized and unrealized gain/appreciation and loss/depreciation on investments.
Investment Transactions and Related Income
For financial reporting purposes, investment transactions are reported on the trade date. However, for daily NAV determination, portfolio securities transactions are reflected no later than in the first calculation on the first business day following trade date. Interest income is recognized on an accrual basis and includes, where applicable, the amortization of premium or accretion of discount based on effective yield. Gains or losses realized on sales of securities are determined using the specific identification method by comparing the identified cost of the security lot sold with the net sales proceeds. Dividend income on the Statement of Operations is shown net of any foreign taxes withheld on income from foreign securities, which are provided for in accordance with the Fund’s understanding of the applicable tax rules and regulations.
When-Issued and Delayed-Delivery Transactions
The Portfolio may engage in when-issued or delayed-delivery transactions. The Portfolio record when-issued securities on the trade date. Securities purchased on a when-issued or delayed-delivery basis are marked to market daily and begin earning interest on the settlement date. Losses may occur on these transactions due to changes in market conditions or the failure of counterparties to perform under the contract.
Income Tax Information and Distributions to Shareholders
It is the Fund’s policy to comply with all requirements of the Internal Revenue Code of 1986, as amended (“the Code”). The Fund intends to qualify for and to elect treatment as a separate Regulated Investment Company (“RIC”) under Subchapter M of the Code. It is the Fund’s policy is to pay out dividends from net investment income monthly. Taxable net realized gains from investment transactions, reduced by capital loss carryforwards, if any, will be declared and distributed to shareholders at least annually. The capital loss carryforward amount, if any, will be available to offset future net capital gains. The Fund may occasionally be required to make supplemental distributions at some other time during the year. The Fund reserves the right to declare special distributions if, in its reasonable discretion, such action is necessary or advisable to preserve the status of the Fund as a RIC or to avoid imposition of income or excise taxes on undistributed income. Dividends and distributions to shareholders, if any, will be recorded on the ex-dividend date. The amount of dividends and distributions from net investment income and net realized capital gains will be determined in accordance with Federal income tax regulations which may differ from U.S. GAAP. These “book/tax” differences are either considered temporary or permanent in nature. To the extent these differences are permanent in nature, (e.g., return of capital and distribution reclassifications), such amounts are reclassified within the composition of net assets based on their federal tax basis treatment; temporary differences (e.g., wash sales and straddles) do not require a reclassification. Dividends and distributions, which exceed earnings and profits for the full year for tax purposes, will be reported as a tax return of capital.
In accordance with U.S. GAAP requirements regarding accounting for uncertainties in income taxes, management has analyzed the Fund’s tax positions expected to be taken on foreign, federal and state income tax returns for all open tax years and has concluded that no provision for income tax is required in the Fund’s financial statement.
The Fund will recognize interest and penalties, if any, related to uncertain tax positions as income tax expense on the Statement of Operations.
3. Derivative Financial Instruments
In the normal course of business, the Fund uses derivative contracts in connection with its proprietary trading activities. Derivative contracts are subject to additional risks that can result in a loss of all or part of an investment. The Fund’s derivative activities and exposure to derivative contracts are classified by the following primary underlying risks: interest rate, credit, foreign exchange, commodity price, and equity price. In addition to its primary underlying risks, the Fund is also subject to additional counterparty risk due to inability of its counterparties to meet the terms of their contracts.
FASB Accounting Standards Codification, Derivatives and Hedging (“ASC 815”) requires enhanced disclosures about the Fund’s use of, and accounting for, derivative instruments and the effect of derivative instruments on the Fund’s financial position and results of operations. Tabular disclosure regarding derivative fair value and gain/loss by contract type (e.g., interest rate contracts, foreign exchange contracts, credit contracts, etc.) is required and derivatives accounted for as hedging instruments under ASC 815 must be disclosed
Simplify Exchange Traded Funds
Notes to Financial Statements (Continued)
June 30, 2024
separately from those that do not qualify for hedge accounting. Even though the Fund may use derivatives in an attempt to achieve an economic hedge, the Fund’s derivatives are not accounted for as hedging instruments under ASC 815 because investment companies account for their derivatives at fair value and record any changes in fair value in current period earnings.
Futures Contracts
A futures contract provides for the future sale by one party and purchase by another party of a specified amount of a specific financial instrument (e.g., units of a stock index) for a specified price, date, time and place designated at the time the contract is made. Brokerage fees are paid when a futures contract is bought or sold and margin deposits must be maintained. Unlike when the Fund purchases or sells a security, no price would be paid or received by the Fund upon the purchase or sale of a futures contract. Upon entering into a futures contract, and to maintain the Fund’s open positions in futures contracts, the Fund would be required to deposit with its custodian or futures broker in a segregated account in the name of the futures broker an amount of cash, U.S. government securities, suitable money market instruments, or other liquid securities, known as “initial margin.” The margin required for a particular futures contract is set by the exchange on which the contract is traded, and may be significantly modified from time to time by the exchange during the term of the contract. If the price of an open futures contract changes (by increase in underlying instrument or index in the case of a sale or by decrease in the case of a purchase) so that the loss on the futures contract reaches a point at which the margin on deposit does not satisfy margin requirements, the broker will require an increase in the margin. However, if the value of a position increases because of favorable price changes in the futures contract so that the margin deposit exceeds the required margin, the broker will pay the excess to the Fund.
These subsequent payments, called “variation margin,” to and from the futures broker, are made on a daily basis as the price of the underlying assets fluctuate making the long and short positions in the futures contract more or less valuable, a process known as “marking to the market.” The Fund expects to earn interest income on margin deposits.
The primary risks associated with the use of futures contracts are (a) the imperfect correlation between the change in market value of the instruments held by the Fund and the price of the forward or futures contract; (b) possible lack of a liquid secondary market for a forward or futures contract and the resulting inability to close a forward or futures contract when desired; (c) investments in futures contracts involves leverage, which means a small percentage of assets in futures can have a disproportionately large impact on the Fund and the Fund can lose more than the principal amount invested; (d) losses caused by unanticipated market movements, which are potentially unlimited; (e) the adviser’s inability to predict correctly the direction of securities prices, interest rates, currency exchange rates and other economic factors; (f) the possibility that the counterparty will default in the performance of its obligations; and (g) if the Fund has insufficient cash, it may have to sell securities from its portfolio to meet daily variation margin requirements, and the Fund may have to sell securities at a time when it may be disadvantageous to do so.
Option Contracts
The Fund may purchase and write (i.e., sell) put and call options. Such options may relate to particular securities or stock indices, and may or may not be listed on a domestic or foreign securities exchange and may or may not be issued by the Options Clearing Corporation. Options trading is a highly specialized activity that entails greater than ordinary investment risk. Options may be more volatile than the underlying instruments, and therefore, on a percentage basis, an investment in options may be subject to greater fluctuation than an investment in the underlying instruments themselves.
A call option for a particular security gives the purchaser of the option the right to buy, and the writer (seller) the obligation to sell, the underlying security at the stated exercise price at any time prior to the expiration of the option, regardless of the market price of the security. The premium paid to the writer is in consideration for undertaking the obligation under the option contract. A put option for a particular security gives the purchaser the right to sell the security at the stated exercise price at any time prior to the expiration date of the option, regardless of the market price of the security. Stock index options are put options and call options on various stock indices. In most respects, they are identical to listed options on common stocks. The primary difference between stock options and index options occurs when index options are exercised. In the case of stock options, the underlying security, common stock, is delivered. However, upon the exercise of an index option, settlement does not occur by delivery of the securities comprising the index. The option holder who exercises the index option receives an amount of cash if the closing level of the stock index upon which the option is based is greater than, in the case of a call, or less than, in the case of a put, the exercise price of the option. This amount of cash is equal to the difference between the closing price of the stock index and the exercise price of the option expressed in dollars times a specified multiple. A stock index fluctuates with changes in the market value of the stocks included in the index.
Premiums paid on options purchased and premiums received on options written, as well as the daily fluctuation in market value, are included in investments at value and options written at value, respectively, in the Statement of Assets and Liabilities. When an instrument is purchased or sold through the exercise of an option, the premium is offset against the cost or proceeds of the underlying instrument. When an option expires, a realized gain or loss is recorded in the Statement of Operations to the extent of the premiums received or paid. When an option is closed or sold, a gain or loss is recorded in the Statement of Operations to the extent the cost of the closing transaction exceeds the premiums received or paid. When the Fund write a call option, such option is typically “covered,” meaning that they hold the underlying instrument subject to being called by the option counterparty. When the Fund write a put option, cash is segregated in an amount sufficient to cover the obligation. These amounts, which are considered restricted, are included in cash pledged as collateral for options written in the Statement of Assets and Liabilities.
Simplify Exchange Traded Funds
Notes to Financial Statements (Continued)
June 30, 2024
Swaps. Swap agreements are agreements between the Fund and a counterparty to exchange cash flows, assets, foreign currencies or market-linked returns at specified intervals. Swap agreements are privately negotiated in the OTC market (OTC swaps) or may be executed on a registered commodities exchange (centrally cleared swaps). Swaps are marked-to-market daily and the change in value is recorded as a component of unrealized appreciation/depreciation of swap contracts. The value of the swap will typically impose collateral posting obligations on the party that is considered out-of-the-money on the swap. Upfront payments made/received by the fund, if any, are amortized/accreted for financial reporting purposes, with the unamortized/unaccreted portion included in the Statement of assets and liabilities. A termination payment by the counterparty or the fund is recorded as realized gain or loss, as well as the net periodic payments received or paid by the fund. Entering into swap agreements involves, to varying degrees, elements of credit, market and documentation risk that may provide outcomes that produce losses in excess of the amounts recognized on the Statement of assets and liabilities. Such risks involve the possibility that there will be no liquid market for the swap, or that a counterparty may default on its obligation or delay payment under the swap terms. The counterparty may disagree or contest the terms of the swap. In addition to interest rate risk, market risks may also impact the swap. The fund may also suffer losses if it is unable to terminate or assign outstanding swaps or reduce its exposure through offsetting transactions.
Total Return Swaps. Total return swaps are commitments where one party pays a fixed or variable rate premium (the Buyer) in exchange for a market-linked return (the Seller). The Seller pays the total return of a specific reference asset or index and in return receives interest payments from the Buyer. To the extent the total return of the underlying asset or index exceeds or falls short of the offsetting interest rate obligation, the Buyer will receive or make a payment to the Seller. The fund may enter into total return swaps in which it may act as either the Buyer or the Seller. Total return swap contracts are subject to the risk associated with the investment in the underlying reference asset or index. The risk in the case of short total return swap contracts is unlimited based on the potential for unlimited increases in the market value of the underlying reference asset or index.
The following table summarizes the value of the Fund’s derivative instruments held as of June 30, 2024 and the related location in the accompanying Statement of Assets and Liabilities presented by underlying risk exposure:
| Fund | | Asset Derivatives | | | Liability Derivatives | |
| Simplify Opportunistic Income ETF | |
| Credit Contracts | | Unrealized appreciation on centrally cleared swaps | | $ | 304,242 | | | Unrealized depreciation on centrally cleared swaps | | $ | — | |
| Interest Rate Contracts | | Unrealized appreciation on futures contracts* | | $ | 278,281 | | | Unrealized depreciation on futures contracts* | | $ | — | |
| Equity Contracts | | Unrealized appreciation on OTC swaps | | $ | — | | | Unrealized depreciation on OTC swaps | | $ | 97,960 | |
| * | Includes cumulative unrealized appreciation or unrealized cumulative depreciation on futures contracts as disclosed in the Schedule of Investments. |
For the year ended June 30, 2024, realized gains/(losses) and the change in unrealized appreciation/(depreciation) on purchased option contracts (a) by risk type, as disclosed in the Statement of Operations, is as follows:
| Fund | | Risk Type | | | Realized
Gain/(Loss) | | | Change in Unrealized Appreciation/
(Depreciation) | |
| Simplify Opportunistic Income ETF | | Equity | | | $ | (42,959 | ) | | $ | — | |
| Simplify Opportunistic Income ETF | | Interest Rate | | | | (35,142 | ) | | | — | |
| (a) | Purchased option contracts are included in Net Realized Gain (Loss) on Investments within the Statement of Operations. |
For the year ended June 30, 2024, realized gains/(losses) and the change in unrealized appreciation/(depreciation) on swap contracts by risk type, as disclosed in the Statement of Operations, is as follows:
| Fund | | Risk Type | | | Realized
Gain/(Loss) | | | Change in Unrealized Appreciation/
(Depreciation) | |
| Simplify Opportunistic Income ETF | | Equity | | | $ | 170,331 | | | $ | (97,960 | ) |
Simplify Exchange Traded Funds
Notes to Financial Statements (Continued)
June 30, 2024
| Fund | | Risk Type | | | Realized
Gain/(Loss) | | | Change in Unrealized
Appreciation/ (Depreciation) | |
| Simplify Opportunistic Income ETF | | Credit | | | $ | (1,194,110 | ) | | $ | 304,242 | |
For the year ended June 30, 2024, realized gains/(losses) and the change in unrealized appreciation/(depreciation) on futures contracts by risk type, as disclosed in the Statement of Operations, is as follows:
| Fund | | Risk Type | | | Realized
Gain/(Loss) | | | Change in Unrealized
Appreciation/
(Depreciation) | |
| Simplify Opportunistic Income ETF | | Equity | | | $ | (242,152 | ) | | $ | — | |
| Simplify Opportunistic Income ETF | | Commodity | | | | (357,358 | ) | | | — | |
| Simplify Opportunistic Income ETF | | Interest Rate | | | | (2,169,239 | ) | | | 278,281 | |
| Simplify Opportunistic Income ETF | | Foreign Exchange | | | | 19,820 | | | | — | |
For the year ended June 30, 2024, realized gains/(losses) and the change in unrealized appreciation/(depreciation) on written option contracts by risk type, as disclosed in the Statement of Operations, is as follows:
| Fund | | Risk Type | | | Realized
Gain/(Loss) | | | Change in Unrealized
Appreciation/
(Depreciation) | |
| Simplify Opportunistic Income ETF | | Equity | | | $ | (94,685 | ) | | $ | — | |
| Simplify Opportunistic Income ETF | | Interest Rate | | | | 33,498 | | | | — | |
For the year ended June 30, 2024, the average fiscal quarter end balances of outstanding derivative financial instruments were as follows:
| Fund | | Purchased Option Contracts (Contract Value) | | | Purchased Swaption Contracts
(Contract Value) | | | Forward Foreign
Currency
Contracts
(Notional Value) | | | Futures Contracts
(Notional Value) | | | Written Option
Contracts
(Contract Value) | | | Swaps
(Notional Value) | |
| Simplify Opportunistic Income ETF | | $ | 95,457 | | | $ | — | | | $ | — | | | $ | 45,616,875 | | | $ | (25,817 | ) | | $ | 16,647,484 | |
The Fund enters into International Swaps and Derivatives Association, Inc. Master Agreements (“ISDA Master Agreements”) or similar master agreements (collectively, “Master Agreements”) with its OTC derivative contract counterparties in order to, among other things, reduce its credit risk to counterparties. ISDA Master Agreements include provisions for general obligations, representations, collateral and events of default or termination. Under an ISDA Master Agreement, the Fund typically may offset with the counterparty certain derivative financial instrument’s payables and/or receivables with collateral held and/or posted and create one single net payment (close-out netting) in the event of default or termination.
The following table presents Fund’s derivative assets and liabilities by counterparty net of amounts available for offset under a master netting agreement or similar arrangement (collectively referred to as “MNA”) and net of the related collateral received/pledged by the Fund as of June 30, 2024:
| Fund | | Gross Amounts of Liabilities Presented
in the Statements
of Assets and
Liabilities | | | Financial
Instruments
and Derivatives
Available for Offset | | | Cash
Collateral
Pledged(1) | | | Non-Cash
Collateral
Pledged(1) | | | Net Amount
of Derivatives
Liabilities | |
| Simplify Opportunistic Income ETF | | | | | | | | | | | | | | | | | | | | |
| Morgan Stanley Capital Services LLC | | $ | 97,960 | | | $ | — | | | $ | — | | | $ | — | | | $ | 97,960 | |
| | | $ | 97,960 | | | $ | — | | | $ | — | | | $ | — | | | $ | 97,960 | |
Simplify Exchange Traded Funds
Notes to Financial Statements (Continued)
June 30, 2024
| (1) | The actual collateral received and/or pledged may be more than amount shown. |
4. Investment Advisory Agreement and Other Agreements
The Adviser has overall responsibility for the general management and administration of the Fund, subject to the oversight of the Board. Under an investment advisory agreement between the Trust, on behalf of the Fund, and the Adviser (the “Investment Advisory Agreement”), the Adviser is responsible for arranging sub-advisory, transfer agency, custody, fund administration, and all other non-distribution related services for the Fund to operate.
Asterozoa Management LLC (the “Sub-Adviser”) serves as investment sub-adviser to the Fund. The Sub-Adviser is responsible for day-to-day management of the Fund, subject to supervision of the Adviser. The Adviser, not the Fund, pays the Sub-Adviser.
For its investment advisory services to the Fund below, the Adviser was entitled to receive a management fee based on the Fund’s average daily net assets, computed and accrued daily and payable monthly, at an annual rate equal to:
| Fund | | Management
Fee | |
| Simplify Opportunistic Income ETF | | | 0.95 | % |
The Adviser has contractually agreed to waive its fee payable under the management agreement by 0.45% through at least October 31, 2024. This agreement may be terminated only by the Board of Trustees on 60 days’ written notice to the Adviser. For the year ended June 30, 2024, the Adviser waived expenses of $295,933.
Under the Investment Advisory Agreement, the Adviser has agreed to pay substantially all the operating expenses of the Fund, excluding interest expenses, taxes, brokerage expenses, Rule 12b-1 fees (if any), acquired fund fees and expenses, expenses incidental to a meeting of the Fund’s shareholders and the management fee. In addition to the excluded operating expenses, the Fund also pays non-operating expenses such as litigation and indemnification expenses and other expenses determined to be extraordinary by the Trust.
The Board has adopted a Distribution and Service Plan pursuant to Rule 12b-1 under the 1940 Act. In accordance with its Rule 12b-1 plan, the Fund is authorized to pay an amount up to 0.25% of its average daily net assets each year to finance activities primarily intended to result in the sale of Creation Units of the Fund or the provision of investor services. No Rule 12b-1 fees are currently paid by the Fund and there are no plans to impose these fees. However, in the event Rule 12b-1 fees are charged in the future, they will be paid out of the Fund’s assets, and directly impact the NAV per share of the Fund.
The Bank of New York Mellon, a wholly-owned subsidiary of The Bank of New York Mellon Corporation, serves as Administrator, Custodian, Accounting Agent and Transfer Agent for the Fund.
Foreside Financial Services, LLC (the “Distributor”) serves as the distributor of Creation Units for the Fund on an agency basis. The Distributor does not maintain a secondary market in shares of the Fund. Foreside Fund Officer Services, LLC a related party to the Distributor also serves as the Trust’s Compliance Officer.
A Trustee and certain Officers of the Trust are also employees of the Adviser and/or the Distributor.
5. Investment Transactions
Purchases and sales of securities, other than short-term securities, U.S. Government Securities and in-kind transactions were as follows:
| Fund | | Purchases | | | Sales | |
| Simplify Opportunistic Income ETF | | $ | 170,792,452 | | | $ | 111,377,404 | |
Purchases and sales of long term U.S. Government Securities were as follows:
| Fund | | Purchases | | | Sales | |
| Simplify Opportunistic Income ETF | | $ | 2,946,490 | | | $ | 2,931,382 | |
6. Fund Share Transactions
The Fund issues and redeems Shares at NAV only in large blocks of 25,000 Shares (each block of Shares is called a “Creation Unit”). Creation Units are issued and redeemed primarily in-kind for securities but may include cash. Individual Shares may only be purchased and sold in secondary market transactions through brokers. Except when aggregated in Creation Units in transactions with Authorized Participants, the Shares are not redeemable securities of the Fund.
Fund Shares are listed and traded on the Exchange on each day that the Exchange is open for business (“Business Day”). The Fund’s Shares may only be purchased and sold on the Exchange through a broker-dealer. Because the Fund’s Shares trade at market prices rather than at their NAV, Shares may trade at a price equal to the NAV, greater than NAV (premium) or less than NAV (discount).
Simplify Exchange Traded Funds
Notes to Financial Statements (Continued)
June 30, 2024
Authorized participants pay a fixed transaction fee of $500 to the shareholder servicing agent when purchasing and redeeming Creation Units of the Fund. The transaction fee is used to defray the costs associated with the issuance and redemption of Creation Units. In addition to the fixed transaction fee, the Fund may charge an additional maximum 3% of the amount invested variable fee for creations and redemptions in cash, to offset brokerage and impact expenses associated with a cash transaction.
7. Federal Income Taxes
For the year ended June 30, 2024, the effect of permanent “book/tax” reclassifications to the components of net assets are included below. These differences are primarily due to redemptions-in-kind, non-deductible excise tax paid, prior year true ups, distributions in excess, return of capital distributions, and controlled foreign corporations income reversal.
| Fund | | Distributable
earnings (loss) | | | Paid-in
Capital | |
| Simplify Opportunistic Income ETF | | $ | — | | | $ | — | |
The tax character of dividends and distributions declared for the year ended June 30, 2024 were as follows:
| Fund | | Ordinary
Income* | | | Long-Term
Capital Gains | | | Return of
Capital | |
| Simplify Opportunistic Income ETF | | $ | 4,326,748 | | | $ | — | | | $ | — | |
| * | For tax purposes short-term capital gain distributions are considered ordinary income distributions. |
The tax character of dividends and distributions declared for the period ended June 30, 2023 were as follows:
| Fund | | Ordinary
Income* | | | Long-Term
Capital Gains | | | Return of
Capital | |
| Simplify Opportunistic Income ETF | | $ | — | | | $ | — | | | $ | — | |
| * | For tax purposes short-term capital gain distributions are considered ordinary income distributions. |
As of June 30, 2024, the components of accumulated earnings (losses) on a tax basis were as follows:
| Fund | | Undistributed
Ordinary
Income | | | Undistributed
Long-term
Capital Gains | | | Temporary
Book/Tax
Differences(a) | | | Net Unrealized
Appreciation
(Depreciation) | | | Accumulated
Capital and
Other Losses | | | Post-October/
Late-year
Ordinary Loss
Deferrals | | | Distributable
earnings (loss) | |
| Simplify Opportunistic Income ETF | | $ | 338,625 | | | $ | — | | | $ | — | | | $ | 1,437,967 | | | $ | (3,146,838 | ) | | $ | — | | | $ | (1,370,246 | ) |
| (a) | The temporary book/tax differences was attributable primarily to dividend payable and straddles deferral. |
At June 30, 2024, gross unrealized appreciation and depreciation of investments owned by the Fund, based on cost for federal income tax purposes were as follows:
| Fund | |
Tax Cost | | | Gross
Unrealized
Appreciation | | | Gross
Unrealized
Depreciation | | | Net Unrealized
Appreciation
(Depreciation) | |
| Simplify Opportunistic Income ETF | | $ | 84,810,501 | | | $ | 2,460,610 | | | $ | (1,218,413 | ) | | $ | 1,242,197 | |
The differences between book-basis and tax-basis components of net assets are primarily attributable to the tax deferral of losses on wash sales, grantor trust adjustments, section 1256 mark-to-market treatment of derivatives and return of capital basis adjustments from underlying investments.
The Fund utilized capital loss carryforwards to offset taxable gains realized during the year ended June 30, 2024:
| Fund | | Amount | |
| Simplify Opportunistic Income ETF | | $ | — | |
Simplify Exchange Traded Funds
Notes to Financial Statements (Continued)
June 30, 2024
At June 30, 2024, for federal income tax purposes, the Fund had capital loss carryforwards available as shown in the table below, to the extent provided by regulations, to offset future capital gains for an unlimited period. To the extent that these capital loss carryforwards are used to offset future capital gains, it is probable that the capital gains so offset will not be distributed to shareholders.
| Fund | | Short-Term | | | Long-Term | | | Total Amount | |
| Simplify Opportunistic Income ETF | | $ | 2,278,042 | | | $ | 868,796 | | | $ | 3,146,838 | |
Certain capital and qualified late year ordinary losses incurred after October 31 and December 31, respectively, and within the current taxable year, are deemed to arise on the first business day of the Fund’s next taxable year. At June 30 2024, the Fund incurred and will elect to defer post-October capital losses and late year ordinary losses:
| Fund | | Capital Post-
October Losses | | | Late-year
ordinary Losses | |
| Simplify Opportunistic Income ETF | | $ | — | | | $ | — | |
8. Subsequent Events
Management has evaluated subsequent events through the date of issuance of these financial statements and has determined that there are no subsequent events that require adjustment to, or disclosure in, the financial statement.
Simplify Exchange Traded Funds
Report of Independent Registered Public Accounting Firm
To the Shareholders of Simplify Opportunistic Income ETF and
Board of Trustees of Simplify Exchange Traded Funds
Opinion on the Financial Statements
We have audited the accompanying statement of assets and liabilities, including the schedule of investments, of Simplify Opportunistic Income ETF (the “Fund”), a series of Simplify Exchange Traded Funds, as of June 30, 2024, the related statement of operations for the year then ended, and the statements of changes in net assets and the financial highlights for the year ended June 30, 2024 and for the period from June 27, 2023 (commencement of operations) through June 30, 2023, and the related notes (collectively referred to as the “financial statements”). In our opinion, the financial statements present fairly, in all material respects, the financial position of the Fund as of June 30, 2024, the results of its operations for the year then ended, and the changes in net assets and the financial highlights for each of the two periods in the period then ended, in conformity with accounting principles generally accepted in the United States of America.
Basis for Opinion
These financial statements are the responsibility of the Fund’s management. Our responsibility is to express an opinion on the Fund’s financial statements based on our audits. We are a public accounting firm registered with the Public Company Accounting Oversight Board (United States) (“PCAOB”) and are required to be independent with respect to the Fund in accordance with the U.S. federal securities laws and the applicable rules and regulations of the Securities and Exchange Commission and the PCAOB.
We conducted our audits in accordance with the standards of the PCAOB. Those standards require that we plan and perform the audit to obtain reasonable assurance about whether the financial statements are free of material misstatement whether due to error or fraud.
Our audits included performing procedures to assess the risks of material misstatement of the financial statements, whether due to error or fraud, and performing procedures that respond to those risks. Such procedures included examining, on a test basis, evidence regarding the amounts and disclosures in the financial statements. Our procedures included confirmation of securities owned as of June 30, 2024, by correspondence with the custodian and brokers. Our audits also included evaluating the accounting principles used and significant estimates made by management, as well as evaluating the overall presentation of the financial statements. We believe that our audits provide a reasonable basis for our opinion.
We have as the auditor of one of more funds advised by Simplify Asset Management, Inc.since 2020.

COHEN & COMPANY, LTD.
Cleveland, Ohio
August 29, 2024
Simplify Exchange Traded Funds
Additional Information (Unaudited)
Discount & Premium Information
Information regarding how often shares of the Fund traded on NYSE Arca at a price above (i.e., at a premium) or below (i.e., at a discount) the NAV of the Fund can be found at www.simplify.us.
Tax Information
Form 1099-DIV and other year-end tax information provide shareholders with actual calendar year amounts that should be included in their tax returns. Shareholders should consult their tax advisors.
The Fund designates the following amounts or, if subsequently determined to be different, the maximum allowable for its period ended June 30, 2024.
| Fund | | Qualified
Dividend
Income* | | | Dividends
Received
Deduction | |
| Simplify Opportunistic Income ETF | | | 22.96 | % | | | 23.50 | % |
| * | The above percentage is based on ordinary income dividends paid to shareholders during the Fund’s fiscal year. |
This report must be preceded or accompanied by a prospectus.
(This page intentionally left blank)
(This page intentionally left blank)
Investment Adviser
Simplify Asset Management Inc.
10845 Griffith Peak Drive, 2/F
Las Vegas, NV 89135 |
| Investment Sub-Adviser
Asterozoa Management, LLC
8550 W. Charleston Blvd
Ste. 102-299
Las Vegas, NV 89117 |
| Custodian, Administrator & Transfer Agent
The Bank of New York Mellon
240 Greenwich Street
New York, NY 10286 |
| | | | | |
Simplify Exchange Traded Funds
10845 Griffith Peak Drive, 2/F
Las Vegas, NV 89135 |
| Independent Registered Public Accounting Firm
Cohen & Company Ltd.
1350 Euclid Ave., Suite 800
Cleveland, OH 44115 |
| Legal Counsel
Thompson Hine LLP
41 South High Street
Suite 1700
Columbus, OH 43215 |
June 30, 2024
Annual Financial Statements and
Other Important Information
Simplify Exchange Traded Funds
Simplify Propel Opportunities ETF (SURI)

(This page intentionally left blank)
Simplify Exchange Traded Funds
Table of Contents
This report is provided for the general information of shareholders and is not authorized for distribution to prospective investors unless preceded or accompanied by a current prospectus.
Simplify Propel Opportunities ETF
Schedule of Investments
June 30, 2024
| | | Shares | | | Value | |
| Common Stocks – 68.2% | | | | | | | | |
| Communication Services – 3.4% | | | | | | | | |
| Telesat Corp.* | | | 365,781 | | | $ | 3,328,607 | |
| Health Care – 64.8% | | | | | | | | |
| Abeona Therapeutics, Inc.* | | | 408,584 | | | | 1,732,396 | |
| Achieve Life Sciences, Inc.* | | | 217,845 | | | | 1,023,871 | |
| Akero Therapeutics, Inc.* | | | 212,477 | | | | 4,984,710 | |
| Applied Therapeutics, Inc.* | | | 2,817,505 | | | | 13,157,748 | |
| Ardelyx, Inc.* | | | 598,000 | | | | 4,431,180 | |
| Athira Pharma, Inc.* | | | 1,492,792 | | | | 3,955,899 | |
| Avidity Biosciences, Inc.* | | | 125,000 | | | | 5,106,250 | |
| Chinook Therapeutics, Inc.*(a) | | | 25,000 | | | | 9,750 | |
| Cybin, Inc.* | | | 500,000 | | | | 135,500 | |
| Eiger BioPharmaceuticals, Inc.* | | | 90,000 | | | | 1,138,500 | |
| Fulcrum Therapeutics, Inc.* | | | 465,000 | | | | 2,883,000 | |
| Kura Oncology, Inc.* | | | 80,000 | | | | 1,647,200 | |
| Kymera Therapeutics, Inc.* | | | 30,515 | | | | 910,873 | |
| MAAT Pharma Saca* | | | 1,362 | | | | 10,444 | |
| Madrigal Pharmaceuticals, Inc.* | | | 23,294 | | | | 6,526,047 | |
| Phathom Pharmaceuticals, Inc.* | | | 521,935 | | | | 5,375,931 | |
| Syndax Pharmaceuticals, Inc.* | | | 50,000 | | | | 1,026,500 | |
| Trevi Therapeutics, Inc.* | | | 200,000 | | | | 596,000 | |
| TScan Therapeutics, Inc.* | | | 1,046,916 | | | | 6,124,459 | |
| Verrica Pharmaceuticals, Inc.* | | | 280,000 | | | | 2,041,200 | |
| | | | | | | | 62,817,458 | |
| Total Common Stocks (Cost $52,420,628) | | | | | | | 66,146,065 | |
| | | | | | | | | |
| Limited Partnership – 26.7% | | | | | | | | |
| Energy – 26.7% | | | | | | | | |
| Plains GP Holdings LP, Class A* | | | | | | | | |
| (Cost $17,065,756) | | | 1,372,360 | | | | 25,827,815 | |
| | | Principal | | | | |
| Corporate Bonds – 3.3% | | | | | | | | |
| Communications – 3.3% | | | | | | | | |
| Telesat Canada / Telesat LLC, 5.63%, 12/6/2026, 144A(b) | | $ | 2,700,000 | | | | 1,275,999 | |
| Telesat Canada / Telesat LLC, 6.50%, 10/15/2027, 144A(b) | | | 6,124,000 | | | | 1,923,863 | |
| Total Corporate Bonds (Cost $4,706,981) | | | | | | | 3,199,862 | |
| | | Shares | | | | |
| Closed-End Funds – 1.6% | | | | | | | | |
| Equity Funds – 1.6% | | | | | | | | |
| Kayne Anderson Energy Infrastructure Fund | | | | | | | | |
| (Cost $1,318,886) | | | 147,033 | | | | 1,518,851 | |
| | | | | | | | | |
| Money Market Funds – 0.3% | | | | | | | | |
| Fidelity Investments Money Market Treasury Only Portfolio - Class I, 5.19%(c) | | | | | | | | |
| (Cost $317,014) | | | 317,014 | | | | 317,014 | |
See Notes to Financial Statements.
Simplify Propel Opportunities ETF
Schedule of Investments (Continued)
June 30, 2024
| | | Value | |
| Total Investments – 100.1% | | | | |
| (Cost $75,829,265) | | $ | 97,009,607 | |
| Liabilities in Excess of Other Assets – (0.1)% | | | (66,037 | ) |
| Net Assets – 100.0% | | $ | 96,943,570 | |
| * | Non Income Producing |
| (a) | Investment was valued using significant unobservable inputs. |
| (b) | Security was purchased (sold) pursuant to Rule 144A under the Securities Act of 1933 and may not be resold (repurchased) subject to that rule except to qualified institutional buyers. Unless otherwise noted, Rule 144A securities are deemed to be liquid. Total fair value of Rule 144A securities amounts to $3,199,862, which represents 3.3% of net assets as of June 30, 2024. |
| (c) | Rate shown reflects the 7-day yield as of June 30, 2024. |
Affiliates
Fiscal year to date transactions with companies which are or were affiliates are as follows:
| Affiliate | | Value at
beginning of
the period | | | Purchases
Cost | | | Sales
Proceeds | | | Net Realized
Gain/(Loss) | | | Net Change
in Unrealized
Appreciation/
Depreciation | | | Value at the
end of the
period | | | Number of
Shares at
the end of
the period | | | Dividend
Income | | | Capital Gain
Distributions | |
| Simplify Enhanced Income ETF | | $ | — | | | $ | 3,002,520 | | | $ | (2,922,372 | ) | | $ | (80,148 | ) | | $ | — | | | $ | — | | | | — | | | $ | 179,179 | | | $ | 892 | |
Summary of Investment Type††
Investment Categories | | % of
Net Assets | |
| Common Stocks | | | 68.2 | % |
| Limited Partnership | | | 26.7 | % |
| Corporate Bonds | | | 3.3 | % |
| Closed-End Funds | | | 1.6 | % |
| Money Market Funds | | | 0.3 | % |
| Total Investments | | | 100.1 | % |
| Liabilities in Excess of Other Assets | | | (0.1 | )% |
| Net Assets | | | 100.0 | % |
| †† | The percentage shown for each investment category is the total value of investments in that category as a percentage of the net assets of the Fund. The table depicts the Fund’s investments but may not represent the Fund’s market exposure to certain derivatives, if any, which are included in Liabilities in Excess of Other Assets. |
See Notes to Financial Statements.
Simplify Exchange Traded Funds
Statement of Assets and Liabilities
June 30, 2024
| | | Simplify Propel
Opportunities
ETF | |
| Assets | | | | |
| Investments, at value | | $ | 97,009,607 | |
| Receivables: | | | | |
| Interest | | | 106,219 | |
| Dividends | | | 32,348 | |
| Investment adviser | | | 20,464 | |
| Prepaid expenses | | | 30 | |
| Total assets | | | 97,168,668 | |
| | | | | |
| Liabilities | | | | |
| Payables: | | | | |
| Investment advisory fees | | | 225,098 | |
| Total liabilities | | | 225,098 | |
| Net Assets | | $ | 96,943,570 | |
| | | | | |
| Net Assets Consist of | | | | |
| Paid-in capital | | $ | 92,257,166 | |
| Distributable earnings (loss) | | | 4,686,404 | |
| Net Assets | | $ | 96,943,570 | |
| Number of Common Shares outstanding | | | 4,380,001 | |
| Net Asset Value, offering and redemption price per share | | $ | 22.13 | |
| Investments, at cost | | $ | 75,829,265 | |
See Notes to Financial Statements.
Simplify Exchange Traded Funds
Statement of Operations
For the Year Ended June 30, 2024
| | | Simplify Propel
Opportunities
ETF | |
| Investment Income | | | | |
| Unaffiliated dividend income | | $ | 753,332 | |
| Affiliated dividend income | | | 179,179 | |
| Interest income | | | 912,424 | |
| Total income | | | 1,844,935 | |
| | | | | |
| Expenses | | | | |
| Investment advisory fees | | | 2,663,709 | |
| Total expenses | | | 2,663,709 | |
| Less fees waived: | | | | |
| Waiver | | | (242,163 | ) |
| Net expenses | | | 2,421,546 | |
| Net investment income (loss) | | | (576,611 | ) |
| | | | | |
| Realized and Unrealized Gain (Loss) | | | | |
| Net realized gain (loss) from: | | | | |
| Investments | | | (10,014,243 | ) |
| Affiliated investments | | | (80,148 | ) |
| In-kind redemptions | | | 980,550 | |
| Foreign currency transactions | | | (25 | ) |
| Capital gain distributions from affiliated funds | | | 892 | |
| Net realized gain (loss) | | | (9,112,974 | ) |
| Net change in unrealized appreciation (depreciation) on: | | | | |
| Investments | | | 24,763,358 | |
| Net unrealized gain (loss) | | | 24,763,358 | |
| Net realized and unrealized gain (loss) | | | 15,650,384 | |
| Net Increase (Decrease) in Net Assets Resulting from Operations | | $ | 15,073,773 | |
See Notes to Financial Statements.
Simplify Exchange Traded Funds
Statements of Changes in Net Assets
| | | Simplify Propel Opportunities ETF | |
| | | Year Ended
June 30,
2024 | | | For the period February 8,
2023(1) to
June 30,
2023 | |
| Increase (Decrease) in Net Assets from Operations | | | | | | | | |
| Net investment income (loss) | | $ | (576,611 | ) | | $ | (129,558 | ) |
| Net realized gain (loss) | | | (9,112,974 | ) | | | (990,028 | ) |
| Net change in net unrealized appreciation (depreciation) | | | 24,763,358 | | | | (3,583,016 | ) |
| Net increase (decrease) in net assets resulting from operations | | | 15,073,773 | | | | (4,702,602 | ) |
| | | | | | | | | |
| Distributions to Shareholders from: | | | | | | | | |
| Distributions | | | — | | | | (3,107,601 | ) |
| Return of capital | | | (14,533,703 | ) | | | (2,920,001 | ) |
| Total distributions | | | (14,533,703 | ) | | | (6,027,602 | ) |
| | | | | | | | | |
| Fund Shares Transactions | | | | | | | | |
| Proceeds from shares sold | | | 24,650,767 | | | | 127,642,507 | |
| Value of shares redeemed | | | (28,418,927 | ) | | | (16,740,643 | ) |
| Net increase (decrease) in net assets resulting from fund share transactions | | | (3,768,160 | ) | | | 110,901,864 | |
| Total net increase (decrease) in Net Assets | | | (3,228,090 | ) | | | 100,171,660 | |
| | | | | | | | | |
| Net Assets | | | | | | | | |
| Beginning of period | | | 100,171,660 | | | | — | |
| End of period | | $ | 96,943,570 | | | $ | 100,171,660 | |
| | | | | | | | | |
| Changes in Shares Outstanding | | | | | | | | |
| Shares outstanding, beginning of period | | | 4,570,001 | | | | — | |
| Shares sold | | | 1,060,000 | | | | 5,320,001 | (2) |
| Shares redeemed | | | (1,250,000 | ) | | | (750,000 | ) |
| Shares outstanding, end of period | | | 4,380,001 | | | | 4,570,001 | |
| (1) | Commencement of operations. |
| (2) | Shares not in increment of 25,000 shares, a creation unit, represent the Adviser’s initial seed investment in connection with the commencement of operations. |
See Notes to Financial Statements.
Simplify Exchange Traded Funds
Financial Highlights
Simplify Propel Opportunities ETF
Selected Per Share Data | | Year Ended
June 30,
2024 | | | Period Ended
June 30,
2023(a) | |
| Net Asset Value, beginning of period | | $ | 21.92 | | | $ | 25.00 | |
| Income (loss) from investment operations: | | | | | | | | |
| Net investment income (loss)(b) | | | (0.13 | ) | | | (0.04 | ) |
| Net realized and unrealized gain (loss) | | | 3.63 | | | | (1.36 | ) |
| Total from investment operations | | | 3.50 | | | | (1.40 | ) |
| Less distributions from: | | | | | | | | |
| Net investment income | | | — | | | | (0.87 | ) |
| Return of capital | | | (3.29 | ) | | | (0.81 | ) |
| Total distributions | | | (3.29 | ) | | | (1.68 | ) |
| Net Asset Value, end of period | | $ | 22.13 | | | $ | 21.92 | |
| Total Return (%) | | | 17.27 | | | | (4.97 | )(c) |
| Ratios to Average Net Assets and Supplemental Data | | | | | | | | |
| Net Assets, end of period ($ millions) | | $ | 97 | | | $ | 100 | |
| Ratio of expenses before fee waiver (%) | | | 2.75 | (d) | | | 2.75 | (d)(e) |
| Ratio of expenses after fee waiver (%) | | | 2.50 | (d) | | | 2.50 | (d)(e) |
| Ratio of net investment income (loss) (%) | | | (0.60 | ) | | | (0.50 | )(e) |
| Portfolio turnover rate (%)(f) | | | 42 | | | | 46 | (c) |
| (a) | For the period February 8, 2023 (commencement of operations) through June 30, 2023. |
| (b) | Per share numbers have been calculated using the average shares method. |
| (c) | Not annualized. |
| (d) | The Fund invests in other ETFs and indirectly bears its proportionate shares of fees and expenses incurred by the Underlying Funds in which the Fund is invested. This ratio does not included these indirect fees and expenses. |
| (e) | Annualized. |
| (f) | Excludes the impact of in-kind transactions related to the processing of capital share transactions in Creation Units. |
See Notes to Financial Statements.
Simplify Exchange Traded Funds
Notes to Financial Statements
June 30, 2024
1. Organization
Simplify Exchange Traded Funds (the “Trust”) is registered under the Investment Company Act of 1940, as amended (the “1940 Act”), as an open-end registered management investment company organized as a Delaware statutory trust.
As of June 30, 2024, the Trust consists of twenty eight investment series of exchange-traded funds (“ETFs”) in operation and trading. These financial statements report on the Fund listed below:
Simplify Propel Opportunities ETF
Simplify Asset Management Inc. (the “Adviser”) serves as investment adviser to the Fund and has overall responsibility for the general management and administration of the Fund, subject to the oversight of the Trust’s Board of Trustees (the “Board”).
The Fund offers shares that are listed and traded on the NYSE Arca, Inc. (“NYSE Arca”). Unlike mutual funds, the Fund issues and redeems shares on a continuous basis, at net asset value (“NAV”), only in large specified lots consisting of 25,000 shares, each called a “Creation Unit”, to authorized participants who have entered into agreements with the Fund’s distributor. Shares are not individually redeemable securities of the Fund, and owners of the shares may acquire those shares from the Fund, or tender such shares for redemption to the Fund, in Creation Units only.
| Fund | | Investment objectives |
| Simplify Propel Opportunities ETF | | The Fund seeks to provide long-term growth of capital. |
2. Significant Accounting Policies
The financial statements have been prepared in conformity with U.S. generally accepted accounting principles (“U.S. GAAP”), which require management to make certain estimates and assumptions that affect the reported amounts and disclosures of contingent assets and liabilities at the date of the financial statement and the reported amounts of revenues and expenses during the reporting period. Actual results could differ from those estimates. The Fund is an investment company and accordingly follow the investment company accounting and reporting guidance of the Financial Accounting Standards Board (“FASB”) Accounting Standards Codification Topic 946 Financial Services – Investment Companies including Accounting Standards Update 2013-08. The following is a summary of significant accounting policies followed by the Fund.
Investment Valuation
The Fund’s investments are valued using procedures approved by the Board and are generally valued using market valuations (Market Approach). A market valuation generally means a valuation (i) obtained from an exchange, a pricing service, or a major market maker (or dealer) or (ii) based on a price quotation or other equivalent indication of value supplied by an exchange, a pricing service, or a major market maker (or dealer). A price obtained from a pricing service based on such pricing service’s valuation matrix may be considered a market valuation. Any assets or liabilities denominated in currencies other than the U.S. dollar are converted into U.S. dollars at the current market rates on the date of valuation as quoted by one or more sources.
If market quotations are not readily available, securities will be valued at their fair market value as determined using the “fair value” procedures approved by the Board. Fair value pricing involves subjective judgments and it is possible that the fair value determined for a security may be materially different than the value that could be realized upon the sale of that security. The fair value prices can differ from market prices when they become available or when a price becomes available. The Board has designated the Adviser as its valuation designee to execute these procedures. The Adviser may also enlist third party consultants such as an audit firm or financial officer of a security issuer on an as-needed basis to assist in determining a security-specific fair value. These securities are either categorized as Level 2 or 3 of the fair value hierarchy depending on the relevant inputs used. The Board reviews the execution of this process and the resultant fair value prices at least quarterly to assure the process produces reliable results.
Equity securities, closed-end funds, and ETFs are valued at the most recent sale price or official closing price reported on the exchange (U.S. or foreign) or over-the-counter market on which they trade. Securities, closed-end funds or ETFs for which no sales are reported are valued at the calculated mean between the most recent bid and asked quotations on the relevant market or, if a mean cannot be determined, at the most recent bid quotation. Equity securities, closed-end funds, and ETFs are generally categorized as Level 1 of the fair value hierarchy.
Exchange traded options are valued at the mean between the current bid and ask prices on the exchange on which such options are traded. If a mean price is not available, the closing price is used. Exchange trade options are categorized as Level 1. Options with international equity exposure are marked to market using closing prices for the underlying and interpolated option implied volatilities obtained from mid-market prices for options on the same underlying of similar expiries and strike prices. These securities are categorized as Level 2 in the fair value hierarchy.
Money Market Funds are valued at NAV.
Debt securities not traded on an exchange may be valued at prices supplied by a pricing agent(s) based on broker or dealer supplied valuations or matrix pricing, a method of valuing securities by reference to the value of other securities with similar characteristics, such as rating, interest rate and maturity. Debt securities are generally categorized as Level 2 of the fair value hierarchy.
Simplify Exchange Traded Funds
Notes to Financial Statements (Continued)
June 30, 2024
Under certain circumstances, the Fund may use an independent pricing service to calculate the fair market value of foreign equity securities on a daily basis by applying valuation factors to the last sale price or the mean price as noted above. The fair market values supplied by the independent pricing service will generally reflect market trading that occurs after the close of the applicable foreign markets of comparable securities or the value of other instruments that have a strong correlation to the fair valued securities. The independent pricing service will also take into account the current relevant currency exchange rate. A security that is fair valued may be valued at a price higher or lower than actual market quotations or the value determined by other funds using their own fair valuation procedures. Because foreign securities may trade on days when Shares are not priced, the value of securities held by the Fund can change on days when Shares cannot be redeemed or purchased. In the event that a foreign security’s market quotations are not readily available or are deemed unreliable (for reasons other than because the foreign exchange on which it trades closed before the Fund’s calculation of NAV), the security will be valued at its fair market value as determined in good faith by the Fund’s Adviser as the Board’s valuation designee in accordance with procedures approved by the Board below. Without fair valuation, it is possible that short-term traders could take advantage of the arbitrage opportunity and dilute the NAV of long-term investors. Fair valuation of the Fund’s portfolio securities can serve to reduce arbitrage opportunities available to short-term traders, but there is no assurance that it will prevent dilution of the Fund’s NAV by short-term traders. In addition, because the Fund may invest in underlying ETFs which hold portfolio securities primarily listed on foreign (non- U.S.) exchanges, and these exchanges may trade on weekends or other days when the underlying ETFs do not price their shares, the value of these portfolio securities may change on days when you may not be able to buy or sell Shares.
Investments initially valued in currencies other than the U.S. dollar are converted to U.S. dollars using exchange rates obtained from pricing services or other parties in accordance with the valuation procedures of the Adviser as the Board’s valuation designee. As a result, the NAV of the Shares may be affected by changes in the value of currencies in relation to the U.S. dollar. The value of securities traded in markets outside the United States or denominated in currencies other than the U.S. dollar may be affected significantly on a day that the Exchange is closed and an investor is not able to purchase, redeem or exchange Shares.
The Fund categorizes the inputs to valuation techniques used to value its investments into a disclosure hierarchy consisting of three levels as shown below:
| ● | Level 1 – Quoted prices in active markets for identical assets that the fund has the ability to access. |
| ● | Level 2 – Other significant observable inputs (including quoted prices for similar securities, interest rates, prepayment speeds, credit risk, etc.). |
| ● | Level 3 – Significant unobservable inputs (including the Fund’s own assumptions in determining the fair value of investments). |
The inputs or methodology used for valuing securities are not necessarily an indication of the risk associated with investing in those securities.
The following is a summary of the valuations as of June 30, 2024 for the Fund based upon the three levels defined above:
Simplify Propel Opportunities ETF
| Assets | | Level 1 | | | Level 2 | | | Level 3 | | | Total | |
| Common Stocks | | $ | 66,136,315 | | | $ | — | | | $ | 9,750 | | | $ | 66,146,065 | |
| Limited Partnership | | | 25,827,815 | | | | — | | | | — | | | | 25,827,815 | |
| Corporate Bonds | | | — | | | | 3,199,862 | | | | — | | | | 3,199,862 | |
| Closed-End Funds | | | 1,518,851 | | | | — | | | | — | | | | 1,518,851 | |
| Money Market Funds | | | 317,014 | | | | — | | | | — | | | | 317,014 | |
| TOTAL | | $ | 93,799,995 | | | $ | 3,199,862 | | | $ | 9,750 | | | $ | 97,009,607 | |
Cash
Cash consists of cash on deposit with a major financial institution which may exceed federally insured limits.
Foreign Currency Translations
The books and records of the Fund are maintained in U.S. dollars. Investment securities and other assets and liabilities denominated in a foreign currency are translated into U.S. dollars at the prevailing exchange rates at period end. Purchases and sales of investment securities, income and expenses are translated into U.S. dollars at the prevailing exchange rates on the respective dates of the transactions.
Net realized and unrealized gains and losses on foreign currency transactions represent net gains and losses between trade and settlement dates on securities transactions, the acquisition and disposition of foreign currencies, and the difference between the amount of net investment income accrued and the U.S. dollar amount actually received. The portion of both realized and unrealized gains and losses on investments that results from fluctuations in foreign currency exchange rates is not separately disclosed, but is included with net realized and unrealized gain/appreciation and loss/depreciation on investments.
Simplify Exchange Traded Funds
Notes to Financial Statements (Continued)
June 30, 2024
Investment Transactions and Related Income
For financial reporting purposes, investment transactions are reported on the trade date. However, for daily NAV determination, portfolio securities transactions are reflected no later than in the first calculation on the first business day following trade date. Dividend income is recorded on the ex-dividend date. Interest income is recognized on an accrual basis and includes, where applicable, the amortization of premium or accretion of discount based on effective yield. Gains or losses realized on sales of securities are determined using the specific identification method by comparing the identified cost of the security lot sold with the net sales proceeds. Dividend Income on the Statements of Operations is shown net of any foreign taxes withheld on income from foreign securities, which are provided for in accordance with the Fund’s understanding of the applicable tax rules and regulations.
Income Tax Information and Distributions to Shareholders
It is the Fund’s policy to comply with all requirements of the Internal Revenue Code of 1986, as amended (“the Code”). The Fund intends to qualify for and to elect treatment as a separate Regulated Investment Company (“RIC”) under Subchapter M of the Code. It is the Fund’s policy is to pay out dividends from net investment income quarterly. Taxable net realized gains from investment transactions, reduced by capital loss carryforwards, if any, will be declared and distributed to shareholders at least annually. The capital loss carryforward amount, if any, will be available to offset future net capital gains. The Fund may occasionally be required to make supplemental distributions at some other time during the year. The Fund reserves the right to declare special distributions if, in its reasonable discretion, such action is necessary or advisable to preserve the status of the Fund as a RIC or to avoid imposition of income or excise taxes on undistributed income. Dividends and distributions to shareholders, if any, will be recorded on the ex-dividend date. The amount of dividends and distributions from net investment income and net realized capital gains will be determined in accordance with Federal income tax regulations which may differ from U.S. GAAP. These “book/tax” differences are either considered temporary or permanent in nature. To the extent these differences are permanent in nature, (e.g., return of capital and distribution reclassifications), such amounts are reclassified within the composition of net assets based on their federal tax basis treatment; temporary differences (e.g., wash sales and straddles) do not require a reclassification. Dividends and distributions, which exceed earnings and profits for the full year for tax purposes, will be reported as a tax return of capital.
In accordance with U.S. GAAP requirements regarding accounting for uncertainties in income taxes, management has analyzed the Fund’s tax positions expected to be taken on foreign, federal and state income tax returns for all open tax years and has concluded that no provision for income tax is required in the Fund’s financial statement.
The Fund will recognize interest and penalties, if any, related to uncertain tax positions as income tax expense on the Statement of Operations.
3. Investment Advisory Agreement and Other Agreements
The Adviser has overall responsibility for the general management and administration of the Fund, subject to the oversight of the Board. Under an investment advisory agreement between the Trust, on behalf of the Fund, and the Adviser (the “Investment Advisory Agreement”), the Adviser is responsible for arranging sub-advisory, transfer agency, custody, fund administration, and all other non-distribution related services for the Fund to operate.
Propel Bio Management, LLC (the “Sub-Adviser”) serves as investment sub-adviser to the Fund. The Sub-Adviser is responsible for day-to-day management of the Fund, subject to supervision of the Adviser. The Adviser, not the Fund, pays the sub-advisory fee to the Sub-Adviser.
In addition to serving as Portfolio Manager of the Sub-Adviser with respect to the Fund, Mr. Richard Kayne (through a trust where he serves as a trustee) indirectly owns voting preferred shares of the Adviser and through the same trust is indirectly the Fund’s seed investor. Mr. Kayne is also a majority owner in Propel Bio Partners, LLC (the “General Partner”), a Delaware limited liability company, which serves as the general partner to the Propel Bio Partners, L.P. (the “Private Fund”). The Private Fund is a pooled investment vehicle that is exempt from registration under the Investment Company Act of 1940 and the Securities Act of 1933. The Sub-Adviser has been retained by the General Partner to serve as the investment adviser to the Private Fund. Mr. Kayne’s indirect part ownership of the Adviser and provision of seed capital to the Fund presents a potential conflict of interest on the part of the Adviser in selecting the Sub-Adviser. These relationships between Mr. Kayne and each of the Adviser and the Sub-Adviser were fully disclosed to, discussed with and considered by the Board in approving and renewing the appointment of the Sub-Adviser.
For its investment advisory services, the Adviser was entitled to receive a management fee based on the Fund’s average daily net assets, computed and accrued daily and payable monthly, at an annual rate equal to:
| Assets | | Management
Fee | |
| Up to and including $1 billion | | | 2.75 | % |
| Over $1 billion and less the $5 billion | | | 2.50 | % |
| Over $5 billion and less the $10 billion | | | 2.00 | % |
| Over $10 billion | | | 1.00 | % |
Simplify Exchange Traded Funds
Notes to Financial Statements (Continued)
June 30, 2024
The Adviser and Sub-Adviser have collectively agreed to waive 0.25% of the management and sub advisory fee on an annualized basis through December 31, 2024. This waiver may be terminated by the Fund’s Board of Trustees on 60 days’ notice and terminates automatically if the management agreement or sub-advisory agreement is terminated. For the year ended June 30, 2024, the Adviser waived fees of $242,163.
Under the Investment Advisory Agreement, the Adviser has agreed to pay substantially all the operating expenses of the Fund, excluding interest expenses, taxes, brokerage expenses, Rule 12b-1 fees (if any), acquired fund fees and expenses, expenses incidental to a meeting of the Fund’s shareholders and the Management Fee. In addition to the excluded operating expenses, the Fund also pays non-operating expenses such as litigation and indemnification expenses and other expenses determined to be extraordinary by the Trust.
The Board has adopted a Distribution and Service Plan pursuant to Rule 12b-1 under the 1940 Act. In accordance with its Rule 12b-1 plan, the Fund is authorized to pay an amount up to 0.25% of its average daily net assets each year to finance activities primarily intended to result in the sale of Creation Units of the Fund or the provision of investor services. No Rule 12b-1 fees are currently paid by the Fund and there are no plans to impose these fees. However, in the event Rule 12b-1 fees are charged in the future, they will be paid out of the Fund’s assets, and directly impact the NAV per share of the Fund.
The Bank of New York Mellon, a wholly-owned subsidiary of The Bank of New York Mellon Corporation, serves as Administrator, Custodian, Accounting Agent and Transfer Agent for the Fund.
Foreside Financial Services, LLC (the “Distributor”) serves as the distributor of Creation Units for the Fund on an agency basis. The Distributor does not maintain a secondary market in shares of the Fund. Foreside Fund Officer Services, LLC a related party to the Distributor also serves as the Trust’s Compliance Officer.
A Trustee and certain Officers of the Trust are also employees of the Adviser and/or the Distributor.
4. Investment Transactions
Purchases and sales of securities, other than short-term securities, U.S. Government Securities and in-kind transactions were as follows:
| Fund | | Purchases | | | Sales | |
| Simplify Propel Opportunities ETF | | $ | 39,881,639 | | | $ | 45,848,862 | |
Securities received and delivered in-kind through subscriptions and redemptions were as follows:
| Fund | | Purchases | | | Sales | |
| Simplify Propel Opportunities ETF | | $ | — | | | $ | 9,768,550 | |
5. Fund Share Transactions
The Fund issues and redeems Shares at NAV only in large blocks of 25,000 Shares (each block of Shares is called a “Creation Unit”). Creation Units are issued and redeemed primarily in-kind for securities but may include cash. Individual Shares may only be purchased and sold in secondary market transactions through brokers. Except when aggregated in Creation Units in transactions with Authorized Participants, the Shares are not redeemable securities of the Fund.
Fund Shares are listed and traded on the Exchange on each day that the Exchange is open for business (“Business Day”). The Fund’s Shares may only be purchased and sold on the Exchange through a broker-dealer. Because the Fund’s Shares trade at market prices rather than at their NAV, Shares may trade at a price equal to the NAV, greater than NAV (premium) or less than NAV (discount).
Authorized participants pay a fixed transaction fee of $500 to the shareholder servicing agent when purchasing and redeeming Creation Units of the Fund. The transaction fee is used to defray the costs associated with the issuance and redemption of Creation Units. In addition to the fixed transaction fee, the Fund may charge an additional maximum 3% of the amount invested variable fee for creations and redemptions in cash, to offset brokerage and impact expenses associated with a cash transaction.
6. Federal Income Taxes
For the year ended June 30, 2024, the effect of permanent “book/tax” reclassifications to the components of net assets are included below. These differences are primarily due to redemptions-in-kind, non-deductible excise tax paid, prior year true ups, distributions in excess, return of capital distributions, and controlled foreign corporations income reversal.
| Fund | | Distributable
earnings (loss) | | | Paid-in
Capital | |
| Simplify Propel Opportunities ETF | | $ | (6,084,313 | ) | | $ | 6,084,313 | |
Simplify Exchange Traded Funds
Notes to Financial Statements (Continued)
June 30, 2024
The tax character of dividends and distributions declared for the year ended June 30, 2024 were as follows:
Fund | | Ordinary
Income* | | Long-Term
Capital Gains | | Return of
Capital | |
| Simplify Propel Opportunities ETF | | $ | — | | $ | — | | $ | 14,533,703 | |
| * | For tax purposes short-term capital gain distributions are considered ordinary income distributions. |
The tax character of dividends and distributions declared for the period ended June 30, 2023 were as follows:
| Fund | | Ordinary
Income* | | Long-Term
Capital Gains | | Return of Capital | |
| Simplify Propel Opportunities ETF | | $ | 3,107,601 | | $ | — | | $ | 2,920,001 | |
| * | For tax purposes short-term capital gain distributions are considered ordinary income distributions. |
As of June 30, 2024, the components of accumulated earnings (losses) on a tax basis were as follows:
Fund | |
Undistributed
Ordinary
Income | | |
Undistributed
Long-term
Capital Gains | | |
Temporary
Book/Tax
Differences(a) | | |
Net Unrealized
Appreciation
(Depreciation) | | |
Accumulated
Capital and
Other Losses | | | Post-October/
Late-year
Ordinary Loss
Deferrals | | |
Distributable
earnings (loss) | |
| Simplify Propel Opportunities ETF | | $ | — | | | $ | — | | | $ | — | | | $ | 15,246,306 | | | $ | (10,559,902 | ) | | $ | — | | | $ | 4,686,404 | |
| (a) | The temporary book/tax differences was attributable primarily to dividend payable and straddles deferral. |
At June 30, 2024, gross unrealized appreciation and depreciation of investments owned by the Fund, based on cost for federal income tax purposes were as follows:
Fund | |
Tax Cost | | |
Gross
Unrealized
Appreciation | | |
Gross
Unrealized
Depreciation | | | Net Unrealized
Appreciation
(Depreciation) | |
| Simplify Propel Opportunities ETF | | $ | 81,763,301 | | | $ | 33,056,499 | | | $ | (17,810,193 | ) | | $ | 15,246,306 | |
The differences between book-basis and tax-basis components of net assets are primarily attributable to the tax deferral of losses on wash sales and return of capital basis adjustments from underlying investments.
The Fund utilized capital loss carryforwards to offset taxable gains realized during the year ended June 30, 2024:
| Fund | | Amount | |
| Simplify Propel Opportunities ETF | | $ | — | |
At June 30, 2024, for federal income tax purposes, the Fund had capital loss carryforwards available as shown in the table below, to the extent provided by regulations, to offset future capital gains for an unlimited period. To the extent that these capital loss carryforwards are used to offset future capital gains, it is probable that the capital gains so offset will not be distributed to shareholders.
| Fund | | Short-Term | | | Long-Term | | | Total Amount | |
| Simplify Propel Opportunities ETF | | $ | 8,326,533 | | | $ | 2,233,369 | | | $ | 10,559,902 | |
Certain capital and qualified late year ordinary losses incurred after October 31 and December 31, respectively, and within the current taxable year, are deemed to arise on the first business day of the Fund’s next taxable year. At June 30 2024, the Fund incurred and will elect to defer post-October capital losses and late year ordinary losses:
| Fund | | Capital Post-
October Losses | | | Late-year
ordinary Losses | |
| Simplify Propel Opportunities ETF | | $ | — | | | $ | — | |
Simplify Exchange Traded Funds
Notes to Financial Statements (Continued)
June 30, 2024
7. In-Kind Seeding
Assets contributed to Simplify Propel Opportunities ETF (SURI) were $60,286,654 in cash and securities at fair market of $71,250,025 with unrealized appreciation of $10,963,371, in exchange for 2,850,001 shares at a NAV of $25 on February 7, 2023. On June 21, 2023, additional assets contributed to Simplify Propel Opportunities ETF (SURI) were $29,722,184 in cash and securities at fair market of $37,751,058 with unrealized appreciation of $8,028,874 in exchange for 1,650,000 shares at a NAV of $22.88. The fair value of assets contributed to Simplify Propel Opportunities ETF (SURI) became the new cost basis for financial reporting purposes.
8. Subsequent Events
Management has evaluated subsequent events through the date of issuance of these financial statements and has determined that there are no subsequent events that require adjustment to, or disclosure in, the financial statement.
Simplify Exchange Traded Funds
Report of Independent Registered Public Accounting Firm
To the Shareholders Simplify Propel Opportunities ETF and
Board of Trustees of Simplify Exchange Traded Funds
Opinion on the Financial Statements
We have audited the accompanying statement of assets and liabilities, including the schedule of investments, of Simplify Propel Opportunities ETF (the “Fund”), a series of Simplify Exchange Traded Funds, as of June 30, 2024, the related statement of operations for the year then ended, and the statements of changes in net assets and the financial highlights for the year ended June 30, 2024 and for the period from February 8, 2023 (commencement of operations) through June 30, 2023, and the related notes (collectively referred to as the “financial statements”). In our opinion, the financial statements present fairly, in all material respects, the financial position of the Fund as of June 30, 2024, the results of its operations for the year then ended, and the changes in net assets and the financial highlights for each of the two periods in the period then ended, in conformity with accounting principles generally accepted in the United States of America.
Basis for Opinion
These financial statements are the responsibility of the Fund’s management. Our responsibility is to express an opinion on the Fund’s financial statements based on our audits. We are a public accounting firm registered with the Public Company Accounting Oversight Board (United States) (“PCAOB”) and are required to be independent with respect to the Fund in accordance with the U.S. federal securities laws and the applicable rules and regulations of the Securities and Exchange Commission and the PCAOB.
We conducted our audits in accordance with the standards of the PCAOB. Those standards require that we plan and perform the audit to obtain reasonable assurance about whether the financial statements are free of material misstatement whether due to error or fraud.
Our audits included performing procedures to assess the risks of material misstatement of the financial statements, whether due to error or fraud, and performing procedures that respond to those risks. Such procedures included examining, on a test basis, evidence regarding the amounts and disclosures in the financial statements. Our procedures included confirmation of securities owned as of June 30, 2024, by correspondence with the custodian. Our audits also included evaluating the accounting principles used and significant estimates made by management, as well as evaluating the overall presentation of the financial statements. We believe that our audits provide a reasonable basis for our opinion.
We have served as the auditor of one of more funds advised by Simplify Asset Management, Inc. since 2020.

COHEN & COMPANY, LTD.
Cleveland, Ohio
August 29, 2024
Simplify Exchange Traded Funds
Additional Information (Unaudited)
Discount & Premium Information
Information regarding how often shares of the Fund traded on NYSE Arca at a price above (i.e., at a premium) or below (i.e., at a discount) the NAV of the Fund can be found at www.simplify.us.
Tax Information
Form 1099-DIV and other year-end tax information provide shareholders with actual calendar year amounts that should be included in their tax returns. Shareholders should consult their tax advisors.
The Fund designates the following amounts or, if subsequently determined to be different, the maximum allowable for its year ended June 30, 2024.
Fund | | Qualified
Dividend
Income* | | | Dividends
Received
Deduction | |
| Simplify Propel Opportunities ETF | | | 100.00 | % | | | 100.00 | % |
| * | The above percentage is based on ordinary income dividends paid to shareholders during the Fund’s fiscal year. |
This report must be preceded or accompanied by a prospectus.
(This page intentionally left blank)
(This page intentionally left blank)
Investment Adviser
Simplify Asset Management Inc.
10845 Griffith Peak Drive, 2/F
Las Vegas, NV 89135 | | Investment Sub-Adviser
Propel Bio Management, LLC
1800 Avenue of the Stars
Los Angeles CA 90067 | | Custodian, Administrator & Transfer Agent
The Bank of New York Mellon
240 Greenwich Street New York, NY 10286 |
| | | | | |
Simplify Exchange Traded Funds
10845 Griffith Peak Drive, 2/F
Las Vegas, NV 89135 | | Independent Registered Public Accounting Firm
Cohen & Company Ltd.
1350 Euclid Ave., Suite 800 Cleveland, OH 44115 | | Legal Counsel
Thompson Hine LLP
41 South High Street
Suite 1700 Columbus, OH 43215 |
June 30, 2024
Annual Financial Statements and
Other Important Information
Simplify Exchange Traded Funds
Simplify Volt RoboCar Disruption and Tech ETF (VCAR)

(This page intentionally left blank)
Simplify Exchange Traded Funds
Table of Contents
This report is provided for the general information of shareholders and is not authorized for distribution to prospective investors unless preceded or accompanied by a current prospectus.
Simplify Volt RoboCar Disruption and Tech ETF
Schedule of Investments
June 30, 2024
| | | Shares | | | Value | |
| Common Stocks – 93.7% | | | | | | |
| Communication Services – 8.7% | | | | | | | | |
| Alphabet, Inc., Class C(a) | | | 1,268 | | | $ | 232,576 | |
| Meta Platforms, Inc., Class A | | | 271 | | | | 136,644 | |
| Netflix, Inc.* | | | 83 | | | | 56,015 | |
| Verizon Communications, Inc. | | | 160 | | | | 6,598 | |
| Walt Disney Co. (The) | | | 458 | | | | 45,475 | |
| | | | | | | | 477,308 | |
| Consumer Discretionary – 11.7% | | | | | | | | |
| Amazon.com, Inc.*(a) | | | 1,185 | | | | 229,001 | |
| BYD Co. Ltd., ADR | | | 344 | | | | 20,324 | |
| Lucid Group, Inc.* | | | 1,245 | | | | 3,249 | |
| NIO, Inc., ADR* | | | 1,261 | | | | 5,246 | |
| Rivian Automotive, Inc., Class A* | | | 700 | | | | 9,394 | |
| Sonder Holdings, Inc.* | | | 7,667 | | | | 35,498 | |
| Tesla, Inc.*(a) | | | 1,720 | | | | 340,354 | |
| | | | | | | | 643,066 | |
| Consumer Staples – 1.0% | | | | | | | | |
| Coca-Cola Co. (The) | | | 107 | | | | 6,811 | |
| Costco Wholesale Corp. | | | 43 | | | | 36,550 | |
| PepsiCo, Inc. | | | 36 | | | | 5,937 | |
| Procter & Gamble Co. (The) | | | 36 | | | | 5,937 | |
| | | | | | | | 55,235 | |
| Financials – 8.0% | | | | | | | | |
| American Express Co. | | | 22 | | | | 5,094 | |
| Bank of New York Mellon Corp. (The) | | | 73 | | | | 4,372 | |
| Block, Inc.* | | | 2,947 | | | | 190,052 | |
| Citigroup, Inc. | | | 79 | | | | 5,013 | |
| Fiserv, Inc.* | | | 48 | | | | 7,154 | |
| Lemonade, Inc.* | | | 13,530 | | | | 223,245 | |
| Moody’s Corp. | | | 16 | | | | 6,735 | |
| PayPal Holdings, Inc.* | | | 42 | | | | 2,437 | |
| | | | | | | | 444,102 | |
| Health Care – 0.1% | | | | | | | | |
| Amgen, Inc. | | | 18 | | | | 5,624 | |
| | | | | | | | | |
| Industrials – 0.7% | | | | | | | | |
| Deere & Co. | | | 15 | | | | 5,605 | |
| FANUC Corp., ADR | | | 1,007 | | | | 13,836 | |
| Paychex, Inc. | | | 86 | | | | 10,196 | |
| Sociedad Quimica y Minera de Chile SA, ADR | | | 296 | | | | 12,062 | |
| | | | | | | | 41,699 | |
| Information Technology – 61.9% | | | | | | | | |
| Adobe, Inc.* | | | 8 | | | | 4,444 | |
| Advanced Micro Devices, Inc.*(a) | | | 3,921 | | | | 636,025 | |
| Amkor Technology, Inc. | | | 753 | | | | 30,135 | |
| Analog Devices Inc. | | | 505 | | | | 115,271 | |
| ANSYS, Inc.* | | | 28 | | | | 9,002 | |
| Apple, Inc.(a) | | | 997 | | | | 209,988 | |
| Applied Materials, Inc. | | | 16 | | | | 3,776 | |
| Arbe Robotics Ltd.* | | | 5,678 | | | | 10,845 | |
| ASML Holding NV | | | 250 | | | | 255,683 | |
See Notes to Financial Statements.
Simplify Volt RoboCar Disruption and Tech ETF
Schedule of Investments (Continued)
June 30, 2024
| | | Shares | | | Value | |
| Common Stocks (continued) | | | | | | |
| Information Technology (continued) | | | | | | | | |
| Atlassian Corp., Class A* | | | 3 | | | $ | 531 | |
| Aurora Innovation, Inc.* | | | 9,180 | | | | 25,429 | |
| Autodesk, Inc.* | | | 83 | | | | 20,538 | |
| Cadence Design Systems, Inc.* | | | 18 | | | | 5,540 | |
| Camtek Ltd. | | | 585 | | | | 73,265 | |
| Cisco Systems, Inc. | | | 83 | | | | 3,943 | |
| Cognizant Technology Solutions Corp., Class A. | | | 62 | | | | 4,216 | |
| Crowdstrike Holdings, Inc., Class A* | | | 83 | | | | 31,805 | |
| Datadog, Inc., Class A* | | | 6 | | | | 778 | |
| Fortinet, Inc.* | | | 19 | | | | 1,145 | |
| GLOBALFOUNDRIES, Inc.*(a) | | | 316 | | | | 15,977 | |
| HP, Inc. | | | 289 | | | | 10,121 | |
| Intel Corp. | | | 1,739 | | | | 53,857 | |
| Intuit, Inc. | | | 6 | | | | 3,943 | |
| KLA Corp. | | | 44 | | | | 36,278 | |
| Lam Research Corp. | | | 40 | | | | 42,594 | |
| Marvell Technology, Inc. | | | 322 | | | | 22,508 | |
| Microchip Technology Inc. | | | 169 | | | | 15,464 | |
| Micron Technology, Inc. | | | 391 | | | | 51,428 | |
| Microsoft Corp.(a) | | | 941 | | | | 420,580 | |
| NVIDIA Corp.(a) | | | 9,734 | | | | 1,202,538 | |
| NXP Semiconductors NV | | | 88 | | | | 23,680 | |
| Palo Alto Networks, Inc.* | | | 5 | | | | 1,695 | |
| QUALCOMM, Inc. | | | 36 | | | | 7,171 | |
| Skyworks Solutions, Inc. | | | 43 | | | | 4,583 | |
| Synopsys, Inc.* | | | 49 | | | | 29,158 | |
| Taiwan Semiconductor Manufacturing Co. Ltd., ADR | | | 47 | | | | 8,169 | |
| Texas Instruments, Inc. | | | 60 | | | | 11,672 | |
| VeriSign, Inc.* | | | 51 | | | | 9,068 | |
| | | | | | | | 3,412,843 | |
| Materials – 1.6% | | | | | | | | |
| Albemarle Corp. | | | 97 | | | | 9,265 | |
| BHP Group Ltd., ADR | | | 314 | | | | 17,926 | |
| Glencore PLC, ADR* | | | 1,714 | | | | 19,437 | |
| Rio Tinto PLC, ADR | | | 291 | | | | 19,186 | |
| Talon Metals Corp.* | | | 56,046 | | | | 5,661 | |
| Vale SA, ADR | | | 1,344 | | | | 15,012 | |
| | | | | | | | 86,487 | |
| Total Common Stocks (Cost $3,219,716) | | | | | | | 5,166,364 | |
| | | Number of
Contracts | | | Notional
Amount | | | | |
| Purchased Options – 2.7% | | | | | | | | | | | |
| Calls – Exchange-Traded – 2.3% | | | | | | | | | | | |
| Tesla, Inc., March Strike Price $435, Expires 3/21/25 | | 100 | | | $ | 4,350,000 | | | | 32,750 | |
| Tesla, Inc., June Strike Price $440, Expires 6/18/26 | | 50 | | | | 2,200,000 | | | | 95,375 | |
| | | | | | | | | | | 128,125 | |
See Notes to Financial Statements.
Simplify Volt RoboCar Disruption and Tech ETF
Schedule of Investments (Continued)
June 30, 2024
| | | Number of
Contracts | | | Notional
Amount | | | Value | |
| Purchased Options – 2.7% (continued) | | | | | | | | | | | |
| | | | | | | | | | | | |
| Puts – Exchange-Traded – 0.4% | | | | | | | | | | | |
| S&P 500 Index, July Strike Price $5,200, Expires 7/02/24(b) | | 27 | | | $ | 14,040,000 | | | $ | 338 | |
| S&P 500 Index, July Strike Price $5,250, Expires 7/08/24(b) | | 8 | | | | 4,200,000 | | | | 800 | |
| S&P 500 Index, July Strike Price $4,230, Expires 7/19/24(b) | | 15 | | | | 6,345,000 | | | | 675 | |
| S&P 500 Index, August Strike Price $4,500, Expires 8/16/24(b) | | 33 | | | | 14,850,000 | | | | 10,230 | |
| S&P 500 Index, September Strike Price $4,880, Expires 9/20/24 | | 6 | | | | 2,928,000 | | | | 10,560 | |
| | | | | | | | | | | 22,603 | |
| | | | | | | | | | | | |
| Total Purchased Options (Cost $197,561) | | | | | | | | | | 150,728 | |
| | | Shares | | | | |
| Money Market Funds – 3.8% | | | | | | | | |
| Fidelity Investments Money Market Treasury Only Portfolio - Class I, 5.19%(c) | | | | | | | | |
| (Cost $207,313) | | | 207,313 | | | | 207,313 | |
| | | | | | | | | |
| Total Investments – 100.2% | | | | | | | | |
| (Cost $3,624,590) | | | | | | $ | 5,524,405 | |
| Liabilities in Excess of Other Assets – (0.2)% | | | | | | | (10,953 | ) |
| Net Assets – 100.0% | | | | | | $ | 5,513,452 | |
| | | Number of
Contracts | | | Notional
Amount | | | | |
| Written Options – (0.1)% | | | | | | | | | | | |
| | | | | | | | | | | | |
| Puts – Exchange-Traded – (0.1)% | | | | | | | | | | | |
| S&P 500 Index, July Strike Price $5,000, Expires 7/02/24 | | (27) | | | $ | (13,500,000 | ) | | $ | (202 | ) |
| S&P 500 Index, July Strike Price $5,000, Expires 7/08/24 | | (8) | | | | (4,000,000 | ) | | | (360 | ) |
| S&P 500 Index, July Strike Price $3,975, Expires 7/19/24 | | (15) | | | | (5,962,500 | ) | | | (450 | ) |
| S&P 500 Index, August Strike Price $4,225, Expires 8/16/24 | | (33) | | | | (13,942,500 | ) | | | (6,600 | ) |
| | | | | | | | | | | (7,612 | ) |
| | | | | | | | | | | | |
| Total Written Options (Premiums Received $43,934) | | | | | | | | | $ | (7,612 | ) |
| * | Non Income Producing |
| (a) | Securities with an aggregate market value of $1,580,220 have been pledged as collateral for options as of June 30, 2024. |
| (b) | Held in connection with Written Options. |
| (c) | Rate shown reflects the 7-day yield as of June 30, 2024. |
ADR: American Depositary Receipt
See Notes to Financial Statements.
Simplify Volt RoboCar Disruption and Tech ETF
Schedule of Investments (Continued)
June 30, 2024
Summary of Investment Type††
| | | % of | |
| Investment Categories | | Net Assets | |
| Common Stocks | | | 93.7 | % |
| Purchased Options | | | 2.7 | % |
| Money Market Funds | | | 3.8 | % |
| Total Investments | | | 100.2 | % |
| Liabilities in Excess of Other Assets | | | (0.2 | )% |
| Net Assets | | | 100.0 | % |
| †† | The percentage shown for each investment category is the total value of investments in that category as a percentage of the net assets of the Fund. The table depicts the Fund’s investments but may not represent the Fund’s market exposure to certain derivatives, if any, which are included in Liabilities in Excess of Other Assets. |
See Notes to Financial Statements.
Simplify Exchange Traded Funds
Statement of Assets and Liabilities
June 30, 2024
| | | Simplify Volt | |
| | | RoboCar | |
| | | Disruption and | |
| | | Tech ETF | |
| Assets | | | | |
| Investments, at value | | $ | 5,524,405 | |
| Cash | | | 50 | |
| Receivables: | | | | |
| Dividends | | | 995 | |
| Prepaid expenses | | | 403 | |
| Due from broker | | | 24 | |
| Total assets | | | 5,525,877 | |
| | | | | |
| Liabilities | | | | |
| Payables: | | | | |
| Written options | | | 7,612 | |
| Investment advisory fees | | | 4,215 | |
| Due to broker | | | 598 | |
| Total liabilities | | | 12,425 | |
| Net Assets | | $ | 5,513,452 | |
| | | | | |
| Net Assets Consist of | | | | |
| Paid-in capital | | $ | 8,963,255 | |
| Distributable earnings (loss) | | | (3,449,803 | ) |
| Net Assets | | $ | 5,513,452 | |
| Number of Common Shares outstanding | | | 500,001 | |
| Net Asset Value, offering and redemption price per share | | $ | 11.03 | |
| Investments, at cost | | $ | 3,624,590 | |
| Premiums received | | $ | 43,934 | |
See Notes to Financial Statements.
Simplify Exchange Traded Funds
Statement of Operations
For the Year Ended June 30, 2024
| | | Simplify Volt
RoboCar
Disruption and
Tech ETF | |
| Investment Income | | | | |
| Dividend income* | | $ | 31,403 | |
| | | | | |
| Expenses | | | | |
| Investment advisory fees | | | 44,271 | |
| Interest expense | | | 138 | |
| Total expenses | | | 44,409 | |
| Net investment income (loss) | | | (13,006 | ) |
| | | | | |
| Realized and Unrealized Gain (Loss) | | | | |
| Net realized gain (loss) from: | | | | |
| Investments | | | (766,228 | ) |
| Written options | | | 211,983 | |
| Net realized gain (loss) | | | (554,245 | ) |
| Net change in unrealized appreciation (depreciation) on: | | | | |
| Investments | | | 1,551,168 | |
| Written options | | | 11,082 | |
| Net unrealized gain (loss) | | | 1,562,250 | |
| Net realized and unrealized gain (loss) | | | 1,008,005 | |
| Net Increase (Decrease) in Net Assets Resulting from Operations | | $ | 994,999 | |
| | | | | |
| * Withholding tax | | $ | 688 | |
See Notes to Financial Statements.
Simplify Exchange Traded Funds
Statement of Changes in Net Assets
| | | Simplify Volt RoboCar Disruption
and Tech ETF | |
| | | Year Ended
June 30,
2024 | | | Year Ended
June 30,
2023 | |
| Increase (Decrease) in Net Assets from Operations | | | | | | | | |
| Net investment income (loss) | | $ | (13,006 | ) | | $ | (461 | ) |
| Net realized gain (loss) | | | (554,245 | ) | | | (876,309 | ) |
| Net change in net unrealized appreciation (depreciation) | | | 1,562,250 | | | | 778,746 | |
| Net increase (decrease) in net assets resulting from operations | | | 994,999 | | | | (98,024 | ) |
| | | | | | | | | |
| Fund Shares Transactions | | | | | | | | |
| Proceeds from shares sold | | | 223,867 | | | | 465,708 | |
| Value of shares redeemed | | | — | | | | (623,533 | ) |
| Net increase (decrease) in net assets resulting from fund share transactions | | | 223,867 | | | | (157,825 | ) |
| Total net increase (decrease) in Net Assets | | | 1,218,866 | | | | (255,849 | ) |
| | | | | | | | | |
| Net Assets | | | | | | | | |
| Beginning of period | | | 4,294,586 | | | | 4,550,435 | |
| End of period | | $ | 5,513,452 | | | $ | 4,294,586 | |
| | | | | | | | | |
| Changes in Shares Outstanding | | | | | | | | |
| Shares outstanding, beginning of year | | | 475,001 | | | | 500,420 | |
| Shares sold | | | 25,000 | | | | 50,000 | |
| Shares redeemed | | | — | | | | (75,419 | ) |
| Shares outstanding, end of year | | | 500,001 | | | | 475,001 | |
See Notes to Financial Statements.
Simplify Exchange Traded Funds
Financial Highlights
| Simplify Volt RoboCar Disruption and Tech ETF | | Years Ended June 30 | | | Period Ended
June 30, | |
| Selected Per Share Data | | 2024 | | | 2023 | | | 2022 | | | 2021(a) | |
| Net Asset Value, beginning of period | | $ | 9.04 | | | $ | 9.09 | | | $ | 11.83 | | | $ | 12.50 | |
| Income (loss) from investment operations: | | | | | | | | | | | | | | | |
| Net investment income (loss)(b) | | | (0.03 | ) | | | (0.00 | )(c) | | | 0.06 | | | | (0.04 | ) |
| Net realized and unrealized gain (loss) | | | 2.02 | | | | (0.05 | ) | | | (2.75 | ) | | | (0.63 | ) |
| Total from investment operations | | | 1.99 | | | | (0.05 | ) | | | (2.69 | ) | | | (0.67 | ) |
| Less distributions from: | | | | | | | | | | | | | | | |
| Net investment income | | | — | | | | — | | | | (0.03 | ) | | | — | |
| Return of capital | | | — | | | | — | | | | (0.02 | ) | | | — | |
| Total distributions | | | — | | | | — | | | | (0.05 | ) | | | — | |
| Net Asset Value, end of period | | $ | 11.03 | | | $ | 9.04 | | | $ | 9.09 | | | $ | 11.83 | |
| Total Return (%) | | | 21.96 | | | | (0.54 | ) | | | (22.91 | ) | | | (5.34 | )(d) |
| Ratios to Average Net Assets and Supplemental Data | | | | | | | | | | | | | | | | |
| Net Assets, end of period ($ millions) | | $ | 6 | | | $ | 4 | | | $ | 5 | | | $ | 2 | |
| Ratio of expenses (%) | | | 0.95 | | | | 0.99 | (e) | | | 0.95 | | | | 0.95 | (f)(g) |
| Ratio of net investment income (loss) (%) | | | (0.28 | ) | | | (0.01 | ) | | | 0.46 | | | | (0.71 | )(f) |
| Portfolio turnover rate (%)(h) | | | 19 | | | | 255 | | | | 254 | | | | 20 | (d) |
| (a) | For the period December 29, 2020 (commencement of operations) through June 30, 2021. |
| (b) | Per share numbers have been calculated using the average shares method. |
| (c) | Less than $.005. |
| (d) | Not annualized. |
| (e) | The ratios of expenses to average net assets includes interest expense fees of 0.03%. |
| (f) | Annualized. |
| (g) | The Fund invests in other ETFs and indirectly bears its proportionate shares of fees and expenses incurred by the Underlying Funds in which the Fund is invested. This ratio does not included these indirect fees and expenses. |
| (h) | Excludes the impact of in-kind transactions related to the processing of capital share transactions in Creation Units. |
See Notes to Financial Statements.
Simplify Exchange Traded Funds
Notes to Financial Statements
June 30, 2024
1. Organization
Simplify Exchange Traded Funds (the “Trust”) is registered under the Investment Company Act of 1940, as amended (the “1940 Act”), as an open-end registered management investment company organized as a Delaware statutory trust.
As of June 30, 2024, the Trust consists of twenty eight investment series of exchange-traded funds (“ETFs”) in operation and trading. These financial statements report on the Fund listed below:
Simplify Volt RoboCar Disruption and Tech ETF
The Simplify Volt Robocar Disruption and Tech ETF is a non-diversified Fund of the Trust.
Simplify Asset Management Inc. (the “Adviser”) serves as investment adviser to the Fund and has overall responsibility for the general management and administration of the Fund, subject to the oversight of the Trust’s Board of Trustees (the “Board”).
The Fund offers shares that are listed and traded on the NYSE Arca, Inc. (“NYSE Arca”). Unlike mutual funds, the Fund issues and redeems shares on a continuous basis, at net asset value (“NAV”), only in large specified lots consisting of 25,000 shares, each called a “Creation Unit”, to authorized participants who have entered into agreements with the Fund’s distributor. Shares are not individually redeemable securities of the Fund, and owners of the shares may acquire those shares from the Fund, or tender such shares for redemption to the Fund, in Creation Units only.
| Fund | | Investment objectives |
| Simplify Volt RoboCar Disruption and Tech ETF | | The Fund seeks to provide capital appreciation. |
2. Significant Accounting Policies
The financial statements have been prepared in conformity with U.S. generally accepted accounting principles (“U.S. GAAP”), which require management to make certain estimates and assumptions that affect the reported amounts and disclosures of contingent assets and liabilities at the date of the financial statement and the reported amounts of revenues and expenses during the reporting period. Actual results could differ from those estimates. The Fund is an investment companies and accordingly follow the investment company accounting and reporting guidance of the Financial Accounting Standards Board (“FASB”) Accounting Standards Codification Topic 946 Financial Services – Investment Companies including Accounting Standards Update 2013-08. The following is a summary of significant accounting policies followed by the Fund.
Investment Valuation
The Fund’s investments are valued using procedures approved by the Board and are generally valued using market valuations (Market Approach). A market valuation generally means a valuation (i) obtained from an exchange, a pricing service, or a major market maker (or dealer) or (ii) based on a price quotation or other equivalent indication of value supplied by an exchange, a pricing service, or a major market maker (or dealer). A price obtained from a pricing service based on such pricing service’s valuation matrix may be considered a market valuation. Any assets or liabilities denominated in currencies other than the U.S. dollar are converted into U.S. dollars at the current market rates on the date of valuation as quoted by one or more sources.
If market quotations are not readily available, securities will be valued at their fair market value as determined using the “fair value” procedures approved by the Board. Fair value pricing involves subjective judgments and it is possible that the fair value determined for a security may be materially different than the value that could be realized upon the sale of that security. The fair value prices can differ from market prices when they become available or when a price becomes available. The Board has designated the Adviser as its valuation designee to execute these procedures. The Adviser may also enlist third party consultants such as an audit firm or financial officer of a security issuer on an as-needed basis to assist in determining a security-specific fair value. These securities are either categorized as Level 2 or 3 of the fair value hierarchy depending on the relevant inputs used. The Board reviews the execution of this process and the resultant fair value prices at least quarterly to assure the process produces reliable results.
Equity securities and ETFs are valued at the most recent sale price or official closing price reported on the exchange (U.S. or foreign) or over-the-counter market on which they trade. Securities or ETFs for which no sales are reported are valued at the calculated mean between the most recent bid and asked quotations on the relevant market or, if a mean cannot be determined, at the most recent bid quotation. Equity securities and ETFs are generally categorized as Level 1 of the fair value hierarchy.
Exchange traded options are valued at the mean between the current bid and ask prices on the exchange on which such options are traded. If a mean price is not available, the closing price is used. Exchange trade options are categorized as Level 1. Options with international equity exposure are marked to market using closing prices for the underlying and interpolated option implied volatilities obtained from mid-market prices for options on the same underlying of similar expiries and strike prices. These securities are categorized as Level 2 in the fair value hierarchy.
Money Market Funds are valued at NAV.
The Fund categorizes the inputs to valuation techniques used to value its investments into a disclosure hierarchy consisting of three levels as shown below:
Simplify Exchange Traded Funds
Notes to Financial Statements (Continued)
June 30, 2024
| ● | Level 1 – Quoted prices in active markets for identical assets that the fund has the ability to access. |
| ● | Level 2 – Other significant observable inputs (including quoted prices for similar securities, interest rates, prepayment speeds, credit risk, etc.). |
| ● | Level 3 – Significant unobservable inputs (including the Fund’s own assumptions in determining the fair value of investments). |
The inputs or methodology used for valuing securities are not necessarily an indication of the risk associated with investing in those securities.
The following is a summary of the valuations as of June 30, 2024 for the Fund based upon the three levels defined above:
Simplify Volt RoboCar Disruption and Tech ETF
| Assets | | Level 1 | | | Level 2 | | | Level 3 | | | Total | |
| Common Stocks | | $ | 5,166,364 | | | $ | — | | | $ | — | | | $ | 5,166,364 | |
| Purchased Options | | | 150,728 | | | | — | | | | — | | | | 150,728 | |
| Money Market Funds | | | 207,313 | | | | — | | | | — | | | | 207,313 | |
| TOTAL | | $ | 5,524,405 | | | $ | — | | | $ | — | | | $ | 5,524,405 | |
| Liabilities | | Level 1 | | | Level 2 | | | Level 3 | | | Total | |
| Written Options | | $ | (7,612 | ) | | $ | — | | | $ | — | | | $ | (7,612 | ) |
| TOTAL | | $ | (7,612 | ) | | $ | — | | | $ | — | | | $ | (7,612 | ) |
Cash
Cash consists of cash on deposit with a major financial institution which may exceed federally insured limits.
Investment Transactions and Related Income
For financial reporting purposes, investment transactions are reported on the trade date. However, for daily NAV determination, portfolio securities transactions are reflected no later than in the first calculation on the first business day following trade date. Dividend income is recorded on the ex-dividend date. Interest income is recognized on an accrual basis and includes, where applicable, the amortization of premium or accretion of discount based on effective yield. Gains or losses realized on sales of securities are determined using the specific identification method by comparing the identified cost of the security lot sold with the net sales proceeds. Dividend Income on the Statement of Operations is shown net of any foreign taxes withheld on income from foreign securities, which are provided for in accordance with the Fund’s understanding of the applicable tax rules and regulations.
Income Tax Information and Distributions to Shareholders
It is the Fund’s policy to comply with all requirements of the Internal Revenue Code of 1986, as amended (“the Code”). The Fund intends to qualify for and to elect treatment as a separate Regulated Investment Company (“RIC”) under Subchapter M of the Code. It is the Fund’s policy to pay out dividends from net investment income quarterly. Taxable net realized gains from investment transactions, reduced by capital loss carryforwards, if any, will be declared and distributed to shareholders at least annually. The capital loss carryforward amount, if any, will be available to offset future net capital gains. The Fund may occasionally be required to make supplemental distributions at some other time during the year. The Fund reserves the right to declare special distributions if, in its reasonable discretion, such action is necessary or advisable to preserve the status of the Fund as a RIC or to avoid imposition of income or excise taxes on undistributed income. Dividends and distributions to shareholders, if any, will be recorded on the ex-dividend date. The amount of dividends and distributions from net investment income and net realized capital gains will be determined in accordance with Federal income tax regulations which may differ from U.S. GAAP. These “book/tax” differences are either considered temporary or permanent in nature. To the extent these differences are permanent in nature, (e.g., return of capital and distribution reclassifications), such amounts are reclassified within the composition of net assets based on their federal tax basis treatment; temporary differences (e.g., wash sales and straddles) do not require a reclassification. Dividends and distributions, which exceed earnings and profits for the full year for tax purposes, will be reported as a tax return of capital.
In accordance with U.S. GAAP requirements regarding accounting for uncertainties in income taxes, management has analyzed the Fund’s tax positions expected to be taken on foreign, federal and state income tax returns for all open tax years and has concluded that no provision for income tax is required in the Fund’s financial statement.
The Fund will recognize interest and penalties, if any, related to uncertain tax positions as income tax expense on the Statement of Operation.
Simplify Exchange Traded Funds
Notes to Financial Statements (Continued)
June 30, 2024
3. Derivative Financial Instruments
In the normal course of business, the Fund uses derivative contracts in connection with its proprietary trading activities. Derivative contracts are subject to additional risks that can result in a loss of all or part of an investment. The Fund’s derivative activities and exposure to derivative contracts are classified by the following primary underlying risks: interest rate, credit, foreign exchange, commodity price, and equity price. In addition to its primary underlying risks, the Fund is also subject to additional counterparty risk due to inability of its counterparties to meet the terms of their contracts.
FASB Accounting Standards Codification, Derivatives and Hedging (“ASC 815”) requires enhanced disclosures about the Fund’s use of, and accounting for, derivative instruments and the effect of derivative instruments on the Fund’s financial position and results of operations. Tabular disclosure regarding derivative fair value and gain/loss by contract type (e.g., interest rate contracts, foreign exchange contracts, credit contracts, etc.) is required and derivatives accounted for as hedging instruments under ASC 815 must be disclosed separately from those that do not qualify for hedge accounting. Even though the Fund may use derivatives in an attempt to achieve an economic hedge, the Fund’s derivatives are not accounted for as hedging instruments under ASC 815 because investment companies account for their derivatives at fair value and record any changes in fair value in current period earnings.
Option Contracts
The Fund may purchase and write (i.e., sell) put and call options. Such options may relate to particular securities or stock indices, and may or may not be listed on a domestic or foreign securities exchange and may or may not be issued by the Options Clearing Corporation. Options trading is a highly specialized activity that entails greater than ordinary investment risk. Options may be more volatile than the underlying instruments, and therefore, on a percentage basis, an investment in options may be subject to greater fluctuation than an investment in the underlying instruments themselves.
A call option for a particular security gives the purchaser of the option the right to buy, and the writer (seller) the obligation to sell, the underlying security at the stated exercise price at any time prior to the expiration of the option, regardless of the market price of the security. The premium paid to the writer is in consideration for undertaking the obligation under the option contract. A put option for a particular security gives the purchaser the right to sell the security at the stated exercise price at any time prior to the expiration date of the option, regardless of the market price of the security. Stock index options are put options and call options on various stock indices. In most respects, they are identical to listed options on common stocks. The primary difference between stock options and index options occurs when index options are exercised. In the case of stock options, the underlying security, common stock, is delivered. However, upon the exercise of an index option, settlement does not occur by delivery of the securities comprising the index. The option holder who exercises the index option receives an amount of cash if the closing level of the stock index upon which the option is based is greater than, in the case of a call, or less than, in the case of a put, the exercise price of the option. This amount of cash is equal to the difference between the closing price of the stock index and the exercise price of the option expressed in dollars times a specified multiple. A stock index fluctuates with changes in the market value of the stocks included in the index.
Premiums paid on options purchased and premiums received on options written, as well as the daily fluctuation in market value, are included in investments at value and options written at value, respectively, in the Statements of Assets and Liabilities. When an instrument is purchased or sold through the exercise of an option, the premium is offset against the cost or proceeds of the underlying instrument. When an option expires, a realized gain or loss is recorded in the Statement of Operations to the extent of the premiums received or paid. When an option is closed or sold, a gain or loss is recorded in the Statement of Operations to the extent the cost of the closing transaction exceeds the premiums received or paid. When the Fund writes a call option, such option is typically “covered,” meaning that they hold the underlying instrument subject to being called by the option counterparty. When the Fund writes a put option, cash is segregated in an amount sufficient to cover the obligation. These amounts, which are considered restricted, are included in cash pledged as collateral for options written in the Statements of Assets and Liabilities.
The following table summarizes the value of the Fund’s derivative instruments held as of June 30, 2024 and the related location in the accompanying Statement of Assets and Liabilities, presented by underlying risk exposure:
| Fund | | Asset Derivatives | | | Liability Derivatives | |
| Simplify Volt RoboCar Disruption and Tech ETF | |
| Equity Contracts | | Investments, at value(1) | | $ | 150,728 | | | Investments, at value(1) | | $ | — | |
| Equity Contracts | | Written options | | $ | — | | | Written options | | $ | 7,612 | |
| (1) | Purchased option contracts are included in Investments within the Statement of Assets and Liabilities. |
Simplify Exchange Traded Funds
Notes to Financial Statements (Continued)
June 30, 2024
For the year ended June 30, 2024, realized gains/(losses) and the change in unrealized appreciation/(depreciation) on purchased option contracts (a) by risk type, as disclosed in the Statement of Operations, is as follows:
| Fund | | Risk Type | | | Realized
Gain/(Loss) | | | Change in Unrealized
Appreciation/
(Depreciation) | |
| Simplify Volt RoboCar Disruption and Tech ETF | | Equity | | | $ | (984,279 | ) | | $ | 190,525 | |
| (a) | Purchased option contracts are included in Net Realized Gain (Loss) on Investments within the Statement of Operations. |
For the year ended June 30, 2024, realized gains/(losses) and the change in unrealized appreciation/(depreciation) on written option contracts by risk type, as disclosed in the Statement of Operations, is as follows:
| Fund | | Risk Type | | | Realized
Gain/(Loss) | | | Change in Unrealized
Appreciation/
(Depreciation) | |
| Simplify Volt RoboCar Disruption and Tech ETF | | Equity | | | $ | 211,984 | | | $ | 11,082 | |
For the year ended June 30, 2024, the average fiscal quarter end balances of outstanding derivative financial instruments were as follows:
| Fund | | Purchased Option
Contracts
(Contract Value) | | | Purchased Swaption
Contracts
(Contract Value) | | | Forward Foreign
Currency Contracts (Notional Value) | | | Futures Contracts
(Notional Value) | | | Written Option
Contracts
(Contract Value) | | | Swaps
(Notional Value) | |
| Simplify Volt RoboCar Disruption and Tech ETF | | $ | 123,740 | | | $ | — | | | $ | — | | | $ | — | | | $ | (18,785 | ) | | $ | — | |
4. Investment Advisory Agreement and Other Agreements
The Adviser has overall responsibility for the general management and administration of the Fund, subject to the oversight of the Board. Under an investment advisory agreement between the Trust, on behalf of the Fund, and the Adviser (the “Investment Advisory Agreement”), the Adviser is responsible for arranging sub-advisory, transfer agency, custody, fund administration, and all other non-distribution related services for the Fund to operate.
Volt Equity LLC (the “Sub-Adviser”) serves as investment sub-adviser to the Fund. The Sub-Adviser is responsible for day-to-day management of the Fund, subject to supervision of the Adviser. The Sub-Adviser is paid by the Adviser, not the Fund.
For its investment advisory services to the Fund, the Adviser was entitled to receive a management fee based on the Fund’s average daily net assets, computed and accrued daily and payable monthly, at an annual rate equal to:
| | | Management | |
| Fund | | Fee | |
| Simplify Volt RoboCar Disruption and Tech ETF | | | 0.95 | % |
Under the Investment Advisory Agreement, the Adviser has agreed to pay substantially all the operating expenses of the Fund, excluding interest expenses, taxes, brokerage expenses, Rule 12b-1 fees (if any), acquired fund fees and expenses, expenses incidental to a meeting of the Fund’s shareholders and the Management Fee. In addition to the excluded operating expenses, the Fund also pays non-operating expenses such as litigation and indemnification expenses and other expenses determined to be extraordinary by the Trust.
The Board has adopted a Distribution and Service Plan pursuant to Rule 12b-1 under the 1940 Act. In accordance with its Rule 12b-1 plan, the Fund is authorized to pay an amount up to 0.25% of its average daily net assets each year to finance activities primarily intended to result in the sale of Creation Units of the Fund or the provision of investor services. No Rule 12b-1 fees are currently paid by the Fund and there are no plans to impose these fees. However, in the event Rule 12b-1 fees are charged in the future, they will be paid out of the Fund’s assets, and directly impact the NAV per share of the Fund.
The Bank of New York Mellon, a wholly-owned subsidiary of The Bank of New York Mellon Corporation, serves as Administrator, Custodian, Accounting Agent and Transfer Agent for the Fund.
Foreside Financial Services, LLC (the “Distributor”) serves as the distributor of Creation Units for the Fund on an agency basis. The Distributor does not maintain a secondary market in shares of the Fund. Foreside Fund Officer Services, LLC a related party to the Distributor also serves as the Trust’s Compliance Officer.
Simplify Exchange Traded Funds
Notes to Financial Statements (Continued)
June 30, 2024
A Trustee and certain Officers of the Trust are also employees of the Adviser and/or the Distributor.
5. Investment Transactions
Purchases and sales of securities, other than short-term securities, U.S. Government Securities and in-kind transactions were as follows:
| Fund | | Purchases | | | Sales | |
| Simplify Volt RoboCar Disruption and Tech ETF | | $ | 844,066 | | | $ | 1,435,096 | |
Securities received and delivered in-kind through subscriptions and redemptions were as follows:
| Fund | | Purchases | | | Sales | |
| Simplify Volt RoboCar Disruption and Tech ETF | | $ | 208,697 | | | $ | — | |
6. Fund Share Transactions
The Fund issues and redeems Shares at NAV only in large blocks of 25,000 Shares (each block of Shares is called a “Creation Unit”). Creation Units are issued and redeemed primarily in-kind for securities but may include cash. Individual Shares may only be purchased and sold in secondary market transactions through brokers. Except when aggregated in Creation Units in transactions with Authorized Participants, the Shares are not redeemable securities of the Fund.
Fund Shares are listed and traded on the Exchange on each day that the Exchange is open for business (“Business Day”). The Fund’s Shares may only be purchased and sold on the Exchange through a broker-dealer. Because the Fund’s Shares trade at market prices rather than at its NAV, Shares may trade at a price equal to the NAV, greater than NAV (premium) or less than NAV (discount).
Authorized participants pay a fixed transaction fee of $500 to the shareholder servicing agent when purchasing and redeeming Creation Units of a Fund. The transaction fee is used to defray the costs associated with the issuance and redemption of Creation Units. In addition to the fixed transaction fee, the Fund may charge an additional maximum 3% of the amount invested variable fee for creations and redemptions in cash, to offset brokerage and impact expenses associated with a cash transaction.
7. Federal Income Taxes
For the year ended June 30, 2024, the effect of permanent “book/tax” reclassifications to the components of net assets are included below. These differences are primarily due to redemptions-in-kind, non-deductible excise tax paid, prior year true ups, distributions in excess, return of capital distributions, and controlled foreign corporations income reversal.
| Fund |
| Distributable
earnings (loss) |
|
| Paid-in
Capital |
|
| Simplify Volt RoboCar Disruption and Tech ETF | | $ | 13,006 | | | $ | (13,006 | ) |
There were no distributions declared for the year ended June 30, 2024 and June 30, 2023, respectively.
As of June 30, 2024, the components of accumulated earnings (losses) on a tax basis were as follows:
Fund | | Undistributed
Ordinary
Income | | | Undistributed
Long-term
Capital Gains | | | Temporary
Book/Tax
Differences(a) | | | Net Unrealized
Appreciation
(Depreciation) | | | Accumulated
Capital and
Other Losses | | | Post-October/
Late-year
Ordinary Loss
Deferrals | | | Distributable
earnings (loss) | |
| Simplify Volt RoboCar Disruption and Tech ETF | | $ | — | | | $ | — | | | $ | — | | | $ | 1,577,054 | | | $ | (5,026,857 | ) | | $ | — | | | $ | (3,449,803 | ) |
| (a) | The temporary book/tax differences was attributable primarily to dividend payable and straddles deferral. |
Simplify Exchange Traded Funds
Notes to Financial Statements (Continued)
June 30, 2024
At June 30, 2024, gross unrealized appreciation and depreciation of investments owned by the Fund, based on cost for federal income tax purposes were as follows:
| Fund | | Tax Cost | | | Gross
Unrealized
Appreciation | | | Gross
Unrealized
Depreciation | | | Net Unrealized
Appreciation
(Depreciation) | |
| Simplify Volt RoboCar Disruption and Tech ETF | | $ | 3,947,351 | | | $ | 2,071,790 | | | $ | (494,736 | ) | | $ | 1,577,054 | |
The differences between book-basis and tax-basis components of net assets are primarily attributable to the tax deferral of losses on wash sales, grantor trust adjustments, section 1256 mark-to-market treatment of derivatives and return of capital basis adjustments from underlying investments.
At June 30, 2024, for federal income tax purposes, the Fund had capital loss carryforwards available as shown in the table below, to the extent provided by regulations, to offset future capital gains for an unlimited period. To the extent that these capital loss carryforwards are used to offset future capital gains, it is probable that the capital gains so offset will not be distributed to shareholders.
| Fund | | Short-Term | | | Long-Term | | | Total Amount | |
| Simplify Volt RoboCar Disruption and Tech ETF | | $ | 4,463,092 | | | $ | 563,765 | | | $ | 5,026,857 | |
8. Subsequent Events
Management has evaluated subsequent events through the date of issuance of these financial statements and has determined that there are no subsequent events that require adjustment to, or disclosure in, the financial statement.
Simplify Exchange Traded Funds
Report of Independent Registered Public Accounting Firm
To the Shareholders of Simplify Volt RoboCar Disruption and Tech ETF and
Board of Trustees of Simplify Exchange Traded Funds
Opinion on the Financial Statements
We have audited the accompanying statement of assets and liabilities, including the schedule of investments, of Simplify Volt RoboCar Disruption and Tech ETF (the “Fund”), a series of Simplify Exchange Traded Funds, as of June 30, 2024, the related statement of operations for the year then ended, the statements of changes in net assets for each of the two years in the period then ended, the financial highlights for the years ended June 30, 2024, 2023, and 2022, and for the period from December 29, 2020 (commencement of operations) through June 30, 2021, and the related notes (collectively referred to as the “financial statements”). In our opinion, the financial statements present fairly, in all material respects, the financial position of the Fund as of June 30, 2024, the results of its operations for the year then ended, the changes in net assets for each of the two years in the period then ended, and the financial highlights for each of the four periods in the period then ended, in conformity with accounting principles generally accepted in the United States of America.
Basis for Opinion
These financial statements are the responsibility of the Fund’s management. Our responsibility is to express an opinion on the Fund’s financial statements based on our audits. We are a public accounting firm registered with the Public Company Accounting Oversight Board (United States) (“PCAOB”) and are required to be independent with respect to the Fund in accordance with the U.S. federal securities laws and the applicable rules and regulations of the Securities and Exchange Commission and the PCAOB.
We conducted our audits in accordance with the standards of the PCAOB. Those standards require that we plan and perform the audit to obtain reasonable assurance about whether the financial statements are free of material misstatement whether due to error or fraud.
Our audits included performing procedures to assess the risks of material misstatement of the financial statements, whether due to error or fraud, and performing procedures that respond to those risks. Such procedures included examining, on a test basis, evidence regarding the amounts and disclosures in the financial statements. Our procedures included confirmation of securities owned as of June 30, 2024, by correspondence with the custodian and brokers. Our audits also included evaluating the accounting principles used and significant estimates made by management, as well as evaluating the overall presentation of the financial statements. We believe that our audits provide a reasonable basis for our opinion.
We have served as the auditor of one of more funds advised by Simplify Asset Management, Inc. since 2020.

COHEN & COMPANY, LTD.
Cleveland, Ohio
August 29, 2024
Simplify Exchange Traded Funds
Additional Information (Unaudited)
Discount & Premium Information
Information regarding how often shares of the Fund traded on NYSE Arca, at a price above (i.e., at a premium) or below (i.e., at a discount) the NAV of the Fund can be found at www.simplify.us.
Tax Information
Form 1099-DIV and other year-end tax information provide shareholders with actual calendar year amounts that should be included in their tax returns. Shareholders should consult their tax advisors.
The Fund designates the following amounts or, if subsequently determined to be different, the maximum allowable for its year ended June 30, 2024.
Fund | | Qualified
Dividend
Income* | | | Dividends
Received
Deduction | |
| Simplify Volt RoboCar Disruption and Tech ETF | | | 00.00 | % | | | 00.00 | % |
| * | The above percentage is based on ordinary income dividends paid to shareholders during the Fund’s fiscal year. |
This report must be preceded or accompanied by a prospectus.
Investment Adviser
Simplify Asset Management Inc.
10845 Griffith Peak Drive, 2/F
Las Vegas, NV 89135 |
| Investment Sub-Adviser
Volt Equity LLC
2193 Fillmore St
San Francisco, CA 94115 |
| Custodian, Administrator & Transfer Agent
The Bank of New York Mellon
240 Greenwich Street
New York, NY 10286 |
| | | | |
Simplify Exchange Traded Funds
10845 Griffith Peak Drive, 2/F
Las Vegas, NV 89135 |
| Independent Registered Public Accounting Firm
Cohen & Company Ltd.
1350 Euclid Ave., Suite 800
Cleveland, OH 44115 |
| Legal Counsel
Thompson Hine LLP
41 South High Street
Suite 1700
Columbus, OH 43215 |
June 30, 2024
Annual Financial Statements and
Other Important Information
Simplify Exchange Traded Funds
Simplify US Equity PLUS Convexity ETF (SPYC)
Simplify US Equity PLUS Downside Convexity ETF (SPD)
Simplify US Equity PLUS Upside Convexity ETF (SPUC)

(This page intentionally left blank)
Simplify Exchange Traded Funds
Table of Contents
This report is provided for the general information of shareholders and is not authorized for distribution to prospective investors unless preceded or accompanied by a current prospectus.
Simplify US Equity PLUS Convexity ETF
Schedule of Investments
June 30, 2024
| | | Shares | | | Value | |
| Exchange-Traded Funds – 98.3% | | | | | | | | |
| Equity Funds – 98.3% | | | | | | | | |
| iShares Core S&P 500 ETF(a)(b) | | | | | | | | |
| (Cost $59,581,768) | | | 131,771 | | | $ | 72,109,044 | |
| | Number of
Contracts | | | Notional
Amount | | | | |
| Purchased Options – 1.8% | | | | | | | | | | | |
| | | | | | | | | | | | |
| Calls – Exchange-Traded – 1.6% | | | | | | | | | | | |
| S&P 500 Index, July Strike Price $5,480, Expires 7/19/24(c) | | 121 | | | $ | 66,308,000 | | | | 650,375 | |
| S&P 500 Index, August Strike Price $5,560, Expires 8/16/24(c) | | 27 | | | | 15,012,000 | | | | 152,820 | |
| S&P 500 Index, September Strike Price $5,680, Expires 9/20/24 | | 77 | | | | 43,736,000 | | | | 375,375 | |
| | | | | | | | | | | 1,178,570 | |
| Puts – Exchange-Traded – 0.2% | | | | | | | | | | | |
| S&P 500 Index, July Strike Price $5,200, Expires 7/02/24(c) | | 346 | | | | 179,920,000 | | | | 4,325 | |
| S&P 500 Index, July Strike Price $5,250, Expires 7/08/24(c) | | 92 | | | | 48,300,000 | | | | 9,200 | |
| S&P 500 Index, July Strike Price $4,230, Expires 7/19/24(c) | | 98 | | | | 41,454,000 | | | | 4,410 | |
| S&P 500 Index, August Strike Price $4,500, Expires 8/16/24(c) | | 221 | | | | 99,450,000 | | | | 68,510 | |
| S&P 500 Index, September Strike Price $4,880, Expires 9/20/24 | | 42 | | | | 20,496,000 | | | | 73,920 | |
| | | | | | | | | | | 160,365 | |
| | | | | | | | | | | | |
| Total Purchased Options (Cost $1,793,931) | | | | | | | | | | 1,338,935 | |
| | | | | | | | | | | | |
| Total Investments – 100.1% | | | | | | | | | | | |
| (Cost $61,375,699) | | | | | | | | | $ | 73,447,979 | |
| Liabilities in Excess of Other Assets – (0.1)% | | | | | | | | | | (91,323 | ) |
| Net Assets – 100.0%. | | | | | | | | | $ | 73,356,656 | |
| | Number of
Contracts | | | Notional
Amount | | | | |
| Written Options – (0.1)% | | | | | | | | | | | |
| | | | | | | | | | | | |
| Calls – Exchange-Traded – (0.0)%† | | | | | | | | | | | |
| S&P 500 Index, July Strike Price $5,750, Expires 7/19/24 | | (121) | | | $ | (69,575,000 | ) | | $ | (7,865 | ) |
| S&P 500 Index, August Strike Price $5,825, Expires 8/16/24 | | (27) | | | | (15,727,500 | ) | | | (9,990 | ) |
| | | | | | | | | | | (17,855 | ) |
| Puts – Exchange-Traded – (0.1)% | | | | | | | | | | | |
| S&P 500 Index, July Strike Price $5,000, Expires 7/02/24 | | (346) | | | $ | (173,000,000 | ) | | $ | (2,595 | ) |
| S&P 500 Index, July Strike Price $5,000, Expires 7/08/24 | | (92) | | | | (46,000,000 | ) | | | (4,140 | ) |
| S&P 500 Index, July Strike Price $3,975, Expires 7/19/24 | | (98) | | | | (38,955,000 | ) | | | (2,940 | ) |
| S&P 500 Index, August Strike Price $4,225, Expires 8/16/24 | | (221) | | | | (93,372,500 | ) | | | (44,200 | ) |
| | | | | | | | | | | (53,875 | ) |
| | | | | | | | | | | | |
| Total Written Options (Premiums Received $478,014) | | | | | | | | | $ | (71,730 | ) |
| † | Less than 0.05% |
| (a) | A copy of the security’s annual report to shareholders may be obtained without charge at www.ishares.com. |
| (b) | Securities with an aggregate market value of $54,723,000 have been pledged as collateral for options as of June 30, 2024. |
| (c) | Held in connection with Written Options. |
See Notes to Financial Statements.
Simplify US Equity PLUS Convexity ETF
Schedule of Investments (Continued)
June 30, 2024
Summary of Investment Type††
| Investment Categories |
| % of Net Assets |
|
| Exchange-Traded Funds | | | 98.3 | % |
| Purchased Options | | | 1.8 | % |
| Total Investments | | | 100.1 | % |
| Liabilities in Excess of Other Assets | | | (0.1 | )% |
| Net Assets | | | 100.0 | % |
| †† | The percentage shown for each investment category is the total value of investments in that category as a percentage of the net assets of the Fund. The table depicts the Fund’s investments but may not represent the Fund’s market exposure to certain derivatives, if any, which are included in Liabilities in Excess of Other Assets. |
See Notes to Financial Statements.
Simplify US Equity PLUS Downside Convexity ETF
Schedule of Investments
June 30, 2024
| | | Shares | | | Value | |
| Exchange-Traded Funds – 99.8% | | | | | | | | |
| Equity Funds – 99.8% | | | | | | | | |
| iShares Core S&P 500 ETF(a)(b) | | | | | | | | |
| (Cost $99,749,145) | | | 208,115 | | | $ | 113,886,772 | |
| | Number of
Contracts | | | Notional
Amount | | | | |
| Purchased Options – 0.4% | | | | | | | | | |
| | | | | | | | | | |
| Puts – Exchange-Traded – 0.4% | | | | | | | | | |
| S&P 500 Index, July Strike Price $5,200, Expires 7/02/24(c) | | 534 | | | $ | 277,680,000 | | | | 6,675 | |
| S&P 500 Index, July Strike Price $5,250, Expires 7/08/24(c) | | 144 | | | | 75,600,000 | | | | 14,400 | |
| S&P 500 Index, July Strike Price $4,230, Expires 7/19/24(c) | | 312 | | | | 131,976,000 | | | | 14,040 | |
| S&P 500 Index, August Strike Price $4,500, Expires 8/16/24(c) | | 704 | | | | 316,800,000 | | | | 218,240 | |
| S&P 500 Index, September Strike Price $4,880, Expires 9/20/24 | | 127 | | | | 61,976,000 | | | | 223,520 | |
| | | | | | | | | | | 476,875 | |
| | | | | | | | | | | | |
| Total Purchased Options (Cost $1,716,617) | | | | | | | | | | 476,875 | |
| | | Shares | | | | |
| Money Market Funds – 0.0%† | | | | | | | | |
| Fidelity Investments Money Market Treasury Only Portfolio - Class I, 5.19%(d) | | | | | | | | |
| (Cost $28,358) | | | 28,358 | | | | 28,358 | |
| | | | | | | | | |
| Total Investments – 100.2% | | | | | | | | |
| (Cost $101,494,120) | | | | | | $ | 114,392,005 | |
| Liabilities in Excess of Other Assets – (0.2)% | | | | | | | (206,032 | ) |
| Net Assets – 100.0% | | | | | | $ | 114,185,973 | |
| | Number of
Contracts | | | Notional
Amount | | | | |
| Written Options – (0.1)% | | | | | | | | | | | |
| | | | | | | | | | | | |
| Puts – Exchange-Traded – (0.1)% | | | | | | | | | | | |
| S&P 500 Index, July Strike Price $5,000, Expires 7/02/24 | | (534) | | | $ | (267,000,000 | ) | | $ | (4,005 | ) |
| S&P 500 Index, July Strike Price $5,000, Expires 7/08/24 | | (144) | | | | (72,000,000 | ) | | | (6,480 | ) |
| S&P 500 Index, July Strike Price $3,975, Expires 7/19/24 | | (312) | | | | (124,020,000 | ) | | | (9,360 | ) |
| S&P 500 Index, August Strike Price $4,225, Expires 8/16/24 | | (704) | | | | (297,440,000 | ) | | | (140,800 | ) |
| | | | | | | | | | | (160,645 | ) |
| | | | | | | | | | | | |
| Total Written Options (Premiums Received $902,767) | | | | | | | | | $ | (160,645 | ) |
| † | Less than 0.05% |
| (a) | A copy of the security’s annual report to shareholders may be obtained without charge at www.ishares.com. |
| (b) | Securities with an aggregate market value of $32,833,800 have been pledged as collateral for options as of June 30, 2024. |
| (c) | Held in connection with Written Options. |
| (d) | Rate shown reflects the 7-day yield as of June 30, 2024. |
See Notes to Financial Statements.
Simplify US Equity PLUS Downside Convexity ETF
Schedule of Investments (Continued)
June 30, 2024
Summary of Investment Type††
| Investment Categories |
| % of
Net Assets |
|
| Exchange-Traded Funds | | | 99.8 | % |
| Purchased Options | | | 0.4 | % |
| Money Market Funds | | | 0.0 | %† |
| Total Investments | | | 100.2 | % |
| Liabilities in Excess of Other Assets | | | (0.2 | )% |
| Net Assets | | | 100.0 | % |
| †† | The percentage shown for each investment category is the total value of investments in that category as a percentage of the net assets of the Fund. The table depicts the Fund’s investments but may not represent the Fund’s market exposure to certain derivatives, if any, which are included in Liabilities in Excess of Other Assets. |
See Notes to Financial Statements.
Simplify US Equity PLUS Upside Convexity ETF
Schedule of Investments
June 30, 2024
| | | Shares | | | Value | |
| Exchange-Traded Funds – 97.3% | | | | | | | | |
| Equity Funds – 97.3% | | | | | | | | |
| iShares Core S&P 500 ETF(a)(b) | | | | | | | | |
| (Cost $7,040,693) | | | 14,329 | | | $ | 7,841,259 | |
| | Number of
Contracts | | | Notional
Amount | | | | |
| Purchased Options – 2.6% | | | | | | | | | | | |
| | | | | | | | | | | | |
| Calls – Exchange-Traded – 2.6% | | | | | | | | | | | |
| S&P 500 Index, July Strike Price $5,480, Expires 7/19/24(c) | | 20 | | | $ | 10,960,000 | | | | 107,500 | |
| S&P 500 Index, August Strike Price $5,560, Expires 8/16/24(c) | | 5 | | | | 2,780,000 | | | | 28,300 | |
| S&P 500 Index, September Strike Price $5,680, Expires 9/20/24 | | 15 | | | | 8,520,000 | | | | 73,125 | |
| | | | | | | | | | | 208,925 | |
| Puts – Exchange-Traded – 0.0%† | | | | | | | | | | | |
| S&P 500 Index, July Strike Price $5,200, Expires 7/02/24(c) | | 39 | | | | 20,280,000 | | | | 487 | |
| S&P 500 Index, July Strike Price $5,250, Expires 7/08/24(c) | | 11 | | | | 5,775,000 | | | | 1,100 | |
| | | | | | | | | | | 1,587 | |
| | | | | | | | | | | | |
| Total Purchased Options (Cost $220,498) | | | | | | | | | | 210,512 | |
| | | Shares | | | | |
| Money Market Funds – 0.2% | | | | | | |
| Fidelity Investments Money Market Treasury Only Portfolio - Class I, 5.19%(d) | | | | | | | | |
| (Cost $18,647) | | | 18,647 | | | | 18,647 | |
| | | | | | | | | |
| Total Investments – 100.1% | | | | | | | | |
| (Cost $7,279,838) | | | | | | $ | 8,070,418 | |
| Liabilities in Excess of Other Assets – (0.1)% | | | | | | | (6,467 | ) |
| Net Assets – 100.0% | | | | | | $ | 8,063,951 | |
| | Number of
Contracts | | | Notional
Amount | | | | |
| Written Options – (0.0)%† | | | | | | | | | | | |
| | | | | | | | | | | | |
| Calls – Exchange-Traded – (0.0)%† | | | | | | | | | | | |
| S&P 500 Index, July Strike Price $5,750, Expires 7/19/24 | | (20) | | | $ | (11,500,000 | ) | | $ | (1,300 | ) |
| S&P 500 Index, August Strike Price $5,825, Expires 8/16/24 | | (5) | | | | (2,912,500 | ) | | | (1,850 | ) |
| | | | | | | | | | | (3,150 | ) |
| Puts – Exchange-Traded – (0.0)%† | | | | | | | | | | | |
| S&P 500 Index, July Strike Price $5,000, Expires 7/02/24 | | (39) | | | $ | (19,500,000 | ) | | $ | (292 | ) |
| S&P 500 Index, July Strike Price $5,000, Expires 7/08/24 | | (11) | | | | (5,500,000 | ) | | | (495 | ) |
| | | | | | | | | | | (787 | ) |
| | | | | | | | | | | | |
| Total Written Options (Premiums Received $33,267) | | | | | | | | | $ | (3,937 | ) |
| † | Less than 0.05% |
| (a) | A copy of the security’s annual report to shareholders may be obtained without charge at www.ishares.com. |
| (b) | Securities with an aggregate market value of $3,556,995 have been pledged as collateral for options as of June 30, 2024. |
| (c) | Held in connection with Written Options. |
| (d) | Rate shown reflects the 7-day yield as of June 30, 2024. |
See Notes to Financial Statements.
Simplify US Equity PLUS Upside Convexity ETF
Schedule of Investments (Continued)
June 30, 2024
Summary of Investment Type††
Investment Categories | | % of
Net Assets | |
| Exchange-Traded Funds. | | | 97.3 | % |
| Purchased Options | | | 2.6 | % |
| Money Market Funds. | | | 0.2 | % |
| Total Investments | | | 100.1 | % |
| Liabilities in Excess of Other Assets | | | (0.1 | )% |
| Net Assets | | | 100.0 | % |
| †† | The percentage shown for each investment category is the total value of investments in that category as a percentage of the net assets of the Fund. The table depicts the Fund’s investments but may not represent the Fund’s market exposure to certain derivatives, if any, which are included in Liabilities in Excess of Other Assets. |
See Notes to Financial Statements.
Simplify Exchange Traded Funds
Statements of Assets and Liabilities
June 30, 2024
| | | Simplify US
Equity PLUS
Convexity ETF | | | Simplify US
Equity PLUS
Downside
Convexity ETF | | | Simplify US
Equity PLUS
Upside
Convexity ETF | |
| Assets | | | | | | | | | | | | |
| Investments, at value | | $ | 73,447,979 | | | $ | 114,392,005 | | | $ | 8,070,418 | |
| Receivables: | | | | | | | | | | | | |
| Securities sold | | | 9,850 | | | | 807,711 | | | | — | |
| Interest | | | 1,263 | | | | 185 | | | | 445 | |
| Prepaid expenses | | | 173 | | | | 2,224 | | | | 58 | |
| Due from broker | | | 18 | | | | 171 | | | | — | |
| Total assets | | | 73,459,283 | | | | 115,202,296 | | | | 8,070,921 | |
| | | | | | | | | | | | | |
| Liabilities | | | | | | | | | | | | |
| Due to custodian | | | 1,663 | | | | — | | | | — | |
| Payables: | | | | | | | | | | | | |
| Written options | | | 71,730 | | | | 160,645 | | | | 3,937 | |
| Investment advisory fees | | | 29,234 | | | | 45,849 | | | | 3,033 | |
| Capital shares | | | — | | | | 809,829 | | | | — | |
| Total liabilities | | | 102,627 | | | | 1,016,323 | | | | 6,970 | |
| Net Assets | | $ | 73,356,656 | | | $ | 114,185,973 | | | $ | 8,063,951 | |
| | | | | | | | | | | | | |
| Net Assets Consist of | | | | | | | | | | | | |
| Paid-in capital | | $ | 66,437,545 | | | $ | 155,542,977 | | | $ | 7,751,795 | |
| Distributable earnings (loss) | | | 6,919,111 | | | | (41,357,004 | ) | | | 312,156 | |
| Net Assets | | $ | 73,356,656 | | | $ | 114,185,973 | | | $ | 8,063,951 | |
| Number of Common Shares outstanding | | | 2,025,001 | | | | 3,525,001 | | | | 200,001 | |
| Net Asset Value, offering and redemption price per share | | $ | 36.23 | | | $ | 32.39 | | | $ | 40.32 | |
| Investments, at cost | | $ | 61,375,699 | | | $ | 101,494,120 | | | $ | 7,279,838 | |
| Premiums received | | $ | 478,014 | | | $ | 902,767 | | | $ | 33,267 | |
See Notes to Financial Statements.
Simplify Exchange Traded Funds
Statements of Operations
For the Year Ended June 30, 2024
| | | Simplify US
Equity PLUS
Convexity ETF | | | Simplify US
Equity PLUS
Downside
Convexity ETF | | | Simplify US
Equity PLUS
Upside
Convexity ETF | |
| Investment Income | | | | | | | | | |
| Dividend income | | $ | 983,383 | | | $ | 1,424,166 | | | $ | 91,962 | |
| | | | | | | | | | | | | |
| Expenses | | | | | | | | | | | | |
| Investment advisory fees | | | 333,776 | | | | 478,744 | | | | 32,773 | |
| Interest expense | | | 2,154 | | | | 3,156 | | | | 262 | |
| Other expenses | | | 27 | | | | — | | | | — | |
| Total expenses | | | 335,957 | | | | 481,900 | | | | 33,035 | |
| Less fees waived: | | | | | | | | | | | | |
| Waiver | | | (84,356 | ) | | | (121,249 | ) | | | (9,110 | ) |
| Net expenses | | | 251,601 | | | | 360,651 | | | | 23,925 | |
| Net investment income (loss) | | | 731,782 | | | | 1,063,515 | | | | 68,037 | |
| | | | | | | | | | | | | |
| Realized and Unrealized Gain (Loss) | | | | | | | | | | | | |
| Net realized gain (loss) from: | | | | | | | | | | | | |
| Investments | | | (203,523 | ) | | | (7,718,006 | ) | | | 459,827 | |
| In-kind redemptions | | | 3,725,546 | | | | (66,284 | ) | | | 138,135 | |
| Written options | | | 1,686,921 | | | | 4,723,518 | | | | 10,341 | |
| Net realized gain (loss) | | | 5,208,944 | | | | (3,060,772 | ) | | | 608,303 | |
| Net change in unrealized appreciation (depreciation) on: | | | | | | | | | | | | |
| Investments | | | 9,141,275 | | | | 17,765,311 | | | | 863,581 | |
| Written options | | | 197,149 | | | | 40,650 | | | | 38,603 | |
| Net unrealized gain (loss) | | | 9,338,424 | | | | 17,805,961 | | | | 902,184 | |
| Net realized and unrealized gain (loss) | | | 14,547,368 | | | | 14,745,189 | | | | 1,510,487 | |
| Net Increase (Decrease) in Net Assets Resulting from Operations | | $ | 15,279,150 | | | $ | 15,808,704 | | | $ | 1,578,524 | |
See Notes to Financial Statements.
Simplify Exchange Traded Funds
Statements of Changes in Net Assets
| | | Simplify US Equity PLUS
Convexity ETF | | | Simplify US Equity PLUS
Downside Convexity ETF | |
| | | Year Ended
June 30,
2024 | | | Year Ended
June 30,
2023 | | | Year Ended
June 30,
2024 | | | Year Ended
June 30,
2023 | |
| Increase (Decrease) in Net Assets from Operations | | | | | | | | | | | | | | | | |
| Net investment income (loss) | | $ | 731,782 | | | $ | 891,070 | | | $ | 1,063,515 | | | $ | 3,188,274 | |
| Net realized gain (loss) | | | 5,208,944 | | | | (5,029,008 | ) | | | (3,060,772 | ) | | | (70,678,125 | ) |
| Net change in net unrealized appreciation (depreciation) | | | 9,338,424 | | | | 11,611,947 | | | | 17,805,961 | | | | 57,383,667 | |
| Net increase (decrease) in net assets resulting from operations | | | 15,279,150 | | | | 7,474,009 | | | | 15,808,704 | | | | (10,106,184 | ) |
| | | | | | | | | | | | | | | | | |
| Distributions to Shareholders from: | | | | | | | | | | | | | | | | |
| Distributions | | | (874,943 | ) | | | (890,883 | ) | | | (1,085,380 | ) | | | (3,166,409 | ) |
| Return of capital | | | — | | | | — | | | | (407,750 | ) | | | — | |
| Total distributions | | | (874,943 | ) | | | (890,883 | ) | | | (1,493,130 | ) | | | (3,166,409 | ) |
| | | | | | | | | | | | | | | | | |
| Fund Shares Transactions | | | | | | | | | | | | | | | | |
| Proceeds from shares sold | | | 11,796,266 | | | | 67,604,172 | | | | 50,366,819 | | | | 92,541,300 | |
| Value of shares redeemed | | | (26,258,350 | ) | | | (62,025,267 | ) | | | (66,111,033 | ) | | | (408,472,788 | ) |
| Net increase (decrease) in net assets resulting from fund share transactions | | | (14,462,084 | ) | | | 5,578,905 | | | | (15,744,214 | ) | | | (315,931,488 | ) |
| Total net increase (decrease) in Net Assets | | | (57,877 | ) | | | 12,162,031 | | | | (1,428,640 | ) | | | (329,204,081 | ) |
| | | | | | | | | | | | | | | | | |
| Net Assets | | | | | | | | | | | | | | | | |
| Beginning of period | | | 73,414,533 | | | | 61,252,502 | | | | 115,614,613 | | | | 444,818,694 | |
| End of period | | $ | 73,356,656 | | | $ | 73,414,533 | | | $ | 114,185,973 | | | $ | 115,614,613 | |
| | | | | | | | | | | | | | | | | |
| Changes in Shares Outstanding | | | | | | | | | | | | | | | | |
| Shares outstanding, beginning of period | | | 2,525,001 | | | | 2,304,000 | | | | 4,225,001 | | | | 16,800,001 | |
| Shares sold | | | 350,000 | | | | 2,550,000 | | | | 1,700,000 | | | | 3,450,000 | |
| Shares redeemed | | | (850,000 | ) | | | (2,328,999 | ) | | | (2,400,000 | ) | | | (16,025,000 | ) |
| Shares outstanding, end of period | | | 2,025,001 | | | | 2,525,001 | | | | 3,525,001 | | | | 4,225,001 | |
See Notes to Financial Statements.
Simplify Exchange Traded Funds
Statements of Changes in Net Assets (Continued)
| | | Simplify US Equity PLUS Upside
Convexity ETF | |
| | | Year Ended | | | Year Ended | |
| | | June 30,
2024 | | | June 30,
2023 | |
| Increase (Decrease) in Net Assets from Operations | | | | | | | | |
| Net investment income (loss) | | $ | 68,037 | | | $ | 158,690 | |
| Net realized gain (loss) | | | 608,303 | | | | (613,652 | ) |
| Net change in net unrealized appreciation (depreciation) | | | 902,184 | | | | 1,807,682 | |
| Net increase (decrease) in net assets resulting from operations | | | 1,578,524 | | | | 1,352,720 | |
| | | | | | | | | |
| Distributions | | | (81,193 | ) | | | (113,758 | ) |
| | | | | | | | | |
| Fund Shares Transactions | | | | | | | | |
| Proceeds from shares sold | | | 3,672,870 | | | | 3,357,979 | |
| Value of shares redeemed | | | (5,534,399 | ) | | | (8,136,895 | ) |
| Net increase (decrease) in net assets resulting from fund share transactions | | | (1,861,529 | ) | | | (4,778,916 | ) |
| Total net increase (decrease) in Net Assets | | | (364,198 | ) | | | (3,539,954 | ) |
| | | | | | | | | |
| Net Assets | | | | | | | | |
| Beginning of period | | | 8,428,149 | | | | 11,968,103 | |
| End of period | | $ | 8,063,951 | | | $ | 8,428,149 | |
| | | | | | | | | |
| Changes in Shares Outstanding | | | | | | | | |
| Shares outstanding, beginning of period | | | 275,001 | | | | 450,001 | |
| Shares sold | | | 100,000 | | | | 125,000 | |
| Shares redeemed | | | (175,000 | ) | | | (300,000 | ) |
| Shares outstanding, end of period | | | 200,001 | | | | 275,001 | |
See Notes to Financial Statements.
Simplify Exchange Traded Funds
Financial Highlights
| Simplify US Equity PLUS Convexity ETF | | Years Ended June 30 | | | Period Ended
June 30, | |
| Selected Per Share Data | | 2024 | | | 2023 | | | 2022 | | | 2021(a) | |
| Net Asset Value, beginning of period | | $ | 29.08 | | | $ | 26.59 | | | $ | 30.63 | | | $ | 25.00 | |
| Income (loss) from investment operations: | | | | | | | | | | | | | | | | |
| Net investment income (loss)(b) | | | 0.34 | | | | 0.36 | | | | 0.33 | | | | 0.31 | |
| Net realized and unrealized gain (loss) | | | 7.22 | | | | 2.46 | | | | (3.85 | ) | | | 5.59 | |
| Total from investment operations | | | 7.56 | | | | 2.82 | | | | (3.52 | ) | | | 5.90 | |
| Less distributions from: | | | | | | | | | | | | | | | | |
| Net investment income | | | (0.41 | ) | | | (0.33 | ) | | | (0.52 | ) | | | (0.27 | ) |
| Total distributions | | | (0.41 | ) | | | (0.33 | ) | | | (0.52 | ) | | | (0.27 | ) |
| Net Asset Value, end of period | | $ | 36.23 | | | $ | 29.08 | | | $ | 26.59 | | | $ | 30.63 | |
| Total Return (%) | | | 26.21 | | | | 10.67 | | | | (11.68 | ) | | | 23.68 | (c) |
| Ratios to Average Net Assets and Supplemental Data | | | | | | | | | | | | | | | | |
| Net Assets, end of period ($ millions) | | $ | 73 | | | $ | 73 | | | $ | 61 | | | $ | 89 | |
| Ratio of expenses before fee waiver (%) | | | 0.50 | (d) | | | 0.53 | (d)(e) | | | 0.50 | (d) | | | 0.50 | (d)(f) |
| Ratio of expenses after fee waiver (%) | | | 0.38 | (d) | | | 0.28 | (d)(e) | | | 0.25 | (d) | | | 0.25 | (d)(f) |
| Ratio of net investment income (loss) (%) | | | 1.10 | | | | 1.35 | | | | 1.04 | | | | 1.35 | (f) |
| Portfolio turnover rate (%)(g) | | | 3 | | | | 1 | | | | 3 | | | | 6 | (c) |
| Simplify US Equity PLUS Downside Convexity ETF | | Years Ended June 30 | Period Ended
June 30, | |
| Selected Per Share Data | | 2024 | | | 2023 | | | 2022 | | | 2021(a) | |
| Net Asset Value, beginning of period | | $ | 27.36 | | | $ | 26.48 | | | $ | 30.26 | | | $ | 25.00 | |
| Income (loss) from investment operations: | | | | | | | | | | | | | | | | |
| Net investment income (loss)(b) | | | 0.32 | | | | 0.30 | | | | 0.35 | | | | 0.36 | |
| Net realized and unrealized gain (loss) | | | 5.17 | | | | 1.07 | (h) | | | (3.76 | ) | | | 5.14 | |
| Total from investment operations | | | 5.49 | | | | 1.37 | | | | (3.41 | ) | | | 5.50 | |
| Less distributions from: | | | | | | | | | | | | | | | | |
| Net investment income | | | (0.33 | ) | | | (0.49 | ) | | | (0.37 | ) | | | (0.24 | ) |
| Return of capital | | | (0.13 | ) | | | — | | | | — | | | | — | |
| Total distributions | | | (0.46 | ) | | | (0.49 | ) | | | (0.37 | ) | | | (0.24 | ) |
| Net Asset Value, end of period | | $ | 32.39 | | | $ | 27.36 | | | $ | 26.48 | | | $ | 30.26 | |
| Total Return (%) | | | 20.23 | | | | 5.31 | | | | (11.38 | ) | | | 22.07 | (c) |
| Ratios to Average Net Assets and Supplemental Data | | | | | | | | | | | | | | | | |
| Net Assets, end of period ($ millions) | | $ | 114 | | | $ | 116 | | | $ | 445 | | | $ | 225 | |
| Ratio of expenses before fee waiver (%) | | | 0.50 | (d) | | | 0.62 | (d)(i) | | | 0.50 | (d) | | | 0.50 | (d)(f) |
| Ratio of expenses after fee waiver (%) | | | 0.38 | (d) | | | 0.37 | (d)(i) | | | 0.25 | (d) | | | 0.25 | (d)(f) |
| Ratio of net investment income (loss) (%) | | | 1.11 | | | | 1.15 | | | | 1.14 | | | | 1.53 | (f) |
| Portfolio turnover rate (%)(g) | | | 0 | | | | 0 | | | | 5 | | | | 4 | (c) |
| (a) | For the period September 4, 2020 (commencement of operations) through June 30, 2021. |
| (b) | Per share numbers have been calculated using the average shares method. |
| (c) | Not annualized. |
| (d) | The Fund invests in other ETFs and indirectly bears its proportionate shares of fees and expenses incurred by the Underlying Funds in which the Fund is invested. This ratio does not included these indirect fees and expenses. |
| (e) | The ratios of expenses to average net assets includes interest expense fees of 0.03%. |
| (f) | Annualized. |
| (g) | Excludes the impact of in-kind transactions related to the processing of capital share transactions in Creation Units. |
| (h) | Because of the timing of subscriptions and redemptions in relation to fluctuating markets at value, the amount shown may not agree with the change in aggregate gains and losses. |
| (i) | The ratios of expenses to average net assets includes interest expense fees of 0.12%. |
See Notes to Financial Statements.
Simplify Exchange Traded Funds
Financial Highlights (Continued)
| Simplify US Equity PLUS Upside Convexity ETF | | Years Ended June 30 | | | Period Ended
June 30, | |
| Selected Per Share Data | | 2024 | | | 2023 | | | 2022 | | | 2021(a) | |
| Net Asset Value, beginning of period | | $ | 30.65 | | | $ | 26.60 | | | $ | 30.99 | | | $ | 25.00 | |
| Income (loss) from investment operations: | | | | | | | | | | | | | | | | |
| Net investment income (loss)(b) | | | 0.34 | | | | 0.40 | | | | 0.36 | | | | 0.32 | |
| Net realized and unrealized gain (loss) | | | 9.78 | | | | 3.99 | | | | (3.91 | ) | | | 6.02 | |
| Total from investment operations | | | 10.12 | | | | 4.39 | | | | (3.55 | ) | | | 6.34 | |
| Less distributions from: | | | | | | | | | | | | | | | | |
| Net investment income | | | (0.45 | ) | | | (0.34 | ) | | | (0.43 | ) | | | (0.35 | ) |
| Net realized gains | | | — | | | | — | | | | (0.41 | ) | | | — | |
| Total distributions | | | (0.45 | ) | | | (0.34 | ) | | | (0.84 | ) | | | (0.35 | ) |
| Net Asset Value, end of period | | $ | 40.32 | | | $ | 30.65 | | | $ | 26.60 | | | $ | 30.99 | |
| Total Return (%) | | | 33.28 | | | | 16.65 | | | | (11.99 | ) | | | 25.52 | (c) |
| Ratios to Average Net Assets and Supplemental Data | | | | | | | | | | | | | | | | |
| Net Assets, end of period ($ millions) | | $ | 8 | | | $ | 8 | | | $ | 12 | | | $ | 9 | |
| Ratio of expenses before fee waiver (%) | | | 0.50 | (d) | | | 0.50 | (d) | | | 0.50 | (d) | | | 0.50 | (d)(e) |
| Ratio of expenses after fee waiver (%) | | | 0.37 | (d) | | | 0.25 | (d) | | | 0.25 | (d) | | | 0.25 | (d)(e) |
| Ratio of net investment income (loss) (%) | | | 1.04 | | | | 1.46 | | | | 1.13 | | | | 1.37 | (e) |
| Portfolio turnover rate (%)(f) | | | 4 | | | | 0 | | | | 4 | | | | 5 | (c) |
| (a) | For the period September 4, 2020 (commencement of operations) through June 30, 2021. |
| (b) | Per share numbers have been calculated using the average shares method. |
| (c) | Not annualized. |
| (d) | The Fund invests in other ETFs and indirectly bears its proportionate shares of fees and expenses incurred by the Underlying Funds in which the Fund is invested. This ratio does not included these indirect fees and expenses. |
| (e) | Annualized. |
| (f) | Excludes the impact of in-kind transactions related to the processing of capital share transactions in Creation Units. |
See Notes to Financial Statements.
Simplify Exchange Traded Funds
Notes to Financial Statements
June 30, 2024
1. Organization
Simplify Exchange Traded Funds (the “Trust”) is registered under the Investment Company Act of 1940, as amended (the “1940 Act”), as an open-end registered management investment company organized as a Delaware statutory trust.
As of June 30, 2024, the Trust consists of twenty eight investment series of exchange-traded funds (“ETFs”) (each a “Fund” and collectively, the “Funds”) in operation and trading. These financial statements report on the Funds listed below:
Simplify US Equity PLUS Convexity ETF
Simplify US Equity PLUS Downside Convexity ETF
Simplify US Equity PLUS Upside Convexity ETF
Simplify Asset Management Inc. (the “Adviser”) serves as investment adviser to the Funds and has overall responsibility for the general management and administration of the Funds, subject to the oversight of the Trust’s Board of Trustees (the “Board”).
Each Fund offers shares that are listed and traded on the NYSE Arca, Inc. (“NYSE Arca”). Unlike mutual funds, each Fund issues and redeems shares on a continuous basis, at net asset value (“NAV”), only in large specified lots consisting of 25,000 shares, each called a “Creation Unit”, to authorized participants who have entered into agreements with the Funds’ distributor. Shares are not individually redeemable securities of the Funds, and owners of the shares may acquire those shares from the Funds, or tender such shares for redemption to the Funds, in Creation Units only.
| Fund | | Investment objectives |
| Simplify US Equity PLUS Convexity ETF | | The Fund seeks to provide capital appreciation. |
| Simplify US Equity PLUS Downside Convexity ETF | | The Fund seeks to provide capital appreciation. |
| Simplify US Equity PLUS Upside Convexity ETF | | The Fund seeks to provide capital appreciation. |
2. Significant Accounting Policies
The financial statements have been prepared in conformity with U.S. generally accepted accounting principles (“U.S. GAAP”), which require management to make certain estimates and assumptions that affect the reported amounts and disclosures of contingent assets and liabilities at the date of the financial statement and the reported amounts of revenues and expenses during the reporting period. Actual results could differ from those estimates. The Funds are investment companies and accordingly follow the investment company accounting and reporting guidance of the Financial Accounting Standards Board (“FASB”) Accounting Standards Codification Topic 946 Financial Services – Investment Companies including Accounting Standards Update 2013-08. The following is a summary of significant accounting policies followed by the Funds.
Investment Valuation
Each Fund’s investments are valued using procedures approved by the Board and are generally valued using market valuations (Market Approach). A market valuation generally means a valuation (i) obtained from an exchange, a pricing service, or a major market maker (or dealer) or (ii) based on a price quotation or other equivalent indication of value supplied by an exchange, a pricing service, or a major market maker (or dealer). A price obtained from a pricing service based on such pricing service’s valuation matrix may be considered a market valuation. Any assets or liabilities denominated in currencies other than the U.S. dollar are converted into U.S. dollars at the current market rates on the date of valuation as quoted by one or more sources.
If market quotations are not readily available, securities will be valued at their fair market value as determined using the “fair value” procedures approved by the Board. Fair value pricing involves subjective judgments and it is possible that the fair value determined for a security may be materially different than the value that could be realized upon the sale of that security. The fair value prices can differ from market prices when they become available or when a price becomes available. The Board has designated the Adviser as its valuation designee to execute these procedures to the Adviser, as valuation designee pursuant to Rule 2a-5 under the 1940 Act. The Adviser may also enlist third party consultants such as an audit firm or financial officer of a security issuer on an as-needed basis to assist in determining a security-specific fair value. These securities are either categorized as Level 2 or 3 of the fair value hierarchy depending on the relevant inputs used. The Board reviews the execution of this process and the resultant fair value prices at least quarterly to assure the process produces reliable results.
Equity securities and ETFs are valued at the most recent sale price or official closing price reported on the exchange (U.S. or foreign) or over-the-counter market on which they trade. Securities or ETFs for which no sales are reported are valued at the calculated mean between the most recent bid and asked quotations on the relevant market or, if a mean cannot be determined, at the most recent bid quotation. Equity securities and ETFs are generally categorized as Level 1 of the fair value hierarchy.
Money Market Funds are valued at NAV.
Exchange traded options are valued at the mean between the current bid and ask prices on the exchange on which such options are traded. If a mean price is not available, the closing price is used. Exchange trade options are categorized as Level 1. Options with international equity exposure are marked to market using closing prices for the underlying and interpolated option implied volatilities
Simplify Exchange Traded Funds
Notes to Financial Statements (Continued)
June 30, 2024
obtained from mid-market prices for options on the same underlying of similar expiries and strike prices. These securities are categorized as Level 2 in the fair value hierarchy.
Each Fund categorizes the inputs to valuation techniques used to value its investments into a disclosure hierarchy consisting of three levels as shown below:
| ● | Level 1 – Quoted prices in active markets for identical assets that the funds have the ability to access. |
| ● | Level 2 – Other significant observable inputs (including quoted prices for similar securities, interest rates, prepayment speeds, credit risk, etc.). |
| ● | Level 3 – Significant unobservable inputs (including each Fund’s own assumptions in determining the fair value of investments). |
The inputs or methodology used for valuing securities are not necessarily an indication of the risk associated with investing in those securities.
The following is a summary of the valuations as of June 30, 2024 for each Fund based upon the three levels defined above:
Simplify US Equity PLUS Convexity ETF
| Assets | | Level 1 | | | Level 2 | | | Level 3 | | | Total | |
| Exchange-Traded Funds | | $ | 72,109,044 | | | $ | — | | | $ | — | | | $ | 72,109,044 | |
| Purchased Options | | | 1,338,935 | | | | — | | | | — | | | | 1,338,935 | |
| TOTAL | | $ | 73,447,979 | | | $ | — | | | $ | — | | | $ | 73,447,979 | |
| Liabilities | | Level 1 | | | Level 2 | | | Level 3 | | | Total | |
| Written Options | | $ | (71,730 | ) | | $ | — | | | $ | — | | | $ | (71,730 | ) |
| TOTAL | | $ | (71,730 | ) | | $ | — | | | $ | — | | | $ | (71,730 | ) |
Simplify US Equity PLUS Downside Convexity ETF
| Assets | | Level 1 | | | Level 2 | | | Level 3 | | | Total | |
| Exchange-Traded Funds | | $ | 113,886,772 | | | $ | — | | | $ | — | | | $ | 113,886,772 | |
| Purchased Options | | | 476,875 | | | | — | | | | — | | | | 476,875 | |
| Money Market Funds | | | 28,358 | | | | — | | | | — | | | | 28,358 | |
| TOTAL | | $ | 114,392,005 | | | $ | — | | | $ | — | | | $ | 114,392,005 | |
| Liabilities | | Level 1 | | | Level 2 | | | Level 3 | | | Total | |
| Written Options | | $ | (160,645 | ) | | $ | — | | | $ | — | | | $ | (160,645 | ) |
| TOTAL | | $ | (160,645 | ) | | $ | — | | | $ | — | | | $ | (160,645 | ) |
Simplify US Equity PLUS Upside Convexity ETF
| Assets | | Level 1 | | | Level 2 | | | Level 3 | | | Total | |
| Exchange-Traded Funds | | $ | 7,841,259 | | | $ | — | | | $ | — | | | $ | 7,841,259 | |
| Purchased Options | | | 210,512 | | | | — | | | | — | | | | 210,512 | |
| Money Market Funds | | | 18,647 | | | | — | | | | — | | | | 18,647 | |
| TOTAL | | $ | 8,070,418 | | | $ | — | | | $ | — | | | $ | 8,070,418 | |
| Liabilities | | Level 1 | | | Level 2 | | | Level 3 | | | Total | |
| Written Options | | $ | (3,937 | ) | | $ | — | | | $ | — | | | $ | (3,937 | ) |
| TOTAL | | $ | (3,937 | ) | | $ | — | | | $ | — | | | $ | (3,937 | ) |
Cash
Cash consists of cash on deposit with a major financial institution which may exceed federally insured limits.
Simplify Exchange Traded Funds
Notes to Financial Statements (Continued)
June 30, 2024
Investment Transactions and Related Income
For financial reporting purposes, investment transactions are reported on the trade date. However, for daily NAV determination, portfolio securities transactions are reflected no later than in the first calculation on the first business day following trade date. Dividend income is recorded on the ex-dividend date. Interest income is recognized on an accrual basis and includes, where applicable, the amortization of premium or accretion of discount based on effective yield. Gains or losses realized on sales of securities are determined using the specific identification method by comparing the identified cost of the security lot sold with the net sales proceeds. Dividend income on the Statements of Operations is shown net of any foreign taxes withheld on income from foreign securities, which are provided for in accordance with each Fund’s understanding of the applicable tax rules and regulations.
Income Tax Information and Distributions to Shareholders
It is the Funds’ policy to comply with all requirements of the Internal Revenue Code of 1986, as amended (“the Code”). Each Fund intends to qualify for and to elect treatment as a separate Regulated Investment Company (“RIC”) under Subchapter M of the Code. It is each Fund’s policy to pay out dividends from net investment income quarterly. Taxable net realized gains from investment transactions, reduced by capital loss carryforwards, if any, will be declared and distributed to shareholders at least annually. The capital loss carryforward amount, if any, will be available to offset future net capital gains. Each Fund may occasionally be required to make supplemental distributions at some other time during the year. Each Fund reserves the right to declare special distributions if, in its reasonable discretion, such action is necessary or advisable to preserve the status of a Fund as a RIC or to avoid imposition of income or excise taxes on undistributed income. Dividends and distributions to shareholders, if any, will be recorded on the ex-dividend date. The amount of dividends and distributions from net investment income and net realized capital gains will be determined in accordance with Federal income tax regulations which may differ from U.S. GAAP. These “book/tax” differences are either considered temporary or permanent in nature. To the extent these differences are permanent in nature, (e.g., return of capital and distribution reclassifications), such amounts are reclassified within the composition of net assets based on their federal tax basis treatment; temporary differences (e.g., wash sales and straddles) do not require a reclassification. Dividends and distributions, which exceed earnings and profits for the full year for tax purposes, will be reported as a tax return of capital.
In accordance with U.S. GAAP requirements regarding accounting for uncertainties in income taxes, management has analyzed each Fund’s tax positions expected to be taken on foreign, federal and state income tax returns for all open tax years and has concluded that no provision for income tax is required in each Fund’s financial statement.
Each Fund will recognize interest and penalties, if any, related to uncertain tax positions as income tax expense on the Statements of Operations.
3. Derivative Financial Instruments
Option Contracts
In the normal course of business, a Fund uses derivative contracts in connection with its proprietary trading activities. Derivative contracts are subject to additional risks that can result in a loss of all or part of an investment. A Fund’s derivative activities and exposure to derivative contracts are classified by the following primary underlying risks: interest rate, credit, foreign exchange, commodity price, and equity price. In addition to its primary underlying risks, the Fund is also subject to additional counterparty risk due to inability of its counterparties to meet the terms of their contracts.
FASB Accounting Standards Codification, Derivatives and Hedging (“ASC 815”) requires enhanced disclosures about a Fund’s use of, and accounting for, derivative instruments and the effect of derivative instruments on a Fund’s financial position and results of operations. Tabular disclosure regarding derivative fair value and gain/loss by contract type (e.g., interest rate contracts, foreign exchange contracts, credit contracts, etc.) is required and derivatives accounted for as hedging instruments under ASC 815 must be disclosed separately from those that do not qualify for hedge accounting. Even though a Fund may use derivatives in an attempt to achieve an economic hedge, a Fund’s derivatives are not accounted for as hedging instruments under ASC 815 because investment companies account for their derivatives at fair value and record any changes in fair value in current period earnings.
A Fund may purchase and write (i.e., sell) put and call options. Such options may relate to particular securities or stock indices, and may or may not be listed on a domestic or foreign securities exchange and may or may not be issued by the Options Clearing Corporation. Options trading is a highly specialized activity that entails greater than ordinary investment risk. Options may be more volatile than the underlying instruments, and therefore, on a percentage basis, an investment in options may be subject to greater fluctuation than an investment in the underlying instruments themselves.
A call option for a particular security gives the purchaser of the option the right to buy, and the writer (seller) the obligation to sell, the underlying security at the stated exercise price at any time prior to the expiration of the option, regardless of the market price of the security. The premium paid to the writer is in consideration for undertaking the obligation under the option contract. A put option for a particular security gives the purchaser the right to sell the security at the stated exercise price at any time prior to the expiration date of the option, regardless of the market price of the security. Stock index options are put options and call options on various stock indices. In most respects, they are identical to listed options on common stocks. The primary difference between stock options and index options occurs when index options are exercised. In the case of stock options, the underlying security, common stock, is delivered. However,
Simplify Exchange Traded Funds
Notes to Financial Statements (Continued)
June 30, 2024
upon the exercise of an index option, settlement does not occur by delivery of the securities comprising the index. The option holder who exercises the index option receives an amount of cash if the closing level of the stock index upon which the option is based is greater than, in the case of a call, or less than, in the case of a put, the exercise price of the option. This amount of cash is equal to the difference between the closing price of the stock index and the exercise price of the option expressed in dollars times a specified multiple. A stock index fluctuates with changes in the market value of the stocks included in the index.
Premiums paid on options purchased and premiums received on options written, as well as the daily fluctuation in market value, are included in investments at value and options written at value, respectively, in the Statements of Assets and Liabilities. When an instrument is purchased or sold through the exercise of an option, the premium is offset against the cost or proceeds of the underlying instrument. When an option expires, a realized gain or loss is recorded in the Statements of Operations to the extent of the premiums received or paid. When an option is closed or sold, a gain or loss is recorded in the Statements of Operations to the extent the cost of the closing transaction exceeds the premiums received or paid. When the Funds write a call option, such option is typically “covered,” meaning that they hold the underlying instrument subject to being called by the option counterparty. When the Funds write a put option, cash is segregated in an amount sufficient to cover the obligation. These amounts, which are considered restricted, are included in cash pledged as collateral for options written in the Statements of Assets and Liabilities.
The following table summarizes the value of the Funds’ derivative instruments held as of June 30, 2024 and the related location in the accompanying Statements of Assets and Liabilities, presented by underlying risk exposure:
| Fund | | Asset Derivatives | | | Liability Derivatives | |
| Simplify US Equity PLUS Convexity ETF | |
| Equity Contracts | | Investments, at value(1) | | $ | 1,338,935 | | | Investments, at value(1) | | $ | — | |
| Equity Contracts | | Written options | | $ | — | | | Written options | | $ | 71,730 | |
| | | | | | | | | | | | | |
| Simplify US Equity PLUS Downside Convexity ETF | |
| Equity Contracts | | Investments, at value(1) | | $ | 476,875 | | | Investments, at value(1) | | $ | — | |
| Equity Contracts | | Written options | | $ | — | | | Written options | | $ | 160,645 | |
| | | | | | | | | | | | | |
| Simplify US Equity PLUS Upside Convexity ETF | |
| Equity Contracts | | Investments, at value(1) | | $ | 210,512 | | | Investments, at value(1) | | $ | — | |
| Equity Contracts | | Written options | | $ | — | | | Written options | | $ | 3,937 | |
| (1) | Purchased option contracts are included in Investments within the Statements of Assets and Liabilities. |
For the year ended June 30, 2024, realized gains/(losses) and the change in unrealized appreciation/(depreciation) on purchased option contracts (a) by risk type, as disclosed in the Statements of Operations, is as follows:
| Fund | | Risk Type | | | Realized
Gain/(Loss) | | | Change in Unrealized
Appreciation/ (Depreciation) | |
| Simplify US Equity PLUS Convexity ETF | | Equity | | | $ | (195,730 | ) | | $ | (397,630 | ) |
| Simplify US Equity PLUS Downside Convexity ETF | | Equity | | | | (7,620,160 | ) | | | (46,323 | ) |
| Simplify US Equity PLUS Upside Convexity ETF | | Equity | | | | 462,755 | | | | (97,022 | ) |
| (a) | Purchased option contracts are included in Net Realized Gain (Loss) on Investments within the Statement of Operations. |
For the year ended June 30, 2024, realized gains/(losses) and the change in unrealized appreciation/(depreciation) on written option contracts by risk type, as disclosed in the Statements of Operations, is as follows:
| Fund | | Risk Type | | | Realized
Gain/(Loss) | | | Change in Unrealized
Appreciation/ (Depreciation) | |
| Simplify US Equity PLUS Convexity ETF | | Equity | | | $ | 1,686,921 | | | $ | 197,149 | |
| Simplify US Equity PLUS Downside Convexity ETF | | Equity | | | | 4,723,518 | | | | 40,650 | |
| Simplify US Equity PLUS Upside Convexity ETF | | Equity | | | | 10,341 | | | | 38,603 | |
Simplify Exchange Traded Funds
Notes to Financial Statements (Continued)
June 30, 2024
For the year ended June 30, 2024, the average fiscal quarter end balances of outstanding derivative financial instruments were as follows:
Fund | | Purchased Option
Contracts
(Contract Value) | | | Purchased Swaption
Contracts
(Contract Value) | | | Forward Foreign
Currency Contracts
(Notional Value) | | | Futures Contracts
(Notional Value) | | | Written Option
Contracts
(Contract Value) | | | Swaps
(Notional Value) | |
| Simplify US Equity PLUS Convexity ETF | | $ | 1,211,355 | | | $ | — | | | $ | — | | | $ | — | | | $ | (301,512 | ) | | $ | — | |
| Simplify US Equity PLUS Downside Convexity ETF | | | 764,333 | | | | — | | | | — | | | | — | | | | (420,927 | ) | | | — | |
| Simplify US Equity PLUS Upside Convexity ETF | | | 192,818 | | | | — | | | | — | | | | — | | | | (33,113 | ) | | | — | |
4. Investment Advisory Agreement and Other Agreements
The Adviser has overall responsibility for the general management and administration of the Funds, subject to the oversight of the Board. Under an investment advisory agreement between the Trust, on behalf of the Funds, and the Adviser (the “Investment Advisory Agreement”), the Adviser is responsible for arranging sub-advisory, transfer agency, custody, fund administration, and all other non-distribution related services for the Funds to operate.
For its investment advisory services to the Funds below, the Adviser was entitled to receive a management fee based on each Fund’s average daily net assets, computed and accrued daily and payable monthly, at an annual rate equal to:
| Fund | | Management
Fee | |
| Simplify US Equity PLUS Convexity ETF | | | 0.50 | % |
| Simplify US Equity PLUS Downside Convexity ETF | | | 0.50 | % |
| Simplify US Equity PLUS Upside Convexity ETF | | | 0.50 | % |
The Adviser for the Funds below had contractually agreed, until at least October 31, 2023, to waive its management fees to 0.25% of the Fund’s average daily net assets. For the year ended June 30, 2024, the Adviser waived expenses of the Funds as follows:
| Fund | | Expenses
Waived | |
| Simplify US Equity PLUS Convexity ETF | | $ | 84,356 | |
| Simplify US Equity PLUS Downside Convexity ETF | | | 121,249 | |
| Simplify US Equity PLUS Upside Convexity ETF | | | 9,110 | |
Under the Investment Advisory Agreement, the Adviser has agreed to pay substantially all the operating expenses of the Funds, excluding interest expenses, taxes, brokerage expenses, Rule 12b-1 fees (if any), acquired fund fees and expenses, expenses incidental to a meeting of a Fund’s shareholders and the Management Fee. In addition to the excluded operating expenses, the Funds also pay non-operating expenses such as litigation and indemnification expenses and other expenses determined to be extraordinary by the Trust.
The Board has adopted a Distribution and Service Plan pursuant to Rule 12b-1 under the 1940 Act. In accordance with its Rule 12b-1 plan, each Fund is authorized to pay an amount up to 0.25% of its average daily net assets each year to finance activities primarily intended to result in the sale of Creation Units of the Fund or the provision of investor services. No Rule 12b-1 fees are currently paid by the Funds and there are no plans to impose these fees. However, in the event Rule 12b-1 fees are charged in the future, they will be paid out of the Fund’s assets, and directly impact the NAV per share of each Fund.
The Bank of New York Mellon, a wholly-owned subsidiary of The Bank of New York Mellon Corporation, serves as Administrator, Custodian, Accounting Agent and Transfer Agent for each Fund.
Foreside Financial Services, LLC (the “Distributor”) serves as the distributor of Creation Units for each Fund on an agency basis. The Distributor does not maintain a secondary market in shares of a Fund. Foreside Fund Officer Services, LLC a related party to the Distributor also serves as the Trust’s Compliance Officer.
A Trustee and certain Officers of the Trust are also employees of the Adviser and/or the Distributor.
5. Investment Transactions
Purchases and sales of securities, other than short-term securities, U.S. Government Securities and in-kind transactions were as follows:
| Fund | | Purchases | | | Sales | |
| Simplify US Equity PLUS Convexity ETF | | $ | 2,149,422 | | | $ | 1,684,872 | |
Simplify Exchange Traded Funds
Notes to Financial Statements (Continued)
June 30, 2024
| Fund | | Purchases | | | Sales | |
| Simplify US Equity PLUS Downside Convexity ETF | | | — | | | | 3,542,571 | |
| Simplify US Equity PLUS Upside Convexity ETF | | | 625,944 | | | | 229,551 | |
Securities received and delivered in-kind through subscriptions and redemptions were as follows:
| Fund | | Purchases | | | Sales | |
| Simplify US Equity PLUS Convexity ETF | | $ | 11,524,782 | | | $ | 25,870,577 | |
| Simplify US Equity PLUS Downside Convexity ETF | | | 50,201,650 | | | | 65,773,570 | |
| Simplify US Equity PLUS Upside Convexity ETF | | | 3,529,228 | | | | 5,441,406 | |
6. Fund Share Transactions
The Funds issue and redeem Shares at NAV only in large blocks of 25,000 Shares (each block of Shares is called a “Creation Unit”). Creation Units are issued and redeemed primarily in-kind for securities but may include cash. Individual Shares may only be purchased and sold in secondary market transactions through brokers. Except when aggregated in Creation Units in transactions with Authorized Participants, the Shares are not redeemable securities of the Fund.
Fund Shares are listed and traded on the Exchange on each day that the Exchange is open for business (“Business Day”). Each Fund’s Shares may only be purchased and sold on the Exchange through a broker-dealer. Because each Fund’s Shares trade at market prices rather than at their NAV, Shares may trade at a price equal to the NAV, greater than NAV (premium) or less than NAV (discount).
Authorized participants pay a fixed transaction fee of $500 to the shareholder servicing agent when purchasing and redeeming Creation Units of a Fund. The transaction fee is used to defray the costs associated with the issuance and redemption of Creation Units. In addition to the fixed transaction fee, the Funds may charge an additional maximum 3% of the amount invested variable fee for creations and redemptions in cash, to offset brokerage and impact expenses associated with a cash transaction.
7. Federal Income Taxes
For the year ended June 30, 2024, the effect of permanent “book/tax” reclassifications to the components of net assets are included below. These differences are primarily due to redemptions-in-kind, non-deductible excise tax paid, prior year true ups, distributions in excess, return of capital distributions, and controlled foreign corporations income reversal.
| Fund | | Distributable
earnings (loss) | | | Paid-in
Capital | |
| Simplify US Equity PLUS Convexity ETF | | $ | (3,499,716 | ) | | $ | 3,499,716 | |
| Simplify US Equity PLUS Downside Convexity ETF | | | 383,956 | | | | (383,956 | ) |
| Simplify US Equity PLUS Upside Convexity ETF | | | (125,672 | ) | | | 125,672 | |
The tax character of dividends and distributions declared for the year ended June 30, 2024 were as follows:
| Fund | | Ordinary Income* | | | Long-Term
Capital Gains | | | Return of
Capital | |
| Simplify US Equity PLUS Convexity ETF | | $ | 874,943 | | | $ | — | | | $ | — | |
| Simplify US Equity PLUS Downside Convexity ETF | | | 1,085,380 | | | | — | | | | 407,750 | |
| Simplify US Equity PLUS Upside Convexity ETF | | | 81,193 | | | | — | | | | — | |
| * | For tax purposes short-term capital gain distributions are considered ordinary income distributions. |
The tax character of dividends and distributions declared for the year ended June 30, 2023 were as follows:
| Fund | | Ordinary
Income* | | | Long-Term
Capital Gains | | | Return of
Capital | |
| Simplify US Equity PLUS Convexity ETF | | $ | 890,883 | | | $ | — | | | $ | — | |
| Simplify US Equity PLUS Downside Convexity ETF | | | 3,166,409 | | | | — | | | | — | |
| Simplify US Equity PLUS Upside Convexity ETF | | | 113,758 | | | | — | | | | — | |
| * | For tax purposes short-term capital gain distributions are considered ordinary income distributions. |
Simplify Exchange Traded Funds
Notes to Financial Statements (Continued)
June 30, 2024
As of June 30, 2024, the components of accumulated earnings (losses) on a tax basis were as follows:
Fund | | Undistributed
Ordinary
Income | | | Undistributed
Long-term
Capital Gains | | | Temporary
Book/Tax
Differences(a) | | | Net Unrealized
Appreciation
(Depreciation) | | | Accumulated
Capital and
Other Losses | | | Post-October/
Late-year
Ordinary Loss
Deferrals | | | Distributable
earnings (loss) | |
| Simplify US Equity PLUS Convexity ETF | | $ | — | | | $ | — | | | $ | (1,009,921 | ) | | $ | 12,423,287 | | | $ | (4,494,255 | ) | | $ | — | | | $ | 6,919,111 | |
| Simplify US Equity PLUS Downside Convexity ETF | | | — | | | | — | | | | (1,243,420 | ) | | | 14,132,101 | | | | (54,245,685 | ) | | | — | | | | (41,357,004 | ) |
| Simplify US Equity PLUS Upside Convexity ETF | | | — | | | | — | | | | (98,167 | ) | | | 797,524 | | | | (387,201 | ) | | | — | | | | 312,156 | |
| (a) | The temporary book/tax differences was attributable primarily to dividend payable, and straddles deferral. |
At June 30, 2024, gross unrealized appreciation and depreciation of investments owned by each Fund, based on cost for federal income tax purposes were as follows:
| Fund | | Tax Cost | | | Gross
Unrealized
Appreciation | | | Gross
Unrealized
Depreciation | | | Net Unrealized
Appreciation
(Depreciation) | |
| Simplify US Equity PLUS Convexity ETF | | $ | 61,024,692 | | | $ | 12,423,724 | | | $ | (437 | ) | | $ | 12,423,287 | |
| Simplify US Equity PLUS Downside Convexity ETF | | | 100,259,904 | | | | 14,139,826 | | | | (7,725 | ) | | | 14,132,101 | |
| Simplify US Equity PLUS Upside Convexity ETF | | | 7,272,894 | | | | 797,692 | | | | (168 | ) | | | 797,524 | |
The differences between book-basis and tax-basis components of net assets are primarily attributable to the tax deferral of losses on wash sales, grantor trust adjustments, section 1256 mark-to-market treatment of derivatives and return of capital basis adjustments from underlying investments.
At June 30, 2024, for federal income tax purposes, the Funds had capital loss carryforwards available as shown in the table below, to the extent provided by regulations, to offset future capital gains for an unlimited period. To the extent that these capital loss carryforwards are used to offset future capital gains, it is probable that the capital gains so offset will not be distributed to shareholders.
| Fund | | Short-Term | | | Long-Term | | | Total Amount | |
| Simplify US Equity PLUS Convexity ETF | | $ | 1,504,904 | | | $ | 2,989,351 | | | $ | 4,494,255 | |
| Simplify US Equity PLUS Downside Convexity ETF | | | 34,613,954 | | | | 19,631,731 | | | | 54,245,685 | |
| Simplify US Equity PLUS Upside Convexity ETF | | | 145,842 | | | | 241,359 | | | | 387,201 | |
8. Subsequent Events
Management has evaluated subsequent events through the date of issuance of these financial statements and has determined that there are no subsequent events that require adjustment to, or disclosure in, the financial statement.
Simplify Exchange Traded Funds
Report of Independent Registered Public Accounting Firm
To the Shareholders and Board of Trustees of
Simplify Exchange Traded Funds
Opinion on the Financial Statements
We have audited the accompanying statements of assets and liabilities, including the schedules of investments, of Simplify US Equity PLUS Convexity ETF, Simplify US Equity PLUS Downside Convexity ETF, and Simplify US Equity PLUS Upside Convexity ETF (the “Funds”), each a series of Simplify Exchange Traded Funds, as of June 30, 2024, the related statements of operations for the year then ended, the statements of changes in net assets for each of the two years in the period then ended, the financial highlights for the years ended June 30, 2024, 2023, and 2022, and for the period from September 4, 2020 (commencement of operations) through June 30, 2021, and the related notes (collectively referred to as the “financial statements”). In our opinion, the financial statements present fairly, in all material respects, the financial position of each of the Funds as of June 30, 2024, the results of their operations for the year then ended, the changes in net assets for each of the two years in the period then ended, and the financial highlights for each of the four periods in the period then ended, in conformity with accounting principles generally accepted in the United States of America.
Basis for Opinion
These financial statements are the responsibility of the Funds’ management. Our responsibility is to express an opinion on the Funds’ financial statements based on our audits. We are a public accounting firm registered with the Public Company Accounting Oversight Board (United States) (“PCAOB”) and are required to be independent with respect to the Funds in accordance with the U.S. federal securities laws and the applicable rules and regulations of the Securities and Exchange Commission and the PCAOB.
We conducted our audits in accordance with the standards of the PCAOB. Those standards require that we plan and perform the audit to obtain reasonable assurance about whether the financial statements are free of material misstatement whether due to error or fraud.
Our audits included performing procedures to assess the risks of material misstatement of the financial statements, whether due to error or fraud, and performing procedures that respond to those risks. Such procedures included examining, on a test basis, evidence regarding the amounts and disclosures in the financial statements. Our procedures included confirmation of securities owned as of June 30, 2024, by correspondence with the custodian and brokers. Our audits also included evaluating the accounting principles used and significant estimates made by management, as well as evaluating the overall presentation of the financial statements. We believe that our audits provide a reasonable basis for our opinion.
We have served as the auditor of one of more funds advised by Simplify Asset Management, Inc. since 2020.

COHEN & COMPANY, LTD.
Cleveland, Ohio
August 29, 2024
Simplify Exchange Traded Funds
Additional Information (Unaudited)
Discount & Premium Information
Information regarding how often shares of each Fund traded on NYSE Arca or NASDAQ, as applicable, at a price above (i.e., at a premium) or below (i.e., at a discount) the NAV of the Fund can be found at www.simplify.us.
Tax Information
Form 1099-DIV and other year-end tax information provide shareholders with actual calendar year amounts that should be included in their tax returns. Shareholders should consult their tax advisors.
Each Fund designates the following amounts or, if subsequently determined to be different, the maximum allowable for its period ended June 30, 2024.
| Fund | | Qualified
Dividend
Income* | | | Dividends
Received
Deduction | |
| Simplify US Equity PLUS Convexity ETF | | | 100.00 | % | | | 100.00 | % |
| Simplify US Equity PLUS Downside Convexity ETF | | | 100.00 | % | | | 100.00 | % |
| Simplify US Equity PLUS Upside Convexity ETF | | | 100.00 | % | | | 100.00 | % |
| * | The above percentage is based on ordinary income dividends paid to shareholders during each Fund’s fiscal year. |
This report must be preceded or accompanied by a prospectus.
(This page intentionally left blank)
(This page intentionally left blank)
(This page intentionally left blank)
Investment Adviser
Simplify Asset Management Inc.
10845 Griffith Peak Drive, 2/F
Las Vegas, NV 89135 | | Simplify Exchange Traded Funds
10845 Griffith Peak Drive, 2/F
Las Vegas, NV 89135 | | Custodian, Administrator & Transfer Agent
The Bank of New York Mellon 240 Greenwich Street
New York, NY 10286 |
| | | | | |
| | | Independent Registered Public Accounting Firm
Cohen & Company Ltd.
1350 Euclid Ave., Suite 800
Cleveland, OH 44115 | | Legal Counsel
Thompson Hine LLP
41 South High Street
Suite 1700
Columbus, OH 43215 |
June 30, 2024
Annual Financial Statements and
Other Important Information
Simplify Exchange Traded Funds
Simplify Enhanced Income ETF (HIGH)
Simplify Stable Income ETF (BUCK)
Simplify Bitcoin Strategy PLUS Income ETF (MAXI)
Simplify Volatility Premium ETF (SVOL)

(This page intentionally left blank)
Simplify Exchange Traded Funds
Table of Contents
This report is provided for the general information of shareholders and is not authorized for distribution to prospective investors unless preceded or accompanied by a current prospectus.
Simplify Enhanced Income ETF
Schedule of Investments
June 30, 2024
| | Principal | | | Value | |
| U.S. Treasury Bills – 100.2% | | | | | | | | |
| U.S. Treasury Bill, 5.37%, 7/5/2024(a) | | $ | 26,000,000 | | | $ | 25,984,877 | |
| U.S. Treasury Bill, 5.41%, 8/13/2024(a)(b) | | | 206,900,000 | | | | 205,606,827 | |
| U.S. Treasury Bill, 5.39%, 9/19/2024(a) | | | 207,300,000 | | | | 204,900,849 | |
| Total U.S. Treasury Bills (Cost $436,468,455) | | | | | | | 436,492,553 | |
| | | Number of
Contracts | | | Notional
Amount | | | | |
| Purchased Options – 0.1% | | | | | | | | | | | |
| | | | | | | | | | | | |
| Calls – Exchange-Traded – 0.0%† | | | | | | | | | | | |
| Energy Select Sector SPDR, July Strike Price $102, Expires 7/12/24(c) | | 2,652 | | | | 27,050,400 | | | | 5,304 | |
| iShares MSCI EAFE ETF, July Strike Price $80.5, Expires 7/05/24 | | 8,854 | | | | 71,274,700 | | | | 53,124 | |
| iShares U.S. home Construction ETF, July Strike Price $112, Expires 7/05/24 | | 9,407 | | | | 105,358,400 | | | | 56,442 | |
| S&P 500 Index, July Strike Price $5,625, Expires 7/05/24 | | 620 | | | | 348,750,000 | | | | 6,200 | |
| | | | | | | | | | | 121,070 | |
| Puts – Exchange-Traded – 0.1% | | | | | | | | | | | |
| iShares Silver trust ETF, July Strike Price $24.5, Expires 7/05/24(c) | | 23,730 | | | | 58,138,500 | | | | 23,730 | |
| Nasdaq 100 Index, July Strike Price $17,800, Expires 7/12/24(c) | | 48 | | | | 85,440,000 | | | | 25,680 | |
| Nasdaq 100 Index, July Strike Price $18,000, Expires 7/12/24(c) | | 116 | | | | 208,800,000 | | | | 91,060 | |
| S&P 500 Index, July Strike Price $5,200, Expires 7/02/24(c) | | 2,021 | | | | 1,050,920,000 | | | | 25,262 | |
| S&P 500 Index, July Strike Price $5,250, Expires 7/08/24(c) | | 542 | | | | 284,550,000 | | | | 54,200 | |
| SPDR S&P Oil & Gas Exploration & Production ETF, July Strike Price $142, Expires 7/05/24 | | 1,619 | | | | 22,989,800 | | | | 56,665 | |
| SPDR S&P Regional Banking ETF, July Strike Price $40, Expires 7/12/24(c) | | 4,546 | | | | 18,184,000 | | | | 27,276 | |
| | | | | | | | | | | 303,873 | |
| | | | | | | | | | | | |
| Total Purchased Options (Cost $683,695) | | | | | | | | | | 424,943 | |
| | | | | | | | | | | | |
| Total Investments – 100.3% | | | | | | | | | | | |
| (Cost $437,152,150) | | | | | | | | | $ | 436,917,496 | |
| Liabilities in Excess of Other Assets – (0.3)% | | | | | | | | | | (1,431,061 | ) |
| Net Assets – 100.0% | | | | | | | | | $ | 435,486,435 | |
| | | Number of
Contracts | | | Notional
Amount | | | | |
| Written Options – (0.2)% | | | | | | | | | |
| | | | | | | | | | |
| Calls – Exchange-Traded – (0.0)%† | | | | | | | | | |
| Energy Select Sector SPDR, July Strike Price $93.5, Expires 7/12/24 | | (2,652) | | | $ | (24,796,200 | ) | | $ | (5,304 | ) |
| | | | | | | | | | | | |
| Puts – Exchange-Traded – (0.2)% | | | | | | | | | | | |
| iShares Silver trust ETF, July Strike Price $25.5, Expires 7/05/24 | | (23,730) | | | $ | (60,511,500 | ) | | $ | (83,055 | ) |
| Nasdaq 100 Index, July Strike Price $19,170, Expires 7/12/24 | | (164) | | | | (314,388,000 | ) | | | (797,860 | ) |
| S&P 500 Index, July Strike Price $5,000, Expires 7/02/24 | | (2,021) | | | | (1,010,500,000 | ) | | | (15,158 | ) |
| S&P 500 Index, July Strike Price $5,000, Expires 7/08/24 | | (542) | | | | (271,000,000 | ) | | | (24,390 | ) |
| SPDR S&P Regional Banking ETF, July Strike Price $45, Expires 7/12/24 | | (4,546) | | | | (20,457,000 | ) | | | (104,558 | ) |
| | | | | | | | | | | (1,025,021 | ) |
| | | | | | | | | | | | |
| Total Written Options (Premiums Received $1,463,547) | | | | | | | | | $ | (1,030,325 | ) |
See Notes to Financial Statements.
Simplify Enhanced Income ETF
Schedule of Investments (Continued)
June 30, 2024
| † | Less than 0.05% |
| (a) | Represents a zero coupon bond. Rate shown reflects the effective yield. |
| (b) | Security, or a portion thereof, in the amount of $64,593,735 has been pledged as collateral for options as of June 30, 2024. |
| (c) | Held in connection with Written Options. |
Summary of Investment Type††
| | | % of | |
| Investment Categories | | Net Assets | |
| U.S. Treasury Bills | | | 100.2 | % |
| Purchased Options | | | 0.1 | % |
| Total Investments | | | 100.3 | % |
| Liabilities in Excess of Other Assets | | | (0.3 | )% |
| Net Assets | | | 100.0 | % |
| †† | The percentage shown for each investment category is the total value of investments in that category as a percentage of the net assets of the Fund. The table depicts the Fund’s investments but may not represent the Fund’s market exposure to certain derivatives, if any, which are included in Liabilities in Excess of Other Assets. |
Simplify Stable Income ETF
Schedule of Investments
June 30, 2024
| | | Principal | | | Value | |
| U.S. Treasury Bills – 99.5% | | | | | | | | |
| U.S. Treasury Bill, 5.39%, 7/5/2024(a)(b) | | $ | 138,300,000 | | | $ | 138,219,555 | |
| U.S. Treasury Bill, 5.36%, 9/19/2024(a) | | | 600,000 | | | | 593,056 | |
| Total U.S. Treasury Bills (Cost $138,811,776) | | | | | | | 138,812,611 | |
| | | | | | | | | |
| Total Investments – 99.5% | | | | | | | | |
| (Cost $138,811,776) | | | | | | $ | 138,812,611 | |
| Other Assets in Excess of Liabilities – 0.5% | | | | | | | 714,788 | |
| Net Assets – 100.0% | | | | | | $ | 139,527,399 | |
| | | Number of | | | Notional | | | | |
| | | Contracts | | | Amount | | | | |
| Written Options – (0.2)% | | | | | | | | | |
| | | | | | | | | | |
| Calls – Exchange-Traded – (0.0)%† | | | | | | | | | | | |
| U.S. Treasury Bond Future, July Strike Price $127, Expires 7/26/24 | | (1,000) | | | $ | (127,000,000 | ) | | $ | (46,875 | ) |
| | | | | | | | | | | | |
| Puts – Exchange-Traded – (0.2)% | | | | | | | | | | | |
| U.S. Treasury Bond Future, July Strike Price $112, Expires 7/26/24 | | (2,000) | | | | (224,000,000 | ) | | | (218,750 | ) |
| | | | | | | | | | | | |
| Total Written Options (Premiums Received $381,543) | | | | | | | | | $ | (265,625 | ) |
| † | Less than 0.05% |
| (a) | Represents a zero coupon bond. Rate shown reflects the effective yield. |
| (b) | Security, or a portion thereof, in the amount of $81,452,594 has been pledged as collateral for options as of June 30, 2024. |
Summary of Investment Type††
| Investment Categories | | % of
Net Assets | |
| U.S. Treasury Bills | | | 99.5 | % |
| Total Investments | | | 99.5 | % |
| Other Assets in Excess of Liabilities | | | 0.5 | % |
| Net Assets | | | 100.0 | % |
| †† | The percentage shown for each investment category is the total value of investments in that category as a percentage of the net assets of the Fund. The table depicts the Fund’s investments but may not represent the Fund’s market exposure to certain derivatives, if any, which are included in Other Assets in Excess of Liabilities. |
See Notes to Financial Statements.
Simplify Bitcoin Strategy PLUS Income ETF
Consolidated Schedule of Investments
June 30, 2024
| | | Principal | | | Value | |
| U.S. Treasury Bills – 303.2% | | | | | | | | |
| U.S. Treasury Bill, 5.37%, 7/5/2024(a) | | $ | 11,300,000 | | | $ | 11,293,427 | |
| U.S. Treasury Bill, 5.23%, 8/13/2024(a)(b) | | | 4,000,000 | | | | 3,974,999 | |
| U.S. Treasury Bill, 5.29%, 9/19/2024(a)(b)(c) | | | 12,000,000 | | | | 11,861,120 | |
| U.S. Treasury Bill, 5.39%, 10/22/2024(a)(c) | | | 30,000,000 | | | | 29,509,698 | |
| Total U.S. Treasury Bills (Cost $56,638,120) | | | | | | | 56,639,244 | |
| | | Number of
Contracts | | | Notional
Amount | | | | |
| Purchased Options – 0.2% | | | | | | | | | | | |
| | | | | | | | | | | | |
| Calls – Exchange-Traded – 0.1% | | | | | | | | | | | |
| Energy Select Sector SPDR, July Strike Price $102, Expires 7/12/24(d) | | 231 | | | | 2,356,200 | | | | 462 | |
| iShares MSCI EAFE ETF, July Strike Price $80.5, Expires 7/05/24 | | 770 | | | | 6,198,500 | | | | 4,620 | |
| iShares U.S. home Construction ETF, July Strike Price $112, Expires 7/05/24 | | 931 | | | | 10,427,200 | | | | 5,586 | |
| S&P 500 Index, July Strike Price $5,625, Expires 7/05/24 | | 62 | | | | 34,875,000 | | | | 620 | |
| | | | | | | | | | | 11,288 | |
| Puts – Exchange-Traded – 0.1% | | | | | | | | | |
| iShares Silver trust ETF, July Strike Price $24.5, Expires 7/05/24(d) | | 2,347 | | | | 5,750,150 | | | | 2,347 | |
| Nasdaq 100 Index, July Strike Price $17,800, Expires 7/12/24(d) | | 5 | | | | 8,900,000 | | | | 2,675 | |
| Nasdaq 100 Index, July Strike Price $18,000, Expires 7/12/24(d) | | 11 | | | | 19,800,000 | | | | 8,635 | |
| S&P 500 Index, July Strike Price $5,200, Expires 7/02/24(d) | | 104 | | | | 54,080,000 | | | | 1,300 | |
| S&P 500 Index, July Strike Price $5,250, Expires 7/08/24(d) | | 24 | | | | 12,600,000 | | | | 2,400 | |
| SPDR S&P Oil & Gas Exploration & Production ETF, July Strike Price $142, Expires 7/05/24 | | 141 | | | | 2,002,200 | | | | 4,935 | |
| SPDR S&P Regional Banking ETF, July Strike Price $40, Expires 7/12/24(d) | | 396 | | | | 1,584,000 | | | | 2,376 | |
| | | | | | | | | | | 24,668 | |
| | | | | | | | | | | | |
| Total Purchased Options (Cost $53,701) | | | | | | | | | | 35,956 | |
| | | | | | | | | | | | |
| Total Investments – 303.4% | | | | | | | | | | | |
| (Cost $56,691,821) | | | | | | | | | $ | 56,675,200 | |
| Liabilities in Excess of Other Assets – (203.4)% | | | | | | | | | | (37,995,144 | ) |
| Net Assets – 100.0% | | | | | | | | | $ | 18,680,056 | |
| | | Number of
Contracts | | | Notional
Amount | | | | |
| Written Options – (0.5)% | | | | | | | | | |
| | | | | | | | | | |
| Calls – Exchange-Traded – (0.0)%† | | | | | | | | | | | |
| Energy Select Sector SPDR, July Strike Price $93.5, Expires 7/12/24 | | (231) | | | $ | (2,159,850 | ) | | $ | (462 | ) |
| | | | | | | | | | | | |
| Puts – Exchange-Traded – (0.5)% | | | | | | | | | | | |
| iShares Silver trust ETF, July Strike Price $25.5, Expires 7/05/24 | | (2,347) | | | $ | (5,984,850 | ) | | $ | (8,215 | ) |
| Nasdaq 100 Index, July Strike Price $19,170, Expires 7/12/24 | | (16) | | | | (30,672,000 | ) | | | (77,840 | ) |
| S&P 500 Index, July Strike Price $5,000, Expires 7/02/24 | | (104) | | | | (52,000,000 | ) | | | (780 | ) |
| S&P 500 Index, July Strike Price $5,000, Expires 7/08/24 | | (24) | | | | (12,000,000 | ) | | | (1,080 | ) |
| SPDR S&P Regional Banking ETF, July Strike Price $45, Expires 7/12/24 | | (396) | | | | (1,782,000 | ) | | | (9,108 | ) |
| | | | | | | | | | | (97,023 | ) |
| | | | | | | | | | | | |
| Total Written Options (Premiums Received $135,416) | | | | | | | | | $ | (97,485 | ) |
See Notes to Financial Statements.
Simplify Bitcoin Strategy PLUS Income ETF
Consolidated Schedule of Investments (Continued)
June 30, 2024
| † | Less than 0.05% |
| (a) | Represents a zero coupon bond. Rate shown reflects the effective yield. |
| (b) | Securities with an aggregate market value of $15,257,435 have been pledged as collateral for options and futures as of June 30, 2024. |
| (c) | Security, or a portion thereof, in the amount of $39,393,400 has been pledged as collateral for reverse repurchase agreements as of June 30, 2024. See note 5 for additional information |
| (d) | Held in connection with Written Options. |
At June 30, 2024, open futures contracts were as follows:
| | | Number of
Contracts | | Notional
Value | | | Expiration
Date | | Value/Unrealized
Appreciation
(Depreciation) | |
| Long position contracts: | | | | | | | | | | | | |
| CME Bitcoin Futures | | 62 | | $ | 18,700,750 | | | 7/26/24 | | $ | (1,074,950 | ) |
Summary of Investment Type††
| Investment Categories | | % of
Net Assets | |
| U.S. Treasury Bills | | | 303.2 | % |
| Purchased Options | | | 0.2 | % |
| Total Investments | | | 303.4 | % |
| Liabilities in Excess of Other Assets | | | (203.4 | )% |
| Net Assets | | | 100.0 | % |
| †† | The percentage shown for each investment category is the total value of investments in that category as a percentage of the net assets of the Fund. The table depicts the Fund’s investments but may not represent the Fund’s market exposure to certain derivatives, if any, which are included in Liabilities in Excess of Other Assets. |
At June 30, 2024, open reverse repurchase agreements were as follows:
| Counterparty | | Interest Rate | | | Trade Date | | Maturity Date | | Face Amount | | | Payable
for Reverse
Repurchase
Agreements | |
| Morgan Stanley Capital Services LLC | | 5.50% | | | 6/28/2024 | | 7/1/2024 | | $ | 38,588,485 | | | $ | 38,588,485 | |
| | | | | | | | | | $ | 38,588,485 | | | $ | 38,588,485 | |
See Notes to Financial Statements.
Simplify Volatility Premium ETF
Consolidated Schedule of Investments
June 30, 2024
| | | Principal | | | Value | |
| U.S. Treasury Bills – 126.4% | | | | | | | | |
| U.S. Treasury Bill, 5.39%, 7/5/2024(a)(b) | | $ | 640,106,000 | | | $ | 639,733,670 | |
| U.S. Treasury Bill, 5.34%, 7/23/2024(a)(c) | | | 600,000,000 | | | | 598,078,668 | |
| U.S. Treasury Bill, 5.36%, 9/19/2024(a)(b) | | | 27,000,000 | | | | 26,687,520 | |
| Total U.S. Treasury Bills (Cost $1,264,496,695) | | | | | | | 1,264,499,858 | |
| | | Shares | | | | |
| Exchange-Traded Funds – 31.6% | | | | | | | | |
| Fixed Income Funds – 31.6% | | | | | | | | |
| Simplify Aggregate Bond ETF(b)(d) | | | 4,896,741 | | | | 101,656,343 | |
| Simplify High Yield PLUS Credit Hedge ETF(d) | | | 3,949,956 | | | | 90,712,714 | |
| Simplify MBS ETF(d) | | | 884,453 | | | | 44,541,053 | |
| Simplify Stable Income ETF(b)(d) | | | 3,216,098 | | | | 79,180,333 | |
| Total Exchange-Traded Funds (Cost $315,762,483) | | | | | | | 316,090,443 | |
| | | Principal | | | | | |
| U.S. Government Obligations – 0.0%† | | | | | | | | |
| U.S. Treasury Note, 2.88%, 6/15/2025(b) | | | | | | | | |
| (Cost $98,369) | | $ | 100,000 | | | | 97,891 | |
| | | Number of
Contracts | | | Notional
Amount | | | | |
| Purchased Options – 0.2% | | | | | | | | | | | |
| | | | | | | | | | | | |
| Calls – Exchange-Traded – 0.2% | | | | | | | | | | | |
| CBOE Volatility Index, July Strike Price $50, Expires 7/17/24 | | 15,419 | | | | 77,095,000 | | | | 53,966 | |
| CBOE Volatility Index, August Strike Price $50, Expires 8/21/24 | | 37,437 | | | | 187,185,000 | | | | 542,837 | |
| CBOE Volatility Index, September Strike Price $50, Expires 9/18/24 | | 36,364 | | | | 181,820,000 | | | | 763,644 | |
| | | | | | | | | | | 1,360,447 | |
| Puts – Exchange-Traded – 0.0%† | | | | | | | | | |
| S&P 500 Index, July Strike Price $5,200, Expires 7/02/24(e) | | 2,304 | | | | 1,198,080,000 | | | | 28,800 | |
| S&P 500 Index, July Strike Price $5,250, Expires 7/08/24(e) | | 1,000 | | | | 525,000,000 | | | | 100,000 | |
| | | | | | | | | | | 128,800 | |
| | | | | | | | | | | | |
| Total Purchased Options (Cost $4,503,620) | | | | | | | | | | 1,489,247 | |
| | | | | | | | | | | | |
| Total Investments – 158.2% | | | | | | | | | | | |
| (Cost $1,584,861,167) | | | | | | | | | $ | 1,582,177,439 | |
| Liabilities in Excess of Other Assets – (58.2)% | | | | | | | | | | (582,161,215 | ) |
| Net Assets – 100.0% | | | | | | | | | $ | 1,000,016,224 | |
| | | Number of
Contracts | | | Notional
Amount | | | | |
| Written Options – (0.1)% | | | | | | | | | | | |
| | | | | | | | | | | | |
| Calls – Exchange-Traded – (0.0)%† | | | | | | | | | | | |
| U.S. Treasury Bond Future, July Strike Price $127, Expires 7/26/24 | | (4,500) | | | $ | (571,500,000 | ) | | $ | (210,938 | ) |
| | | | | | | | | | | | |
| Puts – Exchange-Traded – (0.1)% | | | | | | | | | | | |
| S&P 500 Index, July Strike Price $5,000, Expires 7/02/24 | | (2,304) | | | $ | (1,152,000,000 | ) | | $ | (17,280 | ) |
| S&P 500 Index, July Strike Price $5,000, Expires 7/08/24 | | (1,000) | | | | (500,000,000 | ) | | | (45,000 | ) |
| U.S. Treasury Bond Future, July Strike Price $112, Expires 7/26/24 | | (9,000) | | | | (1,008,000,000 | ) | | | (984,375 | ) |
See Notes to Financial Statements.
Simplify Volatility Premium ETF
Consolidated Schedule of Investments (Continued)
June 30, 2024
| | | Number of
Contracts | | | Notional
Amount | | | Value | |
| | | | | | | | | | $ | (1,046,655) | |
| | | | | | | | | | | | |
| Total Written Options (Premiums Received $1,550,772) | | | | | | | | | $ | (1,257,593) | |
| (a) | Represents a zero coupon bond. Rate shown reflects the effective yield. |
| (b) | Securities with an aggregate market value of $625,862,030 have been pledged as collateral for options and futures as of June 30, 2024. |
| (c) | Security, or a portion thereof, in the amount of $598,078,668 has been pledged as collateral for reverse repurchase agreements as of June 30, 2024. See note 5 for additional information |
| (d) | Affiliated fund managed by Simplify Asset Management Inc. |
| (e) | Held in connection with Written Options. |
At June 30, 2024, open futures contracts were as follows:
| | Number of
Contracts | | | Notional
Value | | | Expiration
Date | | | Value/Unrealized
Appreciation
(Depreciation) | |
| Short position contracts: | | | | | | | | | | | | | | |
| CBOE VIX Future | | (8,922) | | | $ | (133,296,464 | ) | | 8/21/24 | | | $ | 1,031,720 | |
Affiliates
Fiscal year to date transactions with companies which are or were affiliates are as follows:
| Affiliate | | Value at
beginning of
the period | | | Purchases
Cost | | | Sales
Proceeds | | | Net Realized
Gain/(Loss) | | | Net Change
in Unrealized
Appreciation/
Depreciation | | | Value at the
end of the
period | | | Number of
Shares at
the end of
the period | | | Dividend
Income | | | Return of
Capital | |
| Simplify Aggregate Bond ETF | | $ | — | | | $ | 104,937,058 | | | $ | (3,376,729 | ) | | $ | (133,739 | ) | | $ | 229,753 | | | $ | 101,656,343 | | | | 4,896,741 | | | $ | 4,427,619 | | | $ | 4,669,685 | |
| Simplify High Yield PLUS Credit Hedge ETF | | | — | | | | 90,699,427 | | | | — | | | | — | | | | 13,287 | | | | 90,712,714 | | | | 3,949,956 | | | | 1,279,982 | | | | — | |
| Simplify MBS ETF | | | — | | | | 49,692,492 | | | | (5,013,910 | ) | | | 12,430 | | | | (149,959 | ) | | | 44,541,053 | | | | 884,453 | | | | 547,521 | | | | 115,819 | |
| Simplify Stable Income ETF | | | — | | | | 86,241,663 | | | | (7,267,307 | ) | | | (28,902 | ) | | | 234,879 | | | | 79,180,333 | | | | 3,216,098 | | | | 2,359,834 | | | | 1,366,674 | |
| | | $ | — | | | $ | 331,570,640 | | | $ | (15,657,946 | ) | | $ | (150,211 | ) | | $ | 327,960 | | | $ | 316,090,443 | | | | 12,947,248 | | | $ | 8,614,956 | | | $ | 6,152,178 | |
See Notes to Financial Statements.
Simplify Volatility Premium ETF
Consolidated Schedule of Investments (Continued)
June 30, 2024
Summary of Investment Type††
| | | % of | |
| Investment Categories | | Net Assets | |
| U.S. Treasury Bills | | | 126.4 | % |
| Exchange-Traded Funds | | | 31.6 | % |
| Purchased Options | | | 0.2 | % |
| U.S. Government Obligations | | | 0.0 | %† |
| Total Investments | | | 158.2 | % |
| Liabilities in Excess of Other Assets | | | (58.2 | )% |
| Net Assets | | | 100.0 | % |
| †† | The percentage shown for each investment category is the total value of investments in that category as a percentage of the net assets of the Fund. The table depicts the Fund’s investments but may not represent the Fund’s market exposure to certain derivatives, if any, which are included in Liabilities in Excess of Other Assets. |
At June 30, 2024, open reverse repurchase agreements were as follows:
| Counterparty | | Interest Rate | | | Trade Date | | Maturity Date | | Face Amount | | | Payable for
Reverse
Repurchase
Agreements | |
| Morgan Stanley Capital Services LLC | | 5.50% | | | 6/28/2024 | | 7/1/2024 | | $ | 585,859,312 | | | $ | 585,859,312 | |
| | | | | | | | | | $ | 585,859,312 | | | $ | 585,859,312 | |
See Notes to Financial Statements.
Simplify Exchange Traded Funds
Statements of Assets and Liabilities
June 30, 2024
| | | Simplify
Enhanced
Income ETF | | | Simplify
Stable
Income ETF | |
| Assets | | | | | | |
| Investments, at value | | $ | 436,917,496 | | | $ | 138,812,611 | |
| Cash | | | 2,078,270 | | | | 473,166 | |
| Receivables: | | | | | | | | |
| Securities sold | | | 290,186 | | | | — | |
| Due from broker | | | 2,224 | | | | 524,976 | |
| Prepaid expenses | | | 44 | | | | 44 | |
| Capital shares | | | — | | | | 614,658 | |
| Total assets | | | 439,288,220 | | | | 140,425,455 | |
| | | | | | | | | |
| Liabilities | | | | | | | | |
| Payables: | | | | | | | | |
| Securities purchased | | | 1,378,999 | | | | 593,052 | |
| Capital shares | | | 1,217,094 | | | | — | |
| Written options | | | 1,030,324 | | | | 265,625 | |
| Investment advisory fees | | | 175,368 | | | | 39,379 | |
| Total liabilities | | | 3,801,785 | | | | 898,056 | |
| Net Assets | | $ | 435,486,435 | | | $ | 139,527,399 | |
| | | | | | | | | |
| Net Assets Consist of | | | | | | | | |
| Paid-in capital | | $ | 435,259,441 | | | $ | 139,526,580 | |
| Distributable earnings (loss) | | | 226,994 | | | | 819 | |
| Net Assets | | $ | 435,486,435 | | | $ | 139,527,399 | |
| Number of Common Shares outstanding | | | 17,925,001 | | | | 5,675,001 | |
| Net Asset Value, offering and redemption price per share | | $ | 24.29 | | | $ | 24.59 | |
| Investments, at cost | | $ | 437,152,150 | | | $ | 138,811,776 | |
| Premiums received | | $ | 1,463,547 | | | $ | 381,543 | |
See Notes to Financial Statements.
Simplify Exchange Traded Funds
Consolidated Statements of Assets and Liabilities
June 30, 2024
| | | Simplify Bitcoin
Strategy PLUS
Income ETF | | | Simplify Volatility
Premium ETF | |
| Assets | | | | | | | | |
| Investments in unaffiliated securities, at value | | $ | 56,675,200 | | | $ | 1,266,086,996 | |
| Investments in affiliated securities, at value | | | — | | | | 316,090,443 | |
| Cash | | | 584,499 | | | | 1,870,910 | |
| Receivables: | | | | | | | | |
| Due from broker | | | 223,717 | | | | 29,651,758 | |
| Securities sold | | | 29,200 | | | | 790,580 | |
| Prepaid expenses | | | 1,211 | | | | 2,224 | |
| Interest | | | — | | | | 118 | |
| Total assets | | | 57,513,827 | | | | 1,614,493,029 | |
| | | | | | | | | |
| Liabilities | | | | | | | | |
| Payables: | | | | | | | | |
| Reverse repurchase agreement | | | 38,588,485 | | | | 585,859,312 | |
| Securities purchased | | | 120,469 | | | | 26,775,809 | |
| Written options | | | 97,485 | | | | 1,257,593 | |
| Investment advisory fees | | | 15,541 | | | | 405,079 | |
| Interest on reverse repurchase agreement | | | 11,791 | | | | 179,012 | |
| Total liabilities | | | 38,833,771 | | | | 614,476,805 | |
| Net Assets | | $ | 18,680,056 | | | $ | 1,000,016,224 | |
| | | | | | | | | |
| Net Assets Consist of | | | | | | | | |
| Paid-in capital | | $ | 9,760,277 | | | $ | 1,007,296,770 | |
| Distributable earnings (loss) | | | 8,919,779 | | | | (7,280,546 | ) |
| Net Assets | | $ | 18,680,056 | | | $ | 1,000,016,224 | |
| Number of Common Shares outstanding | | | 740,001 | | | | 44,500,001 | |
| Net Asset Value, offering and redemption price per share | | $ | 25.24 | | | $ | 22.47 | |
| Investments, at cost | | $ | 56,691,821 | | | $ | 1,269,098,684 | |
| Investments in affiliated securities, at cost | | $ | — | | | $ | 315,762,483 | |
| Premiums received | | $ | 135,416 | | | $ | 1,550,772 | |
See Notes to Financial Statements.
Simplify Exchange Traded Funds
Statements of Operations
For the Year Ended June 30, 2024
| | | Simplify
Enhanced
Income ETF | | | Simplify
Stable
Income ETF | |
| Investment Income | | | | | | | | |
| Interest income | | $ | 13,259,300 | | | $ | 3,474,227 | |
| Total income | | | 13,259,300 | | | | 3,474,227 | |
| | | | | | | | | |
| Expenses | | | | | | | | |
| Investment advisory fees | | | 1,238,372 | | | | 229,709 | |
| Interest expense | | | 55,199 | | | | 5,980 | |
| Other expenses | | | 53 | | | | 49 | |
| Total expenses | | | 1,293,624 | | | | 235,738 | |
| Net investment income (loss) | | | 11,965,676 | | | | 3,238,489 | |
| | | | | | | | | |
| Realized and Unrealized Gain (Loss) | | | | | | | | |
| Net realized gain (loss) from: | | | | | | | | |
| Investments | | | (4,654,471 | ) | | | (276,093 | ) |
| Futures | | | — | | | | 574,367 | |
| Written options | | | 8,285,985 | | | | 280,198 | |
| Net realized gain (loss) | | | 3,631,514 | | | | 578,472 | |
| Net change in unrealized appreciation (depreciation) on: | | | | | | | | |
| Investments | | | (236,636 | ) | | | (2,911 | ) |
| Written options | | | 433,223 | | | | 115,918 | |
| Net unrealized gain (loss) | | | 196,587 | | | | 113,007 | |
| Net realized and unrealized gain (loss) | | | 3,828,101 | | | | 691,479 | |
| Net Increase (Decrease) in Net Assets Resulting from Operations | | $ | 15,793,777 | | | $ | 3,929,968 | |
See Notes to Financial Statements.
Simplify Exchange Traded Funds
Consolidated Statements of Operations
For the Year Ended June 30, 2024
| | | Simplify Bitcoin
Strategy PLUS
Income ETF | | | Simplify
Volatility
Premium ETF | |
| Investment Income | | | | | | | | |
| Unaffiliated dividend income | | $ | — | | | $ | 666,932 | |
| Affiliated dividend income | | | — | | | | 8,614,956 | |
| Interest income | | | 2,337,744 | | | | 25,762,459 | |
| Total income | | | 2,337,744 | | | | 35,044,347 | |
| | | | | | | | | |
| Expenses | | | | | | | | |
| Investment advisory fees | | | 203,674 | | | | 3,098,140 | |
| Interest on reverse repurchase agreement | | | 1,203,382 | | | | 789,221 | |
| Interest expense | | | 51,583 | | | | 151,916 | |
| Other expenses | | | 93 | | | | 33 | |
| Total expenses | | | 1,458,732 | | | | 4,039,310 | |
| Net investment income (loss) | | | 879,012 | | | | 31,005,037 | |
| | | | | | | | | |
| Realized and Unrealized Gain (Loss) | | | | | | | | |
| Net realized gain (loss) from: | | | | | | | | |
| Investments | | | (707,901 | ) | | | (12,037,362 | ) |
| Affiliated investments | | | — | | | | (150,211 | ) |
| Futures | | | 10,736,545 | | | | 70,639,618 | |
| Written options | | | 1,359,291 | | | | 5,902,362 | |
| Net realized gain (loss) | | | 11,387,935 | | | | 64,354,407 | |
| Net change in unrealized appreciation (depreciation) on: | | | | | | | | |
| Investments | | | (44,846 | ) | | | (2,494,806 | ) |
| Affiliated investments | | | — | | | | 327,960 | |
| Futures | | | (1,325,568 | ) | | | (3,379,649 | ) |
| Written options | | | 37,931 | | | | 293,179 | |
| Net unrealized gain (loss) | | | (1,332,483 | ) | | | (5,253,316 | ) |
| Net realized and unrealized gain (loss) | | | 10,055,452 | | | | 59,101,091 | |
| Net Increase (Decrease) in Net Assets Resulting from Operations | | $ | 10,934,464 | | | $ | 90,106,128 | |
See Notes to Financial Statements.
Simplify Exchange Traded Funds
Statements of Changes in Net Assets
| | | Simplify Enhanced Income ETF | | | Simplify Stable Income ETF | |
| | | Year Ended
June 30,
2024 | | | For the period
October 28,
2022(1) to
June 30,
2023 | | | Year Ended
June 30,
2024 | | | For the period
October 28,
2022(1) to
June 30,
2023 | |
| Increase (Decrease) in Net Assets from Operations | | | | | | | | | | | | |
| Net investment income (loss) | | $ | 11,965,676 | | | $ | 187,567 | | | $ | 3,238,489 | | | $ | 220,611 | |
| Net realized gain (loss) | | | 3,631,514 | | | | 234,837 | | | | 578,472 | | | | 39,021 | |
| Net change in net unrealized appreciation (depreciation) | | | 196,587 | | | | 1,982 | | | | 113,007 | | | | 3,746 | |
| Net increase (decrease) in net assets resulting from operations | | | 15,793,777 | | | | 424,386 | | | | 3,929,968 | | | | 263,378 | |
| | | | | | | | | | | | | | | | | |
| Distributions to Shareholders from: | | | | | | | | | | | | | | | | |
| Distributions | | | (15,538,128 | ) | | | (453,041 | ) | | | (3,934,176 | ) | | | (258,351 | ) |
| Return of capital | | | (7,633,526 | ) | | | — | | | | (2,109,218 | ) | | | — | |
| Total distributions | | | (23,171,654 | ) | | | (453,041 | ) | | | (6,043,394 | ) | | | (258,351 | ) |
| | | | | | | | | | | | | | | | | |
| Fund Shares Transactions | | | | | | | | | | | | | | | | |
| Proceeds from shares sold | | | 473,404,665 | | | | 26,894,963 | | | | 139,737,286 | | | | 15,032,078 | |
| Value of shares redeemed | | | (56,151,091 | ) | | | (1,255,570 | ) | | | (12,505,971 | ) | | | (627,595 | ) |
| Net increase (decrease) in net assets resulting from fund share transactions | | | 417,253,574 | | | | 25,639,393 | | | | 127,231,315 | | | | 14,404,483 | |
| Total net increase (decrease) in Net Assets | | | 409,875,697 | | | | 25,610,738 | | | | 125,117,889 | | | | 14,409,510 | |
| | | | | | | | | | | | | | | | | |
| Net Assets | | | | | | | | | | | | | | | | |
| Beginning of period | | | 25,610,738 | | | | — | | | | 14,409,510 | | | | — | |
| End of period | | $ | 435,486,435 | | | $ | 25,610,738 | | | $ | 139,527,399 | | | $ | 14,409,510 | |
| | | | | | | | | | | | | | | | | |
| Changes in Shares Outstanding | | | | | | | | | | | | | | | | |
| Shares outstanding, beginning of period | | | 1,025,001 | | | | — | | | | 575,001 | | | | — | |
| Shares sold | | | 19,200,000 | | | | 1,075,001 | (2) | | | 5,600,000 | | | | 600,001 | (2) |
| Shares redeemed | | | (2,300,000 | ) | | | (50,000 | ) | | | (500,000 | ) | | | (25,000 | ) |
| Shares outstanding, end of period | | | 17,925,001 | | | | 1,025,001 | | | | 5,675,001 | | | | 575,001 | |
| (1) | Commencement of operations. |
| (2) | Shares not in increment of 25,000 shares, a creation unit, represent the Adviser’s initial seed investment in connection with the commencement of operations. |
See Notes to Financial Statements.
Simplify Exchange Traded Funds
Consolidated Statements of Changes in Net Assets
| | | Simplify Bitcoin Strategy PLUS Income ETF | | | Simplify Volatility Premium ETF | |
| | | Year Ended
June 30,
2024 | | | For the period
September 30,
2022(1) to
June 30,
2023 | | | Year Ended
June 30,
2024 | | | Year Ended
June 30,
2023 | |
| Increase (Decrease) in Net Assets from Operations | | | | | | | | | | | | | | | | |
| Net investment income (loss) | | $ | 879,012 | | | $ | 147,198 | | | $ | 31,005,037 | | | $ | 4,481,069 | |
| Net realized gain (loss) | | | 11,387,935 | | | | 8,263,264 | | | | 64,354,407 | | | | 28,735,708 | |
| Net change in net unrealized appreciation (depreciation) | | | (1,332,483 | ) | | | 278,843 | | | | (5,253,316 | ) | | | 5,517,497 | |
| Net increase (decrease) in net assets resulting from operations | | | 10,934,464 | | | | 8,689,305 | | | | 90,106,128 | | | | 38,734,274 | |
| | | | | | | | | | | | | | | | | |
| Distributions | | | (8,396,057 | ) | | | (1,198,175 | ) | | | (103,075,545 | ) | | | (28,995,598 | ) |
| | | | | | | | | | | | | | | | | |
| Fund Shares Transactions | | | | | | | | | | | | | | | | |
| Proceeds from shares sold | | | 17,720,224 | | | | 17,461,565 | | | | 773,905,376 | | | | 253,466,733 | |
| Value of shares redeemed | | | (26,531,270 | ) | | | — | | | | (84,509,670 | ) | | | (38,880,630 | ) |
| Net increase (decrease) in net assets resulting from fund share transactions | | | (8,811,046 | ) | | | 17,461,565 | | | | 689,395,706 | | | | 214,586,103 | |
| Total net increase (decrease) in Net Assets | | | (6,272,639 | ) | | | 24,952,695 | | | | 676,426,289 | | | | 224,324,779 | |
| | | | | | | | | | | | | | | | | |
| Net Assets | | | | | | | | | | | | | | | | |
| Beginning of period | | | 24,952,695 | | | | — | | | | 323,589,935 | | | | 99,265,156 | |
| End of period | | $ | 18,680,056 | | | $ | 24,952,695 | | | $ | 1,000,016,224 | | | $ | 323,589,935 | |
| | | | | | | | | | | | | | | | | |
| Changes in Shares Outstanding | | | | | | | | | | | | | | | | |
| Shares outstanding, beginning of period | | | 1,380,001 | | | | — | | | | 14,125,001 | | | | 4,475,001 | |
| Shares sold | | | 760,000 | | | | 1,380,001 | (2) | | | 34,100,000 | | | | 11,425,000 | |
| Shares redeemed | | | (1,400,000 | ) | | | — | | | | (3,725,000 | ) | | | (1,775,000 | ) |
| Shares outstanding, end of period | | | 740,001 | | | | 1,380,001 | | | | 44,500,001 | | | | 14,125,001 | |
| (1) | Commencement of operations. |
| (2) | Shares not in increment of 25,000 shares, a creation unit, represent the Adviser’s initial seed investment in connection with the commencement of operations. |
See Notes to Financial Statements.
Simplify Exchange Traded Funds
Consolidated Statement of Cash Flows
For the Year Ended June 30, 2024
| | | Simplify Bitcoin
Strategy PLUS
Income ETF | |
| Cash Flows Provided by (Used for) Operating Activities: | | | | |
| Net increase (decrease) in net assets resulting from operations | | $ | 10,934,464 | |
| Adjustments to reconcile net increase (decrease) in net assets resulting from operations to net cash provided by / (used for) operating activities: | | | | |
| Net purchases and sales in short term investments | | | 11,075,315 | |
| Net proceeds from purchased and written options | | | 726,324 | |
| Net change in unrealized (appreciation) / depreciation on investments | | | 44,846 | |
| Net change in unrealized (appreciation) / depreciation on written options | | | (37,931 | ) |
| Net realized (gain) / loss from sales of investments | | | 707,901 | |
| Net realized (gain) / loss from written options | | | (1,359,291 | ) |
| Net amortization of premium / (discount) | | | (2,326,835 | ) |
| (Increase) Decrease in dividends and interest receivable | | | 5,975 | |
| (Increase) Decrease in securities sold receivable | | | 17,677,000 | |
| (Increase) Decrease in due from broker | | | 1,678,847 | |
| Increase (Decrease) in prepaid expenses | | | (1,211 | ) |
| Interest payable on reverse repurchase agreement | | | 11,791 | |
| Increase (Decrease) in other accrued expenses | | | (12,200 | ) |
| Increase (Decrease) in investment advisory fees payable | | | (263 | ) |
| Increase (Decrease) securities purchased payable | | | 120,469 | |
| Net Cash Provided by / (Used for) Operating Activities | | | 39,245,201 | |
| Cash Flows Provided by (Used for) from Financing Activities: | | | | |
| Shares Sold | | | 17,720,224 | |
| Shares redeemed | | | (26,531,270 | ) |
| Proceeds from reverse repurchase agreement | | | 5,236,113,570 | |
| Payments made on reverse repurchase agreement | | | (5,257,497,036 | ) |
| Distributions paid | | | (8,603,057 | ) |
| Cash provided by (used for) financing activities | | | (38,797,569 | ) |
| Net increase (decrease) in cash | | | 447,632 | |
| Cash and Restricted Cash(1): | | | | |
| Cash and Restricted Cash, at beginning of period | | | 209,655 | |
| Cash and Restricted Cash, at end of period | | $ | 657,287 | |
| (1) | Commencement of operations. |
| Supplemental Disclosure of Cash Flow Information | | | |
| Non-cash financing activities: | | | |
| Cash paid for interest on reverse repurchase agreements | | $ | 1,191,591 | |
| | | | | |
| Reconciliation of Restricted and Unrestricted Cash at the beginning of period to the Statements of Assets and Liabilities | | | | |
| Cash | | $ | 209,655 | |
| | | | | |
| Reconciliation of Restricted and Unrestricted Cash at the end of period to the Statements of Assets and Liabilities | | | | |
| Cash | | $ | 657,287 | |
See Notes to Financial Statements.
Simplify Exchange Traded Funds
Consolidated Statement of Cash Flows
For the Year Ended June 30, 2024
| | | Simplify
Volatility
Premium ETF | |
| Cash Flows Provided by (Used for) Operating Activities: | | | |
| Net increase (decrease) in net assets resulting from operations | | $ | 90,106,128 | |
| Adjustments to reconcile net increase (decrease) in net assets resulting from operations to net cash provided by / (used for) operating activities: | | | | |
| Purchases of long-term investment securities | | | (485,885,151 | ) |
| Net purchases and sales in short term investments | | | (930,695,429 | ) |
| Net change in unrealized (appreciation) / depreciation on unaffiliated investments | | | 2,494,806 | |
| Net change in unrealized (appreciation) / depreciation on affiliated investments | | | (327,960 | ) |
| Net change in unrealized (appreciation) / depreciation on written options | | | (293,179 | ) |
| Net realized (gain) / loss from unaffiliated sales of investments | | | 12,037,362 | |
| Net realized (gain) / loss from affiliated sales of investments | | | 150,211 | |
| Return of capital distributions from affiliated funds | | | 6,152,178 | |
| Net realized (gain) / loss from written options | | | (5,902,362 | ) |
| Proceeds from sale of securities | | | 158,098,806 | |
| Net proceeds from purchase and written options | | | (1,785,913 | ) |
| Net amortization of premium / (discount) | | | (23,647,475 | ) |
| (Increase) Decrease in dividends and interest receivable | | | 267,870 | |
| (Increase) Decrease in securities sold receivable | | | 172,418,139 | |
| (Increase) Decrease in due from broker | | | 123,415,470 | |
| (Increase) Decrease in prepaid expenses | | | (2,224 | ) |
| Interest payable on reverse repurchase agreement | | | 179,012 | |
| Increase (Decrease) in investment advisory fees payable | | | 286,617 | |
| Increase (Decrease) securities purchased payable | | | (43,652,929 | ) |
| Net Cash Provided by / (Used for) Operating Activities | | | (926,586,023 | ) |
| Cash Flows Provided by (Used for) from Financing Activities: | | | | |
| Shares Sold | | | 774,475,705 | |
| Shares redeemed | | | (84,509,670 | ) |
| Proceeds from reverse repurchase agreement | | | 3,303,323,501 | |
| Payments made on reverse repurchase agreement | | | (2,862,001,122 | ) |
| Distributions paid | | | (107,443,545 | ) |
| Increase in bank overdraft | | | (95,387,936 | ) |
| Cash provided by (used for) financing activities | | | 928,456,933 | |
| Net increase (decrease) in cash | | | 1,870,910 | |
| Cash and Restricted Cash(1): | | | | |
| Cash and Restricted Cash, at beginning of year | | | — | |
| Cash and Restricted Cash, at end of year | | $ | 1,870,910 | |
| (1) | Cash and restricted cash include cash and cash held as collateral for futures. |
| Supplemental Disclosure of Cash Flow Information | | | |
| Non-cash financing activities: | | | |
| Cash paid for interest on reverse repurchase agreements | | $ | 610,209 | |
| | | | | |
| Reconciliation of Restricted and Unrestricted Cash at the beginning of year to the Statements of Assets and Liabilities | | | | |
| Cash. | | $ | — | |
| | | | | |
| Reconciliation of Restricted and Unrestricted Cash at the end of year to the Statements of Assets and Liabilities | | | |
| Cash. | | $ | 1,870,910 | |
See Notes to Financial Statements.
Simplify Exchange Traded Funds
Financial Highlights
Simplify Enhanced Income ETF
Selected Per Share Data | | Year Ended
June 30,
2024 | | | Period Ended
June 30,
2023(a) | |
| Net Asset Value, beginning of period | | $ | 24.99 | | | $ | 25.00 | |
| Income (loss) from investment operations: | | | | | | | | |
| Net investment income (loss)(b) | | | 1.18 | | | | 0.65 | |
| Net realized and unrealized gain (loss) | | | 0.37 | | | | 0.60 | |
| Total from investment operations | | | 1.55 | | | | 1.25 | |
| Less distributions from: | | | | | | | | |
| Net investment income | | | (1.48 | ) | | | (1.23 | ) |
| Net realized gains | | | (0.03 | ) | | | (0.03 | ) |
| Return of capital | | | (0.74 | ) | | | — | |
| Total distributions | | | (2.25 | ) | | | (1.26 | ) |
| Net Asset Value, end of period | | $ | 24.29 | | | $ | 24.99 | |
| Total Return (%) | | | 6.51 | | | | 5.07 | (c) |
| Ratios to Average Net Assets and Supplemental Data | | | | | | | | |
| Net Assets, end of period ($ millions) | | $ | 435 | | | $ | 26 | |
| Ratio of expenses (%) | | | 0.52 | (d) | | | 0.87 | (e)(f) |
| Ratio of net investment income (loss) (%) | | | 4.83 | | | | 3.92 | (e) |
| Portfolio turnover rate (%)(g) | | | 0 | | | | 0 | (c) |
Simplify Stable Income ETF
Selected Per Share Data | | Year Ended
June 30,
2024 | | | Period Ended
June 30,
2023(a) | |
| Net Asset Value, beginning of period | | $ | 25.06 | | | $ | 25.00 | |
| Income (loss) from investment operations: | | | | | | | | |
| Net investment income (loss)(b) | | | 1.22 | | | | 0.70 | |
| Net realized and unrealized gain (loss) | | | 0.10 | | | | 0.11 | |
| Total from investment operations | | | 1.32 | | | | 0.81 | |
| Less distributions from: | | | | | | | | |
| Net investment income | | | (1.14 | ) | | | (0.74 | ) |
| Net realized gains | | | (0.03 | ) | | | (0.01 | ) |
| Return of capital | | | (0.62 | ) | | | — | |
| Total distributions | | | (1.79 | ) | | | (0.75 | ) |
| Net Asset Value, end of period | | $ | 24.59 | | | $ | 25.06 | |
| Total Return (%) | | | 5.39 | | | | 3.27 | (c) |
| Ratios to Average Net Assets and Supplemental Data | | | | | | | | |
| Net Assets, end of period ($ millions) | | $ | 140 | | | $ | 14 | |
| Ratio of expenses (%) | | | 0.36 | (h) | | | 0.43 | (e)(i) |
| Ratio of net investment income (loss) (%) | | | 4.93 | | | | 4.21 | (e) |
| Portfolio turnover rate (%)(g) | | | 0 | | | | 0 | (c) |
| (a) | For the period October 28, 2022 (commencement of operations) through June 30, 2023. |
| (b) | Per share numbers have been calculated using the average shares method. |
| (c) | Not annualized. |
| (d) | The ratios of expenses to average net assets includes interest expense fees of 0.02%. |
| (e) | Annualized. |
| (f) | The ratios of expenses to average net assets includes interest expense fees of 0.36%. |
| (g) | Excludes the impact of in-kind transactions related to the processing of capital share transactions in Creation Units. |
| (h) | The ratios of expenses to average net assets includes interest expense fees of 0.01%. |
| (i) | The ratios of expenses to average net assets includes interest expense fees of 0.08%. |
See Notes to Financial Statements.
Simplify Exchange Traded Funds
Consolidated Financial Highlights
Simplify Bitcoin Strategy PLUS Income ETF
Selected Per Share Data |
| Year Ended
June 30,
2024 |
|
| Period Ended
June 30,
2023(a) |
|
| Net Asset Value, beginning of period | | $ | 18.08 | | | $ | 12.50 | |
| Income (loss) from investment operations: | | | | | | | | |
| Net investment income (loss)(b) | | | 0.76 | | | | 0.15 | |
| Net realized and unrealized gain (loss) | | | 12.23 | | | | 6.64 | |
| Total from investment operations | | | 12.99 | | | | 6.79 | |
| Less distributions from: | | | | | | | | |
| Net investment income | | | (4.97 | ) | | | (1.15 | ) |
| Net realized gains | | | (0.86 | ) | | | (0.06 | ) |
| Total distributions | | | (5.83 | ) | | | (1.21 | ) |
| Net Asset Value, end of period | | $ | 25.24 | | | $ | 18.08 | |
| Total Return (%) | | | 84.03 | | | | 58.15 | (c) |
| Ratios to Average Net Assets and Supplemental Data | | | | | | | | |
| Net Assets, end of period ($ millions) | | $ | 19 | | | $ | 25 | |
| Ratio of expenses (%) | | | 6.09 | (d)(e) | | | 11.18 | (e)(f)(g) |
| Ratio of net investment income (loss) (%) | | | 3.67 | | | | 1.35 | (f) |
| Portfolio turnover rate (%)(h) | | | 0 | | | | 0 | (c) |
| Simplify Volatility Premium ETF | | Years Ended June 30 | | | Period Ended
June 30, | |
| Selected Per Share Data | | 2024 | | | 2023 | | | 2022 | | | 2021(i) | |
| Net Asset Value, beginning of period | | $ | 22.91 | | | $ | 22.18 | | | $ | 27.01 | | | $ | 25.00 | |
| Income (loss) from investment operations: | | | | | | | | | | | | | | | | |
| Net investment income (loss)(b) | | | 1.13 | | | | 0.63 | | | | 0.03 | | | | (0.02 | ) |
| Net realized and unrealized gain (loss) | | | 2.04 | | | | 3.97 | | | | (1.54 | ) | | | 2.03 | |
| Total from investment operations | | | 3.17 | | | | 4.60 | | | | (1.51 | ) | | | 2.01 | |
| Less distributions from: | | | | | | | | | | | | | | | | |
| Net investment income | | | (3.61 | ) | | | (3.87 | ) | | | (0.04 | ) | | | — | |
| Return of capital | | | — | | | | — | | | | (3.28 | ) | | | — | |
| Total distributions | | | (3.61 | ) | | | (3.87 | ) | | | (3.32 | ) | | | — | |
| Net Asset Value, end of period | | $ | 22.47 | | | $ | 22.91 | | | $ | 22.18 | | | $ | 27.01 | |
| Total Return (%) | | | 15.05 | | | | 23.14 | | | | (6.23 | ) | | | 8.05 | (c) |
| Ratios to Average Net Assets and Supplemental Data | | | | | | | | | | | | | | | | |
| Net Assets, end of period ($ millions) | | $ | 1,000 | | | $ | 324 | | | $ | 99 | | | $ | 15 | |
| Ratio of expenses (%) | | | 0.65 | (e)(j) | | | 1.16 | (e)(k) | | | 0.61 | (e)(l) | | | 0.51 | (e)(f)(m) |
| Ratio of net investment income (loss) (%) | | | 5.00 | | | | 2.85 | | | | 0.10 | | | | (0.51 | )(f) |
| Portfolio turnover rate (%)(h) | | | 97 | | | | 260 | | | | 207 | | | | 10 | (c) |
| (a) | For the period September 30, 2022 (commencement of operations) through June 30, 2023. |
| (b) | Per share numbers have been calculated using the average shares method. |
| (d) | The ratios of expenses to average net assets includes interest expense fees of 5.24%. |
| (e) | The Fund invests in other ETFs and indirectly bears its proportionate shares of fees and expenses incurred by the Underlying Funds in which the Fund is invested. This ratio does not included these indirect fees and expenses. |
| (g) | The ratios of expenses to average net assets includes interest expense fees of 10.23%. |
| (h) | Excludes the impact of in-kind transactions related to the processing of capital share transactions in Creation Units. |
| (i) | For the period May 13, 2021 (commencement of operations) through June 30, 2021. |
| (j) | The ratios of expenses to average net assets includes interest expense fees of 0.15%. |
| (k) | The ratios of expenses to average net assets includes interest expense fees of 0.66%. |
| (l) | The ratios of expenses to average net assets includes interest expense fees of 0.11%. |
| (m) | The ratios of expenses to average net assets includes interest expense fees of 0.01%. |
See Notes to Financial Statements.
Simplify Exchange Traded Funds
Notes to Financial Statements
June 30, 2024
1. Organization
Simplify Exchange Traded Funds (the “Trust”) is registered under the Investment Company Act of 1940, as amended (the “1940 Act”), as an open-end registered management investment company organized as a Delaware statutory trust.
As of June 30, 2024, the Trust consists of twenty eight investment series of exchange-traded funds (“ETFs”) (each a “Fund” and collectively, the “Funds”) in operation and trading. These financial statements report on the Funds listed below:
Simplify Enhanced Income ETF
Simplify Stable Income ETF
Simplify Bitcoin Strategy PLUS Income ETF
Simplify Volatility Premium ETF
The Simplify Bitcoin Strategy PLUS Income ETF is a non-diversified Fund of the Trust.
Simplify Asset Management Inc. (the “Adviser”) serves as investment adviser to the Funds and has overall responsibility for the general management and administration of the Funds, subject to the oversight of the Trust’s Board of Trustees (the “Board”).
Each Fund offers shares that are listed and traded on the NYSE Arca, Inc. (“NYSE Arca”), except for Simplify Bitcoin Strategy PLUS Income ETF which offer shares that are listed and traded on the Nasdaq Stock Market LLC (“Nasdaq”). Unlike mutual funds, The Funds, except the Simplify Bitcoin Strategy PLUS Income ETF, issue and redeem Shares at NAV only in large blocks of 25,000 Shares (each block of Shares is called a “Creation Unit”). The Simplify Bitcoin Strategy PLUS Income ETF, issues and redeems Shares at NAV only in large blocks of 10,000 Shares. Creation Units are issued and redeemed primarily in-kind for securities but may include cash. Individual Shares may only be purchased and sold in secondary market transactions through brokers. Except when aggregated in Creation Units in transactions with Authorized Participants, the Shares are not redeemable securities of the Fund, and owners of the shares may acquire those shares from the Funds, or tender such shares for redemption to the Funds, in Creation Units only.
| Fund | | Investment objectives |
| Simplify Enhanced Income ETF | | The Fund seeks to provide monthly income. |
| Simplify Stable Income ETF | | The Fund seeks to provide monthly income. |
| Simplify Bitcoin Strategy PLUS Income ETF | | The Fund seeks income and capital gains. |
| Simplify Volatility Premium ETF | | The Fund seeks to provide investment results, before fees and expenses, that correspond approximately to one-fifth to three-tenths the inverse (-0.2x to -0.3x) of the performance of a short-term volatility futures index while seeking to mitigate extreme volatility. |
2. Consolidation of Subsidiary
The Consolidated Schedules of Investments, Consolidated Statements of Assets and Liabilities, Consolidated Statements of Operations, Consolidated Statement of Changes in Net Assets, and the Consolidated Financial Highlights of the Funds listed below include the accounts of a wholly owned subsidiaries. All inter-company accounts and transactions have been eliminated in consolidation.
Each Subsidiary is a Cayman Islands exempted company with limited liability. For tax purposes, each Fund is required to increase its taxable income by its shares of the Cayman subsidiary’s income. Net losses incurred by each Subsidiary cannot offset income earned by each Fund and cannot be carried back or forward by each Subsidiary to offset income from prior or future years.
| Fund | | Wholly Owned Subsidiary |
| Simplify Bitcoin Strategy PLUS Income ETF | | Simplify Bitcoin Strategy PLUS Income Cayman Fund |
| Simplify Volatility Premium ETF | | Simplify Volatility Premium Cayman Fund |
A summary of each Fund’s investment in its corresponding subsidiary is as follows:
| Fund | |
Inception
Date of
Subsidiary | |
Subsidiary Net
Assets at
June 30,
2024 | | | % of Fund’s
Consolidated
Total
Assets at
June 30,
2024 | |
| Simplify Bitcoin Strategy PLUS Income ETF | | September 30, 2022 | | $ | 11,492,611 | | | | 19.8 | % |
| Simplify Volatility Premium ETF | | May 13, 2021 | | $ | 387,131,820 | | | | 23.9 | % |
3. Significant Accounting Policies
The financial statements have been prepared in conformity with U.S. generally accepted accounting principles (“U.S. GAAP”), which require management to make certain estimates and assumptions that affect the reported amounts and disclosures of contingent assets and liabilities at the date of the financial statement and the reported amounts of revenues and expenses during the reporting period. Actual results could differ from those estimates. The Funds are investment companies and accordingly follow the investment company accounting and reporting guidance of the Financial Accounting Standards Board (“FASB”) Accounting Standards Codification Topic 946
Simplify Exchange Traded Funds
Notes to Financial Statements (Continued)
June 30, 2024
Financial Services – Investment Companies including Accounting Standards Update 2013-08. The following is a summary of significant accounting policies followed by the Funds.
Investment Valuation
Each Fund’s investments are valued using procedures approved by the Board and are generally valued using market valuations (Market Approach). A market valuation generally means a valuation (i) obtained from an exchange, a pricing service, or a major market maker (or dealer) or (ii) based on a price quotation or other equivalent indication of value supplied by an exchange, a pricing service, or a major market maker (or dealer). A price obtained from a pricing service based on such pricing service’s valuation matrix may be considered a market valuation. Any assets or liabilities denominated in currencies other than the U.S. dollar are converted into U.S. dollars at the current market rates on the date of valuation as quoted by one or more sources.
If market quotations are not readily available, securities will be valued at their fair market value as determined using the “fair value” procedures approved by the Board. Fair value pricing involves subjective judgments and it is possible that the fair value determined for a security may be materially different than the value that could be realized upon the sale of that security. The fair value prices can differ from market prices when they become available or when a price becomes available. The Board has designated the Adviser as its valuation designee to execute these procedures. The Adviser may also enlist third party consultants such as an audit firm or financial officer of a security issuer on an as-needed basis to assist in determining a security-specific fair value. These securities are either categorized as Level 2 or 3 of the fair value hierarchy depending on the relevant inputs used. The Board reviews the execution of this process and the resultant fair value prices at least quarterly to assure the process produces reliable results.
Equity securities and ETFs are valued at the most recent sale price or official closing price reported on the exchange (U.S. or foreign) or over-the-counter market on which they trade. Securities or ETFs for which no sales are reported are valued at the calculated mean between the most recent bid and asked quotations on the relevant market or, if a mean cannot be determined, at the most recent bid quotation. Equity securities and ETFs are generally categorized as Level 1 of the fair value hierarchy.
Exchange traded options are valued at the mean between the current bid and ask prices on the exchange on which such options are traded. If a mean price is not available, the closing price is used. Exchange trade options are categorized as Level 1. Options with international equity exposure are marked to market using closing prices for the underlying and interpolated option implied volatilities obtained from mid-market prices for options on the same underlying of similar expiries and strike prices. These securities are categorized as Level 2 in the fair value hierarchy.
Debt securities not traded on an exchange may be valued at prices supplied by a pricing agent(s) based on broker or dealer supplied valuations or matrix pricing, a method of valuing securities by reference to the value of other securities with similar characteristics, such as rating, interest rate and maturity. Debt securities are generally categorized as Level 2 of the fair value hierarchy.
Futures contracts are generally valued at the settlement prices established each day on the exchange on which they are traded and are categorized as Level 1.
Reverse repurchase agreements are valued at cost plus accrued interest. These securities are categorized as Level 2 in the fair value hierarchy.
Swap agreements and other derivatives are generally valued daily depending on the type of instrument and reference assets based upon market prices, the mean between bid and asked prices quotations from market makers or by a pricing service or other parties in accordance with the valuation procedures approved by the Board.
Each Fund categorizes the inputs to valuation techniques used to value its investments into a disclosure hierarchy consisting of three levels as shown below:
| ● | Level 1 – Quoted prices in active markets for identical assets that the funds have the ability to access. |
| ● | Level 2 – Other significant observable inputs (including quoted prices for similar securities, interest rates, prepayment speeds, credit risk, etc.). |
| ● | Level 3 – Significant unobservable inputs (including each Fund’s own assumptions in determining the fair value of investments). |
The inputs or methodology used for valuing securities are not necessarily an indication of the risk associated with investing in those securities.
The following is a summary of the valuations as of June 30, 2024 for each Fund based upon the three levels defined above:
Simplify Exchange Traded Funds
Notes to Financial Statements (Continued)
June 30, 2024
Simplify Enhanced Income ETF
| Assets | | Level 1 | | | Level 2 | | | Level 3 | | | Total | |
| U.S. Treasury Bills | | $ | 436,492,553 | | | $ | — | | | $ | — | | | $ | 436,492,553 | |
| Purchased Options | | | 424,943 | | | | — | | | | — | | | | 424,943 | |
| TOTAL | | $ | 436,917,496 | | | $ | — | | | $ | — | | | $ | 436,917,496 | |
| Liabilities | | Level 1 | | | Level 2 | | | Level 3 | | | Total | |
| Written Options | | $ | (1,030,325 | ) | | $ | — | | | $ | — | | | $ | (1,030,325 | ) |
| TOTAL | | $ | (1,030,325 | ) | | $ | — | | | $ | — | | | $ | (1,030,325 | ) |
Simplify Stable Income ETF
| Assets | | Level 1 | | | Level 2 | | | Level 3 | | | Total | |
| U.S. Treasury Bills | | $ | 138,812,611 | | | $ | — | | | $ | — | | | $ | 138,812,611 | |
| TOTAL | | $ | 138,812,611 | | | $ | — | | | $ | — | | | $ | 138,812,611 | |
| Liabilities | | Level 1 | | | Level 2 | | | Level 3 | | | Total | |
| Written Options | | $ | (265,625 | ) | | $ | — | | | $ | — | | | $ | (265,625 | ) |
| TOTAL | | $ | (265,625 | ) | | $ | — | | | $ | — | | | $ | (265,625 | ) |
Simplify Bitcoin Strategy PLUS Income ETF
| Assets | | Level 1 | | | Level 2 | | | Level 3 | | | Total | |
| U.S. Treasury Bills | | $ | 56,639,244 | | | $ | — | | | $ | — | | | $ | 56,639,244 | |
| Purchased Options | | | 35,956 | | | | — | | | | — | | | | 35,956 | |
| TOTAL | | $ | 56,675,200 | | | $ | — | | | $ | — | | | $ | 56,675,200 | |
| Liabilities | | Level 1 | | | Level 2 | | | Level 3 | | | Total | |
| Written Options | | $ | (97,485 | ) | | $ | — | | | $ | — | | | $ | (97,485 | ) |
| Reverse Repurchase Agreements | | | — | | | | (38,588,485 | ) | | | — | | | | (38,588,485 | ) |
| Futures | | | (1,074,950 | ) | | | — | | | | — | | | | (1,074,950 | ) |
| TOTAL | | $ | (1,172,435 | ) | | $ | (38,588,485 | ) | | $ | — | | | $ | (39,760,920 | ) |
Simplify Volatility Premium ETF
| Assets | | Level 1 | | | Level 2 | | | Level 3 | | | Total | |
| U.S. Treasury Bills | | $ | 1,264,499,858 | | | $ | — | | | $ | — | | | $ | 1,264,499,858 | |
| Exchange-Traded Funds | | | 316,090,443 | | | | — | | | | — | | | | 316,090,443 | |
| Purchased Options | | | 1,489,247 | | | | — | | | | — | | | | 1,489,247 | |
| U.S. Government Obligations | | | 97,891 | | | | — | | | | — | | | | 97,891 | |
| Futures | | | 1,031,720 | | | | — | | | | — | | | | 1,031,720 | |
| TOTAL | | $ | 1,583,209,159 | | | $ | — | | | $ | — | | | $ | 1,583,209,159 | |
| Liabilities | | Level 1 | | | Level 2 | | | Level 3 | | | Total | |
| Written Options | | $ | (1,257,593 | ) | | $ | — | | | $ | — | | | $ | (1,257,593 | ) |
| Reverse Repurchase Agreements | | | — | | | | (585,859,312 | ) | | | — | | | | (585,859,312 | ) |
| TOTAL | | $ | (1,257,593 | ) | | $ | (585,859,312 | ) | | $ | — | | | $ | (587,116,905 | ) |
Cash
Cash consists of cash on deposit with a major financial institution which may exceed federally insured limits.
Simplify Exchange Traded Funds
Notes to Financial Statements (Continued)
June 30, 2024
Investment Transactions and Related Income
For financial reporting purposes, investment transactions are reported on the trade date. However, for daily NAV determination, portfolio securities transactions are reflected no later than in the first calculation on the first business day following trade date. Dividend income is recorded on the ex-dividend date. Interest income is recognized on an accrual basis and includes, where applicable, the amortization of premium or accretion of discount based on effective yield. Gains or losses realized on sales of securities are determined using the specific identification method by comparing the identified cost of the security lot sold with the net sales proceeds. Dividend income on the Statements of Operations is shown net of any foreign taxes withheld on income from foreign securities, which are provided for in accordance with each Fund’s understanding of the applicable tax rules and regulations.
Income Tax Information and Distributions to Shareholders
It is the Funds’ policy to comply with all requirements of the Internal Revenue Code of 1986, as amended (“the Code”). Each Fund intends to qualify for and to elect treatment as a separate Regulated Investment Company (“RIC”) under Subchapter M of the Code. It is each Fund’s policy to pay out dividends from net investment income monthly. Taxable net realized gains from investment transactions, reduced by capital loss carryforwards, if any, will be declared and distributed to shareholders at least annually. The capital loss carryforward amount, if any, will be available to offset future net capital gains. Each Fund may occasionally be required to make supplemental distributions at some other time during the year. Each Fund reserves the right to declare special distributions if, in its reasonable discretion, such action is necessary or advisable to preserve the status of a Fund as a RIC or to avoid imposition of income or excise taxes on undistributed income. Dividends and distributions to shareholders, if any, will be recorded on the ex-dividend date. The amount of dividends and distributions from net investment income and net realized capital gains will be determined in accordance with Federal income tax regulations which may differ from U.S. GAAP. These “book/tax” differences are either considered temporary or permanent in nature. To the extent these differences are permanent in nature, (e.g., return of capital and distribution reclassifications), such amounts are reclassified within the composition of net assets based on their federal tax basis treatment; temporary differences (e.g., wash sales and straddles) do not require a reclassification. Dividends and distributions, which exceed earnings and profits for the full year for tax purposes, will be reported as a tax return of capital.
In accordance with U.S. GAAP requirements regarding accounting for uncertainties in income taxes, management has analyzed each Fund’s tax positions expected to be taken on foreign, federal and state income tax returns for all open tax years and has concluded that no provision for income tax is required in any Fund’s financial statement.
Each Fund will recognize interest and penalties, if any, related to uncertain tax positions as income tax expense on the Statement of Operations.
4. Derivative Financial Instruments
In the normal course of business, a Fund uses derivative contracts in connection with its proprietary trading activities. Derivative contracts are subject to additional risks that can result in a loss of all or part of an investment. A Fund’s derivative activities and exposure to derivative contracts are classified by the following primary underlying risks: interest rate, credit, foreign exchange, commodity price, and equity price. In addition to its primary underlying risks, the Fund is also subject to additional counterparty risk due to inability of its counterparties to meet the terms of their contracts.
FASB Accounting Standards Codification, Derivatives and Hedging (“ASC 815”) requires enhanced disclosures about a Fund’s use of, and accounting for, derivative instruments and the effect of derivative instruments on a Fund’s financial position and results of operations. Tabular disclosure regarding derivative fair value and gain/loss by contract type (e.g., interest rate contracts, foreign exchange contracts, credit contracts, etc.) is required and derivatives accounted for as hedging instruments under ASC 815 must be disclosed separately from those that do not qualify for hedge accounting. Even though a Fund may use derivatives in an attempt to achieve an economic hedge, a Fund’s derivatives are not accounted for as hedging instruments under ASC 815 because investment companies account for their derivatives at fair value and record any changes in fair value in current period earnings.
Futures Contracts
A futures contract provides for the future sale by one party and purchase by another party of a specified amount of a specific financial instrument (e.g., units of a stock index) for a specified price, date, time and place designated at the time the contract is made. Brokerage fees are paid when a futures contract is bought or sold and margin deposits must be maintained. Unlike when a Fund purchases or sells a security, no price would be paid or received by a Fund upon the purchase or sale of a futures contract. Upon entering into a futures contract, and to maintain a Fund’s open positions in futures contracts, a Fund would be required to deposit with its custodian or futures broker in a segregated account in the name of the futures broker an amount of cash, U.S. government securities, suitable money market instruments, or other liquid securities, known as “initial margin.” The margin required for a particular futures contract is set by the exchange on which the contract is traded, and may be significantly modified from time to time by the exchange during the term of the contract. If the price of an open futures contract changes (by increase in underlying instrument or index in the case of a sale or by decrease in the case of a purchase) so that the loss on the futures contract reaches a point at which the margin on deposit does not satisfy margin requirements, the broker will require an increase in the margin. However, if the value of a position increases because of favorable price changes in the futures contract so that the margin deposit exceeds the required margin, the broker will pay the excess to a Fund.
Simplify Exchange Traded Funds
Notes to Financial Statements (Continued)
June 30, 2024
These subsequent payments, called “variation margin,” to and from the futures broker, are made on a daily basis as the price of the underlying assets fluctuate making the long and short positions in the futures contract more or less valuable, a process known as “marking to the market.” A Fund expects to earn interest income on margin deposits.
The primary risks associated with the use of futures contracts are (a) the imperfect correlation between the change in market value of the instruments held by a Fund and the price of the forward or futures contract; (b) possible lack of a liquid secondary market for a forward or futures contract and the resulting inability to close a forward or futures contract when desired; (c) investments in futures contracts involves leverage, which means a small percentage of assets in futures can have a disproportionately large impact on a Fund and the Fund can lose more than the principal amount invested; (d) losses caused by unanticipated market movements, which are potentially unlimited; (e) the adviser’s inability to predict correctly the direction of securities prices, interest rates, currency exchange rates and other economic factors; (f) the possibility that the counterparty will default in the performance of its obligations; and (g) if the Fund has insufficient cash, it may have to sell securities from its portfolio to meet daily variation margin requirements, and a Fund may have to sell securities at a time when it may be disadvantageous to do so.
Option Contracts
A Fund may purchase and write (i.e., sell) put and call options. Such options may relate to particular securities or stock indices, and may or may not be listed on a domestic or foreign securities exchange and may or may not be issued by the Options Clearing Corporation. Options trading is a highly specialized activity that entails greater than ordinary investment risk. Options may be more volatile than the underlying instruments, and therefore, on a percentage basis, an investment in options may be subject to greater fluctuation than an investment in the underlying instruments themselves.
A call option for a particular security gives the purchaser of the option the right to buy, and the writer (seller) the obligation to sell, the underlying security at the stated exercise price at any time prior to the expiration of the option, regardless of the market price of the security. The premium paid to the writer is in consideration for undertaking the obligation under the option contract. A put option for a particular security gives the purchaser the right to sell the security at the stated exercise price at any time prior to the expiration date of the option, regardless of the market price of the security. Stock index options are put options and call options on various stock indices. In most respects, they are identical to listed options on common stocks. The primary difference between stock options and index options occurs when index options are exercised. In the case of stock options, the underlying security, common stock, is delivered. However, upon the exercise of an index option, settlement does not occur by delivery of the securities comprising the index. The option holder who exercises the index option receives an amount of cash if the closing level of the stock index upon which the option is based is greater than, in the case of a call, or less than, in the case of a put, the exercise price of the option. This amount of cash is equal to the difference between the closing price of the stock index and the exercise price of the option expressed in dollars times a specified multiple. A stock index fluctuates with changes in the market value of the stocks included in the index.
Premiums paid on options purchased and premiums received on options written, as well as the daily fluctuation in market value, are included in investments at value and options written at value, respectively, in the Statements of Assets and Liabilities. When an instrument is purchased or sold through the exercise of an option, the premium is offset against the cost or proceeds of the underlying instrument. When an option expires, a realized gain or loss is recorded in the Statements of Operations to the extent of the premiums received or paid. When an option is closed or sold, a gain or loss is recorded in the Statements of Operations to the extent the cost of the closing transaction exceeds the premiums received or paid. When the Funds write a call option, such option is typically “covered,” meaning that they hold the underlying instrument subject to being called by the option counterparty. When the Funds write a put option, cash is segregated in an amount sufficient to cover the obligation. These amounts, which are considered restricted, are included in cash pledged as collateral for options written in the Statements of Assets and Liabilities.
Swaps. Swap agreements are agreements between a Fund and a counterparty to exchange cash flows, assets, foreign currencies or market-linked returns at specified intervals. Swap agreements are privately negotiated in the OTC market (OTC swaps) or may be executed on a registered commodities exchange (centrally cleared swaps). Swaps are marked-to-market daily and the change in value is recorded as a component of unrealized appreciation/depreciation of swap contracts. The value of the swap will typically impose collateral posting obligations on the party that is considered out-of-the-money on the swap. Upfront payments made/received by the fund, if any, are amortized/accreted for financial reporting purposes, with the unamortized/unaccreted portion included in the Statement of assets and liabilities. A termination payment by the counterparty or the fund is recorded as realized gain or loss, as well as the net periodic payments received or paid by the fund. Entering into swap agreements involves, to varying degrees, elements of credit, market and documentation risk that may provide outcomes that produce losses in excess of the amounts recognized on the Statement of assets and liabilities. Such risks involve the possibility that there will be no liquid market for the swap, or that a counterparty may default on its obligation or delay payment under the swap terms. The counterparty may disagree or contest the terms of the swap. In addition to interest rate risk, market risks may also impact the swap. The fund may also suffer losses if it is unable to terminate or assign outstanding swaps or reduce its exposure through offsetting transactions.
The following table summarizes the value of the Funds’ derivative instruments held as of June 30, 2024 and the related location in the accompanying Statements of Assets and Liabilities or Consolidated Statements of Assets and Liabilities, presented by underlying risk exposure:
Simplify Exchange Traded Funds
Notes to Financial Statements (Continued)
June 30, 2024
| Fund | | Asset Derivatives | | | Liability Derivatives | |
| Simplify Enhanced Income ETF | |
| Equity Contracts | | Investments, at value(1) | | $ | 401,213 | | | Investments, at value(1) | | $ | — | |
| Commodity Contracts | | Investments, at value(1) | | $ | 23,730 | | | Investments, at value(1) | | $ | — | |
| Equity Contracts | | Written options | | $ | — | | | Written options | | $ | 947,270 | |
| Commodity Contracts | | Written options | | $ | — | | | Written options | | $ | 83,055 | |
| | | | | | | | | | | | | |
| Simplify Stable Income ETF | |
| Interest Rate Contracts | | Written options | | $ | — | | | Written options | | $ | 265,625 | |
| | | | | | | | | | | | | |
| Simplify Bitcoin Strategy PLUS Income ETF | |
| Commodity Contracts | | Unrealized appreciation on futures contracts* | | $ | — | | | Unrealized depreciation on futures contracts* | | $ | 1,074,950 | |
| Equity Contracts | | Investments, at value(1) | | $ | 33,609 | | | Investments, at value(1) | | $ | — | |
| Commodity Contracts | | Investments, at value(1) | | $ | 2,347 | | | Investments, at value(1) | | $ | — | |
| Equity Contracts | | Written options | | $ | — | | | Written options | | $ | 89,270 | |
| Commodity Contracts | | Written options | | $ | — | | | Written options | | $ | 8,215 | |
| | | | | | | | | | | | | |
| Simplify Volatility Premium ETF | |
| Equity Contracts | | Unrealized appreciation on futures contracts* | | $ | 1,031,720 | | | Unrealized depreciation on futures contracts* | | $ | — | |
| Equity Contracts | | Investments, at value(1) | | $ | 1,489,247 | | | Investments, at value(1) | | $ | — | |
| Equity Contracts | | Written options | | $ | — | | | Written options | | $ | 62,280 | |
| Interest Rate Contracts | | Written options | | $ | — | | | Written options | | $ | 1,195,313 | |
| * | Includes cumulative unrealized appreciation or unrealized cumulative depreciation on futures contracts as disclosed in the Schedule of Investments. |
| (1) | Purchased option contracts are included in Investments within the Statements of Assets and Liabilities or Consolidated Statements of Assets and Liabilities. |
For the year ended June 30, 2024, realized gains/(losses) and the change in unrealized appreciation/(depreciation) on purchased option contracts (a) by risk type, as disclosed in the Statements of Operations, is as follows:
| Fund | | Risk Type | | Realized
Gain/(Loss) | | | Change in Unrealized
Appreciation/ (Depreciation) | |
| Simplify Enhanced Income ETF | | Equity | | $ | (3,980,159 | ) | | $ | (196,373 | ) |
| Simplify Enhanced Income ETF | | Commodity | | | (203,803 | ) | | | (62,378 | ) |
| Simplify Enhanced Income ETF | | Interest Rate | | | (478,484 | ) | | | — | |
| Simplify Stable Income ETF | | Equity | | | 6,705 | | | | — | |
| Simplify Stable Income ETF | | Interest Rate | | | (283,327 | ) | | | — | |
| Simplify Bitcoin Strategy PLUS Income ETF | | Equity | | | (331,871 | ) | | | (11,575 | ) |
| Simplify Bitcoin Strategy PLUS Income ETF | | Commodity | | | (275,392 | ) | | | (6,169 | ) |
| Simplify Bitcoin Strategy PLUS Income ETF | | Interest Rate | | | (107,419 | ) | | | — | |
| Simplify Volatility Premium ETF | | Equity | | | (5,989,938 | ) | | | (2,420,530 | ) |
| Simplify Volatility Premium ETF | | Interest Rate | | | (568,125 | ) | | | — | |
| (a) | Purchased option contracts are included in Net Realized Gain (Loss) on Investments within the Statement of Operations or Consolidated Statement of Operations. |
Simplify Exchange Traded Funds
Notes to Financial Statements (Continued)
June 30, 2024
For the year ended June 30, 2024, realized gains/(losses) and the change in unrealized appreciation/(depreciation) on futures contracts by risk type, as disclosed in the Statements of Operations, is as follows:
| Fund | | Risk Type | | Realized
Gain/(Loss) | | | Change in Unrealized
Appreciation/ (Depreciation) | |
| Simplify Stable Income ETF | | Interest Rate | | $ | 574,367 | | | $ | — | |
| Simplify Bitcoin Strategy PLUS Income ETF | | Commodity | | | 10,736,545 | | | | (1,325,568 | ) |
| Simplify Volatility Premium ETF | | Equity | | | 78,596,665 | | | | (3,379,649 | ) |
| Simplify Volatility Premium ETF | | Interest Rate | | | (7,957,047 | ) | | | — | |
For the year ended June 30, 2024, realized gains/(losses) and the change in unrealized appreciation/(depreciation) on written option contracts by risk type, as disclosed in the Statements of Operations, is as follows:
| Fund | | Risk Type | | Realized
Gain/(Loss) | | | Change in Unrealized
Appreciation/ (Depreciation) | |
| Simplify Enhanced Income ETF | | Equity | | $ | 7,787,990 | | | $ | 246,501 | |
| Simplify Enhanced Income ETF | | Commodity | | | 264,701 | | | | 186,721 | |
| Simplify Enhanced Income ETF | | Interest Rate | | | 233,294 | | | | — | |
| Simplify Stable Income ETF | | Equity | | | (21,527 | ) | | | — | |
| Simplify Stable Income ETF | | Interest Rate | | | 301,725 | | | | 115,918 | |
| Simplify Bitcoin Strategy PLUS Income ETF | | Equity | | | 683,138 | | | | 19,464 | |
| Simplify Bitcoin Strategy PLUS Income ETF | | Commodity | | | 479,051 | | | | 18,468 | |
| Simplify Bitcoin Strategy PLUS Income ETF | | Interest Rate | | | 197,102 | | | | — | |
| Simplify Volatility Premium ETF | | Equity | | | 315,534 | | | | 85,946 | |
| Simplify Volatility Premium ETF | | Interest Rate | | | 5,586,828 | | | | 207,233 | |
For the year ended June 30, 2024, the average fiscal quarter end balances of outstanding derivative financial instruments were as follows:
| Fund | | Purchased Option
Contracts
(Contract Value) | | | Futures
Contracts
(Notional Value) | | | Written Option
Contracts
(Contract Value) | |
| Simplify Enhanced Income ETF | | $ | 160,054 | | | $ | — | | | $ | (355,674 | ) |
| Simplify Stable Income ETF | | | 23,851 | | | | — | | | | (286,347 | ) |
| Simplify Bitcoin Strategy PLUS Income ETF | | | 15,672 | | | | 24,318,195 | | | | (38,798 | ) |
| Simplify Volatility Premium ETF | | | 1,007,277 | | | | (103,714,807 | ) | | | (735,894 | ) |
Certain Funds may enter into International Swaps and Derivatives Association, Inc. Master Agreements (“ISDA Master Agreements”) or similar master agreements (collectively, “Master Agreements”) with its OTC derivative contract counterparties in order to, among other things, reduce its credit risk to counterparties. ISDA Master Agreements include provisions for general obligations, representations, collateral and events of default or termination. Under an ISDA Master Agreement, a Fund typically may offset with the counterparty certain derivative financial instrument’s payables and/or receivables with collateral held and/or posted and create one single net payment (close-out netting) in the event of default or termination.
The Funds did not have OTC derivatives subject to a master netting agreement or similar arrangement (collectively referred to as "MNA") as of June 30, 2024.
Reverse repurchase agreements are executed under standardized netting agreements. A netting arrangement creates an enforceable right of set-off that becomes effective, and affects the realization of settlement on individual assets, liabilities and collateral amounts, only following a specified event of default or early termination. Default events may include the failure to make payments or deliver securities timely, material adverse changes in financial condition or insolvency, the breach of minimum regulatory capital requirements, or loss of license, charter or other legal authorization necessary to perform under the contract. These agreements mitigate counterparty credit risk by providing for a single net settlement with a counterparty of all financial transactions covered by the agreement in an event of default as defined under such agreement.
Simplify Exchange Traded Funds
Notes to Financial Statements (Continued)
June 30, 2024
Offsetting of Reverse Repurchase Agreements Liabilities
Simplify Bitcoin Strategy PLUS Income ETF
| | | Gross Amounts of | | | Gross Amounts
Offset in the
Consolidated
Statements of | | | Net Amounts
Presented in the
Consolidated
Statements of | | | Gross Amounts Not Offset in the
Statements of Assets and Liabilities | |
| | | Recognized
Liabilities | | | Assets and
Liabilities | | | Assets and
Liabilities | | | Financial
Instruments(a) | | | Collateral
Pledged(a) | | | Net Amount
Payable | |
| Reverse Repurchase Agreements | | $ | 38,588,485 | | | $ | — | | | $ | 38,588,485 | | | $ | 38,588,485 | | | $ | 38,588,485 | | | $ | — | |
| (a) | These amounts are limited to the derivatives asset/liability balance and, accordingly, do not include excess collateral received/pledged. |
Offsetting of Reverse Repurchase Agreements Liabilities
Simplify Volatility Premium ETF
| | | Gross Amounts of | | | Gross Amounts
Offset in the
Consolidated
Statements of | | | Net Amounts
Presented in the
Consolidated
Statements of | | | Gross Amounts Not Offset in the
Statements of Assets and Liabilities | |
| | | Recognized
Liabilities | | | Assets and
Liabilities | | | Assets and
Liabilities | | | Financial
Instruments(a) | | | Collateral
Pledged(a) | | | Net Amount
Payable | |
| Reverse Repurchase Agreements | | $ | 585,859,312 | | | $ | — | | | $ | 585,859,312 | | | $ | 585,859,312 | | | $ | 585,859,312 | | | $ | — | |
| (a) | These amounts are limited to the derivatives asset/liability balance and, accordingly, do not include excess collateral received/pledged. |
5. Reverse Repurchase Agreements
Reverse repurchase agreements involve the sale of securities held by the Simplify Bitcoin Strategy PLUS Income ETF and Simplify Volatility Premium ETF with an agreement to repurchase the securities at an agreed-upon price, date and interest payment. The Funds may borrow for investment purposes indirectly using reverse repurchase agreements. Cash received in exchange for securities delivered plus accrued interest payments to be made by the Funds to counterparties are reflected as a liability on the Consolidated Statements of Assets and Liabilities. Interest payments made by the Funds to counterparties are recorded as a component of interest expense on each Fund’s Consolidated Statements of Operations. Borrowing may cause the Funds to liquidate positions under adverse market conditions to satisfy its repayment obligations. The use of reverse repurchase agreements involves risks that are different from those associated with ordinary portfolio securities transactions. The Funds are subject to credit risk (i.e., the risk that a counterparty is or is perceived to be unwilling or unable to meet its contractual obligations) with respect to the security it expects to receive back from a counterparty. If a counterparty becomes bankrupt or fails to perform its obligations, or if any collateral posted by the counterparty for the benefit of the Funds is insufficient or there are delays in the Funds’ ability to access such collateral, the value of an investment in the Funds may decline.
For the year ended June 30, 2024, the average amount of reverse repurchase agreements outstanding and the daily weighted average interest rate for the Simplify Bitcoin Strategy PLUS Income ETF and Simplify Volatility Premium ETF were $38,388,021 and 5.40%, and $174,614,119 and 5.51%, respectively.
The following table indicates the total amount of reverse repurchased agreements, including accrued interest, reconciled to the Simplify Bitcoin Strategy PLUS Income ETF liability as of June 30, 2024:
| | | Less than
30 days | | | 30-90 days | | | Greater than
90 days | | | Total | |
| U.S. Government Obligations | | $ | — | | | $ | 9,884,200 | | | $ | 28,704,285 | | | $ | 38,588,485 | |
Simplify Exchange Traded Funds
Notes to Financial Statements (Continued)
June 30, 2024
The following table indicates the total amount of reverse repurchased agreements, including accrued interest, reconciled to the Simplify Volatility Premium ETF liability as of June 30, 2024:
| | | Less than
30 days | | | 30-90 days | | | Greater than
90 days | | | Total | |
| U.S. Government Obligations | | $ | 585,859,312 | | | $ | — | | | $ | — | | | $ | 585,859,312 | |
6. Investment Advisory Agreement and Other Agreements
The Adviser has overall responsibility for the general management and administration of the Funds, subject to the oversight of the Board. Under an investment advisory agreement between the Trust, on behalf of the Funds, and the Adviser (the “Investment Advisory Agreement”), the Adviser is responsible for arranging sub-advisory, transfer agency, custody, fund administration, and all other non-distribution related services for the Funds to operate.
For its investment advisory services to the Funds below, the Adviser was entitled to receive a management fee based on each Fund’s average daily net assets, computed and accrued daily and payable monthly, at an annual rate equal to:
| | | Management | |
| Fund | | Fee | |
| Simplify Enhanced Income ETF | | | 0.50 | % |
| Simplify Stable Income ETF | | | 0.35 | % |
| Simplify Bitcoin Strategy PLUS Income ETF | | | 0.85 | % |
| Simplify Volatility Premium ETF | | | 0.50 | % |
Under the Investment Advisory Agreement, the Adviser has agreed to pay substantially all the operating expenses of the Funds, excluding interest expenses, taxes, brokerage expenses, Rule 12b-1 fees (if any), acquired fund fees and expenses, expenses incidental to a meeting of a Fund’s shareholders and the Management Fee. In addition to the excluded operating expenses, the Funds also pay non-operating expenses such as litigation and indemnification expenses and other expenses determined to be extraordinary by the Trust.
The Board has adopted a Distribution and Service Plan pursuant to Rule 12b-1 under the 1940 Act. In accordance with its Rule 12b-1 plan, each Fund is authorized to pay an amount up to 0.25% of its average daily net assets each year to finance activities primarily intended to result in the sale of Creation Units of the Fund or the provision of investor services. No Rule 12b-1 fees are currently paid by the Funds and there are no plans to impose these fees. However, in the event Rule 12b-1 fees are charged in the future, they will be paid out of the Fund’s assets, and directly impact the NAV per share of each Fund.
The Bank of New York Mellon, a wholly-owned subsidiary of The Bank of New York Mellon Corporation, serves as Administrator, Custodian, Accounting Agent and Transfer Agent for each Fund.
Foreside Financial Services, LLC (the “Distributor”) serves as the distributor of Creation Units for each Fund on an agency basis. The Distributor does not maintain a secondary market in shares of a Fund. Foreside Fund Officer Services, LLC a related party to the Distributor also serves as the Trust’s Compliance Officer.
A Trustee and certain Officers of the Trust are also employees of the Adviser and/or the Distributor.
7. Investment Transactions
Purchases and sales of securities, other than short-term securities, U.S. Government Securities and in-kind transactions were as follows:
| Fund | | Purchases | | | Sales | |
| Simplify Enhanced Income ETF | | $ | — | | | $ | — | |
| Simplify Stable Income ETF | | | — | | | | — | |
| Simplify Bitcoin Strategy PLUS Income ETF | | | — | | | | — | |
| Simplify Volatility Premium ETF | | | 485,885,151 | | | | 158,098,807 | |
8. Fund Share Transactions
The Funds, except the Simplify Bitcoin Strategy PLUS Income ETF, issue and redeem Shares at NAV only in large blocks of 25,000 Shares (each block of Shares is called a “Creation Unit”). The Simplify Bitcoin Strategy PLUS Income ETF, issues and redeems Shares at NAV only in large blocks of 10,000 Shares. Creation Units are issued and redeemed primarily in-kind for securities but may include cash. Individual Shares may only be purchased and sold in secondary market transactions through brokers. Except when aggregated in Creation Units in transactions with Authorized Participants, the Shares are not redeemable securities of the Funds.
Fund Shares are listed and traded on the Exchange on each day that the Exchange is open for business (“Business Day”). Each Fund’s Shares may only be purchased and sold on the Exchange through a broker-dealer. Because each Fund’s Shares trade at market prices rather than at their NAV, Shares may trade at a price equal to the NAV, greater than NAV (premium) or less than NAV (discount).
Simplify Exchange Traded Funds
Notes to Financial Statements (Continued)
June 30, 2024
Authorized participants pay a fixed transaction fee of $500 to the shareholder servicing agent when purchasing and redeeming Creation Units of a Fund. The transaction fee is used to defray the costs associated with the issuance and redemption of Creation Units. In addition to the fixed transaction fee, the Funds may charge an additional maximum 3% of the amount invested variable fee for creations and redemptions in cash, to offset brokerage and impact expenses associated with a cash transaction.
9. Federal Income Taxes
For the year ended June 30, 2024, the effect of permanent “book/tax” reclassifications to the components of net assets are included below. These differences are primarily due to redemptions-in-kind, non-deductible excise tax paid, prior year true ups, distributions in excess, return of capital distributions, and controlled foreign corporations income reversal.
| Fund | | Distributable
earnings (loss) | | | Paid-in
Capital | |
| Simplify Enhanced Income ETF | | $ | — | | | $ | — | |
| Simplify Stable Income ETF | | | — | | | | — | |
| Simplify Bitcoin Strategy PLUS Income ETF | | | (1,360,437 | ) | | | 1,360,437 | |
| Simplify Volatility Premium ETF | | | (5,714,233 | ) | | | 5,714,233 | |
The tax character of dividends and distributions declared for the year ended June 30, 2024 were as follows:
| Fund | | Ordinary
Income* | | | Long-Term
Capital Gains | | | Return of
Capital | |
| Simplify Enhanced Income ETF | | $ | 15,459,476 | | | $ | 78,652 | | | $ | 7,633,526 | |
| Simplify Stable Income ETF | | | 3,918,784 | | | | 15,392 | | | | 2,109,218 | |
| Simplify Bitcoin Strategy PLUS Income ETF | | | 8,229,545 | | | | 166,512 | | | | — | |
| Simplify Volatility Premium ETF | | | 103,075,545 | | | | — | | | | — | |
| * | For tax purposes short-term capital gain distributions are considered ordinary income distributions. |
The tax character of dividends and distributions declared for the year ended June 30, 2023 were as follows:
| Fund | | Ordinary
Income* | | | Long-Term
Capital Gains | | | Return of
Capital | |
| Simplify Enhanced Income ETF | | $ | 450,816 | | | $ | 2,225 | | | $ | — | |
| Simplify Stable Income ETF | | | 257,816 | | | | 535 | | | | — | |
| Simplify Bitcoin Strategy PLUS Income ETF | | | 1,171,779 | | | | 26,396 | | | | — | |
| Simplify Volatility Premium ETF | | | 28,995,598 | | | | — | | | | — | |
| * | For tax purposes short-term capital gain distributions are considered ordinary income distributions. |
As of June 30, 2024, the components of accumulated earnings (losses) on a tax basis were as follows:
| Fund | | Undistributed
Ordinary
Income | | | Undistributed
Long-term
Capital Gains | | | Temporary
Book/Tax
Differences(a) | | | Net Unrealized
Appreciation
(Depreciation) | | | Accumulated
Capital and
Other Losses | | | Post-October/
Late-year
Ordinary Loss
Deferrals | | | Distributable
earnings (loss) | |
| Simplify Enhanced Income ETF | | $ | — | | | $ | — | | | $ | — | | | $ | 226,994 | | | $ | — | | | $ | — | | | $ | 226,994 | |
| Simplify Stable Income ETF | | | — | | | | — | | | | — | | | | 819 | | | | — | | | | — | | | | 819 | |
| Simplify Bitcoin Strategy PLUS | | | | | | | | | | | | | | | | | | | | | | | | | | | | |
| Income ETF | | | 9,756,161 | | | | 218,521 | | | | — | | | | (1,054,903 | ) | | | — | | | | — | | | | 8,919,779 | |
| Simplify Volatility Premium ETF | | | 8,756,043 | | | | — | | | | — | | | | (1,764,924 | ) | | | (14,271,665 | ) | | | — | | | | (7,280,546 | ) |
| (a) | The temporary book/tax differences was attributable primarily to dividend payable, straddles deferral and Subpart F income. |
Simplify Exchange Traded Funds
Notes to Financial Statements (Continued)
June 30, 2024
At June 30, 2024, gross unrealized appreciation and depreciation of investments owned by each Fund, based on cost for federal income tax purposes were as follows:
| Fund | | Tax Cost | | | Gross
Unrealized
Appreciation | | | Gross
Unrealized
Depreciation | | | Net Unrealized
Appreciation
(Depreciation) | |
| Simplify Enhanced Income ETF | | $ | 436,944,430 | | | $ | 58,350 | | | $ | (85,284 | ) | | $ | (26,934 | ) |
| Simplify Stable Income ETF | | | 138,811,792 | | | | 831 | | | | (12 | ) | | | 819 | |
| Simplify Bitcoin Strategy PLUS Income ETF | | | 56,679,476 | | | | 4,103 | | | | (8,379 | ) | | | (4,276 | ) |
| Simplify Volatility Premium ETF | | | 1,585,060,029 | | | | 2,924,140 | | | | (5,806,730 | ) | | | (2,882,590 | ) |
The differences between book-basis and tax-basis components of net assets are primarily attributable to the tax deferral of losses on wash sales, grantor trust adjustments, section 1256 mark-to-market treatment of derivatives and return of capital basis adjustments from underlying investments.
At June 30, 2024, for federal income tax purposes, the Funds had capital loss carryforwards available as shown in the table below, to the extent provided by regulations, to offset future capital gains for an unlimited period. To the extent that these capital loss carryforwards are used to offset future capital gains, it is probable that the capital gains so offset will not be distributed to shareholders.
| Fund | | Short-Term | | | Long-Term | | | Total Amount | |
| Simplify Enhanced Income ETF | | $ | — | | | $ | — | | | $ | — | |
| Simplify Stable Income ETF | | | — | | | | — | | | | — | |
| Simplify Bitcoin Strategy PLUS Income ETF | | | — | | | | — | | | | — | |
| Simplify Volatility Premium ETF | | | 12,427,054 | | | | 1,844,611 | | | | 14,271,665 | |
10. Subsequent Events
Management has evaluated subsequent events through the date of issuance of these financial statements and has determined that there are no subsequent events that require adjustment to, or disclosure in, the financial statement.
Simplify Exchange Traded Funds
Report of Independent Registered Public Accounting Firm
To the Shareholders and Board of Trustees of
Simplify Exchange Traded Funds
Opinion on the Financial Statements
We have audited the accompanying statements of assets and liabilities or consolidated statements of assets and liabilities, including the schedules of investments or consolidated schedules of investments, of the funds listed below (the “Funds”), each a series of Simplify Exchange Traded Funds, as of June 30, 2024, the related statements of operations or consolidated statements of operation, the consolidated statements of cash flows, the statements of changes in net assets or consolidated statements of changes in net assets, the financial highlights or consolidated financial highlights for each of the periods indicated below, and the related notes (collectively referred to as the “financial statements”). In our opinion, the financial statements present fairly, in all material respects, the financial position of each of the Funds as of June 30, 2024, the results of their operations and their cash flows, the changes in net assets, and the financial highlights for each of the periods indicated below in conformity with accounting principles generally accepted in the United States of America.
Fund Name | | Statements of
Operations | | Statements of
Cash Flows | | Statements of
Changes in Net Assets | |
Financial Highlights |
| Simplify Enhanced Income ETF and Simplify Stable Income ETF | | For the year ended June 30, 2024 | | Not applicable | | For the year ended June 30, 2024 and for the period from October 28, 2022 (commencement of operations) through June 30, 2023 |
| Simplify Bitcoin Strategy PLUS Income ETF | | Consolidated for the year ended June 30, 2024 | | Consolidated for the year ended June 30, 2024 | | Consolidated for the year ended June 30, 2024 and for the period from September 30, 2022 (commencement of operations) through June 30, 2023 |
| Simplify Volatility Premium ETF | | Consolidated for the year ended June 30, 2024 | | Consolidated for the year ended June 30, 2024 | | Consolidated for the years ended June 30, 2024 and 2023 | | Consolidated for the years ended June 30, 2024, 2023, and 2022, and for the period from May 13, 2021 (commencement of operations) through June 30, 2021 |
Basis for Opinion
These financial statements are the responsibility of the Funds’ management. Our responsibility is to express an opinion on the Funds’ financial statements based on our audits. We are a public accounting firm registered with the Public Company Accounting Oversight Board (United States) (“PCAOB”) and are required to be independent with respect to the Funds in accordance with the U.S. federal securities laws and the applicable rules and regulations of the Securities and Exchange Commission and the PCAOB.
We conducted our audits in accordance with the standards of the PCAOB. Those standards require that we plan and perform the audit to obtain reasonable assurance about whether the financial statements are free of material misstatement whether due to error or fraud.
Our audits included performing procedures to assess the risks of material misstatement of the financial statements, whether due to error or fraud, and performing procedures that respond to those risks. Such procedures included examining, on a test basis, evidence regarding the amounts and disclosures in the financial statements. Our procedures included confirmation of securities owned as of June 30, 2024, by correspondence with the custodian and brokers; when replies were not received from brokers, we performed other auditing procedures. Our audits also included evaluating the accounting principles used and significant estimates made by management, as well as evaluating the overall presentation of the financial statements. We believe that our audits provide a reasonable basis for our opinion.
We have served as the auditor of one of more funds advised by Simplify Asset Management, Inc. since 2020.

COHEN & COMPANY, LTD.
Cleveland, Ohio
August 29, 2024
Simplify Exchange Traded Funds
Additional Information (Unaudited)
Discount & Premium Information
Information regarding how often shares of each Fund traded on NYSE Arca or NASDAQ, as applicable, at a price above (i.e., at a premium) or below (i.e., at a discount) the NAV of each Fund can be found at www.simplify.us.
Tax Information
Form 1099-DIV and other year-end tax information provide shareholders with actual calendar year amounts that should be included in their tax returns. Shareholders should consult their tax advisors.
Each Fund designates the following amounts or, if subsequently determined to be different, the maximum allowable for its year ended June 30, 2024.
| | | Qualified | | | Dividends | |
| | | Dividend | | | Received | |
| Fund | | Income* | | | Deduction | |
| Simplify Enhanced Income ETF | | | 00.00 | % | | | 00.00 | % |
| Simplify Stable Income ETF | | | 00.00 | % | | | 00.00 | % |
| Simplify Bitcoin Strategy PLUS Income ETF | | | 00.00 | % | | | 00.00 | % |
| Simplify Volatility Premium ETF | | | 00.00 | % | | | 00.00 | % |
| * | The above percentage is based on ordinary income dividends paid to shareholders during each Fund’s fiscal year. |
This report must be preceded or accompanied by a prospectus.
(This page intentionally left blank)
Investment Adviser
Simplify Asset Management Inc.
10845 Griffith Peak Drive, 2/F
Las Vegas, NV 89135 |
| Simplify Exchange Traded Funds
10845 Griffith Peak Drive, 2/F
Las Vegas, NV 89135 |
| Custodian, Administrator & Transfer Agent
The Bank of New York Mellon
240 Greenwich Street
New York, NY 10286 |
| | | | | |
|
| Independent Registered Public Accounting Firm
Cohen & Company Ltd.
1350 Euclid Ave., Suite 800
Cleveland, OH 44115 |
| Legal Counsel
Thompson Hine LLP
41 South High Street
Suite 1700
Columbus, OH 43215 |
June 30, 2024
Annual Financial Statements and
Other Important Information
Simplify Exchange Traded Funds
Simplify Tara India Opportunities ETF

(This page intentionally left blank)
Simplify Exchange Traded Funds
Table of Contents
This report is provided for the general information of shareholders and is not authorized for distribution to prospective investors unless preceded or accompanied by a current prospectus.
Simplify Tara India Opportunities ETF
Schedule of Investments
June 30, 2024
| | | Shares | | | Value | |
| Common Stocks – 92.9% | | | | | | | | |
| Communication Services – 8.9% | | | | | | | | |
| Bharti Airtel Ltd. | | | 27,682 | | | $ | 479,379 | |
| Info Edge India Ltd. | | | 3,320 | | | | 270,172 | |
| | | | | | | | 749,551 | |
| Consumer Discretionary – 22.6% | | | | | | | | |
| Bajaj Auto Ltd. | | | 4,210 | | | | 479,712 | |
| Campus Activewear Ltd.* | | | 25,820 | | | | 90,306 | |
| Tata Motors Ltd. | | | 40,019 | | | | 474,997 | |
| Titan Co. Ltd. | | | 9,375 | | | | 382,724 | |
| UNO Minda Ltd. | | | 19,517 | | | | 255,596 | |
| Zomato Ltd.* | | | 92,249 | | | | 221,873 | |
| | | | | | | | 1,905,208 | |
| Consumer Staples – 20.8% | | | | | | | | |
| Avenue Supermarts Ltd., 144A*(a) | | | 5,352 | | | | 302,732 | |
| Bikaji Foods International Ltd. | | | 21,769 | | | | 186,813 | |
| Britannia Industries Ltd.* | | | 6,105 | | | | 400,878 | |
| ITC Ltd. | | | 93,383 | | | | 475,832 | |
| Marico Ltd. | | | 30,640 | | | | 225,241 | |
| Nestle India Ltd. | | | 5,165 | | | | 158,049 | |
| | | | | | | | 1,749,545 | |
| Financials – 13.6% | | | | | | | | |
| Central Depository Services India Ltd. | | | 7,741 | | | | 221,613 | |
| ICICI Bank Ltd. | | | 25,836 | | | | 371,673 | |
| Kotak Mahindra Bank Ltd. | | | 12,568 | | | | 271,669 | |
| Multi Commodity Exchange of India Ltd. | | | 5,907 | | | | 277,961 | |
| | | | | | | | 1,142,916 | |
| Health Care – 6.2% | | | | | | | | |
| Apollo Hospitals Enterprise Ltd. | | | 4,061 | | | | 301,246 | |
| JB Chemicals & Pharmaceuticals Ltd. | | | 10,335 | | | | 217,470 | |
| | | | | | | | 518,716 | |
| Industrials – 12.1% | | | | | | | | |
| Craftsman Automation Ltd. | | | 5,574 | | | | 370,423 | |
| Indian Railway Catering & Tourism Corp. Ltd. | | | 18,457 | | | | 218,961 | |
| Titagarh Rail System Ltd. | | | 10,550 | | | | 235,304 | |
| Triveni Turbine Ltd. | | | 25,828 | | | | 192,190 | |
| | | | | | | | 1,016,878 | |
| Information Technology – 8.7% | | | | | | | | |
| Infosys Ltd. | | | 8,081 | | | | 151,832 | |
| LTIMindtree Ltd., 144A(a) | | | 2,685 | | | | 173,394 | |
| PG Electroplast Ltd.* | | | 9,665 | | | | 412,006 | |
| | | | | | | | 737,232 | |
| Total Common Stocks (Cost $7,062,986) | | | | | | | 7,820,046 | |
| | | | | | | | | |
| Total Investments – 92.9% | | | | | | | | |
| (Cost $7,062,986) | | | | | | $ | 7,820,046 | |
| Other Assets in Excess of Liabilities – 7.1% | | | | | | | 601,614 | |
| Net Assets – 100.0% | | | | | | $ | 8,421,660 | |
See Notes to Financial Statements.
Simplify Tara India Opportunities ETF
Schedule of Investments (Continued)
June 30, 2024
| * | Non Income Producing |
| (a) | Security was purchased (sold) pursuant to Rule 144A under the Securities Act of 1933 and may not be resold (repurchased) subject to that rule except to qualified institutional buyers. Unless otherwise noted, Rule 144A securities are deemed to be liquid. Total fair value of Rule 144A securities amounts to $476,126, which represents 5.7% of net assets as of June 30, 2024. |
Summary of Investment Type††
| Investment Categories | | % of
Net Assets | |
| Common Stocks | | | 92.9 | % |
| Total Investments | | | 92.9 | % |
| Other Assets in Excess of Liabilities | | | 7.1 | % |
| Net Assets | | | 100.0 | % |
| †† | The percentage shown for each investment category is the total value of investments in that category as a percentage of the net assets of the Fund. The table depicts the Fund’s investments but may not represent the Fund’s market exposure to certain derivatives, if any, which are included in Other Assets in Excess of Liabilities. |
See Notes to Financial Statements.
Simplify Exchange Traded Funds
Statement of Assets and Liabilities
June 30, 2024
| | | Simplify
Tara India
Opportunities
ETF | |
| Assets | | | | |
| Investments, at value | | $ | 7,820,046 | |
| Cash | | | 605,243 | |
| Foreign currency at value | | | 122,593 | |
| Receivables: | | | | |
| Dividends | | | 13,641 | |
| Total assets | | | 8,561,523 | |
| | | | | |
| Liabilities | | | | |
| Payables: | | | | |
| Deferred foreign capital gains tax | | | 135,862 | |
| Investment advisory fees | | | 4,001 | |
| Total liabilities | | | 139,863 | |
| Net Assets | | $ | 8,421,660 | |
| | | | | |
| Net Assets Consist of | | | | |
| Paid-in capital | | $ | 7,689,502 | |
| Distributable earnings (loss) | | | 732,158 | |
| Net Assets | | $ | 8,421,660 | |
| Number of Common Shares outstanding | | | 300,001 | |
| Net Asset Value, offering and redemption price per share | | $ | 28.07 | |
| Investments, at cost | | $ | 7,062,986 | |
| Foreign currency, at cost | | $ | 122,590 | |
See Notes to Financial Statements.
Simplify Exchange Traded Funds
Statement of Operations
For the Period Ended June 30, 2024
| | | Simplify
Tara India
Opportunities
ETF(1) | |
| Investment Income | | | | |
| Dividend income* | | $ | 14,691 | |
| Interest income | | | 359 | |
| Total income | | | 15,050 | |
| | | | | |
| Expenses | | | | |
| Investment advisory fees | | | 15,938 | |
| Interest expense | | | 8,160 | |
| Total expenses | | | 24,098 | |
| Less fees waived: | | | | |
| Waiver | | | (4,782 | ) |
| Net expenses | | | 19,316 | |
| Net investment income (loss) | | | (4,266 | ) |
| | | | | |
| Realized and Unrealized Gain (Loss) | | | | |
| Net realized gain (loss) from: | | | | |
| Investments | | | 134,093 | (2) |
| Foreign currency transactions | | | (18,888 | ) |
| Net realized gain (loss) | | | 115,205 | |
| Net change in unrealized appreciation (depreciation) on: | | | | |
| Investments | | | 621,295 | (3) |
| Foreign currency translations | | | (76 | ) |
| Net unrealized gain (loss) | | | 621,219 | |
| Net realized and unrealized gain (loss) | | | 736,424 | |
| Net Increase (Decrease) in Net Assets Resulting from Operations | | $ | 732,158 | |
| | | | | |
| * Withholding tax | | $ | 4,562 | |
| (1) | For the period March 5, 2024 (commencement of operations) through June 30, 2024. |
| (2) | Net of foreign capital gains taxes of $(19,017). |
| (3) | Net of change in deferred foreign capital gains taxes of $135,765. |
See Notes to Financial Statements.
Simplify Exchange Traded Funds
Statement of Changes in Net Assets
| | | Simplify
Tara India
Opportunities
ETF | |
| | | For the period
March 5,
2024(1) to
June 30,
2024 | |
| Increase (Decrease) in Net Assets from Operations | | | | |
| Net investment income (loss) | | $ | (4,266 | ) |
| Net realized gain (loss) | | | 115,205 | |
| Net change in net unrealized appreciation (depreciation) | | | 621,219 | |
| Net increase (decrease) in net assets resulting from operations | | | 732,158 | |
| | | | | |
| Fund Shares Transactions | | | | |
| Proceeds from shares sold | | | 7,673,061 | |
| Variable transaction fees (see Note 5) | | | 16,441 | |
| Value of shares redeemed | | | — | |
| Net increase (decrease) in net assets resulting from fund share transactions | | | 7,689,502 | |
| Total net increase (decrease) in Net Assets | | | 8,421,660 | |
| | | | | |
| Net Assets | | | | |
| Beginning of period | | | — | |
| End of period | | $ | 8,421,660 | |
| | | | | |
| Changes in Shares Outstanding | | | | |
| Shares outstanding, beginning of period | | | — | |
| Shares sold | | | 300,001 | (2) |
| Shares redeemed | | | — | |
| Shares outstanding, end of period | | | 300,001 | |
| (1) | Commencement of operations. |
| (2) | Shares not in increment of 25,000 shares, a creation unit, represent the Adviser’s initial seed investment in connection with the commencement of operations. |
See Notes to Financial Statements.
Simplify Exchange Traded Funds
Financial Highlights
Simplify Tara India Opportunities ETF
Selected Per Share Data | | Period Ended
June 30,
2024(a) | |
| Net Asset Value, beginning of period | | $ | 25.00 | |
| Income (loss) from investment operations: | | | | |
| Net investment income (loss)(b) | | | (0.02 | ) |
| Net realized and unrealized gain (loss) | | | 3.01 | |
| Total from investment operations | | | 2.99 | |
| Variable transaction fees (see Note 5) | | | 0.08 | |
| Net Asset Value, end of period | | $ | 28.07 | |
| Total Return (%) | | | 12.29 | (c) |
| Ratios to Average Net Assets and Supplemental Data | | | | |
| Net Assets, end of period ($ millions) | | $ | 8 | |
| Ratio of expenses before fee waiver (%) | | | 1.51 | (d)(e) |
| Ratio of expenses after fee waiver (%) | | | 1.21 | (d)(e) |
| Ratio of net investment income (loss) (%) | | | (0.27 | )(d) |
| Portfolio turnover rate (%)(f) | | | 33 | (c) |
| (a) | For the period March 5, 2024 (commencement of operations) through June 30, 2024. |
| (b) | Per share numbers have been calculated using the average shares method. |
| (c) | Not annualized. |
| (d) | Annualized. |
| (e) | The ratios of expenses to average net assets includes interest expense fees of 0.51%. |
| (f) | Excludes the impact of in-kind transactions related to the processing of capital share transactions in Creation Units. |
See Notes to Financial Statements.
Simplify Exchange Traded Funds
Notes to Financial Statements
June 30, 2024
1. Organization
Simplify Exchange Traded Funds (the “Trust”) is registered under the Investment Company Act of 1940, as amended (the “1940 Act”), as an open-end registered management investment company organized as a Delaware statutory trust.
As of June 30, 2024, the Trust consists of twenty eight investment series of exchange-traded funds (“ETFs”) in operation and trading. These financial statements report on the Fund listed below:
Simplify Tara India Opportunities ETF
Simplify Asset Management Inc. (the “Adviser”) serves as investment adviser to the Fund and has overall responsibility for the general management and administration of the Fund, subject to the oversight of the Trust’s Board of Trustees (the “Board”).
The Fund offers shares that are listed and traded on the NYSE Arca, Inc. (“NYSE Arca”). Unlike mutual funds, the Fund issues and redeems shares on a continuous basis, at net asset value (“NAV”), only in large specified lots consisting of 25,000 shares, each called a “Creation Unit”, to authorized participants who have entered into agreements with the Fund’s distributor. Shares are not individually redeemable securities of the Fund, and owners of the shares may acquire those shares from the Fund, or tender such shares for redemption to the Fund, in Creation Units only.
| Fund | | Investment objectives |
| Simplify Tara India Opportunities ETF | | The Fund seeks to achieve long-term capital appreciation. |
2. Significant Accounting Policies
The financial statements have been prepared in conformity with U.S. generally accepted accounting principles (“U.S. GAAP”), which require management to make certain estimates and assumptions that affect the reported amounts and disclosures of contingent assets and liabilities at the date of the financial statement and the reported amounts of revenues and expenses during the reporting period. Actual results could differ from those estimates. The Fund is an investment company and accordingly follow the investment company accounting and reporting guidance of the Financial Accounting Standards Board (“FASB”) Accounting Standards Codification Topic 946 Financial Services – Investment Companies including Accounting Standards Update 2013-08. The following is a summary of significant accounting policies followed by the Fund.
Investment Valuation
The Fund’s investments are valued using procedures approved by the Board and are generally valued using market valuations (Market Approach). A market valuation generally means a valuation (i) obtained from an exchange, a pricing service, or a major market maker (or dealer) or (ii) based on a price quotation or other equivalent indication of value supplied by an exchange, a pricing service, or a major market maker (or dealer). A price obtained from a pricing service based on such pricing service’s valuation matrix may be considered a market valuation. Any assets or liabilities denominated in currencies other than the U.S. dollar are converted into U.S. dollars at the current market rates on the date of valuation as quoted by one or more sources.
If market quotations are not readily available, securities will be valued at their fair market value as determined using the “fair value” procedures approved by the Board. Fair value pricing involves subjective judgments and it is possible that the fair value determined for a security may be materially different than the value that could be realized upon the sale of that security. The fair value prices can differ from market prices when they become available or when a price becomes available. The Board has designated the Adviser as its valuation designee to execute these procedures. The Adviser may also enlist third party consultants such as an audit firm or financial officer of a security issuer on an as-needed basis to assist in determining a security-specific fair value. These securities are either categorized as Level 2 or 3 of the fair value hierarchy depending on the relevant inputs used. The Board reviews the execution of this process and the resultant fair value prices at least quarterly to assure the process produces reliable results.
Equity securities are valued at the most recent sale price or official closing price reported on the exchange (U.S. or foreign) or over-the-counter market on which they trade. Securities for which no sales are reported are valued at the calculated mean between the most recent bid and asked quotations on the relevant market or, if a mean cannot be determined, at the most recent bid quotation. Equity securities are generally categorized as Level 1 of the fair value hierarchy.
Under certain circumstances, the Fund may use an independent pricing service to calculate the fair market value of foreign equity securities on a daily basis by applying valuation factors to the last sale price or the mean price as noted above. The fair market values supplied by the independent pricing service will generally reflect market trading that occurs after the close of the applicable foreign markets of comparable securities or the value of other instruments that have a strong correlation to the fair valued securities. The independent pricing service will also take into account the current relevant currency exchange rate. A security that is fair valued may be valued at a price higher or lower than actual market quotations or the value determined by other funds using their own fair valuation procedures. Because foreign securities may trade on days when Shares are not priced, the value of securities held by the Fund can change on days when Shares cannot be redeemed or purchased. In the event that a foreign security’s market quotations are not readily available or are deemed unreliable (for reasons other than because the foreign exchange on which it trades closed before the Fund’s calculation of NAV), the security will be valued at its fair market value as determined in good faith by the Fund’s Adviser as the Board’s valuation designee in accordance with procedures approved by the Board as discussed below. Without fair valuation, it is possible that short-term traders could
Simplify Exchange Traded Funds
Notes to Financial Statements (Continued)
June 30, 2024
take advantage of the arbitrage opportunity and dilute the NAV of long-term investors. Fair valuation of the Fund’s portfolio securities can serve to reduce arbitrage opportunities available to short-term traders, but there is no assurance that it will prevent dilution of the Fund’s NAV by short-term traders. In addition, because the Fund may invest in underlying ETFs which hold portfolio securities primarily listed on foreign (non-U.S.) exchanges, and these exchanges may trade on weekends or other days when the underlying ETFs do not price their shares, the value of these portfolio securities may change on days when you may not be able to buy or sell Shares.
Investments initially valued in currencies other than the U.S. dollar are converted to U.S. dollars using exchange rates obtained from pricing services or other parties in accordance with the valuation procedures of the Adviser as the Board’s valuation designee. As a result, the NAV of the Shares may be affected by changes in the value of currencies in relation to the U.S. dollar. The value of securities traded in markets outside the United States or denominated in currencies other than the U.S. dollar may be affected significantly on a day that the Exchange is closed and an investor is not able to purchase, redeem or exchange Shares.
The Fund categorizes the inputs to valuation techniques used to value its investments into a disclosure hierarchy consisting of three levels as shown below:
| ● | Level 1 – Quoted prices in active markets for identical assets that the fund has the ability to access. |
| ● | Level 2 – Other significant observable inputs (including quoted prices for similar securities, interest rates, prepayment speeds, credit risk, etc.). |
| ● | Level 3 – Significant unobservable inputs (including the Fund’s own assumptions in determining the fair value of investments). |
The inputs or methodology used for valuing securities are not necessarily an indication of the risk associated with investing in those securities.
The following is a summary of the valuations as of June 30, 2024 for the Fund based upon the three levels defined above:
Simplify Tara India Opportunities ETF
| Assets | | Level 1 | | | Level 2 | | | Level 3 | | | Total | |
| Common Stocks | | $ | 7,820,046 | | | $ | — | | | $ | — | | | $ | 7,820,046 | |
| TOTAL | | $ | 7,820,046 | | | $ | — | | | $ | — | | | $ | 7,820,046 | |
Cash
Cash consists of cash on deposit with a major financial institution which may exceed federally insured limits.
Foreign Currency Translations
The books and records of the Fund are maintained in U.S. dollars. Investment securities and other assets and liabilities denominated in a foreign currency are translated into U.S. dollars at the prevailing exchange rates at period end. Purchases and sales of investment securities, income and expenses are translated into U.S. dollars at the prevailing exchange rates on the respective dates of the transactions.
Net realized and unrealized gains and losses on foreign currency transactions represent net gains and losses between trade and settlement dates on securities transactions, the acquisition and disposition of foreign currencies, and the difference between the amount of net investment income accrued and the U.S. dollar amount actually received. The portion of both realized and unrealized gains and losses on investments that results from fluctuations in foreign currency exchange rates is not separately disclosed, but is included with net realized and unrealized gain/appreciation and loss/depreciation on investments.
Investment Transactions and Related Income
For financial reporting purposes, investment transactions are reported on the trade date. However, for daily NAV determination, portfolio securities transactions are reflected no later than in the first calculation on the first business day following trade date. Interest income is recognized on an accrual basis and includes, where applicable, the amortization of premium or accretion of discount based on effective yield. Gains or losses realized on sales of securities are determined using the specific identification method by comparing the identified cost of the security lot sold with the net sales proceeds. Dividend Income on the Statements of Operations is shown net of any foreign taxes withheld on income from foreign securities, which are provided for in accordance with the Fund’s understanding of the applicable tax rules and regulations.
Income Tax Information and Distributions to Shareholders
It is the Fund’s policy to comply with all requirements of the Internal Revenue Code of 1986, as amended (“the Code”). The Fund intends to qualify for and to elect treatment as a separate Regulated Investment Company (“RIC”) under Subchapter M of the Code. It is the Fund’s policy to pay out dividends from net investment income quarterly. Taxable net realized gains from investment transactions, reduced by capital loss carryforwards, if any, will be declared and distributed to shareholders at least annually. The capital loss carryforward amount, if any, will be available to offset future net capital gains. The Fund may occasionally be required to make supplemental distributions at
Simplify Exchange Traded Funds
Notes to Financial Statements (Continued)
June 30, 2024
some other time during the year. The Fund reserves the right to declare special distributions if, in its reasonable discretion, such action is necessary or advisable to preserve the status of the Fund as a RIC or to avoid imposition of income or excise taxes on undistributed income. Dividends and distributions to shareholders, if any, will be recorded on the ex-dividend date. The amount of dividends and distributions from net investment income and net realized capital gains will be determined in accordance with Federal income tax regulations which may differ from U.S. GAAP. These “book/tax” differences are either considered temporary or permanent in nature. To the extent these differences are permanent in nature, (e.g., return of capital and distribution reclassifications), such amounts are reclassified within the composition of net assets based on their federal tax basis treatment; temporary differences (e.g., wash sales and straddles) do not require a reclassification. Dividends and distributions, which exceed earnings and profits for the full year for tax purposes, will be reported as a tax return of capital.
In accordance with U.S. GAAP requirements regarding accounting for uncertainties in income taxes, management has analyzed the Fund’s tax positions expected to be taken on foreign, federal and state income tax returns for all open tax years and has concluded that no provision for income tax is required in the Fund’s financial statement.
The Fund will recognize interest and penalties, if any, related to uncertain tax positions as income tax expense on the Statement of Operations.
In addition to the requirements of the Code, the Fund may also be subject to capital gains tax in India and potentially other foreign jurisdictions, on gains realized upon the sale of securities in India or other such foreign jurisdictions, payable upon repatriation of sales proceeds. Any realized losses in excess of gains in India may be carried forward to offset future gains. Exposure to Indian securities and potentially other foreign jurisdictions accrue a deferred tax liability for unrealized gains in excess of available loss carryforwards based on existing tax rates and holding periods of the securities.
3. Investment Advisory Agreement and Other Agreements
The Adviser has overall responsibility for the general management and administration of the Fund, subject to the oversight of the Board. Under an investment advisory agreement between the Trust, on behalf of the Fund, and the Adviser (the “Investment Advisory Agreement”), the Adviser is responsible for arranging sub-advisory, transfer agency, custody, fund administration, and all other non-distribution related services for the Fund to operate.
System 2 Advisors L.P. (the “Sub-Adviser”) serves as investment sub-adviser to the Fund. The Sub-Adviser is responsible for day-to-day management of the Fund, subject to supervision of the Adviser. The Adviser, not the Fund, pays the Sub-Adviser.
For its investment advisory services to the Fund below, the Adviser was entitled to receive a management fee based on the Fund’s average daily net assets, computed and accrued daily and payable monthly, at an annual rate equal to:
| | | Management | |
| Fund | | Fee | |
| Simplify Tara India Opportunities ETF | | | 1.00 | % |
The Adviser has contractually agreed to waive its management fee to 0.70% of the Fund’s average daily net assets through at least February 16, 2025. This agreement may be terminated only by the Board of Trustees on 60 days’ written notice to the Adviser. For the period ended June 30, 2024, the Adviser waived expenses of $4,782.
Under the Investment Advisory Agreement, the Adviser has agreed to pay substantially all the operating expenses of the Fund, excluding interest expenses, taxes, brokerage expenses, Rule 12b-1 fees (if any), acquired fund fees and expenses, expenses incidental to a meeting of the Fund’s shareholders and the Management Fee. In addition to the excluded operating expenses, the Fund also pays non-operating expenses such as litigation and indemnification expenses and other expenses determined to be extraordinary by the Trust.
The Board has adopted a Distribution and Service Plan pursuant to Rule 12b-1 under the 1940 Act. In accordance with its Rule 12b-1 plan, the Fund is authorized to pay an amount up to 0.25% of its average daily net assets each year to finance activities primarily intended to result in the sale of Creation Units of the Fund or the provision of investor services. No Rule 12b-1 fees are currently paid by the Fund and there are no plans to impose these fees. However, in the event Rule 12b-1 fees are charged in the future, they will be paid out of the Fund’s assets, and directly impact the NAV per share of the Fund.
The Bank of New York Mellon, a wholly-owned subsidiary of The Bank of New York Mellon Corporation, serves as Administrator, Custodian, Accounting Agent and Transfer Agent for the Fund.
Foreside Financial Services, LLC (the “Distributor”) serves as the distributor of Creation Units for the Fund on an agency basis. The Distributor does not maintain a secondary market in shares of the Fund. Foreside Fund Officer Services, LLC a related party to the Distributor also serves as the Trust’s Compliance Officer.
A Trustee and certain Officers of the Trust are also employees of the Adviser and/or the Distributor.
Simplify Exchange Traded Funds
Notes to Financial Statements (Continued)
June 30, 2024
4. Investment Transactions
Purchases and sales of securities, other than short-term securities, U.S. Government Securities and in-kind transactions were as follows:
| Fund | | Purchases | | | Sales | |
| Simplify Tara India Opportunities ETF | | $ | 8,704,399 | | | $ | 1,794,524 | |
5. Fund Share Transactions
The Fund issue and redeem Shares at NAV only in large blocks of 25,000 Shares (each block of Shares is called a “Creation Unit”). Creation Units are issued and redeemed primarily in-kind for securities but may include cash. Individual Shares may only be purchased and sold in secondary market transactions through brokers. Except when aggregated in Creation Units in transactions with Authorized Participants, the Shares are not redeemable securities of the Fund.
Fund Shares are listed and traded on the Exchange on each day that the Exchange is open for business (“Business Day”). The Fund’s Shares may only be purchased and sold on the Exchange through a broker-dealer. Because the Fund’s Shares trade at market prices rather than at their NAV, Shares may trade at a price equal to the NAV, greater than NAV (premium) or less than NAV (discount).
Authorized participants pay a fixed transaction fee of $500 to the shareholder servicing agent when purchasing and redeeming Creation Units of the Fund. The transaction fee is used to defray the costs associated with the issuance and redemption of Creation Units. In addition to the fixed transaction fee, the Fund may charge an additional maximum 3% of the amount invested variable fee for creations and redemptions in cash, to offset brokerage and impact expenses associated with a cash transaction.
6. Federal Income Taxes
For the period ended June 30, 2024, the effect of permanent “book/tax” reclassifications to the components of net assets are included below. These differences are primarily due to redemptions-in-kind, non-deductible excise tax paid, distributions in excess, return of capital distributions, and controlled foreign corporations income reversal.
| Fund | | Distributable
earnings (loss) | | | Paid-in
Capital | |
| Simplify Tara India Opportunities ETF | | $ | — | | | $ | — | |
The tax character of dividends and distributions declared for the period ended June 30, 2024 were as follows:
| Fund | | Ordinary
Income* | | | Long-Term
Capital Gains | | | Return of
Capital | |
| Simplify Tara India Opportunities ETF | | $ | — | | | $ | — | | | $ | — | |
| * | For tax purposes short-term capital gain distributions are considered ordinary income distributions. |
As of June 30, 2024, the components of accumulated earnings (losses) on a tax basis were as follows:
| Fund | | Undistributed
Ordinary
Income | | | Undistributed
Long-term
Capital Gains | | | Temporary
Book/Tax
Differences(a) | | | Net Unrealized
Appreciation
(Depreciation) | | | Accumulated
Capital and
Other Losses | | | Post-October/
Late-year
Ordinary Loss
Deferrals | | | Distributable
earnings (loss) | |
| Simplify Tara India Opportunities ETF | | $ | 268,188 | | | $ | — | | | $ | — | | | $ | 463,970 | | | $ | — | | | $ | — | | | $ | 732,158 | |
| (a) | The temporary book/tax differences was attributable primarily dividend payable, straddles deferral and Subpart F income. |
At June 30, 2024, gross unrealized appreciation and depreciation of investments owned by the Fund, based on cost for federal income tax purposes were as follows:
| Fund | | Tax Cost | | | Gross
Unrealized
Appreciation | | | Gross
Unrealized
Depreciation | | | Net Unrealized
Appreciation
(Depreciation) | |
| Simplify Tara India Opportunities ETF | | $ | 7,220,235 | | | $ | 795,577 | | | $ | (195,766 | ) | | $ | 599,811 | |
The differences between book-basis and tax-basis components of net assets are primarily attributable to the tax deferral of losses on wash sales, grantor trust adjustments, section 1256 mark-to-market treatment of derivatives and return of capital basis adjustments from underlying investments.
Simplify Exchange Traded Funds
Notes to Financial Statements (Continued)
June 30, 2024
The following Fund utilized capital loss carryforwards to offset taxable gains realized during the period ended June 30, 2024:
| Fund | | Amount | |
| Simplify Tara India Opportunities ETF | | $ | — | |
Certain capital and qualified late year ordinary losses incurred after October 31 and December 31, respectively, and within the current taxable year, are deemed to arise on the first business day of each Fund’s next taxable year. At June 30 2024, the following Fund incurred and will elect to defer post-October capital losses and late year ordinary losses:
| Fund | | Capital Post-
October Losses | | | Late-year
ordinary Losses | |
| Simplify Tara India Opportunities ETF | | $ | — | | | $ | — | |
7. Subsequent Events
Management has evaluated subsequent events through the date of issuance of these financial statements and has determined that there are no subsequent events that require adjustment to, or disclosure in, the financial statement.
Simplify Exchange Traded Funds
Report of Independent Registered Public Accounting Firm
To the Shareholders of Simplify Tara India Opportunities ETF and
Board of Trustees of Simplify Exchange Traded Funds
Opinion on the Financial Statements
We have audited the accompanying statement of assets and liabilities, including the schedule of investments, of Simplify Tara India Opportunities ETF (the “Fund), a series of Simplify Exchange Traded Funds, as of June 30, 2024, the related statements of operations and changes in net assets and the financial highlights for the period from March 5, 2024 (commencement of operations) to June 30, 2024, and the related notes (collectively referred to as the “financial statements”). In our opinion, the financial statements present fairly, in all material respects, the financial position of the Fund as of June 30, 2024, the results of its operations, the changes in net assets, and the financial highlights for the period then ended, in conformity with accounting principles generally accepted in the United States of America.
Basis for Opinion
These financial statements are the responsibility of the Fund’s management. Our responsibility is to express an opinion on the Fund’s financial statements based on our audit. We are a public accounting firm registered with the Public Company Accounting Oversight Board (United States) (“PCAOB”) and are required to be independent with respect to the Fund in accordance with the U.S. federal securities laws and the applicable rules and regulations of the Securities and Exchange Commission and the PCAOB.
We conducted our audit in accordance with the standards of the PCAOB. Those standards require that we plan and perform the audit to obtain reasonable assurance about whether the financial statements are free of material misstatement whether due to error or fraud.
Our audit included performing procedures to assess the risks of material misstatement of the financial statements, whether due to error or fraud, and performing procedures that respond to those risks. Such procedures included examining, on a test basis, evidence regarding the amounts and disclosures in the financial statements. Our procedures included confirmation of securities owned as of June 30, 2024, by correspondence with the custodian. Our audit also included evaluating the accounting principles used and significant estimates made by management, as well as evaluating the overall presentation of the financial statements. We believe that our audit provides a reasonable basis for our opinion.
We have served as the auditor of one of more funds advised by Simplify Asset Management, Inc. since 2020.

COHEN & COMPANY, LTD.
Cleveland, Ohio
August 29, 2024
Simplify Exchange Traded Funds
Additional Information (Unaudited)
Discount & Premium Information
Information regarding how often shares of the Fund traded on NYSE Arca at a price above (i.e., at a premium) or below (i.e., at a discount) the NAV of the Fund can be found at www.simplify.us.
Tax Information
Form 1099-DIV and other year-end tax information provide shareholders with actual calendar year amounts that should be included in their tax returns. Shareholders should consult their tax advisors.
The Fund designates the following amounts or, if subsequently determined to be different, the maximum allowable for its period ended June 30, 2024.
| | | Qualified | | | Dividends | |
| | | Dividend | | | Received | |
| Fund | | Income* | | | Deduction | |
| Simplify Tara India Opportunities ETF | | | 00.00 | % | | | 00.00 | % |
| * | The above percentage is based on ordinary income dividends paid to shareholders during the Fund’s fiscal year. |
This report must be preceded or accompanied by a prospectus.
(This page intentionally left blank)
(This page intentionally left blank)
(This page intentionally left blank)
Investment Adviser
Simplify Asset Management Inc.
10845 Griffith Peak Drive, 2/F
Las Vegas, NV 89135 | | Investment Sub-Adviser
System 2 Advisors L.P.
47 Maple Street,
#303A
Summit, NJ 07901 | | Custodian, Administrator & Transfer Agent
The Bank of New York Mellon
240 Greenwich Street
New York, NY 10286 |
| | | | | |
Simplify Exchange Traded Funds
10845 Griffith Peak Drive, 2/F
Las Vegas, NV 89135 | | Independent Registered Public Accounting Firm
Cohen & Company Ltd.
1350 Euclid Ave., Suite 800
Cleveland, OH 44115 | | Legal Counsel
Thompson Hine LLP
41 South High Street
Suite 1700
Columbus, OH 43215 |
Item 8. Changes in and Disagreements with Accountants for Open-End Management Investment Companies.
None.
Item 9. Proxy Disclosures for Open-End Management Investment Companies.
An Information Statement was provided to the shareholders of the Simplify Market Neutral Equity Long/Short ETF (“EQLS”) regarding the approval of an investment management agreement (the “New Agreement”) in connection with the appointment of a new investment adviser, Simplify EQLS LLC (the “New Manager”), for EQLS. At a meeting held on November 29, 2023, the Board considered and approved the New Agreement between the Trust, on behalf of EQLS, and the New Manager. On April 5, 2024, a shareholder representing a majority of the outstanding voting securities of EQLS as of February 23, 2024 (the “Record Date”) approved the New Agreement via written consent. The New Agreement took effect on May 22, 2024.
| | For | Against | Withheld | Abstentions | Broker Non-Votes |
| Votes | 5,901,041 | 0 | 0 | 0 | 0 |
As of the Record Date, there were issued and outstanding 6,525,000 total shares of EQLS and the majority shareholder held 5,901,041 shares. There were no other votes taken.
Item 10. Remuneration Paid to Directors, Officers, and Others of Open-End Management Investment Companies.
The aggregate remuneration paid by the company during the period covered by the report is as follows:
(1) All directors and all members of any advisory board for regular compensation: $300,000, which is paid by the investment adviser.
(2) Each director and each member of an advisory board for special compensation: None
(3) All officers: None
(4) Each person of whom any officer or director of the Fund is an affiliated person: Investment adviser compensation included under Item 7.
Item 11. Statement Regarding Basis for Approval of Investment Advisory Contract.
| Board Considerations in Approval of Investment Advisory Agreement and Sub-Advisory Agreement (Unaudited) |
Simplify Tara India Opportunities ETF
In connection with the meeting of the Board of Trustees (the “Board” or “Trustees”) of Simplify Exchange Traded Funds (the “Trust”) held on November 29, 2023 (the “Meeting”), the Trustees, including a majority of the Trustees who are not “interested persons” as that term is defined in the Investment Company Act of 1940, as amended, discussed the approval of an investment advisory agreement between Simplify Asset Management, Inc. (the “Adviser” or “Simplify”) and the Trust, on behalf of the Simplify Tara India Opportunities ETF (the “Fund” or “India ETF”) and a sub-advisory agreement between Simplify and System Two Advisors L.P. (“S2” or the “Sub-Adviser”) with respect to the India ETF.
The Trustees reviewed and discussed the materials that were provided in advance of the Meeting and deliberated on the approval of the agreements. The Trustees relied upon the advice of independent legal counsel and their own business judgment in determining the material factors to be considered in evaluating the agreements on behalf of the New Fund and the weight to be given to each factor considered. The conclusions reached by the Trustees were based on a comprehensive evaluation of all of the information provided and were not the result of any one factor. Moreover, each Trustee may have afforded different weight to the various factors in reaching his conclusions with respect to the approval of the agreements.
Nature, Extent, and Quality of Service. The Trustees noted that Simplify was founded in 2020, managed approximately $2.51 billion in assets as of September 30, 2023, and specialized in offering a variety of innovative investment strategies that incorporated various derivative overlays. They then reviewed the background information of the key investment personnel that would be responsible for servicing the New Fund and noted the extensive industry experience. They noted that the India ETF, the Adviser’s first emerging market equity fund, would provide potential investors access to India, one of the fastest growing economies in the world. The Trustees noted that Simplify would monitor compliance with the New Fund’s investment restrictions. They considered the Adviser’s efforts related to compliance, and its understanding of risk mitigation. The Trustees considered the growth in the size and number of funds in the Trust, observed that the Adviser had sufficient personnel resources to service the New Fund, ongoing access to capital, and concluded that, based on the Board’s experience with the Adviser, Simplify would provide high quality service to the New Fund and its shareholders.
Performance. The Trustees reviewed the investment objective of the Fund and considered the performance of other Funds in the Trust. They reviewed the returns of a privately offered fund that pursues a strategy similar to that intended for the Fund, observing that as of September 30, 2023, the private fund outperformed the benchmark for the one-year period, and since its inception in 2020. The Trustees considered the Adviser’s experience working with sub-advisers.
Fees and Expenses. The Trustees discussed the proposed annual advisory fee of 1.00%. The Trustees noted that the proposed advisory fee was higher than the Adviser’s selected peer group (five funds) average advisory fee, and above the average of the Morningstar US Fund India Equity category average advisory fee. The Trustees acknowledged the Adviser’s belief that the fee was reasonable due to the active management of the Fund. The Trustees noted that the Fund’s net expense ratio was below the peer group and the Morningstar category averages. The Trustees then noted that the Adviser intended to waive its management fees to 0.70%. for the first year of Fund operations, and that the proposed sub-adviser had agreed waive its fee in the same amount.
The Trustees discussed the peer funds and Morningstar categories, including the use of mutual funds as relevant comparisons for actively managed ETFs. The Trustees acknowledged that the fees to be charged by the Adviser were competitive with the fees charged by similar registered funds. They concluded that the proposed fee to be charged by the Adviser was well within reason for the strategy and was not unreasonable.
Profitability. The Trustees reviewed the profit analysis provided by Simplify. They noted that because the New Fund had not yet commenced operations, the profitability analysis provided was estimated based on projected asset growth over the first 24 months of operations. They then noted that Simplify projected that the India ETF could generate a modest profit to the Adviser during the second year of operations. The Trustees concluded that based on the information provided by Simplify, the estimated profitability was not excessive with respect to the New Fund.
Economies of Scale. The Trustees considered whether economies of scale would likely be realized by Simplify during the initial term of the proposed advisory agreement. They discussed the New Fund’s prospects for growth. The Trustees noted the Adviser’s belief that the current proposed advisory fee was very competitive and provided the shareholders the benefits of economies of scale even at low initial asset levels. They then discussed whether the Adviser would benefit from economies of scale related to the New Fund from lower variable costs and decreasing impact of fixed costs. Based on these and other considerations, the Trustees agreed that the proposed arrangement was acceptable and would be reconsidered at the first contract renewal in two years.
Conclusion. Having requested and received such information from Simplify as the Trustees believed to be reasonably necessary to evaluate the terms of the advisory agreement, and as assisted by the advice of independent counsel, the Trustees determined that approval of the advisory agreement was in the best interests of the New Fund and its future shareholders.
Approval of Sub-Advisory Agreement (System Two Advisors L.P.)
Nature, Extent, and Quality of Service. The Trustees considered that S2 was founded in June 2011, and managed approximately $516 million in U.S and global assets as of September 30, 2023. They noted that S2 served as the investment adviser to a group of private investment funds focused on investments in India. The Trustees further noted that S2 served as sub-adviser to one large cap equity mutual fund. The Trustees discussed the qualifications of the personnel who would be providing services to the India ETF on a day-to-day basis. The Trustees discussed that the S2 would assume responsibility for managing the Fund’s investment portfolio within the guidelines and objectives defined in the Fund’s prospectus, and would make buy and sell decisions, conduct research and implement investment strategies to achieve the Fund’s objective. The Trustees noted that S2 would assess and manage risks associated with the Fund’s investments, including monitoring portfolio concentrations, sector exposure and other risk factors, and that S2 would be responsible for determining the appropriate asset allocation within the portfolio. The Trustees concluded that, in conjunction with the Adviser, S2 would provide high quality service to the India ETF and its shareholders.
Performance. The Trustees reviewed the returns of a privately offered fund that pursues a strategy similar to that intended for the Fund, observing that as of September 30, 2023, the private fund outperformed the benchmark for the one-year period, and since its inception in 2020. The Trustees considered the Sub-Adviser’s experience managing India focused funds as well as a registered investment company, and concluded that S2 had the ability to deliver favorable returns to the shareholders of the Fund.
Fees and Expenses. The Trustees acknowledged that the India ETF had a proposed annual advisory fee of 1.00%, and that the proposed annual sub-advisory fee was 0.65%. The Trustees noted that S2 currently managed other funds. The Trustees also noted that the sub-advisory fee was proposed by the Adviser after considering several factors that highlight the value provided by the sub-advisory relationship, including, among other things, that the Sub-Adviser possessed specialized knowledge and expertise on India and its securities markets. The Trustees also noted that the Sub-Adviser brought risk management capabilities that complemented the Adviser’s skills. The Trustees discussed the fees charged by the Sub-Adviser to other funds that it managed. The Trustees agreed that the proposed sub-advisory fee was not unreasonable.
Profitability. The Trustees reviewed the profit analysis provided by S2. They noted that because the India ETF had not yet commenced operations, the profitability analysis provided was estimated based on projected asset growth over the first 24 months of operations. They further noted that S2 projected making a very modest profit during the first year of operations, and a more meaningful profit during the second year of operations. The Trustees noted S2’s belief that the profits are reasonable considering the amount of resources that would be devoted to investment research, operational oversight and risk management. The Trustees concluded that based on the information provided by S2, the estimated profitability was not excessive with respect to the India ETF.
Economies of Scale. The Trustees considered whether economies of scale would likely be realized by S2 during the initial term of the proposed sub-advisory agreement. They discussed the India ETF’s prospects for growth. The Trustees noted the Sub-Adviser’s belief that the current proposed sub-advisory fee was very competitive and provided the shareholders the benefits of economies of scale even at low initial asset levels. Based on these and other considerations, the Trustees agreed that the proposed arrangements were acceptable and would be reconsidered at the first contract renewal in two years.
Conclusion. Having requested and received such information from S2 as the Trustees believed to be reasonably necessary to evaluate the terms of the sub-advisory agreement, and as assisted by the advice of independent counsel, the Trustees determined that approval of the sub-advisory agreement was in the best interests of the India ETF and its future shareholders.
| Board Considerations in Approval of Investment Advisory Agreement (Unaudited) |
Simplify Next Intangible Core Index ETF and Simplify Next Intangible Value Index ETF
In connection with the meeting of the Board of Trustees (the “Board” or “Trustees”) of Simplify Exchange Traded Funds (the “Trust”) held on February 9, 2024 (the “Meeting”), the Trustees, including a majority of the Trustees who are not “interested persons” as that term is defined in the Investment Company Act of 1940, as amended, discussed the approval of an investment advisory agreement between Simplify Asset Management, Inc. (the “Adviser” or “Simplify”) and the Trust, on behalf of the Simplify Next Intangible Core Index ETF and the Simplify Next Intangible Value Index ETF (each a “New Fund” and collectively, the “New Funds”).
The Trustees reviewed and discussed the materials that were provided in advance of the Meeting and deliberated on the approval of the agreements. The Trustees relied upon the advice of independent legal counsel and their own business judgment in determining the material factors to be considered in evaluating the agreements on behalf of the New Funds and the weight to be given to each factor considered. The conclusions reached by the Trustees were based on a comprehensive evaluation of all of the information provided and were not the result of any one factor. Moreover, each Trustee may have afforded different weight to the various factors in reaching his conclusions with respect to the approval of the agreements.
Nature, Extent, and Quality of Service. The Trustees noted that Simplify currently provided investment advice and investment management services to twenty-six exchange traded funds, managed approximately $3.18 billion in assets as of December 31, 2023, and that the Trust was the Adviser’s only client. They acknowledged that the Adviser specialized in offering a variety of innovative investment strategies. The Trustees reviewed the background information of the key personnel that would be responsible for servicing each New Fund and noted the extensive industry experience. They noted that the New Funds would expand the fund family’s offerings and would be the Adviser’s first offerings in passive equity strategies. The Trustees noted the Adviser’s belief that the New Funds offered potential investors access to unique and innovative investment strategies not currently available in the marketplace, tracking indexes that were designed to measure intangible capital. The Trustees noted that Simplify would monitor compliance with each New Fund’s investment restrictions. The Trustees considered the Adviser’s efforts related to compliance, and its understanding of risk mitigation. The Trustees noted that the financial condition of the Adviser was sufficient for the Adviser to execute the New Funds’ strategy and to support the launch of the New Funds. The Trustees considered the growth in the size and number of funds in the Trust, observed that the Adviser had sufficient personnel resources to service each New Fund, ongoing access to capital, and concluded that, based on the Board’s experience with the Adviser, Simplify would provide high quality service to each New Fund and its respective shareholders.
Performance.
Simplify Next Intangible Core Index ETF. The Trustees reviewed the investment objective of the Fund and considered the performance of other Funds in the Trust. They reviewed the back-tested annualized returns of the proposed strategy commencing on July 1, 2018, provided by the index developer. Recognizing that the back-tested returns were not those of an actual account, the Trustees considered that the strategy outperformed the S&P 500 Index and the Russell 2000 Index for the one- and five-year periods, and since inception period ended October 31, 2023. The Trustees considered the Adviser’s experience managing actively managed ETFs and its foray into the passive ETFs and noted that the Fund was expected to provide investment results that track the performance of the Next Suite Intangible Core Index.
Simplify Next Intangible Value Index ETF. The Trustees reviewed the investment objective of the Fund and considered the performance of other Funds in the Trust. They reviewed the back-tested annualized returns of the proposed strategy commencing on July 1, 2018, provided by the index developer. Recognizing that the back-tested returns were not those of an actual account, the Trustees considered that the strategy underperformed the S&P 500 Index and substantially outperformed the Russell 2000 Index for the one- and five-year periods, and since inception periods ended October 31, 2023. The Trustees considered the Adviser’s experience managing actively managed ETFs and its foray into the passive ETFs and noted that the Fund was expected to provide investment results that track the performance of the Next Suite Intangible Value Index.
Taking various factors into consideration, the Trustees concluded that Simplify had the opportunity to deliver favorable returns to the shareholders of each of the New Funds.
Fees and Expenses.
Simplify Next Intangible Core Index ETF. The Trustees discussed the proposed annual advisory fee of 0.25%. The Trustees noted that the proposed advisory fee was higher than the average of the Adviser’s selected peer group (five funds) average advisory fee of 0.16%, and was also above the average of the Morningstar US Fund Large Blend category average advisory fee of 0.18%. The Trustees considered that select constituents in the peer group were ETFs chosen by the Adviser from a relevant Morningstar category, namely US large blend. The Trustees noted that the Fund’s net expense ratio was also above its peer group average, but below its Morningstar category average.
Simplify Next Intangible Value Index ETF. The Trustees discussed the proposed annual advisory fee of 0.25%. The Trustees noted that the proposed advisory fee was below the average of the Adviser’s selected peer group (five funds) average advisory fee of 0.35%, and was also below the Morningstar US Fund Large Value category average advisory fee of 0.29%. The Trustees considered that select constituents in the peer group were ETFs chosen by the Adviser from the relevant Morningstar categories, namely US large value. The Trustees noted that the Fund’s net expense ratio was also below its peer group and Morningstar category averages. The Trustees discussed the peer funds and Morningstar categories, including the inclusion of mutual funds in the category data as relevant comparisons for actively managed ETFs. The Trustees acknowledged that the advisory fees to be charged by the Adviser were competitive with the fees charged by similar registered funds and the expense ratio was reasonable. They concluded that the proposed fees to be charged by the Adviser were well within reason for each strategy and were not unreasonable.
Profitability. The Trustees reviewed the profit analysis provided by Simplify. They noted that because the New Funds had not yet commenced operations, the profitability analysis provided was estimated based on projected asset growth over the first 24 months of operations. They further noted that Simplify projected making no profit in connection with each of Simplify Next Intangible Core Index ETF and Simplify Next Intangible Value Index ETF for the first 24 months of operations. They noted that each New Fund would track an index sponsored by a third party vendor, and the Adviser was responsible for paying the license fees. The Trustees concluded that based on the information provided by Simplify, the estimated profitability was not excessive with respect to either New Fund.
Economies of Scale. The Trustees considered whether economies of scale would likely be realized by Simplify during the initial term of the proposed advisory agreement. They discussed each New Fund’s prospects for growth. The Trustees noted the Adviser’s belief that the current proposed advisory fees were very competitive and provided the shareholders the benefits of economies of scale even at low initial asset levels. They discussed whether the Adviser would benefit from economies of scale related to each New Fund from lower variable costs and decreasing impact of fixed costs. Based on these and other considerations, the Trustees agreed that the proposed arrangements were acceptable and would be reconsidered at the first contract renewal in two years.
Conclusion. Having requested and received such information from Simplify as the Trustees believed to be reasonably necessary to evaluate the terms of the advisory agreement, and as assisted by the advice of independent counsel, the Trustees determined that approval of the advisory agreements was in the best interests of each New Fund and their respective future shareholders.
| Board Considerations in Approving a Revised Fee Under the Trading Advisory Agreement Fee (Unaudited) |
Simplify Managed Futures Strategy ETF
In connection with the meeting of the Board of Trustees (the “Board” or “Trustees”) of Simplify Exchange Traded Funds (the “Trust”) held on May 20, 2024 (the “Meeting”), the Trustees, including a majority of the Trustees who are not “interested persons” as that term is defined in the Investment Company Act of 1940, as amended, discussed the approval of an increase to the annual fee paid by Simplify Asset Management, Inc. (the “Adviser” or “Simplify”) to Altis Partners (Jersey) Limited (“Altis”) under the trading advisory agreement for Simplify Managed Futures Strategy ETF (“CTA”).
The Trustees reviewed and discussed the materials that were provided in advance of the Meeting and deliberated on the approval of the revised fee. The Trustees relied upon the advice of independent legal counsel and their own business judgment in determining the material factors to be considered in evaluating the fee and the weight to be given to each factor considered. The conclusions reached by the Trustees were based on a comprehensive evaluation of all of the information provided and were not the result of any one factor. Moreover, each Trustee may have afforded different weight to the various factors in reaching his conclusions with respect to the approval of the revised fee.
The Board reviewed the respective responsibilities of the Adviser and Altis, and noted that the Adviser and Altis meet no less frequently than quarterly to evaluate portfolio composition based on market conditions, and that Altis modeled the portfolio via its proprietary portfolio modeling and optimization tool supported by a stable and experienced management team. They considered the Adviser’s satisfaction with the services provided by Altis. The Board reviewed the performance of CTA provided by the Adviser and Altis, noting that for the one-year and since inception periods ended June 30, 2023, CTA outperformed its benchmark, peer group and Morningstar category. The Board considered the reasonableness of the proposed fee, noting that proposed fee aligns with the fee arrangement in place for Simplify Commodities Strategy No K-1 ETF. The Board reviewed the impact on profits of both the Adviser and Altis, noting the profit margins of each. It was the consensus of the Board that the proposed trading adviser fee was reasonable.
Item 12. Disclosure of Proxy Voting Policies and Procedures for Closed-End Management Investment Companies.
Not applicable.
Item 13. Portfolio Managers of Closed-End Management Investment Companies.
Not applicable.
Item 14. Purchases of Equity Securities by Closed-End Management Investment Company and Affiliated Purchasers.
Not applicable.
Item 15. Submission of Matters to a Vote of Security Holders.
There have been no material changes to the procedures by which shareholders may recommend nominees to the Registrant’s Board of Trustees since last provided in response to this item.
Item 16. Controls and Procedures.
| (a) | The registrant’s principal executive and principal financial officers, or persons performing similar functions, have concluded that the registrant’s disclosure controls and procedures (as defined in Rule 30a-3(c) under the Investment Company Act of 1940, as amended (the “1940 Act”) (17 CFR 270.30a-3(c))) are effective, as of a date within 90 days of the filing date of the report that includes the disclosure required by this paragraph, based on their evaluation of these controls and procedures required by Rule 30a-3(b) under the 1940 Act (17 CFR 270.30a-3(b)) and Rules 13a-15(b) or 15d-15(b) under the Securities Exchange Act of 1934, as amended (17 CFR 240.13a-15(b) or 240.15d-15(b)). |
| (b) | There were no changes in the registrant’s internal control over financial reporting (as defined in Rule 30a-3(d) under the 1940 Act (17 CFR 270.30a-3(d))) that occurred during the period covered by this report that has materially affected, or is reasonably likely to materially affect, the registrant’s internal control over financial reporting. |
Item 17. Disclosure of Securities Lending Activities for Closed-End Management Investment Companies.
Not applicable.
Item 18. Recovery of Erroneously Awarded Compensation.
Item 19. Exhibits.
SIGNATURES
Pursuant to the requirements of the Securities Exchange Act of 1934 and the Investment Company Act of 1940, the registrant has duly caused this report to be signed on its behalf by the undersigned, thereunto duly authorized.
| (Registrant) | Simplify Exchange Traded Funds | |
| | | |
| By* | /s/ Paul Kim, President | |
| Paul Kim, President (principal executive officer) | |
| | | |
| Date: | September 9, 2024 | | |
Pursuant to the requirements of the Securities Exchange Act of 1934 and the Investment Company Act of 1940, this report has been signed below by the following persons on behalf of the registrant and in the capacities and on the dates indicated.
| By* | /s/ Paul Kim, President | |
| Paul Kim, President (principal executive officer) | |
| | | |
| Date: | September 9, 2024 | | |
| By* | /s/ Fiona Ho, Treasurer | |
| Fiona Ho, Treasurer (principal financial officer) | |
| | | |
| Date: | September 9, 2024 | | |