UNITED STATES
SECURITIES AND EXCHANGE COMMISSION
Washington, D.C. 20549
FORM N-CSR
CERTIFIED SHAREHOLDER REPORT OF REGISTERED
MANAGEMENT INVESTMENT COMPANIES
Investment Company Act file number: 811-23579
FLAT ROCK CORE INCOME FUND
(Exact name of registrant as specified in charter)
Robert K. Grunewald
Chief Executive Officer
680 S Cache Street, Suite 100
P.O. Box 7403
Jackson, WY 83001
(Address of principal executive offices) (Zip code)
(307) 500-5200
(Registrant’s telephone number, including area code)
The Corporation Trust Company
Corporation Trust Center
1209 Orange Street
Wilmington, DE 19801
(Name and address of agent for service)
Copy to:
Owen J. Pinkerton, Esq.
Eversheds Sutherland (US) LLP
700 Sixth Street, NW, Suite 700
Washington, DC 20001
(202) 383-0262
| Date of fiscal year end: | December 31 |
| | |
| Date of reporting period: | December 31, 2023 |
Item 1. Reports to Stockholders.
(a)
Table of Contents
| Flat Rock Core Income Fund | Shareholder Letter |
| | December 31, 2023 (Unaudited) |
Fellow CORFX Shareholders:
The Flat Rock Core Income Fund (“CORFX” or the “Fund”) finished 2023 up 13.32%. Since inception in July of 2017, the Fund has generated average annual returns of 7.80% with a standard deviation of 3.08%, almost double the returns of the Bloomberg US Corporate High Yield Index with significantly less volatility.
Fund returns for the year were driven by higher base rates and solid performance of our investment portfolio. In November 2023, our Board of Trustees declared an increase in the monthly distribution from $0.155 to $0.170 per share, which became effective with the January 2024 distribution. At year end, the distribution rate was 9.94%.
Fund Performance (Net)(a)
| | | 2023
Full Year | | | 2022
Full Year | | | Annualized
Return Since
Inception
on 7/2/2017 | | | Standard
Deviation Since
Inception
on 7/2/2017 | |
| Flat Rock Core Income Fund | | | 12.49 | % | | | 2.83 | % | | | 7.68 | % | | | 3.08 | % |
| Bloomberg US Aggregate Bond Index | | | 5.53 | % | | | -13.01 | % | | | 1.04 | % | | | 5.11 | % |
| Bloomberg US Corporate High Yield Index | | | 13.45 | % | | | -11.19 | % | | | 4.15 | % | | | 5.73 | % |
| Morningstar LSTA U.S. Leveraged Loan Index | | | 13.32 | % | | | -0.77 | % | | | 4.83 | % | | | 3.42 | % |
| (a) | Performance data is per Bloomberg as of 12/31/23, and includes the reinvestment of distributions |
The performance data quoted here represents past performance. Current performance may be lower or higher than the performance quoted above. Investment return and principal value will fluctuate, so that shares, when repurchased, may be worth more or less than their original cost. Past performance is no guarantee of future results. A Fund’s performance, especially for very short periods of time, should not be the sole factor in making your investment decisions. All historical performance related to Flat Rock Core Income Fund prior to 11/23/2020 is of the Predecessor Fund, Flat Rock Capital Corp.
We believe our commitment to first lien investments while maintaining a highly selective investment approach creates the foundation for this outperformance.
Today, middle market loans offer yields in the low double-digits, in large part due to the Federal Reserve interest rate hiking cycle. In a typical corporate capital structure, higher returns are accompanied by higher risk. However, middle market loans are senior and secured, thereby offering more downside protection than high yield bonds and equity.
The Fund currently holds 66 positions, in middle market issuers as well as in equity and junior debt tranches of CLOs, which collectively provide exposure to over 1,200 middle market loans. Loan selectivity helps enable our portfolio to stay resilient even at a time when the economy is facing some headwinds. At year end the average loan to value of our loan portfolio was 47% and interest coverage was 2.5x.1 Accordingly, we believe the borrowers in our portfolio are well-capitalized and can absorb the higher interest expense resulting from recent interest rate hikes. Given the Fund’s emphasis on floating rate investments, this increased interest expense results in greater interest income for our shareholders.
| Annual Report | December 31, 2023 | 1 |
| Flat Rock Core Income Fund | Shareholder Letter |
| | December 31, 2023 (Unaudited) |
CORFX had $305 million of assets under management as of 12/31/23. The Fund’s leverage ratio (debt-to-total assets) finished 2023 at a modest 0.28x.
CORFX, in our view, remains a strong candidate for core positions in client portfolios, delivering a consistent monthly dividend, with relatively low volatility and minimal interest rate risk.
As always, if you have any questions, please feel free to reach out.
Sincerely,

Robert Grunewald
Chief Executive Officer and Founder
| (1) | Reflects latest financial information reported by underlying portfolio companies as of 12/31/23 |
Glossary: The Bloomberg US Aggregate Bond Index, or the Agg, is a broad base, market capitalization-weighted bond market index representing intermediate term investment grade bonds traded in the United States. The Bloomberg US Corporate High Yield Index measures the USD-denominated, high yield, fixed-rate corporate bond market. Securities are classified as high yield if the middle rating of Moody’s, Fitch and S&P is Ba1/BB+/BB+ or below. The index excludes bonds from emerging markets. The Morningstar LSTA U.S. Leveraged Loan Index is a market value weighted index designed to capture the performance of the U.S. leveraged loan market.
Consider the investment risks, charges, and expenses of the Fund carefully before investing. Other information about the Fund may be obtained at https://flatrockglobal.com/core-income-fund/. This material must be preceded or accompanied by the prospectus. Please read it carefully.
The Fund is suitable for investors who can bear the risks associated with the Fund’s limited liquidity and should be viewed as a long-term investment. Our shares have no history of public trading, nor is it intended that our shares will be listed on a national securities exchange at this time, if ever. No secondary market is expected to develop for our shares; liquidity for our shares will be provided only through quarterly repurchase offers for no less than 5% of our shares at net asset value, and there is no guarantee that an investor will be able to sell all the shares that the investor desires to sell in the repurchase offer. Due to these limited restrictions, an investor should consider an investment in the Fund to be of limited liquidity. Investing in our shares may be speculative and involves a high degree of risk, including the risks associated with leverage. Investing in the Fund involves risks, including the risk that shareholder may lose part or all of their investment. We may pay distributions in significant part from sources that may not be available in the future and that are unrelated to our performance, such as a returns of capital or borrowing. The amount of distributions that we may pay, if any, is uncertain. ALPS Distributors Inc. serves as our principal underwriter, within the meaning of the 1940 Act, and will act as the distributor of our shares on a best efforts’ basis, subject to various conditions.
| Flat Rock Core Income Fund | Portfolio Update |
| | December 31, 2023 (Unaudited) |
INVESTMENT OBJECTIVE
Flat Rock Core Income Fund’s (the “Fund”) investment objective is the preservation of capital while generating current income from its debt investments and seeking to maximize the portfolio’s total return.
PERFORMANCE as of December 31, 2023
| | | | | | | | | Average Annual Returns | |
| | | 1 Month | | | 6 Month | | | 1 Year | | | 3 Year(1) | | | 5 Year(1) | | | Since
Inception(1) | |
| Flat Rock Core Income Fund(2)(6) | | | 1.56 | % | | | 5.70 | % | | | 12.49 | % | | | 8.05 | % | | | 8.24 | % | | | 7.68 | % |
| Bloomberg US Aggregate Bond Index(3) | | | 3.83 | % | | | 3.37 | % | | | 5.53 | % | | | -3.31 | % | | | 1.10 | % | | | 1.04 | % |
| Bloomberg U.S. Corporate High Yield Bond Index (4) | | | 3.73 | % | | | 7.66 | % | | | 13.45 | % | | | 1.98 | % | | | 5.37 | % | | | 4.15 | % |
| Morningstar LSTA U.S. Leveraged Loan Index(5) | | | 1.65 | % | | | 6.43 | % | | | 13.32 | % | | | 5.76 | % | | | 5.80 | % | | | 4.83 | % |
| (1) | The Fund commenced operations on July 2, 2017. Operations for the period prior to November 23, 2020 are for Flat Rock Capital Corp. (see Note 14 in the Notes to Consolidated Financial Statements for further information). |
| (2) | Performance returns are net of management fees and other Fund expenses. |
| (3) | The Bloomberg US Aggregate Bond Index is a broad-based, market capitalization-weighted bond market index representing intermediate term investment grade bonds traded in the United States. |
| (4) | The Bloomberg U.S. Corporate High Yield Bond Index measures the USD-denominated, high yield, fixed-rate corporate bond market. |
| (5) | The Morningstar LSTA U.S. Leveraged Loan Index is a market value weighted index designed to capture the performance of the U.S. leveraged loan market. |
| (6) | The return shown is based on net asset value calculated for shareholder transactions and may differ from the return shown in the Financial Highlights, which reflects adjustments made to the net asset value in accordance with accounting principles generally accepted in the United States of America. |
Performance data quoted represents past performance, which is not a guarantee of future results. Current performance may be lower or higher than the performance quoted. The principal value and investment return of an investment will fluctuate so that your shares, if repurchased, may be worth more or less than their original cost. Total return measures net investment income and capital gain or loss from portfolio investments. All performance shown assumes reinvestment of dividends and capital gains distributions. Investors cannot invest directly in an index.
The Fund is a continuously offered, non-diversified, closed-end management investment company that is operated as an interval fund. The Fund is suitable only for investors who can bear the risks associated with the Fund’s limited liquidity and should be viewed as a long-term investment. The Fund’s shares have no history of public trading, nor is it intended that its shares will be listed on a national securities exchange at this time, if ever. Investing in the Fund’s shares may be speculative and involves a high degree of risk, including the risks associated with leverage. Investing in the Fund involves risk, including the risk that shareholders may receive little or no return on their investment or that shareholders may lose part or all of their investment. The Fund may pay distributions in significant part from sources that may not be available in the future and that are unrelated to its performance, such as a return of capital or borrowings. The amount of distributions that the Fund may pay, if any, is uncertain.
| Annual Report | December 31, 2023 | 3 |
| Flat Rock Core Income Fund | Portfolio Update |
| | December 31, 2023 (Unaudited) |
ASSET ALLOCATION as of December 31, 2023^
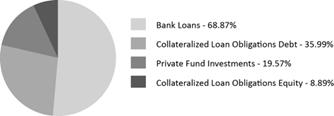
| ^ | Holdings are subject to change. |
| | Percentages are based on net assets of the Fund. |
TOP TEN HOLDINGS* as of December 31, 2023
| | | % of Total Investments** | |
| Triplepoint Private Venture Credit Inc. | | | 5.68 | % |
| BCP Great Lakes II - Series A Holdings LP | | | 4.61 | % |
| Hercules Private Global Venture Growth Fund I L.P. | | | 4.40 | % |
| Galactic Litigation Partners | | | 3.26 | % |
| George Intermediate Holdings, Inc. | | | 2.70 | % |
| Diversified Risk Holdings | | | 2.40 | % |
| Congruex Group LLC | | | 2.35 | % |
| Mount Logan Funding 2018-1 LP | | | 2.12 | % |
| Crane Engineering Sales | | | 2.02 | % |
| Monroe Capital MML CLO VIII, Ltd. | | | 2.01 | % |
| | | | 31.55 | % |
| * | Holdings are subject to change and exclude cash equivalents and government securities. Holdings are presented on an individual security basis and may not reflect the Fund’s total holdings with respect to one issuer. |
| ** | Percentages are based on the fair value of total investments of the Fund. |
| Flat Rock Core Income Fund | Portfolio Update |
| | December 31, 2023 (Unaudited) |
GROWTH OF A HYPOTHETICAL $10,000 INVESTMENT
The graph below illustrates the growth of a hypothetical $10,000 investment assuming the purchase of common shares at the NAV of $20.00 on July 2, 2017 (commencement of operations) and tracking its progress through December 31, 2023. Operations for the period prior to November 22, 2020 are for Flat Rock Capital Corp. (see Note 14 in the Notes to Consolidated Financial Statements for further information).
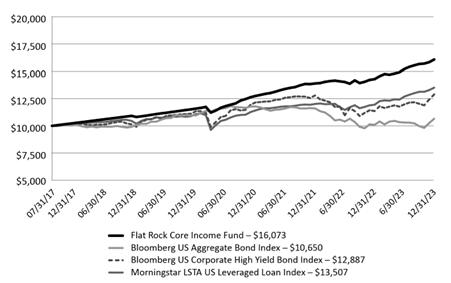
The hypothetical $10,000 investment at inception includes changes due to share price and reinvestment of dividends and capital gains. The chart does not imply future performance. Indexes are unmanaged, do not incur fees, expenses or taxes, and cannot be invested in directly. Performance quoted does not include a deduction for taxes that a shareholder would pay on the repurchase of fund shares.
| Annual Report | December 31, 2023 | 5 |
| Flat Rock Core Income Fund | Consolidated Schedule of Investments |
| | December 31, 2023 |
| | | Rate | | Maturity | | Principal
Amount | | Value | |
| FIRST LIEN SENIOR SECURED DEBT- 68.87% |
| 24 Seven Holdco, LLC(a)(b)(c) | | 1M US SOFR + 6.00%
(1.00% Floor) | | 11/16/2027 | | $ | 4,302,404 | | $ | 4,229,263 | |
| Accordion Partners(a)(b)(c) | | 3M US SOFR +6.25%
(0.75% Floor) | | 08/31/2029 | | | 4,268,234 | | | 4,234,515 | |
| Accordion Partners DDTL(a)(b)(c)(d) | | 3M US SOFR +6.25%
(0.75% Floor) | | 08/31/2024 | | | 270,701 | | | 268,563 | |
| AIS HoldCo, LLC(a)(b)(c) | | 3M US SOFR + 5.00% | | 08/15/2025 | | | 3,275,000 | | | 3,275,000 | |
| ALM Media, LLC(a)(b)(c) | | 1M US SOFR + 6.00%
(1.00% Floor) | | 11/25/2024 | | | 4,062,500 | | | 4,001,562 | |
| Bounteous Inc.(a)(b)(c) | | 1M US SOFR + 5.00%
(1.00% Floor) | | 11/05/2027 | | | 1,633,333 | | | 1,609,977 | |
| Bounteous Inc. Delayed Draw(a)(b)(c)(d) | | 1M US SOFR + 5.00%
(1.00% Floor) | | 02/03/2024 | | | 3,333,333 | | | 3,285,667 | |
| Broder Bros Co.(a)(b)(c) | | 3M US SOFR + 5.75%
(1.00% Floor) | | 12/04/2025 | | | 5,472,378 | | | 5,415,466 | |
| Congruex Group LLC(a)(b)(c) | | 3M SOFR + 5.75%
(0.75% Floor) | | 05/03/2029 | | | 6,899,937 | | | 6,825,418 | |
| Crane Engineering Sales(a)(b)(c) | | 3M US SOFR + 5.50%
(1.00% Floor) | | 08/25/2029 | | | 6,000,000 | | | 5,882,400 | |
| Diversified Risk Holdings(a)(b)(c) | | 3M US SOFR + 6.25%
(1.00% Floor) | | 04/30/2026 | | | 7,111,733 | | | 6,969,498 | |
| Diversified Risk Holdings Revolver(a)(b)(c)(d) | | 3M US SOFR + 6.25% | | 04/30/2026 | | | 296,296 | | | 296,296 | |
| Drive Automotive Services, LLC TL(a)(b)(c) | | 3M US SOFR + 6.15% | | 04/01/2024 | | | 4,250,000 | | | 4,194,622 | |
| See Notes to Consolidated Financial Statements. | |
| 6 | www.flatrockglobal.com |
| Flat Rock Core Income Fund | Consolidated Schedule of Investments |
| | December 31, 2023 |
| | | Rate | | Maturity | | Principal Amount | | Value | |
| ETC Group(a)(b)(c) | | 1M US SOFR + 6.00%
(0.50% Floor) | | 06/10/2029 | | $ | 2,016,168 | | $ | 1,844,793 | |
| Flagship Oral Surgery Partners, LLC(a)(b)(c)(d) | | SOFR + 6.00% | | 12/20/2027 | | | 5,000,000 | | | 4,887,500 | |
| Galactic Litigation Partners(a)(e) | | 13.00% | | 06/21/2024 | | | 9,477,080 | | | 9,477,080 | |
| Garmat USA LLC Term Loan(a)(b)(c) | | 1M US SOFR+ 5.00%
(1.00% Floor) | | 06/19/2025 | | | 4,903,272 | | | 4,859,142 | |
| George Intermediate Holdings, Inc.(a)(b)(c) | | 1M US SOFR + 6.50%
(1.00% Floor) | | 08/15/2027 | | | 7,940,000 | | | 7,850,278 | |
| Inmar, Inc(a)(b)(c) | | 3M US SOFR + 5.50%
(0.50% Floor) | | 05/01/2026 | | | 3,980,000 | | | 3,923,603 | |
| Isagenix International LLC(a)(b)(c)(f) | | 3M US SOFR + 5.50%
(1.00% Floor) | | 04/14/2028 | | | 1,172,262 | | | 440,771 | |
| MAG Aerospace(a)(b)(c) | | 1M US SOFR + 5.50%
(1.00% Floor) | | 04/01/2027 | | | 3,646,872 | | | 3,464,528 | |
| Magnate Worldwide LLC(a)(b)(c) | | 3M SOFR + 5.50%
(0.75% Floor) | | 12/30/2028 | | | 3,805,366 | | | 3,659,240 | |
| North Pole US LLC(a)(b)(c) | | 3M SOFR + 7.00% | | 03/03/2025 | | | 1,750,000 | | | 166,250 | |
| Oak Point Partners Term Loan(a)(b)(c) | | 1M US SOFR + 5.25%
(1.00% Floor) | | 12/01/2027 | | | 4,391,525 | | | 4,279,542 | |
| Perennial Services Group, LLC, Term Loan(a)(b)(c) | | 1M SOFR + 6.00%
(1.00% Floor) | | 09/08/2029 | | | 4,992,630 | | | 4,882,293 | |
| Potpourri Group, Inc.(a)(b)(c) | | 1M US SOFR + 8.25%
(1.50% Floor) | | 07/03/2024 | | | 5,583,553 | | | 5,583,553 | |
| Profile Products LLC, Term Loan(a)(b)(c) | | 1M US SOFR + 5.50%
(0.75% Floor) | | 11/12/2027 | | | 2,963,967 | | | 2,896,093 | |
| S&P Engineering Solutions(a)(b)(c)(e) | | 3M SOFR + 7.00%
(1.00% Floor) | | 05/02/2030 | | | 4,987,500 | | | 4,904,250 | |
| Savers, Inc.(a)(b)(c) | | SOFR + 5.50%
(0.75% Floor) | | 04/26/2028 | | | 1,959,837 | | | 1,962,287 | |
| See Notes to Consolidated Financial Statements. | |
| Annual Report | December 31, 2023 | 7 |
| Flat Rock Core Income Fund | Consolidated Schedule of Investments |
| | December 31, 2023 |
| | | Rate | | Maturity | | Principal Amount | | Value | |
| Solaray LLC(a)(b)(c) | | 3M SOFR + 6.50%
(1.00% Floor) | | 01/15/2024 | | $ | 1,671,199 | | $ | 1,673,704 | |
| Solaray, LLC Inc.(a)(b)(c) | | 3M SOFR + 6.50%
(1.00% Floor) | | 01/15/2024 | | | 1,766,755 | | | 1,769,403 | |
| Solaray, LLC Term Loan 1L(a)(b)(c) | | 3M SOFR + 6.50%
(1.00% Floor) | | 01/15/2024 | | | 1,466,116 | | | 1,468,313 | |
| Spencer Gifts LLC(a)(b)(c) | | 1M US SOFR + 6.00% | | 06/19/2026 | | | 4,916,006 | | | 4,890,197 | |
| Thryv, Inc.(a)(b)(c) | | 1M US SOFR + 8.50%
(1.00% Floor) | | 03/01/2026 | | | 3,735,456 | | | 3,728,470 | |
| Vehicle Management Services, LLC TL(a)(b)(c) | | SOFR + 6.25%
| | 07/26/2027 | | | 5,500,000 | | | 5,417,500 | |
| Watchguard Technologies, Inc.(a)(b)(c) | | 1M US SOFR + 5.25%
(0.75% Floor)(g) | | 06/30/2029 | | | 4,952,424 | | | 4,726,495 | |
| Watterson(a)(b)(c)(e) | | 3M US SOFR + 6.00%
(1.00% Floor) | | 12/17/2026 | | | 4,135,563 | | | 4,107,441 | |
| Watterson Term Loan-Delayed Draw(a)(b)(c)(d)(e) | | 3M US SOFR + 6.00%
(1.00% Floor) | | 12/17/2026 | | | 469,704 | | | 466,510 | |
| Xanitos, Inc. Term Loan(a)(b)(c)(e) | | 3M US SOFR + 6.50%
(1.00% Floor) | | 06/25/2026 | | | 3,514,069 | | | 3,482,443 | |
| Zavation Medical Products, LLC TL(a)(b)(c) | | 3M SOFR + 6.50%
(1.00% Floor) | | 06/30/2028 | | | 2,985,000 | | | 2,976,941 | |
TOTAL FIRST LIEN SENIOR SECURED DEBT
(Cost $152,529,068) | | | | | | | | | $ | 150,276,867 | |
| | | | | | | | | | | | |
| COLLATERALIZED LOAN OBLIGATIONS EQUITY- 8.89%(h) | | | | | | | | | | | |
| | | | | | | | | | | | |
| Barings Middle Market CLO Ltd 2021- I, Subordinated Notes(a)(i) | | 20.36%(g) | | 07/20/2033 | | | 6,300,000 | | | 5,798,790 | |
| BlackRock Elbert CLO V LLC, Subordinated Notes(a) | | 16.15%(g) | | 06/15/2034 | | | 2,000,000 | | | 1,724,278 | |
| BlackRock Maroon Bells CLO XI LLC, Subordinated Notes(a)(i) | | 15.92%(g) | | 10/15/2034 | | | 10,191,083 | | | 4,711,635 | |
| See Notes to Consolidated Financial Statements. | |
| 8 | www.flatrockglobal.com |
| Flat Rock Core Income Fund | Consolidated Schedule of Investments |
December 31, 2023
| | | Rate | | | Maturity | | | Principal
Amount | | | Value | |
| Churchill Middle Market CLO III, Ltd., Subordinated Notes(a)(i) | | | 13.09%(g) | | | | 10/24/2033 | | | $ | 5,000,000 | | | $ | 3,730,304 | |
| TCP Whitney CLO LTD, Class SUB2(a)(i) | | | 15.91%(g) | | | | 08/20/2033 | | | | 5,000,000 | | | | 3,433,584 | |
| | | | | | | | | | | | | | | | | |
| TOTAL COLLATERALIZED LOAN OBLIGATIONS EQUITY | | | | | | | | | | | | | | $ | 19,398,591 | |
| (Cost $21,358,981) | | | | | | | | | | | | | | | | |
| | | | | | | | | | | | | | | | | |
| COLLATERALIZED LOAN OBLIGATIONS DEBT- 35.99% | | |
| ABPCI Direct Lending Fund CLO I LLC, Class E2(a)(b)(i) | | | 3M US SOFR + 8.99% | | | | 07/20/2033 | | | | 5,000,000 | | | | 4,980,541 | |
| ABPCI Direct Lending Fund CLO II LLC, Class ER(a)(b)(i) | | | 3M US SOFR + 7.86% | | | | 04/20/2032 | | | | 3,750,000 | | | | 3,588,926 | |
| ABPCI Direct Lending Fund CLO XI LP, Class E(a)(b)(i) | | | 3M US SOFR + 9.70% | | | | 10/27/2034 | | | | 3,000,000 | | | | 2,979,972 | |
| Barings Middle Market CLO 2023-II, Ltd., Class D(a)(b)(i) | | | 3M US SOFR + 8.67% | | | | 01/20/2032 | | | | 5,000,000 | | | | 4,950,670 | |
| Brightwood Capital MM CLO 2019-1, Ltd., Class D1(a)(b)(i) | | | 3M US SOFR + 5.98% | | | | 01/15/2031 | | | | 2,425,000 | | | | 2,372,117 | |
| Brightwood Capital MM CLO 2023-1, Ltd., Class D(a)(b)(i) | | | 3M US SOFR + 6.46% | | | | 10/15/2035 | | | | 4,400,000 | | | | 4,315,363 | |
| Churchill Middle Market CLO IV, Ltd., Class E2(a)(b) | | | 3M US SOFR + 9.53% | | | | 01/23/2032 | | | | 4,000,000 | | | | 3,999,072 | |
| Deerpath Capital CLO 2020-1, Ltd., Class DR(a)(b)(i) | | | 3M US SOFR + 6.39% | | | | 04/17/2034 | | | | 4,125,000 | | | | 4,071,215 | |
| Great Lakes CLO 2014-1, Ltd., Class FR(a)(b)(i) | | | 3M US SOFR + 10.26% | | | | 10/15/2029 | | | | 3,000,000 | | | | 2,830,854 | |
| MCF CLO IV LLC, Class ERR(a)(b)(i) | | | 3M US SOFR + 8.91% | | | | 10/20/2033 | | | | 5,000,000 | | | | 4,838,408 | |
| MCF CLO VII LLC, Class ER(a)(b)(i) | | | 3M US SOFR + 9.41% | | | | 07/20/2033 | | | | 5,000,000 | | | | 4,931,631 | |
| Monroe Capital MML CLO 2017-1, Ltd., Class E(a)(b)(i) | | | 3M US SOFR + 7.61% | | | | 04/22/2029 | | | | 2,000,000 | | | | 1,950,570 | |
| Monroe Capital MML CLO IX, Ltd., Class E(a)(b)(i) | | | 3M US SOFR + 8.96% | | | | 10/22/2031 | | | | 1,625,000 | | | | 1,591,080 | |
| Monroe Capital MML CLO VII, Ltd., Class E(a)(b)(i) | | | 3M US SOFR + 7.51% | | | | 11/22/2030 | | | | 1,760,000 | | | | 1,667,887 | |
| Monroe Capital MML CLO VIII, Ltd., Class ER(a)(b)(i) | | | 3M US SOFR + 8.62% | | | | 11/22/2033 | | | | 6,250,000 | | | | 5,835,831 | |
| See Notes to Consolidated Financial Statements. | |
| Annual Report | December 31, 2023 | 9 |
| Flat Rock Core Income Fund | Consolidated Schedule of Investments |
December 31, 2023
| | | Rate | | | Maturity | | | Principal
Amount | | | Value | |
| Monroe Capital MML CLO XI, Ltd., Class E(a)(b)(i) | | | 3M US SOFR + 8.80% | | | | 05/20/2033 | | | $ | 5,000,000 | | | $ | 4,753,839 | |
| Monroe Capital MML CLO XIV LLC, Class E(a)(b)(i) | | | 3M US SOFR + 10.02% | | | | 10/24/2034 | | | | 3,000,000 | | | | 2,992,285 | |
| Mount Logan Funding 2018-1 LP, Class ER(a)(b)(i) | | | 3M US SOFR + 8.72% | | | | 01/22/2033 | | | | 6,500,000 | | | | 6,164,810 | |
| PennantPark CLO VII LLC, Class D(a)(b)(i) | | | 3M US SOFR + 7.00% | | | | 07/20/2035 | | | | 3,000,000 | | | | 3,015,131 | |
| TCP Whitney CLO LTD, Class DR(a)(b)(i) | | | 3M US SOFR + 4.11% | | | | 08/20/2033 | | | | 1,897,000 | | | | 1,840,027 | |
| THL Credit Lake Shore MM CLO I, Ltd., Class ER(a)(b)(i) | | | 3M US SOFR + 9.23% | | | | 04/15/2033 | | | | 5,000,000 | | | | 4,870,949 | |
| | | | | | | | | | | | | | | | | |
| TOTAL COLLATERALIZED LOAN OBLIGATIONS DEBT | | | | | | | | | | | | | | $ | 78,541,178 | |
| (Cost $78,077,645) | | | | | | | | | | | | | | | | |
| | | Shares | | | Value | |
| COMMON STOCKS - 0.00% | | | | | | |
| Isagenix International, LLC(a)(c)(j) | | | 85,665 | | | $ | 0 | |
| | | | | | | | | |
| TOTAL COMMON STOCKS | | | | | | | | |
| (Cost $–) | | | | | | $ | 0 | |
| PRIVATE FUND INVESTMENTS - 19.57% | | | | | | | | |
| BCP Great Lakes II - Series A Holdings LP | | | N/A | | | | 13,398,759 | |
| Hercules Private Global Venture Growth Fund I L.P. | | | N/A | | | | 12,798,738 | |
| See Notes to Consolidated Financial Statements. | |
| 10 | www.flatrockglobal.com |
| Flat Rock Core Income Fund | Consolidated Schedule of Investments |
December 31, 2023
| | | Shares | | | Value | |
| Triplepoint Private Venture Credit Inc. | | | 1,324,395 | | | $ | 16,515,200 | |
| TOTAL PRIVATE FUND INVESTMENTS | | | | | | | | |
| (Cost $45,809,896) | | | | | | $ | 42,712,697 | |
| TOTAL INVESTMENTS - 133.32% | | | | | | | | |
| (Cost $297,775,590) | | | | | | $ | 290,929,333 | |
| LIABILITIES IN EXCESS OF OTHER ASSETS - (33.32)% | | | | | | | (72,714,796 | ) |
| NET ASSETS - 100.00% | | | | | | $ | 218,214,537 | |
| (a) | The level 3 assets were a result of unavailable quoted prices from an active market or the unavailability of other significant observable inputs. |
| (b) | Variable rate investment. Interest rates reset periodically. Interest rate shown reflects the rate in effect at December 31, 2023. For securities based on a published reference rate and spread, the reference rate and spread are included in the description above. |
| (c) | All or a portion of the security has been pledged as collateral in connection with the credit facility with certain funds and accounts managed by Cadence Bank, N.A. (the “Credit Facility”). At December 31, 2023, the value of securities pledged amounted to $150,276,867, which represents approximately 68.87% of net assets. |
| (d) | Investment has been committed to but has not been funded by the Fund as of December 31, 2023. See Note 12 for total unfunded investment commitments. |
| (e) | Investment was acquired via participation agreement. |
| (f) | Pays-in-kind securities - Rate paid in-kind is shown in parenthesis. |
| (h) | Collateralized Loan Obligations (“CLO”) equity positions are entitled to recurring distributions which are generally equal to the remaining cash flow of payments made by underlying securities less contractual payments to debt holders and fund expenses. The effective yield is estimated based upon the current projection of the amount and timing of these recurring distributions in addition to the estimated amount of terminal principal payment. Effective yields for the CLO equity positions are updated generally once a quarter or on a transaction such as an add-on purchase, refinancing or reset. The estimated yield and investment cost may ultimately not be realized. Total fair value of the securities is $19,398,591, which represents 8.89% of net assets as of December 31, 2023. |
| (i) | Securities exempt from registration under Rule 144A of the Securities Act of 1933. These securities are not restricted and may normally be sold to qualified institutional buyers in transactions exempt from registration. Total fair value of Rule 144A securities amounts to $92,216,419, which represents 42.26% of net assets as of December 31, 2023. |
| (j) | Non-income producing security. |
| See Notes to Consolidated Financial Statements. | |
| Annual Report | December 31, 2023 | 11 |
| Flat Rock Core Income Fund | Consolidated Schedule of Investments |
December 31, 2023
Investment Abbreviations:
SOFR - Secured Overnight Financing Rate
Reference Rates:
1M US SOFR - 1 Month SOFR as of December 31, 2023 was 5.34%
3M US SOFR - 3 Month SOFR as of December 31, 2023 was 5.33%
| See Notes to Consolidated Financial Statements. | |
| 12 | www.flatrockglobal.com |
| Flat Rock Core Income Fund | Consolidated Statement of Assets and Liabilities |
December 31, 2023
| ASSETS: | | | |
| Investments, at fair value (Cost: $297,775,590) | | $ | 290,929,333 | |
| Cash and cash equivalents | | | 350,674 | |
| Interest receivable | | | 6,847,335 | |
| Receivable for securities sold | | | 4,493,635 | |
| Dividends receivable | | | 786,105 | |
| Receivable for fund shares sold | | | 403,408 | |
| Fee rebate | | | 205,683 | |
| Prepaid loan commitment fees | | | 174,774 | |
| Prepaid expenses and other assets | | | 205,386 | |
| Total Assets | | | 304,396,333 | |
| LIABILITIES: | | | | |
| Credit Facility, net (see Note 9) | | | 54,997,713 | |
| Mandatorily redeemable preferred stock (net of deferred financing costs of $203,828(a)) (see Note 10) | | | 19,796,172 | |
| Payable for securities purchased | | | 9,210,303 | |
| Incentive fee payable | | | 1,109,394 | |
| Accrued interest expense | | | 391,958 | |
| Management fee payable | | | 342,396 | |
| Payable for audit and tax service fees | | | 125,000 | |
| Payable for fund accounting and administration fees | | | 73,025 | |
| Other accrued expenses | | | 40,489 | |
| Distributions payable on redeemable preferred stock | | | 39,905 | |
| Payable to transfer agent | | | 26,668 | |
| Payable to trustees and officers | | | 15,000 | |
| Payable for custodian fees | | | 13,773 | |
| Total Liabilities | | | 86,181,796 | |
| Net Assets | | $ | 218,214,537 | |
| Commitments and Contingencies (see Note 12) | | | | |
| NET ASSETS CONSIST OF: | | | | |
| Paid-in capital | | $ | 215,390,725 | |
| Total distributable earnings (accumulated losses) | | | 2,823,812 | |
| Net Assets | | $ | 218,214,537 | |
| PRICING OF SHARES: | | | | |
| Net Assets | | $ | 218,214,537 | |
Shares of beneficial interest outstanding
(Unlimited number of shares, at $0.001 par value per share) | | | 10,633,767 | |
| Net Asset Value Per Share and Offering Price Per Share | | $ | 20.52 | |
| (a) | $10,000 liquidation value per share. 2,000 shares authorized, issued and outstanding. |
| See Notes to Consolidated Financial Statements. | |
| Annual Report | December 31, 2023 | 13 |
| Flat Rock Core Income Fund | Consolidated Statement of Operations |
For the Year Ended December 31, 2023
| INVESTMENT INCOME: | | | |
| Interest income | | $ | 29,920,238 | |
| Dividend income | | | 5,767,974 | |
| Total Investment Income | | | 35,688,212 | |
| EXPENSES: | | | | |
| Incentive fees | | | 3,794,973 | |
| Management fees | | | 3,642,826 | |
| Interest on credit facility | | | 4,023,730 | |
| Distributions on redeemable preferred stock | | | 850,000 | |
| Accounting and administration fees | | | 610,606 | |
| Transfer agent fees and expenses | | | 363,436 | |
| Audit and tax service fees | | | 151,505 | |
| Amortization of deferred financing costs | | | 111,387 | |
| Legal fees | | | 86,935 | |
| Loan issuance costs | | | 56,076 | |
| Custodian expenses | | | 39,077 | |
| Printing expenses | | | 35,745 | |
| Registration expenses | | | 31,519 | |
| Compliance expenses | | | 24,000 | |
| Trustee expenses | | | 15,000 | |
| Insurance expenses | | | 14,450 | |
| Excise tax expenses | | | 13,835 | |
| Miscellaneous expenses | | | 69,740 | |
| Total Expenses | | | 13,934,840 | |
| Net Investment Income | | | 21,753,372 | |
| REALIZED AND UNREALIZED GAIN/LOSS: | | | | |
| Net realized loss on: | | | | |
| Investments | | | (704,124 | ) |
| Net change in unrealized appreciation/(depreciation) on: | | | | |
| Investments | | | 1,870,472 | |
| Net Realized and Unrealized Gain on Investments | | | 1,166,348 | |
| Net Increase in Net Assets Resulting from Operations | | $ | 22,919,720 | |
| See Notes to Consolidated Financial Statements. | |
| 14 | www.flatrockglobal.com |
| Flat Rock Core Income Fund | Consolidated Statements of Changes in Net Assets |
| | | For the
Year Ended
December 31,
2023 | | | For the
Year Ended
December 31,
2022 | |
| NET INCREASE/(DECREASE) IN NET ASSETS RESULTING FROM OPERATIONS: | | | | | | |
| Net investment income | | $ | 21,753,372 | | | $ | 13,522,323 | |
| Net realized loss | | | (704,124 | ) | | | (833,351 | ) |
| Net change in unrealized appreciation/depreciation | | | 1,870,472 | | | | (8,123,485 | ) |
| Net increase in net assets resulting from operations | | | 22,919,720 | | | | 4,565,487 | |
| | | | | | | | | |
| DISTRIBUTIONS TO SHAREHOLDERS: | | | | | | | | |
| Distributions paid from earnings | | | (16,904,113 | ) | | | (10,386,184 | ) |
| Decrease in net assets from distributions to shareholders | | | (16,904,113 | ) | | | (10,386,184 | ) |
| | | | | | | | | |
| CAPITAL SHARE TRANSACTIONS: | | | | | | | | |
| Proceeds from shares sold | | | 63,788,862 | | | | 89,540,684 | |
| Reinvestment of distributions | | | 5,330,172 | | | | 4,061,316 | |
| Cost of shares repurchased | | | (41,302,630 | ) | | | (19,783,124 | ) |
| Net increase in net assets from capital share transactions | | | 27,816,404 | | | | 73,818,876 | |
| | | | | | | | | |
| Net Increase in Net Assets | | | 33,832,011 | | | | 67,998,179 | |
| | | | | | | | | |
| NET ASSETS: | | | | | | | | |
| Beginning of year | | | 184,382,526 | | | | 116,384,347 | |
| End of year | | $ | 218,214,537 | | | $ | 184,382,526 | |
| | | | | | | | | |
| OTHER INFORMATION: | | | | | | | | |
| Share Transactions: | | | | | | | | |
| Shares sold | | | 3,149,706 | | | | 4,410,688 | |
| Shares issued in reinvestment of distributions | | | 264,003 | | | | 201,263 | |
| Shares repurchased | | | (2,046,890 | ) | | | (983,505 | ) |
| Net increase in shares outstanding | | | 1,366,819 | | | | 3,628,446 | |
| See Notes to Consolidated Financial Statements. | |
| Annual Report | December 31, 2023 | 15 |
| Flat Rock Core Income Fund | Consolidated Statement of Cash Flows |
| | For the Year Ended December 31, 2023 |
| CASH FLOWS RESULTING FROM OPERATING ACTIVITIES: | | | |
| Net increase in net assets resulting from operations | | $ | 22,919,720 | |
| Adjustments to reconcile net increase in net assets resulting from operations to net cash used in operating activities: | | | | |
| Purchase of investment securities | | | (71,867,983 | ) |
| Proceeds from sale of investment securities | | | 35,623,648 | |
| Net purchase of short-term investment securities | | | (95,672 | ) |
| Amortization of premium and accretion of discount on investments, net | | | (1,356,595 | ) |
Net realized loss on:
| | | | |
| Investments | | | 704,124 | |
Net change in unrealized appreciation on:
| | | | |
Investments
| | | (1,870,472 | ) |
| (Increase)/Decrease in assets: | | | | |
| Interest receivable | | | (2,474,260 | ) |
| Prepaid loan commitment fees | | | (174,774 | ) |
| Fee rebate | | | (16,673 | ) |
| Dividends receivable | | | 314,335 | |
| Prepaid expenses and other assets | | | 205,265 | |
Increase/(Decrease) in liabilities:
| | | | |
| Accrued interest expense | | | 150,571 | |
| Incentive fee payable | | | 394,589 | |
| Management fee payable | | | 58,100 | |
| Payable for fund accounting and administration fees | | | 6,434 | |
| Payable for custodian fees | | | 4,346 | |
| Payable for audit and tax service fees | | | 29,000 | |
| Payable to transfer agent | | | (14,091 | ) |
| Payable to trustees and officers | | | 15,000 | |
| Payable for excise tax | | | (16,471 | ) |
| Other accrued expenses | | | 8,687 | |
| Net cash used in operating activities | | | (17,453,172 | ) |
CASH FLOWS FROM FINANCING ACTIVITIES:
| | | | |
| Proceeds from shares sold | | | 63,545,351 | |
| Cost of shares repurchased | | | (41,302,630 | ) |
| Borrowings on credit facility | | | 103,735,855 | |
| Payments on credit facility | | | (97,037,546 | ) |
| Cash distributions paid | | | (11,573,941 | ) |
| Deferred financing costs on redeemable preferred stock | | | 111,387 | |
| Distributions payable on redeemable preferred stock | | | (234 | ) |
| Net cash provided by financing activities | | | 17,478,242 | |
| Net increase in cash | | | 25,070 | |
| Cash, beginning of year | | $ | 325,604 | |
| Cash, end of year | | $ | 350,674 | |
| See Notes to Consolidated Financial Statements. | |
| 16 | www.flatrockglobal.com |
| Flat Rock Core Income Fund | Consolidated Statement of Cash Flows |
| | For the Year Ended December 31, 2023 |
| Non-cash financing activities not included herein consist of: | | | |
| Reinvestment of dividends and distributions: | | $ | 5,330,172 | |
| Cash paid for interest on credit facility during the year was: | | $ | 3,873,159 | |
| Cash paid for interest on mandatory redeemable preferred stock: | | $ | 850,234 | |
| See Notes to Consolidated Financial Statements. | |
| Annual Report | December 31, 2023 | 17 |
| Flat Rock Core Income Fund | Consolidated Financial Highlights |
| | For a share outstanding throughout the years presented |
| | | For the Year Ended December 31,
2023 | | | For the Year Ended December 31,
2022 | | | For the Year Ended December 31,
2021 | | | For the Year Ended December 31,
2020(a) | | | For the Year Ended December 31,
2019(a) | |
| Net asset value - beginning of year | | $ | 19.90 | | | $ | 20.64 | | | $ | 20.29 | | | $ | 19.76 | | | $ | 19.74 | |
| Income from investment operations: | | | | | | | | | | | | | | | | | | | | |
| Net investment income(b) | | | 2.27 | | | | 1.76 | | | | 1.54 | | | | 1.41 | | | | 1.37 | |
| Net realized and unrealized gain/(loss) on investments(b) | | | 0.11 | | | | (1.13 | ) | | | 0.17 | | | | 0.48 | | | | (0.01 | ) |
| Total income from investment operations | | | 2.38 | | | | 0.63 | | | | 1.71 | | | | 1.89 | | | | 1.36 | |
| Less distributions: | | | | | | | | | | | | | | | | | | | | |
| From net investment income | | | (1.76 | ) | | | (1.35 | ) | | | (1.36 | ) | | | (0.81 | ) | | | (1.34 | ) |
| From net realized gain on investments | | | – | | | | (0.02 | ) | | | – | | | | (0.55 | ) | | | – | |
| Total distributions | | | (1.76 | ) | | | (1.37 | ) | | | (1.36 | ) | | | (1.36 | ) | | | (1.34 | ) |
| Net increase/(decrease) in net asset value | | | 0.62 | | | | (0.74 | ) | | | 0.35 | | | | 0.53 | | | | 0.02 | |
| Net asset value - end of year | | $ | 20.52 | | | $ | 19.90 | | | $ | 20.64 | | | $ | 20.29 | | | $ | 19.76 | |
| Total Return(c) | | | 12.43 | % | | | 3.14 | % | | | 8.73 | % | | | 10.03 | % | | | 7.13 | % |
| Ratios/Supplemental Data: | | | | | | | | | | | | | | | | | | | | |
| Net assets, end of year (in thousands) | | $ | 218,215 | | | $ | 184,382 | | | $ | 116,384 | | | $ | 60,436 | | | $ | 55,970 | |
| Ratios to Average Net Assets (including interest on credit facility and distributions on mandatorily redeemable preferred stock)(d) | | | | | | | | | | | | | | | | | | | | |
| Ratio of expenses to average net assets including fee waivers and reimbursements | | | 7.17 | % | | | 6.16 | % | | | 5.51 | % | | | 7.69 | % | | | 7.39 | % |
| Ratio of expenses to average net assets excluding fee waivers and reimbursements | | | 7.17 | % | | | 6.16 | % | | | 5.51 | % | | | 8.07 | % | | | 8.83 | % |
| Ratio of net investment income to average net assets including fee waivers and reimbursements | | | 11.19 | % | | | 8.74 | % | | | 7.50 | % | | | 7.15 | % | | | 6.85 | % |
| Ratio of net investment income to average net assets excluding fee waivers and reimbursements | | | 11.19 | % | | | 8.74 | % | | | 7.50 | % | | | 6.77 | % | | | 5.41 | % |
| See Notes to Consolidated Financial Statements. | |
| 18 | www.flatrockglobal.com |
| Flat Rock Core Income Fund | Consolidated Financial Highlights |
| | For a share outstanding throughout the years presented |
| | | For the Year Ended December 31,
2023 | | | For the Year Ended December 31,
2022 | | | For the Year Ended December 31,
2021 | | | For the Year Ended December 31,
2020(a) | | | For the Year Ended December 31,
2019(a) | |
| Ratios to Average Net Assets (excluding interest on credit facility and distributions on mandatorily redeemable preferred stock)(d) | | | | | | | | | | | | | | | |
| Ratio of expenses to average net assets including fee waivers and reimbursements | | | 4.66 | % | | | 4.41 | % | | | 4.41 | % | | | 5.69 | % | | | 4.47 | % |
| Ratio of expenses to average net assets excluding fee waivers and reimbursements | | | 4.66 | % | | | 4.41 | % | | | 4.41 | % | | | 6.07 | % | | | 4.77 | % |
| Ratio of net investment income to average net assets including fee waivers and reimbursements | | | 13.70 | % | | | 10.49 | % | | | 8.60 | % | | | 9.15 | % | | | 10.31 | % |
| Ratio of net investment income to average net assets excluding fee waivers and reimbursements | | | 13.70 | % | | | 10.49 | % | | | 8.60 | % | | | 8.77 | % | | | 9.77 | % |
| Portfolio turnover rate | | | 13 | % | | | 17 | % | | | 67 | % | | | 32 | % | | | 85 | % |
| Credit Facility: | | | | | | | | | | | | | | | | | | | | |
| Aggregate principal amount, end of year (000s): | | $ | 54,998 | | | $ | 48,548 | | | $ | 41,703 | | | $ | 25,676 | | | $ | 29,796 | |
| Asset coverage, end of year per $1,000:(e) | | | 4,975 | | | | 4,804 | | | | 3,780 | | | | 3,354 | | | | 2,667 | |
| Mandatorily Redeemable Preferred Stock: | | | | | | | | | | | | | | | | | | | | |
| Liquidation value, end of period (000s): | | $ | 20,000 | | | $ | 20,000 | | | $ | 10,000 | | | | N/A | | | | N/A | |
| Asset coverage, end of year per share(f) | | | 23,825 | | | | 20,442 | | | | 12,640 | | | | N/A | | | | N/A | |
| (a) | The consolidated operations for the year ended December 31, 2019 and for the period from January 1, 2020 to November 22, 2020 are for Flat Rock Capital Corp. (See Note 14 in the Notes to Consolidated Financial Statements for further information). |
| (b) | Based on average shares outstanding during the period. |
| (c) | Total return in the above table represents the rate that the investor would have earned or lost on an investment in the Fund, assuming reinvestment of dividends. |
| See Notes to Consolidated Financial Statements. | |
| Annual Report | December 31, 2023 | 19 |
| Flat Rock Core Income Fund | Consolidated Financial Highlights |
| | For a share outstanding throughout the years presented |
| (d) | Interest expense relates to the Fund’s Credit Facility (see Note 9) and includes amortization of debt issuance costs as well as distributions on mandatorily redeemable preferred stock (see Note 10). |
| (e) | Calculated by subtracting the Fund’s total liabilities (excluding the Credit Facility and accumulated unpaid interest on Credit Facility) from the Fund’s total assets and dividing by the outstanding Credit Facility balance. |
| (f) | Asset coverage ratio is calculated by subtracting the Fund’s total liabilities (excluding the liquidation value of the Mandatorily Redeemable Preferred Stock including distributions payable on Mandatorily Redeemable Preferred Stock) from the Fund’s total assets and dividing by the liquidation value of the Mandatorily Redeemable Preferred Stock. The asset coverage per share figure is expressed in terms of dollar amounts per share of outstanding Preferred Stock. |
| See Notes to Consolidated Financial Statements. | |
| 20 | www.flatrockglobal.com |
| Flat Rock Core Income Fund | Notes to Consolidated Financial Statements |
| | December 31, 2023 |
Flat Rock Core Income Fund (the “Fund”) is registered under the Investment Company Act of 1940, as amended, (the “1940 Act”) as a non-diversified, closed-end management investment company. The shares of beneficial interest of the Fund (the “Shares”) are continuously offered under Rule 415 under the Securities Act of 1933, as amended (the “Securities Act”). The Fund operates as an interval fund pursuant to Rule 23c-3 under the 1940 Act, and has adopted a fundamental policy to conduct quarterly repurchase offers at net asset value (“NAV”).
The Fund’s investment objective is the preservation of capital while generating current income from its debt investments and seeking to maximize the portfolio’s total return.
The Fund was formed as a Delaware statutory trust on June 11, 2020 and operates pursuant to a Second Amended and Restated Agreement and Declaration of Trust governed by and interpreted in accordance with the laws of the State of Delaware. The Fund had no operations from that date to November 23, 2020, other than those related to organizational matters and the registration of its shares under applicable securities laws.
The operations reported in the accompanying consolidated financial statements and financial highlights for the periods from January 1, 2019 to November 22, 2020 are for Flat Rock Capital Corp., a Maryland corporation formed on March 20, 2017 that commenced operations on May 3, 2017. Flat Rock Capital Corp. was an externally managed, non-diversified, closed-end management investment company that elected to be regulated as a business development company (“BDC”) under the 1940 Act and that elected to be treated as a regulated investment company (“RIC”) under Subchapter M of the Internal Revenue Code of 1986, as amended (the “Code”). On November 20, 2020, Flat Rock Capital Corp. transferred all of its assets to the Fund as part of a reorganization as described in Note 14.
FRC Funding I, LLC, the Fund’s wholly owned financing subsidiary, is consolidated in the Fund’s financial statements.
| 2. | SIGNIFICANT ACCOUNTING POLICIES |
The following is a summary of significant accounting policies followed by the Fund in preparation of its financial statements in conformity with accounting principles generally accepted in the United States of America (“U.S. GAAP”). The Fund is an investment company under U.S. GAAP and follows the investment company accounting and reporting guidance of the Financial Accounting Standards Board (“FASB”) Accounting Standards Codification (“ASC”) Topic 946.
Use of Estimates: The preparation of the financial statements requires management to make estimates and assumptions that affect the reported amounts of assets and liabilities and disclosure of contingent assets and liabilities at the date of the financial statements, as well as the reported amounts of increases and decreases in net assets from operations during the period. Actual results could differ from these estimates.
| Annual Report | December 31, 2023 | 21 |
| Flat Rock Core Income Fund | Notes to Consolidated Financial Statements |
| | December 31, 2023 |
Preferred Shares: In accordance with ASC 480-10-25, the Fund’s mandatorily redeemable preferred stock have been classified as debt on the Statement of Assets and Liabilities. Refer to “Note 10. Mandatorily Redeemable Preferred Stock” for further details.
Security Valuation: The Fund records its investments at fair value, which is defined as the price that would be received to sell an asset or paid to transfer a liability in an orderly transaction between market participants at the measurement date. The valuation techniques used to determine fair value are further described below. The Fund determines the NAV of its shares daily as of the close of regular trading (normally, 4:00 p.m., Eastern time) on each day that the New York Stock Exchange (“NYSE”) is open for business.
Equity securities for which market quotations are available are generally valued at the last sale price or official closing price on the primary market or exchange on which they trade.
Short-term debt securities having a remaining maturity of 60 days or less when purchased are valued at cost adjusted for amortization of premiums and accretion of discounts, which approximates fair value.
The Fund’s Board of Trustees (the “Board”) is responsible for the valuation of the Fund’s portfolio investments for which market quotations are not readily available, as determined in good faith pursuant to the Fund’s valuation policy and consistently applied valuation process. Rule 2a-5 under the 1940 Act sets forth the requirements for determining fair value in good faith. Determining fair value in good faith requires (i) assessment and management of risks, (ii) establishment of fair value methodologies, (iii) testing of fair value methodologies, and (iv) evaluation of pricing services. The Board is responsible for fair value determination. The day-to-day implementation of the Fund’s fair valuation process is performed by Flat Rock Global, LLC (the “Adviser”), under the oversight and supervision of the Board. The Adviser is not considered a valuation designee for purposes of Rule 2a-5 of the 1940 Act.
It is the policy of the Fund to value its portfolio securities using market quotations when readily available. For purposes of this policy, a market quotation is readily available only when that quotation is a quoted price (unadjusted) in active markets for identical investments that the Fund can access at the measurement date, provided that a quotation will not be readily available if it is not reliable. If market quotations are not readily available, securities or other assets will be valued at their fair market value as determined using the valuation methodologies approved by the Board.
The Fund primarily invests directly in senior secured loans of U.S. middle-market companies (“Senior Loans”) (either in the primary or secondary markets). The Fund’s Senior Loans are valued without accrued interest, and accrued interest is reported as income in the Fund’s statement of operations.
Certain of the Senior Loans held by the Fund will be broadly syndicated loans. Broadly syndicated loans will be valued by using readily available market quotations or indicative market quotations provided by an independent, third-party pricing service.
| Flat Rock Core Income Fund | Notes to Consolidated Financial Statements |
| | December 31, 2023 |
For each Senior Loan held by the Fund, that is either: 1) not a broadly syndicated loan; or 2) is a broadly-syndicated loan but has limited liquidity such that the Adviser determines that readily available or indicative market quotations do not reflect fair value, the Adviser will employ the methodology it deems most appropriate to fair value the Senior Loan. For the period before such a Senior Loan begins providing quarterly financial updates, the Senior Loan’s fair value will usually be listed as the cost at which the Fund purchased the Senior Loan. For all other such Senior Loans, the Adviser will fair value each of these on a quarterly basis after the underlying portfolio company has reported its most recent quarterly financial update. These fair value calculations involve significant professional judgment by the Adviser in the application of both observable and unobservable attributes, and it is possible that the fair value determined for a Senior Loan may differ materially from the value that could be realized upon the sale of the Senior Loan. There is no single standard for determining the fair value of an investment. Accordingly, the methodologies the Adviser may use to fair value the Senior Loan may include: 1) fair values provided by an independent third-party valuation firm; 2) mark-to-model valuation techniques; and 3) matrix pricing.
For each Senior Loan that is either: 1) not a broadly syndicated loan; or 2) is a broadly-syndicated loan but has limited liquidity such that the Adviser determines that readily available or indicative market quotations do not reflect fair value, the Adviser may adjust the value of the Senior Loan between quarterly valuations based on changes in the capital markets. To do this, as a proxy for discount rates and market comparables, the Adviser may look to the Morningstar LSTA U.S. Leveraged Loan 100 Index (the “LSTA Index”). The LSTA Index is an equal value-weighted index designed to track the performance of the largest U.S. leveraged loan facilities. The LSTA Index is comprised of senior secured loans denominated in U.S. dollars that meet certain selection criteria. If there are significant moves in the LSTA Index, the Adviser may adjust the value of the Senior Loan using its discretion.
In addition, the values of the Fund’s Senior Loans may be adjusted daily based on changes to the estimated total return that the asset will generate. The Adviser will monitor these estimates and update them as necessary if macro or individual changes warrant any adjustments.
The Fund may invest in junior debt or equity tranches of collateralized loan obligations (“CLOs”). In valuing such investments, the Adviser considers a number of factors, including: 1) the indicative prices provided by a recognized, independent third-party industry pricing service, and the implied yield of such prices; 2) recent trading prices for specific investments; 3) recent purchases and sales known to the Adviser in similar securities; 4) the indicative prices for specific investments and similar securities provided by the broker who arranges transactions in such CLOs; and 5) the Adviser’s own models, which will incorporate key inputs including, but not limited to, assumptions for future loan default rates, recovery rates, prepayment rates, and discount rates – all of which are determined by considering both observable and third-party market data and prevailing general market assumptions and conventions, as well as those of the Adviser. While the use of an independent third-party industry pricing service can be a source for valuing its CLO investments, the Adviser will not use the price provided by a third-party service if it believes that the price does not accurately reflect fair value, and will instead utilize another methodology outlined above to make its own assessment of fair value.
The Fund may invest in business development companies (“BDCs”) or senior loan facilities that provide the Fund with exposure to Senior Loans (“Loan Facilities”). When valuing BDCs that are publicly-traded, the Adviser will use the daily closing price quoted by the BDC’s respective exchange. When valuing BDCs that are not publicly-traded, as well as Loan Facilities, the Adviser will use the most recently reported net asset value provided by the manager of the respective investment.
| Annual Report | December 31, 2023 | 23 |
| Flat Rock Core Income Fund | Notes to Consolidated Financial Statements |
| | December 31, 2023 |
The Fund may invest in interests or shares in private investment companies and/or funds (“Private Investment Funds”) where the net asset value is calculated and reported by respective unaffiliated investment managers on a monthly or quarterly basis. Unless the Adviser is aware of information that a value reported to the Fund by a portfolio, underlying manager, or administrator does not accurately reflect the value of the Fund’s interest in that Private Investment Fund, the Adviser will use the net asset value provided by the Private Investment Funds as a practical expedient to estimate the fair value of such interests.
All available information, including non-binding indicative bids which may not be considered reliable, typically will be considered by us in making fair value determinations. In some instances, there may be limited trading activity in a security even though the market for the security is considered not active. In such cases we will consider the number of trades, the size and timing of each trade, and other circumstances around such trades, to the extent such information is available. We will engage third-party valuation firms to provide assistance to the Board in valuing a substantial portion of our investments. We expect to evaluate the impact of such additional information and factor it into its consideration of fair value.
Federal Income Taxes: The Fund has elected to be treated for U.S. federal income tax purposes as a RIC under Subchapter M of the Code. Accordingly, the Fund will generally not pay corporate-level
U.S. federal income taxes on any net ordinary income or capital gains that are timely distributed to shareholders. To qualify as a RIC, the Fund must, among other things, meet certain source-of-income and asset diversification requirements and timely distribute at least 90% of its investment company taxable income each year to its shareholders.
As of and during the year ended December 31, 2023, the Fund did not have a liability for any unrecognized tax benefits. The Fund files U.S. federal, state, and local tax returns as required. The Fund’s tax returns are subject to examination by the relevant tax authorities until expiration of the applicable statute of limitations which is generally three years after the filing of the tax return for federal purposes and four years for most state returns.
The Fund recognizes interest and penalties, if any, related to unrecognized tax benefits as income tax expenses on the Statement of Operations. During the year ended December 31, 2023, the Fund did not incur any interest or penalties.
Securities Transactions and Investment Income: Investment security transactions are accounted for on a trade date basis. Dividend income is recorded on the ex-dividend date. Discounts and premiums on securities purchased are amortized or accreted using the effective interest method. Realized gains and losses from securities transactions and unrealized appreciation and depreciation of securities are determined using the identified cost basis method for financial reporting purposes. Interest income from investments in the “equity” tranche of CLO funds is recorded based upon an estimate of an effective yield to expected maturity utilizing assumed cash flows in accordance with FASB ASC 325-40, Beneficial Interests in Securitized Financials Assets.
Debt Issuance Costs: The Fund records origination and other expenses related to its debt obligations as debt issuance costs. These expenses are deferred and amortized over the life of the related debt instrument. Debt issuance costs are presented on the consolidated statement of assets and liabilities as a direct deduction from the debt liability.
| Flat Rock Core Income Fund | Notes to Consolidated Financial Statements |
| | December 31, 2023 |
Distributions to Shareholders: The Fund normally pays dividends, if any, monthly, and distributes capital gains, if any, on an annual basis. Income dividend distributions are derived from dividends and interest income the Fund receives from its investments, including short term capital gains. Long term capital gain distributions are derived from gains realized when the Fund sells a security it has owned for more than one year.
Cash and Cash Equivalents: Cash and cash equivalents (e.g., U.S. Treasury bills) may include demand deposits and highly liquid investments with original maturities of three months or less. Cash and cash equivalents are carried at cost, which approximates fair value. The Fund deposits its cash and cash equivalents with highly-rated banking corporations and, at times, may exceed the insured limits under applicable law.
Participation Agreements and Assignments: The Fund enters into participation agreements in which one or more participants purchase an interest in a loan, but a lead lender, is the sole lender of record is responsible for originating the loan, retains control over the loan, manages the relationship and handles communication with the borrower and services the loan for both itself and the participants. The other participants have a contract with the lead rather than the borrower unless otherwise specified in the participation agreement, and accordingly cannot make claims against the borrower but instead must request reimbursement for their participation from the lead lender.
3. FAIR VALUE MEASUREMENTS
The Fund utilizes various inputs to measure the fair value of its investments. Observable inputs reflect the assumptions market participants would use in pricing the asset or liability that are developed based on market data obtained from sources independent of the reporting entity. Unobservable inputs reflect the reporting entity’s own assumptions about the assumptions market participants would use in pricing the asset or liability that are developed based on the best information available. These inputs are categorized in the following hierarchy under applicable financial accounting standards:
| Level 1 | - | Unadjusted quoted prices in active markets for identical assets and liabilities that the Fund has the ability to access at the measurement date. |
| Level 2 | - | Significant observable inputs (including quoted prices for the identical instrument on an inactive market, quoted prices for similar instruments, interest rates, prepayment spreads, credit risk, yield curves, default rates and similar data). |
| Level 3 | - | Significant unobservable inputs (including the Fund’s own assumptions in determining the fair value of the investments) to the extent relevant observable inputs are not available, for the asset or liability at the measurement date. |
The availability of observable inputs can vary from security to security and is affected by a wide variety of factors, including, for example, the type of security, whether the security is new and not yet established in the marketplace, the liquidity of markets, and other characteristics particular to the security. To the extent that valuation is based on models or inputs that are less observable or unobservable in the market, the determination of fair value requires more judgment. Accordingly, the degree of judgment exercised in determining fair value is greatest for instruments categorized in Level 3.
| Annual Report | December 31, 2023 | 25 |
| Flat Rock Core Income Fund | Notes to Consolidated Financial Statements |
| | December 31, 2023 |
The inputs used to measure fair value may fall into different levels of the fair value hierarchy. In such cases, for disclosure purposes, the level in the fair value hierarchy within which the fair value measurement falls is determined based on the lowest level input that is significant to the fair value measurement in its entirety. The inputs used for valuing securities are not necessarily an indication of the risk associated with investing in those securities.
The following table summarizes the inputs used to value the Fund’s investments under the fair value hierarchy levels as of December 31, 2023:
| | | Valuation Inputs | | | | |
| Investments in Securities at Value | | Level 1 | | | Level 2 | | | Level 3 | | | Total | |
| First Lien Senior Secured Debt | | $ | – | | | $ | – | | | $ | 150,276,867 | | | $ | 150,276,867 | |
| Collateralized Loan Obligations Equity | | | – | | | | – | | | | 19,398,591 | | | | 19,398,591 | |
| Collateralized Loan Obligations Debt | | | – | | | | – | | | | 78,541,178 | | | | 78,541,178 | |
| Common Stock | | | – | | | | – | | | | – | | | | – | |
| Private Fund Investments* | | | – | | | | – | | | | – | | | | 42,712,697 | |
| Total | | $ | – | | | $ | – | | | $ | 248,216,636 | | | $ | 290,929,333 | |
| * | The Fund held private fund investments with a fair value of $42,712,697 that in accordance with GAAP, are valued at net asset value as a “practical expedient” and are excluded from the fair value hierarchy as of December 31, 2023. |
The following table presents changes in the fair value of investments for which Level 3 inputs were used to determine the fair value as of and for the year ended December 31, 2023:
| | | | First Lien Senior Secured | | | | Collateralized
Loan Obligations | | | | Collateralized
Loan Obligations | | | | Common | | | | | |
| | | | Debt | | | | Equity | | | | Debt | | | | Stock | | | | Total | |
| Balance as of December 31, 2022 | | $ | 135,400,593 | | | $ | 20,708,711 | | | $ | 54,336,339 | | | $ | – | | | $ | 210,445,643 | |
| Accrued discount/ premium | | | 421,992 | | | | 212,416 | | | | 692,960 | | | | – | | | | 1,327,368 | |
| Realized Gain/(Loss) | | | (35,684 | ) | | | – | | | | – | | | | – | | | | (35,684 | ) |
| Change in Unrealized Appreciation/(Depreciation) | | | 2,168,635 | | | | (1,522,536 | ) | | | 3,170,707 | | | | – | | | | 3,816,806 | |
| Purchases | | | 46,936,597 | | | | – | | | | 22,059,972 | | | | – | | | | 68,996,569 | |
| Sales Proceeds | | | (34,615,266 | ) | | | – | | | | (1,718,800 | ) | | | – | | | | (36,334,066 | ) |
| Transfer into Level 3 | | | – | | | | – | | | | – | | | | – | | | | – | |
| Transfer out of Level 3 | | | – | | | | – | | | | – | | | | – | | | | – | |
| Balance as of December 31, 2023 | | $ | 150,276,867 | | | $ | 19,398,591 | | | $ | 78,541,178 | | | $ | – | | | $ | 248,216,636 | |
| Net change in unrealized appreciation/(depreciation) included in the Statements of Operations attributable to Level 3 investments held at December 31, 2023 | | $ | (181,911 | ) | | $ | (1,522,536 | ) | | $ | 3,170,707 | | | $ | – | | | $ | 1,466,260 | |
| Flat Rock Core Income Fund | Notes to Consolidated Financial Statements |
| | December 31, 2023 |
The following table summarizes the valuation techniques and significant unobservable inputs used for the Fund’s investments that are categorized in Level 3 of the fair value hierarchy as of December 31, 2023:
| | | | | | | | | | | | | Impact to Valuation |
| | | | Fair Value | | | Valuation | | | | | | from an |
| | | | as of | | | Techniques / | | Unobservable | | Range / Weighted | | Increase in |
| Assets | | | 12/31/23 | | | Methodologies | | Input | | Average(2) | | Input(3) |
First Lien Senior
Secured Debt | | $ | 109,630,900 | | | Market and income approach (through third- party vendor pricing service) | | EV / LTM EBITDA Multiple DCF Discount Margins | | 4.0x - 20.1x / 9.47x 4.41% - 28.00% / 7.42% | | Increase Decrease |
First Lien Senior
Secured Debt | | $ | 21,242,095 | | | Market Quotes | | NBIB(1) | | 9.50% - 100.13% / 97.13% | | N/A |
First Lien Senior
Secured Debt | | $ | 19,403,872 | | | Recent Transaction | | Acquisition Cost | | 97.75% - 98.70% / 98.25% | | N/A |
| CLO Debt | | $ | 73,590,508 | | | Market Quotes | | NBIB(1) | | 93.37% - 100.50% / 97.22% | | N/A |
| CLO Debt | | $ | 4,950,670 | | | Recent Transaction | | Acquisition Cost | | 99.00% - 99.00% / 99.00% | | N/A |
| CLO Equity | | $ | 15,668,287 | | | Market Quotes | | NBIB(1) | | 47.82% - 95.92% / 74.81% | | N/A |
| CLO Equity | | $ | 3,730,304 | | | Yield Analysis | | Internal Rate of Return | | 18.00% - 18.00% / 18.00% | | Decrease |
| (1) | The Fund generally uses non-binding indicative bid prices (“NBIB”) provided by an independent pricing service or broker on the valuation date as the primary basis for the fair value determinations for broadly-syndicated First Lien Senior Secured Debt, CLO Debt, and CLO Equity investments, which may be adjusted for pending equity distributions as of the valuation date. These prices are non-binding, and may not be determinative of fair value. Each price is evaluated by the Board of Directors in conjunction with additional information compiled by Flat Rock Global, including performance and covenant compliance information as provided by the respective CLO’s independent trustee. |
| (2) | Weighted averages are calculated based on fair value of investments |
| (3) | The impact on fair value measurement of an increase in each unobservable input is in isolation. |
| Unobservable Input | | Impact to Value if Input Increases | | Impact to Value if Input Decreases |
| EV / LTM EBITDA | | Increase | | Decrease |
| DCF Discount Margins | | Decrease | | Increase |
| Acquisition Cost | | Increase | | Decrease |
| Broker Quotes | | Increase | | Decrease |
| Annual Report | December 31, 2023 | 27 |
| Flat Rock Core Income Fund | Notes to Consolidated Financial Statements |
| | December 31, 2023 |
4. INVESTMENT ADVISORY SERVICES AND OTHER AGREEMENTS
Flat Rock Global, LLC serves as the investment adviser to the Fund pursuant to the terms of an investment advisory agreement (the “Advisory Agreement”). Under the terms of the Advisory Agreement, the Adviser provides the Fund such investment advice as it deems advisable and furnishes a continuous investment program for the Fund consistent with the Fund’s investment objective and strategies. As compensation for its management services, the Fund pays the Adviser a management fee of 1.375% (as a percentage of the average daily value of total assets), paid monthly in arrears, calculated based on the average daily value of total assets during such period.
In addition to the management fee, the Adviser is entitled to an incentive fee. The incentive fee is calculated and payable quarterly in arrears in an amount equal to 15.0% of the Fund’s “pre-incentive fee net investment income” for the immediately preceding quarter, and is subject to a hurdle rate, expressed as a rate of return on the Fund’s “adjusted capital,” equal to 1.50% per quarter (or an annualized hurdle rate of 6.00%), subject to a “catch-up” feature, which allows the Adviser to recover foregone incentive fees that were previously limited by the hurdle rate. For this purpose, “pre-incentive fee net investment income” means interest income, dividend income and any other income (including any other fees such as commitment, origination, structuring, diligence and consulting fees or other fees that the Fund receives from portfolio companies) accrued during the calendar quarter, minus the Fund’s operating expenses for the quarter (including the management fee, expenses reimbursed to the Adviser for any administrative services provided by the Adviser and any interest expense and distributions paid on any issued and outstanding debt and preferred shares, but excluding the incentive fee). Pre-incentive fee net investment income includes, in the case of investments with a deferred interest feature (such as original issue discount, debt instruments with payment-in-kind interest and zero coupon securities), accrued income that the Fund has not yet received in cash. Pre-incentive fee net investment income does not include any realized capital gains, realized capital losses or unrealized capital appreciation or depreciation. “Adjusted capital” means the cumulative gross proceeds received by the Fund from the sale of shares (including pursuant to the Fund’s distribution reinvestment plan), reduced by amounts paid in connection with purchases of the Fund’s shares pursuant to the Fund’s repurchase program.
The calculation of the incentive fee on pre-incentive fee net investment income for each quarter is as follows:
| ● | No incentive fee is payable in any calendar quarter in which the Fund’s pre-incentive fee net investment income does not exceed the hurdle rate of 1.50% per quarter (or an annualized rate of 6.00%); |
| ● | 100% of the Fund’s pre-incentive fee net investment income, if any, that exceeds the hurdle rate but is less than or equal to 1.764%. This portion of the Fund’s pre-incentive fee net investment income (which exceeds the hurdle rate but is less than or equal to 1.764%) is referred to as the “catch-up.” The “catch-up” provision is intended to provide the Adviser with an incentive fee of 15.0% on all of the Fund’s pre-incentive fee net investment income when the Fund’s pre-incentive fee net investment income reaches 1.764% in any calendar quarter; and |
| ● | 15.0% of the amount of the Fund’s pre-incentive fee net investment income, if any, that exceeds 1.764% in any calendar quarter is payable to the Adviser once the hurdle rate is reached and the catch-up is achieved (15.0% of all pre-incentive fee net investment income thereafter will be allocated to the Adviser). |
| Flat Rock Core Income Fund | Notes to Consolidated Financial Statements |
| | December 31, 2023 |
For the year ended December 31, 2023, the Adviser earned $3,642,826 in management fees and $3,794,973 in incentive fees.
ALPS Fund Services, Inc. (“ALPS”) serves as the Fund’s Administrator and Accounting Agent and receives customary fees from the Fund for such services.
DST Systems Inc., an affiliate of ALPS, serves as transfer, dividend paying and shareholder servicing agent for the Fund.
U.S. Bank N.A. serves as the Fund’s custodian.
The Fund has entered into a Distribution Agreement with ALPS Distributors, Inc. (the “Distributor”), an affiliate of ALPS, to provide distribution services to the Fund. The Distributor serves as principal underwriter/distributor of shares of the Fund.
ALPS, DST Systems Inc., U.S. Bank N.A., and the Distributor are not considered affiliates, as defined under the 1940 Act, of the Fund.
5. REPURCHASE OFFERS
The Fund conducts quarterly repurchase offers of 5% of the Fund’s outstanding shares. Repurchase offers in excess of 5% are made solely at the discretion of the Board and investors should not rely on any expectation of repurchase offers in excess of 5%. In the event that a repurchase offer is oversubscribed, shareholders may only be able to have a portion of their shares repurchased.
Quarterly repurchases occur in the months of January, April, July, and October. A repurchase offer notice will be sent to shareholders at least 21 calendar days before the repurchase request deadline. The repurchase price will be the Fund’s NAV determined on the repurchase pricing date, which is ordinarily expected to be the repurchase request deadline. Payment for all shares repurchased pursuant to these offers will be made not later than seven calendar days after the repurchase pricing date.
During the year ended December 31, 2023, the Fund completed four repurchase offers. In these offers, the Fund offered to repurchase no less than 5% of the number of its outstanding shares as of the repurchase pricing dates. The results of the repurchase offers were as follows:
| | | Repurchase Offer | | | Repurchase Offer | | | Repurchase Offer | | | Repurchase Offer | |
| | | #1 | | | #2 | | | #3 | | | #4 | |
| Commencement Date | | | December 20, 2022 | | | | March 21, 2023 | | | | June 20, 2023 | | | | September 19, 2023 | |
| Repurchase Request Deadline | | | January 24, 2023 | | | | April 25, 2023 | | | | July 25, 2023 | | | | October 24, 2023 | |
| Repurchase Pricing Date | | | January 24, 2023 | | | | April 25, 2023 | | | | July 25, 2023 | | | | October 24, 2023 | |
| Amount Repurchased | | | $13,171,923 | | | | $12,658,996 | | | | $9,214,625 | | | | $6,257,086 | |
| Shares Repurchased | | | 658,596 | | | | 630,428 | | | | 449,938 | | | | 307,927 | |
| Annual Report | December 31, 2023 | 29 |
| Flat Rock Core Income Fund | Notes to Consolidated Financial Statements |
| | December 31, 2023 |
6. PORTFOLIO INFORMATION
Purchases and sales of securities for the year ended December 31, 2023, excluding short-term securities, were as follows:
| Purchases of Securities | | | Proceeds from Sales of Securities | |
| $ 75,998,482 | | | | $ 35,637,315 | |
7. TAXES
Classification of Distributions
Distributions are determined in accordance with U.S. federal income tax regulations, which differ from U.S. GAAP, and therefore, may differ significantly in amount or character from net investment income and realized gains for financial statement purposes. Financial reporting records are adjusted for permanent book/tax differences to reflect tax character but are not adjusted for temporary differences.
The tax character of distributions paid by the Fund during the fiscal year ended December 31, 2023, was as follows:
| | | | | | | Distributions | | | | | | | |
| | | | | | | paid from | | | | | | | |
| Ordinary | | | Tax-Exempt | | | Long-Term | | | Return of | | | | |
| Income | | | Income | | | Capital Gain | | | Capital | | | Total | |
| $ | 16,904,113 | | | $ | – | | | $ | – | | | $ | – | | | $ | 16,904,113 | |
The tax character of distributions paid by the Fund during the fiscal year ended December 31, 2022, was as follows:
| | | | | | | Distributions | | | | | | | |
| | | | | | | paid from | | | | | | | |
| Ordinary | | | Tax-Exempt | | | Long-Term | | | Return of | | | | |
| Income | | | Income | | | Capital Gain | | | Capital | | | Total | |
| $ | 10,187,061 | | | $ | – | | | $ | 199,123 | | | $ | – | | | $ | 10,386,184 | |
Components of Distributable Earnings on a Tax Basis
The tax components of distributable earnings are determined in accordance with income tax regulations which may differ from the composition of net assets reported under U.S. GAAP. The amount reclassified did not affect net assets. The reclassification was related to non-deductible excise taxes paid. The reclassification was as follows:
| Paid-in Capital | | | Total Distributable Earnings | |
| $ | (30,842 | ) | | $ | 30,842 | |
| Flat Rock Core Income Fund | Notes to Consolidated Financial Statements |
| | December 31, 2023 |
At December 31, 2023, the components of distributable earnings on a tax basis for the Fund were as follows:
| Undistributed | | | Accumulated Capital | | | Net Unrealized
Appreciation/ | | | Other Cumulative
Effect of Timing | | | | |
| Ordinary Income | | | Gains/(Losses) | | | (Depreciation) | | | Differences | | | Total | |
| $ | 13,806,620 | | | $ | (925,818 | ) | | $ | (10,056,990 | ) | | $ | – | | | $ | 2,823,812 | |
Tax Basis of Investments
Net unrealized appreciation/(depreciation) of investments based on federal tax cost as of December 31, 2023, with differences related to partnership investments and wash sales, was as follows:
Gross Appreciation
(excess of value over tax) | | | Gross Depreciation
(excess of tax cost over value) | | | Net Unrealized
Appreciation/
(Depreciation) | | | Cost of Investments for
Income Tax Purposes | |
| $ | 2,100,366 | | | $ | (12,157,356 | ) | | $ | (10,056,990 | ) | | $ | 290,929,333 | |
Capital losses
As of december 31, 2023, the fund had capital loss carryforwards which may reduce the fund’s taxable income arising from future net realized gains on investments, if any, to the extent permitted by the irc and thus may reduce the amount of the distributions to shareholders which would otherwise be necessary to relieve the fund of any liability for federal tax pursuant to the irc. The capital loss carryforwards may be carried forward indefinitely. Capital losses carried forward for the year ended december 31, 2023, were as follows:
| Non-Expiring Short-Term | | | Non-Expiring Long-Term | |
| $ | 271,260 | | | $ | 654,558 | |
8. RISK FACTORS
In the normal course of business, the Fund invests in financial instruments and enters into financial transactions where risk of potential loss exists due to such things as changes in the market (market risk) or failure or inability of the other party to a transaction to perform (credit and counterparty risk). See below for a detailed description of select principal risks. The following list is not intended to be a comprehensive listing of all of the potential risks associated with the Fund. The Fund’s prospectus provides a detailed discussion of the Fund’s risks.
Credit Risk. The Fund is subject to the risk that the issuer or guarantor of an obligation, or the counterparty to a transaction, may fail, or become less able, to make timely payment of interest or principal or otherwise honor its obligations or default completely. The strategies utilized by the Adviser require accurate and detailed credit analysis of issuers, and there can be no assurance that its analysis will be accurate or complete. The Fund may be subject to substantial losses in the event of credit deterioration or bankruptcy of one or more issuers in its portfolio.
| Annual Report | December 31, 2023 | 31 |
| Flat Rock Core Income Fund | Notes to Consolidated Financial Statements |
| | December 31, 2023 |
Financial strength and solvency of an issuer are the primary factors influencing credit risk. The Fund could lose money if the issuer or guarantor of a debt security is unable or unwilling, or is perceived (whether by market participants, rating agencies, pricing services or otherwise) as unable or unwilling, to make timely principal and/or interest payments, or to otherwise honor its obligations. Companies in which the Fund invests could deteriorate as a result of, among other factors, an adverse development in their business, a change in the competitive environment or an economic downturn. As a result, companies that the Adviser may have expected to be stable may operate, or expect to operate, at a loss or have significant variations in operating results, may require substantial additional capital to support their operations or maintain their competitive position, or may otherwise have a weak financial condition or be experiencing financial distress. In addition, inadequacy of collateral or credit enhancement for a debt obligation may affect its credit risk. Although the Fund may invest in investments that the Adviser believes are secured by specific collateral, the value of which may exceed the principal amount of the investments at the time of initial investment, there can be no assurance that the liquidation of any such collateral would satisfy the borrower’s obligation in the event of non-payment of scheduled interest or principal payments with respect to such investment, or that such collateral could be readily liquidated. In addition, in the event of bankruptcy of a borrower, the Fund could experience delays or limitations with respect to its ability to realize the benefits of the collateral securing an investment. Under certain circumstances, collateral securing an investment may be released without the consent of the Fund.
Credit risk is typically greater for securities with ratings that are below investment grade (commonly referred to as “junk bonds”). Since the Fund can invest significantly in high-yield investments considered speculative in nature and unsecured investments, this risk may be substantial. The Fund’s right to payment and its security interest, if any, may be subordinated to the payment rights and security interests of more senior creditors. This risk may also be greater to the extent the Fund uses leverage or derivatives in connection with the management of the Fund. Changes in the actual or perceived creditworthiness of an issuer, or a downgrade or default affecting any of the Fund’s securities, could affect the Fund’s performance.
Senior Loans. The Fund pursues its investment objective by investing in a portfolio composed primarily of senior secured loans of U.S. middle-market companies (“Senior Loans”) and investment vehicles, such as CLOs, BDCs or senior loan facilities that provide the Fund with exposure to Senior Loans. Investing in Senior Loans involves a number of significant risks. Below investment grade Senior Loans have historically experienced greater default rates than has been the case for investment grade securities. The Fund intends to achieve its investment objective by investing in a portfolio composed primarily of securities that are rated below investment grade by rating agencies, or that would be rated below investment grade if they were rated. Below investment grade securities, which are often referred to as “junk,” have predominantly speculative characteristics with respect to the issuer’s capacity to pay interest and repay principal. They may also be difficult to value and illiquid. There can be no assurance as to the levels of defaults or recoveries that may be experienced on the Fund’s investments in Senior Loans. Senior Loans in which the Fund invests may be issued by companies with limited financial resources and limited access to alternative financing. Issuers of Senior Loans may be unable to meet their obligations under their debt securities that the Fund holds. Such developments may be accompanied by deterioration in the value of collateral backing its investments. This could lead to a decline in value of the Fund’s Senior Loan investments, which could result in a decline in the Fund’s net earnings and NAV. In addition, many of the Fund’s Senior Loans are “bank loans” that may not be deemed to be “securities” for purposes of the federal securities laws. Bank loan providers may not have the protections of the anti-fraud provisions of the federal securities laws and must rely instead on contractual provisions in loan agreements and applicable common-law fraud protections.
| Flat Rock Core Income Fund | Notes to Consolidated Financial Statements |
| | December 31, 2023 |
CLO Risk. CLOs are securities backed by an underlying portfolio of loan obligations. CLOs issue classes or “tranches” that vary in risk and yield and may experience substantial losses due to actual defaults, decrease of market value due to collateral defaults and removal of subordinate tranches, market anticipation of defaults and investor aversion to CLO securities as a class. Investments in CLO securities may be riskier and less transparent than direct investments in the underlying loans and debt obligations. The risks of investing in CLOs depend largely on the tranche invested in and the type of the underlying loans in the tranche of the CLO in which the Fund invests. The tranches in a CLO vary substantially in their risk profile, and debt tranches are more senior than equity tranches. The senior tranches are relatively safer because they have first priority on the collateral in the event of default. As a result, the senior tranches of a CLO generally have a higher credit rating and offer lower coupon rates than the junior tranches, which offer higher coupon rates to compensate for their higher default risk. The Fund expects that it will primarily invest in junior debt tranches of CLOs. The CLOs in which the Fund may invest may incur, or may have already incurred, debt that is senior to the Fund’s investment. CLOs also carry risks including, but not limited to, interest rate risk and credit risk. Investments in CLOs may be subject to certain tax provisions that could result in the Fund incurring tax or recognizing income prior to receiving cash distributions related to such income. CLOs that fail to comply with certain U.S. tax disclosure requirements may be subject to withholding requirements that could adversely affect cash flows and investment results. Any unrealized losses the Fund experiences with respect to its CLO investments may be an indication of future realized losses. Equity tranches are unrated and equity investors receive no principal payments, if any, until all debt obligations are paid.
Middle Market Risk. Investing in middle-market companies is highly speculative and involves a high degree of risk of credit loss, and therefore the Fund’s securities may not be suitable for someone with a low tolerance for risk. Middle-market companies are more likely to be considered lower grade investments, commonly called “junk,” which are either rated below investment grade by one or more nationally-recognized statistical rating agencies at the time of investment or may be unrated but determined by the Adviser to be of comparable quality. Lower grade securities or comparable unrated securities are considered predominantly speculative regarding the portfolio company’s ability to pay interest and principal and are susceptible to default or decline in market value due to adverse economic and business developments. These risks are likely to increase during volatile economic periods.
Global Markets Risk: The increasing interconnectivity between global economies and financial markets increases the likelihood that events or conditions in one region or financial market may adversely impact issuers in a different country, region or financial market. Securities in the Fund’s portfolio may underperform due to inflation (or expectations for inflation), interest rates, global demand for particular products or resources, natural disasters, pandemics, epidemics, terrorism, regulatory events and governmental or quasi-governmental actions. The occurrence of global events similar to those in recent years may result in market volatility, and may have long term effects on both the U.S. and global financial markets. For example, Russia’s ongoing military interventions in Ukraine have led to, and may lead to additional sanctions being levied by the United States, European Union and other countries against Russia. Russia’s military incursion and the resulting sanctions could adversely affect global energy and financial markets and thus could affect the value of the Fund’s investments, even beyond any direct exposure the Fund may have to Russian issuers or the adjoining geographic regions. The extent and duration of the military action, sanctions and resulting market disruptions are impossible to predict, but could be substantial. Any such disruptions caused by Russian military action or resulting sanctions may magnify the impact of other risks. In addition, the Israel-Hamas conflict as well as the potential risk for a wider conflict could negatively affect financial markets. Geopolitical tensions introduce uncertainty into global markets. This conflict could disrupt regional trade and supply chains, potentially affecting U.S.
| Annual Report | December 31, 2023 | 33 |
| Flat Rock Core Income Fund | Notes to Consolidated Financial Statements |
| | December 31, 2023 |
businesses with exposure to the region. Additionally, the Middle East plays a pivotal role in the global energy sector, and prolonged instability could impact oil prices, leading to increased costs for businesses and consumers. Furthermore, the U.S.’s diplomatic ties and commitments in the region mean that it might become more directly involved, either diplomatically or militarily, diverting attention and resources. These and any related events could significantly impact the Fund’s performance and the value of an investment in the Fund, even if the Fund does not have direct exposure. It is not known how long such impacts, or any future impacts of other significant events described above, will or would last, but there could be a prolonged period of global economic slowdown, which may impact your Fund investment.
Valuation Risk: Most of the Fund’s investments are not traded on national securities exchanges, and the Fund does not have the benefit of market quotations or other pricing data from such an exchange. Certain of the Fund’s investments will have the benefit of third-party bid-ask quotations. With respect to investments for which pricing data is not readily available or when such pricing data is deemed not to represent fair value, the Fund’s Board determines fair value using the valuation procedures approved by the Board. There is no single standard for determining fair value in good faith. As a result, determining fair value requires that judgment be applied to the specific facts and circumstances of each portfolio investment while employing a consistently applied valuation process for the types of investments the Fund makes.
Interest Rate Risk: Interest rate sensitivity refers to the change in earnings that may result from changes in the level of interest rates. The Fund intends to fund portions of its investments with borrowings, and at such time, its net investment income will be affected by the difference between the rate at which it invests and the rate at which it borrows. Accordingly, the Fund cannot assure that a significant change in market interest risks will not have a material adverse effect on its net investment income.
9. BORROWINGS
The Fund maintains a $75 million revolving line of credit through a special purpose wholly-owned subsidiary, FRC Funding I, LLC (“FRC Funding”), with certain financial institutions as lenders (“Lenders”). These Lenders include Cadence Bank, N.A. as the administrative agent, as well as Georgia Banking Company (“GBC”), Synovus Bank (“Synovus”), and Woodforest National Bank (“Woodforest”). The current Loan Agreement expires on June 2, 2026.
As of December 31, 2023, the Fund had drawn down $54,997,713 from the Credit Facility and the maximum borrowing outstanding during the twelve month period was $63,101,960. The balance drawn from the Credit Facility is inclusive of $243,750 of upfront fees in addition to the principal balance. The Fund is charged an interest rate of 2.70% above the 1-month Term SOFR (Secured Overnight Financing Rate) plus 0.11448%. The Fund is charged a fee on the average daily unused balance of the Credit Facility of 0.40%. Pursuant to the terms of the Loan Agreement, the Borrowers granted to Cadence for the benefit of the lenders, a security interest and a lien in substantially all of FRC Funding’s assets. The average balance outstanding and weighted average interest rate for the year ended December 31, 2023 was $48,891,576 and 8.08%, respectively.
| Flat Rock Core Income Fund | Notes to Consolidated Financial Statements |
| | December 31, 2023 |
10. MANDATORILY REDEEMABLE PREFERRED STOCK
At December 31, 2023, the Fund had issued and outstanding 1,000 shares of Series A Term Preferred Shares, and 1,000 shares of Series B Term Preferred Shares. Both the Series A and Series B Term Preferred Shares have a liquidation preference of $10,000 per share plus accrued and unpaid dividends (whether or not declared). The Fund issued 1,000 shares of Series A Term Preferred Shares on September 30, 2021. The Fund issued 1,000 shares of Series B Term Preferred Shares on January 28, 2022. The Series A Term Preferred Shares are entitled to a dividend at a rate of 4.00% per year based on the $10,000 liquidation preference before the common stock is entitled to receive any dividends. The Series B Term Preferred Shares are entitled to a dividend at a rate of 4.50% per year based on the $10,000 liquidation preference before the common stock is entitled to receive any dividends. The Series A Term Preferred Shares are redeemable at $10,000 per share plus accrued and unpaid dividends (whether or not declared) exclusively at the Fund’s option upon written notice. The Series B Term Preferred Shares are redeemable at $10,000 per share plus accrued and unpaid dividends (whether or not declared) exclusively at the Fund’s option. Debt issuance costs related to Series A Preferred Shares of $200,000 are deferred and amortized over the period the Series A Term Preferred Shares are outstanding. Debt issuance costs related to Series B Preferred Shares of
$200,000 are deferred and amortized over the period the Series B Term Preferred Shares are outstanding.
| Series | | Mandatory
Redemption Date | | Annual
Dividend
Rate | | | Shares
Outstanding | | | Aggregate
Liquidation
Preference | | | Unamortized
Deferred
Issuance
Costs | | | Carrying
Value | | | Fair Value as
of 12/31/23 | |
| Series A | | September 15, 2026 | | | 4.00 | % | | | 1,000 | | | $ | 10,000,000 | | | $ | 92,310 | | | $ | 9,907,690 | | | $ | 9,103,909 | |
| Series B | | March 15, 2025 | | | 4.50 | % | | | 1,000 | | | $ | 10,000,000 | | | $ | 111,518 | | | $ | 9,888,482 | | | $ | 9,647,404 | |
| | | | | | | | | | | | | $ | 20,000,000 | | | $ | 203,828 | | | $ | 19,796,172 | | | $ | 18,751,313 | |
This fair value is based on Level 3 inputs under the fair value hierarchy. The following table summarizes the valuation techniques and significant unobservable inputs that are used to estimate the fair value for the Series A Term Preferred Shares and Series B Term Preferred Shares. The Series A Term Preferred Shares and Series B Term Preferred Shares are presented on the Statement of Assets and Liabilities at the aggregate liquidation preference, net of deferred financing costs.
| Assets | | Fair Value as of 12/31/23 | | | Valuation
Techniques | | Unobservable
Inputs | | Range /
Weighted
Average(1) | | Impact to
Valuation
from an
Increase in
Input(2) |
| Series A Term Preferred Shares | | $ | 9,103,909 | | | Income Approach (Discounted Cash Flow Model) | | Discount Rates | | 7.23% - 8.50% / 7.99% | | Decrease |
| Series B Term Preferred Shares | | $ | 9,647,404 | | | Income Approach (Discounted Cash Flow Model) | | Discount Rates | | 7.23% - 8.50% / 7.99% | | Decrease |
| (1) | Weighted averages are calculated based on fair value of investments |
| (2) | The impact on fair value measurement of an increase in each unobservable input is in isolation. |
| Annual Report | December 31, 2023 | 35 |
| Flat Rock Core Income Fund | Notes to Consolidated Financial Statements |
| | December 31, 2023 |
11. DISTRIBUTION REINVESTMENT PLAN
The Board approved the establishment of a distribution reinvestment plan (the “DRIP”). The DRIP was effective as of, and was first applied to the reinvestment of cash distributions paid on or after, December 7, 2020.
Under the DRIP, cash distributions paid to participating stockholders are reinvested in shares at a price equal to the net asset value per share of the Shares as of such date.
12. COMMITMENTS AND CONTINGENCIES
The Fund had an aggregate of $9,370,035 of unfunded commitments to provide debt financing to its portfolio companies as of December 31, 2023. As of December 31, 2023, there were no requests to fund these commitments. Such commitments are generally up to the Fund’s discretion to approve or are subject to the satisfaction of certain financial and nonfinancial covenants and involve, to varying degrees, elements of credit risk in excess of the amount recognized in the Fund’s consolidated statement of assets and liabilities and are reflected in the Fund’s consolidated statement of assets and liabilities.
13. PRIVATE INVESTMENT FUNDS
The following table represents investment strategies, unfunded commitments and redemptive restrictions of investments that are measured at NAV per share (or its equivalent) as a practical expedient as of December 31, 2023:
| | | Redemption
Frequency/
Expiration Date | | As of December 31, 2023 | |
| BCP Great Lakes Fund LP II – Series A Holdings LP(1) | | N/A | | $ | 1,645,156 | |
| TriplePoint Private Venture Credit Inc.(2) | | N/A | | | 0 | |
| Hercules Private Global Venture Growth Fund I LP(3) | | N/A | | | 6,999,944 | |
| Total unfunded commitments | | | | $ | 8,645,100 | |
| (1) | The investment’s strategy is to invest in senior, secured unitranche loans. |
| (2) | The investment’s strategy is to invest in venture capital-backed companies, with a focus on technology and other high-growth industries, via senior secured loans that also provide potential for upside in the form of equity warrants. |
| (3) | The investment’s strategy is to provide secured structured debt and equity financing to venture capital backed life sciences and technology-related companies globally. |
14. FUND REORGANIZATION
On November 20, 2020 (the “Reorganization Date”), pursuant to the approval of an Agreement and Plan of Reorganization (the “Plan”) by and between the Fund and Flat Rock Capital Corp. (the “Acquired Fund”), the Acquired Fund transferred all of its assets to the Fund, in exchange for shares of the Fund and the assumption by the Fund of all of the liabilities of the Acquired Fund.
| Flat Rock Core Income Fund | Notes to Consolidated Financial Statements |
| | December 31, 2023 |
As of the Reorganization Date, and pursuant to the terms of the Plan, shareholders of the Acquired Fund became shareholders of the Fund and received their respective shares. The reorganization qualified as a tax-free “reorganization” under the Code for U.S. federal income tax purposes.
On the Reorganization Date, the Fund and the Acquired Fund reported the following financial information:
Shares Outstanding of
the Fund | | | Net Assets of
the Fund | | | Acquired Fund
Shares Exchanged | | | Net Assets of Acquired
Fund Exchanged | |
| | 250 | | | $ | 5,000 | | | | 2,892,101 | | | $ | 58,947,907 | |
The investment portfolio value and unrealized appreciation/(depreciation) as of the Reorganization Date of the Acquired Fund was as follows:
| Portfolio Value | | Unrealized Appreciation/(Depreciation) of Acquired Fund | |
| $ 86,074,311 | | | $ (708,344) | |
Immediately following the reorganization, the net assets of the Fund equaled $58,952,907 and 2,892,351 shares of the Fund were issued.
15. RECENT ACCOUNTING PRONOUNCEMENTS
In March 2020, the FASB issued Accounting Standards Update (“ASU”) No. 2020-04, Reference Rate Reform (Topic 848): Facilitation of the Effects of Reference Rate Reform on Financial Reporting. The amendments provide optional expedients and exceptions for applying U.S. GAAP to contracts, hedging relationships, and other transactions affected by reference rate reform if certain criteria are met. The standard is effective upon issuance and can be applied through December 31, 2023. Management is currently evaluating the impact of the optional guidance on the Fund’s financial statements and disclosures.
16. SUBSEQUENT EVENTS
The Fund has evaluated events and transactions through the date the financial statements were issued and has identified the following events for disclosure in the financial statements:
On January 24, 2024, the Fund completed a quarterly repurchase offer. In this offer, the Fund offered to repurchase up to 5% of the number of its outstanding shares as of the Repurchase Pricing Date. The result of the repurchase offers was as follow:
| | | Repurchase Offer | |
| Commencement Date | | December 20, 2023 | |
| Repurchase Request Deadline | | January 24, 2024 | |
| Repurchase Pricing Date | | January 24, 2024 | |
| Amount Repurchased | | $4,567,778 | |
| Shares Repurchased | | 221,885 | |
Subsequent to December 31, 2023, the Fund paid the following distributions:
| Ex-Date | | Record Date | | Payable Date | | Rate (per share) | |
| January 9, 2024 | | January 6, 2024 | | January 10, 2024 | | $ | 0.17 | |
| February 9, 2024 | | February 8, 2024 | | February 13, 2024 | | $ | 0.17 | |
| Annual Report | December 31, 2023 | 37 |
| | Report of Independent Registered |
| Flat Rock Core Income Fund | Public Accounting Firm |
To the Shareholders and Board of Trustees of
Flat Rock Core Income Fund
Opinion on the Financial Statements
We have audited the accompanying consolidated statement of assets and liabilities, including the consolidated schedule of investments, of Flat Rock Core Income Fund (the “Fund”) as of December 31, 2023, the related consolidated statements of operations and cash flows for the year then ended, the consolidated statements of changes in net assets for each of the two years in the period then ended, the related notes, and the consolidated financial highlights for each of the five years in the period then ended (collectively referred to as the “financial statements”). In our opinion, the consolidated financial statements present fairly, in all material respects, the financial position of the Fund as of December 31, 2023, the results of its operations and its cash flows for the year then ended, the changes in net assets for each of the two years in the period then ended, and the financial highlights for each of the five years in the period then ended, in conformity with accounting principles generally accepted in the United States of America.
Basis for Opinion
These financial statements are the responsibility of the Fund’s management. Our responsibility is to express an opinion on the Fund’s financial statements based on our audits. We are a public accounting firm registered with the Public Company Accounting Oversight Board (United States) (“PCAOB”) and are required to be independent with respect to the Fund in accordance with the U.S. federal securities laws and the applicable rules and regulations of the Securities and Exchange Commission and the PCAOB.
We conducted our audits in accordance with the standards of the PCAOB. Those standards require that we plan and perform the audit to obtain reasonable assurance about whether the financial statements are free of material misstatement whether due to error or fraud.
Our audits included performing procedures to assess the risks of material misstatement of the financial statements, whether due to error or fraud, and performing procedures that respond to those risks. Such procedures included examining, on a test basis, evidence regarding the amounts and disclosures in the financial statements. Our procedures included confirmation of securities owned as of December 31, 2023, by correspondence with the custodian, brokers, agent banks, and underlying fund managers; when replies were not received from brokers, we performed other auditing procedures. Our audits also included evaluating the accounting principles used and significant estimates made by management, as well as evaluating the overall presentation of the financial statements. We believe that our audits provide a reasonable basis for our opinion.
We have served as the auditor of one or more investment companies advised by Flat Rock Global, LLC since 2018.
 | |
| | |
| COHEN & COMPANY, LTD. | |
| Philadelphia, Pennsylvania | |
| February 29, 2024 | |
Flat Rock Core Income Fund | Additional Information |
| | December 31, 2023 (Unaudited) |
A description of the Fund’s proxy voting policies and procedures is available without charge, upon request by calling 1-307-500-5200, or on the SEC’s website at http://www.sec.gov. Information regarding how the Fund voted proxies relating to portfolio securities during the twelve-month period ended June 30th is available on the SEC’s website at http://www.sec.gov.
The Fund files a monthly portfolio investments report with the U.S. Securities and Exchange Commission (“SEC”) on Form N-PORT within 60 days after the end of the Fund’s first and third quarters. Copies of the Fund’s Form N-PORT are available without charge, upon request, by contacting the Fund at 1-307-500-5200, or on the SEC’s website at http://www.sec.gov.
| FACTS | WHAT DOES FLAT ROCK CORE INCOME FUND
DO WITH YOUR PERSONAL INFORMATION? |
| Why? | Financial companies choose how they share your personal information. Federal law gives consumers the right to limit some but not all sharing. Federal law also requires us to tell you how we collect, share, and protect your personal information. Please read this notice carefully to understand what we do. |
| What? | The types of personal information we collect and share depend on the product or service you have with us. This information can include: |
| | |
| | Social Security number | Purchase History |
| | Assets | Account Balances |
| | Retirement Assets | Account Transactions |
| | Transaction History | Wire Transfer Instructions |
| | Checking Account Information | |
| | | |
| | When you are no longer our customer, we continue to share your information as described in this notice. |
| How? | All financial companies need to share customers’ personal information to run their everyday business. In the section below, we list the reasons financial companies can share their customers’ personal information; the reasons Flat Rock Core Income Fund chooses to share; and whether you can limit this sharing. |
| Annual Report | December 31, 2023 | 39 |
Flat Rock Core Income Fund | Additional Information |
| | December 31, 2023 (Unaudited) |
| | | | Does Flat Rock | | | |
| REASONS WE CAN SHARE YOUR | | Core Income | | Can you limit | |
| PERSONAL INFORMATION | | Fund share? | | this sharing? | |
| For our everyday business purposes — such as to process your transactions, maintain your account(s), respond to court orders and legal investigations, or report to credit bureaus | | Yes | | No | |
| For our marketing purposes — to offer our products and services to you | | No | | We don’t share |
| For joint marketing with other financial companies | | No | | We don’t share |
| For our affiliates’ everyday business purposes — information about your transactions and experiences | | No | | We don’t share |
| For our affiliates’ everyday business purposes — information about your creditworthiness | | No | | We don’t share |
| For nonaffiliates to market to you | | No | | We don’t share |
| QUESTIONS? | Call (307) 500-5200 | | | | | |
Flat Rock Core Income Fund | Additional Information |
| | December 31, 2023 (Unaudited) |
| WHO WE ARE | | |
| Who is providing this notice? | Flat Rock Core Income Fund | | |
| WHAT WE DO | | |
| How does Flat Rock Core Income Fund protect my personal information? | To protect your personal information from unauthorized access and use, we use security measures that comply with federal law. These measures include computer safeguards and secured files and buildings. |
| | Our service providers are held accountable for adhering to strict policies and procedures to prevent any misuse of your nonpublic personal information. |
| How does Flat Rock Core Income Fund collect my | We collect your personal information, for example, when you |
| personal information? | ● | Open an account |
| | ● | Provide account information |
| | ● | Give us your contact information |
| | ● | Make deposits or withdrawals from your account |
| | ● | Make a wire transfer |
| | ● | Tell us where to send the money |
| | ● | Tells us who receives the money |
| | ● | Show your government-issued ID |
| | ● | Show your driver’s license |
| | We also collect your personal information from other companies. |
| Why can’t I limit all sharing? | Federal law gives you the right to limit only |
| | |
| | ● | Sharing for affiliates’ everyday business purposes – information about your creditworthiness |
| | ● | Affiliates from using your information to market to you |
| | ● | Sharing for nonaffiliates to market to you |
| | | |
| | State laws and individual companies may give you additional rights to limit sharing. |
| Annual Report | December 31, 2023 | 41 |
Flat Rock Core Income Fund | Additional Information |
| | December 31, 2023 (Unaudited) |
| DEFINITIONS | | |
| Affiliates | Companies related by common ownership or control. They can be financial and nonfinancial companies. |
| | |
| | ● | Flat Rock Core Income Fund does not share with our affiliates for marketing purposes. |
| Nonaffiliates | Companies not related by common ownership or control. They can be financial and nonfinancial companies. |
| | |
| | ● | Flat Rock Core Income Fund does not share with nonaffiliates so they can market to you. |
| Joint marketing | A formal agreement between nonaffiliated financial companies that together market financial products or services to you. |
| | |
| | ● | Flat Rock Core Income Fund doesn’t jointly market. |
Flat Rock Core Income Fund | Trustees & Officers |
| | December 31, 2023 (Unaudited) |
The business and affairs of the Fund are managed under the direction of the Board. The Board approves all significant agreements between the Fund and the persons or companies that furnish services to the Fund, including agreements with its distributor, investment adviser, administrator, custodian and transfer agent.
The name, age and principal occupations for the past five years of the Trustees and officers of the Fund are listed below, along with the number of portfolios in the fund complex overseen by and the other directorships held by each Trustee. The business address for each Trustee and officer of the Fund is c/o Flat Rock Core Income Fund, 680 S. Cache Street, Suite 100, P.O. Box 7403, Jackson, WY 83001, unless otherwise noted. The Fund’s statement of additional information includes additional information about the Fund’s Trustees and officers and is available without charge, upon request, by calling (212) 596-3413 or by visiting www.flatrockglobal.com.
Name and
Year of Birth | | Position Held
with the Trust | | Term of
Office and
Time
Served(1) | | Principal Occupation(s)
During Past 5 Years | | Number of
Portfolios in
Fund Complex
Overseen by
Trustee(2) | | Other
Directorships
Held by Trustee |
Robert K.
Grunewald
(1962)* | | Interested Trustee, President and Chief Executive Officer | | Since
October 2020 | | Chief Executive Officer, Founder, Flat Rock Global LLC (2016 to Present); President and Chief Executive Officer of Flat Rock Opportunity Fund (2018 to present); President and Chief Executive Officer of Flat Rock Enhanced Income Fund (2022 to present); President and Chief Executive Officer of Flat Rock Capital Corp. (2017 to 2020); President and Chief Investment Officer, Business Development Corporation of America (a BDC) (2011 to 2015). | | 3 | | Flat Rock Opportunity Fund; Flat Rock Enhanced Income Fund; Flat Rock Capital Corp. |
| | | | | | | | | | | |
Marshall H.
Durston
(1959) | | Independent Trustee | | Since
October 2020 | | Managing Director of Spaulding & Slye Investments, a wholly owned subsidiary of Jones Lang LaSalle (2010-2023) | | 3 | | Flat Rock Opportunity Fund; Flat Rock Enhanced Income Fund; Flat Rock Capital Corp. |
| | | | | | | | | | | |
R. Scott
Coolidge
(1955) | | Independent Trustee | | Since
October 2020 | | Partner at Human Capital Advisors (since 2015); Senior Vice President and Vice President, Freddie Mac (2003-2015). | | 3 | | Flat Rock Opportunity Fund; Flat Rock Enhanced Income Fund; Flat Rock Capital Corp. |
| * | Mr. Grunewald is an interested person of the Fund (as defined in the 1940 Act) (an “Interested Trustee”) because of his position with Flat Rock Global. |
| (1) | Each Trustee serves during the continued lifetime of the Fund and will not be subject to a term limit. |
| (2) | The term “Fund Complex” includes the Fund, Flat Rock Opportunity Fund, and Flat Rock Enhanced Income Fund. |
| Annual Report | December 31, 2023 | 43 |
Flat Rock Core Income Fund | Trustees & Officers |
| | December 31, 2023 (Unaudited) |
Name and
Year of Birth | | Position Held
with the Trust | | Term of
Office and
Time
Served(1) | | Principal Occupation(s)
During Past 5 Years | | Number of
Portfolios in
Fund Complex
Overseen by
Trustee(2) | | Other
Directorships
Held by Trustee |
| Paul E. Finnen | | Independent | | Since | | Owner, Paul E. Finnen & | | 2 | | Flat Rock |
| (1958) | | Trustee | | October | | Associates, a Real Estate | | | | Enhanced |
| | | | | 2020 | | Appraisal company (Since 1985). | | | | Income Fund |
| (1) | Each Trustee serves during the continued lifetime of the Fund and will not be subject to a term limit. |
| (2) | The term “Fund Complex” includes the Fund, Flat Rock Opportunity Fund, and Flat Rock Enhanced Income Fund. |
| OFFICERS | |
| Name and | Position Held | Term of Office
and Length of | Principal Occupation(s) |
| Year of Birth | with the Trust | Time Served(1) | During Past 5 Years |
Ryan Ripp
(1987) | Chief Financial Officer,
Treasurer and Secretary | Since January 2021 | Chief Financial Officer of Flat Rock Global, LLC and Flat Rock Opportunity Fund (2021 to Present); Chief Financial Officer of Flat Rock Enhanced Income Fund (2022 to Present); Chief Compliance Officer of Flat Rock Global, LLC, Flat Rock Opportunity Fund and Flat Rock Core Income Fund (2021-2022); Consultant, Boston Consulting Group (2020 to 2021); Associate, McKinsey & Company (2017 to 2020); Senior Associate, Equity Research, Citi (2014 to 2016). |
Andy Chica
(1975)(2) | Chief Compliance Officer | Since May 2022 | Chief Compliance Officer of Flat Rock Opportunity Fund, Flat Rock Enhanced Income Fund and Flat Rock Global, LLC (since 2022); Principal, NexTier Solutions (since 2022); Chief Compliance Officer and Compliance Director, Cipperman Compliance Services, LLC (2019 to 2022); Chief Compliance Officer, Hatteras Funds (2007 to 2019). |
| (1) | Officers are typically elected every year, unless an officer earlier retires, resigns or is removed from office. |
| (2) | The address for Andy Chica is P.O. Box 847 Morrisville, NC 27560. |

Must be accompanied or preceded by a Prospectus.
ALPS Distributors, Inc. is the Distributor for the Flat Rock Core Income Fund.
Item 2. Code of Ethics.
The Registrant, as of the end of the period covered by this report on Form N-CSR, has adopted a code of ethics that applies to the Registrant’s principal executive officer, principal financial officer, principal accounting officer or controller or any persons performing similar functions on behalf of the Registrant. During the period covered by this report, (i) the code was amended and restated to clarify the responsibilities of certain officers under the code and (ii) no implicit or explicit waivers to the provisions of the code of ethics were granted. The Registrant’s code of ethics, as adopted on May 23, 2023, is attached as an exhibit to this report.
Item 3. Audit Committee Financial Expert.
The Board of Trustees of the Registrant has determined that the Registrant has at least one audit committee financial expert serving on its audit committee. The Board of Trustees has designated Mr. Marshall H. Durston as the Fund’s “audit committee financial expert,” as defined in the instructions to Item 3(a) of Form N-CSR, based on the Board’s review of his qualifications. Mr. Durston is “independent” as defined in paragraph (a)(2) of Item 3 to Form N-CSR.
Item 4. Principal Accountant Fees and Services.
| (a) | Audit Fees: For the Registrant’s fiscal years ended December 31, 2022 and December 31, 2023, the aggregate fees billed for professional services rendered by the principal accountant for the audit of the Registrant’s annual financial statements were $100,000 and $123,750, respectively. |
| (b) | Audit-Related Fees: For the Registrant’s fiscal years ended December 31, 2022 and December 31, 2023, the aggregate fees billed for assurance and related services by the principal accountant that are reasonably related to the performance of the audit of the Registrant’s annual financial statements and are not reported under paragraph (a) of this Item were $0 and $0, respectively. |
| (c) | Tax Fees: For the Registrant’s fiscal years ended December 31, 2022 and December 31, 2023, the aggregate fees billed for professional services rendered by the principal accountant for tax compliance, tax advice, and tax planning were $11,500 and $13,500. The tax fees for fiscal years 2022 and 2023 are related to dividend calculation, excise tax preparation and tax return preparation. |
| (d) | All Other Fees: For the Registrant’s fiscal years ended December 31, 2022 and December 31, 2023, the aggregate fees billed by the principal accountant for services other than the services reported in paragraphs (a) through (c) of this item were $0 and $0, respectively. |
| (e)(1) | Audit Committee Pre-Approval Policies and Procedures: All services to be performed by the Registrant’s principal accountant must be pre-approved by the Registrant’s audit committee. |
| (e)(2) | No services described in paragraphs (b) through (d) were approved pursuant to paragraph (c)(7)(i)(C) of Rule 2-01 of Regulation S-X. |
| (g) | The aggregate non-audit fees billed by the Registrant’s principal accountant for services rendered to the Fund and the Fund’s investment adviser for the fiscal year ended December 31, 2022 and December 31, 2023 were $0 and $0, respectively. |
Item 5. Audit Committee of Listed Registrants.
Item 6. Investments.
| (a) | The Schedule of Investments is included as part of the Report to Shareholders filed under Item 1 of this report. |
Item 7. Financial Statements and Financial Highlights for Open-End Management Investment Companies.
Not Applicable.
Item 8. Changes in and Disagreements with Accountants for Open-End Management Investment Companies.
Not Applicable.
Item 9. Proxy Disclosures for Open-End Management Investment Companies.
Not Applicable.
Item 10. Remuneration Paid to Directors, Officers, and Others of Open-End Management Investment Companies.
Not Applicable.
Item 11. Statement Regarding Basis for Approval of Investment Advisory Contract.
Not Applicable.
Item 12. Disclosure of Proxy Voting Policies and Procedures for Closed-End Management Investment Companies.
Flat Rock Core Income Fund
Proxy Voting Policies and Procedures
Flat Rock Core Income Fund, a Delaware statutory trust (the “Fund”), has delegated its proxy voting responsibility to its investment adviser, Flat Rock Global, LLC (the “Adviser”). The Proxy Voting Policies and Procedures of the Adviser are set forth below. The guidelines are reviewed periodically by the Adviser and the Fund’s non-interested trustees and, accordingly, are subject to change.
Introduction
As an investment adviser registered under the Investment Advisers Act of 1940, as amended (the “Advisers Act”), the Adviser has a fiduciary duty to act solely in the best interests of its clients. As part of this duty, the Adviser recognizes that it must vote client securities in a timely manner free of conflicts of interest and in the best interests of its clients.
These policies and procedures for voting proxies for the investment advisory clients of the Adviser are intended to comply with Section 206 of, and Rule 206(4)-6 under, the Advisers Act.
Proxy Policies
The Adviser will vote proxies relating to the Fund’s portfolio securities in the best interest of its clients’ shareholders. The Adviser will review on a case-by-case basis each proposal submitted for a shareholder vote to determine its impact on the portfolio securities held by each of its clients. Although the Adviser will generally vote against proposals that may have a negative impact on its clients’ portfolio securities, it may vote for such a proposal if there exists compelling long-term reasons to do so.
The proxy voting decisions of the Adviser are made by the senior officers who are responsible for monitoring each of its clients’ investments. To ensure that its vote is not the product of a conflict of interest, the Adviser requires that: (i) anyone involved in the decision-making process disclose to the Adviser’s Chief Compliance Officer any potential conflict that he or she is aware of and any contact that he or she has had with any interested party regarding a proxy vote; and (ii) employees involved in the decision-making process or vote administration are prohibited from revealing how the Adviser intends to vote on a proposal in order to reduce any attempted influence from interested parties.
Proxy Voting Records
You may obtain information, without charge, regarding how the Adviser voted proxies with respect to the Fund’s portfolio securities by making a written request for proxy voting information to: Chief Compliance Officer, Flat Rock Opportunity Fund, 680 S Cache Street, Suite 100, P.O. Box 7403, Jackson, WY 83001.
Item 13. Portfolio Managers of Closed-End Management Investment Companies.
(a)(1) Registrant’s Portfolio Managers as of December 31, 2023 are:
| Name | Title | Length of Service | Business Experience 5 Years |
Robert K. Grunewald | Portfolio Manager | Since November 2020 | President and Chief Executive Officer of Flat Rock Enhanced Income Fund (since 2022); President and Chief Executive Officer of Flat Rock Core Income Fund (since 2020); President and Chief Executive Officer of Flat Rock Opportunity Fund (since 2018); President and Chief Executive Officer of Flat Rock Capital Corp. (2017 to 2020); Chief Executive Officer of Flat Rock Global (since 2016); President and Chief Investment Officer of Business Development Corp. of America (BDCA) (2011 to 2015). |
Shiloh Bates | Portfolio Manager | Since January 2021 | Chief Investment Officer of Flat Rock Enhanced Income Fund (since 2022); Managing Director of Flat Rock Global (since 2018); Chief Investment Officer of Flat Rock Opportunity Fund (since 2018); Managing Director, Benefit Street Partners (2016 to 2018); Managing Director, BDCA Adviser (2012 to 2016). |
(a)(2) Other accounts managed by the Registrant’s Portfolio Managers as of December 31, 2023:
| | | Other Accounts Managed | Other Accounts for which Advisory Fee is Based on Performance |
| Name | Account Type | Number of Accounts | Total Assets | Number of Accounts | Total Assets |
| Robert K. Grunewald | Registered Investment Companies | 2 | $528.7M | 0 | $0 |
| | Other Pooled Investment Vehicles | 0 | $0 | 0 | $0 |
| | Other Accounts | 0 | $0 | 0 | $0 |
| Shiloh Bates | Registered Investment Companies | 2 | $528.7M | 0 | $0 |
| | Other Pooled Investment Vehicles | 0 | $0 | 0 | $0 |
| | Other Accounts | 0 | $0 | 0 | $0 |
We have entered into an Investment Advisory Agreement with Flat Rock Global. Certain of the executive officers, directors/trustees and finance professionals of Flat Rock Global who perform services for us on behalf of Flat Rock Global may also serve as officers, directors/trustees, managers, and/or key professionals of affiliates of Flat Rock Global, including Flat Rock Opportunity Fund and Flat Rock Enhanced Income Fund. Further, Flat Rock Global and certain of its affiliates are currently, and plan in the future to continue to be, involved with activities which are unrelated to us. As a result of these activities, Flat Rock Global, its personnel and certain of its affiliates will have conflicts of interest in allocating management time, investment opportunities, services and functions among us and any other business ventures in which they or any of their key personnel, as applicable, are or may become involved. This could result in actions that are more favorable to other affiliated entities than to us.
However, Flat Rock Global has policies and procedures in place designed to manage the conflicts of interest between Flat Rock Global’s fiduciary obligations to us and its similar obligations to other clients. Such policies and procedures are designed to ensure that investment opportunities are allocated on an alternating basis that is fair and equitable among us and Flat Rock Global’s other clients.
(a)(3) Portfolio Manager compensation as of December 31, 2023:
Mr. Shiloh Bates is a Portfolio Manager of the Fund. Mr. Bates holds an equity ownership interest in the Adviser and his compensation is determined by the Adviser’s Compensation Committee. His compensation includes a fixed salary in an amount subject to periodic review; an annual variable discretionary bonus based on the profitability of the Adviser and the performance of the Fund, including consideration of portfolio performance relative to any benchmark, fee waiver, total assets under management and revenues.
Mr. Grunewald is a Portfolio Manager of the Fund. Mr. Grunewald holds an equity ownership interest in the Adviser and his compensation is determined by the Adviser’s Compensation Committee. His compensation includes a fixed salary in an amount subject to periodic review; an annual variable discretionary bonus based on the profitability of the Adviser and the performance of the Fund, including consideration of portfolio performance relative to any benchmark, fee waiver, total assets under management and revenues.
(a)(4) Dollar range of securities owned by the Registrant’s Portfolio Managers as of December 31, 2023:
| Name of Portfolio Manager | Dollar Range of Equity Securities in the Fund(1)(2)(3) |
| Robert K. Grunewald | Over $1,000,000 |
| Shiloh Bates | None |
(1) Dollar ranges are as follows: None, $1 - $10,000, $10,001 - $50,000, $50,001 - $100,000, $100,001 - $500,000, $500,001 - $1,000,000 or over $1,000,000
(2) Beneficial ownership has been determined in accordance with Rule 15a-1(a)(2) under the Exchange Act (17 CFR 240.16a-1(a)(2)).
(3) The dollar range of equity beneficially owned is based on the closing price of $20.52 per share on December 31, 2023.
Item 14. Purchases of Equity Securities by Closed-End Management Investment Company and Affiliated Purchasers.
None.
Item15. Submission of Matters to a Vote of Security Holders.
There have been no material changes to the procedures by which shareholders may recommend nominees to the Registrant’s Board of Trustees.
Item 16. Controls and Procedures.
| (a) | The Registrant’s principal executive and principal financial officers, or persons performing similar functions, have concluded that the Registrant’s disclosure controls and procedures (as defined in Rule 30a-3(c) under the Investment Company Act of 1940, as amended (the “1940 Act”) (17 CFR 270.30a-3(c))) are effective, as of a date within 90 days of the filing date of this report that includes the disclosure required by this paragraph, based on their evaluation of these controls and procedures required by Rule 30a-3(b) under the 1940 Act (17 CFR 270.30a-3(b)) and Rules 13a-15(b) or 15d-15(b) under the Securities Exchange Act of 1934, as amended (17 CFR 240.13a-15(b) or 240.15d-15(b)). |
| (b) | No changes in the Registrant’s internal control over financial reporting (as defined in Rule 30a-3(d) under the 1940 Act (17 CFR 270.30a-3(d)) occurred during the period covered by this report that have materially affected, or are reasonably likely to materially affect, the Registrant’s internal control over financial reporting. |
Item 17. Disclosure of Securities Lending Activities for Closed-End Management Investment Companies.
Item 18. Recovery of Erroneously Awarded Compensation.
Item 19. Exhibits.
SIGNATURES
Pursuant to the requirements of the Securities Exchange Act of 1934 and the Investment Company Act of 1940, the Registrant has duly caused this report to be signed on its behalf by the undersigned, thereunto duly authorized.
FLAT ROCK CORE INCOME FUND
| By: | /s/ Robert K. Grunewald | |
| | Robert K. Grunewald | |
| | President and Chief Executive Officer
(Principal Executive Officer) | |
| | | |
| Date: | March 7, 2024 | |
Pursuant to the requirements of the Securities Exchange Act of 1934 and the Investment Company Act of 1940, this report has been signed below by the following persons on behalf of the Registrant and in the capacities and on the dates indicated.
| By: | /s/ Robert K. Grunewald | |
| | Robert K. Grunewald | |
| | President and Chief Executive Officer
(Principal Executive Officer) | |
| | | |
| Date: | March 7, 2024 | |
| By: | /s/ Ryan Ripp | |
| | Ryan Ripp | |
| | Chief Financial Officer
(Principal Financial and Accounting Officer) | |
| | | |
| Date: | March 7, 2024 | |
iso4217:USD xbrli:shares