UNITED STATES
SECURITIES AND EXCHANGE COMMISSION
Washington, D.C. 20549
FORM N-CSR
CERTIFIED SHAREHOLDER REPORT OF REGISTERED MANAGEMENT INVESTMENT COMPANIES
Investment Company Act File Number 811- 23582
Modern Capital Funds Trust
1701 Meeting Street
Charleson, SC 29464
(Address of Principal Executive Offices)
Paracorp Inc.
2140 South Dupont Hwy.
Camden DE 19934
(Name and address of agent for service)
Registrant's telephone number, including area code: (800) 711-9164
Date of fiscal year end: 3/31/2025
Date of reporting period: 9/30/2024
Item 1. Reports to Stockholders.
Modern Capital Funds Trust Modern Capital Tactical Income Fund Class ADV Shares - MCTDX |  |
September 30, 2024
This semi-annual shareholder report contains important information about the Modern Capital Tactical Income Fund, Class ADV Shares, for the period ended September 30, 2024, as well as certain changes to the Fund. You can find additional information at www.moderncap.com or 800-711-9164.
(as of September 30, 2024)
| Net Assets | $74,783,575 |
| Number of Holdings | 64 |
| Annual Portfolio Turnover | 676% |
| Total Advisory Fee | $190,066 |
(Based on a hypothetical $10,000 investment)
(as of September 30, 2024)
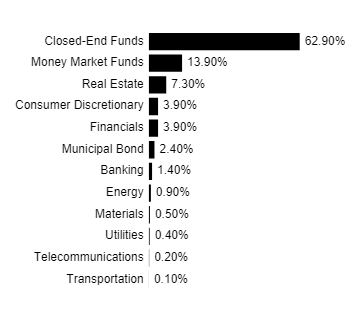
The tables below show the investment makeup of the Fund represented as a percentage of Fund net assets. Derivatives are excluded from the tables unless otherwise noted. The Fund's portfolio composition is subject to change.
| First American Government Obligations Fund, Class X | 13.91% |
| PGIM Short Duration High Yield Opportunities Fund | 4.68% |
| Virtus Global Multi-Sector Income Fund | 3.99% |
| Aberdeen Global Dynamic Dividend Fund | 3.87% |
| FS Credit Opportunities Corp. | 3.25% |
| Aberdeen Total Dynamic Dividend Fund | 3.20% |
| Morgan Stanley Emerging Markets Domestic Debt Fund Inc | 3.15% |
| Highland Income Fund | 3.10% |
| Eaton Vance Tax-Managed Global Buy-Write Opportunities Fund | 3.00% |
| BrandywineGLOBAL - Global Income Opportunities Fund, Inc. | 2.97% |
| Closed-End Funds | 62.90% |
| Money Market Funds | 13.90% |
| Real Estate | 7.30% |
| Consumer Discretionary | 3.90% |
| Financials | 3.90% |
| Municipal Bond | 2.40% |
| Banking | 1.40% |
| Energy | 0.90% |
| Materials | 0.50% |
| Utilities | 0.40% |
| Telecommunications | 0.20% |
| Transportation | 0.10% |
There were no material fund changes during the six months ended September 30, 2024.
Additional information is available on the Fund's website, www.moderncap.com, including its:
prospectus
financial information
holdings
proxy voting information
Mailings of your shareholder documents may be householded indefinitely unless you instruct us otherwise. If you do not want the mailing of these documents to be combined with those for other members of your household, please call the Fund at 800-711-9164.
Modern Capital Funds Trust Modern Capital Tactical Income Fund Class A Shares - MCTOX |  |
September 30, 2024
This semi-annual shareholder report contains important information about the Modern Capital Tactical Income Fund, Class A Shares, for the period ended September 30, 2024, as well as certain changes to the Fund. You can find additional information at www.moderncap.com or 800-711-9164.
(as of September 30, 2024)
| Net Assets | $74,783,575 |
| Number of Holdings | 64 |
| Annual Portfolio Turnover | 676% |
| Total Advisory Fee | $190,066 |
(Based on a hypothetical $10,000 investment)
(as of September 30, 2024)
The tables below show the investment makeup of the Fund represented as a percentage of Fund net assets. Derivatives are excluded from the tables unless otherwise noted. The Fund's portfolio composition is subject to change.
| First American Government Obligations Fund, Class X | 13.91% |
| PGIM Short Duration High Yield Opportunities Fund | 4.68% |
| Virtus Global Multi-Sector Income Fund | 3.99% |
| Aberdeen Global Dynamic Dividend Fund | 3.87% |
| FS Credit Opportunities Corp. | 3.25% |
| Aberdeen Total Dynamic Dividend Fund | 3.20% |
| Morgan Stanley Emerging Markets Domestic Debt Fund Inc | 3.15% |
| Highland Income Fund | 3.10% |
| Eaton Vance Tax-Managed Global Buy-Write Opportunities Fund | 3.00% |
| BrandywineGLOBAL - Global Income Opportunities Fund, Inc. | 2.97% |
| Closed-End Funds | 62.90% |
| Money Market Funds | 13.90% |
| Real Estate | 7.30% |
| Consumer Discretionary | 3.90% |
| Financials | 3.90% |
| Municipal Bond | 2.40% |
| Banking | 1.40% |
| Energy | 0.90% |
| Materials | 0.50% |
| Utilities | 0.40% |
| Telecommunications | 0.20% |
| Transportation | 0.10% |

There were no material fund changes during the six months ended September 30, 2024.
Additional information is available on the Fund's website, www.moderncap.com, including its:
prospectus
financial information
holdings
proxy voting information
Mailings of your shareholder documents may be householded indefinitely unless you instruct us otherwise. If you do not want the mailing of these documents to be combined with those for other members of your household, please call the Fund at 800-711-9164.
Item 2. Code of Ethics.
Not applicable to semi-annual report.
Item 3. Audit Committee Financial Expert.
Not applicable to semi-annual report.
Item 4. Principal Accountant Fees and Services.
Not applicable to semi-annual report.
Item 5. Audit Committee of Listed Companies.
Not applicable to open-end investment companies.
Item 6. Investments.
Included as part of the report to shareholders filed under Item 7 of this Form.
Item 7. Financial Statements and Financial Highlights for Open-End Management Investment Companies.
Financial Statements 2024
As of September 30, 2024

Modern Capital Tactical Income Fund
Class A Shares: MCTOX
Class ADV Shares: MCTDX
This report and the financial statements contained herein are submitted for the general information of the shareholders of the Modern Capital Tactical Income Fund (the “Fund”). The Fund’s shares are not deposits or obligations of, or guaranteed by, any depository institution. The Fund’s shares are not insured by the FDIC, Federal Reserve Board or any other agency, and are subject to investment risks, including possible loss of principal amount invested. Neither the Fund nor the Fund’s distributor is a bank.
The Modern Capital Tactical Income Fund is distributed by Vigilant Distributors, LLC., Member FINRA/SIPC, 223 Wilmington West Chester Pike, Suite 216, Chadds Ford, PA, 19317. There is no affiliation between the Fund, including its principals, and Vigilant Distributors, LLC.
Statements in this Semi-Annual Report that reflect projections or expectations of future financial or economic performance of the Modern Capital Tactical Income Fund (“Fund”) and of the market in general and statements of the Fund’s plans and objectives for future operations are forward-looking statements. No assurance can be given that actual results or events will not differ materially from those projected, estimated, assumed or anticipated in any such forward-looking statements. Important factors that could result in such differences, in addition to the other factors noted with such forward-looking statements, include, without limitation, general economic conditions such as inflation, recession and interest rates. Past performance is not a guarantee of future results. An investor should consider the investment objectives, risks, charges and expenses of the Fund carefully before investing. The prospectus contains this and other information about the Fund. A copy of the prospectus is available at moderncap.com or by calling Shareholder Services at 800-711-9164. The prospectus should be read carefully before investing. |
For More Information on the Modern Capital Tactical Income Fund:
See Our Website @ moderncap.com
or
Call Our Shareholder Services Group at 800-711-9164.
Modern Capital Tactical Income Fund - Class A Shares
Investment Highlights (Unaudited)
For the Period from April 5, 2021 (Commencement of Operations) through September 30, 2024
Average Annual Total Returns |
For the Fiscal Period Ended
September 30, 2024 | 6 Months | 1 Year | Since
Inception* |
Modern Capital Tactical Income Fund - Class A Shares | 6.85% | 24.54% | 14.52% |
Modern Capital Tactical Income Fund - Class A Shares - with 5.00% sales load | 1.55% | 18.41% | 13.23% |
S&P 500 High Dividend Index** | 14.48% | 36.34% | 10.44% |
HFRI 500 Macro: Multi-Strategy Index *** | (3.87)% | 5.02% | 5.48% |
The performance data quoted here represents past performance. The performance comparison includes reinvestment of all dividends and capital gains and has been adjusted for the Class A maximum sales charge of 5.00%, where applicable. The Class A maximum sales charge may be reduced or waived by the Fund’s adviser, Modern Capital Management Co. (the “Adviser”). Current performance may be lower or higher than the performance data quoted above. Past performance is no guarantee of future results. The investment return and principal value of an investment will fluctuate so that an investor’s shares, when redeemed, may be worth more or less than their original cost. The returns shown do not reflect the deduction of taxes that a shareholder would pay on Fund distributions or on the redemption of Fund shares. Performance figures for periods greater than one year are annualized. The Fund’s total annual operating expenses, before fee waivers and/or expense reimbursements, are 4.10% for each of the Class A and Class ADV shares per the July 29, 2024 prospectus. After fee waivers and/or expense reimbursements, the Fund’s total annual operating expenses are 3.02% for each of the Class A and Class ADV shares per the July 29, 2024 prospectus. The Fund’s performance would have been lower had the co-advisers not waived fees and/or reimbursed expenses. The Class A maximum sales may be reduced or waived by the Adviser. For performance information current to the most recent month-end, please call toll-free 800-711-9164.
* | Inception date of Class A Shares is April 5, 2021. |
** | The S&P 500 High Dividend Index is designed to track the performance of the 80 highest yield dividend equities in the S&P 500. Given that all issuers of securities in the S&P 500 High Dividend Index are part of the S&P 500, all securities contained within the index are large capitalization U.S. equities. |
*** | The HFRI 500 Macro Index is a global, equal-weighted index of the largest hedge funds that report to the HFR Database which are open to new investments and offer quarterly liquidity or better. The Macro funds that comprise the index are a subset of the HFRI 500 Fund Weighted Composite Index. The index is rebalanced on a quarterly basis. |
1
Modern Capital Tactical Income Fund - Class ADV Shares
Investment Highlights (Unaudited)
For the Period from June 23, 2021 (Commencement of Operations) through September 30, 2024
Average Annual Total Returns |
For the Fiscal Period Ended
September 30, 2024 | 6 Months | 1 Year | Since
Inception* |
Modern Capital Tactical Income Fund - Class ADV Shares | 6.78% | 24.39% | 12.00% |
S&P 500 High Dividend Index** | 14.48% | 36.34% | 9.60% |
HFRI 500 Macro: Multi-Strategy Index *** | (3.87)% | 5.02% | 5.98% |
The performance data quoted here represents past performance. The performance comparison includes reinvestment of all dividends and capital gains and has been adjusted for the Class A maximum sales charge of 5.00%, where applicable. The Class A maximum sales charge may be reduced or waived by the Fund’s adviser, Modern Capital Management Co. (the “Adviser”). Current performance may be lower or higher than the performance data quoted above. Past performance is no guarantee of future results. The investment return and principal value of an investment will fluctuate so that an investor’s shares, when redeemed, may be worth more or less than their original cost. The returns shown do not reflect the deduction of taxes that a shareholder would pay on Fund distributions or on the redemption of Fund shares. Performance figures for periods greater than one year are annualized. The Fund’s total annual operating expenses, before fee waivers and/or expense reimbursements, are 4.10% for each of the Class A and Class ADV shares per the July 29, 2024 prospectus. After fee waivers and/or expense reimbursements, the Fund’s total annual operating expenses are 3.02% for each of the Class A and Class ADV shares per the July 29, 2024 prospectus. The Fund’s performance would have been lower had the co-advisers not waived fees and/or reimbursed expenses. The Class A maximum sales may be reduced or waived by the Adviser. For performance information current to the most recent month-end, please call toll-free 800-711-9164.
* | Inception date of Class ADV Shares is June 23, 2021. |
** | The S&P 500 High Dividend Index is designed to track the performance of the 80 highest yield dividend equities in the S&P 500. Given that all issuers of securities in the S&P 500 High Dividend Index are part of the S&P 500, all securities contained within the index are large capitalization U.S. equities. |
*** | The HFRI 500 Macro Index is a global, equal-weighted index of the largest hedge funds that report to the HFR Database which are open to new investments and offer quarterly liquidity or better. The Macro funds that comprise the index are a subset of the HFRI 500 Fund Weighted Composite Index. The index is rebalanced on a quarterly basis. |
2
Modern Capital Tactical Income Fund
SCHEDULE OF INVESTMENTS (Unaudited)
As of September 30, 2024
Shares | | | | | Fair Value | |
| | CLOSED-END FUNDS — 62.9% | | | | |
272,300 | Aberdeen Global Dynamic Dividend Fund (a) | | $ | 2,891,826 | |
262,797 | Aberdeen Total Dynamic Dividend Fund (a) | | | 2,391,453 | |
67,446 | Allspring Global Dividend Opportunity Fund | | | 337,904 | |
273,443 | Allspring Income Opportunities Fund | | | 1,949,649 | |
37,252 | Barings Global Short Duration High Yield Fund | | | 565,485 | |
156,953 | Blackstone Strategic Credit Fund | | | 1,933,661 | |
250,840 | BrandywineGLOBAL - Global Income Opportunities Fund, Inc. | | | 2,217,426 | |
148,753 | Brookfield Real Assets Income Fund, Inc. | | | 2,037,916 | |
5,413 | Clough Global Equity Fund | | | 37,562 | |
325,062 | Clough Global Opportunities Fund | | | 1,771,588 | |
150,288 | Destra Multi-Alternative Fund (a) | | | 1,302,997 | |
258,731 | Eaton Vance Tax-Managed Global Buy-Write Opportunities Fund | | | 2,245,785 | |
67,363 | First Trust High Yield Opportunities 2027 Term Fund | | | 1,018,529 | |
382,627 | FS Credit Opportunities Corp. | | | 2,429,681 | |
377,891 | Highland Income Fund | | | 2,316,472 | |
46,171 | Liberty All-Star Equity Fund, Inc. | | | 327,814 | |
268,917 | Liberty All-Star Growth Fund, Inc. | | | 1,508,624 | |
8,252 | MainStay CBRE Global Infrastructure Megatrends Fund | | | 123,037 | |
131,542 | Mexico Equity & Income Fund, Inc. | | | 1,206,240 | |
466,821 | Morgan Stanley Emerging Markets Domestic Debt Fund Inc | | | 2,352,778 | |
107,846 | Nuveen Core Plus Impact Fund | | | 1,277,975 | |
100,032 | PGIM Global High Yield Fund, Inc. | | | 1,278,409 | |
209,404 | PGIM Short Duration High Yield Opportunities Fund | | | 3,508,740 | |
102,132 | Pioneer High Income Trust | | | 817,056 | |
145,471 | Saba Capital Income & Opportunities Fund II | | | 1,237,954 | |
11,398 | Templeton Dragon Fund | | | 104,406 | |
11,402 | Templeton Emerging Markets Income Fund, Inc. | | | 66,474 | |
8,222 | Tortoise Energy Infrastructure Corporation | | | 322,714 | |
368,904 | Virtus Global Multi-Sector Income Fund | | | 2,986,278 | |
342,575 | Virtus Total Return Fund, Inc. | | | 2,123,965 | |
25,616 | Voya Asia Pacific High Dividend Equity Income Fund | | | 175,470 | |
193,791 | Western Asset Emerging Markets Debt Fund, Inc. | | | 1,972,792 | |
28,745 | Western Asset Global High Income Fund, Inc. | | | 199,490 | |
| | | | | | | | 47,038,150 | |
| | TOTAL CLOSED-END FUNDS — (Cost $44,652,592) | | | 47,038,150 | |
| | | | | | | | | |
See accompanying notes to financial statements.
3
Modern Capital Tactical Income Fund
SCHEDULE OF INVESTMENTS (Unaudited) (Continued)
As of September 30, 2024
Shares | | | | | Fair Value | |
| | COMMON STOCK — 10.3% | | | | |
| | BANKING — 1.4% | | | | |
25,757 | Grupo Financiero Galicia S.A. (b) | | $ | 1,084,112 | |
| | | | | | | | | |
| | CONSUMER DISCRETIONARY — 3.9% | | | | |
46,798 | Arcos Dorados Holdings, Inc. | | | 408,079 | |
121,583 | Cresud S.A. Comercial Industrial Financiera Y Agropecuaria (b) | | | 1,050,477 | |
118,164 | Despegar.com, Inc. (a) | | | 1,465,234 | |
| | | | | | | | 2,923,790 | |
| | ENERGY — 0.9% | | | | |
11,989 | Transportadora de Gas del Sur (a)(b) | | | 219,878 | |
8,145 | Vista Oil & Gas S.A. de C.V. (a)(b) | | | 359,846 | |
5,000 | YPF Sociedad Anonima (a)(b) | | | 106,050 | |
| | | | | | | | 685,774 | |
| | | | | | | | | |
| | FINANCIALS — 1.1% | | | | |
50,000 | Banco BBVA Argentina S.A. (b) | | | 518,500 | |
110,000 | Banco Bradesco S.A. (b) | | | 292,600 | |
| | | | | | | | 811,100 | |
| | | | | | | | | |
| | MATERIALS — 0.5% | | | | |
15,000 | Loma Negra Compania Industrial Argentina S.A. (a)(b) | | | 120,900 | |
20,000 | Sigma Lithium Corporation (a) | | | 247,200 | |
| | | | | | | | 368,100 | |
| | REAL ESTATE — 1.8% | | | | |
121,443 | Irsa Inversiones Y Representaciones S.A. (b) | | | 1,382,020 | |
| | | | | | | | | |
| | TELECOMMUNICATIONS — 0.2% | | | | |
17,500 | Telecom Argentina S.A. (a)(b) | | | 131,950 | |
| | | | | | | | | |
| | TRANSPORTATION — 0.1% | | | | |
4,000 | Corporacion America Airports S.A. (a) | | | 69,840 | |
| | | | | | | | | |
| | UTILITIES — 0.4% | | | | |
17,167 | Central Puerto S.A. (b) | | | 162,571 | |
7,206 | Empresa Distribuidora Y Comercializadora Norte S.A. (a)(b) | | | 159,685 | |
| | | | | | | | 322,256 | |
| | | | | | | | | |
| | TOTAL COMMON STOCK — (Cost $7,266,744) | | | 7,778,942 | |
| | | | | | | | | |
See accompanying notes to financial statements.
4
Modern Capital Tactical Income Fund
SCHEDULE OF INVESTMENTS (Unaudited) (Continued)
As of September 30, 2024
Shares | | | | | Fair Value | |
| | EXCHANGE TRADED FUNDS — 4.8% | | | | |
| | FINANCIALS — 2.8% | | | | |
127,296 | VanEck BDC Income ETF | | $ | 2,108,022 | |
| | | | | | | | | |
| | REAL ESTATE — 2.0% | | | | |
39,606 | iShares Mortgage Real Estate ETF | | | 939,652 | |
41,000 | VanEck Mortgage REIT Income ETF | | | 494,870 | |
| | | | | | | | 1,434,522 | |
| | | | | | | | | |
| | TOTAL EXCHANGE TRADED FUNDS - (Cost $3,572,579) | | | 3,542,544 | |
| | | | | | | | | |
| | MUTUAL FUNDS — 2.4% | | | | |
129,085 | Invesco Advantage Municipal Income Trust II | | | 1,201,781 | |
57,647 | Invesco Municipal Trust | | | 591,458 | |
| | | | | | | | 1,793,239 | |
| | | | | | | | | |
| | TOTAL MUTUAL FUNDS — (Cost $1,761,348) | | | 1,793,239 | |
| | | | | | | | | |
| | REAL ESTATE INVESTMENT TRUSTS — 3.5% | | | | |
333,660 | NexPoint Diversified Real Estate Trust | | | 2,085,372 | |
36,939 | Seven Hills Realty Trust | | | 508,650 | |
| | | | | | | | 2,594,022 | |
| | | | | | | | | |
| | TOTAL REAL ESTATE INVESTMENT TRUSTS - (Cost $2,270,538) | | | 2,594,022 | |
Principal
Amount ($) | | | | | Coupon
Rate (%) | | | Fair Value | |
| | SHORT TERM INVESTMENTS — 13.9% | | | | | | | | |
| | MONEY MARKET FUNDS — 13.9% | | | | | | | | |
10,405,155 | First American Government Obligations Fund, Class X (c) | | | 4.815 | | | | 10,405,155 | |
| | | | | | | | | | | | | |
| | TOTAL SHORT TERM INVESTMENTS — (Cost $10,405,155) | | | | | | | 10,405,155 | |
| | | | | | | | | | | | | |
| | TOTAL INVESTMENTS — 97.8% — (Cost $69,928,956) | | | | | | | 73,152,052 | |
| | OTHER ASSETS IN EXCESS OF LIABILITIES — 2.2% | | | | | | | 1,631,523 | |
| | NET ASSETS — 100.0% | | | | | | $ | 74,783,575 | |
(a) | Non-income producing security. |
(b) | American Depositary Receipt |
(c) | Rate disclosed is the seven day effective yield as of September 30, 2024. |
See accompanying notes to financial statements.
5
Modern Capital Tactical Income Fund
SCHEDULE OF INVESTMENTS (Unaudited) (Continued)
As of September 30, 2024
Summary of Investments by Type and Sector | | % of Net
Assets | | | Fair Value | |
Closed-End Funds | | | 62.90 | % | | $ | 47,038,150 | |
Common Stocks: | | | | | | | | |
Banking | | | 1.40 | % | | | 1,084,112 | |
Consumer Discretionary | | | 3.90 | % | | | 2,923,790 | |
Energy | | | 0.90 | % | | | 685,774 | |
Financials | | | 1.10 | % | | | 811,100 | |
Materials | | | 0.50 | % | | | 368,100 | |
Real Estate | | | 1.80 | % | | | 1,382,020 | |
Telecommunications | | | 0.20 | % | | | 131,950 | |
Transportation | | | 0.10 | % | | | 69,840 | |
Utilities | | | 0.40 | % | | | 322,256 | |
Exchange Traded Funds | | | 4.80 | % | | | 3,542,544 | |
Mutual Funds | | | 2.40 | % | | | 1,793,239 | |
Real Estate Investment Trust | | | 3.50 | % | | | 2,594,022 | |
Short-Term Investments | | | 13.90 | % | | | 10,405,155 | |
Other Assets in Excess of Liabilities | | | 2.20 | % | | | 1,631,523 | |
Total Net Assets | | | 100.00 | % | | | 74,783,575 | |
See accompanying notes to financial statements.
6
Modern Capital Tactical Income Fund
STATEMENT OF ASSETS AND LIABILITIES (Unaudited)
As of September 30, 2024
Assets: | | | | |
Investments, at value (Cost $69,928,956) | | $ | 73,152,052 | |
Receivable for securities sold | | | 3,104,567 | |
Receivable for fund shares sold | | | 51,940 | |
Dividends and interest receivable | | | 278,444 | |
Prepaid expenses and other assets | | | 202,170 | |
| | | | | |
TOTAL ASSETS | | | 76,789,173 | |
| | | | | |
LIABILITIES | | | | |
Payable for securities purchased | | | 1,315,765 | |
Payable for fund shares redeemed | | | 625,601 | |
Payable for fund shares distributed | | | 24,252 | |
Accrued investment advisory fees | | | 7,419 | |
Accrued fund administration, fund accounting, and transfer agency fees | | | 15,591 | |
Accrued audit fees and expenses | | | 10,704 | |
Accrued expenses and other liabilities | | | 6,266 | |
| | | | | |
TOTAL LIABILITIES | | | 2,005,598 | |
| | | | | |
NET ASSETS | | $ | 74,783,575 | |
| | | | | |
NET ASSETS CONSIST OF: | | | | |
Paid-in capital | | | 70,439,302 | |
Distributable Earnings | | | 4,344,273 | |
| | | | | |
NET ASSETS | | $ | 74,783,575 | |
| | | | | |
Net Asset Value Per Share: | | | | |
Class A Shares: (1) | | | | |
Net Assets | | $ | 9,130,990 | |
Shares of beneficial interest outstanding ($0 par value, unlimited shares authorized) | | | 735,941 | |
| | | | | |
Net asset value (Net Assets ÷ Shares Outstanding), and redemption price per share | | $ | 12.41 | |
| | | | | |
Offering price per share (net asset value plus maximum sales charge of 5.00%) | | $ | 13.06 | |
Class ADV Shares: | | | | |
Net Assets | | $ | 65,652,585 | |
Shares of beneficial interest outstanding ($0 par value, unlimited shares authorized) | | | 6,079,049 | |
| | | | | |
Net asset value (Net Assets ÷ Shares Outstanding), offering price and redemption price per share | | $ | 10.80 | |
(1) | The Class A shares charge a 5.00% maximum sales load on all initial purchases. |
See accompanying notes to financial statements.
7
Modern Capital Tactical Income Fund
STATEMENT OF OPERATIONS (Unaudited)
For the Period Ended September 30, 2024
INVESTMENT INCOME | | | | |
Interest income | | $ | 186,284 | |
Dividend income, net of witholding tax expense of $20,851 | | | 3,640,468 | |
| | | | | |
TOTAL INVESTMENT INCOME | | | 3,826,752 | |
| | | | | |
EXPENSES | | | | |
Advisory fees | | | 190,066 | |
Shareholder servicing fees | | | 18,861 | |
Professional fees | | | 58,712 | |
Registration fees | | | 21,176 | |
Trustees’ fees and expenses | | | 10,477 | |
Fund administration and accounting fees | | | 29,542 | |
Transfer agency fees | | | 8,967 | |
Compliance officer fees | | | 20,598 | |
Insurance expense | | | 5,332 | |
Pricing expense | | | 2,575 | |
Printing and postage expenses | | | 4,611 | |
Custodian fees | | | 30,824 | |
Miscellaneous expenses | | | 55,308 | |
| | | | | |
TOTAL EXPENSES | | | 457,049 | |
| | | | | |
Advisory fees waived (note 2) | | | (153,608 | ) |
| | | | | |
NET EXPENSES | | | 303,441 | |
| | | | | |
NET INVESTMENT INCOME | | $ | 3,523,311 | |
| | | | | |
REALIZED AND UNREALIZED GAIN / (LOSS) ON INVESTMENTS | | | | |
Net realized gain on Investments | | | 347,137 | |
Long-term capital gain distributions from underlying funds | | | 130,636 | |
| | | | | |
Net change in unrealized appreciation on investments | | | 607,490 | |
| | | | | |
NET REALIZED AND UNREALIZED GAIN ON INVESTMENTS | | | 1,085,263 | |
| | | | | |
NET INCREASE IN NET ASSETS RESULTING FROM OPERATIONS | | $ | 4,608,574 | |
See accompanying notes to financial statements.
8
Modern Capital Tactical Income Fund
STATEMENTS OF CHANGES IN NET ASSETS
| | Period Ended
September 30, 2024
(Unaudited) | | | Year Ended
March 31, 2024 (1) | |
| | | | | | | | | |
FROM OPERATIONS | | | | | | | | |
Net investment income | | $ | 3,523,311 | | | $ | 2,496,499 | |
Net realized gain from investments | | | 347,137 | | | | 1,553,123 | |
Long-term capital gain distributions from underlying funds | | | 130,636 | | | | 240,520 | |
Net change in unrealized appreciation on investments | | | 607,490 | | | | 2,701,074 | |
| | | | | | | | | |
Net increase in net assets resulting from operations | | | 4,608,574 | | | | 6,991,216 | |
| | | | | | | | | |
DISTRIBUTIONS TO SHAREHOLDERS | | | | | | | | |
From return of capital: | | | | | | | | |
Class A | | | (70,434 | ) | | | — | |
Class ADV | | | (681,473 | ) | | | — | |
Total distributions paid from earnings: | | | | | | | | |
Class A | | | (252,299 | ) | | | (506,929 | ) |
Class ADV | | | (2,422,958 | ) | | | (5,531,154 | ) |
| | | | | | | | | |
Net decrease in net assets from distributions to shareholders | | | (3,427,164 | ) | | | (6,038,083 | ) |
| | | | | | | | | |
SHARES OF BENEFICIAL INTEREST | | | | | | | | |
Proceeds from shares sold: | | | | | | | | |
Class A | | | 4,487,509 | | | | 1,954,541 | |
Class ADV | | | 25,914,777 | | | | 21,184,121 | |
Net asset value of shares issued in reinvestment of distributions to shareholders: | | | | | | | | |
Class A | | | 241,432 | | | | 474,818 | |
Class ADV | | | 3,078,889 | | | | 5,519,164 | |
Payments for shares redeemed: | | | | | | | | |
Class A | | | (585,857 | ) | | | (2,023,553 | ) |
Class ADV | | | (10,582,108 | ) | | | (7,821,122 | ) |
Net increase in net assets from shares of beneficial interest | | | 22,554,642 | | | | 19,287,969 | |
| | | | | | | | | |
TOTAL INCREASE IN NET ASSETS | | | 23,736,052 | | | | 20,241,102 | |
| | | | | | | | | |
NET ASSETS | | | | | | | | |
Beginning of year/period | | | 51,047,523 | | | | 30,806,421 | |
End of year/period | | $ | 74,783,575 | | | $ | 51,047,523 | |
See accompanying notes to financial statements.
9
Modern Capital Tactical Income Fund
STATEMENTS OF CHANGES IN NET ASSETS (Continued)
| | Period Ended
September 30, 2024
(Unaudited) | | | Year Ended
March 31, 2024 | |
| | | | | | | | | |
SHARE ACTIVITY | | | | | | | | |
Class A: | | | | | | | | |
Shares sold | | | 371,077 | | | | 164,775 | |
Shares reinvested | | | 20,010 | | | | 39,704 | |
Shares redeemed | | | (48,771 | ) | | | (170,615 | ) |
Net increase / (decrease) in shares of beneficial interesting outstanding | | | 342,316 | | | | 33,864 | |
| | | | | | | | | |
Class ADV: | | | | | | | | |
Shares sold | | | 2,468,107 | | | | 1,988,331 | |
Shares reinvested | | | 292,755 | | | | 522,493 | |
Shares redeemed | | | (1,016,765 | ) | | | (738,379 | ) |
Net increase / (decrease) in shares of beneficial interesting outstanding | | | 1,744,097 | | | | 1,772,445 | |
| | | | | | | | | |
SHARES OUTSTANDING | | | | | | | | |
Class A: | | | | | | | | |
Beginning of year/period | | | 393,625 | | | | 359,761 | |
End of year/period | | | 735,941 | | | | 393,625 | |
| | | | | | | | | |
Class ADV: | | | | | | | | |
Beginning of year/period | | | 4,334,952 | | | | 2,562,507 | |
End of year/period | | | 6,079,049 | | | | 4,334,952 | |
See accompanying notes to financial statements.
10
Modern Capital Tactical Income Fund
FINANCIAL HIGHLIGHTS
| | | Class A Shares | |
| | Period
Ended
Sep. 30,
2024 | | | Year Ended
March 31,
2024 (8) | | | Year Ended
March 31,
2023 | | | Period
Ended
March 31,
2022 (1) | |
| | | (Unaudited) | | | | | | | | | | | | | |
Net asset value, beginning of year/period | | $ | 12.17 | | | $ | 11.58 | | | $ | 11.79 | | | $ | 10.00 | |
| | | | | | | | | | | | | | | | | |
From Investment operations: | | | | | | | | | | | | | | | | |
Net investment income (2) | | | 0.59 | | | | 0.81 | | | | 0.59 | | | | (0.13 | ) |
Net realized and unrealized gain / (loss) on investments | | | 0.21 | | | | 1.42 | | | | 0.26 | | | | 2.42 | |
| | | | | | | | | | | | | | | | | |
Total from investment operations | | | 0.80 | | | | 2.23 | | | | 0.85 | | | | 2.29 | |
| | | | | | | | | | | | | | | | | |
Less distributions from: | | | | | | | | | | | | | | | | |
Net investment income | | | (0.44 | ) | | | (1.10 | ) | | | (0.83 | ) | | | (0.50 | ) |
Return of capital | | | (0.12 | ) | | | (0.54 | ) | | | (0.23 | ) | | | — | |
| | | | | | | | | | | | | | | | | |
Total distributions | | | (0.56 | ) | | | (1.64 | ) | | | (1.06 | ) | | | (0.50 | ) |
| | | | | | | | | | | | | | | | | |
Net Asset Value, end of year/period | | $ | 12.41 | | | $ | 12.17 | | | $ | 11.58 | | | $ | 11.79 | |
| | | | | | | | | | | | | | | | | |
Total Return (5) | | | 6.85 | %(4) | | | 20.32 | %(7) | | | 7.62 | % | | | 23.12 | %(4) |
| | | | | | | | | | | | | | | | | |
Net Asset Value, end of year/period (000s) | | $ | 9,131 | | | $ | 4,791 | | | $ | 4,167 | | | $ | 2,356 | |
| | | | | | | | | | | | | | | | | |
Ratios of: | | | | | | | | | | | | | | | | |
Gross expenses to average net assets (6) (7) | | | 1.44 | %(3) | | | 1.81 | % | | | 5.74 | % | | | 13.12 | %(3) |
Net expenses to average net assets (6) (7) | | | 0.90 | %(3) | | | 1.08 | %(9) | | | 4.55 | %(8) | | | 7.81 | %(3)(8) |
Net investment income / (loss) to average net assets (7) | | | 9.70 | %(3) | | | 6.77 | % | | | 4.89 | % | | | (1.16 | )%(3) |
| | | | | | | | | | | | | | | | | |
Portfolio Turnover Rate | | | 675.71 | %(4) | | | 876.50 | % | | | 1228.52 | % | | | 1496.05 | %(4) |
(1) | For a share outstanding during the initial period from April 5, 2021 (Commencement of Operations) through March 31, 2022. |
(2) | Per shares amounts calculated using the average share method, which appropriately presents the per share data for the year/period. |
(5) | Total return does not relect sales charge, if any. |
(6) | The expense ratios listed reflect total expenses prior to any waivers and reimbursements (gross expense ratio) and after any waivers and reimbursements (net expense ratio). |
(7) | Recognition of the Fund’s net investment income is affected by the timing of dividend declarations of underlying funds. The expenses of the underlying funds are excluded from the Fund’s expense ratio. |
(8) | Net expenses include tax expenses as a result of grantor trust income (Note 2). |
(9) | Net expenses include extraordinary expenses incurred by the Fund outside of the Expense Limitation Agreement (Note 3). |
See accompanying notes to financial statements.
11
Modern Capital Tactical Income Fund
FINANCIAL HIGHLIGHTS
| | | Class ADV Shares | |
| | Period
Ended
Sep. 30,
2024 | | | Year Ended
March 31,
2024 | | | Year Ended
March 31,
2023 | | | Period
Ended
March 31,
2022 (1) | |
| | | (Unaudited) | | | | | | | | | | | | | |
Net asset value, beginning of year/period | | $ | 10.67 | | | $ | 10.40 | | | $ | 10.72 | | | $ | 10.00 | |
| | | | | | | | | | | | | | | | | |
From Investment operations: | | | | | | | | | | | | | | | | |
Net investment income (2) | | | 0.59 | | | | 0.72 | | | | 0.47 | | | | (0.09 | ) |
Net realized and unrealized gain / (loss) on investments | | | 0.10 | | | | 1.23 | | | | 0.27 | | | | 1.32 | |
| | | | | | | | | | | | | | | | | |
Total from investment operations | | | 0.69 | | | | 1.95 | | | | 0.74 | | | | 1.23 | |
| | | | | | | | | | | | | | | | | |
Less distributions from: | | | | | | | | | | | | | | | | |
Net investment income | | | (0.44 | ) | | | (1.14 | ) | | | (0.83 | ) | | | (0.51 | ) |
Return of capital | | | (0.12 | ) | | | (0.54 | ) | | | (0.23 | ) | | | — | |
| | | | | | | | | | | | | | | | | |
Total distributions | | | (0.56 | ) | | | (1.68 | ) | | | (1.06 | ) | | | (0.51 | ) |
| | | | | | | | | | | | | | | | | |
Net Asset Value, end of year/period | | $ | 10.80 | | | $ | 10.67 | | | $ | 10.40 | | | $ | 10.72 | |
. | | | | | | | | | | | | | | | | |
Total Return (5) | | | 6.78 | %(4) | | | 19.97 | % | | | 7.40 | % | | | 12.54 | %(4) |
| | | | | | | | | | | | | | | | | |
Net Asset Value, end of year/period (000s) | | $ | 65,653 | | | $ | 46,257 | | | $ | 26,369 | | | $ | 16,182 | |
| | | | | | | | | | | | | | | | | |
Ratios of: | | | | | | | | | | | | | | | | |
Gross expenses to average net assets (6) (7) | | | 1.44 | %(3) | | | 1.81 | % | | | 5.71 | % | | | 13.04 | %(3) |
Net expenses to average net assets (6) (7) | | | 0.90 | %(3) | | | 1.08 | %(9) | | | 4.52 | %(8) | | | 7.95 | %(3)(8) |
Net investment income to average net assets (7) | | | 11.25 | %(3) | | | 6.82 | % | | | 4.37 | % | | | (1.17 | )%(3) |
| | | | | | | | | | | | | | | | | |
Portfolio Turnover Rate | | | 675.71 | %(4) | | | 876.50 | % | | | 1228.52 | % | | | 1496.05 | %(4) |
(1) | For a share outstanding during the initial period from June 23, 2021 (Commencement of Operations) through March 31, 2022. |
(2) | Per shares amounts calculated using the average share method, which appropriately presents the per share data for the year/period. |
(5) | Total return does not relect sales charge, if any. |
(6) | The expense ratios listed reflect total expenses prior to any waivers and reimbursements (gross expense ratio) and after any waivers and reimbursements (net expense ratio). |
(7) | Recognition of the Fund’s net investment income is affected by the timing of dividend declarations of underlying funds. The expenses of the underlying funds are excluded from the Fund’s expense ratio. |
(8) | Net expenses include tax expenses as a result of grantor trust income (Note 2). |
(9) | Net expenses include extraordinary expenses incurred by the Fund outside of the Expense Limitation Agreement (Note 3). |
See accompanying notes to financial statements.
12
Modern Capital Tactical Income Fund
Notes to the Financial Statements (Unaudited)
As of September 30, 2024
The Modern Capital Tactical Income Fund (the “Fund”) is a series of the Modern Capital Funds Trust (the “Trust”). The Trust is organized as a Delaware statutory trust and is registered under the Investment Company Act of 1940, as amended (“1940 Act”), as an open-end management investment company. The Fund is a separate, non-diversified series of the Trust.
The investment objective of the Fund is to provide income and capital gains. The Fund seeks to achieve its investment objective by tactically investing long or short primarily in publicly traded closed-end funds, domestic or foreign common stocks, exchange-traded funds (“ETFs”), sponsored American Depositary Receipts (“ADRs”) and debt instruments. The Fund seeks income from interest payments and dividends; and seeks capital gains through short-term trading strategies. The Fund may invest without restriction as to issuer capitalization, currency, or country. However, it focuses primarily on issuers in the $100 million to $10 billion capitalization range and generally limits emerging market exposure to 20% of portfolio assets.
The Fund currently has an unlimited number of authorized shares, which are divided into two classes – Class A Shares and Class ADV Shares. Each class of shares has equal rights to assets of the Fund, and the classes are identical except for differences in sales loads.
The Class A Shares and Class ADV Shares are subject to distribution plan fees as described in Note 5. The Fund’s Class A Shares are sold with an initial sales charge of 5.00%. Income, expenses (other than distribution and service fees), and realized and unrealized gains or losses on investments are allocated to each class of shares based upon its relative net assets. Both classes have equal voting privileges, except where otherwise required by law or when the Trustees determine that the matter to be voted on affects only the interests of the shareholders of a particular class.
(2) | Significant Accounting Policies |
The Fund follows the accounting and reporting guidance in the Financial Accounting Standards Board (“FASB”) Accounting Standards Codification 946 “Financial Services – Investment Companies,” and Financial Accounting Standards Update (“ASU”) 2013-08. The following is a summary of significant accounting policies consistently followed by the Fund in the preparation of the financial statements. The policies are in conformity with accounting principles generally accepted in the United States of America (“GAAP”).
Investment Valuation
The Fund’s investments in securities are carried at market or fair value. Securities listed on an exchange or quoted on a national market system are valued at the last sales price as of 4:00 p.m. Eastern Time. Securities traded in the NASDAQ over-the- counter market are generally valued at the NASDAQ Official Closing Price. Other securities traded in the over-the-counter market and listed securities for which no sale was reported on that date are valued at the most recent bid price. Instruments with maturities of 60 days or less are valued at amortized cost, which approximates market value. Securities and assets for which representative market quotations are not readily available (e.g., (i) an exchange-traded portfolio security is so thinly traded that there have been no transactions for that security over an extended period of time or the validity of a market quotation received is questionable; (ii) the exchange on which the portfolio security is principally traded closes early; or (iii) trading of the portfolio security is halted during the day and does not resume prior to the Fund’s NAV calculation) or which cannot be accurately valued using the Fund’s normal pricing procedures are valued at fair value as determined in good faith under policies approved by Modern Capital Management Co. (the “Adviser”), the Fund’s investment Adviser. The Board of Trustees (the “Board”) has designated the Adviser as the valuation designee responsible for the fair valuation function and performing fair value determinations as needed. The investment Adviser has established a Fair Value Committee (the Committee) to carry out the day-to-day fair valuation responsibilities and has adopted policies and procedures to govern the fair valuation process and the activities of the Committee. In accordance with these fair valuation policies and procedures, which have been approved by the Board, the Fund attempts to obtain prices from one or more third party pricing services or brokers to value its investments. When current market prices or quotations are not readily available or reliable, investments will be fair valued in good faith by the Committee, in accordance with the policies and procedures. Factors
13
Modern Capital Tactical Income Fund
Notes to the Financial Statements (Unaudited) (Continued)
September 30, 2024
(2) | Significant Accounting Policies (Continued) |
Investment Valuation (Continued)
used in determining fair value vary by investment type and may include market or investment specific events, transaction data, estimated cash flows, and market observations of comparable investments. The frequency that the fair valuation procedures are used cannot be predicted and they may be utilized to a significant extent. The Committee manages the Fund’s fair valuation policies and procedures. The Adviser reports to the Board information regarding the fair valuation process and related material matters.
Fair Value Measurement
Various inputs are used in determining the value of the Fund’s investments. These inputs are summarized in the three broad levels listed below:
Level 1: quoted prices in active markets for identical securities
Level 2: other significant observable inputs (including quoted prices for similar securities, interest rates, credit risk, etc.)
Level 3: significant unobservable inputs (including the Fund’s own assumptions in determining fair value of investments)
The availability of observable inputs can vary from security to security and is affected by a wide variety of factors, including, for example, the type of security, whether the security is new and not yet established in the marketplace, the liquidity of markets, and other characteristics particular to the security. To the extent that valuation is based on models or inputs that are less observable or unobservable in the market, the determination of fair value requires more judgment. Accordingly, the degree of judgment exercised in determining fair value is greatest for instruments categorized in Level 3.
The inputs used to measure fair value may fall into different levels of the fair value hierarchy. In such cases, for disclosure purposes, the level in the fair value hierarchy within which the fair value measurement falls in its entirety, is determined based on the lowest level input that is significant to the fair value measurement in its entirety.
The inputs or methodology used for valuing securities are not necessarily an indication of the risk associated with investing in those securities. The following table summarizes the inputs as of September 30, 2024, for the Fund’s assets measured at fair value:
Investments in Securities (a) | | Level 1 | | | Level 2 | | | Level 3 | | | Total | |
Assets | | | | | | | | | | | | | | | | |
Closed-End Funds | | $ | 47,038,150 | | | $ | — | | | $ | — | | | $ | 47,038,150 | |
Common Stocks (b) | | | 7,778,942 | | | | — | | | | — | | | | 7,778,942 | |
Mutual Funds | | | 1,793,239 | | | | — | | | | — | | | | 1,793,239 | |
Exchange-Traded Funds | | | 3,542,544 | | | | — | | | | — | | | | 3,542,544 | |
Real Estate Investment Trusts | | | 2,594,022 | | | | — | | | | — | | | | 2,594,022 | |
Short-Term Investments | | | 10,405,155 | | | | — | | | | — | | | | 10,405,155 | |
Total | | $ | 73,152,052 | | | $ | — | | | $ | — | | | $ | 73,152,052 | |
| | (a) | The Fund had no Level 2 or Level 3 holdings as of and during the period ended September 30, 2024. |
| | (b) | Refer to the Schedule of Investments for breakdown by industry. |
14
Modern Capital Tactical Income Fund
Notes to the Financial Statements (Unaudited) (Continued)
September 30, 2024
(2) | Significant Accounting Policies (Continued) |
Investment Transactions and Investment Income
Investment transactions are accounted for as of the date purchased or sold (trade date). Dividend income is recorded on the ex-dividend date. Certain dividends from foreign securities will be recorded as soon as the Fund is informed of the dividend if such information is obtained subsequent to the ex-dividend date. Interest income is recorded on an accrual basis and includes accretion of discounts and amortization of premiums using the effective interest method. Gains and losses are determined on the identified cost basis, which is the same basis used for federal tax income purposes.
Expenses
The Fund is responsible for all expenses incurred specifically on its behalf by the Trustees. Distribution fees are charged to that class of shares. All other expenses are allocated based upon the daily net assets of each class of shares.
Distributions
The Fund may declare and distribute dividends from net investment income (if any) monthly. Distributions from capital gains (if any) are generally declared and distributed annually. Dividends and distributions to shareholders are recorded on ex-date.
Estimates
The preparation of financial statements in conformity with GAAP requires management to make estimates and assumptions that affect the reported amounts of assets and liabilities and the disclosure of contingent assets and liabilities at the date of the financial statements and the reported amounts of increases and decreases in the net assets from operations during the reported period. Actual results could differ from those estimates.
Federal Income Taxes
No provision for income taxes is included in the accompanying financial statements, as the Fund intends to distribute to shareholders all taxable investment income and realized gains and otherwise comply with Subchapter M of the Internal Revenue Code applicable to regulated investment companies.
The Fund’s tax year end of February 29th differs from the book fiscal year end of March 31st prior to changing its tax year end to March 31st as of the fiscal year ended March 31, 2024. Going forward the Fund’s tax and book year end will be the same.
For the fiscal tax year ended February 28, 2023, the Fund did not meet the gross income test for qualification as a regulated investment company (“RIC”). In order to continue to qualify as a RIC, the Fund elected to pay an excise tax in the amount of $922,456. The Fund did not meet the gross income test due to their investment in certain Grantor Trusts that generated income that was not considered qualifying under the gross income test.
Reclassification of capital accounts: Accounting principles generally accepted in the United States of America require that certain components of net assets relating to permanent differences be reclassified between financial and tax reporting. These reclassifications have no effect on net assets or net asset value per share.
For the year ended March 31, 2024, the Fund made the following permanent tax adjustments on the Statement of Assets and Liabilities:
| | Distributable Earnings | | | Paid-in Capital | |
| | $ | 1,828,219 | | | | $(1,828,219 | ) |
15
Modern Capital Tactical Income Fund
Notes to the Financial Statements (Unaudited) (Continued)
September 30, 2024
(3) | Transactions with Related Parties and Service Providers |
Adviser
The Fund pays a monthly fee to the Adviser calculated at the annual rate of 0.60% of the Fund’s average daily net assets.
The Adviser has entered into a contractual agreement (the “Expense Limitation Agreement”) with the Trust in which the Adviser has contractually agreed to waive a portion of its fees and/or reimburse certain Fund expenses, including the Adviser’s management fee, any organizational and offering expenses (exclusive of (i) brokerage fees and commissions; (ii) shareholder servicing fees; (iii) borrowing costs (such as interest and dividend expense on securities sold short); (iv) taxes; (v) specialized pricing services and (vii) extraordinary expenses, such as litigation expenses (which may include indemnification of Trust officers and Trustees, contractual indemnification of Fund service providers (other than the adviser)) in order to limit annual Fund operating expenses to 0.90%, and 0.90% for Class A shares, and Class ADV shares, respectively. These expense limitations will remain in effect until at least July 29, 2025. This agreement may be terminated by the Trust’s Board of Trustees (the “Board”) upon written notice to the Adviser. The agreement may not be terminated by the Adviser without consent of the Board. The Adviser will be permitted to recover fees and expenses it has borne, within three years after the fees were waived or expenses reimbursed, only to the extent that the Fund’s expenses do not exceed the lesser of (1) the expense limit in effect at the time the adviser waives or limits the fees and (2) the expense limit in effect at the time the Adviser recovers fees.
For the period ended September 30, 2024, $190,066 in advisory fees were incurred by the Fund, of which $153,608 were waived by the Adviser.
The Adviser may recapture a portion of the amount noted above no later than the years as stated below:
March 31, 2025 | March 31, 2026 | March 31, 2027 | March 31, 2028 | Total |
$378,355 | $303,620 | $266,482 | $153,608 | $1,102,065 |
Administrator, Fund Accounting and Custody
Gryphon Fund Group, LLC (“Gryphon”) provides accounting, administrative, and transfer agent services to the Fund. The Fund has entered into a Master Services Agreement (“Services Agreement”) with Gryphon. Under the Services Agreement, Gryphon is responsible for a wide variety of` functions, including but not limited to: (a) Fund accounting services; (b) financial statement preparation; (c) valuation of the Fund’s portfolio investments; (d) pricing the Fund’s shares; (e) assistance in preparing tax returns; and (f) preparation and filing of required regulatory reports and are paid fees, computed and payable monthly at an annual rate based on the average daily net assets of the Fund.
U.S. Bank National Association (“USB N.A.”) serves as the custodian to the Fund. Under a custody services agreement, USB N.A. is paid a custody fee monthly based on the average daily market value of any securities and cash held in the portfolio.
The Fund incurred $29,542 in administration and fund accounting fees, and $30,824 in custody fees for the period ended September 30, 2024.
During the period, due to a clerical issue, the Fund paid the administrator in excess of $24,450. As of the period end, the administrator reimbursed the Fund for the excess payments. This amount does not impact the Fund’s net assets, gross expense ratio, net expense ratio or total return.
Compliance Services
Vigilant Compliance, LLC provides services as the Trust’s Chief Compliance Officer. Vigilant Compliance, LLC is entitled to receive customary fees from the Fund for their services pursuant to the Compliance Services agreement with the Fund.
16
Modern Capital Tactical Income Fund
Notes to the Financial Statements (Unaudited) (Continued)
September 30, 2024
(3) | Transactions with Related Parties and Service Providers (Continued) |
Transfer Agency
Gryphon Fund Group, LLC, located at 3000 Auburn Drive, Suite 410, Beachwood, OH 44122, also serves as dividend disbursing agent and transfer agent (the “Transfer Agent”) pursuant to the Master Fund Services Agreement with the Trust. The Fund incurred $8,967 in transfer agent fees from Gryphon during the period ended September 30, 2024.
Distributor
Vigilant Distributors, LLC. (the “Distributor”) serves as the Fund’s principal underwriter and distributor.
Related Broker
The Fund utilizes brokerage services through an affiliate of the Adviser. White Mountain Capital, LLC (“White Mountain”), a registered broker-dealer which is wholly owned by the Adviser, acted as the Fund’s fully disclosed clearing broker. During the period ended September 30, 2024, White Mountain received commissions from trading activities in the amount of $954,490.
(4) Trustees and Officers
The Trust is governed by the Board of Trustees, which is responsible for the management and oversight of the Fund. The Trustees meet periodically throughout the year to review contractual agreements with companies that furnish services to the Fund; review performance of the Adviser and the Fund; and oversee activities of the Fund. Officers of the Trust and Trustees who are interested persons of the Trust or the Adviser will receive no salary or fees from the Trust. Each Trustee who is not an “interested person” of the Trust or the Adviser within the meaning of the 1940 Act, as amended (the “Independent Trustees”) receives $2,500 per quarter from the Fund. The Trust reimburses each Trustee and officer of the Trust for his or her travel and other expenses related to attendance of Board meetings.
(5) Purchases and Sales of Investment Securities
For the period ended September 30, 2024, the aggregate cost of purchases and proceeds from sales of investment securities (excluding short-term securities) were as follows:
| | Purchases of Securities | | | Proceeds from Sales of Securities | |
| | $ | 243,860,610 | | | $ | 230,484,876 | |
There were no long-term purchases or sales of the U.S. Government Obligations for the period ended September 30, 2024.
Active Trading Risk. Active trading of portfolio securities (commonly known as day-trading strategies) may result in added expenses, a lower return and increased tax liability. Because the Adviser engages in high turnover trading strategies that seek to leverage short term price dislocations through the duration of a trade, the Fund will have high portfolio turnover rates, which at times may be significantly in excess of 1,000% of capital over the course of a year. Increased portfolio turnover causes the Fund to incur higher brokerage costs, which may adversely affect the Fund’s performance and may produce increased taxable distributions.
Closed-End Fund Risk. Closed-end funds are subject to investment advisory and other expenses, which will be indirectly paid by the Fund resulting in duplicative fees and expenses. As such, your cost of investing will be higher than the cost of investing directly in a closed-end fund and may be higher than other mutual funds that invest directly in stocks and bonds. Closed-end funds are
17
Modern Capital Tactical Income Fund
Notes to the Financial Statements (Unaudited) (Continued)
September 30, 2024
also subject to management risk because the Adviser to the underlying closed-end fund may be unsuccessful in meeting the fund’s investment objective. These funds may also trade at a discount or premium to their net asset value and may trade at a larger discount or smaller premium subsequent to purchase by the Fund. Since closed-end funds trade on exchanges, the Fund will also incur brokerage expenses and commissions when it buys or sells closed-end fund shares.
Equity Securities Risk. The Fund may invest in equity securities including common stocks, which include the common stock of any class or series of domestic or foreign corporations or any similar equity interest, such as a trust or partnership interest. The value of the equity securities held by the Fund may fall due to general market and economic conditions, perceptions regarding the industries in which the issuers of securities held by the Fund participate, or facts relating to specific companies in which the Fund invests. These investments may or may not pay dividends and may or may not carry voting rights. Common stock occupies the most junior position in a company’s capital structure.
ADR Risk. ADRs are receipts, issued by depository banks in the United States, for shares of a foreign-based company that entitle the holder to dividends and capital gains on the underlying security. ADRs may be sponsored or unsponsored. In a sponsored ADR arrangement, the foreign issuer assumes the obligation to pay some or all of the depositary’s transaction fees.
Under an unsponsored ADR arrangement, the foreign issuer assumes no obligations and the depositary’s transaction fees are paid directly by the ADR holders. In addition to the risks of investing in foreign securities, there is no guarantee that an ADR issuer will continue to offer a particular ADR. As a result, the Fund may have difficulty selling the ADR or selling them quickly and efficiently at the prices at which they have been valued. The issuers of unsponsored ADRs are not obligated to disclose information that is considered material in the U.S. and voting rights with respect to the deposited securities are not passed through. ADRs may not track the prices of the underlying foreign securities on which they are based, and their values may change materially at times when U.S. markets are not open for trading.
Call Risk. During periods of falling interest rates, an issuer of a callable bond held by the Fund may “call” or repay the security before its stated maturity, and the Fund may have to reinvest the proceeds at lower interest rates, resulting in a decline in the Fund’s income.
Cybersecurity Risk. The computer systems, networks and devices used by the Fund and its service providers to carry out routine business operations employ a variety of protections designed to prevent damage or interruption from computer viruses, network failures, computer and telecommunication failures, infiltration by unauthorized persons and security breaches. Despite the various protections utilized by the Fund and its service providers, systems, networks, or devices potentially can be breached. The Fund and its shareholders could be negatively impacted as a result of a cybersecurity breach.
Emerging Market Risk. Emerging market countries may have relatively unstable governments, weaker economies, and less developed legal systems with fewer security holder rights. Emerging market economies may be based on only a few industries and security issuers may be more susceptible to economic weakness and more likely to default. Emerging market securities also tend to be less liquid.
ETF Risk. When the Fund invests in an ETF, it will indirectly bear its proportionate share of any fees and expenses payable directly by the ETF. Therefore, the Fund will incur higher expenses, many of which may be duplicative. In addition, the Fund may be affected by losses of the ETFs and the level of risk arising from the investment practices of the ETFs (such as the use of leverage by the funds). The Fund has no control over the investments and related risks taken by the ETFs in which it invests. Additionally, investments in ETFs are also subject to the following risks: (i) the market price of an ETF’s shares may trade above or below their net asset value; (ii) an active trading market for an ETF’s shares may not develop or be maintained; or (iii) trading of an ETF’s shares may be halted for a number of reasons.
Foreign and Currency Exposure Risk. Foreign markets can be more volatile than the U.S. market due to increased risks of adverse issuer, political, regulatory, market, or economic developments and can perform differently from the U.S. market. The value of foreign securities is also affected by the value of the local currency relative to the U.S. dollar.
18
Modern Capital Tactical Income Fund
Notes to the Financial Statements (Unaudited) (Continued)
September 30, 2024
High-Yield Risk. High-yield, high-risk securities, commonly called “junk bonds,” are considered speculative. While generally providing greater income than investments in higher-quality securities, these lower-quality securities will involve greater risk of principal and income that higher-quality securities.
Interest Rate Risk. Interest rate risk is the risk that debt prices overall, including the prices of securities held by the Fund, will decline over short or even long periods of time due to rising interest rates. Debt instruments with longer maturities tend to be more sensitive to interest rates than bonds with shorter maturities. Recently, interest rates have been historically low. Current conditions may result in a rise in interest rates. As a result, for the present, interest rate risk may be heightened.
Leverage Risk. The use of leverage by the Fund, by borrowing money to purchase securities, will cause the Fund to incur additional expenses and magnify the Fund’s gains or losses.
Management Risk. The Adviser’s tactical strategy may not produce the desired results. The portfolio manager’s judgments about the attractiveness, value and potential appreciation of particular asset classes, sectors or other securities in which the Fund invests may prove to be incorrect and there is no guarantee that the portfolio manager’s judgment will produce the desired results.
Non-Diversification Risk. Because a relatively high percentage of a non-diversified Fund’s assets may be invested in the securities of a limited number of companies that could be in the same or related economic sectors, the Fund’s portfolio may be more susceptible to any single economic, technological or regulatory occurrence than the portfolio of a diversified fund.
Security Market Risk. The value of the Fund may decrease in response to the activities and financial prospects of the securities markets generally, or an individual security in the Fund’s portfolio. Unexpected local, regional or global events, such as war; acts of terrorism; financial, political or social disruptions; natural, environmental or man-made disasters; the spread of infectious illnesses or other public health issues, climate change and climate related events; and recessions and depressions could have a significant impact on the Fund and its investments and may impair market liquidity. Such events can cause investor fear, which can adversely affect the economies of nations, regions and the market in general, in ways that cannot necessarily be foreseen. Inflation pressures have been fueled by elevated energy prices. One of the main near-term sources of elevated energy prices is the geopolitical tensions between Russia and Ukraine These tensions could either escalate into military conflict or could dissipate based on various factors facing Russia and Ukraine. Due to Europe’s reliance on Russian oil and gas, Russia’s bargaining position may decline as the demand for oil and gas declines. This could lead to near term energy price volatility and may contribute to inflation pressures.
China remains a risk factor to both the global supply and demand. The 2021 Chinese property market correction appears broader and deeper than China’s prior housing cycles. Weak market sentiment in China, combined with a high volume of property developer bonds maturing in the offshore USD denominated markets in the first half of 2022, increase the risk of a lack of liquidity in the Chinese property market. The Chinese property market slowdown and resulting potential weakness in China’s economic growth could have broader repercussions. China currently accounts for around half the annual copper and steal used globally while being expected to comprise more than 20% of global GDP growth between 2021 and 2026. Additionally, the Chinese market remains important to both U.S. and globally listed companies as a growing consumer market and an important part of supply chains. Chinese policy action may help mitigate this risk from the property sector and restore confidence and stability. It is impossible to predict the effects of these or similar events in the future on the Fund, although it is possible that these or similar events could have a significant adverse impact on the NAV and/or risk profile of the Fund.
Short Selling Risk. If a security sold short increases in price, the Fund may have to cover its short position at a higher price than the short sale price, resulting in a loss. The Fund may not be able to successfully implement its short sale strategy due to limited availability of desired securities or for other reasons.
19
Modern Capital Tactical Income Fund
Notes to the Financial Statements (Unaudited) (Continued)
September 30, 2024
Small and Medium (Mid) Capitalization Stock Risk. The earnings and prospects of small and mid-capitalization companies are more volatile than larger companies, they may experience higher failure rates than larger companies and normally have a lower trading volume than larger companies, which may tend to make their market price fall more disproportionately than larger companies in response to selling pressures.
(7) Federal Income Tax
Distributions are determined in accordance with Federal income tax regulations, which differ from GAAP, and, therefore, may differ significantly in amount or character from net investment income and realized gains for financial reporting purposes. Financial reporting records are adjusted for permanent book/tax differences to reflect tax character but are not adjusted for temporary differences.
Management reviewed the Fund’s tax positions taken or to be taken on federal income tax returns for the years ended March 31, 2024, February 28, 2024, 2023, and 2022 and determined that the Fund does not have a liability for uncertain tax positions. The Fund recognizes interest and penalties, if any, related to unrecognized tax benefits as income tax expense in the Statement of Operations. During the year, the Fund did not incur any interest or penalties.
The Fund paid $5,617,690 in income and $420,393 in long-term capital gain distributions for the extended tax period ended March 31, 2024.
As of March 31, 2024, the tax-basis cost of investments and components of distributable earnings were as follows:
| | Tax Cost | | | Gross Unrealized
Appreciation | | | Gross Unrealized
Depreciation | | | Net Unrealized
Appreciation /
(Depreciation) | |
| | $ | 48,251,510 | | | $ | 2,942,547 | | | | ($149,371 | ) | | $ | 2,793,176 | |
| | Undistributed
Ordinary Income | | | Undistributed Long-
Term Capital Gains | | | Other Accumulated
Losses | | | Net Unrealized
Appreciation /
(Depreciation) | | | Total Distributable
Earnings | |
| | | $— | | | $ | 1,812,262 | | | | ($1,464,008 | ) | | $ | 2,793,176 | | | $ | 3,141,430 | |
Other accumulated losses primarily relate to the timing of tax paid under internal revenue code section 851(i)(2) related to the gross income test for qualification as a regulated investment company (“RIC”).
The beneficial ownership, either directly or indirectly, of 25% or more of the voting securities of a fund creates a presumption of control of a fund, under Section 2(a)(9) of the Investment Company Act of 1940. As of September 30, 2024, RBC Capital Markets, LLC held 56% of the Fund. The Fund has no knowledge as to whether all or any portion of the shares of record owned by RBC Capital Markets, LLC are also owned beneficially, or the identity of customers of RBC Capital Markets, LLC who may beneficially own Fund shares.
(9) | Commitments and Contingencies |
Under the Trust’s organizational documents, its officers and Trustees are indemnified against certain liabilities arising out of the performance of their duties to the Fund. In addition, in the normal course of business, the Trust entered into contracts with its service providers, on behalf of the Fund, and others that provide for general indemnifications. The Fund’s maximum exposure under these arrangements is unknown, as this would involve future claims that may be made against the Fund. The Fund expects risk of loss to be remote.
20
Modern Capital Tactical Income Fund
Notes to the Financial Statements (Unaudited) (Continued)
September 30, 2024
(10) Subsequent Events
In accordance with GAAP, management has evaluated the need for disclosures and/or adjustments resulting from subsequent events through the date of issuance of these financial statements. Management has concluded there are no additional matters, other than those noted above, requiring recognition or disclosure.
21
Modern Capital Tactical Income Fund
Additional Information (Unaudited)
As of September 30, 2024
1. | Proxy Voting Policies and Voting Records |
A copy of the Adviser’s Proxy and Corporate Action Voting Policies and Procedures is included as Appendix A to the Fund’s Statement of Additional Information and is available, without charge, upon request, by calling 800-711-9164, and on the website of the Securities and Exchange Commission (“SEC”) at http://www.sec.gov. Information regarding how the Fund voted proxies relating to portfolio securities during the most recent 12-month period ended June 30, is available (1) without charge, upon request, by calling the Fund at the number above and (2) on the SEC’s website at http://www.sec.gov.
2. | Quarterly Portfolio Holdings |
The Fund files its complete schedule of portfolio holdings with the SEC for the first and third quarters of each fiscal year on Form N-PORT. The Fund’s Form N-PORT is available on the SEC’s website at http://www.sec.gov. You may also obtain copies without charge, upon request, by calling the Fund at 800-711-9164.
We are required to advise you within 60-days of the Fund’s fiscal year-end regarding the federal tax status of certain distributions received by shareholders during each fiscal year. The following information is provided for the Fund’s fiscal year ended March 31, 2024.
During the fiscal year ended March 31, 2024, the Fund paid $5,617,690 in income distributions and $420,393 long-term capital gains distributions.
Dividend and distributions received by retirement plans such as IRAs, Keogh-type plans, and 403(b) plans need not be reported as taxable income. However, many retirement plans may need this information for their annual information meeting.
4. | Approval of Investment Advisory Agreement |
The Board of Trustees (the “Board”) of Modern Capital Funds Trust (the “Trust”) met virtually at a regular meeting of the Trust on June 12, 2024, for purposes of, among other things, considering whether it would be in the best interests of Modern Capital Tactical Opportunities Fund (the “Fund”) and its shareholders for the Board to reapprove the Management Agreement (the “Agreement”) between the Trust on behalf of the Fund and Modern Capital Management Co. (the “Adviser”).
In connection with the Board’s review of the Agreement, the Trustees of the Trust who were not “interested persons” of the Fund within the meaning of the Investment Company Act of 1940, as amended (the “1940 Act”) (collectively, the “Independent Trustees”) requested, and the Adviser provided the Board with, information about a variety of matters, including, among other information, the following information:
● | nature, extent and quality of services to be provided by the Adviser, including background information on the qualifications and experience of key professional of the Adviser personnel that provide services to the Fund; |
● | fees charged to and expenses of the Fund, including comparative fee and expense information for registered investment companies similar to the Fund; |
● | costs of the services provided; |
● | profits, if any, expected to be realized by the Adviser; and |
At the June 12, 2024, meeting, the Board and the Independent Trustees determined that the Agreement was in the best interests of the Fund in light of the proposed services, personnel, expenses and such other matters as the Board considered to be relevant in the exercise of its reasonable business judgment and approved them.
22
Modern Capital Tactical Income Fund
Supplemental Information (Unaudited) (Continued)
As of September 30, 2024
4. | Approval of Investment Advisory Agreement (Continued) |
To reach this determination, the Board considered its duties under the 1940 Act as well as under the general principles of state law in reviewing and approving advisory contracts; the fiduciary duty of the Adviser with respect to the Agreement and the receipt of investment advisory compensation; the standards used by courts in determining whether investment company boards have fulfilled their duties; and the factors to be considered by the Board in voting on such agreements. To assist the Board in its evaluation of the Agreement, the Independent Trustees received materials in advance of the Board meeting from the Adviser.
The Board applied its business judgment to determine whether the arrangement by the Fund and Adviser is a reasonable business arrangement from the Fund’s perspective as well as from the perspective of its proposed shareholders.
Nature, Extent and Quality of Services Provided by the Advisor
The Board noted that the Adviser was an SEC-registered investment adviser with approximately $64 million in assets under management (“AUM”) as of the end of the review period. The Board reviewed the background information, including education, of the key investment personnel responsible for servicing the Fund and noted their deep financial industry experience. The Board concluded that the Adviser continues to provide high quality services to the Fund.
Performance
The Board noted that as of March 31, 2024, the Fund’s annualized returns over the prior one-year period of 19.84% was higher than the Fund’s category and benchmark index. The Board further noted that the Fund’s annual returns on a since-inception basis of 12.68% was higher than the Fund’s category and benchmark index. The Board agreed that the Fund’s performance has been strong.
Fees and Expenses
The Board noted that as of March 31, 2024, the Adviser charged the Fund an annual advisory fee of 0.60%, which was below the Fund’s peer group average of 1.17%. The Board further noted that the Fund’s net expense ratio was below the Fund’s peer group, and that the Fund had an expense limitation agreement in place. The Board agreed that the fees and expenses with respect to the Fund were not unreasonable. The Board also considered the extent that the Fund invested in closed-end funds and took account the fees charged by the underlying funds. The Board also considered that the Adviser was waiving a portion of its advisory fee paid by the Fund pursuant to an operating expense limitation agreement that limited the Fund’s annual operating expenses to 0.90%.
Profitability
The Board reviewed the Adviser’s pro-forma financials with respect to the Fund’s operations and considered the Adviser’s profitability in terms of absolute dollars and as a percentage of revenue. The Board noted that for the fiscal year ended March 31, 2024, the Adviser reported a loss with respect to its management of the Fund. The Board agreed that the Adviser’s relationship to the Fund to date had not been profitable.
Economies of Scale
The Board considered whether the Adviser had achieved economies of scale with respect to its relationship to the Fund. The Trustees noted that the Fund’s AUM had grown by approximately 60% between March 31, 2023, and March 31, 2024, and that the Adviser did not foresee capacity limitations with respect to the Fund’s future growth. The Board acknowledged the Adviser’s claim that the Fund would experience economies of scale as it grew larger and the Adviser’s willingness to implement breakpoints in response. The Board agreed that it would continue to evaluate whether breakpoints should be implemented.
Conclusion
Having requested and received such information from the Adviser as the Board believed to be reasonably necessary to evaluate the terms of the advisory agreement and the Board concluded that the approval of the advisory agreement was in the best interests of the Fund and its shareholders.
23
Modern Capital Tactical Income Fund
Supplemental Information (Unaudited) (Continued)
As of September 30, 2024
5. Information about Trustees and Officers
The business and affairs of the Fund and the Trust are managed under the oversight of the Board of Trustees of the Trust. Information concerning the Trustees and officers of the Trust and Fund is set forth below. Generally, each Trustee and officer serves an indefinite term or until certain circumstances such as their resignation, death, or otherwise as specified in the Trust’s organizational documents. Any Trustee may be removed at a meeting of shareholders by a vote meeting the requirements of the Trust’s organizational documents. The Statement of Additional Information of the Fund includes additional information about the Trustees and officers and is available, without charge, upon request by calling the Fund toll-free at 800-711-9164. The address of each Trustee and officer, unless otherwise indicated below, is 1701 Meeting Street, Charleson, SC 29405.
Name, Address
and Year of Birth | Position(s)
held with
Fund or
Trust | Length of
Time Served | Principal Occupation(s)
During Past Five Years | Number of
Portfolios
in Fund
Complex
Overseen
by Trustee | Other
Directorships
held by Trustee
During the Past
Five Years |
Independent Trustees |
James Carlson (07/1981) | Independent Trustee | Since 2024 | Managing Member, Kinwell LLC (2017-Present) | 1 | None |
Margaret (Peggy) McCaffrey (03/1963) | Independent Trustee | Since 2021 | CPA/Partner, Cohen & Co. (1990-2021) | 1 | None |
Interested Trustees |
Bradley D. Atkins* (07/1974) | Chairman, Interested Trustee, and President | Since 2020 | Chief Executive Officer, Modern Capital, Inc. (2020-Present); Chief Executive Officer, Rethink LLC (a Retail Financial Services Firm) (2005-Present) | 1 | The Liberty Partners Group of Companies, Modern Capital, Inc. |
* | Basis of Interestedness: Mr. Atkins is an “interested person” of the Trust and the Adviser because of his role as Chief Executive Officer of Modern Capital Management Co., the adviser to the Fund. |
Name and
Date of Birth | | Position held with
Fund or Trust | | | Length of
Time Served | | | Principal Occupation During Past Five Years | |
Officers |
Kristof Wild Year of Birth: 1986 | Treasurer, Principal Accounting Officer, Principal Financial Officer and Secretary | Since 2023 | Chief Operating Officer, Modern Capital, Inc. (2021-Present); Head of Product, Modern Capital, Inc. (2020-2021); Partner, Berryl Swiss Family Advisory (2015-Present) |
Liam Clarke Year of Birth: 1996 | Chief Compliance Officer | Since 2023 | Director, Vigilant Compliance, LLC (2021-present); Financial Services Assurance Experienced Associate, PricewaterhouseCoopers LLP (2018-2021) |
6. Liquidity Risk Management Program
Rule 22e-4, or the “Liquidity Rule,” under the Investment Company Act of 1940 requires a mutual fund to adopt a liquidity risk management program (“Program” and disclose information about the operation and effectiveness of its Program in its reports to shareholders. Under the Program, each of the Fund’s portfolio investments are classified into one of four liquidity categories defined by the SEC: highly liquid, moderately liquid, less liquid, and illiquid. Liquidity classifications take into account a variety of market, trading, and investment factors, including the Fund’s reasonably anticipated trade size, and the Program Administrator has engaged a third-party vendor to assist with the classification of portfolio investments.
24
Modern Capital Tactical Income Fund
Is a series of
Modern Capital Funds Trust
For Shareholder Service Inquiries: | For Investment Advisor Inquiries: |
Gryphon 17, LLC 3000 Auburn Drive Suite 410 Beachwood, Ohio 44122 | Modern Capital Management Co. 825 Lowcountry Boulevard Mount Pleasant, South Carolina 29464 |
| | |
Telephone: | Telephone: |
800-711-9164 | 800-773-3863 |
| | |
World Wide Web @: | World Wide Web @: |
Gryphongroup.us | Moderncap.com |
Item 8. Changes in and Disagreements with Accountants for Open-End Management Investment Companies.
There is nothing to report for this item.
Item 9. Proxy Disclosures for Open-End Management Investment Companies.
There is nothing to report for this item.
Item 10. Remuneration Paid to Directors, Officers, and Others of Open-End Management Investment Companies.
Included as part of the report to shareholders filed under Item 7 of this Form.
Item 11. Statement Regarding Basis for Approval of Investment Advisory Contract.
Included as part of the report to shareholders filed under Item 7 of this Form.
Item 12. Disclosure of Proxy Voting Policies and Procedures for Closed-End Management Investment Companies.
Not applicable to open-end investment companies.
Item 13. Portfolio Managers of Closed-End Management Investment Companies.
Not applicable to open-end investment companies.
Item 14. Purchases of Equity Securities by Closed-End Management Investment Company and Affiliated Purchasers.
Not applicable to open-end investment companies.
Item 15. Submission of Matters to a Vote of Security Holders.
There have been no material changes to the procedures by which shareholders may recommend nominees to the registrant’s Board of Trustees.
Item 16. Controls and Procedures.
| (a) | Based on an evaluation of the Registrant’s disclosure controls and procedures as of a date within 90 days of filing date of this Form N-CSR, the principal executive officer and principal financial officer of the Registrant have concluded that the disclosure controls and procedures of the Registrant are reasonably designed to ensure that the information required in filings on Form N-CSR is recorded, processed, summarized, and reported by the filing date, including that information required to be disclosed is accumulated and communicated to the Registrant’s management, including the Registrant’s principal executive officer and principal financial officer, as appropriate to allow timely decisions regarding required disclosure. |
| (b) | There were no significant changes in the Registrant’s internal control over financial reporting that occurred during the period covered by this report that have materially affected, or are reasonably likely to materially affect, the Registrant’s internal control over financial reporting. |
Item 17. Disclosure of Securities Lending Activities for Closed-Ended Management Investment Companies.
Not applicable to open-end investment companies.
Item 18. Recovery of Erroneously Awarded Compensation.
None.
Item 19. Exhibits.
| (a) | (3) Not applicable for open-end investment companies. |
SIGNATURES
Pursuant to the requirements of the Securities Exchange Act of 1934 and the Investment Company Act of 1940, the registrant has duly caused this report to be signed on its behalf by the undersigned, thereunto duly authorized.
(Registrant) Modern Capital Funds Trust
By Bradley D. Atkins
President and Principal Executive Officer
Date: December 3, 2024
Pursuant to the requirements of the Securities Exchange Act of 1934 and the Investment Company Act of 1940, this report has been signed below by the following person on behalf of the registrant and in the capacities and on the date indicated.
By Bradley D. Atkins
President and Principal Executive Officer
Date: December 3, 2024
By Kristof Wild
Treasurer, Princiipal Accounting Officer, Principal Financial Officer and Secretary
Date: December 3, 2024