UNITED STATES
SECURITIES AND EXCHANGE COMMISSION
WASHINGTON, DC 20549
FORM 10-Q/A
(Amendment No. 1)
(Mark One)
| |
☒ | QUARTERLY REPORT PURSUANT TO SECTION 13 OR 15(d) OF THE SECURITIES EXCHANGE ACT OF 1934 |
For the quarterly period ended March 31, 2024
OR
| |
☐ | TRANSITION REPORT PURSUANT TO SECTION 13 OR 15(d) OF THE SECURITIES EXCHANGE ACT OF 1934 |
For the transition period from______ to______
Commission File Number: 001-39493
SPIRE GLOBAL, INC.
(Exact Name of Registrant as Specified in its Charter)
| |
Delaware | 85-1276957 |
(State or other jurisdiction of incorporation or organization) | (I.R.S. Employer
Identification No.) |
8000 Towers Crescent Drive Suite 1100 Vienna, Virginia 22182 |
(Address of principal executive offices) (Zip Code) |
(202) 301-5127
(Registrant’s telephone number, including area code)
Securities registered pursuant to Section 12(b) of the Act:
| | | | |
Title of each class | | Trading Symbol(s) | | Name of each exchange on which registered |
Class A common stock, par value of $0.0001 per share | | SPIR | | New York Stock Exchange |
Indicate by check mark whether the registrant (1) has filed all reports required to be filed by Section 13 or 15(d) of the Securities Exchange Act of 1934 during the preceding 12 months (or for such shorter period that the registrant was required to file such reports), and (2) has been subject to such filing requirements for the past 90 days. Yes ☐ No ☒
Indicate by check mark whether the registrant has submitted electronically every Interactive Data File required to be submitted pursuant to Rule 405 of Regulation S-T (§232.405 of this chapter) during the preceding 12 months (or for such shorter period that the registrant was required to submit such files). Yes ☐ No ☒
Indicate by check mark whether the registrant is a large accelerated filer, an accelerated filer, a non-accelerated filer, smaller reporting company, or an emerging growth company. See the definitions of “large accelerated filer,” “accelerated filer,” “smaller reporting company,” and “emerging growth company” in Rule 12b-2 of the Exchange Act.
| | | | | | |
Large accelerated filer |
| ☐ |
| Accelerated filer |
| ☐ |
| | | | | | |
Non-accelerated filer |
| ☒ |
| Smaller reporting company |
| ☒ |
Emerging growth company | | ☒ | | | | |
If an emerging growth company, indicate by check mark if the registrant has elected not to use the extended transition period for complying with any new or revised financial accounting standards provided pursuant to Section 13(a) of the Exchange Act. ☐
Indicate by check mark whether the registrant is a shell company (as defined in Rule 12b-2 of the Exchange Act). Yes ☐ No ☒
The registrant had outstanding 25,734,974 shares of Class A common stock and 1,507,325 shares of Class B common stock as of February 14, 2025.
Explanatory Note
Spire Global, Inc. ("we," "us," “Spire” or the “Company”) is filing this Amendment No. 1 on Form 10-Q/A (the "10-Q/A” or “Amendment No. 1”) to amend and restate certain items in the Quarterly Report on Form 10-Q/A for the three-month period ended March 31, 2024, originally filed with the Securities and Exchange Commission (the “SEC”) on May 15, 2024 (the “Original Form 10-Q”).
As previously disclosed in the Current Report on Form 8-K filed with the SEC on August 27, 2024, the Company is restating its previously issued unaudited condensed consolidated financial statements as of March 31, 2024, and for the quarterly periods ended March 31, 2024 and 2023. In addition, we filed an amendment to our Annual Report on Form 10-K for the fiscal year ended December 31, 2023, with the SEC on March 3, 2025 (such report, the “Amended 2023 Form 10-K/A” and, together with this Amendment No.1, the “Amended Reports”), to provide audited restated consolidated financial statements as of and for the fiscal years ended December 31, 2023, and December 31, 2022, as well as unaudited restated condensed consolidated financial information as of the quarter ends and for the interim periods in the fiscal years ended December 31, 2023 and 2022 (collectively, and including the three-month period ended, and as of, March 31, 2024, the “Affected Periods”). All material restatement information has been included in the Amended Reports, and the Company does not intend to separately amend other filings that it has previously filed with the SEC.
Accordingly, investors and other readers should rely only on the financial information and other disclosures regarding the Affected Periods in the Amended Reports and in any other future filings with the SEC (as applicable) and should not rely on any previously issued or filed reports, press releases, corporate presentations or similar communications relating to the Affected Periods.
Restatement Background
In August 2024, the Company began a comprehensive review of its accounting practices and procedures with respect to revenue recognition related to certain (i) contracts in its “Space as a Service” business (the “Space Services Contracts”) and (ii) contracts in its customer-funded or co-funded research and development arrangements (the “R&D Services Contracts”, and together with the Space Services Contracts, the “Space Services and R&D Services Contracts”).
The Company evaluated whether any of its Space Services Contracts contain embedded leases, and the Company concluded that only one Space Services Contract contains embedded leases of satellites to the customer. This contract was historically accounted for in the same manner as other Space Services Contracts for which revenue was recognized separately for project-based deliverables, and the costs to build and launch the satellites were historically capitalized as the Company's property and equipment. The Company assessed its embedded leases in accordance with Accounting Standards Codification (“ASC”) Topic 842. Since the construction work contemplated in the contract was controlled and fully paid by the customer during the construction period, the Company accounted for its role in construction in accordance with ASC Topic 606, and the Company determined that revenue for the contract with embedded leases should have been allocated to each performance obligation and recognized separately: over time for the design/build of satellites controlled by the customer, utilizing an input method based on a cost-to-cost measure of progress over the period from initial design to launch; at the point in time when the launch occurred for launch service; over time utilizing an output method based on the number of satellite months as the measure of progress for operating the satellite; and when (or as) the underlying future services are transferred, or when the options expire, for material rights. The costs to build the customer-controlled satellites should have been recognized as cost of revenue as incurred, and any prepaid fees for launch services should have been capitalized to other current assets and expensed when the launch occurs.
The Company determined that its historical accounting for Space Services Contracts that do not contain embedded leases, primarily revenue recognition for pre-space mission activities, was incorrect. It was determined that these Space Services Contracts have one performance obligation for the space services under the contract. The Company concluded that no revenue should have been recognized for pre-space mission activities and that revenue should instead be recognized over time, utilizing an output measure of progress based on satellite months, during the service period of the satellites. As part of the review, the Company also identified that in addition to space services, certain Space Services Contracts had an additional performance obligation for a customer’s material right to purchase additional satellites or services in the future at a discounted price, which resulted in the transaction price being allocated to the material rights in addition to the space service performance obligation. Revenue allocated to material rights is recognized over the period of service to which the material right relates or at the time the material right expires.
The Company issued a note receivable to the customer of one of its Space Services Contracts during the Affected Periods. The Company concluded during its reevaluation of its accounting practices that an allowance for current expected credit loss related to the notes receivable should have been recorded at the inception of the note receivable and reevaluated during each following accounting period.
For R&D Services Contracts, the Company determined that its previous revenue recognition practice did not accurately represent the pattern of control transfer for the related intellectual property under the contract. The Company concluded that the pattern of control transfer for the intellectual property occurs over time as the Company performs its research and development activities, and therefore its revenue recognition practice should be corrected to represent this pattern. The Company also concluded that the costs associated with the R&D Services Contracts were inappropriately included in research and development expense rather than in cost of revenue within the condensed consolidated statements of operations.
As a result of its comprehensive review, the Company determined that a restatement of its previously issued consolidated financial statements for the Affected Periods were required related to consideration of embedded leases for a Space Services Contract, recognition of an allowance for current expected credit loss related to a note receivable issued to a customer, revenue recognition for Space Services and R&D Services Contracts, and income statement classification of costs related to R&D Services Contracts.
The accounting errors detailed above caused misstatements to revenue, cost of revenue, research and development expense, other expense, income tax provision, accumulated other comprehensive loss, contract assets, contract liabilities, property and equipment, and allowance for current expected credit loss related to a note receivable issued to a customer on the Company’s condensed consolidated balance sheets, condensed consolidated statements of operations, condensed consolidated statements of comprehensive loss, condensed consolidated statements of changes in stockholders' equity and condensed consolidated statements of cash flows as of and for the Affected Periods.
Additionally, the Company also corrected previously identified immaterial errors. Refer to Note 2 of Notes to Condensed Consolidated Financial Statements of this Form 10-Q/A for additional information and for a summary of the accounting impact of these adjustments to the Company’s unaudited condensed consolidated financial statements, as well as certain other adjustments.
Internal Control Considerations
In connection with the restatement of the financial statements for the Affected Periods, the Company has concluded its disclosure controls and procedures as of March 31, 2024, remained ineffective due to the unremediated material weaknesses previously disclosed in Part I, Item 4 “Controls and Procedures” of the Original Form 10-Q, as well as the identification of an additional material weakness in internal control over financial reporting related to the errors described above. Please refer to Part I, Item 4 of this Form 10-Q/A.
Items Amended in this Filing
•This Amendment No.1 amends and restates the following items of the Original Form 10-Q:
•Part I, Item 1. "Unaudited Condensed Consolidated Financial Statements,"
•Part 1, Item 2. "Management's Discussion and Analysis of Financial Condition and Results of Operations,"
•Part I, Item 4. "Controls and Procedures,"
•Part II, Item 1. "Legal Proceedings,"
•Part II, Item 1A. "Risk Factors," and
•Part II, Item 6. Exhibits.
This Form 10-Q/A is presented as of the filing date of the Original Form 10-Q, does not reflect events occurring after that date, and does not modify or update disclosures in any way other than as required to reflect the restatement of the Affected Periods and liquidity and going concern related disclosures included in the financial statements and elsewhere in this Form 10-Q/A. This Form 10-Q/A sets forth the Original Form 10-Q in its entirety, as amended to reflect the restatement. Among other things, forward-looking statements made in the Original Form 10-Q have not been revised to reflect events that occurred or facts that became known to the Company after the filing of the Original Form 10-Q, and such forward-looking statements should be read in their historical context. Unless the context otherwise requires, references to our “Annual Report on Form 10-K” herein refer to the Amended 2023 Form 10-K/A.
In accordance with applicable SEC rules, this Form 10-Q/A includes an updated signature page and certifications of the Company’s Chief Executive Officer and Chief Financial Officer in Exhibits 31.1, 31.2 and 32.1 as required by Rule 12b-15.
Table of Contents
SPECIAL NOTE REGARDING FORWARD-LOOKING STATEMENTS
This Quarterly Report on Form 10-Q contains forward-looking statements within the meaning of the federal securities laws, which statements involve substantial risks and uncertainties. Forward-looking statements generally relate to future events or our future financial or operating performance. In some cases, you can identify forward-looking statements because they contain words such as “may,” “will,” “should,” “expect,” “plan,” “anticipate,” “could,” “would,” “intend,” “target,” “project,” “contemplate,” “believe,” “estimate,” “predict,” “potential,” “seek” or “continue” or the negative of these words or other similar terms or expressions that concern our expectations, strategy, plans or intentions. Forward-looking statements contained in this Quarterly Report on Form 10-Q include, but are not limited to, statements about:
•our ability to meet our financial covenants in the future;
•the sufficiency of our working capital in the future;
•changes in our growth, strategy, future operations, financial position, estimated revenues and losses, projected costs, prospects, and plans;
•our ability to remedy identified material weaknesses;
•the implementation, market acceptance, and success of our business model;
•the ability to develop new offerings, services, solutions and features and bring them to market in a timely manner and make enhancements to our business;
•the quality and effectiveness of and advancements in our technology and our ability to accurately and effectively use data and engage in predictive analytics;
•overall level of customer demand for our products and offerings;
•expectations and timing related to product launches;
•expectations of achieving and maintaining profitability;
•projections of total addressable markets, market opportunity, and market share;
•our ability to acquire data sets, software, equipment, satellite components, and regulatory approvals from third parties;
•our expectations concerning relationships with third parties;
•our ability to acquire or develop products or technologies we believe could complement or expand our platform or to expand our products and offerings internationally;
•our ability to obtain and protect patents, trademarks, licenses and other intellectual property rights;
•our ability to utilize potential net operating loss carryforwards;
•developments and projections relating to our competitors and industries, such as the projected growth in demand for space-based data;
•our ability to acquire new customers and partners or obtain renewals, upgrades, or expansions from our existing customers;
•our ability to compete with existing and new competitors in existing and new markets and offerings;
•our ability to retain or recruit officers, key employees or directors;
•the conversion or planned repayment of our debt obligations;
•our future capital requirements and sources and uses of cash;
•our ability to obtain funding for our operations;
•our business, expansion plans, and opportunities;
•our expectations regarding regulatory approvals and authorizations;
•the expectations regarding the effects of existing and developing laws and regulations, including with respect to regulations around satellites, intellectual property law, and privacy and data protection;
•global and domestic economic conditions, including currency exchange rate fluctuations, inflation, rising interest rates and geopolitical uncertainty and instability, and their impact on demand and pricing for our offerings in affected markets; and
•the impact of global health crises on global capital and financial markets, general economic conditions in the United States, and our business and operations.
We caution you that the foregoing list may not contain all of the forward-looking statements made in this Quarterly Report on Form 10-Q/A. You should not rely upon forward-looking statements as predictions of future events. We have based the forward-looking statements contained in this Quarterly Report on Form 10-Q primarily on our current expectations and projections about future events and trends that we believe may affect our business, financial condition, results of operations, and prospects. The outcome of the events described in these forward-looking statements is subject to risks, uncertainties, and other factors, including those described in Part I, Item 1A “Risk Factors” of our Annual Report on Form 10-K for the year ended December 31, 2023. Moreover, we operate in a very competitive and rapidly changing environment. New risks and uncertainties emerge from time to time and it is not possible for us to predict all risks and uncertainties that could have an impact on the forward-looking statements contained in this Quarterly Report on Form 10-Q. We cannot assure you that the results, events, and circumstances reflected in the forward-looking statements will be achieved or occur, and actual results, events, or circumstances could differ materially from those described in the forward-looking statements.
Neither we nor any other person assumes responsibility for the accuracy and completeness of any of these forward-looking statements. Moreover, the forward-looking statements made in this Quarterly Report on Form 10-Q relate only to expectations as of the date on which the statements are made. We undertake no obligation to update any forward-looking statements made in this Quarterly Report on Form 10-Q to reflect events or circumstances after the date of this Quarterly Report on Form 10-Q or to reflect new information or the occurrence of unanticipated events, except as required by law. We may not actually achieve the plans, intentions or expectations disclosed in our forward-looking statements and you should not place undue reliance on our forward-looking statements. Our forward-looking statements do not reflect the potential impact of any future acquisitions, mergers, dispositions, joint ventures or investments we may make.
In addition, statements that “we believe” and similar statements reflect our beliefs and opinions on the relevant subject. These statements are based upon information available to us as of the date of this Quarterly Report on Form 10-Q, and while we believe such information forms a reasonable basis for such statements, such information may be limited or incomplete, and our statements should not be read to indicate that we have conducted an exhaustive inquiry into, or review of, all potentially available relevant information. These statements are inherently uncertain and investors are cautioned not to rely upon these statements.
PART I—FINANCIAL INFORMATION
Item 1. Unaudited Condensed Consolidated Financial Statements
Spire Global, Inc.
Condensed Consolidated Balance Sheets
(In thousands, except share and per share amounts)
(Unaudited)
| | | | | | | | |
| | March 31, | | | December 31, | |
| | 2024 | | | 2023 | |
| | (As Restated) | | | | |
Assets | | | | | | |
Current assets | | | | | | |
Cash and cash equivalents | | $ | 51,731 | | | $ | 29,136 | |
Marketable securities | | | 12,003 | | | | 11,726 | |
Accounts receivable, net (including allowance of $271 and $586 as of
March 31, 2024 and December 31, 2023, respectively) | | | 12,346 | | | | 9,911 | |
Contract assets | | | 4,987 | | | | 4,718 | |
Other current assets | | | 9,125 | | | | 16,848 | |
Total current assets | | | 90,192 | | | | 72,339 | |
Property and equipment, net | | | 59,600 | | | | 60,446 | |
Operating lease right-of-use assets | | | 14,324 | | | | 14,921 | |
Goodwill | | | 50,051 | | | | 51,155 | |
Customer relationships | | | 18,467 | | | | 19,363 | |
Other intangible assets | | | 11,994 | | | | 12,660 | |
Other long-term assets, including restricted cash | | | 7,701 | | | | 8,380 | |
Total assets | | $ | 252,329 | | | $ | 239,264 | |
Liabilities and Stockholders’ Equity | | | | | | |
Current liabilities | | | | | | |
Accounts payable | | $ | 5,869 | | | $ | 8,012 | |
Accrued wages and benefits | | | 2,147 | | | | 1,829 | |
Contract liabilities, current portion | | | 22,230 | | | | 31,178 | |
Other accrued expenses | | | 11,125 | | | | 8,326 | |
Total current liabilities | | | 41,371 | | | | 49,345 | |
Long-term debt | | | 115,016 | | | | 114,113 | |
Contract liabilities, non-current | | | 19,259 | | | | 17,923 | |
Contingent earnout liability | | | 265 | | | | 220 | |
Deferred income tax liabilities | | | 795 | | | | 804 | |
Warrant liability | | | 10,672 | | | | 5,988 | |
Operating lease liabilities, net of current portion | | | 12,488 | | | | 13,079 | |
Other long-term liabilities | | | 8 | | | | 8 | |
Total liabilities | | | 199,874 | | | | 201,480 | |
Commitments and contingencies (Note 10) | | | | | | |
Stockholders’ equity | | | | | | |
Common stock, $0.0001 par value, 1,000,000,000 Class A and 15,000,000 Class
B shares authorized, 24,315,589 Class A and 1,507,325 Class B shares issued
and outstanding at March 31, 2024; 21,097,351 Class A and 1,507,325 Class B
shares issued and outstanding at December 31, 2023 | | | 3 | | | | 2 | |
Additional paid-in capital | | | 519,400 | | | | 477,624 | |
Accumulated other comprehensive loss | | | (6,118 | ) | | | (4,556 | ) |
Accumulated deficit | | | (460,830 | ) | | | (435,286 | ) |
Total stockholders’ equity | | | 52,455 | | | | 37,784 | |
Total liabilities and stockholders’ equity | | $ | 252,329 | | | $ | 239,264 | |
The accompanying notes are an integral part of these unaudited Condensed Consolidated Financial Statements.
Spire Global, Inc.
Condensed Consolidated Statements of Operations
(In thousands, except share and per share amounts)
(Unaudited)
| | | | | | | | |
| | Three Months Ended March 31, | |
| | 2024 | | | 2023 | |
| | (As Restated) | | | (As Restated) | |
Revenue | | $ | 34,825 | | | $ | 23,217 | |
Cost of revenue | | | 25,596 | | | | 13,369 | |
Gross profit | | | 9,229 | | | | 9,848 | |
Operating expenses: | | | | | | |
Research and development | | | 6,037 | | | | 7,318 | |
Sales and marketing | | | 5,118 | | | | 6,850 | |
General and administrative | | | 9,844 | | | | 11,823 | |
Loss on decommissioned satellites | | | 178 | | | | — | |
Allowance for current expected credit loss on notes receivable | | | 40 | | | | — | |
Total operating expenses | | | 21,217 | | | | 25,991 | |
Loss from operations | | | (11,988 | ) | | | (16,143 | ) |
Other income (expense): | | | | | | |
Interest income | | | 454 | | | | 565 | |
Interest expense | | | (5,053 | ) | | | (4,578 | ) |
Change in fair value of contingent earnout liability | | | (45 | ) | | | 76 | |
Change in fair value of warrant liabilities | | | (4,202 | ) | | | 746 | |
Issuance of stock warrants | | | (2,399 | ) | | | — | |
Foreign exchange (loss) gain | | | (1,786 | ) | | | 1,013 | |
Other expense, net | | | (534 | ) | | | (311 | ) |
Total other expense, net | | | (13,565 | ) | | | (2,489 | ) |
Loss before income taxes | | | (25,553 | ) | | | (18,632 | ) |
Income tax (benefit) provision | | | (9 | ) | | | 23 | |
Net loss | | $ | (25,544 | ) | | $ | (18,655 | ) |
Basic and diluted net loss per share(1) | | $ | (1.17 | ) | | $ | (1.03 | ) |
Weighted-average shares used in computing basic and diluted net loss per share(1) | | | 21,813,045 | | | | 18,096,363 | |
(1) The shares of the Company's common stock and the per share amounts for the three months ended March 31, 2023 have been retroactively adjusted to reflect the 1-for-8 reverse stock split (Note 1).
The accompanying notes are an integral part of these unaudited Condensed Consolidated Financial Statements.
Spire Global, Inc.
Condensed Consolidated Statements of Comprehensive Loss
(In thousands)
(Unaudited)
| | | | | | | | |
| | Three Months Ended March 31, | |
| | 2024 | | | 2023 | |
(In thousands) | | (As Restated) | | | (As Restated) | |
Net loss | | $ | (25,544 | ) | | $ | (18,655 | ) |
Other comprehensive (loss) gain: | | | | | | |
Foreign currency translation adjustments | | | (1,560 | ) | | | (1,614 | ) |
Net unrealized (loss) gain on investments
(net of tax) | | | (2 | ) | | | 44 | |
Comprehensive loss | | $ | (27,106 | ) | | $ | (20,225 | ) |
The accompanying notes are an integral part of these unaudited Condensed Consolidated Financial Statements.
Spire Global, Inc.
Condensed Consolidated Statements of Changes in Stockholders’ Equity
(In thousands, except share amounts)
(Unaudited)
| | | | | | | | | | | | | | | | | | | | | | | | | |
| | | Common Stock | | | Additional
Paid in | | | Accumulated
Other
Comprehensive | | | Accumulated | | | Total
Stockholders' | |
| | | Shares | | | Amount | | | Capital | | | Loss | | | Deficit | | | Equity | |
Balance, December 31, 2023 | | | | 22,604,676 | | | $ | 2 | | | $ | 477,624 | | | $ | (4,556 | ) | | $ | (435,286 | ) | | $ | 37,784 | |
Release of Restricted Stock Units
and Performance Stock Units | | | | 204,511 | | | | — | | | | — | | | | — | | | | — | | | | — | |
Exercise of stock options | | | | 37,536 | | | | — | | | | 267 | | | | — | | | | — | | | | 267 | |
Stock compensation expense | | | | — | | | | — | | | | 3,628 | | | | — | | | | — | | | | 3,628 | |
Issuance of common stock under
Securities Purchase Agreements | | | | 2,976,191 | | | | 1 | | | | 37,881 | | | | — | | | | — | | | | 37,882 | |
Net loss (As Restated) | | | | — | | | | — | | | | — | | | | — | | | | (25,544 | ) | | | (25,544 | ) |
Foreign currency translation
adjustments (As Restated) | | | | — | | | | — | | | | — | | | | (1,560 | ) | | | — | | | | (1,560 | ) |
Net unrealized loss on
investments (net of tax) | | | — | | | | — | | | | — | | | | (2 | ) | | | — | | | | (2 | ) |
Balance, March 31, 2024
(As Restated) | | | | 25,822,914 | | | $ | 3 | | | $ | 519,400 | | | $ | (6,118 | ) | | $ | (460,830 | ) | | $ | 52,455 | |
| | | | | | | | | | | | | | | | | | | |
| | | Common Stock | | | Additional
Paid in | | | Accumulated
Other
Comprehensive | | | Accumulated | | | Total
Stockholders' | |
| | | Shares(1) | | | Amount(1) | | | Capital(1) | | | Loss | | | Deficit | | | Equity | |
Balance, December 31, 2022 | | | | 19,467,183 | | | $ | 2 | | | $ | 455,765 | | | $ | (6,908 | ) | | $ | (357,728 | ) | | $ | 91,131 | |
Release of Restricted Stock Units | | | | 261,153 | | | | — | | | | — | | | | — | | | | — | | | | — | |
Stock compensation expense | | | | — | | | | — | | | | 2,646 | | | | — | | | | — | | | | 2,646 | |
Conversion of warrants to common stock | | | | 34,728 | | | | — | | | | 286 | | | | — | | | | — | | | | 286 | |
Net loss (As Restated) | | | | — | | | | — | | | | — | | | | — | | | | (18,655 | ) | | | (18,655 | ) |
Foreign currency translation
adjustments (As Restated) | | | | — | | | | — | | | | — | | | | (1,614 | ) | | | — | | | | (1,614 | ) |
Net unrealized gain on
investments (net of tax) | | | | — | | | | — | | | | — | | | | 44 | | | | — | | | | 44 | |
Balance, March 31, 2023
(As Restated) | | | | 19,763,064 | | | $ | 2 | | | $ | 458,697 | | | $ | (8,478 | ) | | $ | (376,383 | ) | | $ | 73,838 | |
(1) The shares of the Company's common stock have been retroactively adjusted to reflect the 1-for-8 reverse stock split (Note 1).
The accompanying notes are an integral part of these unaudited Condensed Consolidated Financial Statements.
Spire Global, Inc.
Condensed Consolidated Statements of Cash Flows
(In thousands)
(Unaudited)
| | | | | | | | |
| | Three Months Ended March 31, | |
| | 2024 | | | 2023 | |
| | (As Restated) | | | (As Restated) | |
Cash flows from operating activities | | | | | | |
Net loss | | $ | (25,544 | ) | | $ | (18,655 | ) |
Adjustments to reconcile net loss to net cash used in operating activities: | | | | | | |
Depreciation and amortization | | | 6,837 | | | | 3,916 | |
Stock-based compensation | | | 3,628 | | | | 2,646 | |
Amortization of operating lease right-of-use assets | | | 809 | | | | 224 | |
Amortization of debt issuance costs | | | 900 | | | | 554 | |
Change in fair value of warrant liabilities | | | 4,202 | | | | (746 | ) |
Change in fair value of contingent earnout liability | | | 45 | | | | (76 | ) |
Issuance of stock warrants | | | 2,399 | | | | — | |
Deferred income tax liabilities | | | — | | | | 6 | |
Loss on decommissioned satellites and impairment of assets | | | 432 | | | | — | |
Other, net | | | 228 | | | | (350 | ) |
Changes in operating assets and liabilities: | | | | | | |
Accounts receivable, net | | | (2,564 | ) | | | 97 | |
Contract assets | | | (642 | ) | | | (787 | ) |
Other current assets | | | 8,095 | | | | (688 | ) |
Other long-term assets | | | 516 | | | | 410 | |
Accounts payable | | | (1,508 | ) | | | (604 | ) |
Accrued wages and benefits | | | 343 | | | | 323 | |
Contract liabilities | | | (7,157 | ) | | | 2,154 | |
Other accrued expenses | | | 1,003 | | | | (920 | ) |
Operating lease liabilities | | | (872 | ) | | | (230 | ) |
Net cash used in operating activities | | | (8,850 | ) | | | (12,726 | ) |
Cash flows from investing activities | | | | | | |
Purchases of short-term investments | | | (10,920 | ) | | | (13,908 | ) |
Maturities of short-term investments | | | 10,800 | | | | 11,600 | |
Purchase of property and equipment | | | (7,059 | ) | | | (3,213 | ) |
Net cash used in investing activities | | | (7,179 | ) | | | (5,521 | ) |
Cash flows from financing activities | | | | | | |
Proceeds from Securities Purchase Agreements, net | | | 37,881 | | | | — | |
Proceeds from long-term debt | | | — | | | | 19,886 | |
Proceeds from exercise of stock options | | | 267 | | | | — | |
Net cash provided by financing activities | | | 38,148 | | | | 19,886 | |
Effect of foreign currency translation on cash, cash equivalents and restricted cash | | | 465 | | | | (1,846 | ) |
Net increase (decrease) in cash, cash equivalents and restricted cash | | | 22,584 | | | | (207 | ) |
Cash, cash equivalents and restricted cash | | | | | | |
Beginning balance | | | 29,633 | | | | 47,569 | |
Ending balance | | $ | 52,217 | | | $ | 47,362 | |
Supplemental disclosure of cash flow information | | | | | | |
Cash paid for interest | | $ | 3,983 | | | $ | 3,827 | |
Income taxes paid | | $ | 15 | | | $ | 451 | |
Noncash operating, investing and financing activities | | | | | | |
Property and equipment purchased but not yet paid | | $ | 2,135 | | | $ | 2,299 | |
Right-of-use assets obtained in exchange for lease liabilities | | $ | 353 | | | $ | 1,007 | |
Issuance of stock warrants with long-term debt (Note 8) | | $ | — | | | $ | 286 | |
The accompanying notes are an integral part of these unaudited Condensed Consolidated Financial Statements.
Spire Global, Inc.
Notes to Condensed Consolidated Financial Statements
(In thousands, except shares and per share data, unless otherwise noted)
(Unaudited)
Spire Global, Inc. (“Spire” or the “Company”), founded in August 2012, is a global provider of space-based data and analytics that offers its customers unique datasets and insights about earth from the ultimate vantage point. The Company collects this space-based data through its proprietary constellation of multi-purpose nanosatellites. The Company designs, manufacturers, integrates, and operates its own satellites and ground stations to deliver unique end-to-end comprehensive solutions. The Company offers the following three data solutions to customers: Maritime, Aviation and Weather. As a fourth solution, the Company is providing “space-as-a-service” through its Space Services solution.
The Company is headquartered in Vienna, Virginia and has several wholly owned operating subsidiaries in the United States, United Kingdom, Luxembourg, Singapore, Australia, Germany, and Canada.
On August 16, 2021, Spire Global Subsidiary, Inc. (formerly known as Spire Global, Inc.) (“Legacy Spire”) closed its previously announced merger with NavSight Holdings, Inc. (“NavSight”), a special purpose acquisition company. As a result, Legacy Spire continued as the surviving corporation and a wholly owned subsidiary of NavSight (the “Merger,” and such consummation, the “Closing”). NavSight then changed its name to Spire Global, Inc. and Legacy Spire changed its name to Spire Global Subsidiary, Inc.
On September 14, 2022, the Company entered into an Equity Distribution Agreement (the “Equity Distribution Agreement”) with Canaccord Genuity LLC, as sales agent (the “Agent”). In accordance with the terms of the Equity Distribution Agreement, the Company may offer and sell its Class A common stock, having an aggregate offering price of up to $85,000 from time to time through the Agent pursuant to a registration statement on Form S-3, which became effective on September 26, 2022. Under the Equity Distribution Agreement, the Company sold (i) 2,166,389 shares of its Class A common stock during the year ended December 31, 2023 for gross proceeds of $8,235 and (ii) no shares during the three months ended March 31, 2024.
On March 24, 2023, the Company, was notified by the New York Stock Exchange (“NYSE”) that the Company was not in compliance with Rule 802.01C of the NYSE’s Listed Company Manual (“Rule 802.01C”) relating to the minimum average closing price of the Company’s Class A common stock, par value of $0.0001 per share, required over a consecutive 30 trading-day period. On August 31, 2023, the Company effected a reverse stock split at a ratio of 1-for-8 (the “Reverse Stock Split”) of its common stock. In connection with the Reverse Stock Split, every eight shares of the Company’s Class A and Class B common stock issued and outstanding as of the effective date were automatically combined into one share of Class A or Class B common stock, as applicable. On September 25, 2023, the Company received formal notice from the NYSE that the Company had regained compliance with Rule 802.01C.
On February 4, 2024, the Company and Signal Ocean Ltd (“Signal Ocean”) entered into a securities purchase agreement (the “SPA”) for the issuance and sale of 833,333 shares of the Company’s Class A common stock to Signal Ocean at a price of $12.00 per share (the “Private Placement”). The Private Placement closed on February 8, 2024, resulting in gross proceeds to the Company of $10.0 million.
On March 21, 2024, the Company entered into a Securities Purchase Agreement (the “Purchase Agreement”) with institutional investors (the “Investors”), pursuant to which the Company issued and sold in a registered direct offering (the “Offering”), (i) an aggregate of 2,142,858 shares of Class A common stock and (ii) warrants exercisable for an aggregate of 2,142,858 shares of Class A common stock ("Securities Purchase Agreement Warrants") to the Investors. Each share of Class A common stock and accompanying Securities Purchase Agreement Warrant to purchase one share of Class A common stock was sold at an offering price of $14.00. The aggregate gross proceeds to the Company from the Offering totaled $30,000 before deducting the placement agent’s fees and related offering expenses. The Securities Purchase Agreement Warrants have an exercise price equal to $14.50 per share of Class A common stock, are exercisable for a term beginning on March 25, 2024 and will expire on July 3, 2024.
On March 21, 2024, the Company entered into a placement agency agreement (the “Placement Agency Agreement”) with Alliance Global Partners (“A.G.P” or the “Placement Agent”), pursuant to which the Company engaged A.G.P as the exclusive placement agent in connection with the Offering. The Company paid A.G.P a cash fee equal to 6% of the gross proceeds from the sale of shares and Securities Purchase Agreement Warrants to the Investors, or $1,800, in March 2024. The Company agreed
Spire Global, Inc.
Notes to Condensed Consolidated Financial Statements
(In thousands, except shares and per share data, unless otherwise noted)
(Unaudited)
to pay a cash fee equal to 4% of the gross exercise price paid in cash with respect to the exercise of the Securities Purchase Agreement Warrants.
The par value of the common stock remains $0.001 per share after the Reverse Stock Split. All share and per share information has been retroactively adjusted to reflect the impact of the Reverse Stock Split for applicable periods presented.
2.Restatement of Previously Issued Financial Statements
Description of Restatement Adjustments
In August 2024, the Company began a comprehensive review of its accounting practices and procedures with respect to revenue recognition related to certain (i) contracts in its “Space as a Service” business (the “Space Services Contracts”) and (ii) contracts in its customer-funded or co-funded research and development arrangements (the “R&D Services Contracts,” and together with the Space Services Contracts, the “Space Services and R&D Services Contracts”) under applicable accounting standards and guidance. As a result of its comprehensive review, the Company determined that a restatement of its previously issued consolidated financial statements for the Affected Periods were required related to consideration of embedded leases for a Space Services Contract, recognition of an allowance for current expected credit loss related to a note receivable issued to a customer, revenue recognition for Space Services and R&D Services Contracts, and income statement classification of costs related to R&D Services Contracts.
The Company previously accounted for Space Services Contracts by recognizing revenue separately for each project phase (e.g., development, manufacturing, launch and satellite operations). Because the Space Services Contracts involve bespoke satellites developed under customer requirements, the Company first evaluated whether any of the Space Services Contracts contain embedded leases. Based on this review, the Company concluded that one Space Services Contract contained embedded leases of satellites to the customer, but because the customer controls the satellites being constructed under this specific contract, it was a failed build-to-suit arrangement under Accounting Standards Codification (“ASC”) Topic 842, Leases, and therefore, should still be accounted for under ASC 606, Revenue from Contracts with Customers. The Company determined that the contract requires the transaction price to be allocated to the following performance obligations: design/build, launch, operation, and material rights for up to ten additional satellites. As a result, the Company corrected the financial statements for the Affected Periods to reflect the correct pattern of revenue recognition: over time for the design/build of satellites controlled by the customer, utilizing an input method based on a cost-to-cost measure of progress over the period from initial design to launch; at the point in time when the launch occurred for launch service; over time utilizing an output method based on the number of satellite months as the measure of progress for operating the satellite; and when (or as) the underlying future services are transferred, or when the options expire, for material rights. The Company also made the following correction to account for costs incurred for this contract: construction-related costs were expensed as incurred rather than capitalized as property and equipment, and the prepaid fees for launch services were capitalized as costs to fulfill the contract within other current assets on the condensed consolidated balance sheets, rather than capitalized as property and equipment. The capitalized prepaid launch costs will be recognized as expense upon the successful launch of the satellites.
In addition, under this contract, the customer provided a $4,500 promissory note to the Company to cover the launch costs. Historically, the Company had not recorded an allowance for current expected credit loss (“CECL”) on the promissory note balance. Management determined that the note receivable is subject to CECL guidance and recorded an allowance for current expected credit loss on the notes receivable balance outstanding as of March 31, 2024.
For the Space Services Contracts that do not contain an embedded lease, the Company concluded that, given the contractual clauses in Space Services Contracts by which each company retains its intellectual property, no control of intellectual property was transferred to the end customer during the pre-space period, and therefore, no performance obligation for the pre-space period exists. The Space Services Contracts were determined to generally only have one performance obligation for the overall space service. The transfer of control of the service to the customer starts when the satellite is in operation and the data service commences. As a result, the Company corrected the consolidated financial statements for the Affected Periods to remove revenue recognized during the pre-space period and recognize revenue over-time utilizing an output measure of progress based on satellite months during its intended service period. In addition to the one performance obligation for the space service, certain Space Services Contracts have additional performance obligations for customers’ material rights to purchase additional satellites
Spire Global, Inc.
Notes to Condensed Consolidated Financial Statements
(In thousands, except shares and per share data, unless otherwise noted)
(Unaudited)
or services in the future at a discounted price, which resulted in the transaction price being allocated to the material rights in addition to the space service performance obligation. Revenue allocated to material rights is recognized over the period of service to which the material right relates or at the time the material right expires. The Company concluded that no change was required to the accounting treatment for costs associated with these contracts as the Company's existing practice of capitalizing satellite costs within property and equipment, the capitalization of costs to obtain the contracts within other current assets, and the related recognition of expense over the expected life of the assets or term of the contracts were appropriate.
For the R&D Services Contracts, the Company determined that its previous revenue recognition practice of revenue recognition on completion of each contractual milestone did not accurately represent the pattern of control transfer for the related intellectual property under the contract. The Company concluded that the pattern of control transfer for the intellectual property occurs over time as the Company performs its research and development activities. Therefore, the Company determined that revenue related to customer-funded research and development arrangements should have been recognized by using an input method based on a cost-to-cost measure of progress over the period from initial design to launch, generally resulting in earlier revenue recognition, as the Company’s performance precedes the related milestone. All costs associated with the R&D Services Contracts were reclassified from research and development to cost of revenue within gross profit on the face of the consolidated statements of operations. In the past, these costs were classified as research and development within operating expenses. The costs for the Company’s internal research and development projects will remain as research and development expense within operating expenses.
As a result of the accounting errors detailed above, revenue, cost of revenue, research and development expense, other expense, income tax provision, accumulated other comprehensive loss, contract assets, contract liabilities, property and equipment, and allowance for current expected credit loss on notes receivable were determined to be incorrect on the Company’s unaudited condensed consolidated balance sheets, unaudited condensed consolidated statements of operations, unaudited condensed consolidated statements of comprehensive loss, unaudited condensed consolidated statements of stockholders' equity and unaudited condensed consolidated statements of cash flows as of March 31, 2024, and for the fiscal quarters ended March 31, 2024 and 2023. These restatements resulted in a reclassification between cash flows from operating activities and from investing activities, but they do not impact cash flows from financing activities or net increase in cash, cash equivalents and restricted cash in the unaudited condensed consolidated statements of cash flows for the fiscal quarters ended March 31, 2024 and 2023. The restatement only impacted net loss and accumulated other comprehensive loss in the unaudited condensed consolidated statements of stockholders’ equity for the fiscal quarters ended March 31, 2024 and 2023.
Other Adjustments
The Company historically incorrectly recorded advances made to vendors for property and equipment in other current assets before clearing it to property and equipment in the condensed consolidated balance sheets. As advances to vendors were included in other current assets, the cash flows associated with these payments were incorrectly reflected in operating activities in the condensed consolidated statements of cash flows. The Company determined that the advances made to vendors for property and equipment should be included in property and equipment. Therefore, advances to vendors were reclassified to property and equipment and the cash flows associated with the advances made were reclassified from operating activities to investing activities in the condensed consolidated statements of cash flows for the applicable Affected Periods.
The Company identified that the cash balances held in certain foreign subsidiaries' accounts were remeasured incorrectly. The incorrect remeasurement impacted (i) the cash balance on the condensed consolidated balance sheets as of March 31, 2024, and (ii) the foreign currency remeasurement loss on the condensed consolidated statements of operations for the three months ended March 31, 2024. The Company corrected the remeasurement of the affected cash balances in the Affected Periods.
The Company did not accrue expenses for Delaware franchise taxes in the proper periods on its consolidated balance sheets and the expenses for Delaware franchise taxes were classified as other expense, net on its consolidated statements of operations. As part of this restatement, the Company accrued for the Delaware franchise taxes in the appropriate periods and reclassified the amounts from other expense, net to general and administrative expenses.
The Company identified that certain state taxes that were originally classified as other expense, net are related to state minimums or franchise-like taxes, which are based on revenues. Therefore, those amounts were incorrectly classified as other
Spire Global, Inc.
Notes to Condensed Consolidated Financial Statements
(In thousands, except shares and per share data, unless otherwise noted)
(Unaudited)
expense, and should have been classified as general and administrative expense. As part of this restatement, the Company reclassified the amounts from other expense, net to general and administrative expenses.
The Company identified that a customer deposit was incorrectly classified as other accrued expenses instead of contract liability on its consolidated balance sheets. As part of this restatement, the Company reclassified the amount from other accrued expense to contract liabilities, non-current.
Unaudited Condensed Consolidated Financial Statements - Restatement Reconciliation Tables
The following tables reflect the impact of the restatement to the specific line items presented in the Company’s previously reported unaudited condensed consolidated financial statements as of March 31, 2024, and for the fiscal quarters ended March 31, 2024 and 2023.
The impact of the restatement to the unaudited condensed consolidated statements of changes in stockholders' equity includes increases of $32,971 and $20,063 in net loss for the three months ended March 31, 2024 and March 31, 2023, respectively, and decreases of $116 and $64 in accumulated other comprehensive loss for the three months ended March 31, 2024, and March 31, 2023, respectively.
The amounts in the "As Previously Reported" columns are amounts derived from the Company's previously filed unaudited condensed consolidated financial statements in the Original Form 10-Q. The amounts in the "Restatement Adjustments" columns present the impact of the following adjustments:
•The change in revenue recognition timing for Space Services Contracts,
•The change in revenue recognition timing for R&D Services Contracts,
•The reclassification of costs related to R&D Services Contracts from research and development expense to cost of revenue,
•The recognition of expense for satellite construction and launch services for the failed build-to-suit lease contract,
•The recognition of the allowance for current expected credit loss related to a note receivable issued to a customer,
•The impact to income tax provision as a result of the restatement adjustments above,
•The impact to foreign currency translation gain or loss as a result of the restatement adjustments above, and
•Other adjustments including balance sheet reclassification of fixed asset advances and customer deposits, statements of operations reclassification of department costs, a vendor dispute settlement, franchise taxes, other state taxes and cash remeasurement adjustments.
The amounts in the "As Restated" columns are the updated amounts including the impacts from the restatement. Financial statement line items and subtotals that were not impacted by the restatement adjustments have been omitted for enhanced clarity.
Spire Global, Inc.
Notes to Condensed Consolidated Financial Statements
(In thousands, except shares and per share data, unless otherwise noted)
(Unaudited)
| | | | | | | | | | | | | | |
| | | | As of March 31, 2024 | |
Unaudited Condensed Consolidated Balance Sheet | | Notes | | As Previously Reported | | | Restatement Adjustments | | | As Restated | |
Cash and cash equivalents | | (i) | | $ | 51,985 | | | $ | (254 | ) | | $ | 51,731 | |
Contract assets | | (ii) | | $ | 5,205 | | | $ | (218 | ) | | $ | 4,987 | |
Other current assets | | (iii) | | $ | 12,241 | | | $ | (3,116 | ) | | $ | 9,125 | |
Total current assets | | | | $ | 93,780 | | | $ | (3,588 | ) | | $ | 90,192 | |
Property and equipment, net | | (iv) | | $ | 71,853 | | | $ | (12,253 | ) | | $ | 59,600 | |
Other long-term assets, including restricted cash | | (v) | | $ | 7,503 | | | $ | 198 | | | $ | 7,701 | |
Total assets | | | | $ | 267,972 | | | $ | (15,643 | ) | | $ | 252,329 | |
Contract liabilities, current portion | | (vi) | | $ | 22,617 | | | $ | (387 | ) | | $ | 22,230 | |
Other accrued expenses | | (vii) | | $ | 11,309 | | | $ | (184 | ) | | $ | 11,125 | |
Total current liabilities | | | | $ | 41,942 | | | $ | (571 | ) | | $ | 41,371 | |
Contract liabilities, non-current | | (viii) | | $ | - | | | $ | 19,259 | | | $ | 19,259 | |
Deferred income tax liabilities | | (ix) | | $ | 1,058 | | | $ | (263 | ) | | $ | 795 | |
Other long-term liabilities | | (x) | | $ | 1,221 | | | $ | (1,213 | ) | | $ | 8 | |
Total liabilities | | | | $ | 182,662 | | | $ | 17,212 | | | $ | 199,874 | |
Accumulated other comprehensive loss | | (xi) | | $ | (6,234 | ) | | $ | 116 | | | $ | (6,118 | ) |
Accumulated deficit | | (xii) | | $ | (427,859 | ) | | $ | (32,971 | ) | | $ | (460,830 | ) |
Total stockholders’ equity | | | | $ | 85,310 | | | $ | (32,855 | ) | | $ | 52,455 | |
Total liabilities and stockholders’ equity | | | | $ | 267,972 | | | $ | (15,643 | ) | | $ | 252,329 | |
Description of restatement adjustments in the condensed consolidated balance sheets:
(i)The $254 decrease in cash and cash equivalents as of March 31, 2024, is related to the cash remeasurement adjustment for cash balances from certain foreign subsidiaries.
(ii)The $218 decrease in contract assets as of March 31, 2024, is related to adjustments to correct revenue recognition for Space Services and R&D Services Contracts.
(iii)The $3,116 decrease in other current assets as of March 31, 2024, resulted from a decrease of $1,858 related to advances for fixed assets that have been reclassified from other current assets to other property and equipment and a decrease of $1,258 related to the allowance for current expected credit loss related to the note receivable issued to a customer recorded in other current assets.
(iv)The $12,253 decrease in property and equipment as of March 31, 2024, resulted from a decrease of $14,111 related to costs for customer-controlled satellites for one specific contract being expensed as cost of revenue rather than capitalized into property and equipment, partially offset by $1,858 of advances for fixed assets that have been reclassified from other current assets to property and equipment instead of other current assets.
(v)The $198 increase in other long-term assets, including restricted cash as of March 31, 2024, is related to adjustments to long-term contract assets to correct revenue recognition for Space Services and R&D Services Contracts.
(vi)The $387 decrease in contract liabilities, current portion as of March 31, 2024 is related to the correction of revenue recognition for Space Services and R&D Services Contracts.
(vii)The $184 decrease in other accrued expenses as of March 31, 2024 resulted from a decrease of $182 related to a customer deposit balance reclassified from other accrued expense to contract liabilities, non-current, and a decrease of $52 from income tax provision change as a result of the revenue adjustments, partially offset by $50 Delaware franchise tax accrual.
(viii)The $19,259 increase in contract liabilities, non-current as of March 31, 2024 resulted from an increase of $17,864 related to the correction of revenue recognition for Space Services and R&D Services Contracts, an increase of $1,213 from the historical balance of contract liabilities, non-current that was included within other long-term liabilities but now presented in its own line and an increase of $182 from a customer deposit balance reclassified to contract liabilities, non-current.
(ix)The $263 decrease in deferred income tax liabilities as of March 31, 2024, is related to the impact to income tax provision as a result of the revenue adjustments.
(x)The $1,213 decrease in other long-term liabilities as of March 31, 2024 represents the contract liabilities, non-current balance that was historically included in other long-term liabilities but is now presented in its own line.
Spire Global, Inc.
Notes to Condensed Consolidated Financial Statements
(In thousands, except shares and per share data, unless otherwise noted)
(Unaudited)
(xi)The $116 decrease in accumulated other comprehensive loss as of March 31, 2024, is related to the misstatements’ impact on cumulative foreign currency translation loss.
(xii)The $32,971 increase in accumulated deficit as of March 31, 2024, is related to the cumulative adjustments made in the condensed consolidated statements of operations.
| | | | | | | | | | | | | | | | | | | | | | | | | | |
| | | | Three Months Ended March 31, 2024 | | | Three Months Ended March 31, 2023 | |
Unaudited Condensed Consolidated Statements of Operations | | Notes | | As Previously Reported | | | Restatement Adjustments | | | As Restated | | | As Previously Reported | | | Restatement Adjustments | | | As Restated | |
Revenue | | (i) | | $ | 25,688 | | | $ | 9,137 | | | $ | 34,825 | | | $ | 24,168 | | | $ | (951 | ) | | $ | 23,217 | |
Cost of revenue | | (ii) | | $ | 12,546 | | | $ | 13,050 | | | $ | 25,596 | | | $ | 10,360 | | | $ | 3,009 | | | $ | 13,369 | |
Gross profit | | | | $ | 13,142 | | | $ | (3,913 | ) | | $ | 9,229 | | | $ | 13,808 | | | $ | (3,960 | ) | | $ | 9,848 | |
Research and development | | (iii) | | $ | 9,909 | | | $ | (3,872 | ) | | $ | 6,037 | | | $ | 9,663 | | | $ | (2,345 | ) | | $ | 7,318 | |
General and administrative | | (iv) | | $ | 9,818 | | | $ | 26 | | | $ | 9,844 | | | $ | 11,770 | | | $ | 53 | | | $ | 11,823 | |
Allowance for current expected credit loss on notes receivable | | (v) | | $ | - | | | $ | 40 | | | $ | 40 | | | $ | - | | | $ | - | | | $ | - | |
Total operating expenses | | | | $ | 25,023 | | | $ | (3,806 | ) | | $ | 21,217 | | | $ | 28,283 | | | $ | (2,292 | ) | | $ | 25,991 | |
Loss from operations | | | | $ | (11,881 | ) | | $ | (107 | ) | | $ | (11,988 | ) | | $ | (14,475 | ) | | $ | (1,668 | ) | | $ | (16,143 | ) |
Foreign exchange (loss) gain | | (vi) | | $ | (1,538 | ) | | $ | (248 | ) | | $ | (1,786 | ) | | $ | 1,024 | | | $ | (11 | ) | | $ | 1,013 | |
Other (expense) income, net | | (vii) | | $ | (551 | ) | | $ | 17 | | | $ | (534 | ) | | $ | (762 | ) | | $ | 451 | | | $ | (311 | ) |
Total other income (expense), net | | | | $ | (13,334 | ) | | $ | (231 | ) | | $ | (13,565 | ) | | $ | (2,929 | ) | | $ | 440 | | | $ | (2,489 | ) |
Loss before income taxes | | | | $ | (25,215 | ) | | $ | (338 | ) | | $ | (25,553 | ) | | $ | (17,404 | ) | | $ | (1,228 | ) | | $ | (18,632 | ) |
Income tax (benefit) provision | | (viii) | | $ | 41 | | | $ | (50 | ) | | $ | (9 | ) | | $ | 269 | | | $ | (246 | ) | | $ | 23 | |
Net loss | | | | $ | (25,256 | ) | | $ | (288 | ) | | $ | (25,544 | ) | | $ | (17,673 | ) | | $ | (982 | ) | | $ | (18,655 | ) |
Basic and diluted net loss per share (1) | | | | $ | (1.16 | ) | | $ | (0.01 | ) | | $ | (1.17 | ) | | $ | (0.98 | ) | | $ | (0.05 | ) | | $ | (1.03 | ) |
Weighted-average shares used in computing basic and
diluted net loss per share (1) | | | | | 21,813,045 | | | | - | | | | 21,813,045 | | | | 18,096,363 | | | | - | | | | 18,096,363 | |
(1) The shares of the Company's common stock and the per share amounts for the three months ended March 31, 2023, have been retroactively adjusted to reflect the 1-for-8 reverse stock split (Note 1).
Description of restatement adjustments in the condensed consolidated statements of operations:
(i)The $9,137 increase and $951 decrease in revenue for the three months ended March 31, 2024 and March 31, 2023, respectively, are related to the correction of revenue recognition for Space Services and R&D Services Contracts.
(ii)Adjustments to cost of revenue:
a.The $13,050 increase in cost of revenue for the three months ended March 31, 2024, resulted from an increase of $9,178 in construction costs and launch costs for customer-controlled satellites for one specific contract being expensed to cost of revenue and an increase of $3,872 of costs associated with R&D Services Contracts being reclassified from research and development expense to cost of revenue.
b.The $3,009 increase in cost of revenue for the three months ended March 31, 2023 resulted from an increase of $2,345 of costs associated with R&D Services Contracts for one specific contract being reclassified from research and development expense to cost of revenue, an increase of $642 in construction costs and launch costs for customer-controlled satellites being expensed to cost of revenue, and an increase of $22 from the reclassification of supply chain department costs from general and administrative expense to cost of revenue.
(iii)The $3,872 and $2,345 decreases in research and development expense for the three months ended March 31, 2024 and March 31, 2023, respectively, are related to costs associated with R&D Services Contracts being reclassified from research and development expense to cost of revenue.
(iv)The $26 increase in general and administrative expenses for the three months ended March 31, 2024 resulted from an increase of $17 from the reclassification of other state taxes from other expense, net and an increase of $9 to adjust for the Delaware franchise tax accrual. The $53 increase in general and administrative expenses for the three months ended March 31, 2023, resulted from an increase of $450 from the reclassification of other state taxes from other expense, net,
Spire Global, Inc.
Notes to Condensed Consolidated Financial Statements
(In thousands, except shares and per share data, unless otherwise noted)
(Unaudited)
partially offset by a decrease of $377 to adjust for the Delaware franchise tax accrual and a decrease of $20 from the reclassification of supply chain department costs from general and administrative expense to cost of revenue.
(v)The $40 increase in allowance for current expected credit loss on notes receivable for the three months ended March 31, 2024 is related to the additional allowance for current expected credit loss related to a $4,500 note receivable issued to a customer.
(vi)The $248 and $11 changes in foreign exchange loss for the three months ended March 31, 2024 and March 31, 2023, respectively, are related to the cash remeasurement adjustment for cash balances from certain foreign subsidiaries.
(vii)The $17 and $451 changes in other (expense) income, net for the three months ended March 31, 2024 and March 31, 2023, respectively, are related to the other state taxes reclassified to general and administrative.
(viii)The $50 and $246 decreases in income tax provision for the three months ended March 31, 2024 and March 31, 2023, respectively, are related to the impact to income tax provision as a result of the revenue adjustments.
| | | | | | | | | | | | | | | | | | | | | | | | | | |
| | | | Three Months Ended March 31, 2024 | | | Three Months Ended March 31, 2023 | |
Unaudited Condensed Consolidated Statements of Comprehensive Loss | | Notes | | As Previously Reported | | | Restatement Adjustments | | | As Restated | | | As Previously Reported | | | Restatement Adjustments | | | As Restated | |
Net loss | | | | $ | (25,256 | ) | | $ | (288 | ) | | $ | (25,544 | ) | | $ | (17,673 | ) | | $ | (982 | ) | | $ | (18,655 | ) |
Foreign currency translation adjustments | | (i) | | $ | (1,747 | ) | | $ | 187 | | | $ | (1,560 | ) | | $ | (1,589 | ) | | $ | (25 | ) | | $ | (1,614 | ) |
Comprehensive loss | | | | $ | (27,005 | ) | | $ | (101 | ) | | $ | (27,106 | ) | | $ | (19,218 | ) | | $ | (1,007 | ) | | $ | (20,225 | ) |
Description of restatement adjustments in the condensed consolidated statements of comprehensive loss:
(i)The $187 foreign currency translation gain and $25 foreign currency translation loss for the three months ended March 31, 2024, and March 31, 2023, respectively, are related to the foreign currency translation impact of consolidated statements of operations adjustments (i) to (iv) above.
| | | | | | | | | | | | | | | | | | | | | | | | | | |
| | | | Three Months Ended March 31, 2024 | | | Three Months Ended March 31, 2023 | |
Unaudited Condensed Consolidated Statements of Cash Flows | | Notes | | As Previously Reported | | | Restatement Adjustments | | | As Restated | | | As Previously Reported | | | Restatement Adjustments | | | As Restated | |
Net loss | | | | $ | (25,256 | ) | | $ | (288 | ) | | $ | (25,544 | ) | | $ | (17,673 | ) | | $ | (982 | ) | | $ | (18,655 | ) |
Other, net | | (i) | | $ | (20 | ) | | $ | 248 | | | $ | 228 | | | $ | (110 | ) | | $ | (240 | ) | | $ | (350 | ) |
Change in contract assets | | (ii) | | $ | 624 | | | $ | (1,266 | ) | | $ | (642 | ) | | $ | (855 | ) | | $ | 68 | | | $ | (787 | ) |
Other current assets | | (iii) | | $ | 392 | | | $ | 7,703 | | | $ | 8,095 | | | $ | 117 | | | $ | (805 | ) | | $ | (688 | ) |
Change in contract liabilities | | (iv) | | $ | 775 | | | $ | (7,932 | ) | | $ | (7,157 | ) | | $ | 1,259 | | | $ | 895 | | | $ | 2,154 | |
Other accrued expenses | | (v) | | $ | 973 | | | $ | 30 | | | $ | 1,003 | | | $ | (548 | ) | | $ | (372 | ) | | $ | (920 | ) |
Net cash used in operating activities | | | | $ | (7,345 | ) | | $ | (1,505 | ) | | $ | (8,850 | ) | | $ | (11,290 | ) | | $ | (1,436 | ) | | $ | (12,726 | ) |
Purchase of property and equipment | | (vi) | | $ | (8,564 | ) | | $ | 1,505 | | | $ | (7,059 | ) | | $ | (4,649 | ) | | $ | 1,436 | | | $ | (3,213 | ) |
Net cash used in investing activities | | | | $ | (8,684 | ) | | $ | 1,505 | | | $ | (7,179 | ) | | $ | (6,957 | ) | | $ | 1,436 | | | $ | (5,521 | ) |
Effect of foreign currency translation on cash,
cash equivalents and restricted cash | | (vii) | | $ | 711 | | | $ | (246 | ) | | $ | 465 | | | $ | (1,846 | ) | | $ | - | | | $ | (1,846 | ) |
Cash, cash equivalents and restricted cash -
Beginning balance | | | | $ | 29,641 | | | $ | (8 | ) | | $ | 29,633 | | | $ | 47,569 | | | $ | - | | | $ | 47,569 | |
Cash, cash equivalents and restricted cash -
Ending balance | | | | $ | 52,471 | | | $ | (254 | ) | | $ | 52,217 | | | $ | 47,362 | | | $ | - | | | $ | 47,362 | |
Spire Global, Inc.
Notes to Condensed Consolidated Financial Statements
(In thousands, except shares and per share data, unless otherwise noted)
(Unaudited)
Description of restatement adjustments in the condensed consolidated statements of cash flows:
(i)The $248 and $240 adjustments to change in other, net for the three months ended March 31, 2024 and March 31, 2023, respectively, are related to the impact to income tax provision as a result of the revenue adjustment.
(ii)The $1,266 and $68 adjustments to change in contract assets for the three months ended March 31, 2024 and March 31, 2023, respectively, are related to the impact to current and non-current balances of contract assets from the correction of revenue recognition for Space Services and R&D Services Contracts.
(iii)The $7,703 additional decrease in other current assets for the three months ended March 31, 2024 resulted from expensing the $7,585 prepaid launch costs capitalized into other current assets in 2023, a $78 net change in advances for fixed assets balance that was reclassified to property and equipment, and an additional allowance for current expected credit loss of $40 recorded for the $4,500 note receivable. The $805 increase in other current assets for the three months ended March 31, 2023 related to the net change in advances for fixed assets balance that is reclassified to property and equipment.
(iv)The $7,932 adjustment to change in contract liabilities for the three months ended March 31, 2024 resulted from a $7,860 impact in contract liabilities from the correction of revenue recognition for Space Services and R&D Services Contracts and a $72 change in the customer deposit balance reclassified from other accrued expense to contract liabilities, non-current. The $895 adjustment to change in contract liabilities for the three months ended March 31, 2023 is related to the impact to current and non-current balances of contract liabilities from the correction of revenue recognition for Space Services and R&D Services Contracts.
(v)The $30 decrease in other accrued expense for the three months ended March 31, 2024 resulted from a decrease of $52 from the impact to income tax provision as a result of the revenue adjustment, partially offset by an increase of $72 for change in the customer deposit balance reclassified to contract liability and an increase of $10 to the Delaware franchise tax accrual. The $372 decrease in other accrued expense for the three months ended March 31, 2023 is related to the Delaware franchise tax accrual.
(vi)Adjustments to purchase of property and equipment:
a.The $1,505 decrease in purchase of property and equipment for the three months ended March 31, 2024 resulted from a decrease of $9,074 related to costs incurred to design/build the customer-controlled satellites for one specific contract being expensed rather than capitalized into the Company's property and equipment and a decrease of $16 related to the reclassification of advances for fixed assets, partially offset by an increase of $7,585 from prepaid launch costs for such satellites reclassified into other current assets.
b.The $1,436 decrease in purchase of property and equipment for the three months ended March 31, 2023 resulted from a decrease of $825 noncash addition to property and equipment from prior period advances that was incorrectly reflected as a cash purchase and a decrease of $611 related to costs incurred to design/build the customer-controlled satellites for one specific contract being expensed rather than capitalized into the Company's property and equipment.
(vii)The $8 and $254 decreases in cash and cash equivalents as of December 31, 2023 and March 31, 2024, respectively, are related to the cash remeasurement adjustment for cash balances from certain foreign subsidiaries, which resulted in a $246 change in effect of foreign currency translation on cash, cash equivalents and restricted cash for the three months ended March 31, 2024.
3.Summary of Significant Accounting Policies
Basis of Presentation
The condensed consolidated financial statements and accompanying notes are unaudited and have been prepared in accordance with accounting principles generally accepted in the United States of America (“GAAP”) and regulations of the U.S. Securities and Exchange Commission (the "SEC") for interim financial reporting.
Certain information and footnote disclosures normally included in consolidated financial statements prepared in accordance with GAAP have been condensed or omitted pursuant to rules and regulations applicable to interim financial reporting. The
Spire Global, Inc.
Notes to Condensed Consolidated Financial Statements
(In thousands, except shares and per share data, unless otherwise noted)
(Unaudited)
unaudited condensed consolidated financial statements were prepared on the same basis as the audited consolidated financial statements and, in the opinion of management, contain all adjustments, consisting of normal recurring adjustments necessary for a fair statement of its financial position, results of operations and cash flows for the periods indicated. These condensed consolidated financial statements should be read in conjunction with the consolidated financial statements included within the Company's Annual Report on Form 10-K for the year ended December 31, 2023.
The information as of December 31, 2023 included on the condensed consolidated balance sheets was derived from the Company’s audited consolidated financial statements. All intercompany accounts and transactions have been eliminated in consolidation.
Results of operations for the three months ended March 31, 2024, are not necessarily indicative of the results that may be expected for any other interim period or for the year ending December 31, 2024.
Reverse Stock Split
For the three months ended, and as of, March 31, 2023, reported share amounts, including issued and outstanding shares, per share amounts, and reported issued and outstanding warrants and other securities convertible into common stock in these condensed consolidated financial statements and accompanying notes have been retroactively adjusted for the Reverse Stock Split by applying the Reverse Stock Split ratio. The number of authorized shares of common stock was not impacted by the Reverse Stock Split, and therefore has not been retroactively adjusted.
Liquidity Risks and Uncertainties
The Company has a history of operating losses and negative cash flows from operations since inception. During the three months ended March 31, 2024, net loss was $25,544, cash used in operations was $8,850 and the Company received net proceeds of $9,825 from the Private Placement and $28,056 from the Offering. The Company held cash and cash equivalents of $51,731, excluding restricted cash of $486, and investment in short-term marketable securities of $12,003 as of March 31, 2024.
The Company’s ability to continue as a going concern for the next 12 months from the date of reissuance of these condensed consolidated financial statements is dependent upon its ability to obtain sufficient cash to meet its obligations, including the repayment of all amounts owed pursuant to the Blue Torch Financing Agreement (as amended, and as defined below in Note 7). The Company has failed to meet its leverage ratio and minimum liquidity financial covenants and SEC periodic filing requirement non-financial covenant under the Blue Torch Financing Agreement, and therefore Blue Torch Finance LLC (“Blue Torch”) has the right to accelerate and declare all or any portion of the loans outstanding under the Blue Torch Financing Agreement to be due and payable. Further, upon the filing of the Amended 2023 Form 10-K/A, the Company failed to comply with the non-financial covenant requiring the Company to have a report or opinion of its auditor without an explanatory paragraph expressing substantial doubt about its ability to continue as a going concern. Based on the Company’s current cash and cash equivalents and investment in marketable securities balances and expected future financial results, if the Transactions (as defined below) do not close, the Company will not have sufficient liquidity to continue operations for at least the next twelve months from the reissuance of these condensed consolidated financial statements. Furthermore, the Company will not have sufficient cash to repay the balance of the loans outstanding under the Blue Torch Financing Agreement in the event Blue Torch declares all or any portion of the loans to be due and payable.
The Company entered into a Share Purchase Agreement (the “Purchase Agreement”) with Kpler Holding SA, a Belgian corporation (“Buyer”), pursuant to which the Company agreed to sell its maritime business to Buyer and enter into certain ancillary agreements (the “Transactions”). The maritime business to be sold pursuant to the Transactions does not include any part of the Company’s satellite network or operations. The purchase price to be paid by Buyer to the Company at the closing of the Transactions is a cash payment based upon an enterprise value of $233,500, subject to certain adjustments. The Transactions also include a twelve-month transition service and data provision agreement for $7,500. The Purchase Agreement provides that the closing of the Transactions is subject to the satisfaction or waiver of certain closing conditions set forth in the Purchase Agreement.
On February 10, 2025, the Company filed a complaint in the Delaware Court of Chancery against Buyer seeking a grant of specific performance ordering Buyer to satisfy its obligations under the Purchase Agreement and consummate the closing in
Spire Global, Inc.
Notes to Condensed Consolidated Financial Statements
(In thousands, except shares and per share data, unless otherwise noted)
(Unaudited)
accordance with the terms of the Purchase Agreement. In the complaint, the Company also requested a declaratory judgment declaring that Buyer has breached its obligations under the Purchase Agreement and is not excused from performing its obligations under the Purchase Agreement, including proceeding with the closing.
Kpler removed the matter to the District of Delaware, pursuant to a contract term in the Purchase Agreement promising not to contest removal to that court. The District of Delaware initially selected a March 4 trial date, but on February 26, 2025, the court set a trial date of May 28-30, 2025. There is no assurance as to what action the District of Delaware will take with respect to the proceeding initiated by the Company and there is no assurance as to whether or not the Transactions will be consummated on the terms contemplated or at all. The amount of any damages which may be sought or obtained from Buyer cannot be determined at this time.
The Company intends to use the proceeds from the closing of the Transactions to repay all amounts owed under the Blue Torch Financing Agreement. However, as described above, there is currently no assurance that the Transactions will close or when the Transactions may close. Given the expected delay in the closing of the Transactions, the Company intends to seek additional equity or debt financing (including securities convertible or exchangeable for equity) and may seek waivers of or amendments to contractual obligations, delay, limit, reduce, or terminate certain commercial efforts, or pursue merger, disposition or other strategies, any of which could adversely affect its business, results of operations, and financial condition. There is no assurance that the Company will be successful in achieving any of the foregoing. Due to the Company’s projected cash needs, including amounts owed pursuant to the Blue Torch Financing Agreement and the Company’s breach of its covenants under the Blue Torch Financing Agreement, there is substantial doubt about its ability to continue as a going concern for a period of at least 12 months from the date of reissuance of these condensed consolidated financial statements. The condensed consolidated financial statements do not include any adjustments that might result from the outcome of this uncertainty.
Macroeconomic and Geopolitical
Over the past two years, the Company has been impacted by the macroeconomic environment, such as fluctuations in foreign currencies, increasing interest rates and geopolitical conflicts like the Russian invasion of Ukraine, Israel's war with Hamas and the increased tensions between China and the United States.
The U.S. Dollar exhibited a modest decrease in strength against the local functional currencies of our foreign subsidiaries for the three months ended March 31, 2024, as compared to the three months ended March 31, 2023. This had a marginal positive impact on our revenue, as about one-third of the Company's sales are conducted in foreign currencies. Conversely, it had a marginal unfavorable impact on our expenses, given that a majority of the Company's workforce resides in countries other than the United States.
The macroeconomic environment has caused existing or potential customers to re-evaluate their decision to purchase the Company's offerings, at times resulting in additional customer discounts, extended payment terms, longer sales cycles, and a few contract cancellations.
Increasing interest rates in the three months ended March 31, 2024, compared to the three months ended March 31, 2023, resulted in higher interest expenses, as the Company’s credit facility is based on a floating interest rate. The Russian invasion of Ukraine and the continued conflict created additional global sanctions, which at times caused scheduling shifts or launch cancellations by third-party satellite launch providers and negatively impacted the availability of launch windows and our constellation replenishment efforts.
If any of these factors continue or worsen, and/or if new macroeconomic or geopolitical issues arise, the Company's results and financial condition could be further negatively impacted. The Company cannot predict the timing, strength, or duration of any economic slowdown, downturn, instability, or recovery, generally or within any particular industry or geography. Any downturn of the general economy or industries in which the Company operates would adversely affect its business, financial condition, and results of operations.
Spire Global, Inc.
Notes to Condensed Consolidated Financial Statements
(In thousands, except shares and per share data, unless otherwise noted)
(Unaudited)
Use of Estimates
The preparation of financial statements in conformity with GAAP requires management to make estimates and assumptions that affect the reported amounts of assets and liabilities, and disclosures of contingent assets and liabilities at the dates of the condensed consolidated financial statements, and the reported amounts of revenues and expenses during the reporting period. Management’s significant estimates include assumptions for revenue recognition, which requires estimates of total costs used in measuring the progress of completion for the cost-based input method, allowance for current expected credit losses, valuation of certain assets and liabilities acquired from the acquisition of exactEarth in November 2021 (the “Acquisition”), realizability of deferred income tax assets, and fair value of equity awards, contingent earnout liabilities and warrant liabilities. Actual results could differ from those estimates.
Based on an evaluation of the lifespans of its in-service satellites and on current capabilities to extend the useful life of in-service satellites via software updates, the Company changed the estimated useful life of its capitalized satellites and related launch costs from three to four years for depreciation purposes. The Company determined it was appropriate to make this change beginning June 2023. The change in estimated useful life did not have a material impact for the three months ended March 31, 2024.
In November 2023, the Company updated the estimated useful lives for 43 capitalized satellites and related launch costs based on updated de-orbit dates. This change represents a change in accounting estimate and the impact of the change was an increase in loss from continuing operations before income taxes of approximately $3,009, or $0.14 per basic and diluted share for the three months ended March 31, 2024.
Cash, Cash Equivalents, Marketable Securities and Restricted Cash (As Restated)
The Company considers all highly liquid investments with an original maturity of three months or less to be cash equivalents. Restricted cash included in Other long-term assets, including restricted cash on the condensed consolidated balance sheets, represents amounts pledged as guarantees or collateral for financing arrangements and lease agreements, as contractually required.
The Company invests in highly rated securities, with the primary objective of minimizing the potential risk of principal loss. The Company’s investment policy generally requires securities to be investment grade and limits the amount of credit exposure to any one issuer. The Company’s investments in marketable debt securities have been classified and accounted for as available-for-sale. The Company classifies its marketable debt securities as either short-term or long-term based on each instrument’s underlying contractual maturity date. Unrealized gains and losses on marketable debt securities classified as available-for-sale are recognized in Accumulated other comprehensive loss. Interest on securities classified as available-for-sale is included in Interest income on the condensed consolidated statements of operations.
The following table shows components of cash, cash equivalents, and restricted cash reported on the condensed consolidated balance sheets and in the condensed consolidated statements of cash flows as of the dates indicated:
| | | | | | | | |
| | March 31, | | | December 31, | |
| | 2024 | | | 2023 | |
| | (As Restated) | | | | |
Cash and cash equivalents | | $ | 51,731 | | | $ | 29,136 | |
Restricted cash included in Other long-term assets | | | 486 | | | | 497 | |
| | $ | 52,217 | | | $ | 29,633 | |
Concentrations of Credit Risk (As Restated)
Financial instruments that potentially subject the Company to concentrations of credit risk consist of cash, cash equivalents and restricted cash, marketable securities, and accounts receivable. The Company typically has cash accounts in excess of Federal Deposit Insurance Corporation insurance coverage limits. The Company has not experienced any losses on such accounts, and management believes that the Company’s risk of loss is remote. The Company has a $4,500 note receivable due from a single
Spire Global, Inc.
Notes to Condensed Consolidated Financial Statements
(In thousands, except shares and per share data, unless otherwise noted)
(Unaudited)
customer. The Company has established a $1,258 allowance of current expected credit loss for this note receivable as of March 31, 2024.
The Company has a concentration of contractual revenue arrangements with various government agencies. Entities under common control are reported as a single customer. As of March 31, 2024, the Company had one customer (Customer A noted below) that accounted for 16% of the Company’s total accounts receivable. As of December 31, 2023, the Company did not have any customers that accounted for more than 10% of the Company’s total accounts receivable.
The following customers represented 10% or more of the Company’s total revenue for each of the following periods:
| | | | | | | | |
| | Three Months Ended March 31, | |
| | 2024 | | | 2023 | |
| | (As Restated) | | | (As Restated) | |
Customer A (1) | | | 17 | % | | | 31 | % |
Customer B | | | 28 | % | | * | |
* Revenue from this customer was less than 10% of total revenue during the period.
(1) Consists of multiple U.S. government agencies, of which one government agencies represented greater than 10% of total revenue for the three months ended March 31, 2023.
Related Parties (As Restated)
In conjunction with the Company's acquisition of exactEarth in November 2021, Myriota Pty Ltd ("Myriota"), an existing Spire customer, became a related party as a result of exactEarth's approximately 13% ownership of Myriota at the time of acquisition. As of March 31, 2024, the Company had 11.5% ownership of Myriota. As of March 31, 2024, and December 31, 2023, $1,876 and $2,216, respectively, of investment in Myriota were included in Other long-term assets, including restricted cash on the condensed consolidated balance sheets. The Company accounts for this investment using the equity method of accounting. The Company's share of earnings or losses on the investment is recorded on a one month lag, due to the timing of receiving financial statements from Myriota, as a component of other expense, net in the condensed consolidated statements of operations. The Company generated $217 and $225 in revenue from Myriota for the three months ended March 31, 2024 and 2023, respectively, and had $52 of accounts receivable from Myriota as of March 31, 2024, and had no accounts receivable from Myriota as of December 31, 2023.
Accounting Pronouncements Recently Adopted
In March 2023, the Financial Accounting Standards Board (“FASB”) issued Accounting Standards Update (“ASU”) 2023-01, Leases – Common Control Arrangements (Topic 842), to improve the accounting for amortizing leasehold improvements associated with arrangements between entities under common control. The amendment requires that leasehold improvements be amortized by the lessee over the useful life of the leasehold improvements to the common control group (regardless of the lease term) as long as the lessee controls the use of the underlying asset through a lease. Additionally, leasehold improvements should be accounted for as a transfer between entities under common control through an adjustment to equity when the lessee no longer controls the use of the underlying asset. The amendments in this update are effective for financial statements issued for annual periods beginning after December 15, 2023, with early adoption permitted. The adoption of ASU 2023-01 as of January 1, 2024, did not impact the Company’s condensed consolidated financial statements.
In August 2023, the FASB issued ASU 2023-05, Business Combinations – Joint Venture Formations (Subtopic 805-60): Recognition and Initial Measurement. The amendments in this ASU are intended to facilitate consistency in the application of accounting guidance upon the formation of entities qualifying as joint ventures ("JVs"). This ASU generally requires the use of business combinations accounting at the JV formation date, which would result in the contributed assets/liabilities being revalued to fair value and potentially result in the recognition of goodwill and other intangibles on the JV’s financial statements. However, this ASU does not alter the ongoing accounting for the JV’s operations. This guidance is effective for JVs with formation dates on or after January 1, 2025. The adoption of ASU 2023-05 as of January 1, 2024 did not impact the Company’s condensed consolidated financial statements.
Spire Global, Inc.
Notes to Condensed Consolidated Financial Statements
(In thousands, except shares and per share data, unless otherwise noted)
(Unaudited)
Accounting Pronouncements Not Yet Adopted
In November 2023, the FASB issued ASU 2023-07, Segment Reporting - Improvements to Reportable Segment Disclosures (Topic 280), to improve reportable segment disclosure requirements, primarily through enhanced disclosures about significant segment expenses. The amendments enhance interim disclosure requirements, clarify circumstances in which an entity can disclose multiple segment measures of profit or loss, provide new segment disclosure requirements for entities within a single reportable segment, and contain other disclosure requirements. The ASU is effective for fiscal years beginning after December 15, 2023, and interim periods within fiscal years beginning after December 15, 2024. Early adoption is permitted and will be applied retrospectively to all prior periods presented in the financial statements. The Company is currently evaluating the ASU to determine its impact on the Company’s disclosures.
In December 2023, the FASB issued ASU 2023-09, Income Taxes - Improvements to Income Tax Disclosures (Topic 740), to further enhance income tax disclosures to enable investors to better assess how an entity’s operations, related tax risks, tax planning, and operational opportunities affect its tax rate and prospects for future cash flows. The improvements primarily relate to the disaggregation of rate reconciliation categories and income taxes paid by jurisdiction. The other amendments improve the effectiveness and comparability of disclosures by adding disclosures of pretax income (or loss) and income tax expense (or benefit) to be consistent with SEC regulations. The ASU is effective for public business entities for annual reporting periods beginning after December 15, 2024. Early adoption is permitted and should be applied prospectively or retrospectively. The Company is currently evaluating the ASU to determine its impact on the Company’s disclosures.
In March 2024, the SEC adopted final rules under SEC Release No. 33-11275, The Enhancement and Standardization of Climate-Related Disclosures for Investors, which will require registrants to provide certain climate-related information in their annual reports and registration statements. The rules will require disclosure of material climate-related risks, how the board of directors and management oversee and manage such risks, and the actual and potential impact of such risks on the registrant. It will also require disclosure about material climate-related targets and goals, and the financial impact of severe weather events and other natural conditions in the notes to audited financial statements. The disclosures will be required at the earliest in reports for the year ended December 31, 2025 (or potentially later depending on the Company's filer status at the time). The Company is currently evaluating the impact on the Company's disclosures.
4.Revenue, Contract Assets, Contract Liabilities and Remaining Performance Obligations (As Restated)
Disaggregation of Revenue
Revenue from subscription-based contracts was $18,166, or 52% of total revenue, for the three months ended March 31, 2024, and was $19,600, or 84% of total revenue, for the three months ended March 31, 2023. Revenue from non-subscription-based contracts was $16,659, or 48% of total revenue, for the three months ended March 31, 2024, and was $3,616, or 16% of total revenue, for the three months ended March 31, 2023.
Spire Global, Inc.
Notes to Condensed Consolidated Financial Statements
(In thousands, except shares and per share data, unless otherwise noted)
(Unaudited)
The following revenue disaggregated by geography was recognized:
| | | | | | | | | | | | | | | | |
| | Three Months Ended March 31, 2024 | | | Three Months Ended March 31, 2023 | |
| | (As Restated) | | | (As Restated) | |
Americas (1) | | $ | 22,680 | | | | 65 | % | | $ | 11,680 | | | | 50 | % |
EMEA(2) | | | 9,959 | | | | 29 | % | | | 8,219 | | | | 35 | % |
Asia Pacific | | | 2,186 | | | | 6 | % | | | 3,318 | | | | 15 | % |
Total | | $ | 34,825 | | | | 100 | % | | $ | 23,217 | | | | 100 | % |
| | | | | | | | | | | | |
(1) U.S. represented 34% and 45% for the three months ended March 31, 2024 and 2023, respectively, and Canada represented 30% for the three months ended March 31, 2024.
(2) United Kingdom represented 13% for each of the three months ended March 31, 2023.
Contract Assets
As of March 31, 2024, contract assets were $5,185, of which $4,987 was reported in contract assets, and $198 in other long-term assets, including restricted cash on the Company's condensed consolidated balance sheets. As of December 31, 2023, contract assets were $4,917 which $4,718 was reported in contract assets, and $199 in other long-term assets, including restricted cash on the Company's condensed consolidated balance sheets.
Changes in contract assets for the three months ended March 31, 2024 and 2023 were as follows:
| | | | | | | | |
| | 2024 | | | 2023 | |
| | (As Restated) | | | (As Restated) | |
Balance as of January 1 | | $ | 4,917 | | | $ | 2,881 | |
Contract assets recorded during the period | | | 4,696 | | | | 3,548 | |
Reclassified to accounts receivable during the period | | | (4,399 | ) | | | (2,765 | ) |
Other | | | (29 | ) | | | 9 | |
Balance as of March 31 | | $ | 5,185 | | | $ | 3,673 | |
Contract Liabilities
As of March 31, 2024, contract liabilities were $41,489, of which $22,230 was reported in contract liabilities, current portion, and $19,259 was reported in other long-term liabilities on the Company’s condensed consolidated balance sheets. As of December 31, 2023, contract liabilities were $49,101, of which $31,178 was reported in contract liabilities, current portion, and $17,923 was reported in other long-term liabilities on the Company’s condensed consolidated balance sheets.
Changes in contract liabilities for the three months ended March 31, 2024 and 2023 were as follows:
| | | | | | | | |
| | 2024 | | | 2023 | |
| | (As Restated) | | | (As Restated) | |
Balance as of January 1 | | $ | 49,101 | | | $ | 34,873 | |
Contract liabilities recorded during the period | | | 13,004 | | | | 9,395 | |
Revenue recognized during the period | | | (20,317 | ) | | | (7,261 | ) |
Other | | | (299 | ) | | | 146 | |
Balance as of March 31 | | $ | 41,489 | | | $ | 37,153 | |
Remaining Performance Obligations
The Company has performance obligations associated with commitments in customer contracts for future services that have not yet been recognized as revenue. These commitments for future services exclude (i) contracts with an original term of one year or less, and (ii) cancellable contracts. As of March 31, 2024, the amount not yet recognized as revenue from these commitments was $203,833.
Spire Global, Inc.
Notes to Condensed Consolidated Financial Statements
(In thousands, except shares and per share data, unless otherwise noted)
(Unaudited)
The Company expects to recognize its remaining performance obligations as of March 31, 2024, over the following periods:
| | | | | | | | |
| | March 31, 2024 | |
| | (As Restated) | |
1 to 12 months | | $ | 72,239 | | | | 35 | % |
13 to 24 months | | | 34,200 | | | | 17 | % |
25 to 36 months | | | 27,321 | | | | 13 | % |
Remaining | | | 70,073 | | | | 34 | % |
Total | | $ | 203,833 | | | | 100 | % |
5.Balance Sheet Components (As Restated)
Other current assets consisted of the following:
| | | | | | | | |
| | March 31, | | | December 31, | |
| | 2024 | | | 2023 | |
| | (As Restated) | | | | |
Technology and other prepaid contracts | | $ | 2,536 | | | $ | 9,874 | |
Notes receivable | | | 3,344 | | | | 3,344 | |
Prepaid insurance | | | 956 | | | | 1,476 | |
Deferred contract costs | | | 541 | | | | 487 | |
Other receivables | | | 1,520 | | | | 1,238 | |
Other | | | 228 | | | | 429 | |
Other current assets | | $ | 9,125 | | | $ | 16,848 | |
Property and equipment, net consisted of the following:
| | | | | | | | |
| | March 31, | | | December 31, | |
| | 2024 | | | 2023 | |
| | (As Restated) | | | | |
Satellites in-service | | $ | 53,496 | | | $ | 59,751 | |
Internally developed software | | | 2,135 | | | | 2,138 | |
Ground stations in-service | | | 4,440 | | | | 4,444 | |
Leasehold improvements | | | 4,069 | | | | 5,800 | |
Machinery and equipment | | | 5,794 | | | | 4,787 | |
Computer equipment | | | 1,833 | | | | 1,908 | |
Computer software and website development | | | 99 | | | | 99 | |
Furniture and fixtures | | | 1,329 | | | | 1,336 | |
| | | 73,195 | | | | 80,263 | |
Less: Accumulated depreciation and amortization | | | (37,219 | ) | | | (36,326 | ) |
| | | 35,976 | | | | 43,937 | |
Satellite, launch and ground station work in progress | | | 21,628 | | | | 16,483 | |
Finished satellites not yet placed in-service | | | 1,996 | | | | 26 | |
Property and equipment, net | | $ | 59,600 | | | $ | 60,446 | |
Depreciation and amortization expense related to property and equipment was $5,957 and $3,037 for the three months ended March 31, 2024 and 2023, respectively.
The Company recorded a $178 loss on decommissioned satellites for the three months ended March 31, 2024. There were no satellites decommissioned or impaired in the three months ended March 31, 2023.
Spire Global, Inc.
Notes to Condensed Consolidated Financial Statements
(In thousands, except shares and per share data, unless otherwise noted)
(Unaudited)
Other accrued expenses consisted of the following:
| | | | | | | | |
| | March 31, | | | December 31, | |
| | 2024 | | | 2023 | |
| | (As Restated) | | | | |
Operating lease liabilities, current | | $ | 3,425 | | | $ | 3,506 | |
Warrant liability, current | | | 1,917 | | | | — | |
Professional services | | | 1,359 | | | | 913 | |
Third-party operating costs | | | 683 | | | | 1,088 | |
Corporate and sales tax | | | 545 | | | | 285 | |
Accrued interest | | | 911 | | | | 853 | |
Software | | | 571 | | | | 754 | |
Other | | | 1,714 | | | | 927 | |
Other accrued expenses | | $ | 11,125 | | | $ | 8,326 | |
6.Goodwill and Intangible Assets
The following table summarizes changes in goodwill balance:
| | | | |
Balance at December 31, 2023 | | $ | 51,155 | |
Impact of foreign currency translation | | | (1,104 | ) |
Balance at March 31, 2024 | | $ | 50,051 | |
Intangible assets consisted of the following:
| | | | | | | | |
| | March 31, 2024 | |
| | Gross Carrying Amount | | | Accumulated Amortization | |
Customer relationships | | $ | 22,921 | | | $ | (4,454 | ) |
Developed technology | | | 13,026 | | | | (2,533 | ) |
Trade names | | | 2,208 | | | | (1,030 | ) |
Backlog | | | 3,050 | | | | (3,050 | ) |
Patents | | | 419 | | | | (319 | ) |
FCC licenses | | | 480 | | | | (257 | ) |
| | $ | 42,104 | | | $ | (11,643 | ) |
| | | | | | |
| | December 31, 2023 | |
| | Gross Carrying Amount | | | Accumulated Amortization | |
Customer relationships | | $ | 23,427 | | | $ | (4,064 | ) |
Developed technology | | | 13,313 | | | | (2,312 | ) |
Trade names | | | 2,257 | | | | (940 | ) |
Backlog | | | 3,117 | | | | (3,117 | ) |
Patents | | | 419 | | | | (308 | ) |
FCC licenses | | | 480 | | | | (249 | ) |
| | $ | 43,013 | | | $ | (10,990 | ) |
As of March 31, 2024, the weighted-average amortization period for customer relationships and developed technology was 9.7 years, for trade names was 2.7 years, and for patents and FCC licenses was 6.1 years. Amortization expense related to intangible assets was $880 and $878 for the three months ended March 31, 2024 and 2023, respectively.
No impairment charges were recognized for the three months ended March 31, 2024 and 2023. The patents asset balance included $35 and $57 of capitalized patent costs that will begin amortization upon the issuance of an official patent right to the Company as of March 31, 2024 and December 31, 2023, respectively.
Spire Global, Inc.
Notes to Condensed Consolidated Financial Statements
(In thousands, except shares and per share data, unless otherwise noted)
(Unaudited)
As of March 31, 2024, the expected future amortization expense of intangible assets is as follows:
| | | | |
Years ending December 31, | | | |
Remainder of 2024 | | $ | 2,625 | |
2025 | | | 3,491 | |
2026 | | | 3,446 | |
2027 | | | 3,034 | |
2028 | | | 3,030 | |
Thereafter | | | 14,800 | |
| | | 30,426 | |
Capitalized patent costs, unissued | | | 35 | |
| | $ | 30,461 | |
Long-term debt consisted of the following:
| | | | | | | | |
| | March 31, | | | December 31, | |
| | 2024 | | | 2023 | |
Blue Torch term loan | | $ | 118,109 | | | $ | 117,996 | |
Other | | | 5,017 | | | | 5,128 | |
Total long-term debt | | | 123,126 | | | | 123,124 | |
Less: Debt issuance costs | | | (8,110 | ) | | | (9,011 | ) |
Non-current portion of long-term debt | | $ | 115,016 | | | $ | 114,113 | |
The Company recorded interest expense including amortization of deferred issuance costs from long-term debt of $5,053 and $4,562 for the three months ended March 31, 2024 and 2023, respectively.
As of March 31, 2024, the scheduled principal payments of long-term debt was as follows:
| | | | |
Years ending December 31, | | | |
Remainder of 2024 | | $ | — | |
2025 | | | — | |
2026 | | | 118,387 | |
2027 | | | 335 | |
2028 | | | 335 | |
Thereafter | | | 4,069 | |
Total debt payments | | $ | 123,126 | |
Blue Torch Credit Agreement
On June 13, 2022, the Company, as borrower, and Spire Global Subsidiary, Inc. and Austin Satellite Design, LLC, as guarantors, entered into a financing agreement (the “Blue Torch Financing Agreement”) with Blue Torch Finance LLC, a Delaware limited liability company (“Blue Torch”), as administrative agent and collateral agent, and certain lenders (the “Lenders”). The Blue Torch Financing Agreement provides for, among other things, a term loan facility in an aggregate principal amount of up to $120,000 (the “Blue Torch Credit Facility”). A portion of the proceeds of the term loan was used to repay the Company’s then-existing $70,000 credit facility with FP Credit Partners, L.P., and the remainder of the proceeds of the term loan may be used for general corporate purposes.
The Blue Torch Credit Facility is scheduled to mature on June 13, 2026. Subject to certain exceptions, prepayments of principal under the Blue Torch Credit Facility will be subject to early termination fees in the amount of 3.0%, 2.0%, and 1.0% of the principal prepaid if prepayment occurs within the first, second, and third years following the closing date, respectively, plus if prepayment would have occurred on or prior to the first anniversary of the closing date, a make-whole amount equal to the amount of interest that would have otherwise been payable through the maturity date of the Blue Torch Credit Facility.
The $120,000 term loan was available and drawn at closing, of which $19,735 was placed in an escrow account by Blue Torch with such amount to be released upon the Company achieving certain metrics related to annualized recurring revenue and a total
Spire Global, Inc.
Notes to Condensed Consolidated Financial Statements
(In thousands, except shares and per share data, unless otherwise noted)
(Unaudited)
annualized recurring revenue leverage ratio. These metrics were achieved and the $19,735 was released from the escrow account and delivered to the Company in February 2023. The term loan accrues interest at a floating rate, to be based, at the Company's election, on either a reference rate or a 3-month Term Secured Overnight Financing Rate ("SOFR") (subject to a 1.0% floor), plus an interest rate margin of 7.0% for reference rate borrowings and 8.0% for 3-month Term SOFR borrowings, plus an incremental Term SOFR margin of 0.26161%. The Company elected the Term SOFR rate which was 13.5766% as of March 31, 2024. Principal on the term loan is only payable at maturity and interest on the term loan is due and payable quarterly for Term SOFR borrowings. The Company is also required to pay other customary fees and costs in connection with the Blue Torch Credit Facility, including a commitment fee in an amount equal to $2,400 on the closing date, a $250 annual agency fee and an exit fee of $1,800 upon termination of the Blue Torch Financing Agreement.
The Blue Torch Financing Agreement contains customary affirmative covenants and customary negative covenants limiting the Company's ability and the ability of its subsidiaries to, among other things, dispose of assets, undergo a change in control, merge or consolidate, make acquisitions, incur debt, incur liens, pay dividends, repurchase stock and make investments, in each case subject to certain exceptions. The Company must also comply with a maximum debt to annualized recurring revenue leverage ratio financial covenant tested monthly during the first two years of the Blue Torch Financing Agreement, a maximum debt to EBITDA leverage ratio financial covenant tested monthly during the third and fourth years of the Blue Torch Financing Agreement and a minimum liquidity financial covenant tested at all times.
On September 27, 2023, the Company entered into the Waiver and Amendment No. 2 to Financing Agreement (the “Waiver and Amendment”) with Blue Torch and the Lenders, which amends the Blue Torch Financing Agreement to (a) waive an event of default under the Blue Torch Financing Agreement arising out of the total annualized recurring revenue leverage ratio being greater than the permitted ratio, (b) amend the financial covenants to provide covenant relief from the maximum debt to annualized recurring revenue leverage ratio and the maximum debt to EBITDA leverage ratio set forth in the Blue Torch Financing Agreement for future periods, and (c) provide for a second amendment exit fee. The second amendment exit fee is $1,800 (which is an amount equal to one and a half percent (1.50%) of the aggregate outstanding principal balance of the term loans on the effective date of the Waiver and Amendment), bears interest from the date of the Waiver and Amendment at the Adjusted Term SOFR for a 3-month interest period plus the applicable margin under the Financing Agreement, and is payable by the Company in cash upon the termination of the Blue Torch Financing Agreement, either as a result of acceleration of the loans or at the final maturity date. The Waiver and Amendment required a repayment by the Company of $2,500 of the outstanding principal balance of the term loans and a prepayment premium of $50, which were paid on October 2, 2023. The Waiver and Amendment also requires additional reporting if the Company’s liquidity level is less than $35,000 at any time during a month and revises the minimum liquidity covenant to require liquidity of at least $30,000 at all times, commencing on September 30, 2023, which in both cases represent a $5,000 incremental change from the original requirements. The Company was in compliance with all applicable financial covenants as of March 31, 2024.
On June 13, 2022, in connection with the Blue Torch Financing Agreement, the Company issued warrants to Blue Torch, which were exercisable for an aggregate of 437,024 shares of the Company’s Class A common stock with a per share exercise price of $16.08 (the “2022 Blue Torch Warrants”). In addition, in connection with the closing of the financing, the Company paid Urgent Capital LLC, a Delaware limited liability company, a fee for introducing the Company to the Lenders, for the purpose of loan financing, in the amount equal to $600 in cash and a warrant to purchase 24,834 fully paid and non-assessable shares of the Company's Class A common stock with a per share exercise price of $16.88 (the “Urgent Warrants”).
On September 27, 2023, in connection with the Waiver and Amendment, the Company and certain affiliates of Blue Torch amended and restated the 2022 Blue Torch Warrants to reduce the per share exercise price from $16.08 to $5.44. The Company also concurrently issued new warrants to certain Blue Torch affiliates that are exercisable for an additional 597,082 shares of the Company’s Class A common stock at a per share exercise price of $5.44 (the “2023 Blue Torch Warrants" and together with the 2022 Blue Torch Warrants and the Urgent Warrants, the “Credit Agreement Warrants”).
The Company evaluated the Credit Agreement Warrants and concluded that they do not meet the criteria to be classified within stockholders’ equity. The agreements governing the Credit Agreement Warrants include a provision that could result in a different settlement value for the Credit Agreement Warrants depending on their holder. Because the holder of an instrument is not an input into the pricing of a fixed-for-fixed option on the Company’s Class A common stock, the Credit Agreement Warrants are not considered to be indexed to the Company’s Class A common stock.
Spire Global, Inc.
Notes to Condensed Consolidated Financial Statements
(In thousands, except shares and per share data, unless otherwise noted)
(Unaudited)
As the Credit Agreement Warrants meet the definition of a derivative, the Company recorded these warrants as liabilities on the condensed consolidated balance sheets at fair value (Note 9) based on the Black-Scholes model as of June 13, 2022 and September 27, 2023 with inputs that include the Company’s Class A common stock price in an actively traded market, making this fair value classified as a Level 2 financial instrument. The other significant assumptions used in the model are the exercise price, expected term, volatility, interest rate, and dividend yield. Subsequent changes in their respective fair values are recognized in the condensed consolidated statements of operations at each reporting date. Changes in the fair value of the warrant liabilities will continue to be recognized until the warrants are exercised, expire, or qualify for equity classification.
The Credit Agreement Warrants may be exercised on a cashless basis. The Credit Agreement Warrants are exercisable for a term beginning on the date of issuance and ending on the earlier to occur of ten years from the date of issuance or the consummation of certain of the Company's acquisitions as set forth in the Credit Agreement Warrants. The number of shares for which the Credit Agreement Warrants are exercisable and the associated exercise price are subject to certain proportional adjustments as set forth in the Credit Agreement Warrants.
On April 8, 2024, the Company entered into Amendment No. 3 to Financing Agreement (the “Third Amendment”) with Blue Torch and the Lenders, which amends the Blue Torch Financing Agreement to (i) increase the maximum debt to EBITDA leverage ratio for the monthly periods ending June 30, 2024, July 31, 2024, and August 31, 2024, and to decrease the maximum permitted ratio thereafter, and (ii) amend the minimum liquidity covenant to require liquidity of at least $20,000 at all times, commencing on April 8, 2024, which represents a $10,000 decrease from the requirement in effect immediately prior to the effective date of the Third Amendment. On April 8, 2024, in accordance with the terms of the Third Amendment, the Company made a prepayment to Blue Torch of $10,000 in principal, plus an early termination fee of $200.
Government Loan
In November 2021, the Company completed the Acquisition and assumed an interest free loan agreement with the Strategic Innovation Fund ("SIF") which was recorded at an amount equal to the proceeds received. Under this agreement and subsequent amendment, the Company was eligible to receive funding for certain expenditures incurred from February 13, 2018, to May 12, 2023, up to a maximum of $5,701. The SIF loan agreement of $5,017 and $5,128 was included in long-term debt, non-current on the condensed consolidated balance sheets as of March 31, 2024, and December 31, 2023. Any amount outstanding under this loan is repayable in 15 annual payments beginning February 28, 2026, and has a stated interest rate of zero.
Lease expenses were $1,157 and $930 for the three months ended March 31, 2024 and 2023, respectively. Aggregate variable lease expenses and short-term lease expenses were $239 and $120 for the three months ended March 31, 2024 and 2023, respectively.
The following table provides the required information regarding the Company's leases for which the Company is the lessee:
| | | | | | | | |
| | March 31, | | | December 31, | |
| | 2024 | | | 2023 | |
Assets | | | | | | |
ROU assets | | $ | 14,324 | | | $ | 14,921 | |
Total ROU assets | | $ | 14,324 | | | $ | 14,921 | |
Liabilities | | | | | | |
Current | | $ | 3,425 | | | $ | 3,506 | |
Non-current | | | 12,488 | | | | 13,079 | |
Total lease liabilities | | $ | 15,913 | | | $ | 16,585 | |
Weighted-average remaining lease term (years) | | | 5.2 | | | | 5.4 | |
Weighted-average discount rate | | | 8 | % | | | 8 | % |
Approximately 77% of the Company's right-of-use (“ROU”) assets and lease liabilities relate to office facilities leases, with the remaining amounts representing primarily ground station leases.
Spire Global, Inc.
Notes to Condensed Consolidated Financial Statements
(In thousands, except shares and per share data, unless otherwise noted)
(Unaudited)
As of March 31, 2024, the maturity of operating lease liabilities are as follows:
| | | | |
Years ending December 31, | | | |
Remainder of 2024 | | $ | 3,485 | |
2025 | | | 4,229 | |
2026 | | | 3,820 | |
2027 | | | 2,756 | |
2028 | | | 1,850 | |
Thereafter | | | 3,538 | |
Total lease payments | | | 19,678 | |
Less: Interest on lease payments | | | (3,765 | ) |
Present value of lease liabilities | | $ | 15,913 | |
Operating cash flows paid were $872 and $230 included in the measurement of operating lease liabilities for the three months ended March 31, 2024 and 2023, respectively, and were included in net cash used in operating activities in the condensed consolidated statements of cash flows. Amortization of ROU assets were $809 and $224 for the three months ended March 31, 2024 and 2023, respectively.
9.Fair Value Measurement (As Restated)
The Company follows the guidance in Accounting Standards Codification (“ASC”) 820, “Fair Value Measurement” for its liabilities that are re-measured and reported at fair value at the end of each reporting period.
The fair value of the Company’s common stock warrant liabilities reflects management’s estimate of amounts that the Company would have received in connection with the sale of the assets or paid in connection with the transfer of the liabilities in an orderly transaction between market participants at the measurement date. The following fair value hierarchy is used to classify assets and liabilities based on the observable inputs and unobservable inputs used in order to value the assets and liabilities:
| |
Level 1: | Quoted prices in active markets for identical assets or liabilities. |
Level 2: | Significant other observable inputs other than quoted prices included in Level 1, such as quoted prices for similar assets and liabilities in active markets, quoted prices for identical or similar assets and liabilities in markets that are not active, or other inputs that are observable or can be corroborated by observable market data. |
Level 3: | Unobservable inputs reflecting management’s assumptions, consistent with reasonably available assumptions made by other market participants. These valuations require significant judgment. |
The Company classifies financial instruments in Level 3 of the fair value hierarchy when there is reliance on at least one significant unobservable input to the valuation model. In addition to these unobservable inputs, the valuation models for Level 3 financial instruments typically also rely on a number of inputs that are readily observable, either directly or indirectly. The Company’s assessment of a particular input to the fair value measurement requires management to make judgments and consider factors specific to the asset or liability. The fair value hierarchy requires the use of observable market data when available in determining fair value. The Company recognizes transfers between levels within the fair value hierarchy, if any, at the end of each period.
Spire Global, Inc.
Notes to Condensed Consolidated Financial Statements
(In thousands, except shares and per share data, unless otherwise noted)
(Unaudited)
Assets and Liabilities Measured at Fair Value on a Recurring Basis
The following tables present the Company’s fair value hierarchy for its financial instruments that are measured at fair value on a recurring basis.
| | | | | | | | | | | | | | | | |
| | March 31, 2024 | |
| | Level 1 | | | Level 2 | | | Level 3 | | | Total | |
Assets: | | | | | | | | | | | | |
Cash and cash equivalents: | | | | | | | | | | | | |
Money market funds | | $ | 10,123 | | | $ | — | | | $ | — | | | $ | 10,123 | |
| | $ | 10,123 | | | $ | — | | | $ | — | | | $ | 10,123 | |
Marketable securities: | | | | | | | | | | | | |
U.S. treasury bills and bonds | | $ | 11,018 | | | $ | — | | | $ | — | | | $ | 11,018 | |
Commercial paper | | | — | | | | 985 | | | | — | | | | 985 | |
| | $ | 11,018 | | | $ | 985 | | | $ | — | | | $ | 12,003 | |
| | | | | | | | | | | | |
Long-term liabilities: | | | | | | | | | | | | |
Credit Agreement Warrants | | $ | — | | | $ | 10,672 | | | $ | — | | | $ | 10,672 | |
Securities Purchase Agreement Warrants | | | — | | | | 1,917 | | | | — | | | | 1,917 | |
Contingent earnout liability | | | — | | | | — | | | | 265 | | | | 265 | |
| | $ | — | | | $ | 12,589 | | | $ | 265 | | | $ | 12,854 | |
| | | | | | | | | | | | |
| | December 31, 2023 | |
| | Level 1 | | | Level 2 | | | Level 3 | | | Total | |
Assets: | | | | | | | | | | | | |
Cash and cash equivalents: | | | | | | | | | | | | |
Money market funds | | $ | 10,114 | | | $ | — | | | $ | — | | | $ | 10,114 | |
| | $ | 10,114 | | | $ | — | | | $ | — | | | $ | 10,114 | |
Marketable securities: | | | | | | | | | | | | |
U.S. treasury bills and bonds | | $ | 8,840 | | | $ | — | | | $ | — | | | $ | 8,840 | |
Commercial paper | | | — | | | | 1,395 | | | | — | | | | 1,395 | |
U.S. government and agency securities | | | — | | | | 1,491 | | | | — | | | | 1,491 | |
| | $ | 8,840 | | | $ | 2,886 | | | $ | — | | | $ | 11,726 | |
| | | | | | | | | | | | |
Long-term liabilities: | | | | | | | | | | | | |
Credit Agreement Warrants | | $ | — | | | $ | 5,988 | | | $ | — | | | $ | 5,988 | |
Contingent earnout liability | | | — | | | | — | | | | 220 | | | | 220 | |
| | $ | — | | | $ | 5,988 | | | $ | 220 | | | $ | 6,208 | |
Financial Assets
The Company values its Level 1 assets, consisting of money market funds, and U.S. treasury bills and bonds, using quoted prices in active markets for identical instruments.
Financial assets whose fair values that are measured on a recurring basis using Level 2 inputs consist of commercial paper, and U.S. government and agency securities. The Company measures the fair values of these assets with the help of a pricing service that either provides quoted market prices in active markets for identical or similar securities or uses observable inputs for their pricing without applying significant adjustments.
Credit Agreement Warrants
On June 13, 2022, in connection with the Blue Torch Financing Agreement, the Company issued the 2022 Blue Torch Warrants to Blue Torch, which were exercisable for an aggregate of 437,024 shares of the Company’s Class A common stock with a per share exercise price of $16.08. Additionally, in connection with the closing of the financing, the Company issued the Urgent Warrants to Urgent Capital LLC for introducing the Company to the Lenders, which is exercisable for an aggregate of 24,834 shares of the Company's Class A common stock with a per share exercise price of $16.08.
Spire Global, Inc.
Notes to Condensed Consolidated Financial Statements
(In thousands, except shares and per share data, unless otherwise noted)
(Unaudited)
On September 27, 2023, in connection with the Waiver and Amendment, the Company and certain affiliates of Blue Torch amended and restated the 2022 Blue Torch Warrants to reduce the per share exercise price from $16.08 to $5.44. The Company also concurrently issued the 2023 Blue Torch Warrants to those affiliates that are exercisable for an additional 597,082 shares of the Company’s Class A common stock at a per share exercise price of $5.44.
The fair value of the Credit Agreement Warrants is estimated using the Black-Scholes model with inputs that include the Company’s Class A common stock price in an actively traded market, making this fair value classified as a Level 2 financial instrument. The other significant assumptions used in the model are the exercise price, expected term, volatility, interest rate, and expected dividend yield.
The table below quantifies the significant inputs used for the Credit Agreement Warrants:
| | | | | | | | | |
| | March 31, | | | | December 31, | |
| | 2024 | | | | 2023 | |
Fair value of the Company’s Class A common stock | $ | | 12.00 | | | $ | | 7.82 | |
Exercise price | $ | 5.44 - 16.08 | | | $ | 5.44 - 16.08 | |
Risk-free interest rate | | | 4.20 | % | | | | 3.88 | % |
Expected volatility factor | | | 68.8 | % | | | | 55.0 | % |
Expected dividend yield | | | — | % | | | | — | % |
Remaining contractual term (in years) | | 8.2 - 9.5 | | | | 8.5 - 9.7 | |
Securities Purchase Agreement Warrants
On March 21, 2024, the Company entered into the Purchase Agreement with the Investors, pursuant to which the Company issued and sold in the Offering, (i) an aggregate of 2,142,858 shares of Class A common stock and (ii) Securities Purchase Agreement Warrants exercisable for an aggregate of 2,142,858 shares of Class A common stock to the Investors. Each share of Class A common stock and accompanying Securities Purchase Agreement Warrant to purchase one share of Class A common stock was sold at an offering price of $14.00. The aggregate gross proceeds to the Company from the Offering totaled $30,000 before deducting the placement agent’s fees and related offering expenses. The Securities Purchase Agreement Warrants have an exercise price equal to $14.50 per share of Class A common stock, are exercisable for a term beginning on March 25, 2024, and will expire on July 3, 2024.
The fair value of the Securities Purchase Agreement Warrants is estimated using the Black-Scholes model with inputs that include the Company’s Class A common stock price in an actively traded market, making this fair value classified as a Level 2 financial instrument. The other significant assumptions used in the model are the exercise price, expected term, volatility, interest rate, and expected dividend yield.
The table below quantifies the significant inputs used for the Securities Purchase Agreement Warrants:
| | | | |
| | March 31, | |
| | 2024 | |
Fair value of the Company’s Class A common stock | $ | | 12.00 | |
Exercise price | $ | | 14.50 | |
Risk-free interest rate | | | 5.46 | % |
Expected volatility factor | | | 68.8 | % |
Expected dividend yield | | | — | % |
Remaining contractual term (in years) | | | 0.3 | |
Contingent Earnout Liability
In connection with the Merger, eligible Spire equity holders are entitled to receive additional shares of the Company's Class A common stock upon the achievement of certain earnout triggering events. The estimated fair value of the contingent earnout liability is determined using a Monte Carlo simulation using a distribution of potential outcomes on a monthly basis over the earnout period, which is a period up to five years post-closing of the Merger, prioritizing the most reliable information available, making this fair value classified as a Level 3 liability. The assumptions utilized in the calculation are based on the achievement of certain stock price milestones, including the current price of the Company’s Class A common stock, expected volatility, risk-free interest rate, expected term and expected dividend yield.
Spire Global, Inc.
Notes to Condensed Consolidated Financial Statements
(In thousands, except shares and per share data, unless otherwise noted)
(Unaudited)
The table below quantifies the significant inputs used for the contingent earnout liability:
| | | | | | | | | |
| | March 31, | | | | December 31, | |
| | 2024 | | | | 2023 | |
Fair value of the Company’s Class A common stock | | $ | 12.00 | | | | $ | 7.82 | |
Risk-free interest rate | | | 4.52 | % | | | | 4.09 | % |
Expected volatility factor | | | 68.8 | % | | | | 55.0 | % |
Earnout expiration date | | August 16, 2026 | | | | August 16, 2026 | |
The following table presents a summary of the changes in the fair value of the Company’s Level 3 financial instruments that are measured at fair value on a recurring basis:
| | | | | |
| | Contingent
Earnout
Liability | | |
Fair value as of December 31, 2023 | | $ | 220 | | |
Change in fair value of contingent earnout liability | | | 45 | | |
Fair value as of March 31, 2024 | | $ | 265 | | |
Cash and Cash Equivalents and Marketable Securities
The following tables summarize the Company's cash, cash equivalents and available-for-sale securities by significant marketable securities category:
| | | | | | | | | | | | | | | | |
| | March 31, 2024 | |
| | Amortized Cost | | | Unrealized Gains | | | Unrealized Losses | | | Fair Value | |
Cash and cash equivalents: | | | | | | | | | | | | |
Cash (As Restated) | | $ | 41,608 | | | $ | — | | | $ | — | | | $ | 41,608 | |
Cash equivalents: | | | | | | | | | | | | |
Money market funds | | | 10,123 | | | | — | | | | — | | | | 10,123 | |
| | $ | 51,731 | | | $ | — | | | $ | — | | | $ | 51,731 | |
Marketable Securities: | | | | | | | | | | | | |
U.S. treasury bills and bonds | | $ | 11,018 | | | $ | — | | | $ | — | | | $ | 11,018 | |
Commercial paper | | | 986 | | | | — | | | | (1 | ) | | | 985 | |
| | $ | 12,004 | | | $ | — | | | $ | (1 | ) | | $ | 12,003 | |
| | | | | | | | | | | | |
| | December 31, 2023 | |
| | Amortized Cost | | | Unrealized Gains | | | Unrealized Losses | | | Fair Value | |
Cash and cash equivalents: | | | | | | | | | | | | |
Cash | | $ | 19,022 | | | $ | — | | | $ | — | | | $ | 19,022 | |
Cash equivalents: | | | | | | | | | | | | |
Money market funds | | | 10,114 | | | | — | | | | — | | | | 10,114 | |
| | $ | 29,136 | | | $ | — | | | $ | — | | | $ | 29,136 | |
Marketable Securities: | | | | | | | | | | | | |
U.S. treasury bills and bonds | | $ | 8,838 | | | $ | 2 | | | $ | — | | | $ | 8,840 | |
Commercial paper | | | 1,395 | | | | — | | | | — | | | | 1,395 | |
U.S. government and agency securities | | | 1,492 | | | | — | | | | (1 | ) | | | 1,491 | |
| | $ | 11,725 | | | $ | 2 | | | $ | (1 | ) | | $ | 11,726 | |
Spire Global, Inc.
Notes to Condensed Consolidated Financial Statements
(In thousands, except shares and per share data, unless otherwise noted)
(Unaudited)
The following table represents amortized cost and estimated fair value of marketable securities, by contractual maturity:
| | | | | | | | | | | | |
| | | | | | March 31, 2024 | |
| | | | | | Amortized Cost | | | Fair Value | |
Due in one year or less | | | | | | $ | 12,004 | | | $ | 12,003 | |
In accordance with the Company's investment policy, investments are placed in investment grade securities with high credit quality issuers, and generally limit the amount of credit exposure to any one issuer. The Company evaluates securities for impairment at the end of each reporting period. The Company did not record any impairment charges related to its available-for-sale securities during the three months ended March 31, 2024 and 2023.
10.Commitments and Contingencies (As Restated)
L3Harris Commitment
In conjunction with the Acquisition, the Company acquired the agreement (the "L3Harris Agreement") with L3Harris Technologies, Inc. ("L3Harris") to receive satellite automatic identification system ("S-AIS") data from the L3Harris AppStar payloads on-board Iridium NEXT Constellation, Iridium's Real-Time Second-Generation satellite constellation with 58 AppStar payloads. Under the Amended and Restated L3Harris Agreement dated January 21, 2020 (the "A&R L3Harris Agreement"), the Company incurs a fixed fee of $358 per month. The A&R L3Harris Agreement expires on August 7, 2031.
Under the A&R L3Harris Agreement, the Company will pay a 30% share of S-AIS data revenues for the portion of exactEarth annual S-AIS data revenue which is in excess of $16,000. No revenue share was owed to L3Harris under the A&R L3Harris Agreement, with respect to AIS Analytics sales, as of or for the three months ended March, 2024 and 2023. The Company recognized $1,238 and $1,253 in cost of revenue on the condensed consolidated statements of operations for costs incurred to acquire exclusive access rights to data generated from satellites for the three months ended March 31, 2024 and 2023, respectively.
The following table summarizes the operational fees commitment under the A&R L3Harris Agreement, which includes the fixed payment obligations to L3Harris:
| | | | |
Years ending December 31, | | | |
Remainder of 2024 | | $ | 3,225 | |
2025 | | | 4,300 | |
2026 | | | 4,300 | |
2027 | | | 4,300 | |
2028 | | | 4,300 | |
Thereafter | | | 11,189 | |
| | $ | 31,614 | |
Note Receivable (As Restated)
The Company has outstanding a $4,500 note receivable plus accrued interest of $394 issued to a Space Services customer as of March 31, 2024. The note and accrued interest are due in October 2024. The Company is aware that the customer has been using cash in its operations and its available cash is low. Given the customer's financial performance, there is an indication that it will not have sufficient cash available to repay the note when it is due. The customer has announced that it has secured a financing arrangement with its principal shareholder that would provide it sufficient funds to repay the note and the customer has asserted to the Company its intention to repay the note. The Company believes that a loss of the entire principal value and accrued interest is reasonably possible but not probable. The Company recorded a provision for the current expected credit loss of $1,258 as of March 31, 2024.
Litigation
At times, the Company is party to various claims and legal actions arising in the normal course of business. Although the ultimate outcome of these matters is not presently determinable, management believes that the resolution of all such pending
Spire Global, Inc.
Notes to Condensed Consolidated Financial Statements
(In thousands, except shares and per share data, unless otherwise noted)
(Unaudited)
matters, based on an assessment of the current facts and circumstances, will not have a material adverse effect on the Company’s business, results of operations, financial condition or cash flows; however, there can be no assurance that the ultimate resolution of these matters will not have a material impact on the Company’s condensed consolidated financial statements in any period.
11.Stock-Based Compensation
In connection with the Closing, the Company adopted the 2021 Equity Incentive Plan (the “2021 Plan”) and the 2021 Employee Stock Purchase Plan (“2021 ESPP”). The number of shares available for issuance under the 2021 Plan is increased on the first day of each fiscal year, beginning on January 1, 2022, in an amount as provided in the 2021 Plan. Pursuant to this automatic increase feature of the 2021 Plan, 1,054,867 shares were added as available for issuance thereunder on January 1, 2024. As of March 31, 2024, 818,433 shares were available for issuance under the 2021 Plan.
The number of shares available for issuance under the 2021 ESPP is increased on the first day of each fiscal year, beginning on January 1, 2022, in an amount as provided in the 2021 ESPP. Pursuant to this automatic increase feature of the 2021 ESPP, 210,973 shares were added as available for issuance thereunder on January 1, 2024. As of March 31, 2024, 743,659 shares were available for issuance under the 2021 ESPP.
The following table summarizes stock option activity under our equity compensation plans:
| | | | | | | | | | | | |
| | Number of
Options | | | Weighted-
Average
Exercise
Price | | | Weighted-
Average
Remaining
Contractual
Term | |
| | | | | | | | (in years) | |
Options outstanding as of December 31, 2023 | | | 2,198,552 | | | $ | 17.11 | | | | 5.0 | |
Granted | | | — | | | $ | — | | | | |
Exercised | | | (37,536 | ) | | $ | 7.13 | | | | |
Forfeited, canceled, or expired | | | (166,413 | ) | | $ | 22.26 | | | | |
Options outstanding as of March 31, 2024 | | | 1,994,603 | | | $ | 16.87 | | | | 5.1 | |
Vested and expected to vest at March 31, 2024 | | | 1,994,603 | | | $ | 16.87 | | | | 5.1 | |
Exercisable at March 31, 2024 | | | 1,762,321 | | | $ | 16.74 | | | | 4.8 | |
The Company received $267 in cash proceeds from options exercised during the three months ended March 31, 2024, and there were no options exercised during the three months ended March 31, 2023. There were no options granted during the three months ended March 31, 2024 and 2023.
The following table summarizes restricted stock unit ("RSU") activity under the 2021 Plan:
| | | | | | | | | | |
| | | | Number of RSUs | | | Weighted Average Grant Date Fair Value per Share | |
Outstanding as of December 31, 2023 | | | | | 1,847,583 | | | $ | 10.17 | |
RSUs granted | | | | | 1,905,380 | | | $ | 13.61 | |
RSUs vested | | | | | (204,511 | ) | | $ | 12.49 | |
RSUs forfeited | | | | | (784,990 | ) | | $ | 13.48 | |
Outstanding as of March 31, 2024 | | | | | 2,763,462 | | | $ | 11.43 | |
For RSUs with service-based vesting conditions, the fair value is calculated based upon the Company’s closing stock price on the date of grant, and the stock-based compensation expense is recognized over the applicable grant vesting term, generally four years.
As of March 31, 2024, there was $31,078 of total unrecognized compensation expense related to options and RSUs expected to be recognized over a weighted average-period of 1.95 years.
Spire Global, Inc.
Notes to Condensed Consolidated Financial Statements
(In thousands, except shares and per share data, unless otherwise noted)
(Unaudited)
The following table summarizes the components of total stock-based compensation expense based on roles and responsibilities of the employees within the condensed consolidated statements of operations:
| | | | | | | | |
| | Three Months Ended March 31, | |
| | 2024 | | | 2023 | |
Cost of revenue | | $ | 61 | | | $ | 77 | |
Research and development | | | 1,018 | | | | 651 | |
Sales and marketing | | | 675 | | | | 437 | |
General and administrative | | | 1,874 | | | | 1,481 | |
| | $ | 3,628 | | | $ | 2,646 | |
12.Net Loss per Share (As Restated)
The following table sets forth the computation of basic and diluted net loss per share attributable to common stockholders:
| | | | | | | | |
| | Three Months Ended March 31, | |
| | 2024 | | | 2023 | |
| | (As Restated) | | | (As Restated) | |
Numerator: | | | | | | |
Net loss | | $ | (25,544 | ) | | $ | (18,655 | ) |
Denominator: | | | | | | |
Weighted-average shares used in computing basic and diluted
net loss per share | | | 21,813,045 | | | | 18,096,363 | |
Basic and diluted net loss per share | | $ | (1.17 | ) | | $ | (1.03 | ) |
The Company has two classes of common stock, Class A and Class B. Class B common stock has no economic rights, and therefore has been excluded from the computation of basic and diluted net loss per share. Potentially dilutive securities have been excluded from the computation of diluted net loss per share as the effect would reduce net loss per share. Therefore, the weighted-average number of common shares outstanding used to calculate both basic and diluted net loss per share is the same.
The Company excluded the following potential shares of Class A common stock, presented based on amounts outstanding at each period end, from the computation of diluted net loss per share for the three months ended March 31, 2024 and 2023, because including them would have had an anti-dilutive effect:
| | | | | | | | |
| | Three Months Ended March 31, | |
| | 2024 | | | 2023 | |
Stock options and 2021 ESPP | | | 2,028,412 | | | | 2,422,401 | |
RSUs | | | 2,763,462 | | | | 1,442,755 | |
Securities Purchase Agreement Warrants | | | 2,142,858 | | | | — | |
Credit Agreement Warrants | | | 1,058,940 | | | | 461,860 | |
| | | 7,993,672 | | | | 4,327,016 | |
On April 8, 2024, the Company entered into the Third Amendment with Blue Torch and the Lenders, which amends the Blue Torch Financing Agreement to (i) increase the maximum debt to EBITDA leverage ratio for the monthly periods ending June 30, 2024, July 31, 2024, and August 31, 2024, and to decrease the maximum permitted ratio thereafter, and (ii) amend the minimum liquidity covenant to require liquidity of at least $20,000 at all times, commencing on April 8, 2024, which represents a $10,000 decrease from the requirement in effect immediately prior to the effective date of the Third Amendment. On April 8, 2024, in accordance with the terms of the Third Amendment, the Company made a prepayment to Blue Torch of $10,000 in principal, plus an early termination fee of $200.
In April 2024, the Company recorded an impairment charge of $3,510 for a decommissioned satellite. The impairment was recognized following the Company's standard operating procedure after communication with the satellite was lost in April 2024 and was unable to be reestablished.
Item 2. Management’s Discussion and Analysis of Financial Condition and Results of Operations.
The following discussion and analysis of our financial condition and results of operations should be read in conjunction with the condensed consolidated financial statements and related notes thereto included in this Quarterly Report on Form 10-Q/A and the audited consolidated financial statements included in the Amended 2023 Form 10-K/A for the year ended December 31, 2023 (the “2023 Form 10-K/A”). This discussion contains forward-looking statements that involve risks and uncertainties. Our actual results could differ materially from those anticipated by these forward-looking statements as a result of many factors. Factors that could cause or contribute to such differences include those identified below and those discussed in the section titled “Risk Factors” in the 2023 Form 10-K/A.
Our historical results are not necessarily indicative of the results that may be expected for any period in the future.
The following information has been adjusted only to reflect the restatement of our unaudited condensed consolidated financial statements as of March 31, 2024, and for the fiscal quarters ended March 31, 2024 and 2023 described in the “Explanatory Note” at the beginning of this Form 10-Q/A and in Note 2, “Restatement of Previously Issued Financial Statements.” Other than such restatements, the following information is presented as of the filing date of the Original Form 10-Q, does not reflect events occurring after that date, and does not modify or update disclosures in any way other than as required to reflect the restatement as of March 31, 2024, and for the fiscal quarters ended March 31, 2024 and 2023, included in this Form 10-Q/A.
Overview
Spire is a global provider of space-based data, analytics and space services, offering unique datasets and powerful insights about Earth so that organizations can make decisions with confidence in a rapidly changing world. Spire builds, owns, and operates a fully deployed satellite constellation. We believe our constellation is one of the world’s largest “listening” constellations, observing the Earth in real time using radio frequency technology.
The data acquired by our multipurpose satellites provide global weather intelligence, ship and plane movements, and spoofing and jamming detection to better predict how their patterns impact economies, global security, business operations and the environment. We also offer space-as-a-service solutions that empower customers to leverage our established infrastructure to put their business in space. We provide customers these solutions through an application programming interface (“API”) infrastructure.
Spire also offers research and development services (“R&D Services”) to third parties, for the advancement of contracted satellite technologies. In addition to providing research and development services, we grant the counterparty a license to the developed intellectual property.
Our platform applies our value-add insights and predictive analytics to this proprietary data to create commercially valuable datasets. We offer three data solutions to our customers, which vary in complexity and price and can be delivered in near real-time via our API that can be easily integrated into our customers’ business operations:
•Maritime: Precise space-based data used for highly accurate ship monitoring, ship safety and route optimization.
•Aviation: Precise space-based data used for highly accurate aircraft monitoring, aircraft safety and route optimization.
•Weather: Precise space-based data used for highly accurate weather forecasting.
For each data solution, we have the capability to offer customers a variety of features and additional value. The four forms of data we monetize are:
•Clean data: Clean and structured data directly from our proprietary nanosatellites;
•Smart data: Clean data fused with third-party datasets and proprietary analysis to enhance value and provide insights;
•Predictive solutions: Big data, AI, and ML algorithms applied to fused data sets to create predictive analytics and insights; and
•Solutions: Data-driven actionable recommendations to solve specific business problems, utilizing the full spectrum of our data analytics suite.
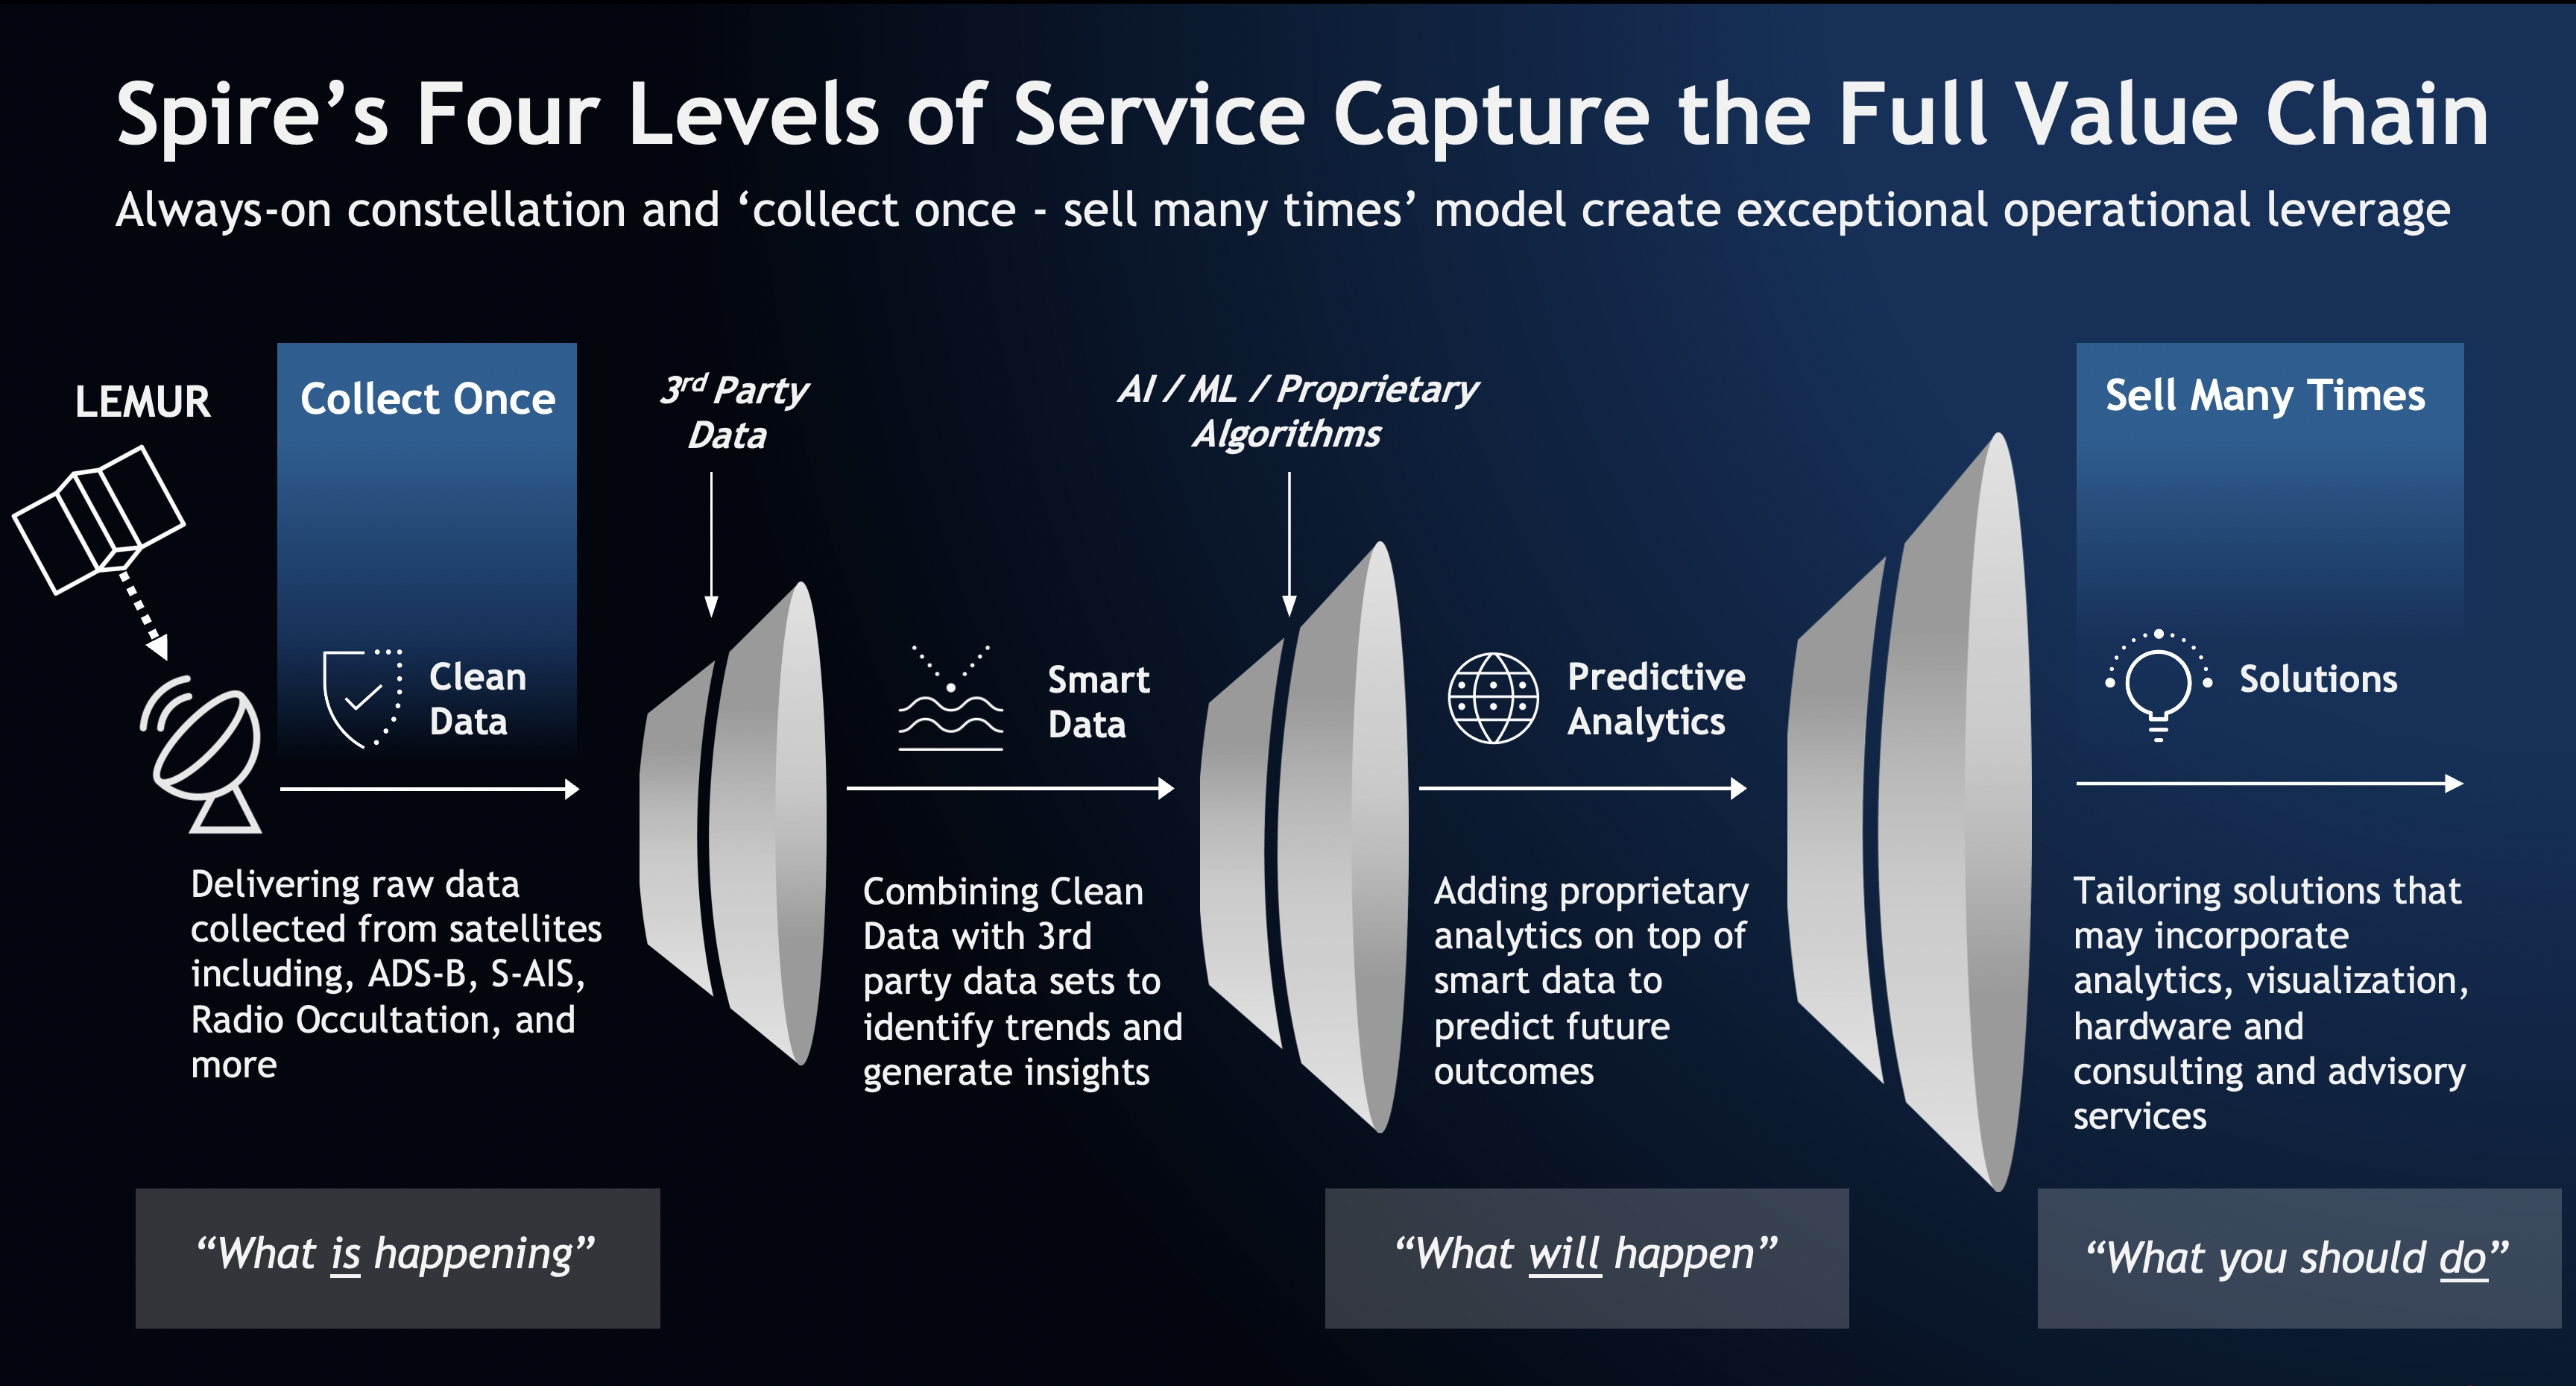
These value-add data features allow customers to solve various use cases and provide a path to expand throughout the customer’s relationship.
As our fourth solution, we are also pioneering an innovative business model through our Space Services solution. We leverage our fully deployed infrastructure and large-scale operations to enable our customers to obtain customized data through our API. Our customers can begin receiving data in less than a year after engaging with us and receive data by entering into a subscription agreement. Our Space Services offering provides our customers with fast, scalable and reliable access to space.
Our solutions are offered to customers across numerous industries and we not only have the opportunity to upsell within each one, but we also have the opportunity to cross-sell among all our solutions.
We provide our solutions to global customers either through a subscription or based on a specific project. We currently sell directly to end customers and utilize reseller partners when beneficial.
Highlights from the Three Months Ended March 31, 2024
•Our revenue was $34.8 million, an increase of 50% from the three months ended March 31, 2023.
•We were awarded a $9.4 million contract by the National Oceanic and Atmospheric Administration (“NOAA”) for Satellite Weather Data (RO).
•We launched the first commercial space situational awareness satellite constellation for NorthStar Earth & Space.
•We and Signal Ocean began collaborating to drive digitalization of the maritime economy and Signal Ocean made a $10 million strategic investment in the Company.
•We were awarded €8.4M by the European Maritime Safety Agency (EMSA) for the provision of SAT-AIS data services.
•We began collaborating with NVIDIA to enhance AI-driven weather prediction.
•We announced a space services deal to scale constellation for HANCOM InSpace.
Macroeconomic and Geopolitical Impact
Over the past two years, we have been impacted by the macroeconomic environment, such as fluctuations in foreign currencies, increasing interest rates and geopolitical conflicts like the Russian invasion of Ukraine, Israel's war with Hamas and the increased tensions between China and the U.S.
The U.S. Dollar exhibited a modest decrease in strength against the local functional currencies of our foreign subsidiaries for the three months ended March 31, 2024, as compared to the three months ended March 31, 2023. This had a marginal positive impact on our revenue, as about one-third of our sales are conducted in foreign currencies. Conversely, it had a marginal unfavorable impact on our expenses, given that a majority of our workforce resides in countries other than the United States.
The macroeconomic environment has caused existing or potential customers to re-evaluate their decision to purchase our offerings, at times resulting in additional customer discounts, extended payment terms, longer sales cycles, and a few contract cancellations. Particularly, the U.S. Congress' delay in approving appropriations bills negatively impacted the timeliness of some of our U.S. federal government orders and revenues expected in the first quarter of 2024.
Increasing interest rates in the three months ended March 31, 2024, compared to the three months ended March 31, 2023, resulted in higher interest expenses, as our credit facility is based on a floating interest rate. The Russian invasion of Ukraine and the continued conflict created additional global sanctions, which at times caused scheduling shifts or launch cancellations by third-party satellite launch providers and negatively impacted the availability of launch windows and our constellation replenishment efforts.
If any of these factors continue or worsen, and/or if new macroeconomic or geopolitical issues arise, our results and financial condition could be further negatively impacted. We cannot predict the timing, strength, or duration of any economic slowdown, downturn, instability, or recovery, generally or within any particular industry or geography. Any downturn of the general economy or industries in which we operate would adversely affect our business, financial condition, and results of operations.
Key Factors Affecting Our Performance
We believe that our current and future performance depends on many factors, including, but not limited to, those described below. While these areas present significant opportunity, they also present risks that we must manage to achieve successful results. For additional information about these risks, see the section titled “Risk Factors” in our 2023 Form 10-K/A. If we are unable to address these risks, our business and results of operations could be adversely affected.
Expansion of and Further Penetration of Our Customer Base
We employ a “land and expand” business model that focuses on efficiently acquiring new customers (“land”) and then growing our relationships with these customers over time (“expand”). We have the capability to offer customers additional data sets and a variety of enhanced features that potentially grow the value of the services for which our customers contract with us. Our future revenue growth and our path to profitability are dependent upon our ability to continue to land new customers and then expand adoption of our solutions within their organizations.
We track our progress landing new customers by measuring the number of ARR Solution Customers (as defined below) we have from one fiscal period to the next. The number of ARR Solution Customers decreased to 708 as of March 31, 2024. We track our increases and decreases in our customer contract values by measuring our ARR Net Retention Rate (as defined below).
Our ARR Net Retention Rate was 102% for the three months ended March 31, 2024, and 108% for the three months ended March 31, 2023.
Expansion into New Industries and Geographies
As our solutions have grown, we continue to focus on further penetration of our initial industries including maritime, aviation, logistics, and government (civil and defense/intelligence) among others. We believe our technology and solutions give us the ability to also expand into additional industries, including energy, financial services, agriculture, transportation, and insurance, and into additional geographies, including Latin America, Africa and the Middle East. Our revenue growth is dependent upon our ability to continue to expand into new industries and geographies. The costs associated with these expansions may adversely affect our results of operations.
Impact of the Solar Cycle on our Assets' Remaining Life
A stronger solar cycle has the potential to impact some of our satellites, accelerating their deorbiting and shortening their useful lives. The solar cycle is the cycle that the Sun’s magnetic field goes through approximately every 11 years. In 2019, National Oceanic and Atmospheric Administration (“NOAA”), NASA, and the International Space Environment Services panel forecasted that Solar Cycle 25 (December 2019 to approximately 2030) would be relatively weak after a relatively weak Solar Cycle 24 (December 2008 to December 2019). Subsequently, NOAA noted that Solar Cycle 24 was the weakest cycle in 100 years with sunspots reaching a maximum of 116 – below the average of 179. In October of 2023, NOAA updated their projection for the strength and duration of Solar Cycle 25, stating that the cycle is expected to be more intense than Cycle 24, and predicting that the peak of the cycle would be earlier, by the end of 2024. A stronger solar cycle may accelerate the deorbiting of our satellites sooner than expected or planned. Our ability to minimize the solar cycle impact, our ability to replenish our existing constellation in a timely manner and the costs associated with these actions may adversely affect our results of operations.
Investment in Growth
We continue investing in growing our business and capitalizing on our market opportunities while balancing the uncertainties from the macroeconomic environment and geopolitical factors. We intend to continue to add headcount to our global sales and marketing teams to acquire new customers and to increase sales to existing customers. We also intend to continue to add headcount as needed to our research and development teams and otherwise invest to improve and innovate our nanosatellite, ground station and data analytics technologies. Our total headcount across all functions increased to 430 employees as of March 31, 2024, from 418 employees as of March 31, 2023. The costs of these investments may adversely affect our results of operations, but we believe that these investments will contribute to our long-term growth.
Acquisitions
Our business strategy may include acquiring other complementary solutions, technologies, or businesses that we believe will allow us to continue on our path to profitability, reduce the time or costs required to develop new technologies, incorporate enhanced functionality into and complement our existing solution offerings, augment our engineering workforce and enhance our technological capabilities.
Impact of Foreign Exchange Rates
We report in U.S. Dollars, and the functional currency of our foreign operating subsidiaries is the local currency, including the Euro, the British Pound Sterling, the Singapore Dollar and the Canadian Dollar. The U.S. Dollar exhibited a modest decrease in strength against the local functional currencies of our foreign subsidiaries for the three months ended March 31, 2024, as compared to the three months ended March 31, 2023. The U.S. Dollar's modest decrease had a marginal positive impact on our revenue, as about one-third of our sales are conducted in foreign currencies. Conversely, the decrease in the value of the U.S. Dollar had a marginal unfavorable impact on our expenses, given that a majority of our workforce resides in countries other than the United States. Approximately 24% of our revenues were generated in currencies other than the U.S. Dollar. The financial statements of these subsidiaries are translated into U.S. Dollars using exchange rates in effect at each balance sheet date for assets and liabilities and average exchange rates during the period for revenues and expenses. To the extent we experience significant currency fluctuations, our results of operations may be impacted.
Key Business Metrics
We review the following key business metrics to evaluate our business, measure our performance, identify trends affecting our business, formulate business plans, and make strategic decisions:
Annual Recurring Revenue
We define ARR as our expected annualized revenue from customers that are under contracts with us at the end of the reporting period with a binding and renewable agreement for our subscription solutions or customers that are under a binding multi-year contract that can range from components of our Space Services solution to a project-based customer solution. Customers with Space Services Contracts are considered recurring when there is a multi-year binding agreement that has a renewable component in the contract. Customers are also considered recurring when they have multiple contracts over multiple years. Customer contracts for data trials and one-time transactions are excluded from the calculation of ARR.
The increase in our ARR for the three months ended March 31, 2024, was primarily driven by increasing the amount of ARR business with our existing customers. Our ARR has fluctuated from period to period in the past due in part to the timing of some of our Space Services Contracts, including when engagements start and stop. We expect our ARR to continue to fluctuate from period to period in the future. ARR is a leading indicator and accordingly will tend to outpace the impact on our revenue as we recognize the contract value of various agreements over time.
The following table summarizes our ARR as of each period end indicated:
| | | | | | | | | | | | |
| | As of March 31, | | | | |
(dollars in thousands) | | 2024 | | | 2023 | | | %
Change | |
ARR | | $ | 120,890 | | | $ | 104,763 | | | | 15 | % |
Number of ARR Customers and ARR Solution Customers
We define an ARR Customer as an entity that has a contract with us or through our reseller partners contracts, that is either a binding and renewable agreement for our subscription solutions, or a binding multi-year contract as of the measurement date independent of the number of solutions the entity has under contract. A single organization with separate subsidiaries, segments, or divisions may represent multiple customers, as we treat each entity that is invoiced separately as an individual customer. In cases where customers subscribe to our platform through our reseller partners, each end customer that meets the above definition is counted separately as an ARR Customer. All entities that have contracts for data trials and one-time transactions are excluded from the calculation of ARR Customers.
We define an ARR Solution Customer similarly to an ARR Customer, but we count every solution the customer has with us separately. As a result, the count of ARR Solution Customers exceeds the count of ARR Customers at each period end, as some customers contract with us for multiple solutions. Our multiple solutions customers are those that are under contract for at least two of our solutions: Maritime, Aviation, Weather, and Space Services. All entities that have contracts for data trials and one-time transactions are excluded from the calculation of ARR Solution Customers.
The decrease in each of our ARR Customers and ARR Solution Customers at the dates presented was driven by our move to de-emphasize sales to customers with very low ARR or revenue. We expect this strategy to ultimately increase our ARR and revenue per customer, increase our ARR in total, and reduce our customer count as we drive towards the most efficient use of our resources.
The following table summarizes the number of our ARR Customers and ARR Solution Customers as of each period end indicated:
| | | | | | | | | | | | |
| | As of March 31, | | | | |
| | 2024 | | | 2023 | | | %
Change | |
ARR Customers | | | 672 | | | | 755 | | | | (11 | )% |
ARR Solution Customers | | | 708 | | | | 781 | | | | (9 | )% |
ARR Net Retention Rate
We calculate our ARR Net Retention Rate for a particular fiscal period end by dividing (i) our ARR from those ARR Customers at that fiscal period end that were also customers as of the last day of the prior fiscal period end by (ii) the ARR from all customers as of the last day of the prior fiscal period. This calculation measures the overall impact from increases in customer contract value (upsells), the decreases in customer contract value (downsells) and the decreases in customer value resulting from customers that have chosen not to renew their contracts with us (lost customers).
The following table summarizes our ARR Net Retention Rate for the three months ended March 31, 2024 and 2023:
| | | | | | | | | | | | |
| | Three Months Ended March 31, | | | | |
| | 2024 | | | 2023 | | | %
Change | |
ARR Net Retention Rate | | | 102 | % | | | 108 | % | | | (6 | )% |
Our ARR Net Retention Rate can be impacted from period to period by large increases or decreases in customer contract value and large decreases in contract value from customers that have not renewed their contracts with us. An ARR Net Retention Rate greater than 100% is an indication that we are growing the value of the solutions our customers are purchasing from us at a fiscal period end versus the prior fiscal period end. An ARR Net Retention Rate less than 100% is an indication that the value of the solutions our customers are purchasing from us declined at a fiscal period end versus the prior fiscal period end. Our ARR Net Retention Rate decreased by 6% for the three months ended March 31, 2024, from the applicable prior fiscal period. This decrease was driven primarily by the reduced value of NOAA's RO weather award in the three months ended March 31, 2024, as compared to the value of the corresponding award in the three months ended March 31, 2023.
Components of Results of Operations
Revenue
We derive revenue from providing data, insights and access to our cloud-based technology platform sold on a subscription basis. Some of our customer arrangements include additional performance obligations that encompass the delivery of specific goods, services or intellectual property apart from the ongoing services provided on a subscription basis which may impact the timing of revenue recognition. Additionally, some of our customer arrangements include material rights to receive discounted subscription services in the future, which impacts the timing of revenue recognition.
Subscription periods for our solutions generally range from one to two years and are typically non-cancelable, with customers having the right to terminate their agreements only if we materially breach our obligations under the agreement. Our subscription fees are typically billed either monthly or quarterly in advance.
Cost of Revenue
Cost of revenue consists primarily of personnel costs, depreciation, hosted infrastructure costs, high-power computing costs, third-party operating and royalty costs associated with delivering our data and services, to our customers, and costs associated with R&D Services Contracts. In addition, cost of revenue includes the amortization of purchased intangibles associated with our acquisition of exactEarth in November 2021 (the “Acquisition”). Personnel costs are primarily related to the cost of our employees supporting and managing our constellation operations including satellite operations, ground station control and launch management. Personnel costs also include the cost of our employees supporting and managing projects for our research and development services. Costs associated with the manufacture and launch of our satellites, including personnel costs, are capitalized and depreciated upon placement in service, typically over a four-year expected useful life. As satellites reach the end
of their expected useful life, they are generally replaced with replenishment satellites to maintain our constellation at optimal performance. Costs associated with the acquisition and development of new ground stations, including the bill of materials and labor to install the ground station, are capitalized and depreciated upon placement in service typically over a four-year to ten-year expected useful life. We anticipate ongoing capital spending to repair and replenish ground stations as they reach the end of their expected useful life to keep our ground station network at optimal performance. Our proprietary ground station network is primarily located in third-party locations where we incur lease and other operational charges. Cost of revenue also includes royalties associated with third-party data sets that we integrate into our data solutions.
Operating Expenses
Research and Development. Research and development expenses consist primarily of employee-related expenses, third-party consulting fees, and computing costs. Our research and development efforts are focused on improving our satellite technology, developing new data sets, developing new algorithms, enhancing our smart and predictive analytics, and enhancing the ease of use and utility of our space-based data solutions.
Sales and Marketing. Sales and marketing expenses consist primarily of employee-related expenses, sales commissions, marketing and advertising costs, costs incurred in the development of customer relationships, brand development costs, travel-related expenses, allowance for current expected credit losses, and amortization of purchased intangible backlog associated with the Acquisition. Commission costs on new customer contract bookings are considered costs of obtaining customer contracts. Commission costs for multi-year deals are considered contract acquisition costs and are deferred and then amortized over the period of the contract. Commission costs on contracts completed with a term of twelve months or less are expensed in the period incurred.
General and Administrative. General and administrative expenses consist of employee-related expenses for personnel in our executive, finance and accounting, facilities, legal, human resources, and management information systems functions, as well as other administrative employees. In addition, general and administrative expenses include fees related to third-party legal counsel, corporate insurance, fees related to accounting, tax and audit costs, office facilities costs, software subscription costs and other corporate costs.
Loss on Decommissioned Satellites. Loss on decommissioned satellites consists of the write-off of the remaining capitalized costs associated with the manufacture and launch of our satellites prior to the end of the satellite’s useful life. We contract with third-party companies to launch, carry and deploy our satellites into space. A loss could result from a third-party launch or deployer failure, a technical failure of the satellite, or the deorbit or decommissioning of a satellite before the end of the satellite’s useful life. A technical failure could include a satellite that is not able to communicate with our network of ground stations or fulfill its intended technical mission for a duration greater than one month. The loss amount is presented net of any insurance proceeds received. Due to the nature of these events, we cannot predict the magnitude or frequency of future satellite deorbit and launch failure losses. We sometimes purchase launch insurance when financially practical, however, the proceeds from these insurance policies will typically only cover a portion of our launch loss. We incurred a $0.2 million loss on decommissioned satellites for the three months ended March 31, 2024 and no loss on decommissioned satellites for the three months ended March 31, 2023.
Allowance for Current Expected Credit Loss on Notes Receivable. Allowance for current expected credit loss on notes receivable consists of allowance for current expected credit loss recorded on a note receivable and accrued interest issued to a Space Services customer.
Other Income (Expense)
Interest Income. Interest income includes interest earned on our cash balances and short-term marketable securities.
Interest Expense. Interest expense primarily includes interest costs associated with our debt and amortization of deferred financing costs.
Change in Fair Value of Contingent Earnout Liability. Change in fair value of contingent earnout liability includes mark-to-market adjustments to reflect changes in the fair value of the contingent earnout liability.
Change in Fair Value of Warrant Liabilities. Change in fair value of warrant liabilities includes mark-to-market adjustments to reflect changes in the fair value of warrant liabilities.
Issuance of Stock Warrants. Issuance of stock warrants includes expense related to the value of the right to purchase company shares.
Foreign Exchange Gain/Loss. Foreign exchange gain/loss consists of the net effect of realized and unrealized foreign currency gains and losses resulting from changes in the currency exchange rates for transactions denominated in non-functional currency relative to each subsidiary's functional currency. We use the local currency as our functional currency for our subsidiaries in Luxembourg, the United Kingdom, Singapore, Australia, Germany, and Canada.
Other Expense, Net. Other expense, net consists primarily of tax credits, grant income, share of equity investment loss, and write-off of certain prepaid assets.
Income Tax Provision
Provision for income taxes consists of federal income taxes in the United States and income taxes in certain foreign jurisdictions. We do not provide for income taxes on undistributed earnings of our foreign subsidiaries since we intend to invest these earnings outside of the United States permanently. We account for income taxes using the asset and liability method, whereby deferred tax assets and liabilities are recognized based on differences between the financial reporting and tax bases of assets and liabilities and are measured using the enacted rates and laws that will be in effect when the differences are expected to reverse.
Results of Operations (As Restated)
Three Months Ended March 31, 2024, Compared to Three Months Ended March 31, 2023
The following tables set forth selected condensed consolidated statements of operations data for each of the periods indicated:
| | | | | | | | |
| | Three Months Ended March 31, | |
(in thousands) | | 2024 | | | 2023 | |
| | (As Restated) | | | (As Restated) | |
Revenue | | $ | 34,825 | | | $ | 23,217 | |
Cost of revenue(1) | | | 25,596 | | | | 13,369 | |
Gross profit | | | 9,229 | | | | 9,848 | |
Operating expenses(1): | | | | | | |
Research and development | | | 6,037 | | | | 7,318 | |
Sales and marketing | | | 5,118 | | | | 6,850 | |
General and administrative | | | 9,844 | | | | 11,823 | |
Loss on decommissioned satellites | | | 178 | | | | — | |
Allowance for current expected credit loss on notes receivable | | | 40 | | | | — | |
Total operating expenses | | | 21,217 | | | | 25,991 | |
Loss from operations | | | (11,988 | ) | | | (16,143 | ) |
Other income (expense): | | | | | | |
Interest income | | | 454 | | | | 565 | |
Interest expense | | | (5,053 | ) | | | (4,578 | ) |
Change in fair value of contingent earnout liability | | | (45 | ) | | | 76 | |
Change in fair value of warrant liabilities | | | (4,202 | ) | | | 746 | |
Issuance of stock warrants | | | (2,399 | ) | | | — | |
Foreign exchange (loss) gain | | | (1,786 | ) | | | 1,013 | |
Other expense, net | | | (534 | ) | | | (311 | ) |
Total other expense, net | | | (13,565 | ) | | | (2,489 | ) |
Loss before income taxes | | | (25,553 | ) | | | (18,632 | ) |
Income tax (benefit) provision | | | (9 | ) | | | 23 | |
Net loss | | $ | (25,544 | ) | | $ | (18,655 | ) |
(1)Includes stock-based compensation as follows:
| | | | | | | | |
| | Three Months Ended March 31, | |
(in thousands) | | 2024 | | | 2023 | |
| | (As Restated) | | | (As Restated) | |
Cost of revenue | | $ | 61 | | | $ | 77 | |
Research and development | | | 1,018 | | | | 651 | |
Sales and marketing | | | 675 | | | | 437 | |
General and administrative | | | 1,874 | | | | 1,481 | |
Total stock-based compensation | | $ | 3,628 | | | $ | 2,646 | |
Revenue (As Restated)
| | | | | | | | | | | | |
| | Three Months Ended March 31, | | | | |
(dollars in thousands) | | 2024 | | | 2023 | | | %
Change | |
| | (As Restated) | | | (As Restated) | | | | |
Revenue | | $ | 34,825 | | | $ | 23,217 | | | | 50 | % |
Total revenue increased $11.6 million, or 50%, for the three months ended March 31, 2024, primarily due to increased ARR business with our existing customers, and growth in revenue recognized for Space Services Contracts, partially offset by a decrease in our RO-based revenue primarily from the reduced value of NOAA's RO weather award. Our ARR Customers decreased 11%, to 672 as of March 31, 2024 from 755 as of March 31, 2023. The decrease in ARR Customers was aligned with our stated move to de-emphasize sales to customers with very low ARR or revenue and instead focus on high ARR or revenue customers. Our ARR Net Retention Rate was 102% and 108% for the three months ended March 31, 2024 and 2023, respectively. The decrease in ARR Net Retention Rate was driven primarily by the reduced value of NOAA’s RO weather award during the three months ended March 31, 2024 as compared to the prior year period..
We derived 65% of our revenue from the Americas, 29% of our revenue from Europe, Middle East, Africa (“EMEA”) and 6% of our revenue from Asia Pacific (“APAC”) for the three months ended March 31, 2024. We derived 50% of our revenue from the Americas, 35% of our revenue from EMEA and 15% of our revenue from APAC for the three months ended March 31, 2023. We derived 52% of our revenue from subscription arrangements for the three months ended March 31, 2024, compared to 84% for the three months ended March 31, 2023. The distribution of our revenue can fluctuate significantly from period to period driven primarily by the timing of the non-subscription revenue recognition in our contracts. Revenue from subscription-based contracts was $18.2 million, or 52%, of total revenue, for the three months ended March 31, 2024, and was $19.6 million, or 84%, of total revenue, for the three months ended March 31, 2023.
Cost of Revenue (As Restated)
| | | | | | | | | | | | |
| | Three Months Ended March 31, | | | | |
(dollars in thousands) | | 2024 | | | 2023 | | | %
Change | |
| | (As Restated) | | | (As Restated) | | | | |
Total cost of revenue | | $ | 25,596 | | | $ | 13,369 | | | | 91 | % |
Gross profit | | | 9,229 | | | | 9,848 | | | | (6 | )% |
Gross margin | | | 27 | % | | | 42 | % | | | (15 | )% |
Headcount (at end of period) (1) | | | 36 | | | | 41 | | | | (12 | )% |
(1) Includes headcount relating to R&D Services Contracts. R&D Services Contracts expenses are included in Cost of revenue.
Cost of revenue increased $12.2 million, or 91%, primarily driven by an increase in satellite operation expense of $8.9 million, an increase in depreciation expense of $2.9 million, and an increase in other miscellaneous expenses of $0.4 million. The increase in satellite operation expense was driven by recognition of launch costs associated with a Space Services Contract. The increase in depreciation expense was primarily driven by a reset of the estimated useful lives of our satellites to account for the potential impact of increased solar activity related to the current solar cycle.
Gross margin was 27% and 42% for the three months ended March 31, 2024 and 2023, respectively. The decrease was driven primarily by expenses as described above. Our gross margin can fluctuate significantly from period to period driven primarily by the timing of the revenue as well as the timing of our technology investments to support future revenue.
We expect cost of revenue, including depreciation and amortization expenses, third-party operating costs and royalties, and high-powered computing costs, to decrease in absolute dollars during the remainder of the year as accelerated depreciation declines to reflect our constellation replenishment efforts.
Operating Expenses
Operating expenses consist of our research and development, our sales and marketing, and our general and administrative expenses, as well as loss on decommissioned satellites in some periods. As we continue to invest in our growth, we expect our operating expenses to increase in absolute dollars as revenue grows. However, we expect our operating expenses as a percentage of revenue to decrease over time.
Research and Development (As Restated)
| | | | | | | | | | | | |
| | Three Months Ended March 31, | | | | |
(dollars in thousands) | | 2024 | | | 2023 | | | %
Change | |
| | (As Restated) | | | (As Restated) | | | | |
Research and development | | $ | 6,037 | | | $ | 7,318 | | | | (18 | )% |
Percentage of total revenue | | | 17 | % | | | 32 | % | | | |
Headcount (at end of period) (1) | | | 232 | | | | 211 | | | | 10 | % |
(1) Includes headcount relating to R&D Services Contracts. R&D Services Contracts expenses are included in Cost of revenue.
Research and development expenses decreased $1.3 million, or 18%, primarily driven by a decrease in personnel costs of $1.8 million, partially offset by an increase in professional services fees of $0.2 million, an increase in software expenses of $0.2 million, and an increase in other miscellaneous operating expenses of $0.1 million. The decrease in personnel costs was driven by increased work related to R&D Services Contracts during the period, which causes a greater proportion of costs to be allocated to cost of revenue. The increase in professional services fees and software expenses was driven by additional technical resources required to support new development processes and capabilities.
We expect research and development expenses to increase in absolute dollars in future periods primarily due to higher headcount as we continue to invest in the development of our solutions offerings and new technologies. However, we expect research and development expenses to decrease as a percentage of revenue in future periods as our revenue growth exceeds our increase in research and development spend.
Sales and Marketing
| | | | | | | | | | | | |
| | Three Months Ended March 31, | | | | |
(dollars in thousands) | | 2024 | | | 2023 | | | %
Change | |
Sales and marketing | | $ | 5,118 | | | $ | 6,850 | | | | (25 | )% |
Percentage of total revenue | | | 15 | % | | | 30 | % | | | |
Headcount (at end of period) | | | 70 | | | | 80 | | | | (13 | )% |
Sales and marketing expenses decreased $1.7 million, or 25%, primarily driven by a decrease in bad debt expenses of $0.8 million, a decrease in bonus expenses of $0.4 million, a decrease in personnel costs of $0.2 million, a decrease in marketing expenses of $0.2 million and a decrease in other miscellaneous operating expenses of $0.1 million. The decrease in bad debt expenses was driven by cash collections and recovery efforts. The decrease in bonus expenses was driven by lower bonus accruals for management. The decrease in personnel costs was driven by an overall reduction in headcount. The decrease in marketing expenses was driven by lower advertising and event spend compared to the prior year quarter.
We expect sales and marketing expenses to generally grow in absolute dollars in the future, primarily due to increased employee-related expenses as we grow our headcount, to support our sales and marketing efforts and our continued expansion of our sales capacity across our solutions; however, we expect sales and marketing expenses as a percentage of revenue to decrease in future periods as our revenue growth exceeds our increases in sales and marketing spend.
General and Administrative (As Restated)
| | | | | | | | | | | | |
| | Three Months Ended March 31, | | | | |
(dollars in thousands) | | 2024 | | | 2023 | | | %
Change | |
| | (As Restated) | | | (As Restated) | | | | |
General and administrative | | $ | 9,844 | | | $ | 11,823 | | | | (17 | )% |
Percentage of total revenues | | | 28 | % | | | 51 | % | | | |
Headcount (at end of period) | | | 92 | | | | 86 | | | | 7 | % |
General and administrative expenses decreased $2.0 million, or 17%, primarily driven by a decrease in severance expenses of $1.0 million, a decrease in bonus expenses of $0.7 million, and a reduction in insurance costs of $0.4 million, partially offset by an increase in other miscellaneous operating expenses of $0.1 million. The decrease in bonus expenses was driven by lower bonus accruals for management. The decrease in business insurance costs was driven by an improvement in annual rates particularly on directors and officers insurance.
We expect our general and administrative expenses to generally grow in absolute dollars in future periods as our employee-related expenses increase to support our revenue growth; however, we expect our general and administrative expenses as a percentage of revenue to decrease as revenue growth exceeds our increases in general and administrative spend.
Loss on Decommissioned Satellites
| | | | | | | | | | |
| | Three Months Ended March 31, | | | |
(dollars in thousands) | | 2024 | | | 2023 | | | %
Change |
Loss on decommissioned satellites | | $ | 178 | | | $ | — | | | * |
Percentage of total revenues | | | 1 | % | | | — | % | | |
*Not Meaningful
We recognized a non-cash expense of $0.2 million on decommissioned satellites prior to the ends of their useful lives for the three months ended March 31, 2024. There were no satellites decommissioned or impaired in the three months ended March 31, 2023.
Due to the nature of these events, we cannot predict the magnitude or frequency of future decommissioning losses. While we sometimes purchase launch insurance when financially practical, the proceeds from these policies will typically only cover a portion of our loss in the event of an unplanned satellite deorbit or launch failure.
Allowance for Current Expected Credit Loss on Notes Receivable (As Restated)
| | | | | | | | | | |
| | Three Months Ended March 31, | | | |
(dollars in thousands) | | 2024 | | | 2023 | | | %
Change |
Allowance for current expected credit loss on notes receivable | | $ | 40 | | | $ | — | | | * |
Percentage of total revenues | | | — | % | | | — | % | | * |
We recognized expense of $0.04 million to reserve for a current expected credit loss on a note receivable issued to a Space Services customer for the three months ended March 31, 2024. There were no such reserves for current expected credit losses in the three months ended March 31, 2023.
Other Income (Expense) (As Restated)
| | | | | | | | | | | | |
| | Three Months Ended March 31, | | | | |
(dollars in thousands) | | 2024 | | | 2023 | | | %
Change | |
| | (As Restated) | | | (As Restated) | | | | |
Interest income | | $ | 454 | | | $ | 565 | | | | (20 | )% |
Interest expense | | $ | (5,053 | ) | | $ | (4,578 | ) | | | 10 | % |
Change in fair value of contingent earnout liability | | $ | (45 | ) | | $ | 76 | | | | (159 | )% |
Change in fair value of warrant liabilities | | $ | (4,202 | ) | | $ | 746 | | | | (663 | )% |
Issuance of stock warrants | | $ | (2,399 | ) | | $ | — | | | * | |
Foreign exchange (loss) gain | | $ | (1,786 | ) | | $ | 1,013 | | | | (276 | )% |
Other expense, net | | $ | (534 | ) | | $ | (311 | ) | | | 72 | % |
*Not Meaningful
Interest income decreased by $0.1 million driven by lower short-term marketable securities available for investments.
Interest expense increased by $0.5 million, or 10%, for the three months ended March 31, 2024, primarily due to incurring higher interest and amortized debt issuance costs associated with our Blue Torch Finance LLC (“Blue Torch”) term loan.
Change in fair value of contingent earnout liability was an immaterial loss for the three months ended March 31, 2024 compared to a gain of $0.1 million for the three months ended March 31, 2023, a reduction of 159%. The loss in three months ended March 31, 2024 was primarily due to the increase in the fair value of the liability driven by appreciation of the underlying stock price in the period. The gain in the prior period was primarily driven by the decrease in the fair value of the liability due to the decline in the underlying stock price during the period. For additional information, see Notes 2 and 8 to our unaudited condensed consolidated financial statements included in this Quarterly Report on Form 10-Q/A and Notes 2 and 8 to our consolidated financial statements included in our 2023 Form 10-K/A.
Change in fair value of warrant liabilities was a loss of $4.2 million for the three months ended March 31, 2024, compared to a gain of $0.7 million for the three months ended March 31, 2023, a reduction of 663%. The $4.2 million loss in the three months ended March 31, 2024 was primarily due to the appreciation of the underlying stock valuation for the warrants issued to Blue Torch and subsequently amended in July 2023.
Issuance of stock warrants was a net loss of $2.4 million for the three months ended March 31, 2024, compared to no such expense for the three months ended March 31, 2023. In March 2024, we entered into a definitive Securities Purchase Agreement with institutional investors that included the issuance of stock warrants.
We recognized a foreign exchange loss of $1.8 million for the three months ended March 31, 2024, compared to a foreign exchange gain of $1.0 million for the three months ended March 31, 2023. The $1.8 million loss for the three months ended March 31, 2024, was primarily due to the remeasurement of intercompany balances denominated in U.S. Dollars between our Luxembourg entity and the U.S. The strengthening of the U.S. Dollar for the period ended March 31, 2024, relative to the Euro at December 31, 2023, triggered the remeasurement and unrealized losses. The gain of $1.0 million for the three months ended March 31, 2023, was a consequence of the U.S. Dollar weakening during the current period relative to the local functional currencies of our subsidiaries outside the U.S. The driver was unrealized foreign exchange gains related to intercompany balances denominated in U.S. Dollars owed from Luxembourg to our U.S. entities.
Other expense, net was a loss of $0.5 million for the three months ended March 31, 2024, an increase of 72% relative to the three months ended March 31, 2023, primarily driven by loss on asset disposal of $0.2 million.
Income Tax Provision (As Restated)
| | | | | | | | | | | | |
| | Three Months Ended March 31, | | | | |
(dollars in thousands) | | 2024 | | | 2023 | | | %
Change | |
| | (As Restated) | | | (As Restated) | | | | |
Income tax (benefit) provision | | $ | (9 | ) | | $ | 23 | | | | (139 | )% |
Income tax provision decreased an immaterial amount primarily due to the research and development expenditure deduction in our U.K. subsidiary.
Non-GAAP Financial Measures
We believe that in addition to our results determined in accordance with GAAP, non-GAAP Adjusted EBITDA is useful in evaluating our business, results of operations and financial condition. We believe that this non-GAAP financial measure may be helpful to investors because it provides consistency and comparability with past financial performance and facilitates period to period comparisons of operations, as this eliminates the effects of certain variables from period to period for reasons that we do not believe reflect our underlying business performance. In addition to our GAAP measures, we use this non-GAAP financial measure internally for budgeting and resource allocation purposes and in analyzing our financial results.
For the reasons set forth below, we believe that excluding the following items provides information that is helpful in understanding our results of operations, evaluating our future prospects, comparing our financial results across accounting periods, and comparing our financial results to our peers, many of which provide similar non-GAAP financial measures.
•Loss on decommissioned satellites. We exclude loss on decommissioned satellites because if there was no loss, the expense would be accounted for as depreciation and would also be excluded as part of our EBITDA calculation.
•Other (expense) income, net. We exclude other (expense) income, net because it includes unusual items that do not reflect the underlying operational results of our business. Examples of such expenses include prepayment penalties on outstanding debt and vendor dispute legal settlements.
•Stock-based compensation. We exclude stock-based compensation expenses primarily because they are non-cash expenses that we exclude from our internal management reporting processes. We also find it useful to exclude these expenses when we assess the appropriate level of various operating expenses and resource allocations when budgeting, planning, and forecasting future periods. Moreover, because of varying available valuation methodologies, subjective assumptions and the variety of award types that companies can use under Financial Accounting Standards Board ("FASB") ASC Topic 718, Stock Compensation (“ASC 718”), we believe excluding stock-based compensation expenses allows investors to make meaningful comparisons between our recurring core business results of operations and those of other companies.
•Change in fair value of warrant liabilities and contingent earnout liabilities. We exclude this as it does not reflect the underlying cash flows or operational results of the business.
•Loss on extinguishment of debt. We exclude this as it does not reflect the underlying cash flows or operational results of the business.
•Foreign exchange gain/loss. We are exposed to foreign currency gains or losses on outstanding foreign currency denominated receivables and payables related to certain customer sales agreements, product costs and other operating expenses. As we do not actively hedge these currency exposures, changes in the underlying currency rates relative to the U.S. Dollar may result in realized and unrealized foreign currency gains and losses between the time these receivables and payables arise and the time that they are settled in cash. Since such realized and unrealized foreign currency gains and losses are the result of macro-economic factors and can vary significantly from one period to the next, we believe that exclusion of such realized and unrealized gains and losses is useful to management and investors in evaluating the performance of our ongoing operations on a period-to-period basis.
•Amortization of purchased intangibles. We incur amortization expense for purchased intangible assets in connection with acquisitions of certain businesses and technologies. Amortization of intangible assets is a non-cash expense and is inconsistent in amount and frequency because it is significantly affected by the timing, size of acquisitions and the inherent subjective nature of purchase price allocations. Because these costs have already been incurred and cannot be recovered, and are non-cash expenses, we exclude these expenses for our internal management reporting processes. Our management also finds it useful to exclude these charges when assessing the appropriate level of various operating expenses and resource allocations when budgeting, planning and forecasting future periods. It is important to note that while this amortization expense is excluded for purposes of non-GAAP presentation, the revenue of the acquired businesses is reflected in the non-GAAP measures and that the assets contribute to revenue generation.
•Other acquisition accounting amortization. We incur amortization expense for purchased data rights in connection with the acquisition of exactEarth and certain technologies. Amortization of this asset is a non-cash expense that can be significantly affected by the inherent subjective nature of the assigned value and useful life. Because this cost has already been incurred and cannot be recovered, and is a non-cash expense, we exclude this expense for our internal management reporting processes. Our management also finds it useful to exclude this charge when assessing the appropriate level of various operating expenses and resource allocations when budgeting, planning and forecasting future periods. It is important to note that while this expense is excluded for purposes of non-GAAP presentation, the revenue of the acquired companies is reflected in the non-GAAP measures and that the assets contribute to revenue generation.
•Mergers and acquisition related expenses. We exclude these expenses as they are transaction costs and expenses associated with the transaction that are generally infrequent in nature and not reflective of the underlying operational results of our business. Examples of these types of expenses include legal, accounting, regulatory, other consulting services, severance, and other employee costs.
•Other unusual and infrequent costs. We exclude these as they are unusual items that do not reflect the ongoing operational results of our business. Examples of these types of expenses include accounting, legal and other professional fees associated with the preparation and filing of our September 2022 Form S-3 shelf registration statement and “at-the-market” offering prospectus supplement, and the December 2022 warrant exchange.
•EBITDA. We define EBITDA as net income (loss), plus depreciation and amortization expense, plus interest expense, and plus the provision for (or minus benefit from) income taxes.
•Adjusted EBITDA. We define Adjusted EBITDA as earnings before interest, taxes, depreciation and amortization, further adjusted for any loss on decommissioned satellites, launch failure and decommissioning, change in fair value of warrant liabilities, change in fair value of contingent earnout liability, other (expense) income, net, stock-based compensation, loss on extinguishment of debt, foreign exchange gain/loss, other acquisition accounting amortization, mergers and acquisition related expenses, and other unusual costs. We believe Adjusted EBITDA can be useful in providing an understanding of the underlying results of operations and trends, an enhanced overall understanding of our financial performance and prospects for the future. While Adjusted EBITDA is not a recognized measure under GAAP, management uses this financial measure to evaluate and forecast business performance. Adjusted EBITDA is not intended to be a measure of liquidity or cash flows from operations or a measure comparable to net income as it does not take into account certain requirements, such as capital expenditures and related depreciation, principal and interest payments, and tax payments. Adjusted EBITDA is not a presentation made in accordance with GAAP, and our use of the term Adjusted EBITDA may vary from the use of similarly titled measures by others in our industry due to the potential inconsistencies in the method of calculation and differences due to items subject to interpretation.
•The presentation of non-GAAP financial information should not be considered in isolation or as a substitute for, or superior to, the financial information prepared and presented in accordance with GAAP. Investors should note that the excluded items may have had, and may in the future have, a material impact on our reported financial results. Investors should read this discussion and analysis of our financial condition and results of operations together with the condensed consolidated financial statements and the related notes thereto also included within.
The following table outlines the reconciliation from net loss to Adjusted EBITDA for the periods indicated:
| | | | | | | | |
| | Three Months Ended March 31, | |
(in thousands) | | 2024 | | | 2023 | |
| | (As Restated) | | | (As Restated) | |
Net loss | | $ | (25,544 | ) | | $ | (18,655 | ) |
Depreciation & amortization | | | 6,837 | | | | 3,916 | |
Interest, net | | | 4,599 | | | | 4,013 | |
Taxes | | | (9 | ) | | | 269 | |
EBITDA | | | (14,117 | ) | | | (10,457 | ) |
Change in fair value of contingent earnout liability | | | 45 | | | | (76 | ) |
Change in fair value of warrant liabilities | | | 4,202 | | | | (746 | ) |
Issuance of stock warrants | | | 2,399 | | | | — | |
Foreign exchange loss (gain) | | | 1,786 | | | | (1,013 | ) |
Other expense, net | | | 534 | | | | 311 | |
Stock-based compensation | | | 3,628 | | | | 2,646 | |
Mergers and acquisition related expenses | | | — | | | | 1,015 | |
Loss on decommissioned satellites | | | 178 | | | | — | |
Other acquisition accounting amortization | | | 170 | | | | 166 | |
Adjusted EBITDA | | $ | (1,175 | ) | | $ | (8,154 | ) |
Limitations on the Use of Non-GAAP Financial Measures
There are limitations to using non-GAAP financial measures because non-GAAP financial measures are not prepared in accordance with GAAP and may be different from non-GAAP financial measures provided by other companies.
The non-GAAP financial measures are limited in value because they exclude certain items that may have a material impact upon our reported financial results. In addition, they are subject to inherent limitations as they reflect the exercise of judgments by management about which items are adjusted to calculate our non-GAAP financial measures. We compensate for these limitations by analyzing current and future results on a GAAP basis as well as a non-GAAP basis and also by providing GAAP measures in our public disclosures. Some of these limitations are:
•Although depreciation and amortization are non-cash charges, the assets being depreciated and amortized may have to be replaced in the future and Adjusted EBITDA does not reflect cash capital expenditure requirements for such replacements or for new capital expenditure requirements;
•Adjusted EBITDA does not reflect the significant interest expense, or the cash requirements necessary to service interest or principal payments, on our debt;
•Adjusted EBITDA does not reflect income tax payments that may represent a reduction in cash available to us; and
•Adjusted EBITDA does not reflect the decommissioned satellites deorbit, launch failure and decommissioning and does not reflect the cash capital expenditure requirements for the replacements of lost satellites. While these expenses could occur in a given year, the existence and magnitude of these costs could vary greatly and are unpredictable.
Non-GAAP financial measures should not be considered in isolation from, or as a substitute for, financial information prepared in accordance with GAAP. We encourage investors and others to review our financial information in its entirety, not to rely on any single financial measure to evaluate our business, and to view our non-GAAP financial measures in conjunction with the most directly comparable GAAP financial measures.
Liquidity and Capital Resources
Our principal sources of liquidity to fund our operations are from cash and cash equivalents and marketable securities, which totaled $63.7 million as of March 31, 2024, mainly from net proceeds from borrowings under the Blue Torch Credit Facility (as defined below), proceeds from the Private Placement and Offering (each as defined below), and the sale of common stock under the Equity Distribution Agreement with Canaccord Genuity LLC, as sales agent (the "Equity Distribution Agreement"). Of the $63.7 million total, $51.7 million was in cash and cash equivalents of which approximately $12.8 million was held outside of the United States. The remaining $12.0 million was held in short-term marketable securities, all of which was held in the United
States and which can be converted to cash with minimal transaction costs. These amounts compare to cash and cash equivalents, and marketable securities of $40.9 million as of December 31, 2023, of which $29.1 million was in cash and cash equivalents with $13.7 million held outside of the United States. The remaining $11.7 million was held in short-term marketable securities. The cash and cash equivalent amounts are exclusive of restricted cash which totaled $0.5 million as of each of March 31, 2024, and December 31, 2023.
On February 4, 2024, we entered into a securities purchase agreement for the issuance and sale of 833,333 shares of our Class A common stock to Signal Ocean Ltd at a price of $12.00 per share (the “Private Placement”). The Private Placement closed on February 8, 2024, resulting in gross proceeds to us of $10.0 million.
On March 21, 2024, we entered into a Securities Purchase Agreement with institutional investors (the “Investors”), pursuant to which we issued and sold in a registered direct offering (the “Offering”), (i) an aggregate of 2,142,858 shares of Class A common stock and (ii) warrants exercisable for an aggregate of 2,142,858 shares of Class A common stock ("Securities Purchase Agreement Warrants") to the Investors. Each share of Class A common stock and accompanying Securities Purchase Agreement Warrant to purchase one share of Class A common stock was sold at an offering price of $14.00. The aggregate gross proceeds to us from the Offering totaled $30.0 million before deducting the placement agent’s fees and related offering expenses. The Securities Purchase Agreement Warrants had an exercise price equal to $14.50 per share of Class A common stock, were exercisable for a term beginning on March 25, 2024 and expired on July 3, 2024 with no warrants exercised.
On March 21, 2024, we entered into a placement agency agreement (the “Placement Agency Agreement”) with Alliance Global Partners (“A.G.P” or the “Placement Agent”), pursuant to which we engaged A.G.P as the exclusive placement agent in connection with the Offering. We paid A.G.P a cash fee equal to 6% of the gross proceeds from the sale of shares and Securities Purchase Agreement Warrants to the Investors, or $1.8 million, in March 2024. We agreed to pay a cash fee equal to 4% of the gross exercise price paid in cash with respect to the exercise of the Securities Purchase Agreement Warrants. The par value of the common stock remains $0.001 per share after the Reverse Stock Split. All share and per share information has been retroactively adjusted to reflect the impact of the Reverse Stock Split for applicable periods presented.
Our ability to continue as a going concern for the next 12 months from the date of reissuance of these condensed consolidated financial statements is dependent upon our ability to obtain sufficient cash to meet our obligations, including the repayment of all amounts owed pursuant to the Blue Torch Financing Agreement (as amended, and as defined below), which is scheduled to mature on June 13, 2026. We have failed to meet our leverage ratio and the minimum liquidity financial covenants and SEC periodic filing requirement non-financial covenant under the Blue Torch Financing Agreement, and therefore Blue Torch has the right to accelerate and declare all or any portion of the loans outstanding under the Blue Torch Financing Agreement to be due and payable. Further, upon the filing of our 2023 Form 10-K/A, we failed to comply with the non-financial covenant requiring us to have a report or opinion of our auditor without an explanatory paragraph expressing substantial doubt about our ability to continue as a going concern. Based on our current cash and cash equivalents and investment in marketable securities balances and expected future financial results, if the Transactions (as defined below) do not close, we will not have sufficient liquidity to continue operations for at least the next twelve months from the reissuance of the accompanying condensed consolidated financial statements. Furthermore, we will not have sufficient cash to repay the balance of the loans outstanding under the Blue Torch Financing Agreement in the event Blue Torch declares all or any portion of the loan to be due and payable.
We entered into a Share Purchase Agreement (the “Purchase Agreement”) with Kpler Holding SA, a Belgian corporation (“Buyer”), pursuant to which we agreed to sell our maritime business to Buyer and enter into certain ancillary agreements (the “Transactions”). The maritime business to be sold pursuant to the Transactions does not include any part of our satellite network or operations. The purchase price to be paid by Buyer to us at the closing of the Transactions is a cash payment based upon an enterprise value of $233.5 million, subject to certain adjustments. The Transactions also include a twelve-month transition service and data provision agreement for $7.5 million. The Purchase Agreement provides that the closing of the Transactions is subject to the satisfaction or waiver of certain closing conditions set forth in the Purchase Agreement.
We believe all conditions to closing contained in the Purchase Agreement have been satisfied or could be satisfied. Notwithstanding our notice to Buyer to that effect, Buyer has failed to consummate the closing. Buyer has cited various reasons for declining to close, which we have rejected. We believe that Buyer’s failure to close is not consistent with the terms of the Purchase Agreement, which do not give Buyer the option to delay closing once all closing conditions have been met.
As a result of the foregoing, on February 10, 2025, we filed a complaint in the Delaware Court of Chancery against Buyer seeking a grant of specific performance ordering Buyer to satisfy its obligations under the Purchase Agreement and consummate the closing in accordance with the terms of the Purchase Agreement. In the complaint, we also requested a declaratory judgment declaring that Buyer has breached its obligations under the Purchase Agreement and is not excused from performing its obligations under the Purchase Agreement, including proceeding with the closing.
Kpler removed the matter to the District of Delaware, pursuant to a contract term in the Purchase Agreement promising not to contest removal to that court. The District of Delaware initially selected a March 4 trial date, but on February 26, 2025, the court set a trial date of May 28-30, 2025. There is no assurance as to what action the District of Delaware will take with respect to the proceeding initiated by us and there is no assurance as to whether or not the Transactions will be consummated on the terms contemplated or at all. The amount of any damages which may be sought or obtained from Buyer cannot be determined at this time.
We intend to use the proceeds from the closing of the Transactions to repay all amounts owed under the Blue Torch Financing Agreement. However, as described above, there is currently no assurance that the Transactions will close or when the Transactions may close. Given the expected delay in the closing of the Transactions, we intend to seek additional equity or debt financing (including securities convertible or exchangeable for equity) and may seek waivers of or amendments to contractual obligations, delay, limit, reduce, or terminate certain commercial efforts, or pursue merger, disposition or other strategies, any of which could adversely affect our business, results of operations, and financial condition. There is no assurance that we will be successful in achieving any of the foregoing. Due to our projected cash needs, including amounts owed pursuant to the Blue Torch Financing Agreement and our breach of our covenants under the Blue Torch Financing Agreement, there is substantial doubt about our ability to continue as a going concern for a period of at least 12 months from the date of reissuance of the accompanying condensed consolidated financial statements. The accompanying condensed consolidated financial statements do not include any adjustments that might result from the outcome of this uncertainty.
Blue Torch Credit Agreement
On June 13, 2022, we, as borrower, and certain of our subsidiaries, as guarantors, entered into a financing agreement (the “Blue Torch Financing Agreement”) with Blue Torch Finance LLC, as administrative agent and collateral agent, and certain lenders (the “Lenders”). The Blue Torch Financing Agreement provides for, among other things, a term loan facility in an aggregate principal amount of up to $120.0 million (the “Blue Torch Credit Facility”). A portion of the proceeds of the term loan was used to repay our then-existing $70.0 million credit facility with FP Credit Partners, L.P., and the remainder of the proceeds of the term loan may be used for general corporate purposes.
The Blue Torch Credit Facility is scheduled to mature on June 13, 2026, upon which we must repay the outstanding principal amount of any outstanding loans thereunder, together with all accrued but unpaid interest, fees and other obligations owing under the Blue Torch Credit Facility. Subject to certain exceptions, prepayments of the Blue Torch Credit Facility will be subject to early termination fees in an amount equal to 3.0% of the principal prepaid if prepayment occurs on or prior to the first anniversary of the closing date, 2.0% of principal prepaid if prepayment occurs after the first anniversary of the closing date but on or prior to the second anniversary of the closing date and 1.0% of principal prepaid if prepayment occurs after the second anniversary of the closing date but on or prior to the third anniversary of the closing date, plus if prepayment would have occurred on or prior to the first anniversary of the closing date, a make-whole amount equal to the amount of interest that would have otherwise been payable through the maturity date of the Blue Torch Credit Facility.
The $120.0 million term loan was available and drawn at closing, of which $19.7 million was placed in an escrow account by Blue Torch with such amount to be released upon our achieving certain metrics related to annualized recurring revenue and a total annualized recurring revenue leverage ratio. These metrics were achieved and the $19.7 million was released from the escrow account and delivered to us in February 2023. The term loan accrues interest at a floating rate, to be based, at our election, on either a reference rate or a 3-month Term Secured Overnight Financing Rate ("SOFR") rate (subject to a 1.0% floor), plus an interest rate margin of 7.0% for reference rate borrowings and 8.0% for 3-month Term SOFR borrowings, plus an incremental Term SOFR margin of 0.26161%. We elected the Term SOFR rate which was 13.5766% as of March 31, 2024. Principal on the term loan is only payable at maturity and interest on the term loan is due and payable quarterly for Term SOFR borrowings. We are also required to pay other customary fees and costs in connection with the Blue Torch Credit Facility, including a commitment fee in an amount equal to $2.4 million on the closing date, a $0.3 million agency fee annually and an exit fee in an amount equal to $1.8 million upon termination of the Blue Torch Financing Agreement.
Our obligations under the Blue Torch Financing Agreement are or will be guaranteed by certain of our domestic and foreign subsidiaries meeting materiality thresholds set forth in the Blue Torch Financing Agreement. Such obligations, including the guarantees, are secured by substantially all of our personal property and that of our subsidiary guarantors, including pursuant to a Security Agreement entered into on June 13, 2022, among us, Spire Global Subsidiary, Inc., Austin Satellite Design, LLC and Blue Torch. As of the closing date, such subsidiary guarantors were Spire Global Subsidiary, Inc., Austin Satellite Design, LLC, Spire Global Canada Subsidiary Corp. and exactEarth Ltd.
The Blue Torch Financing Agreement contains customary affirmative and negative covenants limiting our ability and the ability of our subsidiaries to, among other things, dispose of assets, undergo a change in control, merge or consolidate, make acquisitions, incur debt, incur liens, pay dividends, repurchase stock and make investments, in each case subject to certain exceptions. We must also comply with a maximum debt to annualized recurring revenue leverage ratio financial covenant tested monthly during the first two years of the Blue Torch Financing Agreement, a maximum debt to EBITDA leverage ratio financial covenant tested monthly during the third and fourth years of the Blue Torch Financing Agreement and a minimum liquidity financial covenant tested at all times. As of March 31, 2024, we were in compliance with all applicable financial covenants under the Blue Torch Financing Agreement.
The Blue Torch Financing Agreement also contains customary events of default that include, among other things, certain payment defaults, cross defaults to other indebtedness, inaccuracy of representations and warranties, covenant defaults, change of control defaults, judgment defaults, and bankruptcy and insolvency defaults. If an event of default exists, Blue Torch as agent on behalf of the Lenders may require immediate payment of all obligations under the Blue Torch Financing Agreement and may exercise certain other rights and remedies provided for under the Blue Torch Financing Agreement, the other loan documents and applicable law. Under certain circumstances, a default interest rate will apply on all obligations during the existence of an event of default under the Blue Torch Financing Agreement at a per annum rate equal to 2.00% above the applicable interest rate.
On September 27, 2023, we entered into the Waiver and Amendment No. 2 to Financing Agreement (the “Waiver and Amendment”) with Blue Torch and the Lenders, which amends the Blue Torch Financing Agreement to (a) waive an event of default under the Blue Torch Financing Agreement arising out of the total annualized recurring revenue leverage ratio being greater than the permitted ratio, (b) amend the financial covenants to provide covenant relief from the maximum debt to annualized recurring revenue leverage ratio and the maximum debt to EBITDA leverage ratio set forth in the Blue Torch Financing Agreement for future periods, and (c) provide for a second amendment exit fee. The second amendment exit fee is $1.8 million (which is an amount equal to one and a half percent (1.50%) of the aggregate outstanding principal balance of the term loans on the effective date of the Waiver and Amendment), bears interest from the date of the Waiver and Amendment at Adjusted Term SOFR for a 3-month interest period plus the applicable margin under the Financing Agreement, and is payable to Blue Torch by us in cash upon the termination of the Blue Torch Financing Agreement, either as a result of acceleration of the loans or at the final maturity date. The Waiver and Amendment required a repayment by the Company of $2.5 million of the outstanding principal balance of the term loans on October 2, 2023, with a prepayment premium of $0.05 million. The Waiver and Amendment also requires additional reporting if our liquidity level is less than $35.0 million at any time during a month and revises the minimum liquidity covenant to require liquidity of at least $30.0 million at all times, commencing on September 30, 2023, which in both cases represent a $5.0 million incremental change from the original requirements. We were in compliance with all applicable financial covenants as of March 31, 2024.
On June 13, 2022, in connection with the Blue Torch Financing Agreement, we issued warrants to affiliates of the Lenders to purchase shares of Class A common stock (the “2022 Blue Torch Warrants”), which were exercisable for an aggregate of 437,025 shares of our Class A common stock with a per share exercise price of $16.08.
On June 13, 2022, in connection with the closing of the financing, we paid Urgent Capital LLC, a Delaware limited liability company, a fee for introducing us to the Lenders, for the purpose of loan financing, in the amount equal to $0.6 million in cash and a warrant to purchase shares of Class A common stock (the “GPO Warrant” and, collectively with the 2022 Blue Torch Warrants and the 2023 Blue Torch Warrants (as defined below), the “Credit Agreement Warrants”), which is exercisable for an aggregate of 24,834 shares of our Class A common stock with a per share exercise price of $16.08.
On September 27, 2023, in connection with the Waiver and Amendment, we and certain affiliates of Blue Torch amended and restated the 2022 Blue Torch Warrants to reduce the per share exercise price from $16.08 to $5.44. We also concurrently issued
new warrants to those affiliates that are exercisable for an additional 597,082 shares of the Company’s Class A common stock at a per share exercise price of $5.44 (the “2023 Blue Torch Warrants").
The Credit Agreement Warrants may be exercised on a cashless basis. The Credit Agreement Warrants are exercisable for a term beginning on the date of issuance and ending on the earlier to occur of ten years from the date of issuance or the consummation of certain of our acquisitions as set forth in the Credit Agreement Warrants. The number of shares for which the Credit Agreement Warrants are exercisable and the associated exercise price are subject to certain proportional adjustments as set forth in the Credit Agreement Warrants.
On April 8, 2024, we entered into Amendment No. 3 to Financing Agreement (the “Third Amendment”) with Blue Torch and the Lenders, which amends the Blue Torch Financing Agreement to (i) increase the maximum debt to EBITDA leverage ratio for the monthly periods ending June 30, 2024, July 31, 2024 and August 31, 2024 and to decrease the maximum permitted ratio thereafter, and (ii) amend the minimum liquidity covenant to require liquidity of at least $20.0 million at all times, commencing on April 8, 2024, which represents a $10.0 million decrease from the requirement in effect immediately prior to the effective date of the Third Amendment. On April 8, 2024, in accordance with the terms of the Third Amendment, we made a repayment to Blue Torch of $10.0 million in principal, plus an early termination fee of $0.2 million.
Government Loan
As part of the Acquisition in November 2021, we assumed a loan agreement with the Strategic Innovation Fund ("SIF") which was recorded at fair value of the debt. As of March 31, 2024, $5.0 million was included in long-term debt, non-current on our unaudited condensed consolidated balance sheets related to the SIF loan agreement. Under this agreement and subsequent amendment, we were eligible to receive funding for certain expenditures incurred from February 13, 2018 to May 12, 2023, up to a maximum of $5.7 million. The loan is repayable in 15 annual payments beginning February 28, 2026 and has a stated interest rate of zero.
For additional information, see Note 7 to our unaudited condensed consolidated financial statements included in this Quarterly Report on Form 10-Q/A.
Equity Distribution Agreement
On September 14, 2022, we entered into the Equity Distribution Agreement with Canaccord Genuity LLC, as sales agent. In accordance with the terms of the Equity Distribution Agreement, we may offer and sell shares of our Class A common stock having an aggregate offering price of up to $85.0 million from time to time through the agent pursuant to a registration statement on Form S-3, which became effective on September 26, 2022. In June 2023, we sold approximately 2.2 million shares of our Class A common stock through this arrangement, resulting in net proceeds of $7.9 million. As of March 31, 2024, approximately $76.8 million of shares were remaining, but had not yet been sold, under the Equity Distribution Agreement.
Cash Flows (As Restated)
The following table summarizes our net cash used in operating activities, net cash used in investing activities, and net cash provided by financing activities for the periods indicated:
| | | | | | | | |
| | Three Months Ended March 31, | |
(in thousands) | | 2024 | | | 2023 | |
| | (As Restated) | | | (As Restated) | |
Net cash used in operating activities | | $ | (8,850 | ) | | $ | (12,726 | ) |
Net cash used in investing activities | | $ | (7,179 | ) | | $ | (5,521 | ) |
Net cash provided by financing activities | | $ | 38,148 | | | $ | 19,886 | |
Cash Flows from Operating Activities (As Restated)
Our largest source of operating cash inflows is cash collections from our customers. Our primary uses of cash from operating activities are for employee-related expenditures, expenses related to our technology infrastructure, expenses related to our computing infrastructure (including computing power, database storage and content delivery costs), building infrastructure costs (including leases for office space), fees for third-party services, and marketing program costs.
Net cash used in operating activities was $8.9 million for the three months ended March 31, 2024. This reflected our net loss of $25.5 million, adjustments for non-cash items of $19.2 million and a net increase of $2.8 million in net operating assets. Non-cash items primarily consisted of $6.8 million of depreciation and amortization expense, $4.2 million change in fair value of warrant liabilities, $3.6 million of stock-based compensation expense, $2.4 million of issuance of stock warrants expense, $0.9 million of debt issuance amortization costs, $0.8 million of amortization of operating lease right-of-use assets, a $0.4 million loss on decommissioned satellites and impairment of assets, and a $0.2 gain on other, net. Changes in operating assets and liabilities primarily included a $7.1 million decrease in contract liabilities, a $2.6 million increase in accounts receivable, net, a $1.5 million decrease in accounts payable, a $0.9 million decrease in operating lease liabilities, and a $0.6 million increase in contract assets, partially offset by a $8.1 million decrease in other current assets, a $1.0 million increase in other accrued expenses, a $0.5 million decrease in other long-term assets, and a $0.3 million increase in accrued wages and benefits.
Net cash used in operating activities was $12.7 million for the three months ended March 31, 2023. This reflected our net loss of $18.7 million, adjustments for non-cash items of $6.2 million and a net increase of $0.2 million in net operating assets. Non-cash items primarily included $3.9 million of depreciation and amortization expense, $2.6 million of stock-based compensation, $0.6 million of debt issuance amortization costs, and $0.2 million of amortization of operating lease assets, partially offset by a $0.7 million gain on change in fair value of warrant liability, a $0.4 million gain on other, net, and a $0.1 million gain on change in fair value of contingent earnout liability. Changes in operating assets and liabilities primarily included a $0.9 million decrease in other accrued expenses, a $0.8 million increase in contract assets, a $0.7 million increase in other current assets, a $0.6 million decrease in accounts payable, and a $0.2 million decrease in operating lease liabilities, partially offset by a $2.2 million increase in contract liabilities, a $0.4 million decrease in other long-term assets, a $0.3 million increase in accrued wages and benefits, and a $0.1 million decrease in accounts receivable, net.
Cash Flows from Investing Activities (As Restated)
Cash flows from investing activities primarily relate to cash used for business acquisitions, the procurement, development, and deployment of capital assets, including satellites and related launch costs, ground stations, machinery and equipment, furniture, computer equipment and software, and leasehold improvements.
The following table summarizes our net cash used in investing activities relating to capital expenditures by source of spend:
| | | | | | | | | | | | |
| | Three Months Ended March 31, | | | % | |
(dollars in thousands) | | 2024 | | | 2023 | | | Change | |
Spire platform / Infrastructure | | $ | 609 | | | $ | 1,354 | | | | (55 | )% |
Customer funded (Space Services) | | | 6,450 | | | | 1,859 | | | | 247 | % |
Total CapEx | | $ | 7,059 | | | $ | 3,213 | | | | 120 | % |
Net cash used in investing activities was $7.2 million for the three months ended March 31, 2024. This was driven by purchases of $10.9 million in short-term investments and $7.1 million of investment in property and equipment, partially offset by $10.8 million in maturities of short-term investments.
Net cash used in investing activities was $5.5 million for the three months ended March 31, 2023. This was driven by purchases of $13.9 million in short-term investments and $3.2 million of investment in property and equipment, partially offset by $11.6 million in maturities of short-term investments.
Cash Flows from Financing Activities
Cash flows from financing activities relate primarily to net proceeds from the issuance of long-term debt, convertible notes, warrants and Class A common stock.
Net cash provided by financing activities was $38.1 million for the three months ended March 31, 2024. This was driven by $37.9 million of proceeds from securities purchase agreements with Signal Ocean Ltd. and certain institutional investors and $0.3 million of proceeds from exercise of stock options.
Net cash provided by financing activities was $19.9 million for the three months ended March 31, 2023. This was driven by $19.9 million from the Blue Torch term loan that was released from escrow in the quarter.
Critical Accounting Policies and Estimates
Our condensed consolidated financial statements are prepared in accordance with GAAP. In the preparation of these condensed consolidated financial statements, we are required to make certain estimates and assumptions that affect the reported amounts of assets, liabilities, revenue, costs and expenses and related disclosures. On an ongoing basis, we evaluate our estimates and assumptions. Our actual results may differ from these estimates under different assumptions or conditions.
There have been no material changes to our critical accounting policies and estimates as compared to those disclosed in Part II, Item 7, "Management's Discussion and Analysis of Financial Condition and Results of Operations - Critical Accounting Policies and Estimates" in our Amended 2023 Form 10-K/A.
Accounting Pronouncements Recently Adopted and Not Yet Adopted
See Note 3 to our unaudited condensed consolidated financial statements included in this Quarterly Report on Form 10-Q.
Emerging Growth Company Status
We are an “emerging growth company,” as defined in Section 2(a)(19) of the Securities Act of 1933, as amended, as modified by the Jumpstart our Business Startups Act (the "JOBS Act"). Under the JOBS Act, emerging growth companies can delay adopting new or revised accounting standards issued subsequent to the enactment of the JOBS Act until such time as those standards apply to private companies. We have elected to use this extended transition period for complying with new or revised accounting standards that have different effective dates for public and private companies until the earlier of the date that we are (i) no longer an emerging growth company or (ii) affirmatively and irrevocably opt out of the extended transition period provided in the JOBS Act. As a result, our consolidated financial statements may not be comparable to companies that comply with the new or revised accounting pronouncements as of public company effective dates.
Smaller Reporting Company Status
Additionally, we are a “smaller reporting company” as defined in Item 10(f)(1) of Regulation S-K. Smaller reporting companies may take advantage of certain reduced disclosure obligations, including, among other things, providing only two years of audited financial statements. We will remain a smaller reporting company until the last day of the fiscal year in which (i) the market value of our common stock held by non-affiliates exceeds $250 million as of the prior June 30, or (ii) our annual revenues exceeded $100 million during such completed fiscal year and the market value of our common stock held by non-affiliates exceeds $700 million as of the prior June 30.
Item 3. Quantitative and Qualitative Disclosures about Market Risk
Foreign Currency Exchange Risk
Our results of operations and cash flows are subject to fluctuations due to changes in foreign currency exchange rates, particularly changes in the Euro, British Pound Sterling, Singapore Dollar, and Canadian Dollar and may be adversely affected in the future due to changes in foreign currency exchange rates. We continue to experience foreign currency fluctuations primarily due to the periodic re-measurement of our foreign currency monetary account balances that are denominated in currencies other than the functional currency of the entities in which they are recorded. Changes in exchange rates may negatively affect our revenue and other results of operations as expressed in U.S. Dollars. We do not currently engage in foreign exchange hedging contracts. As we continue to expand our international presence, we will assess options for mitigating foreign exchange risk.
We have experienced and will continue to experience fluctuations in our net loss as a result of gains or losses related to revaluing certain asset and current liability balances that are denominated in currencies other than the functional currency of the entities in which they are recorded. We had a loss of $1.8 million and a gain of $1.0 million for the three months ended March 31, 2024 and 2023, respectively. A hypothetical 10% strengthening or weakening of the U.S. Dollar relative to the currencies in
which our revenue and expenses are denominated would have resulted in an increase or decrease, respectively, in our pre-tax loss of approximately $0.7 million for the three months ended March 31, 2024.
Interest Rate Sensitivity
As of March 31, 2024, we had cash and cash equivalents totaling $51.7 million, which were held primarily in demand deposit accounts, and $12.0 million in investment in short-term marketable securities. The cash and cash equivalents are held for working capital purposes or strategic investment purposes.
We are exposed to market risks related to fluctuations in interest rates related to the Blue Torch Credit Facility. The Blue Torch Credit Facility accrues interest at a floating rate, to be based, at our election, on either a reference rate or a 3-month Term SOFR rate (subject to a 1.0% floor), plus an interest rate margin of 7.0% for reference rate borrowings and 8.0% for 3-month Term SOFR borrowings, plus an incremental Term SOFR margin of 0.26161%. Accordingly, increases in SOFR could increase our interest payments under the Blue Torch Credit Facility. For example, a hypothetical increase of 100 basis points in the interest rate of the Blue Torch Credit Facility would have an approximately $1.0 million impact on an annual basis on our results of operations. The SIF loan is interest free.
Inflation Risk
We are exposed to inflation risk. Inflationary factors, such as increases in component parts, labor and other overhead expenses, could impair our operating results. Although there has been a significant increase in inflation in recent periods, it has not had a substantial impact on our results of operations for the three months ended March 31, 2024 or 2023. However, a higher rate of inflation in the future may have a negative impact on our operational and capital expenditures which we may not be able to pass along as cost increases to our customers.
Item 4. Controls and Procedures
Evaluation of Disclosure Controls and Procedures
Disclosure controls and procedures are controls and other procedures that are designed to ensure that information required to be disclosed in our reports filed or submitted under the Securities Exchange Act of 1934, as amended ("Exchange Act"), is recorded, processed, summarized, and reported within the time periods specified in the SEC’s rules and forms. Disclosure controls and procedures include, without limitation, controls and procedures designed to ensure that information required to be disclosed in company reports filed or submitted under the Exchange Act is accumulated and communicated to management, including our principal executive officer and principal financial officer, to allow timely decisions regarding required disclosure.
We performed an evaluation under the supervision and with the participation of management, including our principal executive officer and principal financial officer, of the effectiveness of the design and operation of our disclosure controls and procedures (as such term is defined in Rule(s) 13a-15(e) and 15d-15(e) under the Exchange Act) as of March 31, 2024. Based upon that evaluation, our principal executive officer and principal financial officer concluded that our disclosure controls and procedures were not effective as of March 31, 2024 because of the material weaknesses in internal control over financial reporting described below.
Notwithstanding the material weaknesses described below, our management has concluded that our condensed consolidated financial statements for the periods covered by and included in this Quarterly Report are prepared in accordance with accounting principles generally accepted in the United States (“GAAP”) and fairly present, in all material respects, our financial position, results of operations and cash flows for each of the periods presented herein.
Material Weaknesses in Internal Control over Financial Reporting
We have identified material weaknesses in our internal control over financial reporting. A material weakness is a deficiency, or a combination of deficiencies, in internal control over financial reporting such that there is a reasonable possibility that a material misstatement of our annual or interim financial statements will not be prevented or detected on a timely basis. The
following material weaknesses were identified:
i.We did not design and maintain an effective control environment commensurate with the financial reporting requirements of a public company. Specifically, we lacked a sufficient number of professionals with an appropriate level of internal controls and accounting knowledge, training, and experience to appropriately analyze, record and disclose accounting matters timely and accurately. Additionally, the lack of a sufficient number of professionals resulted in an inability to consistently establish appropriate authorities and responsibilities in pursuit of our financial reporting objectives, as demonstrated by, among other things, insufficient segregation of duties in our finance and accounting functions. This material weakness contributed to the following additional material weaknesses.:
ii.We did not design and maintain an effective risk assessment process at a precise enough level to identify new and evolving risks of material misstatement in our financial statements. Specifically, changes to existing controls or the implementation of new controls have not been sufficient to respond to changes to the risks of material misstatement in the financial statements.
iii.We did not design and maintain effective controls over the segregation of duties related to journal entries and account reconciliations. Specifically, certain personnel have the ability to both (a) create and post journal entries within our general ledger system, and (b) prepare and review account reconciliations.
The material weaknesses above resulted in certain immaterial audit adjustments, which were recorded prior to the issuance of the consolidated financial statements as of and for the year ended December 31, 2020.
iv.We did not design and maintain effective controls over the accounting for our Space Services and R&D Services solutions contracts with customers. Specifically, we did not design and maintain effective controls over the identification of performance obligations to ensure revenue is recognized at the time performance obligations are satisfied, the identification and accounting for embedded leases, the classification and accounting for costs incurred in connection with performing services, and the recognition of allowances for current expected credit losses. This material weakness resulted in the restatement of our previously filed financial statements for the Affected Periods.
v.We did not design and maintain effective controls related to the identification of and accounting for certain non-routine, unusual or complex transactions, including the proper application of GAAP to such transactions. Specifically, we did not design and maintain:
a.controls to timely identify and account for warrant instruments, which resulted in the restatement of the previously issued financial statements of NavSight related to adjustments to warrant liabilities and equity as of and for the year ended December 31, 2020;
b.controls to account for business combinations, including the associated valuation estimates and the completeness and accuracy of the opening balance sheet, which did not result in a misstatement to our consolidated financial statements; and
c.controls to timely identify and account for the fair value of the contingent earnout liability, which resulted in an error in the fair value of the contingent earnout liability in, and the restatement of, our previously issued unaudited condensed consolidated financial statements as of and for each of the interim periods ended September 30, 2021, March 31, 2022 and June 30, 2022 and our consolidated financial statements as of and for the year ended December 31, 2021.
Additionally, each of the material weaknesses described above could result in a misstatement of substantially all of our accounts or disclosures that would result in a material misstatement to the annual or interim consolidated financial statements that would not be prevented or detected.
vi.We did not design and maintain effective controls over certain information technology (“IT”) general controls for information systems that are relevant to the preparation of our financial statements. Specifically, we did not design and maintain:
a.user access controls to ensure appropriate segregation of duties and that adequately restrict user and privileged access to financial applications, programs, and data to appropriate company personnel;
b.program change management controls for our financial systems to ensure that IT program and data changes affecting financial IT applications and underlying accounting records are identified, tested, authorized, and implemented appropriately; and
c.testing and approval controls for program development to ensure that new software development is aligned with business and IT requirements.
These IT deficiencies did not result in a misstatement to the financial statements; however, the deficiencies, when aggregated, could impact our ability to maintain effective segregation of duties, as well as the effectiveness of IT-dependent controls (such as automated controls that address the risk of material misstatement to one or more assertions, along with the IT controls and underlying data that support the effectiveness of system-generated data and reports) that could result in misstatements potentially impacting all financial statement accounts and disclosures that would result in a material misstatement to the annual or interim financial statements that would not be prevented or detected. Accordingly, management has determined these deficiencies in the aggregate constitute a material weakness.
Remediation Efforts on Material Weaknesses in Internal Control over Financial Reporting
In response to the material weaknesses identified, we have implemented several changes to our internal control over financial reporting and will continue performing remedial actions in 2024, as described below.
The remediation and ultimate resolution of each of the material weaknesses will be reviewed with the Audit Committee of the Company’s Board of Directors.
We have made progress to address the material weaknesses related to the control environment, as described below:
Key Professionals
In fiscal 2022 and 2023 and continuing to date, we identified and hired a number of professionals with appropriate levels of internal controls and accounting knowledge to improve the overall domestic and international financial accounting and reporting departments. The positions hired include chief accounting officer, director of accounting and Americas controller, director of technical accounting, accounting manager, senior and staff accountants, senior financial systems manager, and system administrator. In addition, we engaged with external consultants and experts to provide technical accounting and financial systems services. The Company continues to monitor personnel requirements and expertise needed to have an effective control environment, including providing necessary ongoing training to its finance and accounting personnel.
Risk Assessment
We engaged a third-party consulting firm to assist in designing and implementing a risk assessment process to identify and evaluate changes in the Company’s business and the impact on its internal controls. During fiscal 2023, we conducted a financial risk assessment to identify key business processes and establish internal materiality thresholds. We performed walkthroughs of all key processes, identified key controls, and developed narratives describing risk points, processes, and corresponding controls. A Risk and Control Matrix (RCM) was created to serve as the basis for a testing program in progress.
We engaged a third-party consulting firm to complete an initial Enterprise Risk Assessment ("ERA"). During fiscal 2023, with the assistance of the consulting firm, we identified key risks for technology-based organizations and interviewed management team members and the Chair of the Audit Committee to discuss key risk areas. We reviewed responses received, compiled a list of identified risks, and developed heat maps to depict the likelihood, impact, and preparedness of the Company to respond to the identified risks. Action and testing plans are being developed to address the risks and testing is in process, after which results will be monitored and reviewed with management. We are planning to perform an annual ERA to confirm that key risks remain current and relevant, and to identify any new key risk areas.
Segregation of Duties
During fiscal year 2022, we completed our initial assessment on segregation of duties with assistance from a third-party consulting firm and began our analysis across all processes and locations, including establishing appropriate authorities and responsibilities. During 2022, we designed and implemented controls over the segregation of duties related to journal entries and account reconciliations, including the implementation of automated controls, which replaced previously manual detective controls, designed to prevent the ability for the same person to create and post journal entries in our general ledger system. With the hiring of additional personnel including a senior financial system manager in late 2022, and an accounts receivable specialist and a senior accountant in 2023, we were able to implement additional automated controls and to further segregate the preparation and review of account reconciliations during fiscal year 2023. During the first three months of fiscal year 2024, we implemented accounting software to automate the segregation between the preparation and review of account reconciliations. Additionally, we have reviewed segregation of duties within our key accounting processes and developed a plan to remediate segregation of duties issues.
Non-routine, Unusual or Complex Transactions
Over the course of 2022, we hired key accounting personnel and engaged with third-party technical accounting experts to improve our controls related to the identification of and proper application of GAAP accounting for non-routine, unusual, or complex transactions. Since the Merger that occurred in August 2021, warrant instruments have been accounted for in accordance with the Company’s accounting policies based on GAAP. During the fourth quarter of 2022, Management trained the accounting team and designed new controls to timely identify and account for the fair value of the contingent earnout liability, and hired a third-party technical accounting firm to assist with the proper application of GAAP for non-routine, unusual, or complex transactions, including any business combinations that may arise in the future. We have tested the controls designed for non-routine, unusual or complex transactions and are in the process of monitoring the controls for operating effectiveness.
IT General Controls
Management designed and maintained testing and approval controls for program development to ensure that the software is aligned with business and IT requirements. This includes final approval and testing of the software prior to migration to production. Over the course of 2022 and continuing through 2024, the Company designed and implemented certain IT general controls, including controls over user access rights and privileges and change management.
Space Services and R&D Services Contracts
We are implementing measures designed to improve our internal control over financial reporting to remediate the material weakness over the accounting for our Space Services and R&D Services contracts with customers. In our remediation plan, we are including enhanced training, updating our revenue recognition procedures, and engaging external experts to assist with complex revenue contract arrangements.
While the above actions and planned actions are subject to ongoing management evaluation and will require validation and testing of the design and operating effectiveness of internal controls over a sustained period, we are committed to continuous improvement and will continue to diligently review our internal control over financial reporting. The material weaknesses will not be considered remediated until management completes the design and implementation of the measures described above, until the controls operate for a sufficient period of time, and until management has concluded, through testing, that the controls are effective.
Limitations on Effectiveness of Controls and Procedures
Our management, including our principal executive officer and principal financial officer, do not expect that our disclosure controls and procedures or our internal control over financial reporting will prevent all errors and all fraud. A control system, no matter how well designed and operated, can provide only reasonable, not absolute, assurance that the objectives of the control system are met. Further, the design of a control system must reflect the fact that there are resource constraints, and the benefits of controls must be considered relative to their costs. Because of the inherent limitations in all control systems, no evaluation of controls can provide absolute assurance that all control issues and instances of fraud, if any, have been detected. These inherent
limitations include the realities that judgments in decision-making can be faulty, and that breakdowns can occur because of a simple error or mistake. Additionally, controls can be circumvented by the individual acts of some persons, by collusion of two or more people, or by management override of the controls. The design of any system of controls is also based in part upon certain assumptions about the likelihood of future events, and there can be no assurance that any design will succeed in achieving its stated goals under all potential future conditions; over time, controls may become inadequate because of changes in conditions, or the degree of compliance with policies or procedures may deteriorate. Due to inherent limitations in a cost-effective control system, misstatements due to error or fraud may occur and not be detected.
Changes in Internal Control over Financial Reporting
There have been no changes (other than those described above) in our internal control over financial reporting during the fiscal quarter ended March 31, 2024 that have materially affected, or are reasonably likely to materially affect, our internal control over financial reporting.
PART II—OTHER INFORMATION
Item 1. Legal Proceedings.
From time to time, we are involved in various legal proceedings arising from the normal course of business activities.
Stockholder Litigation
On August 20, 2024, we and two of our executive officers were named as defendants in a purported federal securities law class action filed in the United States District Court for the Eastern District of Virginia, captioned Michal Bousso v. Spire Global, Inc. et al., Court File No. 1:24-cv-1458 (the "Bousso Lawsuit"). On October 14, 2024, a second plaintiff filed a similar lawsuit against us and three current or former executive officers, also in the United States District Court for the Eastern District of Virginia, captioned Kohei Tagawa v. Spire Global, Inc. et al., Court File No. 1:24-cv-1810 (the “Tagawa Lawsuit”). On November 22, 2024, the court consolidated the Bousso Lawsuit and the Tagawa Lawsuit, appointed Michal Bousso as lead plaintiff, and renamed the case to “In re Spire Global, Inc. Securities Litigation,” Master File No. 1:24-cv-1458-MSN-WEF (the “Master Securities Lawsuit”). On December 23, 2024, the plaintiff filed an amended complaint in the Master Securities Lawsuit, which alleges violations of Sections 10(b) and 20(a) of the Exchange Act (and Rule 10b-5 thereunder), arising from or relating to our announcements in August 2024 that certain of our previously issued audited and unaudited financial statements should not be relied upon. Plaintiff alleges that we and the individual defendants made false or misleading statements relating to (1) how revenue was recognized for pre-space services for certain space contracts, and (2) how costs for certain contracts were characterized. The plaintiff seeks to represent a class of shareholders who purchased or otherwise acquired our common stock between May 11, 2022 and August 14, 2024. The plaintiff seeks damages and other relief, including attorneys' fees and costs. The defendants are vigorously defending this lawsuit. On January 22, 2025, the defendants moved to dismiss the amended complaint in its entirety. Briefing on Defendants’ motion to dismiss is scheduled to be completed by the end of February 2025, and the motion is presently scheduled to be heard by the Court on March 14, 2025. By statute, discovery is stayed in the Master Securities Lawsuit until the resolution of Defendants’ motion to dismiss.
On September 5, 2024, a stockholder derivative lawsuit was filed in the United States District Court for the Eastern District of Virginia, purportedly on behalf of us against certain of our officers and directors and us (as a nominal defendant), captioned Lawrence Hollin v. Platzer et al., Court File No. 1:24-cv-01558 (the “Hollin Lawsuit”). On September 10, 2024, a second stockholder derivative lawsuit was filed in the United States District Court for the Eastern District of Virginia, also purportedly on behalf of us against certain of our officers and directors and us (as a nominal defendant), captioned Richard Cobb v. Platzer et al., Court File No. 1:24-cv-01596 (the “Cobb Lawsuit”). On November 12, 2024, a third stockholder derivative lawsuit was filed in the United States District Court for the Eastern District of Virginia, also purportedly on behalf of us against certain of our officers and directors and us (as a nominal defendant) captioned L. Robert Oros v. Platzer et al., 1:24-cv-02020 (the “Oros Lawsuit”). On November 14, 2024, the Court consolidated the Hollin Lawsuit and the Cobb Lawsuit and renamed the case to In re Spire Global, Inc. Stockholder Derivative Litigation, No. 1:24-cv-01596 (the “Master Derivative Case”). On December 2, 2024, the Court consolidated the Oros Lawsuit into the Master Derivative Case. The lawsuits in the Master Derivative Case arise out of the same subject matter as the Master Securities Lawsuit, and they allege some or all of the following claims: (1) breach of fiduciary duty; (2) gross mismanagement; (3) waste of corporate assets; (4) unjust enrichment; (5) as against the
director defendants, violations of Section 14(a) of the Exchange Act and Rule 14a-9 promulgated thereunder; (6) as against the officer defendants, contribution under Sections 10(b) and 21D of the Exchange Act; and (7) aiding and abetting. Each of the lawsuits in the Master Derivative Case seeks damages and other relief, including attorneys' fees and costs. The Master Derivative Case is currently stayed pending the motion to dismiss in the Master Securities Lawsuit.
Share Purchase Agreement Litigation
As previously disclosed, on November 13, 2024, we entered into a Share Purchase Agreement (the “Purchase Agreement”) with Kpler Holding SA, a Belgian corporation (“Buyer”), pursuant to which we agreed to sell our maritime business to Buyer and enter into certain ancillary agreements (the “Transactions”). The maritime business to be sold pursuant to the Transactions does not include any part of our satellite network or operations. The purchase price to be paid by Buyer to us at the closing of the Transactions is a cash payment based upon an enterprise value of $233.5 million, subject to certain adjustments. The Transactions also include a twelve-month transition service and data provision agreement for $7.5 million. The Purchase Agreement provides that the closing of the Transactions is subject to the satisfaction or waiver of certain closing conditions set forth in the Purchase Agreement.
We believe all conditions to closing contained in the Purchase Agreement have been satisfied or could be satisfied. Notwithstanding our notice to Buyer to that effect, Buyer has failed to consummate the closing. Buyer has cited various reasons for declining to close, which we have rejected. There is currently no governmental order in effect prohibiting closing and, in the Purchase Agreement, Buyer agreed to “use best efforts, and to take any and all actions necessary, to eliminate each and every impediment that is asserted” by relevant government entities so as to enable the parties to consummate the Transactions promptly. We believe that Buyer’s failure to close is not consistent with the terms of the Purchase Agreement, which do not give Buyer the option to delay closing once all closing conditions have been met.
As a result of the foregoing, on February 10, 2025, we filed a complaint in the Delaware Court of Chancery against Buyer seeking a grant of specific performance ordering Buyer to satisfy its obligations under the Purchase Agreement and consummate the closing in accordance with the terms of the Purchase Agreement. In the complaint, we also requested a declaratory judgment declaring that Buyer has breached its obligations under the Purchase Agreement and is not excused from performing its obligations under the Purchase Agreement, including proceeding with the closing.
Kpler removed the matter to the District of Delaware, pursuant to a contract term in the Purchase Agreement promising not to contest removal to that court. The District of Delaware initially selected a March 4 trial date, but on February 26, 2025, the court set a trial date of May 28-30, 2025. There is no assurance as to what action the District of Delaware will take with respect to the proceeding initiated by us and there is no assurance as to whether or not the Transactions will be consummated on the terms contemplated or at all. Whether or not the Transactions are consummated as required, we reserve all of our rights under the Purchase Agreement and in law and equity, including the right to seek damages and other remedies from Buyer. The amount of any damages which may be sought or obtained from Buyer cannot be determined at this time.
Except as disclosed above, we are not currently a party to any legal proceedings that, if determined adversely to us, would, in our opinion, have a material adverse effect on our business, results of operations, financial condition, or cash flows. Future litigation may be necessary to defend ourselves, our partners, and our customers by determining the scope, enforceability, and validity of third-party proprietary rights, or to establish our proprietary rights. The results of any current or future litigation cannot be predicted with certainty, and regardless of the outcome, litigation can have an adverse impact on us because of defense and settlement costs, diversion of management resources, and other factors.
Item 1A. Risk Factors.
Our operations and financial results are subject to various risks and uncertainties. You should carefully consider the factors described in Part I, Item 1A, "Risk Factors" in the 2023 Form 10-K/A, which could adversely affect our business, financial condition, results of operations, cash flows, and the trading price of our stock. There have been no material changes to our risk factors included in our 2023 Form 10-K/A. Our business, financial condition, results of operations, or prospects could also be harmed by risks and uncertainties not currently known to us or that we currently do not believe are material.
Item 2. Unregistered Sales of Equity Securities and Use of Proceeds
None.
Item 3. Defaults Upon Senior Securities
Not applicable.
Item 4. Mine Safety Disclosures
Not applicable.
Item 5. Other Information
During the three months ended March 31, 2024, none of our directors or officers (as defined in Rule 16a-1(f) of the Exchange Act) adopted or terminated any contract, instruction or written plan for the purchase or sale of our securities that was intended to satisfy the affirmative defense conditions of Rule 10b5-1(c) of the Exchange Act or any non-Rule 10b5-1 trading arrangement (as defined in the SEC’s rules).
Item 6. Exhibits
The exhibits listed below are filed as part of this Quarterly Report on Form 10-Q/A, or are incorporated herein by reference, in each case as indicated below.
| | | | | | | |
Exhibit
Number | |
| | Incorporated by Reference |
| | Description | | Form | File No. | Exhibit | Filing Date |
3.1 | | Certificate of Incorporation of Spire Global, Inc. | | S-1 | 333-259733 | 3.1 | September 23, 2021 |
3.2 | | Certificate of Amendment to Certificate of Incorporation of Spire Global, Inc., dated August 30, 2023 | | 8-K | 001-39493 | 3.1 | August 30, 2023 |
3.3 | | Bylaws of Spire Global, Inc. | | S-1 | 333-259733 | 3.2 | September 23, 2021 |
4.1 | | Form of Warrant | | 8-K | 001-39493 | 4.1 | March 21, 2024 |
10.1 | | Securities Purchase Agreement, dated February 4, 2024, by and among Spire Global, Inc. and Signal Ocean Ltd. | | 8-K | 001-39493 | 10.1 | February 8, 2024 |
10.2 | | Securities Purchase Agreement, dated as of March 21, 2024, by and among Spire Global, Inc. and the purchasers party thereto. | | 8-K | 001-39493 | 10.1 | March 21, 2024 |
10.3 | | Placement Agency Agreement, dated as of March 21, 2024, by and among Spire Global, Inc. and A.G.P./Alliance Global Partners | | 8-K | 001-39493 | 1.1 | March 21, 2024 |
10.4 | | Amendment No. 3 to Financing Agreement, dated as of April 8, 2024, among Spire Global, Inc., Spire Global Subsidiary, Inc., Austin Satellite Design, LLC, Blue Torch Finance LLC and the lenders party thereto. | | 10-Q | 001-39493 | 10.4 | May 15, 2024 |
31.1 | | Certification of the Principal Executive Officer pursuant to Rules 13a-14(a) and 15d-14(a) under the Securities Exchange Act of 1934, as adopted pursuant to Section 302 of the Sarbanes-Oxley Act of 2002. | | | | | |
31.2 | | Certification of the Principal Financial Officer pursuant to Rules 13a-14(a) and 15d-14(a) under the Securities Exchange Act of 1934, as adopted pursuant to Section 302 of the Sarbanes-Oxley Act of 2002. | | | | | |
32.1* | | Certifications of the Principal Executive Officer and Principal Financial Officer pursuant to 18 U.S.C. Section 1350, as adopted pursuant to Section 906 of the Sarbanes-Oxley Act of 2002. | | | | | |
101.INS | | Inline XBRL Instance Document - the instance document does not appear in the Interactive Data File because XBRL tags are embedded within the Inline XBRL document. | |
|
|
|
|
101.SCH | | Inline XBRL Taxonomy Extension Schema With Embedded Linkbase Documents. | |
|
|
|
|
104 | | The cover page from the Company’s Quarterly Report on Form 10-Q/A for the quarter ended March 31, 2024 has been formatted as Inline XBRL | |
|
|
|
|
* The certifications attached as Exhibit 32.1 that accompany this Quarterly Report on Form 10-Q/A are deemed furnished and not filed with the Securities and Exchange Commission and are not to be incorporated by reference into any filing of Spire Global, Inc. under the Securities Act of 1933, as amended, or the Securities Exchange Act of 1934, as amended, whether made before or after the date of this Quarterly Report on Form 10-Q/A, irrespective of any general incorporation language contained in such filing.
SIGNATURES
Pursuant to the requirements of the Securities Exchange Act of 1934, the registrant has duly caused this report to be signed on its behalf by the undersigned thereunto duly authorized.
| | | |
|
| SPIRE GLOBAL, INC. |
|
|
|
|
Date: March 3, 2025 |
| By: | /s/ Theresa Condor |
|
|
| Theresa Condor |
|
|
| Chief Executive Officer |
| | | (Principal Executive Officer) |
|
|
|
|
Date: March 3, 2025 |
| By: | /s/ Leonardo Basola |
|
|
| Leonardo Basola |
|
|
| Chief Financial Officer |
| | | (Principal Financial and Accounting Officer) |
|
|
|
|